Mass Spectrometry and Ultra-High Vacuum Sven L.M. Schroeder, Norbert Weiher & Eugen Illenberger January 2001 1. Objectives The objectives of this experiment are • To introduce you to mass spectrometry. • To train you in operating a quadrupole mass spectrometer. • To make you familiar with vacuum equipment and technology. • To train you in recording and analysing data by means of a microcomputer. 2. General Aspects of Mass Spectrometry Mass spectrometry is a widely used technique in many areas of basic and applied science. It is based on the ionisation of neutral molecules in the gas phase, which can be analysed by their motion in electric and magnetic fields. There are many different types of mass spectrometers where electric and magnetic fields are used either separately or in combination. In static fields different ions can be distinguished in space through their different trajectories (static mass analysers) or in time through their different flight times (time-of-flight (TOF) mass analysers). The quadrupole mass spectrometer uses a quadrupole radio-frequency electric field (dynamic mass analyser), which forces ions of a particular mass onto stable oscillatory trajectories. Common for any type of mass spectrometer is that mass separation is established according to the ratio M/ze (M: molecular mass, e: elementary charge and z: number of elementary charges). A doubly charged ion hence appears on the scale of a mass spectrometer (which refers to z=1) at the half value of its true mass. We shall briefly introduce the three most commonly used types now. The Magnetic Sector Mass Analyser is the traditional instrument. It uses the Lorentz force acting on a moving charge in a magnetic field. Magnetic analysers have high mass resolution (M/∆M > 10 6 ) are expensive (starting from 10 6 DM, with virtually no upper limit), very heavy (electromagnets) and need a lot of space.

Welcome message from author
This document is posted to help you gain knowledge. Please leave a comment to let me know what you think about it! Share it to your friends and learn new things together.
Transcript

Mass Spectrometry and Ultra-High Vacuum Sven L.M. Schroeder, Norbert Weiher & Eugen Illenberger
January 2001
1. Objectives
The objectives of this experiment are
• To introduce you to mass spectrometry.
• To train you in operating a quadrupole mass spectrometer.
• To make you familiar with vacuum equipment and technology.
• To train you in recording and analysing data by means of a microcomputer.
2. General Aspects of Mass Spectrometry
Mass spectrometry is a widely used technique in many areas of basic and applied science. It is based on the ionisation of neutral molecules in the gas phase, which can be analysed by their motion in electric and magnetic fields. There are many different types of mass spectrometers where electric and magnetic fields are used either separately or in combination. In static fields different ions can be distinguished in space through their different trajectories (static mass analysers) or in time through their different flight times (time-of-flight (TOF) mass analysers). The quadrupole mass spectrometer uses a quadrupole radio-frequency electric field (dynamic mass analyser), which forces ions of a particular mass onto stable oscillatory trajectories. Common for any type of mass spectrometer is that mass separation is established according to the ratio M/ze (M: molecular mass, e: elementary charge and z: number of elementary charges). A doubly charged ion hence appears on the scale of a mass spectrometer (which refers to z=1) at the half value of its true mass.
We shall briefly introduce the three most commonly used types now.
The Magnetic Sector Mass Analyser is the traditional instrument. It uses the Lorentz force acting on a moving charge in a magnetic field. Magnetic analysers have high mass resolution (M/∆M > 106) are expensive (starting from 106 DM, with virtually no upper limit), very heavy (electromagnets) and need a lot of space.
V17 - Mass Spectrometry and Ultra-High Vacuum.................................................................................................2
Time-Of-Flight (TOF) mass spectrometers use the different flight times of ions (accelerated in an electric field) to travel from the ionisation zone to the detector. TOF instruments work in a pulsed mode (a new race can only be started after the slowest ion has reached the detecor), and are therefore often used in connection with ionisation by pulsed lasers. Simple TOF instruments have mass resolutions in the range M/∆M = 100.
Quadrupole Mass Spectrometers (QMS) are a widely used alternative to the traditional magnetic field analysers. They are comparatively inexpensive, light and small. They are often used for experiments in outer space.
Mass spectrometry is a very important analytical tool in many areas of fundamental and applied science. We mention here astrophysics, stratospheric and atmospheric chemistry, environmental research and monitoring (trace gas analysis), process controlling, e.g., in plasma processing (fabrication of integrated circuits, biochemistry (MALDI spectroscopy), etc. etc. The sensitivity of modern mass spectrometers exceeds the ppb range (parts per billion, 10-9).
Mass spectrometers can only operate under reasonable vacuum conditions (high vacuum or ultrahigh vacuum, see table 1). Since mass separation is established by the particular trajectory of the particular ion it must not be affected by collisions with other particles. Gas analysis thus requires pressure reduction, and mass analysis of bulk materials (solid or liquid) requires appropriate (non destructive) evaporation techniques.
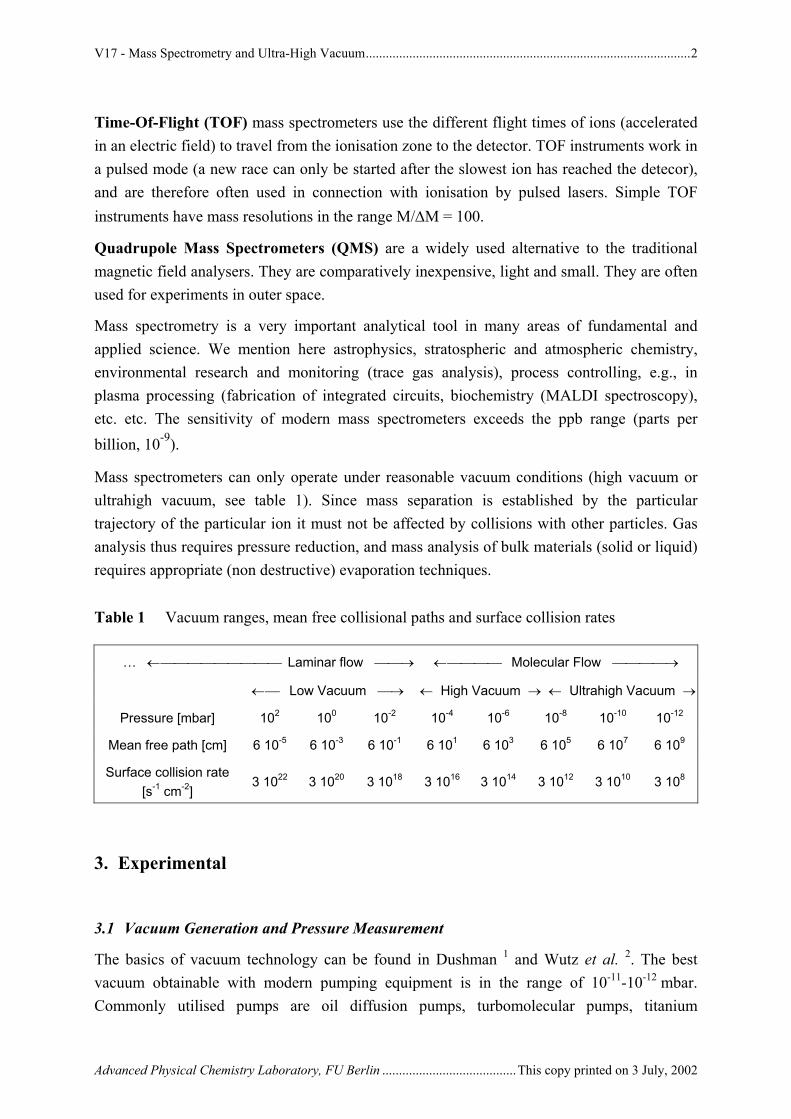
Table 1 Vacuum ranges, mean free collisional paths and surface collision rates
… ← Laminar flow → ← Molecular Flow →
← Low Vacuum → ← High Vacuum → ← Ultrahigh Vacuum →
Pressure [mbar] 102 100 10-2 10-4 10-6 10-8 10-10 10-12
Mean free path [cm] 6 10-5 6 10-3 6 10-1 6 101 6 103 6 105 6 107 6 109
Surface collision rate [s-1 cm-2]
3 1022 3 1020 3 1018 3 1016 3 1014 3 1012 3 1010 3 108
3. Experimental
3.1 Vacuum Generation and Pressure Measurement
The basics of vacuum technology can be found in Dushman 1 and Wutz et al. 2. The best vacuum obtainable with modern pumping equipment is in the range of 10-11-10-12 mbar. Commonly utilised pumps are oil diffusion pumps, turbomolecular pumps, titanium
Advanced Physical Chemistry Laboratory, FU Berlin ........................................This copy printed on 3 July, 2002
V17 - Mass Spectrometry and Ultra-High Vacuum.................................................................................................3
sublimation pumps, ion getter pumps, and cryogenic pumps. Operation of all these pumps requires pre-vacuum below approximately 10-2 mbar. For this purpose a "pre-vacuum pump", "fore pump" or "backing pump" is used, usually a rotary oil pump (often used in synthesis chemistry laboratories). Recently, rotary oil pumps are increasingly replaced by other pumping technologies that do not require oil for their operation (scroll pumps, membrane pumps). The exhaust of oil pumps is environmentally harmful, a health hazard, and a potential contaminant in the residual gas of the ultra-high vacuum vessel.
You will perform your experiment with a vacuum chamber that is pumped by a turbomolecular pump ("turbo") backed by a rotary oil pump. The construction of a turbomolecular pump is quite similar to that of a turbine, consisting of a cylindrical case with stator blades and rotor blades turning at very high speeds (typically in the range of 50,000~rotations/min.). If a gas particle enters the inlet of the pump, it collides with a rotor blade and its momentum vector is changed towards the outlet of the pump. It is then removed from the vacuum vessel by successive collision events inside the pump, until it reaches the outlet of the turbomolecular pump, where the backing pump removes it at a pressure of approximately 10-2 mbar.
The probability for particles diffusing back into the vacuum chamber is typically around 10-6, though it tends to be higher for light elements such as hydrogen and helium, for which back-diffusion rates are higher because of their high molecular velocities. As a result, a major contribution to the residual gas pressure in vessels evacuated with turbomolecular pumps usually comes from hydrogen, which is formed by electron-induced cracking of water and hydrocarbons in the vicinity of glowing filaments (located in the pressure gauge and the mass spectrometer).
The evacuation rate for a vacuum chamber is determined by the effective pumping speed Seff = pV/t [mbar m3 s-1] and the final pressure that can be obtained (approx 10-10 mbar). These quantities depend strongly on the size and the material of the vacuum vessel. The pumping speed must be such that after a moderate pressure burst a half life time t1/2 < 1s is obtained, with t = pV/Seff. Such bursts occur, e.g., during a thermal desorption experiment, where the final pressure has to be restored within seconds. The final pressure is limited by the pumping speed, the leak rate and, especially directly after evacuation from atmospheric pressure to high vacuum, on the rate of desorption of molecules adsorbed at the walls of the vessel (mostly water and complex hydrocarbons). The amount of molecules adsorbed on the walls can be minimised by baking the chamber at 150-200ºC for a day or so.
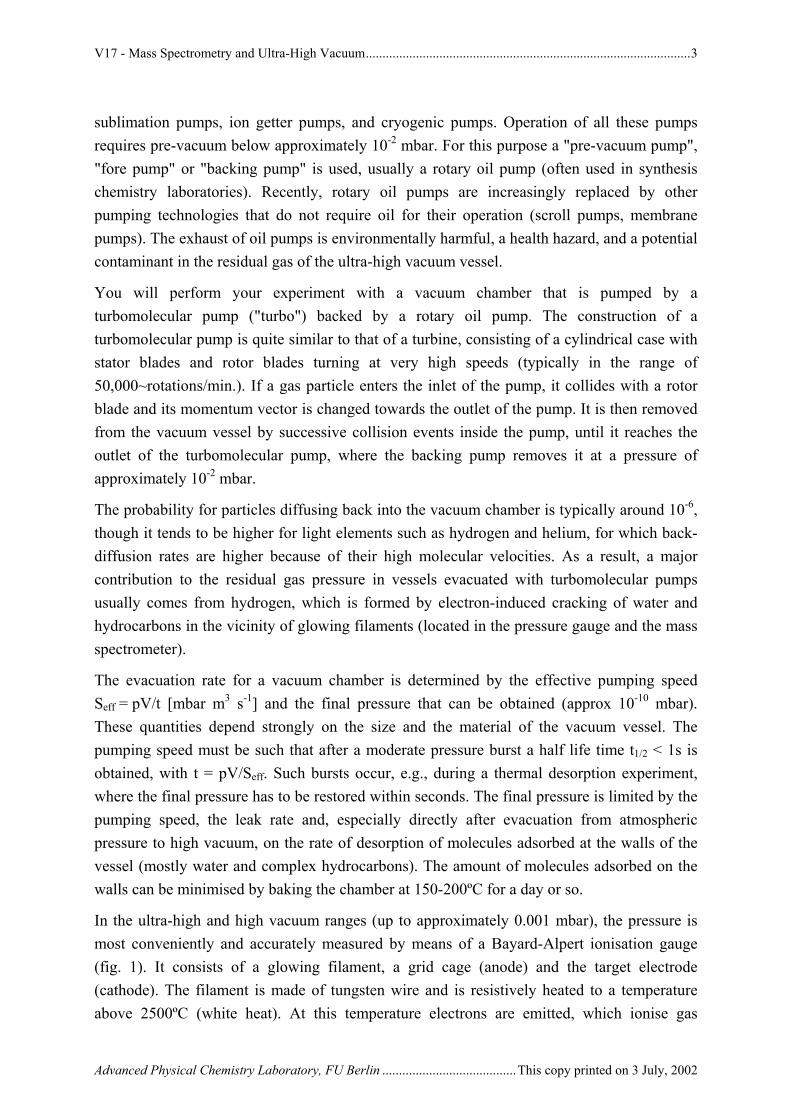
In the ultra-high and high vacuum ranges (up to approximately 0.001 mbar), the pressure is most conveniently and accurately measured by means of a Bayard-Alpert ionisation gauge (fig. 1). It consists of a glowing filament, a grid cage (anode) and the target electrode (cathode). The filament is made of tungsten wire and is resistively heated to a temperature above 2500ºC (white heat). At this temperature electrons are emitted, which ionise gas
Advanced Physical Chemistry Laboratory, FU Berlin ........................................This copy printed on 3 July, 2002
V17 - Mass Spectrometry and Ultra-High Vacuum.................................................................................................4
particles in the environment of the filament. The cations generated by this process are accelerated into the grid cage where they are collected by a target electrode biased at a potential of approximately 600 V. The resulting ion current at the collector is a measure of the pressure. Quantitatively, the pressure p depends on the ion current Ic at the collector and the emission current Iem of the filament according to
Ic = S p Iem (1)
Here, the sensitivity S [mbar-1] is a quantity that depends on the gas and the apparatus used. It is tabulated for common gases.
Figure 1 Schematic drawing of a Bayard-Alpert pressure gauge (“ion gauge”).
For pressures exceeding 10-3 mbar other types of pressure gauges must be employed: most of these are based on the measurement of the resistance of a thin wire (Pirani gauges), which depends on the heat conductivity of the medium in its environment. The better the vacuum around the wire the lower the heat conductivity of the environment, resulting in a warmer wire with a higher resistance. A variation of this principle is the thermocouple gauge, which is based on a measurement of the thermovoltage at a metal-metal junction, which also depends on the heat conductivity of its surroundings.
Advanced Physical Chemistry Laboratory, FU Berlin ........................................This copy printed on 3 July, 2002
V17 - Mass Spectrometry and Ultra-High Vacuum.................................................................................................5
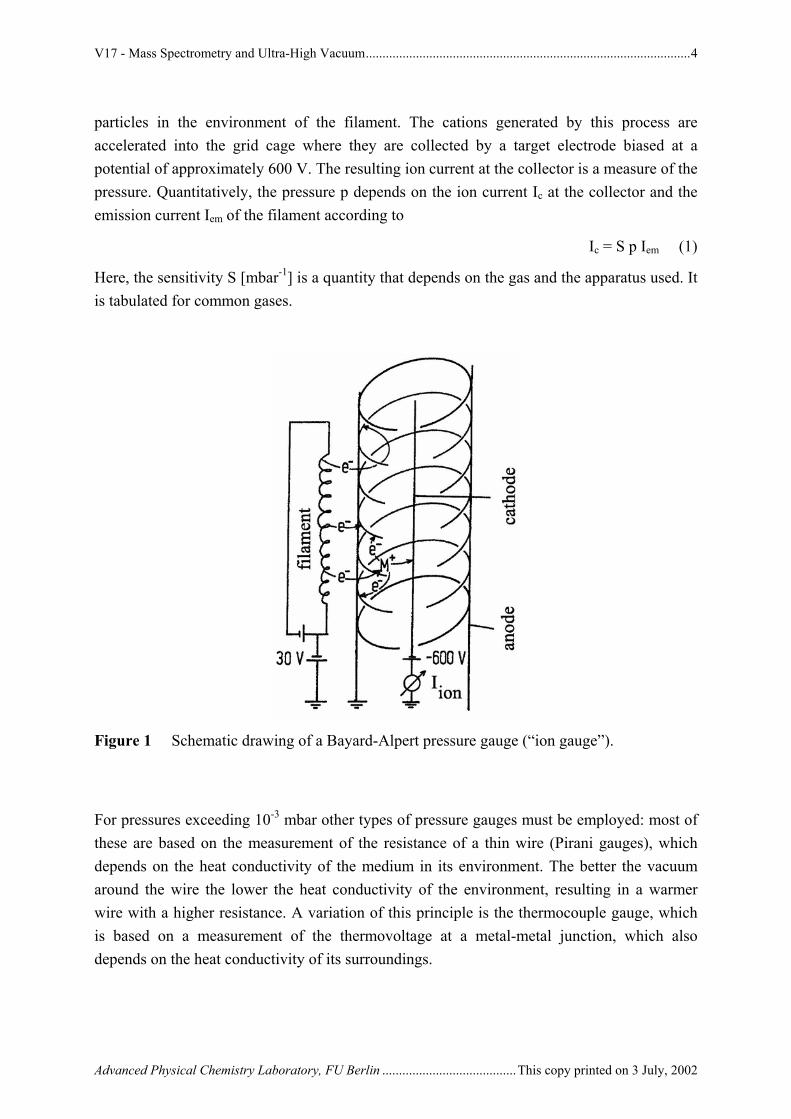
Figure 2 The ultrahigh vacuum apparatus used for this experiment.
Advanced Physical Chemistry Laboratory, FU Berlin ........................................This copy printed on 3 July, 2002
V17 - Mass Spectrometry and Ultra-High Vacuum.................................................................................................6
3.2 Ultrahigh Vacuum Chamber
The UHV system consists of a pumping system and the vacuum vessel. A schematic drawing of the UHV apparatus for this experiment and all devices mounted in it is shown in figure 2.
All parts of the vacuum vessel are made from high-grade steel. All mountable parts are attached using standard Conflat flanges, which have a knife edge that affords a seal by cutting into an oxygen-free high-conductivity (OFHC) copper ring ("gasket"). Besides the pressure gauge described above, the following equipment is attached to the chamber and will be utilised for the experiment.
• Several leak valves, allowing the controlled dosing of gases into the UHV chamber
• The quadrupole mass spectrometer.
Furthermore, there are two devices that are of no significance for this experiment and are described in more detail in the manual for experiment 18:
A manipulator onto which a sample can be mounted for studies of its surface properties
• An ion gun, used for cleaning the surface of the sample by
• bombardment with ions accelerated to kinetic energies of aproximately 1 keV ("sputtering").
3.3 Dosing of Gases
Dosing of gases into the chamber is achieved by use of a leak valve. The final pressure pf measured during dosing is the sum of the base pressure p0 and the partial pressure pi of the gas flowing into the system:
pf - p0 = pi or pi = pf for p0 << pf (2)
The partial pressure pi is proportional to the particle number ni. The ionisation gauge is therefore not only used for measuring the pressure, but also for determining the number of gas particles dosed into the system.
4. Physical Principles of Quadrupole Mass Spectrometry (QMS)
The QMS consists of three components, (i) the ion source with electron impact ioniser and ion extraction optics, (ii) the actual quadrupole analyser consisting of four cylindrically rods, and (iii) the ion detector (electron multiplier).
Advanced Physical Chemistry Laboratory, FU Berlin ........................................This copy printed on 3 July, 2002

V17 - Mass Spectrometry and Ultra-High Vacuum.................................................................................................7
4.1 Electron Impact Ionisation
In the present experiment, the ions are generated by electron impact ionisation (as in most conventional mass spectrometers). Free electrons are formed by thermal emission from an electrically heated tungsten filament. Thermal electron emission can be described by the Richardson-Dushman equation
Φ
⋅=kT
-expCJ (3)
with J the current density of emitted electrons, C a constant (independent of the filament material), T the temperature and Φ the work function of the filament material. It is intuitive and easy to see that the emission current increases with the temperature.
The emitted electrons are accelerated by a potential difference (typically 70 V) between the filament and the grid (fig. 3). Ionisation takes place in the area between grid and aperture, which are at approximately equal potentials. The temperature of the filament is in the range around 2500 K. The emitted electrons have a certain kinetic energy distribution due to the temperature of the filament, but also (more important) due to the electrical potential drop across the heated filament. The energy distribution is typically in the range 2 eV. In other words, after acceleration to 70 eV the ionising electrons have a kinetic energy of 70 ± 1 eV. In practice, the energy spread is larger since the potential in the ionisation region is not completely homogeneous.
Figure 3 Parts of a quadrupole mass spectrometer.
4.2 Electron Impact Ionisation and Photoionisation
Among several possibilities, ionisation of a molecule AB in the gas phase can be achieved by the impact of photons or of electrons with sufficient energy:
Advanced Physical Chemistry Laboratory, FU Berlin ........................................This copy printed on 3 July, 2002

V17 - Mass Spectrometry and Ultra-High Vacuum.................................................................................................8
hν + AB → AB+ + e- (4)
e-(1) + AB → AB+ + e-(1) + e-(2) (5)
For the moment we restrict our discussion to the removal of an electron from the highest molecular orbital (HOMO), which creates the cation in its electronic ground state. AB may represent a diatomic or polyatomic molecule.
In photoionisation, the molecule absorbs the photon and the photoelectron carries away the difference between the photon energy and the binding energy of the ejected electron
ε = hν - IE(AB) (6)
where ε is the kinetic energy of the photoelectron and IE(AB) the ionisation energy of the molecule which is equal to binding energy of the electron.
Figure 4 Ionisation and autoionisation of O2.
Advanced Physical Chemistry Laboratory, FU Berlin ........................................This copy printed on 3 July, 2002
V17 - Mass Spectrometry and Ultra-High Vacuum.................................................................................................9
In electron impact ionisation the incident electron can loose any amount of its initial energy so that the excess energy can be shared between the incident e-(1) and ionised electron e-(2).
So far we have neglected any excitation of the cation during the course of ionisation. Electron impact ionisation as well as photoionisation is controlled by the Franck-Condon principle, which states that the cation is formed in a so-called vertical transition. If the equilibrium distance of the ion differs from that in the neutral, the transition creates the cation in different vibrational states governed by the Franck-Condon factors. In the case of the oxygen molecule, the HOMO has an anti-bonding character and ionisation leads to a decrease of the equilibrium distance, which in turn results in the population of vibrationally excited states (fig. 4).
We can conclude that in electron impact ionisation the excess energy of the process (the difference between primary energy and ionisation energy) is shared between the two outgoing electrons and the internal energy of the ion.
4.3 Mass Separation in the Quadrupole
The quadrupole analyser consists of four cylindrical rods, arranged symmetrically at a distance r0(x,y) around the optical axis z of the system. Opposite rods are electrically connected. The voltage applied to the two pairs of opposite rods can be expressed as
( tVUV ⋅⋅+ )= ωcos1 (7)
( )( )tVUV ⋅⋅+−= ωcos2 (8)
with a constant component U and a radiofrequency component ( )tV ⋅⋅ ωcos .
In the (x,y)-plane (perpendicular to the quadrupole axis) the potential at any point between the rods is
( )( ) ( )2
0
22cos),(r
yxtVUyx −⋅⋅⋅+=Φ
ω (9)
The differential equations of motion for an ion in such a potential are known as Mathieu equations. Their analysis reveals that for a given ion (m/Ze) only certain values of U and V result in stable oscillatory trajectories, while for other values for U and V the amplitude of the oscillations increases exponentially, so that the ion will strike a rod and lose its charge 3.
Note that particles are separated according to their mass/charge ratio m/Ze; doubly ionised paticles thus appear in the spectrum at half their molecular mass, triply charged ions at one third, etc. By this method, molecules with molecular masses of over 1000 can be detected even if the mass spectrometer has a maximum range of, e.g., 300 amu. Apart from the isotope pattern of the molecular ion one can also observe products of ion fragmentation processes.
Advanced Physical Chemistry Laboratory, FU Berlin ........................................This copy printed on 3 July, 2002
V17 - Mass Spectrometry and Ultra-High Vacuum...............................................................................................10
4.4 Ion Detection
The simplest way of detecting ions or electrons is via the detection of their charges. In simple quadrupole mass spectrometers the ions hit a metallic collector cone (Faraday cup) and the charge transferred is recorded using an electrometer preamplifier, which can detect currents down to a the pA-range. For even lower ion currents (i.e., for less than 107 ions per second), one uses secondary electron multipliers or channeltron multipliers. Traditional secondary electron multipliers consist of an array of dynodes (thin metal sheets of certain alloys), which emit electrons when hit by a charged particle. Using a sequence of dynodes with selected voltage distributions, one triggers a cascade of emission events that can lead to signal amplification factors of up to 108. The physics underlying a channeltron multiplier tube, which has the advantage of being monolithic and much smaller than a dynode array, is basically the same, except that charge multiplication occurs along a tapered, spiralling tube which, on its inside, is coated with a material that has a high electron emission coefficient.
5. Electronically Excited Cations: Fragmentation, Autoionisation and Multiple Ionisation
5.1 Electronically Excited Cations and Fragmentation
If the energy of the primary electron is sufficiently high, electrons from MOs below the HOMO can be ionised. The energy to remove an electron from the MO next to the HOMO is called the second ionisation energy. Removal of electrons from MOs below the HOMO generates ions in electronically excited states. This is illustrated in figure 5 in terms of a schematic MO representation. While the MO picture contains details of the electronic configuration and electrons involved in the process, the potential energy curve representation contains quantities related with the geometry of the molecule (potential energy, equilibrium distances, etc.). Vibrational excitation in the electronically excited cation also depends on the disposition of its potential energy curve with respect to that of the neutral ground state.
An electronically excited ion has sufficient energy to undergo fragmentation, e.g., according to
e-(1) + AB → AB+* + e-(1) + e-(2) (10a)
AB+* → A+ + B (10b)
AB+* → A + B+ (10c)
The energy balance for the dissociative ionisation process (10b) is
Advanced Physical Chemistry Laboratory, FU Berlin ........................................This copy printed on 3 July, 2002

V17 - Mass Spectrometry and Ultra-High Vacuum...............................................................................................11
AE (A+) = D(A-B) + IE (A) (11)
With AE (A+), the so called appearance energy of fragment ion A+ (the minimum electron
energy at which A+ can be observed in the mass spectrometer), with D(A-B), the dissociation energy in the neutral molecule and with IE(A), the ionisation energy of the fragment A. The above correlation is often used to determine dissociation energies in mass spectrometry: if the ionisation energy of fragment A is known then the dissociation energy is immediately derived from the appearance energy of the ion A+. The method is based on the assumption that the excess energy can be neglected at the onset (which often holds for larger molecules) - see also question 7 below.
On the microscopic level, dissociative ionisation is described via curve-crossing of the excited state potential energy surface with a repulsive surface correlated with the particular fragments.
Figure 5 Formation of a ground state ion vs. an electronically excited ion and a superexcited neutral particle.
Advanced Physical Chemistry Laboratory, FU Berlin ........................................This copy printed on 3 July, 2002

V17 - Mass Spectrometry and Ultra-High Vacuum...............................................................................................12
5.2 Autoionisation
In addition to the direct ionisation process described by eq. (4), cations can also be generated indirectly in a two step process (fig. 5c). An electronic excitation from an MO below the HOMO to an unoccupied MO creates a highly excited (sometimes called superexcited) neutral molecule AB** with an energy above the first ionisation energy, as can be seen from the length of the arrows in Fig 5c. The superexcited state can then emit an electron and create a cation in its electronic ground state. Formation of a superexcited state was already illustrated in fig. 4 in terms of potential energy curves for the oxygen molecule. Electron autoionisation is a multielectron process that shall not be discussed further (see also the next paragraph on multiionisation). In a conventional mass spectrometer it is not straightforward to distinguish autoionisation from direct ionisation. It can be done, however, by a technique called photoionisation mass spectrometry, which uses photons with variable energies, as, e.g. from a synchrotron radiation source. The ion AB+ that arises from the autoionisation process
hν + AB → AB** → AB+ + e- (12)
can then easily be distinguished from that generated in direct ionisation
hν + AB → AB+ + e- (13)
since formation of AB** in (12) is a resonant process (photoabsorption). Varying the photon
wavelength creates an autoionisation resonance at the energy of AB** on the continuous background of direct ionisation.
5.3 Multiple Ionisation
Electron impact with sufficient energy can also generate ions with multiple charges. Since the the states of electrons in an atom or molecule are to some extent correlated, the colliding or outgoing electron can interact with further electrons and cause the removal of more than one electron. The probability for multiple ionisation is usually a few per cent of that for single ionisation. Multiply charged ions are mostly unstable since they dissociate into the fragments by Coulomb explosion. Exceptions are e.g., the C60 molecule, or molecules with long chains that reduce the effect of the Coulomb repulsion. As in the case of autoionisation, mass spectrometry alone cannot establish whether a fragment ion A+ arises from a double ionisation process with subsequent Coulomb explosion
e- + AB → AB++ + 3e- (14a)
AB++ → A+ + B+ (14b)
or a single dissociative ionisation process.
Advanced Physical Chemistry Laboratory, FU Berlin ........................................This copy printed on 3 July, 2002

V17 - Mass Spectrometry and Ultra-High Vacuum...............................................................................................13
5.4 Ionisation Cross Section / Ion Yield Curve
The ionisation cross section is a measure of the ionisation probability, for instance by electron impact like in the present experiment. Cross sections are given in numbers of m2, cm2, Å2 or
Mbarn (megabarn), with 1 Å2=10-16cm2=10-20m2=100 Mbarn. The ionisation cross section can be thought of as the effective area of the molecule in which ionisation occurs: if an electron collides inside this area, ionisation takes place, while for a collision outside this is not the case. The ionisation cross section depends on the collision energy. In figure 6, this is illustrated for the simple case of single and multiple ionisation of argon atoms. It can be seen that the cross section for single ionisation increases up to a value near 70 eV and then decreases. Such a curve represents the ionisation efficiency as a function of the collision energy and is called and ion yield curve. The ionisation cross section at 70 eV roughly corresponds to the actual geometrical cross section of the molecule.
The increasing efficiency above threshold can be rationalised (among more complex reasons) by the opening of additional ionisation channels mentioned above (creation of excited ions by removing electrons from lower orbitals and autoionisation). The decrease at higher energy is simply a consequence of the fact that the energy of the primary electrons differs from the energy of the outer electrons in the target, resulting in a less effective interaction (see question 10). Most molecules have maximum ionisation cross sections near 70 eV. For that reason mass spectrometers usually operate at 70 eV electron impact energy.
Figure 6 Cross sections for single and multiple ionisation of argon atoms (“ion yield curve”).
Advanced Physical Chemistry Laboratory, FU Berlin ........................................This copy printed on 3 July, 2002

V17 - Mass Spectrometry and Ultra-High Vacuum...............................................................................................14
The energy dependence of the ionisation cross section σ(E) near threshold can be expressed as
σ(E) ∝ ∆(E)n-1 (15a)
where ∆(E) is the electron energy above the corresponding ionisation energy (threshold), ∆(E) = E-IE(i) with E the primary electron energy, IE(i) the ionisation energy (i=1 for single ionisation, i=2 for double ionisation etc.), and n the number of outgoing electrons. The above expression is a special case of the famous threshold laws by Eugene Wigner 4 (Nobel Prize 1963), which predict the energy of any process near the energy threshold. In the case of single ionisation (n=2) we have
σ(E) ∝ ∆E (15b)
and hence a linear increase of the efficiency above the threshold (first ionisation energy). This relation holds for atoms but can approximately also be applied for molecules. In actual practice, one observes a behaviour shown in figure 7 with a ‘soft’ onset due to the energy spread of the ionising electrons. The appearance energy AE (see section 5.1 above!) is obtained by extrapolation of the linear part of the ion yield curve. The ionisation energy can be determined from AE by use of eq. 11.
Figure 7 Schematic ion yield curve near the ionisation threshold.
Advanced Physical Chemistry Laboratory, FU Berlin ........................................This copy printed on 3 July, 2002

V17 - Mass Spectrometry and Ultra-High Vacuum...............................................................................................15
6. Literature
[1] Dushman, S. Scientific Foundations of Vacuum Techniques; John Wiley & Sons: New York, 1962.
[2] Wutz, M.; Adam, H.; Walcher, W. Theorie und Praxis der Vakuumtechnik; Vieweg: Braunschweig, 1988.
[3] Paul, W. Z. Physik 1958, 152, 143.
[4] Wigner, E. Phys. Rev. 1948, 73, 1002.
7. Instructions for the Experiment
• Examine the apparatus and identify the various devices attached to it. After you have convinced yourself that the pressure in the chamber is below 10-7 mbar measure the mass spectrum of the residual gas with the computer program provided (mass range from 0 amu to 50 amu). Save the data for plotting in your experimental report. Include a discussion of all significant peaks in the spectrum in your report.
• Dose some argon into the chamber. Be careful when handling the leak valve and make sure that the high-voltage supply for the multiplier and for the filament is turned off. Use a partial pressure of argon that corresponds roughly to the base pressure of the chamber (remember that ). Record the mass spectrum in the same amu-range as above,
save it, and discuss it in your report.
ppi
i =∑
• Next, dose carbon monoxide into the chamber. Follow the same instructions as for argon above.
• Dose carbon monoxide to obtain a partial pressure of pCO = 1 10-7 mbar. Determine the ion yield curves for CO+, O+ and C+ using the computer program. Instructions for the report: Plot the ion yield curves and determine the ionisation thresholds IECO of CO and IEfrag of the fragments O+ and C+. Discuss the mechanism of the formation of these ions and calculate the bond energies of CO and CO+.
8. Questions
1. Estimate the contribution of the thermal energy to the energy spread of electrons emitted from a hot filament at 2500 K.
Advanced Physical Chemistry Laboratory, FU Berlin ........................................This copy printed on 3 July, 2002
V17 - Mass Spectrometry and Ultra-High Vacuum...............................................................................................16
2. Discuss the electron emission current as a function of the temperature of the filament (Richardson-Dushman equation) in the range kT < Φ. Is the range kT ≥ Φ of any practical relevance?
3. Why do mass spectrometers separate ions according to their m/ze ratio?
4. Explain the Franck-Condon principle and the meaning of Franck-Condon factors.
5. The CO molecule is isoelectronic to the dication O2++. Discuss the relative stability of the
two compounds. Calculate the Coulomb repulsion energy at the moment of ionisation (assume two point charges located at the two O atoms and an O-O distance of 1.2 Å). Compare this value with the binding energy of neutral O2.
6. Explain why the mass spectrum of a molecule usually exhibits a series of peaks.
7. The ionisation energy of ethene is 10.5 eV. The fragment ion CH2+ has an appearance
energy of 18.0 eV. From thermochemical tables we find IE(CH2) = 10.4 eV. Calculate the
bond dissociation energy D(CH2 = CH2) and compare your result with the literature value.
8. Discuss the connection between the MO picture (fig. 5) and the potential energy curve representation (fig. 4). By which quantity are these two representations directly related.
9. What happens to a drop of water in vacuum?
10. Electron impact ionisation is only effective if there is no large mismatch between the energy of the colliding electron and the energy of the electrons in the outer MOs of the target molecule. The kinetic energy of an electron in a particular MO is a rather complex problem. Taking the motion of an electron in a Coulomb potential (H atom) as zeroth order approximation for a molecule, we can find an approximate number.
Advanced Physical Chemistry Laboratory, FU Berlin ........................................This copy printed on 3 July, 2002
Related Documents


![UvA-DARE (Digital Academic Repository) Ultra-performance … · with mass spectrometry [8]. However, only simple, non-ionic macromolecules were studied. Ultra-high-pressure liquid](https://static.cupdf.com/doc/110x72/5f0865147e708231d421cb9c/uva-dare-digital-academic-repository-ultra-performance-with-mass-spectrometry.jpg)