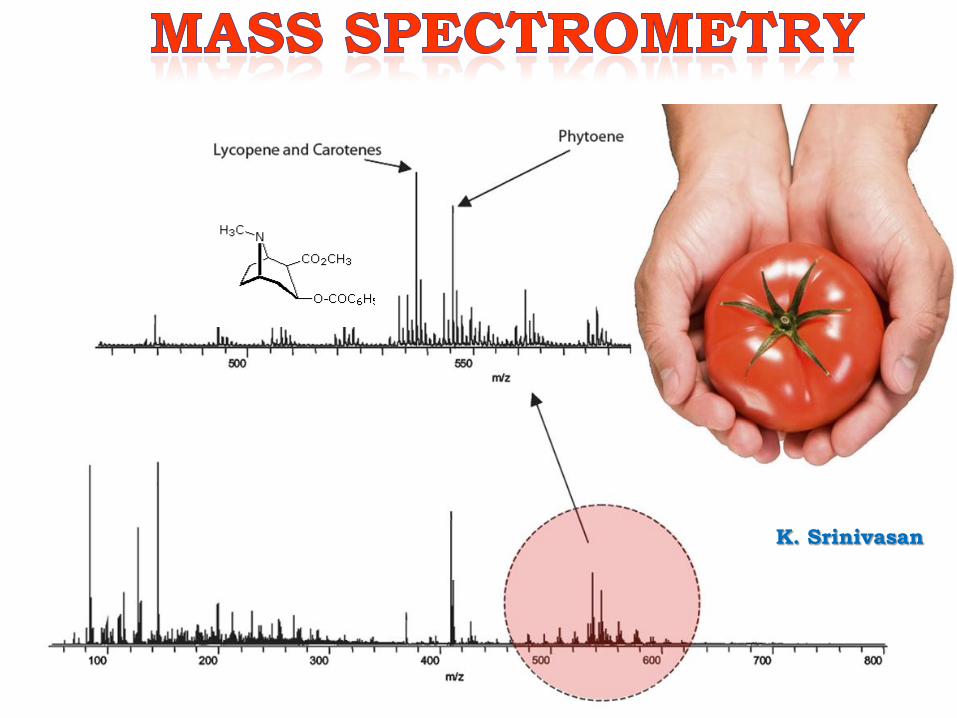
K. Srinivasan

Welcome message from author
This document is posted to help you gain knowledge. Please leave a comment to let me know what you think about it! Share it to your friends and learn new things together.
Transcript
K. Srinivasan
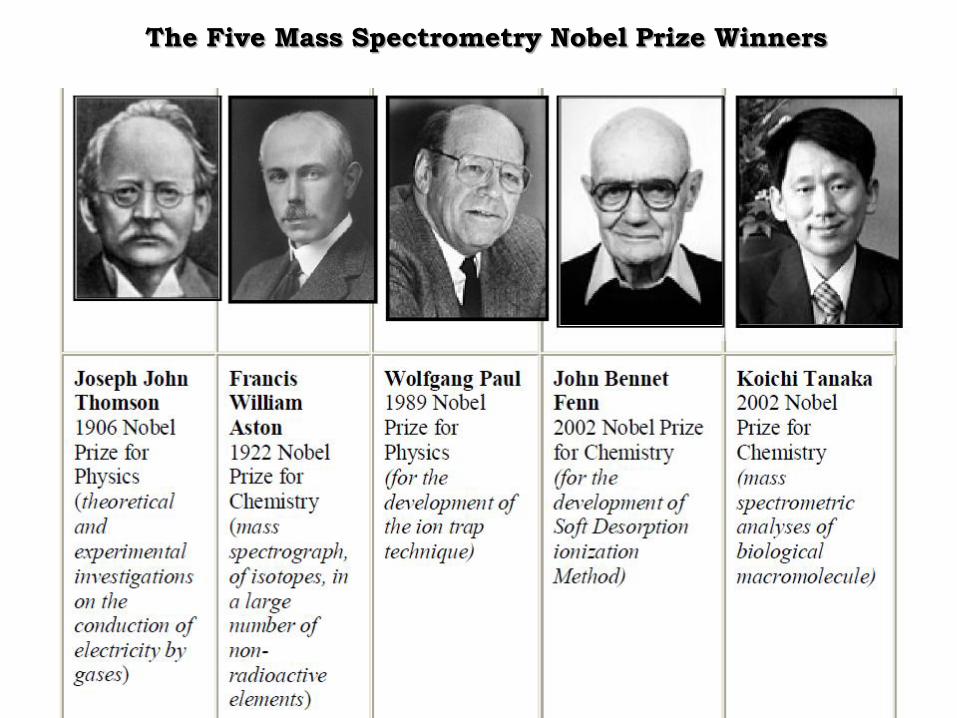
The Five Mass Spectrometry Nobel Prize Winners
Mass Spectrometer
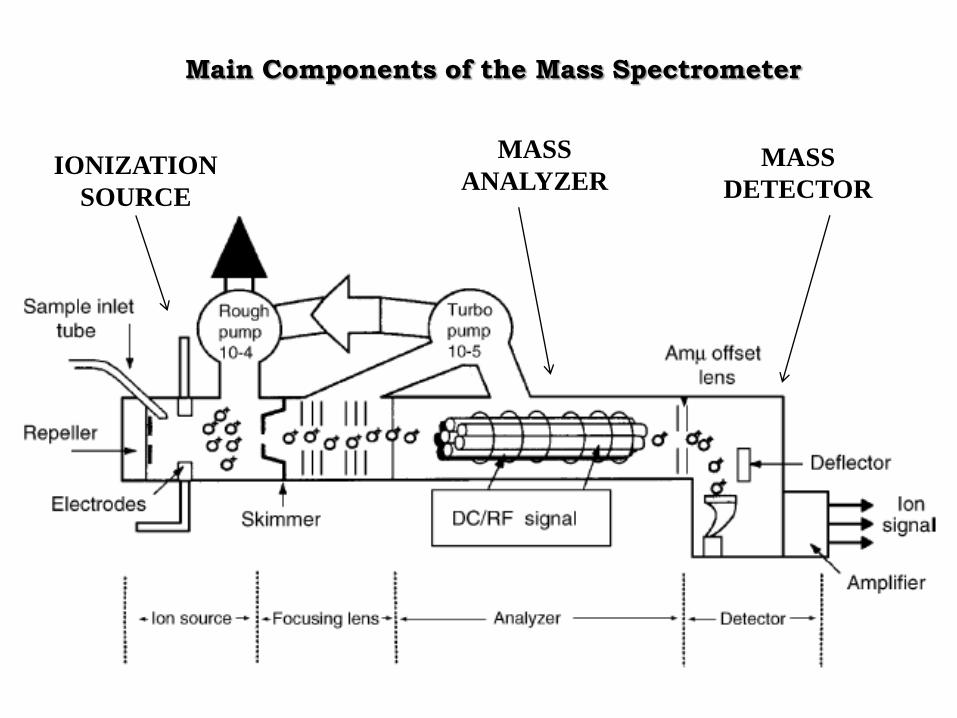
Main Components of the Mass Spectrometer
IONIZATION
SOURCE
MASS
ANALYZERMASS
DETECTOR
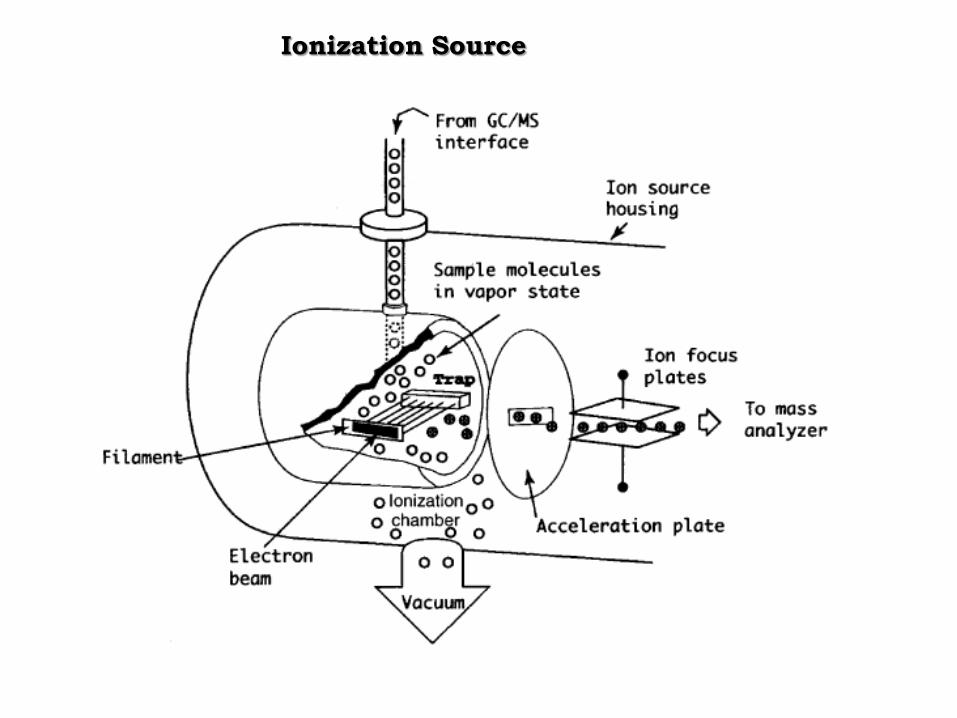
Ionization Source
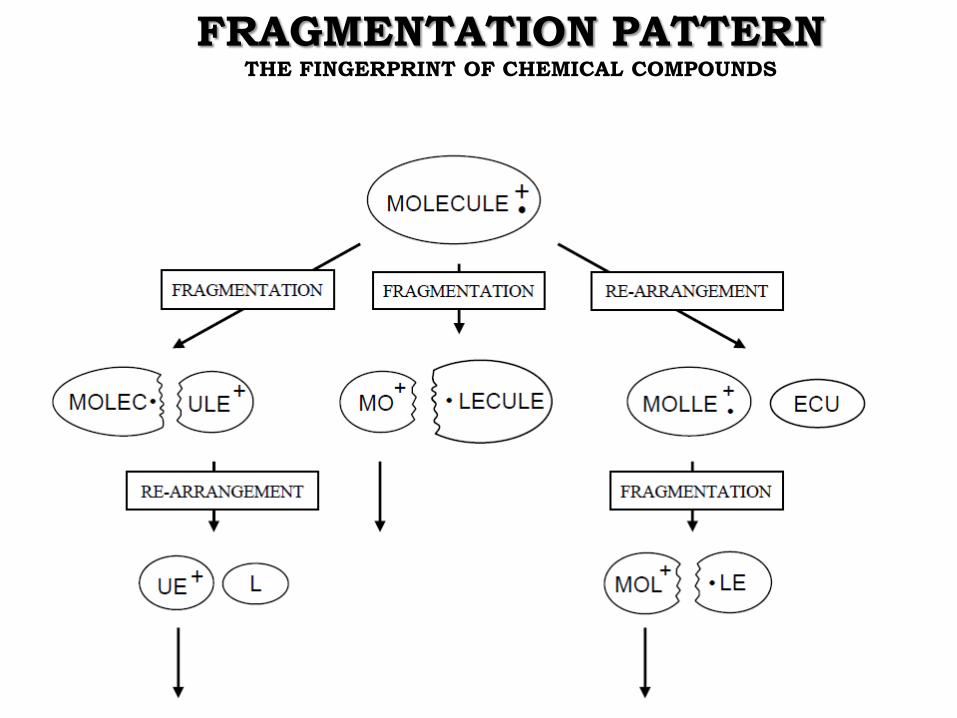
FRAGMENTATION PATTERNTHE FINGERPRINT OF CHEMICAL COMPOUNDS
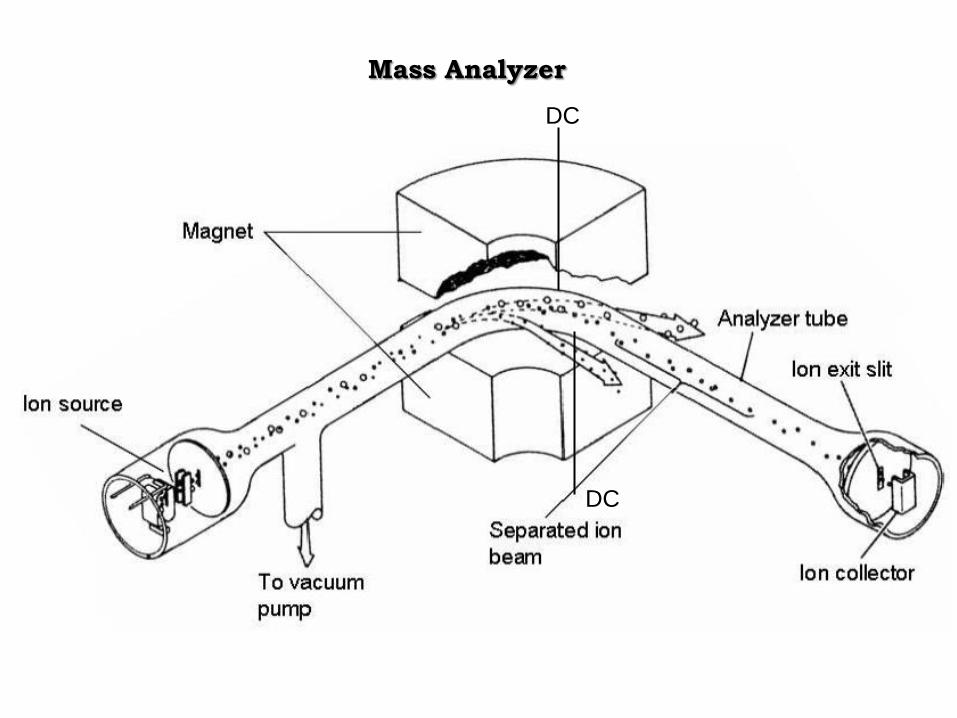
Mass Analyzer
DC
DC
m1m3m4 m2
m3
m1
m4
m2
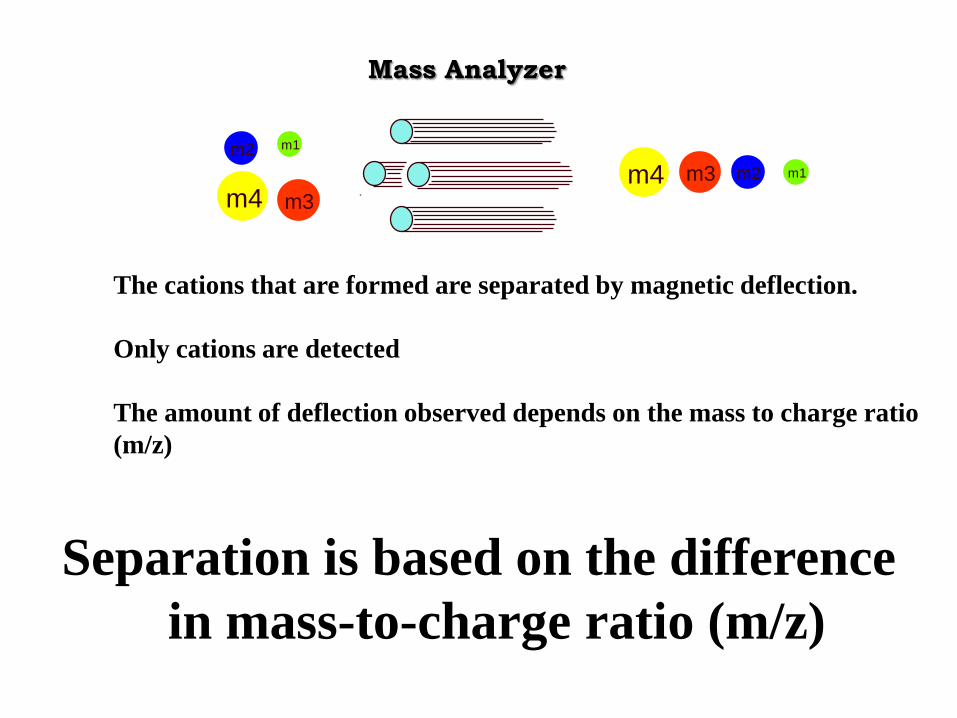
The cations that are formed are separated by magnetic deflection.
Only cations are detected
The amount of deflection observed depends on the mass to charge ratio
(m/z)
Separation is based on the difference
in mass-to-charge ratio (m/z)
Mass Analyzer
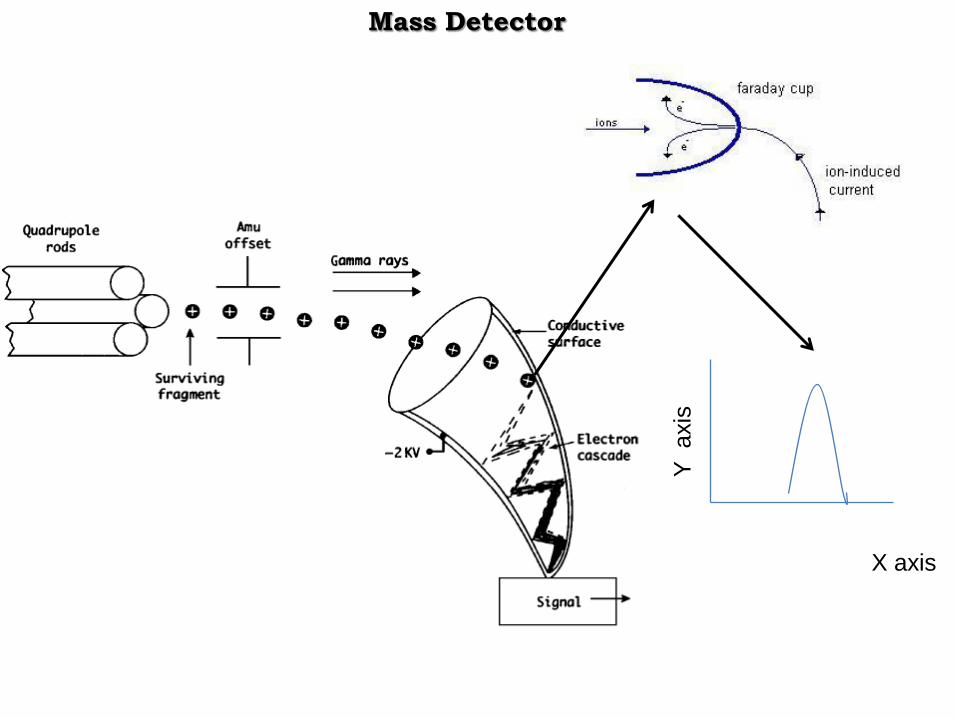
Mass Detector
X axis
Y axis
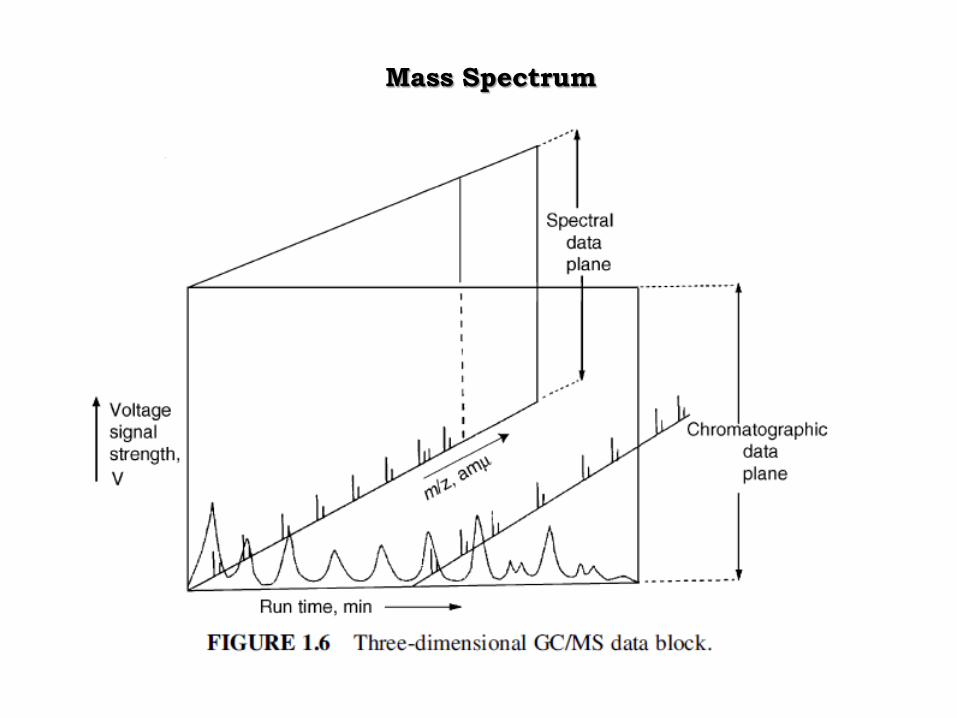
Mass Spectrum
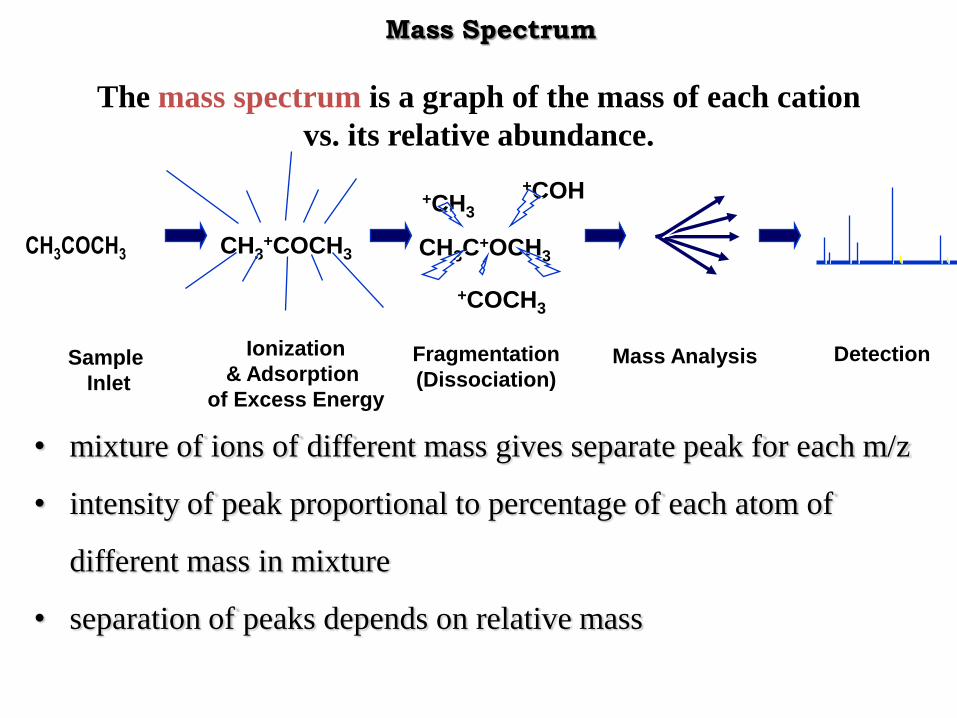
CH3COCH3
Sample
Inlet
CH3+COCH3
Ionization
& Adsorption
of Excess Energy
Mass Analysis
CH3C+OCH3
+COCH3
+CH3
+COH
Fragmentation
(Dissociation)
Detection
The mass spectrum is a graph of the mass of each cation
vs. its relative abundance.
• mixture of ions of different mass gives separate peak for each m/z
• intensity of peak proportional to percentage of each atom of
different mass in mixture
• separation of peaks depends on relative mass
Mass Spectrum
20 40 60 80 100 120m/z
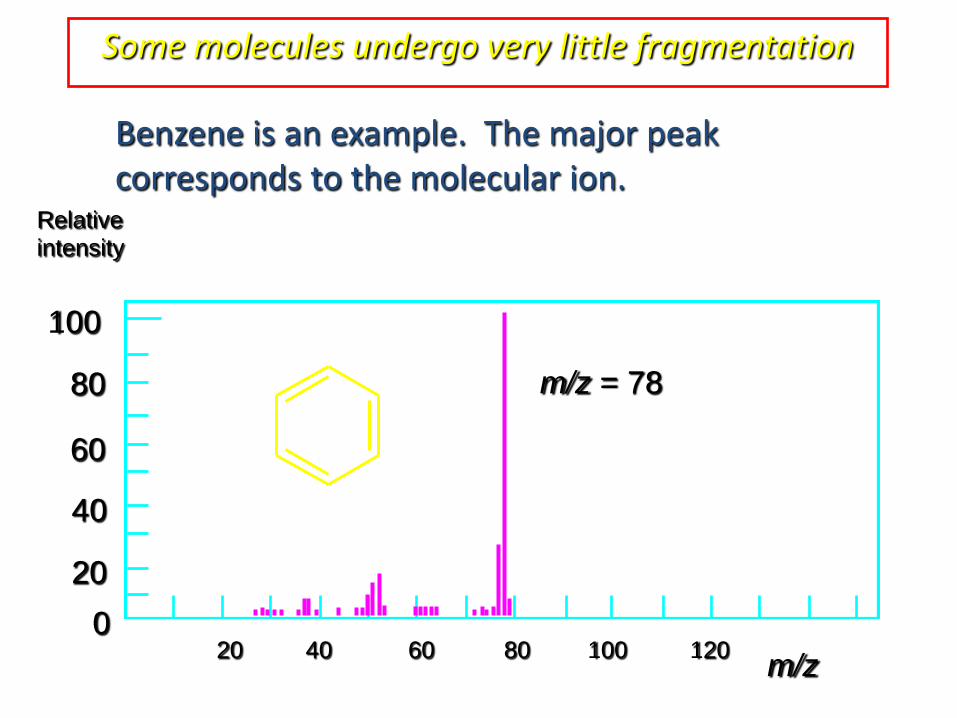
m/z = 78
100
80
60
40
20
0
Relative intensity
Some molecules undergo very little fragmentation
Benzene is an example. The major peak corresponds to the molecular ion.
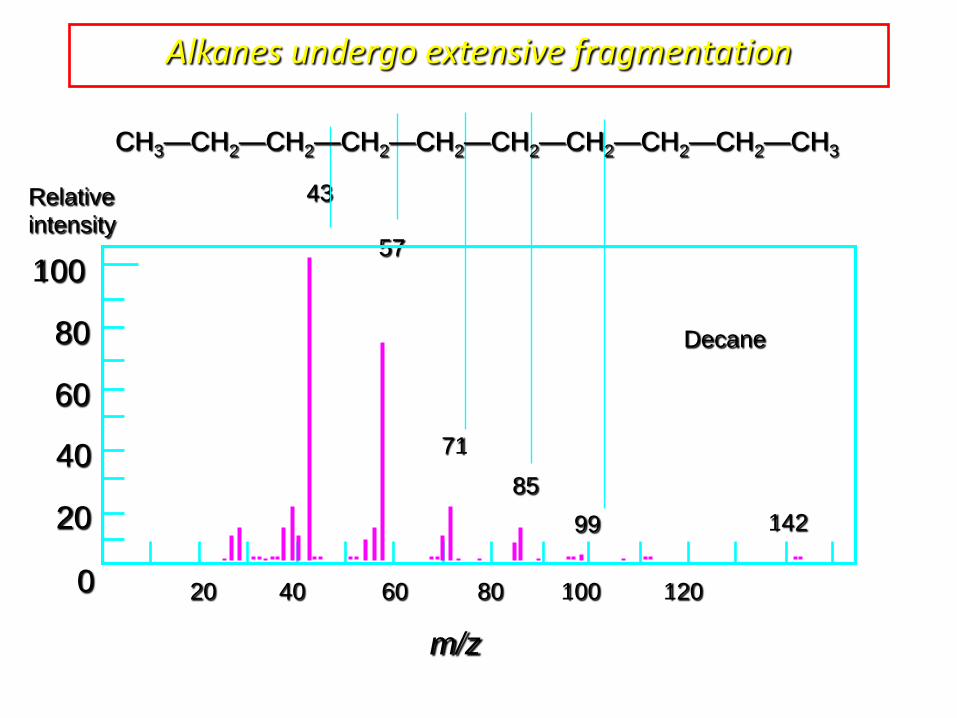
Alkanes undergo extensive fragmentation
m/z
Decane
142
43
57
71
85
99
CH3—CH2—CH2—CH2—CH2—CH2—CH2—CH2—CH2—CH3
Relative intensity
100
80
60
40
20
0
20 40 60 80 100 120
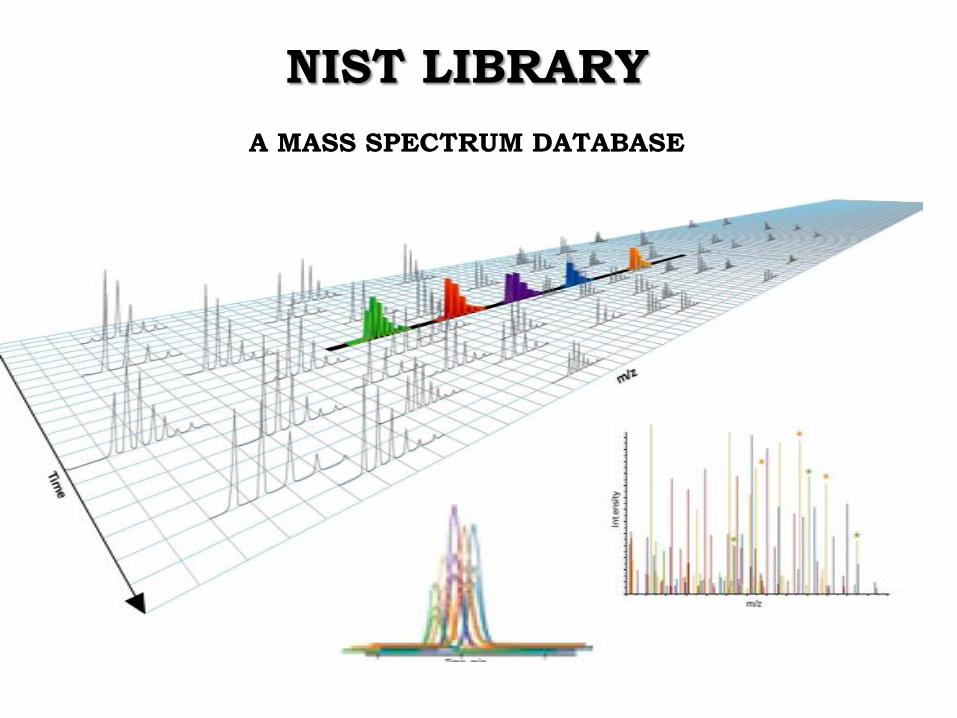
NIST LIBRARY
A MASS SPECTRUM DATABASE
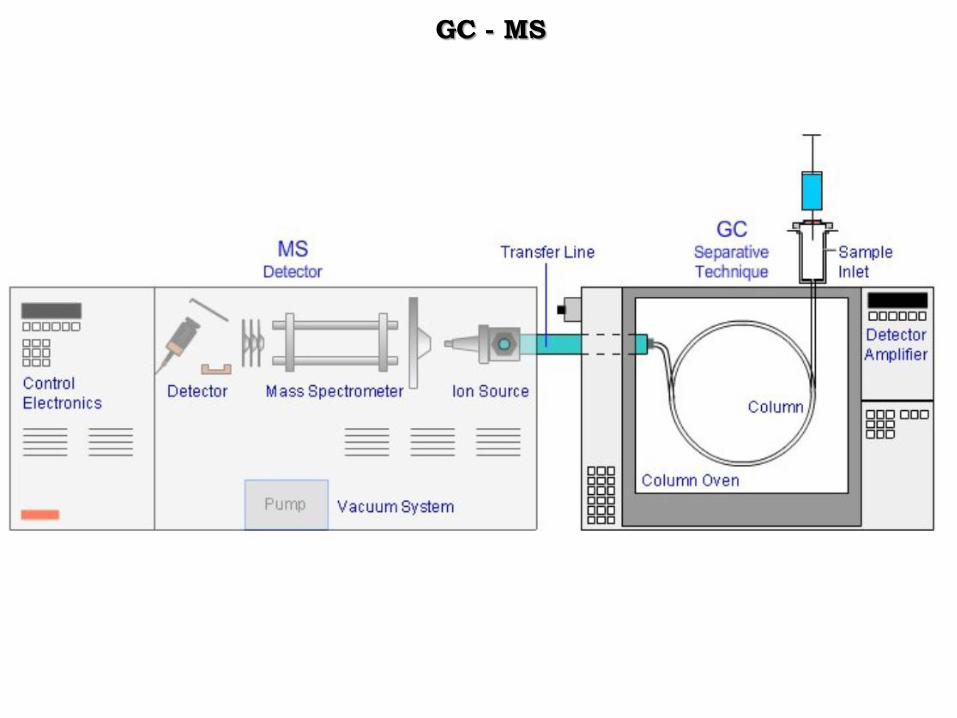
GC - MS
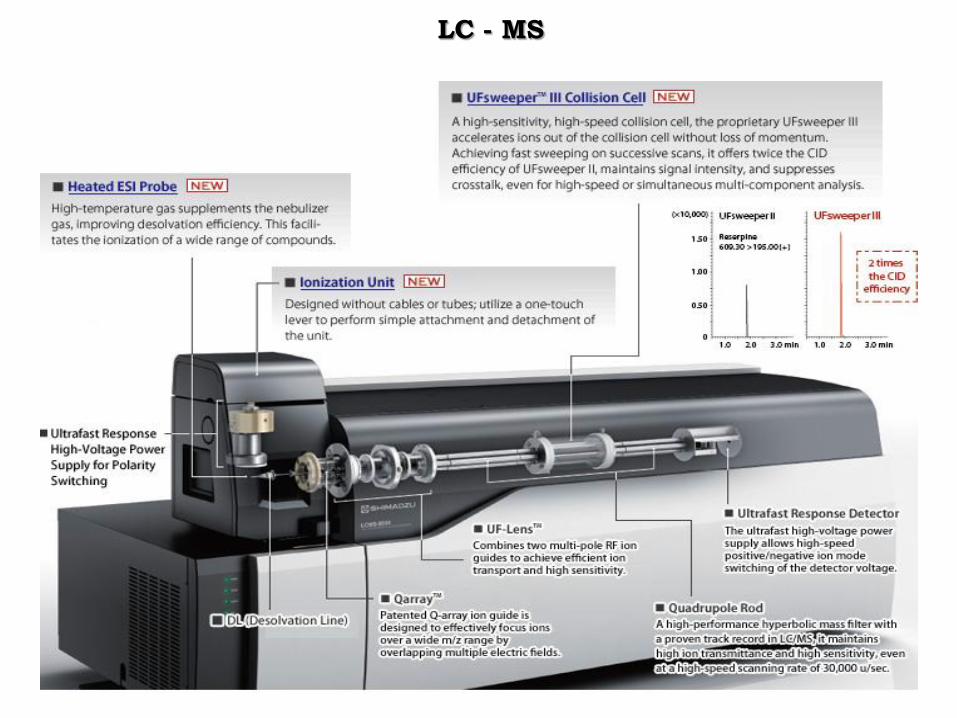
LC - MS
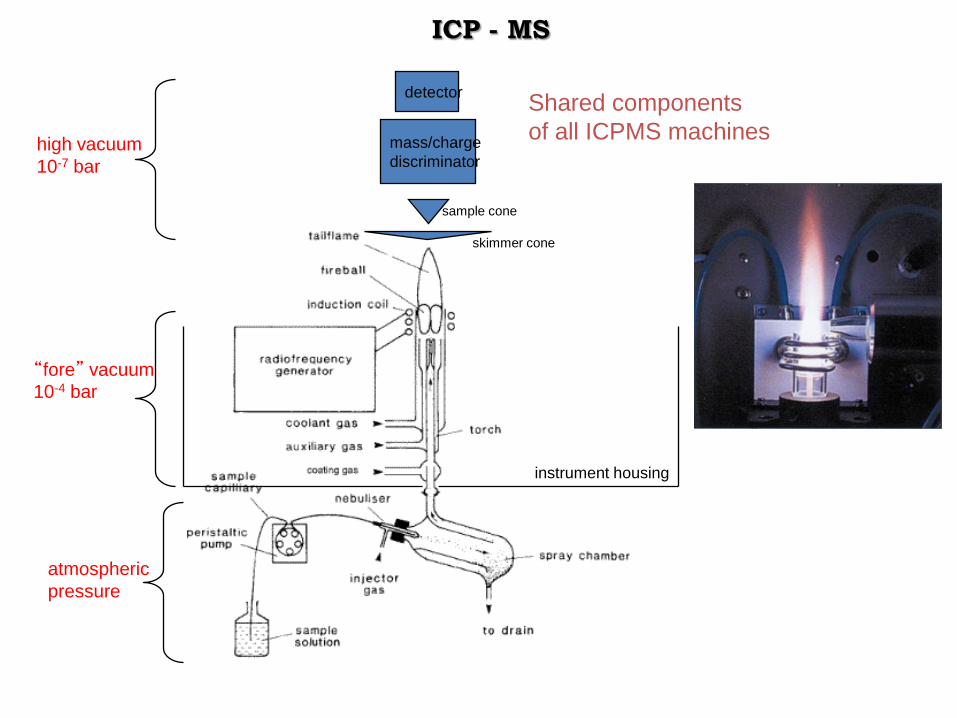
sample cone
skimmer cone
instrument housing
mass/charge
discriminator
detector
atmospheric
pressure
“fore” vacuum
10-4 bar
high vacuum
10-7 bar
Shared components
of all ICPMS machines
ICP - MS
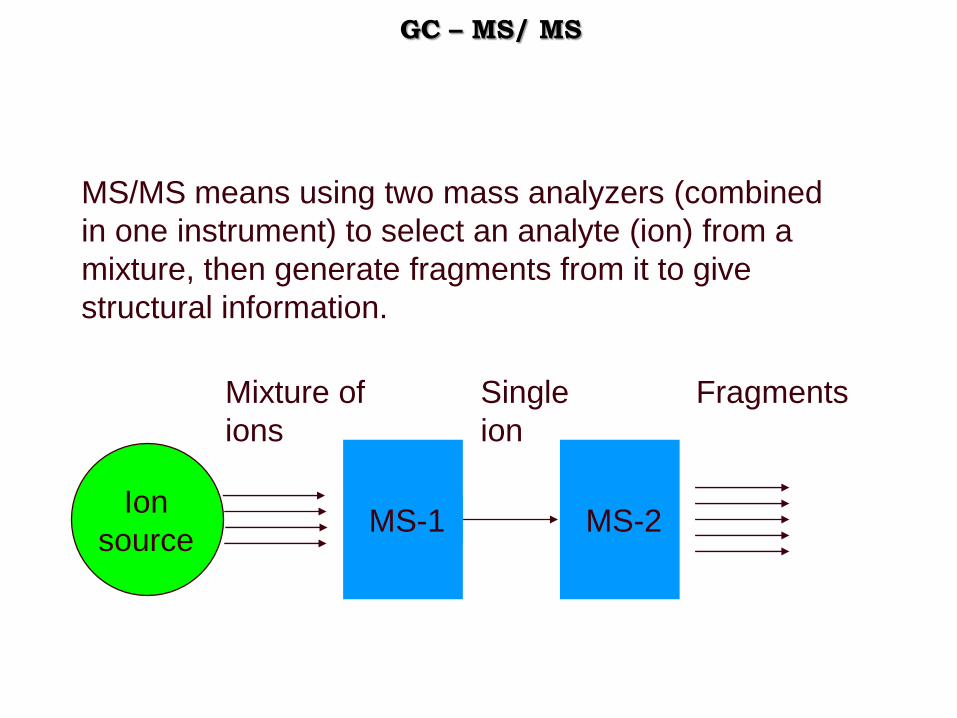
MS/MS means using two mass analyzers (combined
in one instrument) to select an analyte (ion) from a
mixture, then generate fragments from it to give
structural information.
Ion
sourceMS-2MS-1
Mixture of
ions
Single
ion
Fragments
GC – MS/ MS
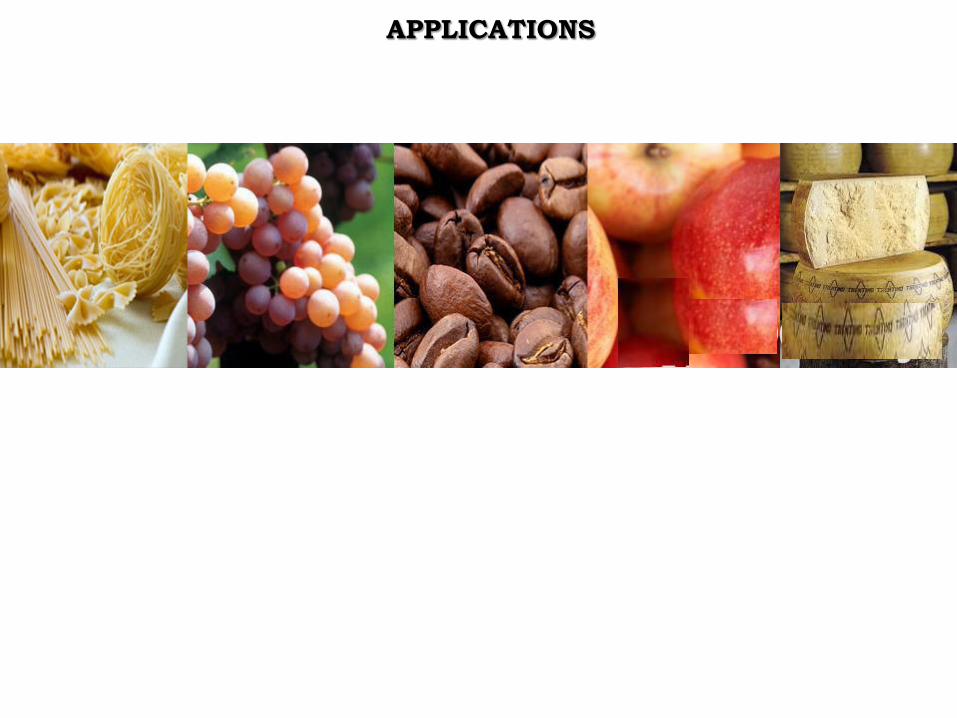
APPLICATIONS
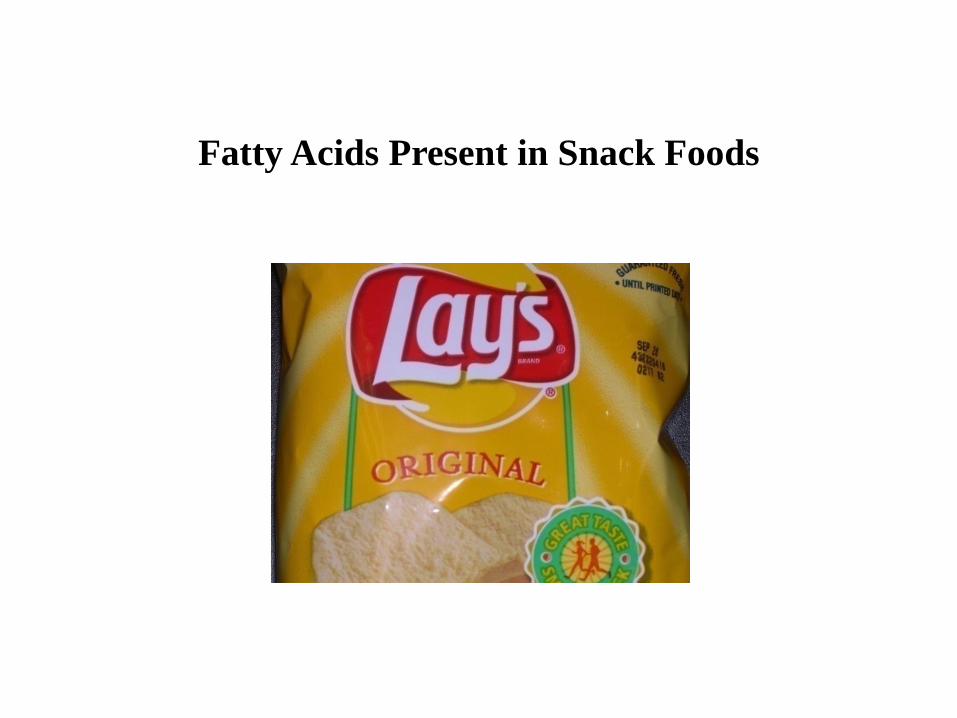
Fatty Acids Present in Snack Foods
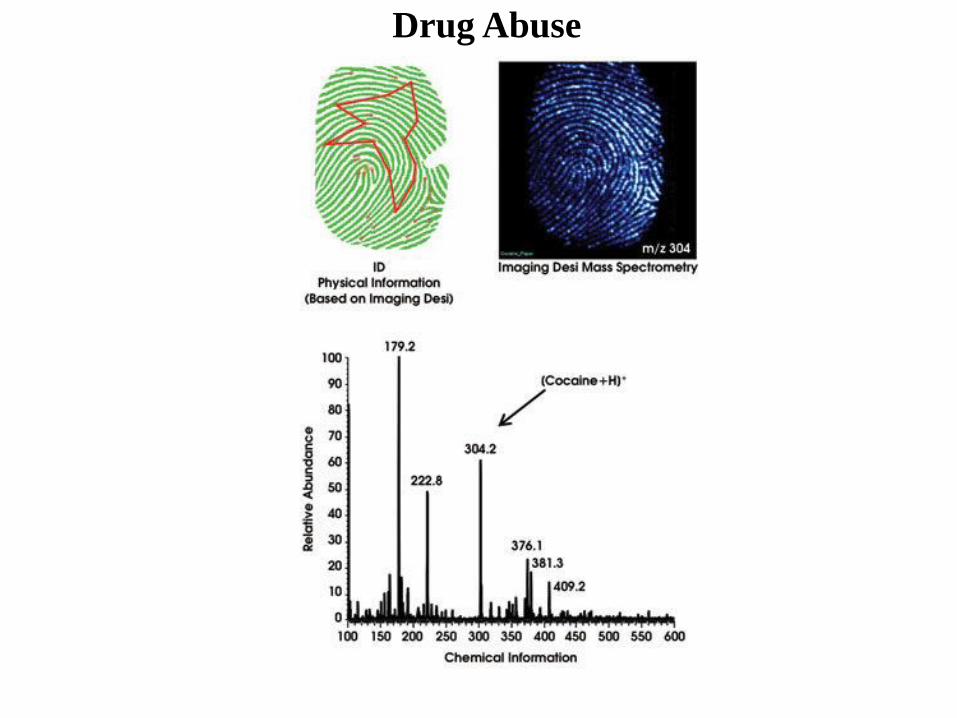
Drug Abuse
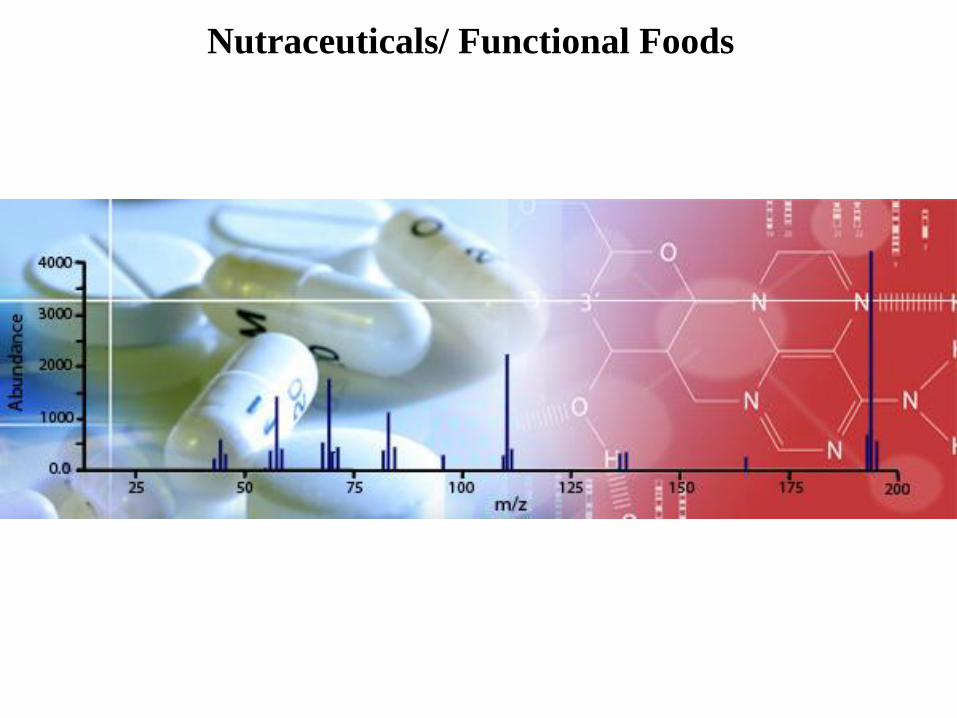
Nutraceuticals/ Functional Foods
Mass Spectrometry, O. David Sparkman, Global
View Publishing (2012)
LC/MS: A Practical User's Guide, Marvin C
McMaster, Wiley(2011)
Liquid Chromatography – Mass Spectrometry:
An Introduction, Robert E. Ardrey, Wiley (2009)
Mass Spectrometry: A Foundation Course, K.
Downard, RSC (2004) (ISBN 0854046097) Mass
Spectrometry: Principles and Applications,
Edmond de Hoffmann & Vincent Stroobant, 2
nd Ed., Wiley (2001)
REFERENCE
THANK YOU
Related Documents