RAPID COMMUNICATIONS IN MASS SPECTROMETRY Rapid Commun. Mass Spectrom. 2004; 18: 2577–2586 Published online in Wiley InterScience (www.interscience.wiley.com). DOI: 10.1002/rcm.1659 Mass spectrometric studies on the intrinsic stability of destruxin E from Metarhizium anisopliae Ed Dudley 1 *, Chengshu Wang 2 , Anke Skrobek 2 , Russell P. Newton 1,2 and Tariq M. Butt 2 1 Biomolecular Analysis Mass Spectrometry Laboratory, University of Wales Swansea, Swansea SA2 8PP, UK 2 School of Biological Sciences, University of Wales Swansea, Swansea SA2 8PP, UK Received 3 June 2004; Revised 1 September 2004; Accepted 1 September 2004 Destruxins are of current interest as bioactive agents. They are cyclic hexadepsipeptides produced by fungi, the most common destruxins, A, B and E, differing in the structure of a side chain. Before they can be widely used, the potential risk of destruxins and their metabolites entering the human food chain must to be assessed; thus, knowledge of the structures of their degradation products is essential. Here we report a study aimed at identifying, by tandem mass spectrometry and accurate mass analysis, the products resulting from thermally and temporally induced degradation of des- truxin E. The degradation products fell into two groups: those with relatively simple modifications of the side chain and those involving much more complex rearrangements. The structures of most of the degradation products were deduced from the MS data, with the major product being destrux- in E diol: significantly, this compound had previously been reported to have only been produced as a metabolic product of enzyme action rather than as a simple degradation product as demonstrated here. Copyright # 2004 John Wiley & Sons, Ltd. The entomogenous fungus Metarhizium anisopliae shows considerable promise as a biological control agent (BCA) for use in integrated pest management programmes, 1 where it may be applied as an environmental insecticide agent. 2,3 Several strains have been commercialised yet still much infor- mation is required by registration authorities regarding the risks it may pose to human health and the environment. Of particular concern are the bioactive metabolites secreted by Metarhizium. One major group of metabolites produced by this fungus consists of cyclic hexadepsipeptides called des- truxins. 4,5 These compounds are also known to be produced by the insect pathogen Aschersonia sp. 6 and the plant patho- gen Alternaria brassicae. 7 The most commonly produced destruxins are A, B and E with the latter usually predominat- ing. 4,8 The chemical structures of cyclic hexadepsipeptide destruxins A, B and E have the same backbone, with the gen- eral formula: – D -HA 1 - L -Pro 2 - L -Ile 3 - L -MeVal 4 - L -MeAla 5 -b- Ala 6 -, where HA is a D -a-hydroxy acid residue. The difference is found in the R residue (see Fig. 4) bound to HA which is – CH 2 –CH CH 2 , –CH 2 –CH(CH 3 ) 2 , and for dtx A, B and E, respectively. Some of the properties of these compounds have been reviewed by Vey et al. 5 and Pedras et al. 9 Little is known about the stability and fate of these com- pounds in the environment yet such information could help in risk assessment and possibly accelerate the registration process. Mass spectrometry has previously been applied to the analysis of destruxin metabolism, 10 identification from fungus extracts 11 and their gas-phase fragmentation, 12 and was therefore considered to be a useful technique for the study of destruxin E and related compounds. This paper provides the first detailed mass spectrometric analysis of the intrinsic stabi- lity of purified destruxins with attention focused on destruxin E, the most bioactive of the metabolites, 5,13 and its degradation products. This study forms part of a major programme to deter- mine if destruxins enter the food chain and pose a risk to humans and the environment. EXPERIMENTAL Chemicals All chemicals used were purchased from Fisher Scientific (UK) with the exception of leucine enkephalin purchased from Sigma Aldrich (UK). Water for the analytical analysis was prepared in-house using an Elix and Milli-Q system (Millipore, UK). Cultures and metabolites Metarhizium anisopliae strains V275 (isolated from Cydia pome- nella, Austria) and V245 (isolated from hay field soil, Finland) were grown in Czapek Dox liquid media and crude extracts of the metabolites prepared as described by Wang et al. 13 Destruxin E (dtx E) was purified using a Dionex HPLC system, equipped with a C18 reverse-phase column (Acclaim TM , silica, particle size: 5 mm, pore diameter: 120 A ˚ , length: 4.6 250 mm) and a UVD 340U diode-array detector at a flow rate of 1 mL/min. 13 Purified samples from different batch cultures were stored at 208C until required. Storage under different temperature conditions To evaluate the temperature stability of the purified dtx E as well as the comparative stability in crude extracts, the Copyright # 2004 John Wiley & Sons, Ltd. *Correspondence to: E. Dudley, BAMS Laboratory, University of Wales Swansea, Swansea, SA2 8PP, UK. E-mail: [email protected] Contract/grant sponsor: European Commission; contract/ grant number: QLK1-2001-01391.

Welcome message from author
This document is posted to help you gain knowledge. Please leave a comment to let me know what you think about it! Share it to your friends and learn new things together.
Transcript
RAPID COMMUNICATIONS IN MASS SPECTROMETRY
Rapid Commun. Mass Spectrom. 2004; 18: 2577–2586
Published online in Wiley InterScience (www.interscience.wiley.com). DOI: 10.1002/rcm.1659
Mass spectrometric studies on the intrinsic stability
of destruxin E from Metarhizium anisopliae
Ed Dudley1*, Chengshu Wang2, Anke Skrobek2, Russell P. Newton1,2 and Tariq M. Butt2
1Biomolecular Analysis Mass Spectrometry Laboratory, University of Wales Swansea, Swansea SA2 8PP, UK2School of Biological Sciences, University of Wales Swansea, Swansea SA2 8PP, UK
Received 3 June 2004; Revised 1 September 2004; Accepted 1 September 2004
Destruxins are of current interest as bioactive agents. They are cyclic hexadepsipeptides produced
by fungi, the most common destruxins, A, B and E, differing in the structure of a side chain. Before
they can be widely used, the potential risk of destruxins and their metabolites entering the human
food chain must to be assessed; thus, knowledge of the structures of their degradation products is
essential. Here we report a study aimed at identifying, by tandem mass spectrometry and accurate
mass analysis, the products resulting from thermally and temporally induced degradation of des-
truxin E. The degradation products fell into two groups: those with relatively simple modifications
of the side chain and those involving much more complex rearrangements. The structures of most
of the degradation products were deduced from the MS data, with the major product being destrux-
in E diol: significantly, this compound had previously been reported to have only been produced as
a metabolic product of enzyme action rather than as a simple degradation product as demonstrated
here. Copyright # 2004 John Wiley & Sons, Ltd.
The entomogenous fungus Metarhizium anisopliae shows
considerable promise as a biological control agent (BCA)
for use in integrated pest management programmes,1 where
it may be applied as an environmental insecticide agent.2,3
Several strains have been commercialised yet still much infor-
mation is required by registration authorities regarding the
risks it may pose to human health and the environment. Of
particular concern are the bioactive metabolites secreted by
Metarhizium. One major group of metabolites produced by
this fungus consists of cyclic hexadepsipeptides called des-
truxins.4,5 These compounds are also known to be produced
by the insect pathogen Aschersonia sp.6 and the plant patho-
gen Alternaria brassicae.7 The most commonly produced
destruxins are A, B and E with the latter usually predominat-
ing.4,8 The chemical structures of cyclic hexadepsipeptide
destruxins A, B and E have the same backbone, with the gen-
eral formula: –D-HA1-L-Pro2-L-Ile3-L-MeVal4-L-MeAla5-b-
Ala6-, where HA is a D-a-hydroxy acid residue. The difference
is found in the R residue (see Fig. 4) bound to HA which is –
CH2–CH CH2, –CH2–CH(CH3)2, and for
dtx A, B and E, respectively. Some of the properties of these
compounds have been reviewed by Vey et al.5 and Pedras
et al.9 Little is known about the stability and fate of these com-
pounds in the environment yet such information could help
in risk assessment and possibly accelerate the registration
process. Mass spectrometry has previously been applied to
the analysis of destruxin metabolism,10 identification from
fungus extracts11 and their gas-phase fragmentation,12 and
was therefore considered to be a useful technique for the study
of destruxin E and related compounds. This paper provides the
first detailed mass spectrometric analysis of the intrinsic stabi-
lity of purified destruxins with attention focused on destruxin
E, the most bioactive of the metabolites,5,13 and its degradation
products. This study forms part of a major programme to deter-
mine if destruxins enter the food chain and pose a risk to
humans and the environment.
EXPERIMENTAL
ChemicalsAll chemicals used were purchased from Fisher Scientific
(UK) with the exception of leucine enkephalin purchased
from Sigma Aldrich (UK). Water for the analytical analysis
was prepared in-house using an Elix and Milli-Q system
(Millipore, UK).
Cultures and metabolitesMetarhizium anisopliae strains V275 (isolated fromCydia pome-
nella, Austria) and V245 (isolated from hay field soil, Finland)
were grown in Czapek Dox liquid media and crude extracts
of the metabolites prepared as described by Wang et al.13
Destruxin E (dtx E) was purified using a Dionex HPLC
system, equipped with a C18 reverse-phase column
(AcclaimTM, silica, particle size: 5mm, pore diameter: 120 A,
length: 4.6� 250 mm) and a UVD 340U diode-array detector
at a flow rate of 1 mL/min.13 Purified samples from different
batch cultures were stored at �208C until required.
Storage under different temperature conditionsTo evaluate the temperature stability of the purified dtx E
as well as the comparative stability in crude extracts, the
Copyright # 2004 John Wiley & Sons, Ltd.
*Correspondence to: E. Dudley, BAMS Laboratory, University ofWales Swansea, Swansea, SA2 8PP, UK.E-mail: [email protected]/grant sponsor: European Commission; contract/grant number: QLK1-2001-01391.
purified and crude extracts of metabolites were prepared in
brown high-performance liquid chromatography (HPLC)
vials (Fisher) in triplicate and stored at �20, 4, 25, and 378C.
Material was also stored in an unheated greenhouse which
fluctuated in temperature (range 10–508C between March
and September). Purified and crude metabolites were
retrieved from the above treatments at 1 month intervals, dis-
solved in 0.5 mL methanol, and analysed by HPLC under the
conditions described above. Peak areas of the destruxin com-
pounds and their degradation products (where applicable)
were measured. UV peaks arising from suspected degrada-
tion products were numbered in order to identify them in
further experiments. The breakdown ratio (BR) of dtx E at
monthly time points was calculated as:
BRð%Þ ¼ SA� FA
SA� 100;
where SA is the start amount (mg) and FA is the final amount
(mg) of the destruxin.
Analytical analysisAny significant degradation products detected from the
HPLC-UV data were analysed by mass spectrometry in
order to study the structures of these compounds after the
fractionation of the different peaks. For the fractionation of
the degradation samples, the samples were run on a Vision
workstation with an inbuilt AFC2000 fraction collector
(Applied Biosystems, UK). An Acclaim column and gradient
were used as described previously in this paper with occa-
sional lengthening in time of the gradient sections in order
to improve the resolution between some of the closely eluting
peaks. Fractions were collected during the HPLC separation
and important fractions identified from their UV response
and correlation with the previously observed chromato-
graphic peaks numbered as describer earlier. The fractions
were concentrated to approximately 100mL using a Speed-
vac concentrator 5301 (Eppendorf) and these concentrated
fractions were applied to the following electrospray mass
spectrometry analyses.
The samples were first loop injected (1 mL) into a flow of
50:50 methanol/water at a flow rate of 4mL/min from an
Ultimate pump using a FAMOS autosampler (Dionex, UK)
connected to an LCQ DECAXP Plus ion trap electrospray
mass spectrometer (Thermo Finnigan, UK), operated in
positive ion mode with a spray voltage of 3.5 kV, a sheath
gas flow rate (arbitrary units) of 35, a capillary temperature
of 2008C and an electron multiplier voltage of �890 V. Mass
spectra were collected between m/z 50 and 2000. Major
[MþH]þ ions detected by this method for each of the fractions
were then subjected to repeated injections during which
the precursor [MþH]þ ion was fragmented using various
collision energies (usually enough to result in a precursor ion
of at most 10% relative abundance) and MS/MS data was
collected. Where the product ions were of sufficient abun-
dance, these also were fragmented to provide MS3 and MS4
spectra. The fractions were also infused at 1 mL/min onto
an Ultima Q-ToF (Waters, UK) using a nanolockspray ion
source and a reference sprayer which electrosprayed a
solution of 250 leucine enkephalin (fmol/mL in 50:50 0.1%
formic acid/acetonitrile). The fractions were diluted or
concentrated sufficiently to produce a reasonable signal
intensity and for this to be less than 200 counts per second,
thereby avoiding a dead time effect that would reduce mass
accuracy. Accurate mass electrospray conditions required
a spray voltage of 3 kV, a cone voltage of 100 V, a source
temperature of 808C, a cone gas flow of 50 L/h and a
nanoflow gas level of approximately 7 psi. Full scan mass
spectra were obtained between m/z 50 and 1600 with a
reference spray scan being performed once every 5 s, and
MS/MS scans were performed in the same manner with
varying collision energies being applied to the analyte spray
(enough to sufficiently fragment the precursor ion) and a
collision energy of 10 being applied to the reference spray.
The resulting mass spectra were adjusted using the reference
spectra and MassLynx 4.0 software in order to obtain the
resulting accurate mass spectra and empirical formulae of the
degradation products.
RESULTS
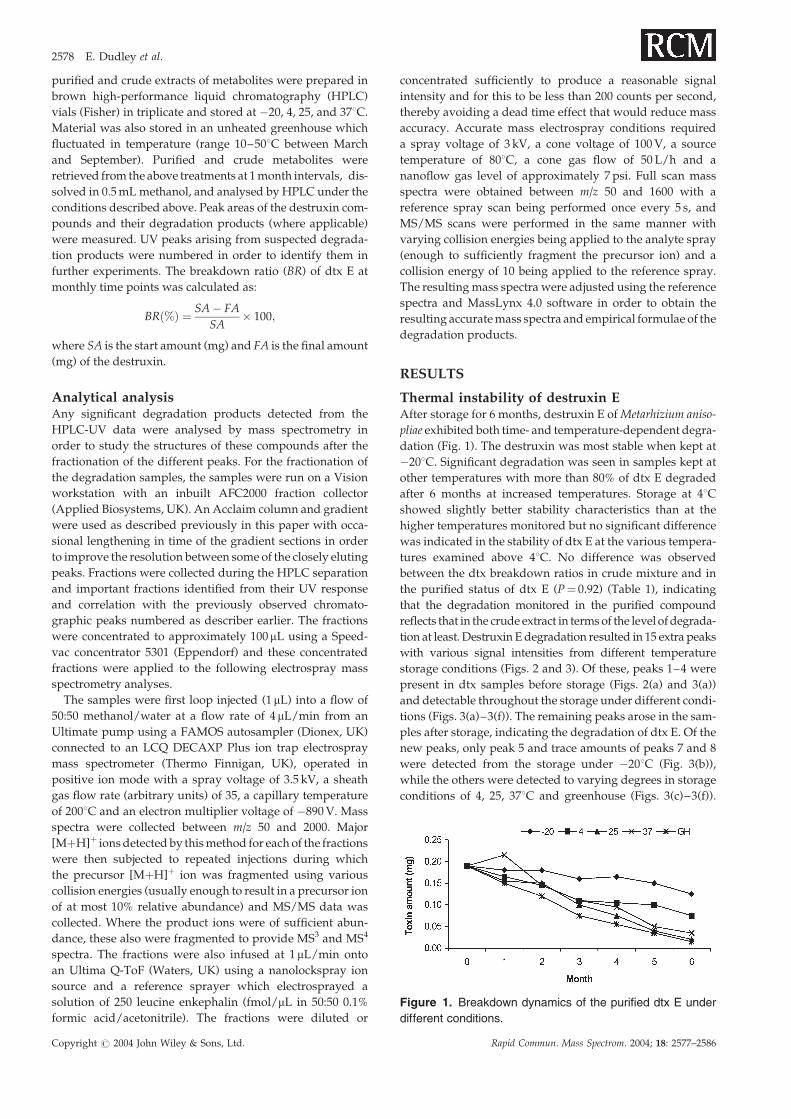
Thermal instability of destruxin EAfter storage for 6 months, destruxin E of Metarhizium aniso-
pliae exhibited both time- and temperature-dependent degra-
dation (Fig. 1). The destruxin was most stable when kept at
�208C. Significant degradation was seen in samples kept at
other temperatures with more than 80% of dtx E degraded
after 6 months at increased temperatures. Storage at 48Cshowed slightly better stability characteristics than at the
higher temperatures monitored but no significant difference
was indicated in the stability of dtx E at the various tempera-
tures examined above 48C. No difference was observed
between the dtx breakdown ratios in crude mixture and in
the purified status of dtx E (P¼ 0.92) (Table 1), indicating
that the degradation monitored in the purified compound
reflects that in the crude extract in terms of the level of degrada-
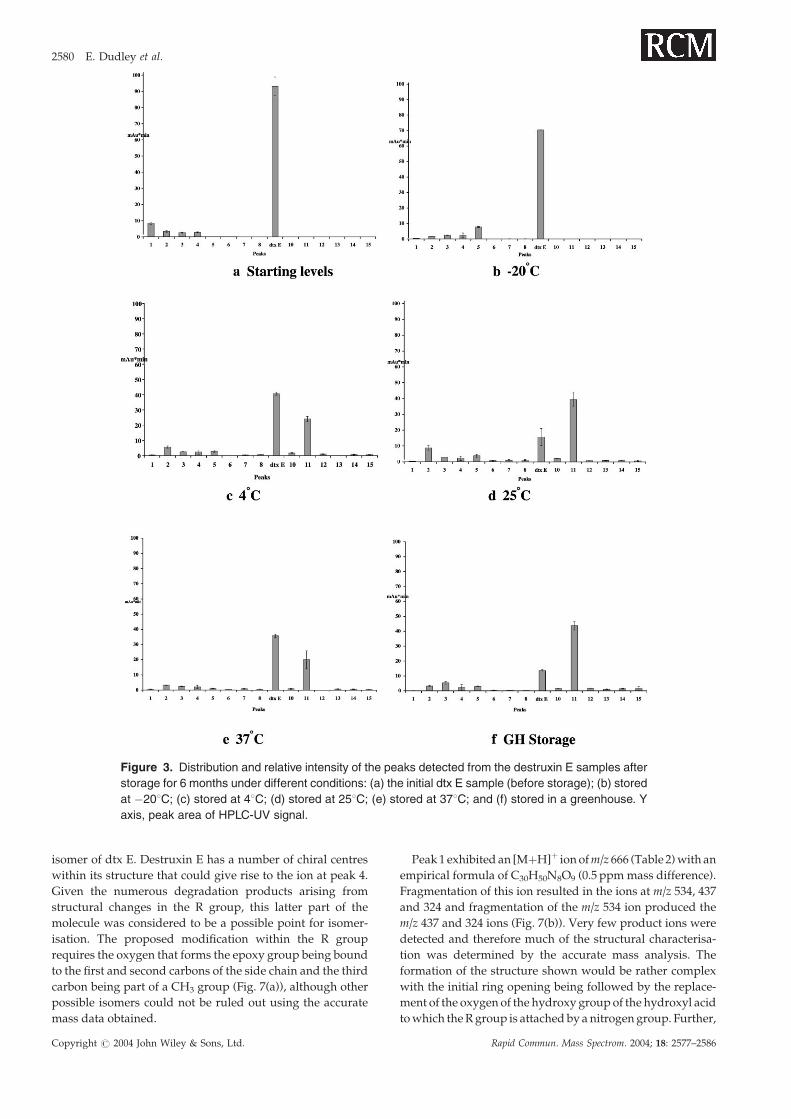
tion at least. Destruxin E degradation resulted in 15 extra peaks
with various signal intensities from different temperature
storage conditions (Figs. 2 and 3). Of these, peaks 1–4 were
present in dtx samples before storage (Figs. 2(a) and 3(a))
and detectable throughout the storage under different condi-
tions (Figs. 3(a)–3(f)). The remaining peaks arose in the sam-
ples after storage, indicating the degradation of dtx E. Of the
new peaks, only peak 5 and trace amounts of peaks 7 and 8
were detected from the storage under �208C (Fig. 3(b)),
while the others were detected to varying degrees in storage
conditions of 4, 25, 378C and greenhouse (Figs. 3(c)–3(f)).
Figure 1. Breakdown dynamics of the purified dtx E under
different conditions.
Copyright # 2004 John Wiley & Sons, Ltd. Rapid Commun. Mass Spectrom. 2004; 18: 2577–2586
2578 E. Dudley et al.
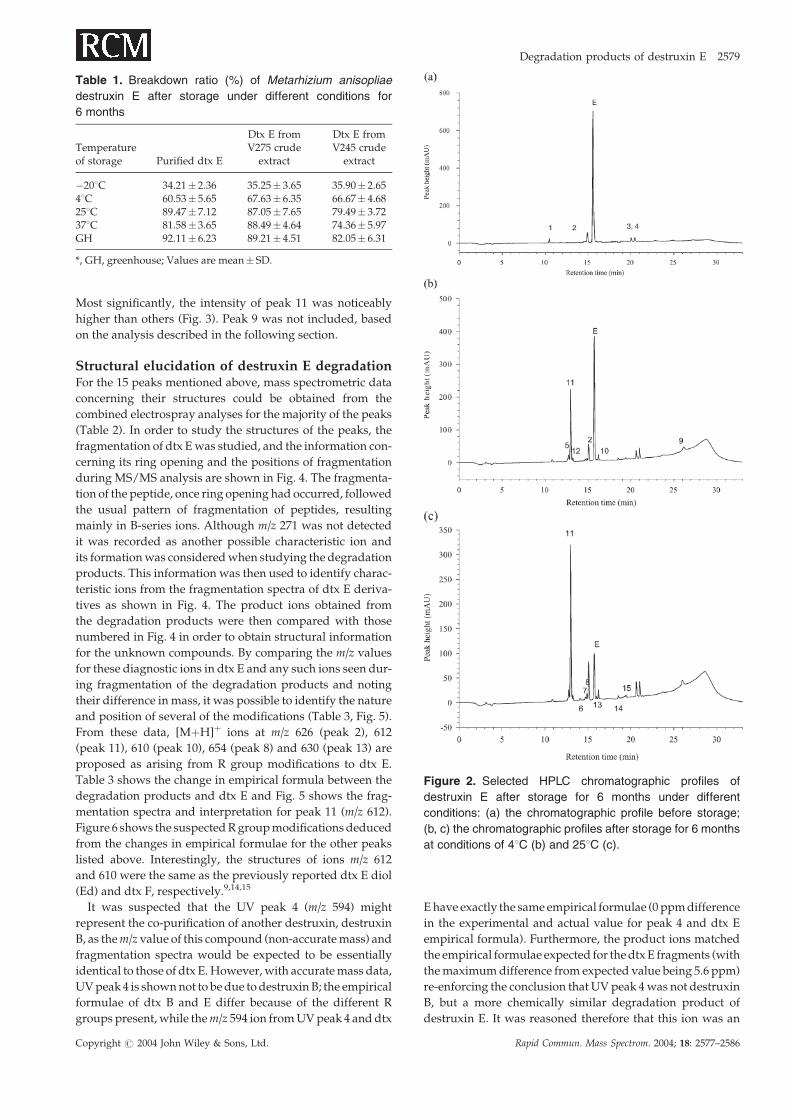
Most significantly, the intensity of peak 11 was noticeably
higher than others (Fig. 3). Peak 9 was not included, based
on the analysis described in the following section.
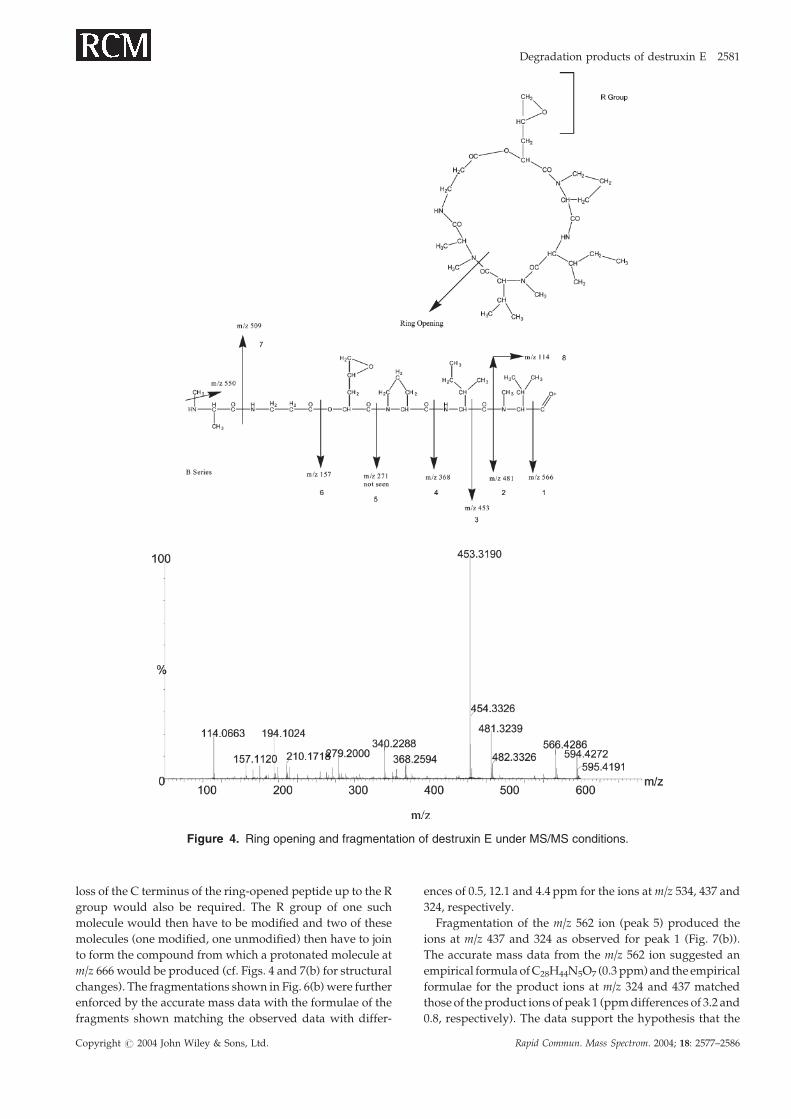
Structural elucidation of destruxin E degradationFor the 15 peaks mentioned above, mass spectrometric data
concerning their structures could be obtained from the
combined electrospray analyses for the majority of the peaks
(Table 2). In order to study the structures of the peaks, the
fragmentation of dtx E was studied, and the information con-
cerning its ring opening and the positions of fragmentation
during MS/MS analysis are shown in Fig. 4. The fragmenta-
tion of the peptide, once ring opening had occurred, followed
the usual pattern of fragmentation of peptides, resulting
mainly in B-series ions. Although m/z 271 was not detected
it was recorded as another possible characteristic ion and
its formation was considered when studying the degradation
products. This information was then used to identify charac-
teristic ions from the fragmentation spectra of dtx E deriva-
tives as shown in Fig. 4. The product ions obtained from
the degradation products were then compared with those
numbered in Fig. 4 in order to obtain structural information
for the unknown compounds. By comparing the m/z values
for these diagnostic ions in dtx E and any such ions seen dur-
ing fragmentation of the degradation products and noting
their difference in mass, it was possible to identify the nature
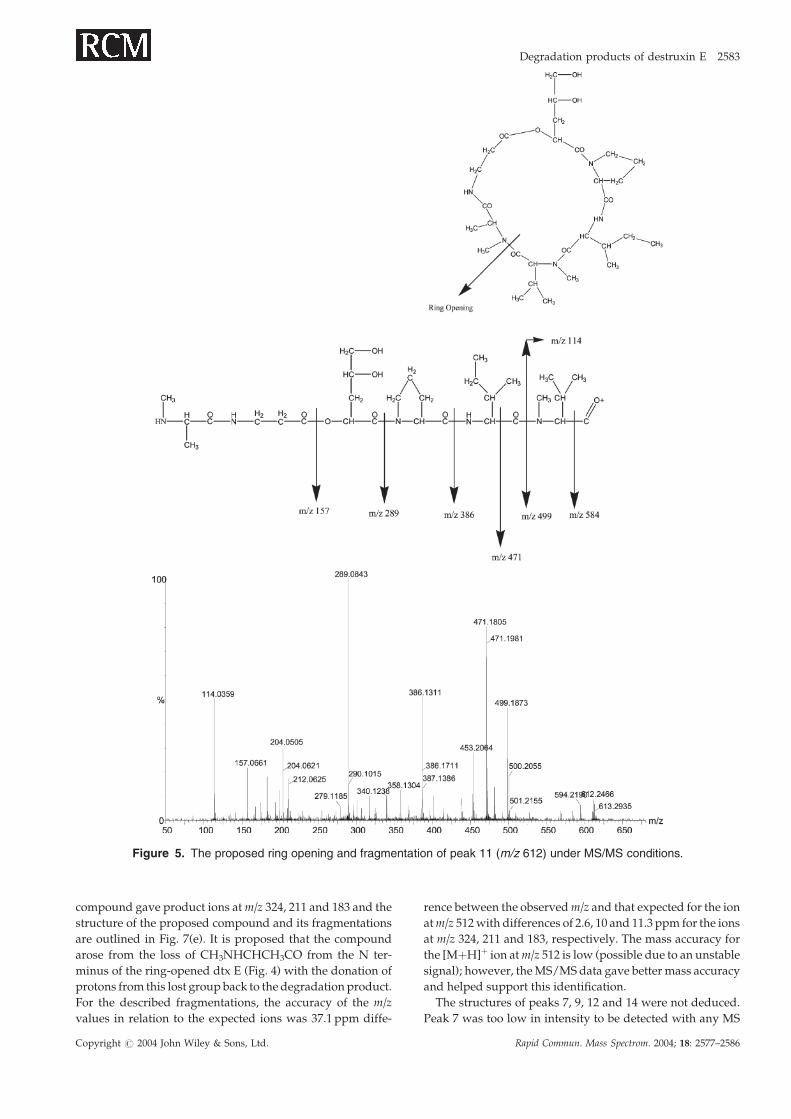
and position of several of the modifications (Table 3, Fig. 5).
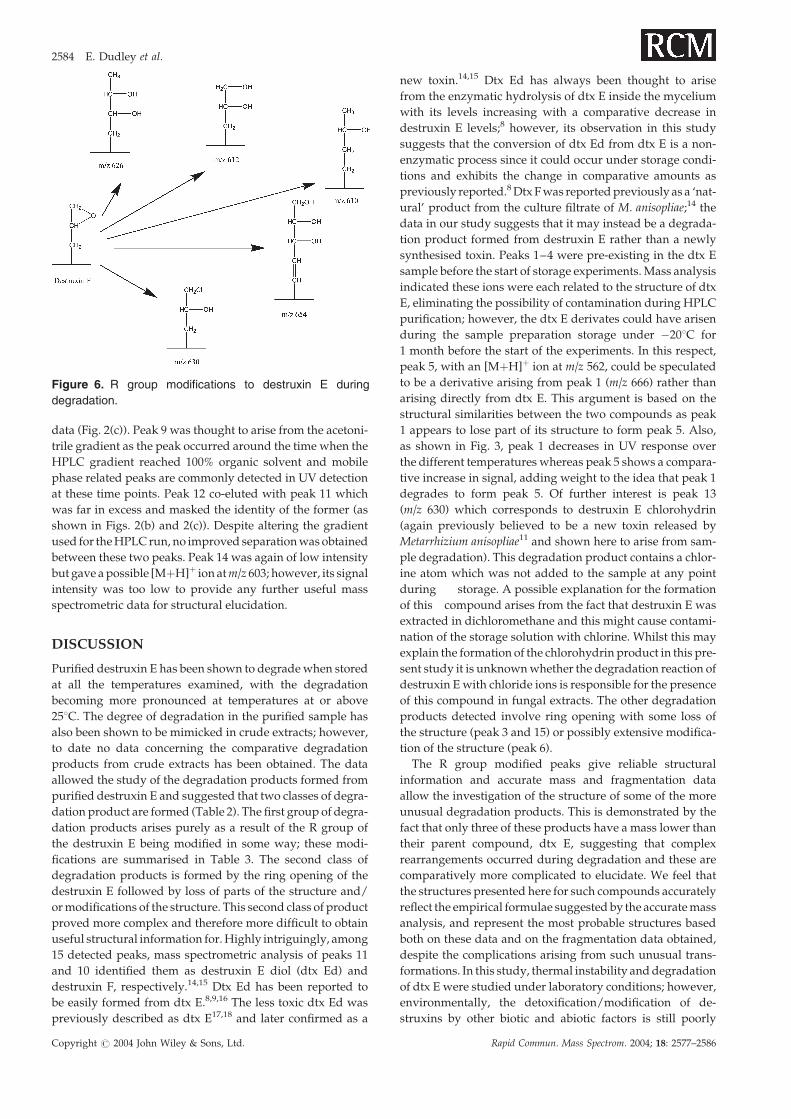
From these data, [MþH]þ ions at m/z 626 (peak 2), 612
(peak 11), 610 (peak 10), 654 (peak 8) and 630 (peak 13) are
proposed as arising from R group modifications to dtx E.
Table 3 shows the change in empirical formula between the
degradation products and dtx E and Fig. 5 shows the frag-
mentation spectra and interpretation for peak 11 (m/z 612).
Figure 6 shows the suspected R group modifications deduced
from the changes in empirical formulae for the other peaks
listed above. Interestingly, the structures of ions m/z 612
and 610 were the same as the previously reported dtx E diol
(Ed) and dtx F, respectively.9,14,15
It was suspected that the UV peak 4 (m/z 594) might
represent the co-purification of another destruxin, destruxin
B, as them/z value of this compound (non-accurate mass) and
fragmentation spectra would be expected to be essentially
identical to those of dtx E. However, with accurate mass data,
UV peak 4 is shown not to be due to destruxin B; the empirical
formulae of dtx B and E differ because of the different R
groups present, while them/z 594 ion from UV peak 4 and dtx
E have exactly the same empirical formulae (0 ppm difference
in the experimental and actual value for peak 4 and dtx E
empirical formula). Furthermore, the product ions matched
the empirical formulae expected for the dtx E fragments (with
the maximum difference from expected value being 5.6 ppm)
re-enforcing the conclusion that UV peak 4 was not destruxin
B, but a more chemically similar degradation product of
destruxin E. It was reasoned therefore that this ion was an
Table 1. Breakdown ratio (%) of Metarhizium anisopliae
destruxin E after storage under different conditions for
6 months
Temperatureof storage Purified dtx E
Dtx E fromV275 crude
extract
Dtx E fromV245 crude
extract
�208C 34.21� 2.36 35.25� 3.65 35.90� 2.6548C 60.53� 5.65 67.63� 6.35 66.67� 4.68258C 89.47� 7.12 87.05� 7.65 79.49� 3.72378C 81.58� 3.65 88.49� 4.64 74.36� 5.97GH 92.11� 6.23 89.21� 4.51 82.05� 6.31
*, GH, greenhouse; Values are mean� SD.
Figure 2. Selected HPLC chromatographic profiles of
destruxin E after storage for 6 months under different
conditions: (a) the chromatographic profile before storage;
(b, c) the chromatographic profiles after storage for 6 months
at conditions of 48C (b) and 258C (c).
Degradation products of destruxin E 2579
Copyright # 2004 John Wiley & Sons, Ltd. Rapid Commun. Mass Spectrom. 2004; 18: 2577–2586
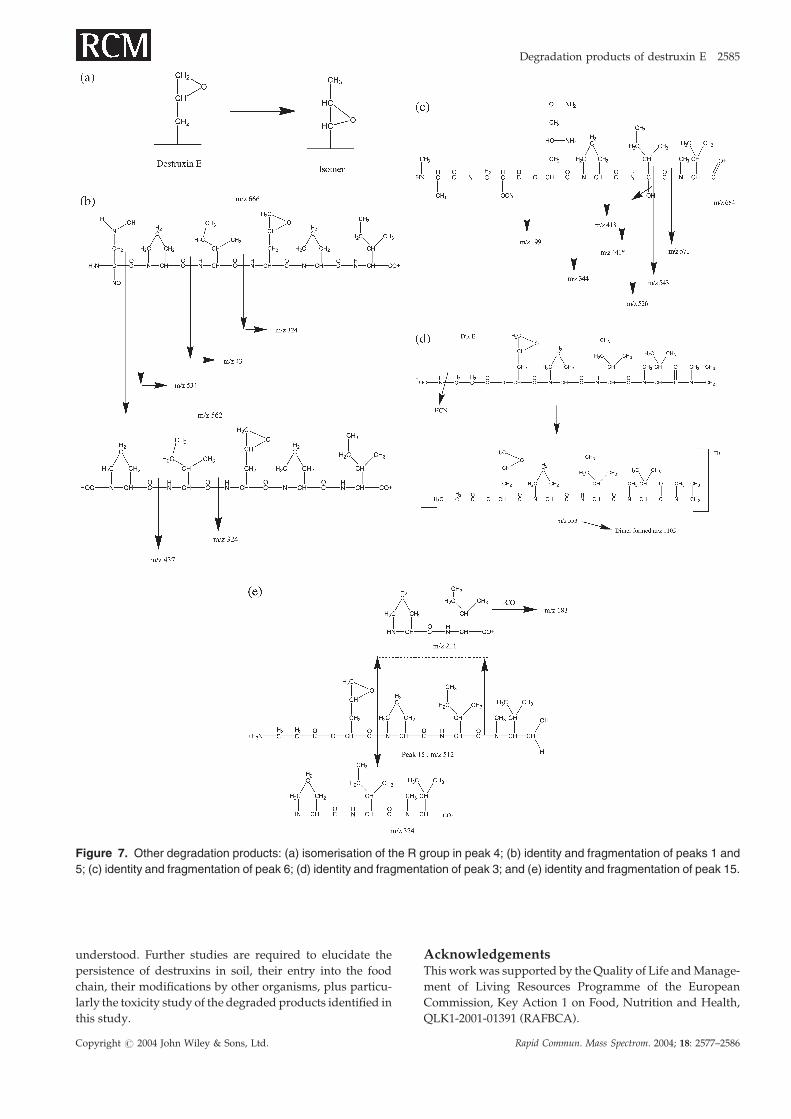
isomer of dtx E. Destruxin E has a number of chiral centres
within its structure that could give rise to the ion at peak 4.
Given the numerous degradation products arising from
structural changes in the R group, this latter part of the
molecule was considered to be a possible point for isomer-
isation. The proposed modification within the R group
requires the oxygen that forms the epoxy group being bound
to the first and second carbons of the side chain and the third
carbon being part of a CH3 group (Fig. 7(a)), although other
possible isomers could not be ruled out using the accurate
mass data obtained.
Peak 1 exhibited an [MþH]þ ion ofm/z 666 (Table 2) with an
empirical formula of C30H50N8O9 (0.5 ppm mass difference).
Fragmentation of this ion resulted in the ions at m/z 534, 437
and 324 and fragmentation of the m/z 534 ion produced the
m/z 437 and 324 ions (Fig. 7(b)). Very few product ions were
detected and therefore much of the structural characterisa-
tion was determined by the accurate mass analysis. The
formation of the structure shown would be rather complex
with the initial ring opening being followed by the replace-
ment of the oxygen of the hydroxy group of the hydroxyl acid
to which the R group is attached by a nitrogen group. Further,
Figure 3. Distribution and relative intensity of the peaks detected from the destruxin E samples after
storage for 6 months under different conditions: (a) the initial dtx E sample (before storage); (b) stored
at �208C; (c) stored at 48C; (d) stored at 258C; (e) stored at 378C; and (f) stored in a greenhouse. Y
axis, peak area of HPLC-UV signal.
2580 E. Dudley et al.
Copyright # 2004 John Wiley & Sons, Ltd. Rapid Commun. Mass Spectrom. 2004; 18: 2577–2586
loss of the C terminus of the ring-opened peptide up to the R
group would also be required. The R group of one such
molecule would then have to be modified and two of these
molecules (one modified, one unmodified) then have to join
to form the compound from which a protonated molecule at
m/z 666 would be produced (cf. Figs. 4 and 7(b) for structural
changes). The fragmentations shown in Fig. 6(b) were further
enforced by the accurate mass data with the formulae of the
fragments shown matching the observed data with differ-
ences of 0.5, 12.1 and 4.4 ppm for the ions at m/z 534, 437 and
324, respectively.
Fragmentation of the m/z 562 ion (peak 5) produced the
ions at m/z 437 and 324 as observed for peak 1 (Fig. 7(b)).
The accurate mass data from the m/z 562 ion suggested an
empirical formula of C28H44N5O7 (0.3 ppm) and the empirical
formulae for the product ions at m/z 324 and 437 matched
those of the product ions of peak 1 (ppm differences of 3.2 and
0.8, respectively). The data support the hypothesis that the
Figure 4. Ring opening and fragmentation of destruxin E under MS/MS conditions.
Degradation products of destruxin E 2581
Copyright # 2004 John Wiley & Sons, Ltd. Rapid Commun. Mass Spectrom. 2004; 18: 2577–2586
m/z 562 ion arose from the m/z 666 ion by loss of the N-
terminus section, as indicated in Fig. 7(b).
Peak 6 represents a compound that gives rise to a pro-
tonated molecule and its sodium adduct at m/z 684 and 706,
respectively. The accurate mass data for both ions indicate
that they differed from those expected for dtx E by the
addition of CH4N3O2 (4 ppm for m/z 684 and 2.7 ppm for
m/z 706). Fragmentation of them/z 684 ion produced very low
intensity MS/MS data; however, significant product ions
were detected at m/z 632, 571, 543, 526, 441, 413, 344, and 199
(Fig. 7(c)).The possibility that the m/z 684 ion was similar to
the ion at m/z 666 with the additional presence of an extra
water moiety was considered as they both exhibited a
product ion at m/z 324; however, the difference in fragmenta-
tion patterns and in the accurate mass data led to the rejection
of this option. The product ions of m/z 571 and 543 were
sufficient to give reliable accurate mass data and were shown
to be identical to the fragments 2 and 3 of dtx E (Fig. 4)
but with the addition of the extra atoms as described above
(7.7 and 8.5 ppm, respectively). Other product ions provided
unreliable accurate mass data and so the nominal masses
were considered along with the known fragmentation of
destruxin-like compounds. The mass differences between the
m/z 684 and the dtx E ions could generate an idea of the
structural differences between them but it was impossible to
identify exactly where the modification occurred on the R
group. The proposed structure represented a ‘best fit’ of the
data obtained (Fig. 7(c)). The asterisk in Fig. 7(c) denotes a
transfer of a proton from the ion formed in the mass spec-
trometer to the neutral C terminus to form the ion at m/z 441.
Peak 3 contained three significant ions: m/z 553 (approxi-
mately 30% relative abundance), m/z 1105 (100% relative
abundance) and m/z 1127 (10% abundance). Due to its high
m/z value, the m/z 1105 ion gave no accurate mass-defined
empirical formula and the fragmentation of this ion did not
yield reproducible MS/MS spectra. The m/z 553 ion was too
low in abundance to produce any useful fragmentation
spectra but an empirical formula of C28H49N4O7 could be
obtained (5.6 ppm). This empirical formula represented a loss
of NCO from, and an addition of a hydrogen atom to, dtx E.
The m/z 1105 ion corresponded to the protonated dimer
[2MþH]þ, a deduction supported by the presence of an ion of
m/z 1127 in which the proton is replaced by a sodium ion on
the dimer. The loss of the NCO from the dtx E would involve
ring opening and it is believed that this would occur at a
point from which NCO could be easily lost (Fig. 7(d)). It is
noteworthy that a second site also has the possibility of losing
HCN – indicated by the asterisk in Fig. 7(d), giving identical
accurate mass data. However, this possibility was considered
less likely as this site is adjacent to a proline amino acid
residue and these sections of peptide structures are not prone
to fragmentation or degradation due to the stability imparted
by the cyclic side chain structure of the proline amino acid.19
The ion atm/z 512 (peak 15) possessed an empirical formula
consistent with the structure of the protonated molecule of
dtx E minus a C4H4NO moiety. The MS/MS analysis of the
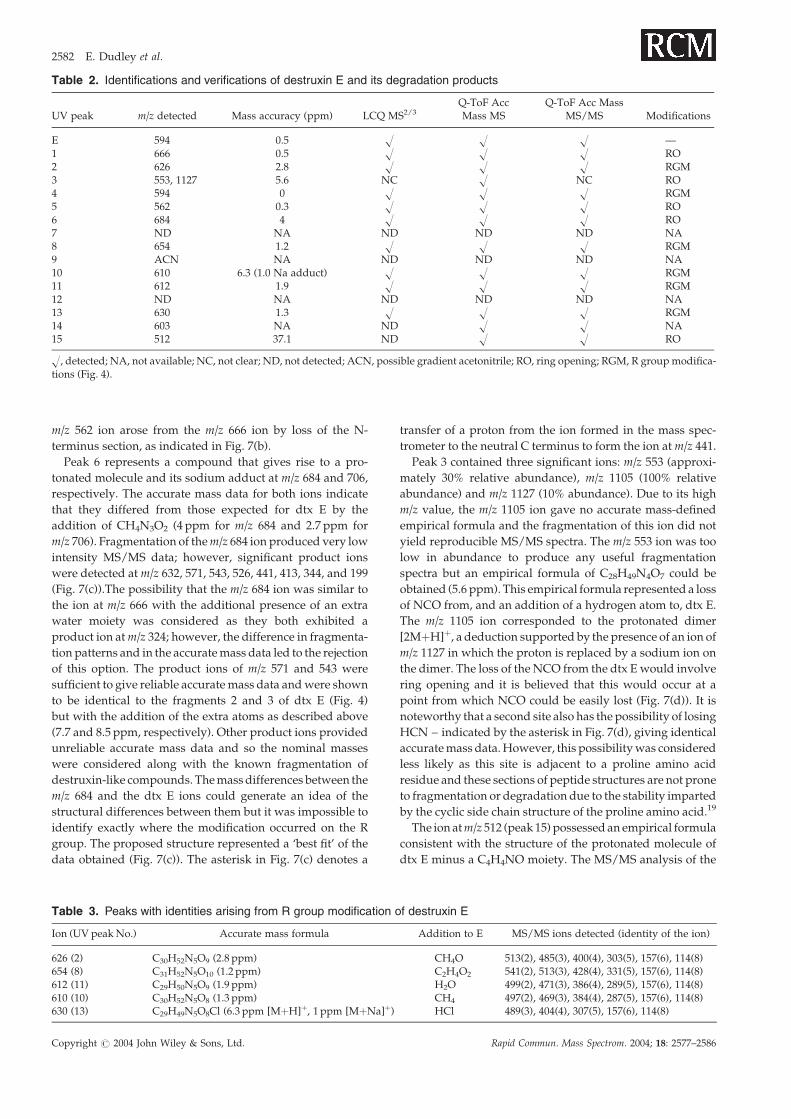
Table 3. Peaks with identities arising from R group modification of destruxin E
Ion (UV peak No.) Accurate mass formula Addition to E MS/MS ions detected (identity of the ion)
626 (2) C30H52N5O9 (2.8 ppm) CH4O 513(2), 485(3), 400(4), 303(5), 157(6), 114(8)654 (8) C31H52N5O10 (1.2 ppm) C2H4O2 541(2), 513(3), 428(4), 331(5), 157(6), 114(8)612 (11) C29H50N5O9 (1.9 ppm) H2O 499(2), 471(3), 386(4), 289(5), 157(6), 114(8)610 (10) C30H52N5O8 (1.3 ppm) CH4 497(2), 469(3), 384(4), 287(5), 157(6), 114(8)630 (13) C29H49N5O8Cl (6.3 ppm [MþH]þ, 1 ppm [MþNa]þ) HCl 489(3), 404(4), 307(5), 157(6), 114(8)
Table 2. Identifications and verifications of destruxin E and its degradation products
UV peak m/z detected Mass accuracy (ppm) LCQ MS2/3Q-ToF AccMass MS
Q-ToF Acc MassMS/MS Modifications
E 594 0.5 H H H —1 666 0.5 H H H RO2 626 2.8 H H H RGM3 553, 1127 5.6 NC H NC RO4 594 0 H H H RGM5 562 0.3 H H H RO6 684 4 H H H RO7 ND NA ND ND ND NA8 654 1.2 H H H RGM9 ACN NA ND ND ND NA10 610 6.3 (1.0 Na adduct) H H H RGM11 612 1.9 H H H RGM12 ND NA ND ND ND NA13 630 1.3 H H H RGM14 603 NA ND H H NA15 512 37.1 ND H H RO
H, detected; NA, not available; NC, not clear; ND, not detected; ACN, possible gradient acetonitrile; RO, ring opening; RGM, R group modifica-tions (Fig. 4).
2582 E. Dudley et al.
Copyright # 2004 John Wiley & Sons, Ltd. Rapid Commun. Mass Spectrom. 2004; 18: 2577–2586
compound gave product ions at m/z 324, 211 and 183 and the
structure of the proposed compound and its fragmentations
are outlined in Fig. 7(e). It is proposed that the compound
arose from the loss of CH3NHCHCH3CO from the N ter-
minus of the ring-opened dtx E (Fig. 4) with the donation of
protons from this lost group back to the degradation product.
For the described fragmentations, the accuracy of the m/z
values in relation to the expected ions was 37.1 ppm diffe-
rence between the observed m/z and that expected for the ion
atm/z 512 with differences of 2.6, 10 and 11.3 ppm for the ions
at m/z 324, 211 and 183, respectively. The mass accuracy for
the [MþH]þ ion at m/z 512 is low (possible due to an unstable
signal); however, the MS/MS data gave better mass accuracy
and helped support this identification.
The structures of peaks 7, 9, 12 and 14 were not deduced.
Peak 7 was too low in intensity to be detected with any MS
Figure 5. The proposed ring opening and fragmentation of peak 11 (m/z 612) under MS/MS conditions.
Degradation products of destruxin E 2583
Copyright # 2004 John Wiley & Sons, Ltd. Rapid Commun. Mass Spectrom. 2004; 18: 2577–2586
data (Fig. 2(c)). Peak 9 was thought to arise from the acetoni-
trile gradient as the peak occurred around the time when the
HPLC gradient reached 100% organic solvent and mobile
phase related peaks are commonly detected in UV detection
at these time points. Peak 12 co-eluted with peak 11 which
was far in excess and masked the identity of the former (as
shown in Figs. 2(b) and 2(c)). Despite altering the gradient
used for the HPLC run, no improved separation was obtained
between these two peaks. Peak 14 was again of low intensity
but gave a possible [MþH]þ ion atm/z 603; however, its signal
intensity was too low to provide any further useful mass
spectrometric data for structural elucidation.
DISCUSSION
Purified destruxin E has been shown to degrade when stored
at all the temperatures examined, with the degradation
becoming more pronounced at temperatures at or above
258C. The degree of degradation in the purified sample has
also been shown to be mimicked in crude extracts; however,
to date no data concerning the comparative degradation
products from crude extracts has been obtained. The data
allowed the study of the degradation products formed from
purified destruxin E and suggested that two classes of degra-
dation product are formed (Table 2). The first group of degra-
dation products arises purely as a result of the R group of
the destruxin E being modified in some way; these modi-
fications are summarised in Table 3. The second class of
degradation products is formed by the ring opening of the
destruxin E followed by loss of parts of the structure and/
or modifications of the structure. This second class of product
proved more complex and therefore more difficult to obtain
useful structural information for. Highly intriguingly, among
15 detected peaks, mass spectrometric analysis of peaks 11
and 10 identified them as destruxin E diol (dtx Ed) and
destruxin F, respectively.14,15 Dtx Ed has been reported to
be easily formed from dtx E.8,9,16 The less toxic dtx Ed was
previously described as dtx E17,18 and later confirmed as a
new toxin.14,15 Dtx Ed has always been thought to arise
from the enzymatic hydrolysis of dtx E inside the mycelium
with its levels increasing with a comparative decrease in
destruxin E levels;8 however, its observation in this study
suggests that the conversion of dtx Ed from dtx E is a non-
enzymatic process since it could occur under storage condi-
tions and exhibits the change in comparative amounts as
previously reported.8 Dtx F was reported previously as a ‘nat-
ural’ product from the culture filtrate of M. anisopliae;14 the
data in our study suggests that it may instead be a degrada-
tion product formed from destruxin E rather than a newly
synthesised toxin. Peaks 1–4 were pre-existing in the dtx E
sample before the start of storage experiments. Mass analysis
indicated these ions were each related to the structure of dtx
E, eliminating the possibility of contamination during HPLC
purification; however, the dtx E derivates could have arisen
during the sample preparation storage under �208C for
1 month before the start of the experiments. In this respect,
peak 5, with an [MþH]þ ion at m/z 562, could be speculated
to be a derivative arising from peak 1 (m/z 666) rather than
arising directly from dtx E. This argument is based on the
structural similarities between the two compounds as peak
1 appears to lose part of its structure to form peak 5. Also,
as shown in Fig. 3, peak 1 decreases in UV response over
the different temperatures whereas peak 5 shows a compara-
tive increase in signal, adding weight to the idea that peak 1
degrades to form peak 5. Of further interest is peak 13
(m/z 630) which corresponds to destruxin E chlorohydrin
(again previously believed to be a new toxin released by
Metarrhizium anisopliae11 and shown here to arise from sam-
ple degradation). This degradation product contains a chlor-
ine atom which was not added to the sample at any point
during storage. A possible explanation for the formation
of this compound arises from the fact that destruxin E was
extracted in dichloromethane and this might cause contami-
nation of the storage solution with chlorine. Whilst this may
explain the formation of the chlorohydrin product in this pre-
sent study it is unknown whether the degradation reaction of
destruxin E with chloride ions is responsible for the presence
of this compound in fungal extracts. The other degradation
products detected involve ring opening with some loss of
the structure (peak 3 and 15) or possibly extensive modifica-
tion of the structure (peak 6).
The R group modified peaks give reliable structural
information and accurate mass and fragmentation data
allow the investigation of the structure of some of the more
unusual degradation products. This is demonstrated by the
fact that only three of these products have a mass lower than
their parent compound, dtx E, suggesting that complex
rearrangements occurred during degradation and these are
comparatively more complicated to elucidate. We feel that
the structures presented here for such compounds accurately
reflect the empirical formulae suggested by the accurate mass
analysis, and represent the most probable structures based
both on these data and on the fragmentation data obtained,
despite the complications arising from such unusual trans-
formations. In this study, thermal instability and degradation
of dtx E were studied under laboratory conditions; however,
environmentally, the detoxification/modification of de-
struxins by other biotic and abiotic factors is still poorly
Figure 6. R group modifications to destruxin E during
degradation.
2584 E. Dudley et al.
Copyright # 2004 John Wiley & Sons, Ltd. Rapid Commun. Mass Spectrom. 2004; 18: 2577–2586
understood. Further studies are required to elucidate the
persistence of destruxins in soil, their entry into the food
chain, their modifications by other organisms, plus particu-
larly the toxicity study of the degraded products identified in
this study.
AcknowledgementsThis work was supported by the Quality of Life and Manage-
ment of Living Resources Programme of the European
Commission, Key Action 1 on Food, Nutrition and Health,
QLK1-2001-01391 (RAFBCA).
Figure 7. Other degradation products: (a) isomerisation of the R group in peak 4; (b) identity and fragmentation of peaks 1 and
5; (c) identity and fragmentation of peak 6; (d) identity and fragmentation of peak 3; and (e) identity and fragmentation of peak 15.
Degradation products of destruxin E 2585
Copyright # 2004 John Wiley & Sons, Ltd. Rapid Commun. Mass Spectrom. 2004; 18: 2577–2586
REFERENCES
1. Butt TM, Jackson CW, Magan N (eds). Fungi as BiocontrolAgents: Progress, Problems and Potential. CAB International:Wallingford, UK, 2001.
2. Ignoffo CM. In CRC Handbook of Natural Pesticides, vol. V.Microbial insecticides, Part A, Entomogenous protozoa andfungi. CRC Press Inc.: Boca Raton, 1988; 243.
3. Vestergaard S, Gillespie AT, Butt TM, Schreiter G, EilenbergJ. Biocontrol Sci. Technol. 1995; 5: 185.
4. Amiri-Besheli B, Khambay B, Cameron S, Deadman ML,Butt TM. Mycol. Res. 2000; 104: 447.
5. Vey A, Hoagland R, Butt TM. In Fungi as Biocontrol Agents:Progress, Problems and Potential, Butt TM, Jackson CW,Magan N (eds). CAB International: Wallingford, UK,2001; 311–345.
6. Krasnoff SB, Gibson DM, Belofsky GN, Gloer KB, Gloer JB.J. Nat Prod. 1996; 59: 485.
7. Pedras MSC, Zaharia IL, Gai Y, Zhou Y, Ward DE. Proc. NatlAcad. Sci. USA 2001; 98: 747.
8. Loutelier C, Cherton J-C, Lange C, Traris M, Vey A.J. Chromatogr. A 1996; 738: 181.
9. Pedras MSC, Zaharia LI, Ward DE. Phytochemistry 2002; 59:579.
10. Hubert M, Cherton J-C, Vey A, Lange C. Rapid Commun.Mass Spectrom. 1999; 13: 179.
11. Potterat O, Wagner K, Haag H. J. Chromatogr. A 2000; 872:85.
12. Loutelier C, Hubet M, Marcual A, Lange C, Mercadier J-L,Cavelier F, Verducci J, Jacquier R. Rapid. Commun. MassSpectrom. 1995; 9: 1512.
13. Wang C-S, Skrobek A, Butt TM. FEMS Microbiol. Lett. 2003;226: 373.
14. Wahlman M, Davidson BS. J. Nat. Prod. (Lloydia) 1993; 56: 643.15. Jegorov A, Sedmera P, Havlicek V, Matha V. Phytochemistry
1998; 49: 1815.16. Wang C-S, Skrobek A, Butt TM. J. Invertebr. Pathol. 2004; 85:
168.17. Cherton J-C, Lange C, Mulheim C, Pais M, Cassier P, Vey A.
J. Chromatogr. B 1991; 566: 511.18. Lange C, Loutelier C, Cherton JC, Cassier P, Vey A, Pais M.
Rapid Commun. Mass Spectrom. 1992; 6: 28.19. Liebler DC. Introduction to Proteomics: Tools for the New
Biology. Humana Press, Inc.: Towowa, NJ, 2003; 89–99.
2586 E. Dudley et al.
Copyright # 2004 John Wiley & Sons, Ltd. Rapid Commun. Mass Spectrom. 2004; 18: 2577–2586
Related Documents


