Mass spectrometric imaging for Tuberculosis drug development Sooraj Baijnath 2017

Welcome message from author
This document is posted to help you gain knowledge. Please leave a comment to let me know what you think about it! Share it to your friends and learn new things together.
Transcript
Mass spectrometric imaging for Tuberculosis drug
development
Sooraj Baijnath
2017


I
Mass spectrometric imaging for TB drug development Sooraj Baijnath
2017
This thesis is submitted to the School of Health Sciences, College of Health Science, University
of KwaZulu-Natal, Westville, to satisfy the requirements for the degree of PhD in Pharmaceutical
Chemistry.
The thesis format follows that which the chapters are written as a set of discrete research
publications that have either been accepted or submitted to internationally recognized ISI-rated
peer-reviewed journals. This includes an introduction and summary, which follow the format of
the Journal of Pharmaceutical and Biomedical Analysis.
This is to certify that the contents of this thesis is the original research work of Mr Sooraj Baijnath,
carried out under our supervision at the Catalysis and Peptide Research Unit, University of
KwaZulu-Natal, Westville Campus, Durban, South Africa.
Supervisor: Signed: ____________________Name: Prof. T Govender Date:_________________________ Co-Supervisor: Signed: ____________________Name: Prof. T Naicker Date:__________________________ Co-supervisor: Signed: ____________________Name: Prof. HG Kruger Date: _________________________
II
Abstract For many years, Tuberculosis (TB) has plagued the human race claiming millions, if not billions,
of lives. With the advent of short-course chemotherapy TB has become a manageable disease,
however in recent times Mycobacterium tuberculosis has developed resistance to a number of
established and trusted antibiotics. This coupled with severe forms of extra-pulmonary TB, has
placed significant emphasis on the development of new anti-TB agents.
The drug development process is a long and costly affair, with less than 1% of new drugs reaching
clinical trials. This is where molecular imaging, in particular mass spectrometry imaging (MSI),
is fast becoming a promising tool in the evaluation of drug candidates. MSI can be used to
streamline the drug development process by fast tracking areas of target identification, target
quantification, pharmacokinetics, drug distribution and tissue localization. MSI possesses some
distinct advantages in terms of sample preparation and the lack of the need for radiolabeling,
making it the ideal technique for in vivo tissue drug distribution studies.
The objectives of this study were to demonstrate the value of MSI in the development and
evaluation of new and existing TB antibiotics, focusing on central nervous system (CNS)
manifestations of the disease. In order to achieve these objectives, two of the most promising anti-
mycobacterial agents, clofazimine (CFZ) and linezolid (LIN), were selected. Initially, the
distribution of these agents in a healthy animal model was investigated, since these would represent
the minimum tissue concentrations achievable. The single-dose study for both drugs were similar,
in that there was poor penetration into the brain after a 100mg/kg dose in a healthy murine and
rodent model, respectively. A four-week multiple dose study was conducted, each of the
antibacterials showed excellent accumulation in the CNS, with preference to specific areas of the
brain, demonstrating the neuroprotective potential of these drugs (Chapters 2 and 3).
For the effective evaluation of anti-TB drugs, the lung has to be taken into consideration since this
is the primary site of M.tb infections. However, the lung poses problems in terms of sample
preparation for MSI. Since the lung is responsible for gaseous exchange, it is made up of a number
of air-filled spaces that are kept “open” by a fine balance in pressure, inside and outside the lung.
When this balance is disturbed, such as when the thoracic cavity is pierced, to collect tissue, the
lung collapses. This results in distortion of tissue structure and subsequent distribution information
can be misleading. For this reason, we evaluated various established cryoprotectants as lung
inflation media. This inflation procedure would main structural integrity of the lung and provide
III
accurate tissue distribution data. From the cryoprotective agents tested in this experiment we found
that 10% DMSO was ideal, in terms of structural preservation and accurate drug distribution
(Chapter 4).
As part of this series of experiments other anti-bacterial agents were also evaluated, to demonstrate
the value of MSI in drug development. These drugs also appear in the antibiotic pipeline;
tetracyclines, tigecycline (TIG) and doxycycline (DOX), rifampicin (RIF), gatifloxacin (GAT) and
pretomanid (PA-824). The findings were very interesting in that each agent displayed a unique
pattern of distribution, this is due to the chemical nature of these drugs and their interaction with
the blood-brain-barrier (BBB). In addition to this, we have demonstrated how MSI can be used to
determine various aspects of drug-tissue interaction for drug development. MSI was used to prove
that the chemical properties of a drug do not always govern its movement across the BBB. RIF is
a large drug molecule that one would not expect to permeate the brain, however this experiment
has demonstrated its time-dependent distribution in the brain (Chapter 5). The results show how
the tetracyclines have widespread tissue distribution in the brain, which contributes to their
efficacy in the treatment of brain damage (Chapters 6 and 7). This technique was also used to
understand how GAT enters the brain and contributes to the proven neurotoxicity of the
flouroquinolones (Chapter 8). In the final chapter, we showed how MSI can be used in the tissue
evaluation of novel antibiotics, such as pretomanid (Chapter 9). These findings emphasize the need
to evaluate the drug distribution of antibiotics, since pathogens manifest themselves in different
areas of the brain and cause damage. This information will be invaluable in our pursuit of effective
treatments to CNS diseases and disorders, allowing medical practitioners to develop more targeted
treatment programmes.
IV
Declaration I - Plagiarism declaration I, Sooraj Baijnath declare that
1. The research work reported in this thesis, except where otherwise indicated, is my original
research.
2. This thesis has not been submitted for any degree or examination at any other university.
3. This thesis does not contain other person’s data, pictures, graphs or other information,
unless specifically acknowledged as being sourced from other persons.
4. This thesis does not contain other person’s writing, unless specifically acknowledged as
being sourced from other researchers. In cases where other written sources have been
quoted:
a. Their words have been re-written but the general information attributed to them has
been referenced.
b. Where their exact words have been used, then their writing has been placed in italics
and inside quotation marks, and referenced.
5. This thesis does not contain text, graphics or tables copied and pasted from the internet,
unless specifically acknowledged, and the source being detailed in the thesis and in the
references sections.
Signed
______________________ Sooraj Baijnath

V
Declaration II – Publications A. Publications for degree purposes
1. Evidence for the presence of clofazimine and its distribution in the healthy mouse brain (Chapter 2). Published
Sooraj Baijnath, Suhashni Naiker, Adeola Shobo, Chivonne Moodley, John Adamson, Bongani Ngcobo, Linda A. Bester, Sanil D. Singh, Hendrick G. Kruger, Tricia Naicker, Thavendran Govender. Journal of Molecular Histology. 46.4-5 (2015):439-442. Sooraj Baijnath contributed to the design of the project, carried out all of the animal experimentation, tissue analysis and wrote the publication. S. Naiker assisted with preparation of the manuscript and pK analysis. A. Shobo assisted with MSI and LC-MS analysis. C. Moodley, B. Ngcobo, LA. Bester and SD. Singh assisted in various aspects of the animal experimentation. J. Adamson assisted in LC-MS analysis. The remaining authors are supervisors and contributed to the writing of the publication.
2. The neuroprotective potential of Linezolid: a quantitative and distribution study via mass spectrometry (Chapter 3). Published Sooraj Baijnath, Adeola Shobo, Linda A. Bester, Sanil D. Singh, Hendrick G. Kruger, Per I. Arvidsson, Tricia Naicker, Thavendran Govender. Journal of Molecular Histology. 47.4 (2016):429-435. Sooraj Baijnath contributed to the design of the project, carried out all of the animal experimentation, tissue analysis and wrote the publication. A. Shobo assisted with MSI and LC-MS analysis. LA. Bester and SD. Singh assisted with and supervised animal experiments. The remaining authors are supervisors and contributed to the writing of the publication
3. Small molecule distribution in rat lung: A comparison of various cryoprotectants as inflation media and their applicability to MSI (Chapter 4). Published
Sooraj Baijnath, Adeola Shobo, Linda A. Bester, Sanil D. Singh, Hendrick G. Kruger, Tricia Naicker, Thavendran Govender. Molecular Histology. 42.2 (2016):213-219. Sooraj Baijnath contributed to the design of the project, carried out all of the animal experimentation, tissue analysis and wrote the publication. The remaining authors are supervisors and contributed to the writing of the publication. A. Shobo assisted with MSI and LC-MS analysis. LA. Bester and SD. Singh assisted with and supervised animal experiments. The remaining authors are supervisors and contributed to the writing of the publication

VI
4. Development and Validation of a Liquid chromatography-tandem mass spectrometry (LC-MS/MS) Method for the quantification of Tigecycline in rat brain tissues (Chapter 5). Published Chiedza F. Munyeza, Adeola Shobo, Sooraj Baijnath, Dominika Bratkowska, Suhashni Naiker, Linda A. Bester, Sanil D. Singh, Glenn E. M. Maguire, Hendrik G. Kruger, Tricia Naicker, Thavendran Govender. Biomedical Chromatography. 30.6 (2016): 837-845. Sooraj Baijnath led the animal experimentation, consulted on the LC-MS/MS method development, aided in data analysis and assisted in the preparation of the manuscript.
5. MALDI MSI and LCMS/MS: Towards preclinical determination of the neurotoxic potential of fluoroquinolones (Chapter 6). Published Adeola Shobo, Sooraj Baijnath, Dominika Bratkowska, Suhashni Naiker, Anou M. Somboro, Linda A. Bester, Sanil D. Singh, Tricia Naicker, Hendrik G. Kruger, Thavendran Govender. Drug Testing and Analysis. 8.8 (2016):832-838 Sooraj Baijnath led the animal experimentation, consulted on the LC-MS/MS method development, aided in data analysis and assisted in the preparation of the manuscript.
6. Rapid and Widespread Distribution of Doxycycline in Rat Brain: A Mass Spectrometric Imaging Study (Chapter 7). Published Chiedza F Munyeza, Adeola Shobo, Sooraj Baijnath, Dominika Bratkowska, Suhashni Naiker, Linda A Bester, Sanil D Singh, Glenn EM Maguire, Tricia Naicker, Hendrik G. Kruger, Thavendran Govender. Xenobiotica. 46.5(2015):385-392 Sooraj Baijnath led the animal experimentation, consulted on the LC-MS/MS method development, aided in data analysis and assisted in the preparation of the manuscript.
7. Tissue distribution of Pretomanid in rat brain via mass spectrometry imaging (Chapter 8). Published Adeola Shobo, Dominika Bratkowska, Sooraj Baijnath, Suhashni Naicker, Anou M. Somboro, Linda A. Bester, Sanil D. Singh, Hendrik G. Kruger, Tricia Naicker, Thavendran Govender. Xenobiotica. 46.3 (2015):247-252 Sooraj Baijnath led the animal experimentation, consulted on the LC-MS/MS method development, aided in data analysis and assisted in the preparation of the manuscript.
VII
8. Visualization of time dependent distribution of rifampicin in rat brain using MALDI MSI and quantitative LCMS/MS (Chapter 9). Published Adeola Shobo, Dominika Bratkowska, Sooraj Baijnath, Suhashni Niacker, Linda A. Bester, Sanil D. Singh, Glenn E. Maguire, Hendrik G. Kruger, Thavendran Govender. Assay and Drug Development Technologies 2015. 13(5) 277-284 Sooraj Baijnath led the animal experimentation, consulted on the LC-MS/MS method development, aided in data analysis and assisted in the preparation of the manuscript.
B. Publications for non-degree purposes
9. Antibiotic resistance profiles of Campylobacter species in the South Africa private health care sector. C.O Shobo, L.A Bester, S. Baijnath, A.M Somboro, A.K.C. Peer and S.Y Essack. The Journal of Infection in Developing Countries 2016. Accepted. Sooraj Baijnath contributed to the development and optimization of all molecular biology protocols and assisted in the preparation of the manuscript.
10. Plasmid-mediated resistance and virulence mechanisms in the private health sector in KwaZulu-Natal, South Africa: An investigation of methicillin resistant Staphylococcus aureus (MRSA) clinical isolates collected during a three month period. Daniel G. Amoako, Linda A. Bester, Anou M. Somboro, Sooraj Baijnath, Chetna N. Govind, Sabiha Y. Essack. International Journal of Infectious Disease 2016. DOI: /doi:10.1016/j.ijid.2016.03.019 Sooraj Baijnath contributed to the development and optimization of all molecular biology protocols and assisted in the preparation of the manuscript.
VIII
Acknowledgements
I would like to express my most sincere words of gratitude to:
• My supervisors, Prof Thavendran Govender, Dr Tricia Naicker, Prof Gert Kruger and Prof
Per Arvidsson, for their remarkable guidance, support and motivation throughout my
studies. They have provided me with the ideal platform to hone my research capabilities,
while helping me to develop personally.
• My role model, Dr Sanil Singh, for constant motivation and personal support during some
of the most trying times in my life and career. For always believing in me and pushing me
to go further.
• My lifelong friend, Jyotibon Dutta, for professional, emotional and personal support. We
met as strangers and will be friends for life.
• My mentors Dr Adeola Shobo and Dr Dominika Bratkowska, for their training and
technical assistance throughout my degree.
• Dr Byron Peters and the CPRU group 2014/2015/2016 for their professionalism, eagerness
to assist and each having the ability to be a teamer player.
• Dr Linda Bester and the staff of the Biomedical Resource Unit, UKZN Westville, for use
of their facilities and their technical assistance during all the animal experiments.
• Ms Chivonne Moodley, Mr Bongani Ngcobo and the staff at the Africa Health Research
Institute, for their technical expertise and assistance with TB-related projects.
• My mum and sister, for tolerating me and putting up with all the stress that I put them
through during the recent years. For continuing to motivating me and for believing in my
abilities.
• National Research Foundation (NRF, SA), AspenPharmacare and the University of
KwaZulu-Natal (College of Health Sciences), for financial support.
• Lastly, to my late dad, Mr Madhanlall Baijnath, for giving me teachings that have never
left me and made me the man that I am today. A real inspiration and a constant source of
motivation for me to achieve anything. This is for you Dad!
Table of Contents
Abstract ......................................................................................................................................... II
Declaration I - Plagiarism declaration ...................................................................................... IV
Declaration II - Publications ....................................................................................................... V
A. Publications for degree purposes ......................................................................................................... VB. Publications for non-degree purposes ............................................................................................... VII
Acknowledgements .................................................................................................................. VIII
Chapter 1 - Introduction .............................................................................................................. 1
1.1 Importance of molecular imaging in drug development .....................................................................11.2 Mass Spectrometry Imaging: the latest technology in molecular imaging .........................................31.3 LC-MS/MS: the gold standard in drug quantitation ............................................................................61.4 Tuberculosis ........................................................................................................................................81.5 Clofazimine .......................................................................................................................................101.6 Linezolid ............................................................................................................................................111.7 Rifampicin .........................................................................................................................................131.8 Tetracyclines: Tigecycline and Doxycycline ....................................................................................14
1.8.1 Tigecycline .................................................................................................................................141.8.2 Doxycycline ...............................................................................................................................15
1.9 Gatifloxacin .......................................................................................................................................161.10 Pretomanid .......................................................................................................................................161.11 Drug Penetration in the Brain ..........................................................................................................171.12 Molecular Imaging of the Lung and its Associated Difficulty ........................................................181.13 Cryopreservation and Cryoprotectants ............................................................................................201.14 Research Questions .........................................................................................................................211.15 Outline of thesis ...............................................................................................................................21References ...............................................................................................................................................22
Chapter 2 – Paper 1 .................................................................................................................... 29
Evidence for the presence of Clofazimine and its distribution in the healthy mouse brain 29Abstract ....................................................................................................................................................30Introduction .............................................................................................................................................31Materials and Methods ............................................................................................................................32Results and Discussion ............................................................................................................................33Conclusion ...............................................................................................................................................37Funding ....................................................................................................................................................37Conflict of interest ...................................................................................................................................37References ...............................................................................................................................................38

Chapter 3 – Paper 2 .................................................................................................................... 40
Neuroprotective potential of Linezolid: A quantitative and distribution study via mass
spectrometry ................................................................................................................................ 40Abstract ....................................................................................................................................................41Materials and Methods ............................................................................................................................44Results and Discussion ............................................................................................................................47Conclusion ...............................................................................................................................................55Funding ....................................................................................................................................................55Conflict of interest ...................................................................................................................................55References ...............................................................................................................................................56
Chapter 4 – Paper 3 .................................................................................................................... 58
Small molecule distribution in rat lung: A comparison of various cryoprotectants as
inflation media and their applicability to MSI ......................................................................... 58
Abstract ....................................................................................................................................................59Introduction .............................................................................................................................................60Materials and Methods ............................................................................................................................62Results and Discussion ............................................................................................................................65Conclusion ...............................................................................................................................................72Funding ....................................................................................................................................................72Conflict of interest ...................................................................................................................................72References ...............................................................................................................................................73
Chapter 5 – Paper 4 .................................................................................................................... 75
Visualization of time dependent distribution of rifampicin in rat brain using MALDI MSI
and quantitative LCMS/MS ....................................................................................................... 75
Abstract ....................................................................................................................................................76Introduction .............................................................................................................................................77Materials and methods .............................................................................................................................78Results and Discussion ............................................................................................................................82Acknowledgements .................................................................................................................................87Author disclosure statement ....................................................................................................................87References ...............................................................................................................................................88
Chapter 6 – Paper 5 .................................................................................................................... 90
Development and Validation of a Liquid chromatography-tandem mass spectrometry (LC-
MS/MS) Method for the quantification of Tigecycline in rat brain tissues ........................... 90Abstract ....................................................................................................................................................91Introduction .............................................................................................................................................92Materials and methods .............................................................................................................................94Results and discussion .............................................................................................................................99Conclusion .............................................................................................................................................110Acknowledgements ...............................................................................................................................110References .............................................................................................................................................111
Chapter 7 – Paper 6 .................................................................................................................. 114
Rapid and Widespread Distribution of Doxycycline in Rat Brain: A Mass Spectrometric
Imaging Study ........................................................................................................................... 114
Abstract ..................................................................................................................................................115Introduction ...........................................................................................................................................116Materials and methods ...........................................................................................................................117Results and Discussion ..........................................................................................................................121Conclusion .............................................................................................................................................130Acknowledgements ...............................................................................................................................130Conflict of Interest .................................................................................................................................130References .............................................................................................................................................131
Chapter 8 – Paper 7 .................................................................................................................. 133
MALDI MSI and LCMS/MS: Towards preclinical determination of the neurotoxic
potential of fluoroquinolones ................................................................................................... 133
Abstract ..................................................................................................................................................134Introduction ...........................................................................................................................................135Materials and Methods ..........................................................................................................................136Results and discussion ...........................................................................................................................140Conclusion .............................................................................................................................................147Conflict of interest .................................................................................................................................147References .............................................................................................................................................148

Chapter 9 – Paper 8 .................................................................................................................. 151
Tissue Distribution of Pretomanid in Rat Brain via Mass Spectrometry Imaging ............. 151
Abstract ................................................................................................................................................152Introduction .........................................................................................................................................153Materials and methods ........................................................................................................................154Results ...................................................................................................................................................157Discussion .............................................................................................................................................161Declaration of interest .........................................................................................................................162References ............................................................................................................................................163
Chapter 10 - Summary ............................................................................................................. 165

0
1
Chapter 1 - Introduction
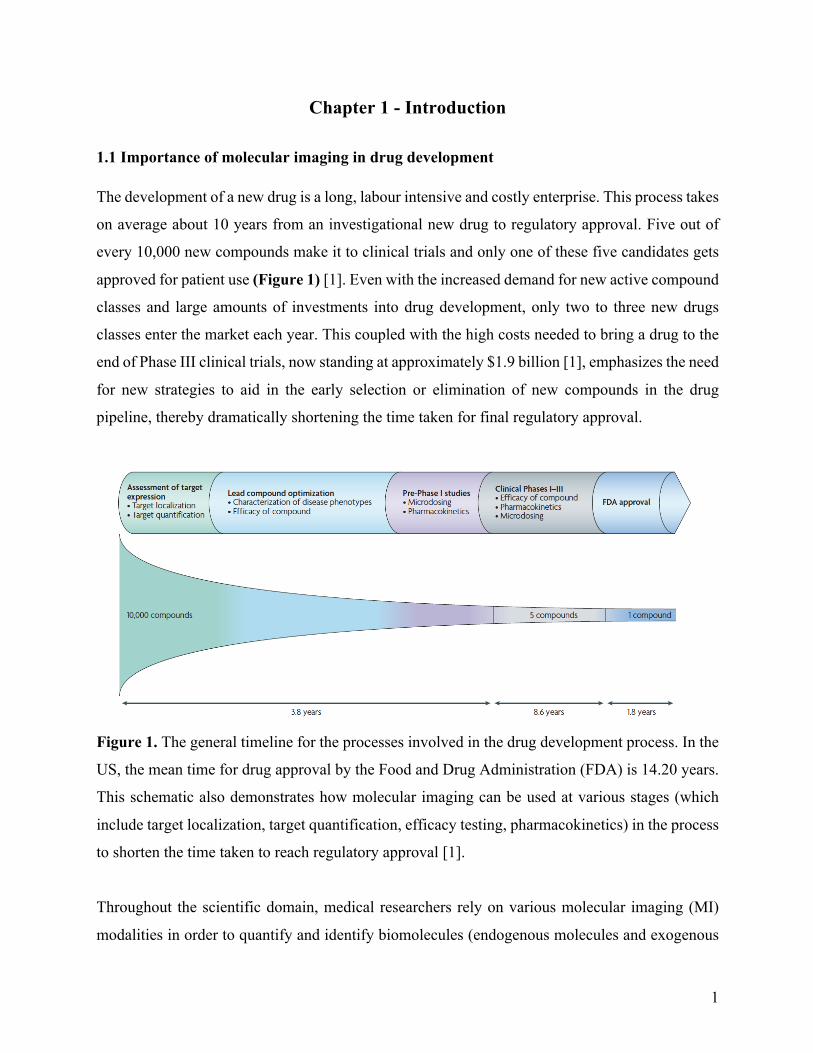
1.1 Importance of molecular imaging in drug development The development of a new drug is a long, labour intensive and costly enterprise. This process takes
on average about 10 years from an investigational new drug to regulatory approval. Five out of
every 10,000 new compounds make it to clinical trials and only one of these five candidates gets
approved for patient use (Figure 1) [1]. Even with the increased demand for new active compound
classes and large amounts of investments into drug development, only two to three new drugs
classes enter the market each year. This coupled with the high costs needed to bring a drug to the
end of Phase III clinical trials, now standing at approximately $1.9 billion [1], emphasizes the need
for new strategies to aid in the early selection or elimination of new compounds in the drug
pipeline, thereby dramatically shortening the time taken for final regulatory approval.
Figure 1. The general timeline for the processes involved in the drug development process. In the
US, the mean time for drug approval by the Food and Drug Administration (FDA) is 14.20 years.
This schematic also demonstrates how molecular imaging can be used at various stages (which
include target localization, target quantification, efficacy testing, pharmacokinetics) in the process
to shorten the time taken to reach regulatory approval [1].
Throughout the scientific domain, medical researchers rely on various molecular imaging (MI)
modalities in order to quantify and identify biomolecules (endogenous molecules and exogenous
2
probes) and drugs [2]. MI at the early stages of the drug development process allows for the high-
throughput screening of cell and animal-based assays while providing essential evidence on
biological activity, target identification, drug efficacy and toxicity [1]. All of this combined allows
the researcher to evaluate drug treatments and understand the mechanistics that underline the
associated biological responses such as enzyme activity, gene expression, ligand/receptor binding,
receptor distribution and transporter activity.
Commonly used MI techniques are computed tomography (CT), positron emission tomography
(PET), magnetic resonance imaging (MRI), single photon emission computed tomography
(SPECT), ultrasound and optical imaging [1-4]. These technologies have wide application ranges
and are used for diagnostics, therapeutics and the pre-clinical evaluation of drug candidates. Each
technique possesses its own pro’s and con’s for example, many provide excellent clinical
translation however are very expensive to conduct and some have limited spatial resolution (Table
1). In addition to this, those that use radiolabeled tracers (PET, CT) have the added occupational
hazards associated with exposure to radioactive materials. A new MI modality that has come to
the forefront of drug development investigations in the form of mass spectrometry imaging (MSI)
[3].
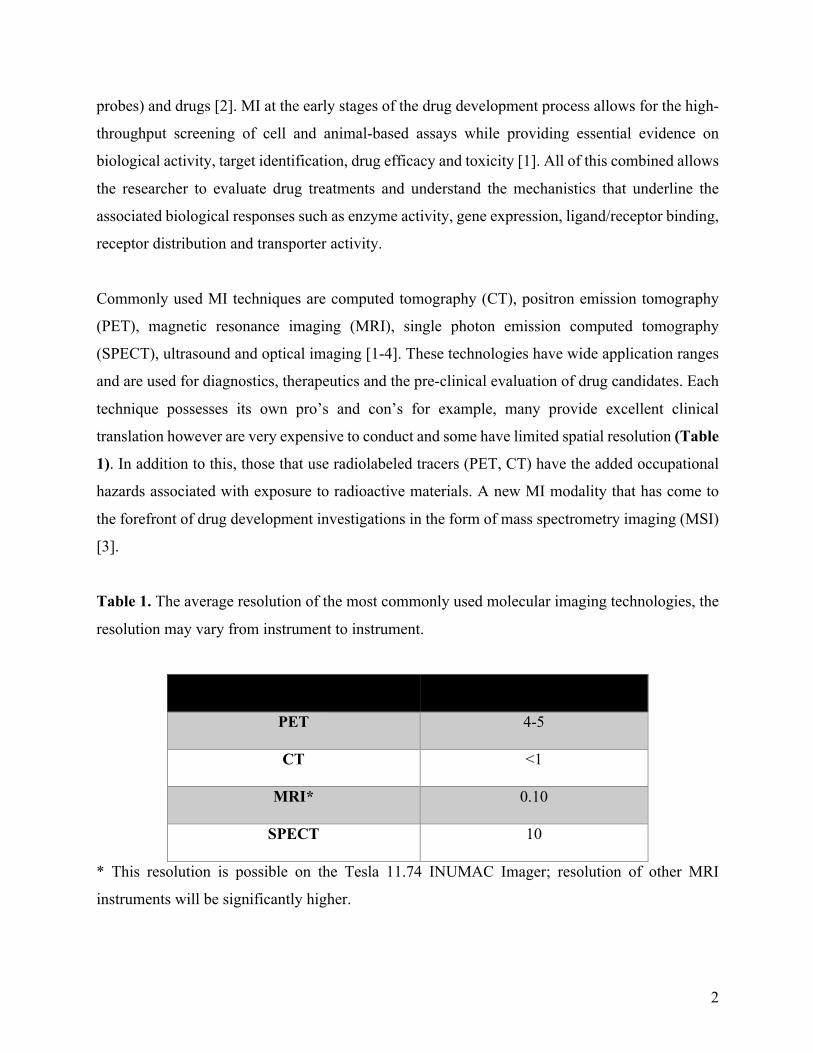
Table 1. The average resolution of the most commonly used molecular imaging technologies, the
resolution may vary from instrument to instrument.
Molecular imaging modality
Average resolution (mm)
PET
4-5
CT
<1
MRI*
0.10
SPECT
10
* This resolution is possible on the Tesla 11.74 INUMAC Imager; resolution of other MRI
instruments will be significantly higher.

3
1.2 Mass Spectrometry Imaging: the latest technology in molecular imaging
Scientists are beginning to see the value of MSI and its myriad of potential applications. This can
be evidenced by the large number of recent publications in various disciplines ranging from food
chemistry to drug discovery [5, 6]. MSI possesses some distinct advantages over the more popular
imaging technologies such as PET, CT, MRI and SPECT [2]. These more conventional techniques
require the use of radiolabeled compounds or agents (radiotracers) which are expensive to produce
and some requiring a cyclotron for production. With specific radiochemicals having their own
shortcomings, example flourodeoxyglucose [18FDG], having non-specific binding and localizing
in any region of high glucose metabolism. 68Ga has a particularly short half-life (68 min) meaning
that labelling and imaging has to be conducted within a very small time window or radioactivity
would decrease and radiolabeling and subsequent image quality would be compromised.
With MSI all of these potential shortcomings are eliminated since there is no requirement for
radiolabeling, pre-treatment or modification of the drug and the ability to achieve single-cell
resolution. MSI can be used at various stages during the drug development process which include
pharmacological target identification as well as the distribution of drugs and drug metabolites in
tissue. This is possible since all of the processes in a biological system involve the interaction and
spatial redistribution of molecules or molecular complexes. This technique also allows for the
identification of multiple numbers of known and unknown compounds. This is of great value since
target compounds vary greatly in terms of size, physiochemical properties, concentrations,
structure and chiral variability (in biological proteins and peptides) [3]. MSI overcomes many of
these challenges by detecting the atomic mass of a compound of interest, which is a universal
parameter based on the molecules atomic composition [3].
MSI combines the analytical power of mass spectrometry and histology to create chemical images
of the tissue distribution of endogenous biomolecules, drugs and their metabolites, in tissue
sections. The accumulation of spectra, during the data acquisition stage, allows for the
retrospective identification of unknown molecules. Applications have evolved tremendously, with
a number of technological advancements in the available hardware and software [6, 7]. This
coupled with a number of research groups striving to create standardized protocols has led to the
4
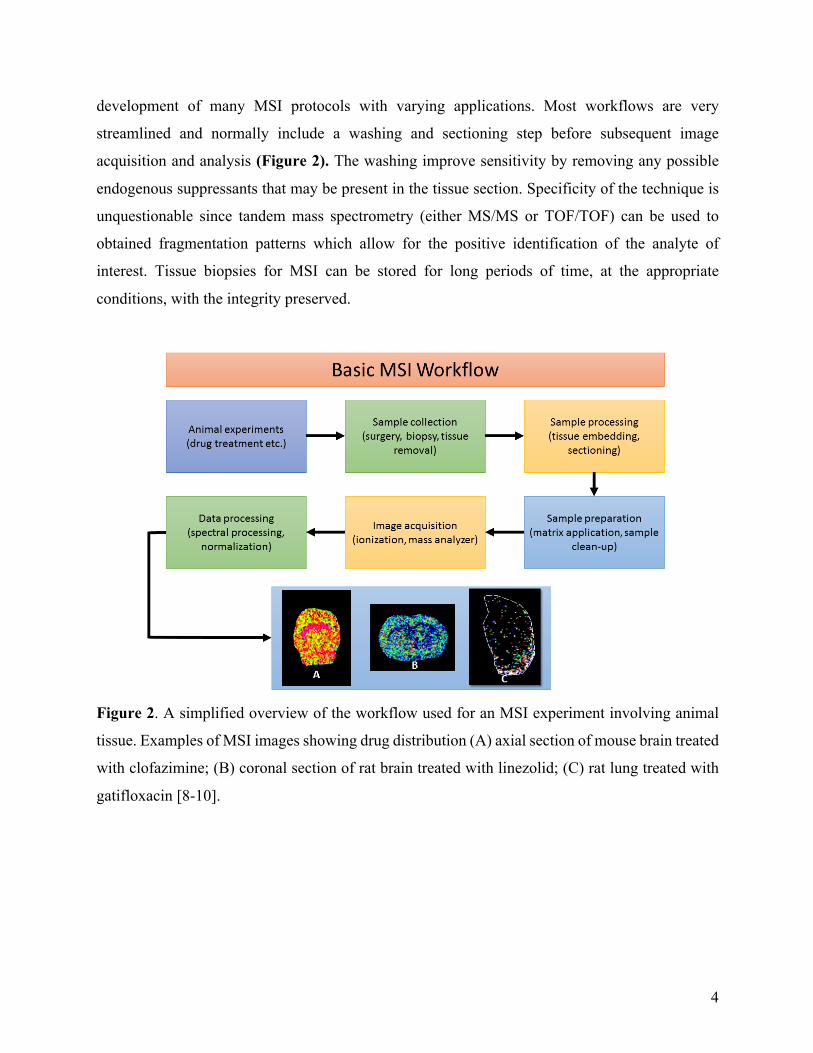
development of many MSI protocols with varying applications. Most workflows are very
streamlined and normally include a washing and sectioning step before subsequent image
acquisition and analysis (Figure 2). The washing improve sensitivity by removing any possible
endogenous suppressants that may be present in the tissue section. Specificity of the technique is
unquestionable since tandem mass spectrometry (either MS/MS or TOF/TOF) can be used to
obtained fragmentation patterns which allow for the positive identification of the analyte of
interest. Tissue biopsies for MSI can be stored for long periods of time, at the appropriate
conditions, with the integrity preserved.
Figure 2. A simplified overview of the workflow used for an MSI experiment involving animal
tissue. Examples of MSI images showing drug distribution (A) axial section of mouse brain treated
with clofazimine; (B) coronal section of rat brain treated with linezolid; (C) rat lung treated with
gatifloxacin [8-10].

5
Currently there are a number of techniques available for MSI analysis, the most popular technique
is matrix assisted laser desorption ionization (MALDI), followed by secondary ion mass
spectrometry (SIMS) and desorption electrospray ionization (DESI). Each of these ionization
methods can be combined with a number of possible mass analyzers, increasing the potential of
MSI to measure a large array of molecules, ranging from small drug metabolites to large
endogenous proteins [11]. MALDI has become the most popular technique since it allows for the
label-free identification of a variety of molecular species, directly from tissue sections. This
technique uses a uniform layer of a crystalline matrix which coats the tissue sections (normally
10-20µm). A laser is used to generate ions via a transfer of energy through the matrix. One
disadvantage of this technique is that it is seen as destructive since tissue sections cannot be re-
analysed [12]. DESI is advantageous as it requires no sample preparation beyond tissue sectioning
and it has proven to have excellent sensitivity for small molecules. This technique uses an
electrically charged solvent mist for the ionization and desorption of analytes. Therefore, DESI-
MSI can be used to generate 2D-images and for the determination of relative abundance of the
analytes of interest. DESI is also less destructive and allows for the reuse of tissue sections [13].
SIMS was the first ionization technique investigated for MSI applications, this technique works
by focusing a primary ion beam onto the tissue section in order to generate and desorb ions [14].
When SIMS is combined with TOF, the analyst is able to measure large biomolecules with high
levels of sensitivity and spatial resolution [11]. However, this is a very expensive and labour
intensive approach which has more applicability to specific investigations, rather than being a
general MSI technique.
Each MSI experiment is tailor made and for this reason there are now guidelines on the reporting
of MSI which allows for the dissemination of knowledge throughout the scientific community
[15]. Of the many applications currently available, our group has focused on the use of MSI in
drug development and pharmacokinetic studies [16, 17]. The technique was used with great
efficacy in the imaging of anti-TB agents in the brain of small rodents [16-18]. The results were
very intriguing where different classes of drugs showed preferential distribution in the brain; this
is an important point to consider when prescribing treatments for neurological disorders.

6
1.3 LC-MS/MS: the gold standard in drug quantitation
Over the years’ liquid chromatography-tandem mass spectrometry (LC-MS/MS) has become the
preferred technique in drug quantitation studies. This combines the specificity of chromatography
with the sensitivity of mass spectrometry to provide accurate quantification data for a wide range
of analytes. The value of this technique has been seen by pharmaceutical drug development
agencies and has become the gold standard for drug quantitation during all stages of drug
development (Figure 1). Due to its accuracy, precision, specificity and sensitivity; LC-MS/MS is
the ideal complementary technique to MSI for its ability to provide reliable information on exact
tissue concentrations of the desired drug [19].
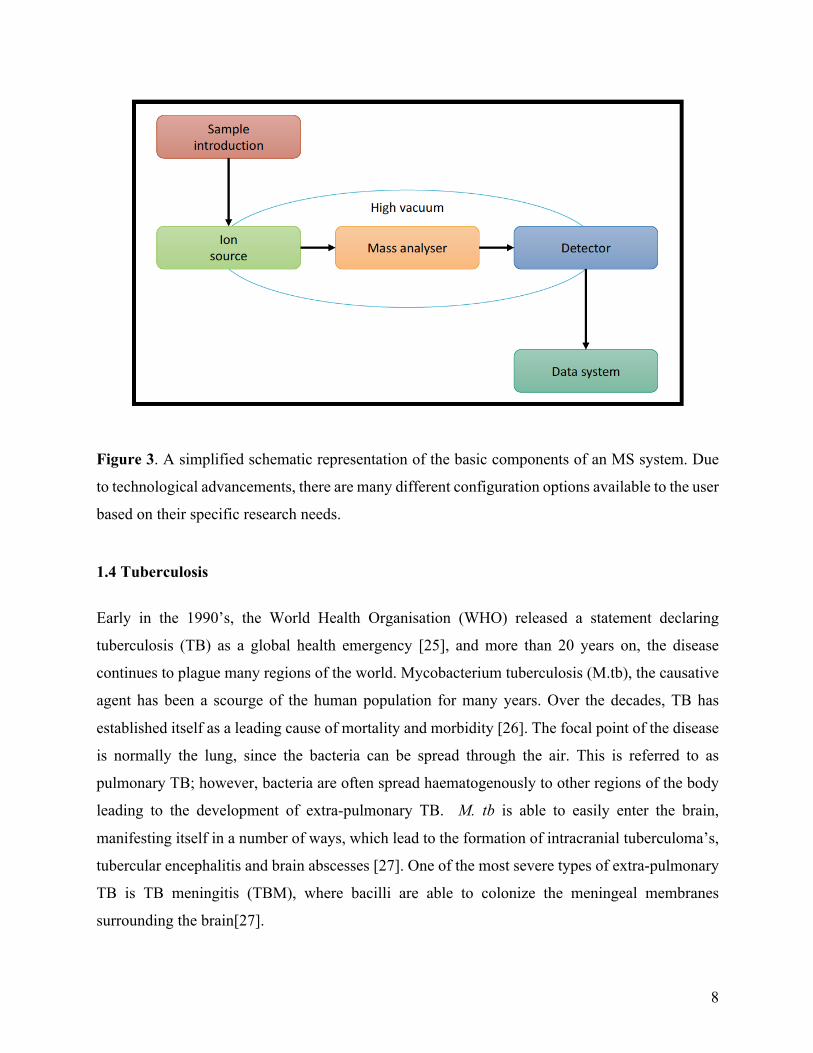
Each mass spectrometry (MS) system has the same basic components (Figure 3), however with
technological advancements each system can be configured based on the nature of the analyte
being investigated.
Sample introduction is typically achieved via a liquid chromatography (LC) system, which is ideal
since it allows the efficient separation of the analyte from endogenous proteins and lipids that
would interfere with subsequent MS analysis. LC set-ups are standardised across analytical labs,
with most consisting of a degasser (to prevent unwanted gas from the mobile phase from entering
the LC system), a binary pump (for efficient mixing of mobile phases), an autosampler (to
introduce samples for analysis), a column compartment (to keep the column temperature constant)
and a column (for separation of the analyte from complex biological matrices). There are a number
of column technologies available, such as the C8, C18, HILIC and diol, all of which allow for the
retention of a wide range of analytes with varying physiochemical properties [20].
The mobile phase containing the compound to be measured then enters the ion source, which
results in the formation of ions that can be easily detected. As with other parts of the analytical
MS, there are a number of source options available for the analysis of different analytes. The most
commonly encountered ionisation sources are the electro-spray ionisation (ESI), atmospheric
pressure chemical ionisation (APCI) and atmospheric pressure photoionisation (APPI). Each of
these sources can be operated in either positive or negative mode based on the analyte to be
quantified [21].

7
The sample then continues its journey through the MS by entering the mass analyser, where again
there are a number of options available, based on the intended application. Researchers have the
option of a quadrupole, time-of-flight (TOF), ion trap and magnetic selector mass analysers. Each
uses a different principle to separate and filter the ions. It is not uncommon for modern instruments
to have a combination of two mass analysers, such as a quadrupole-TOF system [22,23]. The mass
analyser can be operated in MS mode or MS/MS mode. In MS mode only a signal product ion is
detected whilst in MS/MS mode, a precursor ion is selected, which is then subjected to physical
breakdown (either electrical as in a collision cell or gaseous as in collision induced dissociation)
resulting in product ions, known as molecular fragments. MS/MS mode is preferred for drug
analysis as it is highly specific, the precursor ion is also known as the qualifier ion while the
fragment ion is the quantifier ion [24].
Once the ions have passed the mass analyser, they need to be detected and transformed into a
usable signal for analysis. There are 2 major classes of detectors ie. point and array detectors. They
are able to convert the number of ion hits into a signal that can be amplified and analysed using a
data system. The data system used in conjunction with MS systems are typically high-powered
computers with specialised software that can collect, collate and analyse spectral data.
8
Figure 3. A simplified schematic representation of the basic components of an MS system. Due
to technological advancements, there are many different configuration options available to the user
based on their specific research needs.
1.4 Tuberculosis
Early in the 1990’s, the World Health Organisation (WHO) released a statement declaring
tuberculosis (TB) as a global health emergency [25], and more than 20 years on, the disease
continues to plague many regions of the world. Mycobacterium tuberculosis (M.tb), the causative
agent has been a scourge of the human population for many years. Over the decades, TB has
established itself as a leading cause of mortality and morbidity [26]. The focal point of the disease
is normally the lung, since the bacteria can be spread through the air. This is referred to as
pulmonary TB; however, bacteria are often spread haematogenously to other regions of the body
leading to the development of extra-pulmonary TB. M. tb is able to easily enter the brain,
manifesting itself in a number of ways, which lead to the formation of intracranial tuberculoma’s,
tubercular encephalitis and brain abscesses [27]. One of the most severe types of extra-pulmonary
TB is TB meningitis (TBM), where bacilli are able to colonize the meningeal membranes
surrounding the brain[27].

9
TB continues to plague South Africa, with approximately 1% of the population (54 million)
contracting the disease each year, with a further 80% suspected to have latent TB. While current
treatment programs are effective in some cases, they have a maximum success rate of 78% [28].
This is further complicated by extra-pulmonary TB where studies have shown that TBM
constitutes approximately 28% of all reported meningitis cases [29]. Despite the initiation of
effective anti-TB chemotherapy for pulmonary cases, the mortality rate amongst TBM patients
remains high. This is largely due to the lack of penetration of TB drugs into the central nervous
system (CNS) which is imperative for the treatment of TBM. Permeability of the blood brain
barrier (BBB) is a major obstacle for potential drug candidates in the treatment of TBM. Passage
through the BBB is dependent on the chemical properties of the drug with lipophilic, low molecular
weight compounds being favoured [30]. Previous studies involving the investigation of anti-
mycobacterial agents have primarily been determined by the concentrations of these drugs in the
cerebrospinal fluid (CSF) of patients as an indicator of CNS penetration. However, antibiotics do
not display homogenous distribution in the compartments of the CNS (viz. the CSF and brain
compartments). This method of using CSF drug concentrations as an indicator of CNS penetration
is also flawed in that the brain and spine (where CSF sampling is conducted via lumbar puncture)
contain two distinctively different CSF networks. Coupled with the fact that CSF is turned over
every 3 hours makes this data very unreliable, emphasising the need to establish and develop new,
more effective techniques to investigate drug penetration through the BBB.
The current TB short course chemotherapy is effective in managing the disease. However these
regimens last up to 12 months and place emphasis on patient compliance. This has contributed to
the rapid increase in extremely- and multi-drug resistant TB (XDR-and MDR-TB) strains. This
highlights the need for new, more effective anti-mycobacterial agents.
Current TBM treatment guidelines vary, with the British Infection Society proposing a first-line
2 month program consisting of isoniazid, rifampicin, pyrazinamide and ethambutol followed by
10 weeks of rifampicin and isoniazid treatment [31,32]. The World Health Organisation
recommends substituting ethambutol for streptomycin in adults. Both organisations also advocate
for adjunctive therapy using corticosteroids to decrease the potential neurological deficits seen in
meningitis patients [33,34].

10
The inclusion of bedaquiline in MDR-treatment regimens show that other promising anti-TB
agents have great potential in the treatment of TB and TBM [35]. Clofazimine (CFZ) and linzezolid
(LIN) are two such drugs that remain as unknown quantities in the treatment of mycobacterial
infections.
1.5 Clofazimine Clofazimine (CFZ) (Figure 3) is a riminophenazine dye that was discovered in 1954 [36], and
possesses both anti-inflammatory and anti-mycobacterial efficacy [37]. Initially, the drug showed
encouraging in vitro results against M. tb [38, 39], however, these findings could not be replicated
in animal models [40].
Figure 3. Chemical structure of Clofazimine (MW: 473.94 g/mol)
CFZ was then found to be effective against another member of the Mycobacterium family and
subsequently used to treat infections caused by M. leprae [41]. Since then CFZ in combination
with rifampicin and dapsone have become the gold standard in leprosy treatment [42]. The drug’s
mechanism of action is not clearly understood, but it is widely believed that the main site of action
is the outer membrane of the bacterial cell wall [43].
With the growing concern of XDR and MDR-TB, there is renewed interest in the use of CFZ as
an anti-TB treatment since there are no known cases of resistance [44]. A recently observational
study reported that the addition of CFZ to the standard therapy for MDR-TB resulted in a relapse-
free cure rate of 87.9% in 206 patients [44]. In addition to this, using a murine model of pan-

11
susceptible TB, a 4-month CFZ containing regimen was compared with the standard 6-month
therapy. The CFZ containing regiment showed relapse-free cure after 3 months of treatment when
compared to 6 months of the standard treatment [45]. CFZ has showed limited penetration into
caseous lesions in the lung, but exhibits a lethal bactericidal effect [46, 47]. Its penetration into the
CNS of both the healthy and unhealthy brain is yet to be elucidated.
Given its proven efficacy against members of the Mycobacterium family, its lipophilicity and low
molecular weight, CFZ has great potential for crossing the BBB for the treatment of TBM.
1.6 Linezolid The discovery of the oxazolidinones, the first new class of antibiotics since 1980 has led to the
discovery of Linezolid (Figure 4) (LIN) [48], one of the most promising antimicrobial agents in
recent times.
Figure 4. Chemical structure of Linezolid (MW: 337.35 g/mol)
The drug has a unique mechanism of action which involves the inhibition of protein synthesis by
preventing the formation of the 70s ribosomal subunit (Figure 5) during the translation step [48].
12
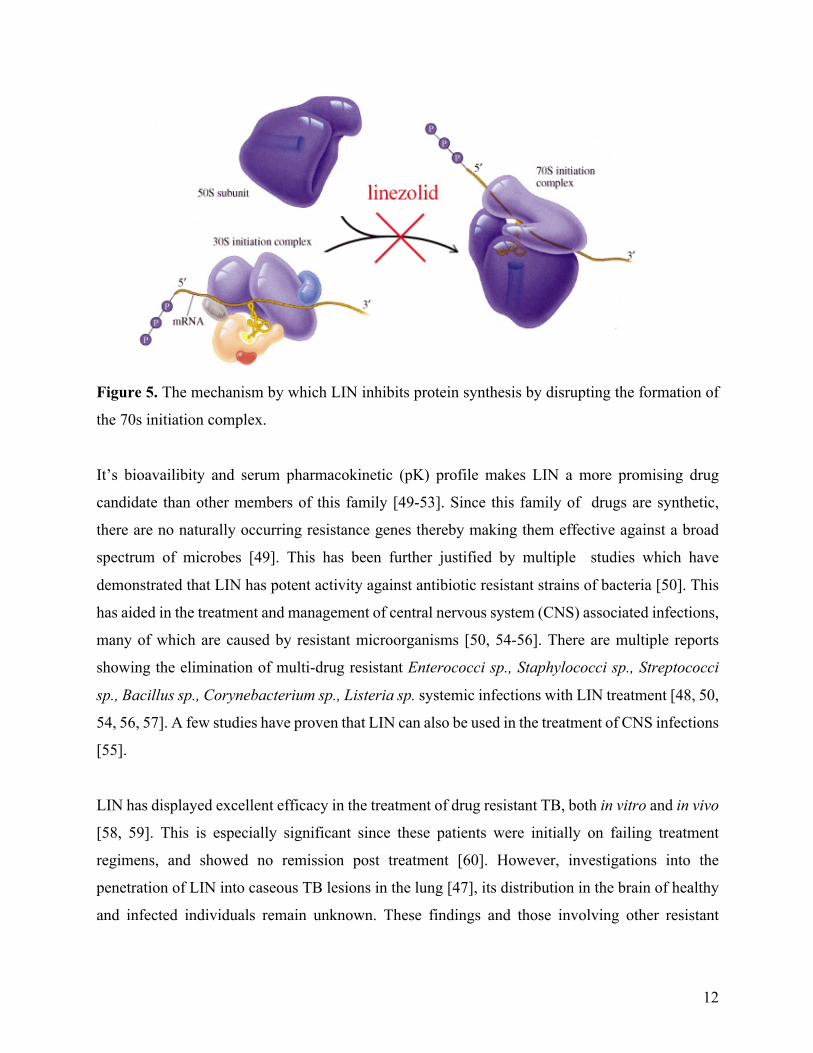
Figure 5. The mechanism by which LIN inhibits protein synthesis by disrupting the formation of
the 70s initiation complex.
It’s bioavailibity and serum pharmacokinetic (pK) profile makes LIN a more promising drug
candidate than other members of this family [49-53]. Since this family of drugs are synthetic,
there are no naturally occurring resistance genes thereby making them effective against a broad
spectrum of microbes [49]. This has been further justified by multiple studies which have
demonstrated that LIN has potent activity against antibiotic resistant strains of bacteria [50]. This
has aided in the treatment and management of central nervous system (CNS) associated infections,
many of which are caused by resistant microorganisms [50, 54-56]. There are multiple reports
showing the elimination of multi-drug resistant Enterococci sp., Staphylococci sp., Streptococci
sp., Bacillus sp., Corynebacterium sp., Listeria sp. systemic infections with LIN treatment [48, 50,
54, 56, 57]. A few studies have proven that LIN can also be used in the treatment of CNS infections
[55].
LIN has displayed excellent efficacy in the treatment of drug resistant TB, both in vitro and in vivo
[58, 59]. This is especially significant since these patients were initially on failing treatment
regimens, and showed no remission post treatment [60]. However, investigations into the
penetration of LIN into caseous TB lesions in the lung [47], its distribution in the brain of healthy
and infected individuals remain unknown. These findings and those involving other resistant
13
microbes, indicate that LIN could present a strong possibility for the treatment of tuberculosis
meningitis (TBM).
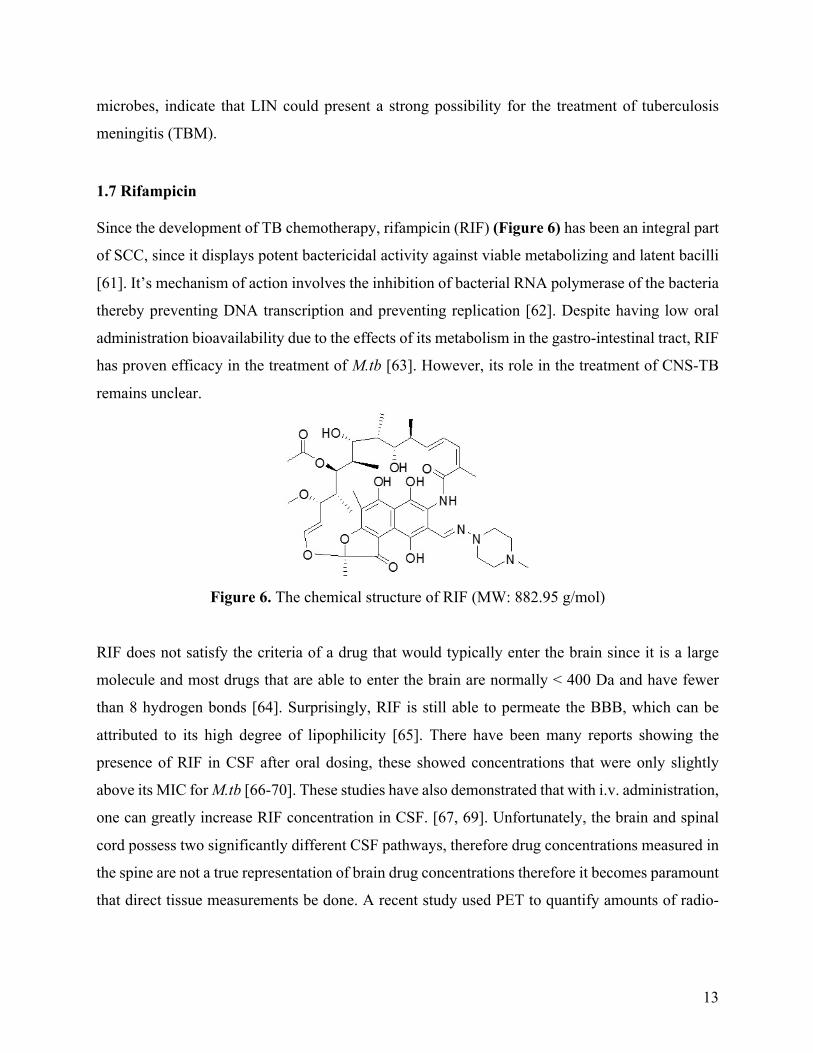
1.7 Rifampicin Since the development of TB chemotherapy, rifampicin (RIF) (Figure 6) has been an integral part
of SCC, since it displays potent bactericidal activity against viable metabolizing and latent bacilli
[61]. It’s mechanism of action involves the inhibition of bacterial RNA polymerase of the bacteria
thereby preventing DNA transcription and preventing replication [62]. Despite having low oral
administration bioavailability due to the effects of its metabolism in the gastro-intestinal tract, RIF
has proven efficacy in the treatment of M.tb [63]. However, its role in the treatment of CNS-TB
remains unclear.
Figure 6. The chemical structure of RIF (MW: 882.95 g/mol)
RIF does not satisfy the criteria of a drug that would typically enter the brain since it is a large
molecule and most drugs that are able to enter the brain are normally < 400 Da and have fewer
than 8 hydrogen bonds [64]. Surprisingly, RIF is still able to permeate the BBB, which can be
attributed to its high degree of lipophilicity [65]. There have been many reports showing the
presence of RIF in CSF after oral dosing, these showed concentrations that were only slightly
above its MIC for M.tb [66-70]. These studies have also demonstrated that with i.v. administration,
one can greatly increase RIF concentration in CSF. [67, 69]. Unfortunately, the brain and spinal
cord possess two significantly different CSF pathways, therefore drug concentrations measured in
the spine are not a true representation of brain drug concentrations therefore it becomes paramount
that direct tissue measurements be done. A recent study used PET to quantify amounts of radio-
14
labeled RIF in the brain. Despite the drug concentration being 4 times the MIC for TB, RIF
displayed poor permeability when compared to other frontline drugs. [71].
Given its proven efficacy against TB and its penetration into the CNS, it is important to investigate
RIF’s distribution in the brain, using MSI and correlating this to PET investigations using radio-
labelled forms of the drug.
1.8 Tetracyclines: Tigecycline and Doxycycline The tetracyclines are a class of antibacterial agents that were developed in the 1940s and have a
broad-spectrum of activity against both gram-positive and gram-negative bacteria. Their
mechanism of action involves its attachment to the 30S ribosomal subunit thereby inhibiting
protein synthesis by preventing the binding of transfer RNA to its associated acceptor [72].
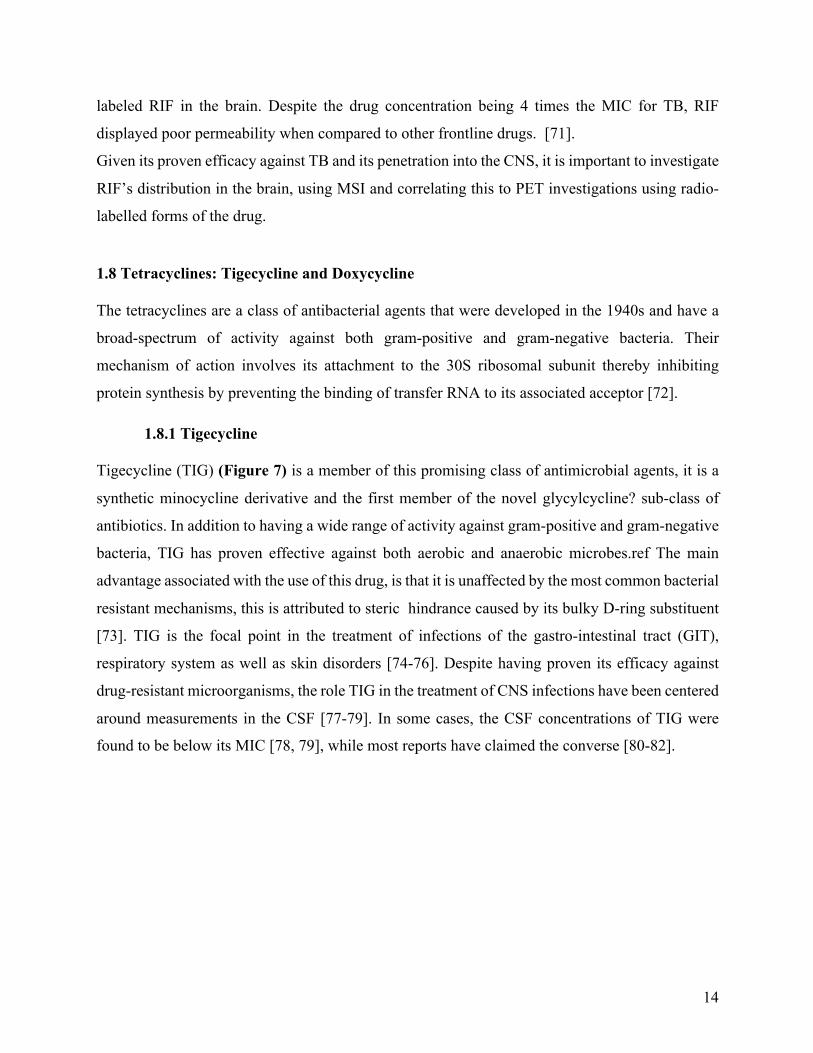
1.8.1 Tigecycline Tigecycline (TIG) (Figure 7) is a member of this promising class of antimicrobial agents, it is a
synthetic minocycline derivative and the first member of the novel glycylcycline? sub-class of
antibiotics. In addition to having a wide range of activity against gram-positive and gram-negative
bacteria, TIG has proven effective against both aerobic and anaerobic microbes.ref The main
advantage associated with the use of this drug, is that it is unaffected by the most common bacterial
resistant mechanisms, this is attributed to steric hindrance caused by its bulky D-ring substituent
[73]. TIG is the focal point in the treatment of infections of the gastro-intestinal tract (GIT),
respiratory system as well as skin disorders [74-76]. Despite having proven its efficacy against
drug-resistant microorganisms, the role TIG in the treatment of CNS infections have been centered
around measurements in the CSF [77-79]. In some cases, the CSF concentrations of TIG were
found to be below its MIC [78, 79], while most reports have claimed the converse [80-82].
15
Figure 7. The chemical structure of TIG (MW: 588.65 g/mol)
These conflicting results necessitates the need for investigations into the penetration of TIG in the
CNS by means of direct tissue measurements, rather than relying on CSF quantitation.
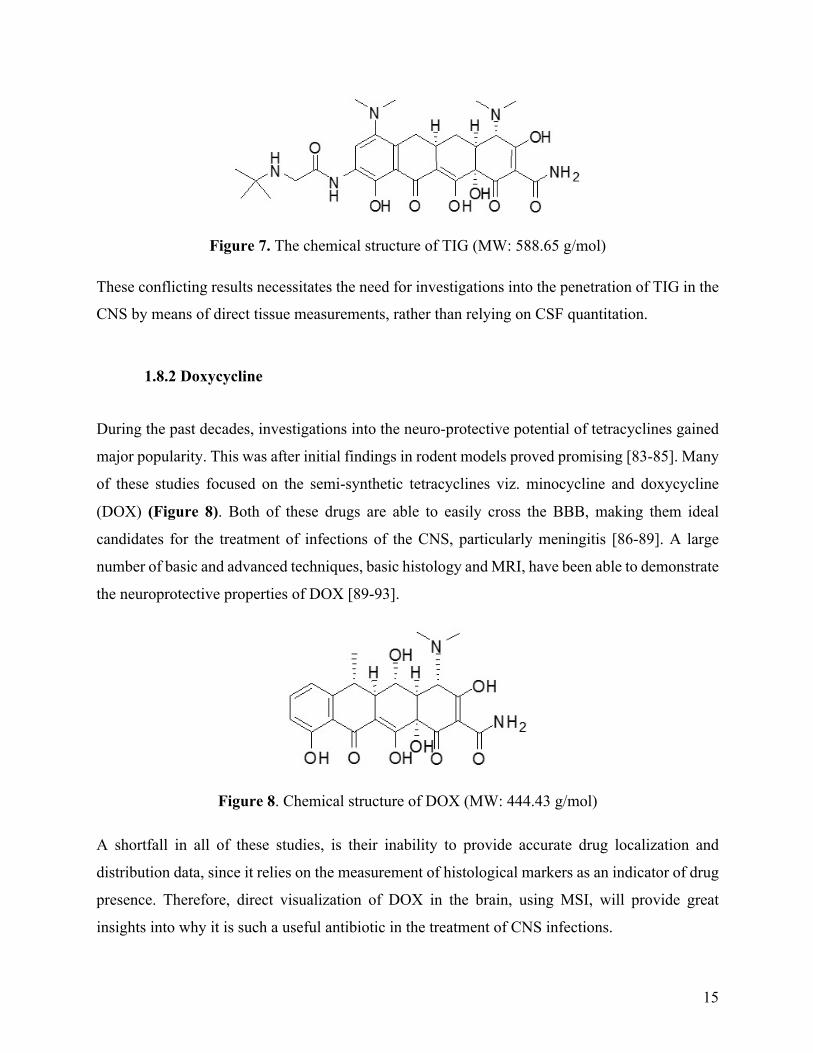
1.8.2 Doxycycline
During the past decades, investigations into the neuro-protective potential of tetracyclines gained
major popularity. This was after initial findings in rodent models proved promising [83-85]. Many
of these studies focused on the semi-synthetic tetracyclines viz. minocycline and doxycycline
(DOX) (Figure 8). Both of these drugs are able to easily cross the BBB, making them ideal
candidates for the treatment of infections of the CNS, particularly meningitis [86-89]. A large
number of basic and advanced techniques, basic histology and MRI, have been able to demonstrate
the neuroprotective properties of DOX [89-93].
Figure 8. Chemical structure of DOX (MW: 444.43 g/mol)
A shortfall in all of these studies, is their inability to provide accurate drug localization and
distribution data, since it relies on the measurement of histological markers as an indicator of drug
presence. Therefore, direct visualization of DOX in the brain, using MSI, will provide great
insights into why it is such a useful antibiotic in the treatment of CNS infections.
16
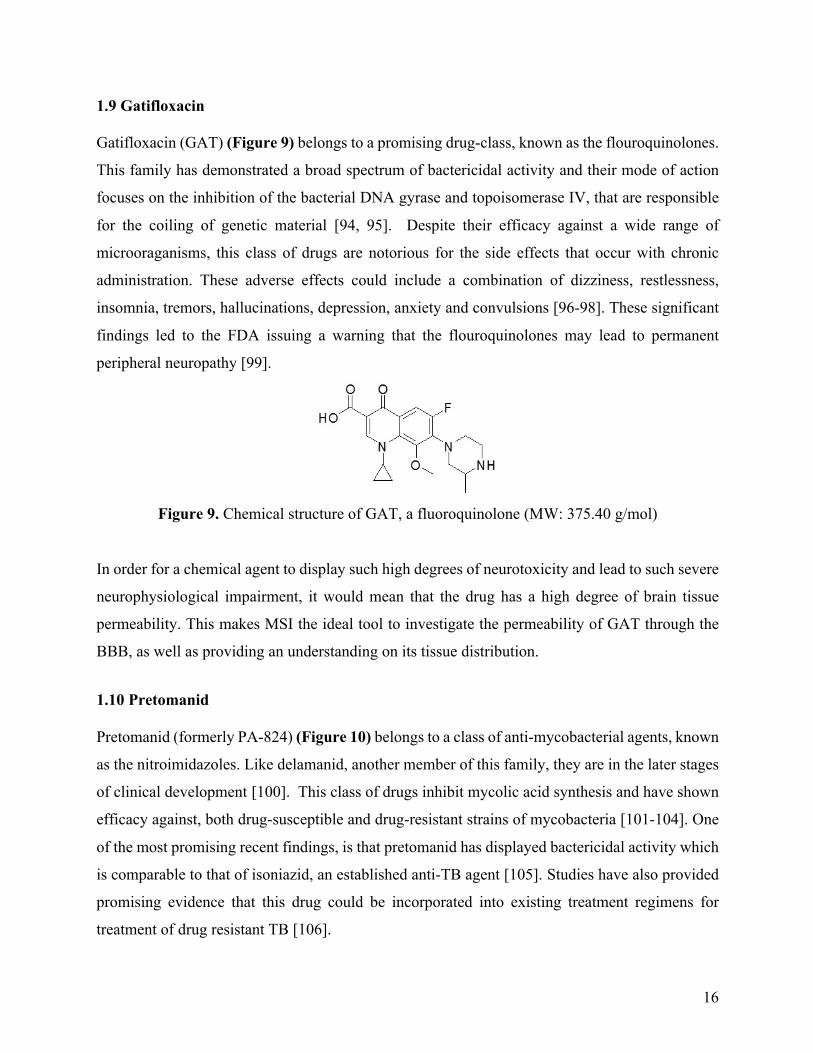
1.9 Gatifloxacin Gatifloxacin (GAT) (Figure 9) belongs to a promising drug-class, known as the flouroquinolones.
This family has demonstrated a broad spectrum of bactericidal activity and their mode of action
focuses on the inhibition of the bacterial DNA gyrase and topoisomerase IV, that are responsible
for the coiling of genetic material [94, 95]. Despite their efficacy against a wide range of
microoraganisms, this class of drugs are notorious for the side effects that occur with chronic
administration. These adverse effects could include a combination of dizziness, restlessness,
insomnia, tremors, hallucinations, depression, anxiety and convulsions [96-98]. These significant
findings led to the FDA issuing a warning that the flouroquinolones may lead to permanent
peripheral neuropathy [99].
Figure 9. Chemical structure of GAT, a fluoroquinolone (MW: 375.40 g/mol)
In order for a chemical agent to display such high degrees of neurotoxicity and lead to such severe
neurophysiological impairment, it would mean that the drug has a high degree of brain tissue
permeability. This makes MSI the ideal tool to investigate the permeability of GAT through the
BBB, as well as providing an understanding on its tissue distribution.
1.10 Pretomanid Pretomanid (formerly PA-824) (Figure 10) belongs to a class of anti-mycobacterial agents, known
as the nitroimidazoles. Like delamanid, another member of this family, they are in the later stages
of clinical development [100]. This class of drugs inhibit mycolic acid synthesis and have shown
efficacy against, both drug-susceptible and drug-resistant strains of mycobacteria [101-104]. One
of the most promising recent findings, is that pretomanid has displayed bactericidal activity which
is comparable to that of isoniazid, an established anti-TB agent [105]. Studies have also provided
promising evidence that this drug could be incorporated into existing treatment regimens for
treatment of drug resistant TB [106].

17
Figure 10. The chemical structure of Pretomanid (MW: 359.26 g/mol)
Being a novel drug class, there is a lack of information regarding the CNS effects of pretomanid,
MSI investigations of its distribution in the brain will provide insight on its potential for treating
extra-pulmonary TB.
1.11 Drug Penetration in the Brain
The brain poses a very difficult problem for pharmaceutical scientists in their pursuit of ideal
treatments for the many brain diseases that affect the population. In cases, such as HIV and TB,
the causative agents are able to enter the brain and lead to an array of neurodegenerative changes
that cause severe debilitation. Drugs used to treat these diseases have limited penetration into the
brain, allowing them to persist and continue their pathogenic processes [107].
Due to the complex nature of the brain and its physiological functions, it is surrounded by a highly
selective membrane that forms a barrier between brain tissue and the circulating blood, which is
thus referred to as the blood-brain-barrier (BBB) [108]. This barrier (Figure 11) has a dual
function; in that it allows useful molecules into the brain via endothelial tight junctions, while
preventing the entry of unwanted substances and microbes [108]. To combat such conditions,
treatment drugs need to be able to penetrate the BBB and reach levels that are sufficient enough to
fight such infections. Drug penetration into the CNS is governed by a number of factors including
the molecular size (with smaller molecules favoring diffusion across the BBB) [109], lipophilicity
(since the brain is lipid in nature, more lipophilic compounds are favored) [110] and plasma protein
binding.

18
Figure 11. The blood brain barrier. Endotheial tight junctions govern the movement of substances
from blood into the brain, while astrocytes are responsible for selective permeability in the
opposite direction [111].
This highlights the need for the pharmaceutical scientist to measure drug concentrations in the
brain and to investigate tissue distribution of drug candidates in order to better guide clinical
treatment regimens. At this point it is also important to measure drug concentrations in the absence
of an infection, since these values would represent the minimum concentrations reached during
the early stages of a CNS infection [107].
This is especially important since other MI techniques such as PET and MRI have been used to
identify areas of the brain that are susceptible to damage during infection but studies involving the
distribution of treatment drugs are limited.
1.12 Molecular Imaging of the Lung and its Associated Difficulty
As with any disease in which the lung forms the focal point of its infection, it is paramount to
understand how the drug behaves in this tissue. Bacteria initially colonize the lung before
spreading haematogenously and leading to the development of more severe extra-pulmonary forms
of the disease [27]. Therefore, drug distribution information will aid in our understanding of how
the compound will interact with the TB bacilli in tissue.

19
The lung itself poses difficulty during sample preparation for MI, especially MSI. Due to the nature
of its function, the lung is made up of a number of air-filled spaces to facilitate gaseous exchange.
In order for this process to occur the lung is maintained in an “open” state by the balance of
pressures inside and outside the thoracic cavity [112]. When tissue is harvested from experimental
animals, the thoracic cavity is pierced, this pressure balance is offset causing these air-filled spaces
to collapse (Figure 12).
Figure 12. A collapsed lung vs. an inflated lung. This figure shows how the lung collapses when
the thoracic cavity is pierced causing air to flow into the cavity and the subsequent loss of lung
structure [113].
Collapsing of the lung will result in the folding together of multiple cell layers. MI of this tissue
will result in false distribution data since the lung is primarily composed of single cell layers. This
emphasizes the need for a sample preparation technique that will preserve the structural integrity
of the lung, while providing true distribution data. Such a technique has been available to
histologists for many years and this involves the inflation of lung tissue using neutral buffered
formalin [114, 115]. However, for MSI, the tissue needs to be frozen to prevent post-operative
changes, therefore other inflation media are needed for this specific application. This provides the
ideal opportunity for the use of cryoprotectants which are commonly used in the cryopreservation
of biological samples.
20
1.13 Cryopreservation and Cryoprotectants
Cryopreservation is a well-established technique with many applications in the scientific
community. It involves the use of extremely low temperatures to preserve biological cells, keeping
them intact and in their native form [116]. The major issues with freezing live cells is the water
content of the tissue. As water freezes it crystallizes and forms crystals that pierce and tease cells
apart causing them to lose structural integrity [116]. In order to circumvent this problem, scientists
have developed a number of cryoprotective agents (cryoprotectants), which increase the solute
content of the media and minimizes the effects of freezing [116]. As this technique, has developed
over the years, the number of cryoprotective media has also increased proportionately, with many
commercial cryoprotectants also becoming available [117-120]. This combined with the inflation
technique that has been in practice could provide the answer for sample preparation of lung tissue
for MSI.
There are currently many cryoprotective agents employed for the cryopreservation of various
sample types, which maintain tissue structural integrity during storage at sub-zero temperatures
[117-120]. However, their applicability to MSI remains unknown, therefore we proceeded to
conduct a study which investigated the use of various cryoprotectants as lung inflation media.

21
1.14 Research Questions
1. Can we provide evidence for the presence of Clofazimine (CFZ), in the brain?
Objectives: to determine the presence of CFZ in the brain using MSI and LC-MS.
2. What is the distribution of Linezolid (LIN), in the brain?
Objective: to determine the distribution of LIN in the brain using MSI.
3. Can lung inflation be used as a suitable sample preparation technique for lung MSI?
Objective: to evaluate the use of various cryoprotectants as inflation media for MSI of lung tissue.
4. What is the distribution of Rifampicin (RIF), in the brain?
Objective: to determine the time-dependent distribution of RIF in the brain using MSI.
5. What is the degree of brain penetration of the Tetracycline class of drugs?
Objective: to determine the brain penetration of Tigecycline (TIG) and Doxycycline (DOX), using
LC-MS and MSI, respectively.
6. How does the distribution of the Flouroquinolones contribute to their neurotoxicity?
Objective: To determine the brain distribution of Gatifloxacin (GAT), using MSI.
7. What is the brain distribution of Pretomanid (PA-824), in the brain?
Objective: To determine the distribution of PA-824 in the brian, using MSI.
1.15 Outline of thesis
The main aim of these series of experiments is to demonstrate the value of MSI during the early
stages of the TB drug development process. First, by assessing the brain drug distribution of CFZ
and LIN, two promising anti-TB agents, in healthy animal models. These results are presented in
Chapters 2 and 3. Second, we attempted to create a sample preparation protocol for molecular
imaging of drug distribution in animal lung tissue in Chapter 4. In Chapters 5, 6, 7, 8 and 9, we
demonstrate how MSI can be used to evaluate other antibiotics in the drug pipeline. In Chapter 5,
we show the time-dependent distribution of RIF. In Chapters 6 and 7, we present the brain
penetration of the Tetracyclines, TIG and DOX. In Chapter 8, we demonstrate how MSI can be
used to evaluate the neurotoxic potential of the Flouroquinolones, using GAT as the candidate
drug. Finally in Chapter 9, MSI is used to investigate the brain distribution of PA-824, a
nitroimidazole.
22
References 1. Willmann, J.K., et al., Molecular imaging in drug development. Nature Reviews Drug
Discovery, 2008. 7(7): p. 591-607. 2. Cho, Y.W., et al., Molecular imaging in the aid of drug delivery technology.
Macromolecular Research, 2014. 22(9): p. 926-931. 3. Rubakhin, S.S., et al., Imaging mass spectrometry: fundamentals and applications to drug
discovery. Drug discovery today, 2005. 10(12): p. 823-837. 4. Aichler, M., et al., Spatially Resolved Quantification of Gadolinium (III)-Based Magnetic
Resonance Agents in Tissue by MALDI Imaging Mass Spectrometry after In Vivo MRI. Angewandte Chemie, 2015. 127(14): p. 4353-4357.
5. Jungmann, J.H. and R.M. Heeren, Emerging technologies in mass spectrometry imaging. Journal of proteomics, 2012. 75(16): p. 5077-5092.
6. Addie, R.D., et al., Current State and Future Challenges of Mass Spectrometry Imaging for Clinical Research. Analytical chemistry, 2015.
7. Deininger, S.-O., et al., Normalization in MALDI-TOF imaging datasets of proteins: practical considerations. Analytical and bioanalytical chemistry, 2011. 401(1): p. 167-181.
8. Baijnath, S., et al., Evidence for the presence of clofazimine and its distribution in the healthy mouse brain. Journal of molecular histology, 2015. 46(4-5): p. 439-442.
9. Baijnath, S., et al., Neuroprotective potential of Linezolid: A quantitative and distribution study. 2016.
10. Baijnath, S., et al., Small molecule distribution in rat lung: a comparison of various cryoprotectants as inflation media and their applicability to MSI. Journal of Molecular Histology, 2016: p. 1-7.
11. Nilsson, A., et al., Mass spectrometry imaging in drug development. Analytical chemistry, 2015. 87(3): p. 1437-1455.
12. Hsieh, Y., et al., Matrix-assisted laser desorption/ionization imaging mass spectrometry for direct measurement of clozapine in rat brain tissue. Rapid Communications in Mass Spectrometry, 2006. 20(6): p. 965-972.
13. Wiseman, J.M., et al., Tissue imaging at atmospheric pressure using desorption electrospray ionization (DESI) mass spectrometry. Angewandte Chemie International Edition, 2006. 45(43): p. 7188-7192.
14. Griffiths, J., Secondary ion mass spectrometry. Analytical chemistry, 2008. 80(19): p. 7194-7197.
15. McDonnell, L.A., et al., Discussion point: reporting guidelines for mass spectrometry imaging. Analytical and bioanalytical chemistry, 2014. 407(8): p. 2035-2045. 16. Shobo, A., et al., MALDI MSI and LC-MS/MS: Towards preclinical determination of the
neurotoxic potential of fluoroquinolones. Drug testing and analysis, 2015. 17. Prideaux, B. and M. Stoeckli, Mass spectrometry imaging for drug distribution studies.
Journal of proteomics, 2012. 75(16): p. 4999-5013. 18. Shobo, A., et al., Visualization of time-dependent distribution of rifampicin in rat brain
using MALDI MSI and quantitative LCMS/MS. Assay and drug development technologies, 2015. 13(5): p. 277-284.
19. Desiderio, D.M., Mass spectrometry: clinical and biomedical applications. 2013: Springer Science & Business Media.
23
20. Lee, M.S. and E.H. Kerns, LC/MS applications in drug development. Mass Spectrometry Reviews, 1999. 18(3-4): p. 187-279.
21. Pitt, J.J., Principles and applications of liquid chromatography-mass spectrometry in clinical biochemistry. Clin Biochem Rev, 2009. 30(1): p. 19-34.
22. Niessen, W.M., Liquid chromatography-mass spectrometry. 2006: CRC Press. 23. Holčapek, M., R. Jirásko, and M. Lísa, Recent developments in liquid chromatography–
mass spectrometry and related techniques. Journal of Chromatography A, 2012. 1259: p. 3-15.
24. Hoffmann, E.d. and V. Stroobant, Mass spectrometry: principles and applications. 1996: John Wiley and Sons, New York, USA.
25. WHO, TB-a global emercency. WHO Press Release, 1993. WHO/31. Geneva: p. World Health Organisation, 1993.
26. UNAIDS, Fact Sheet: 2014 Statistics. 2015. 27. Rock, R.B., et al., Central nervous system tuberculosis: pathogenesis and clinical aspects.
Clinical microbiology reviews, 2008. 21(2): p. 243-261. 28. Organization, W.H., Global tuberculosis report 2016. 2016: World Health Organization. 29. Woldeamanuel, Y., Girma B, A 43-year systematic review and meta-analysis: case fatality
and risk of death among adults with tuberculosis meningitis in Africa. J Neurol, 2013. Aug 21. .
30. Liu, X., et al., Molecular imaging of drug transit through the blood-brain barrier with MALDI mass spectrometry imaging. Scientific reports, 2013. 3.
31. Ruslami, R., et al., Intensified regimen containing rifampicin and moxifloxacin for tuberculous meningitis: an open-label, randomised controlled phase 2 trial. The Lancet Infectious Diseases, 2013. 13(1): p. 27-35.
32. Thwaites, G.E., R. van Toorn, and J. Schoeman, Tuberculous meningitis: more questions, still too few answers. The Lancet Neurology, 2013. 12(10): p. 999-1010.
33. WHO. Treatment of tuberculosis: guidelines: 4th ed. 2010 [cited 2016; Available from: http://www.who.int/tb/publications/2010/9789241547833/en/index.html.
34. WHO. Rapid advice: treatment of tuberculosis in children. [cited 2016; Available from: http://apps.who.int/iris/handle/10665/44444.
35. Mase, S., et al., Provisional CDC guidelines for the use and safety monitoring of bedaquiline fumarate (Sirturo) for the treatment of multidrug-resistant tuberculosis. MMWR Recomm Rep, 2013. 62(09): p. 1-12.
36. Barry, V.C., M.L. Conalty, and E.E. Gaffney, Antituberculosis activity in the phenazine series. isomeric pigments obtained by oxidation of O-phenylenediamine derivatives. Journal of Pharmacy and Pharmacology, 1956. 8(1): p. 1089-1096.
37. Cholo, M.C., et al., Clofazimine: current status and future prospects. Journal of antimicrobial chemotherapy, 2011: p. dkr444.
38. Barry, V.C. and M.L. Conalty, Antituberculosis activity in the phenazine series. II. N3-substituted anilinoaposafranines (rimino-compounds) and some derivatives. American review of tuberculosis, 1958. 78(1): p. 62.
39. Barry, V.C., et al., A new series of phenazines (rimino-compounds) with high antituberculosis activity. Nature, 1957. 179: p. 1013-1015.
40. Barry, V.C., et al., Factors influencing the antituberculosis activity of the Rimino-compounds. Bulletin of the International Union against Tuberculosis and Lung Disease, 1959. 29: p. 11.
24
41. Chang, Y., Effects of B. 663, a rimino compound of the phenazine series, in murine leprosy. Antimicrobial agents and chemotherapy, 1962. 294: p. 307.
42. Programmes, W.S.G.o.C.o.L.f.C., Chemotherapy of Leprosy for Control Programmes: Report of a WHO Study Group. 1982: World Health Organization; Albany, NY: WHO Publications Centre USA.
43. Xu, H.B., R.H. Jiang, and H.P. Xiao, Clofazimine in the treatment of multidrug-resistant tuberculosis. Clinical Microbiology and Infection, 2012. 18(11): p. 1104-1110.
44. Van Deun, A., et al., Short, highly effective, and inexpensive standardized treatment of multidrug-resistant tuberculosis. American journal of respiratory and critical care medicine, 2010. 182(5): p. 684-692.
45. Tyagi, S., et al., Clofazimine shortens the duration of the first-line treatment regimen for experimental chemotherapy of tuberculosis. Proceedings of the National Academy of Sciences, 2015. 112(3): p. 869-874.
46. Prideaux, B., et al., The association between sterilizing activity and drug distribution into tuberculosis lesions. Nature medicine, 2015. 21(10): p. 1223-1227.
47. Sarathy, J.P., et al., Prediction of drug penetration in tuberculosis lesions. ACS infectious diseases, 2016. 2(8): p. 552-563.
48. Moellering, R.C., Linezolid: the first oxazolidinone antimicrobial. Annals of internal medicine, 2003. 138(2): p. 135-142.
49. Dryden, M.S., Linezolid pharmacokinetics and pharmacodynamics in clinical treatment. Journal of antimicrobial chemotherapy, 2011. 66(suppl 4): p. iv7-iv15.
50. Ager, S. and K. Gould, Clinical update on linezolid in the treatment of Gram-positive bacterial infections. Infection and drug resistance, 2012. 5: p. 87.
51. Slatter, J., et al., Pharmacokinetics, toxicokinetics, distribution, metabolism and excretion of linezolid in mouse, rat and dog. Xenobiotica, 2002. 32(10): p. 907-924.
52. MacGowan, A.P., Pharmacokinetic and pharmacodynamic profile of linezolid in healthy volunteers and patients with Gram-positive infections. Journal of Antimicrobial Chemotherapy, 2003. 51(suppl 2): p. ii17-ii25.
53. Gee, T., et al., Pharmacokinetics and tissue penetration of linezolid following multiple oral doses. Antimicrobial Agents and Chemotherapy, 2001. 45(6): p. 1843-1846.
54. Beer, R., et al., Pharmacokinetics of intravenous linezolid in cerebrospinal fluid and plasma in neurointensive care patients with staphylococcal ventriculitis associated with external ventricular drains. Antimicrobial agents and chemotherapy, 2007. 51(1): p. 379-382.
55. Krzysztofiak, A., et al., Linezolid Therapy of Brain Abscess. The Pediatric infectious disease journal, 2010. 29(11): p. 1063-1064.
56. Villani, P., et al., Cerebrospinal fluid linezolid concentrations in postneurosurgical central nervous system infections. Antimicrobial agents and chemotherapy, 2002. 46(3): p. 936-937.
57. Shaikh, Z., C.A. Peloquin, and C.D. Ericsson, Successful treatment of vancomycin-resistant Enterococcus faecium meningitis with linezolid: case report and literature review. Scandinavian journal of infectious diseases, 2000. 33(5): p. 375-379.
58. Coleman, M.T., et al., PET/CT imaging reveals a therapeutic response to oxazolidinones in macaques and humans with tuberculosis. Science translational medicine, 2014. 6(265): p. 265ra167-265ra167.
25
59. Schecter, G., et al., Linezolid in the treatment of multidrug-resistant tuberculosis. Clinical Infectious Diseases, 2010. 50(1): p. 49-55.
60. Zhang, X., et al., Systematic review and meta-analysis of the efficacy and safety of therapy with linezolid containing regimens in the treatment of multidrug-resistant and extensively drug-resistant tuberculosis. Journal of thoracic disease, 2015. 7(4): p. 603.
61. Mitchison, D.A., Basic mechanisms of chemotherapy. Chest, 1979. 76: p. 771-781. 62. Wehrli, W., Rifampin: mechanisms of action and resistance. Review of Infectious
Diseases, 1983. 5(Supplement 3): p. S407-S411. 63. Strolin Benedetti, M. and P. Dostert, Induction and autoinduction properties of rifamycin
derivatives: a review of animal and human studies. Environ Health Perspect, 1994. 102 Suppl 9: p. 101-5.
64. Pardridge, W.M., Drug transport across the blood–brain barrier. Journal of Cerebral Blood Flow & Metabolism, 2012. 32(11): p. 1959-1972.
65. Leeson, P., Drug discovery: Chemical beauty contest. Nature, 2012. 481(7382): p. 455-456.
66. Barling, R., and Selkon JB, The penetration of antibiotics into cerebrospinal fluid and brain tissue. JAC, 1978. 4: p. 203-227.
67. Minedermann, T., Zimmerli W, and Gratzil O, Rifampicin Concentrations in Various Compartments of the Human Brain: A Novel method for Determining Drug Levels in the Cerebral Extracellular Space. Anti Microb Agent Chem, 1998. 42(10): p. 2626-2629.
68. Mindermann, T., Landolt H, Zimmerli W, Rajacic Z and Otmar G, Penetration of rifampicin into the brain tissue and cerebral extracellular space of rats. JAC, 1993. 31: p. 731-737.
69. Nau, R., Prange HW, Menck S, Kolenda H, Visser K, and Seydel JK, Penetration of rifampicin into the cerebrospinal fluid of adults with uninflamed meninges. J Antimicrob Chemother, 1992. 29: p. 719-724.
70. Ellard, G., Humphries MJ, Allen BW, Cerebrospinal fluid drug concentrations and the treatment of tuberculosis meningitis. Am Rev Respir Dis, 1993. 148(3): p. 650-655.
71. Liu, L., et al., Radiosynthesis and bioimaging of the tuberculosis chemotherapeutics isoniazid, rifampicin and pyrazinamide in baboons. Journal of medicinal chemistry, 2010. 53(7): p. 2882-2891.
72. Chopra, I. and M. Roberts, Tetracycline antibiotics: mode of action, applications, molecular biology, and epidemiology of bacterial resistance. Microbiology and molecular biology reviews, 2001. 65(2): p. 232-260.
73. Livermore, D.M., Tigecycline: what is it, and where should it be used? Journal of Antimicrobial Chemotherapy, 2005. 56(4): p. 611-614.
74. Hoffmann, M., et al., Metabolism, excretion, and pharmacokinetics of [14C] tigecycline, a first-in-class glycylcycline antibiotic, after intravenous infusion to healthy male subjects. Drug Metabolism and Disposition, 2007. 35(9): p. 1543-1553.
75. Peterson, L.R., A review of tigecycline — the first glycylcycline. International Journal of Antimicrobial Agents, 2008. 32, Supplement 4(0): p. S215-S222.
76. Bradford, P.A., D.T.W. Sands, and P.J. Petersen, In vitro activity of tigecycline against isolates from patients enrolled in phase 3 clinical trials of treatment for complicated skin and skin-structure infections and complicated intra-abdominal infections. Clinical infectious diseases, 2005. 41(Supplement 5): p. S315-S332.
26
77. Rodvold, K.A., et al., Serum, tissue and body fluid concentrations of tigecycline after a single 100 mg dose. Journal of Antimicrobial Chemotherapy, 2006. 58(6): p. 1221-1229.
78. Lengerke, C., et al., Low tigecycline concentrations in the cerebrospinal fluid of a neutropenic patient with inflamed meninges. Antimicrobial agents and chemotherapy, 2011. 55(1): p. 449-450.
79. Pallotto, C., et al., Cerebrospinal fluid penetration of tigecycline. Scandinavian journal of infectious diseases, 2014. 46(1): p. 69-72.
80. Pankey, G.A. and D.S. Ashcraft, In vitro antibacterial activity of tigecycline against resistant Gram-negative bacilli and enterococci by time–kill assay. Diagnostic microbiology and infectious disease, 2009. 64(3): p. 300-304.
81. Ray, L., et al., Cerebral spinal fluid penetration of tigecycline in a patient with Acinetobacter baumannii cerebritis. Annals of Pharmacotherapy, 2010. 44(3): p. 582-586.
82. Dandache, P., D.P. Nicolau, and G. Sakoulas, Tigecycline for the treatment of multidrug-resistant Klebsiella pneumoniae meningitis. Infectious Diseases in Clinical Practice, 2009. 17(1): p. 66-68.
83. Clark, W.M., et al., Reduction of central nervous system reperfusion injury in rabbits using doxycycline treatment. Stroke, 1994. 25(7): p. 1411-1415.
84. Yrjänheikki, J., et al., Tetracyclines inhibit microglial activation and are neuroprotective in global brain ischemia. Proceedings of the National Academy of Sciences, 1998. 95(26): p. 15769-15774.
85. Fagan, S.C., et al., Optimal delivery of minocycline to the brain: implication for human studies of acute neuroprotection. Experimental neurology, 2004. 186(2): p. 248-251.
86. Uckun, O.M., et al., Neuroprotective effects of tetracyclines on blunt head trauma: An experimental study on rats. Journal of neurosciences in rural practice, 2015. 6(1): p. 27.
87. Adembri, C., et al., Minocycline But Not Tigecycline Is Neuroprotective and Reduces the Neuroinflammatory Response Induced by the Superimposition of Sepsis Upon Traumatic Brain Injury. Critical care medicine, 2014. 42(8): p. e570-e582.
88. Jantzie, L.L., G.A. Rauw, and K.G. Todd, The effects of doxycycline administration on amino acid neurotransmitters in an animal model of neonatal hypoxia-ischemia. Neurochemistry international, 2006. 49(8): p. 717-728.
89. Lazzarini, M., et al., Doxycycline restrains glia and confers neuroprotection in a 6-OHDA Parkinson model. Glia, 2013. 61(7): p. 1084-1100.
90. Meli, D.N., et al., Doxycycline reduces mortality and injury to the brain and cochlea in experimental pneumococcal meningitis. Infection and immunity, 2006. 74(7): p. 3890-3896.
91. Widerøe, M., et al., Doxycycline treatment in a neonatal rat model of hypoxia–ischemia reduces cerebral tissue and white matter injury: a longitudinal magnetic resonance imaging study. European Journal of Neuroscience, 2012. 36(1): p. 2006-2016.
92. Lindeberg, J.o., R. Mattsson, and T. Ebendal, Timing the doxycycline yields different patterns of genomic recombination in brain neurons with a new inducible Cre transgene. Journal of neuroscience research, 2002. 68(2): p. 248-253.
93. Lin, A.J., et al., In vivo optical signatures of neuronal death in a mouse model of Alzheimer's disease. Lasers in surgery and medicine, 2014. 46(1): p. 27-33.
94. Soni, K., Fluoroquinolones: chemistry & action—a review. Indo Glob J Pharm Sci, 2012. 2: p. 43-53.

27
95. Somasundaram, S. and K. Manivannan, An overview of fluoroquinolones. Annual Review & Research in Biology, 2013. 3(3): p. 296-313.
96. Akahane, K., M. Kato, and S. Takayama, Involvement of inhibitory and excitatory neurotransmitters in levofloxacin-and ciprofloxacin-induced convulsions in mice. Antimicrobial agents and chemotherapy, 1993. 37(9): p. 1764-1770.
97. De Sarro, A., et al., Effects of novel 6-desfluoroquinolones and classic quinolones on pentylenetetrazole-induced seizures in mice. Antimicrobial agents and chemotherapy, 1999. 43(7): p. 1729-1736.
98. Sarro, A. and G. Sarro, Adverse reactions to fluoroquinolones. An overview on mechanistic aspects. Current medicinal chemistry, 2001. 8(4): p. 371-384.
99. Administration, U.S.F.a.D., FDA drug safety communication: FDA requires label changes to warn of risk for possibly permanent nerve damage from antibacterial fluoroquinolone drugs taken by mouth or by injection. UCM365078. pdf, 2013.
100. Matsumoto, M., Hashizume H, Tomishige T, Kawasaki M, Tsubouchi H, et al., OPC-67683, a Nitro-Dihydro_imidazooxazole Derivative with Promising Action against Tuberculosis In Vitro and In Mice. PLoS Med, 2006. 3(1): p. e466.
101. Stover, C.K., et al., A small-molecule nitroimidazopyran drug candidate for the treatment of tuberculosis. Nature, 2000. 405: p. 962-966.
102. Koul, A., et al., The challenge of new drug discovery for tuberculosis. Nature, 2011. 469: p. 483-490.
103. Moir, D.T., et al., New classes of antibiotics. Curr. Opin. Pharmacol., 2012. 12: p. 535-544.
104. Villemagne, B., et al., Tuberculosis: The drug development pipeline at a glance. Eur. J. Med. Chem., 2012. 51: p. 1-16.
105. Tyagi, S., et al., Bactericidal Activity of the Nitroimidazopyran PA-824 in a Murine Model of Tuberculosis. Antimicrob. Agents Chemother., 2005. 49: p. 2289-2293.
106. medicines-Deltyba., E.M.A.-H., Available from: http://www.ema.europa.eu/docs/en_GB/document_library?Summaryof opinion-Initial autorisation/human/002552/WC500155458.pdf.
107. Nau, R., F. Sörgel, and H. Eiffert, Penetration of drugs through the blood-cerebrospinal fluid/blood-brain barrier for treatment of central nervous system infections. Clinical microbiology reviews, 2010. 23(4): p. 858-883.
108. Carpenter, R. and B. Reddi, Neurophysiology: A Conceptual Approach. 2012: CRC Press. 109. Levin, V.A., Relationship of octanol/water partition coefficient and molecular weight to
rat brain capillary permeability. Journal of medicinal chemistry, 1980. 23(6): p. 682-684. 110. Nau, R., F. Sörgel, and H.W. Prange, Lipophilicity at pH 7.4 and molecular size govern
the entry of the free serum fraction of drugs into the cerebrospinal fluid in humans with uninflamed meninges. Journal of the neurological sciences, 1994. 122(1): p. 61-65.
111. Wellness, N.M. How does BBB damage begin? 2016 [cited 2016 7 December 2016]; Available from: http://www.newportmesawellness.com/lyme/blood-brain-barrier/.
112. Nunn, J.F., Applied respiratory physiology. 2013: Butterworth-Heinemann. 113. Dice, M. Atelectasis / Collapsed lung. 2016 [cited 2016 7 Decemeber 2016]; Available
from: http://medicaldice.com/diseases-a-z/health/atelectasis-collapsed-lung/. 114. Buckingham, K.W. and W.E. Wyder, Rapid tracheal infusion method for routine lung
fixation using rat and guinea pig. Toxicologic Pathology, 1981. 9(1): p. 17-20.

28
115. Braber, S., et al., A comparison of fixation methods on lung morphology in a murine model of emphysema. American Journal of Physiology-Lung Cellular and Molecular Physiology, 2010. 299(6): p. L843-L851.
116. Pegg, D.E., Principles of cryopreservation. Cryopreservation and freeze-drying protocols, 2007: p. 39-57.
117. Berry, K.A.Z., et al., MALDI imaging MS of phospholipids in the mouse lung. Journal of lipid research, 2011. 52(8): p. 1551-1560.
118. Baatz, J.E., et al., Cryopreservation of Viable Human Lung Tissue for Versatile Post-thaw Analyses and Culture. in vivo, 2014. 28(4): p. 411-423.
119. Brockbank, K.G. and M.J. Taylor, 8 Tissue Preservation. Advances in biopreservation, 2006: p. 157.
120. Mancia, A., et al., Cryopreservation and in vitro culture of primary cell types from lung tissue of a stranded pygmy sperm whale (Kogia breviceps). Comparative Biochemistry and Physiology Part C: Toxicology & Pharmacology, 2012. 155(1): p. 136-142.
29
Chapter 2 – Paper 1
Evidence for the presence of Clofazimine and its distribution in the healthy mouse brain
Sooraj Baijnath1, Suhashni Naiker1, Adeola Shobo1, Chivonne Moodley2, John Adamson2,
Bongani Ngcobo2, Linda A Bester3, Sanil Singh3, Gert Kruger1, Tricia Naicker1, Thavendran
Govender1
1 Catalysis and Peptide Research Unit, School of Pharmacy and Pharmacology, University of
KwaZulu-Natal, Westville Campus, Durban, South Africa. 2KwaZulu-Natal Research Institute for Tuberculosis and HIV, Nelson R. Mandela School of
Medicine, University of KwaZulu-Natal, Durban, South Africa. 3 Biomedical Resource Unit, University of KwaZulu-Natal, Westville Campus, Durban, South
Africa.
30
Abstract
This is the first report of clofazimine (CFZ) penetration and distribution in normal mouse brain.
Mice were administered 25mg/kg CFZ or 100mg/kg CFZ orally, daily for 2 weeks. Animals were
sacrificed and blood and brain tissues were harvested. LC/MS/MS (liquid chromatography tandem
mass spectrometry) showed high concentrations of CFZ in homogenized brain, with 100mg/kg
dose having significantly higher concentration than 25mg/kg. MALDI (matrix-assisted laser
desorption/ionization) imaging of brain sections showed widespread tissue distribution of CFZ.
Our results show dose dependent localization in brain.
Keywords: Clofazimine, brain distribution, MALDI-MSI
31
Introduction
Since its discovery in 1954 [1], CFZ has had an eventful history when compared to other
antibiotics. Initially, the drug showed promising in vitro results against Mycobacterium
tuberculosis (MTB) [2, 3], but disappointing in vivo results halted its progress [4]. However, CFZ
was subsequently used to treat against Mycobacterium leprae [5], and combined with rifampicin
and dapsone has become the gold standard in leprosy treatment [6]. With the emergence of XDR
and MDR-TB there is currently renewed interest in the use of the drug as an anti-TB agent mainly
because there is no known resistance against CFZ [7]. Recently in an observational study in
Bangladesh, the addition of CFZ to standard therapy for MDR-TB resulted in a relapse-free cure
rate of 87.9% in 206 patients [8]. Additionally, a murine model of pan-susceptible TB comparing
a 4-month CFZ containing regimen with standard 6-month therapy reported relapse-free cure after
3 months in the CFZ regimen as compared to 6 months with standard treatment[9].
MTB classically affects the lungs, but other organs can become infected by the haematogenous
spread of bacilli. Tuberculosis (TB) of the CNS occurs frequently in immunocompromised
patients and is often fatal, and occurs in 20-70% of HIV co-infected patients [10]. Therefore it is
important for anti-TB drugs to also enter the CNS of infected patients in therapeutic
concentrations, in order to fight these infections. Previous reports have stated that CFZ does not
enter the brain [11-14], however, in the latest to do so, a low dose of CFZ was administered
(10mg/kg/day) [11]. Hence in our study we have opted to use 2 significantly higher doses, which
have been shown to be effective in a mouse model of TB [15], in order to properly investigate
CFZ’s brain penetration and distribution, which will help in understanding if the drug can be used
as a therapeutic agent in the treatment of TB of the CNS.

32
We are currently investigating the tissue distribution and penetration of various antibiotics using
liquid chromatography mass spectrometry (LC/MS) and matrix assisted laser desorption ionization
(MALDI) mass spectrometry imaging (MSI). CFZ has a low molecular weight, high lipophilicity
and LogP of 7.132 [16], which should aid its brain penetration. Therefore this study was
undertaken to determine if CFZ administered orally at 25 and 100 mg/kg for two weeks to healthy
mice, penetrates the brain.
Materials and Methods
Ethical approval was obtained from University of KwaZulu-Natal Institutional Animal Ethics
Committee (027/02/15). The study cohort consisted of 30 female Balb/c mice (6-8 weeks; 18-
20g) divided into 3 groups (n=10). The first group received only the vehicle (control), the second
group received 25mg/kg CFZ and the third 100mg/kg. CFZ suspension was prepared in 0.05%
(w/v) agarose and administered orally 5 days a week for 2 weeks. Following treatment, animals
were sacrificed; and blood samples and whole brain were harvested. Plasma and brain samples
were stored at -80o C until analysis.
LC/MS/MS analysis was done with homogenized tissue suspended in 3 volumes of water.
Methanol (800µL) was added to homogenate (200µL), and centrifuged for 15 minutes at 15,000
rpm at 4oC. 800µL of supernatant was filtered through a Supelco Hybrid SPE cartridge, prior to
analysis. Analysis was carried out on a Bruker Q-TOF MS coupled with an Agilent 1100 HPLC
equipped with an YMC Triart C18 (3.0 mm x 150 mm). Mobile phase A was 5mM ammonium
acetate (pH 10) and mobile phase B was acetonitrile, the chromatographic conditions were as
follows: the flow rate was 0.4mL/min with a linear gradient from 50% to 100% phase B over 5
min, with a hold at 100% phase B for 2 min, followed by re-equilibration at 50% phase B for 3

33
min. The mass spectrometer was used in positive ion mode, with a dry gas flow rate of 8.0 L/min,
nebulizer pressure of 1.5 bar, capillary voltage of 5500V and a drying temperature of 200oC. The
MS/MS was conducted using MRM and the transition monitored was 473.1 to 431.9 m/z. Plasma
samples were processed and quantified as previously described [15]. The results from the
quantitative analysis were analyzed using GraphPad Prism V5 using the t test, a p value of less
than 0.05 was considered statistically significant.
MSI analysis was conducted on the Bruker Autoflex III Smartbeam system. Brain tissues were
sectioned using the Leica CM 1100 cryotome; 10µm sections were dried and fixed onto ITO coated
slides. The slides were then prepared using HCCA matrix and the Bruker ImagePrep automated
system. The images were acquired using an optimized LIFT method for CFZ with a spatial
resolution of 100 µm and a mass window of 473 ± 0.1 m/z, thus giving a clear distinction of the
drug from other endogenous substances that are present in the brain.
Results and Discussion
The mean (SD) CFZ concentration in plasma were 444.80 (78.07) ng/ml and 3357.50 (93.91)
ng/ml in the 25mg/kg and 100mg/kg group, respectively (Figure 1). The mean (SD) CFZ
concentration in brain were 156.16 (5.49) ng/ml and 719.50 (10.45) ng/ml after 25 mg/kg and 100
mg/kg dosing, respectively (Figure 1). CFZ concentration was significantly higher with a
100mg/kg dosing regimen (p < 0.01), showing that the concentration of the drug in the brain may
be dose related, however this is in opposition with another recent study investigating the
pharmacokinetics and pharmacodynamics of CFZ in the mouse model of TB, which reported that
lung, liver and spleen concentrations are independent of the dose administered [15].
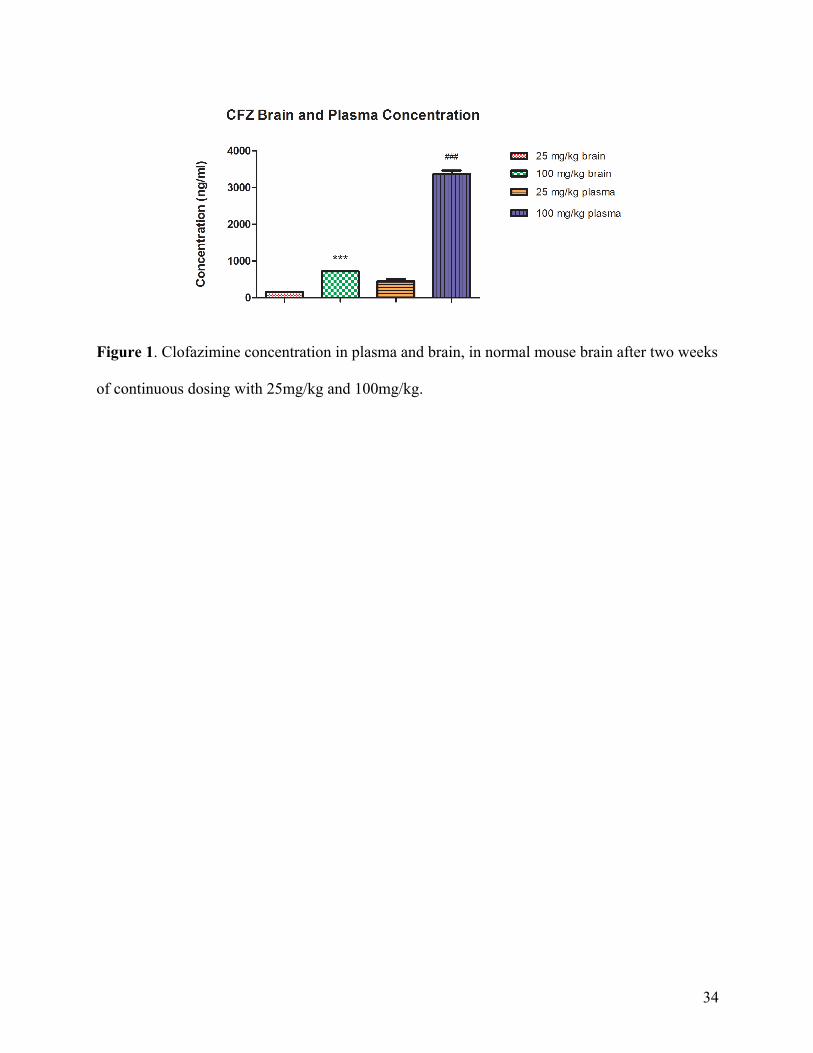
34
Figure 1. Clofazimine concentration in plasma and brain, in normal mouse brain after two weeks
of continuous dosing with 25mg/kg and 100mg/kg.
35
The MSI study showed widespread distribution of CFZ in the healthy mouse brain. Using the
spectrum obtained in the LIFT method as shown in supplementary information figure 1 and
figure 2, we utilized m/z 473 for the visualization of the drug and to distinguish them from
other biomolecules, since the brain is expected to contain predominantly heme and lipids,
which would only be detected around m/z 600-800, allowing for the specificity of CFZ.
Clofazimine localization is shown in the axial and coronal view for both 25mg/kg and
100mg/kg doses (Figure 1). However, greater accumulation is noted in the lateral ventricle
with the higher dose. This might be a significant finding, as the lateral ventricle houses the
choroid plexus which produces CSF and may explain the widespread distribution of CFZ [17],
however there is lack of information on CFZ’s availability in CSF. It has been shown that CFZ
requires approximately 2 weeks to reach tissue saturation levels[15], once a steady state is
reached the drug persists in tissues for a long time given its long half-life, and is slowly released
from tissue. However, many studies have reported on CFZ’s ability to form crystal-like drug
inclusions (CLDI’s) in tissue [11], which limit its antimicrobial activity. The concentrations
detected in our study are above the MIC for Mycobacterium tuberculosis [18], but recent results
suggest that tissue concentrations are not reflective of the amount of active drug present but
instead the bound drug and CLDI’s [15]. It is unclear if the concentration of CFZ we observed
are CLDI’s or the drug in its active form. This means once peak concentrations are reached
they are maintained for a prolonged period as the drug is slowly released from tissue deposits.
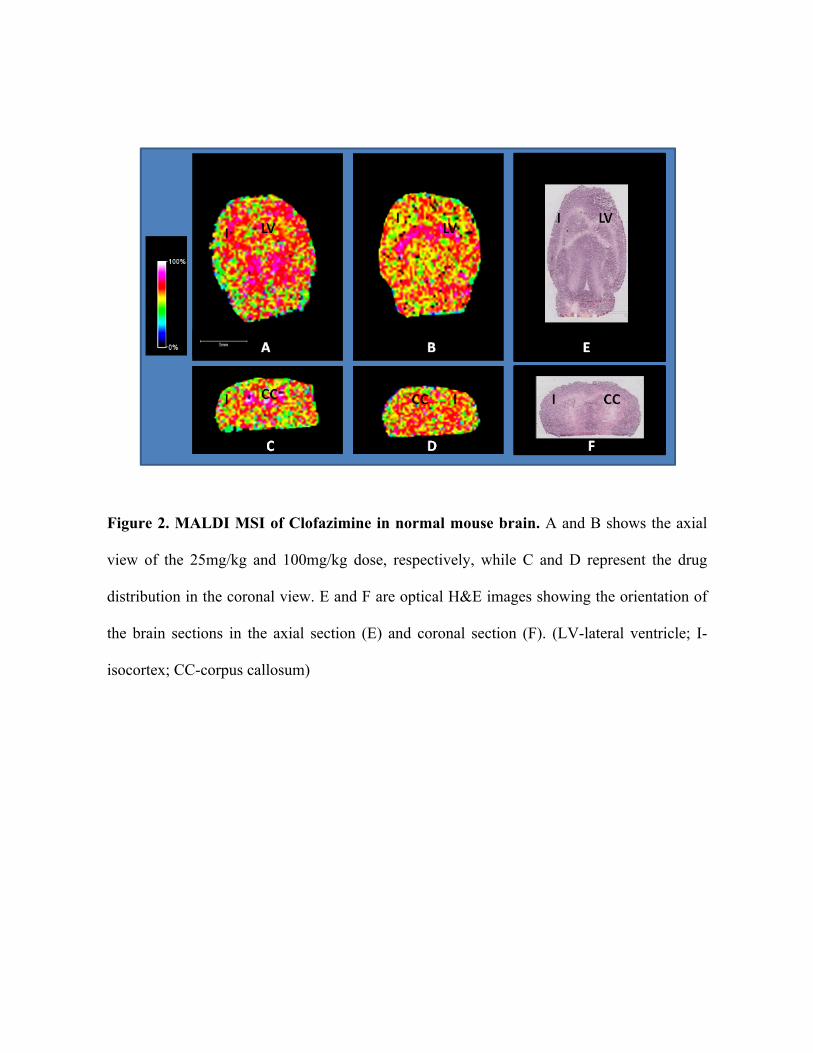
36
Figure 2. MALDI MSI of Clofazimine in normal mouse brain. A and B shows the axial
view of the 25mg/kg and 100mg/kg dose, respectively, while C and D represent the drug
distribution in the coronal view. E and F are optical H&E images showing the orientation of
the brain sections in the axial section (E) and coronal section (F). (LV-lateral ventricle; I-
isocortex; CC-corpus callosum)
37
Conclusion
This is the first study to confirm the penetration and distribution of CFZ in the brain of healthy
mice. MALDI MSI is an ideal technique for determining the exact tissue distribution of drugs,
this does not allow us to provide information on the route of entry into the brain. However, we
can prove the presence of CFZ in the brain, using a method that was previously shown to be
effective in the imaging of rifampicin and pretomanid [19, 20]. This is a powerful tool in
pharmacokinetic and pharmacodynamic studies especially when coupled with LC/MS/MS,
which is more specific than conventional LC/MS. Thus there is a possibility that CFZ
combined with other treatment regimens may be used in the treatment of CNS TB, since it has
been shown to shorten the treatment of first-line pulmonary TB in mice [9]. This study was
conducted using healthy mice in order to determine if CFZ is able to reach therapeutic
concentrations in the brain, which we have demonstrated. However, more studies are required
to determine the efficacy of CFZ as a neuroprotective agent.
Funding The authors would like to thank the National Research Foundation, SA; Aspenpharmacare, SA;
and the University of KwaZulu-Natal, Durban, SA for having funded this project.
Conflict of interest The authors declare no conflict of interest.
38
References 1. Barry, V.C., M.L. Conalty, and E.E. Gaffney, Antituberculosis activity in the phenazine
series. isomeric pigments obtained by oxidation of O-phenylenediamine derivatives. Journal of Pharmacy and Pharmacology, 1956. 8(1): p. 1089-1096.
2. Barry, V.C. and M.L. Conalty, Antituberculosis activity in the phenazine series. II. N3-substituted anilinoaposafranines (rimino-compounds) and some derivatives. American review of tuberculosis, 1958. 78(1): p. 62.
3. Barry, V.C., et al., A new series of phenazines (rimino-compounds) with high antituberculosis activity. Nature, 1957. 179: p. 1013-1015.
4. Barry, V.C., et al., Factors influencing the antituberculosis activity of the Rimino-compounds. Bulletin of the International Union against Tuberculosis and Lung Disease, 1959. 29: p. 11.
5. Chang, Y., Effects of B. 663, a rimino compound of the phenazine series, in murine leprosy. Antimicrobial agents and chemotherapy, 1962. 294: p. 307.
6. Programmes, W.S.G.o.C.o.L.f.C., Chemotherapy of Leprosy for Control Programmes: Report of a WHO Study Group. 1982: World Health Organization; Albany, NY: WHO Publications Centre USA.
7. Xu, H.B., R.H. Jiang, and H.P. Xiao, Clofazimine in the treatment of multidrug-resistant tuberculosis. Clinical Microbiology and Infection, 2012. 18(11): p. 1104-1110.
8. Van Deun, A., et al., Short, highly effective, and inexpensive standardized treatment of multidrug-resistant tuberculosis. American journal of respiratory and critical care medicine, 2010. 182(5): p. 684-692.
9. Tyagi, S., et al., Clofazimine shortens the duration of the first-line treatment regimen for experimental chemotherapy of tuberculosis. Proceedings of the National Academy of Sciences, 2015. 112(3): p. 869-874.
10. WHO, World Health Organization Global Tuberculosis Report 2013. World Health Organization, WHO Press, Geneva, Switzerland, 2013.
11. Baik, J., et al., Multiscale distribution and bioaccumulation analysis of clofazimine reveals a massive immune system-mediated xenobiotic sequestration response. Antimicrobial agents and chemotherapy, 2013. 57(3): p. 1218-1230.
12. Cholo, M.C., et al., Clofazimine: current status and future prospects. Journal of antimicrobial chemotherapy, 2011: p. dkr444.
13. Mansfield, R.E., Tissue concentrations of clofazimine (B663) in man. The American journal of tropical medicine and hygiene, 1974. 23(6): p. 1116-1119.
14. Venkatesan, K., Clinical pharmacokinetic considerations in the treatment of patients with leprosy. Clinical pharmacokinetics, 1989. 16(6): p. 365-386.
15. Swanson, R.V., et al., Pharmacokinetics and Pharmacodynamics of Clofazimine in a Mouse Model of Tuberculosis. Antimicrobial agents and chemotherapy, 2015. 59(6): p. 3042-3051.
16. Bolla, G. and A. Nangia, Clofazimine mesylate: a high solubility stable salt. Crystal Growth & Design, 2012. 12(12): p. 6250-6259.
17. Kandel, E.R., J.H. Schwartz, and T.M. Jessell, Principles of neural science. Vol. 4. 2000: McGraw-hill New York.
18. Lu, Y., et al., [Activities of clofazimine against Mycobacterium tuberculosis in vitro and in vivo]. Zhonghua jie he he hu xi za zhi= Zhonghua jiehe he huxi zazhi= Chinese journal of tuberculosis and respiratory diseases, 2008. 31(10): p. 752-755.

39
19. Shobo, A., et al., Visualization of time dependent distribution of rifampicin in rat brain using MALDI MSI and quantitative LCMS/MS. ASSAY and Drug Development Technologies, 2015. 13(5): p. 8.
20. Shobo, A., et al., Tissue Distribution of Pretomanid in Rat Brain via Mass Spectrometry Imaging. Xenobiotica, 2015.

40
Chapter 3 – Paper 2
Neuroprotective potential of Linezolid: A quantitative and distribution study via mass spectrometry
Sooraj Baijnath1, Adeola Shobo1, Linda A Bester2, Sanil D Singh2, Gert Kruger1, Per I.
Arvidsson1, 3, Tricia Naicker1, Thavendran Govender1
1 Catalysis and Peptide Research Unit, University of KwaZulu-Natal, Westville Campus,
Durban, South Africa. 2Biomedical Resource Unit, University of KwaZulu-Natal, Westville Campus, Durban, South
Africa. 3Science for Life Laboratory, Drug Discovery & Development Platform & Division of
Translational Medicine and Chemical Biology, Department of Medical Biochemistry and
Biophysics, Karolinska Institutet, Stockholm, Sweden
41
Abstract A study was undertaken to determine the neuroprotective potential of Linezolid (LIN) in an animal
model. Female Sprague-Dawley rats were either given a single (100 mg/kg) dose or treated daily
for 4 weeks. A validated LC-MS/MS method was used to measure LIN levels in plasma and brain,
this was paired with mass spectrometry imaging (MSI) to determine the tissue spatial distribution
of the drug. The results showed that after a single dose there was poor penetration of the drug into
the brain. With multiple doses there were high tissue levels, with the drug reaching steady state in
subsequent weeks. LIN displayed a promising distribution pattern with localisation in the
brainstem. Systemic circulation is fed into the brain by the carotid and vertebral arteries which
enter through the brain stem, therefore high drug concentrations is this area may protect against
infectious agents entering via this route.
Keywords: linezolid, brain, MSI, LC-MS/MS, neuroprotection, molecular histology

42
Introduction Oxazolidinones, the first new class of antimicrobial agents since 1980 has led to the discovery of
Linezolid (LIN) [1], one of the most promising antibiotics in recent years. Its mechanism of action
involves the inhibition of protein synthesis during the translation stage [1].Its excellent
bioavailibity and serum pharmacokinetic (pK) profile sets it apart from other members of this
family [2-6]. Since these drugs are synthetic, there are no naturally occurring resistance genes,
making LIN effective against many life threatening bacterial infections [2]. This has been
reinforced by multiple studies which have demonstrated its in vivo and in vitro activity against a
number of resistant strains [3]. In recent times, this advantage has been used in the effective
treatment and management of central nervous system (CNS) associated infections [3, 7-9].After
initial results in a rabbit model of meningitis were discouraging, follow-up human studies have
proven to be much more promising, with a number of case studies reporting the complete
eradication of multi-drug resistant Enterococci sp., Staphylococci sp., Streptococci sp., Bacillus
sp., Corynebacterium sp., Listeria sp. systemic infections[1, 3, 7, 9, 10]. A few studies have
demonstrated the ability of LIN to effectively combat neurological disorders such as brain
abscesses and meningeal infections[8]. Quantitative investigations using cerebrospinal fluid (CSF)
measurements have been conducted [7, 9-11], however, these are not a true representation of tissue
concentrations since the brain possesses its own independent CSF pathway [12]. A study involving
brain penetration has been conducted [13] but can be misleading since only a small tissue biopsy
was used for quantification and as previously shown, many drugs show preferential tissue
distribution, particularly in the brain [12, 14-17]. Many recent reports have shown LIN
effectiveness against drug resistant TB both in vitro and in vivo [18, 19], there was the remission
of symptoms in these patients, who were initially on failing treatment regimens [20]. A concern

43
is hematologic toxicity, which can be mitigated when treatment is supplemented with vitamin B6
[19, 21]. Paired with these findings and those involving other resistant microbes, LIN may have
strong applications for the treatment of tuberculosis meningitis (TBM), a disease that is responsible
for a large number of deaths each year, and other neurological disorders. A positron emission
tomography/ computed tomography (PET/CT) imaging study demonstrated its beneficial effect on
pulmonary tuberculosis (TB) infections in macaques and human subjects[18]. This shows that
there is a strong correlation between LIN behaviour in human and experimental models.
Even with these promising results, the distribution and localisation of LIN in the brain is not yet
fully understood. A deeper understanding of LIN´s mechanism of action in the CNS will help
researchers to develop new treatments to fight neurological disorders and effectively combat life
threatening meningeal infections.
For these reasons, the purpose of this study is to investigate the brain tissue pharmacokinetic
properties of LIN following single and multiple does using an accurate and sensitive LC-MS/MS
method. The second aim was to determine tissue distribution using mass spectrometry imaging
(MSI) which was successfully applied in the investigation of other potential anti-TBM agents [12,
14, 16, 17]. This will aid in understanding the role of LIN in the treatment of neurological
disorders.

44
Materials and Methods
Reagents and standards
LIN was purchased as ZyvoxR IV infusion (Pharmed Pharmaceuticals, Durban, South Africa) and
extracted using dichloromethane (the yield was > 98%), purity was then determined using a
Shimadzu LC-MS before being used for analytical method development. Bedaquiline (TMC-207)
was used as the internal standard (IS) (synthesised in our laboratory, its 1H and 13C NMR spectra
corresponded to that in literature[22].All solvents were LC-MS grade and purchased from Sigma
Aldrich (Steinham, Germany); Ultra-pure water was obtained using a Milli-Q water purification
system (Bedford, MA, USA).
Animal study
The animal study was approved by the institutional Animal Research Ethics Committee (AREC)
of the University of KwaZulu-Natal (UKZN) (approval reference: 001/15/Animal). For the short
term study, the animals received a single dose of LIN (100mg/kg) which was prepared in 10 %
DMSO, this was based on a previous study in which this amount was well tolerated in rodents and
showed excellent kill characteristics in a murine model of septicaemia [23]. In the short term study,
female Sprague-Dawley rats (with ad libitum access to food and water throughout the study) were
given a single dose of LIN via oral gavage thereafter they were periodically sacrificed (0, 0.25,
0.5, 1, 2, 4, 6, 8 and 24 hours; n = 3 per time-point) post-dose to determine the short term plasma
and brain pK profile of LIN. For the long term study, the animals were orally administered LIN
five days weekly, for a period of four weeks. After each week, the animals were terminated (n =
5), at a single time point, to investigate the pK changes following each treatment period. The
sacrifice was the same in both studies, animals were euthanized using Halothane (Safeline
Pharmaceuticals, South Africa) overdose and blood collected via cardiac puncture. The brain was
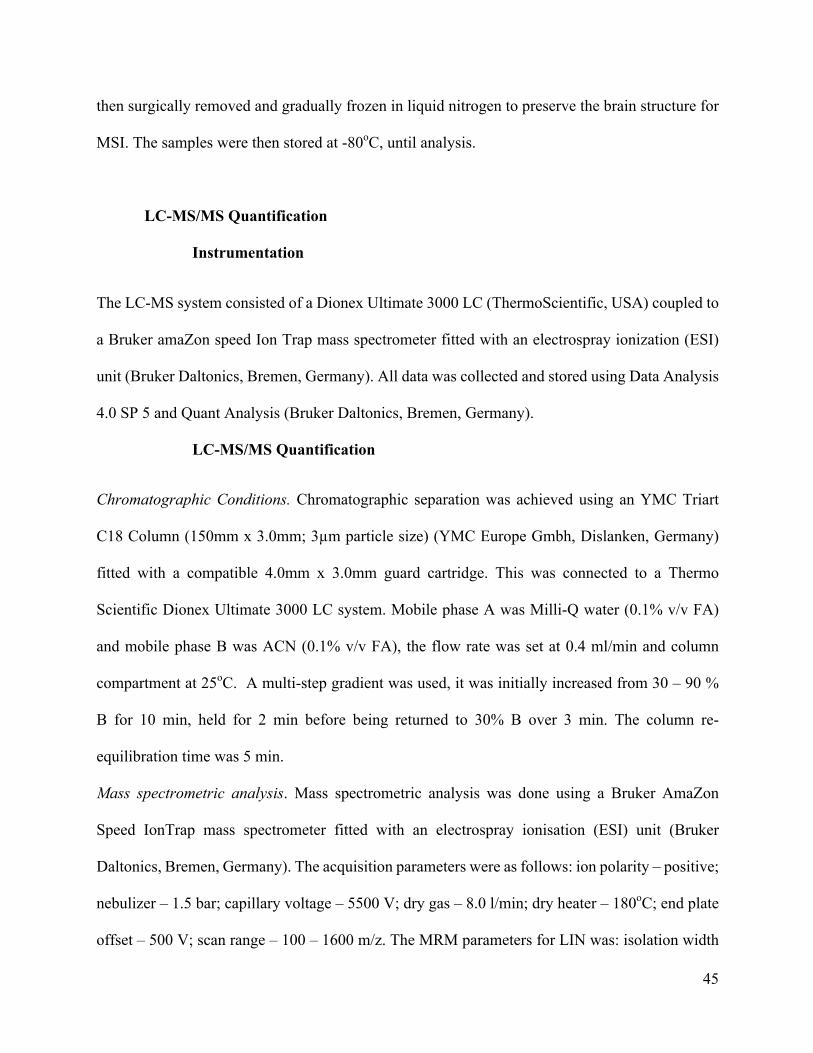
45
then surgically removed and gradually frozen in liquid nitrogen to preserve the brain structure for
MSI. The samples were then stored at -80oC, until analysis.
LC-MS/MS Quantification
Instrumentation
The LC-MS system consisted of a Dionex Ultimate 3000 LC (ThermoScientific, USA) coupled to
a Bruker amaZon speed Ion Trap mass spectrometer fitted with an electrospray ionization (ESI)
unit (Bruker Daltonics, Bremen, Germany). All data was collected and stored using Data Analysis
4.0 SP 5 and Quant Analysis (Bruker Daltonics, Bremen, Germany).
LC-MS/MS Quantification
Chromatographic Conditions. Chromatographic separation was achieved using an YMC Triart
C18 Column (150mm x 3.0mm; 3µm particle size) (YMC Europe Gmbh, Dislanken, Germany)
fitted with a compatible 4.0mm x 3.0mm guard cartridge. This was connected to a Thermo
Scientific Dionex Ultimate 3000 LC system. Mobile phase A was Milli-Q water (0.1% v/v FA)
and mobile phase B was ACN (0.1% v/v FA), the flow rate was set at 0.4 ml/min and column
compartment at 25oC. A multi-step gradient was used, it was initially increased from 30 – 90 %
B for 10 min, held for 2 min before being returned to 30% B over 3 min. The column re-
equilibration time was 5 min.
Mass spectrometric analysis. Mass spectrometric analysis was done using a Bruker AmaZon
Speed IonTrap mass spectrometer fitted with an electrospray ionisation (ESI) unit (Bruker
Daltonics, Bremen, Germany). The acquisition parameters were as follows: ion polarity – positive;
nebulizer – 1.5 bar; capillary voltage – 5500 V; dry gas – 8.0 l/min; dry heater – 180oC; end plate
offset – 500 V; scan range – 100 – 1600 m/z. The MRM parameters for LIN was: isolation width
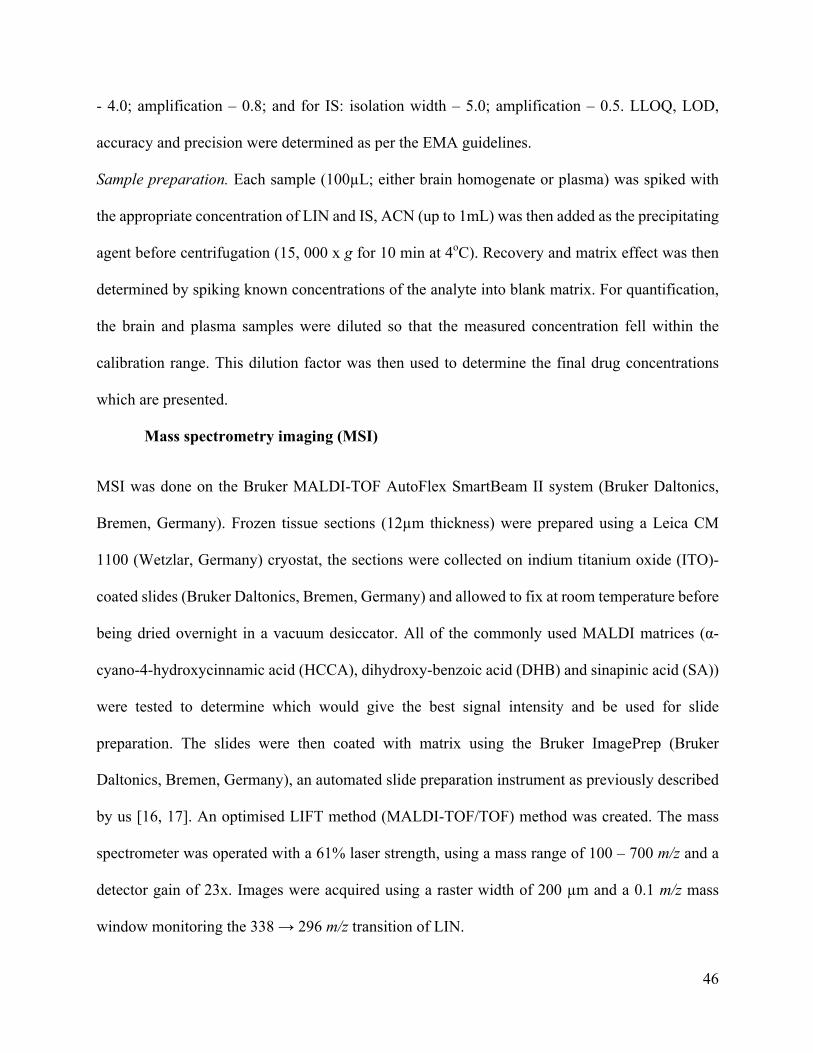
46
- 4.0; amplification – 0.8; and for IS: isolation width – 5.0; amplification – 0.5. LLOQ, LOD,
accuracy and precision were determined as per the EMA guidelines.
Sample preparation. Each sample (100µL; either brain homogenate or plasma) was spiked with
the appropriate concentration of LIN and IS, ACN (up to 1mL) was then added as the precipitating
agent before centrifugation (15, 000 x g for 10 min at 4oC). Recovery and matrix effect was then
determined by spiking known concentrations of the analyte into blank matrix. For quantification,
the brain and plasma samples were diluted so that the measured concentration fell within the
calibration range. This dilution factor was then used to determine the final drug concentrations
which are presented.
Mass spectrometry imaging (MSI)
MSI was done on the Bruker MALDI-TOF AutoFlex SmartBeam II system (Bruker Daltonics,
Bremen, Germany). Frozen tissue sections (12µm thickness) were prepared using a Leica CM
1100 (Wetzlar, Germany) cryostat, the sections were collected on indium titanium oxide (ITO)-
coated slides (Bruker Daltonics, Bremen, Germany) and allowed to fix at room temperature before
being dried overnight in a vacuum desiccator. All of the commonly used MALDI matrices (α-
cyano-4-hydroxycinnamic acid (HCCA), dihydroxy-benzoic acid (DHB) and sinapinic acid (SA))
were tested to determine which would give the best signal intensity and be used for slide
preparation. The slides were then coated with matrix using the Bruker ImagePrep (Bruker
Daltonics, Bremen, Germany), an automated slide preparation instrument as previously described
by us [16, 17]. An optimised LIFT method (MALDI-TOF/TOF) method was created. The mass
spectrometer was operated with a 61% laser strength, using a mass range of 100 – 700 m/z and a
detector gain of 23x. Images were acquired using a raster width of 200 µm and a 0.1 m/z mass
window monitoring the 338 → 296 m/z transition of LIN.
47
Results and Discussion
LC-MS/MS Quantification
After optimization of the separation conditions, a reproducible separation of LIN and the IS was
achieved in the biological matrices. Subsequently, the spectrometer was tuned to produce good
sensitivity and signal reproducibility, using these optimized conditions an MS method was created
to monitor the 338.11 → 296.10 m/z (Figure 1) transition for LIN and 555.10 → 523.08 m/z for
IS (Figure 2). The LLOQ and LOD for this method was 100ng/ml and 1ng/ml, respectively.
The calibration curve was created over a concentration range of 100 – 1500 ng/mL, the linear
regression analysis (y = 9.038689 + 0.493295x) showed the curve to be linear over this range, with
an r2value of 0.9996. Before separation using HPLC, endogenous proteins and lipids were
removed from the samples to prevent unwanted interferences during quantification. This was
effectively achieved using protein precipitation (using ACN) coupled with filtration through a
Supelco HyBrid SPE cartridge, which yielded excellent recovery rates (Table 1.). Matrix effects
are referred to any undesired ion enhancement or suppression that may be caused by the biological
matrix (brain homogenate) on the target analyte (LIN), these results are also summarised in Table
1.
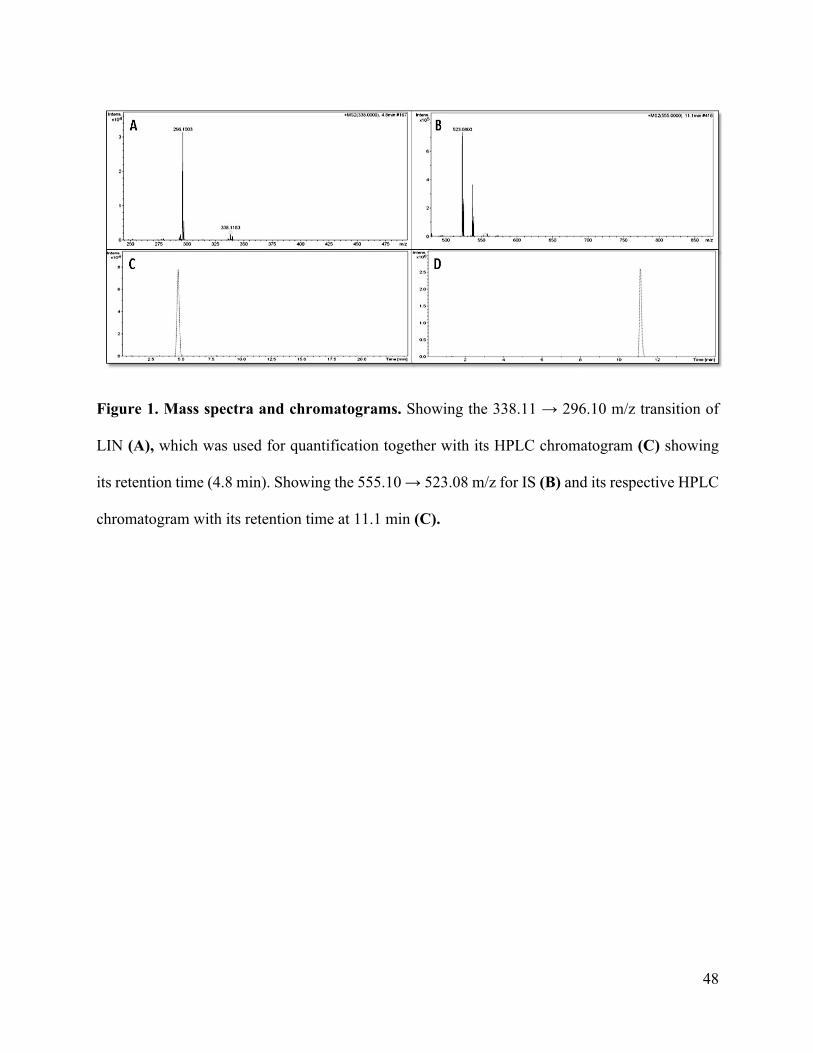
48
Figure 1. Mass spectra and chromatograms. Showing the 338.11 → 296.10 m/z transition of
LIN (A), which was used for quantification together with its HPLC chromatogram (C) showing
its retention time (4.8 min). Showing the 555.10 → 523.08 m/z for IS (B) and its respective HPLC
chromatogram with its retention time at 11.1 min (C).

49
Table 1. Extraction recovery, using ACN as the precipitant coupled with filtration through the
Supelco HyBrid SPE cartridge.
Sample Mean Recovery (%)
% RSD Matrix Effect (%)
% RSD
LQC 91.4 1.7 -6.7 5.3 MQC 91.9 2.5 -10.1 2.1 HQC 92.2 1.5 -8.3 4.7
Table 2. Accuracy and precision of the method for LIN in brain homogenate.
Theoretical concentration
(µg/ml)
Mean concentration
(µg/ml)
% Accuracy % RSD
Intra-day 100 93.2 93.2 4.6 150 141.5 94.3 3.1 800 756.7 94.6 6.3 1400 1289.3 92.1 3.8 Inter-day 100 92.9 92.9 1.8 150 139.1 92.7 2.9 800 755.6 94.4 5.2 1400 1287.9 92.0 2.6
Pharmacokinetic analysis and MSI analysis
The optimised LC-MS/MS method was then used to determine plasma and brain concentrations
of LIN after single (100mg/kg.b.w.) and multiple doses (100mg/kg.b.w daily; 5 days weekly for 4
weeks).After the initial 24 hour single dose study significant amounts of the drug was detected in
rat plasma samples with a maximum concentration (Cmax) of 70.36 ± 5.3µg/mL that was reached
after time of maximum concentration (Tmax) of 2 hours. This was consistent with a study
investigating the neurological effects of LIN in a rat model[24]. Pharmacokinetic parameters were
determine using Stata13 (StataCorp LP, Texas, USA) and are summarised in Table 2.
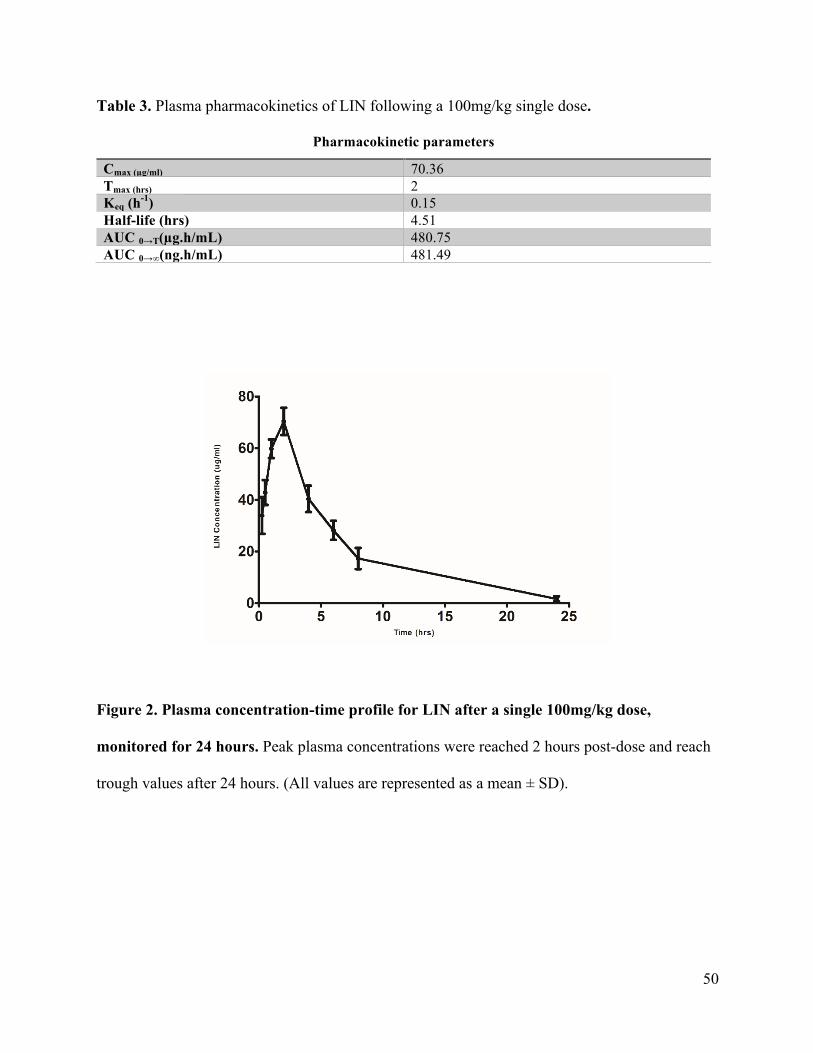
50
Table 3. Plasma pharmacokinetics of LIN following a 100mg/kg single dose.
Pharmacokinetic parameters
Cmax (µg/ml) 70.36 Tmax (hrs) 2 Keq (h-1) 0.15 Half-life (hrs) 4.51 AUC 0→T(µg.h/mL) 480.75 AUC 0→∞(ng.h/mL) 481.49
Figure 2. Plasma concentration-time profile for LIN after a single 100mg/kg dose,
monitored for 24 hours. Peak plasma concentrations were reached 2 hours post-dose and reach
trough values after 24 hours. (All values are represented as a mean ± SD).
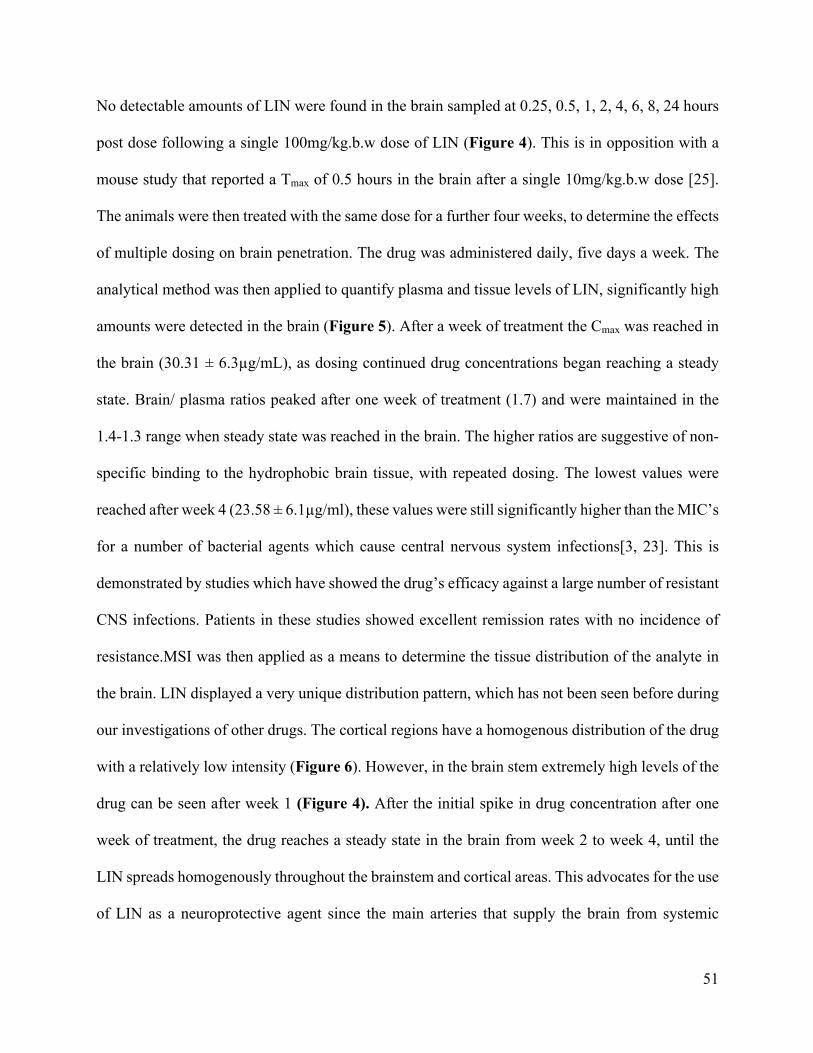
51
No detectable amounts of LIN were found in the brain sampled at 0.25, 0.5, 1, 2, 4, 6, 8, 24 hours
post dose following a single 100mg/kg.b.w dose of LIN (Figure 4). This is in opposition with a
mouse study that reported a Tmax of 0.5 hours in the brain after a single 10mg/kg.b.w dose [25].
The animals were then treated with the same dose for a further four weeks, to determine the effects
of multiple dosing on brain penetration. The drug was administered daily, five days a week. The
analytical method was then applied to quantify plasma and tissue levels of LIN, significantly high
amounts were detected in the brain (Figure 5). After a week of treatment the Cmax was reached in
the brain (30.31 ± 6.3µg/mL), as dosing continued drug concentrations began reaching a steady
state. Brain/ plasma ratios peaked after one week of treatment (1.7) and were maintained in the
1.4-1.3 range when steady state was reached in the brain. The higher ratios are suggestive of non-
specific binding to the hydrophobic brain tissue, with repeated dosing. The lowest values were
reached after week 4 (23.58 ± 6.1µg/ml), these values were still significantly higher than the MIC’s
for a number of bacterial agents which cause central nervous system infections[3, 23]. This is
demonstrated by studies which have showed the drug’s efficacy against a large number of resistant
CNS infections. Patients in these studies showed excellent remission rates with no incidence of
resistance.MSI was then applied as a means to determine the tissue distribution of the analyte in
the brain. LIN displayed a very unique distribution pattern, which has not been seen before during
our investigations of other drugs. The cortical regions have a homogenous distribution of the drug
with a relatively low intensity (Figure 6). However, in the brain stem extremely high levels of the
drug can be seen after week 1 (Figure 4). After the initial spike in drug concentration after one
week of treatment, the drug reaches a steady state in the brain from week 2 to week 4, until the
LIN spreads homogenously throughout the brainstem and cortical areas. This advocates for the use
of LIN as a neuroprotective agent since the main arteries that supply the brain from systemic

52
circulation enter through the brainstem. These are the carotid and vertebral arteries which
contribute 80% and 20% of the blood flow entering the brain, respectively[26]. They come
together at the level of the pons in the brainstem, to form the midline basilar artery that branches
into the rest of the brain[26]. This means that the large concentrations of the drug in the brainstem
may be able to combat the entry of infections, from systemic circulation, into the brain; thus,
preventing the establishment of CNS infections in patients with a predisposition to develop
neurological illness. The added benefit of using LIN for such cases is its proven safety profile,
with no pro-convulsive properties and no effect on nervous system function [4, 24].
Figure 3. MSI image of rat brain after 2 hours with a single 100 mg/kg dose. A1 and A2 show
the axial and coronal view, respectively. Minute amounts of the drug, which was below the limit
of quantification, can be seen after 2 hours which was the Tmax in plasma. B1 and B2 are the
histological images (x 2.5 mag), for spatial correlation.
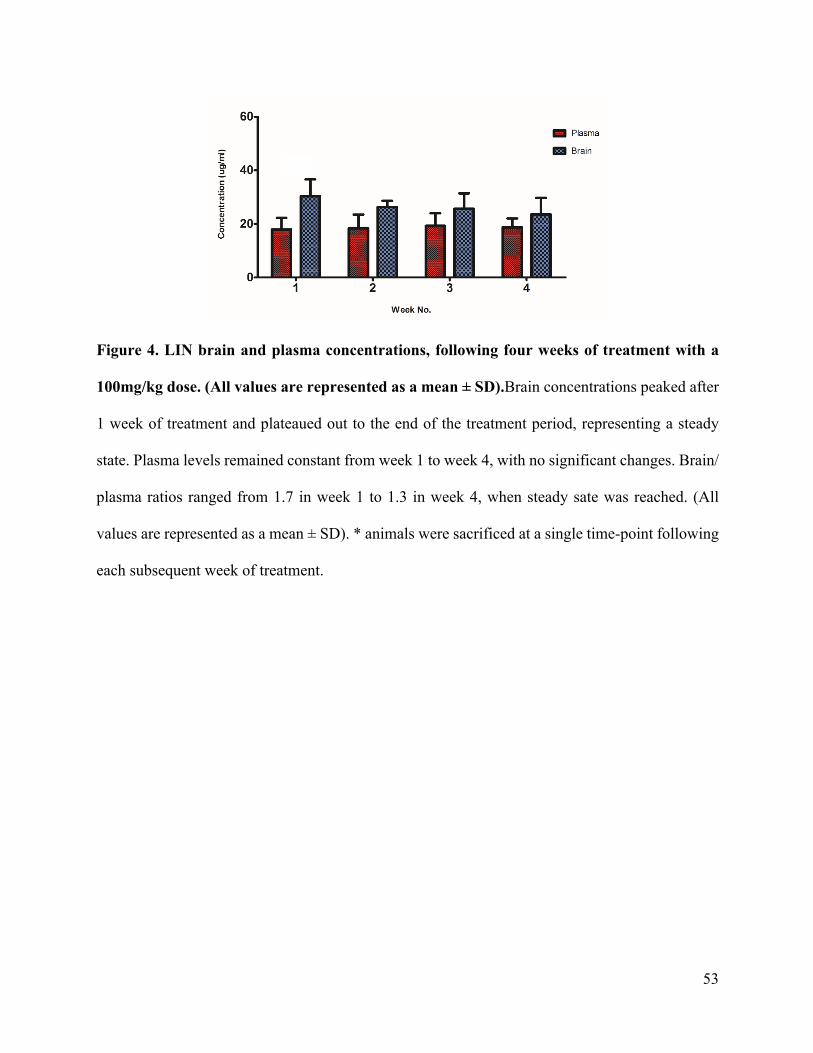
53
Figure 4. LIN brain and plasma concentrations, following four weeks of treatment with a
100mg/kg dose. (All values are represented as a mean ± SD).Brain concentrations peaked after
1 week of treatment and plateaued out to the end of the treatment period, representing a steady
state. Plasma levels remained constant from week 1 to week 4, with no significant changes. Brain/
plasma ratios ranged from 1.7 in week 1 to 1.3 in week 4, when steady sate was reached. (All
values are represented as a mean ± SD). * animals were sacrificed at a single time-point following
each subsequent week of treatment.
54
Figure 6. MSI images showing weekly LIN distribution in the healthy rat brain following
four weeks of multiple dosing. Images were acquired after each subsequent week of treatment.
(KEY: C = after 1 week of treatment; D = after 2 weeks of treatment; E = after 3 weeks of
treatment; F = after 4 weeks of treatment; 1 and 2 are the axial and coronal sections,
respectively)
55
Conclusion In this study we have proven that single doses may not be sufficient for LIN to penetrate the CNS.
After a single week of multiple dosing peak concentrations were reached in the brain, and a steady
state was reached within subsequent weeks of treatment.MSI was also used to demonstrate LIN’s
unique distribution in the brain, where it localises at the brainstem which could potentially protect
against infectious agents entering via systemic circulation. This makes LIN a potential silver bullet
in the struggle to effectively combat neurological infections, especially during a time when CNS
infections are responsible for such high morbidit0y and mortality rates worldwide.
Funding
The authors would like to thank the National Research Foundation, SA; Aspenpharmacare, SA;
and the University of KwaZulu-Natal, Durban, SA for having funded this project.
Conflict of interest
The authors declare no conflict of interest.
56
References 1. Moellering, R.C., Linezolid: the first oxazolidinone antimicrobial. Annals of internal
medicine, 2003. 138(2): p. 135-142. 2. Dryden, M.S., Linezolid pharmacokinetics and pharmacodynamics in clinical treatment.
Journal of antimicrobial chemotherapy, 2011. 66(suppl 4): p. iv7-iv15. 3. Ager, S. and K. Gould, Clinical update on linezolid in the treatment of Gram-positive
bacterial infections. Infection and drug resistance, 2012. 5: p. 87. 4. Slatter, J., et al., Pharmacokinetics, toxicokinetics, distribution, metabolism and excretion
of linezolid in mouse, rat and dog. Xenobiotica, 2002. 32(10): p. 907-924. 5. MacGowan, A.P., Pharmacokinetic and pharmacodynamic profile of linezolid in healthy
volunteers and patients with Gram-positive infections. Journal of Antimicrobial Chemotherapy, 2003. 51(suppl 2): p. ii17-ii25.
6. Gee, T., et al., Pharmacokinetics and tissue penetration of linezolid following multiple oral doses. Antimicrobial Agents and Chemotherapy, 2001. 45(6): p. 1843-1846.
7. Beer, R., et al., Pharmacokinetics of intravenous linezolid in cerebrospinal fluid and plasma in neurointensive care patients with staphylococcal ventriculitis associated with external ventricular drains. Antimicrobial agents and chemotherapy, 2007. 51(1): p. 379-382.
8. Krzysztofiak, A., et al., Linezolid Therapy of Brain Abscess. The Pediatric infectious disease journal, 2010. 29(11): p. 1063-1064.
9. Villani, P., et al., Cerebrospinal fluid linezolid concentrations in postneurosurgical central nervous system infections. Antimicrobial agents and chemotherapy, 2002. 46(3): p. 936-937.
10. Shaikh, Z., C.A. Peloquin, and C.D. Ericsson, Successful treatment of vancomycin-resistant Enterococcus faecium meningitis with linezolid: case report and literature review. Scandinavian journal of infectious diseases, 2000. 33(5): p. 375-379.
11. Myrianthefs, P., et al., Serum and cerebrospinal fluid concentrations of linezolid in neurosurgical patients. Antimicrobial agents and chemotherapy, 2006. 50(12): p. 3971-3976.
12. Shobo, A., et al., Visualization of time-dependent distribution of rifampicin in rat brain using MALDI MSI and quantitative LCMS/MS. Assay and drug development technologies, 2015. 13(5): p. 277-284.
13. Tsona, A., et al., Linezolid penetration into cerebrospinal fluid and brain tissue. Journal of Chemotherapy, 2010. 22(1): p. 17-19.
14. Shobo, A., et al., Tissue distribution of pretomanid in rat brain via mass spectrometry imaging. Xenobiotica, 2015: p. 1-6.
15. Munyeza, C.F., et al., Rapid and widespread distribution of doxycycline in rat brain: a mass spectrometric imaging study. Xenobiotica, 2015: p. 1-8.
16. Baijnath, S., et al., Evidence for the presence of clofazimine and its distribution in the healthy mouse brain. Journal of molecular histology, 2015. 46(4-5): p. 439-442.
17. Shobo, A., et al., MALDI MSI and LC-MS/MS: Towards preclinical determination of the neurotoxic potential of fluoroquinolones. Drug testing and analysis, 2015.
18. Coleman, M.T., et al., PET/CT imaging reveals a therapeutic response to oxazolidinones in macaques and humans with tuberculosis. Science translational medicine, 2014. 6(265): p. 265ra167-265ra167.

57
19. Schecter, G., et al., Linezolid in the treatment of multidrug-resistant tuberculosis. Clinical Infectious Diseases, 2010. 50(1): p. 49-55.
20. Zhang, X., et al., Systematic review and meta-analysis of the efficacy and safety of therapy with linezolid containing regimens in the treatment of multidrug-resistant and extensively drug-resistant tuberculosis. Journal of thoracic disease, 2015. 7(4): p. 603.
21. Youssef, S., et al., The role of vitamin B6 in the prevention of haematological toxic effects of linezolid in patients with cancer. Journal of antimicrobial chemotherapy, 2008. 61(2): p. 421-424.
22. Chandrasekhar, S., G. Babu, and D.K. Mohapatra, Practical Syntheses of (2S)-R207910 and (2R)-R207910. European Journal of Organic Chemistry, 2011. 2011(11): p. 2057-2061.
23. Marra, A., et al., Effect of linezolid on the 50% lethal dose and 50% protective dose in treatment of infections by Gram-negative pathogens in naive and immunosuppressed mice and on the efficacy of ciprofloxacin in an acute murine model of septicemia. Antimicrobial agents and chemotherapy, 2012. 56(9): p. 4671-4675.
24. Tukaram, S.A., et al., Systemic Safety Evaluation of Central Nervous System Function in the Rat by Oral Administration of Linezolid.
25. Seetharamsingh, B., et al., Design, Synthesis, and Identification of Silicon Incorporated Oxazolidinone Antibiotics with Improved Brain Exposure. ACS medicinal chemistry letters, 2015. 6(11): p. 1105-1110.
26. Magee, D.J., Orthopedic physical assessment. 2014: Elsevier Health Sciences.

58
Chapter 4 – Paper 3
Small molecule distribution in rat lung: A comparison of various cryoprotectants as inflation media and their applicability to MSI
Sooraj Baijnath1, Adeola Shobo1, Linda A Bester2, Sanil D Singh2, Gert Kruger1, Tricia Naicker1,
Thavendran Govender1
1 Catalysis and Peptide Research Unit, University of KwaZulu-Natal, Westville Campus, Durban,
South Africa. 2 Biomedical Resource Unit, University of KwaZulu-Natal, Westville Campus, Durban, South
Africa.

59
Abstract
Introduction:Given the recent explosion of mass spectrometric imaging (MSI), it has become easier to assess drug tissue localisation without the use of radiolabeling and other more complex methods (such as PET and MRI). For MSI tissue preparation is of utmost importance, however, the lung in particular does pose some difficulties with imaging since it is made up of a number of air-filled alveoli. These organs are known to collapse when the thoracic cavity is pierced, losing its structural integrity and giving poor histological representation for drug distribution analysis.
Hypothesis: The use of cryoprotectants as a tissue inflation media will aid in the preservation of the lung’s structural integrity during MSI experiments involving small molecule distribution.
Methods: Various established cryoprotectants (DMSO, PvP, ethylene glycol, sucrose, DMEM, control serum, OCT) were selected as lung inflation media for MSI analysis of gatifloxacin (GAT). Female Sprague-Dawley rats were treated with GAT (10 mg/kg.b.w) via i.p. injection. After 15 min the animals were terminated by halothane overdose, and each set of tissue inflated with a specific agent. Cryosections were made and MSI conducted to determine drug tissue distribution.
Results: During the early stages of the experimental procedure some crypreservatives were eliminated due to difficulties with sample preparation. While others displayed excellent preservation of the tissue structure and integrity. Following MSI analysis, some agents showed homogenous drug distribution while some displayed heterogeneous distribution favoring the basal periphery. Taking into account the physiology of the lung and previous MRI investigations of its perfusion, it is expected that a systemically administered drug would localize in the basal areas. DMSO and DMEM proved to display this distribution pattern while keeping structural integrity intact. However, the later was ruled out since it showed complete suppression of GAT in solution.
Conclusion: From the cryoprotectants selected for this study, DMSO is the most promising lung inflation media focusing on small molecule distribution via MSI.
Keywords: lung inflation, cryopreservation, MALDI-MSI, drug distribution, gatifloxacin
60
Introduction
Historically, lung disorders have been a major health concern leading to acute, chronic and
life threatening complications. The importance of the histological evaluation of the
respiratory system dates back to the 1920’s when used for the diagnosis of small cell cancer,
which was believed to be an oat cell sarcoma of the mediastinum [1]. With recent
advancement in imaging technologies and new pharmaceutics, histochemistry has
significantly improved, e.g. mass spectrometric imaging (MSI) at the forefront as an
important analytical tool [2], making these conditions and associated pathologies easier to
target. Numerous publications have demonstrated the value of small molecule MSI as an
alternative, label-free approach in drug distribution studies [3, 4]. Our research group is
currently investigating the localization and distribution of anti-tuberculosis (TB) drugs in the
rat brain using this approach [5-7]. However, an ideal pharmacological agent should also
enter the lung (the primary infection site). Although these drugs can be quantified using LC-
MS/MS, this does not afford the privilege of spatial information, which is required to help
curb and manage pulmonary disorders. A few studies in which MSI has provided spatial
information of small molecules and endogenous substances in the lung have been reported,
however the information can be misleading due to the structural integrity of the tissue [4, 8-
10]. In order for clinicians to effectively combat disease, the distribution and behaviour of
new drugs in healthy tissue needs to be investigated.
The lung is the respiratory centre of the body and facilitates efficient gaseous exchange
through of a number of air-filled sacs, the alveoli. It is enclosed in a double membrane, called
the pleura [11]. The trachea, bronchi and bronchioles make up the conducting zone of the
respiratory system which carries inhaled air to the gas exchange surface [11]. In order for the
organ to efficiently carry out its physiological functions, these alveoli are maintained in an
“open” state by the balance between alveolar pressure (pressure in the alveoli), intrapleural

61
pressure (pressure in the intrapleural space) and transpulmonary pressure (pressure gradient
across the lung walls) [11]. These pressures are also responsible for keeping the lung stable
between breaths and preventing it from collapsing. The pressure is closely maintained by the
tissue and its associated anatomical structures including the diaphragm, the pleural walls and
the thoracic cavity [11]. When the organ has to be removed for analysis, the thoracic cavity
is pierced and the pressure balance is disturbed, as a result the alveolar tissue collapses and
structural integrity is compromised [12].
For many years histologists have used inflation of the lung as a technique to maintain its
structural integrity during staining and subsequent analysis [13, 14]. This allows for the
maintenance of the lung in a state that more closely resembles its physiological appearance,
while preserving all histological features. Formalin is commonly employed to keep the lungs
inflated, but it is used primarily as a fixative and introduced over time, since the minimum
fixation time is 72 hours it is highly likely that displacement of the drug would occur giving
false spatial information [13]. This process will have adverse effects on the distribution of
molecules especially for MSI analyses since tissues are frozen soon after removal from the
animal in order to prevent post-operative changes. The situation can be circumvented with
the use of a cryoprotective substance as an inflation medium. There are currently many
agents employed for the cryopreservation of tissues (cryoprotectants), which effectively
maintain tissue integrity during cold storage [12, 15-17]. This study serves as an
investigation into the use of various established cryprotectants as inflation media. It will
enable the development of an optimized procedure for the preparation of lung tissues
focusing on small molecule distribution for MSI whilst preserving the structural integrity.
Previous studies employing MSI, have mainly reported on its use in TB infection models and
a single study using DESI-MSI in a healthy animal [4, 9, 18]. However, extra care was not
taken to maintain structural integrity and to preserve tissue histology, this could lead to
62
misleading drug distribution. In order to obtain a true representation of drug distribution in
the lung, a healthy rat model was chosen to evaluate the use of different cryoprotectants in
the absence of physiological interferences. For the purpose of this study, gatifloxacin (GAT)
was chosen as the candidate drug. It is an 8-methoxy fluoroquinolone (Figure SI1) with
activity against a broad spectrum of infectious agents and is commonly used in the treatment
of pulmonary and respiratory infections [19]. In our lab GAT was previously shown to reach
a high maximum concentration (Cmax )in the lung [20].
Materials and Methods
Chemicals and reagents
All chemicals and reagents were purchased from Sigma Aldrich (St Louis, USA) unless
otherwise stated. The GAT standard was purchased from DLD Scientific (Durban, South
Africa). CHCA (α-cyano-hydroxy cinnamic acid) was purchased from Bruker (Bruker,
Germany).
Animal experiments
The use of animals in this study was approved by the University of KwaZulu-Natal’s
institutional Animal Research Ethics Committee (approval number 006/15/2015). Female
Sprague-Dawley rats (n =3 per cryoprotectant) with an average body weight of 120 ± 10 g
were housed in polycarbonate cages in air-conditioned rooms (50-70% humidity and between
21-24oC) with a 12 hr light/dark cycle. The animals were dosed (i.p.), the injection site was
sterilized using alcohol and 0.5 ml of GAT was delivered into the peritoneal cavity of the
animal using a sterile 25 gauge needle. The animals were then euthanized after 15 min, as
previously described [20].
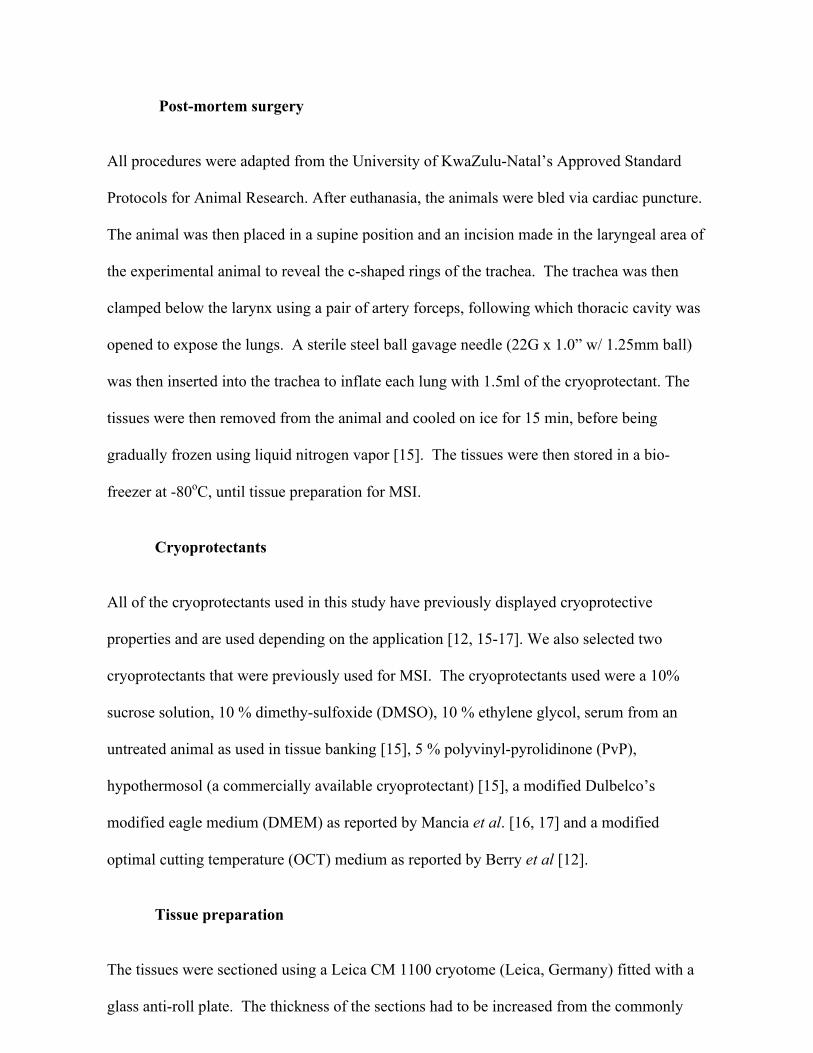
63
Post-mortem surgery
All procedures were adapted from the University of KwaZulu-Natal’s Approved Standard
Protocols for Animal Research. After euthanasia, the animals were bled via cardiac puncture.
The animal was then placed in a supine position and an incision made in the laryngeal area of
the experimental animal to reveal the c-shaped rings of the trachea. The trachea was then
clamped below the larynx using a pair of artery forceps, following which thoracic cavity was
opened to expose the lungs. A sterile steel ball gavage needle (22G x 1.0” w/ 1.25mm ball)
was then inserted into the trachea to inflate each lung with 1.5ml of the cryoprotectant. The
tissues were then removed from the animal and cooled on ice for 15 min, before being
gradually frozen using liquid nitrogen vapor [15]. The tissues were then stored in a bio-
freezer at -80oC, until tissue preparation for MSI.
Cryoprotectants
All of the cryoprotectants used in this study have previously displayed cryoprotective
properties and are used depending on the application [12, 15-17]. We also selected two
cryoprotectants that were previously used for MSI. The cryoprotectants used were a 10%
sucrose solution, 10 % dimethy-sulfoxide (DMSO), 10 % ethylene glycol, serum from an
untreated animal as used in tissue banking [15], 5 % polyvinyl-pyrolidinone (PvP),
hypothermosol (a commercially available cryoprotectant) [15], a modified Dulbelco’s
modified eagle medium (DMEM) as reported by Mancia et al. [16, 17] and a modified
optimal cutting temperature (OCT) medium as reported by Berry et al [12].
Tissue preparation
The tissues were sectioned using a Leica CM 1100 cryotome (Leica, Germany) fitted with a
glass anti-roll plate. The thickness of the sections had to be increased from the commonly
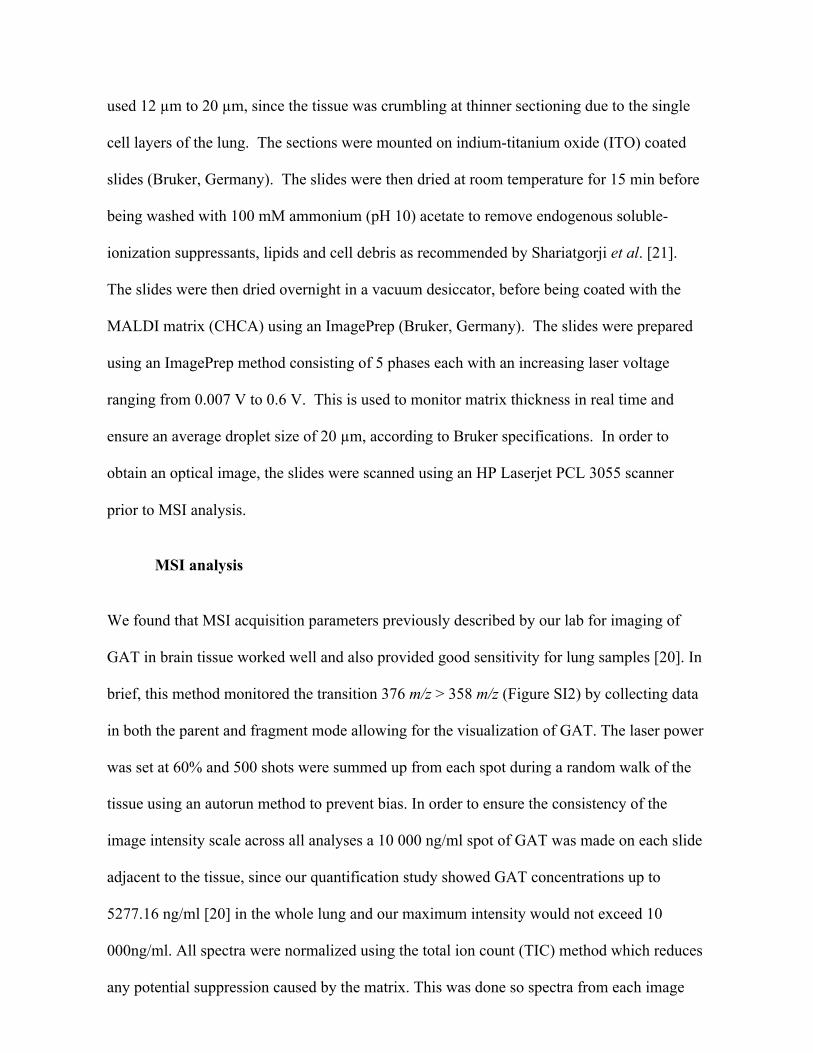
64
used 12 µm to 20 µm, since the tissue was crumbling at thinner sectioning due to the single
cell layers of the lung. The sections were mounted on indium-titanium oxide (ITO) coated
slides (Bruker, Germany). The slides were then dried at room temperature for 15 min before
being washed with 100 mM ammonium (pH 10) acetate to remove endogenous soluble-
ionization suppressants, lipids and cell debris as recommended by Shariatgorji et al. [21].
The slides were then dried overnight in a vacuum desiccator, before being coated with the
MALDI matrix (CHCA) using an ImagePrep (Bruker, Germany). The slides were prepared
using an ImagePrep method consisting of 5 phases each with an increasing laser voltage
ranging from 0.007 V to 0.6 V. This is used to monitor matrix thickness in real time and
ensure an average droplet size of 20 µm, according to Bruker specifications. In order to
obtain an optical image, the slides were scanned using an HP Laserjet PCL 3055 scanner
prior to MSI analysis.
MSI analysis
We found that MSI acquisition parameters previously described by our lab for imaging of
GAT in brain tissue worked well and also provided good sensitivity for lung samples [20]. In
brief, this method monitored the transition 376 m/z > 358 m/z (Figure SI2) by collecting data
in both the parent and fragment mode allowing for the visualization of GAT. The laser power
was set at 60% and 500 shots were summed up from each spot during a random walk of the
tissue using an autorun method to prevent bias. In order to ensure the consistency of the
image intensity scale across all analyses a 10 000 ng/ml spot of GAT was made on each slide
adjacent to the tissue, since our quantification study showed GAT concentrations up to
5277.16 ng/ml [20] in the whole lung and our maximum intensity would not exceed 10
000ng/ml. All spectra were normalized using the total ion count (TIC) method which reduces
any potential suppression caused by the matrix. This was done so spectra from each image

65
acquisition could be projected onto the same intensity scale [22]. The limit of detection for
lung was 500 pg/ml, determined by spotting varying concentrations on untreated tissue
(Figure SI2).
MALDI-TOF Quantification
Quantification was carried out in triplicate on the Bruker Autoflex III 1KHz SmartBeam
system. Briefly, calibration samples were prepared in the cryoprotectant (either DMSO or
DMEM) and standard concentrations of GAT (100 – 1000ng/ml) was spotted on blank
conductive indium titanium oxide (ITO)-coated glass slides. A standard curve was plotted
using linear regression and the transition 376 m/z to 358 m/z, a fragment from the parent GAT
molecule as we have previously described [20]. In order to quantify the amount of GAT in
the lung sections the overall average spectra were generated for each tissue section which
showed good localization and structural preservation, the intensity of our peak of interest was
then used to determine the concentration from the standard curve [9].
Results and Discussion
From the cyroprotectants selected for the study, a few had to be eliminated prior to the MSI
analysis due to various difficulties encountered during the sample preparation steps. The first
problem was with the use of modified OCT as an inflation medium. The highly viscous
nature of OCT made it difficult to inflate the lung utilizing a syringe. This does not rule out
the use of OCT for other cold applications since it has been effectively used as an embedding
medium for cryosectioning and is known to provide good spatial resolution when imaging
proteins and lipids in the lung, but requires an additionally washing step to remove excess
media [12]. The second issue encountered was with sucrose; inflation was easily possible,
however the tissue fractured upon cooling. This phenomenon may be due to the formation of
freezing artifacts, such as the sugar crystals, that destroy cell membranes and compromising
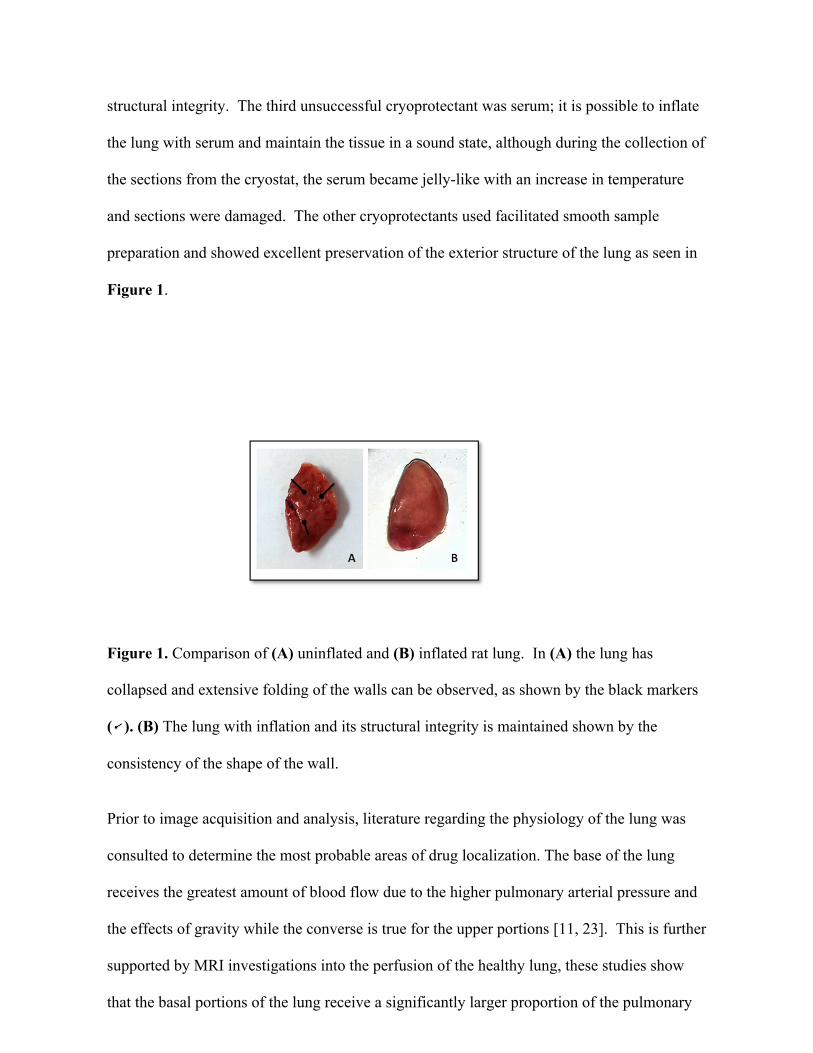
66
structural integrity. The third unsuccessful cryoprotectant was serum; it is possible to inflate
the lung with serum and maintain the tissue in a sound state, although during the collection of
the sections from the cryostat, the serum became jelly-like with an increase in temperature
and sections were damaged. The other cryoprotectants used facilitated smooth sample
preparation and showed excellent preservation of the exterior structure of the lung as seen in
Figure 1.
Figure 1. Comparison of (A) uninflated and (B) inflated rat lung. In (A) the lung has
collapsed and extensive folding of the walls can be observed, as shown by the black markers
( ). (B) The lung with inflation and its structural integrity is maintained shown by the
consistency of the shape of the wall.
Prior to image acquisition and analysis, literature regarding the physiology of the lung was
consulted to determine the most probable areas of drug localization. The base of the lung
receives the greatest amount of blood flow due to the higher pulmonary arterial pressure and
the effects of gravity while the converse is true for the upper portions [11, 23]. This is further
supported by MRI investigations into the perfusion of the healthy lung, these studies show
that the basal portions of the lung receive a significantly larger proportion of the pulmonary
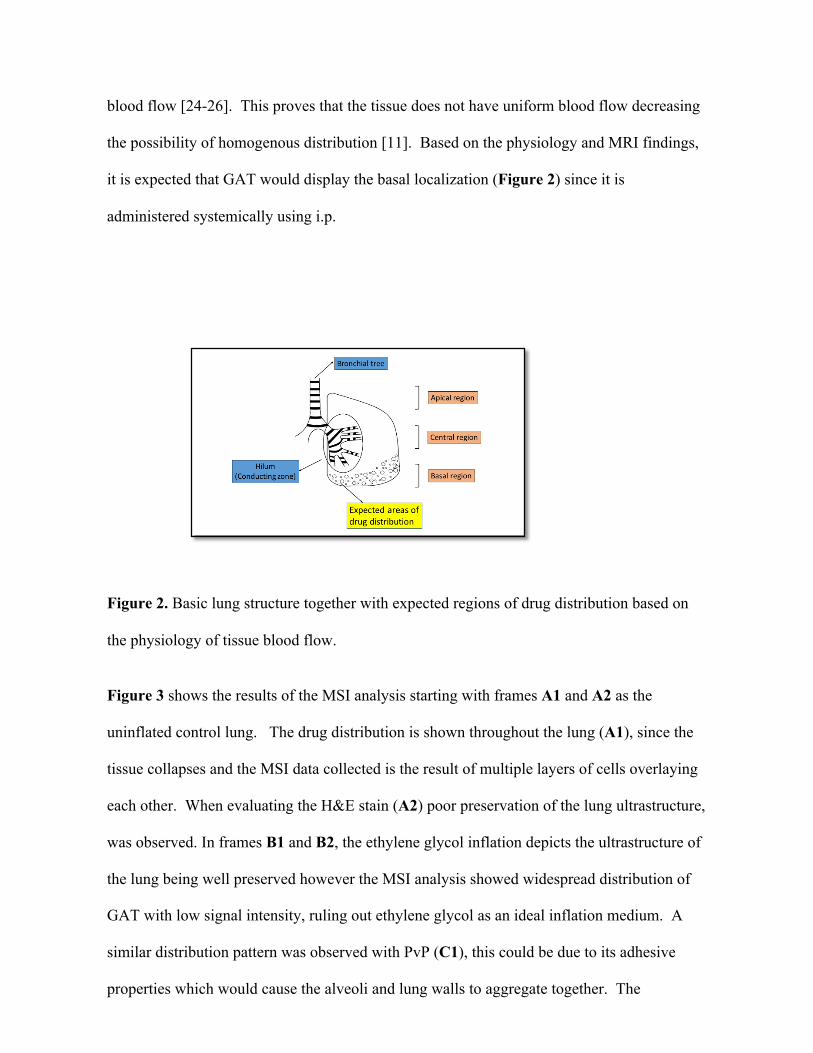
67
blood flow [24-26]. This proves that the tissue does not have uniform blood flow decreasing
the possibility of homogenous distribution [11]. Based on the physiology and MRI findings,
it is expected that GAT would display the basal localization (Figure 2) since it is
administered systemically using i.p.
Figure 2. Basic lung structure together with expected regions of drug distribution based on
the physiology of tissue blood flow.
Figure 3 shows the results of the MSI analysis starting with frames A1 and A2 as the
uninflated control lung. The drug distribution is shown throughout the lung (A1), since the
tissue collapses and the MSI data collected is the result of multiple layers of cells overlaying
each other. When evaluating the H&E stain (A2) poor preservation of the lung ultrastructure,
was observed. In frames B1 and B2, the ethylene glycol inflation depicts the ultrastructure of
the lung being well preserved however the MSI analysis showed widespread distribution of
GAT with low signal intensity, ruling out ethylene glycol as an ideal inflation medium. A
similar distribution pattern was observed with PvP (C1), this could be due to its adhesive
properties which would cause the alveoli and lung walls to aggregate together. The
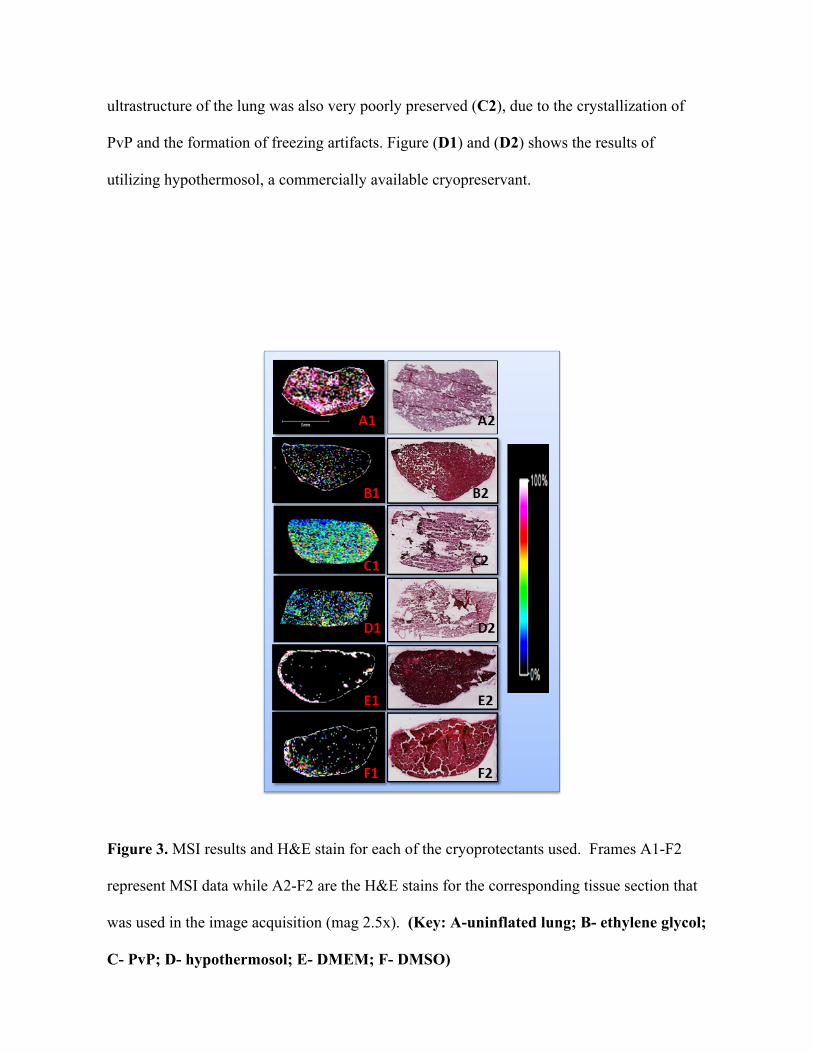
68
ultrastructure of the lung was also very poorly preserved (C2), due to the crystallization of
PvP and the formation of freezing artifacts. Figure (D1) and (D2) shows the results of
utilizing hypothermosol, a commercially available cryopreservant.
Figure 3. MSI results and H&E stain for each of the cryoprotectants used. Frames A1-F2
represent MSI data while A2-F2 are the H&E stains for the corresponding tissue section that
was used in the image acquisition (mag 2.5x). (Key: A-uninflated lung; B- ethylene glycol;
C- PvP; D- hypothermosol; E- DMEM; F- DMSO)
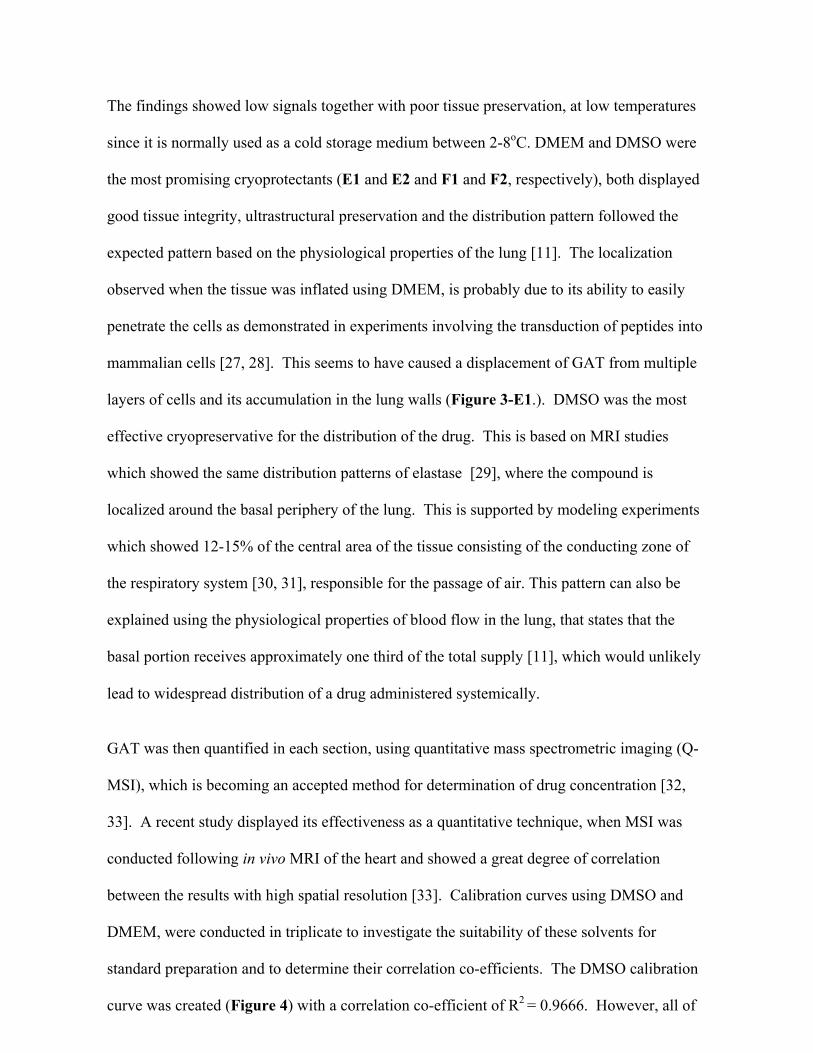
69
The findings showed low signals together with poor tissue preservation, at low temperatures
since it is normally used as a cold storage medium between 2-8oC. DMEM and DMSO were
the most promising cryoprotectants (E1 and E2 and F1 and F2, respectively), both displayed
good tissue integrity, ultrastructural preservation and the distribution pattern followed the
expected pattern based on the physiological properties of the lung [11]. The localization
observed when the tissue was inflated using DMEM, is probably due to its ability to easily
penetrate the cells as demonstrated in experiments involving the transduction of peptides into
mammalian cells [27, 28]. This seems to have caused a displacement of GAT from multiple
layers of cells and its accumulation in the lung walls (Figure 3-E1.). DMSO was the most
effective cryopreservative for the distribution of the drug. This is based on MRI studies
which showed the same distribution patterns of elastase [29], where the compound is
localized around the basal periphery of the lung. This is supported by modeling experiments
which showed 12-15% of the central area of the tissue consisting of the conducting zone of
the respiratory system [30, 31], responsible for the passage of air. This pattern can also be
explained using the physiological properties of blood flow in the lung, that states that the
basal portion receives approximately one third of the total supply [11], which would unlikely
lead to widespread distribution of a drug administered systemically.
GAT was then quantified in each section, using quantitative mass spectrometric imaging (Q-
MSI), which is becoming an accepted method for determination of drug concentration [32,
33]. A recent study displayed its effectiveness as a quantitative technique, when MSI was
conducted following in vivo MRI of the heart and showed a great degree of correlation
between the results with high spatial resolution [33]. Calibration curves using DMSO and
DMEM, were conducted in triplicate to investigate the suitability of these solvents for
standard preparation and to determine their correlation co-efficients. The DMSO calibration
curve was created (Figure 4) with a correlation co-efficient of R2 = 0.9666. However, all of
70
the attempts to create a standard curve using DMEM, showed complete suppression of the
GAT signal. This is a combination of the interaction of the drug with the mediums’ complex
mixture of components (ranging from amino acids, to vitamins and other supplements) and
GAT’s amphoteric nature [34]. Using the DMSO calibration curve, the mean drug
concentration in the DMEM inflated lung was 3357.87 ± 402.47ng/ml (Figure 5) whereas in
our previous study it was 5277.16 ng/ml, in whole lung homogenate. This provides further
evidence that DMEM causes the displacement of the drug from several layers of cells and
leads to its deposition in the lung walls, accounting for the distribution pattern. The GAT
concentration in the uninflated (214.87 ± 57.89ng/ml) vs. the DMSO (348.28 ± 22.01ng/ml)
inflation are very similar showing that no displacement of the drug occurs. DMEM may still
have applications for the MSI of endogenous proteins and lipids in lung tissue when used as
a perfusion agent as previously demonstrated [16, 17].
Figure 4. Calibration curve. Plot of GAT concentrations (100 – 1000ng/ml in DMSO), on an
ITO coated slide, with images of each spot shown adjacent to the graph.

71
Figure 5. The concentration of GAT on each slide was determined using linear regression,
the sections inflated with ethylene glycol and hypothermosol could not be quantified.
(Sections were quantified in triplicate, n=3)
The results reveal that the optimum cryoprotectant for the inflation of rat lung, for the
purpose of small drug MSI may be DMSO (Figure 3 - F1 and F2); with good tissue
preservation and structural integrity. The most important point in the favor of DMSO was
that the distribution patterns observed closely resemble MRI studies showing the distribution
of elastase in the lung [29]. This argument was also supported by the physiological
properties of the respiratory system. This study does not discount the cryprotective properties
of the other agents used in this study, as they may be suitable for other applications.
72
Conclusion
This study demonstrated that DMSO is a suitable cryoprotectant as an inflation medium for
biomedical MSI of the lung. It preserves the structural integrity and enables good spatial
resolution of small drug molecules using MSI analysis. Since the distribution pattern
observed with GAT is similar to that of elastase, we can also conclude that drug distribution
in the lung is not bias based on particle size. The advantage of this technique is that current
methods have low spatial resolution, in the order of millimetres while with MSI this is
increased to micrometres. Moreover, this paper provides an alternative method for the
preparation of lung tissues to produce images similar to those acquired using MRI. This study
provides scientists with an optimized procedure for the preparation of lung tissue, while
taking into account its structural characteristics.
Funding
The authors would like to thank the National Research Foundation, SA; Aspenpharmacare,
SA; and the University of KwaZulu-Natal, Durban, SA for having funded this project.
Conflict of interest
The authors declare no conflict of interest.
73
References 1. Hirsch, F.R., et al., Histopathologic classification of small cell lung cancer changing
concepts and terminology. Cancer, 1988. 62(5): p. 973-977. 2. Addie, R.D., et al., Current State and Future Challenges of Mass Spectrometry Imaging
for Clinical Research. Analytical chemistry, 2015. 3. Liu, X., et al., Molecular imaging of drug transit through the blood-brain barrier with
MALDI mass spectrometry imaging. Scientific reports, 2013. 3. 4. Prideaux, B., et al., High-sensitivity MALDI-MRM-MS imaging of moxifloxacin
distribution in tuberculosis-infected rabbit lungs and granulomatous lesions. Analytical chemistry, 2011. 83(6): p. 2112-2118.
5. Baijnath, S., et al., Evidence for the presence of clofazimine and its distribution in the healthy mouse brain. Journal of molecular histology, 2015. 46(4-5): p. 439-442.
6. Shobo, A., et al., Tissue distribution of pretomanid in rat brain via mass spectrometry imaging. Xenobiotica, 2015: p. 1-6.
7. Munyeza, C.F., et al., Rapid and widespread distribution of doxycycline in rat brain: a mass spectrometric imaging study. Xenobiotica, 2015: p. 1-8.
8. Tomlinson, L., et al., Using a single, high mass resolution mass spectrometry platform to investigate ion suppression effects observed during tissue imaging. Rapid Communications in Mass Spectrometry, 2014. 28(9): p. 995-1003.
9. Wiseman, J.M., et al., Desorption electrospray ionization mass spectrometry: Imaging drugs and metabolites in tissues. Proceedings of the National Academy of Sciences, 2008. 105(47): p. 18120-18125.
10. Desbenoit, N., et al., Localized lipidomics in cystic fibrosis: TOF-SIMS imaging of lungs from Pseudomonas aeruginosa-infected mice. The international journal of biochemistry & cell biology, 2014. 52: p. 77-82.
11. Nunn, J.F., Applied respiratory physiology. 2013: Butterworth-Heinemann. 12. Berry, K.A.Z., et al., MALDI imaging MS of phospholipids in the mouse lung. Journal
of lipid research, 2011. 52(8): p. 1551-1560. 13. Buckingham, K.W. and W.E. Wyder, Rapid tracheal infusion method for routine lung
fixation using rat and guinea pig. Toxicologic Pathology, 1981. 9(1): p. 17-20. 14. Braber, S., et al., A comparison of fixation methods on lung morphology in a murine
model of emphysema. American Journal of Physiology-Lung Cellular and Molecular Physiology, 2010. 299(6): p. L843-L851.
15. Brockbank, K.G. and M.J. Taylor, 8 Tissue Preservation. Advances in biopreservation, 2006: p. 157.
16. Baatz, J.E., et al., Cryopreservation of Viable Human Lung Tissue for Versatile Post-thaw Analyses and Culture. in vivo, 2014. 28(4): p. 411-423.
17. Mancia, A., et al., Cryopreservation and in vitro culture of primary cell types from lung tissue of a stranded pygmy sperm whale (Kogia breviceps). Comparative Biochemistry and Physiology Part C: Toxicology & Pharmacology, 2012. 155(1): p. 136-142.
18. Prideaux, B., et al., The association between sterilizing activity and drug distribution into tuberculosis lesions. Nature medicine, 2015. 21(10): p. 1223-1227.
19. Brittain, H.G., Profiles of drug substances, excipients and related methodology: critical compilation of pKa values for pharmaceutical substances. Vol. 33. 2007: Academic Press.
20. Shobo, A., et al., MALDI MSI and LC-MS/MS: Towards preclinical determination of the neurotoxic potential of fluoroquinolones. Drug testing and analysis, 2015.

74
21. Shariatgorji, M., et al., Controlled-pH tissue cleanup protocol for signal enhancement of small molecule drugs analyzed by MALDI-MS imaging. Analytical chemistry, 2012. 84(10): p. 4603-4607.
22. Deininger, S.-O., et al., Normalization in MALDI-TOF imaging datasets of proteins: practical considerations. Analytical and bioanalytical chemistry, 2011. 401(1): p. 167-181.
23. Costanzo, L.S., Physiology, Philadelphia, Saunders. 2003, Elsevier. 24. Nikolaou, K., et al., Quantification of pulmonary blood flow and volume in healthy
volunteers by dynamic contrast-enhanced magnetic resonance imaging using a parallel imaging technique. Investigative radiology, 2004. 39(9): p. 537-545.
25. Ohno, Y., et al., Quantitative assessment of regional pulmonary perfusion in the entire lung using three-dimensional ultrafast dynamic contrast-enhanced magnetic resonance imaging: Preliminary experience in 40 subjects. Journal of Magnetic Resonance Imaging, 2004. 20(3): p. 353-365.
26. Stock, K.W., et al., Demonstration of gravity-dependent lung perfusion with contrast-enhanced magnetic resonance imaging. Journal of Magnetic Resonance Imaging, 1999. 9(4): p. 557-561.
27. Mäe, M. and Ü. Langel, Cell-penetrating peptides as vectors for peptide, protein and oligonucleotide delivery. Current opinion in pharmacology, 2006. 6(5): p. 509-514.
28. Järver, P. and Ü. Langel, The use of cell-penetrating peptides as a tool for gene regulation. Drug discovery today, 2004. 9(9): p. 395-402.
29. Oakes, J.M., et al., MRI-based measurements of aerosol deposition in the lung of healthy and elastase-treated rats. Journal of Applied Physiology, 2014. 116(12): p. 1561-1568.
30. Oakes, J.M., et al., Airflow and particle deposition simulations in health and emphysema: From in vivo to in silico animal experiments. Annals of biomedical engineering, 2014. 42(4): p. 899-914.
31. Oakes, J.M., et al., Regional distribution of aerosol deposition in rat lungs using magnetic resonance imaging. Annals of biomedical engineering, 2013. 41(5): p. 967-978.
32. Porta, T., et al., Quantification in MALDI-MS imaging: what can we learn from MALDI-selected reaction monitoring and what can we expect for imaging? Analytical and bioanalytical chemistry, 2015. 407(8): p. 2177-2187.
33. Aichler, M., et al., Spatially Resolved Quantification of Gadolinium (III)-Based Magnetic Resonance Agents in Tissue by MALDI Imaging Mass Spectrometry after In Vivo MRI. Angewandte Chemie, 2015. 127(14): p. 4353-4357.
34. Dulbecco, R. and G. Freeman, Plaque production by the polyoma virus. Virology, 1959. 8(3): p. 396-397.
75
Chapter 5 – Paper 4
Visualization of time dependent distribution of rifampicin in rat brain using MALDI MSI and quantitative LCMS/MS
Adeola Shoboa, Dominika Bratkowskaa, Sooraj Baijnatha, Suhashni Naikera, Linda A.
Besterb, Sanil D. Singhb, Glenn E. M. Maguirec, Hendrik G. Krugera, Thavendran
Govendera*
a Catalysis and Peptide Research Unit, University of KwaZulu-Natal, Westville Campus,
Durban 4000, South Africa.
*e-mail: [email protected]
b Biomedical Resource Unit, University of KwaZulu-Natal, Westville Campus, Durban
4000, South Africa.
c School of Chemistry and Physics, University of KwaZulu-Natal, Westville Campus,
Durban 4000, South Africa.
76
Abstract
Rifampicin (RIF) is a major component for short course chemotherapy against tuberculosis,
since it is active against rapidly metabolizing as well as dormant bacteria. According to
the Lipinski rules, rifampicin should not enter the blood brain barrier. Visualization of
tissue drug distribution is of major importance in pharmacological studies; thus far imaging
of RIF in the brain has been limited to positron emission tomography (PET). We propose
using matrix-assisted laser desorption ionization-mass spectrometry imaging techniques as
a suitable alternative for the visualization and localization of drug tissue distribution. Using
liquid chromatography mass spectrometric (LCMS) technique we were able to quantify the
concentrations of RIF in the uninfected rat brain, we paired this with MALDI MSI to show
the time dependent manner in which RIF is able to enter the brain. Our results show that
even at the minute concentrations measured with LCMS/MS we were able visualize the
drug and show its exact distribution in the rat brain. Other available methods require
nuclear labeling and the detection of gamma rays produced by labeled compounds in order
to visualize the compound and its localization, MALDI MSI is a more recently developed
technique, which can provide detailed information on drug distribution in tissues when
compared to other imaging techniques. This study shows that without any requirement for
complex pre-processing we are able to produce images with a relatively improved
resolution and localization than those acquired using more complex imaging methods,
showing MALDI MSI to be an invaluable tool in drug distribution studies.
77
Introduction
Short course chemotherapy (SCC) is currently the only effective treatment available for
pulmonary tuberculosis (TB) as well as extra pulmonary forms such as TB meningitis.
Tuberculosis meningitis (TBM) occurs more frequently in HIV-infected children [1] than
adults; and lower CD4+ counts are associated with severe infection and poor outcomes [2,
3]. Rifampicin (RIF) is the most important drug in SCC as it is the only anti-TB drug
capable of effectively killing rapidly metabolizing as well as dormant bacteria [4]. It
inhibits RNA polymerase of the bacteria which is the enzyme responsible for DNA
transcription by forming a stable drug-enzyme complex at 37oC with a binding constant of
10-9 M [5]. However, oral administration of RIF leads to low bioavailability due to the
high first pass effect and auto induction [6]. In vitro studies have even shown that orally
administered RIF does not effectively reach tuberculosis granulomas in lung alveoli [7].
RIF is a drug that one would typically not expect to enter the brain due to its size. Drugs
that are able to diffuse through the blood brain barrier are normally < 400 Da and have less
than 8 hydrogen bonds [8]. RIF is still able to penetrate the blood brain barrier, although
it only obeys one of the conditions for Lipinski’s rule of five due to its lipophilicity [9].
Several studies have shown the presence of RIF in the brain with five reporting on the
quantification by measurements of this drug in cerebrospinal fluid (CSF) [10-14]. After
oral dosing, concentrations of RIF in the CSF, determined by fluorometric and
microbiologic procedures, were reported to be only slightly above its minimum inhibitory
concentration (MIC) for Mycobacterium tuberculosis [14]. In contrast to oral dosing,
human studies on intravenous administration of standard doses of RIF reported a more
favorable penetration into CSF and cerebral extracellular space [11, 13]. But CSF
determination of drug concentration is not an accurate measure of the amount of the
compound that actually enters the brain, as CSF is only a fluid produced by the choroid
plexus and not an anatomical feature of the brain [15]. It is therefore necessary to study
the amount of drug directly in the brain as a true measure of its neuroprotective potential.
Mindermann et al., reported the first direct measurement of rifampicin concentrations in
various compartments of the human brain and this was achieved via a microdialysis probe
inserted into the cortex and found that concentrations of this drug in a brain tumor is not a
true reflection of its concentration in a normal brain [16, 17]. Qosa et al. recently reported
the first quantification of RIF directly from rat brain homogenate while investigating the
78
clearance of amyloid-β and they found that RIF crossed the blood brain barrier and had a
protective effect against Alzheimer’s disease. The concentration of RIF was comparable
to patients receiving therapeutic doses [18].
Visualizing the exact localization of drugs in tissue is an essential tool in drug distribution
studies, as this will allow researchers to investigate whether or not the drug reaches its
desired site of action and be a determining factor in its neuroprotective efficacy. This is
especially important for drugs such as RIF since it has a high degree of plasma protein
binding (approximately 80%), leaving only about 20% to diffuse into CSF [19]. The most
common methods for tissue distribution employs radio-labeled drugs for imaging via
positron emission tomography (PET), magnetic resonance imaging (MRI) and X-ray
computerized tomography (CT) [20]. Liu et al. reported the use of positron emission
tomography (PET) quantified radio labeled RIF in the brain; this study which compared
the permeability of the three frontline TB chemotherapeutics concluded that they entered
through the blood brain barrier of baboons with RIF showing the least penetration [21].
The study concluded that the predicted concentration of RIF in the infected baboons was
3-4 times above the MTB minimum inhibitory concentration, which confirms the
suitability of the drug for treating CNS TB infections. MALDI MSI is an attractive research
tool which serves as an alternative to the use of radio-labeled compounds that are less
widely available [22]. This method can precisely depict the anatomical distribution of a
compound with a lateral resolution of a few tens of microns and is currently used for the
development of drugs to treat CNS conditions such as Parkinson’s [23].
This present study is aimed to investigate the penetration and distribution of RIF in the
brain of healthy rats using MALDI MSI upon intraperitoneal application of the drug.
Materials and methods
Animals
All animal experiments were undertaken with the approval of the Institutional Animal
Ethical Committee of University of KwaZulu-Natal (UKZN), Durban, with the ethics
number 067/14/Animal. Healthy male Sprague dawley rats with average weight of 95 ±
10 g were obtained from the Biomedical Resource Unit (BRU), University of KwaZulu-
Natal, Durban, South Africa. Animals were housed at the BRU in polycarbonate cages in
air-conditioned rooms (50-70% humidity and between 21-24oC) with a 12 hr light/dark
79
cycle. Animals were allowed ad libitum access to drinking water and standard rat chow.
Drug Administration and tissue sampling
Animals (95 ± 10 g) were dosed with RIF (Sigma Aldrich, South Africa) of 10 mg/kg
respectively, prepared in 10% DMSO and 90% ultrapure water, this dose was calculated
based on the average body weight. RIF was administered intraperitoneally (i.p.) to 6 groups
of animals (n=3). Animals were anaesthetized with halothane before blood was collected
by cardiac puncture at 0, 20, 40, 60, 120, and 240 min post RIF administration in
heparinized tubes. Blood samples were immediately centrifuged at 12,000 × g for 10 min
and aliquots of plasma (1.5 ml) and immediately stored at -80oC prior to analysis.
Dissection and storage
The rats were euthanized with halothane and termination was confirmed by the absence of
breathing and dissection was performed immediately. The lungs and brain were surgically
removed and snap frozen in liquid nitrogen vapor before storage at -80oC.
Sample preparation for MALDI-MSI
Serial sections (10 µm thick) were sectioned from each biopsy and freeze thaw mounted
onto an indium titanium oxide (ITO) coated glass slide (Bruker, Bremen, Germany) with a
cryostat (Leica Microsystems CM1100, Wetzlar, Germany) using optimum cutting
temperature (OCT) embedding medium and kept at −80 °C till needed for analysis. Glass
slides were removed from deep freeze and immediately transferred to a desiccator.
Following 30 min desiccation time, the slides were scanned using a flatbed scanner (HP
LaserJet 3055). Matrix preparation was done by preparing 7 mg/ ml α-cyano-4-hydroxy
cinnamic acid (CHCA) (Bruker, Bremen, Germany) matrix solution in 50% acetonitrile
(ACN) containing 0.2% trifluoroacetic acid (TFA). The matrix solution was sonicated for
5 min and centrifuged at 9390 x g for 10 min before transferred to the ImagePrep (Bruker
Daltonics). This is a spraying device that automatically deposits matrix solution onto the
tissue in a consistent manner. In short, aerosol is generated by vibrating spay generator
producing tiny droplets (average droplet size of ≈20 µm) under controlled conditions.
80
MALDI-MSI Analysis
Standard solutions of RIF were analyzed using MALDI TOF MS operated both at
reflectron and LIFT modes respectively with the aid of the Autoflex III MALDI TOF/TOF
1 KHz smartbeam laser (Bruker Daltonics, Germany) and FlexControl acquisition software
ran in positive ion mode. The instrument was calibrated using standard peptides
bradykinin, angiotensin II, angiotensin I and substance P spotted with CHCA matrix on the
ground steel target (Bruker Daltonics, Germany) for m/z 700–1400. Each spectrum was
acquired from 200 laser shots. Tissue sections were imaged with spatial resolution from
25–100 µm. The MALDI images were displayed using the software FlexImaging 3.0
(Bruker Daltonics, Germany). Spotting different concentrations (0.5, 1, 5, 10,100 and 500
ng/mL respectively) of RIF with the matrix onto a brain section of an untreated animal was
used to evaluate background signals interfering with the analyte. The chosen matrix
(CHCA) would not promote the detection of lipids [24]. The drug was mixed (1:2) with
matrix solution and the different concentrations of RIF spotted on the tissue in a total
volume of 3 µL. The spots were analyzed in reflectron mode by collecting 200 shots per
spot. The MS/MS experiments were performed using a LIFT method optimized for the
drug by specific tuning of the timing of the LIFT cell and of the precursor ion selector. The
LIFT method was calibrated with peptide calibration standards as mentioned above. The
same method was used to perform MS/MS directly on RIF-matrix spotted tissue section
and spectra were compared to the MS/MS spectra generated from of the drug standard only.
For the initial analysis of the manually deposited spots, spectra consisting of 1000 laser
shots were acquired in bundles of 5 x 200 shots and data was collected in the range between
m/z 700–1000. A product ion scan of the sodium adduct precursor ions (m/z 845) revealed
a clear fragmentation pattern with the transition m/z 845 → 791dominating the spectra with
a laser power of 60%. This transition represents the loss of CH3OH and sodium ion
respectively. An increase in the laser power led to production of other product ions but
with less sensitivity. The software Flex Imaging 3.0 was used to set up the acquisition of
the imaging experiments. The imaging MS/MS experiments were performed by collecting
spectra with a raster width of 200 µm in the same m/z range as above. The spectra were
baseline subtracted (Convex hull) and smoothed (Savitzski golay) in the processing
software during acquisition. In LIFT mode, all spectra were normalized against total ion
count (TIC) to reduce potential suppression by i.e. matrix hot spots. We define the total
ion current as the sum of all intensities in the mass range analyzed. For this analysis, both
fragment and parent spectra were acquired from each spot and 500 laser shots were summed
81
up in a random walk pattern from each position. The RIF parent ion of m/z 845 served as
a qualifier ion while m/z 791, a major fragment of RIF was used to visualize the brain
sections in triplicate and m/z 773 further confirmed the fragment to be due to loss of water
from the fragment.
Quantification in biological samples
The methods used for the extraction and detection of RIF followed those of Srivastava et
al. (2012) with minor modifications [25]. Drug free tissues stored at -80oC to be used as
matrix for calibration was homogenized in water at ratio of 3 mL of water for every 1g of
tissue by using a manual tissue homogenizer. Tissue concentrations of RIF were measured
using LCMS/MS after protein precipitation with a 100% methanol ratio of 9:1 for plasma
and lung while a ratio of 2:1 for brain tissue. This was followed by refrigeration for 10 min
and centrifugation at 15870 x g for 15 min, supernatants were filtered through Supelco
hybrid solid phase extraction 30 mg phospholipid cartridges. Matrices were spiked with
standard drug concentrations to obtain quality control samples and calibration curve for
quantification. Recovery of the analyte and the internal standard were determined on the
quality control samples of the 3 matrices.
The samples were separated using an Ultimate 3000 LC system (Dionex, Sunnyvale, CA,
USA) coupled to an amaZon speed ion trap (IT) equipped with ESI ion source from Bruker
Daltonics (Bremen, Germany). The IT-MS was operated in the ultrascan mode. The HPLC
system was a Dionex Ultimate 3000, consisting of a binary pump, connected to an
autosampler equipped with a 20 µL injection loop and the temperature of the column was
maintained at 25 °C. The flow rate was 0.4 mL min-1. The analytical column was a 150
mm × 3.0 mm (internal diameter) stainless-steel column YMC Triart C18, 3 µm from YMC
Europe Gmbh (Dislanken, Germany). The mobile phases were Milli-Q water (0.1%
v/v formic acid) and ACN (0.1% v/v formic acid). The gradient profile was initially from
35% to 65% ACN in 7 min, then in next 3 min increased to 90% ACN (held 2 min), after
which time the mobile phase was returned to the initial conditions (35% ACN) in 3 min.
The MS was operated in the ESI positive mode and auto MSn spectra collection was
applied. The MS settings were as follows: capillary outlet 4500 V, end plate voltage 500
V. Nebulizer was set to 1.5 bar and desolvation gas temperature was 210°C at a flow-rate
of 8 L/min. Positive ion mode MS spectra were obtained within a mass range of m/z 100-
1200. Smart parameter setting (SPS) was set to m/z 823.5. The ion charge control (ICC)
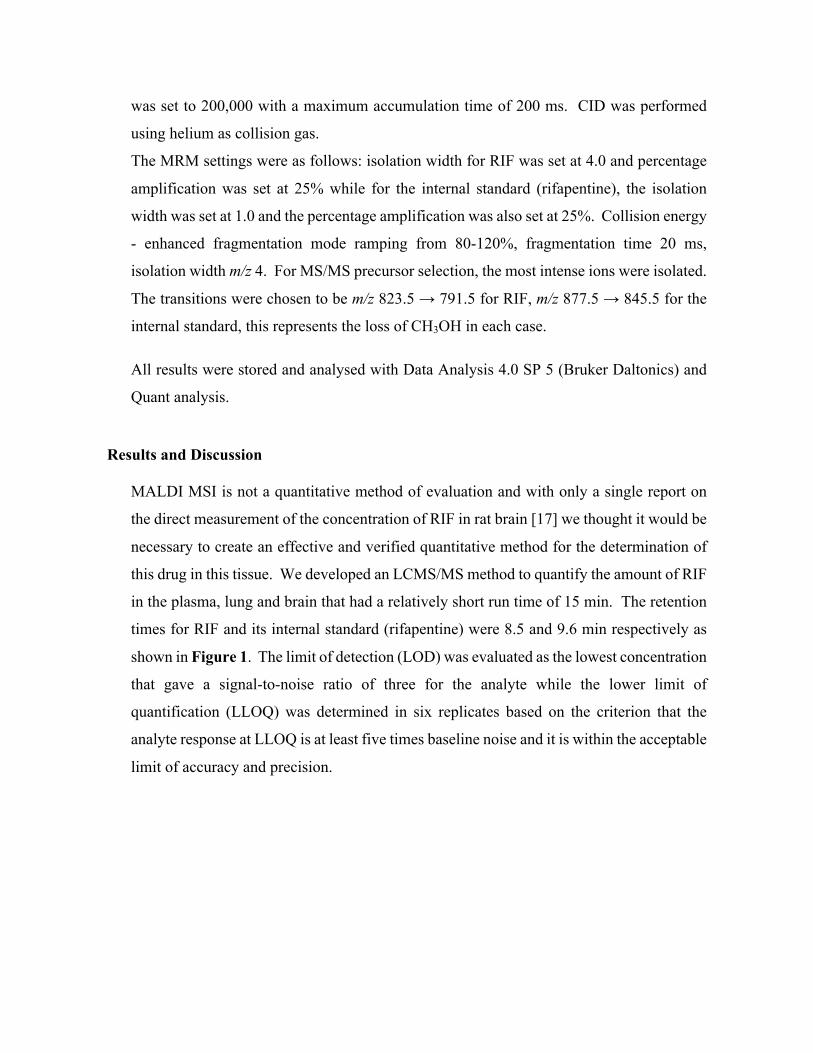
82
was set to 200,000 with a maximum accumulation time of 200 ms. CID was performed
using helium as collision gas.
The MRM settings were as follows: isolation width for RIF was set at 4.0 and percentage
amplification was set at 25% while for the internal standard (rifapentine), the isolation
width was set at 1.0 and the percentage amplification was also set at 25%. Collision energy
- enhanced fragmentation mode ramping from 80-120%, fragmentation time 20 ms,
isolation width m/z 4. For MS/MS precursor selection, the most intense ions were isolated.
The transitions were chosen to be m/z 823.5 → 791.5 for RIF, m/z 877.5 → 845.5 for the
internal standard, this represents the loss of CH3OH in each case.
All results were stored and analysed with Data Analysis 4.0 SP 5 (Bruker Daltonics) and
Quant analysis.
Results and Discussion
MALDI MSI is not a quantitative method of evaluation and with only a single report on
the direct measurement of the concentration of RIF in rat brain [17] we thought it would be
necessary to create an effective and verified quantitative method for the determination of
this drug in this tissue. We developed an LCMS/MS method to quantify the amount of RIF
in the plasma, lung and brain that had a relatively short run time of 15 min. The retention
times for RIF and its internal standard (rifapentine) were 8.5 and 9.6 min respectively as
shown in Figure 1. The limit of detection (LOD) was evaluated as the lowest concentration
that gave a signal-to-noise ratio of three for the analyte while the lower limit of
quantification (LLOQ) was determined in six replicates based on the criterion that the
analyte response at LLOQ is at least five times baseline noise and it is within the acceptable
limit of accuracy and precision.
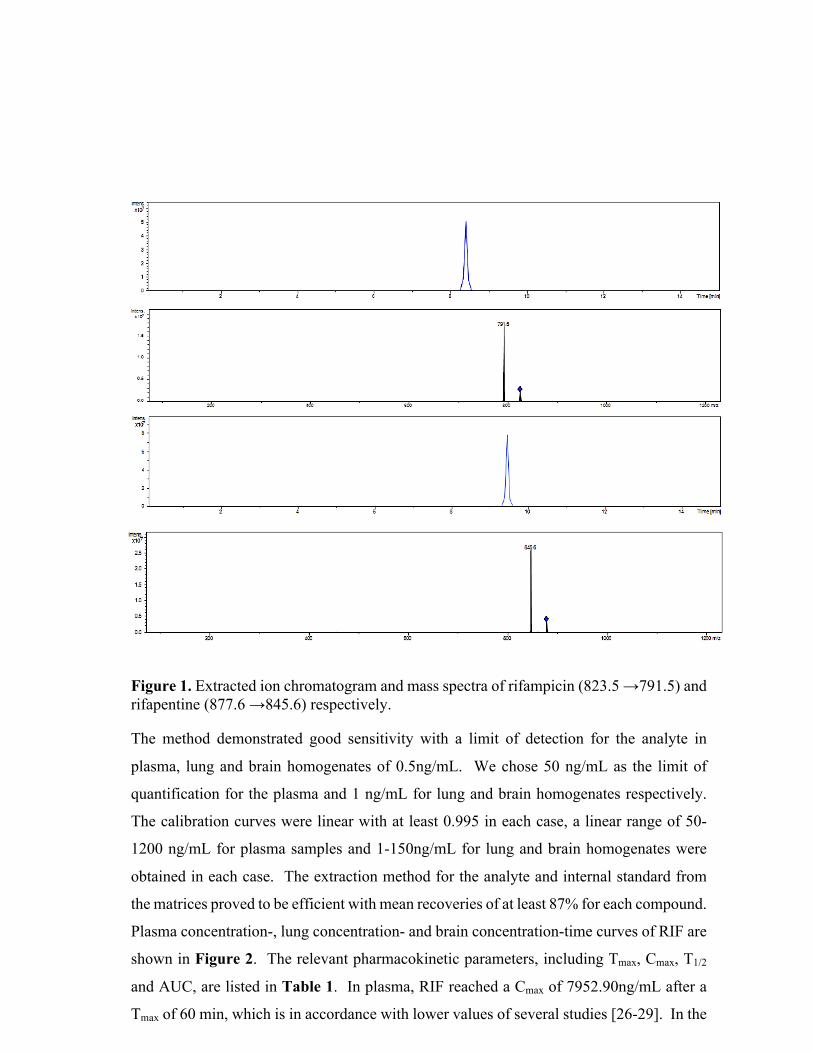
83
Figure 1. Extracted ion chromatogram and mass spectra of rifampicin (823.5 →791.5) and rifapentine (877.6 →845.6) respectively.
The method demonstrated good sensitivity with a limit of detection for the analyte in
plasma, lung and brain homogenates of 0.5ng/mL. We chose 50 ng/mL as the limit of
quantification for the plasma and 1 ng/mL for lung and brain homogenates respectively.
The calibration curves were linear with at least 0.995 in each case, a linear range of 50-
1200 ng/mL for plasma samples and 1-150ng/mL for lung and brain homogenates were
obtained in each case. The extraction method for the analyte and internal standard from
the matrices proved to be efficient with mean recoveries of at least 87% for each compound.
Plasma concentration-, lung concentration- and brain concentration-time curves of RIF are
shown in Figure 2. The relevant pharmacokinetic parameters, including Tmax, Cmax, T1/2
and AUC, are listed in Table 1. In plasma, RIF reached a Cmax of 7952.90ng/mL after a
Tmax of 60 min, which is in accordance with lower values of several studies [26-29]. In the
84
lung, the Cmax was 3110.38ng/mL with a similar Tmax of 60 min. Curves for both the plasma
and lung concentrations showed similar trends, where there were steady initial increases in
drug concentrations followed by a gradual decrease until trough concentrations were
reached at 240 min. Compared to the lung and brain concentrations, the plasma had greater
amounts of RIF with AUC’s that were significantly higher.
Figure 2. The concentration-time curve for plasma, lung and brain respectively, after a 10 mg/kg intraperitoneal dose of RIF. This represents the data obtained from plasma, lung and brain homogenates of a single animal used for the study. Data acquired with LC/MS.
The observed results for plasma concentrations of RIF are in agreement with that of data
reported [18, 30]. The AUC and the Cmax values in the lung homogenates was about half
of that in the plasma. The Tmax (120 min) observed in the brain homogenate was twice that
observed in both the plasma and lung matrices respectively. Poor brain permeability was
also observed for RIF after its intraperitoneal administration of 20mg/kg to healthy mice
which was twice the dose administered in our research but yet with relatively close plasma
and brain concentrations [18].

85
Table 1: Quantitative analysis (LCMS/MS) of RIF in plasma, lung and brain
homogenates.
Parameters
Plasma (ng/mL)
Lung (ng/mL)
Brain (ng/mL)
20 mins
5926.90 ± 0.61 1701.00 ± 2.12 11.27 ± 0.40
40 mins
6665.80 ± 0.98 2969.89 ± 9.51 60.49 ± 1.14
60 mins
7952.90 ± 7.80 3110.38 ± 9.66 73.52 ± 1.21
120 mins
4925.50 ± 5.21 2293.06 ± 5.56 89.27 ± 0.91
240 mins
2413.10 ± 0.64 900.97 ± 1.18 30.24 ± 0.6
Tmax (min)
60 60 120
Cmax (ng/mL)
7952.90 ± 7.80 3110.38 ± 9.66 89.27 ± 0.91
AUC 0-4 (ng x min/mL)
1,158,042 748,269.6
14,224.70
T½ (min) 165 172
208
Presented data originates from one animal only and n=3 corresponds to three injections to the HPLC, values are expressed as mean ± S.D.
This result is not strange as it has been earlier reported [17] that only about 0.3-1% of the
RIF plasma concentration penetrates into the brain. The lower availability of RIF in the
brain is also associated with the rapid penetration of this drug into other tissues as observed
in the mean lung concentrations in our study. It readily diffuses into most organs, tissues,
bones and body fluids, including exudates into TB infected lung cavities [31]. About 20%
of serum concentration has been observed in the saliva and other high concentration
therapeutic concentrations appeared in the lachrymal glands, tears and urine [32]. The
lateral ventricles houses the choroid plexus, which is responsible for producing the CSF
found in the brain. In our study, we have found that the lateral ventricles to be devoid of
RIF (Figure 3), thus implying that RIF may not be entering or leaving the brain via the
CSF; this has not been previously demonstrated.

86
Figure 3. Quantitative analysis of brain tissue homogenates together with the images of the MSI. The tissue sections represent different time points, as well as axial (a) and coronal (b) sections shown at 100 µm resolution. Using the images at 40 min as an example we have shown the cortex (indicated by the red arrow) and the lateral ventricles (indicated by the red oval) in the axial section. In the coronal section the cortex is also shown (indicated by the red arrow). The results show the time-dependent penetration of RIF into brain tissue, as shown in the shape of the curve but also as demonstrated by the steady development of the bright pink to white color in the tissue sections representing the presence of the drug as visualized by m/z 791 ± 0.01.
There is approximately 40 µL of CSF in the rat brain and the entire volume is turned over
every 2 hours [26], this could produce a wash out effect and be responsible for the high
concentrations of RIF observed at the brain stem. A previous report that demonstrated the
use of PET imaging on baboon brain [21], which observed the penetration of RIF through
the blood brain barrier of diseased and healthy animals, however they did not comment of
the availability of RIF in the brain CSF. The axial and coronal views (Figure 3), supports
this theory with the observed presence of RIF concentration at the brain stem in the time
dependent images. The high density of the drug in the cortex and striatum in our findings
are in keeping with those found in mice [27]. The detected RIF in the isocortex region of
the brain support the point that administration of RIF reduces brain injury after both
permanent and transient focal cerebral ischemia in mice [27-29]. The mechanisms
87
expediting such effects of RIF may involve fortification against oxidative stress and or the
activation of glucocorticoid receptors in areas of the hippocampal formation [27-29].
In conclusion, the novelty of this study is two-fold. Firstly, we were able to show that
MALDI imaging is a sensitive and powerful tool for evaluating drug distribution, even at
low concentrations, in the brain as in the case of RIF when compared to other anti-
tuberculosis drugs such as isoniazid, or pyrazinamide which have better penetration into
brain tissue [21]; hence the exploration of the sensitivity of MALDI imaging. Secondly,
we were able to demonstrate the time-dependent manner in which RIF penetrates into the
brain. This data, despite being collected in an uninfected model, is highly significant as it
allows us to determine the minimum doses reaching the brain in the early course of an
infection and its distribution. This will enable us to evaluate the drug’s location and if the
drug is reaching the therapeutic doses in the brain required to treat TB associated meningeal
infections [30]. The MALDI-TOF/TOF method developed for this study had a relatively
reasonable run time. The main advantage of this LIFT method is that both parent and
fragments of the analyte can be determined consecutively, providing adequate information
of adducts formed in the process. The transition of RIF from its sodium adduct m/z
845→791 made its mapping successful on the brain sections.
Acknowledgements
The authors would like to thank the National Research Foundation, SA; Aspenpharmacare,
SA; and the University of KwaZulu-Natal, Durban, SA for having funded this project.
Author disclosure statement
Authors declare no conflict of interest with the information contained in this work.
88
References 1. Wolzak, N., Cooke ML, Orth H and van Toorn R, The Changing Profile of Pediatric
Meningitis at a Referral Centre in Cape Town, South Africa. J Trop Pediatr 2012. 58(6): p. 491-495.
2. Sterling, T., Pham PA and Chaisson RE, HIV Infection-Related Tuberculosis: Clinical Manifestations and Treatment. CID, 2010. 50(S3): p. S223-230.
3. Leeds, I., Magee MJ, Kurbatova EV, del Rio C, Blumberg HM, Leonard MK and Kraft CS, Site of Extrapulmonary Tuberculosis is Associated with HIV Infection. CID, 2012. 55(1): p. 75-81.
4. Mitchison, D.A., Basic mechanisms of chemotherapy. Chest, 1979. 76: p. 771-781. 5. Wehrli, W., Rifampin: mechanisms of action and resistance. Review of Infectious
Diseases, 1983. 5(Supplement 3): p. S407-S411. 6. Strolin Benedetti, M. and P. Dostert, Induction and autoinduction properties of
rifamycin derivatives: a review of animal and human studies. Environ Health Perspect, 1994. 102 Suppl 9: p. 101-5.
7. Dartois, V., The path of anti-tuberculosis drugs: from blood to lesions to mycobacerial cells. Nat Rev, 2014. 12: p. 159-167.
8. Pardridge, W.M., Drug transport across the blood–brain barrier. Journal of Cerebral Blood Flow & Metabolism, 2012. 32(11): p. 1959-1972.
9. Leeson, P., Drug discovery: Chemical beauty contest. Nature, 2012. 481(7382): p. 455-456.
10. Barling, R., and Selkon JB, The penetration of antibiotics into cerebrospinal fluid and brain tissue. JAC, 1978. 4: p. 203-227.
11. Minedermann, T., Zimmerli W, and Gratzil O, Rifampicin Concentrations in Various Compartments of the Human Brain: A Novel method for Determining Drug Levels in the Cerebral Extracellular Space. Anti Microb Agent Chem, 1998. 42(10): p. 2626-2629.
12. Mindermann, T., Landolt H, Zimmerli W, Rajacic Z and Otmar G, Penetration of rifampicin into the brain tissue and cerebral extracellular space of rats. JAC, 1993. 31: p. 731-737.
13. Nau, R., Prange HW, Menck S, Kolenda H, Visser K, and Seydel JK, Penetration of rifampicin into the cerebrospinal fluid of adults with uninflamed meninges. J Antimicrob Chemother, 1992. 29: p. 719-724.
14. Ellard, G., Humphries MJ, Allen BW, Cerebrospinal fluid drug concentrations and the treatment of tuberculosis meningitis. Am Rev Respir Dis, 1993. 148(3): p. 650-655.
15. Kandel, E.R., Schwartz JH & Jessell T, Principles of Neural Science Edn. 2000. fourth(McGraw Hill United States of America).
16. Mindermann, T., W. Zimmerli, and O. Gratzl, Rifampin concentrations in various compartments of the human brain: a novel method for determining drug levels in the cerebral extracellular space. Antimicrobial agents and chemotherapy, 1998. 42(10): p. 2626-2629.
17. Mindermann, T., et al., Penetration of rifampicin into the brain tissue and cerebral extracellular space of rats. Journal of Antimicrobial Chemotherapy, 1993. 31(5): p. 731-737.
18. Qosa, H., et al., Enhanced brain amyloid-β clearance by rifampicin and caffeine as a possible protective mechanism against Alzheimer's disease. Journal of Alzheimer's Disease, 2012. 31(1): p. 151-165.
19. Acocella, G., Nicolis FB, Lamarina AA, A study on the kinetics of rifampicin in man. Chemotherapia, 1967. 5: p. 87.
89
20. Matthews, P., Rabiner I and Gunn R, Non-invasive imaging in experimental medicine for drug development. Curr Opin Pharmacol, 2011. 11: p. 501-507.
21. Liu, L., et al., Radiosynthesis and bioimaging of the tuberculosis chemotherapeutics isoniazid, rifampicin and pyrazinamide in baboons. Journal of medicinal chemistry, 2010. 53(7): p. 2882-2891.
22. Liu, X., Ide JL, Norton I, Marchionni MA, Ebling MC, Wang LY, et al., Molecular imaging of drug transit through the blood-brain barrier with MALDI mass spectrometry imaging. Scientific Report, 2013. 3: p. 2859.
23. Kadar, H., Douaron GL, Amar M, Ferrie L, Figadere B, et al, MALDI Mass Spectrometry Imaging of 1-Methyl-4-phenylpyridinium (MPP+) in Mouse Brain. Neurotox Res, 2014. 25: p. 135-145.
24. Meriaux, C., et al., Liquid ionic matrixes for MALDI mass spectrometry imaging of lipids. Journal of proteomics, 2010. 73(6): p. 1204-1218.
25. Srivastava, A., et al., Quantification of rifampicin in human plasma and cerebrospinal fluid by a highly sensitive and rapid liquid chromatographic–tandem mass spectrometric method. Journal of pharmaceutical and biomedical analysis, 2012. 70: p. 523-528.
26. Karimy, J.K., et al., A novel method to study cerebrospinal fluid dynamics in rats. Journal of neuroscience methods, 2015. 241: p. 78-84.
27. Yulug, B., et al., Rifampicin attenuates brain damage in focal ischemia. Brain research, 2004. 996(1): p. 76-80.
28. Nau, R., F. Sörgel, and H. Eiffert, Penetration of drugs through the blood-cerebrospinal fluid/blood-brain barrier for treatment of central nervous system infections. Clinical microbiology reviews, 2010. 23(4): p. 858-883.
29. Oida, Y., et al., Rifampicin attenuates the MPTP-induced neurotoxicity in mouse brain. Brain research, 2006. 1082(1): p. 196-204.
30. Nau, R., F. Sörgel, and H. Eiffert, Penetration of drugs through the blood-cerebrospinal fluid/blood-brain barrier for treatment of central nervous system infections. Clinical microbiology reviews, 2010. 23(4): p. 858-883.
90
Chapter 6 – Paper 5
Development and Validation of a Liquid chromatography-tandem mass spectrometry (LC-MS/MS) Method for the quantification of Tigecycline in
rat brain tissues Chiedza F. Munyezaa, Adeola Shoboa, Sooraj Baijnatha, Dominika Bratkowskaa, Suhashni
Naikera, Linda A. Besterb, Sanil D. Singhb, Glenn E. M. Maguirec, Hendrik G. Krugera, Tricia
Naickera, Thavendran Govendera*
a School of Pharmacy and Pharmacology, University of KwaZulu-Natal, Westville Campus,
Durban 4000, South Africa.
*e-mail: [email protected]
b Biomedical Resource Unit, University of KwaZulu-Natal, Westville Campus, Durban 4000,
South Africa.
c School of Chemistry and Physics, University of KwaZulu-Natal, Westville Campus, Durban
4000, South Africa.
Highlights
• LC-MS/MS is sensitive enough to detect low levels of tigecycline in healthy rat brain
tissues
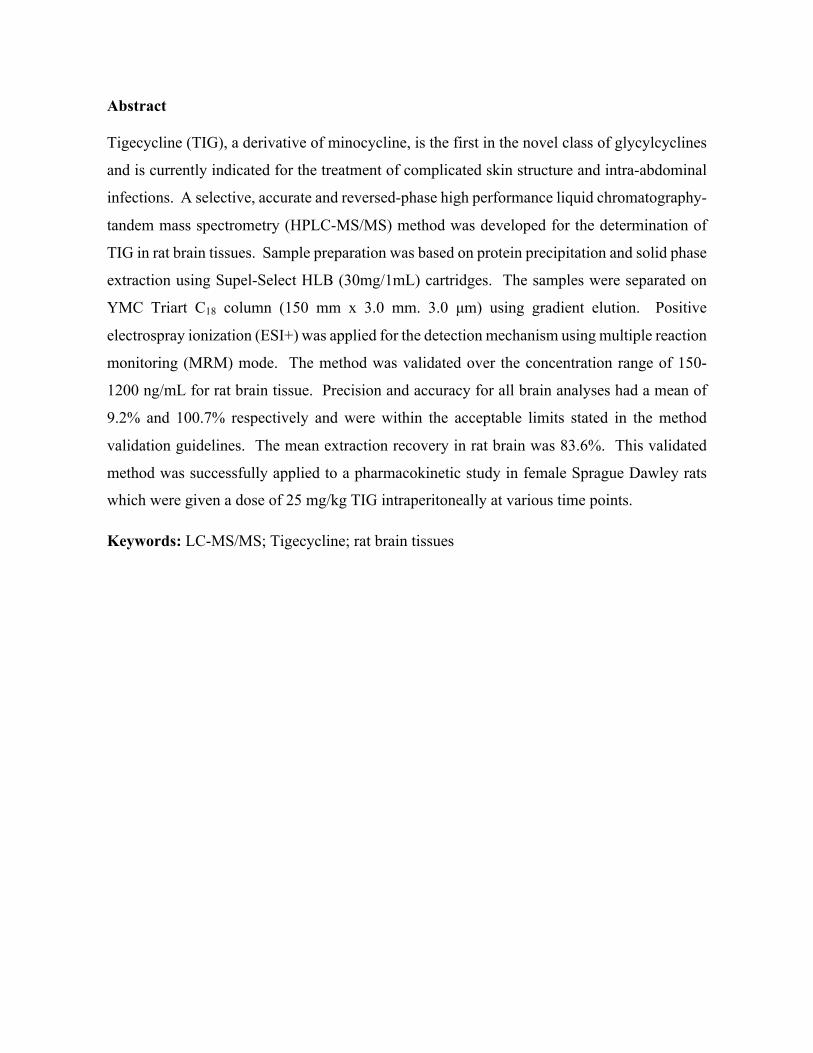
91
Abstract Tigecycline (TIG), a derivative of minocycline, is the first in the novel class of glycylcyclines
and is currently indicated for the treatment of complicated skin structure and intra-abdominal
infections. A selective, accurate and reversed-phase high performance liquid chromatography-
tandem mass spectrometry (HPLC-MS/MS) method was developed for the determination of
TIG in rat brain tissues. Sample preparation was based on protein precipitation and solid phase
extraction using Supel-Select HLB (30mg/1mL) cartridges. The samples were separated on
YMC Triart C18 column (150 mm x 3.0 mm. 3.0 µm) using gradient elution. Positive
electrospray ionization (ESI+) was applied for the detection mechanism using multiple reaction
monitoring (MRM) mode. The method was validated over the concentration range of 150-
1200 ng/mL for rat brain tissue. Precision and accuracy for all brain analyses had a mean of
9.2% and 100.7% respectively and were within the acceptable limits stated in the method
validation guidelines. The mean extraction recovery in rat brain was 83.6%. This validated
method was successfully applied to a pharmacokinetic study in female Sprague Dawley rats
which were given a dose of 25 mg/kg TIG intraperitoneally at various time points.
Keywords: LC-MS/MS; Tigecycline; rat brain tissues
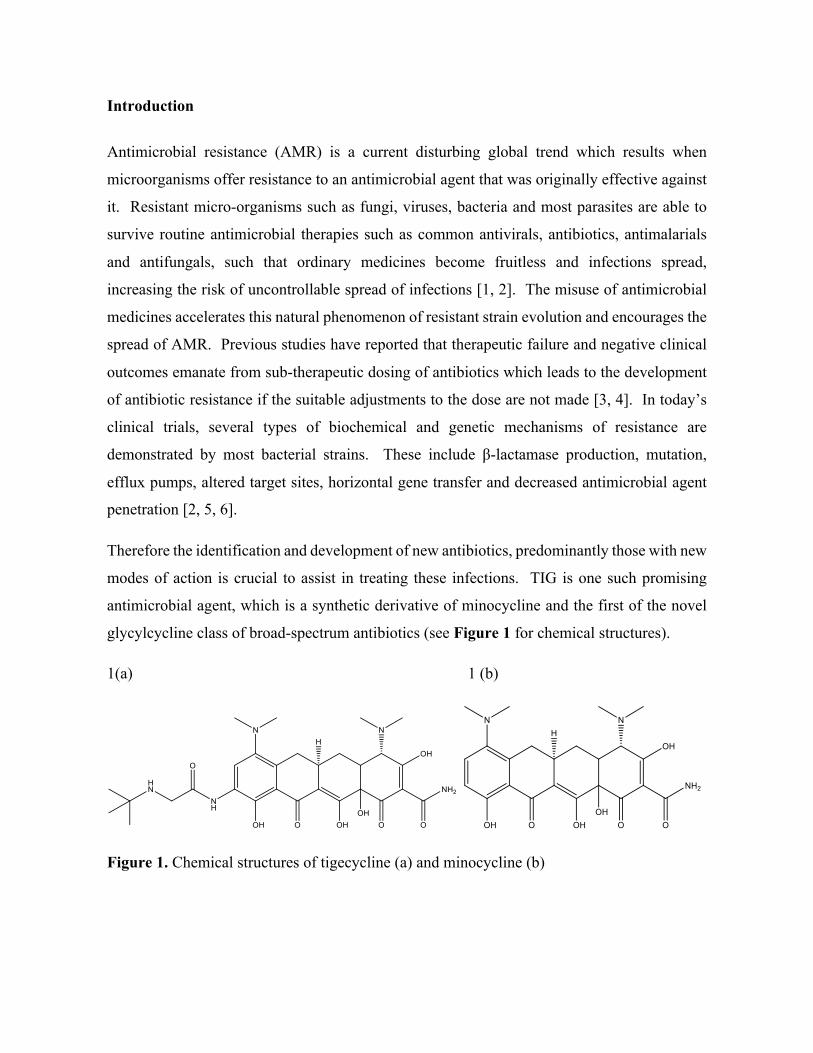
92
Introduction
Antimicrobial resistance (AMR) is a current disturbing global trend which results when
microorganisms offer resistance to an antimicrobial agent that was originally effective against
it. Resistant micro-organisms such as fungi, viruses, bacteria and most parasites are able to
survive routine antimicrobial therapies such as common antivirals, antibiotics, antimalarials
and antifungals, such that ordinary medicines become fruitless and infections spread,
increasing the risk of uncontrollable spread of infections [1, 2]. The misuse of antimicrobial
medicines accelerates this natural phenomenon of resistant strain evolution and encourages the
spread of AMR. Previous studies have reported that therapeutic failure and negative clinical
outcomes emanate from sub-therapeutic dosing of antibiotics which leads to the development
of antibiotic resistance if the suitable adjustments to the dose are not made [3, 4]. In today’s
clinical trials, several types of biochemical and genetic mechanisms of resistance are
demonstrated by most bacterial strains. These include β-lactamase production, mutation,
efflux pumps, altered target sites, horizontal gene transfer and decreased antimicrobial agent
penetration [2, 5, 6].
Therefore the identification and development of new antibiotics, predominantly those with new
modes of action is crucial to assist in treating these infections. TIG is one such promising
antimicrobial agent, which is a synthetic derivative of minocycline and the first of the novel
glycylcycline class of broad-spectrum antibiotics (see Figure 1 for chemical structures).
1(a) 1 (b)
Figure 1. Chemical structures of tigecycline (a) and minocycline (b)

93
TIG has demonstrated an expanded broad spectrum of in vitro activity and clinical potency
against both Gram negative and Gram positive aerobic and anaerobic bacteria. It is also not
affected by most of the common mechanisms of antibiotic resistance used by bacteria to resist
antibiotic therapy, due to steric hindrance afforded by the bulky D-ring substituent [7]. TIG is
the key in the containment of complicated multi-organism infections and is officially accepted
for the treatment of a number of pathologies including intra-abdominal infections, complicated
skin and skin structure infections and community-acquired pneumonia [8-10]. Infections of
the central nervous system (CNS) are amongst the diseases with the most severe outcomes,
from both social and individual points of view. Amongst these disorders is acute bacterial
meningitis, which is a life threatening infectious disease. Despite its high efficacy against
multidrug-resistant (MDR) pathogens, TIG is currently being reviewed for the treatment of
meningeal infections based on studies of it in cerebrospinal fluid (CSF) [11-13]. TIG
concentrations were lower when compared to other drugs in the tetracycline family at the same
dose and it was concluded that inflamed meninges might be increasing TIG concentrations by
facilitating the drug’s penetration into CSF [14]. In a couple of cases, the CSF concentrations
were determined to be lower than the minimum inhibitory concentration (MIC) [12, 13], but in
most of the reported cases were constantly above the MIC [15-17]. These results warrant
further investigations into the neuroprotective properties of TIG.
Furthermore, CSF concentrations in spine is not the same as CSF concentrations in brain
therefore measuring the concentration of drug in spinal cord CSF is considered incorrect [18].
Data on the actual measurement of TIG in the brain are still scarce, with only a single study
evaluating the antibiotic levels in cerebral tissue using a microbiological agar diffusion assay
with Staphylococcus aureus ATCC 6538P as the indicator microorganism [19]. Recent
publications have not reported any literature that demonstrates the development and validation
of a sensitive and selective assay for the determination of TIG in rat brain tissues. Therefore
an accurate and sensitive analytical method to quantify TIG in the brain is an important tool
that is lacking. During the past decade, highly significant technological advancements in mass
spectrometry have resulted in a great impact on drug discovery, development and analysis [20,
21]. Currently, LC-MS/MS is a very popular analytical method for the determination and
quantification of most drugs in biological samples and various pharmaceutical formulations
[22, 23]. As recently summarized by Xie et al. [24], several HPLC methods coupled with MS
have been used for the determination and quantification of TIG at low concentrations in plasma
samples because of the high sensitivity and specificity of this technique [23]. All the current
94
published analytical methods for TIG are generally aimed only at analyzing the drug in
solution, body fluids or tissues other than the brain. We are currently interested in studying
the neuroprotective properties of antibiotics for resistant strains of microorganisms [25]. The
aim of the present study was to develop an accurate and selective LC-MS/MS method for the
determination of TIG in rat brain tissues to be applied in a pharmacokinetic study after
intraperitoneal (i.p.) administration of TIG in healthy rats.
Materials and methods
Chemicals and reagents
TIG and minocycline (internal standard) standards were purchased from DLD Scientific
(Durban, South Africa). The chemical structures of the analytes are shown in Figure 1.
Acetonitrile (ACN), formic acid, trifluoroacetic acid (TFA) and methanol (MeOH) were of
analytical grade all from Sigma–Aldrich (Munich, Germany). Ultra-pure water was obtained
using a Milli-Q purification system from Millipore Corporation (Bedford, MA, USA).
Deuterated internal standard (IS) is recommended whenever possible; however, this was not
commercially available for TIG, therefore we decided to use structurally similar minocycline.
Chromatographic conditions The analytical column was a YMC Triart C18 (150 mm × 3.0 mm i.d. 3 µm) stainless-steel
column, from YMC Europe Gmbh (Dislanken, Germany). The mobile phase was a mixture of
Millipore water (0.1% v/v formic acid) (A) and 1:3 MeOH: ACN (0.1% v/v formic acid) (B),
which resulted in a reasonable total run time of 25 min. The flow rate was 0.4 mL min-1 and
the column oven temperature was set at 25 oC. The gradient profile was developed from 5%
to 95% ACN in 15 min, (held 5 min), after which time the mobile phase was returned to (5%
ACN) in 5 min.
Standard stock, calibration standards and quality control sample preparation
Stock solutions of TIG, (1 mg/mL) were prepared in methanol and stored at -20 oC. Serial
dilutions of these solutions were prepared in mobile phases A and B (50:50, v/v) for the
calibration curve and quality control (QC) samples. Stock solution of 1 mg/mL of IS in
methanol was also prepared and diluted with the same diluents to prepare working solutions.
Calibration standard plasma and brain samples were prepared as follows: working standard
solutions and IS (at a concentration level of 500 ng/mL) were spiked into 200 µL of plasma
and blank brain tissue homogenates of untreated rats to yield a linear range from 300 to 2000
95
ng/mL and 150 to 1200 ng/mL for the calibration curve of plasma and brain respectively. QC
plasma (300, 900, 1800 ng/mL) and brain samples (150, 600, 1000 ng/mL) were prepared in
the same way.
Instrumentation and Mass spectrometric analysis
Identification and determination of TIG and minocycline was performed using an Agilent
Series 1100 HPLC (Shimadzu Corporation, Kyoto, Japan), with an online degasser, gradient
pump and an autosampler coupled to a time of flight mass spectrometer analyzer (MicrOTOF-
Q II, Bruker, Germany). Electrospray was used as an ion source, the optimized conditions
were as follows: collision energy: 32 eV, nebulizer pressure: 1.5 bar, dry gas: 8.0 L/min and
temperature of dry gas: 200 ºC. The profile spectra were acquired in positive mode in the mass
range of 150-1600 m/z with mass resolving power over 16000. Mass calibration was performed
prior to each run. Data was processed by Data Analysis software (Bruker, Germany) and
extracted ion chromatograms of all analytes were plotted. For each analysis, 3 µL of sample
solution was injected by an autosampler.
Plasma and brain tissue samples Drug free plasma samples were purchased from Life Technologies (Burlington, ON, Canada)
and stored at -20oC prior to analysis. Plasma samples were allowed to thaw at room
temperature before analysis. Rat brains were weighed, cut into small pieces using scissors and
mixed with ultra-pure water (3 µL/mg tissue). The tissues were then homogenized using a
glass ‘pestle and mortar’ homogenizer and all homogenate was stored at -80 °C until analysis.
Sample preparation To precipitate the proteins in the biological samples, aliquots of 200 µL plasma samples were
added into 1 mL Eppendorf tubes, spiked with IS solution at a concentration level of 500 ng/mL
and the mixture slightly vortexed. Subsequently, 600 µL 0.1% TFA in ACN was added into
the Eppendorf tubes, then vigorously mixed for 1 min and the precipitated protein was removed
by centrifugation at 12000 rpm for 10 min. The supernatants from plasma and brain were
filtered through 30 mg/1 mL Supel-Select HLB (High Lipid Binding) cartridges or 100 mg/1
mL DSC-18 SPE cartridges (Sigma Aldrich, Munich, Germany) and the cartridge which gave
the highest recovery for each respective matrix was used. After protein precipitation, the
cartridges were conditioned with 2 mL methanol:water in a ratio of 1:1 and were eluted using
96
0.1% TFA in ACN. The filtered samples were dried under a gentle stream of nitrogen and then
combined with 200 µL of mobile phase (50% A:B). All the vials containing samples were
vortexed briefly and transferred into autosampler vials for injection into the chromatographic
system. All thawing of frozen plasma and brain tissue samples was done at room temperature.
For the brain tissue samples, the IS was added to 200 µL brain homogenates samples. After
addition of 10 µL IS solution, the homogenized tissue sample was thoroughly mixed.
Subsequent extraction procedure of the drug from the rat brain tissue samples was the same as
described for the plasma. To improve sensitivity, a further procedure to concentrate the
samples was used. 1 mL brain homogenate samples were lyophilized overnight in a VirTis
freeze dryer (SP Scientific, Germany). The lyophilized powder was re-suspended in 600 µL
0.1% TFA in ACN and 10 µL IS solution was added. After vortexing for 1 min, the suspension
was centrifuged, extracted and processed as described for plasma. For the brain samples, the
supernatant was dried under vacuum at room temperature, samples were reconstituted in 200
µL mobile phase and an aliquot was injected for LC-MS/MS analysis.
Method validation
The bioanalytical method was validated according to the criteria laid out in the European
Medicines Agency Guideline for bioanalytical method validation (EMA) [26].
Specificity and selectivity
The specificity and selectivity of the method was evaluated by analyzing six individual spiked
brain samples and blank samples after i.p. administration of TIG. Two blank brain samples
spiked with an IS concentration of 500 ng/mL were also prepared and examined for matrix
interferences. Interferences from the matrix which could produce similar mass spectra to the
target compound were investigated to reveal true analytical selectivity. Each blank sample was
tested for the effect of matrix interferences at the retention times of analytes and IS. In
accordance with the validation guideline [26], absence of interferences is accepted where the
response is less than 20% of the LOQ for the analyte and 5% for the IS.
Linearity and carry over effect
To evaluate the linearity of the method, seven calibration standards were studied over a
calibration range of 150-1200 ng/mL for TIG in rat brain homogenate. Each calibration curve
consisted of a blank sample, a zero sample and seven calibration concentration levels, among
which blank and zero samples were necessary only to confirm the absence of interferences.
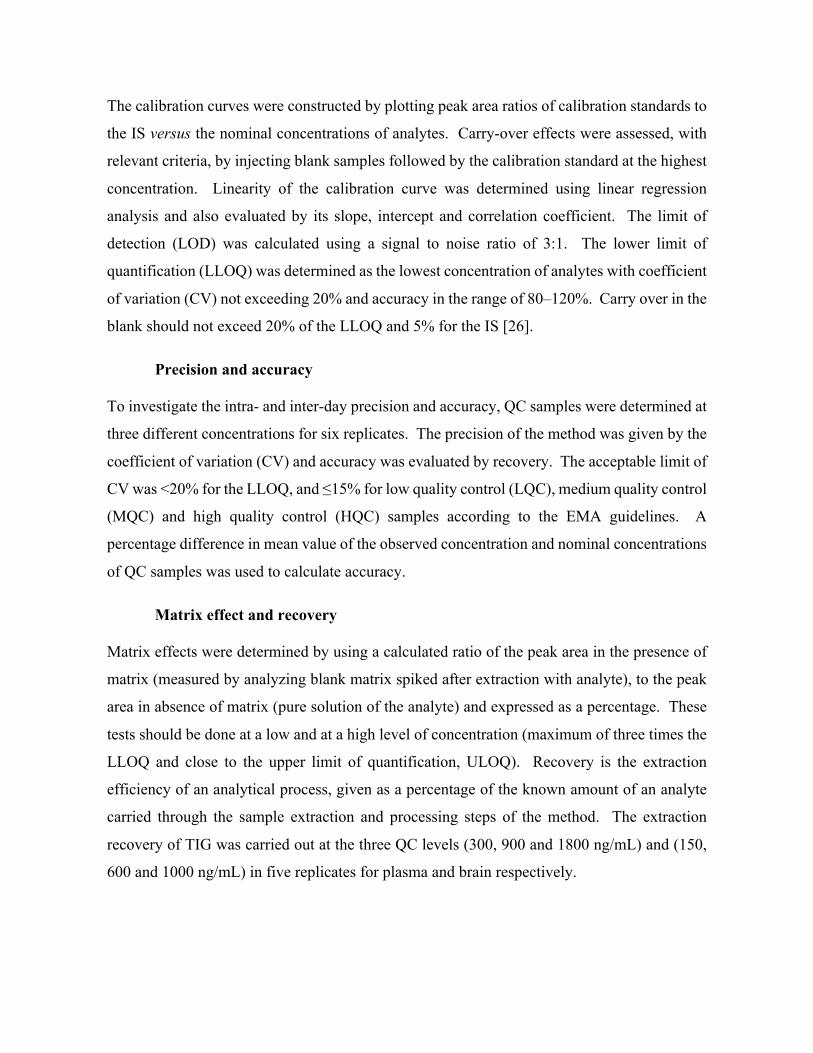
97
The calibration curves were constructed by plotting peak area ratios of calibration standards to
the IS versus the nominal concentrations of analytes. Carry-over effects were assessed, with
relevant criteria, by injecting blank samples followed by the calibration standard at the highest
concentration. Linearity of the calibration curve was determined using linear regression
analysis and also evaluated by its slope, intercept and correlation coefficient. The limit of
detection (LOD) was calculated using a signal to noise ratio of 3:1. The lower limit of
quantification (LLOQ) was determined as the lowest concentration of analytes with coefficient
of variation (CV) not exceeding 20% and accuracy in the range of 80–120%. Carry over in the
blank should not exceed 20% of the LLOQ and 5% for the IS [26].
Precision and accuracy To investigate the intra- and inter-day precision and accuracy, QC samples were determined at
three different concentrations for six replicates. The precision of the method was given by the
coefficient of variation (CV) and accuracy was evaluated by recovery. The acceptable limit of
CV was <20% for the LLOQ, and ≤15% for low quality control (LQC), medium quality control
(MQC) and high quality control (HQC) samples according to the EMA guidelines. A
percentage difference in mean value of the observed concentration and nominal concentrations
of QC samples was used to calculate accuracy.
Matrix effect and recovery Matrix effects were determined by using a calculated ratio of the peak area in the presence of
matrix (measured by analyzing blank matrix spiked after extraction with analyte), to the peak
area in absence of matrix (pure solution of the analyte) and expressed as a percentage. These
tests should be done at a low and at a high level of concentration (maximum of three times the
LLOQ and close to the upper limit of quantification, ULOQ). Recovery is the extraction
efficiency of an analytical process, given as a percentage of the known amount of an analyte
carried through the sample extraction and processing steps of the method. The extraction
recovery of TIG was carried out at the three QC levels (300, 900 and 1800 ng/mL) and (150,
600 and 1000 ng/mL) in five replicates for plasma and brain respectively.
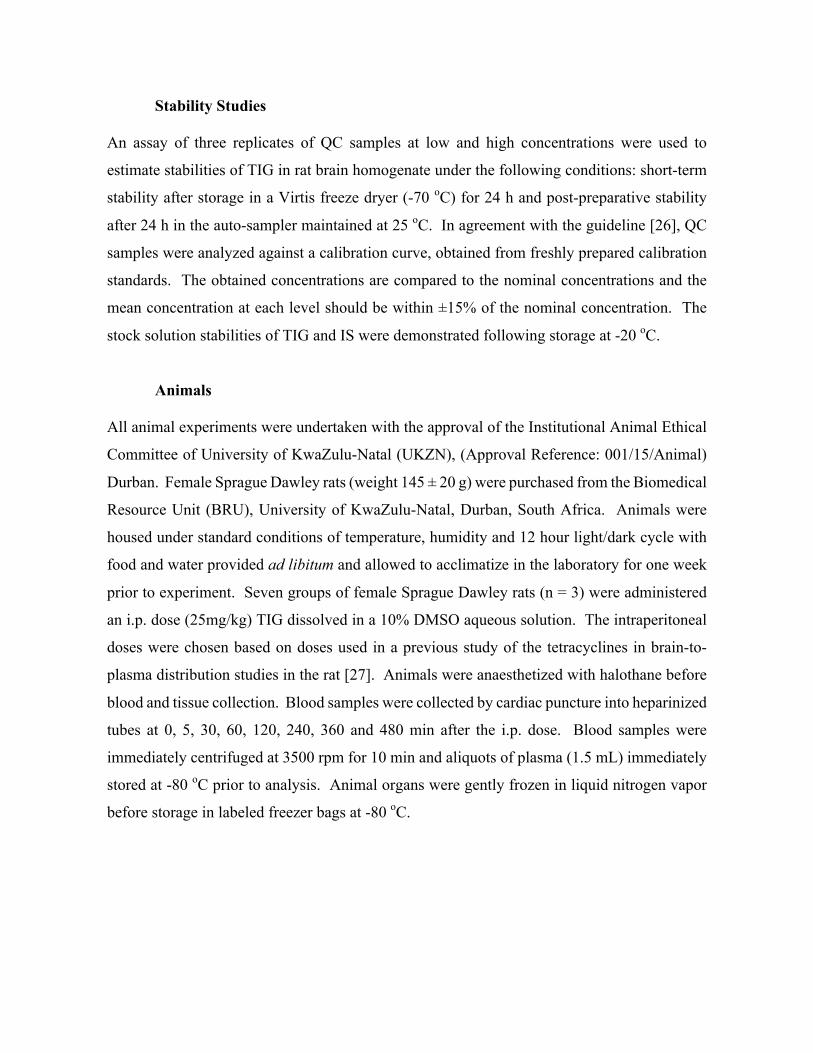
98
Stability Studies An assay of three replicates of QC samples at low and high concentrations were used to
estimate stabilities of TIG in rat brain homogenate under the following conditions: short-term
stability after storage in a Virtis freeze dryer (-70 oC) for 24 h and post-preparative stability
after 24 h in the auto-sampler maintained at 25 oC. In agreement with the guideline [26], QC
samples were analyzed against a calibration curve, obtained from freshly prepared calibration
standards. The obtained concentrations are compared to the nominal concentrations and the
mean concentration at each level should be within ±15% of the nominal concentration. The
stock solution stabilities of TIG and IS were demonstrated following storage at -20 oC.
Animals
All animal experiments were undertaken with the approval of the Institutional Animal Ethical
Committee of University of KwaZulu-Natal (UKZN), (Approval Reference: 001/15/Animal)
Durban. Female Sprague Dawley rats (weight 145 ± 20 g) were purchased from the Biomedical
Resource Unit (BRU), University of KwaZulu-Natal, Durban, South Africa. Animals were
housed under standard conditions of temperature, humidity and 12 hour light/dark cycle with
food and water provided ad libitum and allowed to acclimatize in the laboratory for one week
prior to experiment. Seven groups of female Sprague Dawley rats (n = 3) were administered
an i.p. dose (25mg/kg) TIG dissolved in a 10% DMSO aqueous solution. The intraperitoneal
doses were chosen based on doses used in a previous study of the tetracyclines in brain-to-
plasma distribution studies in the rat [27]. Animals were anaesthetized with halothane before
blood and tissue collection. Blood samples were collected by cardiac puncture into heparinized
tubes at 0, 5, 30, 60, 120, 240, 360 and 480 min after the i.p. dose. Blood samples were
immediately centrifuged at 3500 rpm for 10 min and aliquots of plasma (1.5 mL) immediately
stored at -80 oC prior to analysis. Animal organs were gently frozen in liquid nitrogen vapor
before storage in labeled freezer bags at -80 oC.

99
Application to Pharmacokinetic Study
Maximum concentration (Cmax) of TIG and time to reach Cmax (Tmax) were determined directly
from the rat plasma and brain concentration-time curves. All the other pharmacokinetic
parameters were determined using non-compartmental analysis (STATA 13.0). The area under
the curve (AUC0→480) was calculated by the linear trapezoidal rule.
Results and discussion
LC-MS method development
During method development, various parameters were evaluated to optimize mass
spectrometry detection conditions, chromatography and sample extraction.
Development of MS-TOF method
Initially, to identify target analytes at low concentrations the ESI-MS-TOF parameters were
optimized using a single variable procedure for all tested parameters of ESI source and mass
spectrometer. Obtaining the highest abundance of m/z values corresponding to ions of the
analyte and the IS provided a high sensitivity of the developed method. Both the target analyte
and IS gave good response in positive ion mode since ESI is the preferred ionization technique
for polar analytes like these tetracyclines. The best chromatographic conditions were obtained
by testing different mobile phases consisting of acetonitrile-water and methanol-water in order
to provide adequate selectivity in a reasonably short separation time. Modifiers such as
ammonium formate, TFA and acetic acid were tested. Due to its high miscibility with organic
solvents, formic acid was selected and this resulted in improved peak symmetry and ionization
efficiency for TIG and IS.
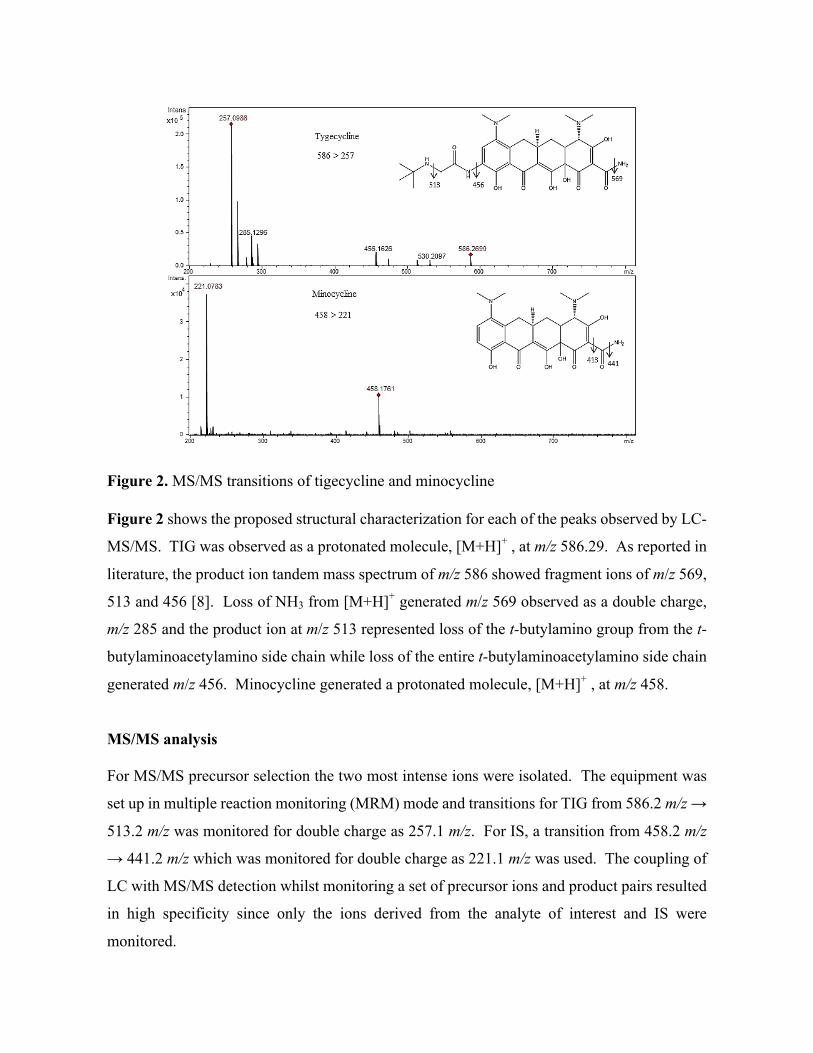
100
Figure 2. MS/MS transitions of tigecycline and minocycline
Figure 2 shows the proposed structural characterization for each of the peaks observed by LC-
MS/MS. TIG was observed as a protonated molecule, [M+H]+ , at m/z 586.29. As reported in
literature, the product ion tandem mass spectrum of m/z 586 showed fragment ions of m/z 569,
513 and 456 [8]. Loss of NH3 from [M+H]+ generated m/z 569 observed as a double charge,
m/z 285 and the product ion at m/z 513 represented loss of the t-butylamino group from the t-
butylaminoacetylamino side chain while loss of the entire t-butylaminoacetylamino side chain
generated m/z 456. Minocycline generated a protonated molecule, [M+H]+ , at m/z 458.
MS/MS analysis For MS/MS precursor selection the two most intense ions were isolated. The equipment was
set up in multiple reaction monitoring (MRM) mode and transitions for TIG from 586.2 m/z →
513.2 m/z was monitored for double charge as 257.1 m/z. For IS, a transition from 458.2 m/z
→ 441.2 m/z which was monitored for double charge as 221.1 m/z was used. The coupling of
LC with MS/MS detection whilst monitoring a set of precursor ions and product pairs resulted
in high specificity since only the ions derived from the analyte of interest and IS were
monitored.

101
Method validation After suitable optimization of the chromatographic separation conditions, a reproducible
separation of TIG from plasma was achieved. Figure 3 (a) represents typical chromatograms
of blank plasma and brain, Figure 3 (b) blank plasma and brain spiked with IS at 500 ng/mL
and TIG at LQC level. Typical retention time for TIG was 7.1 min. From these chromatograms
and peaks, it was concluded that adequate optimization had been done and the method could
be used for further analyses. Typical linear regression equations of the calibration curves for
different matrices were y=0.541616 x + 0.193140 and y=0.326337 x + 0.032136 (where y was
the peak area ratio of the analyte to the internal standard and x the concentration of the analyte),
while the mean regression coefficients of the calibration curves were 0.9991 and 0.9981 in
plasma and brain, respectively. Calibration curves of TIG were established and were linear
over a concentration range of 300-2000 ng/mL for plasma and 150-1200 ng/mL for brain tissue
and this was shown in Figures S1 and S2. To complete the method validation, batches
consisting of duplicate calibration standards at each concentration level were analyzed on three
different days. In each batch, QC samples at 300; 900; 1800ng/mL and 150; 600; 1000ng/mL
in plasma samples and brain tissue respectively were assayed in sets of six replicates. The
LLOQ was evaluated by analyzing six replicates of spiked samples at the concentration of 300
ng/mL for plasma and 150ng/mL for brain homogenate. The LOD was 100ng/mL and 50
ng/mL for plasma and brain homogenate respectively.

102
Figure 3. Representative LC – MS/MS extracted ion chromatograms of m/z 257.1 obtained
from (a) blank matrix, (b) low QC plasma and brain samples (c) plasma and brain samples at
Tmax, (30 min and 120 min respectively)
Intra- and inter-day precisions was determined by an assay of five replicates of QC samples at
low, medium and high concentrations on the same day and on three different days. Under the
current method validation conditions [26], a satisfactory precision, accuracy and
reproducibility of TIG in solution were obtained by analyzing the QC samples. The intra- and
inter-day precisions (%RSD) were <5.0% and the accuracies (%) were within the range of 98.9-
106%. These results showed that the repeatability and reproducibility of the method were
adequate and they fall within the acceptance criteria of the guidelines. The results are presented
in Table 1. No significant carry-over from the analyte and IS was observed in the double blank
after subsequent injection of the highest calibration standard (aqueous and extracted) at the
retention time of analyte.
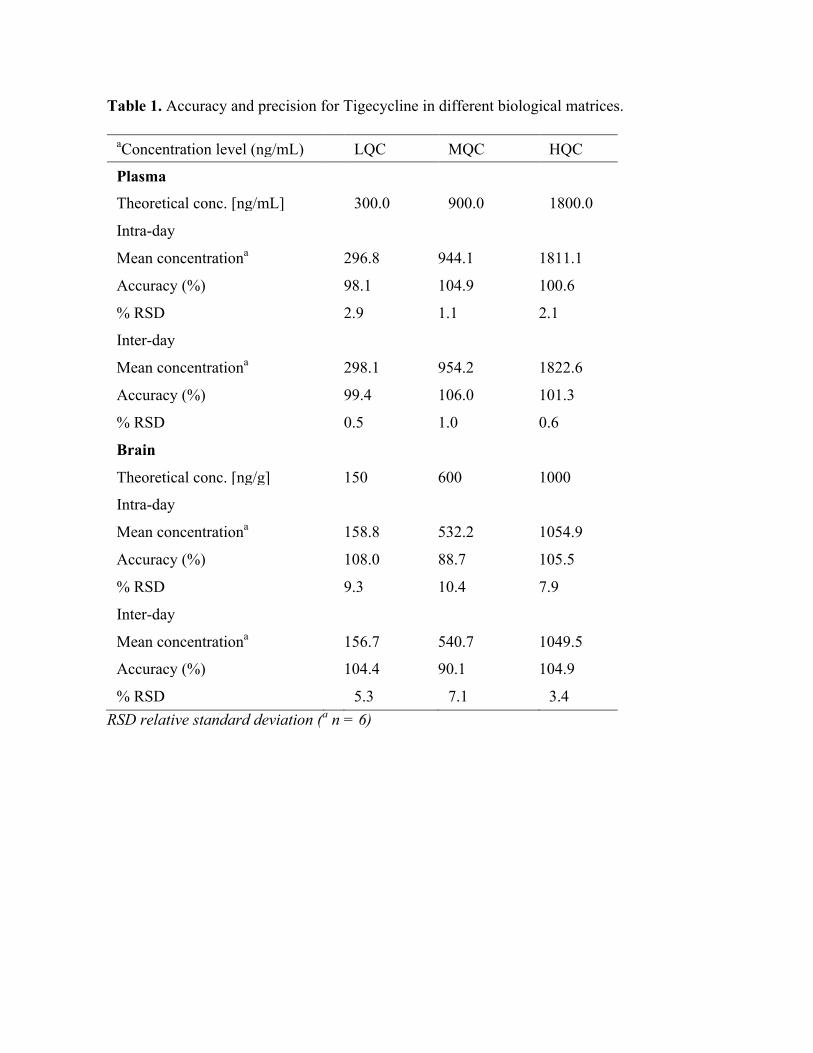
103
Table 1. Accuracy and precision for Tigecycline in different biological matrices.
aConcentration level (ng/mL) LQC MQC HQC
Plasma
Theoretical conc. [ng/mL] 300.0 900.0 1800.0
Intra-day
Mean concentrationa 296.8 944.1 1811.1
Accuracy (%) 98.1 104.9 100.6
% RSD 2.9 1.1 2.1
Inter-day
Mean concentrationa 298.1 954.2 1822.6
Accuracy (%) 99.4 106.0 101.3
% RSD 0.5 1.0 0.6
Brain
Theoretical conc. [ng/g] 150 600 1000
Intra-day
Mean concentrationa 158.8 532.2 1054.9
Accuracy (%) 108.0 88.7 105.5
% RSD 9.3 10.4 7.9
Inter-day
Mean concentrationa 156.7 540.7 1049.5
Accuracy (%) 104.4 90.1 104.9
% RSD
5.3 7.1 3.4
RSD relative standard deviation (a n = 6)
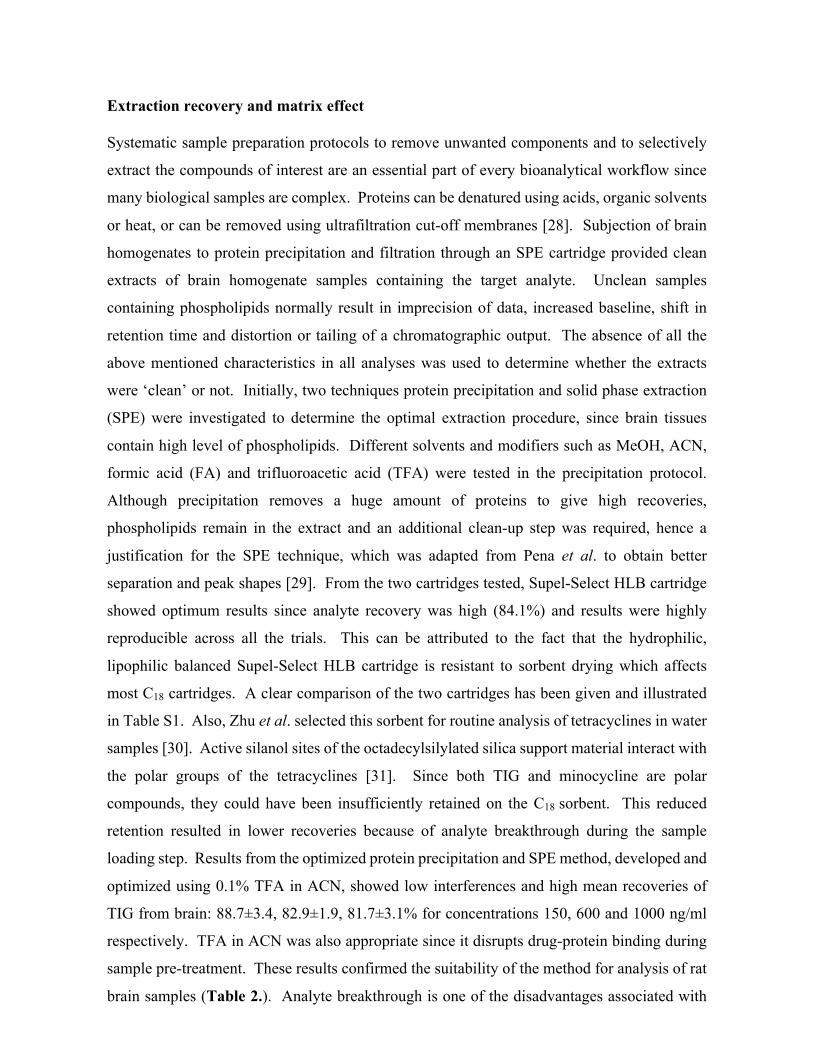
104
Extraction recovery and matrix effect Systematic sample preparation protocols to remove unwanted components and to selectively
extract the compounds of interest are an essential part of every bioanalytical workflow since
many biological samples are complex. Proteins can be denatured using acids, organic solvents
or heat, or can be removed using ultrafiltration cut-off membranes [28]. Subjection of brain
homogenates to protein precipitation and filtration through an SPE cartridge provided clean
extracts of brain homogenate samples containing the target analyte. Unclean samples
containing phospholipids normally result in imprecision of data, increased baseline, shift in
retention time and distortion or tailing of a chromatographic output. The absence of all the
above mentioned characteristics in all analyses was used to determine whether the extracts
were ‘clean’ or not. Initially, two techniques protein precipitation and solid phase extraction
(SPE) were investigated to determine the optimal extraction procedure, since brain tissues
contain high level of phospholipids. Different solvents and modifiers such as MeOH, ACN,
formic acid (FA) and trifluoroacetic acid (TFA) were tested in the precipitation protocol.
Although precipitation removes a huge amount of proteins to give high recoveries,
phospholipids remain in the extract and an additional clean-up step was required, hence a
justification for the SPE technique, which was adapted from Pena et al. to obtain better
separation and peak shapes [29]. From the two cartridges tested, Supel-Select HLB cartridge
showed optimum results since analyte recovery was high (84.1%) and results were highly
reproducible across all the trials. This can be attributed to the fact that the hydrophilic,
lipophilic balanced Supel-Select HLB cartridge is resistant to sorbent drying which affects
most C18 cartridges. A clear comparison of the two cartridges has been given and illustrated
in Table S1. Also, Zhu et al. selected this sorbent for routine analysis of tetracyclines in water
samples [30]. Active silanol sites of the octadecylsilylated silica support material interact with
the polar groups of the tetracyclines [31]. Since both TIG and minocycline are polar
compounds, they could have been insufficiently retained on the C18 sorbent. This reduced
retention resulted in lower recoveries because of analyte breakthrough during the sample
loading step. Results from the optimized protein precipitation and SPE method, developed and
optimized using 0.1% TFA in ACN, showed low interferences and high mean recoveries of
TIG from brain: 88.7±3.4, 82.9±1.9, 81.7±3.1% for concentrations 150, 600 and 1000 ng/ml
respectively. TFA in ACN was also appropriate since it disrupts drug-protein binding during
sample pre-treatment. These results confirmed the suitability of the method for analysis of rat
brain samples (Table 2.). Analyte breakthrough is one of the disadvantages associated with
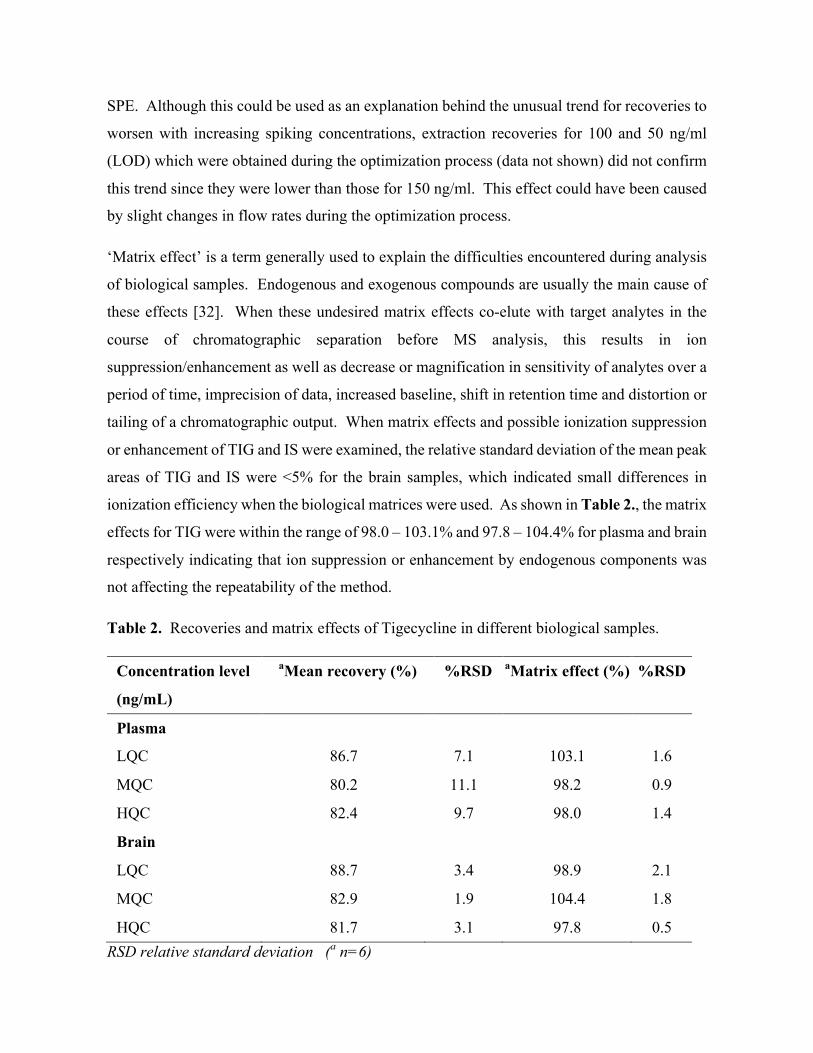
105
SPE. Although this could be used as an explanation behind the unusual trend for recoveries to
worsen with increasing spiking concentrations, extraction recoveries for 100 and 50 ng/ml
(LOD) which were obtained during the optimization process (data not shown) did not confirm
this trend since they were lower than those for 150 ng/ml. This effect could have been caused
by slight changes in flow rates during the optimization process.
‘Matrix effect’ is a term generally used to explain the difficulties encountered during analysis
of biological samples. Endogenous and exogenous compounds are usually the main cause of
these effects [32]. When these undesired matrix effects co-elute with target analytes in the
course of chromatographic separation before MS analysis, this results in ion
suppression/enhancement as well as decrease or magnification in sensitivity of analytes over a
period of time, imprecision of data, increased baseline, shift in retention time and distortion or
tailing of a chromatographic output. When matrix effects and possible ionization suppression
or enhancement of TIG and IS were examined, the relative standard deviation of the mean peak
areas of TIG and IS were <5% for the brain samples, which indicated small differences in
ionization efficiency when the biological matrices were used. As shown in Table 2., the matrix
effects for TIG were within the range of 98.0 – 103.1% and 97.8 – 104.4% for plasma and brain
respectively indicating that ion suppression or enhancement by endogenous components was
not affecting the repeatability of the method.
Table 2. Recoveries and matrix effects of Tigecycline in different biological samples.
Concentration level
aMean recovery (%) %RSD aMatrix effect (%) %RSD
(ng/mL)
Plasma
LQC
ISII
86.7 7.1 103.1 1.6
MQC 80.2 11.1 98.2 0.9
HQC 82.4 9.7 98.0 1.4
Brain
LQC 88.7 3.4 98.9 2.1
MQC 82.9 1.9 104.4 1.8
HQC 81.7 3.1 97.8 0.5 RSD relative standard deviation (a n=6)
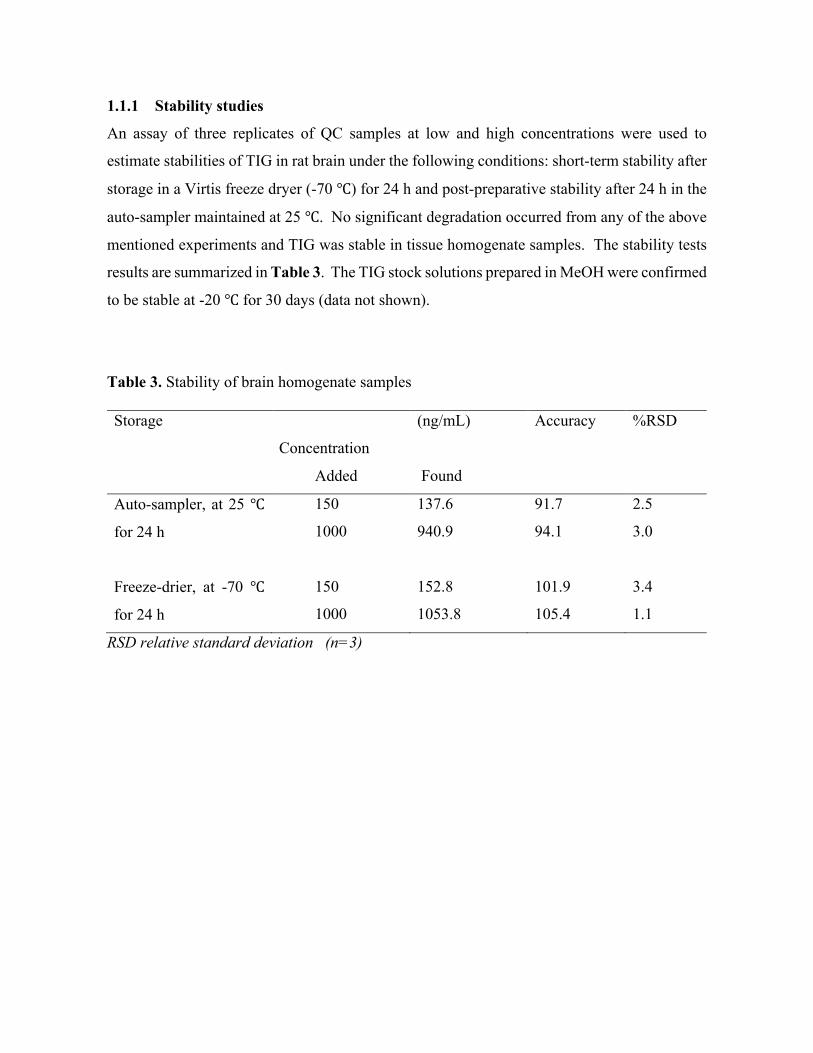
106
1.1.1 Stability studies
An assay of three replicates of QC samples at low and high concentrations were used to
estimate stabilities of TIG in rat brain under the following conditions: short-term stability after
storage in a Virtis freeze dryer (-70 ℃) for 24 h and post-preparative stability after 24 h in the
auto-sampler maintained at 25 ℃. No significant degradation occurred from any of the above
mentioned experiments and TIG was stable in tissue homogenate samples. The stability tests
results are summarized in Table 3. The TIG stock solutions prepared in MeOH were confirmed
to be stable at -20 ℃ for 30 days (data not shown).
Table 3. Stability of brain homogenate samples
Storage
Concentration
(ng/mL) Accuracy %RSD
Added Found
Auto-sampler, at 25 ℃
for 24 h
150
1000
137.6
940.9
91.7
94.1
2.5
3.0
Freeze-drier, at -70 ℃
for 24 h
150
1000
152.8
1053.8
101.9
105.4
3.4
1.1
RSD relative standard deviation (n=3)
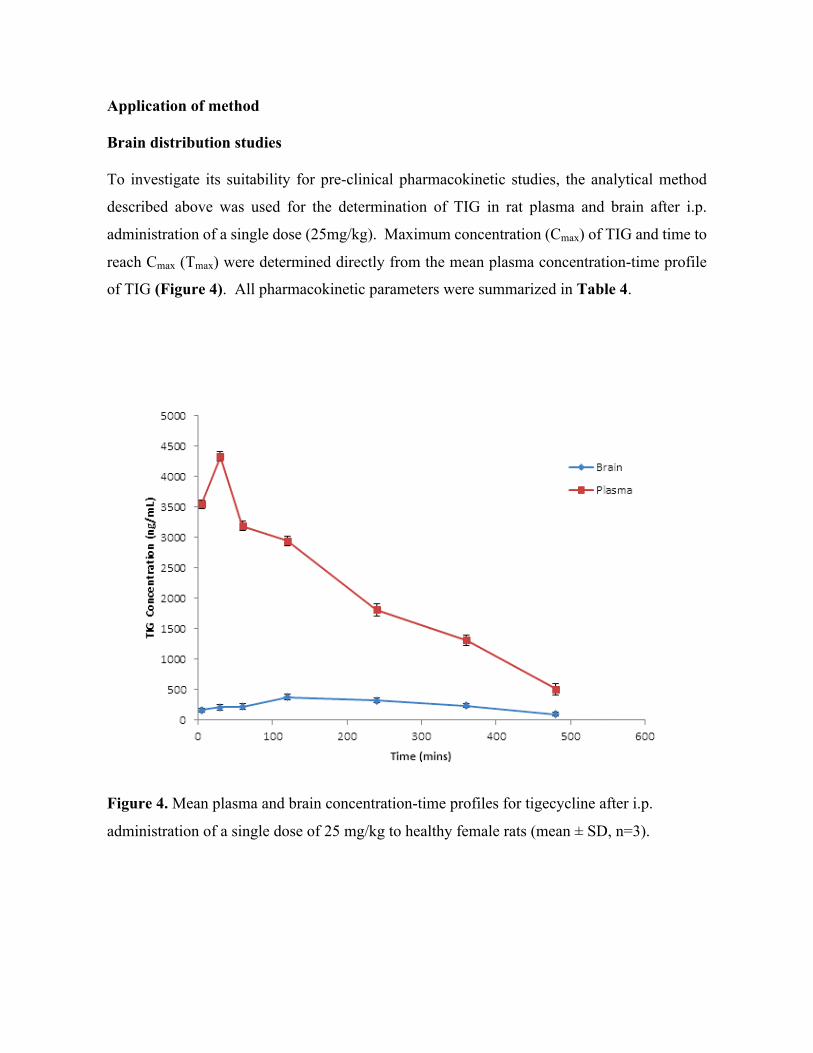
107
Application of method Brain distribution studies To investigate its suitability for pre-clinical pharmacokinetic studies, the analytical method
described above was used for the determination of TIG in rat plasma and brain after i.p.
administration of a single dose (25mg/kg). Maximum concentration (Cmax) of TIG and time to
reach Cmax (Tmax) were determined directly from the mean plasma concentration-time profile
of TIG (Figure 4). All pharmacokinetic parameters were summarized in Table 4.
Figure 4. Mean plasma and brain concentration-time profiles for tigecycline after i.p.
administration of a single dose of 25 mg/kg to healthy female rats (mean ± SD, n=3).

108
The overall shape of the plasma concentration-time profile was consistent with previous studies
in which TIG was administered intraperitonealy [33]. After i.p. administration, TIG was
absorbed rapidly. The concentration of the drug was easily detected and quantified in the
plasma samples collected up to 480 min post dose and all the concentrations were above LOQ
of the analytical procedure. As can be seen in (Figure 4), after i.p. administration, the plasma
concentration of TIG first decreased rapidly from 30 min to 60 min and then more slowly
thereafter. Similar parameters and trends are reported by Goessens et al. for i.p. administration
of TIG in which absorption occurs rapidly within the first 30 min, followed by distribution
around 60-120 min then elimination [33]. TIG reached a peak concentration of 4332.8 ng/mL
and 376.9 ng/mL at Tmax=30 min and Tmax= 120 min, in plasma and brain respectively. TIG
brain concentrations rose gradually up to the Tmax after administration, amounting to
approximately 10% of the plasma concentrations. The mean brain-plasma ratio, in terms of
area under the curve (AUC 0-480), was 0.12. These results are comparable with the data from
the studies done on penetration of antibiotics into the CNS where TIG reached CSF
concentrations of approximately 10% of those found in serum with non-inflamed meninges
[11, 14]. It is unknown whether these distribution ratios reflect the true extent of brain-to-
blood ratios since the plasma protein binding of TIG was not determined in this experiment
with rats. However, in man the plasma protein binding ranges from 71-89%. Therefore there
is a possibility that brain uptake ratios based on total plasma concentrations underestimates the
uptake of the unbound drug which is actually available for distribution in the brain [7, 34, 35].
Table 4. Plasma and brain concentration of TIG after i.p. administration of 25mg/kg
Parameters Plasma Brain
Tmax (min) 30 120
Cmax (ng/mL) 4333 ± 4.6 377 ± 4.8
AUC 0-480 (ng x min/mL) 986,666.5 125,043.2
T ½ (min) 140 131
Values are expressed as mean ± %RSD, n=3
109
Data on brain-to-plasma distribution of TIG are still scarce and only a few studies have
evaluated penetration of TIG into tissues and CSF. Drug distribution into the brain is regulated
by many processes, including plasma pharmacokinetics, plasma protein binding, passive and
active transport across the blood-brain barrier. Once the drug penetrates into the brain, bulk-
flow, diffusion, passive and active extra-intracellular exchange take control of its distribution.
However, Westerhout questioned the usefulness of CSF concentrations as a predictor of brain
target site concentrations [18]. The study concluded that CSF is only a fluid produced by the
choroid plexus hence it is not an accurate measure of the actual amount that enters the brain.
We believe that our study is the first to show the quantification of TIG in brain tissue using
LC-MS/MS technique. The data we have acquired show moderate concentrations of the drug
in the brain which are above most proposed MIC values [15]. Therefore TIG can be considered
as a potential neuroprotective agent which has an added advantage of overcoming multi-drug
resistance. However, other studies suggest that inflamed meninges may facilitate penetration
of the drug to the brain [12, 14]. Rodvold et al. were the first to describe CSF penetration of
TIG and they discuss that multiple doses may be needed to allow adequate accumulation of
TIG into bone and tissue [11, 36]. Recently another study proposed increased dosages of TIG
for severe infections due to multidrug-resistant bacteria [37]. They concluded that TIG was
tolerated at a higher than standard dose and therefore further trials with higher and multiple
doses in an infected model may enable sufficient accumulation of this molecule in the brain.
Since drug formulation is a vital factor for delivery into the brain, future studies may also
consider encapsulating the drug into nasal spray or nanoparticles and use this validated method
to study the pharmacokinetic parameters.
HPLC has been extensively used for the estimation of TIG in biological samples [11, 13, 24,
36]. However, relatively few parameters such as mobile phase composition, analysis time,
reproducibility, detection limit and obtaining a suitable IS have been reported, making it
difficult for these few methods to be used for widespread applications [24]. Although there is
a lot of literature reporting sample clean up prior to LC-MS/MS analysis, a few publications
provide the necessary details [29]. In our study, a clear comparison between two types of SPE
cartridges (as illustrated in Table S1), a detailed protein precipitation and SPE extraction
method for lipid preparation from brain tissue samples has been described. Comparing our
chromatographic methods with that of Hoffmann et. al which resulted in a total run of 60 min,
our gradient elution was delivered for 25 min, using a new composition of the mobile phase
[8]. Precision and accuracy for all analyses were within the acceptable limits, which is in

110
agreement with reported literature and the validation guidelines, hence making this method
more suitable to measure TIG in brain.
Conclusion
An accurate HPLC-MS/MS method was optimized and validated for the determination of TIG
in rat plasma and brain tissues. Efficient sample preparation was performed for both matrices
as observed from the mean recoveries of above 82% in all analyses. The procedure was
successfully applied to investigate a single dose pharmacokinetic study in female rats. The
results in this study showed that the assay is highly reproducible and can be used for
pharmacokinetic investigations in further clinical studies. The LC-MS/MS assay reported in
this work is the first quantitative method for determination of TIG in rat brain tissues.
However, moderate amounts of this glycylcycline accumulated in the brain compared to the
tetracycline family of drugs. Based on the reported data, this method has potential for several
pharmacological applications and can be adapted to brain and other tissue concentration
measurements of various new derivatives in the tetracycline family.
Acknowledgements The authors wish to thank National Research Foundation (NRF, SA) and the University of
KwaZulu-Natal (Durban, SA), for financial support.
111
References
1. Oliphant, C.M. and K. Eroschenko, Antibiotic Resistance, Part 1: Gram-positive Pathogens. The Journal for Nurse Practitioners, 2015. 11(1): p. 70-78. 2. Oliphant, C.M. and K. Eroschenko, Antibiotic Resistance, Part 2: Gram-negative
Pathogens. The Journal for Nurse Practitioners, 2015. 11(1): p. 79-86. 3. Shah, S., G. Barton, and A. Fischer, Pharmacokinetic considerations and dosing
strategies of antibiotics in the critically ill patient. Journal of the Intensive Care Society, 2015: p. 1751143714564816.
4. Roberts, J.A., et al., Antibiotic resistance—What’s dosing got to do with it? Critical care medicine, 2008. 36(8): p. 2433-2440.
5. Blair, J.M., et al., Molecular mechanisms of antibiotic resistance. Nature Reviews Microbiology, 2015. 13(1): p. 42-51.
6. Shaikh, S., et al., Antibiotic resistance and extended spectrum beta-lactamases: Types, epidemiology and treatment. Saudi journal of biological sciences, 2015. 22(1): p. 90-101.
7. Livermore, D.M., Tigecycline: what is it, and where should it be used? Journal of Antimicrobial Chemotherapy, 2005. 56(4): p. 611-614.
8. Hoffmann, M., et al., Metabolism, excretion, and pharmacokinetics of [14C] tigecycline, a first-in-class glycylcycline antibiotic, after intravenous infusion to healthy male subjects. Drug Metabolism and Disposition, 2007. 35(9): p. 1543-1553.
9. Peterson, L.R., A review of tigecycline — the first glycylcycline. International Journal of Antimicrobial Agents, 2008. 32, Supplement 4(0): p. S215-S222.
10. Bradford, P.A., D.T.W. Sands, and P.J. Petersen, In vitro activity of tigecycline against isolates from patients enrolled in phase 3 clinical trials of treatment for complicated skin and skin-structure infections and complicated intra-abdominal infections. Clinical infectious diseases, 2005. 41(Supplement 5): p. S315-S332.
11. Rodvold, K.A., et al., Serum, tissue and body fluid concentrations of tigecycline after a single 100 mg dose. Journal of Antimicrobial Chemotherapy, 2006. 58(6): p. 1221-1229.
12. Lengerke, C., et al., Low tigecycline concentrations in the cerebrospinal fluid of a neutropenic patient with inflamed meninges. Antimicrobial agents and chemotherapy, 2011. 55(1): p. 449-450.
13. Pallotto, C., et al., Cerebrospinal fluid penetration of tigecycline. Scandinavian journal of infectious diseases, 2014. 46(1): p. 69-72.
14. Nau, R., F. Sörgel, and H. Eiffert, Penetration of drugs through the blood-cerebrospinal fluid/blood-brain barrier for treatment of central nervous system infections. Clinical microbiology reviews, 2010. 23(4): p. 858-883.
15. Pankey, G.A. and D.S. Ashcraft, In vitro antibacterial activity of tigecycline against resistant Gram-negative bacilli and enterococci by time–kill assay. Diagnostic microbiology and infectious disease, 2009. 64(3): p. 300-304.
16. Ray, L., et al., Cerebral spinal fluid penetration of tigecycline in a patient with Acinetobacter baumannii cerebritis. Annals of Pharmacotherapy, 2010. 44(3): p. 582-586.
17. Dandache, P., D.P. Nicolau, and G. Sakoulas, Tigecycline for the treatment of multidrug-resistant Klebsiella pneumoniae meningitis. Infectious Diseases in Clinical Practice, 2009. 17(1): p. 66-68.
18. Westerhout, J., Prediction of brain target site concentrations on the basis of CSF PK: impact of mechanisms of blood-to-brain transport and within brain distribution, in
112
Faculty of Science. 2014, Division of Pharmacology of the Leiden Academic Centre for Drug Research (LACDR), Faculty of Science, Leiden University: Netherlands.
19. Adembri, C., et al., Minocycline But Not Tigecycline Is Neuroprotective and Reduces the Neuroinflammatory Response Induced by the Superimposition of Sepsis Upon Traumatic Brain Injury. Critical care medicine, 2014. 42(8): p. e570-e582.
20. Jayewardene, A.L., et al., An LC-MS-MS method for the determination of indinavir, an HIV-1 protease inhibitor, in human plasma. Journal of pharmaceutical and biomedical analysis, 2001. 25(2): p. 309-317.
21. Korfmacher, W.A., Foundation review: Principles and applications of LC-MS in new drug discovery. Drug discovery today, 2005. 10(20): p. 1357-1367.
22. Jung, B.H., et al., Simultaneous determination of 17 antiretroviral drugs in human plasma for quantitative analysis with liquid chromatography–tandem mass spectrometry. Biomedical Chromatography, 2007. 21(10): p. 1095-1104.
23. Pitt, J.J., Principles and applications of liquid chromatography-mass spectrometry in clinical biochemistry. The Clinical Biochemist Reviews, 2009. 30(1): p. 19.
24. Xie, J., et al., Quantitative analysis and pharmacokinetics study of tigecycline in human serum using a validated sensitive liquid chromatography with tandem mass spectrometry method. Journal of separation science, 2014. 37(12): p. 1396-1403.
25. Bratkowska, D., et al., Determination of the antitubercular drug PA-824 in rat plasma, lung and brain tissues by liquid chromatography tandem mass spectrometry: Application to a pharmacokinetic study. Journal of Chromatography B, 2015. 988: p. 187-194.
26. Agency, E.M.A.E.M., C.H.M.P. Committee for Medicinal Products for Human Use. european medicines agency, 2011.
27. Colovic, M. and S. Caccia, Liquid chromatographic determination of minocycline in brain-to-plasma distribution studies in the rat. Journal of Chromatography B, 2003. 791(1): p. 337-343.
28. Kole, P.L., et al., Recent advances in sample preparation techniques for effective bioanalytical methods. Biomedical Chromatography, 2011. 25(1-2): p. 199-217.
29. Pena, A., et al., Determination of tetracycline antibiotic residues in edible swine tissues by liquid chromatography with spectrofluorometric detection and confirmation by mass spectrometry. Journal of agricultural and food chemistry, 2007. 55(13): p. 4973-4979.
30. Zhu, J., et al., Analysis of oxytetracycline, tetracycline, and chlortetracycline in water using solid-phase extraction and liquid chromatography–tandem mass spectrometry. Journal of Chromatography A, 2001. 928(2): p. 177-186.
31. Law, B. and S. Weir, Fundamental studies in reversed-phase liquid—solid extraction of basic drugs; II: Hydrogen bonding effects. Journal of pharmaceutical and biomedical analysis, 1992. 10(2): p. 181-186.
32. Bylda, C., et al., Recent advances in sample preparation techniques to overcome difficulties encountered during quantitative analysis of small molecules from biofluids using LC-MS/MS. Analyst, 2014. 139(10): p. 2265-2276.
33. Goessens, W.H., et al., The Therapeutic Effect of Tigecycline, Unlike That of Ceftazidime, Is Not Influenced by whether the Klebsiella pneumoniae Strain Produces Extended-Spectrum β-Lactamases in Experimental Pneumonia in Rats. Antimicrobial agents and chemotherapy, 2013. 57(1): p. 643-646.
34. Muralidharan, G., et al., Pharmacokinetics of tigecycline after single and multiple doses in healthy subjects. Antimicrobial agents and chemotherapy, 2005. 49(1): p. 220-229.
35. Agwuh, K.N. and A. MacGowan, Pharmacokinetics and pharmacodynamics of the tetracyclines including glycylcyclines. Journal of Antimicrobial Chemotherapy, 2006. 58(2): p. 256-265.

113
36. Ji, A.J., et al., A novel antibiotic bone assay by liquid chromatography/tandem mass spectrometry for quantitation of tigecycline in rat bone. Journal of pharmaceutical and biomedical analysis, 2007. 44(4): p. 970-979.
37. De Pascale, G., et al., High dose tigecycline in critically ill patients with severe infections due to multidrug-resistant bacteria. Critical Care, 2014. 18: p. R90.
114
Chapter 7 – Paper 6
Rapid and Widespread Distribution of Doxycycline in Rat Brain: A Mass Spectrometric Imaging Study
Chiedza F. Munyezaa, Adeola Shoboa, Sooraj Baijnatha, Dominika Bratkowskaa, Suhashni
Naikera, Linda A. Besterb, Sanil D. Singhb, Glenn E. M. Maguirec, Hendrik G. Krugera, Tricia
Naickera, Thavendran Govendera*
a School of Pharmacy and Pharmacology, University of KwaZulu-Natal, Westville Campus,
Durban 4000, South Africa.
*E-mail: [email protected]
Phone number: +27 732625616
b Biomedical Resource Unit, University of KwaZulu-Natal, Westville Campus, Durban 4000,
South Africa.
c School of Chemistry and Physics, University of KwaZulu-Natal, Westville Campus, Durban
4000, South Africa.
Keywords: Mass spectrometric imaging; Doxycycline; rat brain tissues

115
Abstract
1. The penetration of tetracyclines into the brain has been widely documented. The aim
of this work was to develop a matrix assisted laser desorption ionization-mass
spectrometry imaging (MALDI MSI) method for molecular histology of doxycycline
(DOX) in the healthy rat brain.
2. The time dependent distribution was investigated after an i.p. dose of 25mg/kg at 0, 5,
30, 120, 240, 360 and 480 min post dose. LC-MS/MS was used to quantify the drug in
plasma and brain homogenates and MALDI MSI was used to determine the distribution
of the analyte.
3. Within the first hour post dose, the drug showed slow accumulation into the plasma and
brain tissues. DOX brain concentration gradually increased and reached a peak (Cmax)
of 1034.9ng/mL at 240 min post dose, resulting in a brain plasma ratio of 31%. The
images acquired by MSI matched the quantification results and clearly showed drug
distribution over the entire rat brain coronal section from 5 min and its slow elimination
after 360 min post dose.
4. Our findings confirm that MALDI MSI provides an advanced, label free and faster
alternative technique for xenobiotic distribution such as DOX in tissues, making it an
essential drug discovery tool for other possible neuroprotective agents.

116
Introduction
Studies in the early 1990s showed that tetracyclines display neuro-protective properties in
rodent models of chronic and acute neurodegeneration [1-3]. These findings resulted in an
explosion of similar projects showing that tetracyclines, especially the semi-synthetic
minocycline and DOX, easily cross the blood-brain barrier and hold great potential as
therapeutic agents for the treatment of bacterial meningitis [4-7]. Both neurological and
pharmaceutical research requires an understanding of the complex biochemistry of these drugs
and their interactions in the brain and other tissues at a molecular level. In the clinical history
of drug development, several labelled procedures such as basic immunohistochemistry (IHC),
positron emission tomography (PET), computerized tomography (CT), magnetic resonance
imaging (MRI) and whole body autoradiography (WBA) have been used to give detailed
molecular imaging of biological tissues [8-10].
Basic histological techniques, IHC, MRI and spatial frequency domain imaging (SFDI) have
been used in previous studies demonstrating the neuroprotective effects of DOX [7, 11-14].
Linderberg et al. investigated the effect of pre- and post-natal administration of DOX on
neuronal recombination. They found that varying time points of administration yielded
different recombination patterns as evidenced by a nuclear fast red stain [13]. In a separate
study, Jantzie et al. showed the putative neuroprotective effects of DOX on hypoxia ischemia
(HI) using an immunostaining approach [15]. Their work showed that the drug significantly
decreased caspase-3 immunoreactivity, promoted neuronal survival, inhibited microglial
activation and reduced reactive astrocytosis in vulnerable brain regions which included the
hippocampal formation, thalamus, striatum, cerebral cortex and white matter tracts [15]. The
same research team also used fluoro-jade staining to prove that DOX reduces amino acid levels
in rat pups when they investigated the effect of drug administration on amino acid and
neurotransmitter levels [6]. A recent study has used SFDI to detect blood perfusion and
changes in brain cellular composition by measuring the amount of light reflected by the tissue
and reduced scattering coefficients. Immunohistochemical methods were employed to
determine if removal of DOX from the diet in mice would result in expected trends such as a
decrease in neuronal cells and an increase in inflammatory microglia and astrocytes. Removal
of the drug was associated with progressive loss in forebrain neurons and structural changes in
117
the cortex were quantified by comparing the average optical density of the neuronal staining in
the cortex [14].
Biological, fluorometric and high performance liquid chromatography (HPLC) assays have
also been described for the determination of DOX concentration in standard solutions, body
fluids and tissues [16]. During the past decade, highly significant technological advancements
in mass spectrometry have resulted in great advancements in drug discovery, development and
analysis [17, 18]. We are currently interested in developing new mass spectrometric methods
and alternative imaging techniques to study the neuroprotective potential of antibiotics and
their time dependent penetration and distribution in brain tissues [19-21]. Today, MALDI MSI
is an imaging technique which has gained more attention and is frequently being used in the
drug development industry as a result of its fast, label-free approach [22-25]. The aim of the
present study was to develop an MSI method as an alternative for molecular histology of DOX
by investigating its time dependent penetration and distribution in the brain of healthy rats.
Materials and methods
Chemicals and reagents
DOX and the internal standard (IS) minocycline were purchased from DLD Scientific,
(Durban, South Africa). Acetonitrile (ACN), formic acid, trifluoroacetic acid (TFA) and
methanol were of analytical grade all from Sigma–Aldrich (Munich, Germany). Ultra-pure
water was obtained using a Milli-Q purification system from Millipore Corporation (Bedford,
MA, USA).
Drug Administration and tissue sampling
All animal experiments were undertaken with the approval of the Institutional Animal Ethical
Committee of University of KwaZulu-Natal (UKZN), (Approval Reference: 001/15/Animal)
Durban, South Africa. Female Sprague Dawley rats (weight 115 ± 20 g) were purchased from
the Biomedical Resource Unit (BRU) at UKZN. Animals were housed under standard
conditions of temperature, humidity and 12 h light/dark cycle with food and water provided ad
libitum and allowed to acclimatize in the laboratory for one week prior to experiment. Seven
groups of female Sprague Dawley rats (n = 3) were administered an i.p. dose (25mg/kg) DOX
dissolved in a 10% DMSO aqueous solution. The i.p. doses were chosen based on doses used
in a previous study of the tetracyclines in brain-to-plasma distribution studies in the rat [26].
Animals were anaesthetized with halothane before blood and tissue collection. Blood samples
118
were collected by cardiac puncture into heparinized tubes at 0, 5, 30, 120, 240, 360 and 480
min after the i.p. dose. All blood and tissue samples were handled as described in Shobo et al.
[20]. Blood samples were immediately centrifuged at 3500 rpm for 10 min and aliquots of
plasma (1.5 mL) immediately stored at -80 °C prior to analysis. Brains were gently frozen in
liquid nitrogen vapor before storage in labeled freezer bags at -80 oC.
Quantification in biological samples
LC-MS/MS Chromatographic conditions
Identification and determination of DOX and minocycline was performed using an HPLC
Agilent Series 1100, with an online degasser, gradient pump and an autosampler coupled to a
time-of-flight mass spectrometer analyzer (MicrOTOF-Q II, Bruker, Germany). For each
analysis, 3 µL of sample solution was injected by an autosampler. The analytical column was
a 150 mm × 3.0 mm 3 µm i.d stainless-steel column YMC Triart C18, from YMC Europe Gmbh
(Dislanken, Germany). The mobile phase was prepared from Millipore water (0.1% v/v formic
acid) (A) and 1:3 MeOH: ACN (0.1% v/v formic acid) (B). The flow rate was 0.4 mL min-1
and the temperature of the column oven was set at 25 ºC. The gradient profile was developed
from 5% to 95% ACN in 15 min, (held 5 min), after which time the mobile phase was returned
to (5% ACN) in 5 min.
Mass spectrometry analysis
Electrospray ionisation (ESI) was used in all analyses. The optimized conditions were as
follows: nebulizer pressure: 1.5 bar, dry gas: 8.0 L/min and temperature of dry gas: 200 ºC.
The profile spectra were acquired in positive mode in the mass range of m/z 150-1600 with
mass resolving power over 16000. Data were processed by Data Analysis software (Bruker,
Germany) and extracted ion chromatograms of all analytes were plotted. Electrospray
ionization time-of-flight mass spectrometry (ESI-TOF-MS) parameters were optimized using
a single variable procedure for all tested parameters of ESI source and mass spectrometer. The
best chromatographic conditions were obtained by testing different mobile phases consisting
of acetonitrile-water and methanol-water in order to provide adequate selectivity in a
reasonably short separation time. Modifiers such as ammonium formate, TFA and acetic acid
were tested. Due to its high miscibility with organic solvents, formic acid was selected and
this resulted in improved peak symmetry and ionization efficiency for DOX and IS.
119
The protonated molecular ions, [M+H]+, of DOX and IS observed in full-scan mass spectra
were m/z 445.2 and 458.2 respectively. For MS/MS precursor selection the two most intense
ions were isolated. The mass spectrometer was operated in positive ion mode using MRM
mode to monitor the mass transitions. A set of precursor ion or product pairs was selected and
monitored in this method. To quantify the analyte, its most intense transition was chosen. As
reported in literature, the MS/MS transitions m/z 445.2→ 428.1 and m/z 458.2 → 441.2 were
also selected for this analytical assay for DOX and IS respectively [27, 28]. The coupling of
LC with MS/MS detection whilst monitoring a set of precursor ions/ product pairs resulted in
high selectivity because only the ions derived from the analytes of interest were monitored.
Recovery was given as a percentage of the known amount of an analyte carried through the
sample extraction and processing steps of the method. Matrix effects was determined by using
a calculated ratio of the peak area in the presence of matrix (measured by analyzing blank
matrix spiked after extraction with analyte), to the peak area in absence of matrix (pure solution
of the analyte) expressed as a percentage.
MALDI-MSI
Sample preparation
Optimal cutting temperature (OCT) was used as a medium to mount the tissue onto the chuck
of the cryostat and serial sections (10 µm thick) were obtained from each biopsy and thaw
mounted onto an indium titanium oxide (ITO) coated glass slide (Bruker, Bremen, Germany)
with the aid of a cryostat (Leica Microsystems CM1100, Wetzlar, Germany) and stored at −80
°C until needed for analysis. Glass slides were removed from cryostat and immediately
transferred to a desiccator for drying. Following overnight desiccation time, the slides were
scanned using a flatbed scanner (HP LaserJet 3055). Matrix preparation was achieved by using
7 mg/mL α-cyano-4-hydroxy cinnamic acid (CHCA) (Bruker, Bremen, Germany) matrix
solution in 50% ACN containing 0.2% TFA. The matrix solution was sonicated for 5 min and
transferred to the ImagePrep (Bruker Daltonics), which automatically and consistently deposits
matrix onto the slide under controlled conditions. The total thickness of matrix layer deposited
on all slides determined by the optical sensor was 1.5 V. The pre-developed Image prep
method which had 5 phases all included spraying, incubation and drying times respectively.
120
Image Acquisition
All experimental methods were developed according to the guidelines for mass spectrometry
imaging [29]. Reflectron and LIFT modes for MALDI TOF MS operation, with the aid of
Autoflex III MALDI TOF/TOF 1 KHz smartbeam laser (Bruker Daltonics, Germany) and data
acquired using FlexControl (version 3.4, build 119) software in positive ion mode. Calibration
of the instrument was done using DOX with CHCA as the matrix on the ground steel target
(Bruker Daltonics, Germany) for m/z 200–600. Spatial resolution from 100 µm was used for
the MALDI imaging of the tissue sections and the images were analyzed using the software
FlexImaging 3.0 (Bruker Daltonics, Germany). Spotting various concentrations (10, 100, 200
and 300 ng/mL respectively) of DOX with the matrix onto a brain section of an untreated
animal was used to evaluate background signals that may interfere with the analyte and to
determine a limit of detection. The spots were analyzed in reflectron mode by collecting 200
shots per spot and spectra collected. To perform the MS/MS experiments, a LIFT method was
optimized for the drug by specific tuning of the timing of the LIFT cell and of the parent ion
selector.
Using the same method, MS/MS was performed directly on DOX-matrix spotted tissue section
and spectra were compared to the MS/MS spectra generated from that of the drug standard
only. For the initial analysis of the manually deposited spots, spectra consisting of 1000 laser
shots were acquired in bundles of 5 x 200 shots and data was collected in the range between
m/z 200–600 with a laser frequency of 200 Hz, mass window range of 2 Da and the
digitalization rate was 2 GS/s. Laser power of 60% was used and an increase in the laser power
led to production of other product ions but with less sensitivity. The software Flex Imaging
3.0 build 54 was used to set up the acquisition of the imaging experiments. Using the same
m/z range given above, MS imaging experiments were performed by collecting spectra with a
raster width of 100 µm. The spectra were baseline subtracted (Convex hull) and smoothed
(Savitzski golay) in the processing software during acquisition. In LIFT mode, all spectra were
normalized against total ion count (TIC) to reduce influences by matrix hot spots. We define
the total ion count as the sum of all intensities in the mass range analyzed. For this analysis,
both fragment and parent spectra were acquired from each spot and 500 laser shots were
summed up in a random walk pattern from each position.
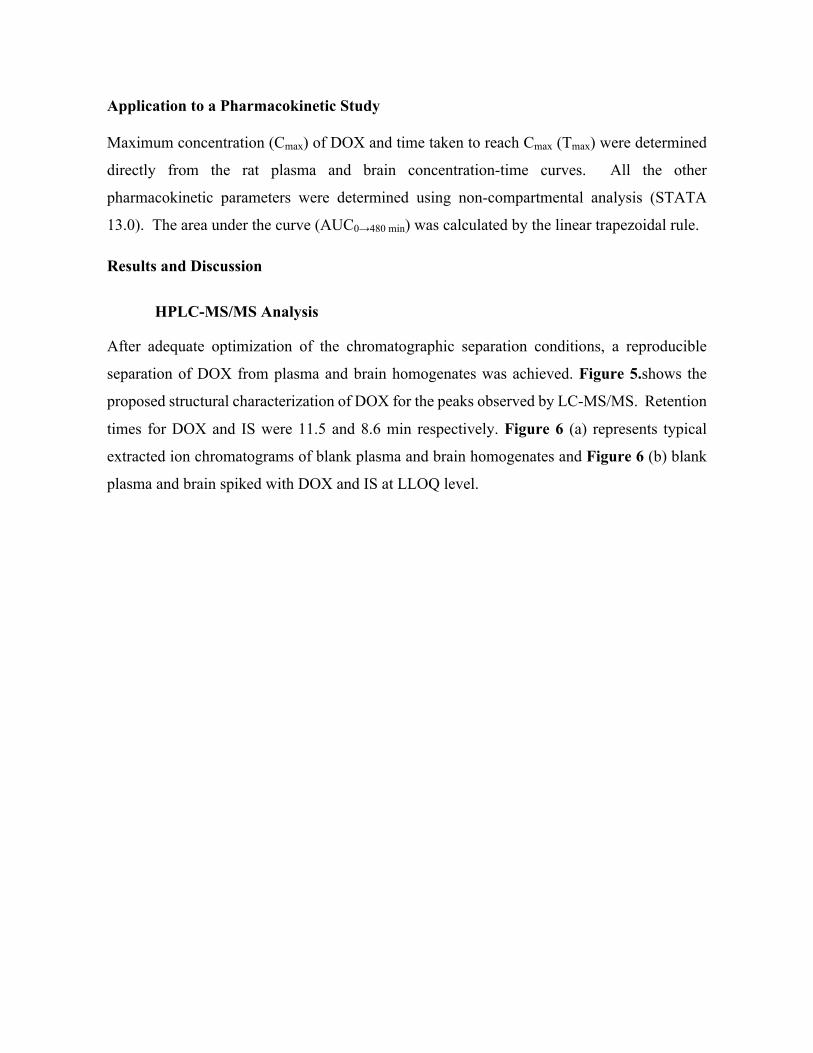
121
Application to a Pharmacokinetic Study Maximum concentration (Cmax) of DOX and time taken to reach Cmax (Tmax) were determined
directly from the rat plasma and brain concentration-time curves. All the other
pharmacokinetic parameters were determined using non-compartmental analysis (STATA
13.0). The area under the curve (AUC0→480 min) was calculated by the linear trapezoidal rule.
Results and Discussion
HPLC-MS/MS Analysis
After adequate optimization of the chromatographic separation conditions, a reproducible
separation of DOX from plasma and brain homogenates was achieved. Figure 5.shows the
proposed structural characterization of DOX for the peaks observed by LC-MS/MS. Retention
times for DOX and IS were 11.5 and 8.6 min respectively. Figure 6 (a) represents typical
extracted ion chromatograms of blank plasma and brain homogenates and Figure 6 (b) blank
plasma and brain spiked with DOX and IS at LLOQ level.
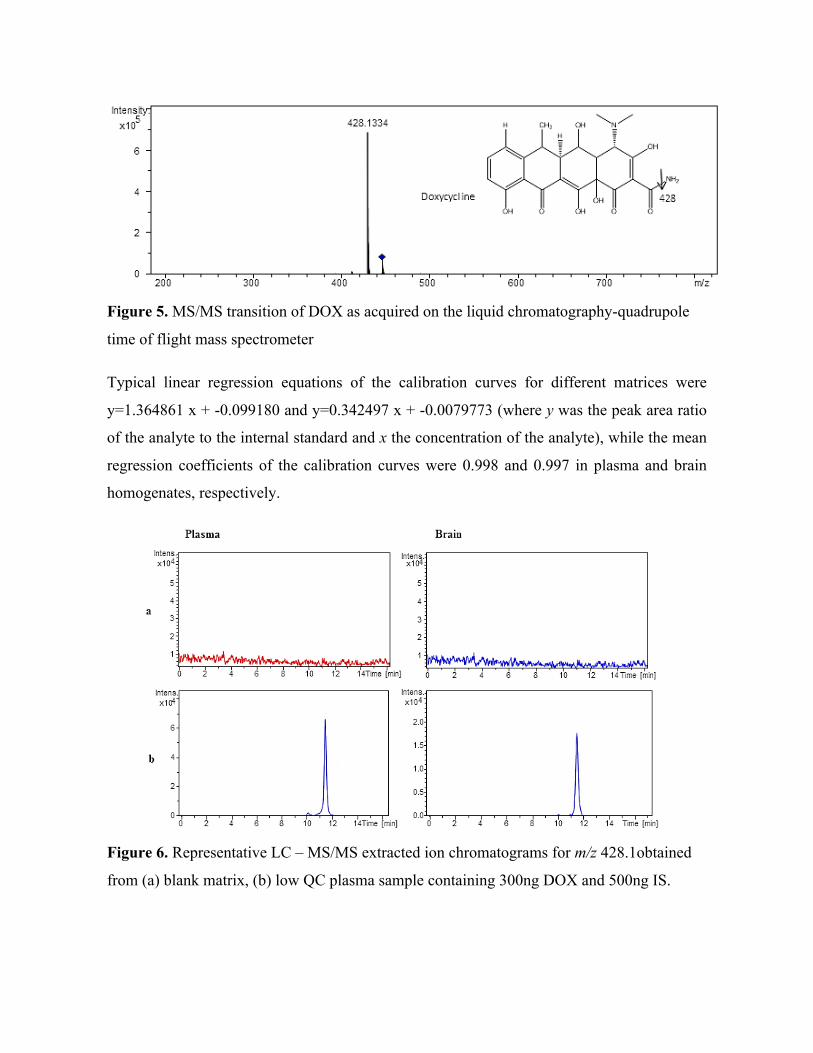
122
Figure 5. MS/MS transition of DOX as acquired on the liquid chromatography-quadrupole
time of flight mass spectrometer
Typical linear regression equations of the calibration curves for different matrices were
y=1.364861 x + -0.099180 and y=0.342497 x + -0.0079773 (where y was the peak area ratio
of the analyte to the internal standard and x the concentration of the analyte), while the mean
regression coefficients of the calibration curves were 0.998 and 0.997 in plasma and brain
homogenates, respectively.
Figure 6. Representative LC – MS/MS extracted ion chromatograms for m/z 428.1obtained
from (a) blank matrix, (b) low QC plasma sample containing 300ng DOX and 500ng IS.
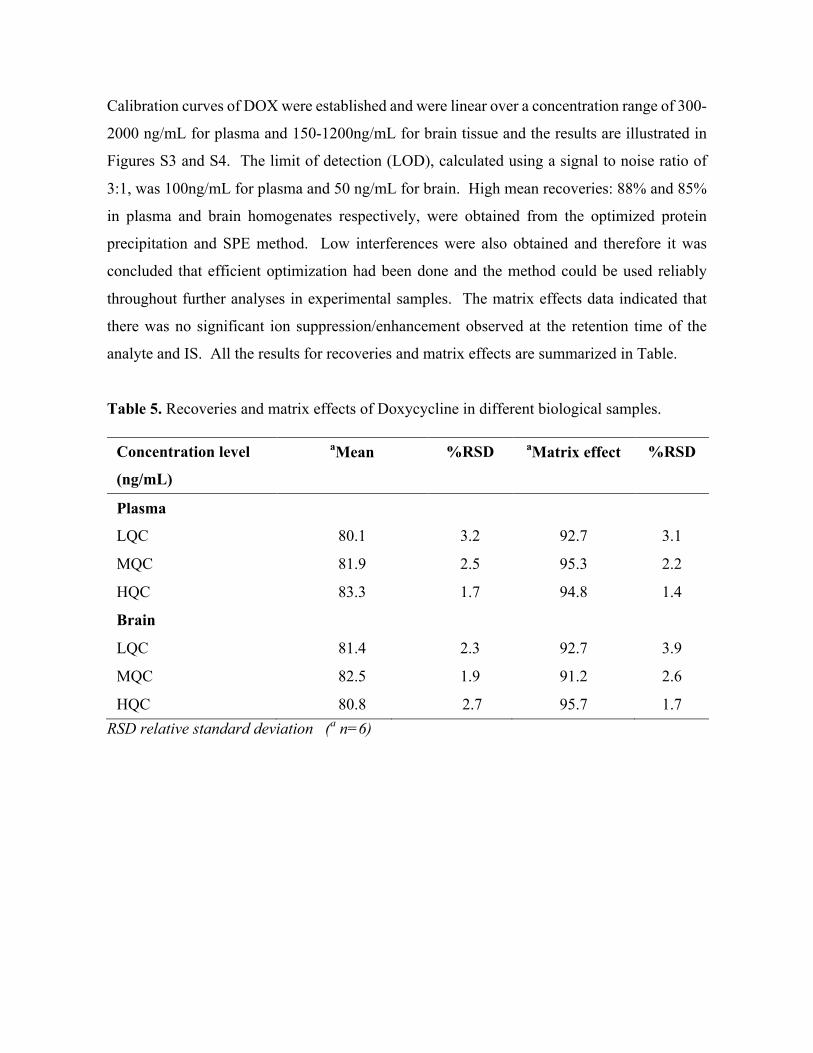
123
Calibration curves of DOX were established and were linear over a concentration range of 300-
2000 ng/mL for plasma and 150-1200ng/mL for brain tissue and the results are illustrated in
Figures S3 and S4. The limit of detection (LOD), calculated using a signal to noise ratio of
3:1, was 100ng/mL for plasma and 50 ng/mL for brain. High mean recoveries: 88% and 85%
in plasma and brain homogenates respectively, were obtained from the optimized protein
precipitation and SPE method. Low interferences were also obtained and therefore it was
concluded that efficient optimization had been done and the method could be used reliably
throughout further analyses in experimental samples. The matrix effects data indicated that
there was no significant ion suppression/enhancement observed at the retention time of the
analyte and IS. All the results for recoveries and matrix effects are summarized in Table.
Table 5. Recoveries and matrix effects of Doxycycline in different biological samples.
Concentration level aMean
recovery(%)
%RSD aMatrix effect
(%)
%RSD
(ng/mL)
Plasma
LQC
ISII
80.1 3.2 92.7 3.1
MQC 81.9 2.5 95.3 2.2
HQC 83.3 1.7 94.8 1.4
Brain
LQC 81.4 2.3 92.7 3.9
MQC 82.5 1.9 91.2 2.6
HQC 80.8 2.7 95.7 1.7 RSD relative standard deviation (a n=6)
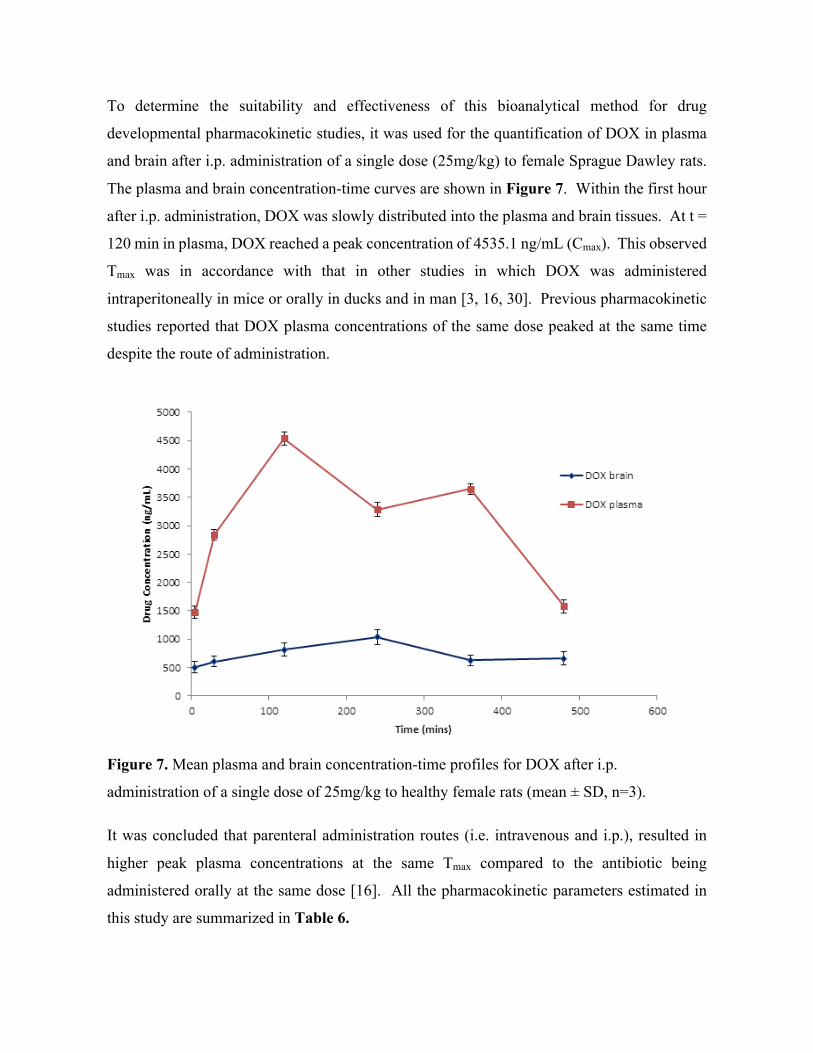
124
To determine the suitability and effectiveness of this bioanalytical method for drug
developmental pharmacokinetic studies, it was used for the quantification of DOX in plasma
and brain after i.p. administration of a single dose (25mg/kg) to female Sprague Dawley rats.
The plasma and brain concentration-time curves are shown in Figure 7. Within the first hour
after i.p. administration, DOX was slowly distributed into the plasma and brain tissues. At t =
120 min in plasma, DOX reached a peak concentration of 4535.1 ng/mL (Cmax). This observed
Tmax was in accordance with that in other studies in which DOX was administered
intraperitoneally in mice or orally in ducks and in man [3, 16, 30]. Previous pharmacokinetic
studies reported that DOX plasma concentrations of the same dose peaked at the same time
despite the route of administration.
Figure 7. Mean plasma and brain concentration-time profiles for DOX after i.p.
administration of a single dose of 25mg/kg to healthy female rats (mean ± SD, n=3).
It was concluded that parenteral administration routes (i.e. intravenous and i.p.), resulted in
higher peak plasma concentrations at the same Tmax compared to the antibiotic being
administered orally at the same dose [16]. All the pharmacokinetic parameters estimated in
this study are summarized in Table 6.

125
Table 6. Pharmacokinetic data of DOX after i.p. administration of 25 mg/kg
Parameters Plasma Brain
Tmax (min) 120 240
Cmax (ng/mL) 4535.1 ± 5.3 1034.9 ± 8.7
AUC 0-480 (ng x min/mL) 1 581 371.0 370 186.2
Values are expressed as mean ± SD, n=3
The plasma curve displayed a double-peak phenomenon, which is a common characteristic of
DOX and was also reported in fish, pigs, sheep and humans, with enterohepatic recirculation
being the reason for the second peak in the concentration vs time curve [30-32]. Fagan et al.
also reported a double peak phenomenon for i.p. administration of a similar tetracycline,
minocycline, in which the drug was erratically absorbed and deposited in the peritoneal cavity
[3]. Once the antibiotic is in the peritoneal cavity, it acts as ‘depot’ injection, slowly releasing
the drug into the circulation system, usually peaking around 240 min after administration,
which explains the second peak in our plasma concentration time curve [3].
Brain Distribution Studies
DOX brain concentrations rose gradually and reached a peak level (Cmax) of 1034.9ng/mL at a
Tmax of 240 min after i.p. administration, resulting in approximately 31% of the plasma
concentrations. This was in close agreement with the preliminary studies by Colovic and
Caccia which reported a DOX mean brain-plasma ratio of 0.31 at t = 240 min after 25mg/kg
intravenous injection [26]. Early studies of DOX pharmacology and toxicology concluded that
peak tissue concentrations were obtained slightly after peak plasma concentrations, within 120
to 240 min post oral or i.p. administration in rats [14, 33]. Once the Cmax was reached, DOX
depletion in the brain tissue was seen from the slow decrease in concentrations after 240 min
as shown on the concentration time curve. The mean brain-plasma ratio, in terms of area under
the curve (AUC 0-480min), was 0.24, which implied that approximately a quarter of the total drug
concentration in plasma managed to cross the blood-brain barrier and entered the brain. This
result can also be explained by the fact that free DOX makes up only a small fraction of the
total drug amount in the body due to the drug’s high lipophilicity and high protein binding
126
capacity (82-93%) [16, 34]. The levels of DOX reported in our rat brain quantification assay
were closely related to the findings in a previous study which reported mean drug levels of
867.1 ng/mL in brain tissue after a single 10mg/kg i.p. administration of DOX [6]. However,
our data reported a higher mean Cmax, which could be attributed to the higher dose and a more
sensitive MS detection in our current study as compared to UV. Based on previous dose-
response studies performed by Jantzie et al., DOX reached a therapeutic dose when 10 mg/kg
of the drug was administered intraperitoneally [15]. Although DOX has been reported to have
higher minimum inhibitory concentrations (MICs) [35], our quantification data reported a
mean Cmax which is above the MICs of most common bacteria which might cause meningeal
infections [36].

127
MALDI-MS Imaging
Figure 8. Typical spectrum of DOX parent and fragments, during the acquisition of data on
the spotted rat brain section using the LIFT mode in the MALDI-MSI technique
After method optimization of the MALDI-MSI experiment for DOX, reproducible analyses
were obtained from the spotted tissue. The DOX parent ion of m/z 445.4 and fragment with
m/z 428.1 were used to visualize the distribution of the drug in the brain sections in triplicate
on each slide. This transition was chosen for the MSI assay because during the method
development and optimization in the LIFT mode, the m/z 428 had the highest intensity (as
shown in Figure 8). The same transition was used in our LC-MS/MS quantification study and
in literature [27, 28]. An increase in the laser power led to production of other product ions
but with lower sensitivity. The result of the limit of detection which was calculated using a
signal to noise ratio of ≥3 reported a value of 100 ng/mL (as shown in Figure 9).
The images showed widespread distribution of DOX in the entire rat brain, with the highest
concentration in the cerebral cortex (as shown in Figure 9). The antibiotic was readily detected
at 5 min after administration as indicated by the high colour intensities observed in the brain
sections, mainly in the cortex and hippocampal formation. The intensity increased with time,
which showed the penetration and accumulation of the drug into the brain. This trend was also
observed when analysing the LC-MS/MS quantification data in the brain.

128
Figure 9. Haemotoxylin and Eosin (H and E) stain (top left) and spots of standard solutions
(10, 100, 200, and 300 ng/mL) of DOX with the matrix on a brain section for the
determination of limit of detection (top right).
Coronal brain images displayed were acquired from 0 min to 480 min after intraperitoneal
administration of DOX (25mg/kg) to rats, using LIFT mode with both parent and fragments
simultaneously (data represents mean values, n=3). Mass filter applied was m/z 428 ± 0.1%
represented by the rainbow colour scale bar, these data represents mean ± standard deviation
(SD). Images 5 to 240 min displayed entry and distribution of DOX into the coronal (C) and
hippocampal (H)section of the rat brain and 360 to 480 min the gradual elimination of the drug
from the tissues. C = Cortex, H = Hippocampal formation.
129
At 360 min the highest intensity can be observed in the peripheral cortex, which suggested that
the drug was slowly beginning to localize in the cortical region. The designed MSI technique
allowed us to track the distribution of DOX in cerebral tissue over time after i.p. administration.
Significant elimination of the drug was only seen in the images of the brain tissue sections from
360 to 480 min, which indicated that the drug persisted in the tissue over significant time before
it was eliminated. This was expected and was consistent with other studies which reported that
a single injection of this antibiotic had a long half-life of about 12-24 hours [16, 34].
The major findings of MRI and histological studies in which DOX was administered to rats
with induced brain injury reported a higher density and concentration of the drug in areas where
injury was induced, thus the drug significantly reduced brain injury and inhibited neuro-
inflammation [11, 12, 37]. In another study using an immunohistochemistry approach, the
neuroprotective properties of DOX were examined and it was discovered that the drug
localized in the hippocampus, thalamus cerebral cortex, striatum, and subcortical and peri-
ventricular white matter of the brain [15]. These regions constitute a larger area of the brain
and can therefore be correlated with our findings that showed the drug was readily detected in
the entire brain. However these studies do not show the exact location of DOX since they use
the brain injury as a marker for the presence of the drug. This could lead to false conclusions
since it is possible that improvements in injury are caused by the DOX-induced release of
neurotransmitters and other factors which may be responsible for this. The advantage of using
MALDI MSI is that we are able to identify the presence of the drug by looking for parent and
fragment masses, making this a more reliable, sensitive and accurate technique.
130
Conclusion
The MSI technique as a new method for molecular histology was successfully applied for the
investigation of the time dependent penetration and distribution of DOX administered by i.p.
injection in the brain of healthy rats, adding to its success as a neuroprotective agent. The
quantification data and images were in agreement with previous studies, which reported the
neuroprotective properties of DOX. These encouraging results suggest great potential
applicability of the MALDI MSI technique for the direct analysis of tetracyclines, and other
possible neuroprotective agents, making it an essential drug discovery tool with respect to
histology. Using DOX as an example, it is clear that these techniques can be easily optimized
for use and detection of known and developmental drugs.
Acknowledgements The authors wish to thank National Research Foundation (NRF, SA) and the University of
KwaZulu-Natal (Durban, SA), for financial support.
Conflict of Interest The authors declare no conflict of interest.
131
References
1. Clark, W.M., et al., Reduction of central nervous system reperfusion injury in rabbits
using doxycycline treatment. Stroke, 1994. 25(7): p. 1411-1415. 2. Yrjänheikki, J., et al., Tetracyclines inhibit microglial activation and are
neuroprotective in global brain ischemia. Proceedings of the National Academy of Sciences, 1998. 95(26): p. 15769-15774.
3. Fagan, S.C., et al., Optimal delivery of minocycline to the brain: implication for human studies of acute neuroprotection. Experimental neurology, 2004. 186(2): p. 248-251.
4. Uckun, O.M., et al., Neuroprotective effects of tetracyclines on blunt head trauma: An experimental study on rats. Journal of neurosciences in rural practice, 2015. 6(1): p. 27.
5. Adembri, C., et al., Minocycline But Not Tigecycline Is Neuroprotective and Reduces the Neuroinflammatory Response Induced by the Superimposition of Sepsis Upon Traumatic Brain Injury. Critical care medicine, 2014. 42(8): p. e570-e582.
6. Jantzie, L.L., G.A. Rauw, and K.G. Todd, The effects of doxycycline administration on amino acid neurotransmitters in an animal model of neonatal hypoxia-ischemia. Neurochemistry international, 2006. 49(8): p. 717-728.
7. Lazzarini, M., et al., Doxycycline restrains glia and confers neuroprotection in a 6-OHDA Parkinson model. Glia, 2013. 61(7): p. 1084-1100.
8. Solon, E.G., et al., Autoradiography, MALDI-MS, and SIMS-MS imaging in pharmaceutical discovery and development. The AAPS journal, 2010. 12(1): p. 11-26.
9. McEwen, A.B., C.M. Henson, and S.G. Wood, Quantitative whole-body autoradiography, LC-MS/MS and MALDI for drug-distribution studies in biological samples: the ultimate matrix trilogy. Bioanalysis, 2014. 6(3): p. 377-391.
10. Végvári, Á. and B. Döme, State-of-the-art MS technology applications in lung disease. Bioanalysis, 2011. 3(23): p. 2665-2677.
11. Meli, D.N., et al., Doxycycline reduces mortality and injury to the brain and cochlea in experimental pneumococcal meningitis. Infection and immunity, 2006. 74(7): p. 3890-3896.
12. Widerøe, M., et al., Doxycycline treatment in a neonatal rat model of hypoxia–ischemia reduces cerebral tissue and white matter injury: a longitudinal magnetic resonance imaging study. European Journal of Neuroscience, 2012. 36(1): p. 2006-2016.
13. Lindeberg, J.o., R. Mattsson, and T. Ebendal, Timing the doxycycline yields different patterns of genomic recombination in brain neurons with a new inducible Cre transgene. Journal of neuroscience research, 2002. 68(2): p. 248-253.
14. Lin, A.J., et al., In vivo optical signatures of neuronal death in a mouse model of Alzheimer's disease. Lasers in surgery and medicine, 2014. 46(1): p. 27-33.
15. Jantzie, L.L., P.-Y. Cheung, and K.G. Todd, Doxycycline reduces cleaved caspase-3 and microglial activation in an animal model of neonatal hypoxia-ischemia. Journal of Cerebral Blood Flow & Metabolism, 2005. 25(3): p. 314-324.
16. Kogawa, A. and H.R.N. Salgado, Doxycycline hyclate: a review of properties, applications and analytical methods. International journal of life science and pharma research, 2012. 2: p. 11-25.
17. Jayewardene, A.L., et al., An LC-MS-MS method for the determination of indinavir, an HIV-1 protease inhibitor, in human plasma. Journal of pharmaceutical and biomedical analysis, 2001. 25(2): p. 309-317.
18. Korfmacher, W.A., Foundation review: Principles and applications of LC-MS in new drug discovery. Drug discovery today, 2005. 10(20): p. 1357-1367.
19. Bratkowska, D., et al., Determination of the antitubercular drug PA-824 in rat plasma, lung and brain tissues by liquid chromatography tandem mass spectrometry:

132
Application to a pharmacokinetic study. Journal of Chromatography B, 2015. 988: p. 187-194.
20. Shobo, A., et al., Visualization of time-dependent distribution of rifampicin in rat brain using MALDI MSI and quantitative LCMS/MS. Assay and drug development technologies, 2015. 13(5): p. 277-284.
21. Shobo, A., et al., Tissue Distribution of Pretomanid in Rat Brain via Mass Spectrometry Imaging. Xenobiotica, 2015.
22. Heeren, R.M., Getting the picture: the coming of age of imaging MS. International Journal of Mass Spectrometry, 2014.
23. Li, F., et al., MALDI-tandem mass spectrometry imaging of astemizole and its primary metabolite in rat brain sections. Bioanalysis, 2009. 1(2): p. 299-307.
24. Goodwin, R.J., et al., Qualitative and quantitative MALDI imaging of the positron emission tomography ligands raclopride (a D2 dopamine antagonist) and SCH 23390 (a D1 dopamine antagonist) in rat brain tissue sections using a solvent-free dry matrix application method. Analytical chemistry, 2011. 83(24): p. 9694-9701.
25. Pirman, D.A., et al., Quantitative MALDI tandem mass spectrometric imaging of cocaine from brain tissue with a deuterated internal standard. Analytical chemistry, 2012. 85(2): p. 1081-1089.
26. Colovic, M. and S. Caccia, Liquid chromatographic determination of minocycline in brain-to-plasma distribution studies in the rat. Journal of Chromatography B, 2003. 791(1): p. 337-343.
27. Junior, L.B., et al., Determination of quinine and doxycycline in rat plasma by LC–MS–MS: application to a pharmacokinetic study. Chromatographia, 2011. 73(11-12): p. 1081-1088.
28. Junior, L.B., et al., Development and validation of LC-MS/MS method for the simultaneous determination of quinine and doxycycline in pharmaceutical formulations. Journal of Liquid Chromatography & Related Technologies®, 2009. 32(18): p. 2699-2711.
29. McDonnell, L.A., et al., Discussion point: reporting guidelines for mass spectrometry imaging. Analytical and bioanalytical chemistry, 2014. 407(8): p. 2035-2045.
30. Yang, F., et al., Pharmacokinetics of doxycycline after a single intravenous, oral or intramuscular dose in Muscovy ducks (Cairina moschata). British poultry science, 2015(ahead-of-print): p. 1-6.
31. Yang, F., et al., Pharmacokinetics of doxycycline in tilapia (Oreochromis aureus× Oreochromis niloticus) after intravenous and oral administration. Journal of veterinary pharmacology and therapeutics, 2014. 37(4): p. 388-393.
32. Riond, J. and J. Riviere, Pharmacokinetics and metabolic inertness of doxycycline in young pigs. American journal of veterinary research, 1990. 51(8): p. 1271-1275.
33. Riond, J. and J. Riviere, Pharmacology and toxicology of doxycycline. Veterinary and human toxicology, 1988. 30(5): p. 431-443.
34. Agwuh, K.N. and A. MacGowan, Pharmacokinetics and pharmacodynamics of the tetracyclines including glycylcyclines. Journal of Antimicrobial Chemotherapy, 2006. 58(2): p. 256-265.
35. Suepaul, S., et al., Antimicrobial susceptibility of Leptospira isolates from dogs and rats to 12 antimicrobial agents. Tropical biomedicine, 2015. 32(1): p. 1-10.
36. Cunha, B., P. Domenico, and C. Cunha, Pharmacodynamics of doxycycline. Clinical Microbiology and Infection, 2000. 6(5): p. 270-273.
37. Jantzie, L.L. and K.G. Todd, Doxycycline inhibits proinflammatory cytokines but not acute cerebral cytogenesis after hypoxia–ischemia in neonatal rats. Journal of psychiatry & neuroscience: JPN, 2010. 35(1): p. 20-32.
133
Chapter 8 – Paper 7
MALDI MSI and LCMS/MS: Towards preclinical determination of the neurotoxic potential of fluoroquinolones
Adeola Shoboa, Sooraj Baijnatha, Dominika Bratkowskaa, Suhashni Naikera, Anou M.
Somboroa, Linda A. Besterb, Sanil D. Singhb, Tricia Naickera, Hendrik G. Krugera,
Thavendran Govendera*
a Catalysis and Peptide Research Unit, School of Health Sciences, University of KwaZulu-
Natal, Westville Campus, Durban 4000, South Africa.
*e-mail: [email protected]
b Biomedical Resource Unit, University of KwaZulu-Natal, Westville Campus, Durban
4000, South Africa.

134
Abstract
Fluoroquinolones are broad-spectrum antibiotics with efficacy against a wide range of
pathogenic microbes associated with respiratory and meningeal infections. The potential
toxicity of this class of chemical agents is a source of major concern and it is becoming a
global issue. The aim of this study was to develop a method for the brain distribution and
the pharmacokinetic profile of gatifloxacin in healthy Sprague-Dawley rats, via MALDI
MSI and quantitative LC-MS/MS.
We developed a sensitive LC-MS/MS method to quantify gatifloxacin in plasma, lung and
brain homogenates. A pharmacokinetic profile was observed where there is a double peak
pattern; a sharp initial increase in the concentration soon after dosing followed by a steady
decline until another increase in concentration after a longer period post dosing in all the
three biological samples was observed. The imaging results showed the drug gradually
entering the brain via the blood brain barrier and into the cortical regions from 15-240 min
post dose. As time elapses the drug leaves the brain following the same path as it followed
on its entry and finally concentrates at the cortex.

135
Introduction
Fluoroquinolones are a promising class of antibiotic with a broad spectrum of bactericidal
activities [1, 2]. It is well established that these chemical agents have side effects such as
dizziness, restlessness, insomnia, tremor, hallucination, depression, anxiety and convulsion
[3-5]. In 2013, the United States Food and Drug Administration (FDA) warned that this
group of drugs may cause permanent peripheral neuropathy [6]. Neurotoxicity is
dependent on the penetration of drugs into the blood brain barrier (BBB), and this feature
protects the central nervous system (CNS) from neurotoxic substances circulating in the
blood [7].
Few studies had attempted the use of positron emission tomography (PET) to quantify and
localize fluoroquinolones in vivo [8-13] but they had either failed to report the
concentration or show convincing localization of this class of antibiotics in the brain of the
models they had worked on. This is mostly because the lipophilic properties of the
compound might have been altered due to the attachment of a radioactive group on the
analyte [14] or the method lacks sensitivity. [18F] ciprofloxacin had earlier been shown not
to penetrate the BBB in human subjects [8] and consequently could not be quantified using
this technique, however labeled ciprofloxacin had earlier been quantified in rat brains using
high performance liquid chromatography (HPLC)-spectrophotometry technique [15].
Unlabeled ciprofloxacin had initially been quantified and shown in rats to instantaneously
penetrate the BBB using the HPLC technique, with obtained values higher than that in the
cerebrospinal fluid (CSF) [16]. [18F] trovafloxacin and [18F] fleroxacin on the other hand
had been quantified in the brain using PET, however, low concentrations and non-definitive
images were reported in animal and human subjects [9, 10, 17, 18].
It is therefore necessary to study the amount of drug directly in the brain using a more
sensitive technique as a true measure of its neurotoxicity. The choice of gatifloxacin (GAT)
in our study was based on the earlier warning issued by the FDA on the neurotoxic potential
of this class of drug [6]. In addition, GAT is in the forefront of the tuberculosis (TB)
pipeline and it is currently not in use for multi-drug regimen.
Traditionally, radiolabelled drugs have been employed for imaging in drug distribution
studies by magnetic resonance imaging (MRI), autoradiography, X-ray computerized

136
tomography (CT), and PET [19]. However, these methods are expensive and only show
total drug-related materials [20]. Matrix assisted laser desorption ionization mass
spectrometry imaging (MALDI MSI) is a label free technique, which offers the advantage
of determining the distribution of parent drug and metabolites simultaneously [21-24]. We
have recently shown that combination of Liquid chromatography tandem mass
spectrometry (LC-MS/MS) with MALDI MSI provides better correlation than PET
imaging technique [25-28]. The aim of this study was to establish methods for the
preclinical evaluation and localization of fluoroquinolones in the rat brain by using LC-
MS/MS and MALDI MSI as sensitive tools for its determination.
Materials and Methods
Animals
All animal experiments were undertaken with the approval of the Institutional Animal
Ethical Committee of University of KwaZulu-Natal (UKZN), Durban (Ethics number:
006/15/Animal) and adequate measures were taken to minimize pain or discomfort.
Healthy female Sprague-Dawley rats with average weight of 135 ± 20 g were housed in
polycarbonate cages in air-conditioned rooms (50-70% humidity and between 21-24oC)
with a 12 hr light/dark cycle. Animals were allowed ad libitum access to drinking water
and standard rat chow.
Drug Administration and tissue sampling
Animals were dosed with GAT (DLD Scientific, South Africa) at 10 mg/kg prepared in
10% DMSO and 90% ultrapure water, this dose was calculated based on the average body
weight of the animals. GAT was administered intraperitoneally (i.p.) to 9 groups of animals
(n=3). Animals were anaesthetized with halothane before blood was collected by cardiac
puncture at 0, 15, 30, 60, 90, 120, 150, 180, 240 min post GAT administration in
heparinized tubes. Blood samples were immediately centrifuged at 3500 rpm for 10 min
and aliquots of plasma (1.5 mL) were immediately stored at -20o C prior to analysis.
Dissection and storage
The rats were euthanized with halothane and termination was confirmed by the absence of
breathing and dissection was performed immediately. The lungs and brains were surgically
removed and snap frozen in liquid nitrogen vapor prior to storage at -80oC.

137
Sample preparation for MALDI MSI
Serial sections (10 µm thick) from the mid brain of the same animal were sectioned from
each biopsy thaw mounted onto an indium titanium oxide (ITO) coated glass slide (Bruker,
Bremen, Germany) with a cryostat (Leica Microsystems CM1100, Wetzlar, Germany)
using optimum cutting temperature (OCT) embedding medium and stored at -80 °C until
analysis. Glass slides were removed from deep freeze and immediately transferred to a
desiccator. Following 30 min desiccation time, the slides were scanned using a flatbed
scanner (HP LaserJet 3055). The α-cyano-4-hydroxy cinnamic acid (CHCA) matrix (7
mg/mL) was prepared in 50% acetonitrile (ACN) containing 0.2% trifluoroacetic acid
(TFA). The matrix solution was sonicated for 5 min and centrifuged at 10,000 rpm for 10
min before transfer to the ImagePrep (Bruker Daltonics). This is a spraying device that
automatically deposits matrix solution onto the tissue in a consistent manner. In short,
aerosol is generated by vibrating spray generator producing tiny droplets (average droplet
size of ≈20 µm) under controlled conditions.
MALDI MSI Analysis
A standard solution of GAT was analyzed using matrix assisted laser desorption ionization
time of flight mass spectrometry (MALDI TOF MS) operated both at reflectron and
MALDI MS/MS (LIFT) modes respectively with the aid of the Autoflex III MALDI
TOF/TOF 1 KHz smartbeam laser (Bruker Daltonics, Germany) and FlexControl
acquisition software ran in positive ion mode. The instrument was calibrated using
standard peptide mix, which included arginine, alanine spotted with CHCA matrix on the
ground steel target (Bruker Daltonics, Germany) for m/z 200-700. Each spectrum was
acquired from 200 laser shots. Tissue sections were imaged with spatial resolution from
25-100 µm. The MALDI images were displayed using the software FlexImaging 3.0
(Bruker Daltonics, Germany). Spotting different concentrations (0.5, 1, 5, 10, 100 and 500
ng/mL respectively) of GAT with the matrix onto a brain section of an untreated animal
was used to evaluate background signals interfering with the analyte. The drug was mixed
(1:2) with matrix solution and the different concentrations of GAT spotted on the tissue in
a total volume of 3 µL. The spots were analyzed in reflectron mode by collecting 200 shots
per spot. The LIFT experiments were performed using a method optimized for the drug by
specific tuning of the timing of the LIFT cell and of the precursor ion selector. The LIFT
method was calibrated with peptide calibration standards and also a standard solution of

138
GAT as mentioned above. The same method was used to perform MS/MS directly on
GAT-matrix spotted tissue section and spectra were compared to the MS/MS spectra
generated from the drug standard only. Spotting various concentrations (5, 10, 100, 250
and 500 ng/mL respectively) of GAT with the matrix onto a brain section of an untreated
animal was used to evaluate background signals that may interfere with the analyte and to
determine limit of detection (LOD). For the initial analysis of the manually deposited spots,
spectra consisting of 1000 laser shots were acquired in bundles of 5 x 200 shots and data
was collected in the range between m/z 200-700. A product ion scan of the protonated
precursor ions (m/z 376) revealed a clear fragmentation pattern with the transition m/z 376
→ 358dominating the spectra with a laser power of 60%. An increase in the laser power
led to production of other product ions but with less sensitivity. The software Flex Imaging
3.0 was used to set up the acquisition of the imaging experiments. The imaging MS/MS
experiments were performed by collecting spectra with a raster width of 100 µm in the
same m/z range as above. The spectra were baseline subtracted (Convex hull) and
smoothed (Savitzski Golay) in the processing software during acquisition. In LIFT mode,
all spectra were normalized against total ion count (TIC) to reduce potential suppression
by matrix hot spots. We define the total ion count as the sum of all intensities in the mass
range analyzed. For this analysis, both fragment and parent spectra were acquired from
each spot and 500 laser shots were summed up in a random walk pattern from each position.
The product ion, m/z 358 from the transition m/z 376 > m/z 358 was used to visualize the
distribution of GAT in the brain sections in triplicate.
Analytical method
The HPLC system was coupled to an AmaZon ion trap (IT) equipped with ESI ion source
from Bruker Daltonics (Bremen, Germany) operated in the ultrascan mode. The HPLC
system was a Dionex Ultimate 3000, consisting of a binary pump, connected to an
autosampler equipped with a 20 µL injection loop and the temperature of the column was
maintained at 25°C. The analytical column was a 150 mm × 3.0 mm (internal diameter)
stainless-steel column YMC Triart C18, 3 µm from YMC Europe Gmbh (Dislanken,
Germany). The flow rate was 0.4 mL min-1. The mobile phases were Milli-Q water (0.1%
v/v formic acid) and ACN (0.1% v/v formic acid). The gradient profile was gradually
increased from 10% to 40% ACN in 7 min, then in next 3 min increased to 90% ACN (held
2 min), after which time the mobile phase was returned to the initial conditions (10% ACN)
in 3 min.

139
The MS was operated in the electrospray ionization (ESI) positive mode and auto MSn
spectra collection was applied. The MS settings were as follows: capillary outlet 5500 V,
end plate voltage 500 V. Nebulizer was set to 1.5 bar and desolvation gas temperature was
210°C at a flow-rate of 8 L/min. Positive ion mode MS spectra were obtained within a
mass range of m/z 100-1200. Smart parameter setting (SPS) was set to m/z 376.1. The ion
charge control (ICC) was set to 200000 with a maximum accumulation time of 200 ms.
Operation of the collision induced dissociation was performed using helium as collision
gas. The MRM settings were as follows: isolation width for GAT was set at 4.0 and
percentage amplification was set at 0.5% while for the internal standard (ciprofloxacin),
the isolation width was set at 5.0 and the percentage amplification was set at 2%. Collision
energy - enhanced fragmentation mode ramping from 60-180%, fragmentation time 40 ms,
isolation width m/z 4. For MS/MS precursor selection, the most intense ions were isolated.
The transitions were chosen to be m/z 376.1 → 332.1 for GAT, m/z 332.0 → 288.0 for the
internal standard (IS). All results were stored and analysed with Data Analysis 4.0 SP 5
(Bruker Daltonics) and Quant analysis.
Preparation of the samples
The extraction and quantification of GAT were done as described previously, with minor
modifications [29-31]. Control tissues stored at -80oC to be used as matrix for calibration
were homogenized in 3 mL of water for every 1g of tissue with a manual tissue
homogenizer. Gatifloxacin concentration was measured using LC-MS/MS after protein
precipitation with a 100% methanol (9:1) for plasma, 4:1 for brain homogenate, and 3.33:1
for lung homogenate respectively. This was followed by centrifugation at 15,000 rpm for
10 min (4oC) and supernatants were filtered through Supel-select 30 mg HLB, Discovery
DSC-18 (50 mg) and Discovery DSC-18 (100 mg) cartridges. The extraction recoveries of
GAT were performed on three quality control samples (QC) for each level (low, medium
and high) and assayed in three replicates. Recoveries of the GAT were calculated by
comparing its peak area in the processed biological samples with the corresponding peak
area acquired from an aqueous solution at the same concentration. Plasma and lung
homogenate had 30, 600 and 900 ng/mL as concentrations of their QC samples while the
brain homogenate had 3, 25 and 35 ng/mL as QC samples. Calibration curves were drawn
for individual matrices using the optimized method of extraction.
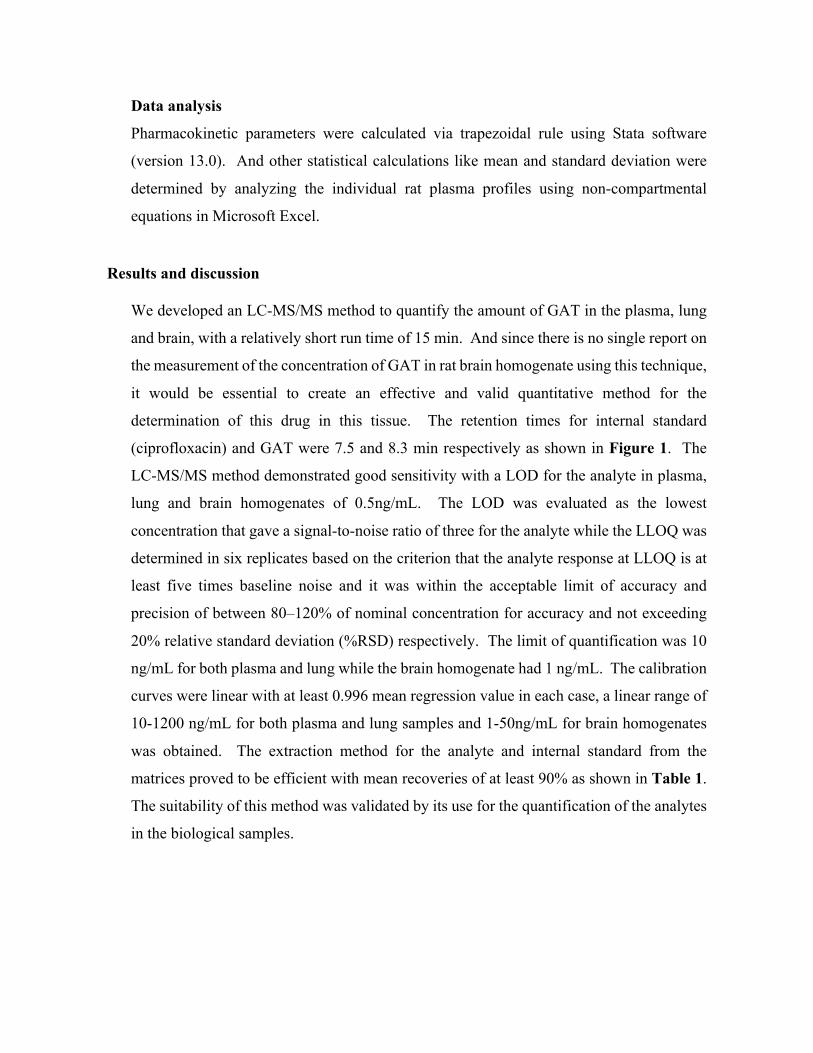
140
Data analysis
Pharmacokinetic parameters were calculated via trapezoidal rule using Stata software
(version 13.0). And other statistical calculations like mean and standard deviation were
determined by analyzing the individual rat plasma profiles using non-compartmental
equations in Microsoft Excel.
Results and discussion
We developed an LC-MS/MS method to quantify the amount of GAT in the plasma, lung
and brain, with a relatively short run time of 15 min. And since there is no single report on
the measurement of the concentration of GAT in rat brain homogenate using this technique,
it would be essential to create an effective and valid quantitative method for the
determination of this drug in this tissue. The retention times for internal standard
(ciprofloxacin) and GAT were 7.5 and 8.3 min respectively as shown in Figure 1. The
LC-MS/MS method demonstrated good sensitivity with a LOD for the analyte in plasma,
lung and brain homogenates of 0.5ng/mL. The LOD was evaluated as the lowest
concentration that gave a signal-to-noise ratio of three for the analyte while the LLOQ was
determined in six replicates based on the criterion that the analyte response at LLOQ is at
least five times baseline noise and it was within the acceptable limit of accuracy and
precision of between 80–120% of nominal concentration for accuracy and not exceeding
20% relative standard deviation (%RSD) respectively. The limit of quantification was 10
ng/mL for both plasma and lung while the brain homogenate had 1 ng/mL. The calibration
curves were linear with at least 0.996 mean regression value in each case, a linear range of
10-1200 ng/mL for both plasma and lung samples and 1-50ng/mL for brain homogenates
was obtained. The extraction method for the analyte and internal standard from the
matrices proved to be efficient with mean recoveries of at least 90% as shown in Table 1.
The suitability of this method was validated by its use for the quantification of the analytes
in the biological samples.
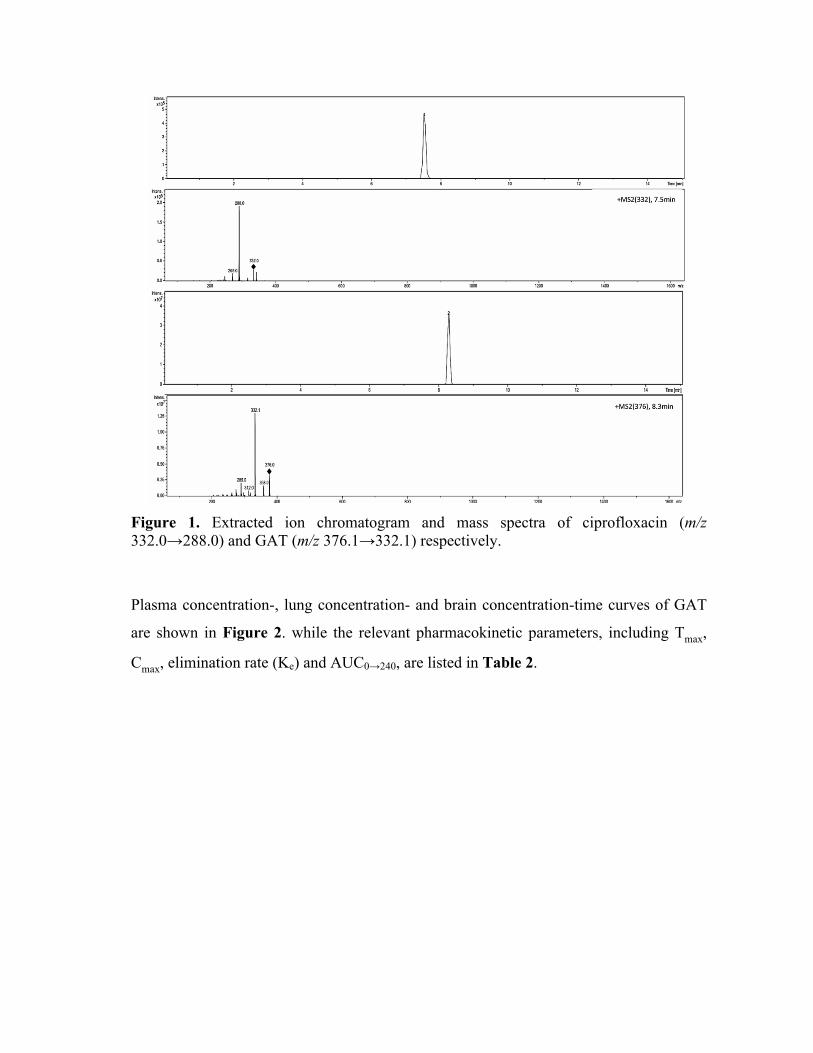
141
Figure 1. Extracted ion chromatogram and mass spectra of ciprofloxacin (m/z 332.0→288.0) and GAT (m/z 376.1→332.1) respectively.
Plasma concentration-, lung concentration- and brain concentration-time curves of GAT
are shown in Figure 2. while the relevant pharmacokinetic parameters, including Tmax,
Cmax, elimination rate (Ke) and AUC0→240, are listed in Table 2.
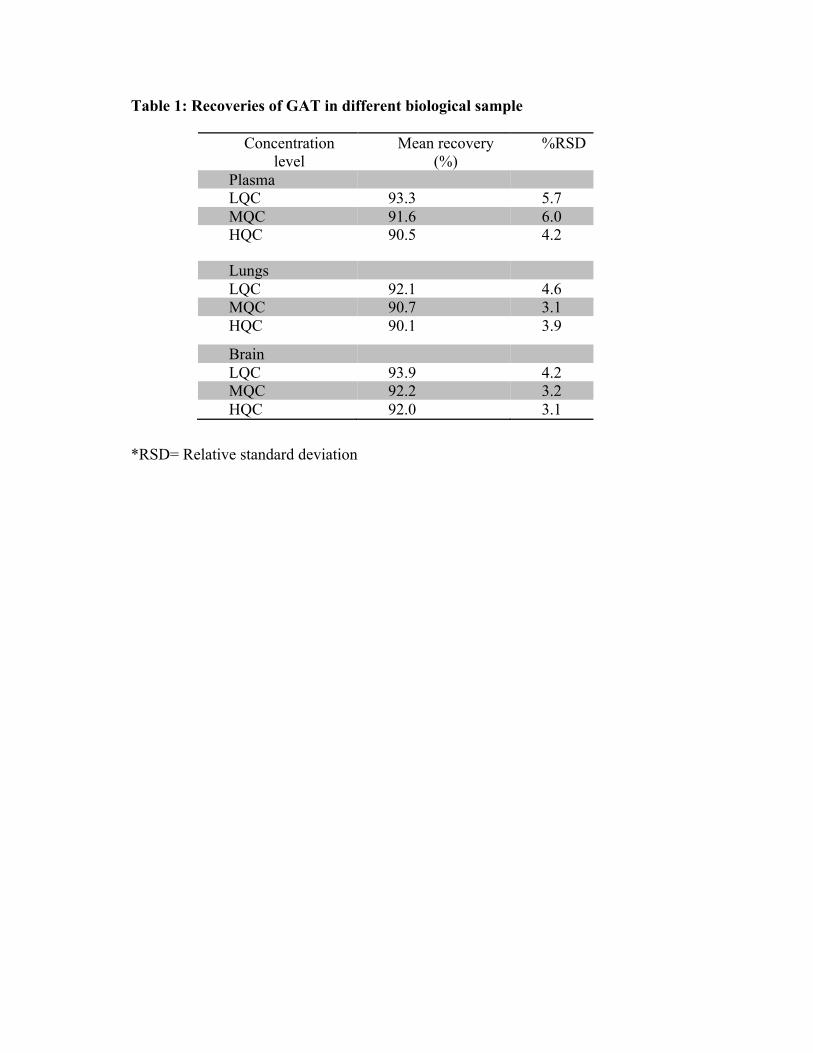
142
Table 1: Recoveries of GAT in different biological sample
*RSD= Relative standard deviation
Concentration level
Mean recovery (%)
%RSD
Plasma LQC 93.3 5.7 MQC 91.6 6.0 HQC 90.5 4.2
Lungs LQC 92.1 4.6 MQC 90.7 3.1 HQC 90.1 3.9
Brain LQC 93.9 4.2 MQC 92.2 3.2 HQC 92.0 3.1
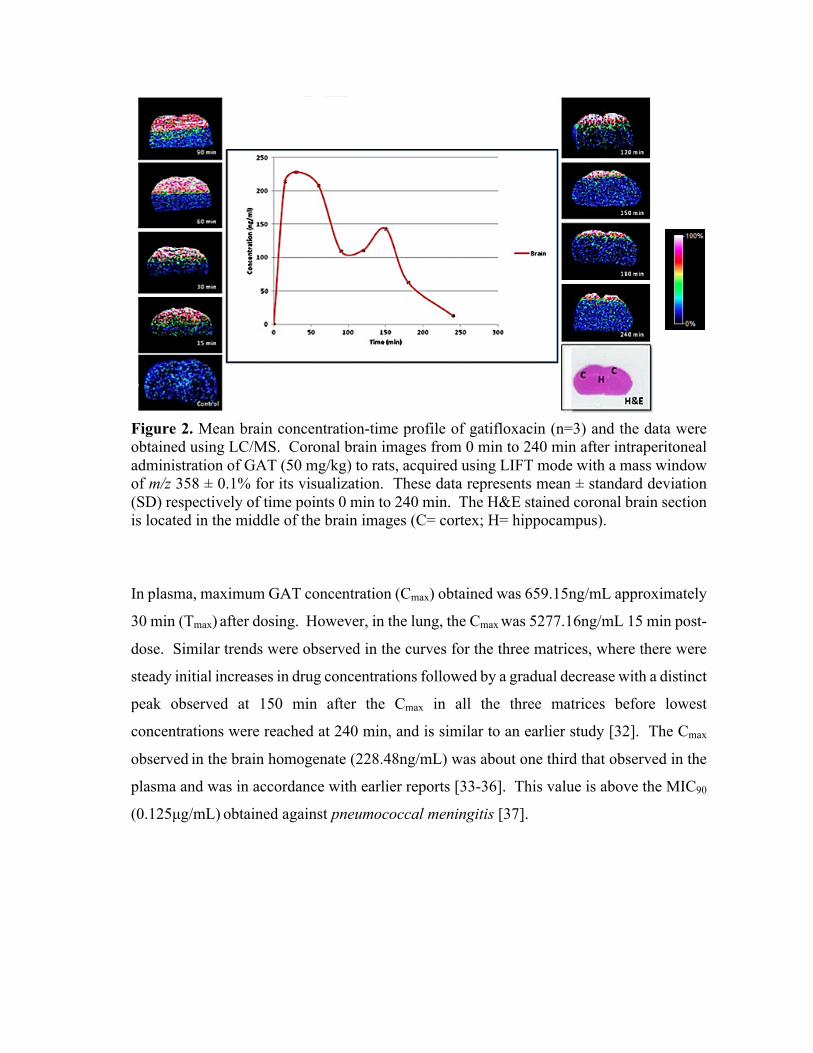
143
Figure 2. Mean brain concentration-time profile of gatifloxacin (n=3) and the data were obtained using LC/MS. Coronal brain images from 0 min to 240 min after intraperitoneal administration of GAT (50 mg/kg) to rats, acquired using LIFT mode with a mass window of m/z 358 ± 0.1% for its visualization. These data represents mean ± standard deviation (SD) respectively of time points 0 min to 240 min. The H&E stained coronal brain section is located in the middle of the brain images (C= cortex; H= hippocampus).
In plasma, maximum GAT concentration (Cmax) obtained was 659.15ng/mL approximately
30 min (Tmax) after dosing. However, in the lung, the Cmax was 5277.16ng/mL 15 min post-
dose. Similar trends were observed in the curves for the three matrices, where there were
steady initial increases in drug concentrations followed by a gradual decrease with a distinct
peak observed at 150 min after the Cmax in all the three matrices before lowest
concentrations were reached at 240 min, and is similar to an earlier study [32]. The Cmax
observed in the brain homogenate (228.48ng/mL) was about one third that observed in the
plasma and was in accordance with earlier reports [33-36]. This value is above the MIC90
(0.125µg/mL) obtained against pneumococcal meningitis [37].

144
Table 2. Quantitative analysis (LC-MS/MS) of GAT in plasma, lung and brain homogenates
Parameters Plasma (ng/mL)
Lung (ng/mL)
Brain (ng/mL)
15 min 612.81±77.04 5277.16±70.16 214.45±2.58
30 min 659.15±49.76 3410.76±23.99 228.48±1.51 60 min 360.29±49.76 1887.33±71.76 208.43±2.82 90 min 105.17±13.6 729.28±49.88 110.04±1.00
120 min 121.13±9.58 770.51±44.04 110.89±1.11 150 min 163.15±5.12 1466.31±24.54 143.09±1.80 180 min 39.46±13.86 295.77±36.13 63.66±0.97 240 min 23.43±1.64 132.47±13.61 13.24±0.28
Tmax (min) 30 15 30 Cmax (ng/mL) 659.15±49.76 5277.16±70.16 228.48±1.51 AUC0→∞ (ng x
min/mL) 48,993.83 318,786.50 28,794.03
T½ (min) 60 40 90 Ke 0.0197 0.0248 0.0264
*Values are expressed as mean ± S.D of samples taken from the three animals except the brain samples, ran at three different days
Brain and CSF penetration of between 15-50% of plasma concentration had earlier been
observed for GAT after a loading dose of 15.60mg/kg and subsequent maintenance doses
of 3.35mg/kg/h intravenously for 4 hours to healthy Wistar rats [37, 38] and our findings
(approx. 35%) were within the acclaimed range. The developed MALDI MSI method had
a transition of m/z 376 > m/z 358 and was chosen for the MSI assay because during the
method development and optimization in the LIFT mode, the m/z 358 had the highest
intensity as shown in Figure 3. An increase in the laser power led to production of other
product ions but with lower sensitivity. The method had a LOD of 10 ng/mL with a signal
to noise ratio of at least 3:1. Image representatives of the MSI investigations for serial
brain coronal sections from the same animal analyzed in triplicate are shown with drug
mean concentration-time profile in Figure 2 from 0-240 min time points. Characteristic
spectra obtained in the MSI study are in Figure 3, which revealed the chosen transition.
Typical reproducible serial coronal sections from the mid-brain of the same animal
analyzed in triplicate is shown in Figure 4.
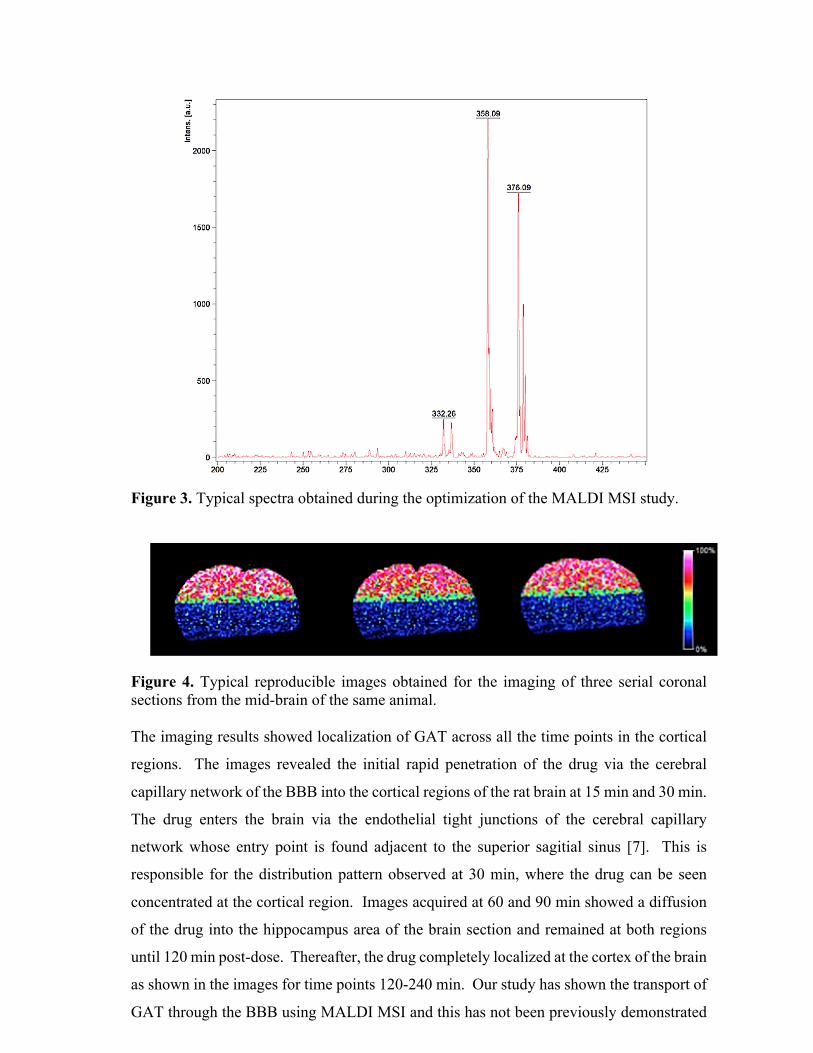
145
Figure 3. Typical spectra obtained during the optimization of the MALDI MSI study.
Figure 4. Typical reproducible images obtained for the imaging of three serial coronal sections from the mid-brain of the same animal. The imaging results showed localization of GAT across all the time points in the cortical
regions. The images revealed the initial rapid penetration of the drug via the cerebral
capillary network of the BBB into the cortical regions of the rat brain at 15 min and 30 min.
The drug enters the brain via the endothelial tight junctions of the cerebral capillary
network whose entry point is found adjacent to the superior sagitial sinus [7]. This is
responsible for the distribution pattern observed at 30 min, where the drug can be seen
concentrated at the cortical region. Images acquired at 60 and 90 min showed a diffusion
of the drug into the hippocampus area of the brain section and remained at both regions
until 120 min post-dose. Thereafter, the drug completely localized at the cortex of the brain
as shown in the images for time points 120-240 min. Our study has shown the transport of
GAT through the BBB using MALDI MSI and this has not been previously demonstrated

146
in other studies of fluoroquinolone transport in the brain [33, 38-41]. Ooie et al [38]
investigated the penetration of GAT through the BBB of dogs and rats. Their findings
observed no significant difference in GAT concentration between the cortex and
cerebellum in both animals [38]. However, this does not deviate from the results of our
imaging studies as shown in the localization of the drug in cortical regions of the coronal
brain images. Our findings have also been validated by another study that involved the
quantitative brain microdialysis on the mechanism of quinolones distribution in the central
nervous system which assumed that an efflux transport system for quinolones at the BBB
might be responsible for the restricted distribution of this class of drugs in the brain [33,
39]. The results obtained in this study was in agreement with the investigation of Lui et al,
they studied the uptake of GAT and other fluoroquinolones by assessing BBB penetration
invitro and in rats [39], their findings also confirmed that GAT penetrated the BBB as
reported. As presented in our results, the presence of this drug in the brain was supported
in a recent study [40] aimed to ascertain the effect of oral single dose of GAT in male albino
rat on the concentrations of amino acid monoamine neurotransmitters and
acetylecholinesterase activities in the frontal cortex and hippocampus brain areas, they
noted elevations in monoamine level in the hippocampus and reduction in the dopamine
level with such increase translated to a susceptibility to seizures [40, 42] and this seizure
inducing activity has previously been reported [33, 43-45] as a side effect. A reduction in
the serotonin level in the prefrontal cortex was also reported [40, 45], a finding which
supplement as a symptom of depression [46, 47] caused by penetration of the drug through
the BBB.
The known penetration and localization of GAT in the rat brain supplements our findings
and that of others, it further confirms the penetration of the therapeutic agent through the
blood brain barrier and hence its localization while strengthening the use of MALDI MSI
as a valuable tool for drug mapping in biological tissues.
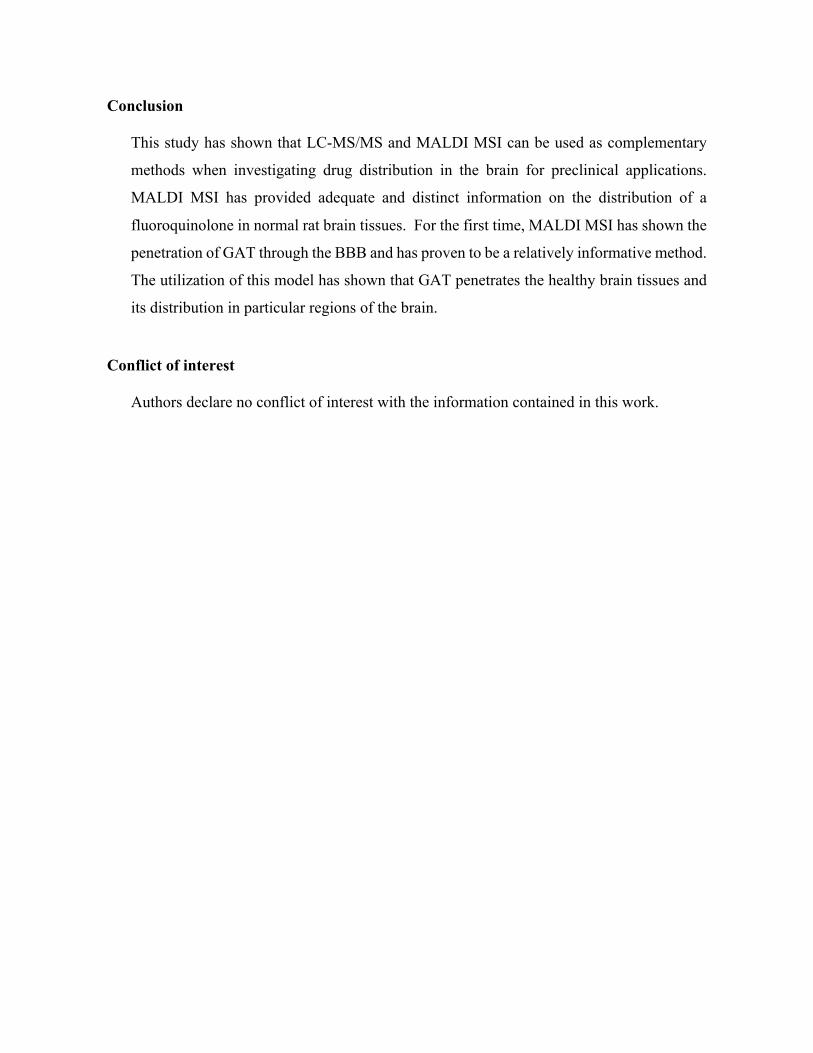
147
Conclusion
This study has shown that LC-MS/MS and MALDI MSI can be used as complementary
methods when investigating drug distribution in the brain for preclinical applications.
MALDI MSI has provided adequate and distinct information on the distribution of a
fluoroquinolone in normal rat brain tissues. For the first time, MALDI MSI has shown the
penetration of GAT through the BBB and has proven to be a relatively informative method.
The utilization of this model has shown that GAT penetrates the healthy brain tissues and
its distribution in particular regions of the brain.
Conflict of interest
Authors declare no conflict of interest with the information contained in this work.
148
References 1. Soni, K., Fluoroquinolones: chemistry & action—a review. Indo Glob J Pharm Sci,
2012. 2: p. 43-53. 2. Somasundaram, S. and K. Manivannan, An overview of fluoroquinolones. Annual
Review & Research in Biology, 2013. 3(3): p. 296-313. 3. Akahane, K., M. Kato, and S. Takayama, Involvement of inhibitory and excitatory
neurotransmitters in levofloxacin-and ciprofloxacin-induced convulsions in mice. Antimicrobial agents and chemotherapy, 1993. 37(9): p. 1764-1770.
4. De Sarro, A., et al., Effects of novel 6-desfluoroquinolones and classic quinolones on pentylenetetrazole-induced seizures in mice. Antimicrobial agents and chemotherapy, 1999. 43(7): p. 1729-1736.
5. Sarro, A. and G. Sarro, Adverse reactions to fluoroquinolones. An overview on mechanistic aspects. Current medicinal chemistry, 2001. 8(4): p. 371-384.
6. Administration, U.S.F.a.D., FDA drug safety communication: FDA requires label changes to warn of risk for possibly permanent nerve damage from antibacterial fluoroquinolone drugs taken by mouth or by injection. UCM365078. pdf, 2013.
7. Abbott, N.J., et al., Structure and function of the blood–brain barrier. Neurobiology of disease, 2010. 37(1): p. 13-25.
8. Brunner, M., Langer, O., Dobrozemsky, G., Müller, U., Zeitlinger, M., Mitterhauser, M., Wadsak, W.,Dudczak, R., Kletter, K., Müller, M., [18F] Ciprofloxacin, a new positron emission tomography tracer for noninvasive assessment of the tissue distribution and pharmacokinetics of ciprofloxacin in humans. Antimicrobial agents and chemotherapy, 2004. 48(10): p. 3850-3857.
9. Fischman, A.J., et al., Pharmacokinetics of 18F-labeled trovafloxacin in normal and Escherichia coli-infected rats and rabbits studied with positron emission tomography. Clinical Microbiology and Infection, 1997. 3(1): p. 63-72.
10. Fischman, A.J., et al., Pharmacokinetics of [18F] trovafloxacin in healthy human subjects studied with positron emission tomography. Antimicrobial agents and chemotherapy, 1998. 42(8): p. 2048-2054.
11. Tewson, T., et al., The synthesis of fluorine-18 lomefloxacin and its preliminary use in human studies. Nuclear medicine and biology, 1996. 23(6): p. 767-772.
12. Babich, J.W., et al., 18 F-labeling and biodistribution of the novel fluoro-quinolone antimicrobial agent, trovafloxacin (CP 99,219). Nuclear medicine and biology, 1996. 23(8): p. 995-998.
13. Fischman, A.J., Babich, J.W., Alpert, N. M., Vincent, J., Wilkinson, R. A., Callahan, R. J., Correia, J. A., Rubin, R. H., Pharmacokinetics of 18F-labeled trovafloxacin in normal and Escherichia coli-infected rats and rabbits studied with positron emission tomography. Clinical Microbiology and Infection, 1997. 3(1): p. 63-72.
14. Wagner, C.C. and O. Langer, Approaches using molecular imaging technology—use of PET in clinical microdose studies. Advanced drug delivery reviews, 2011. 63(7): p. 539-546.
15. Naora, K., et al., Distribution of ciprofloxacin into the central nervous system in rats with acute renal or hepatic failure. Journal of pharmacy and pharmacology, 1999. 51(5): p. 609-616.
16. Katagiri, Y., et al., High-performance liquid chromatographic determination of ciprofloxacin in rat brain and cerebrospinal fluid. Chemical & pharmaceutical bulletin, 1990. 38(10): p. 2884-2886.
149
17. Rubin, R.H., et al., Tissue pharmacokinetics of fleroxacin in humans as determined by positron emission tomography. International journal of antimicrobial agents, 1994. 4: p. S15-S20.
18. Fischman, A.J., et al., Pharmacokinetics of 18F-labeled fleroxacin in rabbits with Escherichia coli infections, studied with positron emission tomography. Antimicrobial agents and chemotherapy, 1992. 36(10): p. 2286-2292.
19. Matthews, P.M., I. Rabiner, and R. Gunn, Non-invasive imaging in experimental medicine for drug development. Current opinion in pharmacology, 2011. 11(5): p. 501-507.
20. Li, F., et al., MALDI-tandem mass spectrometry imaging of astemizole and its primary metabolite in rat brain sections. Bioanalysis, 2009. 1(2): p. 299-307.
21. Sugiura, Y. and M. Setou, Imaging mass spectrometry for visualization of drug and endogenous metabolite distribution: toward in situ pharmacometabolomes. Journal of Neuroimmune Pharmacology, 2010. 5(1): p. 31-43.
22. Khatib-Shahidi, S., et al., Direct molecular analysis of whole-body animal tissue sections by imaging MALDI mass spectrometry. Analytical chemistry, 2006. 78(18): p. 6448-6456.
23. Stoeckli, M., D. Staab, and A. Schweitzer, Compound and metabolite distribution measured by MALDI mass spectrometric imaging in whole-body tissue sections. International Journal of Mass Spectrometry, 2007. 260(2): p. 195-202.
24. Castellino, S., M.R. Groseclose, and D. Wagner, MALDI imaging mass spectrometry: bridging biology and chemistry in drug development. Bioanalysis, 2011. 3(21): p. 2427-2441.
25. Shobo, A., Bratkowska, D.,Baijnath, S.,Naiker, S.,Bester, L.,Singh, S. D.,Maguire, G. E. M.,Kruger, H. G.,Govender, T, Visualization of Time-Dependent Distribution of Rifampicin in Rat Brain Using MALDI MSI and Quantitative LCMS/MS. Assay and drug development technologies, 2015. 13(5): p. 277-284.
26. Bratkowska, D., et al., Determination of the antitubercular drug PA-824 in rat plasma, lung and brain tissues by liquid chromatography tandem mass spectrometry: Application to a pharmacokinetic study. Journal of Chromatography B, 2015. 988: p. 187-194.
27. Shobo, A., Bratkowska, D., Baijnath, S., Naiker, S., Bester, L. A., Singh, S. D., Maguire, G. E. M., Kruger, H. G. & Govender, T, Tissue Distribution of Pretomanid in Rat Brain via Mass Spectrometry Imaging. Xenobiotica 2015.
28. Baijnath, S., Naiker,S., Shobo, A.,Moodley, C.,Adamson, J.,Ngcobo, B.,Bester, L. A. ,Singh, S.,Kruger, G.,Naicker, T.,Govender,T., Evidence for the presence of Clofazimine and its distribution in the healthy mouse brain. Journal of molecular histology, 2015.1-7
29. Sousa, J., et al., First liquid chromatography method for the simultaneous determination of levofloxacin, pazufloxacin, gatifloxacin, moxifloxacin and trovafloxacin in human plasma. Journal of Chromatography B, 2013. 930: p. 104-111.
30. Sousa, J., et al., Analytical methods for determination of new fluoroquinolones in biological matrices and pharmaceutical formulations by liquid chromatography: a review. Analytical and bioanalytical chemistry, 2012. 403(1): p. 93-129.
31. Tasso, L. and T. Dalla Costa, High performance liquid chromatography for quantification of gatifloxacin in rat plasma following automated on-line solid phase extraction. Journal of pharmaceutical and biomedical analysis, 2007. 44(1): p. 205-210.
32. Saribas, Z., et al., Critical appraisal of air pouch infection model in rats. Annals of Clinical & Laboratory Science, 2012. 42(1): p. 50-56.
150
33. Ooie, T., et al., Quantitative brain microdialysis study on the mechanism of quinolones distribution in the central nervous system. Drug metabolism and disposition, 1997. 25(7): p. 784-0789.
34. Okezaki, E., et al., Structure-tissue distribution relationship based on physiological pharmacokinetics for NY-198, a new antimicrobial agent, and the related pyridonecarboxylic acids. Drug metabolism and disposition, 1988. 16(6): p. 865-874.
35. Naora, K., et al., Enhanced entry of ciprofloxacin into the rat central nervous system induced by fenbufen. Journal of Pharmacology and Experimental Therapeutics, 1991. 258(3): p. 1033-1037.
36. Ichikawa, N., et al., Effect of fenbufen on the entry of new quinolones, norfloxacin and ofloxacin, into the central nervous system in rats. Journal of pharmacy and pharmacology, 1992. 44(11): p. 915-920.
37. Lutsar, I., et al., Pharmacodynamics of gatifloxacin in cerebrospinal fluid in experimental cephalosporin-resistant pneumococcal meningitis. Antimicrobial agents and chemotherapy, 1998. 42(10): p. 2650-2655.
38. Ooie, T., et al., Comparative distribution of quinolone antibiotics in cerebrospinal fluid and brain in rats and dogs. Journal of Pharmacology and Experimental Therapeutics, 1996. 278(2): p. 590-596.
39. Liu, X., D. Wang, and L. Xie, Correlation between quinolone uptakes by BCECs in vitro and brain-to-plasma concentration ratios in rats. European journal of drug metabolism and pharmacokinetics, 2005. 30(4): p. 249-254.
40. Arafa, N.M.S., S.M. Rawi, and S.A. Mubarak, Exploration of the neurotoxicity of ciprofloxcin or gatifloxacin single dose in rat cortex and hippocampus. African Journal of Pharmacy and Pharmacology, 2015. 9(4): p. 65-73.
41. Tamai, I., et al., Limited distribution of new quinolone antibacterial agents into brain caused by multiple efflux transporters at the blood-brain barrier. Journal of Pharmacology and Experimental Therapeutics, 2000. 295(1): p. 146-152.
42. Kobayashi, K. and A. Mori, Brain Monoamines in Seizure Mechanism (Review). Psychiatry and Clinical Neurosciences, 1977. 31(3): p. 483-489.
43. Moorthy, N., N. Raghavendra, and P. Venkatarathnamma, Levofloxacin-induced acute psychosis. Indian journal of psychiatry, 2008. 50(1): p. 57.
44. Agbaht, K., et al., Ciprofloxacin-associated seizures in a patient with underlying thyrotoxicosis: case report and literature review. International journal of clinical pharmacology and therapeutics, 2009(47): p. 303-10.
45. Rawi, S.M., N. Arafa, and M.M. El-Hazmi, Evaluation of the effects of ciprofloxcin or gatifloxacin on neurotransmitters levels in rat cortex and hippocampus. Afr J Pharm Pharmacol, 2011. 5(8): p. 993-1005.
46. Juckel, G., A. Mendlin, and B.L. Jacobs, Electrical stimulation of rat medial prefrontal cortex enhances forebrain serotonin output: implications for electroconvulsive therapy and transcranial magnetic stimulation in depression. Neuropsychopharmacology, 1999. 21(3): p. 391-398.
47. Koenigs, M. and J. Grafman, The functional neuroanatomy of depression: distinct roles for ventromedial and dorsolateral prefrontal cortex. Behavioural brain research, 2009. 201(2): p. 239-243.

151
Chapter 9 – Paper 8
Tissue Distribution of Pretomanid in Rat Brain via Mass Spectrometry Imaging
Adeola Shobo1, Dominika Bratkowska1, Sooraj Baijnath1, Suhashni Naiker1, Anou M.
Somboro1, Linda A. Bester2, Sanil D. Singh2, Tricia Naicker1, Hendrik G. Kruger1,
Thavendran Govender1*
1 School of Pharmacy and Pharmacology, University of KwaZulu-Natal, Westville
Campus, Durban 4000, South Africa.
*e-mail: [email protected]
2 Biomedical Resource Unit, University of KwaZulu-Natal, Westville Campus, Durban
4000, South Africa.

152
Abstract
Matrix-assisted laser desorption/ionization mass spectrometry imaging (MALDI MSI)
combines the sensitivity and selectivity of mass spectrometry with spatial analysis to
provide a new dimension for histological analyses of the distribution of drugs in tissue.
Pretomanid is a pro-drug belonging to a class of antibiotics known as nitroimidizoles,
which have been proven to be active under hypoxic conditions and to the best of our
knowledge there have been no studies investigating the distribution and localisation of this
class of compounds in the brain using MALDI MSI. Herein we report on the distribution
of pretomanid in the healthy rat brain after intraperitoneal administration (20 mg/kg) using
MALDI MSI. Our findings showed that the drug localises in specific compartments of the
rat brain viz. the corpus callosum, a dense network of neurons connecting left and right
cerebral hemispheres. This study proves that MALDI MSI technique has great potential
for mapping the pretomanid distribution in uninfected tissue samples, without the need for
molecular labeling.
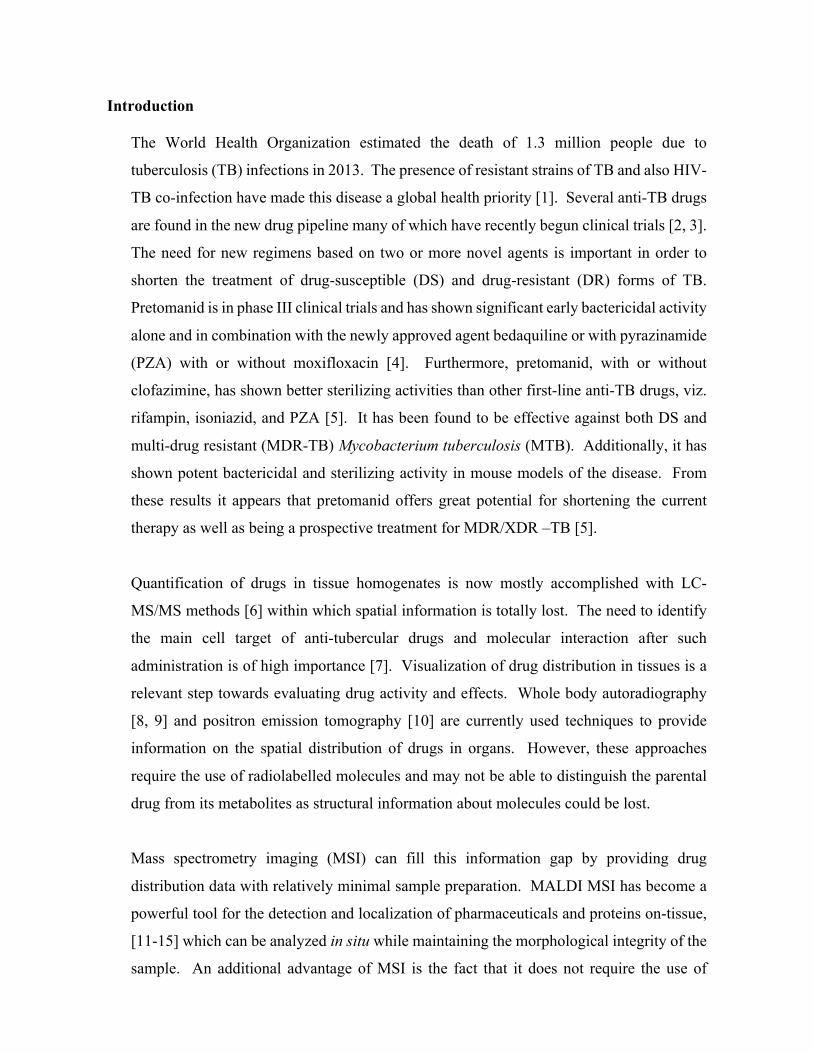
153
Introduction
The World Health Organization estimated the death of 1.3 million people due to
tuberculosis (TB) infections in 2013. The presence of resistant strains of TB and also HIV-
TB co-infection have made this disease a global health priority [1]. Several anti-TB drugs
are found in the new drug pipeline many of which have recently begun clinical trials [2, 3].
The need for new regimens based on two or more novel agents is important in order to
shorten the treatment of drug-susceptible (DS) and drug-resistant (DR) forms of TB.
Pretomanid is in phase III clinical trials and has shown significant early bactericidal activity
alone and in combination with the newly approved agent bedaquiline or with pyrazinamide
(PZA) with or without moxifloxacin [4]. Furthermore, pretomanid, with or without
clofazimine, has shown better sterilizing activities than other first-line anti-TB drugs, viz.
rifampin, isoniazid, and PZA [5]. It has been found to be effective against both DS and
multi-drug resistant (MDR-TB) Mycobacterium tuberculosis (MTB). Additionally, it has
shown potent bactericidal and sterilizing activity in mouse models of the disease. From
these results it appears that pretomanid offers great potential for shortening the current
therapy as well as being a prospective treatment for MDR/XDR –TB [5].
Quantification of drugs in tissue homogenates is now mostly accomplished with LC-
MS/MS methods [6] within which spatial information is totally lost. The need to identify
the main cell target of anti-tubercular drugs and molecular interaction after such
administration is of high importance [7]. Visualization of drug distribution in tissues is a
relevant step towards evaluating drug activity and effects. Whole body autoradiography
[8, 9] and positron emission tomography [10] are currently used techniques to provide
information on the spatial distribution of drugs in organs. However, these approaches
require the use of radiolabelled molecules and may not be able to distinguish the parental
drug from its metabolites as structural information about molecules could be lost.
Mass spectrometry imaging (MSI) can fill this information gap by providing drug
distribution data with relatively minimal sample preparation. MALDI MSI has become a
powerful tool for the detection and localization of pharmaceuticals and proteins on-tissue,
[11-15] which can be analyzed in situ while maintaining the morphological integrity of the
sample. An additional advantage of MSI is the fact that it does not require the use of
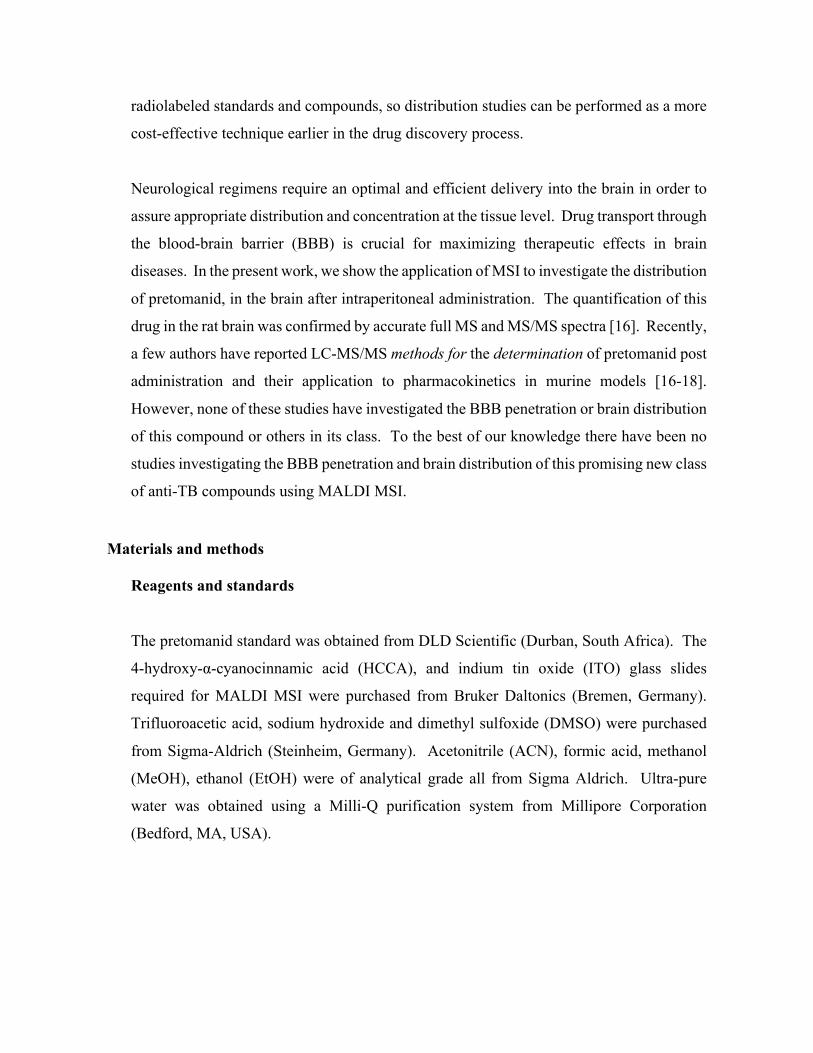
154
radiolabeled standards and compounds, so distribution studies can be performed as a more
cost-effective technique earlier in the drug discovery process.
Neurological regimens require an optimal and efficient delivery into the brain in order to
assure appropriate distribution and concentration at the tissue level. Drug transport through
the blood-brain barrier (BBB) is crucial for maximizing therapeutic effects in brain
diseases. In the present work, we show the application of MSI to investigate the distribution
of pretomanid, in the brain after intraperitoneal administration. The quantification of this
drug in the rat brain was confirmed by accurate full MS and MS/MS spectra [16]. Recently,
a few authors have reported LC-MS/MS methods for the determination of pretomanid post
administration and their application to pharmacokinetics in murine models [16-18].
However, none of these studies have investigated the BBB penetration or brain distribution
of this compound or others in its class. To the best of our knowledge there have been no
studies investigating the BBB penetration and brain distribution of this promising new class
of anti-TB compounds using MALDI MSI.
Materials and methods
Reagents and standards
The pretomanid standard was obtained from DLD Scientific (Durban, South Africa). The
4-hydroxy-α-cyanocinnamic acid (HCCA), and indium tin oxide (ITO) glass slides
required for MALDI MSI were purchased from Bruker Daltonics (Bremen, Germany).
Trifluoroacetic acid, sodium hydroxide and dimethyl sulfoxide (DMSO) were purchased
from Sigma-Aldrich (Steinheim, Germany). Acetonitrile (ACN), formic acid, methanol
(MeOH), ethanol (EtOH) were of analytical grade all from Sigma Aldrich. Ultra-pure
water was obtained using a Milli-Q purification system from Millipore Corporation
(Bedford, MA, USA).
155
Animals
All animal experiments were undertaken with the approval of the Institutional Animal
Ethical Committee of University of KwaZulu-Natal (UKZN), Durban, with the approval
number 069/14/Animal. Healthy female Sprague-Dawley rats weighing 130 ± 10g were
obtained from the Biomedical Resource Unit (BRU), University of KwaZulu-Natal.
Animals were housed at the BRU in polycarbonate cages in air-conditioned rooms (50-
70% humidity and between 21-24oC) with a 12 hr light/dark cycle. Animals were allowed
ad libitum access to drinking water and standard rat chow.
Drug administration and tissue sampling
Pretomanid was weighed and prepared based on the average weight of animals to 20mg/kg
using 40% DMSO in ultra pure water. The drug was administered intraperitoneally (i.p.)
to 8 groups of animals (n=3). Animals were anaesthetized with halothane before blood was
collected by cardiac puncture at 0, 15, 30, 60, 120, 240, 360, and 480 min post dose. The
rats were euthanized with halothane and termination was confirmed by the absence of
breathing and dissection was performed immediately. The brains were surgically removed
and snap frozen in liquid nitrogen vapour before storage at −80oC.
Sample preparation for MALDI-MSI
Optimal cutting temperature (OCT) was used as a medium to mount the tissue onto the
chuck of the cryostat and serial sections (10 µm thick) were obtained from each biopsy and
thaw mounted onto an indium titanium oxide (ITO) coated glass slide (Bruker, Bremen,
Germany) with the aid of a cryostat (Leica Microsystems CM1100, Wetzlar, Germany) and
stored at −80 °C till needed for analysis. Glass slides were removed from deep freeze and
immediately transferred to a desiccator. Following 30 min desiccation times, the slides
were scanned on a flatbed scanner (HP LaserJet 3055). Matrix preparation was done by
preparing 7 mg/ml α-cyano-4-hydroxy cinnamic acid (CHCA) (Bruker, Bremen, Germany)
matrix solution in 50% acetonitrile (ACN) containing 0.2% trifluoroacetic acid (TFA). The
matrix solution was sonicated for 5 min before transferring to an Image Prep (Bruker
Daltonics). This is a spraying device that automatically deposits matrix solution onto the
tissue in a consistent manner. Briefly, aerosol is generated by vibrating spray generator
producing tiny droplets (average droplet size of ≈20 µm) under controlled conditions. The
pre-developed Image prep method had 5 phases which all included spraying, incubation
156
and drying times respectively. The total thickness of matrix layer deposited on all slides
determined by the optical sensor was 1.5 V.
MSI Analysis
For all MSI analyses, it is important to give details of parameters, protocols and equipment
for any experiment [19]. Standard solutions of pretomanid were analyzed using MALDI
TOF MS operated both at reflectron and LIFT modes respectively with the aid of the
Autoflex III MALDI TOF/TOF 1 KHz smartbeam laser (Bruker Daltonics, Germany) and
data acquired using FlexControl (version 3.4, build 119) software in positive ion mode.
The LIFT mode allows a re-acceleration of ions in such a way that all fragment ions
penetrate far enough into the reflector to provide a spectrum of fragment ions with
improved spectral resolution. The instrument was calibrated using standard peptides and
standard concentrations of the drug spotted with HCCA matrix on a ground steel target
(Bruker Daltonics, Germany) for m/z 100-500. Each spectrum was acquired from 200 laser
shots with a laser frequency of 200 Hz. Tissue sections were imaged with spatial resolution
of 100 µm. The MALDI images were displayed using the software Flex Imaging 3.0
(Bruker Daltonics, Germany). Spotting various concentrations (5, 10, 100, 250 and 500
ng/mL respectively) of pretomanid with the matrix onto a brain section of an untreated
animal was used to evaluate background signals that may interfere with the analyte and to
determine a limit of detection. The spots were analyzed in reflectron mode by collecting
200 shots per spot. The MS/MS experiments were executed using the LIFT method
optimized for the drug by exact tuning of the timing of the LIFT cell and of the precursor
ion selector. This method has the major advantage of acquiring data for both parent and
fragments of the analyte consecutively, providing adequate information on the analyte. The
LIFT method was calibrated as earlier mentioned and the same method was used to perform
MS/MS directly on pretomanid-matrix spotted tissue section and spectra were compared to
the MS/MS spectra generated from of the drug standard only. For the initial analysis of the
manually deposited spots, spectra consisting of 1000 laser shots were acquired in bundles
of 5 x 200 shots and data were collected in the range between m/z 100–500 with a laser
frequency of 200 Hz, mass window range of 2 Da and the digitalization rate was 2 GS/s.
A product ion scan of the parent ion (m/z 360) revealed a clear fragmentation pattern with
the transition m/z 360 → 344dominating the spectra with a laser power of 60%. An increase
in the laser power led to production of other product ions but with lower sensitivity. The
software, Flex Imaging version 3.0 build 54 was used to set up the acquisition of the
157
imaging experiments. The imaging MS/MS experiments were performed by collecting
spectra with a raster width of 100 µm in the same m/z range as above. The spectra were
baseline subtracted (Convex hull) and smoothed (Savitzski golay) in the processing
software during acquisition. In LIFT mode, all spectra were normalized against total ion
count (TIC) to reduce influences by matrix hot spots. We define the total ion count as the
sum of all intensities in the mass range analyzed. For this analysis, both fragment and
parent spectra were acquired from each spot and 500 laser shots were summed up in a
random walk pattern from each position. The pretomanid parent ion of m/z 360 and
fragment with m/z 344 were used to visualize the distribution of pretomanid in the 3 serial
brain sections from the same animal in triplicate.
Results
The results of the MSI optimization are shown in Figure 1, the spectra show the transition
of pretomanid from parent ion m/z 360→344. This transition was chosen for the MSI assay
because during the method development and optimization in the LIFT mode, the m/z 344
had the highest intensity (as shown in Figure 1). An increase in the laser power led to
production of other product ions but with lower sensitivity. This made it possible for the
visualization and mapping of the drug in the brain sections. The [M-16u]+• ion,
corresponding to an oxygen loss, was observed in all cases as a significant peak.

158
Figure 1. Spectra acquired using LIFT-positive mode; (A) typical spectrum obtained during the optimization of pretomanid on the brain tissue sections, (B) spectrum of the parent ion, and (C) spectrum of the fragments obtained.
This kind of fragmentation has been previously described for similar moieties [20, 21]. The
result of the limit of detection as shown in Figure 2 reported a value of 10ng/mL. From
the results of the MSI experiments shown in Figure 3, it can be seen that the initial entry
of the drug occurred via the cerebral capillary network of the BBB into the cortical regions
(C) of the rat brain (15 and 30 min snapshots). The drug might have diffused into the brain
via the endothelial tight junctions of the cerebral capillary network whose entry point is
found adjacent to the superior sagitial sinus [22] or possibly transported. These might be
responsible for the distribution pattern observed at 30 min, where it can be seen
concentrating at the cortex (C).
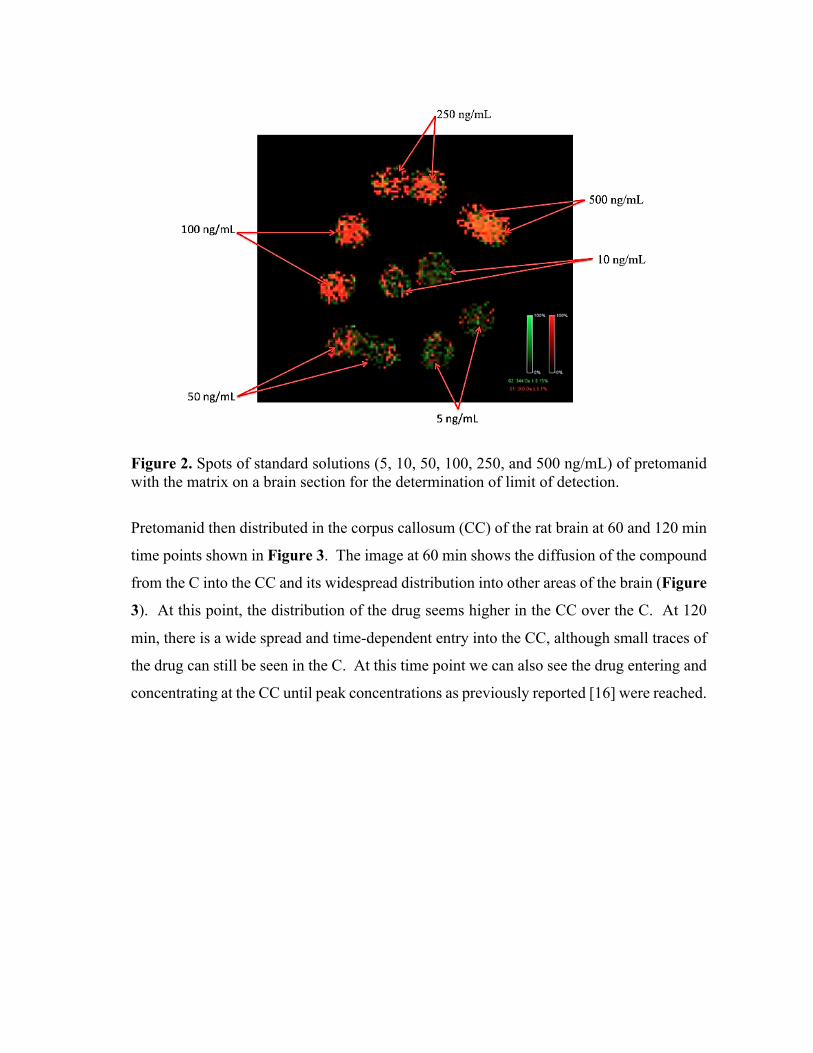
159
Figure 2. Spots of standard solutions (5, 10, 50, 100, 250, and 500 ng/mL) of pretomanid with the matrix on a brain section for the determination of limit of detection.
Pretomanid then distributed in the corpus callosum (CC) of the rat brain at 60 and 120 min
time points shown in Figure 3. The image at 60 min shows the diffusion of the compound
from the C into the CC and its widespread distribution into other areas of the brain (Figure
3). At this point, the distribution of the drug seems higher in the CC over the C. At 120
min, there is a wide spread and time-dependent entry into the CC, although small traces of
the drug can still be seen in the C. At this time point we can also see the drug entering and
concentrating at the CC until peak concentrations as previously reported [16] were reached.

160
Figure 3. Coronal brain images acquired from 0 min to 480 min after intraperitoneal administration of pretomanid (20 mg/kg) to rats, acquired using LIFT mode with both parent and fragments simultaneously. Red represents the parent ion with a mass window m/z 360 ± 0.1% and green is the fragment of the drug at m/z 344 ± 0.15%, these data represents mean ± standard deviation (SD) respectively. Images 15 and 30 min respectively showed initial entry of pretomanid in a coronal section of the rat brain via the BBB and 60 and 120 min revealed the distribution of pretomanid into the CC. Images 240, 360 and 480 min respectively displayed a diffusion of the drug into other parts of the brain.
In the next phase, 240, 360 and 480 min respectively, we observed reduced intensity of the
drug which might have been due to elimination of the drug since the cerebrospinal fluid is
regularly produced by the choroid plexus for this purpose. The images for the latter two
time points indicate a steady decrease in the concentration of the drug in the CC, providing
evidence of outward diffusion into neighbouring areas of the brain. As evident in the
images, the distribution of the drug at these time points does not vary greatly. The exact
mechanism of how the pretomanid leaves the CC is unclear, however by analysing the
images we can postulate that the drug is able to slowly diffuse and dissipate throughout the
brain until trough concentrations are reached as shown in Figure 4.

161
Figure 4. Drug-concentration time profile of pretomanid in the brain after intraperitoneal administration of 20mg/kg to rats [16]. Data represented are mean ± SD.
Discussion
The novelty of this study lies in the ability of MSI to show the localization of pretomanid
in a healthy rat brain. The significance of the use of uninfected rats in this study allows for
the determination of the compounds distribution in the brain during the early course of an
infection. Coupled with quantification data via LCMS/MS, would allow us to determine if
it reached the therapeutic doses required to treat the associated neurological infections [23].
Pretomanid is a pro-drug belonging to a class of antibiotics known as nitroimidizoles,
which have proven to become active under hypoxic conditions [24]. In a previous study,
our research team developed, optimised and validated a LC/MS/MS method for the
detection of pretomanid in rat plasma, lung and brain homogenates and the Cmax of the drug
in the brain homogenate was 236.8ng/g with a Tmax of 120 min (as shown in the Figure 4)
and the lowest concentration reported within the same time of our study was 161.5ng/g.
The observed trend of the images could be paired with concentrations reported earlier [16]
and this correlates with our findings. The reported Cmax depicts that the concentration
reached by the drug in the brain is within the therapeutic range for MTB as previously
reported [25]. However, from the available work on this nitroimidizole we are able to make
certain postulations regarding this unusual distribution pattern. Upon the interpretation of

162
our acquired images, we were able to show the initial entry of the drug into the brain via
the BBB, which is expected due its Log P value of 2.7 [26]. Using this information, we
propose that pretomanid is able to diffuse into the neighbouring lateral ventricles and
follows the rostral migratory stream to the olfactory area leading to the observed reduction
in drug distribution after 120 min in the CC. The findings we have presented in this paper
together with previous reports indicate that the distribution and localisation of drugs in the
brain vary among different groups of antibiotics depending on their structural and chemical
properties [27-30].
We have developed for the first time a MALDI MSI method for the localization of
pretomanid in rat brain tissues. This study has shown the application of MALDI-MSI in
evaluating the tissue distribution of the drug even at trough concentrations. This study
proves that this technique has great potential for drug distribution in uninfected as well as
infected tissue samples, without the need for molecular labeling, highlighting the
importance of this technique for pharmacological applications. Our study has shown that
this chemical agent distributes at the CC and a reason for its location at this part of the brain
might be because of the hypoxic nature of this feature. CC had previously been described
as an area with rich blood supply but it is relatively hypoxic due to its fibrous structure [31]
and pretomanid itself had earlier been reported as a pro-drug that is active under hypoxic
conditions [24]. It has earlier been shown that infection leads to the development of an
hypoxic environment that could aid the favourable concentration of this drug at the specific
sites of infection, we suggest that investigations using infected models be used to further
elucidate and explore the sterilizing potentials of pretomanid.
Declaration of interest
The authors report no conflicts of interest. The authors alone are responsible for the
content and writing of this article.
163
References 1. World Health Organization, W.H.O., Antimicrobial resistance: global report on
surveillance. 2014: World Health Organization. 2. Zumla, A., P. Nahid, and S.T. Cole, Advances in the development of new tuberculosis
drugs and treatment regimens. Nature Reviews Drug Discovery, 2013. 12(5): p. 388-404.
3. Wong, E.B., K.A. Cohen, and W.R. Bishai, Rising to the challenge: new therapies for tuberculosis. Trends in microbiology, 2013. 21(9): p. 493-501.
4. Tasneen, R., et al., Contribution of the Nitroimidazoles PA-824 and TBA-354 to the Activity of Novel Regimens in Murine Models of Tuberculosis. Antimicrobial agents and chemotherapy, 2015. 59(1): p. 129-135.
5. Williams, K., et al., Sterilizing activities of novel combinations lacking first-and second-line drugs in a murine model of tuberculosis. Antimicrobial agents and chemotherapy, 2012. 56(6): p. 3114-3120.
6. Himmelsbach, M., 10years of MS instrumental developments–Impact on LC–MS/MS in clinical chemistry. Journal of Chromatography B, 2012. 883: p. 3-17.
7. Dartois, V., The path of anti-tuberculosis drugs: from blood to lesions to mycobacterial cells. Nature Reviews Microbiology, 2014. 12(3): p. 159-167.
8. Solon, E.G., Use of radioactive compounds and autoradiography to determine drug tissue distribution. Chemical research in toxicology, 2012. 25(3): p. 543-555.
9. Stumpf, W.E., Whole-body and microscopic autoradiography to determine tissue distribution of biopharmaceuticals—Target discoveries with receptor micro-autoradiography engendered new concepts and therapies for vitamin D. Advanced drug delivery reviews, 2013. 65(8): p. 1086-1097.
10. Matthews, P.M., et al., Positron emission tomography molecular imaging for drug development. British Journal of Clinical Pharmacology, 2012. 73(2): p. 175-186.
11. Svatoš, A., Mass spectrometric imaging of small molecules. Trends in Biotechnology, 2010. 28(8): p. 425-434.
12. Prideaux, B. and M. Stoeckli, Mass spectrometry imaging for drug distribution studies. J. Proteomics, 2012. 75(Copyright (C) 2015 American Chemical Society (ACS). All Rights Reserved.): p. 4999-5013.
13. Amstalden van Hove, E.R., D.F. Smith, and R.M.A. Heeren, A concise review of mass spectrometry imaging. J. Chromatogr. A, 2010. 1217(Copyright (C) 2015 American Chemical Society (ACS). All Rights Reserved.): p. 3946-3954.
14. Heeren, R., Getting the picture: The coming of age of imaging MS. International Journal of Mass Spectrometry, 2014.
15. Castellino, S., MALDI imaging MS analysis of drug distribution in tissue: the right time!(?). Bioanalysis, 2012. 4(21): p. 2549-2551.
16. Bratkowska, D., et al., Determination of the antitubercular drug PA-824 in rat plasma, lung and brain tissues by liquid chromatography tandem mass spectrometry: Application to a pharmacokinetic study. Journal of Chromatography B, 2015. 988: p. 187-194.
17. Lakshminarayana, S.B., et al., Pharmacokinetics-pharmacodynamics analysis of bicyclic 4-nitroimidazole analogs in a murine model of tuberculosis. PLoS One, 2014. 9(Copyright (C) 2015 American Chemical Society (ACS). All Rights Reserved.): p. e105222/1-e105222/12, 12 pp.
18. Wang, L., et al., LC–MS/MS method for the simultaneous determination of PA-824, moxifloxacin and pyrazinamide in rat plasma and its application to pharmacokinetic study. Journal of pharmaceutical and biomedical analysis, 2014. 97: p. 1-8.

164
19. McDonnell, L.A., et al., Discussion point: reporting guidelines for mass spectrometry imaging. Analytical and bioanalytical chemistry, 2014. 407(8): p. 2035-2045.
20. Levsen, K., et al., Even-electron ions: a systematic study of the neutral species lost in the dissociation of quasi-molecular ions. Journal of mass spectrometry, 2007. 42(8): p. 1024-1044.
21. Kaneko, R. and Y. Wada, Decomposition of protein nitrosothiolsin matrix-assisted laser desorption/ionization and electrospray ionization mass spectrometry. Journal of mass spectrometry, 2003. 38(5): p. 526-530.
22. Abbott, N.J., et al., Structure and function of the blood–brain barrier. Neurobiology of disease, 2010. 37(1): p. 13-25.
23. Nau, R., F. Sörgel, and H. Eiffert, Penetration of drugs through the blood-cerebrospinal fluid/blood-brain barrier for treatment of central nervous system infections. Clinical microbiology reviews, 2010. 23(4): p. 858-883.
24. Manjunatha, U., H.I.M. Boshoff, and C.E. Barry, The mechanism of action of PA-824. Communicative & Integrative Biology, 2009. 2(3): p. 215-218.
25. Lenaerts, A.J., et al., Preclinical testing of the nitroimidazopyran PA-824 for activity against Mycobacterium tuberculosis in a series of in vitro and in vivo models. Antimicrobial agents and chemotherapy, 2005. 49(6): p. 2294-2301.
26. Denny, W.A. and B.D. Palmer, The nitroimidazooxazines (PA-824 and analogs): structure-activity relationship and mechanistic studies. Future medicinal chemistry, 2010. 2(8): p. 1295-1304.
27. Liu, L., et al., Radiosynthesis and bioimaging of the tuberculosis chemotherapeutics isoniazid, rifampicin and pyrazinamide in baboons. Journal of medicinal chemistry, 2010. 53(7): p. 2882-2891.
28. Mindermann, T., et al., Penetration of rifampicin into the brain tissue and cerebral extracellular space of rats. Journal of Antimicrobial Chemotherapy, 1993. 31(5): p. 731-737.
29. Shobo, A., et al., MALDI MSI and LCMS/MS: Towards preclinical determination of the neurotoxic potential of fluoroquinolones.
30. Shobo, A., et al., Visualization of Time-Dependent Distribution of Rifampicin in Rat Brain Using MALDI MSI and Quantitative LCMS/MS. Assay and drug development technologies, 2015.
31. Aboitiz, F., et al., Fiber composition of the human corpus callosum. Brain research, 1992. 598(1): p. 143-153.

165
Chapter 10 - Summary
In this series of projects, the value of MSI in the evaluation of new and promising anti-TB
agents, have been demonstrated. Not only does this bode well for anti-mycobacterial agents
this technique can also be applied to the evaluation of other anti-bacterial agents, especially in
terms of tissue distribution and localization. This has great potential for streamlining the drug
development process by either identifying or eliminating drug candidates during the early
stages. This is possible due to some distinct advantages MSI has over other more commonly
used molecular imaging modalities, such as PET and MRI. MSI can be seen as the future of
molecular imaging and diagnostics, allowing for the high-throughput screening of a large
sample size within a short period of time, requiring minimal sample preparation. In addition,
this technique allows for the simultaneous identification of drugs, drug metabolites, bio-
markers, receptors etc., whereas other modalities are only able to detect one target molecule
per an instance. Even with this versatility, the specificity of MSI is unquestioned since the
molecular mass and signature of a compound is used to identify targets. The sum of all the MSI
experiments carried out during this period has yielded interesting results in that no two anti-
bacterial agents have displayed the same CNS distribution. This proves that brain drug
localization is highly preferential and is affected by the chemical properties of the drug and the
physical properties of the BBB. Using these findings, we were able to show how MSI can be
highly beneficial in the pre-clinical evaluation of anti-bacterial agents, specifically targeting
extra-pulmonary-TB of the brain.
In Chapter 1, we are the first to provide evidence that CFZ does in fact enter the brain, using
MSI. This was in vast contrast to the popular belief that the drug does not penetrate the BBB.
CFZ showed widespread distribution in the brain, with high concentrations in the lateral
ventricles. This is especially significant since the lateral ventricles house the choroid plexus
and is responsible for the production and circulation of CSF throughout the brain. In Chapter
2, the same experimental approach was used to demonstrate the neuroprotective potential of
LIN. MSI findings showed that the drug showed the greatest deposition in the brain stem,
which forms the entry point of systemic blood vessels. This is important since the CNS is not
the primary site of bacterial infections, which normally occur systemically and are
haematogenously spread to the brain. By forming a “sentinel” in the brain stem, LIN has the
potential to prevent the entry of infectious agents into the CNS.
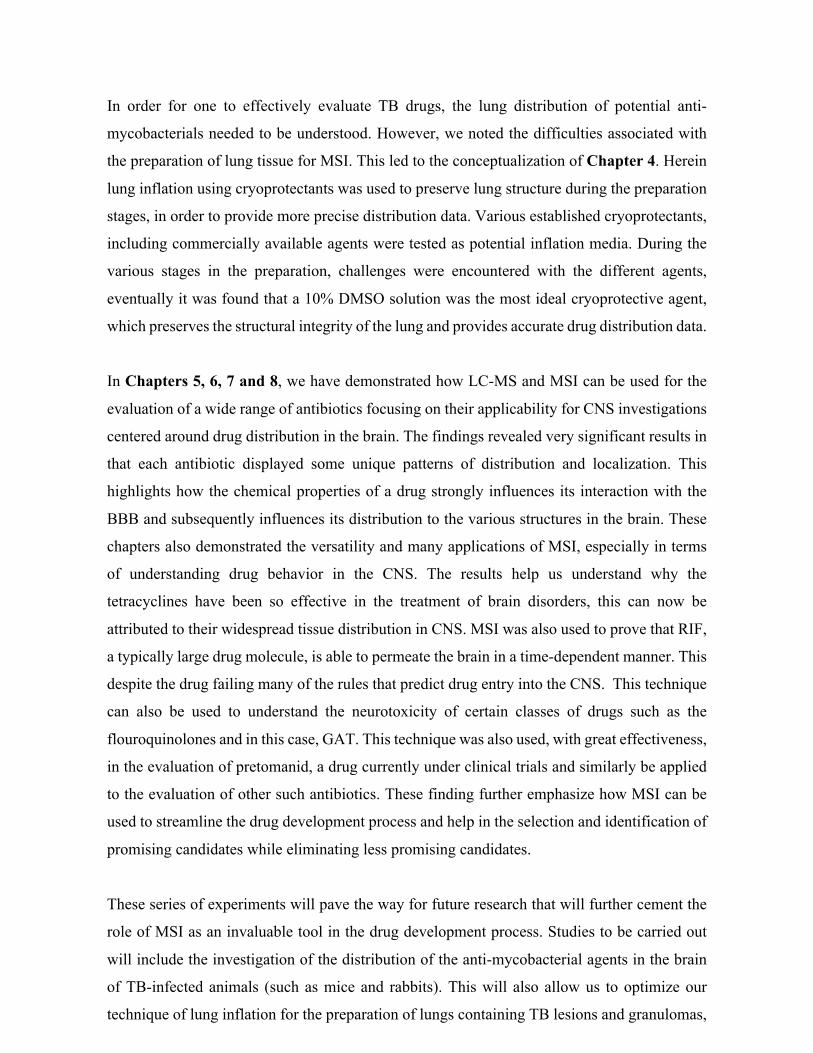
166
In order for one to effectively evaluate TB drugs, the lung distribution of potential anti-
mycobacterials needed to be understood. However, we noted the difficulties associated with
the preparation of lung tissue for MSI. This led to the conceptualization of Chapter 4. Herein
lung inflation using cryoprotectants was used to preserve lung structure during the preparation
stages, in order to provide more precise distribution data. Various established cryoprotectants,
including commercially available agents were tested as potential inflation media. During the
various stages in the preparation, challenges were encountered with the different agents,
eventually it was found that a 10% DMSO solution was the most ideal cryoprotective agent,
which preserves the structural integrity of the lung and provides accurate drug distribution data.
In Chapters 5, 6, 7 and 8, we have demonstrated how LC-MS and MSI can be used for the
evaluation of a wide range of antibiotics focusing on their applicability for CNS investigations
centered around drug distribution in the brain. The findings revealed very significant results in
that each antibiotic displayed some unique patterns of distribution and localization. This
highlights how the chemical properties of a drug strongly influences its interaction with the
BBB and subsequently influences its distribution to the various structures in the brain. These
chapters also demonstrated the versatility and many applications of MSI, especially in terms
of understanding drug behavior in the CNS. The results help us understand why the
tetracyclines have been so effective in the treatment of brain disorders, this can now be
attributed to their widespread tissue distribution in CNS. MSI was also used to prove that RIF,
a typically large drug molecule, is able to permeate the brain in a time-dependent manner. This
despite the drug failing many of the rules that predict drug entry into the CNS. This technique
can also be used to understand the neurotoxicity of certain classes of drugs such as the
flouroquinolones and in this case, GAT. This technique was also used, with great effectiveness,
in the evaluation of pretomanid, a drug currently under clinical trials and similarly be applied
to the evaluation of other such antibiotics. These finding further emphasize how MSI can be
used to streamline the drug development process and help in the selection and identification of
promising candidates while eliminating less promising candidates.
These series of experiments will pave the way for future research that will further cement the
role of MSI as an invaluable tool in the drug development process. Studies to be carried out
will include the investigation of the distribution of the anti-mycobacterial agents in the brain
of TB-infected animals (such as mice and rabbits). This will also allow us to optimize our
technique of lung inflation for the preparation of lungs containing TB lesions and granulomas,
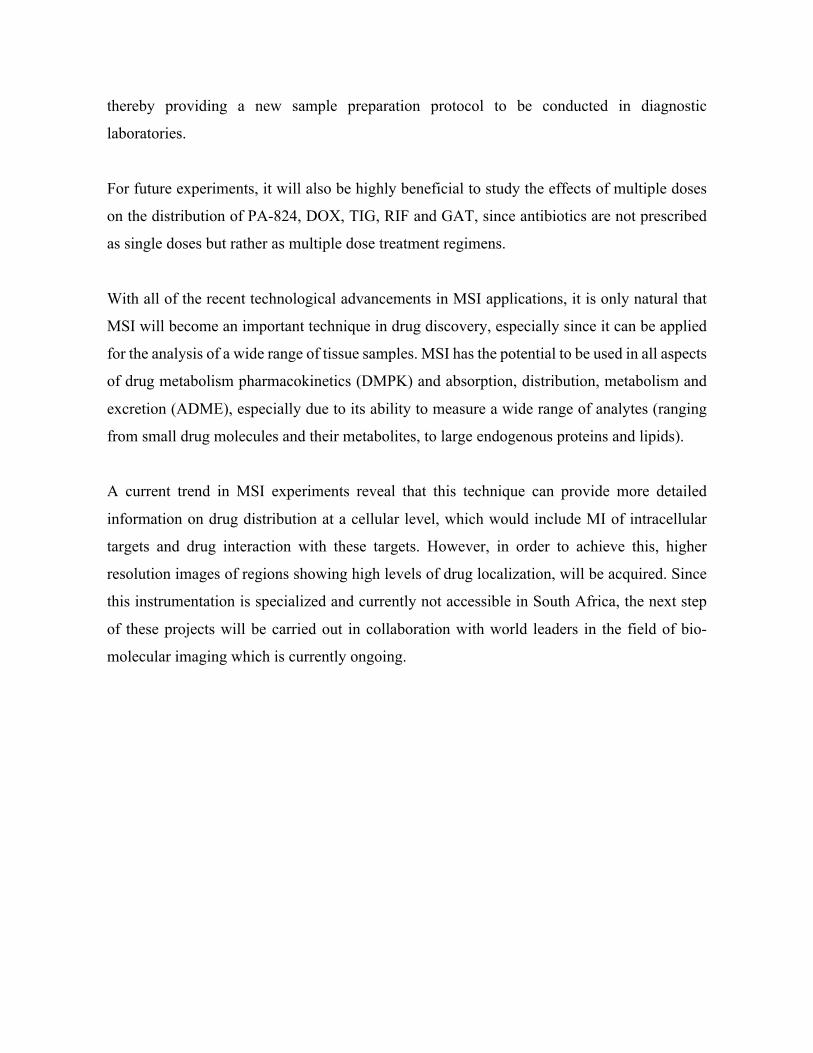
167
thereby providing a new sample preparation protocol to be conducted in diagnostic
laboratories.
For future experiments, it will also be highly beneficial to study the effects of multiple doses
on the distribution of PA-824, DOX, TIG, RIF and GAT, since antibiotics are not prescribed
as single doses but rather as multiple dose treatment regimens.
With all of the recent technological advancements in MSI applications, it is only natural that
MSI will become an important technique in drug discovery, especially since it can be applied
for the analysis of a wide range of tissue samples. MSI has the potential to be used in all aspects
of drug metabolism pharmacokinetics (DMPK) and absorption, distribution, metabolism and
excretion (ADME), especially due to its ability to measure a wide range of analytes (ranging
from small drug molecules and their metabolites, to large endogenous proteins and lipids).
A current trend in MSI experiments reveal that this technique can provide more detailed
information on drug distribution at a cellular level, which would include MI of intracellular
targets and drug interaction with these targets. However, in order to achieve this, higher
resolution images of regions showing high levels of drug localization, will be acquired. Since
this instrumentation is specialized and currently not accessible in South Africa, the next step
of these projects will be carried out in collaboration with world leaders in the field of bio-
molecular imaging which is currently ongoing.

168
Related Documents