Journal of Chromatography A, 1218 (2011) 4727–4737 Contents lists available at ScienceDirect Journal of Chromatography A jou rn al h om epage: www.elsevier.com/locat e/chroma Mass spectrometric characterization of urinary toremifene metabolites for doping control analyses C. Gómez a,b , O.J. Pozo a , R. Diaz c , J.V. Sancho c , E. Vilaroca d,e , J.P. Salvador d,e , M.P. Marco d,e , F. Hernandez c , J. Segura a,b , R. Ventura a,b,∗ a Bioanalysis and Analytical Services Research Group, Neuropsychopharmacology Research Program, IMIM, Institut de Recerca Hospital del Mar, Barcelona, Spain b Department of Experimental and Health Sciences, Universitat Pompeu Fabra, Barcelona, Spain c Research Institute for Pesticides and Water, University Jaume I, E-12071 Castellón, Spain d Applied Molecular Receptors Group, Institut de Química Avanc ¸ ada de Catalunya, CSIC, Barcelona, Spain e CIBER de Bioingeniería, Biomateriales y Nanomedicina (CIBER-BBN), Barcelona, Spain a r t i c l e i n f o Article history: Received 1 December 2010 Received in revised form 18 March 2011 Accepted 18 May 2011 Available online 27 May 2011 Keywords: Toremifene metabolites Doping control LC–MS/MS Triple quadrupole QTOF Urine samples a b s t r a c t Toremifene is a selective estrogen receptor modulator included in the list of prohibited substances in sport by the World Anti-doping Agency. The aim of the present study was to investigate toremifene metabolism in humans in order to elucidate the structures of the most abundant urinary metabolites and to define the best marker to detect toremifene administration through the analysis of urine samples. Toremifene (Fareston ® ) was administered to healthy volunteers and the urine samples were subjected to different preparation methods to detect free metabolites as well as metabolites conjugated with glucuronic acid or sulphate. Urinary extracts were analyzed by LC–MS/MS with triple quadrupole analyzer using selected reaction monitoring mode. Transitions for potential metabolites were selected by using the theoretical [M+H] + as precursor ion and m/z 72 or m/z 58 as product ions for N,N-dimethyl and N-desmethyl metabo- lites, respectively. Toremifene and 20 metabolites were detected in excretion study samples, excreted free or conjugated with glucuronic acid or sulphate. Structures for most abundant phase I metabolites were proposed using accurate mass measurements performed by QTOF MS, based on fragmentation pattern observed for those metabolites available as reference standards. Several metabolic pathways including mono- and di-hydroxylation, N-desmethylation, hydroxymethylation, oxidation, dehalogena- tion and combinations were proposed. All metabolites were detected up to one month after toremifene administration; the most abundant metabolites were detected in the free fraction and they were metabo- lites resulting from dehalogenation. Several of the metabolites elucidated in this work have not been reported until now in the scientific literature. © 2011 Elsevier B.V. All rights reserved. 1. Introduction Toremifene (2-[4-[(Z)-4-chloro-1,2-diphenylbut-1-enyl] phenoxy]-N,N-dimethylethanamine) is a selective estrogen recep- tor modulator (SERM) that is structurally similar to tamoxifen. The only difference between toremifene and tamoxifen structures is the chlorine atom in C4 which is present in toremifene (Fig. 1) and absent in tamoxifen. Anti-estrogen drugs are effective for prevention and as adjuvant treatment of estrogen-dependent breast cancer, for the treatment and prevention of post-menopausal osteoporosis and cardiovas- cular disease. Anti-estrogenic substances may cause an increase ∗ Corresponding author at: Bioanalysis and Analytical Services Research Group, IMIM, Institut de Recerca Hospital del Mar, Doctor Aiguader, 88, 08003 Barcelona, Spain. Tel.: +34 93 3160471; fax: +34 93 3160499. E-mail address: [email protected] (R. Ventura). of the endogenous production of androgens and increase endoge- nous testosterone by stimulating the release of gonadotrophines. There are no well-established clinical indications for anti-estrogens in men [1,2]. In athletes the use of antiestrogenic compounds may compensate an extensive abuse of anabolic androgenic steroids [3,4]. For these reasons, the use of agents with anti-estrogenic activ- ity has been banned in sports by the World Anti-doping Agency (WADA) [5], and anti-doping control laboratories have to be able to detect the administration of the drug. In doping control, identification of an exogenous compound is typically sufficient to declare a sample as adverse analytical finding for most of doping agents. Therefore, metabolic studies are compul- sory in order to find the metabolites that are detectable for longer period of time after administration, which are the most adequate markers for the detection of the drug misuse. Usefulness of liquid chromatography coupled to tandem mass spectrometry (LC–MS/MS) in doping control analyses have been demonstrated in several studies [6–8] with enhanced separation of 0021-9673/$ – see front matter © 2011 Elsevier B.V. All rights reserved. doi:10.1016/j.chroma.2011.05.073

Welcome message from author
This document is posted to help you gain knowledge. Please leave a comment to let me know what you think about it! Share it to your friends and learn new things together.
Transcript

Md
CFa
b
c
d
e
a
ARRAA
KTDLTQU
1
ptota
tac
IS
0d
Journal of Chromatography A, 1218 (2011) 4727– 4737
Contents lists available at ScienceDirect
Journal of Chromatography A
jou rn al h om epage: www.elsev ier .com/ locat e/chroma
ass spectrometric characterization of urinary toremifene metabolites foroping control analyses
. Gómeza,b, O.J. Pozoa, R. Diazc, J.V. Sanchoc, E. Vilarocad,e, J.P. Salvadord,e, M.P. Marcod,e,. Hernandezc, J. Seguraa,b, R. Venturaa,b,∗
Bioanalysis and Analytical Services Research Group, Neuropsychopharmacology Research Program, IMIM, Institut de Recerca Hospital del Mar, Barcelona, SpainDepartment of Experimental and Health Sciences, Universitat Pompeu Fabra, Barcelona, SpainResearch Institute for Pesticides and Water, University Jaume I, E-12071 Castellón, SpainApplied Molecular Receptors Group, Institut de Química Avanc ada de Catalunya, CSIC, Barcelona, SpainCIBER de Bioingeniería, Biomateriales y Nanomedicina (CIBER-BBN), Barcelona, Spain
r t i c l e i n f o
rticle history:eceived 1 December 2010eceived in revised form 18 March 2011ccepted 18 May 2011vailable online 27 May 2011
eywords:oremifene metabolitesoping controlC–MS/MSriple quadrupoleTOFrine samples
a b s t r a c t
Toremifene is a selective estrogen receptor modulator included in the list of prohibited substances in sportby the World Anti-doping Agency. The aim of the present study was to investigate toremifene metabolismin humans in order to elucidate the structures of the most abundant urinary metabolites and to definethe best marker to detect toremifene administration through the analysis of urine samples. Toremifene(Fareston®) was administered to healthy volunteers and the urine samples were subjected to differentpreparation methods to detect free metabolites as well as metabolites conjugated with glucuronic acidor sulphate. Urinary extracts were analyzed by LC–MS/MS with triple quadrupole analyzer using selectedreaction monitoring mode. Transitions for potential metabolites were selected by using the theoretical[M+H]+ as precursor ion and m/z 72 or m/z 58 as product ions for N,N-dimethyl and N-desmethyl metabo-lites, respectively. Toremifene and 20 metabolites were detected in excretion study samples, excretedfree or conjugated with glucuronic acid or sulphate. Structures for most abundant phase I metaboliteswere proposed using accurate mass measurements performed by QTOF MS, based on fragmentation
pattern observed for those metabolites available as reference standards. Several metabolic pathwaysincluding mono- and di-hydroxylation, N-desmethylation, hydroxymethylation, oxidation, dehalogena-tion and combinations were proposed. All metabolites were detected up to one month after toremifeneadministration; the most abundant metabolites were detected in the free fraction and they were metabo-lites resulting from dehalogenation. Several of the metabolites elucidated in this work have not beenscien
reported until now in the. Introduction
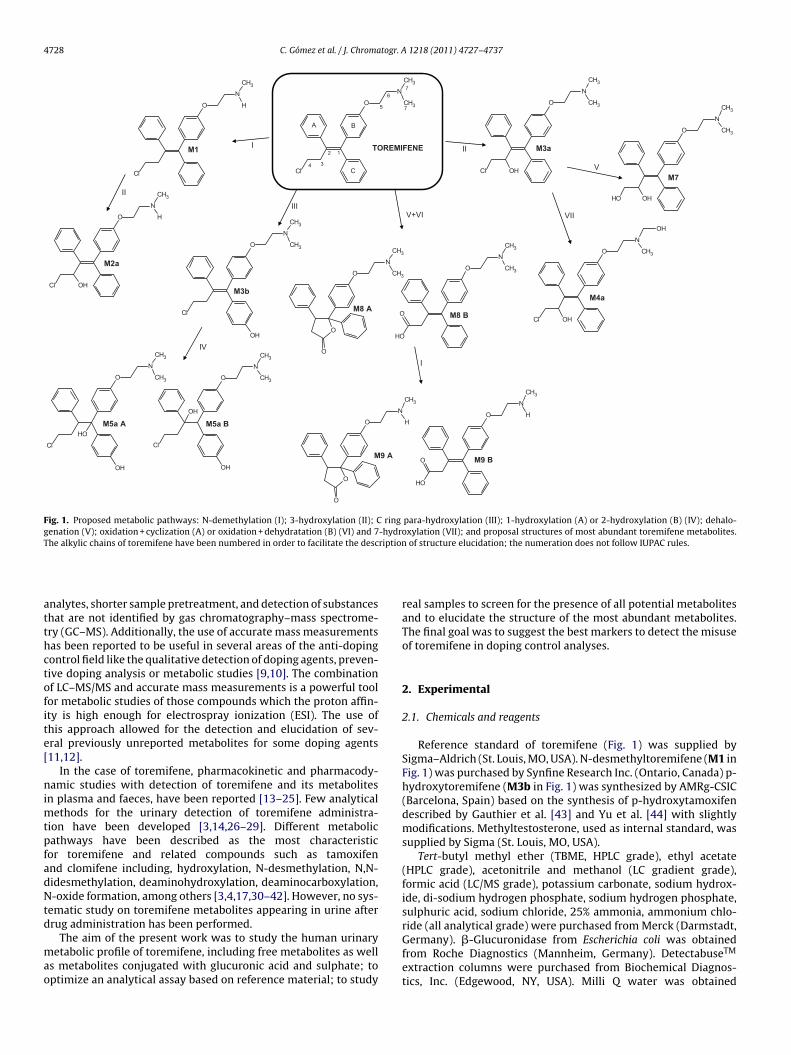
Toremifene (2-[4-[(Z)-4-chloro-1,2-diphenylbut-1-enyl]henoxy]-N,N-dimethylethanamine) is a selective estrogen recep-or modulator (SERM) that is structurally similar to tamoxifen. Thenly difference between toremifene and tamoxifen structures ishe chlorine atom in C4 which is present in toremifene (Fig. 1) andbsent in tamoxifen.
Anti-estrogen drugs are effective for prevention and as adjuvant
reatment of estrogen-dependent breast cancer, for the treatmentnd prevention of post-menopausal osteoporosis and cardiovas-ular disease. Anti-estrogenic substances may cause an increase∗ Corresponding author at: Bioanalysis and Analytical Services Research Group,MIM, Institut de Recerca Hospital del Mar, Doctor Aiguader, 88, 08003 Barcelona,pain. Tel.: +34 93 3160471; fax: +34 93 3160499.
E-mail address: [email protected] (R. Ventura).
021-9673/$ – see front matter © 2011 Elsevier B.V. All rights reserved.oi:10.1016/j.chroma.2011.05.073
tific literature.© 2011 Elsevier B.V. All rights reserved.
of the endogenous production of androgens and increase endoge-nous testosterone by stimulating the release of gonadotrophines.There are no well-established clinical indications for anti-estrogensin men [1,2]. In athletes the use of antiestrogenic compounds maycompensate an extensive abuse of anabolic androgenic steroids[3,4]. For these reasons, the use of agents with anti-estrogenic activ-ity has been banned in sports by the World Anti-doping Agency(WADA) [5], and anti-doping control laboratories have to be ableto detect the administration of the drug.
In doping control, identification of an exogenous compound istypically sufficient to declare a sample as adverse analytical findingfor most of doping agents. Therefore, metabolic studies are compul-sory in order to find the metabolites that are detectable for longerperiod of time after administration, which are the most adequate
markers for the detection of the drug misuse.Usefulness of liquid chromatography coupled to tandem massspectrometry (LC–MS/MS) in doping control analyses have beendemonstrated in several studies [6–8] with enhanced separation of
4728 C. Gómez et al. / J. Chromatogr. A 1218 (2011) 4727– 4737
TOREMIFENEM1
M3b
M3a
M4a
M2a
M7
M8 AM8 B
M9 A M9 B
M5a A M5a B
Fig. 1. Proposed metabolic pathways: N-demethylation (I); 3-hydroxylation (II); C ring para-hydroxylation (III); 1-hydroxylation (A) or 2-hydroxylation (B) (IV); dehalo-genation (V); oxidation + cyclization (A) or oxidation + dehydratation (B) (VI) and 7-hydroxylation (VII); and proposal structures of most abundant toremifene metabolites.The alkylic chains of toremifene have been numbered in order to facilitate the description of structure elucidation; the numeration does not follow IUPAC rules.
atthctofite[
nimtpfadNtd
mao
nalytes, shorter sample pretreatment, and detection of substanceshat are not identified by gas chromatography–mass spectrome-ry (GC–MS). Additionally, the use of accurate mass measurementsas been reported to be useful in several areas of the anti-dopingontrol field like the qualitative detection of doping agents, preven-ive doping analysis or metabolic studies [9,10]. The combinationf LC–MS/MS and accurate mass measurements is a powerful toolor metabolic studies of those compounds which the proton affin-ty is high enough for electrospray ionization (ESI). The use ofhis approach allowed for the detection and elucidation of sev-ral previously unreported metabolites for some doping agents11,12].
In the case of toremifene, pharmacokinetic and pharmacody-amic studies with detection of toremifene and its metabolites
n plasma and faeces, have been reported [13–25]. Few analyticalethods for the urinary detection of toremifene administra-
ion have been developed [3,14,26–29]. Different metabolicathways have been described as the most characteristicor toremifene and related compounds such as tamoxifennd clomifene including, hydroxylation, N-desmethylation, N,N-idesmethylation, deaminohydroxylation, deaminocarboxylation,-oxide formation, among others [3,4,17,30–42]. However, no sys-
ematic study on toremifene metabolites appearing in urine afterrug administration has been performed.
The aim of the present work was to study the human urinaryetabolic profile of toremifene, including free metabolites as well
s metabolites conjugated with glucuronic acid and sulphate; toptimize an analytical assay based on reference material; to study
real samples to screen for the presence of all potential metabolitesand to elucidate the structure of the most abundant metabolites.The final goal was to suggest the best markers to detect the misuseof toremifene in doping control analyses.
2. Experimental
2.1. Chemicals and reagents
Reference standard of toremifene (Fig. 1) was supplied bySigma–Aldrich (St. Louis, MO, USA). N-desmethyltoremifene (M1 inFig. 1) was purchased by Synfine Research Inc. (Ontario, Canada) p-hydroxytoremifene (M3b in Fig. 1) was synthesized by AMRg-CSIC(Barcelona, Spain) based on the synthesis of p-hydroxytamoxifendescribed by Gauthier et al. [43] and Yu et al. [44] with slightlymodifications. Methyltestosterone, used as internal standard, wassupplied by Sigma (St. Louis, MO, USA).
Tert-butyl methyl ether (TBME, HPLC grade), ethyl acetate(HPLC grade), acetonitrile and methanol (LC gradient grade),formic acid (LC/MS grade), potassium carbonate, sodium hydrox-ide, di-sodium hydrogen phosphate, sodium hydrogen phosphate,sulphuric acid, sodium chloride, 25% ammonia, ammonium chlo-ride (all analytical grade) were purchased from Merck (Darmstadt,
Germany). �-Glucuronidase from Escherichia coli was obtainedfrom Roche Diagnostics (Mannheim, Germany). DetectabuseTMextraction columns were purchased from Biochemical Diagnos-tics, Inc. (Edgewood, NY, USA). Milli Q water was obtained

togr. A
bS
2
tdtwpp8ttew
apfcootuTer5(3ateAsgwv
mdtr(nu1K5(tTd
2
Aascaff
C. Gómez et al. / J. Chroma
y a Milli-Q purification system (Millipore Ibérica, Barcelona,pain).
.2. Sample preparation procedures
Free fraction of metabolites. The extraction of free urinaryoremifene metabolites was based on a previously described proce-ure [45,46]. Briefly, 100 ng mL−1 of methyltestostenone was addedo 5 mL aliquots of urine samples and the pH was made alkalineith 100 �L of 5.3 M ammonium chloride solution (adjusted toH 9.5 with ammonia). Then, sodium chloride (1 g) was added toromote salting-out effect and the samples were extracted with
mL of ethyl acetate by shaking at 40 mpm for 20 min. After cen-rifugation (3500 rpm, 5 min), the organic layers were evaporatedo dryness under a nitrogen stream in a water bath at 40 ◦C. Thextracts were reconstituted with 100 �L of a mixture of deionisedater:acetonitrile (50:50, v|v).
Glucuronide fraction of metabolites. Samples (5 mL) weredjusted to pH 7 with 1.5 mL of sodium phosphate buffer (0.2 M,H 7) and were extracted with 5 mL of TBME by shaking at 40 mpmor 20 min. After centrifugation (3500 rpm, 5 min), the organic layerontaining free metabolites was discarded. The small volume ofrganic solvent still present on top of the aqueous phase was evap-rated under stream of nitrogen. After addition of ISTD solution,he aqueous phase was passed through a DetectabuseTM col-mn previously conditioned with 2 mL methanol and 2 mL water.he column was washed with 2 mL water and the analytes wereluted with 2 mL methanol. The methanolic extract was evapo-ated to dryness under a stream of nitrogen in a water bath at0 ◦C and reconstituted with 1 mL of sodium phosphate buffer0.2 M, pH 7). Enzymatic hydrolysis was performed by adding0 �L of �-glucuronidase from E. coli and incubating the mixturet 55 ◦C for 1 h. After the sample reached the ambient tempera-ure 250 �L of 5% K2CO3 solution was added and the mixture wasxtracted with 5 mL of TBME by shaking at 40 mpm for 20 min.fter centrifugation (3500 rpm, 5 min), the organic layers wereeparated and evaporated to dryness under a stream of nitro-en in a water bath at 40 ◦C. The dry extracts were reconstitutedith 100 �L of a mixture of deionised water:acetonitrile (50:50,|v).
Sulphated fraction of metabolites. The recovery of sulphatedetabolites was accomplished using a procedure previously
escribed [47]. The extracts obtained after DetectabuseTM extrac-ion, using the procedure described in the previous paragraph, wereeconstituted with 4 mL of ethyl acetate/methanol/sulphuric acid80:20:0.06, v|v|v) and incubated at 55 ◦C for 2 h. The samples wereeutralized with 60 �L of 1 M NaOH and evaporated to drynessnder a stream of nitrogen. The residues were reconstituted in
mL of sodium phosphate buffer (0.2 M, pH 7) and 250 �L of 5%2CO3 solution were added. The extraction was performed with
mL of TBME by shaking at 40 mpm for 20 min. After centrifugation3500 rpm, 5 min), the organic layer was separated and evaporatedo dryness under a stream of nitrogen in a water bath at 40 ◦C.he dry extracts were reconstituted with 100 �L of a mixture ofeionised water:acetonitrile (90:10, v|v).
.3. LC–MS/MS study of urinary metabolic profile of toremifene
Chromatographic separation was carried out on a Waterscquity UPLCTM system (Waters Corporation, Milford, MA) usingn Acquity BEH C18 column (100 mm × 2.1 mm i.d., 1.7 �m particleize). The column temperature was set to 45 ◦C. The mobile phase
onsisted of deionized water with 0.01% formic acid (solvent A) andcetonitrile with 0.01% formic acid (solvent B). Separation was per-ormed at a flow rate of 0.4 mL min−1 and using a gradient pattern:rom 0 to 1 min, 5% B; from 1 to 16 min, to 90% B; during 1.6 min,1218 (2011) 4727– 4737 4729
90% B; from 17.6 to 17.8 min, to 5% B; from 17.8 to 23 min, 5% B.The mobile phases were filtered daily using filters of 0.22 �m. Thesample volume injected was 5 �L.
The liquid chromatograph was coupled to a Quattro PremierXE triple quadrupole mass spectrometer (Micromass, Waters Cor-poration, Milford, MA.) with an electrospray (Z-spray) ionizationsource with positive ion mode ESI. Source conditions were fixedas follows: capillary voltage, 3 kV; lens voltage, 0.2 V; source tem-perature 120 ◦C; desolvation temperature, 450 ◦C; cone gas flowrate, 50 L/h; desolvation gas flow rate, 1200 L/h. Negative ionizationmode was tested, using the same conditions, except the capillaryvoltage was set at 2.5 kV. High-purity nitrogen was used as desol-vation gas and argon was used as collision gas.
For detection of toremifene metabolites, different fractions(free, glucuronide- or sulpho-conjugated metabolites) of urinesamples from excretion studies were analyses by LC–MS/MS inselected ion reaction monitoring (SRM) mode. Transitions wereselected using the protonated molecular ion [M+H]+ of the potentialmetabolite as the precursor ion, which, depending on the specificstructure, yield product ions at m/z 72, 58, or 44. The targetedmetabolic pathways are described in Table 1, and included mono-and di-hydroxylation, hydroxy-methoxylation, N-desmethyl andN,N-didemesmethyl, among others. ESI-parameters (ionizationmode, cone voltage and collision energy) and precursor ion-product ion pairs were optimized with available reference material(toremifene, M1and M3b) using direct infusion of individual stan-dard solutions of the compounds (10 �g mL−1) at 10 �L min−1 withmobile phase (50:50, A:B) at 200 �L min−1. Cone voltage was set at35 V and collision energy used was 30 eV.
2.4. Accurate mass measurement and characterization oftoremifene metabolites
Accurate mass experiments were carried out using a hybridquadrupole time-of-flight (QTOF Premier, Waters) mass spectrom-eter, and UPLC (Acquity, Waters) was interfaced with the systemvia positive ion mode ESI. Drying gas as well as nebulising gaswas nitrogen. The desolvation gas flow was set to approximately600 L/h and the cone gas flow to 50 L/h. A cone voltage of 40 Vand a capillary voltage of 3.0 kV were used in positive ionizationmode. The nitrogen desolvation temperature was set at 350 ◦Cand the source temperature at 120 ◦C. TOF MS resolution wasapproximately 10,000 (FWHM) at m/z 556. MS and MS/MS spec-tra were acquired over a m/z range of 50–1000. For both MS andMS/MS, argon (99.995%) was used as collision gas with a pressure ofapproximately 8 × 10⁻³ mbar in the collision cell. The MCP detec-tor potential was set to 1700 V. Scan times of 0.2 s/spectrum werechosen.
Calibration of the m/z axis was performed using the built-in sin-gle syringe pump, directly connected to the interface. Calibrationwas conducted from m/z 50 to 1000 with a 1:1 mixture of 0.1 Msodium hydroxide: 10% formic acid diluted (1:25) with acetoni-trile:water (80:20), at a flow rate of 10 �L min−1. For automatedaccurate mass measurement, the lockspray probe was used, usingas lockmass a solution of leucine enkephaline 2 �g mL−1 in acetoni-trile/water (50:50) pumped at 30 �L min−1 through the locksprayneedle using a Reagent Delivery Module from Waters. The proto-nated molecule of leucine enkephaline at m/z 556.2771 was usedfor recalibrating the mass axis and ensuring a robust accurate massmeasurement along time.
Chromatographic separation was carried out on the same con-
ditions (column and mobile phases) as described above using adifferent gradient pattern: from 0 to 1 min, 20% B; from 1 to 2 min,to 25% B; from 2 to 3 min, to 30% B; from 3 to 5 min, to 40% B; from5 to 17.6 min, to 90% B; during 0.4 min, 90% B; from 18 to 18.4 min,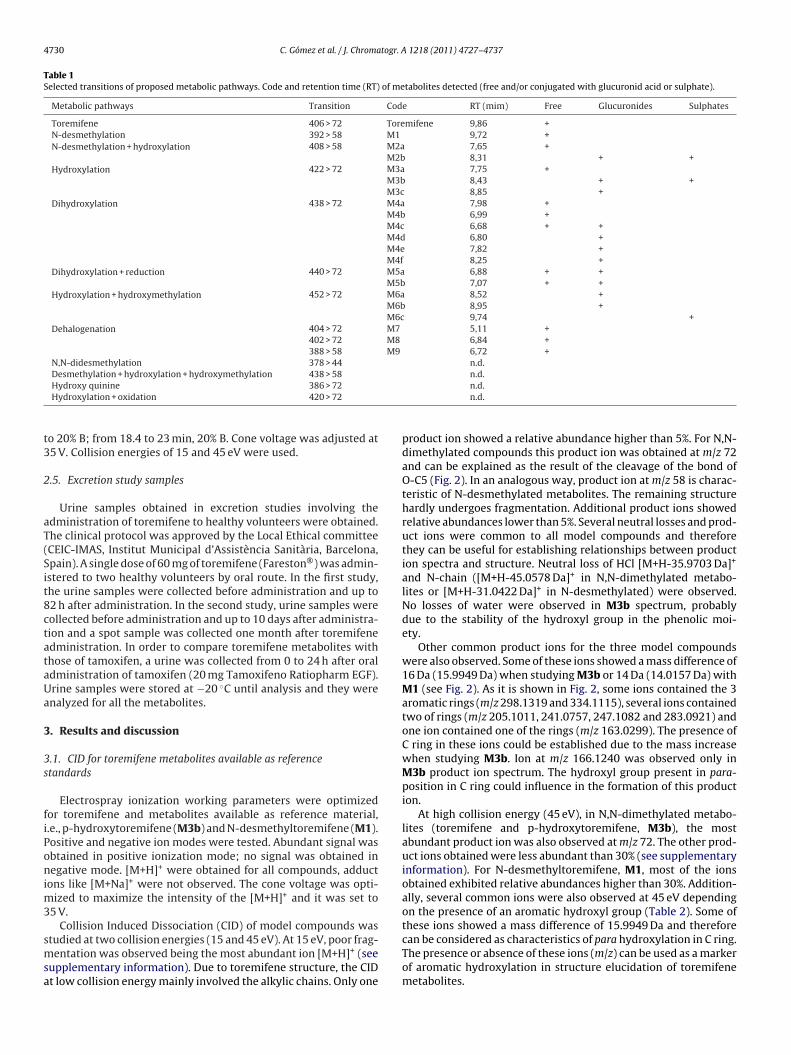
4730 C. Gómez et al. / J. Chromatogr. A 1218 (2011) 4727– 4737
Table 1Selected transitions of proposed metabolic pathways. Code and retention time (RT) of metabolites detected (free and/or conjugated with glucuronid acid or sulphate).
Metabolic pathways Transition Code RT (mim) Free Glucuronides Sulphates
Toremifene 406 > 72 Toremifene 9,86 +N-desmethylation 392 > 58 M1 9,72 +N-desmethylation + hydroxylation 408 > 58 M2a 7,65 +
M2b 8,31 + +Hydroxylation 422 > 72 M3a 7,75 +
M3b 8,43 + +M3c 8,85 +
Dihydroxylation 438 > 72 M4a 7,98 +M4b 6,99 +M4c 6,68 + +M4d 6,80 +M4e 7,82 +M4f 8,25 +
Dihydroxylation + reduction 440 > 72 M5a 6,88 + +M5b 7,07 + +
Hydroxylation + hydroxymethylation 452 > 72 M6a 8,52 +M6b 8,95 +M6c 9,74 +
Dehalogenation 404 > 72 M7 5,11 +402 > 72 M8 6,84 +388 > 58 M9 6,72 +
N,N-didesmethylation 378 > 44 n.d.Desmethylation + hydroxylation + hydroxymethylation 438 > 58 n.d.
t3
2
aT(Sit8ctataUa
3
3s
fiPonim3
smsa
Hydroxy quinine 386 > 72
Hydroxylation + oxidation 420 > 72
o 20% B; from 18.4 to 23 min, 20% B. Cone voltage was adjusted at5 V. Collision energies of 15 and 45 eV were used.
.5. Excretion study samples
Urine samples obtained in excretion studies involving thedministration of toremifene to healthy volunteers were obtained.he clinical protocol was approved by the Local Ethical committeeCEIC-IMAS, Institut Municipal d’Assistència Sanitària, Barcelona,pain). A single dose of 60 mg of toremifene (Fareston®) was admin-stered to two healthy volunteers by oral route. In the first study,he urine samples were collected before administration and up to2 h after administration. In the second study, urine samples wereollected before administration and up to 10 days after administra-ion and a spot sample was collected one month after toremifenedministration. In order to compare toremifene metabolites withhose of tamoxifen, a urine was collected from 0 to 24 h after oraldministration of tamoxifen (20 mg Tamoxifeno Ratiopharm EGF).rine samples were stored at −20 ◦C until analysis and they werenalyzed for all the metabolites.
. Results and discussion
.1. CID for toremifene metabolites available as referencetandards
Electrospray ionization working parameters were optimizedor toremifene and metabolites available as reference material,.e., p-hydroxytoremifene (M3b) and N-desmethyltoremifene (M1).ositive and negative ion modes were tested. Abundant signal wasbtained in positive ionization mode; no signal was obtained inegative mode. [M+H]+ were obtained for all compounds, adduct
ons like [M+Na]+ were not observed. The cone voltage was opti-ized to maximize the intensity of the [M+H]+ and it was set to
5 V.Collision Induced Dissociation (CID) of model compounds was
tudied at two collision energies (15 and 45 eV). At 15 eV, poor frag-entation was observed being the most abundant ion [M+H]+ (see
upplementary information). Due to toremifene structure, the CIDt low collision energy mainly involved the alkylic chains. Only one
n.d.n.d.
product ion showed a relative abundance higher than 5%. For N,N-dimethylated compounds this product ion was obtained at m/z 72and can be explained as the result of the cleavage of the bond ofO-C5 (Fig. 2). In an analogous way, product ion at m/z 58 is charac-teristic of N-desmethylated metabolites. The remaining structurehardly undergoes fragmentation. Additional product ions showedrelative abundances lower than 5%. Several neutral losses and prod-uct ions were common to all model compounds and thereforethey can be useful for establishing relationships between production spectra and structure. Neutral loss of HCl [M+H-35.9703 Da]+
and N-chain ([M+H-45.0578 Da]+ in N,N-dimethylated metabo-lites or [M+H-31.0422 Da]+ in N-desmethylated) were observed.No losses of water were observed in M3b spectrum, probablydue to the stability of the hydroxyl group in the phenolic moi-ety.
Other common product ions for the three model compoundswere also observed. Some of these ions showed a mass difference of16 Da (15.9949 Da) when studying M3b or 14 Da (14.0157 Da) withM1 (see Fig. 2). As it is shown in Fig. 2, some ions contained the 3aromatic rings (m/z 298.1319 and 334.1115), several ions containedtwo of rings (m/z 205.1011, 241.0757, 247.1082 and 283.0921) andone ion contained one of the rings (m/z 163.0299). The presence ofC ring in these ions could be established due to the mass increasewhen studying M3b. Ion at m/z 166.1240 was observed only inM3b product ion spectrum. The hydroxyl group present in para-position in C ring could influence in the formation of this production.
At high collision energy (45 eV), in N,N-dimethylated metabo-lites (toremifene and p-hydroxytoremifene, M3b), the mostabundant product ion was also observed at m/z 72. The other prod-uct ions obtained were less abundant than 30% (see supplementaryinformation). For N-desmethyltoremifene, M1, most of the ionsobtained exhibited relative abundances higher than 30%. Addition-ally, several common ions were also observed at 45 eV dependingon the presence of an aromatic hydroxyl group (Table 2). Some ofthese ions showed a mass difference of 15.9949 Da and therefore
can be considered as characteristics of para hydroxylation in C ring.The presence or absence of these ions (m/z) can be used as a markerof aromatic hydroxylation in structure elucidation of toremifenemetabolites.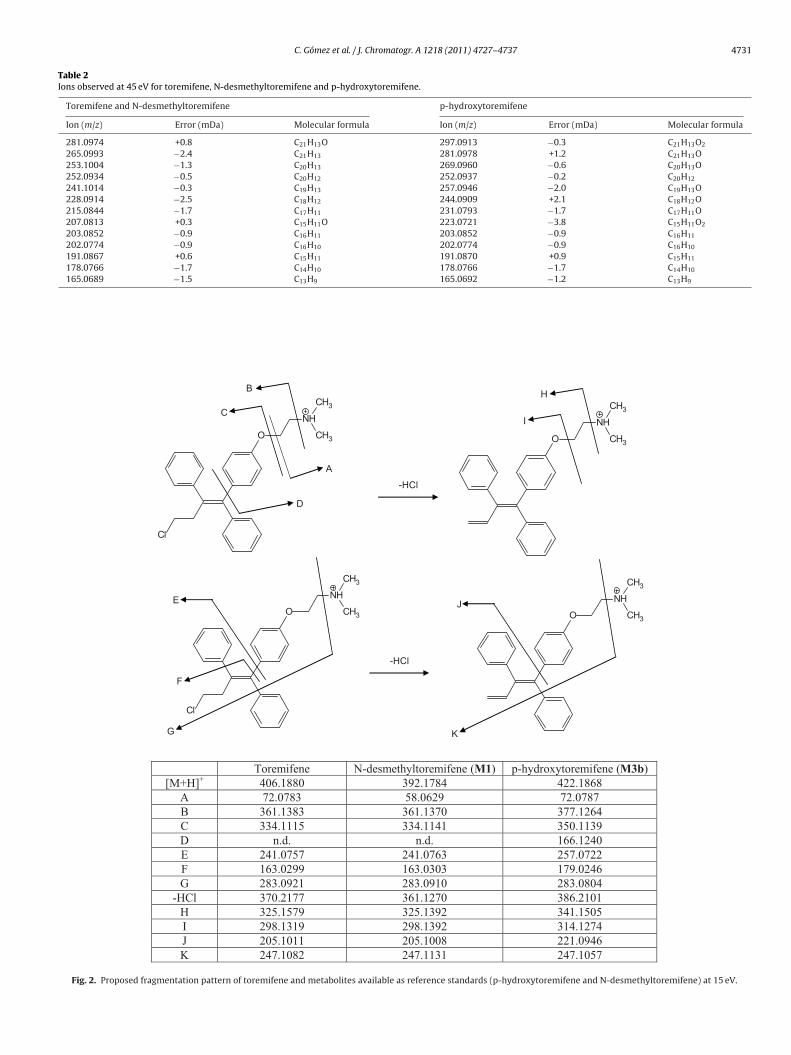
C. Gómez et al. / J. Chromatogr. A 1218 (2011) 4727– 4737 4731
Table 2Ions observed at 45 eV for toremifene, N-desmethyltoremifene and p-hydroxytoremifene.
Toremifene and N-desmethyltoremifene p-hydroxytoremifene
Ion (m/z) Error (mDa) Molecular formula Ion (m/z) Error (mDa) Molecular formula
281.0974 +0.8 C21H13O 297.0913 −0.3 C21H13O2
265.0993 −2.4 C21H13 281.0978 +1.2 C21H13O253.1004 −1.3 C20H13 269.0960 −0.6 C20H13O252.0934 −0.5 C20H12 252.0937 −0.2 C20H12
241.1014 −0.3 C19H13 257.0946 −2.0 C19H13O228.0914 −2.5 C18H12 244.0909 +2.1 C18H12O215.0844 −1.7 C17H11 231.0793 −1.7 C17H11O207.0813 +0.3 C15H11O 223.0721 −3.8 C15H11O2
203.0852 −0.9 C16H11 203.0852 −0.9 C16H11
202.0774 −0.9 C16H10 202.0774 −0.9 C16H10
191.0867 +0.6 C15H11 191.0870 +0.9 C15H11
178.0766 −1.7 C14H10 178.0766 −1.7 C14H10
165.0689 −1.5 C13H9 165.0692 −1.2 C13H9
O
NH
CH3
CH3
Cl
A
-HCl
B
O
NH
CH3
CH3
H
CI
D
O
NH
CH3
CH3
Cl
G
-HCl
O
NH
CH3
CH3
K
E J
F
Toremifene N-desmethylt ore mifene (M1) p-hyd roxyto remi fene (M3b) [M+H ]+ 406.1880 392.1784 422.1868
A 72.0783 58.0629 72.0787 B 361.1383 361.1370 377.1264 C 334.1115 334.1141 350.1139 D n.d. n.d. 166.1240 E 241.0757 241.0763 257.0722 F 163.0299 163.0303 179.0246 G 283.0921 283.0910 283.0804
-HCl 370.2177 361.1270 386.2101 H 325.1579 325.1392 341.1505 I 298.1319 298.1392 314.1274 J 205.1011 205.1008 221.0946 K 247.1082 247.1131 247.1057
Fig. 2. Proposed fragmentation pattern of toremifene and metabolites available as reference standards (p-hydroxytoremifene and N-desmethyltoremifene) at 15 eV.

4732 C. Gómez et al. / J. Chromatogr. A 1218 (2011) 4727– 4737
FREE METABOLITES GLUCURONOCONJUGATED METABOLITES
Most abundant metabolites
0
0,5
1
1,5
2
109876543210Day
Rel
ativ
e re
spon
seM2a
M4a
M5a
M8
M7
M9
Toremifene
0
0,05
0,1
0,15
0,2
0,25
0,3
0,35
0,4
0,45
0,5
109876543210 Day
Rel
ativ
e re
spon
se
M3b
M6a
M3c
Less abundant metabolites
0
0,05
0,1
0,15
0,2
109876543210Day
Rel
ativ
e re
spon
se
M4b
M4c
M1
M3a
M5b
0
0,02
0,04
0,06
0,08
0,1
0,12
0,14
109876543210Day
Rel
ativ
e re
spon
se
M6b
M4e
M4d
M2b
F undanR ng tra
3
sSlpscmstadm
m[tmmri(
epNmSNh(timygla
ig. 3. Excretion ratios of toremifene metabolites. Relative responses for most abelative responses were obtained as comparison between the areas of analytes (usi
.2. Detection of metabolites in urines from excretion studies
For the detection of toremifene metabolites, extracts of urinesamples from excretion studies were analyzed by LC–MS/MS inRM mode by monitoring the transitions of potential metabo-ites excreted in free form. The characteristic fragmentationattern shown by toremifene and its metabolites available astandards, with main fragment ions resulting from the alkylichains, allow the use of SRM analysis for the detection of newetabolites. As indicated in experimental section, transitions were
elected by calculating the protonated molecular ion [M+H]+ ofhe potential metabolite as precursor ion to the product ionst m/z 72, for N,N-dimethylated metabolites, at m/z 58 for N-esmethylated metabolites, and at m/z 44 for N-didesmethylatedetabolites.Metabolic pathways studied were based on those
etabolites reported in previous studies for toremifene3,13,14,20,21,24,26,28–30] and other related compounds, such asamoxifen and clomifene [3,4,17,31–41]. All previously reported
etabolic pathways and their combination were included in SRMethod, with the main exception of those proposed after metabolic
emoval of the amine function because of no ionization in positiveon mode was expected for these compounds [13–15,18–25,27,42]Table 1).
Unchanged toremifene and 20 metabolites were detectedxcreted free or conjugated with glucuronic acid and/or sul-hate. Metabolic pathways detected for toremifene include-desmethylation, hydroxylation, dihydroxylation, reduction,ethylation and dehalogenation and combinations of them.
ome of proposed metabolic pathways (N,N-didesmethylation,-desmethylation + hydroxylation + hydroxymethylation,ydroxy-quinine and hydroxylation + oxidation) were not detectedTable 1) despite the fact that they were previously reported foramoxifen, clomifene and toremifene [3,4,14,18–21,25,28–30]. Ast can be observed in Table 1, N-desmethylated and dehalogenated
etabolites were detected mainly in free form. Monohydrox-
lated metabolites were detected mainly as conjugated withlucuronic acid and/or sulphate and dihydroxylated metabo-ites were detected as free and/or conjugated with glucuroniccid.t free and conjugated metabolites (top) and less abundant metabolites (bottom).nsitions described in Table 1) and the area of ISTD (303 > 97).
3.3. Characterization of structures of the most abundantmetabolites
The poor fragmentation observed for toremifene and metabo-lites (see above) causes serious difficulties to elucidate the structureof the metabolites detected. As stated previously, only one abun-dant product ion was obtained for each metabolite. The otherproduct ions used for structural elucidation commonly exhibitedabundances lower than 5%. Therefore, only the most abundantmetabolites (M2a, M3a, M4a, M5a, M7, M8 and M9) could bestudied. Product ion mass spectra were obtained for each metabo-lite at 15 and 45 eV using accurate mass measurements, and theywere compared with previously obtained for toremifene, M3b andM1 (see supplementary information, Fig. 2 and Table 2). Proposedstructures are shown in Fig. 1.
3.3.1. M3aAt low collision energy (15 eV), the most abundant ion of
M3a (RT 10.81 min) was [M+H]+ (accurate mass m/z 422.1900;C26H29NO2Cl), i.e., one oxygen more than toremifene. Therefore,hydroxylation seemed to be the most feasible metabolic pathway.Product ion at m/z 72.0810, neutral losses of [M+H-35.9703 Da]+,[M+H-45.0578 Da]+ and [M+H-18.0106]+, corresponding to lossesof HCl, N-chain and H2O, respectively, were observed (Fig. 5). Thelosses of HCl and N-chain together with the molecular formulaand the ion at m/z 72.0810 confirmed that M3a is a chlorinated,N,N-dimethylated metabolite. Neutral losses containing water([M+H–H2O]+ at m/z 404 and [M+H–Nchain–H2O]+ at m/z 359)suggested that the hydroxyl group was not in phenolic ring. Thisfact was supported by the results at high collision energy (45 eV),where characteristic ions of hydroxylation in C ring (Table 2) werenot observed. For these reasons, hydroxylation in C3 was proposed(Fig. 1).
Other two late-eluting hydroxylated metabolites were detectedas conjugated with glucuronic acid (M3b (p-hydroxytoremifene)
and M3c in Table 1 and Fig. 4). These results are in agreement withthose previously reported [17,26,29] where the first eluting mono-hydroxylated metabolite was described as �-hydroxytoremifeneand can correspond to M3a.
C. Gómez et al. / J. Chromatogr. A 1218 (2011) 4727– 4737 4733
Free fraction Conjugated fraction Metabolite Basa l ur ine On e mon th ur ine Basa l ur ine On e mon th ur ine
Toremifene
Time9.00 10.0 0 11.0 0
%0
100 406 > 729.49e 4
Time9.00 10.0 0 11.00
%
0
100 406 > 729.49e4
Area
9.865694
Time9.00 10.00 11 .00
%
0
100 406 > 729.49e4
Time9.00 10.00 11 .00
%
0
100 406 > 729.49e4
Area
9.862171
M1
Time9.00 9.50 10.00 10.50
%
0
100 392 > 581.33e5
9.679.84
Time9.00 9.5 0 10.0 0 10.5 0
%
0
100 392 > 581.33e 5
Area
9.727831
Time9.00 9.50 10.00 10.50
%
0
100 392 > 581.33e5
Time9.00 9.50 10.00 10.50
%
0
100 392 > 581.33e5
9.74 9.61
M2a to M2b*
Time7.00 7.50 8.00 8.50
%
0
100 408 > 581.37e6
Time7.00 7.50 8.00 8.50
%
0
100 408 > 581.37e6
Area
7.6578065
Time7.00 7.50 8.00 8.50
%
0
100 408 > 583.78e4
Time7.00 7.50 8.00 8.50
%
0
100
7.267.79 8.43
408 > 583.78e4
Area
8.311908
7.61344
M3a to M3c*
Time7.50 8.00 8.50 9.00
%
0
100 422 > 721.85e5
Time7.50 8.00 8.50 9.00
%
0
100 422 > 721.84e5
Area
7.758683
Time7.50 8.00 8.50 9.00
%
0
100 422 > 722.88e5
Time7.50 8. 00 8.50 9.00
%
0
100 422 > 722.88e5
Area
8.431448 5
7.751547
8.8513240
M4a to M4f*
Time6.50 7.00 7.50 8.00 8.50
%
0
100 438 > 723.51e5
Time6.50 7.00 7.50 8.00 8.50
%
0
100 438 > 723.51e5
Area
7.98179 50
6.9932306.68
1798Time
6.50 7.0 0 7.5 0 8.0 0 8.5 0
%
0
100 438 > 725.18e 4
Time6.50 7.0 0 7.5 0 8.0 0 8.5 0
%
0
100 438 > 725.18e 4
Area
6.662618
7.982644 8.25
21876.801048
6.951038
7.157.03 7.26 7.96
M5a to M5b*
Time6.60 6.8 0 7.0 0 7.2 0 7.4 0
%
0
100 440 > 721.70e 6
Time6.60 6.8 0 7.0 0 7.2 0 7.4 0
%
0
100 440 > 721.70e 6
Area
6.8880632
7.078177
Time6.60 6.80 7.00 7.20 7.40
%
0
100 440 > 721.70e6
Time6.60 6.80 7.00 7.20 7.40
%
0
100 440 > 721.70e6
Area
6.8616838 7.05
1851
M6a to M6b*
Time8.25 8.50 8.75 9.00 9.25
%
0
100 452 > 722.00e5
Time8.25 8.50 8.75 9.00 9.25
%
0
100 452 > 722.00e5
Time8.25 8.50 8.75 9.00 9.25
%
0
100 452 > 722.00e5
Time8.25 8.50 8.75 9.00 9.25
%
0
100 452 > 722.00e5
Area
8.9510911
8.525378
M7
Time4.75 5.0 0 5.2 5 5.5 0
%
0
100 404 > 728.56e 5
Time4.75 5.00 5.25 5.50
%
0
100 404 > 728.56e 5
Area
5.1138446
Time4.75 5.00 5.25 5.50
%
0
100 404 > 728.56e5
Time4.75 5.00 5.25 5.50
%
0
100 404 > 728.56e 5
Area
5.061998
M8
Time6.40 6.60 6.80 7.00 7.20
%
0
100 402 > 723.23 e6
Time6.40 6.60 6.80 7.00 7.20
%
0
100 402 > 723.23 e6
Area
6.84165357
Time6.40 6.60 6.80 7.00 7.20
%
0
100 402 > 723.23e 6
Time6.40 6.60 6.80 7.00 7.20
%
0
100 402 > 723.23e 6
Area6.80
662 11
M9
Time6.40 6.60 6.80 7.00 7.20
%
0
100 388 > 582.61 e6
Time6.40 6.60 6.80 7.00 7.20
%
0
100 388 > 582.61e 6
Area
6.72137161
Time6.40 6.60 6.80 7.00 7.20
%
0
100 388 > 582.61e6
Time6.40 6.60 6.80 7.00 7.20
%
0
100 388 > 582.61e6
Area
6.681630 6
Fig. 4. SRM chromatograms of toremifene metabolites. Basal urine and urine obtained one month after toremifene administration (60 mg, orally). Free (left) and conjugatedfraction (right). (*) For identification of the different metabolites, see retention time in Table 1.
3
4ttm
.3.2. M2aM2a elutes at 9.93 min. The accurate mass of [M+H]+ (m/z
08.1735, elemental composition C25H27NO2Cl) can be assignedo a N-desmethylated and hydroxylated metabolite. At 15 eV,he product ion at m/z 58.0662, characteristic of N-demethylated
etabolites, was observed (Fig. 2). Similarly to M3a, neutral losses
of HCl [M+H-35.9703 Da]+, N-chain [M+H-31.0422 Da]+ and N-chain + H2O [M+H-31.0422-18.0106]+, were observed for M2a at
low collision energy. These losses suggested the presence of ahydroxyl group in an alkylic chain of a N-desmethylated metabolite.At 45 eV, several ions with high relative abundances were obtainedas described in N-desmethylated standard. Characteristic ions of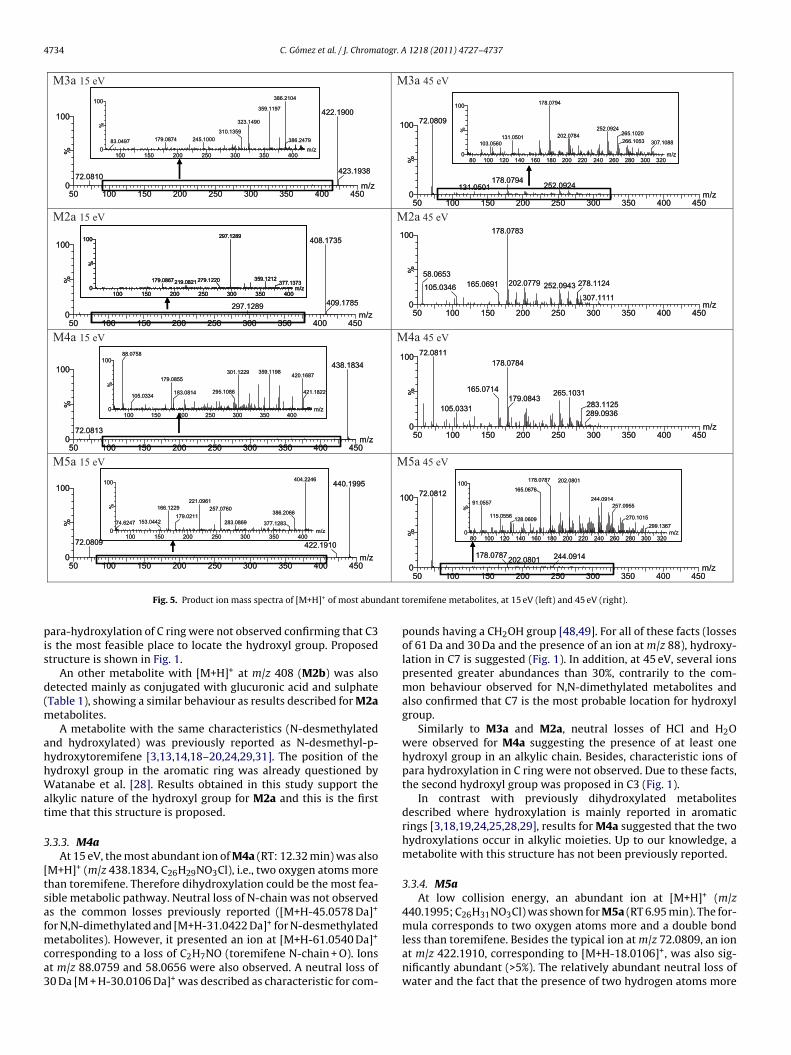
4734 C. Gómez et al. / J. Chromatogr. A 1218 (2011) 4727– 4737
M3a 15 eV
m/z50 100 15 0 200 250 300 350 400 450
%
0
100 422.1900
72.0810423.1 938
m/z100 150 200 250 300 35 0 400
%
0
100 386.210 4
359.119 7
323.149 0
310.13 59245.100 0179.087 483.049 7 386.24 79
m/z50 100 15 0 200 250 300 350 400 450
%
0
100 422.1900
72.0810423.1 938
m/z100 150 200 250 300 35 0 400
%
0
100 386.210 4
359.119 7
323.149 0
310.13 59245.100 0179.087 483.049 7 386.24 79
M3a 45 eV
m/z50 10 0 15 0 20 0 25 0 30 0 35 0 40 0 45 0
%
0
100 72.080 9
178.079 4131.050 1 252.092 4
m/z80 10 0 120 14 0 16 0 18 0 20 0 22 0 24 0 26 0 28 0 30 0 32 0
%
0
100 178.0794
131.050 1103.0560
252.0924202.0784 265.1020
266.1053 307.1088
m/z50 10 0 15 0 20 0 25 0 30 0 35 0 40 0 45 0
%
0
100 72.080 9
178.079 4131.050 1 252.092 4
m/z80 10 0 120 14 0 16 0 18 0 20 0 22 0 24 0 26 0 28 0 30 0 32 0
%
0
100 178.0794
131.050 1103.0560
252.0924202.0784 265.1020
266.1053 307.1088
M2a 15 eV
m/z50 10 0 15 0 20 0 25 0 30 0 35 0 40 0 45 0
%
0
100 408.173 5
297.128 9 409.178 5
m/z100 15 0 200 25 0 30 0 35 0 40 0
%
0
100 297.128 9
179.0867219.082 1 279.122 0 359.121 2377.1373
m/z50 10 0 15 0 20 0 25 0 30 0 35 0 40 0 45 0
%
0
100 408.173 5
297.128 9 409.178 5
m/z100 15 0 200 25 0 30 0 35 0 40 0
%
0
100 297.128 9
179.0867219.082 1 279.122 0 359.121 2377.1373
m/z100 15 0 200 25 0 30 0 35 0 40 0
%
0
100 297.128 9
179.0867219.082 1 279.122 0 359.121 2377.1373
M2a 45 eV
m/z50 10 0 15 0 20 0 25 0 30 0 35 0 40 0 45 0
%
0
100 178.078 3
58.065 3165.069 1105.034 6 202.0779 252.094 3 278.112 4
307 .111 1m/z
50 10 0 15 0 20 0 25 0 30 0 35 0 40 0 45 0
%
0
100 178.078 3
58.065 3165.069 1105.034 6 202.0779 252.094 3 278.112 4
307 .111 1
M4a 15 eV
m/z100 15 0 20 0 250 30 0 35 0 400
%
0
10088.075 8
359.1198301.1229179.085 5
105.0334295.1086183.08 14
420.168 7
421.1822
m/z50 10 0 15 0 200 250 30 0 350 400 45 0
%
0
100 438.183 4
72.081 3
m/z100 15 0 20 0 250 30 0 35 0 400
%
0
10088.075 8
359.1198301.1229179.085 5
105.0334295.1086183.08 14
420.168 7
421.1822
m/z50 10 0 15 0 200 250 30 0 350 400 45 0
%
0
100 438.183 4
72.081 3
M4a 45 eV
m/z50 10 0 15 0 20 0 25 0 30 0 35 0 40 0 45 0
%
0
100 72.0811178.0784
165.071 4
105.0331
265.103 1179.0843
283.1125289.093 6
m/z50 10 0 15 0 20 0 25 0 30 0 35 0 40 0 45 0
%
0
100 72.0811178.0784
165.071 4
105.0331
265.103 1179.0843
283.1125289.093 6
M5a 15 eV
m/z50 100 15 0 20 0 25 0 30 0 35 0 40 0 45 0
%
0
100 440.199 5
72.080 9 422 .1910
m/z100 15 0 20 0 25 0 300 350 40 0
%
0
100 404.224 6
221.096 1166.122 9
153.044274.624 7179.021 1
257.076 0386.206 6
283.086 9 377.128 3
m/z50 100 15 0 20 0 25 0 30 0 35 0 40 0 45 0
%
0
100 440.199 5
72.080 9 422 .1910
m/z100 15 0 20 0 25 0 300 350 40 0
%
0
100 404.224 6
221.096 1166.122 9
153.044274.624 7179.021 1
257.076 0386.206 6
283.086 9 377.128 3
M5a 45 eV
m/z
%
0
100 72.08 12
202 .080 1178 .078 7 244.091 4
m/z80 10 0 12 0 14 0 16 0 180 20 0 22 0 24 0 26 0 28 0 30 0 32 0
%
0
100 202 .0801178 .0787
165.067 6
91.055 7
115 .05 56 128.060 9
244.0914257 .09 55
270.101 5299 .1367
m/z
%
0
100 72.08 12
202 .080 1178 .078 7 244.091 4
m/z80 10 0 12 0 14 0 16 0 180 20 0 22 0 24 0 26 0 28 0 30 0 32 0
%
0
100 202 .0801178 .0787
165.067 6
91.055 7
115 .05 56 128.060 9
244.0914257 .09 55
270.101 5299 .1367
dant t
pis
d(m
ahhWat
3
[tsafmca3
Fig. 5. Product ion mass spectra of [M+H]+ of most abun
ara-hydroxylation of C ring were not observed confirming that C3s the most feasible place to locate the hydroxyl group. Proposedtructure is shown in Fig. 1.
An other metabolite with [M+H]+ at m/z 408 (M2b) was alsoetected mainly as conjugated with glucuronic acid and sulphateTable 1), showing a similar behaviour as results described for M2a
etabolites.A metabolite with the same characteristics (N-desmethylated
nd hydroxylated) was previously reported as N-desmethyl-p-ydroxytoremifene [3,13,14,18–20,24,29,31]. The position of theydroxyl group in the aromatic ring was already questioned byatanabe et al. [28]. Results obtained in this study support the
lkylic nature of the hydroxyl group for M2a and this is the firstime that this structure is proposed.
.3.3. M4aAt 15 eV, the most abundant ion of M4a (RT: 12.32 min) was also
M+H]+ (m/z 438.1834, C26H29NO3Cl), i.e., two oxygen atoms morehan toremifene. Therefore dihydroxylation could be the most fea-ible metabolic pathway. Neutral loss of N-chain was not observeds the common losses previously reported ([M+H-45.0578 Da]+
or N,N-dimethylated and [M+H-31.0422 Da]+ for N-desmethylated
etabolites). However, it presented an ion at [M+H-61.0540 Da]+orresponding to a loss of C2H7NO (toremifene N-chain + O). Ionst m/z 88.0759 and 58.0656 were also observed. A neutral loss of0 Da [M + H-30.0106 Da]+ was described as characteristic for com-
50 10 0 15 0 20 0 25 0 30 0 35 0 40 0 45 050 10 0 15 0 20 0 25 0 30 0 35 0 40 0 45 0
oremifene metabolites, at 15 eV (left) and 45 eV (right).
pounds having a CH2OH group [48,49]. For all of these facts (lossesof 61 Da and 30 Da and the presence of an ion at m/z 88), hydroxy-lation in C7 is suggested (Fig. 1). In addition, at 45 eV, several ionspresented greater abundances than 30%, contrarily to the com-mon behaviour observed for N,N-dimethylated metabolites andalso confirmed that C7 is the most probable location for hydroxylgroup.
Similarly to M3a and M2a, neutral losses of HCl and H2Owere observed for M4a suggesting the presence of at least onehydroxyl group in an alkylic chain. Besides, characteristic ions ofpara hydroxylation in C ring were not observed. Due to these facts,the second hydroxyl group was proposed in C3 (Fig. 1).
In contrast with previously dihydroxylated metabolitesdescribed where hydroxylation is mainly reported in aromaticrings [3,18,19,24,25,28,29], results for M4a suggested that the twohydroxylations occur in alkylic moieties. Up to our knowledge, ametabolite with this structure has not been previously reported.
3.3.4. M5aAt low collision energy, an abundant ion at [M+H]+ (m/z
440.1995; C26H31NO3Cl) was shown for M5a (RT 6.95 min). The for-mula corresponds to two oxygen atoms more and a double bond
less than toremifene. Besides the typical ion at m/z 72.0809, an ionat m/z 422.1910, corresponding to [M+H-18.0106]+, was also sig-nificantly abundant (>5%). The relatively abundant neutral loss ofwater and the fact that the presence of two hydrogen atoms more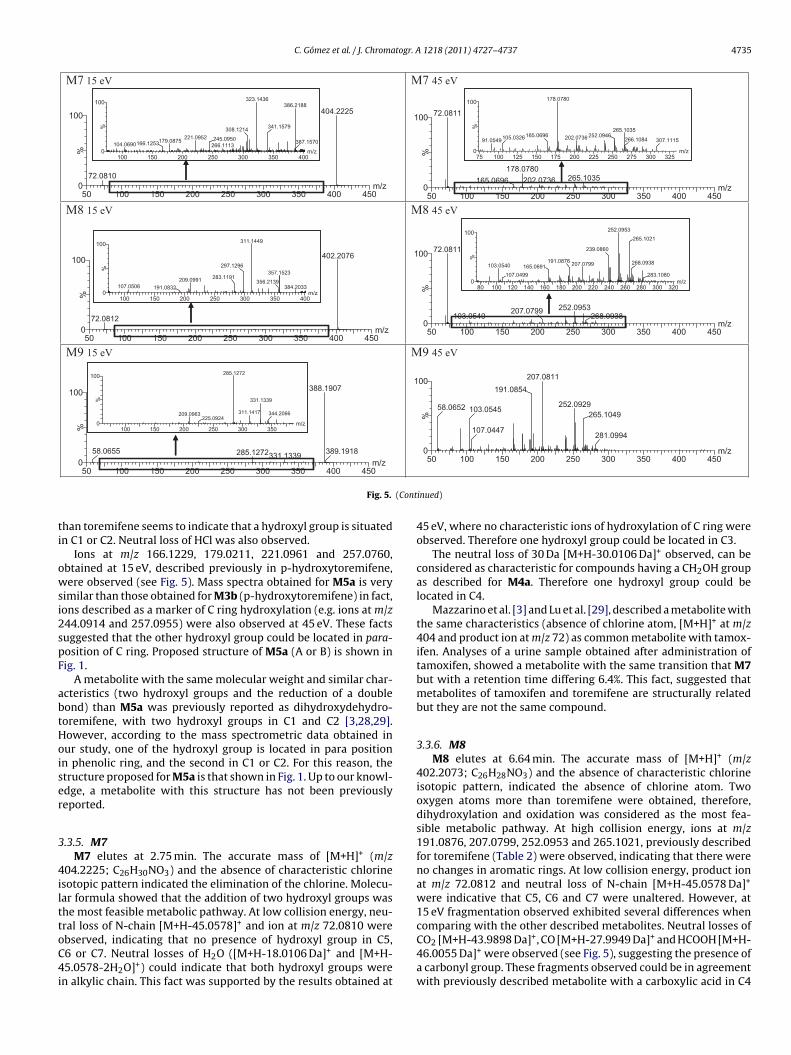
C. Gómez et al. / J. Chromatogr. A 1218 (2011) 4727– 4737 4735
M7 15 eV
m/z400350300250200150100
%
0
100 323.14 36
308.1214
221.0952179.0875166.12 53104.0690
245.0950266.1113
386.2188
341.1579
387.1570
m/z45040035030025020015010050
%
0
100 404.2225
72.0810
M7 45 eV
m/z45040035030025020015010050
%
0
100 72.0811
178.0780
165.0696 265.1035202.0736
m/z32530027525022520017515012510075
%
0
100 178.0780
165.069691.0549105.0326
265.1035252.094 6202.073 6 266.108 4 307.1115
M8 15 eV
m/z400350300250200150100
%
0
100 311.1449
297.1296
209.0991107.0506 191.0832
283.1191357.1523
356.2139384.2033
m/z45040035030025020015010050
%
0
100 402.2076
72.0812
M8 45 eV
m/z45040035030025020015010050
%
0
100 72.0811
252.0953207.0799103.0540 268.0938
m/z32030028026024022020018016014012010080
%
0
100 252.0953
239.0860
207.0799191.0876103.0540 165.0691
107.0499
265.1021
268.0938
283.1080
M9 15 eV
m/z
%
0
100 388.1907
285.127258.0655331.133 9
389.1918
m/z350300250200150100
%
0
100 285.1272
209.0963225.0924
331.1339
311.1417 344.2066
M9 45 eV
m/z45040035030025020015010050
%
0
100 207.0811
191.0854
58.0652 103.0545
107.0447
252.0929265.1049
281.0994
(Cont
ti
owsi2spF
abtHoiser
3
4ilttoC4i
45040035030025020015010050
Fig. 5.
han toremifene seems to indicate that a hydroxyl group is situatedn C1 or C2. Neutral loss of HCl was also observed.
Ions at m/z 166.1229, 179.0211, 221.0961 and 257.0760,btained at 15 eV, described previously in p-hydroxytoremifene,ere observed (see Fig. 5). Mass spectra obtained for M5a is very
imilar than those obtained for M3b (p-hydroxytoremifene) in fact,ons described as a marker of C ring hydroxylation (e.g. ions at m/z44.0914 and 257.0955) were also observed at 45 eV. These factsuggested that the other hydroxyl group could be located in para-osition of C ring. Proposed structure of M5a (A or B) is shown inig. 1.
A metabolite with the same molecular weight and similar char-cteristics (two hydroxyl groups and the reduction of a doubleond) than M5a was previously reported as dihydroxydehydro-oremifene, with two hydroxyl groups in C1 and C2 [3,28,29].owever, according to the mass spectrometric data obtained inur study, one of the hydroxyl group is located in para positionn phenolic ring, and the second in C1 or C2. For this reason, thetructure proposed for M5a is that shown in Fig. 1. Up to our knowl-dge, a metabolite with this structure has not been previouslyeported.
.3.5. M7M7 elutes at 2.75 min. The accurate mass of [M+H]+ (m/z
04.2225; C26H30NO3) and the absence of characteristic chlorinesotopic pattern indicated the elimination of the chlorine. Molecu-ar formula showed that the addition of two hydroxyl groups washe most feasible metabolic pathway. At low collision energy, neu-ral loss of N-chain [M+H-45.0578]+ and ion at m/z 72.0810 were
bserved, indicating that no presence of hydroxyl group in C5,6 or C7. Neutral losses of H2O ([M+H-18.0106 Da]+ and [M+H-5.0578-2H2O]+) could indicate that both hydroxyl groups weren alkylic chain. This fact was supported by the results obtained at
inued)
45 eV, where no characteristic ions of hydroxylation of C ring wereobserved. Therefore one hydroxyl group could be located in C3.
The neutral loss of 30 Da [M+H-30.0106 Da]+ observed, can beconsidered as characteristic for compounds having a CH2OH groupas described for M4a. Therefore one hydroxyl group could belocated in C4.
Mazzarino et al. [3] and Lu et al. [29], described a metabolite withthe same characteristics (absence of chlorine atom, [M+H]+ at m/z404 and product ion at m/z 72) as common metabolite with tamox-ifen. Analyses of a urine sample obtained after administration oftamoxifen, showed a metabolite with the same transition that M7but with a retention time differing 6.4%. This fact, suggested thatmetabolites of tamoxifen and toremifene are structurally relatedbut they are not the same compound.
3.3.6. M8M8 elutes at 6.64 min. The accurate mass of [M+H]+ (m/z
402.2073; C26H28NO3) and the absence of characteristic chlorineisotopic pattern, indicated the absence of chlorine atom. Twooxygen atoms more than toremifene were obtained, therefore,dihydroxylation and oxidation was considered as the most fea-sible metabolic pathway. At high collision energy, ions at m/z191.0876, 207.0799, 252.0953 and 265.1021, previously describedfor toremifene (Table 2) were observed, indicating that there wereno changes in aromatic rings. At low collision energy, product ionat m/z 72.0812 and neutral loss of N-chain [M+H-45.0578 Da]+
were indicative that C5, C6 and C7 were unaltered. However, at15 eV fragmentation observed exhibited several differences whencomparing with the other described metabolites. Neutral losses of
CO2 [M+H-43.9898 Da]+, CO [M+H-27.9949 Da]+ and HCOOH [M+H-46.0055 Da]+ were observed (see Fig. 5), suggesting the presence ofa carbonyl group. These fragments observed could be in agreementwith previously described metabolite with a carboxylic acid in C4
4 togr. A
[cOatrtw
3
3ii5a(4antosc
3
raad1w(lwhb
admgff
4
mlmpNcbMdamM
t(
[
736 C. Gómez et al. / J. Chroma
3,29] (M8B in Fig. 2). Contrarily to the expected behaviour for acidicompounds, no signal in negative ionization mode was obtained.ther alternative structure is proposed (M8A in Fig. 2), involvingn oxidation of M7 and cyclization. This structure could also givehe neutral losses of CO2, CO and HCOOH. Ion at m/z 384.2033 cor-esponding to a loss of water [M+H-18.0106 Da]+ was more difficulto be explained from the structure M8A. Synthesis and comparisonith reference material would be needed to confirm the structure.
.3.7. M9M9 elutes at 6.25 min. The accurate mass of [M+H]+ (m/z
88.1909; C25H26NO3) and the absence of characteristic chlorinesotopic pattern, as described in previous metabolites (M7 and M8),ndicated the absence of chlorine atom. At 15 eV, product ion at m/z8.0656 and neutral loss of N-chain [M+H-31.0422 Da]+, describeds characteristic of N-demethylated metabolites, were observedFig. 5). In a similar way than M8, neutral loss of HCOOH [M+H-6.0055 Da]+ was observed. A structure with a carboxylic acid in C4,s described previously [3] was proposed (M9B in Fig. 2) but no sig-al in negative ionization mode was obtained. This metabolite seemo be the N-desmethylated M8, and as the same way, an oxidationf M7 and cyclization was also proposed (M9A in Fig. 2). Synthe-is and comparison with reference material would be needed toonfirm the structure.
.4. Relevant target analytes for doping control assays.
The analysis of urine samples of the whole excretion studyevealed that all of metabolites were detected up to 10 daysfter toremifene administration (Fig. 3). In the first hours afterdministration, the relative response increased for all metabolitesetected with maximum concentrations for most of them between2 and 48 h after administration. The most abundant responseas observed for metabolites excreted in free form, dehalogenated
M7, M8, M9) and dihydroxylated (M4a) metabolites. Metabo-ites with most abundant relative response in conjugated fraction
ere hydroxylated metabolites M3b and M3c, and hydroxyl-ydroxymethyl metabolite M6a. Similar results were obtained foroth excretion studies analyzed.
A spot urine sample was additionally collected one month afterdministration, and all free and conjugated metabolites could beetected with satisfactory sensitivity (Fig. 4). The most importantetabolites detected one month after administration were dehalo-
enated metabolites (M7, M8, and M9) and metabolites resultingrom hydroxylation M3b, M4a and M5a, all of them detected in freeraction.
. Conclusions
A metabolic study of toremifene was performed. The SRMethod created based on the study of the CID for available metabo-
ites, allowed for the detection of unchanged toremifene and 20etabolites in post administration studies. Different metabolic
athways were proposed, including mono- and di-hydroxylation,-desmethylation, methylation, reduction, dehalogenation andombinations of them. Hydroxylation in the alkylic chains haseen confirmed as an important metabolic pathway for toremifene.ost of the detected metabolites were excreted free (mainly N-
esmethylated, dihidroxylated and dehalogenated metabolites)nd/or conjugated with glucuronic acid (mono and dihydroxylatedetabolites). Some metabolites involving hydroxylation (M2b,
3b and M6c) were also detected as conjugated with sulphate.The most abundant metabolites were detected in the free frac-ion. Among them, some metabolites do not have the chlorine atomM7, M8 and M9), some were monohydroxylated (M2a and M3a)
[
[
1218 (2011) 4727– 4737
and some dihydroxylated metabolites (M4a and M5a). The struc-tures of these abundant metabolites have been proposed based onfragmentation pattern with mass accurate measurements. Struc-tures of metabolites M2a, M4a, M5a, M7 and M9 have not beenpreviously reported.
All metabolites could be detected up to one month afteradministration of toremifene. According to results obtained, highsensitivity and less chemical background were obtained using afree faction extraction procedure although the conjugated fractioncould be also used in order to detect toremifene misuse. The mostabundant conjugated metabolites were: monohydroxylated (M3band M3c), and hydroxylated and hydroxymethylated metabolite(M6a). Therefore, these metabolites can be considered as the mostadequate target analytes for doping control purposes.
The poor fragmentation observed in toremifene and metabolitescould be a problem in confirmation purposes. N-desmethylatedmetabolites (M2a and M9) and the N-methyl-N-hydroxymethylmetabolite (M4a), at high collision energy (45 eV), presented morethan one product ion with a relative abundance higher than 10%.Therefore, these metabolites would be the most useful compoundsfor confirmation purposes in doping control analyses.
Acknowledgements
The financial support received from Ministerio de Educación yCiencia (Spain; project number DEP2007-73224) and Consell Catalàde l’Esport, Generalitat de Catalunya (Spain) is acknowledged. TheAnalytical and Bioanalytical Services Research Group (IMIM) andAMR group (CSIC) are a consolidated research group (Grup deRecerca) of the Generalitat de Catalunya. The collaboration of Dr.Rafael de la Torre is gratefully acknowledged. Postdoctoral grantby the Generalitat de Catalunya (OJP) is gratefully acknowledged.The authors are very grateful to Serveis Centrals d’instrumentacióCientifica (SCIC) of the University Jaume I for use of QTOF massspectrometer. CIBER-BBN is an initiative funded by the VI NationalR&D&i Plan 2008–2011, Iniciativa Ingenio 2010, Consolider Program,CIBER Actions and financed by the Instituto de Salud Carlos III withassistance from the European Regional Development Fund.
Appendix A. Supplementary data
Supplementary data associated with this article can be found, inthe online version, at doi:10.1016/j.chroma.2011.05.073.
References
[1] D.J. Handelsman, J. Clin. Endocrinol. Metab. 91 (2006) 1646.[2] D.J. Handelsman, Br. J. Pharmacol. 154 (2008) 598.[3] M. Mazzarino, I. Fiacco, X. de la Torre, F. Botrè, Eur. J. Mass Spectrom. 14 (2008)
171.[4] M. Mazzarino, X. de la Torre, R. Di Santo, I. Fiacco, F. Rossi, F. Botrè, Rapid
Commun. Mass Spectrom. 24 (2010) 749.[5] World Anti-Doping Agency (WADA), The World Anti Doping Code. The 2010
Prohibited List International Standard, 2009, http://www.wada-ama.org/Documents/World Anti-Doping Program/WADP-Prohibited-list/WADA Prohibited List 2010 EN.pdf.
[6] M. Thevis, W. Schänzer, Anal. Bioanal. Chem. 388 (2007) 1351.[7] K. Deventer, O.J. Pozo, P. Van Eenoo, F.T. Delbeke, LCGC North Am. 26 (2008)
376.[8] M. Thevis, W. Schänzer, Mass Spectrom. Rev. 26 (2007) 79.[9] O.J. Pozo, P. Van Eenoo, K. Deventer, H. Elbardissy, S. Grimalt, J.V. San-
cho, F. Hernandez, R. Ventura, F.T. Delbeke, Anal. Chim. Acta (2010),doi:10.1016/j.aca.2010.10.045.
10] C.G. Georgakopoulos, A. Vonaparti, M. Stamou, P. Kiousi, E. Lyris, Y.S. Angelis,G. Tsoupras, B. Wuest, M.W.F. Nielen, I. Panderi, M. Koupparis, Rapid Commun.Mass Spectrom. 21 (2007) 2436.
11] O.J. Pozo, P. Van Eenoo, K. Deventer, L. Lootens, W. Van Thuyne, M.K. Parr, W.Schänzer, J.V. Sancho, F. Hernández, P. Meuleman, G. Leroux-Roels, F.T. Delbeke,Drug Metab. Dispos. 37 (2009) 2153.
12] O.J. Pozo, P. Van Eenoo, K. Deventer, L. Lootens, S. Grimalt, J.V. Sancho, F. Hernán-dez, P. Meuleman, G. Leroux-Roels, F.T. Delbeke, Steroids 74 (2009) 837.

togr. A
[
[[
[
[
[[[
[
[
[
[
[[[[[
[
[[
[
[
[[
[[[[
[[[[[
[
C. Gómez et al. / J. Chroma
13] T.L. Taras, G.T. Wurz, G.R. Linares, M.W. DeGregorio, Clin. Pharmacokinet. 5(2000) 327.
14] L.K. Webster, N.A. Crinis, K.H. Stokes, J.F. Bishop, J. Chromatogr. 565 (1991) 482.15] J. Bishop, R. Murray, L. Webster, P. Pitt, K. Strokes, A. Fennessy, I. Olver, G. Leber,
Cancer Chemother. Pharmacol. 30 (1992) 174.16] V.J. Wiebe, C.C. Benz, I. Shemano, T.B. Cadman, M.W. DeGregorio, Cancer
Chemother. Pharmacol. 25 (1990) 247.17] S.Y. Kim, N. Suzuki, Y.R. Santosh Laxmi, R. Rieger, S. Shibutani, Chem. Res.
Toxicol. 16 (2003) 1138.18] L. Kangas, Cancer Chemother. Pharmacol. 27 (1990) 8.19] L. Kangas, Breast Cancer Res. Treat. 16 (1990) S3.20] M. Anttila, R. Valavaara, S. Kivinen, J. Mäenpää, J. Steroid Biochem. 38 (1990)
249.21] M. Anttila, S. Laakso, P. Nyländen, E.A. Sotaniemi, Clin. Pharmacol. Ther. 57
(1995) 628.22] F. Berthou, Y. Dreano, C. Belloc, L. Kangas, J.C. Gautier, P. Beaune, Biochem.
Pharmacol. 47 (1994) 1883.23] M.W. DeGregorio, G.T. Wurz, T.L. Taras, R.U. Erkkola, K.H. Halonen, R.K. Huup-
ponen, Eur. J. Clin. Pharmacol. 56 (2000) 469.24] H. Sipilä, L. Kangas, L. Vuorilehto, A. Kalapudas, M. Eloranta, M. Södervall, R.
Toivola, M. Anttila, J. Steroid Biochem. 36 (1990) 211.25] W. Lohmann, U. Karst, Anal. Bioanal. Chem. 394 (2009) 1341.26] R.M. Jones, C.K. Lim, Biomed. Chomatogr. 16 (2002) 361.
27] K.C. Morello, G.T. Wurz, M.W. DeGregorio, Clin. Pharmacokinet. 42 (2003) 361.28] N. Watanabe, T. Irie, M. Koyama, T. Tominaga, J. Chromatogr. 497 (1989) 169.29] J. Lu, X. Wang, Y. Dong, S. Yang, Y. Wu, Y. Qin, M. Wu, Analyst 136 (2011)467.30] P.W. Fan, F. Zhang, J.L. Bolton, Chem. Res. Toxicol. 13 (2000) 45.
[[
[
1218 (2011) 4727– 4737 4737
31] S.P. Robinson, C.J. Parker, V.C. Jordan, Breast Cancer Res. Treat. 16 (1990) S9.32] B. Vitoriano, X. de la Torre (Eds.), Recent Advances in Doping Analysis, vol. 15,
Köln, 2007, p. 113.33] F. Oueslati, M. Maatku, Z. Osman, H. Loueslati (Eds.), Recent Advances in Doping
Analysis, vol. 16, Köln, 2008, p. 333.34] B. Claude, P. Morin, S. Bayoudh, J. de Ceaurriz, J. Chromatogr. A 1196–1197
(2008) 81.35] R.M. Jones, Z.X. Yuan, J.H. Lamb, C.K. Lim, J. Chromatogr. A 722 (1996) 249.36] E.A. Lien, E. Solheim, O.A. Lea, S. Lundgren, S. Kvinnsland, P.M. Ueland, Cancer
Res. 49 (1989) 2175.37] J.M. Fromson, S. Pearson, S. Bramah, Xenobiotica 3 (1973) 693.38] J.M. Fromson, S. Pearson, S. Bramah, Xenobiotica 3 (1973) 711.39] K.M. Fried, I.W. Wainer, J. Chromatogr. B 655 (1994) 261.40] X.F. Li, S. Carter, N.J. Dovich, J.Y. Zhao, P. Kovarik, T. Sakuuma, J. Chromatogr. A
914 (2001) 5.41] V.C. Jordan, Steroids 72 (2007) 829.42] A. Martissen, J. Gynther, J. Chromatogr. A 724 (1996) 358.43] S. Gauthier, J. Mailhot, F. Labrie, J. Org. Chem. 61 (1996) 3890.44] D.D. Yu, B.M. Forman, J. Org. Chem. 68 (2003) 9489.45] R. Ventura, M. Roig, N. Monfort, P. Sáez, R. Bergés, J. Segura, Eur. J. Mass Spec-
trom. 14 (2008) 191.46] C. Gómez, J. Segura, N. Monfort, T. Suominen, A. Leinonen, M. Vahermo, J. Yli-
Kauhaluoma, R. Ventura, Anal. Bioanal. Chem. 397 (2010) 2903.
47] M. Roig, J. Segura, R. Ventura, Anal. Chim. Acta 586 (2007) 184.48] O.J. Pozo, P. Van Eenoo, K. Deventer, S. Grimalt, J.V. Sancho, F. Hernandez, F.T.Delbeke, Rapid Commun. Mass Spectrom. 22 (2008) 4009.49] O.J. Pozo, P. Van Eenoo, K. Deventer, F.T. Delbeke, TrAC Trends Anal. Chem. 27
(2008) 657.
Related Documents