Mass Spectrometric Analysis of Tyrosine Metabolic Enzymes Christopher John Vavricka Jr. Dissertation submitted to the faculty of the Virginia Polytechnic Institute and State University in partial fulfillment of the requirements for the degree of Doctor of Philosophy In Biochemistry Jianyong Li, Chairperson Richard Helm Glenda Gillaspy Timothy Larson July 28 th , 2009 Blacksburg, Virginia Keywords: tyrosine metabolism, mass spectrometry, proteomics, post-translational modification, glycosylation, dopachrome, melanogenesis, methyldopa, dopamine

Welcome message from author
This document is posted to help you gain knowledge. Please leave a comment to let me know what you think about it! Share it to your friends and learn new things together.
Transcript

Mass Spectrometric Analysis of Tyrosine Metabolic Enzymes
Christopher John Vavricka Jr.
Dissertation submitted to the faculty of the Virginia Polytechnic Institute and State
University in partial fulfillment of the requirements for the degree of
Doctor of Philosophy
In
Biochemistry
Jianyong Li, Chairperson
Richard Helm
Glenda Gillaspy
Timothy Larson
July 28th
, 2009
Blacksburg, Virginia
Keywords: tyrosine metabolism, mass spectrometry, proteomics, post-translational
modification, glycosylation, dopachrome, melanogenesis, methyldopa, dopamine
Mass Spectrometric Analysis of Tyrosine Metabolic Enzymes
Christopher John Vavricka Jr.
(ABSTRACT)
The metabolism of tyrosine is essential for many critical biochemical events
including catecholamine synthesis, melanogenesis and insect cuticle sclerotization. These
pathways are highly regulated in both insects and mammals by many well-characterized
enzymes including dopa decarboxylase and tyrosine hydroxylase. On the other hand,
there are still many enzymes involved in these processes that we know very little about.
Dopachrome tautomerase (DCT), dopachrome conversion enzyme (DCE) and α-
methyldopa resistant protein (AMD) fall into the category of the less characterized
enzymes.
Dopachrome is a pivotal intermediate in melanogenesis. Mammalian DCT and
insect DCE both use dopachrome as substrate. DCE catalyzes a decarboxylative
structural rearrangement of dopachrome to 5,6-dihydroxyindole (DHI), whereas DCT
mediates the isomerization/tautomerization of dopachrome 5,6-dihydroxyindole-2-
carboxylic acid (DHICA). DHI is oxidized easily, leading to the production of melanin,
as well as reactive oxygen species (ROS). DHICA is less reactive, relative to DHI, and
consequently produces less toxic byproducts during melanogenesis; therefore DCT plays
an important role in detoxification of DHI and ROS.
iii
Purification and MS analysis of DCE and DCT determined that N-glycosylation is
a primary post-translational modification. Q-TOF mass spectrometry was used to
determine N-glycosylation patterns from Aedes aegypti DCE and MALDI-TOF/TOF was
used to determine multiple glycosylation sites in DCT. N-glycosylation is critical for the
folding and trafficking of secreted proteins in the endomembrane system. The analysis of
glycosylation sites in DCE and DCT therefore is essential toward achieving a
comprehensive understanding of their structure and function.
Like DCT, AMD also plays a protective role. The AMD protein was originally
identified in Drosophila mutants hypersensitive to α-methyldopa, an inhibitor of dopa
decarboxylase (DDC). Production of dopamine by DDC is critical for developing insects
because dopamine conjugates are used as crosslinking agents for cuticle sclerotization.
Although there has been much discussion into the function of AMD, what exactly this
protein does has been unknown. AMD shares 48% sequence identity with DDC, however
we have found that AMD is an enzyme, which possesses a different catalytic activity.
GC-MS analysis of AMD enzymatic reaction components revealed that AMD catalyzes
the oxidative decarboxylation of L-DOPA to DOPAL, and also the oxidative
decarboxylation of α-methyldopa to 3,4-dihydroxyphenylacetone.
In summary, multiple N-Glycosylation sites were characterized in DCT and
DCE. Furthermore, a new protein function has been demonstrated for AMD. These
experiments were performed using classical biochemistry techniques in combination with
mass spectrometry.
iv
ACKNOWLEDGMENT
First and foremost, I would like to express my sincere gratitude to Dr. Jianyong Li for his
guidance and support throughout my graduate studies. Many thanks to Dr. Tim Larson,
Dr. Rich Helm and Dr. Glenda Gillaspy, all for taking me on as a student in their labs and
serving on my committee. Thank you Dr. Junsuo Li for mentoring me in the study of
glycoproteins. Thanks Haizhen Ding for producing so much valuable raw material for
protein purification. I am very grateful of my co-authors Keith Ray and Kim Harich for
collecting valuable MS data for this dissertation. Thank you Dr. Qian Han for serving as
a mentor for me. I would also like to thank Dr. Eugene Gregory, Dr. Helen Crawford, Dr.
Jinsong Zhu, Dr. David Bevan, Dr. Bruce Christensen and Dr. Thomas Sitz for playing
an important role throughout my studies. Of course, I cannot avoid giving honorable
mention to my friends Brian Hickory, Dr. Joseph Germana, Sam Russell, Dr. Amir Guri
and Brian Stanek. Last, but not least, I would like to give a special thanks to my mother,
Diane Vavricka, and father, Chris Vavricka, for being there for me always.

v
DEDICATION
In memory of Anthony Scarpa, my old friend, opponent in chess and the best electrician
in south Jersey.

vi
TABLE OF CONTENTS
ACKNOWLEDGMENT…………………………………………………………………iv
LIST OF FIGURES…………………………………………………………………......viii
LIST OF TABLES……………………………………………………………………….xv
LIST OF ABBREVIATIONS……………………………………………………….......xvi
CHAPTER 1. INTRODUCTION………………………………………………………1
1.1 Tyrosine Metabolism…...…………………...………………………………...2
1.2 Melanogenesis…………………………………………………………….…...4
1.3 Processing of Secreted Proteins…………...……………….………………...11
1.4 Insect Catecholamine Metabolism……………..………………….…………13
CHAPTER 2. DOPACHROME TAUTOMERASE....................................................19
2.1 Abstract………………………………………………………………………20
2.2 Introduction…………………………………………………………………..21
2.3 Materials and Methods…………………………………………………….…23
2.4 Results………………………………………………………………………..29
2.5 Discussion……………………………………………………………………41
CHAPTER 3. DOPACHROME CONVERSION ENZYME.………………………45
3.1 Abstract…………...……………………….…………………………………46
3.2 Introduction……………………………….………………………………….47
3.3 Materials and Methods……………………...………….…………………….48
3.4 Results and Discussion………………………………….…………………...53
3.5 Concluding Remarks…………………………………….…………………...74

vii
CHAPTER 4. α-METHYLDOPA RESISTANT PROTEIN……………….………..80
4.1 Abstract……………………...…………….………………………………...81
4.2 Introduction………………………………....……………………………….81
4.3 Materials and Methods……………………….……………………………...85
4.4 Results……………………………………….………………………………88
4.5 Discussion…………………………………….……………………………..98
CHAPTER 5. GENERAL DISCUSSION……………………………….…………..104
APPENDIX. SUPPLEMENTARY INFORMATION…………………......…..…...111
A.1 Supplementary DCT Information…………………...……………………112
A.2 Tyrosinase-Related Proteins…………………………………..………….119
A.3 Drosophila AMD Mutant Analysis………………………………………122
viii
LIST OF FIGURES
CHAPTER 1
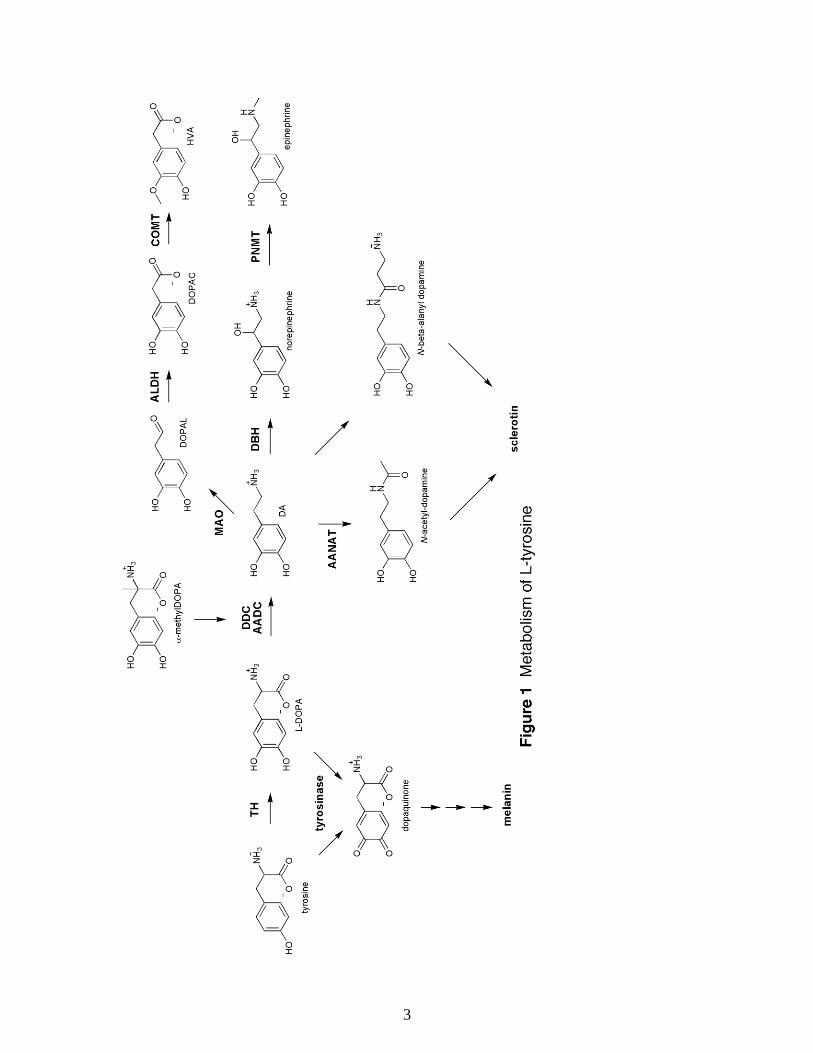
Figure 1.1 Metabolism of L-tyrosine…………………………………………………….3
Figure 1.2 Structure of Sepia melanin proposed by Nicolaus RA. Due to the irregular
nature of this polymer, no exact crystal structures currently exist of melanin………...….5
Figure 1.3 Melanogenesis. The decarboxylative rearrangement of dopachrome to DHI
(indicated by the asterisk), proceeds spontaneously under physiological conditions, or
may be accelerated by the insect protein DCE. Non-enzymatic oxidation of catechols or
hydroxylated indoles by molecular oxygen produces semiquinone radical. Polymerization
of DHI and DHICA often results in C-C bonding at the 4’-7 positions of the indole
ring………………………….……………….…………………………………………….9
CHAPTER 2
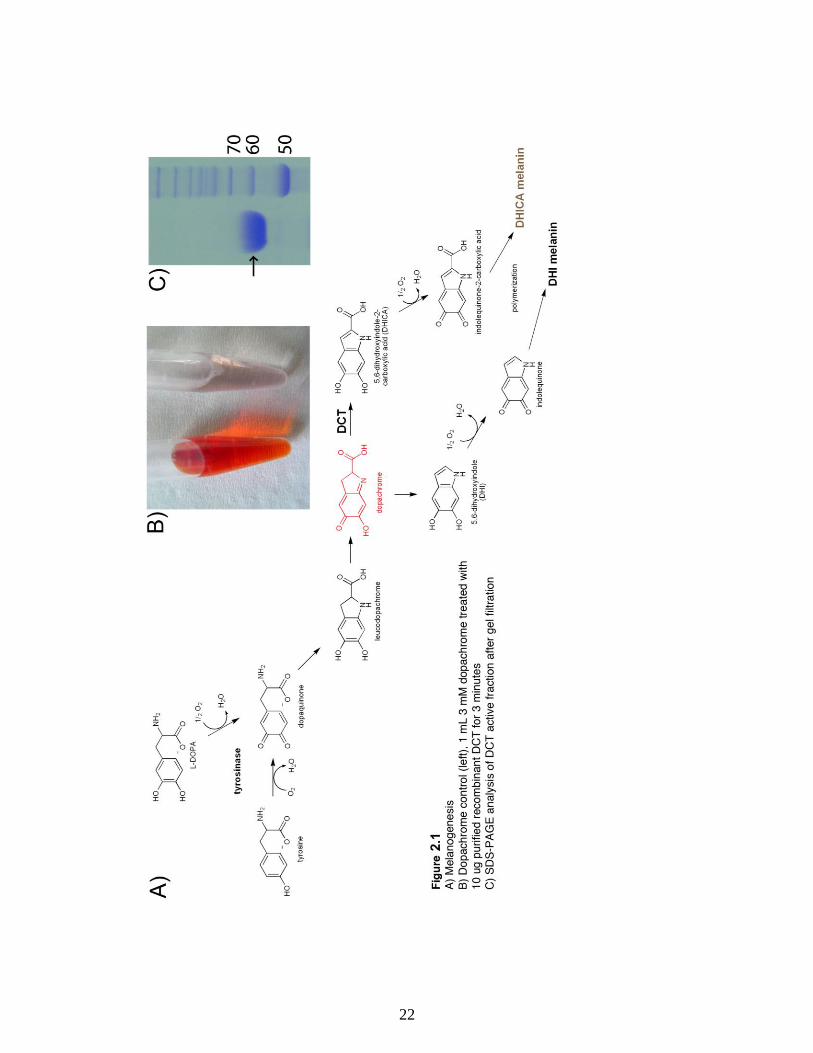
Figure 2.1 A) Melanogenesis, B) Dopachrome control (left), 1 mL 3 mM dopachrome
treated with 10 ug purified recombinant DCT for 3 minutes (right), C) SDS-PAGE
analysis of DCT active fraction after gel filtration……….……………………………...22
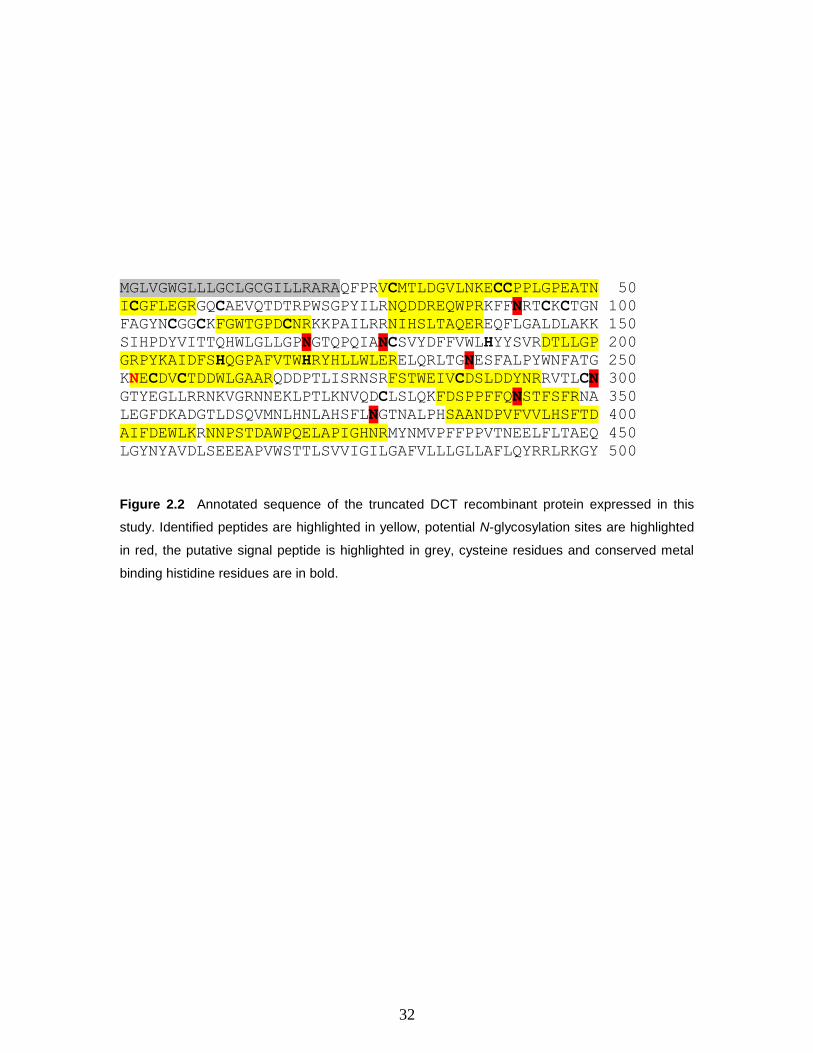
Figure 2.2 Annotated sequence of the truncated DCT recombinant protein expressed in
this study. Identified peptides are highlighted in yellow, potential N-glycosylation sites
ix
are highlighted in red, the putative signal peptide is highlighted in grey, cysteine residues
and conserved metal binding histidine residues are in bold.………………………….....32
Figure 2.3 MALDI-TOF peptide map of a DCT tryptic digest. The inset shows a close-
up of the glycosylated peptide ions m/z 2700.26, 2862.17 and 3008.31. ……..………...35
Figure 2.4 MALDI-TOF/TOF spectra of N-glycosylated DCT peptide m/z 2700.06
(FDSPPFFQNSTFSFR).…………………………….…………………………………...36
Figure 2.5 MALDI MALDI-TOF/TOF spectra of N-glycosylated DCT peptide m/z
3008.15 (FDSPPFFQNSTFSFR). Ions indicated with * also appear as dominant ions in
Figure 2.3, however due to complex fragmentation of glycopeptides with MALDI-
TOF/TOF remain elusive…………………………………………………………………………….37
Figure 2.6 MALDI-TOF/TOF spectra of DCT peptide NECDVCTDELLGAAR A) with
addition of 146 Da, and B) with no modification……………………………………......38
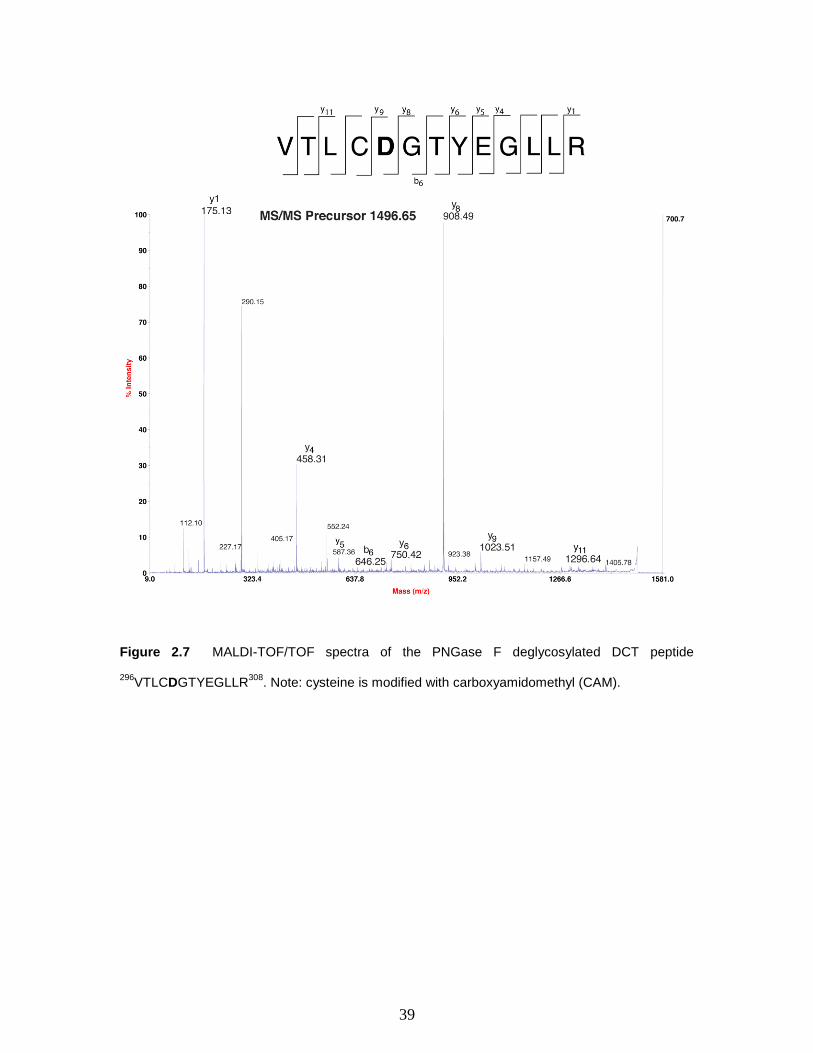
Figure 2.7 MALDI-TOF/TOF spectra of the PNGase F deglycosylated DCT peptide
296VTLCDGTYEGLLR
308. Note: cysteine is modified with carboxyamidomethyl
(CAM).………………………………………………………..…………………….....…39
Figure 2.8 MALDI-TOF/TOF spectra the non-glycosylated DCT peptide
NNPSTDAWPQELAPIGHNR………………………………………………………….40
CHAPTER 3
Figure 3.1 Chromatogram and SDS-PAGE of purified DCE from A. Aegypti larvae
homogenate.…………………………………………………………….………………..55
x
Figure 3.2 Elution profile (activity and protein) of purified A. aegypti DCE from a Con
A affinity column (0.5 mL). The elution buffer was 20 mM Tris-HCl (pH 7.4) containing
0.5 M NaCl and 0–0.5 M α-D-methylmannoside (α-MM)………………...…………….55
Figure 3.3 Chromatograms of 2-anthranilic acid-labeled monosaccharides in the TFA-
hydrolysate of A. aegypti DCE. Top, blank PVDF membrane; middle, DCE
monosaccharide profile; bottom, monosaccharide standards (25 pmol each). GlcNAc, N-
acetyl D-glucosamine; GalNAc, N-acetyl D-galactosamine; Gal, galactose; Man, D-
mannose; Glc, Glucose; Ara, D-arabinose; Xyl, xylose; Fuc, L-Fucose.
………………………………………………………………………………….….……..58
Figure 3.4 ESI-MS/MS spectrum and structure of the +4 glycopeptide ion m/z 992.16
(monoisotopic m/z 3963) from A. aegypti DCE. (A) De novo sequencing; (B)–(E) ESI-
MS/MS spectrum and elucidation. m/z 3807 is a proposed fragment derivatized from m/z
3963 through C-terminal rearrangement (E). The inset in Fig. 3B shows the entire
spectrum of m/z 3963……………………………………………….…..……………….….…...62
Figure 3.5 ESI-MS/MS spectrum and structure of the sugar moiety of the +4
glycopeptide ion m/z 992.16 (monoisotopic m/z 3963) from A. aegypti DCE. (A)
Fragmentation pathway of m/z 3963 [M + H] associated oligosaccharide; (B)
fragmentation pathway of m/z 3807 [b27 + H2O] associated oligosaccharide (C-terminal
rearrangement ion). (C) Elucidation of fragments from the sugar moiety of m/z 3963. (D)
and (E) are complexes and the fragmentation pattern of their sugar
moiety………………………………………………………………….………………………...…66
Figure 3.6 Effect of glycosylation on DCE activity and thermal stability. (A) Kinetic
parameters of the control and deglycosylated DCE from A. aegypti. The incubation

xi
condition was described above. Mean +/- SD, n = 3. (unincubated DCE: Km 0.36 +/- 0.05
mM and Vmax 442.5 +/- 24.0 umol/min/mg). (B) Thermal stability of the control and
deglycosylated DCE at 45oC. All data were means of two repeats……………………...69
Figure 3.7 Confirmation of DCE deglycosylation by nano-LC/ESI/MS and SDS-PAGE.
(A) SDS-PAGE of the control and PNGase-deglycosylated DCE, and TIC of their tryptic
peptides. The shadowed areas indicate the elution window of relevant peptides and their
peak shift. (B) ESI/MS spectra of the relevant peptides of the control (Top) and
deglycosylated (Bottom) DCE…………………………………………...………………70
Figure 3.8 Structure and profile of N-linked oligosaccharides in mosquito DCE. (A) TIC
of tryptic peptides of DCE from A. aegypti. The shadowed area indicates the elution
window of the glycopeptides which are shown in (B). (B) and (C) show the
oligosaccharides and profile at Asn285
-Glu-Thr of A. Aegypti and A. subalbatus DCE,
respectively. These oligosaccharide structures are elucidated based on the data from
fragmentation spectra, monosaccharide analysis, and glycosidase deglycosylation. Man,
mannose; Fuc, Fucose; GlcNAc, N-acetylglucosamine………………………….……...72
CHAPTER 4
Figure 4.1 Multiple Sequence alignment of DDC and AMD. Gene accession numbers:
DDC, 724164; AMD isoform A, NP 476592; AMD isoform B, NP 724162…..….……84
Figure 4.2 AMD MALDI-TOF/TOF spectra of AMD isoform B specific tryptic
peptides. Peptide ion m/z 2111.05 (top spectrum) corresponds to the AMD isoform B

xii
peptide 26
ERDVLPSTAPYAVINQLPK44
, and peptide ion m/z 1306.56 (bottom
spectrum) corresponds to the peptide 45
EIPEQPDHWR55
………………………..….....89
Figure 4.3 Electrochemical detection of AMD (A and C) and DDC (B) enzymatic
metabolites. Reaction conditions: (A) 100 ug/mL AMD, 2 mM L-DOPA, (B) 100 ug/mL
DDC, 2 mM L-DOPA, (C) 100 ug/mL AMD, 2 mM methyldopa. All reactions were
carried out in 20 mM sodium phosphate pH 6.8 for 10 minutes. The L-DOPA reactions
were separated through C18 using 6% acetonitrile in the mobile phase; 30% acetonitrile
was used for methyldopa. Figure 4.3D indicates the reactions catalyzed by AMD based
on this analysis.…………………………………..………………….…………………...90
Figure 4.4 Electron impact fragmentation spectrum of the TMS derivatized L-DOPA
(above) and the EI spectrum of the TMS derivatized initial fraction from the AMD L-
DOPA enzymatic reaction (below)………………………………………….…………...91
Figure 4.5 Electron impact fragmentation spectrum of the TMS derivatized dopamine
(above) and the EI spectrum of the TMS derivatized second fraction from the AMD L-
DOPA enzymatic reaction (below)………………………………………..……………..92
Figure 4.6 Electron impact fragmentation spectrum of the TMS derivatized third
fraction from the L-DOPA AMD enzymatic reaction. A TMS-DOPAL derivative
standard ESI reference spectrum was obtained from Mattammal et al. [8]. These spectra
indicate an enolization of the aldehyde during the process of TMS derivatization.
…………………………………………………………………………..……….……….93
Figure 4.7 Electron impact fragmentation spectrum of the TMS derivatized methyldopa
(above) and the EI spectrum of the TMS derivatized initial fraction from the methyldopa
reaction (below)………………………………………………………………………..………...…..95
xiii
Figure 4.8 Electron impact fragmentation spectrum of the TMS derivatized 3,4-
dihydroxyphenylacetone (DHPA) standard (above) and the EI spectrum of the TMS
derivatized second fraction from the α-methyldopa reaction (below)…………………...96
Figure 4.9 GC-MS TIC for the dihydroxyphenylacetone standard (above) and product
fraction from incubation of AMD with methyldopa (below).…………….….…….……97
Figure 4.10 Intramolecular cyclization of dopamine. This same process can occur with
other catecholamines like L-DOPA, however not with sclerotization agents NADA and
NBAD or oxidized DOPAL that contain no amino group.…………………………….100
Figure 4.11 Proposed reaction mechanism for the oxidative decarboxylation of L-DOPA
and α-methyldopa catalyzed by AMD………..……………………………………...….101
APPENDIX
Figure A.1 Q-TOF tandem spectra of DCT tryptic peptides………………..………...114
Figure A.2 MALDI-TOF/TOF spectra of DCT glycosylated peptide ion m/z 2862.1..115
Figure A.3 Vector Map and multiple cloning site sequence of pHotWax. This vector was
modified from pMelBacA (Invitrogen) and shares the exact sequence with exception to
the multiple cloning site…………………..………………………………………..…...116
Figure A.4 Higher purity fractions of PNGase F after elution from Ni-NTA with 0-150
mM imidazole……………………………….…………………………………..…..….118
Figure A.5 Annotated mouse DCT, Tyr and TRP1 (Ty1) sequence alignment. Potential
N-glycosylation sites with an N-X-S/T motif are highlighted in green (X may represent
xiv
any amino acid except proline). Cysteine residues are highlighted in red with the
exception of those present in the signal sequence. The highly conserved metal binding
histidine residues are highlighted in yellow. Putative transmembrane domains are
highlighted in turquoise………………………………………………………………...120

xv
LIST OF TABLES
CHAPTER 2
Table 2.1 Identification of DCT tryptic peptides Identification and PTMs of DCT
peptides. All peptides were confirmed by manual analysis of tandem MS spectra.
* Peptide ion m/z 1249.86 was not seen in the MALDI-TOF/TOF analysis, but was seen
using Q-TOF. This method is described by Li et al.
[17]………………………………………………………………….…………...……….31
CHAPTER 3
Table 3.1 Identification and PTMs of A. aegypti dopachrome conversion enzyme……56
Table 3.2 Monosaccharide composition of DCE from A. aegypti……………………...61

xvi
LIST OF ABBREVIATIONS
5-HTP 5-hydroxytryptophan
5-HT 5-hydroxytryptamine, serotonin
α-methyldopa 3-(3,4-Dihydroxyphenyl)-2-methyl-L-alanine
AADC aromatic amino acid decarboxylase
AANAT arylalkylamine N-acetyltransferase
ALDH aldehyde dehydrogenase
AMD α-methyldopa resistant protein
asn asparagine
bp base pairs
BSTFA N,O-Bis(trimethylsilyl)trifluoroacetamide
COMT catechol-O-methyl transferase
CID collision induced dissociation
Da dalton
DA dopamine, L-3,4-dihydroxyphenethylamine
DBH dopamine-β-hydroxylase
DCE dopachrome conversion enzyme
DCT dopachrome tautomerase
DDC dopa decarboxylase
DHI 5,6-dihydroxyindole
DHICA 5,6-dihydroxyindole-2-carboxylic acid
DTT dithiothreitol

xvii
GlcNAc N-acetyl-glucosamine
Hex Hexose
L-DOPA L-3,4-dihydroxyphenylalanine
MALDI matrix assisted laser desorption ionization
Man Mannose
MS mass spectrometry
MS/MS tandem mass spectrometry
NADA N-acetyldopamine
NBAD N-β-alanyldopamine
PCR polymerase chain reaction
PMSF phenylmethylsulfonyl fluoride
PNGase F peptide N-glycosidase F
PNMT phenyletanolamine N-methyltransferase
PTM post-translational modification
Q quadrupole
ROS reactive oxygen species
Sf9 Spodoptera frugiperda 9 cell line
TEV tobacco etch virus
TH tyrosine hydroxylase
TIC total ion count
TMCS trimethylchlorosilane
TOF time of flight
TRP1 tyrosinase-related protein 1

1
I
INTRODUCTION

2
1.1 Tyrosine Metabolism
Tyrosine or (S)-2-Amino-3-(4-hydroxyphenyl)-propanoic acid is a semi-essential
amino acid synthesized from phenylalanine in most animals. Along with tryptophan,
tyrosine contributes to a majority of the UV absorbance of proteins. Aside from its role as
a protein residue, tyrosine may undergo many different fates in animals depending on the
enzymatic or oxidative forces it encounters (Figure 1.1).
Many evolutionary commonalities and differences exist between the precise
functions of tyrosine metabolism in insects and mammals. One common link in all
animals is the use of tyrosine for the synthesis of catecholamines, 3,4-dihydroxy
derivatives of phenylethylamine [1]. The biosynthesis of catecholamines begins with the
enzymatic hydroxylation tyrosine to L-DOPA by tyrosine hydroxylase [1].
Decarboxylation of L-DOPA by dopa decarboxylase (DDC) leads to the formation of
dopamine (DA), an abundant signaling molecule located primarily in the striatum of
mammals [1]. Dopamine appears to have multiple functions, relating to movement,
reward, motivation, cognition and learning [2]. Hydroxylation of dopamine by dopamine-
β-hydroxylase (DBH) produces norepinephrine [1]. Phenylethanolamine-N-
methyltransferase (PNMT) methylates norepinephrine to epinephrine, which is primarily
a hormone in the peripheral nervous system [1]. Both the aromatic phenol ring of tyrosine
and the catechol ring absorb light strongly in the UV-region making them easy to detect.
3

4
The vicinal diol system of catechol rings is easily oxidized to a quinone [3]. The
ability to oxidize catecholamines easily makes them convenient for detection using
electrochemical detection. Furthermore, the oxidation of catechol to highly electrophilic
quinones is precisely the driving force for melanogenesis and sclerotization [3].
1.2 Melanogenesis
Melanin is a large pigment composed primarily of hydroxylated indole residues
(Figure 1.2). This complex heteropolymer is present in various bacteria, fungi, plants and
animals [4]. It is well established that melanin protects against detrimental UV radiation;
however, the presence of melanin in the CNS and inner ear of mammals suggests
additional functions [5]. Melanin polymers may participate in either one- or two-electron
redox reactions, enabling these polymers to protect against reactive oxygen species [6].
The cuttlefish Sepia officinalis secretes a melanin-rich ink as a defense response [7].
Furthermore, melanin has also been demonstrated to be involved in various immune
responses [6], chelating of metals [8], mosquito eggshell hardening [9], and possibly
signal transduction [5].

5
Figure 1.2 Structure of Sepia melanin proposed by Nicolaus RA [10]. Due to the irregular nature of this polymer, no exact crystal structures currently exist of melanin.
6
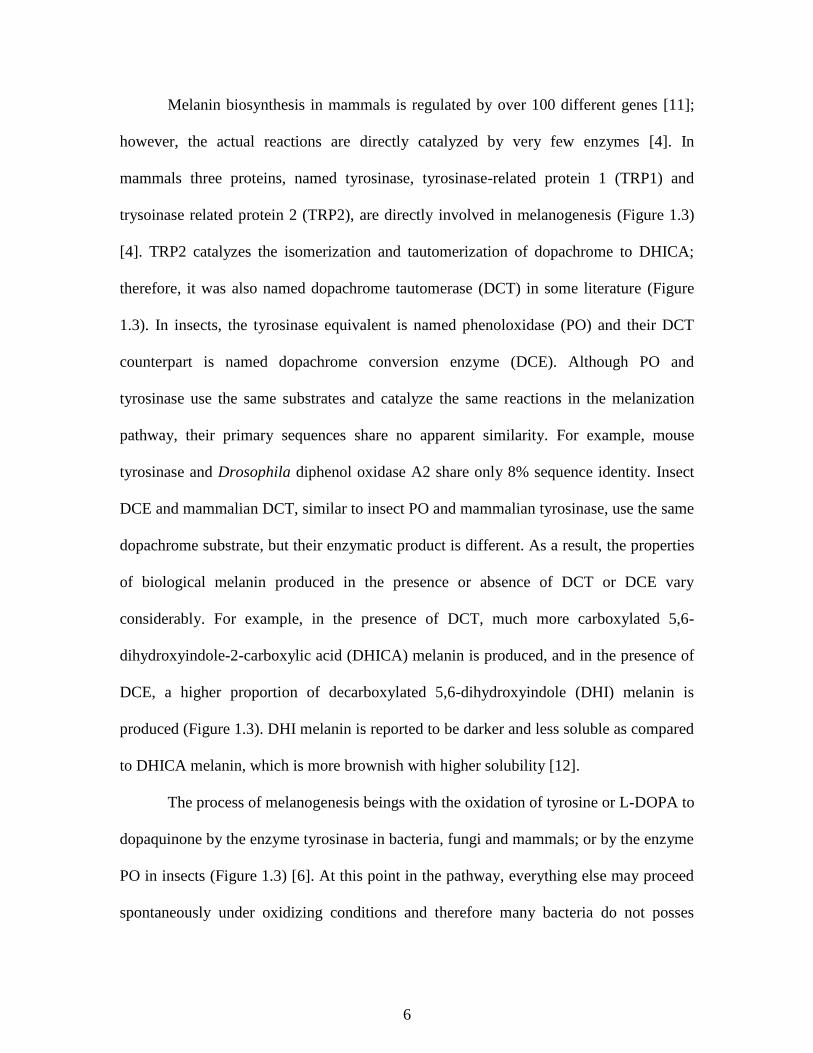
Melanin biosynthesis in mammals is regulated by over 100 different genes [11];
however, the actual reactions are directly catalyzed by very few enzymes [4]. In
mammals three proteins, named tyrosinase, tyrosinase-related protein 1 (TRP1) and
trysoinase related protein 2 (TRP2), are directly involved in melanogenesis (Figure 1.3)
[4]. TRP2 catalyzes the isomerization and tautomerization of dopachrome to DHICA;
therefore, it was also named dopachrome tautomerase (DCT) in some literature (Figure
1.3). In insects, the tyrosinase equivalent is named phenoloxidase (PO) and their DCT
counterpart is named dopachrome conversion enzyme (DCE). Although PO and
tyrosinase use the same substrates and catalyze the same reactions in the melanization
pathway, their primary sequences share no apparent similarity. For example, mouse
tyrosinase and Drosophila diphenol oxidase A2 share only 8% sequence identity. Insect
DCE and mammalian DCT, similar to insect PO and mammalian tyrosinase, use the same
dopachrome substrate, but their enzymatic product is different. As a result, the properties
of biological melanin produced in the presence or absence of DCT or DCE vary
considerably. For example, in the presence of DCT, much more carboxylated 5,6-
dihydroxyindole-2-carboxylic acid (DHICA) melanin is produced, and in the presence of
DCE, a higher proportion of decarboxylated 5,6-dihydroxyindole (DHI) melanin is
produced (Figure 1.3). DHI melanin is reported to be darker and less soluble as compared
to DHICA melanin, which is more brownish with higher solubility [12].
The process of melanogenesis beings with the oxidation of tyrosine or L-DOPA to
dopaquinone by the enzyme tyrosinase in bacteria, fungi and mammals; or by the enzyme
PO in insects (Figure 1.3) [6]. At this point in the pathway, everything else may proceed
spontaneously under oxidizing conditions and therefore many bacteria do not posses
7
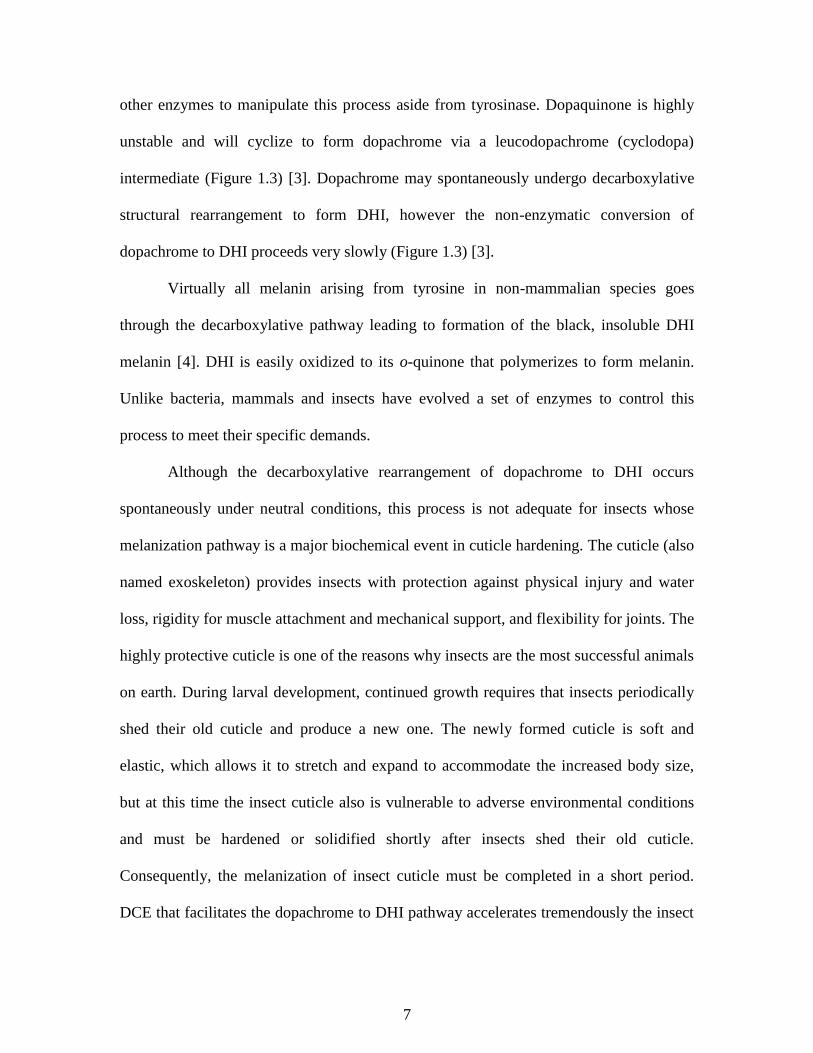
other enzymes to manipulate this process aside from tyrosinase. Dopaquinone is highly
unstable and will cyclize to form dopachrome via a leucodopachrome (cyclodopa)
intermediate (Figure 1.3) [3]. Dopachrome may spontaneously undergo decarboxylative
structural rearrangement to form DHI, however the non-enzymatic conversion of
dopachrome to DHI proceeds very slowly (Figure 1.3) [3].
Virtually all melanin arising from tyrosine in non-mammalian species goes
through the decarboxylative pathway leading to formation of the black, insoluble DHI
melanin [4]. DHI is easily oxidized to its o-quinone that polymerizes to form melanin.
Unlike bacteria, mammals and insects have evolved a set of enzymes to control this
process to meet their specific demands.
Although the decarboxylative rearrangement of dopachrome to DHI occurs
spontaneously under neutral conditions, this process is not adequate for insects whose
melanization pathway is a major biochemical event in cuticle hardening. The cuticle (also
named exoskeleton) provides insects with protection against physical injury and water
loss, rigidity for muscle attachment and mechanical support, and flexibility for joints. The
highly protective cuticle is one of the reasons why insects are the most successful animals
on earth. During larval development, continued growth requires that insects periodically
shed their old cuticle and produce a new one. The newly formed cuticle is soft and
elastic, which allows it to stretch and expand to accommodate the increased body size,
but at this time the insect cuticle also is vulnerable to adverse environmental conditions
and must be hardened or solidified shortly after insects shed their old cuticle.
Consequently, the melanization of insect cuticle must be completed in a short period.
DCE that facilitates the dopachrome to DHI pathway accelerates tremendously the insect

8
melanization process, which likely explains why DCE is evolved only in insects [13]
[14]. To illustrate this, mosquito eggs can darken from white to black within a 2 hour-
period [9].
On the other hand, mammals have much more time to invest into the process of
melanogenesis. DHI is highly reactive and toxic to various cell lines [13]. DCT catalyzes
the specific non-decarboxylative tautomerization of dopachrome to DHICA, which can
polymerize in a similar manner to DHI. Therefore, DCT protects the cell against the
formation of DHI, a toxic intermediate [13]. Although DCT shares approximately 40%
sequence identity with tyrosinase and contains the same highly conserved metal binding
histidine residues, the active site of DCT has a very different function and has nothing to
do with the binding of molecular oxygen (see appendix).

9
10
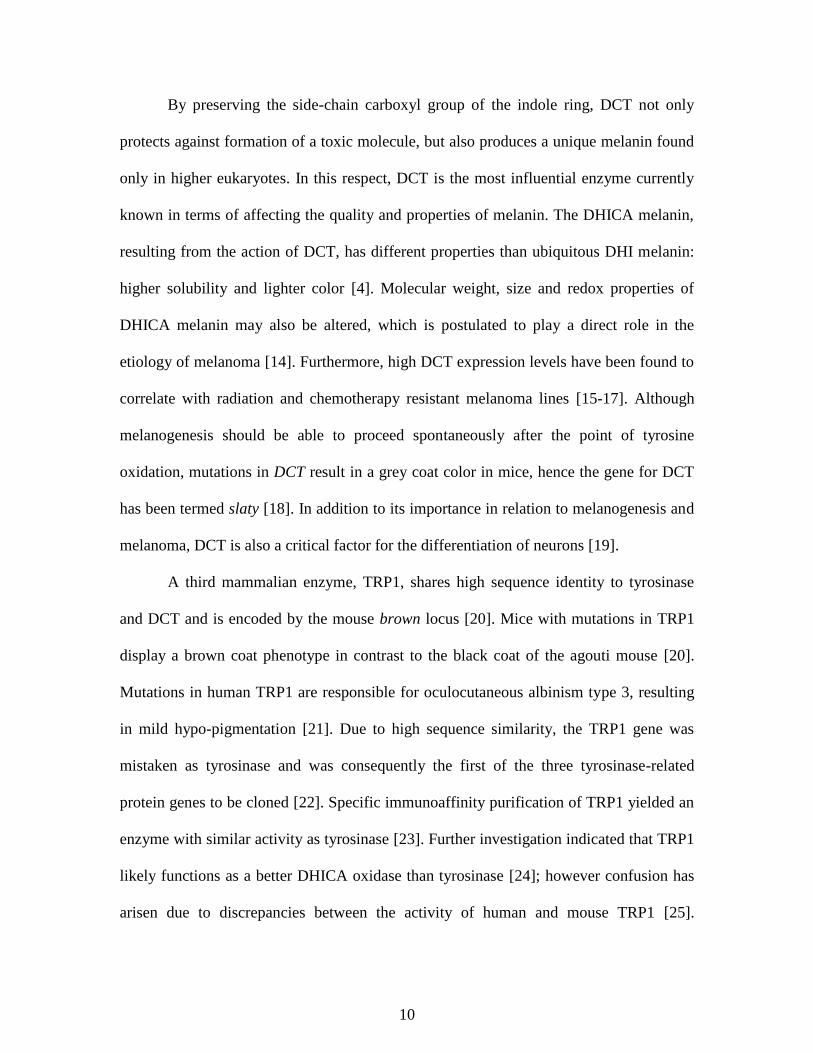
By preserving the side-chain carboxyl group of the indole ring, DCT not only
protects against formation of a toxic molecule, but also produces a unique melanin found
only in higher eukaryotes. In this respect, DCT is the most influential enzyme currently
known in terms of affecting the quality and properties of melanin. The DHICA melanin,
resulting from the action of DCT, has different properties than ubiquitous DHI melanin:
higher solubility and lighter color [4]. Molecular weight, size and redox properties of
DHICA melanin may also be altered, which is postulated to play a direct role in the
etiology of melanoma [14]. Furthermore, high DCT expression levels have been found to
correlate with radiation and chemotherapy resistant melanoma lines [15-17]. Although
melanogenesis should be able to proceed spontaneously after the point of tyrosine
oxidation, mutations in DCT result in a grey coat color in mice, hence the gene for DCT
has been termed slaty [18]. In addition to its importance in relation to melanogenesis and
melanoma, DCT is also a critical factor for the differentiation of neurons [19].
A third mammalian enzyme, TRP1, shares high sequence identity to tyrosinase
and DCT and is encoded by the mouse brown locus [20]. Mice with mutations in TRP1
display a brown coat phenotype in contrast to the black coat of the agouti mouse [20].
Mutations in human TRP1 are responsible for oculocutaneous albinism type 3, resulting
in mild hypo-pigmentation [21]. Due to high sequence similarity, the TRP1 gene was
mistaken as tyrosinase and was consequently the first of the three tyrosinase-related
protein genes to be cloned [22]. Specific immunoaffinity purification of TRP1 yielded an
enzyme with similar activity as tyrosinase [23]. Further investigation indicated that TRP1
likely functions as a better DHICA oxidase than tyrosinase [24]; however confusion has
arisen due to discrepancies between the activity of human and mouse TRP1 [25].
11
Furthermore, TRP1 has been found to form a heterodimeric complex with tyrosinase
[26]. Therefore the precise function of TRP1 is not entirely clear.
Among the three proteins directly involved in mammalian melanogenesis, tyrosinase
has been the most well-characterized biochemically. A 3-D structure for a Streptomyces
tyrosinase has been solved [27]. Although its primary sequence shares relatively limited
sequence identity (29%) with mammalian tyrosinase and is only about half the size of the
mammalian enzyme, the structural basis of substrate binding and catalysis of the
mammalian tyrosinase likely is similar to that of the bacterial enzyme. DCT is very
interesting in terms of its substrate specificity and catalysis, since it contains a
“tyrosinase” domain yet catalyzes a completely different type of reaction. This, in
addition to the ease in detecting dopachrome activity, has made DCT an ideal starting
point for the structure and function analysis of the tyrosinase-related protein family. As
for TRP1, there is much to learn about its physiological function.
1.3 Processing of Secreted Proteins
Many of the proteins involved in melanogenesis contain a signal peptide and undergo
extensive processing and trafficking before reaching their functional state and
destination. This has been a major area of research for the tyrosinase related protein
family [28]. DCE also contains a signal sequence and is processed and glycosylated in
the ER (Chapter 3).
Proteins secreted into the ER undergo various co- and post-translational modifications
including N-glycosylation and disulfide bond formation [29]. N-glycosylation normally
12
occurs at Asn residues with the Asn-X-Ser/Thr motif, where X can be any amino acid
except proline [29]. A core Glc3Man9GlcNAc2 oligosaccharide unit is transferred to the
N-glycosylation site of glycoproteins in the ER, and processing begins with the removal
of the 3 terminal glucose residues by α-glucosidase I and II [30]. Before the third glucose
is removed by α-glucosidase II, the monoglucosylated oligosaccharide moiety is able to
bind with the ER lectin chaperones calnexin and calreticulin [31]. Once the protein is
folded and the third glucose is removed, the protein may then enter the Golgi complex,
where it undergoes further glycan processing [29].
Incorporation of an N-glycosylation site has been demonstrated to increase secretion
of heterologous proteins in yeast [32]. Due to the heavy involvement of the N-
glycosylation into the proper folding and processing of secreted proteins, proteins in this
class are very unlikely to express as soluble recombinant protein in a bacterial expression
system. Therefore, if there is difficulty in obtaining protein from native sources, as it is
the case with the tyrosinase-related proteins, a eukaryotic expression system like yeast,
insect cells or mammalian Chinese hamster ovary (CHO) cells must be utilized.
O-glycosylation of serine or threonine protein residues may occur at a later point
(after N-glycosylation) in the processing of secreted proteins in the Golgi. Due to the
importance of N-glycosylation for interactions with the chaperones calnexin and
calreticulin in the ER, there is an emphasis on N-glycosylation in the study of the
tyrosinase-related proteins. However, O-glycosylation has also been demonstrated to play
an important role in the processing of secreted proteins, like synaptotagmin [33], and
there is evidence that tyrosinase may contain O-glycosylation sites [34].

13
1.4 Insect Catecholamine Metabolism
A major difference between insects and mammals in regards to tyrosine metabolism
is the use of dopamine in the process of cuticle sclerotization. This process is highly
related to melanogenesis and occurs simultaneously. Insects produce N-acetyl-dopamine
and N-beta-alanyldopamine as crosslinking precursors to promote the hardening of the
cuticle (Figure 1.1) [35]. It is understood that highly reactive quinones, similar to those
arising from melanogenesis, also function to crosslink components in the cuticle [35].
One major difference between the known intermediates in melanogenesis and
sclerotization is the presence of a free amino group able to promote intramolecular
cyclization.
α-Methyldopa is a competitive inhibitor of DDC and therefore prevents the formation
of dopamine from L-DOPA [36]. In a similar manner, α-methyltyrosine is also a
competitive inhibitor of TH and is slowly metabolized to α-methyldopa [1].
Catecholamines stimulate the sympathetic nervous system, which is activated during a
response to stress (fight-or-flight response). Therefore, catecholamines often result in
increased blood pressure and α-methyldopa has been marketed as the drug aldomet to
treat hypertension [1]. Insects, which require dopamine to form sclerotin, especially
during cuticle development, are especially susceptible to inhibition of DDC [37]. While
studying the effect of α-methyldopa on DDC mutants, strains of Drosophila that are
hypersensitive to this inhibitor were identified [37]. A new gene adjacent to DDC was
identified and the product was termed α-methyldopa resistant protein (AMD) [37]. This
protein shares approximately 40% sequence identity with DDC and is expressed as two

14
isoforms with variation in their N-terminal sequence, however the function of the two
AMD isoforms has yet to be reported.
15
LITERATURE CITED
1. Molinoff, P.B. and J. Axelrod, Biochemistry of catecholamines. Annu Rev
Biochem, 1971. 40: p. 465-500.
2. Schultz, W., Multiple dopamine functions at different time courses. Annu Rev
Neurosci, 2007. 30: p. 259-88.
3. Ito, S. and K. Wakamatsu, Chemistry of mixed melanogenesis--pivotal roles of
dopaquinone. Photochem Photobiol, 2008. 84(3): p. 582-92.
4. Prota, G., Melanins and melanogenesis. 1992, San Diego: Academic Press. xiii,
290 p.
5. Nicolaus, B.J.R., A critical review of the function of neuromelanin and an attempt
to provide a unified theory. Medical Hypotheses, 2005. 65(4): p. 791-796.
6. Riley, P.A., Melanin. International Journal of Biochemistry & Cell Biology, 1997.
29(11): p. 1235-1239.
7. Russo, G.L., et al., Toxicity of melanin-free ink of Sepia officinalis to transformed
cell lines: identification of the active factor as tyrosinase. Biochemical and
Biophysical Research Communications, 2003. 308(2): p. 293-299.
8. Sarna, T., J.S. Hyde, and H.M. Swartz, Ion-Exchange in Melanin - Electron-Spin
Resonance Study with Lanthanide Probes. Science, 1976. 192(4244): p. 1132-
1134.
9. Li, J.S.S. and J.Y. Li, Major chorion proteins and their crosslinking during
chorion hardening in Aedes aegypti mosquitoes. Insect Biochemistry and
Molecular Biology, 2006. 36(12): p. 954-964.
10. Nicolaus, R.A., M. Piattelli, and E. Fattorusso, The structure of melanins and
melanogenesis. IV. On some natural melanins. Tetrahedron, 1964. 20(5): p. 1163-
72.
11. Bennett, D.C. and M.L. Lamoreux, The color loci of mice - A genetic century.
Pigment Cell Research, 2003. 16(4): p. 333-344.
12. Orlow, S.J., M.P. Osber, and J.M. Pawelek, Synthesis and characterization of
melanins from dihydroxyindole-2-carboxylic acid and dihydroxyindole. Pigment
Cell Res, 1992. 5(3): p. 113-21.

16
13. Pawelek, J.M. and A.B. Lerner, 5,6-Dihydroxyindole is a melanin precursor
showing potent cytotoxicity. Nature, 1978. 276(5688): p. 626-8.
14. Sarangarajan, R. and S.P. Apte, The polymerization of melanin: a poorly
understood phenomenon with egregious biological implications. Melanoma
Research, 2006. 16(1): p. 3-10.
15. Pak, B.J., et al., Lineage-specific mechanism of drug and radiation resistance in
melanoma mediated by tyrosinase-related protein 2. Cancer Metastasis Rev,
2001. 20(1-2): p. 27-32.
16. Pak, B.J., et al., Radiation resistance of human melanoma analysed by retroviral
insertional mutagenesis reveals a possible role for dopachrome tautomerase.
Oncogene, 2004. 23(1): p. 30-8.
17. Pak, B.J., et al., TYRP2-mediated resistance to cis-diamminedichloroplatinum (II)
in human melanoma cells is independent of tyrosinase and TYRP1 expression and
melanin content. Melanoma Res, 2000. 10(5): p. 499-505.
18. Costin, G.E., et al., Mutations in dopachrome tautomerase (Dct) affect
eumelanin/pheomelanin synthesis, but do not affect intracellular trafficking of the
mutant protein. Biochem J, 2005. 391(Pt 2): p. 249-59.
19. Jiao, Z., et al., Dopachrome tautomerase (Dct) regulates neural progenitor cell
proliferation. Dev Biol, 2006. 296(2): p. 396-408.
20. Jackson, I.J., A cDNA encoding tyrosinase-related protein maps to the brown
locus in mouse. Proc Natl Acad Sci U S A, 1988. 85(12): p. 4392-6.
21. Boissy, R.E., et al., Mutation in and lack of expression of tyrosinase-related
protein-1 (TRP-1) in melanocytes from an individual with brown oculocutaneous
albinism: a new subtype of albinism classified as "OCA3". Am J Hum Genet,
1996. 58(6): p. 1145-56.
22. Shibahara, S., et al., Cloning and expression of cDNA encoding mouse tyrosinase.
Nucleic Acids Res, 1986. 14(6): p. 2413-27.
23. Jimenez, M., K. Tsukamoto, and V.J. Hearing, Tyrosinases from two different loci
are expressed by normal and by transformed melanocytes. J Biol Chem, 1991.
266(2): p. 1147-56.
24. Jimenez-Cervantes, C., et al., A new enzymatic function in the melanogenic
pathway. The 5,6-dihydroxyindole-2-carboxylic acid oxidase activity of
tyrosinase-related protein-1 (TRP1). J Biol Chem, 1994. 269(27): p. 17993-8000.

17
25. Boissy, R.E., et al., Human tyrosinase related protein-1 (TRP-1) does not function
as a DHICA oxidase activity in contrast to murine TRP-1. Exp Dermatol, 1998.
7(4): p. 198-204.
26. Jimenez-Cervantes, C., et al., Molecular interactions within the melanogenic
complex: Formation of heterodimers of tyrosinase and TRP1 from B16 mouse
melanoma. Biochemical and Biophysical Research Communications, 1998.
253(3): p. 761-767.
27. Matoba, Y., et al., Crystallographic evidence that the dinuclear copper center of
tyrosinase is flexible during catalysis. J Biol Chem, 2006. 281(13): p. 8981-90.
28. Branza-Nichita, N., et al., N-glycosylation processing and glycoprotein folding -
Lessons from the tyrosinase-related proteins. Chemical Reviews, 2000. 100(12):
p. 4697-+.
29. Varki, A., Essentials of glycobiology. 2nd ed. 2009, Cold Spring Harbor, N.Y.:
Cold Spring Harbor Laboratory Press. xxix, 784 p.
30. Roth, J., M. Ziak, and C. Zuber, The role of glucosidase II and endomannosidase
in glucose trimming of asparagine-linked oligosaccharides. Biochimie, 2003.
85(3-4): p. 287-94.
31. Caramelo, J.J. and A.J. Parodi, Getting in and out from calnexin/calreticulin
cycles. Journal of Biological Chemistry, 2008. 283(16): p. 10221-10225.
32. Sagt, C.M.J., et al., Introduction of an N-glycosylation site increases secretion of
heterologous proteins in yeasts. Applied and Environmental Microbiology, 2000.
66(11): p. 4940-+.
33. Atiya-Nasagi, Y., et al., O-glycosylation is essential for intracellular targeting of
synaptotagmins I and II in non-neuronal specialized secretory cells. J Cell Sci,
2005. 118(Pt 7): p. 1363-72.
34. Halaban, R., et al., Regulation of Tyrosinase in Human Melanocytes Grown in
Culture. Journal of Cell Biology, 1983. 97(2): p. 480-488.
35. Andersen, S.O., M.G. Peter, and P. Roepstorff, Cuticular sclerotization in insects.
Comparative Biochemistry and Physiology B-Biochemistry & Molecular Biology,
1996. 113(4): p. 689-705.
36. Lovenberg, W., et al., Characteristics of the Inhibition of Aromatic L-Amino Acid
Decarboxylase by Alpha-Methylamino Acids. Arch Biochem Biophys, 1963. 103:
p. 9-14.

18
37. Marsh, J.L. and T.R.F. Wright, Evidence for Regulatory Variants of the Dopa
Decarboxylase and Alpha-Methyldopa Hypersensitive Loci in Drosophila.
Genetics, 1986. 112(2): p. 249-265.
19
II
DOPACHROME TAUTOMERASE
20
2.1 Abstract
Dopachrome tautomerase (DCT) catalyzes the non-decarboxylative
tautomerization of dopachrome to 5,6-dihydroxyindole-2-carboxylic acid (DHICA) in the
melanogenesis pathway. In the absence of DCT, dopachrome spontaneously undergoes
decarboxylative structural rearrangement to form 5,6-dihydroxyindole (DHI), which is
more easily oxidized that DHICA, leading to higher levels of reactive oxygen species.
DCT plays a critical role in lowering oxidative stress resulting from melanogenesis.
Levels of DCT are elevated in melanoma cell lines that are especially resistant to
chemotherapy and radiation. DCT is also processed as a melanoma antigen and is being
explored as a potential target for immunotherapy. In order to establish a more complete
understanding of the contributions that DCT may offer in the treatment of melanoma skin
cancer, isolation of highly pure and properly processed protein is necessary. Purification
of native DCT has been problematic due to a hydrophobic transmembrane anchor and
interactions with melanin. In this study, DCT was expressed, without its carboxy-terminal
transmembrane region, using a Sf9 insect cell protein expression system and its
recombinant protein was purified by various chromatographic techniques. Analysis of its
tryptic peptides by MALDI-TOF/TOF determined N-glycosylation as a primary DCT
post-translational modification. Our success in the expression of soluble mammalian
DCT and the characterization of N-glycosylation should serve as a useful reference
toward a comprehensive understanding of the structure / function relationship of
mammalian DCT.

21
2.2 Introduction
Dopachrome tautomerase (DCT, TRP-2) catalyzes a tautomerization of L-
dopachrome to 5,6-dihydroxyindole-2-carboxylic acid in the mammalian melanogenesis
pathway (Figure 2.1) [1]. In the absence of DCT, dopachrome undergoes a
decarboxylative structural rearrangement to form 5,6-dihydroindole that is easily
oxidized by molecular oxygen, leading to the production of reactive oxygen species. By
preserving the carboxylic acid group of its substrate, DCT protects the cell against the
formation of 5,6-dihydroxyindole, a highly toxic intermediate [2].
Unfortunately, DCT not only protects healthy melanocytes, but also contributes
significantly to the resistance of melanoma to many various forms of treatment.
Transfection of WM35 human melanoma cells with DCT has been reported to confer
resistance to the chemotherapeutic drug, CDDP [3, 4]. Later, it was demonstrated that
DCT is significantly elevated at the mRNA and protein level in WM35 cell lines that
display increased resistance to X-ray radiation, UV radiation and chemotherapy [5].
Furthermore, DCT is presented as a melanoma surface antigen that is recognized by
cytotoxic T-cells and is therefore a potential target for immunotherapy [6-8].
The ability to obtain purified DCT is essential to our understanding of its function
in resistant melanoma lines. Although there is high DCT activity in melanocytes and
melanoma cells, a carboxy-terminal transmembrane domain has made it difficult to purify
native DCT. Furthermore, melanosomal proteins are often covalently linked to melanin,
making them even less soluble [9]. Immune-affinity purification of native DCT has been
reported; however, this was done using antibodies specific for a portion of the carboxy-
terminal membrane region [10]
22

23
In the study described herein, functionally active recombinant DCT was
expressed, without this problematic hydrophobic region, using a Sf9 insect cell
expression system. This recombinant DCT was purified without the use of detergents that
often interfere with separation and cannot simply be removed with dialysis. Expression of
DCT in a eukaryotic system has proved necessary largely due to extensive N-
glycosylation of DCT, which is critical for correct processing and trafficking in the ER
and Golgi [11]. Transient interactions between protein N-glycan structures and ER lectin-
like resident chaperones are extremely important for folding of glycoproteins [12, 13].
This maturation process in the endomembrane system has been extensively studied using
tyrosinase and tyrosinase-related protein 1, the proteins most closely related to DCT [12,
13]. However, no direct investigation into the glycosylation sites of DCT has previously
been reported [14]. In the analysis of recombinant DCT using MALDI-TOF/TOF, two
out of the seven potential N-glycosylated sites were found to be occupied.
2.3 Materials and Methods
Materials
Spodoptera frugiperda (Sf9) insect cells, pBlueBac4.5, linearized Autographa
californica multicapsid nucleopolyhedrovirus (AcMNPV) viral DNA, and CellfectinR
Transfection Reagent were from Invitrogen (Carlsbad, CA, USA). Grace’s Insect
Medium was from Gibco (Carlsbad, CA, USA) and fetal bovine serum was from
Innovative Research (Novi, MI, USA). B16 murine melanoma cells and Dulbecco’s
Modified Eagle’s Medium were obtained from ATCC (Manassas, VA, USA). 3,4-

24
dihydroxyphenylalanine (L-DOPA), sodium periodate, phenylmethylsulfonyl fluoride
(PMSF) and Octyl-Sepharose were from Sigma (St. Louis, MO, USA). Mono-Q and
Superose were from Amersham Biosciences (Piscataway, NJ, USA). CHT
Ceramic
Hydroxyapatite was obtained from Bio-Rad (Hercules, CA, USA). PNGase F expression
vector, pOPH6, was a gift from Dr. Shaun Lott (University of Auckland, New Zealand).
Expression of Recombinant DCT
Total mRNA was isolated from B16 mouse melanoma cells and reverse
transcribed to cDNA. A forward primer
(ACTAGTATGCTAGCATGGGCCTTGTGGGAT) containing an NheI restriction site
and a reverse primer (ACTAGGATCCCTATGAGAGAGTTGTGGACC) containing an
EcoRI restriction site were used for PCR amplification of the DCT coding sequence from
the B16 cDNA library. PCR parameters: 64oC annealing temperature, (45 s); 72
oC
extension (2 min, 20 s); 36 cycles. This led to the amplification of a 1416 bp truncated
DCT coding sequence (without the carboxyl-terminal membrane domain of 135 bp). The
gene fragment amplified using the above primers encode a truncated DCT protein with
the C-terminal sequence SEEEAPVWSTTLS
The PCR product was ligated into the baculovirus transfer vector pBlueBac4.5
between the NheI and EcoRI restriction sites. The resulting recombinant baculovirus
transfer vector was amplified in E. coli. DNA from purified recombinant baculovirus was
PCR amplified using the forward primer TTTACTGTTTTCGTAACAGTTTTG and
reverse primer CAACAACGCACAGAATCTAGC. PCR parameters: 60oC annealing
temperature, (45 s); 72oC extension (2 min, 30 s); 36 cycles. A 1.85 kb fragment was
25
observed, matching the calculated size of the DCT coding sequence (1.41 kb) and b
aculovirus sequence (435 bp). No wild-type virus amplified DNA fragment was present
when analyzing the PCR products with agarose gel electrophoresis.
The DCT recombinant pBlueBac4.5 transfer vector and linearized Bac-N-Blue™
viral DNA were co-transfected into log phase Sf9 cells using CellfectinR Reagent. Pure
recombinant baculovirus was purified by a plaque assay. Viral DNA was isolated for
PCR analysis to determine the purity of the recombinant virus. A high-titer viral stock of
a pure recombinant virus was generated through amplification in suspension cultured Sf9
cells.
DCT activity was detected in transfected Sf9 cells one day after inoculation of
DCT recombinant baculovirus and reached its peak activity four days after viral
infection. Sf9 cells were cultured in TNM-FH medium containing 10% fetal bovine
serum and harvested 4 days after inoculation of DCT recombinant virus by centrifugation
(800 g for 15 min at 4°C). Cell pellets were stored at -80°C until use.
Dopachrome Tautomerase Activity Assay
The preparation of fresh L-dopachrome and assay of DCT activity were according
to the methods of Aroca et al. [15]. Briefly, an equal volume of 4 mM L-DOPA was
mixed with 8 mM sodium periodate. Dopachrome activity was assessed visually by the
disappearance of dopachrome, which is bright red, or by the decrease in absorbance at
475 nm. Dopachrome has a molar extinction coefficient of 3,700 M-1
cm-1
. Sf9 insect
cells transfected with baculovirus encoding an unrelated protein was used as a control to

26
determine that there was no background DCT activity in the expression system (data not
shown).
DCT Purification
Harvested Sf9 cells (12g wet weight) were solubilized in 20 mM sodium
phosphate (pH 6.8) with 1 mM PMSF. After sonication and incubation on ice for one
hour, cell lysates were centrifuged for 45 min at 35,000 g at 4°C. The pellet was re-
extracted in the same manner and the supernatants were combined to a total volume of
250 mL. Ammonium sulfate (49.5 g) was added to the crude cell extract to make the final
concentration 1.5 M and the sample was loaded onto 20 mL Octyl Sepharose column (15
x 170 mm) at a flow rate of 1.5 ml min-1
in a 4oC cold room. After washing with 3
column volumes of 1.5 M ammonium sulfate, protein was eluted with a linear gradient of
ammonium sulfate (1.5 - 0 M) prepared in 50 mM sodium phosphate, pH 6.8. DCT active
fractions were combined and immediately dialyzed against 20 mM sodium phosphate
(pH 7.5) with 5% glycerol at 4oC.
A hydroxyapatite column was packed using 20-µm particle CHT ceramic
hydroxyapatite (Bio-Rad) with a bed volume of 5 mL (1.0 x 6.4 ml). The column was
washed with 50 ml of 400 mM sodium phosphate (pH 7.5) and then equilibrated with 20
mM sodium phosphate (pH 7.5) with 5% glycerol. The dialyzed DCT active fractions
from Octyl Sepharose chromatography were applied to the hydroxyapatite column at a
flow rate of 0.8 ml min-1
. The recombinant DCT did not bind to hydroxyapatite under the
applied conditions; the flow through was collected and then immediately applied to Mono
Q.

27
A Mono Q column (8 mL, 10 x 100 mm) was equilibrated with 20 mM sodium
phosphate (pH 7.5) and the hydroxyapatite flow through was applied to the column.
Proteins were eluted by a linear NaCl gradient (0 - 400 mM) made up in 20 mM sodium
phosphate (pH 7.5) with 5% glycerol.
DCT active fractions were combined and concentrated using a membrane
concentrator with a molecular weight cutoff of 30,000. During concentration, the buffer
was exchanged with sodium phosphate (pH 6.8) with 150 mM NaCl and 5% glycerol and
the DCT active sample was loaded onto a Superose 6 gel filtration column (24 mL, 10 x
300 mm) at a flow rate of 0.2 mL min-1
. DCT active fractions were collected and
concentrated again using the membrane concentrator. DCT was stored at -20oC in 20 mM
sodium phosphate (pH 6.8) with 5% glycerol.
SDS-PAGE
12% polyacrylamide gels were used for SDS-PAGE separations. Protein samples
were heated to 95oC in loading buffer containing DTT. Samples were loaded and run at a
current of 15 mA. Gels were stained with Coomassie Blue and destained using 40%
methanol containing 7% acetic acid.
In-Gel Digestion of DCT
DCT, separated by SDS-PAGE, was cut into 1 mm cubes and transferred to a low
retention microcentrifuge tube. The gel cubes were extensively washed and destained
using a washing buffer containing 25 mM NH4HCO3 and 50% acetonitrile (pH 8.0).
Next, the gel pieces were dehydrated using 100% acetonitrile, followed by DTT (35 mM)
28
reduction and iodoacetamide alkylation (80 mM). Before digestion with trypsin, the gel
cubes were washed using the same washing buffer and dried under vacuum in a Speed
Vac. DCT was digested with 1 µg / mL trypsin for 16 hours at 37°C. Peptides were
extracted from the gel pieces with 0.1% TFA and desalted using ZipTip C18.
PNGase F Deglycosylation
Glycoamidase PNGase F was produced according to the methods of Loo et al.
(see section A.1 of the appendix) [16]. Recombinant His-tagged PNGaseF from
Flavobacterium meningosepticum was overexpressed in BL21(DE3) E. coli and purified
with a Ni-NTA column. Purified DCT (0.25 mg) was digested with 0.1 mg PNGase F
(0.1 mg) for 48 hours at 37°C in a reaction volume of 0.5 mL. After deglycosylation, the
sample was separated by SDS-PAGE and processed for in-gel digestion in the same
manner as the glycosylated DCT.
MALDI-TOF/TOF Analysis
The MALDI-TOF/TOF analysis of DCT tryptic peptides was carried out by the
Virginia Tech Mass Spectrometry Incubator (http://www.mass.biochem.vt.edu/).
Approximately 1 µL of each desalted sample was deposited onto a dried matrix spot on a
MALDI target plate. The matrix spot was 1 µL of a 4 mg/mL α-cyano-hydroxycinnamic
acid solution in 40% acetonitrile, 60% water supplemented with 0.5% formic acid and 20
mM ammonium dihydrogen citrate. MS data were acquired using an Applied Biosystems
4800 MALDI TOF/TOF operated in positive ion reflectron mode for m/z range 800 to
4000. MS/MS data were then collected utilizing the positive ion MS/MS 1kV mode
29
(without the use of a CID gas) for the predominant peaks observed in the MS spectrum.
Typically, data for 500 to 1000 laser shots (or more if needed for adequate signal to
noise) were collected and averaged for each spectrum. DCT peptides were identified by
manual de novo sequencing of peptides tandem TOF/TOF spectra.
2.4 Results
DCT Purification
Although the soluble protein sample from transfected insect cells displayed DCT
activity, no apparent protein band corresponding to DCT was observed when the crude
supernatant was analyzed by SDS-PAGE. A three-step procedure ending with gel
filtration chromatography gave DCT as the major protein band in the collected fraction
and displayed activity toward dopachrome (Figure 2.1).
DCT eluted from Octyl-Sepharose at approximately 750 mM ammonium sulfate
Although DCT did not bind to the hydroxyapatite column under the applied conditions
(20 mM phosphate buffer, pH 6.8, containing 5% glycerol), approximately 50% of the
excess proteins were retained and thereby eliminated by the hydroxyapatite column. This
allowed for the separation of many problematic proteins that co-elute with DCT from
anion exchange and hydrophic interaction chromatography. The hydroxyapatite flow
through was then passed through a Mono-Q column (GE Health) and DCT activity eluted
at 100-150 mM NaCl. When applied to a Superose 6 gel filtration column, DCT behaved
as a protein with a relative molecular weight of 56,000 Da, suggesting that the protein
was present as a monomer in the applied buffer conditions during chromatography.
30
Glycerol was immediately included after separation by Octyl-Sepharose to increase the
stability of the enzyme. The purified recombinant DCT retained its activity after 6
months of storage in 25% glycerol at -20oC.
MALDI-TOF/TOF Analysis
DCT in-gel digestion and subsequent analysis of its tryptic peptides by tandem
mass spectrometry resulted in the identification of a number of interesting peptide ions
(Table 2.1, Figure 2.2). Due to the presence of many complex and modified peptides,
only ions with clear MS/MS spectra were reported. DCT contains many cysteine
residues, which were all found to contain carboxyamidomethyl (CAM) modification after
iodoacetamide treatment. A CAM alkylated histidine residue was also found upon
MS/MS analysis of peptide ion m/z 1925.91 (AIDFSHQGPAFVTWHR). Trypsin
digestion also generated an unexpected peptide ion, m/z 2721.34, which was verified as
SAANDPVFVVLHSFTDAIFDEWLK.

31
Table 2.1 Identification and PTMs of DCT peptides. All peptides were confirmed by manual analysis of tandem MS spectra. * Peptide ion m/z 1249.86 was not seen in the MALDI-TOF/TOF analysis, but was seen using Q-TOF. This method is described by Li et al. [17].
Observed mass (m/z)
Deduced mass (m/z)
Start End Sequence
1249.86* 1249.63 28 38 VCMTLDGVLNK (C29
-CAM) 2277.00 2276.99 39 58 ECCPPLGPEATNICGFLEGR
(C40
, C41
and C52
- CAM) 1343.59 1343.58 79 88 NQDDREQWPR 1209.49 1209.48 111 120 FGWTGPDCNR 1168.62 1168.58 129 138 NIHSLTAQER 1216.68 1216.67 195 205 DTLLGPGRPYK 1868.91 1868.90 206 221 AIDFSHQGPAFVTWHR 1925.91 1925.83
1925.90 206 221 AIDFSHQGPAFVTWHR (H211
-CAM)
1186.57 1186.57 221 229 RYHLLWLER R229
-99.08 1129.60 1129.59 222 229 YHLLWLER 1722.68 1722.74 252 266 NECDVCTDELLGAAR (C
254 and C
257-CAM)
1868.84 1868.79 252 266 NECDVCTDELLGAAR (N
252-Fuc, C
254 and C
257-CAM
2019.76 2019.76 279 294 FSTWEIVCDSLDDYNR (C286
-CAM) 1496.65 1496.64 296 308 VTLCDGTYEGLLR (C
299-CAM)
N300
deamidated after PNGase F treatment 1824.82 1824.82 334 348 FDSPPFFQDSTFSFR
N342
deamidated after PNGase F treatment 2026.90 2026.91 334 348 FDSPPFFQNSTFSFR (N
342-HexNAc)
2700.06 2700.16 334 348 FDSPPFFQNSTFSFR (N342
-Hex2-HexNAc2-Fuc) 2721.34 2721.33 385 408 SAANDPVFVVLHSFTDAIFDEWLK 2116.89 2116.88 410 428 NNPSTDAWPQELAPIGHNR
32
MGLVGWGLLLGCLGCGILLRARAQFPRVCMTLDGVLNKECCPPLGPEATN 50
ICGFLEGRGQCAEVQTDTRPWSGPYILRNQDDREQWPRKFFNRTCKCTGN 100
FAGYNCGGCKFGWTGPDCNRKKPAILRRNIHSLTAQEREQFLGALDLAKK 150
SIHPDYVITTQHWLGLLGPNGTQPQIANCSVYDFFVWLHYYSVRDTLLGP 200
GRPYKAIDFSHQGPAFVTWHRYHLLWLERELQRLTGNESFALPYWNFATG 250
KNECDVCTDDWLGAARQDDPTLISRNSRFSTWEIVCDSLDDYNRRVTLCN 300
GTYEGLLRRNKVGRNNEKLPTLKNVQDCLSLQKFDSPPFFQNSTFSFRNA 350
LEGFDKADGTLDSQVMNLHNLAHSFLNGTNALPHSAANDPVFVVLHSFTD 400
AIFDEWLKRNNPSTDAWPQELAPIGHNRMYNMVPFFPPVTNEELFLTAEQ 450
LGYNYAVDLSEEEAPVWSTTLSVVIGILGAFVLLLGLLAFLQYRRLRKGY 500
Figure 2.2 Annotated sequence of the truncated DCT recombinant protein expressed in this
study. Identified peptides are highlighted in yellow, potential N-glycosylation sites are highlighted
in red, the putative signal peptide is highlighted in grey, cysteine residues and conserved metal
binding histidine residues are in bold.
33
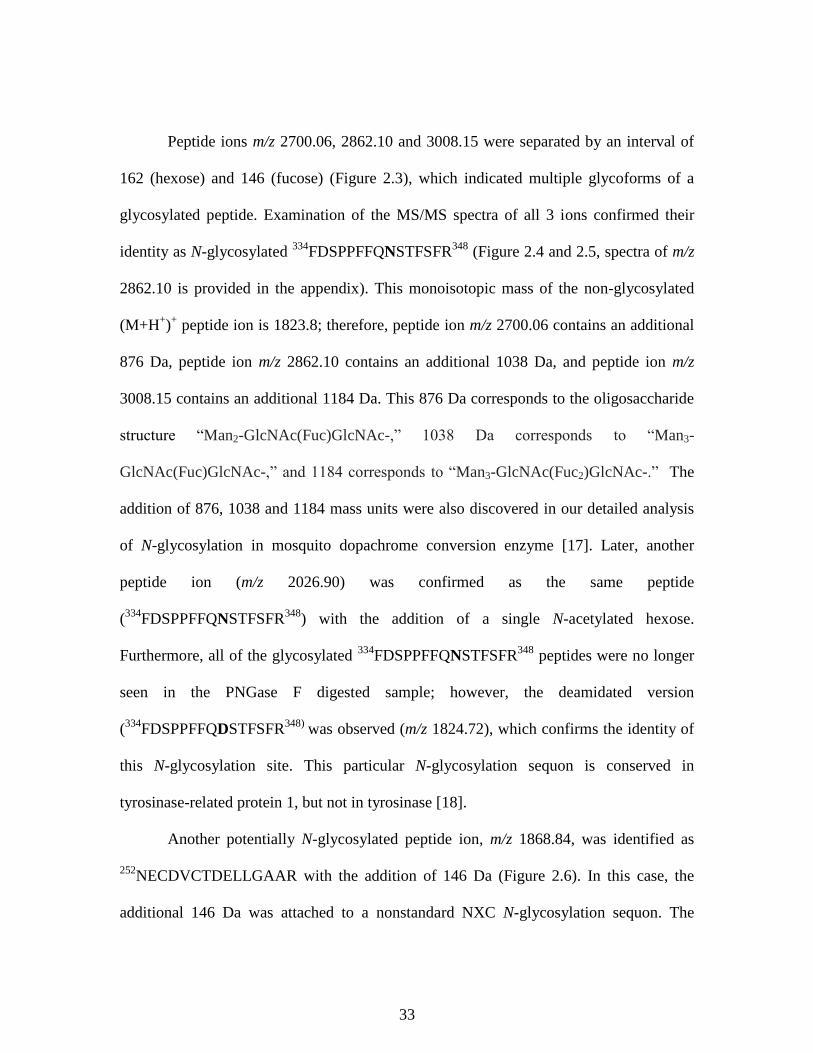
Peptide ions m/z 2700.06, 2862.10 and 3008.15 were separated by an interval of
162 (hexose) and 146 (fucose) (Figure 2.3), which indicated multiple glycoforms of a
glycosylated peptide. Examination of the MS/MS spectra of all 3 ions confirmed their
identity as N-glycosylated 334
FDSPPFFQNSTFSFR348
(Figure 2.4 and 2.5, spectra of m/z
2862.10 is provided in the appendix). This monoisotopic mass of the non-glycosylated
(M+H+)+ peptide ion is 1823.8; therefore, peptide ion m/z 2700.06 contains an additional
876 Da, peptide ion m/z 2862.10 contains an additional 1038 Da, and peptide ion m/z
3008.15 contains an additional 1184 Da. This 876 Da corresponds to the oligosaccharide
structure “Man2-GlcNAc(Fuc)GlcNAc-,” 1038 Da corresponds to “Man3-
GlcNAc(Fuc)GlcNAc-,” and 1184 corresponds to “Man3-GlcNAc(Fuc2)GlcNAc-.” The
addition of 876, 1038 and 1184 mass units were also discovered in our detailed analysis
of N-glycosylation in mosquito dopachrome conversion enzyme [17]. Later, another
peptide ion (m/z 2026.90) was confirmed as the same peptide
(334
FDSPPFFQNSTFSFR348
) with the addition of a single N-acetylated hexose.
Furthermore, all of the glycosylated 334
FDSPPFFQNSTFSFR348
peptides were no longer
seen in the PNGase F digested sample; however, the deamidated version
(334
FDSPPFFQDSTFSFR348)
was observed (m/z 1824.72), which confirms the identity of
this N-glycosylation site. This particular N-glycosylation sequon is conserved in
tyrosinase-related protein 1, but not in tyrosinase [18].
Another potentially N-glycosylated peptide ion, m/z 1868.84, was identified as
252NECDVCTDELLGAAR with the addition of 146 Da (Figure 2.6). In this case, the
additional 146 Da was attached to a nonstandard NXC N-glycosylation sequon. The

34
observation of 146 Da to N252
is suggestive of N-fucosylation. The same peptide without
any modification was also identified as peptide ion m/z 1722.68 (Figure 2.6).
The deamidated potential glycopeptide m/z 1496.65 VTLCDGTYEGLLR was
identified in the PNGase F digested sample (Figure 2.7), however its glycosylated
counterpart was not identified in the native sample. The presence of peptide ion m/z
1496.65 only in the deglycosylated sample is a strong indication that this particular
peptide is N-glycosylated as well. This method to identify glycosylation sites by
searching for deamidated peptides after PNGase F treatment has been documented with
the human protein nephrin [19].
The peptide ion m/z 2116.89 NNPSTDAWPQELAPIGHNR from the PNGase F
treated sample was almost considered a deamidated NDPSTDAWPQELAPIGHNR
because these two sequences would yield the same y1 – y17 ions. However, the NPS
sequon is rarely glycosylated because proline disrupts the peptide backbone, and the
same ion m/z 2117 was also found in the untreated sample. Our results confirm that the
N411
is not glycosylated (Figure 2.8).

35
Figure 2.3 MALDI-TOF peptide map of a DCT tryptic digest. The inset shows a close-up of the
glycosylated peptide ions m/z 2700.26, 2862.17 and 3008.31.

36
Figure 2.4 MALDI-TOF/TOF spectra of N-glycosylated DCT peptide m/z 2700.06
(FDSPPFFQNSTFSFR).

37
Figure 2.5 MALDI-TOF/TOF spectra of N-glycosylated DCT peptide m/z 3008.15
(FDSPPFFQNSTFSFR). Ions indicated with * also appear as dominant ions in Figure 2.3,
however due to complex fragmentation of glycopeptides with MALDI-TOF/TOF remain elusive.

38
39
Figure 2.7 MALDI-TOF/TOF spectra of the PNGase F deglycosylated DCT peptide
296VTLCDGTYEGLLR
308. Note: cysteine is modified with carboxyamidomethyl (CAM).

40
Figure 2.8 MALDI-TOF/TOF spectra of the non-glycosylated DCT peptide
NNPSTDAWPQELAPIGHNR.
41
2.5 Discussion
There has been considerable interest in the structure and function of DCT due to
its involvement in the resistance of melanoma cell lines to radiation and chemotherapy.
Furthermore, DCT is processed through the trans-Golgi network, where it may end up in
the melanosome or as melanoma surface antigen [11]. Although it is well known that the
trafficking of DCT is heavily reliant upon N-glycosylation, no direct investigations into
the exact sites of glycosylation have been previously carried out [14].
The major obstacle in the structural characterization of DCT has proven to be the
ability to attain purified, functional protein. Purification of native DCT from melanoma is
very problematic due to the hydrophobic transmembrane domain and interactions with
melanin. The use of a eukaryotic expression system to express recombinant DCT without
the membrane domain has solved this problem and allowed for the production of soluble,
active and glycosylated DCT.
Although the complexity of N-glycosylation structures varies between
mammalian and insect systems, in most cases the same sites of a particular protein are
glycosylated in both insect and mammalian cells [20-23]. Glycoproteins produced in
insect cell expression systems contain lower complexity glycan structures than
mammalian or yeast systems, which results in a more homogeneous protein [21]. Less
complex and more homogeneous glycan structures, in addition to the increased solubility
of recombinant DCT, will increase the future potential for obtaining quality protein
crystals.
DCT is one of only three mammalian proteins that are currently known to directly
participate in melanin biosynthesis. These three proteins, DCT, tyrosinase and tyrosinase-

42
related protein 1 all share approximately 40% sequence identity. Like DCT, tyrosinase
and tyrosinase-related protein 1 are both glycoproteins that are processed as melanoma
antigens. N-glycosylation has recently been reported to enhance the presentation of a
tyrosinase MHC Class I-restricted epitope [24]. Because of the high level of similarity
between these three proteins, the work described in this manuscript should also offer
insight into the purification and N-glycosylation of tyrosinase and tyrosinase-related
protein 1.
Acknowledgements
The MALDI-TOF/TOF analysis of DCT was carried out by Dr. Keith Ray at the
Virginia Tech Mass Spectrometry Incubator (VT-MSI). This work is supported by
College of Agricultural Life Sciences, Virginia Tech and NIH grant AI 19769.
43
LITERATURE CITED
1. Bernard, K., et al., Functional proteomic analysis of melanoma progression.
Cancer Res, 2003. 63(20): p. 6716-25.
2. Pawelek, J.M. and A.B. Lerner, 5,6-Dihydroxyindole is a melanin precursor
showing potent cytotoxicity. Nature, 1978. 276(5688): p. 626-8.
3. Chu, W., et al., Tyrosinase-related protein 2 as a mediator of melanoma specific
resistance to cis-diamminedichloroplatinum(II): therapeutic implications.
Oncogene, 2000. 19(3): p. 395-402.
4. Pak, B.J., et al., TYRP2-mediated resistance to cis-diamminedichloroplatinum (II)
in human melanoma cells is independent of tyrosinase and TYRP1 expression and
melanin content. Melanoma Res, 2000. 10(5): p. 499-505.
5. Pak, B.J., et al., Radiation resistance of human melanoma analysed by retroviral
insertional mutagenesis reveals a possible role for dopachrome tautomerase.
Oncogene, 2004. 23(1): p. 30-8.
6. Wang, R.F., et al., Identification of TRP-2 as a human tumor antigen recognized
by cytotoxic T lymphocytes. J Exp Med, 1996. 184(6): p. 2207-16.
7. Umansky, V., et al., Melanoma-specific memory T cells are functionally active in
Ret transgenic mice without macroscopic tumors. Cancer Res, 2008. 68(22): p.
9451-8.
8. Lu, X., et al., Adoptive transfer of pTRP2-specific CTLs expanding by bead-based
artificial antigen-presenting cells mediates anti-melanoma response. Cancer Lett,
2008. 271(1): p. 129-39.
9. Chi, A., et al., Proteomic and bioinformatic characterization of the biogenesis
and function of melanosomes. J Proteome Res, 2006. 5(11): p. 3135-44.
10. Tsukamoto, K., et al., A second tyrosinase-related protein, TRP-2, is a
melanogenic enzyme termed DOPAchrome tautomerase. Embo J, 1992. 11(2): p.
519-26.
11. Negroiu, G., R.A. Dwek, and S.M. Petrescu, The inhibition of early N-glycan
processing targets TRP-2 to degradation in B16 melanoma cells. J Biol Chem,
2003. 278(29): p. 27035-42.
44
12. Toyofuku, K., et al., Oculocutaneous albinism types 1 and 3 are ER retention
diseases: mutation of tyrosinase or Tyrp1 can affect the processing of both mutant
and wild-type proteins. Faseb J, 2001. 15(12): p. 2149-61.
13. Wang, N., R. Daniels, and D.N. Hebert, The cotranslational maturation of the
type I membrane glycoprotein tyrosinase: the heat shock protein 70 system hands
off to the lectin-based chaperone system. Mol Biol Cell, 2005. 16(8): p. 3740-52.
14. Gupta, G., et al., Probing into the role of conserved N-glycosylation sites in the
Tyrosinase glycoprotein family. Glycoconj J, 2008.
15. Aroca, P., et al., A new spectrophotometric assay for dopachrome tautomerase. J
Biochem Biophys Methods, 1990. 21(1): p. 35-46.
16. Loo, T., et al., Using secretion to solve a solubility problem: high-yield
expression in Escherichia coli and purification of the bacterial glycoamidase
PNGase F. Protein Expr Purif, 2002. 24(1): p. 90-8.
17. Li, J.S., et al., Proteomic analysis of N-glycosylation in mosquito dopachrome
conversion enzyme. Proteomics, 2007. 7(15): p. 2557-2569.
18. Branza-Nichita, N., et al., N-glycosylation processing and glycoprotein folding-
lessons from the tyrosinase-related proteins. Chem Rev, 2000. 100(12): p. 4697-
712.
19. Khoshnoodi, J., et al., Identification of N-linked glycosylation sites in human
nephrin using mass spectrometry. J Mass Spectrom, 2007. 42(3): p. 370-9.
20. James, D.C., et al., N-glycosylation of recombinant human interferon-gamma
produced in different animal expression systems. Biotechnology (N Y), 1995.
13(6): p. 592-6.
21. Altmann, F., et al., Insect cells as hosts for the expression of recombinant
glycoproteins. Glycoconj J, 1999. 16(2): p. 109-23.
22. Yeh, J.C., et al., Site-specific N-glycosylation and oligosaccharide structures of
recombinant HIV-1 gp120 derived from a baculovirus expression system.
Biochemistry, 1993. 32(41): p. 11087-99.
23. Lopez, M., et al., Microheterogeneity of the oligosaccharides carried by the
recombinant bovine lactoferrin expressed in Mamestra brassicae cells.
Glycobiology, 1997. 7(5): p. 635-51.
24. Ostankovitch, M., et al., N-glycosylation enhances presentation of a MHC class I-
restricted epitope from tyrosinase. J Immunol, 2009. 182(8): p. 4830-5.

45
III
DOPACHROME CONVERSION ENZYME
46
3.1 Abstract
A novel dopachrome conversion enzyme (DCE) is present in insects and involved
in their melanization pathway. DCE shares no sequence homology with any noninsect
species from bacteria to humans. Several DCE sequences have been available, but
enzyme structure and catalytic mechanism are unclear. This study concerns DCE PTMs,
especially glycosylation. A mosquito DCE was purified and its monosaccharide
composition, N-glycosylation site, and oligosaccharide structures were determined.
Results showed that N-acetyl D-glucosamine and D-mannose are the major
monosaccharides and L-fucose, D-xylose, and D-arabinose are the minor ones in mosquito
DCE. Glycosylation site and oligosaccharide structures were elucidated from MS and
MS/MS spectra of trypsin-digested DCE glycopeptides. A single N-glycosylation site
(Asn285
-Glu-Thr) was identified in DCE and was proven to be fully glycosylated.
Man3GlcNAc2, Man3(Fuc)1–2GlcNAc2, and their truncated structures were the dominant
oligosaccharides. In addition, high hexose (likely mannose) type structures (Hex4–
7(Fuc)GlcNAc2) were also identified. Removal of DCE N-oligosaccharides with PNGase
F decreased its activity and thermal stability. However, partial DCE deglycosylation with
α-mannosidase or α-fucosidase somewhat stimulated its activity and improved its thermal
stability. During mass spectrometric analysis of DCE glycopeptides, their CID patterns
were highly intriguing, in that some glycopeptides underwent both C-terminal
rearrangement and formation of dimeric structures during CID. Results of this study
provide an interesting example in terms of potential complexity of the glycopeptide CID
fragmentation pattern.

47
3.2 Introduction
An enzyme from Aedes aegypti was recently determined to catalyze a
decarboxylative structural rearrangement of dopachrome to 5,6-dihydroxyindole in the
melanization pathway [1]. Based on its function, this protein was termed dopachrome
conversion enzyme (DCE). Sequence comparison determined that mosquito DCE belongs
to a mosquito yellow gene family. The yellow gene family is insect-specific; members of
the yellow gene family in different insect species have sequence homology, but they
share no similarity with proteins from any non-insect species. Among the yellow genes,
Drosophila yellow-y gene has attracted considerable attention, because loss of the
yellow-y function due to mutation prevents normal pigmentation in Drosophila cuticle
[2]. Recently, there were also extensive studies concerning the molecular regulation of
the yellow gene [3–5]. Although a number of potential functions have been suggested for
the Drosophila yellow-y gene in flybase (http://flybase.org/reports/FBgn0004034.html),
the exact chemical mechanism by which the yellow-y protein promotes normal
Drosophila pigmentation is unclear. To achieve a comprehensive understanding of the
structure/function relationship of DCE and yellow-y as well as other members of the
insect yellow gene family, it is necessary to study them at the protein level.
Our current study demonstrates that DCE is a glycoprotein. In this study, we
purified DCE from two mosquito species and determined their N-glycosylation site and
oligosaccharide structures by direct analysis of glycopeptides using LC-ESI MS/MS.
Comparison of DCE sequences with the deduced sequences of other yellow genes from
several insect species indicated that a similar N-glycosylation site is present in a number
of yellow family proteins, suggesting that there might be similar glycosylation pathway

48
for most of the yellow family proteins in insects. Results of this study provide a basis for
understanding the structure/function relationship of the insect yellow family proteins.
3.2 Materials and methods
Materials
Monosaccharide standards, TFA (protein sequencing grade), 2-aminobenzoic
acid, sodium cyanoborohydride, o-phenylenediamine, peptide N-glycosidase (PNGase F),
Jack Bean α-mannosidase, and bovine kidney α-fucosidase were purchased from Sigma
(St. Louis, MO, USA). Modified trypsin was from Promega (Madison, WI, USA). PVDF
membrane was from Amersham Biosciences (Piscataway, NJ, USA). Centrifugal filters
(30,000 MWcut-off) and ZipTip C18 were from Millipore (Bedford, MA, USA). Dialysis
membrane tubing (12,000 MW cut-off) was from Spectrum Laboratory (Ft. Lauderdale,
FL, USA). Fresh Mini-Q water was used to prepare all buffers. Other laboratory
chemicals were purchased from Sigma or Fisher (Fairlawn, NJ, USA).
DCE Purification
All operations were performed at 0–4oC. Fifty grams (wet weight) of 6-day-old A.
aegypti larvae were homogenized in 100 mM sodium phosphate buffer (pH 6.5)
containing 1 mM PMSF, 1 mM phenylthiocarbamide, 1 mM DTT, and 2 mM EDTA.
Homogenates were centrifuged at 25,000 x g for 20 min. Supernatant was collected and
brought up to 60% ammonium sulfate saturation. The precipitates were then separated
from supernatant by centrifugation (10,000 x g, 20 min) and resuspended into a minimal
49
volume of 0.5 M ammonium sulfate in 50 mM phosphate buffer (pH 6.5). After
centrifugation at 10,000 x g for 20 min, the solution was applied to a phenyl Sepharose
column (50 mL, Amersham Biosciences), and eluted using a linear gradient of
ammonium sulfate (1.0–0 M) in 10 mM phosphate buffer (pH 6.5). The fractions with
DCE activity were collected into dialysis tubes and dialyzed against 10 mM phosphate
buffer (pH 6.5). The dialyzed active fraction was applied to a DEAE Sepharose column
(20 mL, Amersham Biosciences), and proteins were eluted using a linear NaCl gradient
(0–500 mM) prepared in 10 mM phosphate buffer (pH 6.5). DCE fractions were
concentrated using membrane filters and further purified sequentially using the following
columns, including phenyl-Superose (5 mL), Mono-Q (5 mL, Amersham Biosciences),
CHT5-I (hydroxyapatite) (5 mL, BioRad, Hercules, CA, USA), and Superose (30 mL,
Amersham Biosciences). Finally, the purity of the DCE fraction was examined by 12%
SDS-PAGE. Protein concentration was determined at 280 nm using a U2800A
spectrophotometer (Hitachi, Tokyo, Japan). To compare DCE N-glycosylation from
different mosquito species, a DCE from Armigeres subalbatus larvae was also purified as
those described for the purification of the A. aegypti DCE.
DCE Activity Assay
DCE activity was measured by determining the decrease in dopachrome
absorbance at 475 nm (ε = 3245 M-1
/cm) using a U2800A spectrophotometer (Hitachi).
Dopachrome was generated by mixing 0.5 mM L-DOPA in water with an equal volume
of 1.0 mM sodium periodate (NaIO4) in 20 mM phosphate buffer (pH 7.0) (the initial
absorbance is 0.98–1.00 at room temperature.)
50
Con A Affinity Chromatography
An aliquot of purified DCE was loaded onto a Con A-Sepharose 4B column (0.5
mL) equilibrated with binding buffer containing 20 mM Tris and 0.5 M NaCl (pH 7.4).
After washing with binding buffer, DCE was eluted by a linear α-D-methylmannoside
gradient (0.05–0.5 M) prepared in the same buffer solution.
Monosaccharide Analysis
Monosaccharide determination was based on methods described by Weitzhandler
et al. [6] and Anumula [7–9]. SDS-PAGE was performed with 12% polyacrylamide gel
and 0.1% SDS [10]. After electrophoresis, protein bands were transferred directly to
PVDF membranes using a Hoefer TE22 Mini Transfer Unit (Amersham Biosciences) at
400 mA for 6 h. The protein bands were cut, and put into 1.6 mL polypropylene vials
with O-ring seal screw caps (Fisher).
For neutral and amino monosaccharide analysis, DCE on a PVDF membrane was
hydrolyzed in 20% TFA at 100oC for 6 h. The released monosaccharides were derivatized
with 2-aminobenzoic acid and sodium cyanoborohydride [6, 7]. Determination of the
derivatized monosaccharides was achieved through the use of a LaChrom D7000 HPLC
system with fluorescence detection (Hitachi). HPLC conditions were as follows: C18
column, 5 μm particle, 4.6 x 150 mm2; fluorescence detection at Ex360 nm and Em425
nm; mobile phase A, 0.2% v/v 1-butylamine, 0.5% v/v phosphoric acid, and 1.0% v/v
THF in water; mobile phase B, 50% ACN in mobile phase A; gradient profile, 5% B
from 0 to 10 min, 5–12% B from 11 to 35 min, and 12–100% B from 36 to 40 min, 1
51
mL/min of flow rate; loading volume, 50 uL.
For sialic acid analysis, the DCE on PVDF was first hydrolyzed with 0.25 M
sodium bisulfate at 80oC for 20 min, and then derivatized with o-phenylenediamine at
80oC for 40 min [8]. HPLC conditions were as follows: C18 column, 5 mm particle, 4.6 x
150 mm; fluorescence detection at Ex 230 nm/Em 425 nm; gradient profile, 10% B from
0 to 20 min and 10–100% B from 21 to 25 min, 1 mL/min of flow rate; loading volume,
50 uL. The monosaccharide standards and blank were subjected to the same hydrolysis
and derivatization processes, and analyzed by HPLC under identical conditions.
In-gel Digestion
DCE was electrophorezed by SDS-PAGE, stained with CBB and destained with 40%
methanol containing 7% acetic acid. The DCE band was cut from the gel and transferred
to a 0.6 mL siliconized microcentrifuge tube (Fisher). After DTT reduction and
iodoacetamide alkylation, DCE was digested with 0.01 mg/mL trypsin in 50 mM Tris-
HCl (pH 8.0) at 37oC for 16–18 h. The peptide products were extracted from the gel
using 50% ACN in 0.5% TFA combined with sonication. After evaporation in a Speed
Vac, peptides were redissolved in 0.1% formic acid and cleaned-up with ZipTip C18 for
subsequent LC-ESI MS/MS analysis.
Capillary LC-ESI MS/MS
The capillary LC-ESI MS/MS system consisted of a CapLC XE fitted with a
NanoEase 75 mm C18 column, an OPTI-PAK C18 Trap column, and a Q-TOF micro™
mass spectrometer with a nanospray source (Waters Micromass, Manchester, UK).
52
Peptide separation was achieved by gradient elution with mobile phase A (5% ACN in
0.1% formic acid) and mobile phase B (90% ACN in 0.1% formic acid). The following
gradient profile was applied: 5% B from 0 to 5 min, 5–40% B from 6 to 40 min, and 40–
90% B from 40 to 65 min. The ESI/Q-TOF was operated in positive ion mode with a
capillary voltage of 3719 V. For MS analysis, precursor ions were scanned from 400 to
1900 Da with a collision voltage of 10 V. The potential glycopeptides were screened by a
precursor ion scan using m/z 163 and 204 as marker ions. During MS/MS analysis,
fragmentation was performed with a collision voltage of 35 V and a scan of 50–1900 Da.
Only precursor ions having a charge state of +2, +3, or +4 were extracted into the
collision cell for dissociation.
Protein Sequencing, Identification and Glycosylation Analysis
The raw MS and MS/MS data were analyzed by Masslynx 4.0 (Waters
Micromass). Protein was identified by Proteinlynx 2.1 (Waters Micromass), with peptide
tolerance set at 0.5 Da and fragment tolerance at 0.2 Da. The glycosylation site and
structures were elucidated through MS/MS fragmentation. The Aedes aegypti NCBI
database was used to search for identified peptides.
DCE Deglycosylation and Effect on DCE Activity and Stability
A. aegypti DCE (10 mg) was incubated with individual glycosidases at 37oC for
12 h: 100 U/mL PNGase F in 50 mM sodium phosphate buffer (pH 7.5) containing 0.5%
Triton X-100; 50 U/mL α-mannosidase in 50 mM sodium acetate buffer (pH 5.5)
containing 0.5% Triton X-100; 1 U/mL α-fucosidase in 50 mM sodium acetate buffer
53
(pH 5.5) containing 0.5% Triton X-100. Controls were incubated at identical conditions
as the corresponding deglycosylation reactions in the absence of glycosidase. Kinetic
parameters and thermal stability (at 45oC) of the control and deglycosylated DCE
samples were analyzed. Km and Vmax were determined by the Lineweaver–Burke plot
(Sigma Plot). Aliquots of individual samples were also subjected to SDS-PAGE, in-gel
digested with trypsin at 37oC overnight, and then analyzed by LC-ESI MS/MS.
3.3 Results and Discussion
DCE Purification
After separation of DCE from extracted mosquito larval proteins by various
chromatographic procedures, a DCE active fraction displayed as a single peak during gel
filtration chromatography (Figure 3.1) and a single band during SDS-PAGE analysis
(Figure 3.1, inset). The purified DCE showed extremely high activity to dopachrome and
was highly stable in neutral buffer. During gel filtration chromatography, DCE behaved
like a protein with a relative molecular weight of 55,600, suggesting that it is present as a
monomer at the applied chromatographic conditions.
Purified DCE was retained by Con A column, and can be eluted with high
concentrations of α-D-methylmannoside (Figure 3.2). This result suggest that DCE is a
glycoprotein and its associated oligosaccharides contain high-mannose or paucimannose
structures.
54
Identification and Modifications of DCE
The results of de novo sequencing of MS/MS data from the A. aegypti DCE active
fraction matched A. aegypti DCE (accession no. AAG01014) in the NCBI nonredundant
database, with 20 matched peptides (Table 3.1). Similarly, the spectral data of the
purified A. subalbatus protein matched A. subalbatus DCE (accession no. AY960762)
with 21 matched peptides. The sequences of matching peptides and possible post-
translation modifications are listed in Table 3.1. In addition to glycosylation, there were
several amino acid substitutions within C-terminal of DCE. Furthermore, propionamide
modification of cysteine was observed from several peptide ions; this can be explained by
exposure of the protein to acrylamide during SDS-PAGE, prior to in-gel digestion.

55
Figure 3.1 Chromatogram and SDS-PAGE of purified DCE from A. Aegypti larvae homogenate.
Figure 3.2 Elution profile (activity and protein) of purified A. aegypti DCE from a Con A affinity
column (0.5 mL). The elution buffer was 20 mM Tris-HCl (pH 7.4) containing 0.5 M NaCl and 0–
0.5 M α-D-methylmannoside (α-MM).
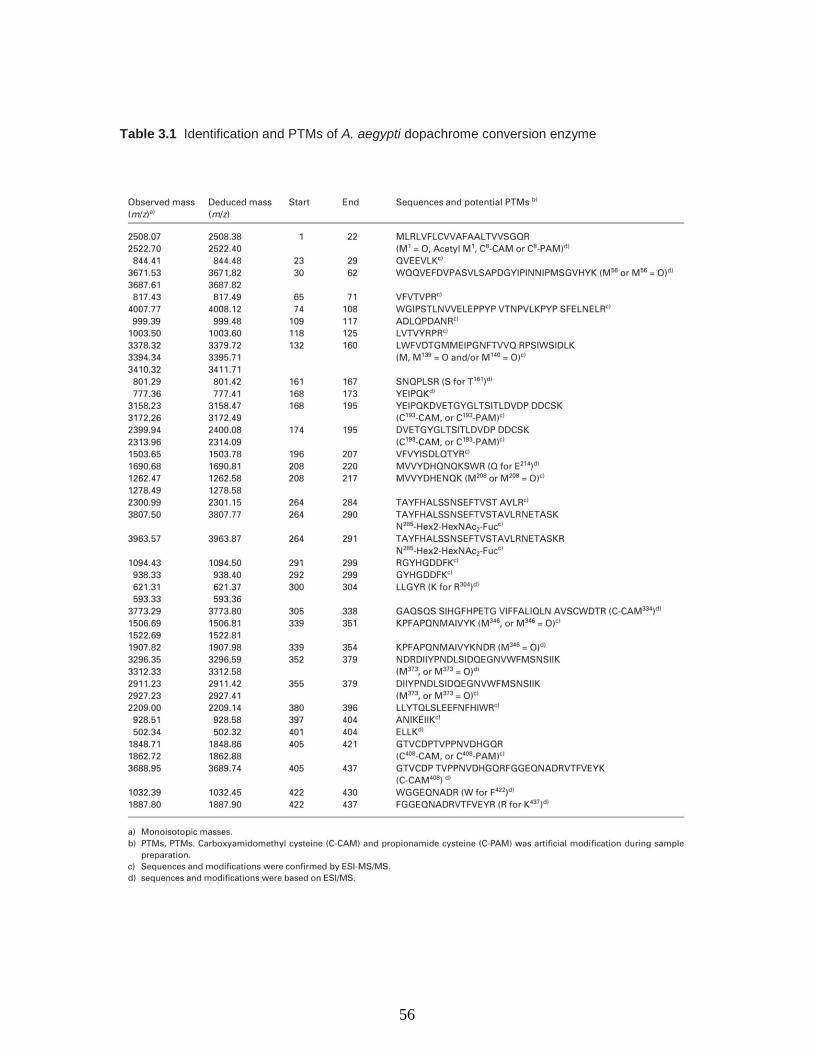
56
Table 3.1 Identification and PTMs of A. aegypti dopachrome conversion enzyme
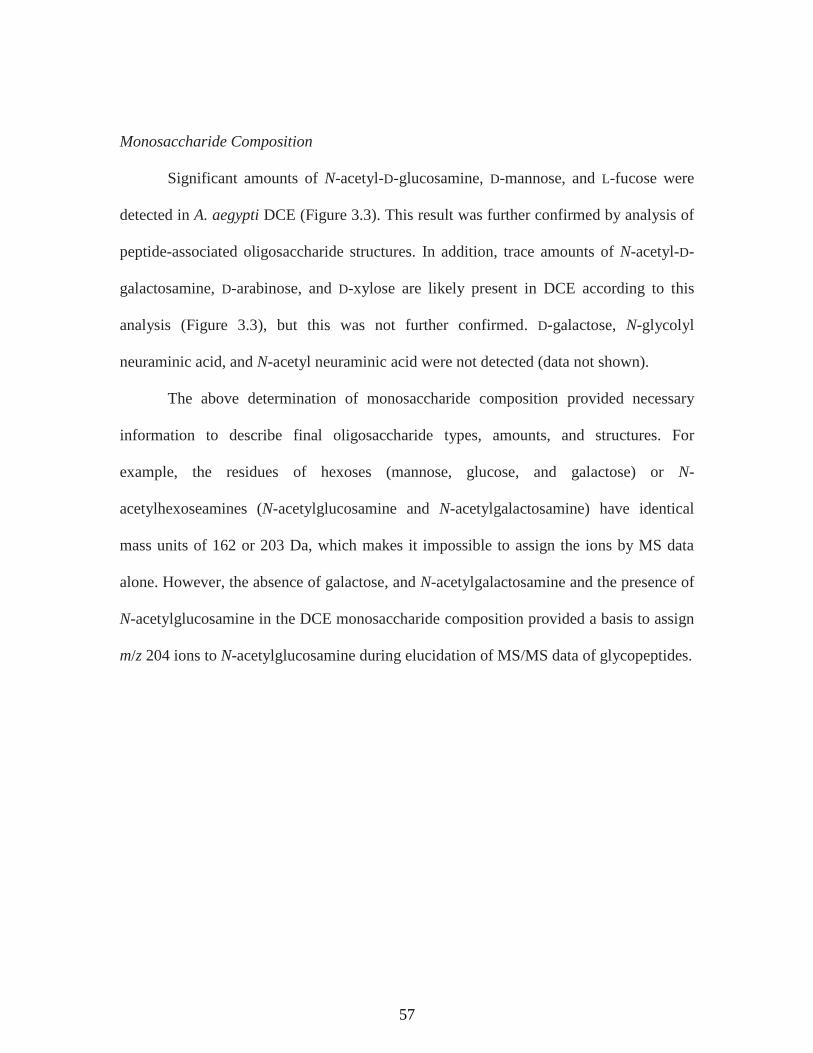
57
Monosaccharide Composition
Significant amounts of N-acetyl-D-glucosamine, D-mannose, and L-fucose were
detected in A. aegypti DCE (Figure 3.3). This result was further confirmed by analysis of
peptide-associated oligosaccharide structures. In addition, trace amounts of N-acetyl-D-
galactosamine, D-arabinose, and D-xylose are likely present in DCE according to this
analysis (Figure 3.3), but this was not further confirmed. D-galactose, N-glycolyl
neuraminic acid, and N-acetyl neuraminic acid were not detected (data not shown).
The above determination of monosaccharide composition provided necessary
information to describe final oligosaccharide types, amounts, and structures. For
example, the residues of hexoses (mannose, glucose, and galactose) or N-
acetylhexoseamines (N-acetylglucosamine and N-acetylgalactosamine) have identical
mass units of 162 or 203 Da, which makes it impossible to assign the ions by MS data
alone. However, the absence of galactose, and N-acetylgalactosamine and the presence of
N-acetylglucosamine in the DCE monosaccharide composition provided a basis to assign
m/z 204 ions to N-acetylglucosamine during elucidation of MS/MS data of glycopeptides.
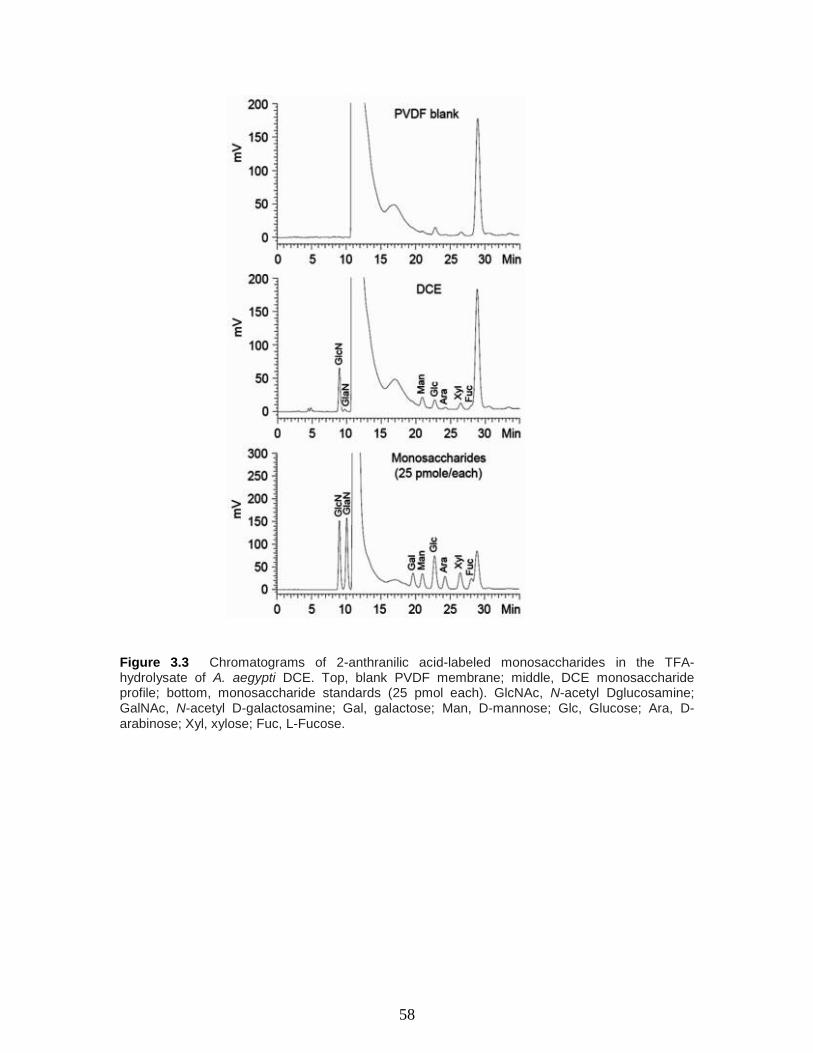
58
Figure 3.3 Chromatograms of 2-anthranilic acid-labeled monosaccharides in the TFA-hydrolysate of A. aegypti DCE. Top, blank PVDF membrane; middle, DCE monosaccharide profile; bottom, monosaccharide standards (25 pmol each). GlcNAc, N-acetyl Dglucosamine; GalNAc, N-acetyl D-galactosamine; Gal, galactose; Man, D-mannose; Glc, Glucose; Ara, D-arabinose; Xyl, xylose; Fuc, L-Fucose.

59
Glycosylation Site
Analysis of the deduced A. aegypti DCE sequence by an N-glycosylation
prediction program (http://www.cbs.dtu.dk/services/NetNGlyc) indicated that the enzyme
has two potential glycosylation sites (Asn145
-Phe-Thr and Asn285
-Glu-Thr) with possible
tryptic peptides of 132
LWFVDTGMMEIPGNFTVVQRPSIWSIDLK160
, 285
NETASKR291
,
or 285
NETASK290
.
Based on the presence of m/z 163 and 204 in the tandem mass spectra of
individual precursor ions, a number of potential glycopeptides were detected (see Figure
3.8). Among these tryptic glycopeptides (3000–4500 Da), m/z 3963 displayed an MS/MS
spectrum with good quality and rich fragmentation data. Therefore, a detailed structural
elucidation of m/z 3963 is illustrated (Figures 3.4 and 3.5). The MS/MS fragmentation
pattern of m/z 3963 was particularly intriguing (Figure 3.4). The presence of strong
diagnostic marker ions in the spectrum, such as m/z 163 [Hex], 204 [GlcNAc], and 366
[HexHexNAc], confirmed the peptide from the precursor ion scan as a glycopeptide
(Figure 3.4B). Further de novo sequencing suggested that it was the tryptic peptide,
264TAYFHALSSNSEFTVSTAVLRNETASKR
291, with two missed trypsin cleavage sites
(Arg284
-Asn285
and Lys290
-Arg291
), and a sugar moiety (876 Da) attached to its Asn285
-
Glu-Thr motif (Figure 3.4A). Evidently, the conjugated oligosaccharide on Asn285
hindered the hydrolysis of the C-terminal side of Arg284
-Asn285
.
It was interesting that the glycosylated peptide ion, m/z 3963 [M + H]+ underwent
apparent C-terminal rearrangement during CID, resulting in the loss of the C-terminal
arginine residue (156 Da) and formation of a rearrangement ion of m/z 3807 [b27 + H2O]
(Figure 3.4E). Peptide ion m/z 3963 has a lysine residue (a basic residue) at the n - 1

60
position of C-terminal (Lys290
-Arg291
), which enhances this intramolecular rearrangement
[11, 12]. Hence, the CID spectrum of m/z 3963 contained fragments from both m/z 3963
and 3807, which helped explain the complexity of its MS/MS spectrum, e.g. the abundant
fragment of m/z 3807 and added sugar signals (also see Figure 3.5).
The unmodified peptide ions, m/z 3087
(264
TAYFHALSSNSEFTVSTAVLRNETASKR291
), m/z 2931
(264
TAYFHALSSNSEFTVSTAVLRNETASK290
), m/z 649 (285
NETASK290
), and m/z 805
(285
NETASKR291
), were not observed in the ESI/MS spectrum. Therefore, the Asn285
-
Glu-Thr site in most of the DCE molecules is occupied. The binding of purified DCE to
the Con A column (data not shown) and the monosaccharide composition (Table 3.2) also
support this conclusion.
There is another potential N-glycosylation motif (Asn145
-Phe-Thr) in DCE.
Several methods were used to determine the possible glycosylation at Asn145
, including
direct detection of glycopeptides, comparison of peptide maps of control and
deglycosylated DCE, and enrichment of glycopeptides followed by LC-MS/MS (data not
shown). Unglycosylated (Asn145
-Phe-Thr) tryptic peptides, m/z 3378
(132
LWFVDTGMMEIPGNFTVVQRPSIWSIDLK160
), m/z 3394 (oxidized Met139
or
Met1140
), and m/z 3410 (oxidized Met139
and oxidized Met140
), were clearly observed
(Table 3.1). However, no trace evidence for possible N-glycosylation at Asn145
was
obtained. Based on these data, it seems clear that Asn145
is not N-glycosylated in DCE.

61
Table 3.2 Monosaccharide composition of DCE from A. aegypti
Monosaccharide Content
(ng/13.8 ug DCE)a)
Percentage in total
carbohydrates
(%w/w)b)
Residues per molecule
of DCEc)
N-acetyl D-glucosamine 119.8 +/- 5.35 39.5 1.92
D-Mannose 98.0 +/- 9.03 32.3 1.93
L-Fucose 40.5 +/- 9.35 13.4 0.88
a) Mean +/- SD, n = 3. b) The samples contain small amounts of others sugars that are not further confirmed (see Figure 3.3) c) Calculation based on 49,000 Da of the molecular weight by SDS-PAGE.

62
Figure 3.4 ESI-MS/MS spectrum and structure of the +4 glycopeptide ion m/z 992.16 (monoisotopic m/z 3963) from A. aegypti DCE. (A) De novo sequencing; (B)–(E) ESI-MS/MS spectrum and elucidation. m/z 3807 is a proposed fragment derivatized from m/z 3963 through C-terminal rearrangement (E). The inset in Fig. 3B shows the entire spectrum of m/z 3963.

63
Figure 3.4 (continued) ESI-MS/MS spectrum the +4 glycopeptide ion m/z 992.16 (monoisotopic m/z 3963) from A. aegypti DCE. (B)–(E) ESI-MS/MS spectrum and elucidation. m/z 3807 is a proposed fragment derivatized from m/z 3963 through C-terminal rearrangement (E). The inset in Fig. 3B shows the entire spectrum of m/z 3963.

64
Oligosaccharide Structures
The sugar moiety structure of m/z 3963 is illustrated in Figure 3.5. The presence
of m/z 163, 204, and 147, in conjunction with results of monosaccharide analysis (Figure
3.3), suggests that this oligosaccharide contains hexose (likely mannose), N-
acetylglucosamine, and fucose. Examination of the MS/MS spectra of m/z 3963 (Figure
3.5) indicates no addition of 146 Da on the y1 ion, which could result from lysine. The
strong fragments of m/z 3134, 3280, 3290, and 3817, along with m/z 350 [FucGlcNAc]
and m/z 366 [HexGlcNAc], indicate that the Asn285
-linked GlcNAc residue bears a
branched fucose residue. Therefore the presence of m/z 147 is extremely suggestive of
fucosylation. Because the N-oligosaccharide was cleaved by PNGase F, the fucose
residue likely joined to the GlcNAc residue through α-1,6-linkage [13]. Figure 3.4
illustrates the assigned structures of these fragments. The y- and b-ion series were
dominant fragments in this CID spectrum and signals seemed to be derived from both
precursor m/z 3963 [M + H]+ and its proposed C-rearrangement ion m/z 3807 [b27 + H2O]
(Figure 3.4B and Figure 3.5C). Based on the above spectral analysis, the associated
oligosaccharide was identified as “Hex2-GlcNAc(Fuc)GlcNAc-” (Figures 3.5A and B).
In addition, there were also abundant ion peaks that seemed to be derived from
dimers [2M + 3H]3+
or [2M + 6H]6+
(Figures 3.5D and E). These multiple charged
complexes had similar fragmentation pattern as their monomers. For example, in Figure
3.5C, m/z 3645 [(F-162) + H+] (F refers fragment) was derived from m/z 3807 [F + H
+]
by the loss of a hexose unit (162 Da). Similarly, in Figure 3.5D, m/z 2431 [2(F-162) +
3H+] was derived from m/z 2539 [2F + 3H] by the loss of two hexose units. In Figure
3.5E, m/z 1215 [2(F-162) + 6H] was derived from m/z 1269 [2F + 6H] by the loss of two
65
hexose units. The presence of [2M + 3H]3+
or [2M + 6H]6+
complexes further
complicated this particular MS/MS spectrum. We do not have a specific mechanism to
explain why this peptide formed dimeric complexes, but their presence could be clearly
derived from the precursor ions. The glycopeptide has large size (3963 Da) and a number
of charged residues (Glu275
, Arg284
, Glu286
, Lys290
, Arg291
). It is possible that the peptide
molecules maintain strong noncovalent interactions in vacuum or gas phase, such as
hydrogen bonds and ionic bonds [14].
Another precursor of m/z 3807 [M + H]+ was produced by trypsin digestion.
Analysis of its CID spectrum revealed the sequence
264TAYFHALSSNSEFTVSTAVLRNETASK
290, with an oligosaccharide of
Hex2(Fuc)HexNAc2 (876 Da) (data not shown). m/z 3807 has the same sequence as m/z
3963 except that it has one missing cleavage site (-Ser289
-Lys290
at C-terminal region). Its
fragmentation pathway and complexes were similar to m/z 3963, but there was no C-
terminal rearrangement.
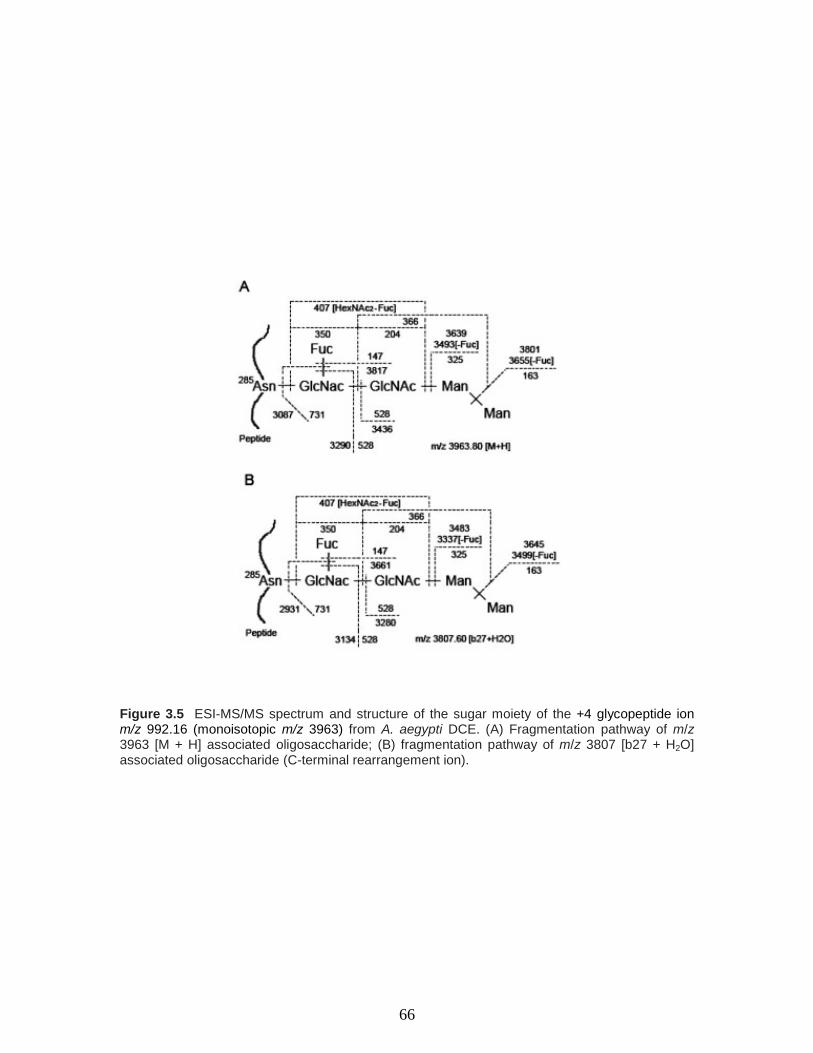
66
Figure 3.5 ESI-MS/MS spectrum and structure of the sugar moiety of the +4 glycopeptide ion m/z 992.16 (monoisotopic m/z 3963) from A. aegypti DCE. (A) Fragmentation pathway of m/z 3963 [M + H] associated oligosaccharide; (B) fragmentation pathway of m/z 3807 [b27 + H2O] associated oligosaccharide (C-terminal rearrangement ion).
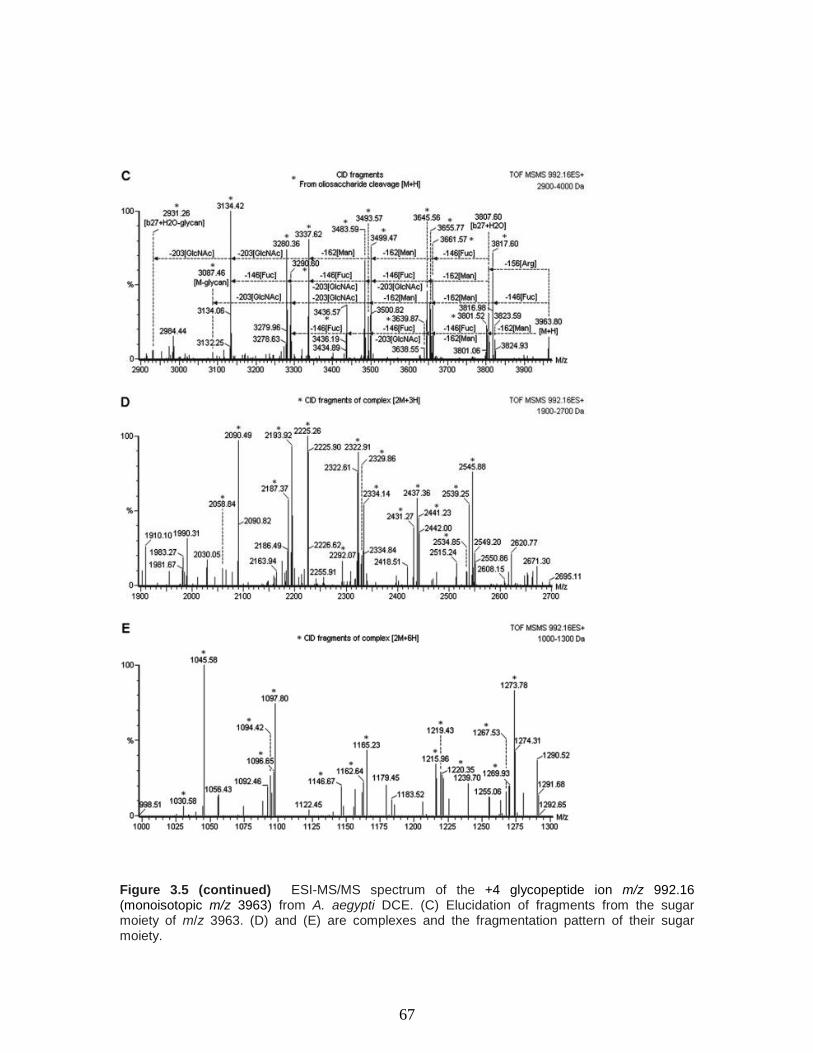
67
Figure 3.5 (continued) ESI-MS/MS spectrum of the +4 glycopeptide ion m/z 992.16 (monoisotopic m/z 3963) from A. aegypti DCE. (C) Elucidation of fragments from the sugar moiety of m/z 3963. (D) and (E) are complexes and the fragmentation pattern of their sugar moiety.
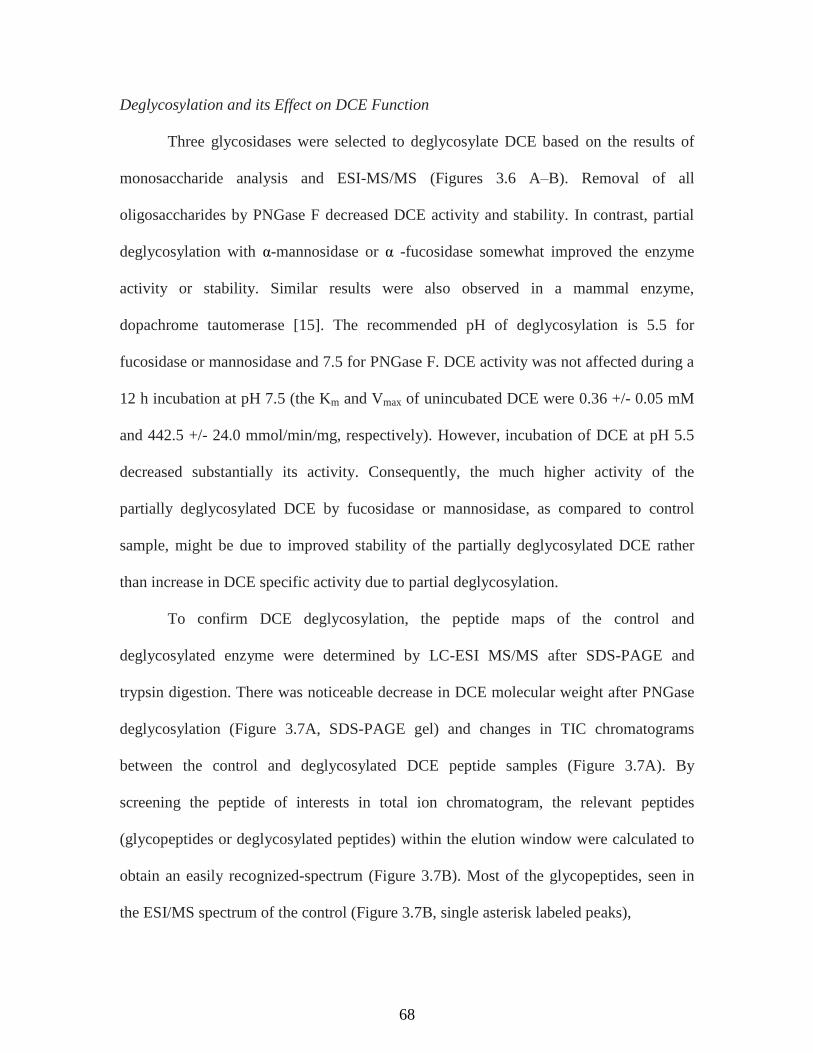
68
Deglycosylation and its Effect on DCE Function
Three glycosidases were selected to deglycosylate DCE based on the results of
monosaccharide analysis and ESI-MS/MS (Figures 3.6 A–B). Removal of all
oligosaccharides by PNGase F decreased DCE activity and stability. In contrast, partial
deglycosylation with α-mannosidase or α -fucosidase somewhat improved the enzyme
activity or stability. Similar results were also observed in a mammal enzyme,
dopachrome tautomerase [15]. The recommended pH of deglycosylation is 5.5 for
fucosidase or mannosidase and 7.5 for PNGase F. DCE activity was not affected during a
12 h incubation at pH 7.5 (the Km and Vmax of unincubated DCE were 0.36 +/- 0.05 mM
and 442.5 +/- 24.0 mmol/min/mg, respectively). However, incubation of DCE at pH 5.5
decreased substantially its activity. Consequently, the much higher activity of the
partially deglycosylated DCE by fucosidase or mannosidase, as compared to control
sample, might be due to improved stability of the partially deglycosylated DCE rather
than increase in DCE specific activity due to partial deglycosylation.
To confirm DCE deglycosylation, the peptide maps of the control and
deglycosylated enzyme were determined by LC-ESI MS/MS after SDS-PAGE and
trypsin digestion. There was noticeable decrease in DCE molecular weight after PNGase
deglycosylation (Figure 3.7A, SDS-PAGE gel) and changes in TIC chromatograms
between the control and deglycosylated DCE peptide samples (Figure 3.7A). By
screening the peptide of interests in total ion chromatogram, the relevant peptides
(glycopeptides or deglycosylated peptides) within the elution window were calculated to
obtain an easily recognized-spectrum (Figure 3.7B). Most of the glycopeptides, seen in
the ESI/MS spectrum of the control (Figure 3.7B, single asterisk labeled peaks),
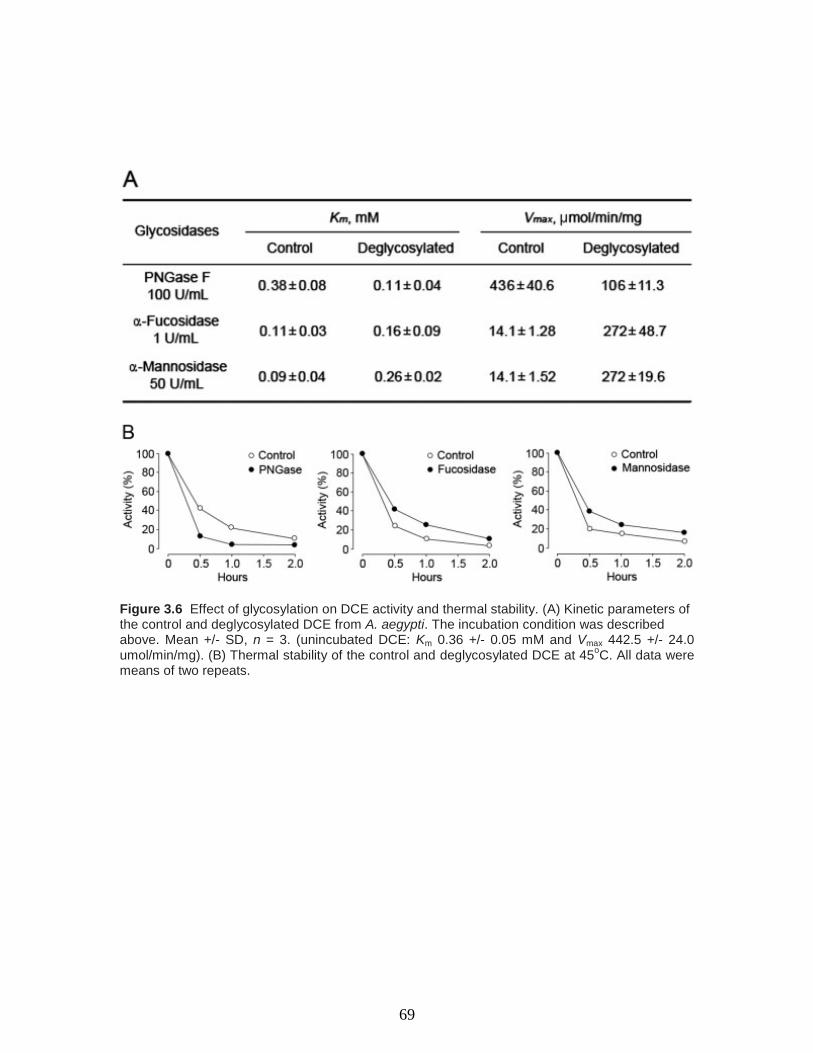
69
Figure 3.6 Effect of glycosylation on DCE activity and thermal stability. (A) Kinetic parameters of the control and deglycosylated DCE from A. aegypti. The incubation condition was described above. Mean +/- SD, n = 3. (unincubated DCE: Km 0.36 +/- 0.05 mM and Vmax 442.5 +/- 24.0 umol/min/mg). (B) Thermal stability of the control and deglycosylated DCE at 45
oC. All data were
means of two repeats.
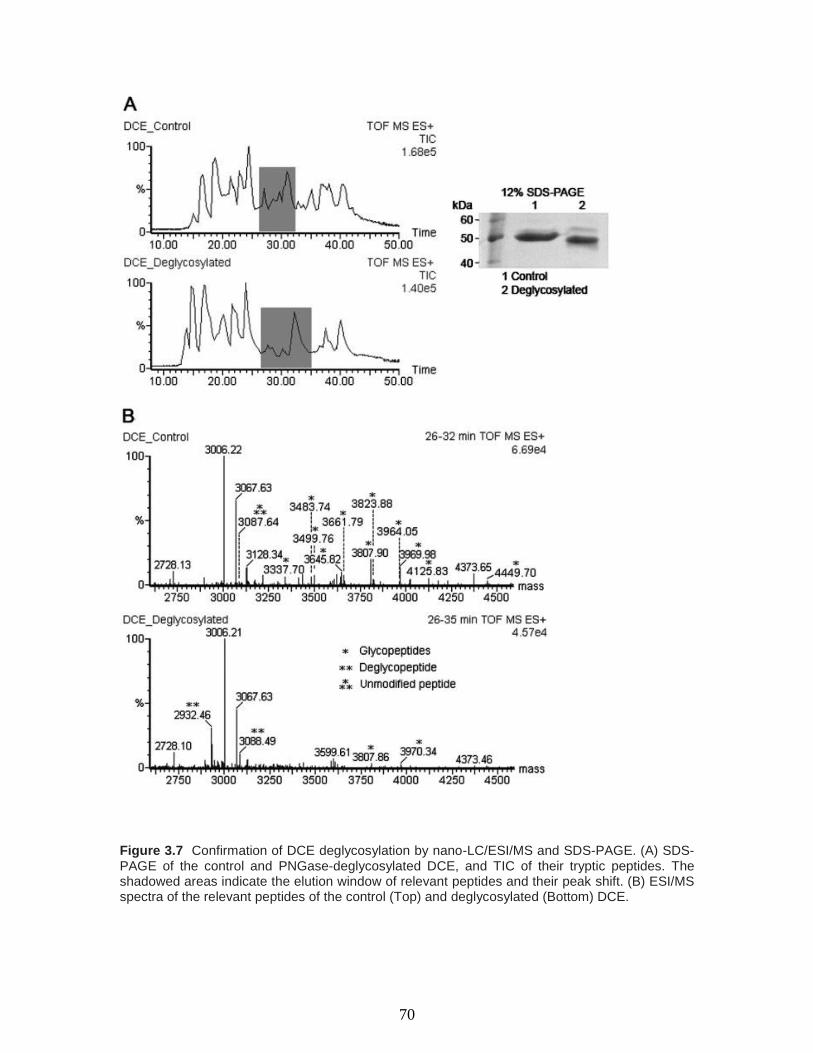
70
Figure 3.7 Confirmation of DCE deglycosylation by nano-LC/ESI/MS and SDS-PAGE. (A) SDS-PAGE of the control and PNGase-deglycosylated DCE, and TIC of their tryptic peptides. The shadowed areas indicate the elution window of relevant peptides and their peak shift. (B) ESI/MS spectra of the relevant peptides of the control (Top) and deglycosylated (Bottom) DCE.

71
disappeared or diminished from the spectrum of PNGase F-treated DCE (Figure 3.7B,
double asterisks labeled peaks). Two deglycosylated peptides, m/z 2932.46 and 3088.49,
were observed in the treated DCE. In addition, a weak peak at m/z 3087 (Figure 3.7B,
three asterisks) may be from trace amount of unmodified peptide at Asn285. Similar
events were also observed in α-mannosidase or α-fucosidase-treated DCE (data not
shown). These ESI-MS/MS data further confirmed DCE deglycosylation and provide
additional evidence for the elucidated oligosaccharide structures.
Oligosaccharide Profile
All glycopeptides were eluted within 3 min under the applied RP separation
conditions. Figure 3.8 (A and B) illustrates the TIC of A. aegypti DCE glycopeptides and
their oligosaccharide structures, respectively. These oligosaccharides had dominant
Hex3GlcNAc2, Hex3(Fuc)1-2GlcNAc2, and truncated structures, including GlcNAc1–2,
Hex1–2GlcNAc2, and Hex1–2(Fuc)1–2GlcNAc2. In addition, high hexose-type structures
(Hex4–7(Fuc)GlcNAc2) were also detected. Overall, the oligosaccharides confirmed by
MS/MS are consistent with the result of monosaccharide analysis, and no other
glycosylation was observed (Table 3.1). Therefore, N-glycosylation seems to be the
dominant glycosylation in DCE. When DCE from A. subalbatus was purified and
analyzed in the same manners, it had a quite similar profile of N-linked oligosaccharides
at its Asn285
-Glu-Thr motif (Figure 3.8C).
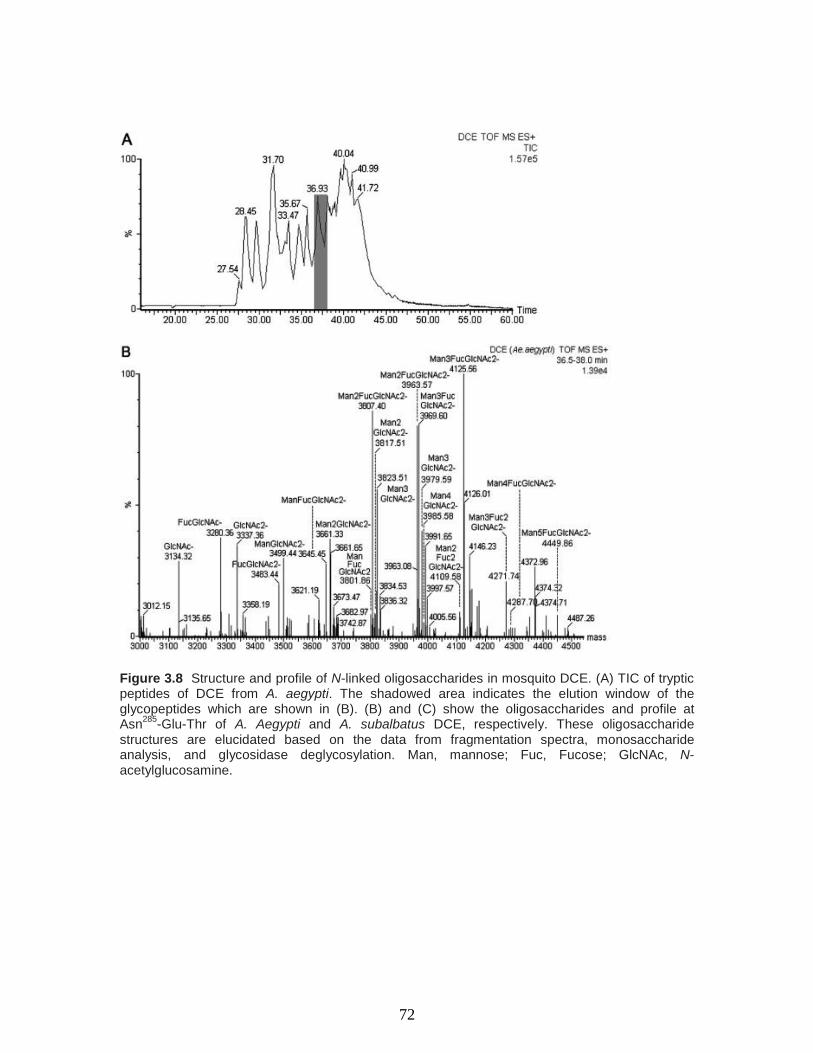
72
Figure 3.8 Structure and profile of N-linked oligosaccharides in mosquito DCE. (A) TIC of tryptic peptides of DCE from A. aegypti. The shadowed area indicates the elution window of the glycopeptides which are shown in (B). (B) and (C) show the oligosaccharides and profile at Asn
285-Glu-Thr of A. Aegypti and A. subalbatus DCE, respectively. These oligosaccharide
structures are elucidated based on the data from fragmentation spectra, monosaccharide analysis, and glycosidase deglycosylation. Man, mannose; Fuc, Fucose; GlcNAc, N-acetylglucosamine.

73
Figure 3.8 (continued) Structure and profile of N-linked oligosaccharides in mosquito DCE. (A) TIC of tryptic peptides of DCE from A. aegypti. The shadowed area indicates the elution window of the glycopeptides which are shown in (B). (B) and (C) show the oligosaccharides and profile at Asn
285-Glu-Thr of A. Aegypti and A. subalbatus DCE, respectively. These oligosaccharide
structures are elucidated based on the data from fragmentation spectra, monosaccharide analysis, and glycosidase deglycosylation. Man, mannose; Fuc, Fucose; GlcNAc, N-acetylglucosamine.
74
3.4 Concluding Remarks
DCE was purified to its apparent homogeneity from mosquitoes. The protein is N-
glycosylated at Asn285
. High- and paucimannose oligosaccharides, with quite a few
truncated structures, were detected by nano-LC-ESI MS/MS and supported by
monosaccharide composition analysis and glycosidase deglycosylation. The
glycopeptides undergoes C-terminal rearrangement and complex formation, which
further complicates its MS/MS spectrum. Although the oligosaccharides in DCE have
been highly trimmed, they still have substantial effect on its activity and stability.
DCE is a novel insect protein that shares no similarity with any noninsect proteins
from bacteria to humans. Although we have determined the biological function of the
protein, its structural basis underlying the catalytic function is unclear. Results from this
study demonstrate that mosquito DCE is a glycoprotein with dominant Man3GlcNAc2
and Hex3(Fuc)GlcNAc2 structures. In addition, high hexose-type structures (Hex4–
7GlcNAc2) and truncated structures (Hex2GlcNAc2, Man2FucGlcNAc2) are also present.
During glycoprotein synthesis in eukaryotic cells, a dolichol-linked precursor
oligosaccharide (Hex12GlcNAc2) is first transferred to a newly synthesized protein. The
oligosaccharide is then further processed in the ER and Golgi, involving removal and
addition of monosaccharides by exoglycosidases and glycosyltransferases, leading to the
production of a complex or hybrid type of oligosaccharides. It has been suggested that
most insect cells have low levels of glycosyltransferase activities, but higher levels of
exoglycosidases (such as α-mannosidase and β-N-acetylglucosaminidase) activity [16,
17], so that the processing pathway in insect cells is usually completed with the final
structure of Hex3GlcNAc2, which is in agreement with our data.

75
The common approach for analyzing oligosaccharides in glycoproteins involves
enzymatic release of oligosaccharides by PNGase A or F, direct analysis of
oligosaccharides by MALDI-TOF-MS, LC-ESI MS/MS, or HPLC with fluorescent
detection after oligosaccharide fluorescent labeling, sequential digestion of
oligosaccharides by specific exoglycosidases, and final analysis of the digested products
by normal phase HPLC or by MALDI-TOF-MS [17]. This overall process should provide
information regarding the oligosaccharide profiles and the oligosaccharide structures.
However, when the amount of glycoproteins is the limiting factor, it is difficult to
determine the oligosaccharide structures using this approach. In addition, when a number
of glycosylation sites are present in a glycoprotein, it is difficult to assign the specific
oligosaccharide structures to a particular site. In our analysis of the DCE glycosylation
site and oligosaccharide structures using LC-ESI MS/MS, oligosaccharides were not
released from their associated peptide, so that the sensitivity or signal intensity of the
glycopeptides was greatly improved due to the charge contribution from amino acid
residues in the peptide. Moreover, the CID fragmentation pattern of the representative
3963 glycopeptide ion is highly interesting (Figure 3.4). Its precursor ion and MS/MS
spectrum did not match to the DCE sequence, and its C-terminal rearrangement and
formation of dimeric structures during CID considerably complicated structural analysis.
Consequently, it is almost certain that the peptide would have easily been excluded for
further analysis or treated as a contaminant. Through careful analysis, however,
essentially all the major fragments could be assigned with confidence. This provides an
interesting example in terms of potential complexity of the glycopeptide CID
fragmentation pattern.

76
Based on the genomes of several model species, including Drosophila
melanogaster, Anopheles gambiae, A. aegypti, Apis mellifera, and Tribolium castaneum,
the yellow gene family is present in all of these insect species. Because members of the
insect yellow gene family share no sequence similarity with other organisms, there is no
shortcut to simulate the function by comparison of their protein functional correlates from
noninsect species. To truly understand the biological function of insect DCE and other
yellow proteins, one must study them at the protein level. Analysis of the deduced coding
sequences of the mosquito and Drosophila yellow gene family by an N-glycosylation
program (http://www.cbs.dtu.dk/services/NetNGlyc/) indicated that most of the yellow
family proteins are potential glycoproteins and that some of them contain a conserved
fragment with the same glycosylation site. For example, the VLRNETASQR,
LQNETMAQL, and LRNET fragments in EAA08479, EAA09172, and EAA03946
coding sequences from the A. gambiae yellow gene family, and the VLQNET,
LQNETYS, VLKNETLAR fragments in the EAT43230, EAT40936, and EAT48899
coding sequences from the A. aegypti yellow gene family share high similarity with the
VLRNETASKR fragment of the A. aegypti DCE. All of these fragments contain the same
N-glycosylation consensus (NET) sequence and they are located in similar positions in
their deduced sequences. Therefore, the glycosylation site and oligosaccharide structures
of mosquito DCE provide an essential basis for future studies of the glycosylation and
oligosaccharide structures of other members of the insect yellow family proteins.

77
Acknowledgements
A majority of the analysis of DCE was carried out by Dr. Junsuo Li. This chapter
has been published in the journal Proteomics with the following citation:
Li, J.S., et al., Proteomic analysis of N-glycosylation in mosquito dopachrome
conversion enzyme. Proteomics, 2007. 7(15): p. 2557-2569.
This work was supported in part by the College of Agriculture and Life Science
and NIH grant AI 37789 and AI19769.

78
LITERATURE CITED
1. Johnson, J. K., Li, J., Christensen, B. M., Cloning and characterization of a
dopachrome conversion enzyme from the yellow fever mosquito, Aedes aegypti.
Insect Biochem. Mol. Biol. 2001, 31, 1125–1135.
2. Georgiev, P., Tikhomirova, T., Yelagin, V., Belenkaya, T. et al., Insertions of
hybrid P elements in the yellow gene of Drosophila cause a large variety of
mutant phenotypes. Genetics 1997, 146, 583–594.
3. Wittkopp, P. J., Vaccaro, K., Carroll, S. B., Evolution of yellow gene regulation
and pigmentation in Drosophila. Curr. Biol. 2002, 12, 1547–1556.
4. Prud’homme, B., Gompelm, N., Rokas, A., Kassner, V. A. et al., Repeated
morphological evolution through cis-regulatory changes in a pleiotropic gene.
Nature 2006, 440, 1001–1002.
5. Jeong, S., Rokas, A., Carroll, S. B., Regulation of body pigmentation by the
Abdominal-B Hox protein and its gain and loss in Drosophila evolution. Cell
2006, 125, 1387–1399.
6. Weitzhandler, M., Kadlecek, D., Avdalovic, N., Forte, J. G. et al.,
Monosaccharide and oligosaccharide analysis of proteins transferred to
polyvinylidene fluoride membranes after sodium dodecyl sulfate-polyacrylamide
gel electrophoresis. J. Biol. Chem. 1993, 268, 5121–5130.
7. Anumula, K. R., Quantitative determination of monosaccharides in glycoproteins
by high performance liquid chromatography with highly sensitive fluorescence
detection. Anal. Biochem. 1994, 220, 275–283.
8. Anumula, K. R., Rapid quantitative determination of sialic acids in glycoproteins
by high-performance liquid chromatography with a sensitive fluorescence
detection. Anal. Biochem. 1995, 230, 24–30.
9. Anumula, K. R., Advances in fluorescence derivatization methods for high-
performance liquid chromatographic analysis of glycoprotein carbohydrates.
Anal. Biochem. 2006, 350, 1–23.
10. Laemmli, U. K., Cleavage of structural proteins during the assembly of the head
of bacteriophage T4. Nature 1970, 227, 680–685.
11. Ballard, K. D., Gaskell, S. J., Intramolecular [18O] isotopic exchange in the gas
phase observed during the tandem mass spectrometric analysis of peptides. J.
Am. Chem. Soc. 1992, 114, 64–71.
79
12. Gonzalez, J., Besada, V., Garay, H., Reyes, O. et al., Effect of the position of a
basic amino acid on C-terminal rearrangement of protonated peptides upon
collision-induced dissociation. J. Mass. Spectrom. 1996, 31, 150–158.
13. Fabini, G., Freilinger, A., Altmann, F., Wilson, I. B. H., Identification of core
a1,3-fucosylated glycans and cloning of the requisite fucosyltransferase cDNA
from Drosophila melanogaster: Potential basis of the neural anti-horseradish
peroxidase epitope. J. Biol. Chem. 2001, 176, 28058–28067.
14. Sudha, R., Kohtani, M., Jarrold, M. F., Noncovalent interactions between
unsolvated peptides: Helical complexes based on acid-base interactions. J. Phys.
Chem. B 2005, 109, 6442–6447.
15. Aroca, P., Martinez-Liarte, J. H., Solano, F., Garcia-Borron, J. C., Lozano, J. A.,
The action of glycosylases on dopachrome (2-carboxy-2,3-dihydroindole-5,6-
quinone) tautomerase. Biochem. J. 1992, 284, 109–113.
16. Tomiya, N., Narang, S., Lee, Y. C., Betenbaugh, M. J., Comparing N-glycan
processing in mammalian cell lines to native and engineered lepidopteran insect
cell lines. Glucoconj. J. 2004, 21, 343–360.
17. Varki, V., Cummings, R., Esko, J., Freeze, H., Hart, G., Marth, J., Essentials of
Glycobiology, Cold Spring Harbor
80
IV
METHYLDOPA RESISTANT PROTEIN

81
4.1 Abstract
The α-methyldopa resistant protein (AMD) was originally identified in Drosophila
mutants hypersensitive to α-methyldopa, an inhibitor of dopa decarboxylase (DDC).
Production of dopamine by DDC is critical for developing insects because dopamine
conjugates are used as crosslinking precursors for cuticle sclerotization. Although there
has been much discussion into the phenotypic effects of AMD, the actual function of this
protein is not clear. In this study, we expressed a recombinant AMD and assessed its
activity to α-methyldopa and dopa. Incubation of AMD in the presence of α-methyldopa
results in accumulation of 3,4-dihydroxyphenylacetone in the reaction mixture and
incubation of the protein in the presence of dopa produces 3,4-
dihydroxyphenylacetaldehyde (DOPAL) as a major product and dopamine as a minor
product. These results demonstrate that AMD is an enzyme that can use α-methyldopa
and L-DOPA as its substrates. Based on the identified enzymatic products, we propose
that AMD catalyzes an oxidative decarboxylation of α-methyldopa and dopa, leading to
the production of the deaminated intermediates 3,4-dihydroxyphenylacetone and
DOPAL, respectively. The ability to catalyze α-methyldopa to 3,4-
dihydroxyphenylacetone by AMD may explain why Drosophila becomes more resistant
to α-methyldopa in the presence of AMD.
4.2 Introduction
An α-methyldopa hypersensitive loci adjacent to the dopa decarboxylase (DDC) gene
was originally identified in Drosophila strains resistant to α-methyldopa and the gene
82
product was termed α-methyldopa resistant protein (AMD) [1, 2]. The compound, α-
methyldopa, is a competitive inhibitor of DDC that catalyzes the decarboxylation of L-
DOPA to dopamine [3]. AMD mutants are highly sensitive to α-methyldopa and die more
rapidly than wild type in the presence of this compound. The AMD protein has been
named after its phenotype; however, what exactly the AMD does to make Drosophila
resistant to α-methyldopa is unknown.
AMD shares 48% sequence identity to DDC; which may seem sufficient to classify AMD
as a DDC isozyme. However, the potential function in dopa decarboxylation by AMD
has never been described. DDC is a ubiquitous protein that is present in living organisms
from bacteria to humans [3]. Compared to other species, however, DDC plays some
unique functions in insects. For example, DDC is involved in cuticle
formation/sclerotization and immune responses in insects, which has not been discussed
in other species except in some arthropods [4]. Dopamine (DA), the product of insect
DDC, is used to produce N-acetyldopamine and N-β-alanyl-dopamine that are important
crosslinking precursors used by insects to crosslink cuticle proteins during cuticle
sclerotization, an essential biochemical event leading to the production of highly
protective exoskeleton in insects [4]. DA is an intermediate in the insect melanization
pathway that is involved in insect immune responses and wound healing [5]. This may
explain why DDC is highly regulated in insects than in most other species.
Although mammalian DDC is able to catalyze the decarboxylation of L-DOPA,
tryptophan and 5-HTP, insect DDC is more specific and is only able to catalyze the
83
decarboxylation of L-DOPA, and 5-HTP, but not tryptophan. In addition to DDC and
histidine decarboxylase, which both mammals and insects contain, two separate tyrosine
decarboxylase enzymes and AMD are both additionally present in insects, and are not
found in mammalian systems. The higher specificity of insect DDC in addition to the
presence of additional similar decarboxylase enzymes reflects the evolutionary pressure
to regulate catecholamine metabolism in insects.
The high sequence identity between DDC and AMD raises an essential question
regarding the relationship between DDC and AMD. A protein BLAST search of
Drosophila AMD against the available sequences of several insect species identified the
presence of AMD in their genomes. To understand the function of AMD and its
relationship with DDC, we expressed Drosopohila AMD and assessed its potential
function towards L-DOPA and α-methyldopa, which leads to the identification of AMD
as an enzyme that is capable of mediating oxidative deamination of L-DOPA and α-
methyldopa. In this report, we present data to describe and discuss the biochemical
function of AMD and its relation with DDC. Expression and purification of recombinant
Drosophila AMD produced a protein that displays high activity toward L-DOPA and α-
methyldopa. GC-MS analysis of TMS derivatized AMD enzymatic metabolites revealed
3,4-dihydroxyphenylacetaldehyde (DOPAL) as the major enzymatic product of L-DOPA
and 3,4-dihydroxyphenylacetone as the AMD product of α-methyldopa. Unlike DDC,
which simply catalyzes a decarboxylation of L-DOPA to dopamine, AMD catalyzes an
oxidative decarboxylation of L-DOPA to DOPAL.
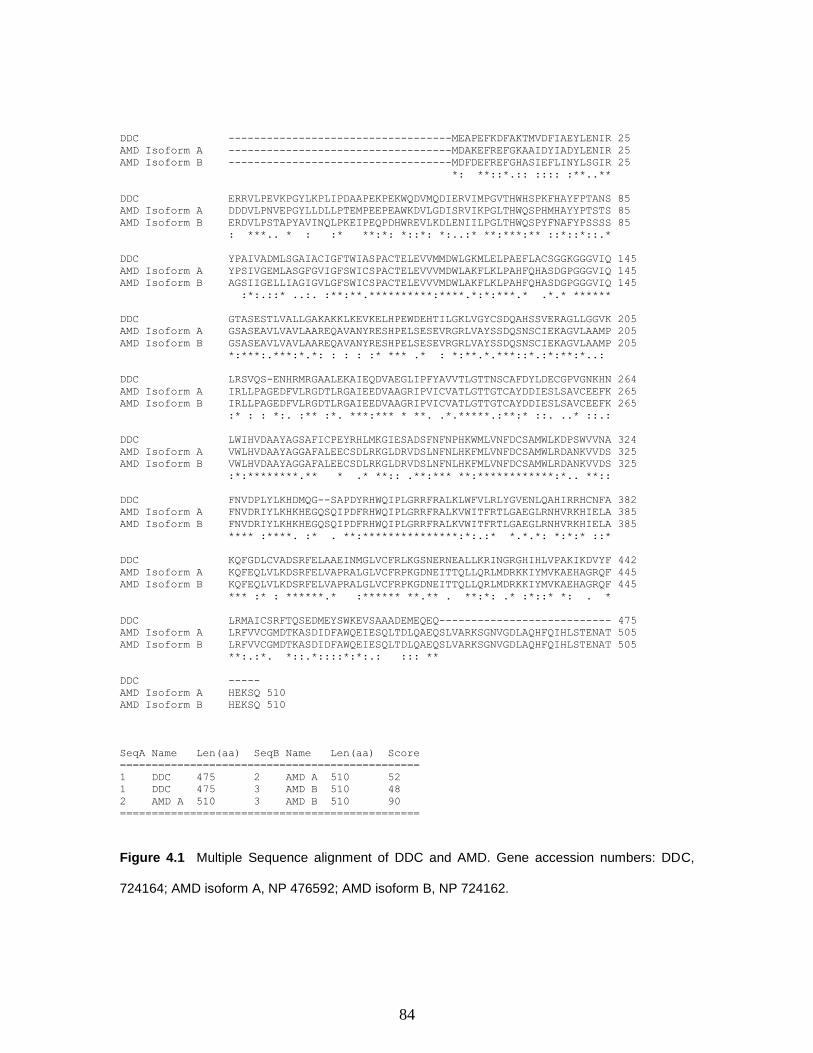
84
DDC -----------------------------------MEAPEFKDFAKTMVDFIAEYLENIR 25
AMD Isoform A -----------------------------------MDAKEFREFGKAAIDYIADYLENIR 25
AMD Isoform B -----------------------------------MDFDEFREFGHASIEFLINYLSGIR 25
*: **::*.:: :::: :**..**
DDC ERRVLPEVKPGYLKPLIPDAAPEKPEKWQDVMQDIERVIMPGVTHWHSPKFHAYFPTANS 85
AMD Isoform A DDDVLPNVEPGYLLDLLPTEMPEEPEAWKDVLGDISRVIKPGLTHWQSPHMHAYYPTSTS 85
AMD Isoform B ERDVLPSTAPYAVINQLPKEIPEQPDHWREVLKDLENIILPGLTHWQSPYFNAFYPSSSS 85
: ***.. * : :* **:*: *::*: *:..:* **:***:** ::*::*::.*
DDC YPAIVADMLSGAIACIGFTWIASPACTELEVVMMDWLGKMLELPAEFLACSGGKGGGVIQ 145
AMD Isoform A YPSIVGEMLASGFGVIGFSWICSPACTELEVVVMDWLAKFLKLPAHFQHASDGPGGGVIQ 145
AMD Isoform B AGSIIGELLIAGIGVLGFSWICSPACTELEVVVMDWLAKFLKLPAHFQHASDGPGGGVIQ 145
:*:.::* ..:. :**:**.**********:****.*:*:***.* .*.* ******
DDC GTASESTLVALLGAKAKKLKEVKELHPEWDEHTILGKLVGYCSDQAHSSVERAGLLGGVK 205
AMD Isoform A GSASEAVLVAVLAAREQAVANYRESHPELSESEVRGRLVAYSSDQSNSCIEKAGVLAAMP 205
AMD Isoform B GSASEAVLVAVLAAREQAVANYRESHPELSESEVRGRLVAYSSDQSNSCIEKAGVLAAMP 205
*:***:.***:*.*: : : : :* *** .* : *:**.*.***::*.:*:**:*..:
DDC LRSVQS-ENHRMRGAALEKAIEQDVAEGLIPFYAVVTLGTTNSCAFDYLDECGPVGNKHN 264
AMD Isoform A IRLLPAGEDFVLRGDTLRGAIEEDVAAGRIPVICVATLGTTGTCAYDDIESLSAVCEEFK 265
AMD Isoform B IRLLPAGEDFVLRGDTLRGAIEEDVAAGRIPVICVATLGTTGTCAYDDIESLSAVCEEFK 265
:* : : *:. :** :*. ***:*** * **. .*.*****.:**:* ::. ..* ::.:
DDC LWIHVDAAYAGSAFICPEYRHLMKGIESADSFNFNPHKWMLVNFDCSAMWLKDPSWVVNA 324
AMD Isoform A VWLHVDAAYAGGAFALEECSDLRKGLDRVDSLNFNLHKFMLVNFDCSAMWLRDANKVVDS 325
AMD Isoform B VWLHVDAAYAGGAFALEECSDLRKGLDRVDSLNFNLHKFMLVNFDCSAMWLRDANKVVDS 325
:*:********.** * .* **:: .**:*** **:************:*.. **::
DDC FNVDPLYLKHDMQG--SAPDYRHWQIPLGRRFRALKLWFVLRLYGVENLQAHIRRHCNFA 382
AMD Isoform A FNVDRIYLKHKHEGQSQIPDFRHWQIPLGRRFRALKVWITFRTLGAEGLRNHVRKHIELA 385
AMD Isoform B FNVDRIYLKHKHEGQSQIPDFRHWQIPLGRRFRALKVWITFRTLGAEGLRNHVRKHIELA 385
**** :****. :* . **:***************:*:.:* *.*.*: *:*:* ::*
DDC KQFGDLCVADSRFELAAEINMGLVCFRLKGSNERNEALLKRINGRGHIHLVPAKIKDVYF 442
AMD Isoform A KQFEQLVLKDSRFELVAPRALGLVCFRPKGDNEITTQLLQRLMDRKKIYMVKAEHAGRQF 445
AMD Isoform B KQFEQLVLKDSRFELVAPRALGLVCFRPKGDNEITTQLLQRLMDRKKIYMVKAEHAGRQF 445
*** :* : ******.* :****** **.** . **:*: .* :*::* *: . *
DDC LRMAICSRFTQSEDMEYSWKEVSAAADEMEQEQ--------------------------- 475
AMD Isoform A LRFVVCGMDTKASDIDFAWQEIESQLTDLQAEQSLVARKSGNVGDLAQHFQIHLSTENAT 505
AMD Isoform B LRFVVCGMDTKASDIDFAWQEIESQLTDLQAEQSLVARKSGNVGDLAQHFQIHLSTENAT 505
**:.:*. *::.*::::*:*:.: ::: **
DDC -----
AMD Isoform A HEKSQ 510
AMD Isoform B HEKSQ 510
SeqA Name Len(aa) SeqB Name Len(aa) Score
===============================================
1 DDC 475 2 AMD A 510 52
1 DDC 475 3 AMD B 510 48
2 AMD A 510 3 AMD B 510 90
===============================================
Figure 4.1 Multiple Sequence alignment of DDC and AMD. Gene accession numbers: DDC,
724164; AMD isoform A, NP 476592; AMD isoform B, NP 724162.
85
4.3 Materials and Methods
Materials
L-α-methyl-3,4-dihydroxyphenylalanine (α-methyldopa), L-3,4-
dihydroxyphenylalanine (L-DOPA), L-3,4-dihydroxyphenethylamine (dopamine, DA)
pyridoxal-5-phosphate, pyridine, sodium phosphate, formic acid, trifluroacetic acid
(TFA), acetonitrile, sodium hypochlorite, boric acid, benzene, were from Sigma (St.
Louis, MO). N,O-bis[Trimethylsilyl]trifluoroacetamide (BSTFA) and
trimethylchlorosilane (TMCS) were from Pierce (Waltham, MA). The IMPACT-CN
protein expression and purification system was from New England Biolabs (Ipswich,
MA). A pursuit C18 5u column was from Varian (Palo Alto, CA). HPLC with UV
detection was from Hitachi (Pleasanton, CA).
Expression and Purification
Recombinant AMD (NP_476592.1) was obtained using an intein-mediated purification
with an affinity chitin-binding tag system (IMPACT-CN, New England Biolabs). The
AMD protein was expressed and purified according to methods described previously [6].
An AMD isoform B coding sequence was amplified from a Drosophila melanogaster
cDNA pool. The PCR amplified AMD coding sequence was cloned into the pTYB12
plasmid (New England Biolabs) for expression of a fusion protein containing a chitin-
binding domain. Transformed Escherichia coli cells (6 L) were cultured at 37 °C and
induced with 0.2 mM isopropyl-1-thio-β-D-galactopyranoside. Following induction, the
cells were cultured at 15°C for 24 h. Cells were collected and sonicated in 10 mM sodium
phosphate (pH 7.5) with 1 mM phenylmethanesulphonylfluoride (PMSF). The soluble

86
protein extract was applied to a column packed with chitin beads and subsequently
hydrolyzed under reducing conditions. The recombinant AMD was concentrated in 5 mM
phosphate buffer (pH 7.5) using a Centricon YM-30 concentrator (Millipore). The
identity of the protein was verified as AMD isoform B by MALDI-TOF/TOF analysis of
its tryptic peptides.
Identification of Products Formed
AMD (10 ug in 100 uL reaction volume) was incubated with 2 mM L-DOPA or
α-methyldopa for 10 minutes in 20 mM sodium phosphate (pH 6.8). The reaction mixture
was treated with formic acid and then centrifuged to precipitate the enzyme. The
components of the enzymatic reaction were separated and analyzed using a pursuit 5u C18
column (Varian) with UV (280 nm) or electrochemical detection (Hitachi). The mobile
phase was 6% acetonitrile 0.1% TFA for separation of the L-DOPA reaction and 30%
acetonitrile 0.1% TFA for α-methyldopa using isocratic elution. Sodium phosphate was
included during electrochemical detection. The major peaks were collected and dried
using a speedvac.
Fractions were derivatized with TMS and analyzed with GC-MS in a similar
manner to the methods described by Loutelier-Bourhis et al. [7]. The dried enzymatic
fractions separated by HPLC were treated with pyridine (50 uL) and BSTFA/TMS (99:1,
50 uL). Each sample was transferred to a glass tube for GC-MS analysis. Products were
identified after an exact match with a TMS derivatized standard. All products were
identified as the dominant component of the sample by observation of the total ion count.
All standards were available to run under the same conditions with exception of DOPAL;
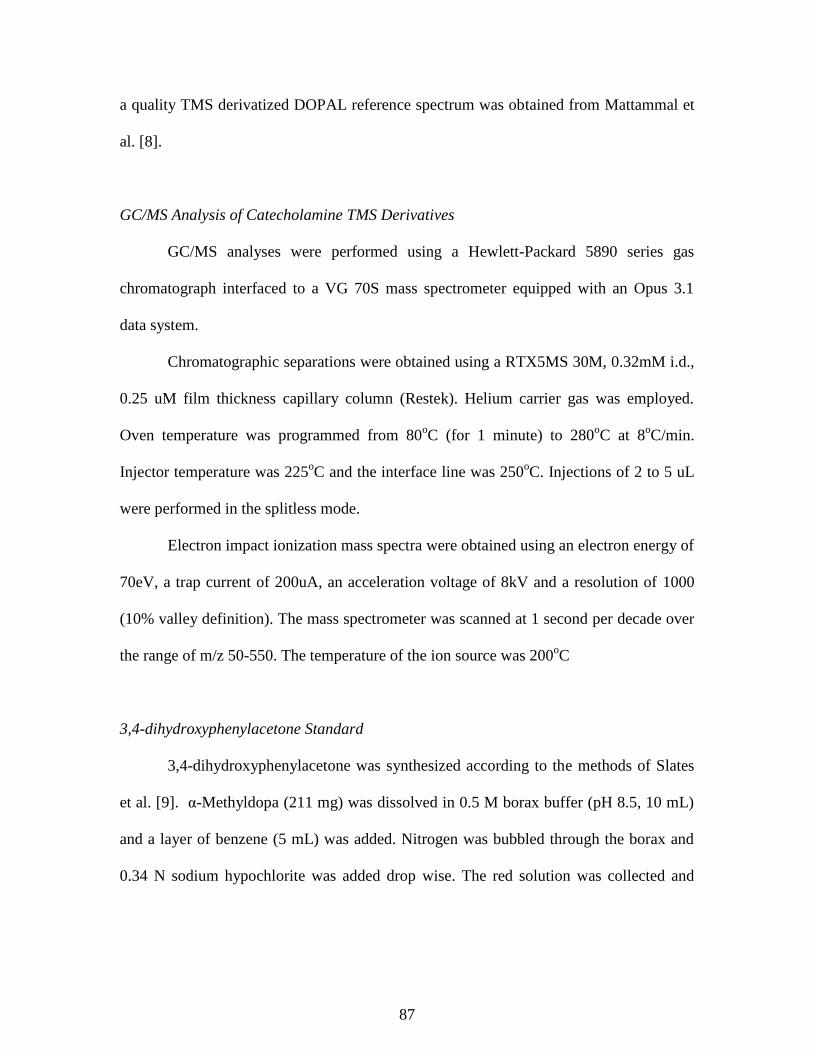
87
a quality TMS derivatized DOPAL reference spectrum was obtained from Mattammal et
al. [8].
GC/MS Analysis of Catecholamine TMS Derivatives
GC/MS analyses were performed using a Hewlett-Packard 5890 series gas
chromatograph interfaced to a VG 70S mass spectrometer equipped with an Opus 3.1
data system.
Chromatographic separations were obtained using a RTX5MS 30M, 0.32mM i.d.,
0.25 uM film thickness capillary column (Restek). Helium carrier gas was employed.
Oven temperature was programmed from 80oC (for 1 minute) to 280
oC at 8
oC/min.
Injector temperature was 225oC and the interface line was 250
oC. Injections of 2 to 5 uL
were performed in the splitless mode.
Electron impact ionization mass spectra were obtained using an electron energy of
70eV, a trap current of 200uA, an acceleration voltage of 8kV and a resolution of 1000
(10% valley definition). The mass spectrometer was scanned at 1 second per decade over
the range of m/z 50-550. The temperature of the ion source was 200oC
3,4-dihydroxyphenylacetone Standard
3,4-dihydroxyphenylacetone was synthesized according to the methods of Slates
et al. [9]. α-Methyldopa (211 mg) was dissolved in 0.5 M borax buffer (pH 8.5, 10 mL)
and a layer of benzene (5 mL) was added. Nitrogen was bubbled through the borax and
0.34 N sodium hypochlorite was added drop wise. The red solution was collected and

88
dilute HCl was added. The 3,4-dihydroxyphenylacetone was extracted with ethylacetate
and dried by rotary evaporation.
4.4 Results
MALDI-TOF/TOF Verification
MALDI-TOF/TOF analysis was carried out in the same manner as described for
DCT (Chapter 2). The recombinant protein was verified as AMD isoform B through
MALDI-TOF/TOF sequencing of tryptic peptides with 28% sequence coverage. AMD
isoform A and B vary with regards to their N-terminal sequence. 3 N-terminal AMD
isoform B specific peptides were identified (Figure 4.2).
Identification of AMD Enzymatic Products of L-DOPA
Three major peaks eluted during separation of the L-DOPA AMD enzymatic
reaction mixture with reverse phase HPLC (Figure 4.3A). The first peak to elute was
identified as the substrate L-DOPA (Figure 4.4). The second peak to elute was much
smaller than the other two and was identified as dopamine (Figure 4.5). The third peak to
elute was red when dried in the speedvac and was identified as 3,4-
dihydroxyphenylacetaldehyde (DOPAL) (Figure 4.6) [8]. In contrast to the formation of
DOPAL from DOPA by AMD, Drosophila DDC only forms DA from DOPA (Figure
4.3B).

89
Figure 4.2 AMD MALDI-TOF/TOF spectra of AMD isoform B specific tryptic peptides. Peptide
ion m/z 2111.05 (top spectrum) corresponds to the AMD isoform B peptide
26ERDVLPSTAPYAVINQLPK
44, and peptide ion m/z 1306.56 (bottom spectrum) corresponds to
the peptide 45
EIPEQPDHWR55
.
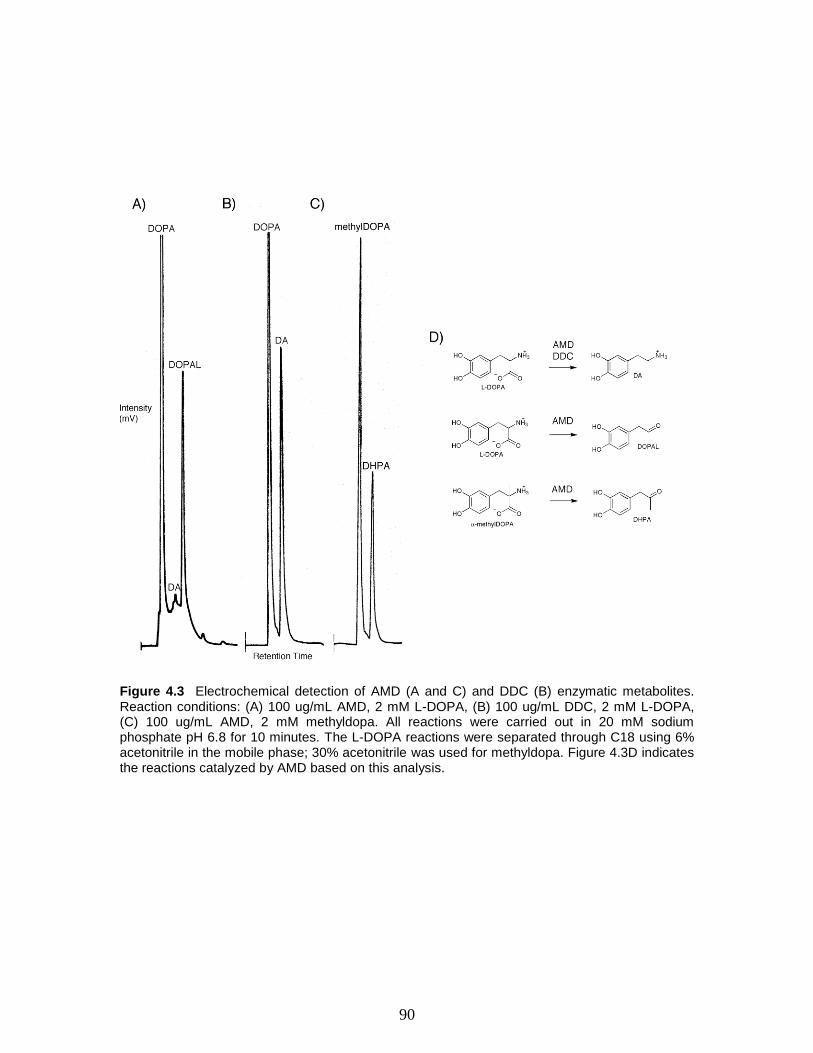
90
Figure 4.3 Electrochemical detection of AMD (A and C) and DDC (B) enzymatic metabolites. Reaction conditions: (A) 100 ug/mL AMD, 2 mM L-DOPA, (B) 100 ug/mL DDC, 2 mM L-DOPA, (C) 100 ug/mL AMD, 2 mM methyldopa. All reactions were carried out in 20 mM sodium phosphate pH 6.8 for 10 minutes. The L-DOPA reactions were separated through C18 using 6% acetonitrile in the mobile phase; 30% acetonitrile was used for methyldopa. Figure 4.3D indicates the reactions catalyzed by AMD based on this analysis.
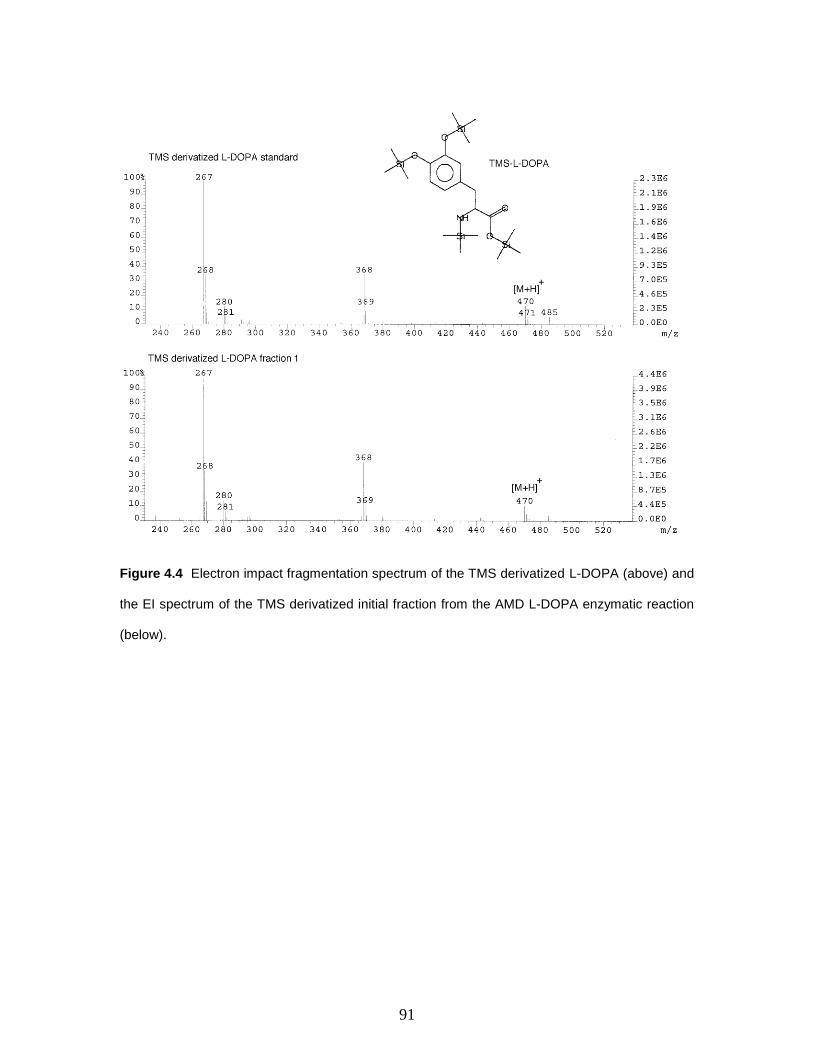
91
Figure 4.4 Electron impact fragmentation spectrum of the TMS derivatized L-DOPA (above) and
the EI spectrum of the TMS derivatized initial fraction from the AMD L-DOPA enzymatic reaction
(below).
92
Figure 4.5 Electron impact fragmentation spectrum of the TMS derivatized dopamine (above)
and the EI spectrum of the TMS derivatized second fraction from the AMD L-DOPA enzymatic
reaction (below).

93
Figure 4.6 Electron impact fragmentation spectrum of the TMS derivatized third fraction from the
L-DOPA AMD enzymatic reaction. A TMS-DOPAL derivative standard ESI reference spectrum
was obtained from Mattammal et al. [8]. These spectra indicate an enolization of the aldehyde
during the process of TMS derivatization.
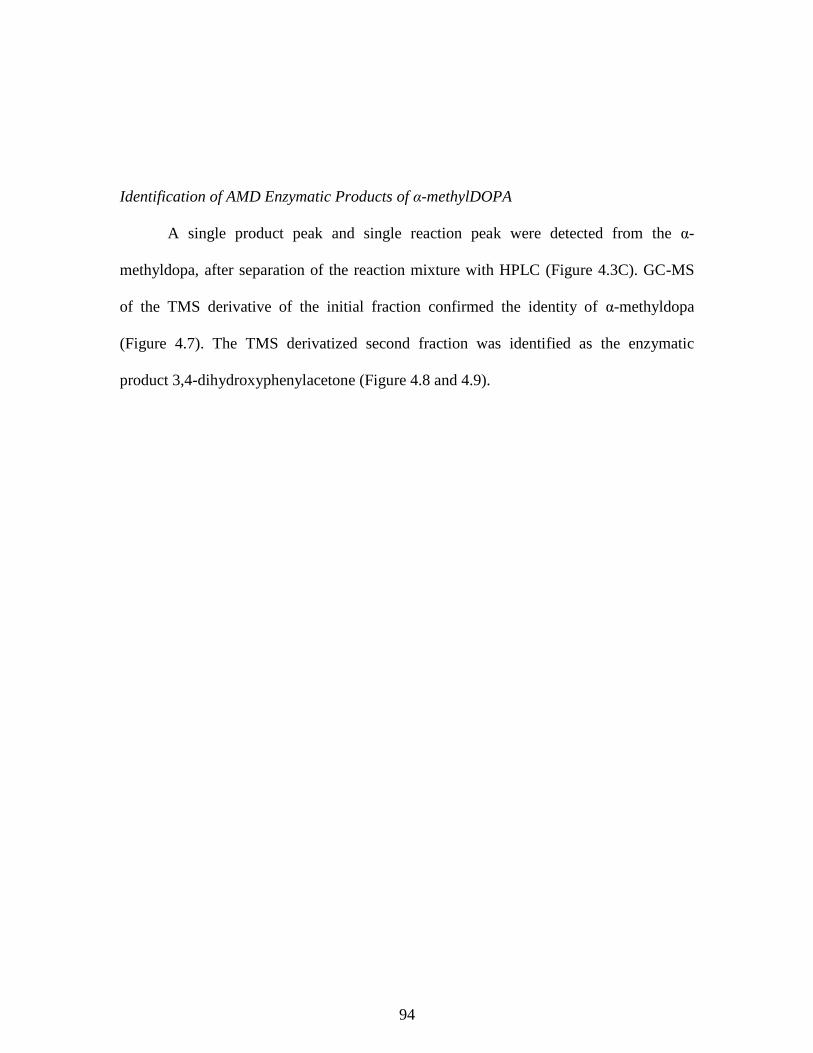
94
Identification of AMD Enzymatic Products of α-methylDOPA
A single product peak and single reaction peak were detected from the α-
methyldopa, after separation of the reaction mixture with HPLC (Figure 4.3C). GC-MS
of the TMS derivative of the initial fraction confirmed the identity of α-methyldopa
(Figure 4.7). The TMS derivatized second fraction was identified as the enzymatic
product 3,4-dihydroxyphenylacetone (Figure 4.8 and 4.9).
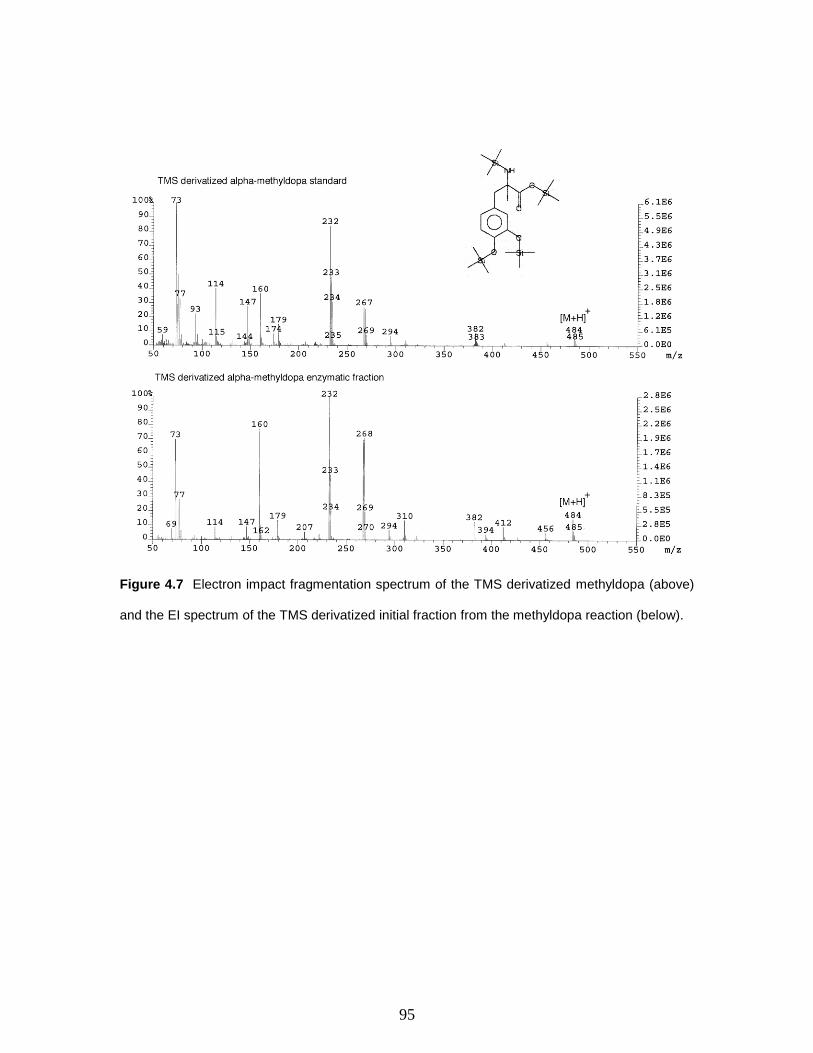
95
Figure 4.7 Electron impact fragmentation spectrum of the TMS derivatized methyldopa (above)
and the EI spectrum of the TMS derivatized initial fraction from the methyldopa reaction (below).
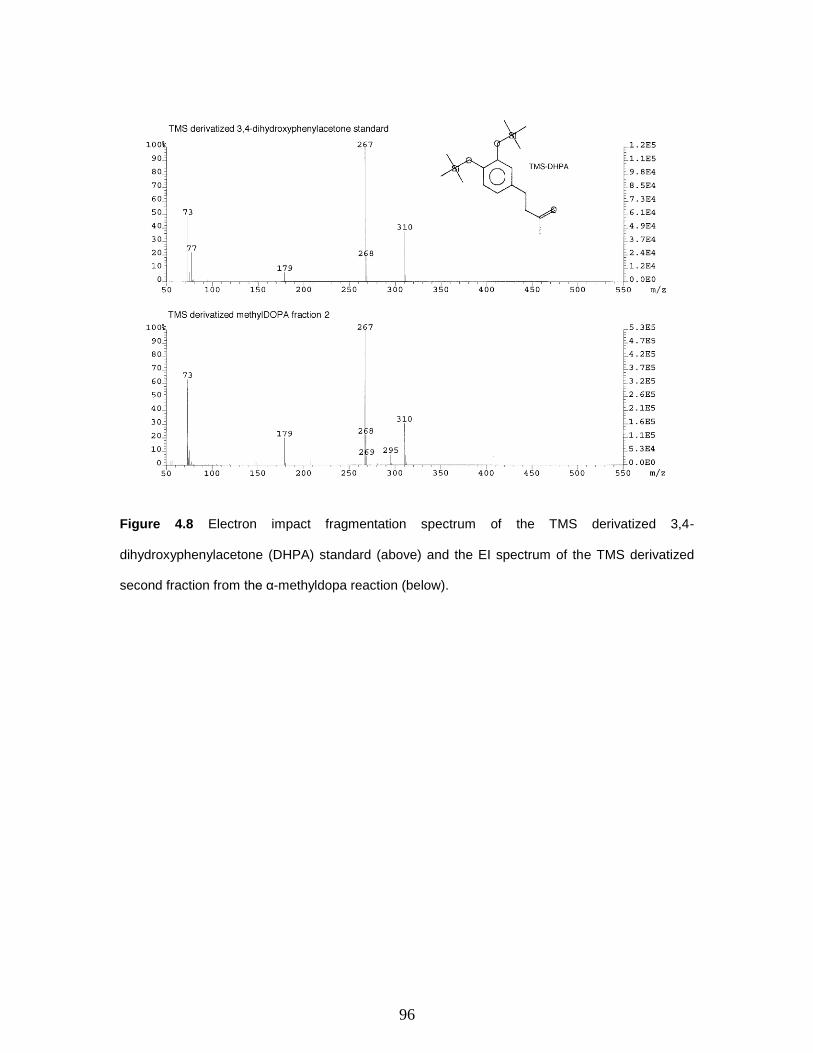
96
Figure 4.8 Electron impact fragmentation spectrum of the TMS derivatized 3,4-
dihydroxyphenylacetone (DHPA) standard (above) and the EI spectrum of the TMS derivatized
second fraction from the α-methyldopa reaction (below).
97
Figure 4.9 GC-MS TIC for the dihydroxyphenylacetone standard (above) and product fraction
from incubation of AMD with methyldopa (below).

98
4.5 Discussion
Although DDC has been shown to catalyze an oxidative deamination of α-
methyldopa to some extent, the primary activity of DDC is to produce dopamine from L-
DOPA [10]. Unlike DDC, AMD catalyzes the formation of oxidatively deaminated
DOPAL from L-DOPA to a large extent (Figure 4.3).
AMD was originally isolated in Drosophila mutants that display high resistance
to α-methyldopa. However, its primary function is likely not detoxification. α-
Methyldopa is not a common metabolite in nature and furthermore AMD is highly active
toward the common metabolite L-DOPA. Catecholamines are easily oxidized to quinones
and when this happens intramolecular cyclization by way of the amino group occurs
rapidly in order to gain stability (Figure 4.10). Cyclization of quinones is a major reaction
in melanogenesis. For example, when dopamine is oxidized to dopaquinone, the quinone
is able to cyclize to dopaminechrome, a primary intermediate in formation of DHI
melanin. By oxidizing the amino group of its substrate, AMD prevents intramolecular
cyclization from occurring. Cuticle crosslinking agents NBAD and NADA both have
their amino groups blocked and are believed to be major crosslinking agents for cuticle
sclerotization. DOPAL and further dopamine metabolites could potentially act in a
similar manner.
Drosophila strains with both elevated resistance to α-methyldopa and increased
DDC activity were also previously identified [2]. This posed the question whether DDC
could be responsible for the α-methyldopa resistance. However, through comparison of
DDC and AMD mutants, it was concluded that the resistance to α-methyldopa was
generated from AMD alone [2]. Our finding that AMD produces some residual dopamine

99
along with DOPAL from L-DOPA explains why higher AMD activity could have been
mistaken as high DDC activity as well.
Based on the production of DOPAL from L-DOPA and production of 5,6-
dihydroxyphenylacetone from α-methyldopa, a pyrodoxal reaction mechanism is outlined
in Figure 4.11. Because there is no α-proton in α-methyldopa, the mechanism must begin
with the decarboxylation of substrate and shifting of electrons to the pyrodoxal cofactor.
Normally, in this type of decarboxylation mechanism, the electrons shift back toward the
substrate along with the addition of a proton. However, hydrolysis of the shiff base at this
point would leave the amino group on the substrate. Therefore, it is proposed that the
shiff base is first hydrolyzed leaving the amino group on the pyridoxal, followed by the
electrons shifting toward the amino group with the addition of a proton to the amino
group (formation of pyridoxamine). In the case of L-DOPA, the presence of an α-proton
may allow the mechanism to follow the standard route leaving the amino group on the
substrate, hence formation of small amounts of dopamine.
In conclusion, a new protein function has been characterized for Drosophila
AMD: an oxidative deamination of L-DOPA and methyldopa. This could potentially be
used for production of DOPAL as a crosslinking agent for sclerotization or for the quick
degradation of L-DOPA, without producing the melanization intermediate dopamine.

100
Figure 4.10 Intramolecular cyclization of dopamine. This same process can occur with other
catecholamines like L-DOPA, however not with sclerotization agents NADA and NBAD or
oxidized DOPAL that contain no amino group.
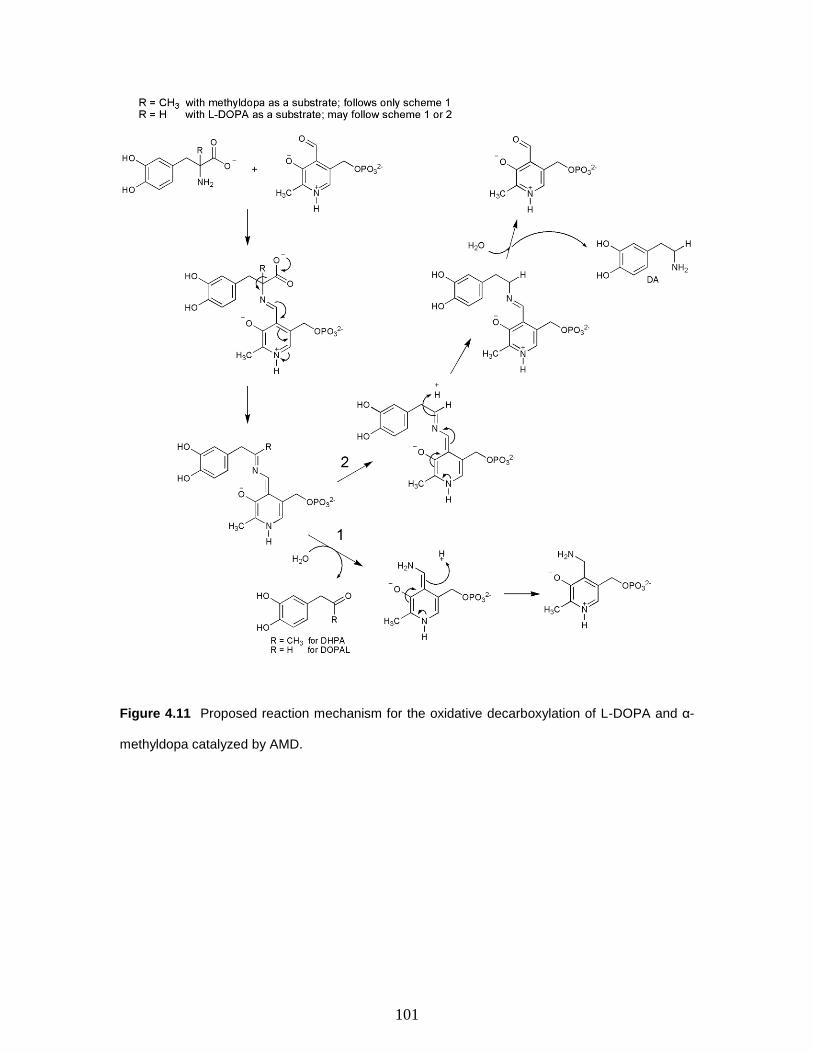
101
Figure 4.11 Proposed reaction mechanism for the oxidative decarboxylation of L-DOPA and α-
methyldopa catalyzed by AMD.
102
Acknowledgements
This work was done in partnership with Kim Harich at the Virginia Tech
Biochemistry Department GC-MS Faculity. Thanks to Dr. Keith Ray and Dr. Rich Helm
at the Virginia Tech Mass Spectrometry Incubator (http://www.mass.biochem.vt.edu/) for
their assistance with the analysis of AMD peptides. Thanks to Brian Hickory for
assistance with the synthesis of 3,4-dihydroxyphenylacetone.
103
LITERATURE CITED
1. Wright, T.R.F., R.B. Hodgetts, and A.F. Sherald, Genetics of Dopa
Decarboxylase in Drosophila-Melanogaster .1. Isolation and Characterization of
Deficiencies That Delete "Dopa-Decarboxylase-Dosage-Sensitive Region and
Alpha-Methyl-Dopa-Hypersensitive Locus. Genetics, 1976. 84(2): p. 267-285.
2. Marsh, J.L. and T.R.F. Wright, Evidence for Regulatory Variants of the Dopa
Decarboxylase and Alpha-Methyldopa Hypersensitive Loci in Drosophila.
Genetics, 1986. 112(2): p. 249-265.
3. Molinoff, P.B. and J. Axelrod, Biochemistry of catecholamines. Annu Rev
Biochem, 1971. 40: p. 465-500.
4. Andersen, S.O., M.G. Peter, and P. Roepstorff, Cuticular sclerotization in insects.
Comparative Biochemistry and Physiology B-Biochemistry & Molecular Biology,
1996. 113(4): p. 689-705.
5. Suderman, R.J., et al., Model reactions for insect cuticle sclerotization: Cross-
linking of recombinant cuticular proteins upon their laccase-catalyzed oxidative
conjugation with catechols (vol 36, pg 353, 2006). Insect Biochemistry and
Molecular Biology, 2006. 36(7): p. 610-611.
6. Han, Q., H. Robinson, and J. Li, Crystal structure of human kynurenine
aminotransferase II. J Biol Chem, 2008. 283(6): p. 3567-73.
7. Loutelier-Bourhis, C., et al., Gas chromatography/mass spectrometric
identification of dopaminergic metabolites in striata of rats treated with L-DOPA.
Rapid Commun Mass Spectrom, 2004. 18(5): p. 571-6.
8. Mattammal, M.B., et al., Confirmation of a dopamine metabolite in parkinsonian
brain tissue by gas chromatography-mass spectrometry. J Chromatogr, 1993.
614(2): p. 205-12.
9. Slates, H.L., et al., Degradation of α-Methyl-3,4-dihydroxyphenylalanine (α-
MethylDOPA). J Org Chem, 1964. 29(6): p. 1424-1429.
10. Bertoldi, M., et al., Reaction of Dopa decarboxylase with alpha-methyldopa leads
to an oxidative deamination producing 3,4-dihydroxyphenylacetone: An active
site directed affinity label. Biochemistry, 1998. 37(18): p. 6552-6561.
11. Marchitti, S.A., R.A. Deitrich, and V. Vasiliou, Neurotoxicity and metabolism of
the catecholamine-derived 3,4-dihydroxyphenylacetaldehyde and 3,4-
dihydroxyphenylglycolaldehyde: The role of aldehyde dehydrogenase.
Pharmacological Reviews, 2007. 59(2): p. 125-150.

104
IV
GENERAL DISCUSSION

105
The purification and analysis of recombinant DCT and AMD, as well as native
DCE is outlined in this dissertation. Through these studies, many valuable insights in
terms of the structural and functional characteristics of these important proteins have
been gained. For example, N-glycosylation sites from DCT and DCE have been
characterized. Furthermore, a new protein function has been demonstrated for AMD.
These contributions were gained through the purification and mass spectrometric analysis
of these enzymes or their metabolites.
The highly purified and active DCT, DCE and AMD were obtained using
conventional biochemical methods. The technology and means used for the purification
of these enzymes have existed for quite a while now, however these methods are still are
very powerful tools for the elucidation of protein structure and function. Furthermore, the
analysis of the products and substrates of the AMD enzymatic reaction were done using a
VG 70S mass spectrometer.
In the post-genomic era, direct structural and functional characterization at the
protein level has become an extremely important task [1]. Despite heavy interest into
tyrosine metabolism fueled by the demand for insight into Parkinson’s disease, dopamine
related pharmacology and melanoma, many of the core enzymes in these pathways are
still not understood. In the case of DCT, tyrosinase and TRP1, this is likely due to the
level of difficulty required to isolate these enzymes. The major factors contributing to the
difficulty in purifying these three enzymes are the transmembrane domain and high level
of post-translational processing.
To avoid the complications that arise when working with membrane proteins,
DCT was expressed without the C-terminal transmembrane domain and cytosolic tail
106
using an Sf9 insect cell expression system. Purification of the truncated, recombinant
DCT proved to be much easier than the native protein from B16 cells. This recombinant
DCT is soluble in the absence of detergent and is expressed at higher levels than from
B16 mouse melanoma cells. The successful expression tyrosinase and TRP1 in insect
cells (see appendix) is also a move in the right direction for the proteomic
characterization of the entire tyrosinase related protein family. Tyrosinase has been
extensively characterized and a crystal structure for a bacterial tyrosinase has recently
been reported. There is still much work to be done with TRP1. However, the reactions
catalyzed by tyrosinase and TRP1 are more difficult to assay for than DCT. For these
reasons, DCT was an ideal starting point for the purification of tyrosinase related
proteins.
Despite the many advantages of working with recombinant protein, the
physiological relevance may be brought into question. In the case of proteins that are able
to be expressed in bacterial systems, like AMD, the differences between the recombinant
and native protein are likely to be much less significant than for highly processed proteins
like DCT. In regards to N-glycosylation, the complexity of the final occupied N-
glycosylation sites varies between the eukaryotic expression systems. For example, yeast
generate high mannose, “complex type” N-glycans and vertebrates produce the most
complex N-glycan structures [2]. The processing pathway in insect cells is the least
complicated and is usually completed with the final structure of Man3GlcNAc2 [2], as was
found in our analysis of DCE and DCT expressed in insect cells [3].
Although production of a mammalian glycoprotein in an insect cell expression
system would therefore lead to production of less complex glycan structures as was found
107
in the case with DCT, it has been found that the same glycosylation sites are occupied
between different eukaryotic expression systems [4-6]. Furthermore, the less complex
and more uniform processing in the insect cell expression system will be highly
advantageous for obtaining protein crystals.
N-glycosylation is critical for the correct folding and processing of glycoproteins
through the ER and Golgi. Mutation of glycosylation sites in tyrosinase have been found
to disrupt the processing of the protein. Furthermore, disruption of glycosylation sites
through mutation is also linked to various forms of oculocutaneous albinism. Although
DCT plays a very important role in melanogenesis, no direct analysis of its N-
glycosylation sites has previously been carried out.
The purification of DCE is somewhat more manageable than for the tyrosinase
related proteins. The activity of DCE can be measured in the same manner as DCT, by
observing the disappearance of dopachrome. Furthermore, the activity of DCE is higher
than DCT, which makes it even easier to track during purification. DCE contains no
membrane domain and is not as highly processed; DCE contains only a single
glycosylation site in comparison to the multiple sites in DCT and mammalian tyrosinase.
This allowed for extensive analysis of the native protein. However, recombinant protein
is also being explored as a good option to produce uniform protein for crystallography
purposes.
In the case of AMD, it is not a matter of difficulty that has left this interesting
protein uncharacterized. This may demonstrate the enormity of the task of proteomics, as
there still is an abundant number of proteins that have yet to be characterized. However,
this may simply reflect the amount of interest in insect proteins relative to mammals.
108
There are still quite a number of uncharacterized proteins involved in the metabolism of
tyrosine.
Comparison between the enzymes of melanogenesis and dopamine metabolism
between insects and mammals reveals many interesting evolutionary differences. In
regards to melanogenesis, the direct enzymatic regulation by the mammalian system may
appear to be more highly controlled. However the insect pathway is highly evolved;
insects contain multiple phenoloxidases and DCE is a member of a yellow gene family
with a number of similar enzymes. As a model species, Drosophila contains 13
phenoloxidases and up to 14 yellow family proteins [7]. Insects must invest a great deal
of energy to hardening of their eggs and formation of their cuticle. It is therefore logical
that they have evolved a highly complex network of enzymes to assist in these processes.
Currently, most of the yellow proteins and phenoloxidases remain uncharacterized.
The evolutionary difference is also pronounced when examining DDC from both
phyla. Mammals utilize just a single DDC termed aromatic amino acid decarboxylase
(AADC) for the decarboxylation of L-DOPA to dopamine, and the decarboxylation of 5-
hydroxytryptophan to serotonin. Drosophila contains multiple DDC isoforms, two
tyrosine decarboxylases and AMD. Similar to the situation with melanization related
enzymes, insects must also invest a great deal into L-DOPA metabolism, as they require
dopamine for cuticle formation.
There is still much to be done in regards to understanding the enzymes involved
in melanogenesis and sclerotization at the protein level. The purification and
characterization of DCT, DCE and AMD have answered many questions, however
crystal structures of these proteins are an essential piece of the complete picture.
109
Hopefully, this dissertation will serve as a useful reference for the comprehensive
understanding of the enzymes of melanogenesis and sclerotization.
110
LITERATURE CITED
1. Eisenberg, D., et al., Protein function in the post-genomic era. Nature, 2000.
405(6788): p. 823-826.
2. Varki, A., Essentials of glycobiology. 1999, Cold Spring Harbor, NY: Cold
Spring Harbor Laboratory Press. xvii, 653 p.
3. Li, J.S., et al., Proteomic analysis of N-glycosylation in mosquito dopachrome
conversion enzyme. Proteomics, 2007. 7(15): p. 2557-2569.
4. James, D.C., et al., N-glycosylation of recombinant human interferon-gamma
produced in different animal expression systems. Biotechnology (N Y), 1995.
13(6): p. 592-6.
5. Altmann, F., et al., Insect cells as hosts for the expression of recombinant
glycoproteins. Glycoconjugate Journal, 1999. 16(2): p. 109-123.
6. Yeh, J.C., et al., Site-Specific N-Glycosylation and Oligosaccharide Structures of
Recombinant Hiv-1 Gp120 Derived from a Baculovirus Expression System. Faseb
Journal, 1994. 8(7): p. A1427-A1427.
7. Drapeau, M.D., The family of yellow-related Drosophila melanogaster proteins.
Biochemical and Biophysical Research Communications, 2001. 281(3): p. 611-
613.
111
APPENDIX
SUPPLEMENTARY INFORMATION

112
A.1 Supplementary DCT Information
Supplementary DCT MS Data
A few quality MS/MS spectra of DCT tryptic peptides were also collected using
Q-TOF mass spectrometry (Figure A.1). These peptides were analyzed using the same
methods described in Chapter 3 for Dopachrome Conversion enzyme. Additional
MALDI-TOF/TOF spectra mentioned in Chapter 3 are also included (Figure A.2)
Generation of DCT-TEV-His6 Baculovirus Transfer Vector
Although recombinant DCT was successfully purified from baculovirus
transfected Sf9 insect cells, this process is difficult to reproduce. In an attempt to simplify
the purification process, a polyhistidine tagged DCT has been produced. Because his-tags
often interfere with chromatographic separations after metal affinity chromatography has
already been used, a TEV cleavable his-tag is ideal.
No C-terminal TEV cleavable his-tag vector has been available commercially for
baculovirus transfection. Because DCT contains an N-terminal signal sequence and a C-
terminal transmembrane anchor, a C-terminal tag is best. An engineered Invitrogen
vector pMelBacC with this modification was obtained from graduate student Michael
Smout of University of Queensland, Australia (Figure A.3). DCT was amplified without
its transmembrane domain using the forward primer
ATATGTCGACATGGGCCTTGTGGGAT containing a SalI (SalI is compatible with
XhoI) restriction site and the reverse primer TCAGAAGCTTGAGAGAGTTGTGGACC
containing a HindIII restriction site. The amplified DCT coding sequence was inserted
113
into the modified vector, which was named pHotWax, however an extra nucleotide was
detected in the vector before the stop codon after DNA sequencing. The DNA coding
sequence containing DCT followed by a TEV site and histidine tag was reamplified with
the reverse primer GGATCCTCAATGGTGATGGTGATG (BamHI restriction site)
without the extra nucleotide and recloned into the transfer vector.
Sf9 insect cells were cotransfected with recombinant pHotWax and viral DNA in
the same manner described in Chapter 2. The transfected cells contain high DCT activity,
which indicates this recombinant DCT is also active and properly folded.
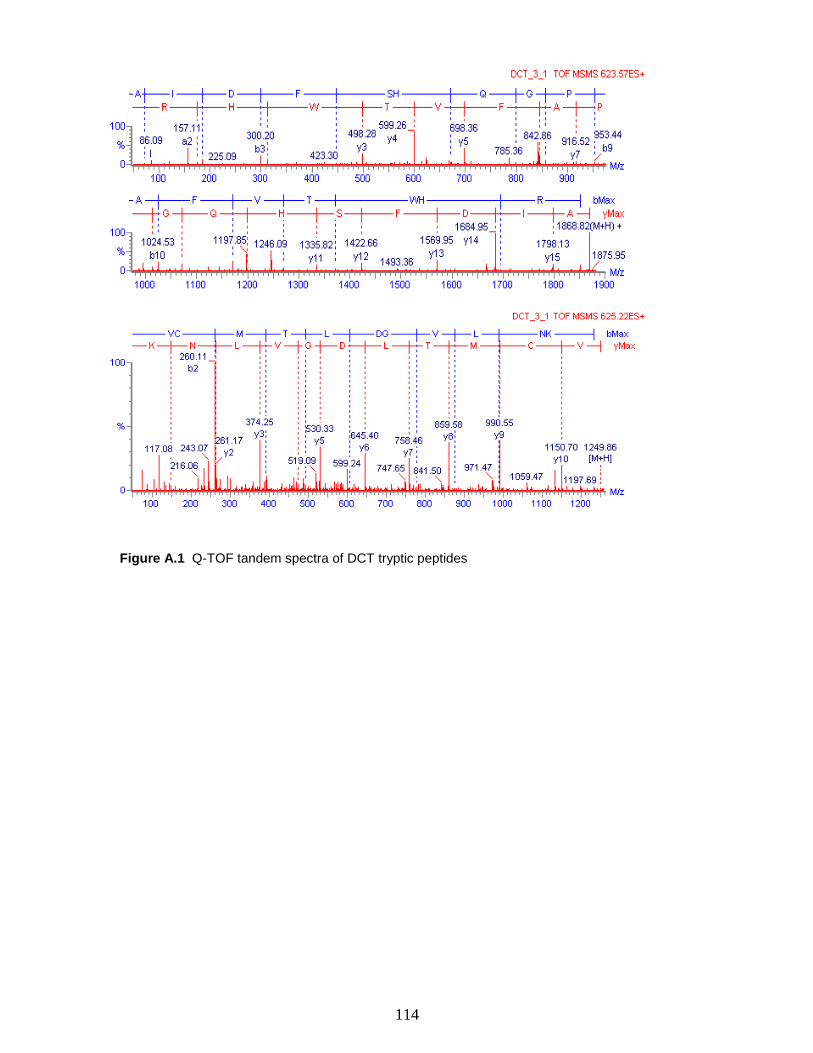
114
Figure A.1 Q-TOF tandem spectra of DCT tryptic peptides
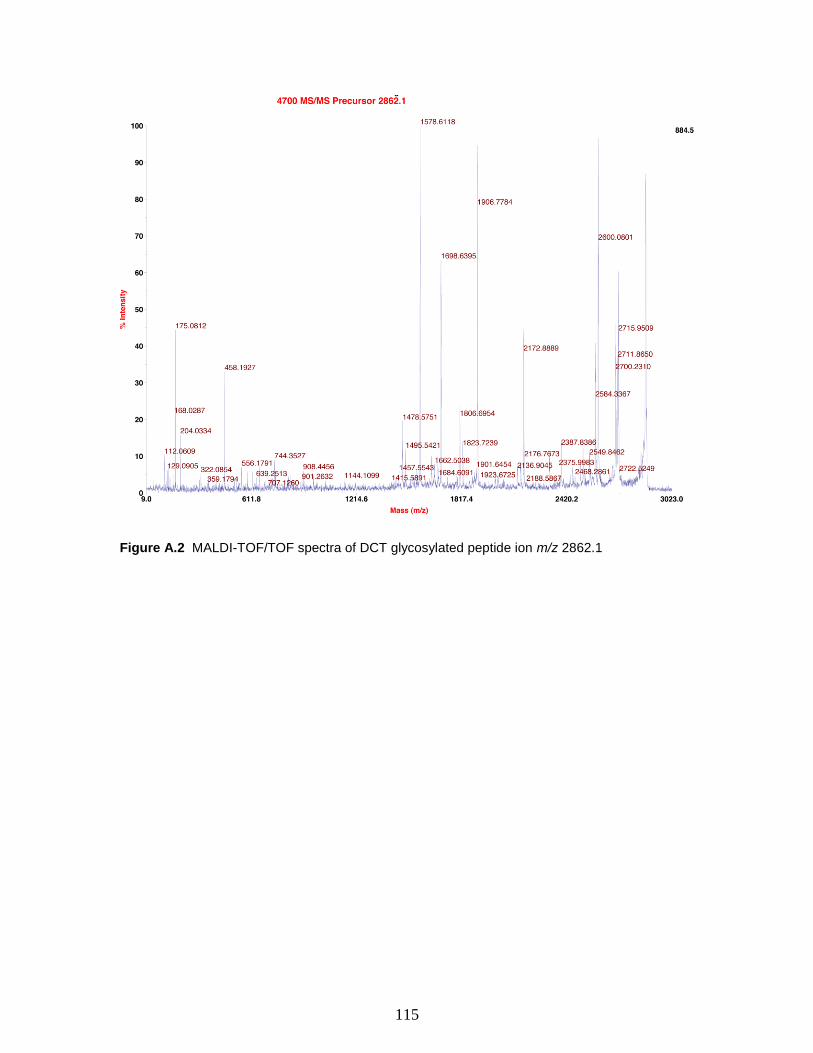
115
Figure A.2 MALDI-TOF/TOF spectra of DCT glycosylated peptide ion m/z 2862.1

116
GTGTCCAGTGTGGCTTGATATCATGGAGATAATTAAAATRATAACCATCTCGCAAATAA
ATAAGTATTTTACTGTTTTCGTAACAGTTTTGTAATAAAAAAACCTATAAATATGAAAT
TCTTAGTCAACGTTGCCCTTGTTTTTATGGTCGTATACATTTCTTACATCTATGCGGAT
CGATGGGGATCCGAGCTCGAGATCTGCAGCTGGTACCATGGAATTCGAAGCTTGGAGGG
CCAGTTTTATCTGAACGAAGGTAAGCCTATCCCTAACCCTCTCCTCGGTCTCGATTCTA
CGCGTACCGGTCATCATCACCATCACCATTGAGTCGACTCTGCTGAAGAGGAGGAAATT
CTCCTTGAAGTTTCCCTGGTGTTCAAAGTAAAGGAGTTTGCACCAGACGCACCTCTGTT
CACTGGTCCGGCGTATTAAAACACGATACATTGTTATTAGTACATTTATTAAGCGCTAG
ATTCTGTGCGTTGTTGATTTACAGACAATTGTTGTACGTATTTTAATAATTCATTAAAT
TTATAATCTTTAG
Figure A.3 Vector Map and multiple cloning site sequence of pHotWax. This vector was modified
from pMelBacA (Invitrogen) and shares the exact sequence with exception to the multiple cloning
site.
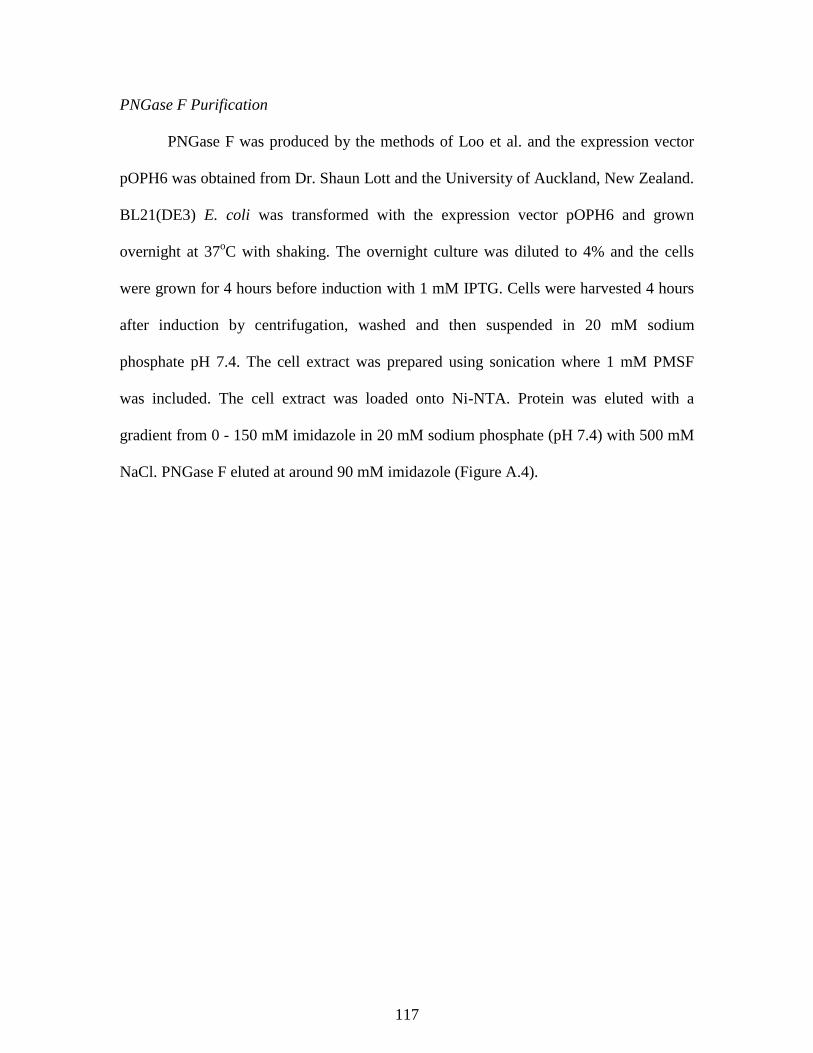
117
PNGase F Purification
PNGase F was produced by the methods of Loo et al. and the expression vector
pOPH6 was obtained from Dr. Shaun Lott and the University of Auckland, New Zealand.
BL21(DE3) E. coli was transformed with the expression vector pOPH6 and grown
overnight at 37oC with shaking. The overnight culture was diluted to 4% and the cells
were grown for 4 hours before induction with 1 mM IPTG. Cells were harvested 4 hours
after induction by centrifugation, washed and then suspended in 20 mM sodium
phosphate pH 7.4. The cell extract was prepared using sonication where 1 mM PMSF
was included. The cell extract was loaded onto Ni-NTA. Protein was eluted with a
gradient from 0 - 150 mM imidazole in 20 mM sodium phosphate (pH 7.4) with 500 mM
NaCl. PNGase F eluted at around 90 mM imidazole (Figure A.4).
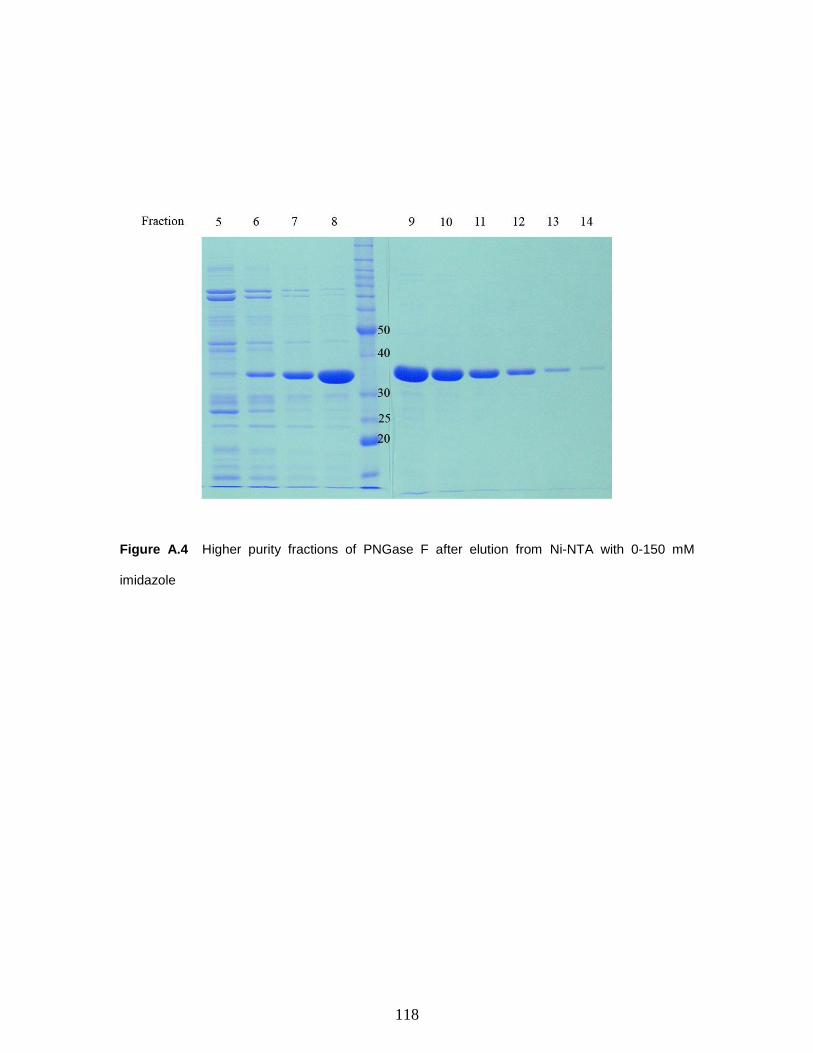
118
Figure A.4 Higher purity fractions of PNGase F after elution from Ni-NTA with 0-150 mM
imidazole

119
A.2 Tyrosinase Related Proteins
DCT has only two close relatives within the same protein family: tyrosinase and
tyrosinase-related protein 1 (TRP1) [1]. All three mammalian proteins share 38-47%
sequence identity. Unlike DCT and TRP1, tyrosinase is also found in bacteria and a
crystal structure of Streptomyces castaneoglobisporus tyrosinase has been solved [2].
This Streptomyces tyrosinase shares approximately 29% amino acid sequence identity
with its three mammalian relatives.
Each protein contains an N-terminal signal peptide, 6-7 potential N-glycosylation
sites, a C-terminal transmembrane domain and two highly conserved metal binding sites
(Figure A.5). This high level of similarity in primary sequence strongly suggests a
common evolutionary origin. A BLAST search against the NCBI non-redundant protein
database using any one of these three sequences yields “tyrosinase” or “tyrosinase-like”
sequences; however, their specific functions in the melanogenesis pathway are quite
different. Tyrosinase functions as both a mono and dioxygenase using molecular oxygen
as an electron acceptor to catalyze hydroxylation of tyrosine to 3,4-
dihydroxyphenylalanine (L-DOPA) followed by the oxidation of L-DOPA to
dopaquinone. In contrast, DCT serves as an intramolecular oxidoreductase and mediates
a tautomerization of dopachrome to DHICA (Chapter 2). Although the exact function of
TRP1 is not clear, it is most likely involved in the oxidation of DHICA units, a similar
reaction to the tyrosinase oxidation of L-DOPA [3].
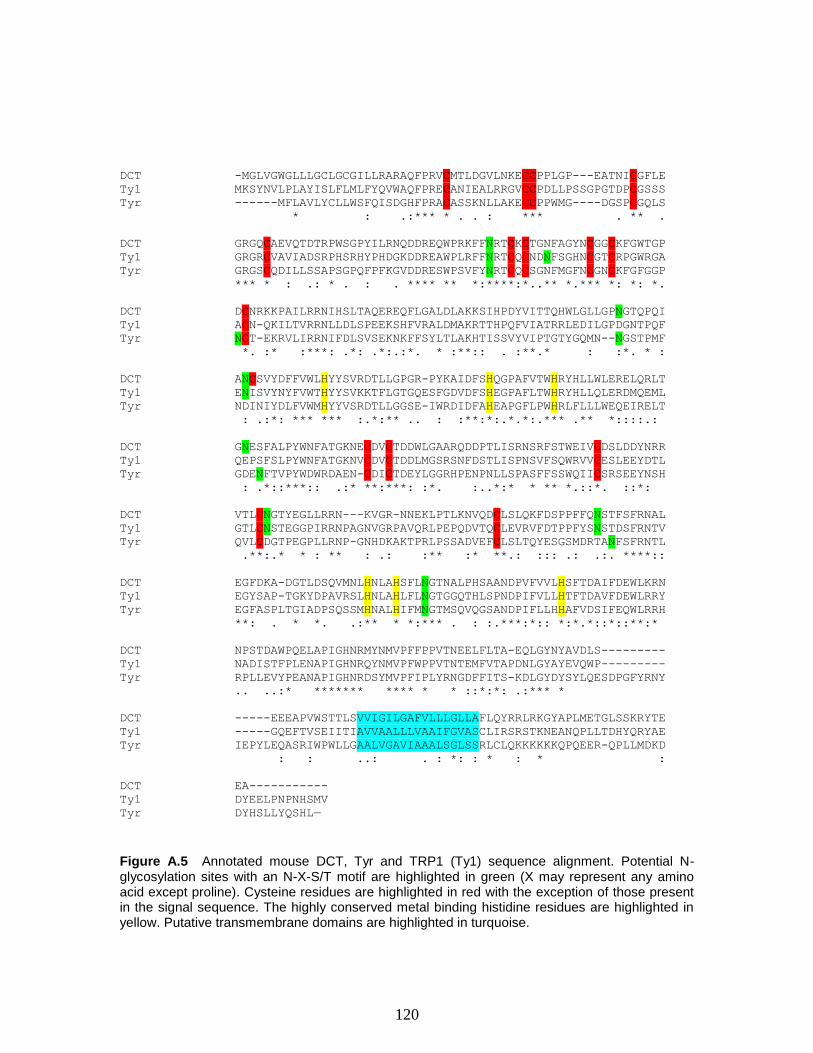
120
DCT -MGLVGWGLLLGCLGCGILLRARAQFPRVCMTLDGVLNKECCPPLGP---EATNICGFLE
Ty1 MKSYNVLPLAYISLFLMLFYQVWAQFPRECANIEALRRGVCCPDLLPSSGPGTDPCGSSS
Tyr ------MFLAVLYCLLWSFQISDGHFPRACASSKNLLAKECCPPWMG----DGSPCGQLS
* : .:*** * . . : *** . ** .
DCT GRGQCAEVQTDTRPWSGPYILRNQDDREQWPRKFFNRTCKCTGNFAGYNCGGCKFGWTGP
Ty1 GRGRCVAVIADSRPHSRHYPHDGKDDREAWPLRFFNRTCQCNDNFSGHNCGTCRPGWRGA
Tyr GRGSCQDILLSSAPSGPQFPFKGVDDRESWPSVFYNRTCQCSGNFMGFNCGNCKFGFGGP
*** * : .: * . : . **** ** *:****:*..** *.*** *: *: *.
DCT DCNRKKPAILRRNIHSLTAQEREQFLGALDLAKKSIHPDYVITTQHWLGLLGPNGTQPQI
Ty1 ACN-QKILTVRRNLLDLSPEEKSHFVRALDMAKRTTHPQFVIATRRLEDILGPDGNTPQF
Tyr NCT-EKRVLIRRNIFDLSVSEKNKFFSYLTLAKHTISSVYVIPTGTYGQMN--NGSTPMF
*. :* :***: .*: .*:.:*. * :**:: . :**.* : :*. * :
DCT ANCSVYDFFVWLHYYSVRDTLLGPGR-PYKAIDFSHQGPAFVTWHRYHLLWLERELQRLT
Ty1 ENISVYNYFVWTHYYSVKKTFLGTGQESFGDVDFSHEGPAFLTWHRYHLLQLERDMQEML
Tyr NDINIYDLFVWMHYYVSRDTLLGGSE-IWRDIDFAHEAPGFLPWHRLFLLLWEQEIRELT
: .:*: *** *** :.*:** .. : :**:*:.*.*:.*** .** *::::.:
DCT GNESFALPYWNFATGKNECDVCTDDWLGAARQDDPTLISRNSRFSTWEIVCDSLDDYNRR
Ty1 QEPSFSLPYWNFATGKNVCDVCTDDLMGSRSNFDSTLISPNSVFSQWRVVCESLEEYDTL
Tyr GDENFTVPYWDWRDAEN-CDICTDEYLGGRHPENPNLLSPASFFSSWQIICSRSEEYNSH
: .*::***:: .:* **:***: :*. :..*:* * ** *.::*. ::*:
DCT VTLCNGTYEGLLRRN---KVGR-NNEKLPTLKNVQDCLSLQKFDSPPFFQNSTFSFRNAL
Ty1 GTLCNSTEGGPIRRNPAGNVGRPAVQRLPEPQDVTQCLEVRVFDTPPFYSNSTDSFRNTV
Tyr QVLCDGTPEGPLLRNP-GNHDKAKTPRLPSSADVEFCLSLTQYESGSMDRTANFSFRNTL
.**:.* * : ** : .: :** :* **.: ::: .: .:. ****::
DCT EGFDKA-DGTLDSQVMNLHNLAHSFLNGTNALPHSAANDPVFVVLHSFTDAIFDEWLKRN
Ty1 EGYSAP-TGKYDPAVRSLHNLAHLFLNGTGGQTHLSPNDPIFVLLHTFTDAVFDEWLRRY
Tyr EGFASPLTGIADPSQSSMHNALHIFMNGTMSQVQGSANDPIFLLHHAFVDSIFEQWLRRH
**: . * *. .:** * *:*** . : :.***:*:: *:*.*::*::**:*
DCT NPSTDAWPQELAPIGHNRMYNMVPFFPPVTNEELFLTA-EQLGYNYAVDLS---------
Ty1 NADISTFPLENAPIGHNRQYNMVPFWPPVTNTEMFVTAPDNLGYAYEVQWP---------
Tyr RPLLEVYPEANAPIGHNRDSYMVPFIPLYRNGDFFITS-KDLGYDYSYLQESDPGFYRNY
.. ..:* ******* **** * * ::*:*: .:*** *
DCT -----EEEAPVWSTTLSVVIGILGAFVLLLGLLAFLQYRRLRKGYAPLMETGLSSKRYTE
Ty1 -----GQEFTVSEIITIAVVAALLLVAAIFGVASCLIRSRSTKNEANQPLLTDHYQRYAE
Tyr IEPYLEQASRIWPWLLGAALVGAVIAAALSGLSSRLCLQKKKKKKQPQEER-QPLLMDKD
: : ..: . : *: : * : * :
DCT EA-----------
Ty1 DYEELPNPNHSMV
Tyr DYHSLLYQSHL—
Figure A.5 Annotated mouse DCT, Tyr and TRP1 (Ty1) sequence alignment. Potential N-glycosylation sites with an N-X-S/T motif are highlighted in green (X may represent any amino acid except proline). Cysteine residues are highlighted in red with the exception of those present in the signal sequence. The highly conserved metal binding histidine residues are highlighted in yellow. Putative transmembrane domains are highlighted in turquoise.
121
Expression of Tyrosinase and Tyrosinase Related Protein 1
Immunoaffinity purification of all three tyrosinase-related proteins has been
reported, however this was done using antibodies specific for a portion of the C-terminal
cytosolic domain [4]. We have successfully expressed truncated mammalian TRP1 and
tyrosinase with the absence of their C-terminal hydrophobic and cytosolic domain using
the same methods described in the DCT section. Tyrosinase was amplified using a
forward primer (GACTGGATCCATGTTCTTGGCTGTTTTG) containing a BamHI
restriction site and a reverse primer (GACTGAATTCTCACCAGATACGACTGGCTT)
containing an EcoRI restriction site. TRP1 was amplified using a forward primer
(CAGCACTCGAGATGAAATCTTACAACGTC) containing an XhoI restriction site
and a reverse primer (GCGCGAATTCTCAAGATACAGTAAACTCCT) containing an
EcoRI restriction site. The PCR protocol for the amplification of tyrosinase and
tyrosinase-related protein 1 is identical to that described for DCT in Chapter 2.
Although the activity for tyrosinase and TRP1 are somewhat more difficult to
monitor than DCT, the methods for purification of these proteins should be relatively
similar since the proteins share high sequence identity and structural features.
122
A.3 Drosophila AMD Mutant Analysis
The following Drosophila melanogaster AMD mutants were obtained from
Bloomington Drosophila stock center (http://flystocks.bio.indiana.edu/). Stock number
18640, genotype: w[1118];PBac{w[+mC]=WH}amd[f03321]/CyO; stock number 3194,
genotype: dp[ov1] b[1] amd[7] pr[1]/CyO; Dp(2;Y)H2; and stock number 3177,
genotype: amd[1]/CyO. A DDC mutant was also obtained (stock number 3168,
genotype: Ddc[DE1]). All mutants were grown in the presence of 0.1 mM methyldopa
along with wildtype Drosophila. None of the flies grew except the DDC mutants.
Because DDC and AMD have similar function, it is surprising that the DDC mutants
were actually more resistant to methyldopa when the AMD mutants are hypersensitive.
Acetone extractions of the Drosophila mutants were also analyzed to determine
their catecholamine levels using GC-MS in the same manner as described in Chapter 4.
Unfortunately, no molecules resembling catechoamines were detected in any of the
samples.
123
LITERATURE CITED
1. Prota, G., Melanins and melanogenesis. 1992, San Diego: Academic Press. xiii,
290 p.
2. Matoba, Y., et al., Crystallographic evidence that the dinuclear copper center of
tyrosinase is flexible during catalysis. J Biol Chem, 2006. 281(13): p. 8981-90.
3. Kobayashi, T., et al., Tyrosinase stabilization by Tyrp1 (the brown locus protein).
J Biol Chem, 1998. 273(48): p. 31801-5.
4. Tsukamoto, K., et al., A second tyrosinase-related protein, TRP-2, is a
melanogenic enzyme termed DOPAchrome tautomerase. EMBO J, 1992. 11(2): p.
519-26.
Related Documents