Mass-Spectrometric Analysis of Lipids (Lipidomics) 1. Identification 2. Quantification 3. Metabolism

Mass-Spectrometric Analysis of Lipids (Lipidomics) 1. Identification 2. Quantification 3. Metabolism.
Dec 29, 2015
Welcome message from author
This document is posted to help you gain knowledge. Please leave a comment to let me know what you think about it! Share it to your friends and learn new things together.
Transcript
Mass-Spectrometric Analysis of Lipids (Lipidomics)
1. Identification
2. Quantification
3. Metabolism
Why to do lipidomics?
Biology: Functions of different lipids?
Medicine: Diagnostics and Therapy
Industry: Healthier food, Quality control

GlyceroPhospholipids
>10 classes (PC, PE, PS, PI, PA etc)
- Each class consists of numerous species
with different fatty acid combinations
(>20 different fatty acids)
=> Thousands of different molecular
species possible
O
O
O
O
HCH2C CH2
O
PO
O
ON
H
H
H
H
HH
H
H
H
HH
H
H
Phosphatidylcholine (PC)

Neutral Glycerolipids
- Triacylglycerols (TG)- Diacylglycerols (DG)- Monoacylglycerols (MG)
-Each class consists of numerous species due to different fatty acid combinations
=> Hundreads of different molecular species
TG DG
O
O
O
O
HCH2C CH2
O
O
O
O
O
O
HCH2C CH2
OH

Lactosylceramide Ganglioside Sulfatide
O
O
HNHC
CH2
O
C O
CH
O
H
H
OH
H
O
H
H
OH
O
OH
H
H
OH
H
O
HO HH
OH
O
O
HNHC
CH2
O
C OH
CH
O
H
H
OH
H
O
H
H
OH
O
O
H
H
OH
H
O
HO HH
HO
O
COOH
O
HO
OH
AcHN
OH
HO
O
O
HNHC
CH2
O
C OH
CH
O
H
H
O
H
O
H
H
OH
H3SO3-
Sphingolipids
- Ceramides- Neutral Glycosphingolipids- Acidic Glycosphingolipids
-Each class consists of numerous species due to different fatty acid
=> Hundreads of different molecular species

The complete lipidome of no cell or tissue has ever been determined
...because of technical limitations
Advantages of MS analysis
Sensitivity >1000-fold higher than with conventional methods
Resolution - Allows quantification of hundreds of lipid species
Speed -100 times faster
Can be automated - High troughput possible

Ionization methods used in lipid MS
Electrospray (ESI)– Does not cause fragmentation – Can be easily automated – Compatible with on-line LC
Matrix-assisted laser desorption (MALDI)– Less used thus far – Suppression by PC/SM > All lipids not detected– On-line LC separation not feasible

Electrospray ionization
Competition for charge => Suppression effects!
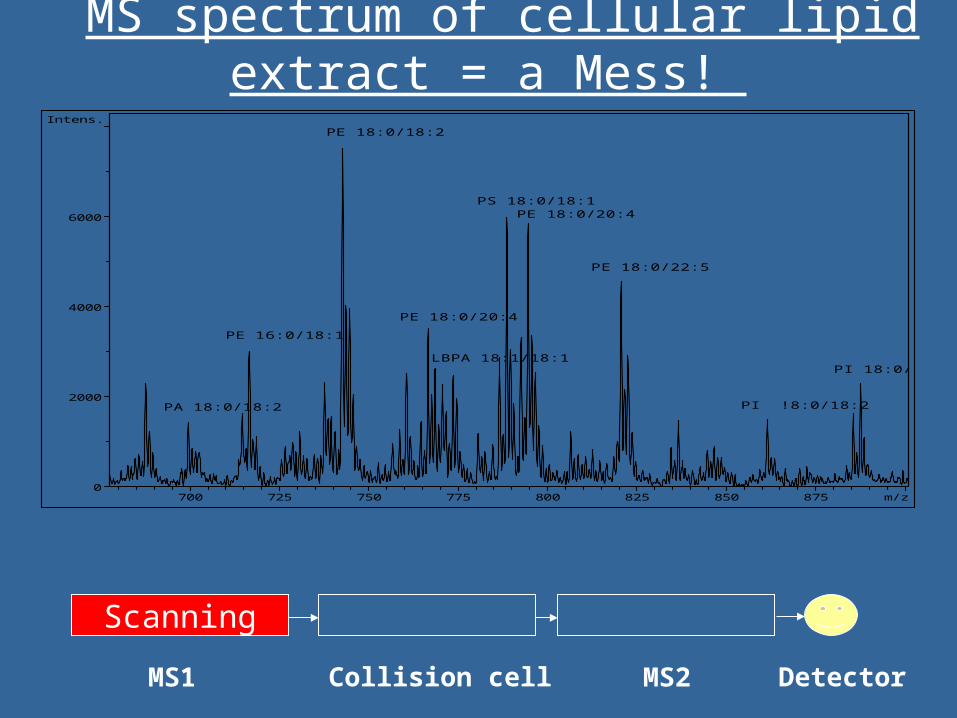
MS spectrum of cellular lipid extract = a Mess!
700 725 750 775 800 825 850 875 m/z0
2000
4000
6000
Intens.PE 18:0/18:2
PE 16:0/18:1
PA 18:0/18:2
PE 18:0/20:4
LBPA 18:1/18:1
PE 18:0/22:5
PI !8:0/18:2
PI 18:0/20:3
PS 18:0/18:1PE 18:0/20:4
Scanning
MS1 MS2 Collision cell Detector

How to improve selectivity?
A. Lipid class -specific scanning (MS/MS)
B. On-line chromatographic separation (LC-MS)

Lipid class -specific scanning
Phospholipid class consist of species with the same polar head-group but different fatty acids
Phospholipid class Specific scan
Phosphatidylcholines Precursors of +184
Phosphatidylinositols Precursors of -241
Phosphatidylethanolamines Neutral-loss of 141
Phosphatidylserines Neutral-loss of 87
O
O O
O
CH
CH2
H2C O P
O
O
O X
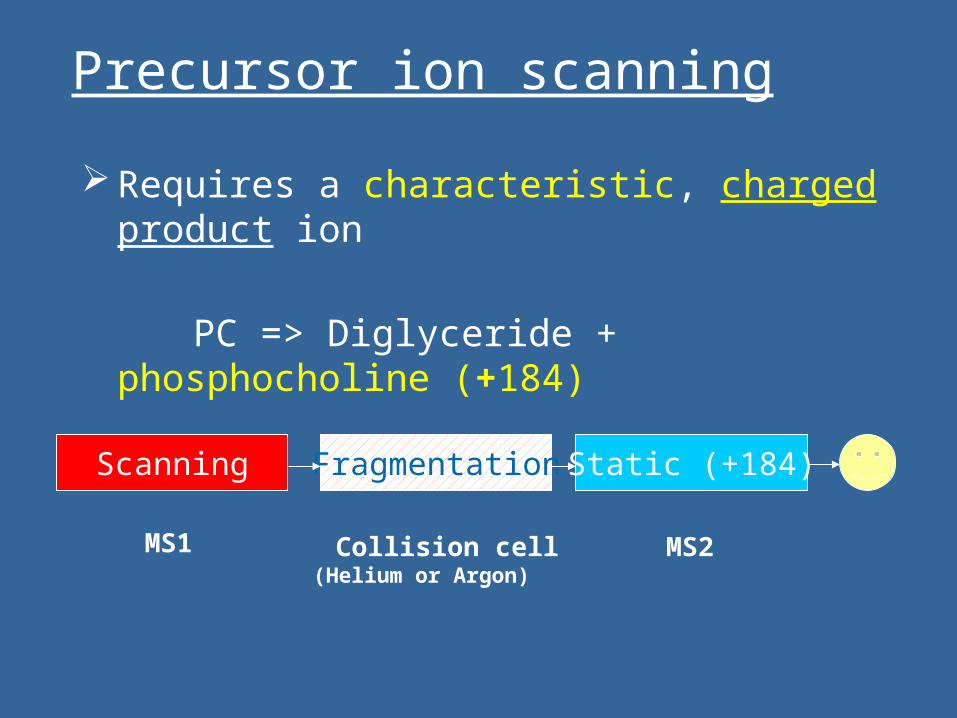
Precursor ion scanning
Requires a characteristic, charged product ion
PC => Diglyceride + phosphocholine (+184)
FragmentationScanning Static (+184)
MS1 MS2 Collision cell (Helium or Argon)

Precursors of +184 => PC + SM
-Alkaline hydrolysis can be used to remove PCs
SM-16:0
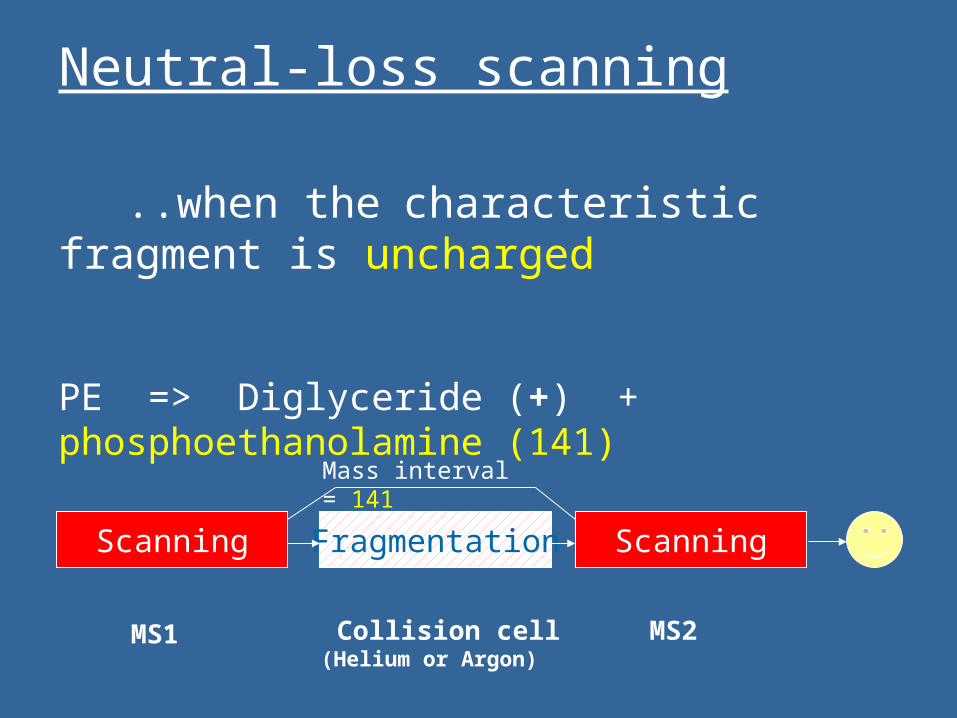
Neutral-loss scanning
Scanning Fragmentation Scanning
MS1 MS2 Collision cell(Helium or Argon)
Mass interval = 141
..when the characteristic fragment is uncharged
PE => Diglyceride (+) + phosphoethanolamine (141)

Neutral-loss of 141 (= PE)
700 725 750 775 800 825 850 875 m/z0
2000
4000
6000
Intens.PE 18:0/18:2
PE 16:0/18:1
PA 18:0/18:2
PE 18:0/20:4
LBPA 18:1/18:1
PE 18:0/22:5
PI !8:0/18:2
PI 18:0/20:3
PS 18:0/18:1PE 18:0/20:4
MS-scan
700 750 800

MS analysis of Sphingolipids

Sphingosine Ceramide Lactosylceramide Ganglioside Sulfatide
O
O
HNHC
CH2
O
C O
CH
O
H
H
OH
H
O
H
H
OH
O
OH
H
H
OH
H
O
HO HH
OH
O
O
HNHC
CH2
O
C OH
CH
O
H
H
OH
H
O
H
H
OH
O
O
H
H
OH
H
O
HO HH
HO
O
COOH
O
HO
OH
AcHN
OH
HO
O
O
HNHC
CH2
O
C OH
CH
O
H
H
O
H
O
H
H
OH
H3SO3-
OOH
O
COOH
O
HO
OH
AcHN
OH
HO
H3SO3-
OO
HNHC
CH2
C OH
CH
OH
HHNHC
CH2
C OH
CH
OH
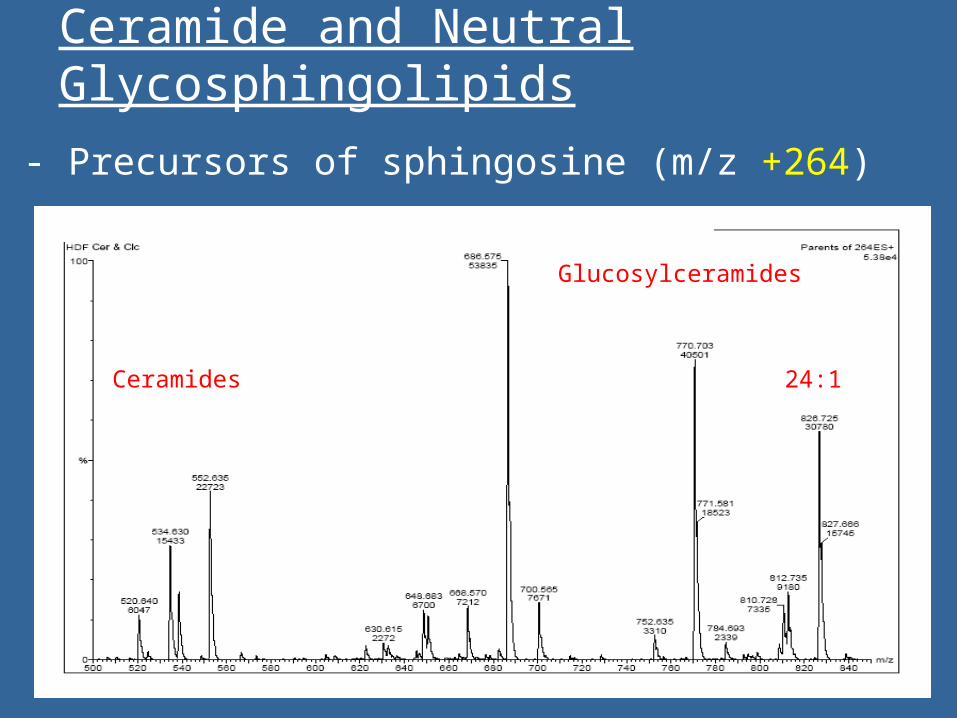
Ceramide and Neutral Glycosphingolipids
- Precursors of sphingosine (m/z +264)
Ceramides
Glucosylceramides
24:1

Sulfatides
- Precursors of Sulfate (m/z -97)

Liquid chromatography-MS (LC-MS)
Advantages - Increased sensitivity due to diminished suppression of minor species by
- Major species - Impurities
Disadvantages– Takes more time (not UPLC)– Data analysis more complex (?)
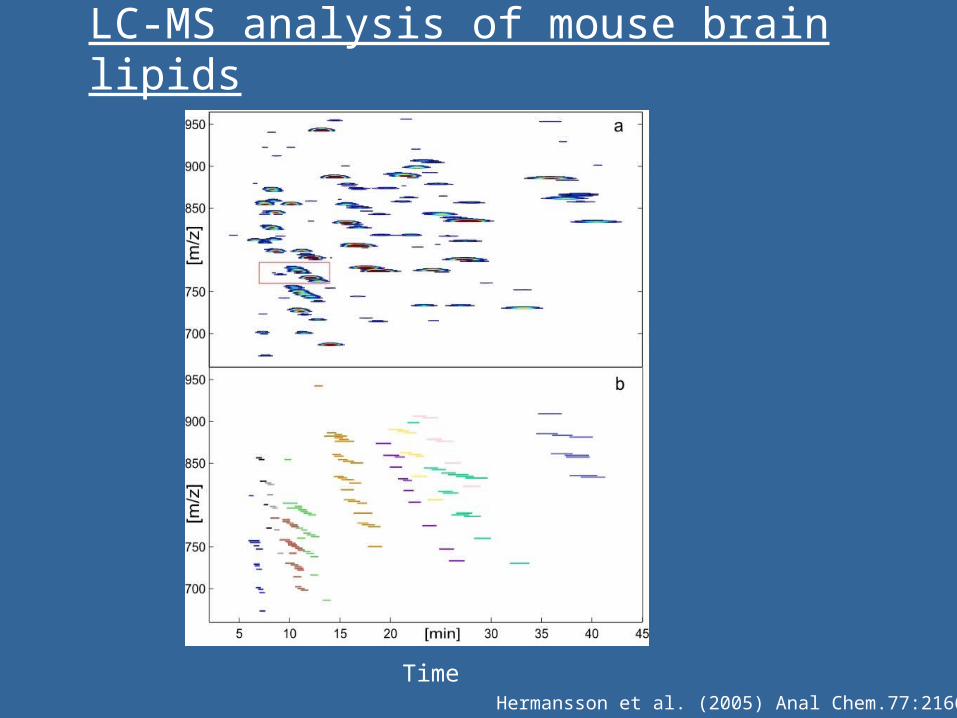
LC-MS analysis of mouse brain lipids
TimeHermansson et al. (2005) Anal Chem.77:2166-75

Data analysis => software
A. Processing of the data => Identification
=> Concentrations
B. Bioinformatics => Biomarkers?
=>Biological significance?
Quantification not simple
Signal intensity depends on:
• Lipid head-group• Acyl chain length• Acyl chain unsaturation• Ions present (adduct formation)• Detergent and other impurities (suppression)• Solvent composition and instrument settings
=> Internal standards necessary!
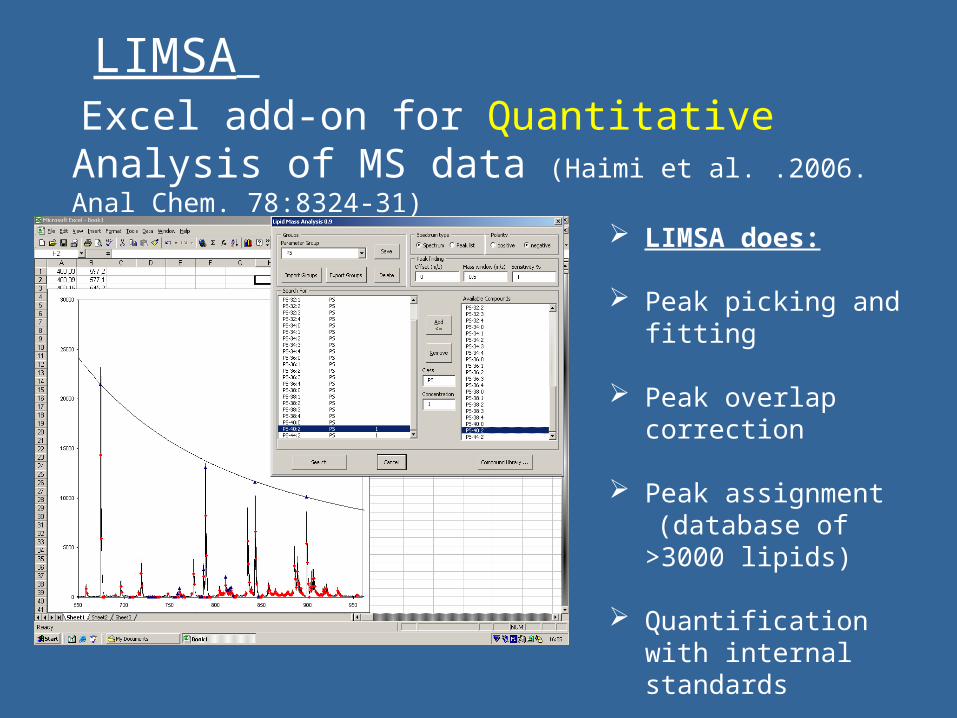
LIMSA
Excel add-on for Quantitative Analysis of MS data (Haimi et al. .2006. Anal Chem. 78:8324-31)
LIMSA does:
Peak picking and fitting
Peak overlap correction
Peak assignment (database of >3000 lipids)
Quantification with internal standards
Batch analysis
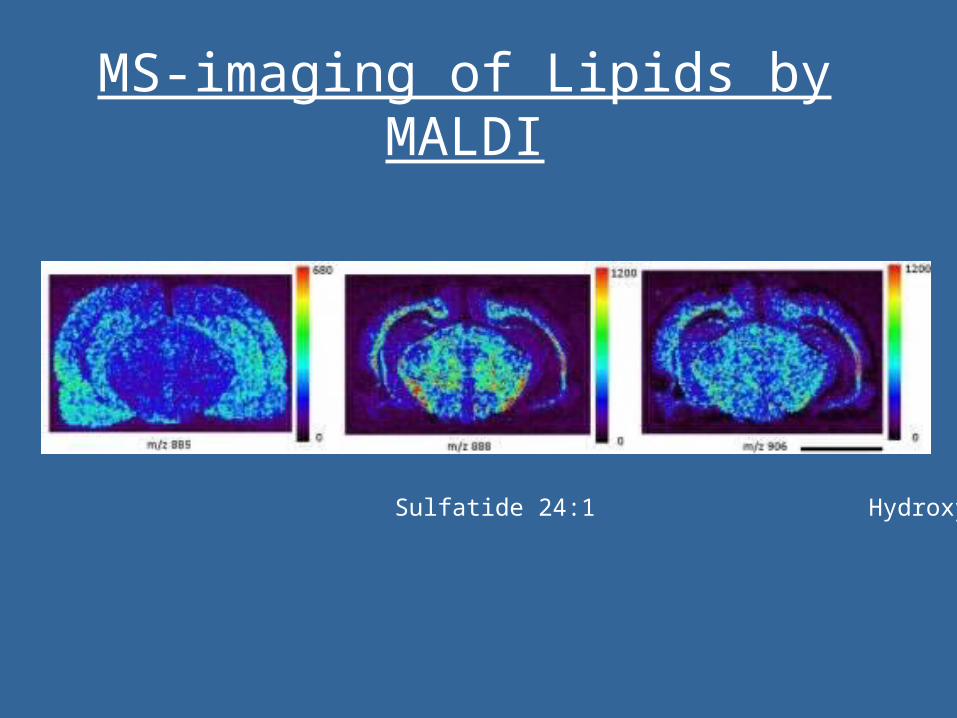
MS-imaging of Lipids by MALDI
PI 38:4 Sulfatide 24:1 Hydroxy-Sulfatide 24:1
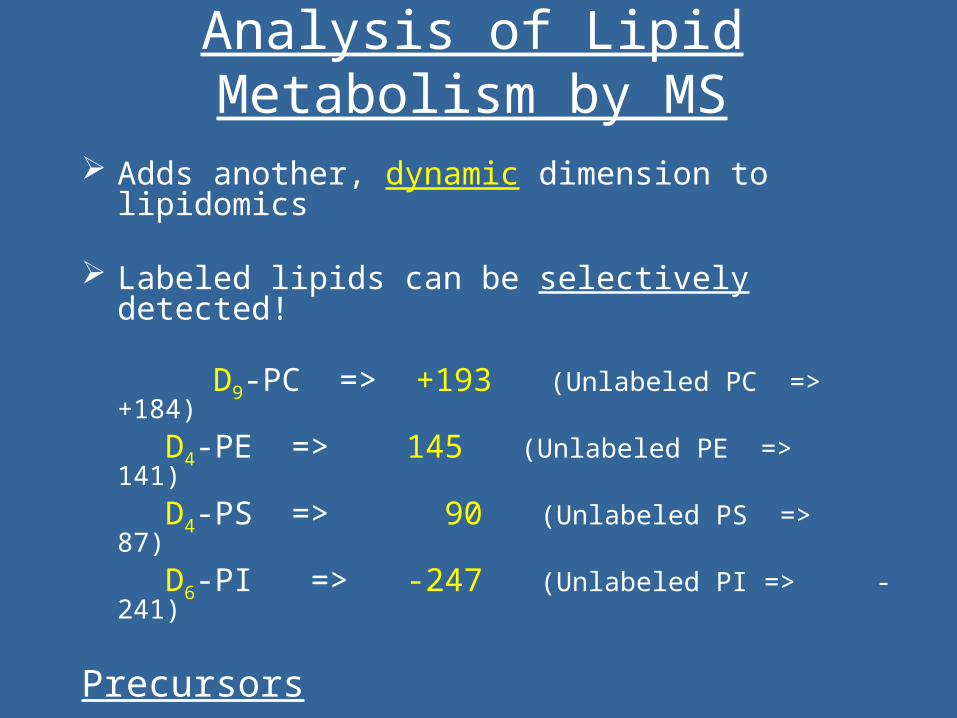
Analysis of Lipid Metabolism by MS
Adds another, dynamic dimension to lipidomics
Labeled lipids can be selectively detected!
D9-PC => +193 (Unlabeled PC => +184)
D4-PE => 145 (Unlabeled PE => 141)
D4-PS => 90 (Unlabeled PS => 87)
D6-PI => -247 (Unlabeled PI => -241)
Precursors
Water soluble precursors (D9-choline etc) Exogenous lipids
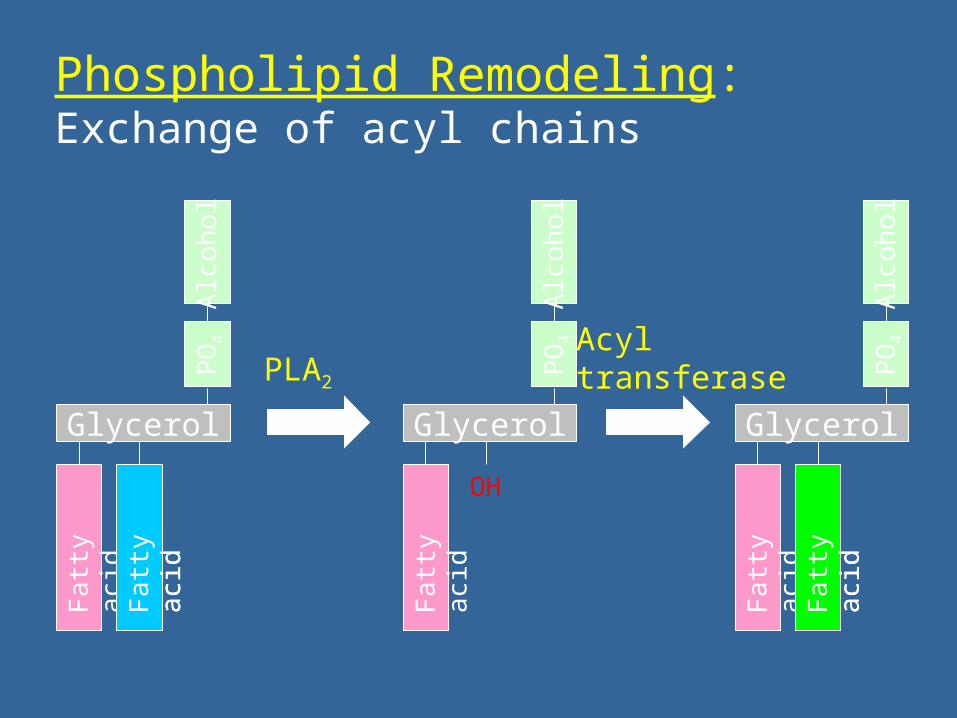
Phospholipid Remodeling: Exchange of acyl chains
Glycerol
Fa
tty a
cid
Fa
tty a
cid
Alc
oh
olP
O4
Fa
tty a
cid
Glycerol
Fa
tty a
cid
Fa
tty a
cid
Alc
oh
olP
O4
Fa
tty a
cid
PLA2
GlycerolF
atty
aci
d
Alc
oh
olP
O4
OH
Acyl transferase

Analysis of phospholipid remodeling using soluble precursor is problematic
100
100
100
100
680 700 720 740 760 780 800
100
16:0/17:1
24h
unlabeled
0h
1h
5h
16:0/18:1
18:1/18:1
18:0/18:1
16:0/16:1
Rel
ativ
e in
tens
ity (
%)
m/z
0 5 10 15 20 25
0
25
50
Rel
ativ
e ab
unda
nce
(%)
Chase time (h)
16:0/16:1 16:0/17:1 16:0/18:1 16:1/18:1 18:0/18:1 18:1/18:1 18:1/18:2 18:0/20:4 18:1/20:4 18:0/22:6
D4-ethanolamine => cells => D4-PE species
Kinetics

Our approach: Use intact exogenous phospholipids with a deuterium-labeled head-group
PROTOCOL
• Synthesize a phospholipid with a deuterium-labeled head group
• Make vesicles containing the labeled phospholipid • Incubate cells with these vesicles and β-cyclodextrin
(carrier)• Extract and analyze lipids using MS/MS scans showing
the labeled (or unlabeled) lipid only• Determine the pathways and kinetics of remodeling

100%
100%
100%
100
700 750 800 850
100%
14:0/14:0
0h
18:0/20:4
18:0/18:114:0/20:4
14:0/18:1
16:0/14:0
3h
18:1/20:4
18:1/18:1
16:0/18:1
7h
Rel
ati
ve
Inte
ns
ity
24h
Endogenous
m/z
Unnatural 14:0/14:0-PE is remodeled very rapidly
14:0/14:0-D4-PE
0 5 10 15 20 25
0
25
50
14:1/14:1 16:0/14:1 18:0/14:1 18:1/14:1 16:0/18:1 14:1/20:4 18:0/18:1 18:1/18:1 18:0/20:4 18:1/20:4
KINETICS
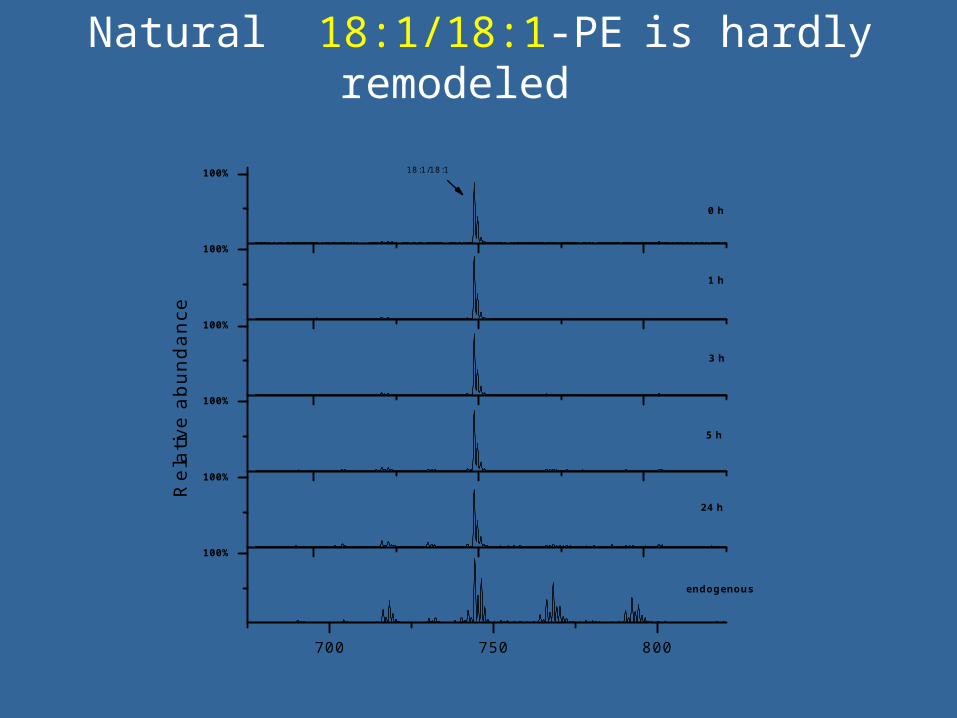
”Natural” 18:1/18:1-PE is hardly remodeled
100%
100%
100%
100%
100%
700 750 800
100%
0 h
18:1/18:1
1 h
3 h
5 h
Re
lativ
e a
bu
nd
an
ce
24 h
endogenous
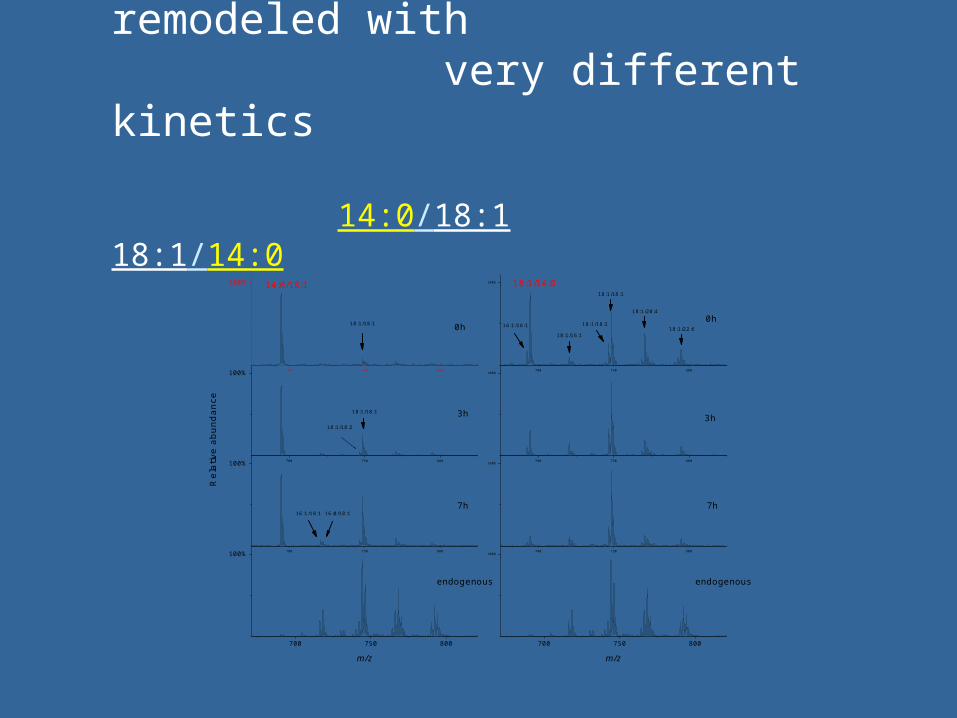
Positional isomers are remodeled with very different kinetics
14:0/18:1 18:1/14:0
700 750 800
100%
700 750 800
100%
700 750 800
100%
700 750 800
100%
700 750 800
100%
700 750 800
100%
700 750 800
100%
700 750 800
100%
0h18:1/18:1
14:0/18:1
18:1/18:1 3h18:1/18:2
16:0/18:116:1/18:17h
endogenous
Rel
ativ
e ab
unda
nce
m/z
16:1/16:10h
18:1/16:1
18:1/18:218:1/22:6
18:1/20:4
18:1/18:1
18:1/14:0
3h
7h
endogenous
m/z

Pathways of 14:0/14:0-PE remodeling
14:0/14:0
14:0/ 18:2 14:0/ 16:1 14:0/ 18:1 14:0/ 20:4 14:0/ 22:6
16:1 /18:2
16:0 /18:2 18:1 /18:2 18:1 /16:1 16:0 /18:1 16:1 /18:1 18:1 /20:4 18:1 /22:6
18:1 /18:1 18:0 /20:4
Kainu et al. (2008) J Biol Chem. 283:3676-87

Studies with >50 phospholipid species (and PLA inhibitors) indicate that
=> Multiple acyl chain specific PLAs are involved
in remodeling of phospholipids in mammalian cells
BUT which PLAs? ..and what determines their specificity?
..and which acyltransferases are involved?

Conclusions
MS-based lipidomics is highly usefull in – Biology– Medicine– Food industry
....but needs to be integrated with other “omics” and functional assays
Heavy isotope –labeling adds an important extra dimension to lipidomics

Contributors
• Martin Hermansson• Ville Kainu• Perttu Haimi
Related Documents