This article was downloaded by: [Vienna University Library] On: 14 February 2015, At: 04:09 Publisher: Taylor & Francis Informa Ltd Registered in England and Wales Registered Number: 1072954 Registered office: Mortimer House, 37-41 Mortimer Street, London W1T 3JH, UK Journal of the Chinese Advanced Materials Society Publication details, including instructions for authors and subscription information: http://www.tandfonline.com/loi/tadm20 Mass sensitive multi-sensor platform for receptor screening and quantification purposes Naseer Iqbal a b , Ghulam Mustafa a & Peter A Lieberzeit a a University of Vienna, Department of Analytical Chemistry , Vienna , Austria b Interdisciplinary Research Centre in Biomedical Materials , COMSATS Institute of Information Technology , Lahore , Pakistan Published online: 13 Sep 2013. To cite this article: Naseer Iqbal , Ghulam Mustafa & Peter A Lieberzeit (2013) Mass sensitive multi-sensor platform for receptor screening and quantification purposes, Journal of the Chinese Advanced Materials Society, 1:3, 200-209, DOI: 10.1080/22243682.2013.835119 To link to this article: http://dx.doi.org/10.1080/22243682.2013.835119 PLEASE SCROLL DOWN FOR ARTICLE Taylor & Francis makes every effort to ensure the accuracy of all the information (the “Content”) contained in the publications on our platform. However, Taylor & Francis, our agents, and our licensors make no representations or warranties whatsoever as to the accuracy, completeness, or suitability for any purpose of the Content. Any opinions and views expressed in this publication are the opinions and views of the authors, and are not the views of or endorsed by Taylor & Francis. The accuracy of the Content should not be relied upon and should be independently verified with primary sources of information. Taylor and Francis shall not be liable for any losses, actions, claims, proceedings, demands, costs, expenses, damages, and other liabilities whatsoever or howsoever caused arising directly or indirectly in connection with, in relation to or arising out of the use of the Content. This article may be used for research, teaching, and private study purposes. Any substantial or systematic reproduction, redistribution, reselling, loan, sub-licensing, systematic supply, or distribution in any form to anyone is expressly forbidden. Terms &

Welcome message from author
This document is posted to help you gain knowledge. Please leave a comment to let me know what you think about it! Share it to your friends and learn new things together.
Transcript

This article was downloaded by: [Vienna University Library]On: 14 February 2015, At: 04:09Publisher: Taylor & FrancisInforma Ltd Registered in England and Wales Registered Number: 1072954 Registeredoffice: Mortimer House, 37-41 Mortimer Street, London W1T 3JH, UK
Journal of the Chinese AdvancedMaterials SocietyPublication details, including instructions for authors andsubscription information:http://www.tandfonline.com/loi/tadm20
Mass sensitive multi-sensor platform forreceptor screening and quantificationpurposesNaseer Iqbal a b , Ghulam Mustafa a & Peter A Lieberzeit aa University of Vienna, Department of Analytical Chemistry ,Vienna , Austriab Interdisciplinary Research Centre in Biomedical Materials ,COMSATS Institute of Information Technology , Lahore , PakistanPublished online: 13 Sep 2013.
To cite this article: Naseer Iqbal , Ghulam Mustafa & Peter A Lieberzeit (2013) Mass sensitivemulti-sensor platform for receptor screening and quantification purposes, Journal of the ChineseAdvanced Materials Society, 1:3, 200-209, DOI: 10.1080/22243682.2013.835119
To link to this article: http://dx.doi.org/10.1080/22243682.2013.835119
PLEASE SCROLL DOWN FOR ARTICLE
Taylor & Francis makes every effort to ensure the accuracy of all the information (the“Content”) contained in the publications on our platform. However, Taylor & Francis,our agents, and our licensors make no representations or warranties whatsoever as tothe accuracy, completeness, or suitability for any purpose of the Content. Any opinionsand views expressed in this publication are the opinions and views of the authors,and are not the views of or endorsed by Taylor & Francis. The accuracy of the Contentshould not be relied upon and should be independently verified with primary sourcesof information. Taylor and Francis shall not be liable for any losses, actions, claims,proceedings, demands, costs, expenses, damages, and other liabilities whatsoever orhowsoever caused arising directly or indirectly in connection with, in relation to or arisingout of the use of the Content.
This article may be used for research, teaching, and private study purposes. Anysubstantial or systematic reproduction, redistribution, reselling, loan, sub-licensing,systematic supply, or distribution in any form to anyone is expressly forbidden. Terms &

Conditions of access and use can be found at http://www.tandfonline.com/page/terms-and-conditions
Dow
nloa
ded
by [
Vie
nna
Uni
vers
ity L
ibra
ry]
at 0
4:09
14
Febr
uary
201
5

Mass sensitive multi-sensor platform for receptor screening
and quantification purposes
Naseer Iqbala,b, Ghulam Mustafaa and Peter A Lieberzeita*
aUniversity of Vienna, Department of Analytical Chemistry, Vienna, Austria; bInterdisciplinaryResearch Centre in Biomedical Materials, COMSATS Institute of Information Technology,Lahore, Pakistan
(Received 19 July 2013; revised 6 August 2013; accepted 12 August 2013)
Quartz crystal microbalance (QCM) multi-sensor arrays coated with molecularlyimprinted polymers (MIP) as recognition materials have been tested for screening andquantification. For receptor screening, six-electrode QCM sensor arrays containingMIP with variable ratios of vinylpyrrolidone–styrene–divinylbenzene copolymerswere examined to identify the optimal monomer combination for chemical sensing ofethyl acetate in one measuring step. This revealed an optimum MIP that can detectvapours below 50 ppm. For quantification purposes, the QCM sensor array data wereanalysed chemometrically. Polystyrene–divinylbenzene imprinted polymers selec-tively detected volatile emissions from different herbs. The terpenes emission patternrevealed screening among isomeric terpenes with detection limits below 20 ppm.Furthermore, this strategy allows evaluating fresh and dried herbs and their levels offreshness and respective shelf lives.
Keywords: QCM sensor array; molecularly imprinted polymers; materials screening;isomer sensing
1. Introduction
Materials showing controlled and significant changes in their physicochemical properties
with respect to external stimuli can be utilized for sensing purposes.[1] During the last few
decades, fabrication of highly sensitive recognition materials with optimized selectivity for
online and real-time sensing has been a major challenge for material scientists.[2,3] Among
a variety of strategies to overcome these, molecular imprinting proved highly suitable to
generate recognition materials due to its biomimetic approach.[4] It can be employed for
sensing purposes along with various transducer systems like quartz crystal microbalance
(QCM), interdigital capacitor (IDC) etc. The QCM belongs to the group of acoustic
microsensors and is a highly interesting and effective tool in chemical sensing, for analyti-
cal purposes,[5–7] in electrochemistry,[8] biology,[9] environmental sciences,[10] life
sciences [11] and pharmaceutical sciences.[12] Furthermore, they [13,14] are widely used
for detecting gaseous vapours, e.g. with molecularly imprinted polymers (MIP).[15–18] In
addition, mass sensitive devices have been used in developing electronic noses [19–21]
also with MIP-coated arrays.[22–24] Nevertheless, the multi-sensor systems are not only
highly feasible as electronic noses, but can also be extremely helpful for screening
purposes. To demonstrate this, we propose two applications in this paper. First, parallel
one-step screening of different MIP candidates targeting a defined analyte and second for
*Corresponding author. Email: [email protected]
� 2013 Chinese Advanced Materials Society
Journal of the Chinese Advanced Materials Society, 2013
Vol. 1, No. 3, 200–209, http://dx.doi.org/10.1080/22243682.2013.835119
Dow
nloa
ded
by [
Vie
nna
Uni
vers
ity L
ibra
ry]
at 0
4:09
14
Febr
uary
201
5
screening and quantification of closely related volatile organics by recording herbs emana-
tion patterns via QCM MIP sensor arrays.
2. Materials and methods
2.1. Chemicals and reagents
All chemicals used were of highest quality and purity and purchased from Sigma-Aldrich
and Fluka Gmbh, Austria. Limonene, a-pinene, eucalyptol, b-pinene, terpinene,
estragole, ethyl acetate (EtAc), 1-propanol, diphenyl methane and the functional
monomer, 1-vinyl-2-pyrrolidone (VP) were used without further purification for prepar-
ing the respective polymers. Styrene (ST) and divinylbenzene (DVB) were extracted with
0.1 M NaOH in order to remove the stabilizer prior to polymerization; azobisisobutyroni-
trile (AIBN) was re-crystallized from methanol. The QCM sheets were processed follow-
ing an already published procedure.[22,23]
2.2. Polymer synthesis
2.2.1. EtAc imprinted polymers for MIP screening
We screened different VP, ST and DVB copolymers for their ability as artificial receptors
in mass sensitive devices by preparing materials as described in Table 1.
We first mixed the respective monomers and then added 200 mL of EtAc serving as
both template and solvent. These mixtures were degassed for 5 min in ultrasonic bath; then
2 mg initiator AIBN was added to each mixture. The mixtures were kept for 30 min at
70�C in water bath for polymerization. The resulting imprinted polymers (10 mL) werespin coated onto QCM electrodes and kept overnight for layer hardening and template
removal prior to sensing measurements for receptor screening. The complete parameters
and resulting layer heights are given in Table 1.
2.2.2. Synthesis of MIPs for terpene isomers
MIPs for selected terpenes were synthesized by mixing 30 mL ST, 70 mL DVB as cross-
linker, 2 mg AIBN radical initiator and 5 mL diphenylmethane as porogen. Then 300 mLof template was added to this mixture and polymerized for 40 min at 70�C. Finally,
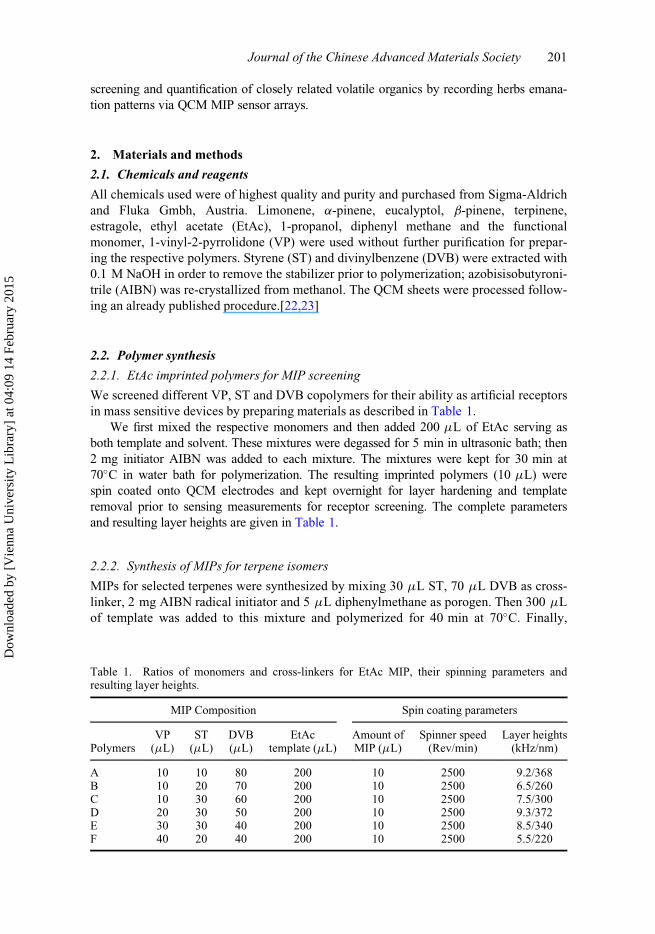
Table 1. Ratios of monomers and cross-linkers for EtAc MIP, their spinning parameters andresulting layer heights.
MIP Composition Spin coating parameters
PolymersVP(mL)
ST(mL)
DVB(mL)
EtActemplate (mL)
Amount ofMIP (mL)
Spinner speed(Rev/min)
Layer heights(kHz/nm)
A 10 10 80 200 10 2500 9.2/368B 10 20 70 200 10 2500 6.5/260C 10 30 60 200 10 2500 7.5/300D 20 30 50 200 10 2500 9.3/372E 30 30 40 200 10 2500 8.5/340F 40 20 40 200 10 2500 5.5/220
Journal of the Chinese Advanced Materials Society 201
Dow
nloa
ded
by [
Vie
nna
Uni
vers
ity L
ibra
ry]
at 0
4:09
14
Febr
uary
201
5

5 mL of each MIP was spun onto the respective gold electrodes of the array at 2000 rpm
in order to achieve 1–6 kHz thick MIP layers. Before sensing measurements, the MIP
layers were hardened overnight at room temperature so as to evaporate the template
leaving behind specifically adapted cavities to incorporate templates reversibly.
2.2.3. Device design and fabrication
Three gold electrodes each of 5 mm diameter were screen-printed on both sides of the
respective QCM substrate, and the electrode structures were burned at 400�C. Later on,the synthesized MIPs were spun individually onto both sides of each respective electrode
of QCM sheet. Two such QCM sheets were soldered to an eight-pin connector with thin
copper wires as shown in Figure 1. The ‘bottom’ electrodes on each quartz plates were
connected to a single pin, which was grounded. The ‘top’ electrodes were individually
connected to the phase side of the oscillator. Hence, the eight pins are sufficient to address
the six different sensors (one mass contact and three phase contacts per quartz plate). The
array was plugged into custom-made oscillator circuit sequentially switching between
channels to record the respective frequency readings.
2.2.4. Mass sensitive measurements with QCM
Air streams with defined contents of analyte vapours were generated by mass flow control-
ler System (Tylan-RO7020). The MIP-coated QCM sensor was exposed to various concen-
trations of EtAc and individual terpenes. Frequency-based data obtained from the sensor
for each polymer was recorded through oscillator circuit that was connected with frequency
counter HP5385A and a personal computer in order to continuously evaluate device perfor-
mance. In case of real-time analysis of fresh and dried herbs, the sensor array was exposed
to emanations of various herbs. For that purpose, 20–30 g of fresh and dried basil, sage
and rosemary, respectively, were placed in a sample vessel of volume �500 cm3 and the
sensor set-up applied as a lid.
Figure 1. A real image of MIP-coated QCM sensor array.
202 N. Iqbal et al.
Dow
nloa
ded
by [
Vie
nna
Uni
vers
ity L
ibra
ry]
at 0
4:09
14
Febr
uary
201
5

2.2.5. GC–MS analysis
Agilent 6830N gas chromatograph with Agilent J&W (DB-624) GC capillary column,
5973N mass spectrometric detector and an auto sampler from COMBI-PAL were used
for validation of herbal vapour emanations. Head space gas chromatography–mass spec-
trometry (GC–MS) analysis was carried out at regular intervals during the validation of
the QCM sensor array data for quantification of terpenes. Analytes were identified by the
software’s built-in NIST library.
3. Results and discussion
3.1. Screening optimal monomer composition for EtAc sensors
Multi-sensor arrays have already been proven seminal in electronic noses and tongues,
but mass-sensitive screening of receptor layers has not yet been performed to the best of
our knowledge. Herein, we propose such a system for determining the sensitive and
recognition abilities of different polymers towards EtAc. Figure 2 summarizes the
sensor signals obtained during layer screening: part (a) illustrates the sensitivity profile of
the MIP layers on multi-sensor array for a concentration range of 25–3000 ppm in air and
part (b) shows the real-time sensor measurement and responses at the concentration range
750–3000 ppm. Evidently, polymer B with its monomer to cross-linker ratio (VP:ST:
DVB, 1:2:7) yields the maximum sensor signal, namely up to 20 Hz frequency shift and
is the only material responding to concentrations down to 25 ppm of EtAc. Recognition
is based on non-covalent interactions between analyte and receptors. In the case of EtAc,
hydrogen bonding and Van der Waals interactions can be assumed. The overall order of
MIP sensitivity observed was B>A�C�F>E�D. First, this shows that it is possible to
find an optimized sensing material for EtAc in a single experiment. Second, it provides
information about the material properties leading to the optimal recognition in a given
system: polymers A, C and F, for instance, yield lower sensor signals than their optimized
counterparts. This is mainly due to the amount of cross-linker: 70% DVB (as used in
polymer B) is obviously optimal, because both 80% and 60% (polymers A and C, respec-
tively) lead to only half the sensor effects. In addition, the sensor responses also clearly
reveal the influence of functional monomer: the optimal amount of VP is 10%, which was
used for coating polymers A–C.
Figure 2. (a) Comparison of six MIP against different concentrations of EtAc. (b) Normalizedresponse of MIP against 750–3000 ppm of EtAc.
Journal of the Chinese Advanced Materials Society 203
Dow
nloa
ded
by [
Vie
nna
Uni
vers
ity L
ibra
ry]
at 0
4:09
14
Febr
uary
201
5

The polymers D–F containing more VP (20–40%) yield lower sensor and when com-
paring polymers D, E and F with one another; it is remarkable that the polymer F produces
higher sensor effects despite the high VP amount. However, it is also the material with the
lowest amount of cross-linker and should therefore be prone to swelling on exposition to
organic solvent vapours. Hence, the adverse effect of high VP content on the sensor effects
is compensated for by the higher mobility of the polymer chains.
For complementing the picture of the optimized material, we exposed it to different
concentrations of 1-propanol to assess selectivity. Figure 3 summarizes the results on
exposure to different concentrations of 1-propanol and EtAc. In the former case, only
very low responses (�1 Hz) can be observed. Therefore, sensitivity and selectivity in this
case go hand in hand.
3.2. QCM sensor array for screening and quantification of isomeric terpenes
A second screening application for multi-channel sensor arrays is quantification of closely
related molecules such as isomeric terpenes. In this case, the parameter tested is the template
instead of the monomer. A purely phenomenological approach of this has already been
published previously.[18] Prior to real-time measurements, the e-nose was calibrated with
a-pinene, b-pinene, limonene, eucalyptol, terpinene and estragole. Among others, this
results in the selectivity profile presented in Figure 4.
Obviously, each sensor clearly prefers its own analyte. In addition, it is noteworthy
that selectivity is caused exclusively by varying the template, because aside of that all
polymer compositions are exactly the same. Sensitivities and selectivities of the sensor
array were evaluated by principal component analysis (PCA). This showed that only the
first few principal components (PCs) contain statistically significant data. Plots of PC1
and PC2 showed grouping according to terpinene concentrations. Within the different
subgroups, estragole concentration was found to be the second major contribution to
signals. Smaller patterns in the multivariate data are attributed to the remaining terpenes,
i.e. limonene, a-pinene, b-pinene and eucalyptol (Figure 5).
Figure 3. Cross selectivity profile of VP–ST–DVB (Polymer B) MIP to 500 and 750 ppm EtAc.
204 N. Iqbal et al.
Dow
nloa
ded
by [
Vie
nna
Uni
vers
ity L
ibra
ry]
at 0
4:09
14
Febr
uary
201
5

Quantitative analysis of the data took place by artificial neural networks (ANN)
following a procedure described previously.[19] The number of neurons, optimized for
training network was 33, which gave the lowest relative error as shown in Figure 6.
3.2.1. ANN models of various herbs
The terpene emanations of real-life samples was screened by MIP-coated multi-sensor
array over several hours. Figures 7 and 8 show the sensor signals recorded for fresh and
dried basil as a model case. In the case of dried basil as depicted in Figure 7, the emana-
tion pattern of the sensor system can be confirmed by GC–MS. Despite the fact that the
maximum concentrations of any compound recorded were lower than 60 ppm, the MIP
sensor correctly reproduced all compounds, even though a-pinene, limonene and estra-
gole were present in 2–3 times higher concentration than b-pinene, eucalyptol and
Figure 4. Relative sensor signals of all six MIP layers towards their respective terpenes, signifyingselectivity.
Journal of the Chinese Advanced Materials Society 205
Dow
nloa
ded
by [
Vie
nna
Uni
vers
ity L
ibra
ry]
at 0
4:09
14
Febr
uary
201
5

Figure 5. PCA of calibration data showing score/score plots.
Figure 6. Optimized number of neurons for ANN.
206 N. Iqbal et al.
Dow
nloa
ded
by [
Vie
nna
Uni
vers
ity L
ibra
ry]
at 0
4:09
14
Febr
uary
201
5

terpinene, respectively. In general, fresh herbs (see Figure 8) showed 2–4 times higher
sensor signals than their dried counterparts (see Figure 7).
In both cases, the vapour concentrations of the analytes decreased with increasing
time. The respective upper limit for dried herbs could be observed within the first
20 hours of the measurement and 60 hours for the fresh herbs. Therefore, this screening
can provide the information about freshness and remaining shelf life of herbs. Further-
more, the system made it possible to distinguish selectively between the isomers a-pinene
and b-pinene during real-time measurement.
4. Conclusion
QCM sensor arrays can be implemented for a variety of screening approaches. For
instance, coating a six-electrode multisensor with different MIP candidates towards EtAc
allowed us to assess the functional properties of the monomers applied. A different
Figure 7. Comparison of sensor’s ANN pattern of emanated terpenes vs observed via GC–MSfrom dried basil.
Figure 8. Comparison of sensor’s ANN patterns of emanated terpenes vs observed.
Journal of the Chinese Advanced Materials Society 207
Dow
nloa
ded
by [
Vie
nna
Uni
vers
ity L
ibra
ry]
at 0
4:09
14
Febr
uary
201
5

approach was to develop a system that can be used to assess the differences of MIP
having the same monomer composition, but polymerized in the presence of different
templates. An example for the latter is imprinting with terpenes such as limonene,
a-pinene, b-pinene and terpinene. Detecting these volatile organic compounds down to
below 20 ppm during real-time measurements leads to quantifiable electronic nose sig-
nals. Such sensor arrays overcome the need of high-tech instrumentation and well-trained
staff for real time on spot analysis in food and process industry.[25] Finally, they are also
applicable for quality control screening purposes, such as in determining remaining
usable shelf lives.
Acknowledgements
Naseer Iqbal and Ghulam Mustafa are highly grateful to Higher Education of Pakistan for providingfinancial support during their research work via an overseas PhD grant.
References
[1] Villmow T, John A, P€otschke P, Heinrich G. Polymer/carbon nanotube composites for liquidsensing: selectivity against different solvents. Polymer 2012;53:2908–2918.
[2] Mustafa G, Hussain M, Iqbal N, Dickert FL, Lieberzeit PA. Quartz crystal microbalance sensorbased on affinity interactions between organic thiols and molybdenum disulfide nanoparticles.Sens Actuators B 2012;162:63–67.
[3] Kotova K, Hussain M, Mustafa G, Lieberzeit PA. MIP sensors on the way to biotech applica-tions: targeting selectivity. Sens Actuators B Forthcoming 2013, http://dx.doi.org/10.1016/j.snb.2013.03.040.
[4] Hussain M, Wackerlig J, Lieberzeit PA. Biomimetic strategies for sensing biological species.Biosensors 2013;3:89–107.
[5] King WH. Piezoelectric sorption detector. Anal Chem. 1964;36:1735–1739.[6] Sener G, Ozgur E, Yilmaz E, Uzun L, Say R, Denizli A. Quartz crystal microbalance based
nanosensor for lysozyme detection with lysozyme imprinted nanoparticles. Biosens Bioelec-tron. 2010;26:815–821.
[7] Lee SW, Takahara N, Korposh S, Yang DH, Toko K, Kunitake T. Nanoassembled thin film gassensors. III: sensitive detection of amine odors using TiO2/poly(acrylic acid) ultrathin filmquartz crystal microbalance sensors. Anal Chem. 2010;82:2228–2236.
[8] Erosoez A, Diltemiz SE, Oezcan AA, Dennizli A, Say R. 8-OHdG sensing with MIP basedsolid phase extraction and QCM technique. Sens Actuators B 2009;137:7–11.
[9] Alizadeh T, Amjadi S. Preparation of nano-sized Pb(2þ) imprinted polymer and its applicationas the chemical interface of an electrochemical sensor for toxic lead determination in differentreal samples. J Hazard Mater. 2011;190:451–459.
[10] Seidler K, Polreichova M, Lieberzeit PA, Dickert FL. Biomimetic yeast cell typing-applicationof QCMs. Sensors 2009;9:8146–8157.
[11] Yang ZP, Zhang CJ. Designing of MIP-based QCM sensor for the determination of Cu(II) ionsin solution. Sens Actuators B 2009;142:210–215.
[12] Karamolaoglu I, Oktem HA, Mutlu M. QCM-based DNA biosensor for detection of geneticallymodified organisms (GMOs). Biochem Eng J. 2009;44:142–150.
[13] Liu F, Liu X, Ng SC, Chan HSO. Enantioselective molecular imprinting polymer coated QCMfor the recognition of l-tryptophan. Sens Actuators B 2006;113:234–240.
[14] Dickert FL, Forth P, Lieberzeit P, Tortschanoff M. Molecular imprinting in chemical sensing:detection of aromatic and halogenated hydrocarbons as well as polar solvent vapors. Fresen JAnal Chem. 1998;360:759–762.
[15] Dickert FL, Hayden O. Molecular imprinting in chemical sensing. TrAC Trends Anal Chem.1999;18:192–199.
[16] Li S, Ge Y, Pilestsky SA, Turner APF. A zipper-like on/off-switchable molecularly imprintedpolymer. Adv Funct Mater. 2011;21:3344–3349.
208 N. Iqbal et al.
Dow
nloa
ded
by [
Vie
nna
Uni
vers
ity L
ibra
ry]
at 0
4:09
14
Febr
uary
201
5

[17] Piletska EV, Guerreiro ANR, Whitcombe MJ, Piletsky SA. Influence of the polymerizationconditions on the performance of molecularly imprinted polymers. Macromolecules2009;42:4921–4928.
[18] Iqbal N, Mustafa G, Rehman A, Biedermann A, Najafi B, Lieberzeit PA, Dickert FL. QCM-arrays for sensing terpenes in fresh and dried herbs via bio-mimetic MIP layers. Sensors2010;10:6361–6376.
[19] Dickert FL, Lieberzeit PA, Achatz P, Palfinger C, Fassnauer M, Schmid E, Werther W, HornerG. QCM array for on-line-monitoring of composting procedures. Analyst 2004;129:432–437.
[20] Kohl A, Binz HK, Forrer P, Stumpp MT, Pluckthun A, Grutter MG. Designed to be stable:crystal structure of a consensus ankyrin repeat protein. Proc Natl Acad Sci U.S.A.2003;100:1700–1705.
[21] Peris M Escuder-Gilabert L. A 21st century technique for food control: electronic noses. AnalChim Acta 2009;638:1–15.
[22] Rock F, Barsan N, Weimar U. Electronic nose: current status and future trends. Chem Rev.2008;108:705–725.
[23] Lieberzeit PA, Rehman A, Iqbal N, Najafi B, Dickert FL. QCM sensor array for monitoringterpene emissions from odoriferous plants. Monatsh Chem. 2009;140:947–952.
[24] Lieberzeit PA, Rehman A, Najafi B, Dickert FL. Real-life application of a QCM-based e-nose:quantitative characterization of different plant-degradation processes. Anal Bioanal Chem.2008;391:2897–2903.
[25] Rehman A, Iqbal N, Lieberzeit PA, Dickert FL. Multisensor biomimetic systems with fullyartificial recognition strategies in food analysis. Monatsh Chem. 2009;140:931–939.
Journal of the Chinese Advanced Materials Society 209
Dow
nloa
ded
by [
Vie
nna
Uni
vers
ity L
ibra
ry]
at 0
4:09
14
Febr
uary
201
5
Related Documents