NI 43-101 Technical Report Preliminary Economic Assessment and Updated Mineral Resource Estimates Mason Project Yerington, Nevada, USA Effective Date: January 1, 2021 25 York Street, Suite 800 Toronto, Ontario Canada M5J 2V5 Prepared by: Olivier Tavchandjian, P.Geo., Hudbay Minerals Inc. Revision Draft

Welcome message from author
This document is posted to help you gain knowledge. Please leave a comment to let me know what you think about it! Share it to your friends and learn new things together.
Transcript

NI 43-101 Technical Report
Preliminary Economic Assessment and
Updated Mineral Resource Estimates
Mason Project Yerington, Nevada, USA Effective Date: January 1, 2021
25 York Street, Suite 800
Toronto, Ontario
Canada M5J 2V5
Prepared by:
Olivier Tavchandjian, P.Geo., Hudbay Minerals Inc.
Revision Draft

CAUTIONARY NOTES
Cautionary Note Regarding Forward Looking Information
This technical report (this “Technical Report “) contains "forward-looking statements" and "forward-looking information" (collectively, "forward-looking information") within the meaning of applicable Canadian and United States securities legislation. All information contained in this Technical Report, other than statements of current and historical fact, is forward-looking information. Often, but not always, forward-looking information can be identified by the use of words such as “plans”, “expects”, “budget”, “guidance”, “scheduled”, “estimates”, “forecasts”, “strategy”, “target”, “intends”, “objective”, “goal”, “understands”, “anticipates” and “believes” (and variations of these or similar words) and statements that certain actions, events or results “may”, “could”, “would”, “should”, “might” “occur” or “be achieved” or “will be taken” (and variations of these or similar expressions). All of the forward-looking information in this Technical Report is qualified by this cautionary note.
Forward-looking information includes, but is not limited to, the results of the PEA, including the production, operating cost, capital cost and cash cost estimates, the projected valuation metrics and rates of return, the cash flow and EBITDA projections, as well as the anticipated permitting requirements and project design, including processing and tailings facilities, metal recoveries, mine life and production rates for the project, the potential to further enhance the economics of the project and optimize the design, the possibility of extending the life of the first production phase, the implications of the recent court decisions in respect of the standalone Rosemont project design, the potential to obtain federal permits for the second phase earlier than planned and the costs and plans for future pre-feasibility and feasibility studies on the Copper World Complex as well as potential timelines for obtaining the required permits and financing and sanctioning the first phase of the project. Forward-looking information is not, and cannot be, a guarantee of future results or events. Forward-looking information is based on, among other things, opinions, assumptions, estimates and analyses that, while considered reasonable by us at the date the forward-looking information is provided, inherently are subject to significant risks, uncertainties, contingencies and other factors that may cause actual results and events to be materially different from those expressed or implied by the forward-looking information.
The material factors or assumptions that Hudbay identified and were applied by the company in drawing conclusions or making forecasts or projections set out in the forward-looking information include, but are not limited to:
• obtaining all required permits to develop the Copper World Complex;
• no delays or disruption due to litigation challenging the permitting requirements for the Copper World Complex and no significant unanticipated litigation;
• the success of exploration and development activities at the Copper World Complex;
• the accuracy of geological, mining and metallurgical estimates;
• anticipated metals prices and the costs of production;
• the supply and demand for metals Hudbay produces;
• the supply and availability of all forms of energy and fuels at reasonable prices;
• no significant unanticipated operational or technical difficulties;
• the availability of additional financing, if needed;
• the availability of personnel for the company’s exploration, development and operational projects and ongoing employee relations;
• maintaining good relations with the communities in which the company operates, including the neighbouring communities and local governments in Arizona;
• no significant unanticipated challenges with stakeholders at the Copper World Complex;
• no significant unanticipated events or changes relating to regulatory, environmental, health and safety matters;
• no contests over title to Hudbay’s properties, including as a result of rights or claimed rights of Indigenous peoples or challenges to the validity of its unpatented mining claims;

• an upfront stream deposit of $230 million will be paid by Wheaton Precious Metals at the commencement of construction;
• no offtake commitments in respect of production from the Copper World Complex;
• certain tax matters, including, but not limited to the mining tax regime in Arizona; and
• no significant and continuing adverse changes in general economic conditions or conditions in the financial markets (including commodity prices and foreign exchange rates).
The risks, uncertainties, contingencies and other factors that may cause actual results to differ materially from those expressed or implied by the forward-looking information may include, but are not limited to, risks associated with COVID-19 and its effect on the company’s operations, financial condition, projects and prospects, risks generally associated with the mining industry, such as economic factors (including future commodity prices, currency fluctuations, energy and consumable prices, supply chain constraints and general cost escalation in the current inflationary environment), risks related to ongoing and potential litigation processes and other legal challenges that could affect the permitting timeline for the Copper World Complex, risks related to changes in government and government policy, risks related to changes in law, risks in respect of community relations, risks related to contracts that were entered into in respect of the Rosemont mine project, uncertainties related to the geology, continuity, grade and estimates of mineral reserves and resources, and the potential for variations in grade and recovery rates, as well as the risks discussed under the heading “Risk Factors” in the company’s AIF.
Should one or more risk, uncertainty, contingency or other factor materialize or should any factor or assumption prove incorrect, actual results could vary materially from those expressed or implied in the forward-looking information. Accordingly, you should not place undue reliance on forward-looking information. The company does not assume any obligation to update or revise any forward-looking information after the date of this technical report or to explain any material difference between subsequent actual events and any forward-looking information, except as required by applicable law.
Cautionary Note Regarding Preliminary Economic Assessment and NI 43-101
The scientific and technical information contained in this Technical Report has been approved by Olivier Tavchandjian,
P. Geo, Hudbay’s Vice-President, Exploration and Technical Services. Mr. Tavchandjian is a qualified person pursuant to Canadian Securities Administrators’ National Instrument 43-101 - Standards of Disclosure for Mineral Projects (“NI 43-101”).
Mineral resources that are not mineral reserves do not have demonstrated economic viability. This preliminary economic assessment (“PEA”) is preliminary in nature, includes inferred resources that are considered too speculative geologically to have the economic considerations applied to them that would enable them to be categorized as mineral reserves and there is no certainty the preliminary economic assessment will be realized.
As a result of this PEA, the 2017 Feasibility Study in respect of the standalone Rosemont project, including the estimates of mineral reserves and mineral resources contained therein, is no longer current and should not be relied upon by investors. This technical report is the current technical report in respect of all the mineral properties (including the Rosemont deposit) that form part of the Copper World Complex and shall supersede and replace the 2017 Feasibility Study.
Non-IFRS Financial Performance Measures
Cash cost and sustaining cash cost per pound of copper produced are shown because the company believes they help investors and management assess the performance of its operations, including the margin generated by the operations and the company. Unit operating costs are shown because these measures are used by the company as a key performance indicator to assess the performance of its mining and processing operations. EBITDA is shown to provide additional information about the cash generating potential in order to assess the company’s capacity to service and repay debt, carry out investments and cover working capital needs. These measures do not have a meaning prescribed by IFRS and are therefore unlikely to be comparable to similar measures presented by other issuers. These measures should not be considered in isolation or as a substitute for measures prepared in accordance with IFRS and are not necessarily indicative of operating profit or cash flow from operations as determined under IFRS. Other companies may calculate these measures differently. For further details on these measures, please refer to page 39 of Hudbay’s management’s discussion and analysis for the three months ended March 31, 2022 available on SEDAR at
www.sedar.com.

Cautionary Note to United States Investors
This Technical Report has been prepared in accordance with the requirements of the securities laws in effect in Canada, which differ from the requirements of United States securities laws. Canadian reporting requirements for disclosure of mineral properties are governed NI 43-101.
For this reason, information contained in this Technical Report in respect of the Copper World Complex may not be comparable to similar information made public by United States companies subject to the reporting and disclosure requirements under the United States federal securities laws and the rules and regulations thereunder. For further information on the differences between the disclosure requirements for mineral properties under the United States federal securities laws and NI 43-101, please refer to the company’s AIF, a copy of which has been filed under Hudbay’s profile on SEDAR at www.sedar.com and the company’s Form 40-F, a copy of which has been filed on EDGAR at www.edgar.com.
SIGNATURE PAGE
This Technical Report titled “Preliminary Economic Assessment, Copper World Complex, Pima County, Arizona, USA”, dated July 14th, 2022, and effective as of May 1st, 2022, was prepared under the supervision and signed by the following author:
Dated July 14th, 2022.
/s/ Olivier Tavchandjian Signature of Qualified Person
Olivier Tavchandjian, P. Geo. Vice President, Exploration and Technical Services Hudbay Minerals Inc.

Preliminary Economic Assessment Copper World Complex, Pima County, Arizona USA
Page ii
TABLE OF CONTENTS
1. SUMMARY .......................................................................................................................................................... 1-1
1.1 Summary ..................................................................................................................................................... 1-1 1.2 Introduction .................................................................................................................................................. 1-1 1.3 Property Description and Location............................................................................................................... 1-2 1.4 Geological Setting and Mineralization ......................................................................................................... 1-2 1.5 Deposit Types .............................................................................................................................................. 1-3 1.6 Exploration ................................................................................................................................................... 1-3 1.7 Drilling, Sample Preparation, Analytical Procedures and Data Validation ................................................... 1-3 1.8 Mineral Processing and Metallurgical Testing ............................................................................................. 1-4 1.9 Mineral Resource Estimates ........................................................................................................................ 1-5 1.10 Mineral Processing ...................................................................................................................................... 1-8 1.11 Mining Methods ......................................................................................................................................... 1-10 1.12 Project Infrastructure ................................................................................................................................. 1-16 1.13 Market Studies and Contracts ................................................................................................................... 1-17 1.14 Impact Environmental Studies, Permitting and Social or Community........................................................ 1-18
1.14.1 Environmental Studies ....................................................................................................................... 1-19 1.14.2 Project Permitting .............................................................................................................................. 1-19 1.14.3 Social and Community Requirements and Plans .............................................................................. 1-20 1.14.4 Facility Details and Monitoring ........................................................................................................... 1-20 1.14.5 Social and Environmental Benefits of the Project .............................................................................. 1-20 1.14.6 Reclamation and Closure .................................................................................................................. 1-21
1.15 Capital and Operating Costs...................................................................................................................... 1-21 1.16 Economic Analysis..................................................................................................................................... 1-23 1.17 Interpretation and Recommendations........................................................................................................ 1-24
2. INTRODUCTION AND TERMS OF REFERENCE............................................................................................ 2-26
2.1 General ...................................................................................................................................................... 2-26 2.2 Terms of References ................................................................................................................................. 2-27 2.3 Qualified Persons ...................................................................................................................................... 2-27 2.4 Site Visits and Responsibility ..................................................................................................................... 2-27 2.5 Unit Abbreviations...................................................................................................................................... 2-28 2.6 Name Abbreviations .................................................................................................................................. 2-29
3. RELIANCE ON OTHER EXPERTS................................................................................................................... 3-33
4. PROPERTY DESCRIPTION AND LOCATION ................................................................................................. 4-34
4.1 Location ..................................................................................................................................................... 4-34 4.2 Land Tenure .............................................................................................................................................. 4-35
5. ACCESSIBILITY, CLIMATE, LOCAL RESOURCES, INFRASTRUCTURE, AND PHYSIOGRAPHY ............ 5-48
5.1 Accessibility ............................................................................................................................................... 5-48 5.2 Climate....................................................................................................................................................... 5-48 5.3 Local Resources ........................................................................................................................................ 5-49 5.4 Infrastructure.............................................................................................................................................. 5-49 5.5 Physiography ............................................................................................................................................. 5-49
6. HISTORY ........................................................................................................................................................... 6-50
6.1 Helvetia-Rosemont Mining District (1875-1973) ........................................................................................ 6-50 6.2 Anamax Mining Company (1973-1985) ..................................................................................................... 6-51 6.3 Asarco, Inc (1988-2004) ............................................................................................................................ 6-51 6.4 Augusta Resource Corporation (2005-2014) ............................................................................................. 6-52 6.5 Hudbay (2014-Present) ............................................................................................................................. 6-52
7. GEOLOGICAL SETTING AND MINERALIZATION ......................................................................................... 7-54
7.1 Regional Geology ...................................................................................................................................... 7-54 7.2 District Geology ......................................................................................................................................... 7-54 7.3 Deposit Geology ........................................................................................................................................ 7-55 7.4 Alteration.................................................................................................................................................... 7-57 7.5 Structural Domains .................................................................................................................................... 7-57

Preliminary Economic Assessment Copper World Complex, Pima County, Arizona USA
Page iii
7.6 Mineralization............................................................................................................................................. 7-59 7.6.1 East Deposit ...................................................................................................................................... 7-59 7.6.2 Bolsa .................................................................................................................................................. 7-60 7.6.3 Broadtop Butte ................................................................................................................................... 7-60 7.6.4 West Deposit ..................................................................................................................................... 7-60 7.6.5 Peach-Elgin ....................................................................................................................................... 7-60
8. DEPOSIT TYPE................................................................................................................................................. 8-61
9. EXPLORATION ................................................................................................................................................. 9-62
9.1 Previous Work ........................................................................................................................................... 9-62 9.2 Exploration Potential Between Known Deposits ........................................................................................ 9-62 9.3 Additional Regional Potential on Hudbay Tenements ............................................................................... 9-62
10. DRILLING ........................................................................................................................................................ 10-63
10.1 Introduction .............................................................................................................................................. 10-63 10.2 lewisohn and Banner Mining Company (1953 to 1963) ........................................................................... 10-64 10.3 The Anaconda Mining Co., (1963 to 1986) .............................................................................................. 10-65 10.4 ASARCO Mining Co., (1988 to 2004) ...................................................................................................... 10-65 10.5 Augusta Resource (2005 to 2012) ........................................................................................................... 10-65 10.6 Hudbay (2014 to 2015) ............................................................................................................................ 10-65 10.7 Hudbay (2020 to 2021) ............................................................................................................................ 10-66 10.8 Drilling Method and Survey...................................................................................................................... 10-66
11. SAMPLE PREPARATION, ANALYSES AND SECURITY ............................................................................. 11-68
11.1 Summary of Earlier Work (1956 To 2016) ............................................................................................... 11-68 11.1.1 Core Logging, Documentation and Security .................................................................................... 11-68 11.1.2 Preparation Methods ....................................................................................................................... 11-69 11.1.3 Assay Methologies........................................................................................................................... 11-70 11.1.4 Density Measurements .................................................................................................................... 11-70 11.1.5 Conclusion on the Historical Data.................................................................................................... 11-71
11.2 Summary of 2020 & 2021 Work............................................................................................................... 11-71 11.2.1 Core Logging ................................................................................................................................... 11-71 11.2.2 Sample Selection ............................................................................................................................. 11-71 11.2.3 Core Photographs............................................................................................................................ 11-72 11.2.4 Core Cutting..................................................................................................................................... 11-72 11.2.5 Sample Dispatching ......................................................................................................................... 11-72 11.2.6 Sample Preparation ......................................................................................................................... 11-72 11.2.7 Density Measurements .................................................................................................................... 11-73 11.2.8 Assay Methodology ......................................................................................................................... 11-74 11.2.9 Quality Assurance and Quality Control Programs ........................................................................... 11-76 11.2.10 External Checks............................................................................................................................... 11-82 11.2.11 Conclusion ....................................................................................................................................... 11-83
12. DATA VERIFICATION .................................................................................................................................... 12-84
12.1 Summary of Earlier Work (1956 to 2017) ................................................................................................ 12-84 12.2 Drill Collar and Drill Pad Setup ................................................................................................................ 12-84 12.3 Collar Survey ........................................................................................................................................... 12-84 12.4 Downhole Survey Method........................................................................................................................ 12-85 12.5 Procedures For Geologists And Technicians .......................................................................................... 12-85 12.6 Inspection Of Labratories By Hudbay Personnel ..................................................................................... 12-85 12.7 Drill Hole Database .................................................................................................................................. 12-85 12.8 Data Security ........................................................................................................................................... 12-85 12.9 Assay Results Verification ....................................................................................................................... 12-85 12.10 Site Visits ................................................................................................................................................. 12-86 12.11 Conclusion ............................................................................................................................................... 12-86
13. MINERAL PROCESSING AND METALLURGICAL TESTING ...................................................................... 13-87
13.1 Historical Work......................................................................................................................................... 13-87 13.2 Hudbay’s Metallurgical Testing Programs ............................................................................................... 13-87
13.2.1 Samples and Representativity ......................................................................................................... 13-87 13.3 Mineralogy ............................................................................................................................................... 13-87
Preliminary Economic Assessment Copper World Complex, Pima County, Arizona USA
Page iv
13.4 Comminution............................................................................................................................................ 13-89 13.5 Leaching .................................................................................................................................................. 13-90
13.5.1 Leach Recovery and Acid Consumption Estimates ......................................................................... 13-90 13.6 Flotation ................................................................................................................................................... 13-91
13.6.1 Copper-Molybdenum Separation ..................................................................................................... 13-93 13.6.2 Concentrate quality .......................................................................................................................... 13-93 13.6.3 Flotation Recovery Estimates .......................................................................................................... 13-93
13.7 Concentrate Leaching.............................................................................................................................. 13-95 13.8 Precious Metals Recovery ....................................................................................................................... 13-95 13.9 Tailings Dewatering ................................................................................................................................. 13-95 13.10 Conclusions and Recommendations ....................................................................................................... 13-95
14. MINERAL RESOURCES ESTIMATES ........................................................................................................... 14-97
14.1 Drilling Database ..................................................................................................................................... 14-97 14.2 Modeling of the Mineralized Envelopes ................................................................................................... 14-97 14.3 Density for East deposit ......................................................................................................................... 14-102 14.4 Density for the Copper World deposits .................................................................................................. 14-104 14.5 Compositing ........................................................................................................................................... 14-106 14.6 Exploratory Data Analysis...................................................................................................................... 14-106 14.7 Grade Capping ...................................................................................................................................... 14-106 14.8 Variography ........................................................................................................................................... 14-107 14.9 Grade Estimation and Interpolation Methods ........................................................................................ 14-109 14.10 Grade Estimation Validation .................................................................................................................. 14-110 14.11 Visual Inspection.................................................................................................................................... 14-110 14.12 Global Bias Checks ............................................................................................................................... 14-113 14.13 Smoothing Assessment ......................................................................................................................... 14-116 14.14 Smoothing Correction ............................................................................................................................ 14-116 14.15 Classification of Mineral Resource ........................................................................................................ 14-118 14.16 Reasonable Prospects of Economics Extraction and Mineral Resource Estimates .............................. 14-119 14.17 Conclusion ............................................................................................................................................. 14-120 14.18 Recommendations ................................................................................................................................. 14-120
15. MINERAL RESERVES .................................................................................................................................. 15-121
16. MINING METHODS ....................................................................................................................................... 16-122
16.1 Mine Overview ....................................................................................................................................... 16-122 16.2 Pit Optimization...................................................................................................................................... 16-124 16.3 Economic Parameters ........................................................................................................................... 16-125 16.4 Pit Slope Guidance ................................................................................................................................ 16-125 16.5 Lerchs-Grossmann (LG) Analysis.......................................................................................................... 16-127 16.6 Mine Phases .......................................................................................................................................... 16-128
16.6.1 Design Criteria ............................................................................................................................... 16-128 16.6.2 Mine Phases and Ultimate Pit........................................................................................................ 16-128
16.7 Mine Schedule and Production Plan...................................................................................................... 16-132 16.7.1 Production Scheduling Criteria ...................................................................................................... 16-132 16.7.2 Mill Feed – Rom Leach and Cut-Off Grade Strategy ..................................................................... 16-133 16.7.3 Mine Plan ....................................................................................................................................... 16-135
16.8 Mine Facilities ........................................................................................................................................ 16-145 16.8.1 WRF and TSF ................................................................................................................................ 16-145
16.9 Mine Equipment ..................................................................................................................................... 16-145 16.9.1 Large Equipment Operating Parameter ......................................................................................... 16-145 16.9.2 Mine Equipment Calculation .......................................................................................................... 16-146
16.10 Mine Operations .................................................................................................................................... 16-147 16.10.1 Drilling And Blasting....................................................................................................................... 16-147 16.10.2 Slope Monitoring ............................................................................................................................ 16-148 16.10.3 Loading .......................................................................................................................................... 16-148 16.10.4 Hauling........................................................................................................................................... 16-148 16.10.5 Support Equipment ........................................................................................................................ 16-148
17. MINERAL PROCESSING AND METALLURGICAL TESTING .................................................................... 17-150
17.1 Introduction ............................................................................................................................................ 17-150 17.2 Process Description ............................................................................................................................... 17-150

Preliminary Economic Assessment Copper World Complex, Pima County, Arizona USA
Page v
17.3 Crushing ................................................................................................................................................ 17-152 17.4 Grinding ................................................................................................................................................. 17-153 17.5 Flotation ................................................................................................................................................. 17-153
17.5.1 Bulk Rougher/Scavenger ............................................................................................................... 17-153 17.5.2 Bulk Cleaners ................................................................................................................................ 17-153 17.5.3 Cu-Mo Separation.......................................................................................................................... 17-154 17.5.4 Concentrate Dewatering ................................................................................................................ 17-154
17.6 Concentrate Treatment .......................................................................................................................... 17-155 17.6.1 Sulfide Leach ................................................................................................................................. 17-155 17.6.2 Sulfur Recovery ............................................................................................................................. 17-155 17.6.3 Iron Control .................................................................................................................................... 17-155 17.6.4 Precious Metals Recovery ............................................................................................................. 17-155
17.7 Acid Plant............................................................................................................................................... 17-156 17.8 Heap Leach ........................................................................................................................................... 17-156 17.9 Solvent Extraction and Electrowinning .................................................................................................. 17-156 17.10 Tailings .................................................................................................................................................. 17-157 17.11 Reagents and Consumables ................................................................................................................. 17-157
17.11.1 Collector – SIBX ............................................................................................................................ 17-157 17.11.2 Collector – Fuel Oil ........................................................................................................................ 17-157 17.11.3 Frother – MIBC .............................................................................................................................. 17-157 17.11.4 Flocculant – Magnafloc 10 ............................................................................................................. 17-157 17.11.5 Depressant – NaHS ....................................................................................................................... 17-158
17.12 Plant Services ........................................................................................................................................ 17-158 17.13 Process Control Strategy ....................................................................................................................... 17-158
18. PROJECT INFRASTRUCTURE.................................................................................................................... 18-159
18.1 Access Roads, Plant Roads and Haul Roads ....................................................................................... 18-159 18.2 Processing Complex .............................................................................................................................. 18-159 18.3 Power Supply and Distribution............................................................................................................... 18-159 18.4 Water Supply and Distribution ............................................................................................................... 18-159 18.5 Communications .................................................................................................................................... 18-160 18.6 Tailings Storage Facility......................................................................................................................... 18-160
18.6.1 Tailings Storage Facility Designs................................................................................................... 18-160 18.6.2 Stability Analysis ............................................................................................................................ 18-161
18.7 Leach Facility ......................................................................................................................................... 18-162 18.8 Waste Rock Facility ............................................................................................................................... 18-162 18.9 Site Water Management ........................................................................................................................ 18-163
18.9.1 Stormwater Management Facilities ............................................................................................... 18-163 18.9.2 Tailings Storage Water Management ............................................................................................ 18-163 18.9.3 Leach Water Management ............................................................................................................ 18-163 18.9.4 Waste Rock Water Management ................................................................................................... 18-163
18.10 Mine Infrastructures ............................................................................................................................... 18-164
19. MARKETING ................................................................................................................................................. 19-165
19.1 Copper Metal ......................................................................................................................................... 19-165 19.2 Copper Concentrate .............................................................................................................................. 19-166 19.3 Molybdenum .......................................................................................................................................... 19-166 19.4 Sulfur ..................................................................................................................................................... 19-167 19.5 Sulfuric Acid ........................................................................................................................................... 19-167 19.6 Doré ....................................................................................................................................................... 19-167 19.7 marketing assumptions used in the economic model ............................................................................ 19-168
20. ENVIRONMENTAL STUDIES, PERMITTING AND SOCIAL OR COMMUNITY IMPACT ........................... 20-170
20.1 Environmental Studies ........................................................................................................................... 20-170 20.1.1 Biological ....................................................................................................................................... 20-170 20.1.2 Cultural .......................................................................................................................................... 20-171 20.1.3 Geochemical .................................................................................................................................. 20-171 20.1.4 Groundwater .................................................................................................................................. 20-171 20.1.5 Surface Water ................................................................................................................................ 20-171
20.2 Project Permitting .................................................................................................................................. 20-172 20.2.1 Phase I Permitting ......................................................................................................................... 20-172 20.2.2 Phase II Permitting ........................................................................................................................ 20-173
Preliminary Economic Assessment Copper World Complex, Pima County, Arizona USA
Page vi
20.3 Social and Community Requirements and Plans .................................................................................. 20-175 20.4 Facility Details and Monitoring ............................................................................................................... 20-175
20.4.1 Waste Rock Facility ....................................................................................................................... 20-175 20.4.2 Tailings Storage Facility................................................................................................................. 20-175 20.4.3 Heap Leach Facility ....................................................................................................................... 20-176 20.4.4 Open Pits ....................................................................................................................................... 20-176 20.4.5 Process Plant................................................................................................................................. 20-177 20.4.6 Site Monitoring ............................................................................................................................... 20-177
20.5 Social and Environmental Benefits of the Project .................................................................................. 20-178 20.6 Reclamation and Closure ...................................................................................................................... 20-179
20.6.1 Reclamation and Closure Concepts .............................................................................................. 20-179 20.6.2 Closure Costs ................................................................................................................................ 20-180 20.6.3 Financial Assurance ...................................................................................................................... 20-180
21. CAPITAL AND OPERATING COSTS........................................................................................................... 21-181
21.1 Growth Capital costs.............................................................................................................................. 21-181 21.1.1 EPCM Growth Capital costs .......................................................................................................... 21-181 21.1.2 Owner’s Growth Capital Costs....................................................................................................... 21-183
21.2 Sustaining Capital costs ........................................................................................................................ 21-183 21.3 Operating costs...................................................................................................................................... 21-184
22. ECONOMIC ANALYSIS ................................................................................................................................ 22-186
22.1 Summary of Results .............................................................................................................................. 22-186 22.2 Sensitivity Analysis ................................................................................................................................ 22-187 22.3 Key Model Assumptions ........................................................................................................................ 22-188
22.3.1 Valuation Approach ....................................................................................................................... 22-188 22.3.2 Processing & Purchased Concentrate ........................................................................................... 22-188 22.3.3 Metal Price and Other Marketing Assumptions ............................................................................. 22-189 22.3.4 Royalty ........................................................................................................................................... 22-189 22.3.5 Stream ........................................................................................................................................... 22-189 22.3.6 Federal and State Taxes ............................................................................................................... 22-189 22.3.7 Working Capital Changes .............................................................................................................. 22-191
22.4 Production Profile and Cost of Production ............................................................................................. 22-191 22.5 Details of the Economic Model and Cash Flow Profile .......................................................................... 22-192
23. ADJACENT PROPERTIES ........................................................................................................................... 23-198
24. OTHER RELEVANT DATA AND INFORMATION........................................................................................ 24-199
25. INTERPRETATION AND CONCLUSIONS ................................................................................................... 25-200
25.1 Recent History of the Project ................................................................................................................. 25-200 25.2 Open Pit Mining ..................................................................................................................................... 25-200 25.3 Metallurgy and Process ......................................................................................................................... 25-200 25.4 Environmental Studies, Permitting and Social or Community Impact.................................................... 25-201 25.5 Economic Analysis................................................................................................................................. 25-202 25.6 Risks and Uncertainties ......................................................................................................................... 25-202
26. RECOMMENDATIONS ................................................................................................................................. 26-203
26.1 Drilling and Resource Modeling Updates .............................................................................................. 26-203 26.2 Pre-Feasibility Engineering Work .......................................................................................................... 26-203
26.2.1 Geotechnical Investigation and Design ......................................................................................... 26-203 26.2.2 Hydrogeology Investigation and Study; Groundwater Model and Pit Dewatering ......................... 26-204 26.2.3 Geochemical Impact Assessment ................................................................................................. 26-204 26.2.4 Mining ............................................................................................................................................ 26-204 26.2.5 Metallurgy and Processing ............................................................................................................ 26-205 26.2.6 Infrastructure and Site Layout........................................................................................................ 26-205 26.2.7 Waste and Water Management ..................................................................................................... 26-206 26.2.8 Environmental ................................................................................................................................ 26-206
27. REFERENCES .............................................................................................................................................. 27-207
Preliminary Economic Assessment Copper World Complex, Pima County, Arizona USA
Page vii
LIST OF FIGURES Figure 1-1: Project Property Location .......................................................................................................................... 1-2 Figure 1-2: Simplified Flowsheet of the Processing Complex ..................................................................................... 1-8 Figure 1-3: Plan View of Open Pits: Phase I and II ................................................................................................... 1-10 Figure 1-4: Mine Production from the Copper World Complex Deposits Over the Life of the Mine .......................... 1-16 Figure 1-5: Reduction in Energy Consumption and Emissions Resulting from the Flowsheet of the Project............ 1-21 Figure 4-1: project Property Ownership ..................................................................................................................... 4-34 Figure 5-1: Project Property Location ........................................................................................................................ 5-48 Figure 6-1: Location of Historical Mines in the Helvetia-Rosemont Mining District ................................................... 6-50 Figure 7-1: Laramide Belt and Associated Porphyry Copper Mineralization (Barra Et Al., 2005) ............................. 7-54 Figure 7-2: Project Regional Geology........................................................................................................................ 7-55 Figure 7-3: East Deposit Geologic – 11,555,050 Vertical Selection .......................................................................... 7-56 Figure 7-4: Peach Elgin Deposit Geologic – 11.565,200 Vertical Section ................................................................. 7-56 Figure 7-5: Broadtop Butte Deposit Geologic – 11,565,200 Vertical Section ............................................................ 7-57 Figure 7-6: Project Deposit Geolocal Model Structural Domains Plan View ............................................................. 7-58 Figure 7-7: East Deposit Geological Model Structural Domains 3d View (Looking North) ........................................ 7-59 Figure 10-1: Drill Hole Locations By Company ........................................................................................................ 10-64 Figure 13-1: Comparison Of XPS and KCA Flotation Variability Testing – Copper Recovery vs. Acid Soluble
Copper/Total Copper ....................................................................................................................................... 13-92 Figure 13-2: Comparison Of XPS and KCA Flotation Variability Testing – Mass Recovery vs. Acid Soluble
Copper/Total Copper ....................................................................................................................................... 13-93 Figure 14-1: General View of the 0.1% Cu grade shells.......................................................................................... 14-99 Figure 14-2: Cross Section of the Mineralized Domains at the East deposit......................................................... 14-100 Figure 14-3: Peach & Elgin Mineralized Envelopes............................................................................................... 14-100 Figure 14-4: West deposit Mineralized Envelope .................................................................................................. 14-101 Figure 14-5: Broadtop Butte Mineralized Envelope ............................................................................................... 14-101 Figure 14-6: Bolsa Mineralized Envelopes ............................................................................................................ 14-102 Figure 14-7: East deposit Main Typical Cross Section (Looking North) With Geological Units ............................. 14-103 Figure 14-8: Density Measurements – SGS vs Bureau Veritas............................................................................. 14-104 Figure 14-9: Density Measurement vs Core Box Weight....................................................................................... 14-105 Figure 14-10: EW Cross Section of the East Deposit Showing the OK Model and Composites Copper Grades . 14-111 Figure 14-11: EW Cross Section of the Peach & Elgin Deposit Showing OK Model and Composites Copper Grades
....................................................................................................................................................................... 14-111 Figure 14-12: EW Cross Section of the West Deposit Showing OK Model and Composites Copper Grades ..... 14-112 Figure 14-13: EW Cross Section of the Broadtop Butte Deposit Showing OK Model and Composites Copper Grades
....................................................................................................................................................................... 14-112 Figure 14-14: EW Cross Section of the Bolsa Deposit Showing OK Model and Composites Copper Grades...... 14-113 Figure 14-15: Resource classification at the Copper World Complex deposits ..................................................... 14-119 Figure 16-1: Project Mine Plan Site Layout at the end of Phase I ......................................................................... 16-123 Figure 16-2: Project Mine Plan Site Layout at the end of Phase II ........................................................................ 16-124 Figure 16-3: Plan View Of Geotechnical Sectors East Pit ..................................................................................... 16-127 Figure 16-4: Project Pit Shell Sensitivity Analysis By Revenue Factor.................................................................. 16-128 Figure 16-5: Plan View of the Project, Mine Phases ............................................................................................. 16-129 Figure 16-6: AA’ Section of East Pit, Mine Phases................................................................................................ 16-130 Figure 16-7: BB’ Section of Broadtop Butte, Mine Phases .................................................................................... 16-130 Figure 16-8: CC’ Section of West Pit, Mine Phases .............................................................................................. 16-131 Figure 16-9: DD’ Section of Peach Elgin, Mine Phases ........................................................................................ 16-131 Figure 16-10: Annual Mine Plan Movement .......................................................................................................... 16-134 Figure 16-11: Plant Feed Mill Tonnages by Year .................................................................................................. 16-134 Figure 16-12: Plant Feed Rom Leach Tonnages by Year ..................................................................................... 16-135 Figure 16-13: Mine Production from the Copper World complex Deposits Over the Life of the Mine ................... 16-140 Figure 16-14: Mine Plan of Period Year 01 ........................................................................................................... 16-141 Figure 16-15: Mine Plan of Period Year 02 ........................................................................................................... 16-141 Figure 16-16: Mine Plan of Period Year 05 ........................................................................................................... 16-142 Figure 16-17: Mine Plan of Period Year 10 ........................................................................................................... 16-142 Figure 16-18: Mine Plan of Period Year 16 – End of Phase I ................................................................................ 16-143 Figure 16-19: Mine Plan of Period Year 21 ........................................................................................................... 16-143 Figure 16-20: Mine Plan of Period Year 31 ........................................................................................................... 16-144 Figure 16-21: Mine Plan Final Configuration (Year 44) ......................................................................................... 16-144 Figure 16-22: Waste and Tailing Loading Plan...................................................................................................... 16-145 Figure 16-23: Mine Equipment Requirements (Million Tons) ................................................................................ 16-146

Preliminary Economic Assessment Copper World Complex, Pima County, Arizona USA
Page viii
Figure 16-24: Haulage Fleet Per Year ................................................................................................................... 16-147 Figure 17-1 Process Flow Diagram ....................................................................................................................... 17-150 Figure 18-1: General Plant Site Arrangement ....................................................................................................... 18-159 Figure 18-2: Infrastructure Arrangements.............................................................................................................. 18-160 Figure 19-1: Global copper market fundamentals ................................................................................................. 19-165 Figure 19-2: future copper demand ...................................................................................................................... 19-166 Figure 20-1: Reduction in Energy Consumption and Greenhouse Gas Emissions Resulting from the Sulfide and
Oxide Leaching .............................................................................................................................................. 20-178 Figure 22-1: Key Valuation Metrics Copper Price Sensitivity ................................................................................ 22-187 Figure 22-2: Sensitivity to Phase I Growth Capex by 5% Increments ................................................................... 22-187 Figure 22-3: Sensitivity to Discount Rate............................................................................................................... 22-188 Figure 22-4: Sensitivity Delays in Start of Construction......................................................................................... 22-188 Figure 22-5: Phase I Production Profile and Cost of Production ........................................................................... 22-192 Figure 22-6: Phase II Production Profile and Cost of Production .......................................................................... 22-192 Figure 22-7: Phase I Cash Flow Profile ................................................................................................................. 22-193 Figure 22-8: Phase II Cash Flow Profile ................................................................................................................ 22-193

Preliminary Economic Assessment Copper World Complex, Pima County, Arizona USA
Page ix
LIST OF TABLES Table 1-1: Drillhole Summary ...................................................................................................................................... 1-4 Table 1-2: Equations to Forecast Copper Recovery by Deposit.................................................................................. 1-5 Table 1-3: Mineral Resource Statement ...................................................................................................................... 1-7 Table 1-4: Comparison of the 2017 and 2022 Mineral Resource Estimates ............................................................... 1-7 Table 1-5: Summary of Process Design Criteria – Sulfide Mill .................................................................................... 1-9 Table 1-6: Summary of Process Design Criteria – Oxide Leach ................................................................................. 1-9 Table 1-7: Phase I Mine Plan (Imperial Units) ........................................................................................................... 1-12 Table 1-8: Phase I Mine Plan (Metric Units) .............................................................................................................. 1-13 Table 1-9: Phase II and Total Life of Mine Plan (Imperial Units) ............................................................................... 1-14 Table 1-10: Phase II and Total Life of Mine Plan (Metric Units) ................................................................................ 1-15 Table 1-11: Mine Equipment Fleet by Year ............................................................................................................... 1-16 Table 1-12: Commodity Price Assumptions............................................................................................................... 1-18 Table 1-13: Project Capital EPCM Costs Summary .................................................................................................. 1-22 Table 1-14: Project Capital Owner’s Costs Summary ............................................................................................... 1-22 Table 1-15: Project Sustaining Capital Costs Summary ............................................................................................ 1-22 Table 1-16: Unit Operating Cost Summary................................................................................................................ 1-23 Table 1-17: Cash Cost Summary .............................................................................................................................. 1-23 Table 1-18: Key Metrics of the Financial Analysis ..................................................................................................... 1-24 Table 2-1: Dates of Recent Site Visits ....................................................................................................................... 2-27 Table 2-2: Unit Abbreviations .................................................................................................................................... 2-28 Table 2-3: Name Abbreviations ................................................................................................................................. 2-29 Table 3-1: Responsible Person for Each Section of this Report ............................................................................... 3-33 Table 4-1: patented mining claims Description & Location ........................................................................................ 4-35 Table 4-2: unpatented mining claims description and location .................................................................................. 4-38 Table 4-3: fee owned properties description and location ......................................................................................... 4-44 Table 4-4: fee owned and leased properties description and location ...................................................................... 4-46 Table 6-1: Historical Helvetia-Rosemont District Productions 1875-1969 (After Briggs, 2020) ................................ 6-51 Table 6-2: Historical Mineral Resource estimates (Augusta 2012)............................................................................ 6-52 Table 6-3: Historical Mineral Reserve and Mineral Resource Estimate for the stand-alone Rosemont Project ........ 6-53 Table 10-1: Drillhole database for the project .......................................................................................................... 10-63 Table 11-1: Summary of the Core Logging, Documentation and Security Before 2017 .......................................... 11-68 Table 11-2: Summary of the Sample Preparation Before 2017 ............................................................................... 11-69 Table 11-3: Summary of the Assaying Before 2017 ................................................................................................ 11-70 Table 11-4: Density Measurements Before 2017 .................................................................................................... 11-71 Table 11-5: Sample Preparation .............................................................................................................................. 11-73 Table 11-6: Density Measurements ......................................................................................................................... 11-73 Table 11-7: Summary of Analytical Packages (2020-2021 drilling) ......................................................................... 11-75 Table 11-8: Summary of Detection Limits (2020-2021 drilling)................................................................................ 11-76 Table 11-9: Blanks & CRMS Expected Values (2020-2021 drilling) ........................................................................ 11-77 Table 11-10: Blanks QAQC Results Summary (2020-2021 drilling) ........................................................................ 11-79 Table 11-11: CRM QAQC Results Summary (2020-2021 drilling) .......................................................................... 11-80 Table 11-12: Coarse Duplicates QAQC Results Summary (2020-2021 drilling) ..................................................... 11-81 Table 11-13: External Check Assays Results Summary (2020-2021 drilling) ......................................................... 11-82 Table 12-1: Summary of Verification ....................................................................................................................... 12-84 Table 13-1: QEMSCAN and TIMA Modal Abundance of East deposit, Broadtop Butte, Peach and Elgin Composite
Samples ........................................................................................................................................................... 13-88 Table 13-2: Copper Deportment by Mineral Species in East deposit, Broadtop Butte, Peach and Elgin Composite
Samples ........................................................................................................................................................... 13-89 Table 13-3: Comminution Data Across All Deposits ................................................................................................ 13-89 Table 13-4: Summary of Column Leach Test Results Reported by MSRDI (2007). ............................................... 13-90 Table 13-5: Summary of Modelled KCA Column Leach Test Results ..................................................................... 13-90 Table 13-6: Summary of Rougher Flotation Kinetic Parameters ............................................................................. 13-92 Table 13-7: Equations to Forecast Copper Recovery by Deposit .......................................................................... 13-94 Table 13-8: Silver Recovery by Deposit .................................................................................................................. 13-94 Table 14-1: Drillhole Summary ................................................................................................................................ 14-97 Table 14-2: Drillhole summary per deposit .............................................................................................................. 14-97 Table 14-3: Mineralized Envelopes Code Equivalency ........................................................................................... 14-98 Table 14-4: Regression Models Formulas and Statistics ...................................................................................... 14-103 Table 14-5: Summary Statistics of Core Box Weight Measurements for the Copper World Deposits ................. 14-106 Table 14-6: Capping Thresholds ........................................................................................................................... 14-107

Preliminary Economic Assessment Copper World Complex, Pima County, Arizona USA
Page x
Table 14-7: East Deposit Variogram Parameters .................................................................................................. 14-108 Table 14-8: Copper World Deposits Variogram Parameters ................................................................................. 14-109 Table 14-9: Search Ellipse Parameters ................................................................................................................. 14-110 Table 14-10: Global Statistics of East Deposit ...................................................................................................... 14-114 Table 14-11: Global Statistics of the Copper World Deposits................................................................................ 14-115 Table 14-12: Summary Of Smoothing Correction For East Deposit ...................................................................... 14-117 Table 14-13: Summary Of Smoothing Correction for The Copper World Deposits ............................................... 14-118 Table 14-14: Resource Classification Proportion Pre & Post Processing ............................................................. 14-119 Table 14-15 Copper World Complex mineral resource estimates ......................................................................... 14-119 Table 16-1: Lerchs-Grossman Economic Parameters........................................................................................... 16-125 Table 16-2: Pit Slope Design Phase I East Deposit .............................................................................................. 16-126 Table 16-3: Pit Slope Design Phase II East Deposit ............................................................................................. 16-126 Table 16-4: Pit Design Parameters........................................................................................................................ 16-128 Table 16-5: Mining Production by Mine Phases – Phase I .................................................................................... 16-132 Table 16-6: Mining Production by Mine Phases – Phase II ................................................................................... 16-132 Table 16-7: Mine Production Schedule Criteria ..................................................................................................... 16-133 Table 16-8: Phase I Mine Plan (Imperial Units) ..................................................................................................... 16-136 Table 16-9: Phase I Mine Plan (Metric Units) ........................................................................................................ 16-137 Table 16-10: Phase II and Total Life of Mine Plan (Imperial Units) ....................................................................... 16-138 Table 16-11: Phase II and Total Life of Mine Plan (Metric Units) .......................................................................... 16-139 Table 16-12: WRF Design Criteria......................................................................................................................... 16-145 Table 16-13: Mine Equipment Fleet by Year ......................................................................................................... 16-147 Table 17-1: Summary of Process Design Criteria – Sulfide Mill ............................................................................ 17-151 Table 17-2: Summary of Process Design Criteria – Oxide Leach ......................................................................... 17-151 Table 17-3: Summary of Process Design Criteria – Concentrate Treatment ........................................................ 17-152 Table 17-4: Summary of Process Design Criteria – Precious Metals Plant........................................................... 17-152 Table 17-5: Summary of Process Design Criteria – Acid Plant ............................................................................. 17-152 Table 19-1: Price Deck Summary .......................................................................................................................... 19-168 Table 19-2: Other Marketing Assumptions ............................................................................................................ 19-169 Table 20-1: Phase I Permit and Status .................................................................................................................. 20-172 Table 21-1: Project Capital EPCM Costs Summary .............................................................................................. 21-181 Table 21-2: Basis for EPCM Capital Costs Estimates ........................................................................................... 21-182 Table 21-3: Project Capital Owner’s Costs Summary ........................................................................................... 21-183 Table 21-4: Project Sustaining Capital Costs Summary ........................................................................................ 21-184 Table 21-5: unit Operating Cost Summary ............................................................................................................ 21-184 Table 21-6: Cash Cost Summary .......................................................................................................................... 21-184 Table 21-7: Operating Mining Cost ........................................................................................................................ 21-185 Table 21-8: Operating Processing Cost................................................................................................................. 21-185 Table 22-1: Key Metrics of the Financial Analysis ................................................................................................. 22-186 Table 22-2: Income Tax Depreciation Rates ......................................................................................................... 22-190 Table 22-3: Other Tax Assumptions ...................................................................................................................... 22-191 Table 22-4: Phase I Cash Flow Model: Physicals ................................................................................................. 22-194 Table 22-5: Phase I Cash Flow Model: Units Costs and Financials ...................................................................... 22-195 Table 22-6: Phase II and Total Cash Flow Model: Physicals ................................................................................ 22-196 Table 22-7: Phase II and Total Cash Flow Model: Units Costs and Financials ..................................................... 22-197
Preliminary Economic Assessment Copper World Complex, Pima County, Arizona USA
Page 1-1
1. SUMMARY
1.1 SUMMARY
The information that follows provides an executive summary of important information contained in this Technical Report.
1.2 INTRODUCTION
Hudbay is a diversified mining company primarily producing copper concentrate (containing copper, gold and silver), silver/gold doré, and zinc and molybdenum concentrates. Hudbay’s mission is to create sustainable value through the acquisition, development, and operation of high-quality, long-life deposits with exploration potential in jurisdictions that support responsible mining, and to see the regions and communities in which the company operates benefit from its presence.
This Technical Report presents the results of a preliminary economic assessment (“PEA”) of Hudbay’s 100%-owned Copper World Complex in Arizona, which includes the recently discovered Copper World deposits along with the Rosemont deposit (collectively, the “Project”). The Copper World deposits consist of seven deposits, including Bolsa, Broad Top Butte, West (formerly referred to as Copper World), Peach, Elgin, South Limb and North Limb, and are referred to collectively in this Technical Report as “Copper World”. The Rosemont deposit has been renamed the “East” deposit and is referred to as such throughout this Technical Report, unless the historical context requires otherwise.
Hudbay previously completed a feasibility study contemplating a standalone development plan for the East deposit and published the results in a technical report titled “NI 43-101, Feasibility Study, Updated Mineral Resource, Mineral Reserve and Financial Estimates, Rosemont Project, Pima County, Arizona, USA” that was filed by Hudbay in March 2017 (the “2017 Feasibility Study” or the “2017 Technical Report”).
While litigation over the federal permits for the standalone Rosemont project was ongoing, Hudbay commenced a comprehensive review of the exploration potential of the entire land package it acquired from Augusta Resource Corporation, along with the East deposit, in 2014. Drilling conducted in 2020 and 2021 resulted in the discovery and delineation of multiple satellite deposits, referred to collectively as “Copper World”, in almost a continuous manner over a 7km strike length adjacent to the East deposit.
The recent exploration success on patented mining claims and ongoing litigation uncertainty regarding the project design contemplated by the 2017 Feasibility Study caused Hudbay to evaluate alternative design options to unlock value within this prospective district. This included remodeling the 2017 mineral resources, incorporating the new mineral resources from successful exploration results and completing new metallurgical testing work, which led to a comprehensive review of the mine plan, process plant design, tailings deposition strategies and permitting requirements for the new project.
This Technical Report describes the latest resource model and mine plan and the current state of metallurgical testing, operating cost, and capital cost estimates for the combined development of the Copper World and East deposits and supersedes and replaces the 2017 Technical Report and the mineral resource and mineral reserve estimates for the Rosemont deposit stated therein.
The PEA contemplates a two-phased mine plan with the first phase reflecting a standalone operation with processing infrastructure on Hudbay’s private land and mining occurring on patented mining claims. Phase I is expected to require only state and local permits and reflects a 16-year mine life. Phase II extends the mine life to 44 years through an expansion onto federal land to mine the entire deposits. Phase II would be subject to the federal permitting process. Phase I has been extended for as long as possible as a prudent base case for this PEA but Hudbay expects to secure federal permits much earlier which would unlock considerable value by allowing to mine more tonnes and/or at higher grade sooner than estimated in the mine plan presented in this report.

Preliminary Economic Assessment Copper World Complex, Pima County, Arizona USA
Page 1-2
The Project consists of four planned open pit mines with processing infrastructure that is fundamentally different from what was contemplated in the 2017 Feasibility Study. The Project includes milling, leaching, solvent extraction and electrowinning of both copper sulfide and oxides to produce and sell copper cathodes, molybdenum concentrate, and silver and gold in doré, with sulfuric acid as a by-product. The Project also includes, waste rock and tailings storage facilities, leach pads and supporting infrastructure and utilities.
The PEA is preliminary in nature, includes inferred resources that are considered too speculative geologically to have the economic considerations applied to them that would enable them to be categorized as mineral reserves and there is no certainty the preliminary economic assessment will be realized. All dollar amounts in this Technical Report are in US dollars, unless otherwise noted.
1.3 PROPERTY DESCRIPTION AND LOCATION
The Project is located within the historic Helvetia-Rosemont Mining District that dates back to the 1800’s. The deposit lies on the northern end and western foothills of the Santa Rita Mountain range approximately 50 km southeast of Tucson, in Pima County, Arizona (Figure 1-1).
FIGURE 1-1: PROJECT PROPERTY LOCATION
The property consists of a combination of fee land, leased land, patented mining claims and mill sites, unpatented mining claims and mill sites, rights-of-way from the Arizona State Land Department, and grazing leases and permits. Taken together, the land position is sufficient to allow the proposed open pit mining operation, processing and concentrating facilities, storage of tailings, disposal of waste rock and a utility corridor to bring water and power to the Project.
1.4 GEOLOGICAL SETTING AND MINERALIZATION
The deposits are located in the Laramide belt, a major porphyry province that includes a number of other world class deposits. Mesozoic subduction and associated magmatism and tectonism in the southwestern United

Preliminary Economic Assessment Copper World Complex, Pima County, Arizona USA
Page 1-3
States and northern Mexico, generated extensive and relevant porphyry copper mineralization. Compressional tectonism during the Mesozoic and early Cenozoic Laramide Orogeny caused folding and thrusting, accompanied by extensive calc-alkaline magmatism Tertiary faulting juxtaposed mineralized and unmineralized rocks in large-scale block faulting that produced the present basin and range geomorphology that is typical throughout southern Arizona.
The deposits are located in the northern block of the Santa Rita Mountains dominated by Precambrian granite with slices of Paleozoic and Mesozoic sediments and small stocks and dikes of quartz monzonite or quartz latite porphyry that are related to porphyry copper and skarn mineralization. Tertiary faulting has significantly segmented the original stratigraphy juxtaposing mineralized and unmineralized rocks. Mineralization occurs as both copper oxides and sulfides in skarns and in the intrusive porphyry.
1.5 DEPOSIT TYPES
Genetically, skarns form part of the suite of deposit styles associated with porphyry copper centers. The skarns were formed as the result of thermal and metasomatic alteration of Paleozoic carbonate and to a lesser extent Mesozoic clastic rocks. Near surface weathering has resulted in the oxidation of the sulfides in the overlying Mesozoic units at the East deposit and near surface Paleozoic units at Copper World.
Mineralization is mostly in the form of primary (hypogene) copper, molybdenum and silver bearing sulfides, found in stockwork veinlets, and disseminated in the altered host rock at depth. Near surface, along structural zones, and in quartzite units oxidized copper mineralization is present. The oxidized mineralization occurs as mixed copper oxide and copper carbonate minerals. Locally, enrichment of supergene chalcocite and associated secondary mineralization are found in and beneath the oxidized mineralization.
1.6 EXPLORATION
Prospecting began in the Helvetia-Rosemont Mining Districts in the mid-1800s, and by 1875, copper production was first recorded, which continued sporadically until 1951. By the late 1950s, exploration drilling had discovered the East deposit. A succession of major mining companies subsequently conducted exploratory drilling focused on the East deposit and the nearby Broadtop Butte and Peach Elgin mineralized areas.
Two infill drilling campaigns were completed by Hudbay around the East deposit in 2014 and 2015. In addition to chemical assaying, magnetic susceptibility and conductivity measurements were also taken. Hudbay analyzed all samples of the 2014 and 2015 drilling programs with ICP multi-element geochemistry. This new geochemical data set was used to model stratigraphy and geochemical attributes and proved to be a useful tool for geological modeling and vectoring.
In October 2020, Hudbay resumed exploration drilling on targets at its Copper World private land claims located north and west of the East deposit. The drill program included drilling of targets proximal to the historic mines in the Broadtop Butte and Peach areas as well as greenfield drilling over the Elgin, Copper World (now referred to as the “West” deposit) and Bolsa areas.
The cut-off date on the drilling results used in this PEA is October 12th, 2021, but drilling has continued since to both infill known deposits and to further refine their strike extent and fill gaps between them, especially between Bolsa, Broadtop Butte and the East deposit.
1.7 DRILLING, SAMPLE PREPARATION, ANALYTICAL PROCEDURES AND DATA VALIDATION
All available data from the historical drilling was consolidated for inclusion in the geological model (Table 1-1). Out of a total of 956 drill holes, 614 holes have intersected copper mineralization and were used to define the mineralized envelopes for the Copper World and East deposits.
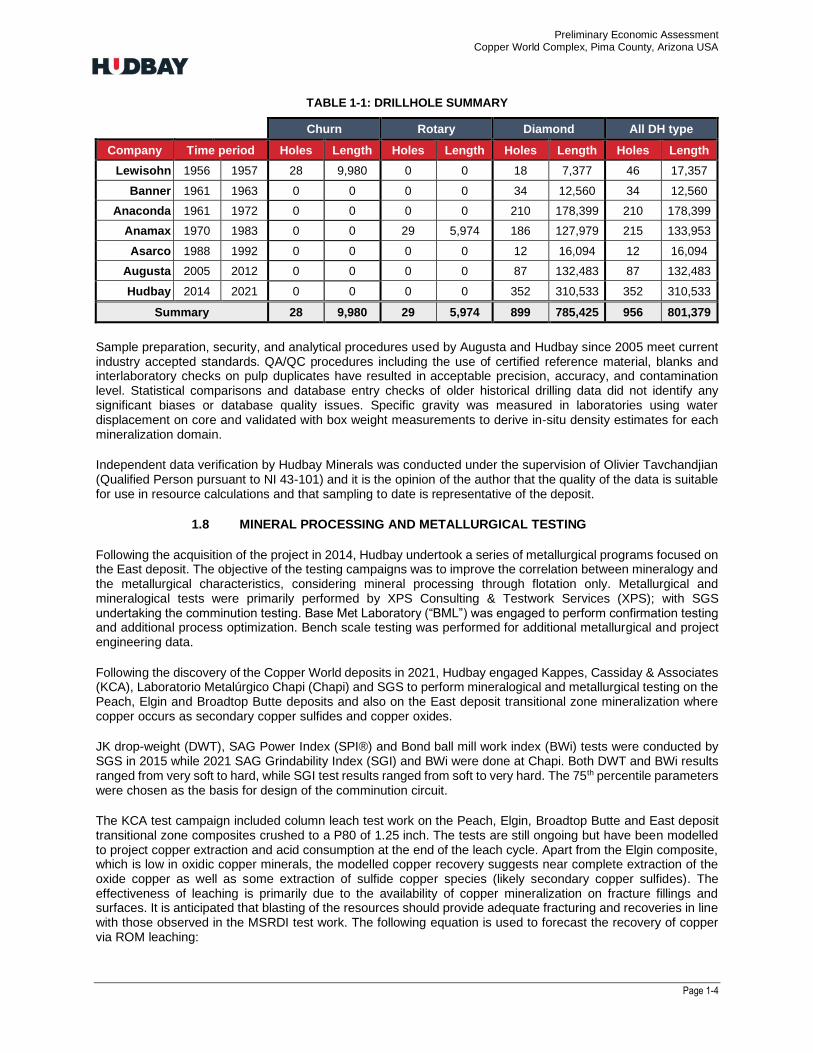
Preliminary Economic Assessment Copper World Complex, Pima County, Arizona USA
Page 1-4
TABLE 1-1: DRILLHOLE SUMMARY
Churn Rotary Diamond All DH type
Company Time period Holes Length Holes Length Holes Length Holes Length
Lewisohn 1956 1957 28 9,980 0 0 18 7,377 46 17,357
Banner 1961 1963 0 0 0 0 34 12,560 34 12,560
Anaconda 1961 1972 0 0 0 0 210 178,399 210 178,399
Anamax 1970 1983 0 0 29 5,974 186 127,979 215 133,953
Asarco 1988 1992 0 0 0 0 12 16,094 12 16,094
Augusta 2005 2012 0 0 0 0 87 132,483 87 132,483
Hudbay 2014 2021 0 0 0 0 352 310,533 352 310,533
Summary 28 9,980 29 5,974 899 785,425 956 801,379
Sample preparation, security, and analytical procedures used by Augusta and Hudbay since 2005 meet current industry accepted standards. QA/QC procedures including the use of certified reference material, blanks and interlaboratory checks on pulp duplicates have resulted in acceptable precision, accuracy, and contamination level. Statistical comparisons and database entry checks of older historical drilling data did not identify any significant biases or database quality issues. Specific gravity was measured in laboratories using water displacement on core and validated with box weight measurements to derive in-situ density estimates for each mineralization domain.
Independent data verification by Hudbay Minerals was conducted under the supervision of Olivier Tavchandjian (Qualified Person pursuant to NI 43-101) and it is the opinion of the author that the quality of the data is suitable for use in resource calculations and that sampling to date is representative of the deposit.
1.8 MINERAL PROCESSING AND METALLURGICAL TESTING
Following the acquisition of the project in 2014, Hudbay undertook a series of metallurgical programs focused on the East deposit. The objective of the testing campaigns was to improve the correlation between mineralogy and the metallurgical characteristics, considering mineral processing through flotation only. Metallurgical and mineralogical tests were primarily performed by XPS Consulting & Testwork Services (XPS); with SGS undertaking the comminution testing. Base Met Laboratory (“BML”) was engaged to perform confirmation testing and additional process optimization. Bench scale testing was performed for additional metallurgical and project engineering data.
Following the discovery of the Copper World deposits in 2021, Hudbay engaged Kappes, Cassiday & Associates (KCA), Laboratorio Metalúrgico Chapi (Chapi) and SGS to perform mineralogical and metallurgical testing on the Peach, Elgin and Broadtop Butte deposits and also on the East deposit transitional zone mineralization where copper occurs as secondary copper sulfides and copper oxides.
JK drop-weight (DWT), SAG Power Index (SPI®) and Bond ball mill work index (BWi) tests were conducted by SGS in 2015 while 2021 SAG Grindability Index (SGI) and BWi were done at Chapi. Both DWT and BWi results ranged from very soft to hard, while SGI test results ranged from soft to very hard. The 75th percentile parameters were chosen as the basis for design of the comminution circuit.
The KCA test campaign included column leach test work on the Peach, Elgin, Broadtop Butte and East deposit transitional zone composites crushed to a P80 of 1.25 inch. The tests are still ongoing but have been modelled to project copper extraction and acid consumption at the end of the leach cycle. Apart from the Elgin composite, which is low in oxidic copper minerals, the modelled copper recovery suggests near complete extraction of the oxide copper as well as some extraction of sulfide copper species (likely secondary copper sulfides). The effectiveness of leaching is primarily due to the availability of copper mineralization on fracture fillings and surfaces. It is anticipated that blasting of the resources should provide adequate fracturing and recoveries in line with those observed in the MSRDI test work. The following equation is used to forecast the recovery of copper via ROM leaching:
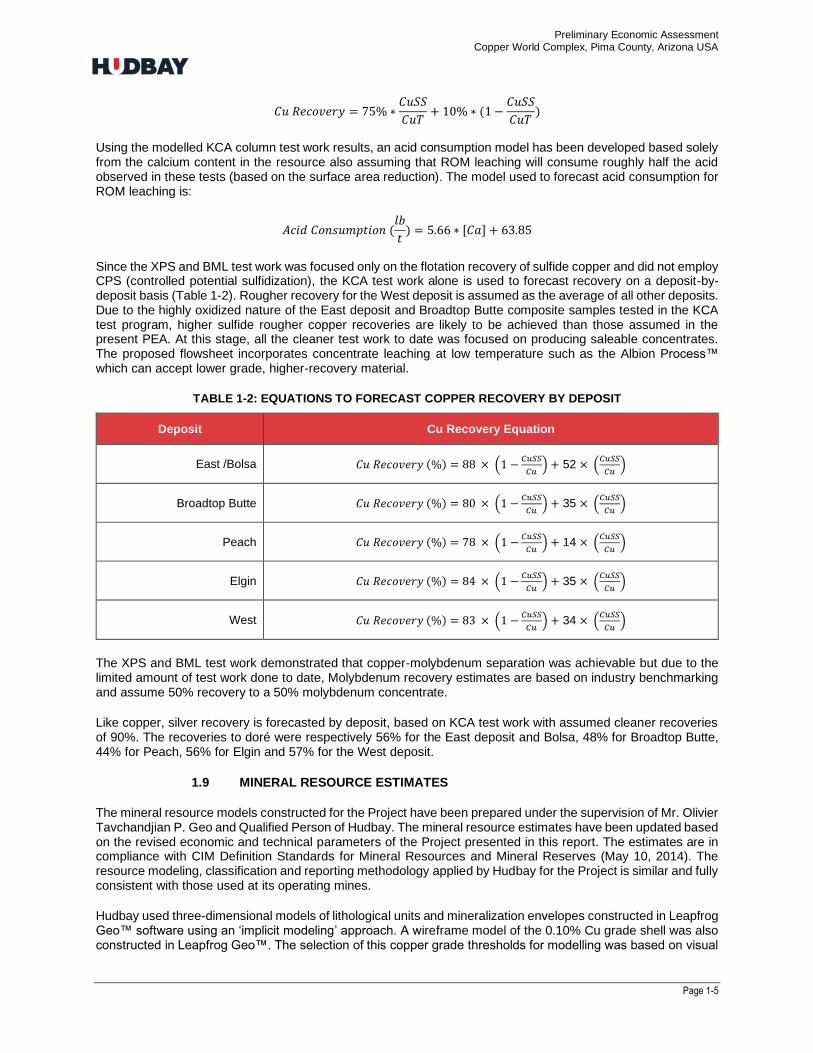
Preliminary Economic Assessment Copper World Complex, Pima County, Arizona USA
Page 1-5
𝐶𝑢 𝑅𝑒𝑐𝑜𝑣𝑒𝑟𝑦 = 75% ∗𝐶𝑢𝑆𝑆
𝐶𝑢𝑇+ 10% ∗ (1 −
𝐶𝑢𝑆𝑆
𝐶𝑢𝑇)
Using the modelled KCA column test work results, an acid consumption model has been developed based solely from the calcium content in the resource also assuming that ROM leaching will consume roughly half the acid observed in these tests (based on the surface area reduction). The model used to forecast acid consumption for ROM leaching is:
𝐴𝑐𝑖𝑑 𝐶𝑜𝑛𝑠𝑢𝑚𝑝𝑡𝑖𝑜𝑛 (𝑙𝑏
𝑡) = 5.66 ∗ [𝐶𝑎] + 63.85
Since the XPS and BML test work was focused only on the flotation recovery of sulfide copper and did not employ CPS (controlled potential sulfidization), the KCA test work alone is used to forecast recovery on a deposit-by-deposit basis (Table 1-2). Rougher recovery for the West deposit is assumed as the average of all other deposits. Due to the highly oxidized nature of the East deposit and Broadtop Butte composite samples tested in the KCA test program, higher sulfide rougher copper recoveries are likely to be achieved than those assumed in the present PEA. At this stage, all the cleaner test work to date was focused on producing saleable concentrates. The proposed flowsheet incorporates concentrate leaching at low temperature such as the Albion Process™ which can accept lower grade, higher-recovery material.
TABLE 1-2: EQUATIONS TO FORECAST COPPER RECOVERY BY DEPOSIT
Deposit Cu Recovery Equation
East /Bolsa 𝐶𝑢 𝑅𝑒𝑐𝑜𝑣𝑒𝑟𝑦 (%) = 88 × (1 −𝐶𝑢𝑆𝑆
𝐶𝑢) + 52 × (
𝐶𝑢𝑆𝑆
𝐶𝑢)
Broadtop Butte 𝐶𝑢 𝑅𝑒𝑐𝑜𝑣𝑒𝑟𝑦 (%) = 80 × (1 −𝐶𝑢𝑆𝑆
𝐶𝑢) + 35 × (
𝐶𝑢𝑆𝑆
𝐶𝑢)
Peach 𝐶𝑢 𝑅𝑒𝑐𝑜𝑣𝑒𝑟𝑦 (%) = 78 × (1 −𝐶𝑢𝑆𝑆
𝐶𝑢) + 14 × (
𝐶𝑢𝑆𝑆
𝐶𝑢)
Elgin 𝐶𝑢 𝑅𝑒𝑐𝑜𝑣𝑒𝑟𝑦 (%) = 84 × (1 −𝐶𝑢𝑆𝑆
𝐶𝑢) + 35 × (
𝐶𝑢𝑆𝑆
𝐶𝑢)
West 𝐶𝑢 𝑅𝑒𝑐𝑜𝑣𝑒𝑟𝑦 (%) = 83 × (1 −𝐶𝑢𝑆𝑆
𝐶𝑢) + 34 × (
𝐶𝑢𝑆𝑆
𝐶𝑢)
The XPS and BML test work demonstrated that copper-molybdenum separation was achievable but due to the limited amount of test work done to date, Molybdenum recovery estimates are based on industry benchmarking and assume 50% recovery to a 50% molybdenum concentrate.
Like copper, silver recovery is forecasted by deposit, based on KCA test work with assumed cleaner recoveries of 90%. The recoveries to doré were respectively 56% for the East deposit and Bolsa, 48% for Broadtop Butte, 44% for Peach, 56% for Elgin and 57% for the West deposit.
1.9 MINERAL RESOURCE ESTIMATES
The mineral resource models constructed for the Project have been prepared under the supervision of Mr. Olivier Tavchandjian P. Geo and Qualified Person of Hudbay. The mineral resource estimates have been updated based on the revised economic and technical parameters of the Project presented in this report. The estimates are in compliance with CIM Definition Standards for Mineral Resources and Mineral Reserves (May 10, 2014). The resource modeling, classification and reporting methodology applied by Hudbay for the Project is similar and fully consistent with those used at its operating mines.
Hudbay used three-dimensional models of lithological units and mineralization envelopes constructed in Leapfrog Geo™ software using an ‘implicit modeling’ approach. A wireframe model of the 0.10% Cu grade shell was also constructed in Leapfrog Geo™. The selection of this copper grade thresholds for modelling was based on visual
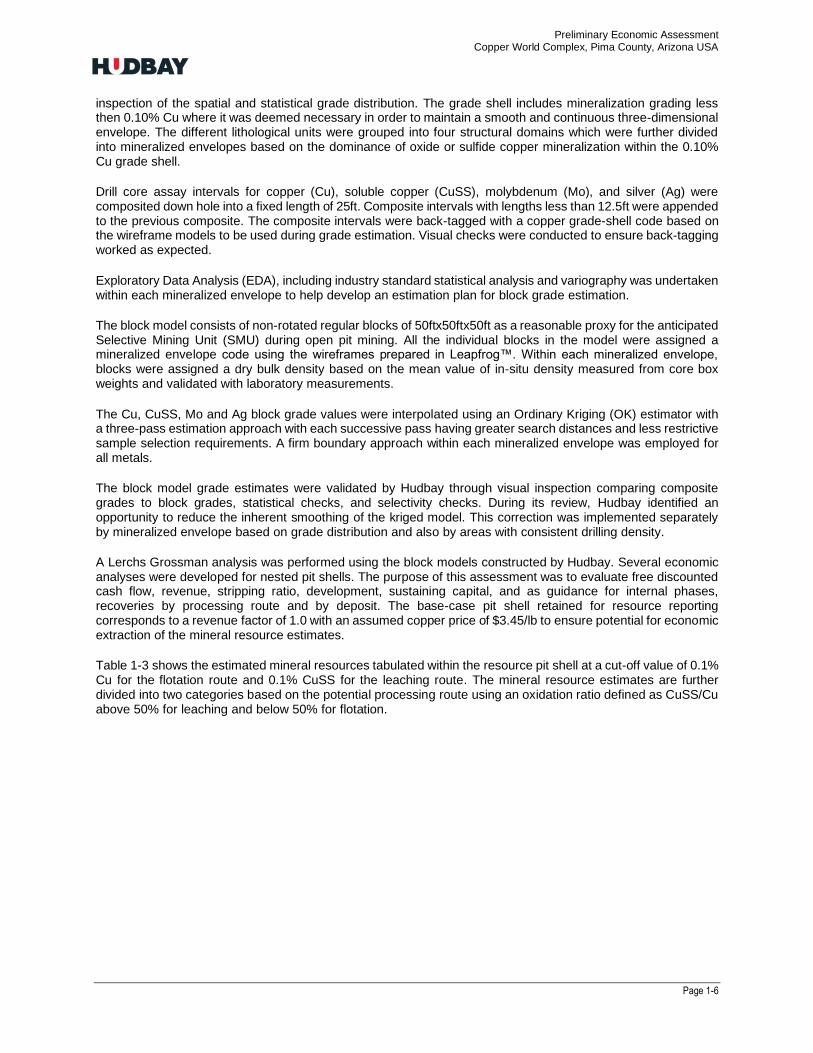
Preliminary Economic Assessment Copper World Complex, Pima County, Arizona USA
Page 1-6
inspection of the spatial and statistical grade distribution. The grade shell includes mineralization grading less then 0.10% Cu where it was deemed necessary in order to maintain a smooth and continuous three-dimensional envelope. The different lithological units were grouped into four structural domains which were further divided into mineralized envelopes based on the dominance of oxide or sulfide copper mineralization within the 0.10% Cu grade shell.
Drill core assay intervals for copper (Cu), soluble copper (CuSS), molybdenum (Mo), and silver (Ag) were composited down hole into a fixed length of 25ft. Composite intervals with lengths less than 12.5ft were appended to the previous composite. The composite intervals were back-tagged with a copper grade-shell code based on the wireframe models to be used during grade estimation. Visual checks were conducted to ensure back-tagging worked as expected.
Exploratory Data Analysis (EDA), including industry standard statistical analysis and variography was undertaken within each mineralized envelope to help develop an estimation plan for block grade estimation.
The block model consists of non-rotated regular blocks of 50ftx50ftx50ft as a reasonable proxy for the anticipated Selective Mining Unit (SMU) during open pit mining. All the individual blocks in the model were assigned a mineralized envelope code using the wireframes prepared in Leapfrog™. Within each mineralized envelope, blocks were assigned a dry bulk density based on the mean value of in-situ density measured from core box weights and validated with laboratory measurements.
The Cu, CuSS, Mo and Ag block grade values were interpolated using an Ordinary Kriging (OK) estimator with a three-pass estimation approach with each successive pass having greater search distances and less restrictive sample selection requirements. A firm boundary approach within each mineralized envelope was employed for all metals.
The block model grade estimates were validated by Hudbay through visual inspection comparing composite grades to block grades, statistical checks, and selectivity checks. During its review, Hudbay identified an opportunity to reduce the inherent smoothing of the kriged model. This correction was implemented separately by mineralized envelope based on grade distribution and also by areas with consistent drilling density.
A Lerchs Grossman analysis was performed using the block models constructed by Hudbay. Several economic analyses were developed for nested pit shells. The purpose of this assessment was to evaluate free discounted cash flow, revenue, stripping ratio, development, sustaining capital, and as guidance for internal phases, recoveries by processing route and by deposit. The base-case pit shell retained for resource reporting corresponds to a revenue factor of 1.0 with an assumed copper price of $3.45/lb to ensure potential for economic extraction of the mineral resource estimates.
Table 1-3 shows the estimated mineral resources tabulated within the resource pit shell at a cut-off value of 0.1% Cu for the flotation route and 0.1% CuSS for the leaching route. The mineral resource estimates are further divided into two categories based on the potential processing route using an oxidation ratio defined as CuSS/Cu above 50% for leaching and below 50% for flotation.
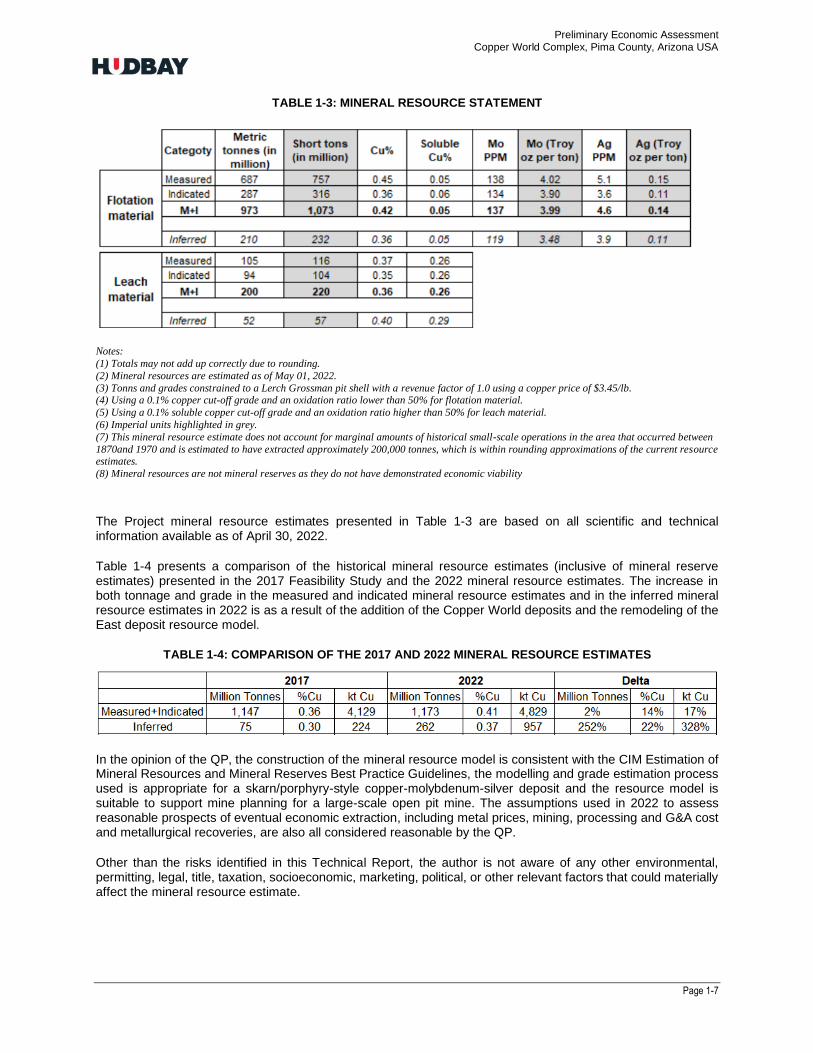
Preliminary Economic Assessment Copper World Complex, Pima County, Arizona USA
Page 1-7
TABLE 1-3: MINERAL RESOURCE STATEMENT
Notes:
(1) Totals may not add up correctly due to rounding.
(2) Mineral resources are estimated as of May 01, 2022.
(3) Tonns and grades constrained to a Lerch Grossman pit shell with a revenue factor of 1.0 using a copper price of $3.45/lb. (4) Using a 0.1% copper cut-off grade and an oxidation ratio lower than 50% for flotation material.
(5) Using a 0.1% soluble copper cut-off grade and an oxidation ratio higher than 50% for leach material.
(6) Imperial units highlighted in grey.
(7) This mineral resource estimate does not account for marginal amounts of historical small-scale operations in the area that occurred between
1870and 1970 and is estimated to have extracted approximately 200,000 tonnes, which is within rounding approximations of the current resource estimates.
(8) Mineral resources are not mineral reserves as they do not have demonstrated economic viability
The Project mineral resource estimates presented in Table 1-3 are based on all scientific and technical information available as of April 30, 2022.
Table 1-4 presents a comparison of the historical mineral resource estimates (inclusive of mineral reserve estimates) presented in the 2017 Feasibility Study and the 2022 mineral resource estimates. The increase in both tonnage and grade in the measured and indicated mineral resource estimates and in the inferred mineral resource estimates in 2022 is as a result of the addition of the Copper World deposits and the remodeling of the East deposit resource model.
TABLE 1-4: COMPARISON OF THE 2017 AND 2022 MINERAL RESOURCE ESTIMATES
In the opinion of the QP, the construction of the mineral resource model is consistent with the CIM Estimation of Mineral Resources and Mineral Reserves Best Practice Guidelines, the modelling and grade estimation process used is appropriate for a skarn/porphyry-style copper-molybdenum-silver deposit and the resource model is suitable to support mine planning for a large-scale open pit mine. The assumptions used in 2022 to assess reasonable prospects of eventual economic extraction, including metal prices, mining, processing and G&A cost and metallurgical recoveries, are also all considered reasonable by the QP.
Other than the risks identified in this Technical Report, the author is not aware of any other environmental, permitting, legal, title, taxation, socioeconomic, marketing, political, or other relevant factors that could materially affect the mineral resource estimate.
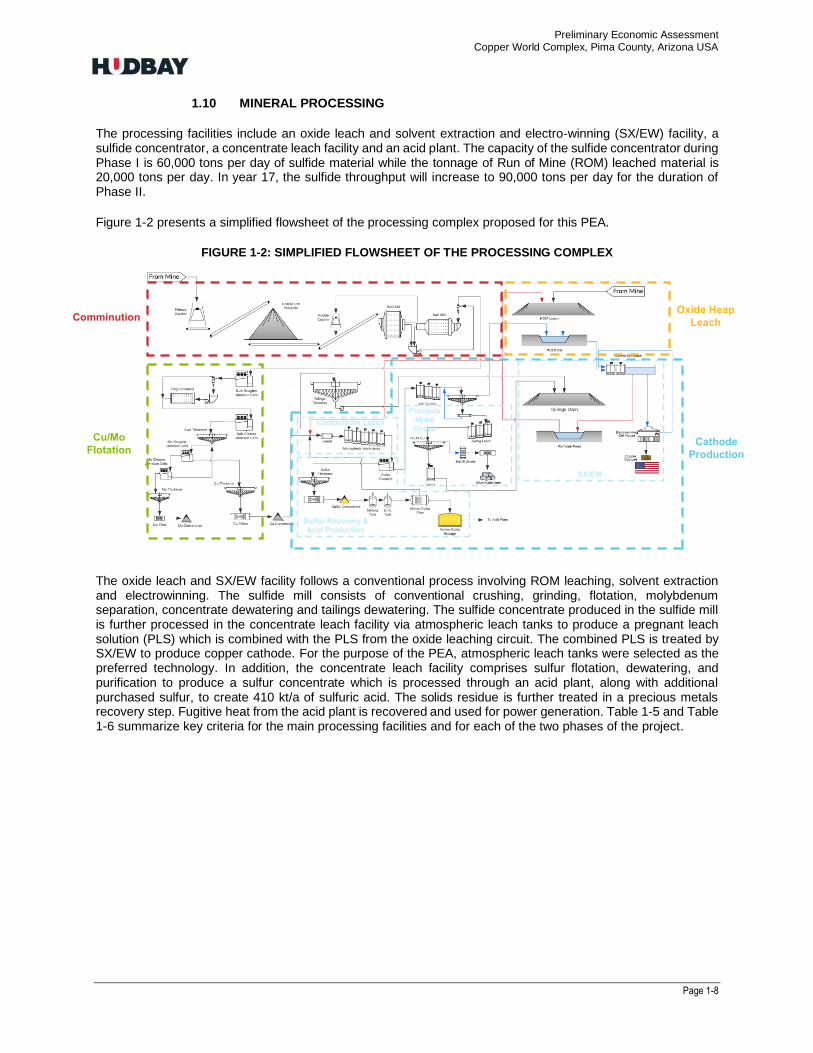
Preliminary Economic Assessment Copper World Complex, Pima County, Arizona USA
Page 1-8
1.10 MINERAL PROCESSING
The processing facilities include an oxide leach and solvent extraction and electro-winning (SX/EW) facility, a sulfide concentrator, a concentrate leach facility and an acid plant. The capacity of the sulfide concentrator during Phase I is 60,000 tons per day of sulfide material while the tonnage of Run of Mine (ROM) leached material is 20,000 tons per day. In year 17, the sulfide throughput will increase to 90,000 tons per day for the duration of Phase II.
Figure 1-2 presents a simplified flowsheet of the processing complex proposed for this PEA.
FIGURE 1-2: SIMPLIFIED FLOWSHEET OF THE PROCESSING COMPLEX
The oxide leach and SX/EW facility follows a conventional process involving ROM leaching, solvent extraction and electrowinning. The sulfide mill consists of conventional crushing, grinding, flotation, molybdenum separation, concentrate dewatering and tailings dewatering. The sulfide concentrate produced in the sulfide mill is further processed in the concentrate leach facility via atmospheric leach tanks to produce a pregnant leach solution (PLS) which is combined with the PLS from the oxide leaching circuit. The combined PLS is treated by SX/EW to produce copper cathode. For the purpose of the PEA, atmospheric leach tanks were selected as the preferred technology. In addition, the concentrate leach facility comprises sulfur flotation, dewatering, and purification to produce a sulfur concentrate which is processed through an acid plant, along with additional purchased sulfur, to create 410 kt/a of sulfuric acid. The solids residue is further treated in a precious metals recovery step. Fugitive heat from the acid plant is recovered and used for power generation. Table 1-5 and Table 1-6 summarize key criteria for the main processing facilities and for each of the two phases of the project.
Oxide Heap
Leach
Cu/Mo
FlotationCathode
Production
Comminution
Concentrate Leach
Precious
Metal
Circuit
Sulfur Recovery &
Acid Production
SX/EW
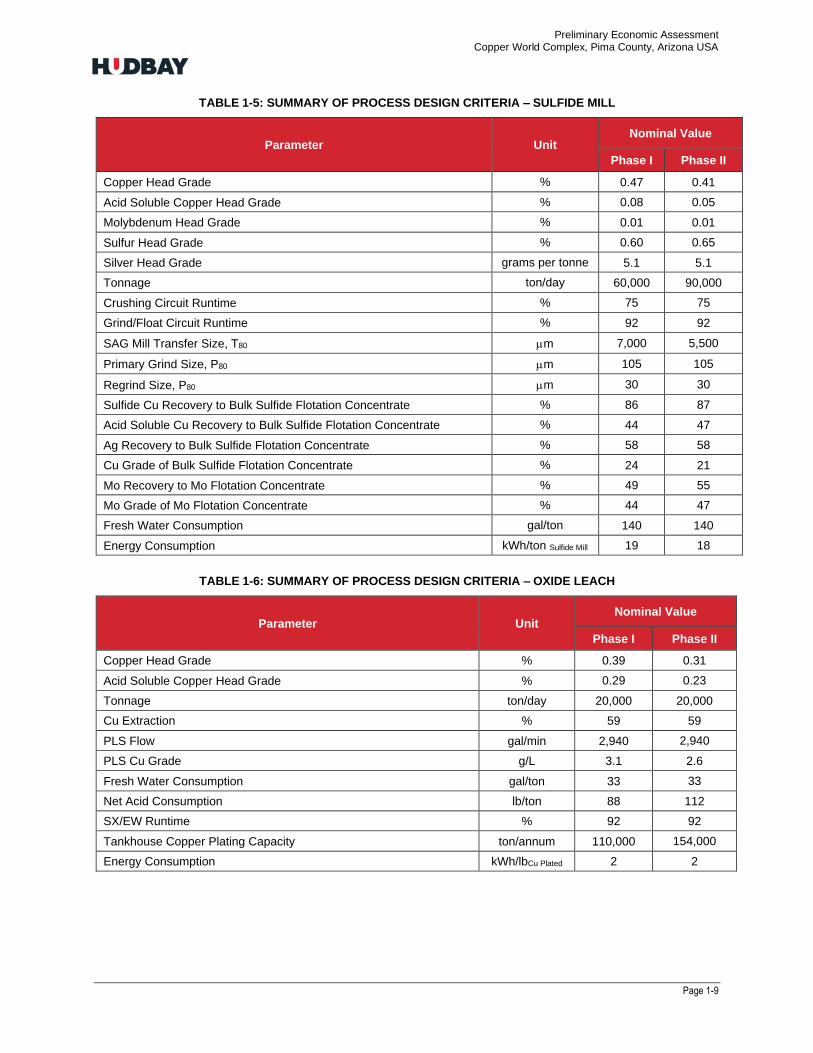
Preliminary Economic Assessment Copper World Complex, Pima County, Arizona USA
Page 1-9
TABLE 1-5: SUMMARY OF PROCESS DESIGN CRITERIA – SULFIDE MILL
Parameter Unit Nominal Value
Phase I Phase II
Copper Head Grade % 0.47 0.41
Acid Soluble Copper Head Grade % 0.08 0.05
Molybdenum Head Grade % 0.01 0.01
Sulfur Head Grade % 0.60 0.65
Silver Head Grade grams per tonne 5.1 5.1
Tonnage ton/day 60,000 90,000
Crushing Circuit Runtime % 75 75
Grind/Float Circuit Runtime % 92 92
SAG Mill Transfer Size, T80 m 7,000 5,500
Primary Grind Size, P80 m 105 105
Regrind Size, P80 m 30 30
Sulfide Cu Recovery to Bulk Sulfide Flotation Concentrate % 86 87
Acid Soluble Cu Recovery to Bulk Sulfide Flotation Concentrate % 44 47
Ag Recovery to Bulk Sulfide Flotation Concentrate % 58 58
Cu Grade of Bulk Sulfide Flotation Concentrate % 24 21
Mo Recovery to Mo Flotation Concentrate % 49 55
Mo Grade of Mo Flotation Concentrate % 44 47
Fresh Water Consumption gal/ton 140 140
Energy Consumption kWh/ton Sulfide Mill 19 18
TABLE 1-6: SUMMARY OF PROCESS DESIGN CRITERIA – OXIDE LEACH
Parameter Unit Nominal Value
Phase I Phase II
Copper Head Grade % 0.39 0.31
Acid Soluble Copper Head Grade % 0.29 0.23
Tonnage ton/day 20,000 20,000
Cu Extraction % 59 59
PLS Flow gal/min 2,940 2,940
PLS Cu Grade g/L 3.1 2.6
Fresh Water Consumption gal/ton 33 33
Net Acid Consumption lb/ton 88 112
SX/EW Runtime % 92 92
Tankhouse Copper Plating Capacity ton/annum 110,000 154,000
Energy Consumption kWh/lbCu Plated 2 2

Preliminary Economic Assessment Copper World Complex, Pima County, Arizona USA
Page 1-10
1.11 MINING METHODS
The mine will be a traditional open pit shovel and truck operation with bench heights of 50 and 100 feet, and 255-ton capacity haul trucks for material and waste movement.
The mining sequence follows a two-phase approach, where the first phase of production considers the exploitation of the pits and their associated infrastructure over a footprint requiring only state and local permits for 16 years (plus one year of pre-stripping). During this period, all waste, tailings, and leach pads are disposed within the limits of Hudbay’s private land properties. After this first phase, it is assumed that all necessary permits have been obtained in order to mine and deposit tailings and waste also on unpatented mining claims for a second production phase. The open pits are mined in a sequence consisting of 17 mining phases for a total lifetime of 44 years, plus one additional year of pre-stripping. The three Copper World pits will measure 5,600 ft on average in diameters with an average depth of 520 ft while the final East pit size will measure approximately 8,200 ft in diameter and have a depth of approximately 2,250 ft. Through the life of mine 1,486 million tons of economic material and approximately 2,437 million tons of waste will be extracted, yielding a life of mine stripping ratio of 1.64 (including pre-stripping material). The overall mine footprint for the two phases of production, is shown below in Figure 1-3.
FIGURE 1-3: PLAN VIEW OF OPEN PITS: PHASE I AND II
(BLUE OUTLINE CORRESPONDS TO OUTER LIMIT OF PRIVATE LAND)
Preliminary Economic Assessment Copper World Complex, Pima County, Arizona USA
Page 1-11
Pit design and production were conducted using a NSR optimization model in order to select the optimum processing method that maximizes NPV for each mining block extracted from the open pits taking into consideration land restriction both for mining and for the connected actions of waste, leach pads and tailings depositions as well as the maximum capacity of the various components of the processing facilities.
An important constraint on the mine production schedule during Phase I is the limited space for disposing waste rock, tailings, and economic material on leach pads. In addition, some of the waste rock can only be disposed after mining has been completed at the Elgin and West pits. These important constraints result in a sub-optimum mining sequence from a strict economic standpoint but allow the mine to operate in a sustainable manner during Phase I for 17 years until federal permits are in place. Securing these permits earlier would unlock significant benefits to the project by removing these important constraints on the mining schedule allowing more tons and/or better grade to enter the mine plan earlier than currently planned (Table 1-7 to Table 1-10).
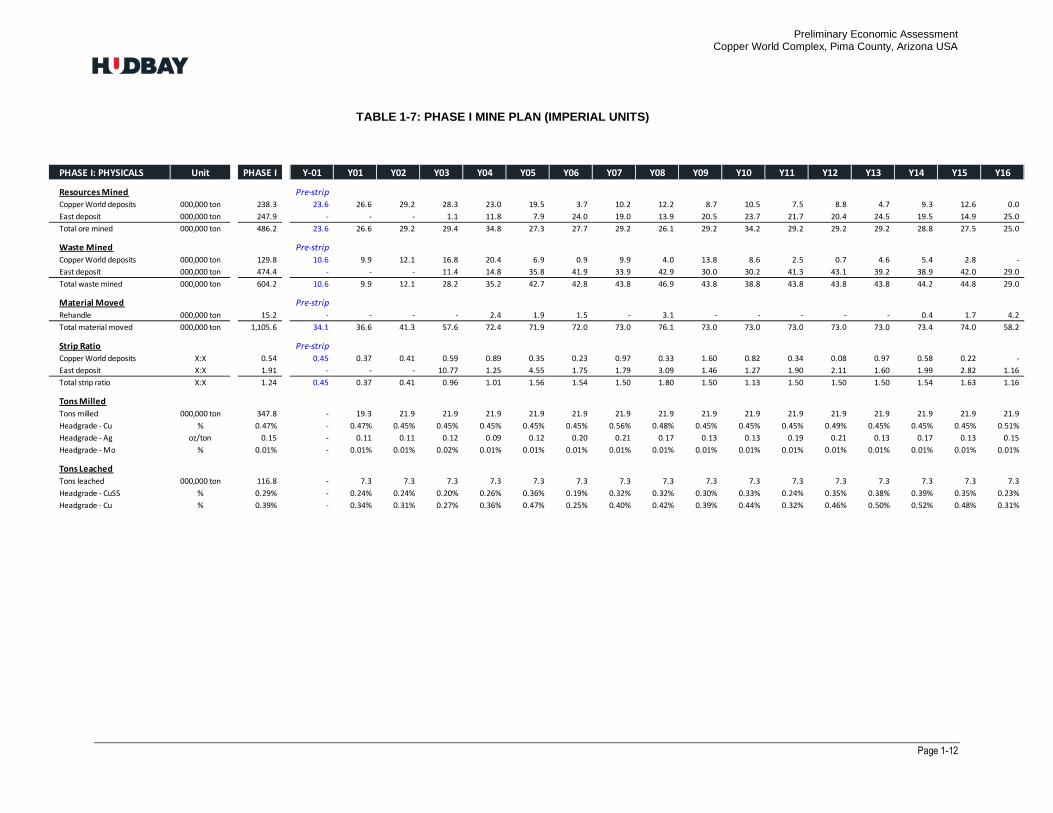
Preliminary Economic Assessment Copper World Complex, Pima County, Arizona USA
Page 1-12
TABLE 1-7: PHASE I MINE PLAN (IMPERIAL UNITS)
PHASE I: PHYSICALS Unit PHASE I Y-01 Y01 Y02 Y03 Y04 Y05 Y06 Y07 Y08 Y09 Y10 Y11 Y12 Y13 Y14 Y15 Y16
Resources Mined Pre-strip
Copper World deposits 000,000 ton 238.3 23.6 26.6 29.2 28.3 23.0 19.5 3.7 10.2 12.2 8.7 10.5 7.5 8.8 4.7 9.3 12.6 0.0
East deposit 000,000 ton 247.9 - - - 1.1 11.8 7.9 24.0 19.0 13.9 20.5 23.7 21.7 20.4 24.5 19.5 14.9 25.0
Total ore mined 000,000 ton 486.2 23.6 26.6 29.2 29.4 34.8 27.3 27.7 29.2 26.1 29.2 34.2 29.2 29.2 29.2 28.8 27.5 25.0
Waste Mined Pre-strip
Copper World deposits 000,000 ton 129.8 10.6 9.9 12.1 16.8 20.4 6.9 0.9 9.9 4.0 13.8 8.6 2.5 0.7 4.6 5.4 2.8 -
East deposit 000,000 ton 474.4 - - - 11.4 14.8 35.8 41.9 33.9 42.9 30.0 30.2 41.3 43.1 39.2 38.9 42.0 29.0
Total waste mined 000,000 ton 604.2 10.6 9.9 12.1 28.2 35.2 42.7 42.8 43.8 46.9 43.8 38.8 43.8 43.8 43.8 44.2 44.8 29.0
Material Moved Pre-strip
Rehandle 000,000 ton 15.2 - - - - 2.4 1.9 1.5 - 3.1 - - - - - 0.4 1.7 4.2
Total material moved 000,000 ton 1,105.6 34.1 36.6 41.3 57.6 72.4 71.9 72.0 73.0 76.1 73.0 73.0 73.0 73.0 73.0 73.4 74.0 58.2
Strip Ratio Pre-strip
Copper World deposits X:X 0.54 0.45 0.37 0.41 0.59 0.89 0.35 0.23 0.97 0.33 1.60 0.82 0.34 0.08 0.97 0.58 0.22 -
East deposit X:X 1.91 - - - 10.77 1.25 4.55 1.75 1.79 3.09 1.46 1.27 1.90 2.11 1.60 1.99 2.82 1.16
Total strip ratio X:X 1.24 0.45 0.37 0.41 0.96 1.01 1.56 1.54 1.50 1.80 1.50 1.13 1.50 1.50 1.50 1.54 1.63 1.16
Tons Milled
Tons milled 000,000 ton 347.8 - 19.3 21.9 21.9 21.9 21.9 21.9 21.9 21.9 21.9 21.9 21.9 21.9 21.9 21.9 21.9 21.9
Headgrade - Cu % 0.47% - 0.47% 0.45% 0.45% 0.45% 0.45% 0.45% 0.56% 0.48% 0.45% 0.45% 0.45% 0.49% 0.45% 0.45% 0.45% 0.51%
Headgrade - Ag oz/ton 0.15 - 0.11 0.11 0.12 0.09 0.12 0.20 0.21 0.17 0.13 0.13 0.19 0.21 0.13 0.17 0.13 0.15
Headgrade - Mo % 0.01% - 0.01% 0.01% 0.02% 0.01% 0.01% 0.01% 0.01% 0.01% 0.01% 0.01% 0.01% 0.01% 0.01% 0.01% 0.01% 0.01%
Tons Leached
Tons leached 000,000 ton 116.8 - 7.3 7.3 7.3 7.3 7.3 7.3 7.3 7.3 7.3 7.3 7.3 7.3 7.3 7.3 7.3 7.3
Headgrade - CuSS % 0.29% - 0.24% 0.24% 0.20% 0.26% 0.36% 0.19% 0.32% 0.32% 0.30% 0.33% 0.24% 0.35% 0.38% 0.39% 0.35% 0.23%
Headgrade - Cu % 0.39% - 0.34% 0.31% 0.27% 0.36% 0.47% 0.25% 0.40% 0.42% 0.39% 0.44% 0.32% 0.46% 0.50% 0.52% 0.48% 0.31%

Preliminary Economic Assessment Copper World Complex, Pima County, Arizona USA
Page 1-13
TABLE 1-8: PHASE I MINE PLAN (METRIC UNITS)
-
PHASE I: PHYSICALS Unit PHASE I Y-01 Y01 Y02 Y03 Y04 Y05 Y06 Y07 Y08 Y09 Y10 Y11 Y12 Y13 Y14 Y15 Y16
Resources Mined Pre-strip
Copper World deposits 000,000 tonne 216.2 21.4 24.2 26.5 25.7 20.8 17.6 3.3 9.3 11.1 7.9 9.5 6.8 8.0 4.3 8.4 11.4 0.0
East deposit 000,000 tonne 224.9 - - - 1.0 10.7 7.1 21.8 17.2 12.6 18.6 21.5 19.7 18.5 22.2 17.7 13.5 22.7
Total ore mined 000,000 tonne 441.1 21.4 24.2 26.5 26.7 31.6 24.8 25.1 26.5 23.7 26.5 31.0 26.5 26.5 26.5 26.1 24.9 22.7
Waste Mined Pre-strip
Copper World deposits 000,000 tonne 117.8 9.6 9.0 11.0 15.2 18.5 6.3 0.8 8.9 3.6 12.5 7.8 2.3 0.6 4.2 4.9 2.5 -
East deposit 000,000 tonne 430.3 - - - 10.3 13.4 32.5 38.0 30.8 38.9 27.2 27.4 37.4 39.1 35.6 35.3 38.1 26.3
Total waste mined 000,000 tonne 548.1 9.6 9.0 11.0 25.6 31.9 38.7 38.8 39.7 42.5 39.7 35.2 39.7 39.7 39.7 40.1 40.7 26.3
Material Moved Pre-strip
Rehandle 000,000 tonne 13.8 - - - - 2.2 1.7 1.4 - 2.8 - - - - - 0.4 1.5 3.8
Total material moved 000,000 tonne 1,003.0 31.0 33.2 37.5 52.2 65.7 65.2 65.3 66.2 69.0 66.2 66.2 66.2 66.2 66.2 66.6 67.2 52.8
Strip Ratio Pre-strip
Copper World deposits X:X 0.54 0.45 0.37 0.41 0.59 0.89 0.35 0.23 0.97 0.33 1.60 0.82 0.34 0.08 0.97 0.58 0.22 -
East deposit X:X 1.91 - - - 10.77 1.25 4.55 1.75 1.79 3.09 1.46 1.27 1.90 2.11 1.60 1.99 2.82 1.16
Total strip ratio X:X 1.24 0.45 0.37 0.41 0.96 1.01 1.56 1.54 1.50 1.80 1.50 1.13 1.50 1.50 1.50 1.54 1.63 1.16
Tonnes Milled
Tonnes milled 000,000 tonne 315.6 - 17.5 19.9 19.9 19.9 19.9 19.9 19.9 19.9 19.9 19.9 19.9 19.9 19.9 19.9 19.9 19.9
Headgrade - Cu % 0.47% - 0.47% 0.45% 0.45% 0.45% 0.45% 0.45% 0.56% 0.48% 0.45% 0.45% 0.45% 0.49% 0.45% 0.45% 0.45% 0.51%
Headgrade - Ag g/tonne 5.13 - 3.82 3.84 4.08 3.10 4.26 7.02 7.36 5.94 4.44 4.52 6.39 7.27 4.30 6.00 4.42 5.17
Headgrade - Mo % 0.01% - 0.01% 0.01% 0.02% 0.01% 0.01% 0.01% 0.01% 0.01% 0.01% 0.01% 0.01% 0.01% 0.01% 0.01% 0.01% 0.01%
Tonnes Leached
Tonnes leached 000,000 tonne 106.0 - 6.6 6.6 6.6 6.6 6.6 6.6 6.6 6.6 6.6 6.6 6.6 6.6 6.6 6.6 6.6 6.6
Headgrade - CuSS % 0.29% - 0.24% 0.24% 0.20% 0.26% 0.36% 0.19% 0.32% 0.32% 0.30% 0.33% 0.24% 0.35% 0.38% 0.39% 0.35% 0.23%
Headgrade - Cu % 0.39% - 0.34% 0.31% 0.27% 0.36% 0.47% 0.25% 0.40% 0.42% 0.39% 0.44% 0.32% 0.46% 0.50% 0.52% 0.48% 0.31%
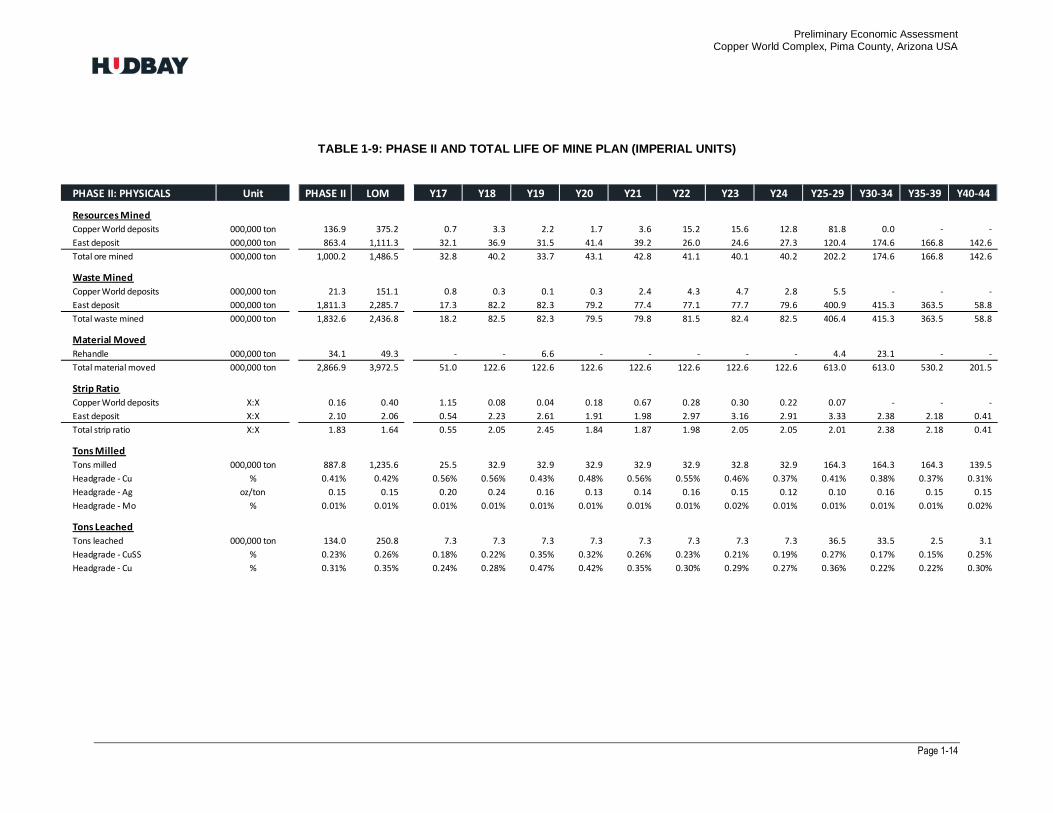
Preliminary Economic Assessment Copper World Complex, Pima County, Arizona USA
Page 1-14
TABLE 1-9: PHASE II AND TOTAL LIFE OF MINE PLAN (IMPERIAL UNITS)
PHASE II: PHYSICALS Unit PHASE II LOM Y17 Y18 Y19 Y20 Y21 Y22 Y23 Y24 Y25-29 Y30-34 Y35-39 Y40-44
Resources Mined
Copper World deposits 000,000 ton 136.9 375.2 0.7 3.3 2.2 1.7 3.6 15.2 15.6 12.8 81.8 0.0 - -
East deposit 000,000 ton 863.4 1,111.3 32.1 36.9 31.5 41.4 39.2 26.0 24.6 27.3 120.4 174.6 166.8 142.6
Total ore mined 000,000 ton 1,000.2 1,486.5 32.8 40.2 33.7 43.1 42.8 41.1 40.1 40.2 202.2 174.6 166.8 142.6
Waste Mined
Copper World deposits 000,000 ton 21.3 151.1 0.8 0.3 0.1 0.3 2.4 4.3 4.7 2.8 5.5 - - -
East deposit 000,000 ton 1,811.3 2,285.7 17.3 82.2 82.3 79.2 77.4 77.1 77.7 79.6 400.9 415.3 363.5 58.8
Total waste mined 000,000 ton 1,832.6 2,436.8 18.2 82.5 82.3 79.5 79.8 81.5 82.4 82.5 406.4 415.3 363.5 58.8
Material Moved
Rehandle 000,000 ton 34.1 49.3 - - 6.6 - - - - - 4.4 23.1 - -
Total material moved 000,000 ton 2,866.9 3,972.5 51.0 122.6 122.6 122.6 122.6 122.6 122.6 122.6 613.0 613.0 530.2 201.5
Strip Ratio
Copper World deposits X:X 0.16 0.40 1.15 0.08 0.04 0.18 0.67 0.28 0.30 0.22 0.07 - - -
East deposit X:X 2.10 2.06 0.54 2.23 2.61 1.91 1.98 2.97 3.16 2.91 3.33 2.38 2.18 0.41
Total strip ratio X:X 1.83 1.64 0.55 2.05 2.45 1.84 1.87 1.98 2.05 2.05 2.01 2.38 2.18 0.41
Tons Milled
Tons milled 000,000 ton 887.8 1,235.6 25.5 32.9 32.9 32.9 32.9 32.9 32.8 32.9 164.3 164.3 164.3 139.5
Headgrade - Cu % 0.41% 0.42% 0.56% 0.56% 0.43% 0.48% 0.56% 0.55% 0.46% 0.37% 0.41% 0.38% 0.37% 0.31%
Headgrade - Ag oz/ton 0.15 0.15 0.20 0.24 0.16 0.13 0.14 0.16 0.15 0.12 0.10 0.16 0.15 0.15
Headgrade - Mo % 0.01% 0.01% 0.01% 0.01% 0.01% 0.01% 0.01% 0.01% 0.02% 0.01% 0.01% 0.01% 0.01% 0.02%
Tons Leached
Tons leached 000,000 ton 134.0 250.8 7.3 7.3 7.3 7.3 7.3 7.3 7.3 7.3 36.5 33.5 2.5 3.1
Headgrade - CuSS % 0.23% 0.26% 0.18% 0.22% 0.35% 0.32% 0.26% 0.23% 0.21% 0.19% 0.27% 0.17% 0.15% 0.25%
Headgrade - Cu % 0.31% 0.35% 0.24% 0.28% 0.47% 0.42% 0.35% 0.30% 0.29% 0.27% 0.36% 0.22% 0.22% 0.30%
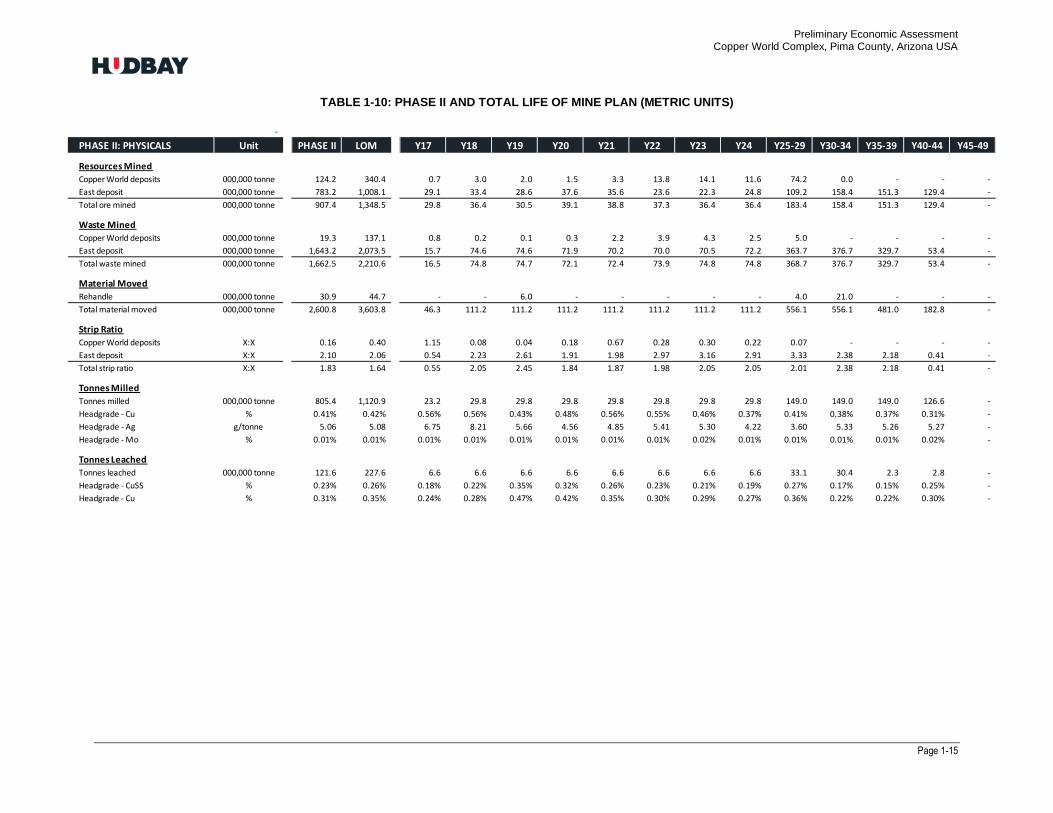
Preliminary Economic Assessment Copper World Complex, Pima County, Arizona USA
Page 1-15
TABLE 1-10: PHASE II AND TOTAL LIFE OF MINE PLAN (METRIC UNITS)
-
PHASE II: PHYSICALS Unit PHASE II LOM Y17 Y18 Y19 Y20 Y21 Y22 Y23 Y24 Y25-29 Y30-34 Y35-39 Y40-44 Y45-49
Resources Mined
Copper World deposits 000,000 tonne 124.2 340.4 0.7 3.0 2.0 1.5 3.3 13.8 14.1 11.6 74.2 0.0 - - -
East deposit 000,000 tonne 783.2 1,008.1 29.1 33.4 28.6 37.6 35.6 23.6 22.3 24.8 109.2 158.4 151.3 129.4 -
Total ore mined 000,000 tonne 907.4 1,348.5 29.8 36.4 30.5 39.1 38.8 37.3 36.4 36.4 183.4 158.4 151.3 129.4 -
Waste Mined
Copper World deposits 000,000 tonne 19.3 137.1 0.8 0.2 0.1 0.3 2.2 3.9 4.3 2.5 5.0 - - - -
East deposit 000,000 tonne 1,643.2 2,073.5 15.7 74.6 74.6 71.9 70.2 70.0 70.5 72.2 363.7 376.7 329.7 53.4 -
Total waste mined 000,000 tonne 1,662.5 2,210.6 16.5 74.8 74.7 72.1 72.4 73.9 74.8 74.8 368.7 376.7 329.7 53.4 -
Material Moved
Rehandle 000,000 tonne 30.9 44.7 - - 6.0 - - - - - 4.0 21.0 - - -
Total material moved 000,000 tonne 2,600.8 3,603.8 46.3 111.2 111.2 111.2 111.2 111.2 111.2 111.2 556.1 556.1 481.0 182.8 -
Strip Ratio
Copper World deposits X:X 0.16 0.40 1.15 0.08 0.04 0.18 0.67 0.28 0.30 0.22 0.07 - - - -
East deposit X:X 2.10 2.06 0.54 2.23 2.61 1.91 1.98 2.97 3.16 2.91 3.33 2.38 2.18 0.41 -
Total strip ratio X:X 1.83 1.64 0.55 2.05 2.45 1.84 1.87 1.98 2.05 2.05 2.01 2.38 2.18 0.41 -
Tonnes Milled
Tonnes milled 000,000 tonne 805.4 1,120.9 23.2 29.8 29.8 29.8 29.8 29.8 29.8 29.8 149.0 149.0 149.0 126.6 -
Headgrade - Cu % 0.41% 0.42% 0.56% 0.56% 0.43% 0.48% 0.56% 0.55% 0.46% 0.37% 0.41% 0.38% 0.37% 0.31% -
Headgrade - Ag g/tonne 5.06 5.08 6.75 8.21 5.66 4.56 4.85 5.41 5.30 4.22 3.60 5.33 5.26 5.27 -
Headgrade - Mo % 0.01% 0.01% 0.01% 0.01% 0.01% 0.01% 0.01% 0.01% 0.02% 0.01% 0.01% 0.01% 0.01% 0.02% -
Tonnes Leached
Tonnes leached 000,000 tonne 121.6 227.6 6.6 6.6 6.6 6.6 6.6 6.6 6.6 6.6 33.1 30.4 2.3 2.8 -
Headgrade - CuSS % 0.23% 0.26% 0.18% 0.22% 0.35% 0.32% 0.26% 0.23% 0.21% 0.19% 0.27% 0.17% 0.15% 0.25% -
Headgrade - Cu % 0.31% 0.35% 0.24% 0.28% 0.47% 0.42% 0.35% 0.30% 0.29% 0.27% 0.36% 0.22% 0.22% 0.30% -
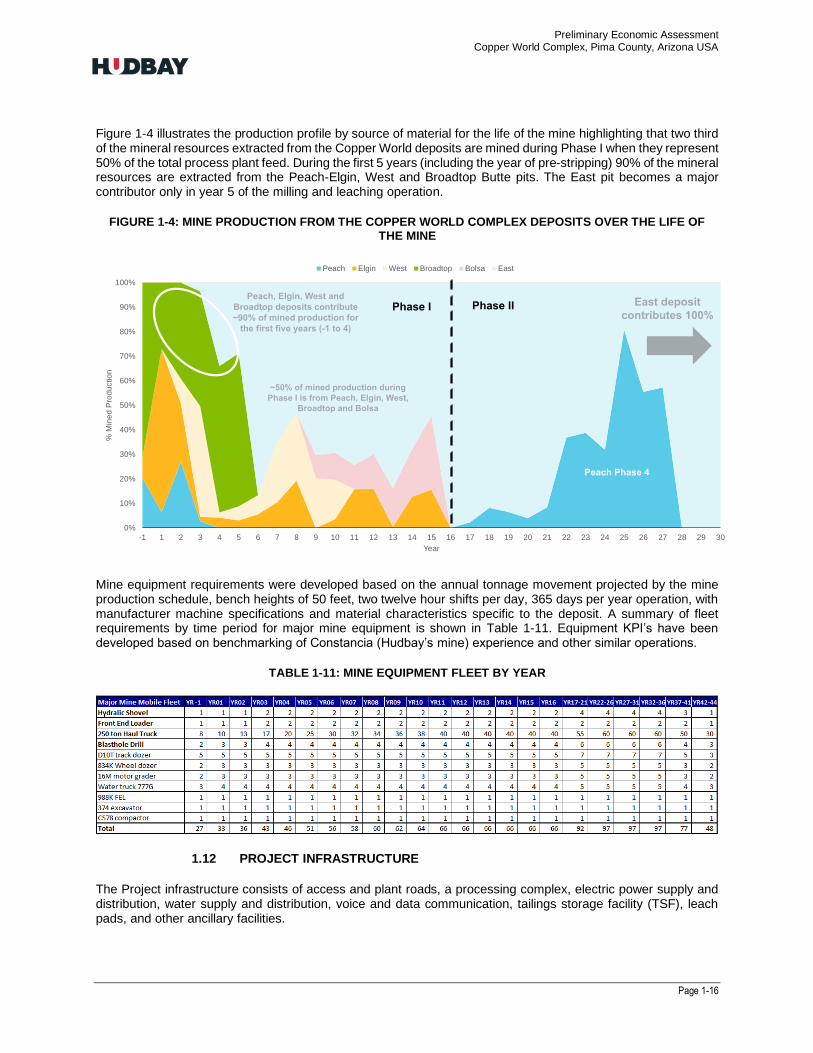
Preliminary Economic Assessment Copper World Complex, Pima County, Arizona USA
Page 1-16
Figure 1-4 illustrates the production profile by source of material for the life of the mine highlighting that two third of the mineral resources extracted from the Copper World deposits are mined during Phase I when they represent 50% of the total process plant feed. During the first 5 years (including the year of pre-stripping) 90% of the mineral resources are extracted from the Peach-Elgin, West and Broadtop Butte pits. The East pit becomes a major contributor only in year 5 of the milling and leaching operation.
FIGURE 1-4: MINE PRODUCTION FROM THE COPPER WORLD COMPLEX DEPOSITS OVER THE LIFE OF THE MINE
Mine equipment requirements were developed based on the annual tonnage movement projected by the mine production schedule, bench heights of 50 feet, two twelve hour shifts per day, 365 days per year operation, with manufacturer machine specifications and material characteristics specific to the deposit. A summary of fleet requirements by time period for major mine equipment is shown in Table 1-11. Equipment KPI’s have been developed based on benchmarking of Constancia (Hudbay’s mine) experience and other similar operations.
TABLE 1-11: MINE EQUIPMENT FLEET BY YEAR
1.12 PROJECT INFRASTRUCTURE
The Project infrastructure consists of access and plant roads, a processing complex, electric power supply and distribution, water supply and distribution, voice and data communication, tailings storage facility (TSF), leach pads, and other ancillary facilities.
0%
10%
20%
30%
40%
50%
60%
70%
80%
90%
100%
-1 1 2 3 4 5 6 7 8 9 10 11 12 13 14 15 16 17 18 19 20 21 22 23 24 25 26 27 28 29 30
% M
ine
d P
rod
uctio
n
Year
Peach Elgin West Broadtop Bolsa East
Peach, Elgin, West and
Broadtop deposits contribute
~90% of mined production for
the first five years (-1 to 4)
Peach Phase 4
Phase I Phase II
~50% of mined production during
Phase I is from Peach, Elgin, West,
Broadtop and Bolsa
East deposit
contributes 100%
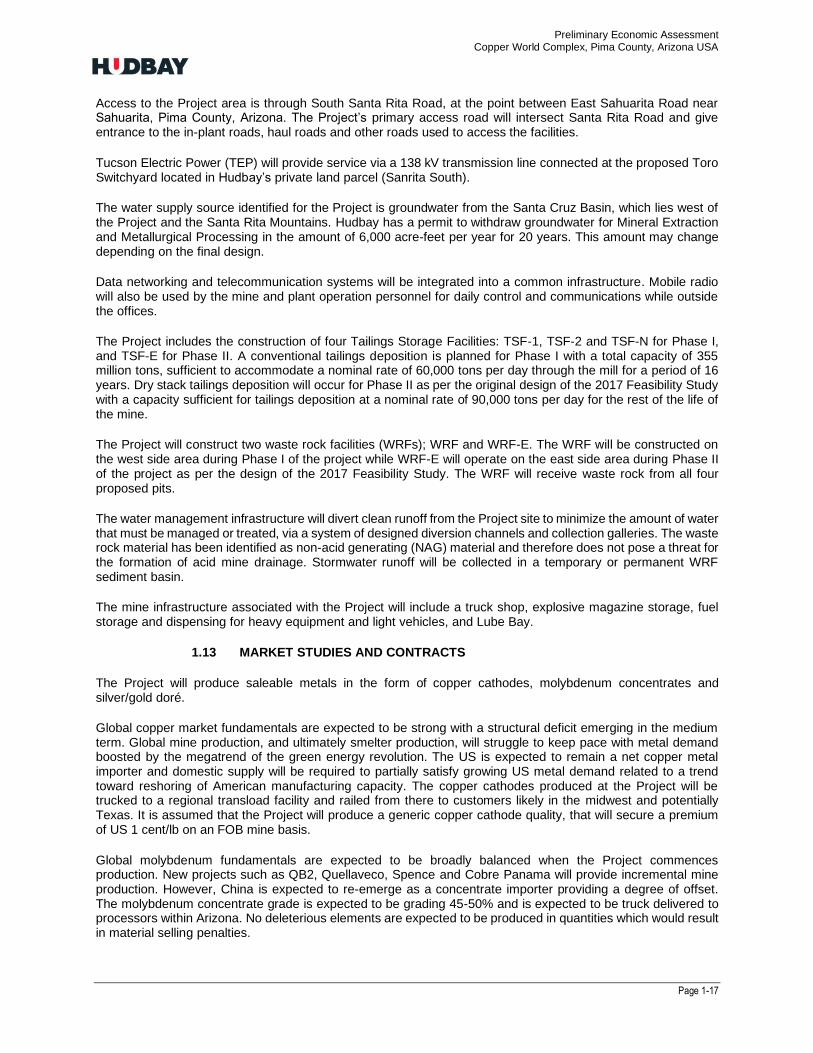
Preliminary Economic Assessment Copper World Complex, Pima County, Arizona USA
Page 1-17
Access to the Project area is through South Santa Rita Road, at the point between East Sahuarita Road near Sahuarita, Pima County, Arizona. The Project’s primary access road will intersect Santa Rita Road and give entrance to the in-plant roads, haul roads and other roads used to access the facilities.
Tucson Electric Power (TEP) will provide service via a 138 kV transmission line connected at the proposed Toro Switchyard located in Hudbay’s private land parcel (Sanrita South).
The water supply source identified for the Project is groundwater from the Santa Cruz Basin, which lies west of the Project and the Santa Rita Mountains. Hudbay has a permit to withdraw groundwater for Mineral Extraction and Metallurgical Processing in the amount of 6,000 acre-feet per year for 20 years. This amount may change depending on the final design.
Data networking and telecommunication systems will be integrated into a common infrastructure. Mobile radio will also be used by the mine and plant operation personnel for daily control and communications while outside the offices.
The Project includes the construction of four Tailings Storage Facilities: TSF-1, TSF-2 and TSF-N for Phase I, and TSF-E for Phase II. A conventional tailings deposition is planned for Phase I with a total capacity of 355 million tons, sufficient to accommodate a nominal rate of 60,000 tons per day through the mill for a period of 16 years. Dry stack tailings deposition will occur for Phase II as per the original design of the 2017 Feasibility Study with a capacity sufficient for tailings deposition at a nominal rate of 90,000 tons per day for the rest of the life of the mine.
The Project will construct two waste rock facilities (WRFs); WRF and WRF-E. The WRF will be constructed on the west side area during Phase I of the project while WRF-E will operate on the east side area during Phase II of the project as per the design of the 2017 Feasibility Study. The WRF will receive waste rock from all four proposed pits.
The water management infrastructure will divert clean runoff from the Project site to minimize the amount of water that must be managed or treated, via a system of designed diversion channels and collection galleries. The waste rock material has been identified as non-acid generating (NAG) material and therefore does not pose a threat for the formation of acid mine drainage. Stormwater runoff will be collected in a temporary or permanent WRF sediment basin.
The mine infrastructure associated with the Project will include a truck shop, explosive magazine storage, fuel storage and dispensing for heavy equipment and light vehicles, and Lube Bay.
1.13 MARKET STUDIES AND CONTRACTS
The Project will produce saleable metals in the form of copper cathodes, molybdenum concentrates and silver/gold doré.
Global copper market fundamentals are expected to be strong with a structural deficit emerging in the medium term. Global mine production, and ultimately smelter production, will struggle to keep pace with metal demand boosted by the megatrend of the green energy revolution. The US is expected to remain a net copper metal importer and domestic supply will be required to partially satisfy growing US metal demand related to a trend toward reshoring of American manufacturing capacity. The copper cathodes produced at the Project will be trucked to a regional transload facility and railed from there to customers likely in the midwest and potentially Texas. It is assumed that the Project will produce a generic copper cathode quality, that will secure a premium of US 1 cent/lb on an FOB mine basis.
Global molybdenum fundamentals are expected to be broadly balanced when the Project commences production. New projects such as QB2, Quellaveco, Spence and Cobre Panama will provide incremental mine production. However, China is expected to re-emerge as a concentrate importer providing a degree of offset. The molybdenum concentrate grade is expected to be grading 45-50% and is expected to be truck delivered to processors within Arizona. No deleterious elements are expected to be produced in quantities which would result in material selling penalties.

Preliminary Economic Assessment Copper World Complex, Pima County, Arizona USA
Page 1-18
The silver/gold doré grade is expected to be greater than 85% silver on average. The doré will be shipped to and refined by a third-party refinery. We have estimated provisional payment for 95% of the metal content value upon arrival at the refiner’s premises (or other predetermined destination), with financing rates of 3% or less.
Precious metals production from the Project is subject to a stream agreement with Wheaton Precious Metals International Ltd. (“Wheaton”). Under the agreement, Hudbay is entitled to receive a deposit payment of $230 million against delivery of 92.5% of the gold and silver that is produced from the Project and sold to third party purchasers. Given certain ambiguities in the contract arising from the change in the development plan for the Project since the 2017 Feasibility Study, Hudbay and Wheaton have commenced discussions regarding a possible restructuring of the stream agreement based upon the new mine plan and processing plant design. The PEA presented in this Technical Report assumes an upfront deposit of $230 million in the first year of Phase I construction in exchange for the delivery of 100% of silver produced, at a fixed price of $3.90/oz.
In addition, when the sulfur production from the concentrate leach process is insufficient to support the sulfuric acid requirements of the Project, sulfur will be purchased and trucked to the mine site using specialized trucks. As Arizona is expected to be a net importing region, sulfur pricing on a delivered basis will trade at a premium to international references such as Tampa and has been assumed to be US$ 215/tonne delivered to the Project mine site. Conversely when sulfuric acid production exceeds the leaching requirements of the operation, it will be sold at local market price. Assuming the Arizona region emerges as a sulfuric net acid importer, the Project will be well positioned to supply growing regional demand at an assumed price of US$145/tonne FOB.
Table 1-12 provides a summary of the commodity price assumptions used in the economic evaluation of the Project.
TABLE 1-12: COMMODITY PRICE ASSUMPTIONS
1.14 IMPACT ENVIRONMENTAL STUDIES, PERMITTING AND SOCIAL OR COMMUNITY
The relevant environmental studies, permitting requirements, social and community plans, monitoring of the Project facilities, social and environmental benefits, and reclamation requirements are summarized in this section and discussed in more detail in Section 20.
PRICE / RATE UNIT LONG TERM
Metals
Copper $/lb 3.50
Copper (FOB mine premium) $/lb 0.01
Moly $/lb 11.00
Gold - Offtaker $/oz 1,600.00
Silver - Offtaker $/oz 22.00
Gold - Stream $/oz 450.00
Silver - Stream $/oz 3.90
Stream Contracted Escalator % per year* 1.00
Other
Molten Sulphur - Purchases $/tonne 215.00
Molten Sulphur - Sales $/tonne 195.00
Acid - Sales $/tonne 145.00
Electricity $/kWh 0.075
NSR Royalty % 3.00
*Annual escalator begins in Year 4
PRICE DECK
Preliminary Economic Assessment Copper World Complex, Pima County, Arizona USA
Page 1-19
1.14.1 ENVIRONMENTAL STUDIES
As part of both current and past project activities, numerous surveys and studies related to the biological and cultural aspects of the site have been completed. Additionally, geochemical characterization of site materials has been performed along with groundwater and surface water studies. These surveys and studies will support both Phase I and Phase II of the Project and are discussed in detail in Section 20.
1.14.2 PROJECT PERMITTING
The first phase of the Project (Phase I), which is restricted to private and state land, is expected to require only state, county, and local permits and/or authorizations. In addition to state, county, and local permits, Phase II will require federal permits due to impacts to USFS and BLM administered lands.
Phase I of the Project requires state, county and local permits and/or authorizations from the following agencies:
• Arizona Corporation Commission (ACC)
• Arizona Department of Water Quality (ADEQ)
• Arizona Department of Water Resources (ADWR)
• Arizona State Mine Inspector (ASMI)
• Pima County (PC)
• Town of Sahuarita (TOS)
The status of the major permits required for Phase I of the Project is listed below. Many of the permits have either been issued, are in the active permitting phase, or are in the process of amendment.
• Groundwater Withdrawal Permit (issued by ADWR)
• Arizona Mined Land Reclamation Plan (MLRP) Authorization (update to approved plan is under review by ASMI)
• Class II Air Quality Control Permit (amendment to existing permit submitted to ADEQ, in progress)
• Aquifer Protection Permit (APP) (application submitted to ADEQ, in progress)
• Arizona Pollutant Elimination System Multi-Sector General Permit (MSGP) (can obtain coverage when
needed by notice to ADEQ)
• Certificate of Environmental Compatibility (CEC) (for powerline, amendment in progress with ACC)
• Floodplain Use Permit (FUP) (for waterline within utility corridor, issued by Pima County)
The State of Arizona environmental permits and approvals issued for Phase I, such as for the Class II air permit and Aquifer Protection Permit, will be amended to match the applicable Phase II federal permits. Submittal of the amendments for review by state agencies will be timed to accommodate both the layout used in the federal plan and the anticipated timing of approvals. Authorizations for the water and power line routing will remain valid for Phase II.
The federal agencies that may be involved in Phase II permitting include the following:
• Bureau of Land Management (BLM)
• United States Army Corps of Engineers (USACE)
• United States Fish and Wildlife Service (USFWS)
• United States Forest Service (USFS)

Preliminary Economic Assessment Copper World Complex, Pima County, Arizona USA
Page 1-20
The following federal permits and/or studies will be obtained for Phase II.
• Mine Plan of Operations (USFS and BLM)
o National Environmental Policy Act (NEPA) Analysis
o Consultation under Section 106 of National Historic Preservation Act (NHPA) (Tribal Consultation)
o Biological and Conference Opinion (BO) by the USFWS
o Environmental Impact Statement (EIS)
o Record of Decision (ROD)
Hudbay does not anticipate that Phase II will require a permit from the United States Army Corps of Engineers (USACE) under Section 404 of the Clean Water Act (“404 Permit”).
It should also be noted that two groups of Project opponents provided separate notices of their intent to bring citizen suits against Copper World under the Clean Water Act. In each case, project opponents have alleged that the site contains WOTUS and that a 404 Permit is needed to advance any part of the project (including Phase I). The USACE has never determined that there are jurisdictional waters of the U.S. at the Copper World Complex and Hudbay has independently concluded through its own scientific analysis that there are no such waters in the area. As a result, Hudbay does not believe Phase I will require a 404 Permit.
Under the mine plan discussed in this PEA, federal permits will not be required until year 16 which in Hudbay’s opinion will provide sufficient time to complete the federal permitting process for expanding from Phase I to Phase II and to resolve any legal challenges arising from that process.
1.14.3 SOCIAL AND COMMUNITY REQUIREMENTS AND PLANS
Regarding community outreach and other social commitments, specific allocations for Phase I will be determined as the Project progresses and the community is engaged. Additionally, Hudbay is committed to the preservation of historical and cultural resources as well as the protection of endangered and other protected species. Additional mitigation measures and other commitments will be determined as part of development of the EIS for Phase II. Mitigation elements would include those listed in the BO developed by the USFWS.
1.14.4 FACILITY DETAILS AND MONITORING
Phase I of the Project includes conventional tailings disposal and heap leaching. Dry stack tailings disposal will be incorporated into Phase II of the Project. Permits issued for the Project will generally need to meet specific design and monitoring requirements. For example, the Project will meet the Arizona Department of Environmental Quality (ADEQ) Best Available Demonstrated Control Technology (BADCT) requirements (includes facilities such as the Waste Rock Facility, Tailings Storage Facilities and Heap Leach Facilities). Equipment specifications, such as for dust collector efficiency, will be part of permit requirements for an air quality control permit issued by ADEQ. Additional design and monitoring requirements will also be part of the Phase II federal permitting process.
Monitoring and reporting requirements will be required for most of the permits associated with Phase I of the Project. Additional monitoring and reporting requirements will be determined by the USFS and BLM for Phase II.
1.14.5 SOCIAL AND ENVIRONMENTAL BENEFITS OF THE PROJECT
The development plan proposed for the Copper World Complex will yield many benefits. The “Made in America” copper cathodes produced through concentrate and oxide leaching at the Project are expected to be sold entirely to domestic U.S. customers, reducing the operation’s total energy requirements, greenhouse gas (“GHG”) and sulfur (SO2) emissions by eliminating overseas shipping, smelting and refining activities relating to copper concentrate (Figure 1-5). The company estimates that the project will reduce total energy consumption by more than 10%, including a more than 30% decline in energy consumption relating to downstream processing when compared to a Project design that produces copper concentrates for overseas smelting and refining. The lower energy consumption would result in an approximate 10% to 15% reduction in scope 1, 2 and 3 GHG emissions.
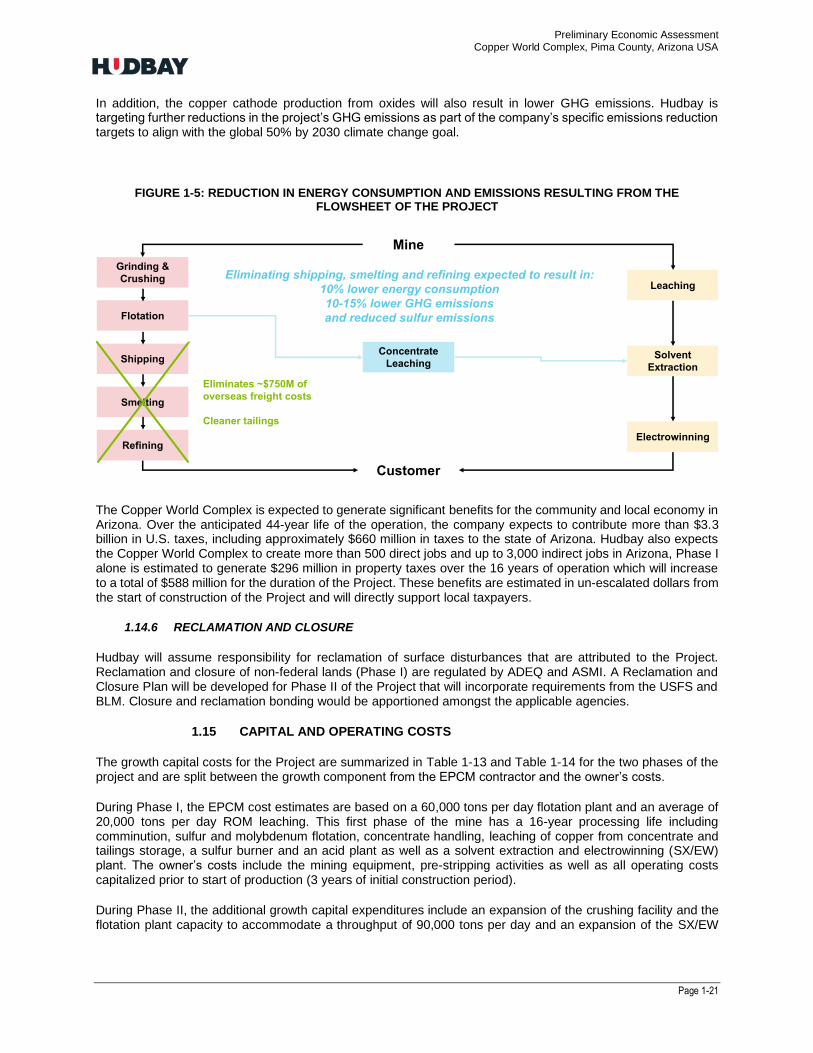
Preliminary Economic Assessment Copper World Complex, Pima County, Arizona USA
Page 1-21
In addition, the copper cathode production from oxides will also result in lower GHG emissions. Hudbay is targeting further reductions in the project’s GHG emissions as part of the company’s specific emissions reduction targets to align with the global 50% by 2030 climate change goal.
FIGURE 1-5: REDUCTION IN ENERGY CONSUMPTION AND EMISSIONS RESULTING FROM THE FLOWSHEET OF THE PROJECT
The Copper World Complex is expected to generate significant benefits for the community and local economy in Arizona. Over the anticipated 44-year life of the operation, the company expects to contribute more than $3.3 billion in U.S. taxes, including approximately $660 million in taxes to the state of Arizona. Hudbay also expects the Copper World Complex to create more than 500 direct jobs and up to 3,000 indirect jobs in Arizona, Phase I alone is estimated to generate $296 million in property taxes over the 16 years of operation which will increase to a total of $588 million for the duration of the Project. These benefits are estimated in un-escalated dollars from the start of construction of the Project and will directly support local taxpayers.
1.14.6 RECLAMATION AND CLOSURE
Hudbay will assume responsibility for reclamation of surface disturbances that are attributed to the Project. Reclamation and closure of non-federal lands (Phase I) are regulated by ADEQ and ASMI. A Reclamation and Closure Plan will be developed for Phase II of the Project that will incorporate requirements from the USFS and BLM. Closure and reclamation bonding would be apportioned amongst the applicable agencies.
1.15 CAPITAL AND OPERATING COSTS
The growth capital costs for the Project are summarized in Table 1-13 and Table 1-14 for the two phases of the project and are split between the growth component from the EPCM contractor and the owner’s costs.
During Phase I, the EPCM cost estimates are based on a 60,000 tons per day flotation plant and an average of 20,000 tons per day ROM leaching. This first phase of the mine has a 16-year processing life including comminution, sulfur and molybdenum flotation, concentrate handling, leaching of copper from concentrate and tailings storage, a sulfur burner and an acid plant as well as a solvent extraction and electrowinning (SX/EW) plant. The owner’s costs include the mining equipment, pre-stripping activities as well as all operating costs capitalized prior to start of production (3 years of initial construction period).
During Phase II, the additional growth capital expenditures include an expansion of the crushing facility and the flotation plant capacity to accommodate a throughput of 90,000 tons per day and an expansion of the SX/EW
Grinding &
Crushing
Flotation
Shipping
Smelting
Refining
Mine
Leaching
Solvent
Extraction
Electrowinning
Customer
Concentrate
Leaching
Eliminating shipping, smelting and refining expected to result in:
10% lower energy consumption
10-15% lower GHG emissions
and reduced sulfur emissions
Eliminates ~$750M of
overseas freight costs
Cleaner tailings

Preliminary Economic Assessment Copper World Complex, Pima County, Arizona USA
Page 1-22
capacity for the EPCM costs while the owner’s costs include construction costs of a new facility for the storage of dry stack tailings.
TABLE 1-13: PROJECT CAPITAL EPCM COSTS SUMMARY
TABLE 1-14: PROJECT CAPITAL OWNER’S COSTS SUMMARY
Table 1-15 presents a summary of the sustaining capital costs split between mining, processing and general and administrative categories.
TABLE 1-15: PROJECT SUSTAINING CAPITAL COSTS SUMMARY
Operating costs were developed by Hudbay based on a bottom-up approach and utilizing budget quotes from different suppliers, Hudbay operations experience, and labor costs within the region. Site visits were conducted to other facilities currently utilizing the same mining fleet and tailings facilities to better understand the operations
METRIC UNIT Phase I Phase II LOM
Growth - EPCM $M $1,345 $621 $1,966
Growth - owner's costs $M $572 $264 $836
Growth - subtotal $M $1,917 $885 $2,802
Sustaining $M $531 $967 $1,498
Deferred stripping $M $111 $456 $567
Total $M $2,559 $2,308 $4,867
METRIC UNIT Phase I Phase II LOM
Sitewide $M $15 $5 $20
Mining $M $38 $0 $38
Primary crushing $M $31 $33 $64
Sulfide plant $M $227 $144 $371
Molybdenum plant $M $15 $0 $15
Reagents $M $9 $5 $13
Plant services $M $29 $14 $43
SX/EW plant $M $190 $60 $250
Concentrate leach plant $M $88 $0 $88
Acid plant $M $77 $0 $77
Doré plant $M $20 $0 $20
Site services and utilities $M $3 $3 $5
Internal infrastructure $M $19 $10 $29
External infrastructure $M $102 $0 $102
Common construction $M $84 $54 $138
Other $M $173 $118 $291
Contingency $M $224 $177 $401
Total $M $1,345 $621 $1,966
METRIC UNIT Phase I Phase II LOM
Pre-stripping $M $57 $0 $57
Mining fleet and equipment $M $186 $0 $186
Tailings storage $M $20 $264 $284
Heap leach pad $M $45 $0 $45
Earthworks and roads $M $28 $0 $28
G&A and other $M $156 $0 $156
Indirects and contingency $M $79 $0 $79
Total $M $572 $264 $836
METRIC UNIT Phase I Phase II LOM
Mining $M $305 $439 $744
Processing $M $163 $365 $528
Admin $M $63 $163 $226
Deferred stripping $M $111 $456 $567
Total $M $642 $1,423 $2,065
GROWTH CAPITAL DETAILS - OWNER'S COSTS
SUSTAINING CAPITAL DETAILS
CAPITAL COST SUMMARY
GROWTH CAPITAL DETAILS - EPCM
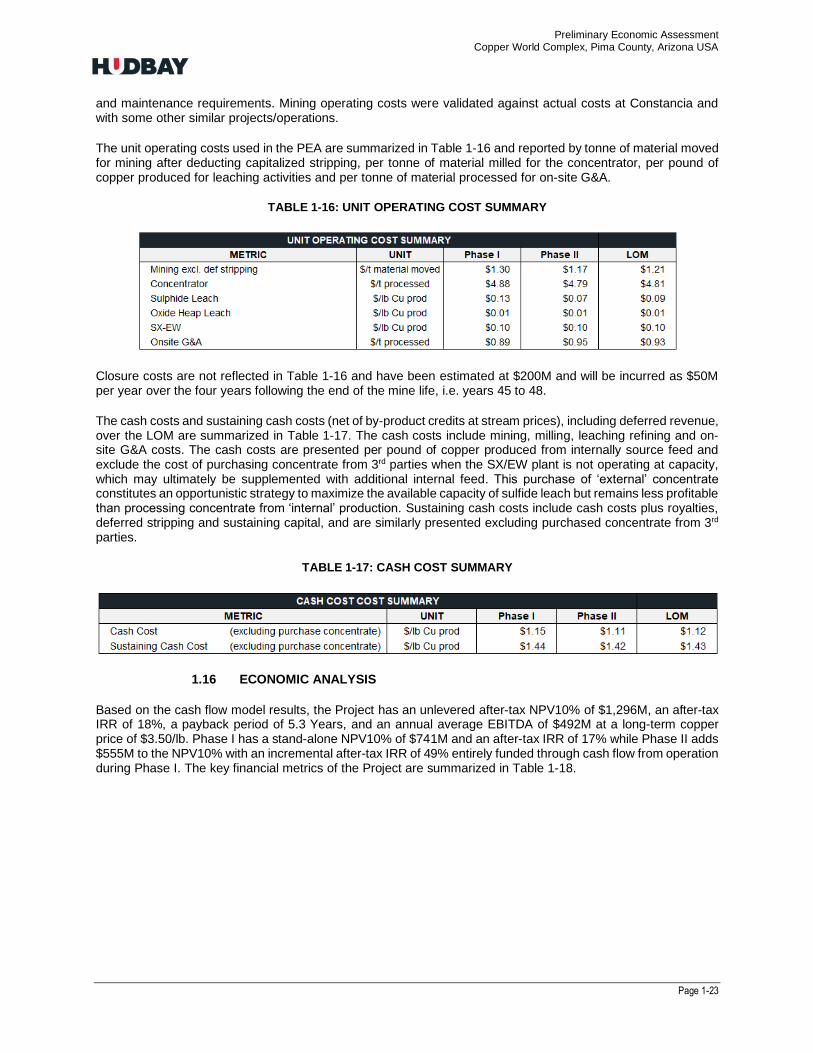
Preliminary Economic Assessment Copper World Complex, Pima County, Arizona USA
Page 1-23
and maintenance requirements. Mining operating costs were validated against actual costs at Constancia and with some other similar projects/operations.
The unit operating costs used in the PEA are summarized in Table 1-16 and reported by tonne of material moved for mining after deducting capitalized stripping, per tonne of material milled for the concentrator, per pound of copper produced for leaching activities and per tonne of material processed for on-site G&A.
TABLE 1-16: UNIT OPERATING COST SUMMARY
Closure costs are not reflected in Table 1-16 and have been estimated at $200M and will be incurred as $50M per year over the four years following the end of the mine life, i.e. years 45 to 48.
The cash costs and sustaining cash costs (net of by-product credits at stream prices), including deferred revenue, over the LOM are summarized in Table 1-17. The cash costs include mining, milling, leaching refining and on-site G&A costs. The cash costs are presented per pound of copper produced from internally source feed and exclude the cost of purchasing concentrate from 3rd parties when the SX/EW plant is not operating at capacity, which may ultimately be supplemented with additional internal feed. This purchase of ‘external’ concentrate constitutes an opportunistic strategy to maximize the available capacity of sulfide leach but remains less profitable than processing concentrate from ‘internal’ production. Sustaining cash costs include cash costs plus royalties, deferred stripping and sustaining capital, and are similarly presented excluding purchased concentrate from 3rd parties.
TABLE 1-17: CASH COST SUMMARY
1.16 ECONOMIC ANALYSIS
Based on the cash flow model results, the Project has an unlevered after-tax NPV10% of $1,296M, an after-tax IRR of 18%, a payback period of 5.3 Years, and an annual average EBITDA of $492M at a long-term copper price of $3.50/lb. Phase I has a stand-alone NPV10% of $741M and an after-tax IRR of 17% while Phase II adds $555M to the NPV10% with an incremental after-tax IRR of 49% entirely funded through cash flow from operation during Phase I. The key financial metrics of the Project are summarized in Table 1-18.
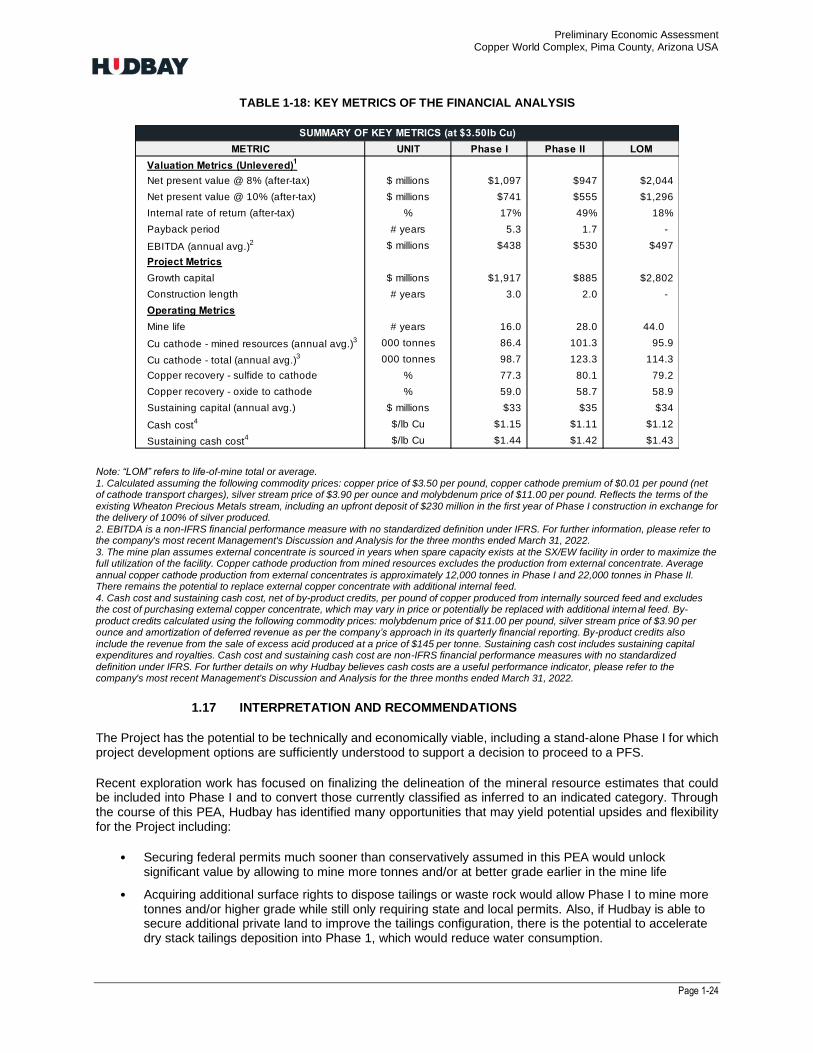
Preliminary Economic Assessment Copper World Complex, Pima County, Arizona USA
Page 1-24
TABLE 1-18: KEY METRICS OF THE FINANCIAL ANALYSIS
Note: “LOM” refers to life-of-mine total or average. 1. Calculated assuming the following commodity prices: copper price of $3.50 per pound, copper cathode premium of $0.01 per pound (net of cathode transport charges), silver stream price of $3.90 per ounce and molybdenum price of $11.00 per pound. Reflects the terms of the existing Wheaton Precious Metals stream, including an upfront deposit of $230 million in the first year of Phase I construction in exchange for the delivery of 100% of silver produced. 2. EBITDA is a non-IFRS financial performance measure with no standardized definition under IFRS. For further information, please refer to the company's most recent Management's Discussion and Analysis for the three months ended March 31, 2022. 3. The mine plan assumes external concentrate is sourced in years when spare capacity exists at the SX/EW facility in order to maximize the full utilization of the facility. Copper cathode production from mined resources excludes the production from external concentrate. Average
annual copper cathode production from external concentrates is approximately 12,000 tonnes in Phase I and 22,000 tonnes in Phase II. There remains the potential to replace external copper concentrate with additional internal feed. 4. Cash cost and sustaining cash cost, net of by-product credits, per pound of copper produced from internally sourced feed and excludes the cost of purchasing external copper concentrate, which may vary in price or potentially be replaced with additional internal feed. By-product credits calculated using the following commodity prices: molybdenum price of $11.00 per pound, silver stream price of $3.90 per ounce and amortization of deferred revenue as per the company’s approach in its quarterly financial reporting. By-product credits also include the revenue from the sale of excess acid produced at a price of $145 per tonne. Sustaining cash cost includes sustaining capital expenditures and royalties. Cash cost and sustaining cash cost are non-IFRS financial performance measures with no standardized definition under IFRS. For further details on why Hudbay believes cash costs are a useful performance indicator, please refer to the company's most recent Management's Discussion and Analysis for the three months ended March 31, 2022.
1.17 INTERPRETATION AND RECOMMENDATIONS
The Project has the potential to be technically and economically viable, including a stand-alone Phase I for which project development options are sufficiently understood to support a decision to proceed to a PFS.
Recent exploration work has focused on finalizing the delineation of the mineral resource estimates that could be included into Phase I and to convert those currently classified as inferred to an indicated category. Through the course of this PEA, Hudbay has identified many opportunities that may yield potential upsides and flexibility for the Project including:
• Securing federal permits much sooner than conservatively assumed in this PEA would unlock significant value by allowing to mine more tonnes and/or at better grade earlier in the mine life
• Acquiring additional surface rights to dispose tailings or waste rock would allow Phase I to mine more tonnes and/or higher grade while still only requiring state and local permits. Also, if Hudbay is able to secure additional private land to improve the tailings configuration, there is the potential to accelerate dry stack tailings deposition into Phase 1, which would reduce water consumption.
METRIC UNIT Phase I Phase II LOM
Valuation Metrics (Unlevered)1
Net present value @ 8% (after-tax) $ millions $1,097 $947 $2,044
Net present value @ 10% (after-tax) $ millions $741 $555 $1,296
Internal rate of return (after-tax) % 17% 49% 18%
Payback period # years 5.3 1.7 -
EBITDA (annual avg.)2 $ millions $438 $530 $497
Project Metrics
Growth capital $ millions $1,917 $885 $2,802
Construction length # years 3.0 2.0 -
Operating Metrics
Mine life # years 16.0 28.0 44.0
Cu cathode - mined resources (annual avg.)3 000 tonnes 86.4 101.3 95.9
Cu cathode - total (annual avg.)3 000 tonnes 98.7 123.3 114.3
Copper recovery - sulfide to cathode % 77.3 80.1 79.2
Copper recovery - oxide to cathode % 59.0 58.7 58.9
Sustaining capital (annual avg.) $ millions $33 $35 $34
Cash cost4 $/lb Cu $1.15 $1.11 $1.12
Sustaining cash cost4 $/lb Cu $1.44 $1.42 $1.43
SUMMARY OF KEY METRICS (at $3.50lb Cu)
Note: “LOM” refers to life-of-mine total or average.
1 Calculated assuming the following commodity prices: copper price of $3.50 per pound, copper cathode premium of $0.01 per pound (net of cathode transport charges), silver stream price of $3.90 per ounce and molybdenum price of $11.00 per pound. Reflects the terms of the existing Wheaton Precious Metals stream, including an upfront deposit of $230 million in the first year of Phase I construction in exchange for the delivery of 100% of silver produced.
2 EBITDA is a non-IFRS financial performance measure with no standardized definition under IFRS. For further information, please refer to the
company's most recent Management's Discussion and Analysis for the three months ended March 31, 2022.
3 The mine plan assumes external concentrate is sourced in years when spare capacity exists at the SX/EW facility in order to maximize the full utilization of the facility. Copper cathode production from mined resources excludes the production from external concentrate. Average annual copper cathode production from external concentrates is approximately 12,000 tonnes in Phase I and 22,000 tonnes in Phase II. There remains the potential to replace external copper concentrate with additional internal feed.
4 Cash cost and sustaining cash cost, net of by-product credits, per pound of copper produced from internally sourced feed and excludes the cost of purchasing external copper concentrate, which may vary in price or potentially be replaced with additional internal feed. By-product credits calculated using the following commodity prices: molybdenum price of $11.00 per pound, silver stream price of $3.90 per ounce and amortization of deferred revenue as per the company’s approach in its quarterly financial reporting. By-product credits also include the revenue from the sale of excess acid produced at a price of $145 per tonne. Sustaining cash cost includes sustaining capital expenditures and royalties.
Cash cost and sustaining cash cost are non-IFRS financial performance measures with no standardized definition under IFRS. For further details on why Hudbay believes cash costs are a useful performance indicator, please refer to the company's most recent Management's Discussion and Analysis for the three months ended March 31, 2022.
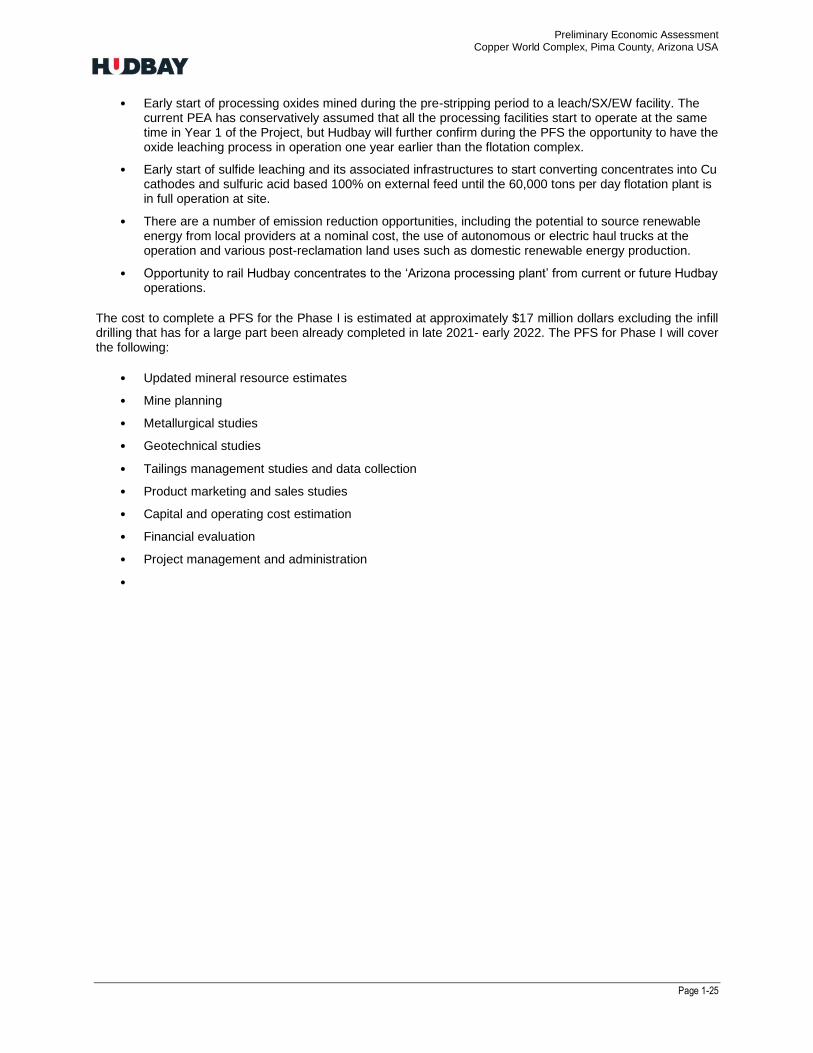
Preliminary Economic Assessment Copper World Complex, Pima County, Arizona USA
Page 1-25
• Early start of processing oxides mined during the pre-stripping period to a leach/SX/EW facility. The current PEA has conservatively assumed that all the processing facilities start to operate at the same time in Year 1 of the Project, but Hudbay will further confirm during the PFS the opportunity to have the oxide leaching process in operation one year earlier than the flotation complex.
• Early start of sulfide leaching and its associated infrastructures to start converting concentrates into Cu cathodes and sulfuric acid based 100% on external feed until the 60,000 tons per day flotation plant is in full operation at site.
• There are a number of emission reduction opportunities, including the potential to source renewable energy from local providers at a nominal cost, the use of autonomous or electric haul trucks at the operation and various post-reclamation land uses such as domestic renewable energy production.
• Opportunity to rail Hudbay concentrates to the ‘Arizona processing plant’ from current or future Hudbay operations.
The cost to complete a PFS for the Phase I is estimated at approximately $17 million dollars excluding the infill drilling that has for a large part been already completed in late 2021- early 2022. The PFS for Phase I will cover the following:
• Updated mineral resource estimates
• Mine planning
• Metallurgical studies
• Geotechnical studies
• Tailings management studies and data collection
• Product marketing and sales studies
• Capital and operating cost estimation
• Financial evaluation
• Project management and administration
•
Preliminary Economic Assessment Copper World Complex, Pima County, Arizona USA
Page 2-26
2. INTRODUCTION AND TERMS OF REFERENCE
2.1 GENERAL
Hudbay is a diversified mining company primarily producing copper concentrate (containing copper, gold and silver), silver/gold doré and zinc and molybdenum concentrates. Hudbay’s mission is to create sustainable value through the acquisition, development, and operation of high-quality, long-life deposits with exploration potential in jurisdictions that support responsible mining, and to see the regions and communities in which the company operates benefit from its presence.
This Technical Report presents the results of a PEA of Hudbay’s 100%-owned Copper World Complex in Arizona, which includes the recently discovered Copper World deposits along with the East deposit (collectively, the “Project”). The Copper World deposits consist of seven deposits, including Bolsa, Broad Top Butte, West (formerly referred to as Copper World), Peach, Elgin, South Limb and North Limb, and are referred to collectively in this Technical Report as “Copper World”. The Rosemont deposit has been renamed the “East” deposit and is referred to as such throughout this Technical Report, unless the historical context requires otherwise. Hudbay previously completed a feasibility study contemplating a standalone development plan for the East deposit and published the results in its 2017 Technical Report.
While litigation over the federal permits for the standalone Rosemont project was ongoing, Hudbay commenced a comprehensive review of the exploration potential of the entire land package it acquired from Augusta Resource Corporation, along with the East deposit, in 2014. Drilling conducted in 2020 and 2021 resulted in the discovery and delineation of multiple satellite deposits, referred to collectively as “Copper World”, in almost a continuous manner over a 7km strike length adjacent to the East deposit.
The recent exploration success on patented mining claims and ongoing litigation uncertainty regarding the project design contemplated by the 2017 Feasibility Study caused Hudbay to evaluate alternative design options to unlock value within this prospective district. This included remodeling the 2017 mineral resources, incorporating the new mineral resources from successful exploration results and completing new metallurgical testing work, which led to a comprehensive review of the mine plan, process plant design, tailings deposition strategies and permitting requirements for the new project.
This Technical Report describes the latest resource model and mine plan and the current state of metallurgical testing, operating cost, and capital cost estimates for the combined development of the Copper World and East deposits and supersedes and replaces the 2017 Technical Report and the mineral resource and mineral reserve estimates for the Rosemont deposit stated therein.
The PEA contemplates a two-phased mine plan with the first phase reflecting a standalone operation with processing infrastructure on Hudbay’s private land and mining occurring on patented mining claims. Phase I is expected to require only state and local permits and reflects a 16-year mine life. Phase II extends the mine life to 44 years through an expansion onto federal land to mine the entire deposits. Phase II would be subject to the federal permitting process. Phase I has been extended for as long as possible as a prudent base case for this PEA but Hudbay expects to secure federal permits much earlier which would unlock considerable value by allowing to mine more tonnes and/or at higher grade sooner than estimated in the mine plan presented in this report.
The Project consists of four planned open pit mines with processing infrastructure that is fundamentally different from what was contemplated in the 2017 Feasibility Study. The project, includes milling, leaching, solvent extraction and electrowinning of both copper sulfide and oxides to produce and sell copper cathodes, molybdenum concentrate, and silver and gold in doré, with sulfuric acid as a by-product. The Project also includes, waste rock and tailings storage facilities, leach pads and supporting infrastructure and utilities.
The PEA is preliminary in nature, includes inferred resources that are considered too speculative geologically to have the economic considerations applied to them that would enable them to be categorized as mineral reserves and there is no certainty the preliminary economic assessment will be realized. All dollar amounts in this Technical Report are in US dollars, unless otherwise noted.
Preliminary Economic Assessment Copper World Complex, Pima County, Arizona USA
Page 2-27
2.2 TERMS OF REFERENCES
This Technical Report conforms with the 2014 CIM Definition Standards and the requirements of NI 43-101.
The QP who supervised the preparation of this Technical Report is Olivier Tavchandjian, P.Geo, Hudbay’s Vice President, Exploration and Technical Services. Mr. Tavchandjian made multiple site visits to the property in the last twelve months to maintain familiarity with conditions on the property, to observe the geology and mineralization and to verify the work completed on the Project. Mr. Tavchandjian has also reviewed and conducted sufficient confirmatory work to act as QP for the reporting of the mineral resource and mineral reserve estimates for the Project.
The Mineral Resource estimates are based on all scientific and technical information as of May 1st, 2022 and therefore have an effective date of May 1st, 2022.
Additional drilling collected since 2017 has focused on the Copper World satellite deposits. The drilling data and assumptions used in the 2017 Technical Report were used to generate the mineral resource model for the East deposit.
Additional mineralogical studies and metallurgical test work has been conducted since 2020 on material collected both at East and at the Copper World deposits to assess the viability of flotation and leaching mineral processing alternatives.
The capital costs, sustaining capital costs and operating costs have been reviewed and updated to reflect the current plan and are expressed in 2022 dollars.
All currency is expressed in United States dollars unless stated otherwise.
This Technical Report includes measurements in both imperial and metric tons. All references to “tons” and “(short) tons” are to imperial tons and all references to “tonnes” are to metric tonnes. Please refer to the Unit Abbreviations below for further information.
2.3 QUALIFIED PERSONS
The Qualified Person (QP) responsible for the preparation of this Technical Report, is Olivier Tavchandjian, P. Geo., Hudbay’s Vice President, Exploration and Technical Services. Mr Tavchandjian is not independent from the company.
2.4 SITE VISITS AND RESPONSIBILITY
Site visits to the Project have been completed as shown in Table 2-1.
TABLE 2-1: DATES OF RECENT SITE VISITS
QP Name Site Visit Dates
Olivier Tavchandjian
May 17 – 22, 2021
September 7 – 11, 2021
February 1-4, 2022
March 8-9, 2022
April 11-14, 2022
Mr. Tavchandjian, while on site, reviewed the site property, project office, and drilled core samples that remain at site and visited two external laboratories that were used for the 2020 and 2021 drill programs.
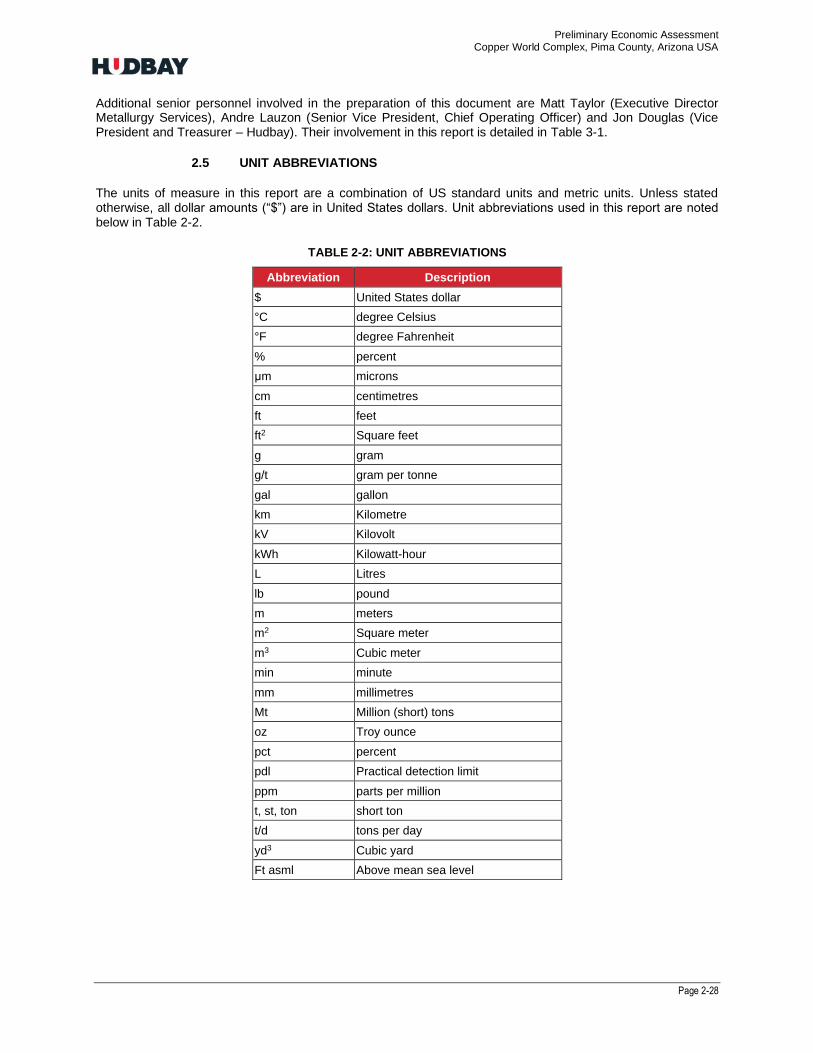
Preliminary Economic Assessment Copper World Complex, Pima County, Arizona USA
Page 2-28
Additional senior personnel involved in the preparation of this document are Matt Taylor (Executive Director Metallurgy Services), Andre Lauzon (Senior Vice President, Chief Operating Officer) and Jon Douglas (Vice President and Treasurer – Hudbay). Their involvement in this report is detailed in Table 3-1.
2.5 UNIT ABBREVIATIONS
The units of measure in this report are a combination of US standard units and metric units. Unless stated otherwise, all dollar amounts (“$”) are in United States dollars. Unit abbreviations used in this report are noted below in Table 2-2.
TABLE 2-2: UNIT ABBREVIATIONS
Abbreviation Description
$ United States dollar
°C degree Celsius
°F degree Fahrenheit
% percent
μm microns
cm centimetres
ft feet
ft2 Square feet
g gram
g/t gram per tonne
gal gallon
km Kilometre
kV Kilovolt
kWh Kilowatt-hour
L Litres
lb pound
m meters
m2 Square meter
m3 Cubic meter
min minute
mm millimetres
Mt Million (short) tons
oz Troy ounce
pct percent
pdl Practical detection limit
ppm parts per million
t, st, ton short ton
t/d tons per day
yd3 Cubic yard
Ft asml Above mean sea level
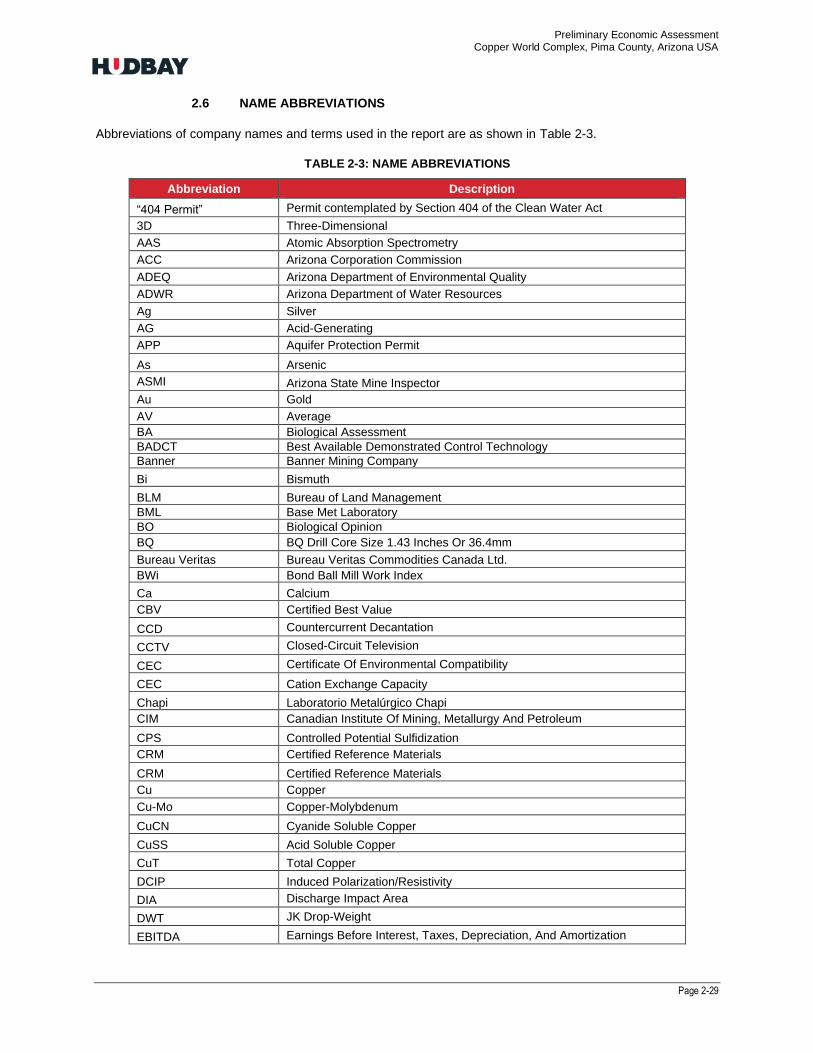
Preliminary Economic Assessment Copper World Complex, Pima County, Arizona USA
Page 2-29
2.6 NAME ABBREVIATIONS
Abbreviations of company names and terms used in the report are as shown in Table 2-3.
TABLE 2-3: NAME ABBREVIATIONS
Abbreviation Description
“404 Permit” Permit contemplated by Section 404 of the Clean Water Act
3D Three-Dimensional
AAS Atomic Absorption Spectrometry
ACC Arizona Corporation Commission
ADEQ Arizona Department of Environmental Quality
ADWR Arizona Department of Water Resources
Ag Silver
AG Acid-Generating
APP Aquifer Protection Permit
As Arsenic
ASMI Arizona State Mine Inspector
Au Gold
AV Average
BA Biological Assessment
BADCT Best Available Demonstrated Control Technology
Banner Banner Mining Company
Bi Bismuth
BLM Bureau of Land Management
BML Base Met Laboratory
BO Biological Opinion
BQ BQ Drill Core Size 1.43 Inches Or 36.4mm
Bureau Veritas Bureau Veritas Commodities Canada Ltd.
BWi Bond Ball Mill Work Index
Ca Calcium
CBV Certified Best Value
CCD Countercurrent Decantation
CCTV Closed-Circuit Television
CEC Certificate Of Environmental Compatibility
CEC Cation Exchange Capacity
Chapi Laboratorio Metalúrgico Chapi
CIM Canadian Institute Of Mining, Metallurgy And Petroleum
CPS Controlled Potential Sulfidization
CRM Certified Reference Materials
CRM Certified Reference Materials
Cu Copper
Cu-Mo Copper-Molybdenum
CuCN Cyanide Soluble Copper
CuSS Acid Soluble Copper
CuT Total Copper
DCIP Induced Polarization/Resistivity
DIA Discharge Impact Area
DWT JK Drop-Weight
EBITDA Earnings Before Interest, Taxes, Depreciation, And Amortization

Preliminary Economic Assessment Copper World Complex, Pima County, Arizona USA
Page 2-30
EDA Exploratory Data Analysis
EIS Environmental Impact Statement
EPCM Engineering Procurement and Construction Manager
EPMA Electron Probe Micro-analysis
FASL Feet Above Sea Level Elevation
Fe Iron
FROD Final Record of Decision
FUP Floodplain Use Permit
GCL Geosynthetic Clay Liner
H2SO4 Sulfuric acid
HLP Leach Pads
HMI Human Machine Interface
HPTPs Historic Properties Treatment Plans
HQ HQ drill core size 2.50 inches or 63.5 mm diameter
Hudbay Collectively, Hudbay Minerals Inc. and its subsidiaries and business units
ICP Inductively Coupled Plasma
ICP-ES Inductively Coupled Plasma Emission SpectroscopyInductively Coupled Plasma Emission Spectroscopy
ICP-MS Inductively Coupled Plasma Mass Spectrometry
ICP-OES Inductively Coupled Plasma Optical Emission Spectroscopy
IP Pg 9-20
ISO International Standards Organization
K Potassium
KCA Kappes, Cassiday & Associates
LG Lerchs-Grossman
LOM Life Of Mine
Mg Magnesium
MLRP Arizona Mined Land Reclamation Plan
Mo Molybdenum
MPO Mine Plan of Operations
MSGP Arizona Pollutant Elimination System Multi-Sector General Permit
MSRDI Mountain State R&D International
Na Sodium
NaCN Sodium Cyanide
NAG Non-Acid Generating
NaHS Sodium Hydrosulfide
NEPA National Environmental Policy Act
NHPA National Historic Preservation Act
NIR Near Infrared Spectroscopy
NN Nearest Neighbour
NPV Net present value
NQ HQ drill core size 1.875 inches or 47.6 mm diameter
NSR Net smelter return
OK Ordinary Kriging
OREAS Ore Research and Exploration
OSA Online Sample Analyzer
P Phosphorus
PAG Potentially Acid Generating
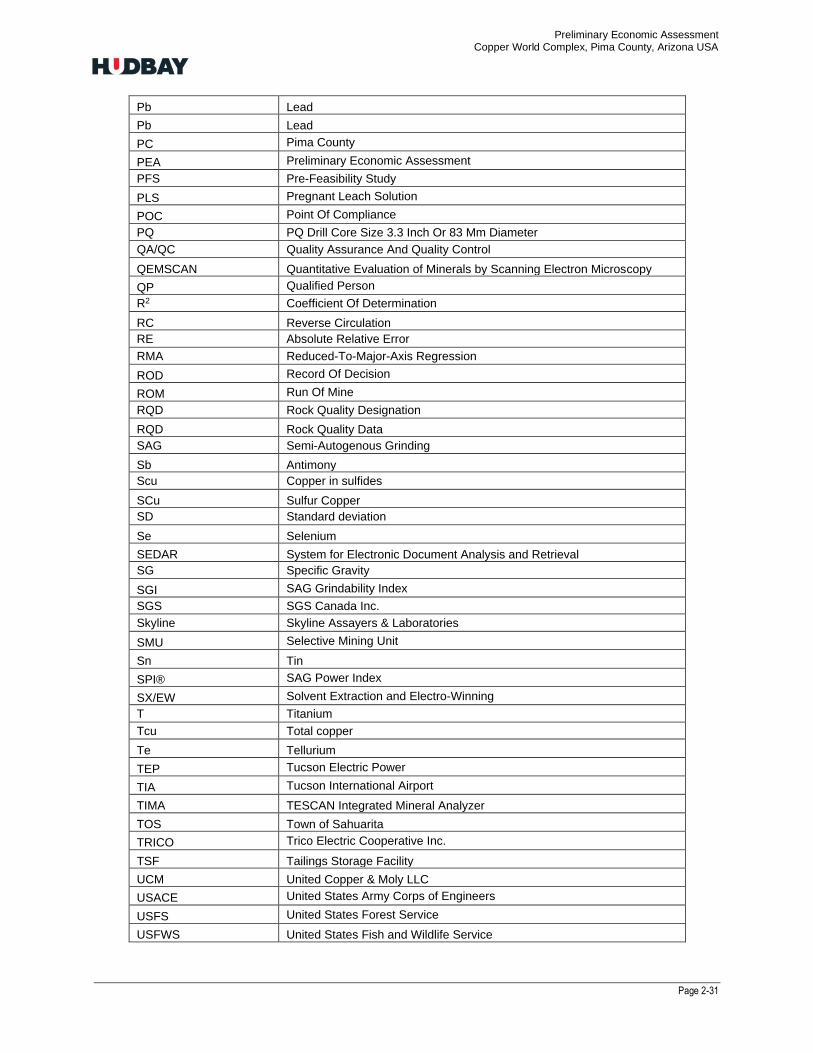
Preliminary Economic Assessment Copper World Complex, Pima County, Arizona USA
Page 2-31
Pb Lead
Pb Lead
PC Pima County
PEA Preliminary Economic Assessment
PFS Pre-Feasibility Study
PLS Pregnant Leach Solution
POC Point Of Compliance
PQ PQ Drill Core Size 3.3 Inch Or 83 Mm Diameter
QA/QC Quality Assurance And Quality Control
QEMSCAN Quantitative Evaluation of Minerals by Scanning Electron Microscopy
QP Qualified Person
R2 Coefficient Of Determination
RC Reverse Circulation
RE Absolute Relative Error
RMA Reduced-To-Major-Axis Regression
ROD Record Of Decision
ROM Run Of Mine
RQD Rock Quality Designation
RQD Rock Quality Data
SAG Semi-Autogenous Grinding
Sb Antimony
Scu Copper in sulfides
SCu Sulfur Copper
SD Standard deviation
Se Selenium
SEDAR System for Electronic Document Analysis and Retrieval
SG Specific Gravity
SGI SAG Grindability Index
SGS SGS Canada Inc.
Skyline Skyline Assayers & Laboratories
SMU Selective Mining Unit
Sn Tin
SPI® SAG Power Index
SX/EW Solvent Extraction and Electro-Winning
T Titanium
Tcu Total copper
Te Tellurium
TEP Tucson Electric Power
TIA Tucson International Airport
TIMA TESCAN Integrated Mineral Analyzer
TOS Town of Sahuarita
TRICO Trico Electric Cooperative Inc.
TSF Tailings Storage Facility
UCM United Copper & Moly LLC
USACE United States Army Corps of Engineers
USFS United States Forest Service
USFWS United States Fish and Wildlife Service

Preliminary Economic Assessment Copper World Complex, Pima County, Arizona USA
Page 2-32
VoIP Voice-over Internet Protocol
WOTUS Waters of the United States
WRFs waste rock facilities
XPS XPS Consulting & Test work Services
XRD X-Ray Diffraction
Zn Zinc

Preliminary Economic Assessment Copper World Complex, Pima County, Arizona USA
Page 3-33
3. RELIANCE ON OTHER EXPERTS
The information, conclusions, opinions, and estimates contained herein are based on:
• Information available to Hudbay at the time of preparation of this Technical Report, and
• Assumptions, conditions, and qualifications as set forth in this Technical Report.
TABLE 3-1: RESPONSIBLE PERSON FOR EACH SECTION OF THIS REPORT
Section Description Responsible Person
1 Summary Olivier Tavchandjian
2 Introduction Olivier Tavchandjian
3 Reliance on Other Experts Olivier Tavchandjian
4 Property Description and Location Andre Lauzon
5 Accessibility, Climate, Local Resources,
Infrastructure and Physiography Olivier Tavchandjian
6 History Olivier Tavchandjian
7 Geological Setting and Mineralization Olivier Tavchandjian
8 Deposit Type Olivier Tavchandjian
9 Exploration Olivier Tavchandjian
10 Drilling Olivier Tavchandjian
11 Sample Preparation Analyses and Security Olivier Tavchandjian
12 Data Verification Olivier Tavchandjian
13 Mineral Processing and Metallurgical Testing Matt Taylor
14 Mineral Resource Estimates Olivier Tavchandjian
15 Mineral Reserve Estimates Not Applicable
16 Mining Methods Andre Lauzon
17 Recovery Methods Matt Taylor
18 Project Infrastructure Andre Lauzon
19 Market Studies and Contracts Jon Douglas
20 Environmental Studies, Permitting, and Social or Community Impact
Andre Lauzon
21 Capital and Operating Costs Andre Lauzon
22 Economic Analysis Andre Lauzon
23 Adjacent Properties Olivier Tavchandjian
24 Other Relevant Data and Information Olivier Tavchandjian
25 Interpretation and Conclusions Olivier Tavchandjian
26 Recommendations Olivier Tavchandjian
27 References Olivier Tavchandjian
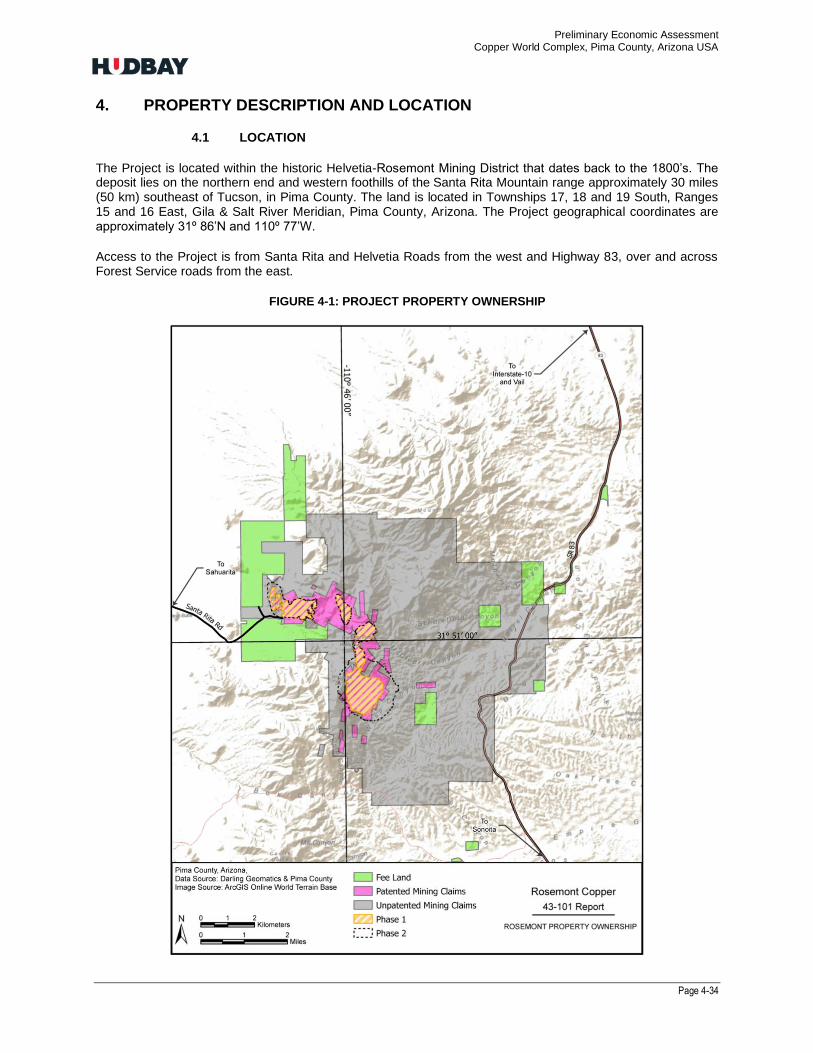
Preliminary Economic Assessment Copper World Complex, Pima County, Arizona USA
Page 4-34
4. PROPERTY DESCRIPTION AND LOCATION
4.1 LOCATION
The Project is located within the historic Helvetia-Rosemont Mining District that dates back to the 1800’s. The deposit lies on the northern end and western foothills of the Santa Rita Mountain range approximately 30 miles (50 km) southeast of Tucson, in Pima County. The land is located in Townships 17, 18 and 19 South, Ranges 15 and 16 East, Gila & Salt River Meridian, Pima County, Arizona. The Project geographical coordinates are approximately 31º 86’N and 110º 77’W.
Access to the Project is from Santa Rita and Helvetia Roads from the west and Highway 83, over and across Forest Service roads from the east.
FIGURE 4-1: PROJECT PROPERTY OWNERSHIP
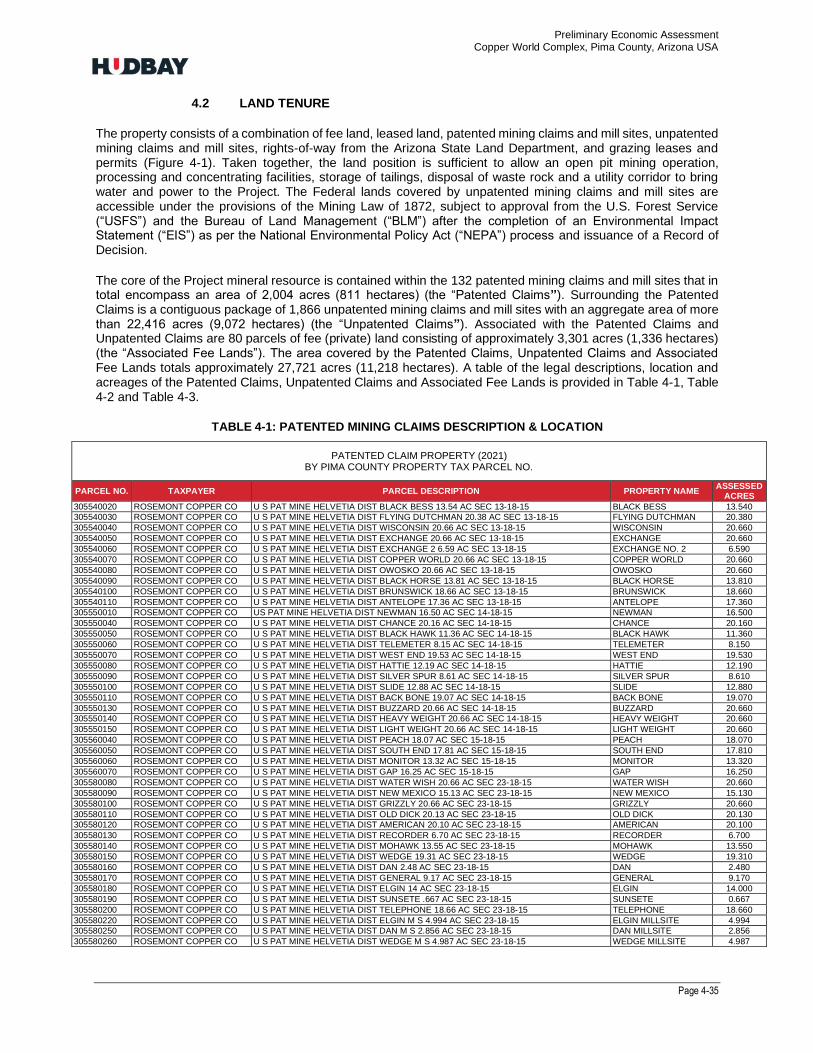
Preliminary Economic Assessment Copper World Complex, Pima County, Arizona USA
Page 4-35
4.2 LAND TENURE
The property consists of a combination of fee land, leased land, patented mining claims and mill sites, unpatented mining claims and mill sites, rights-of-way from the Arizona State Land Department, and grazing leases and permits (Figure 4-1). Taken together, the land position is sufficient to allow an open pit mining operation, processing and concentrating facilities, storage of tailings, disposal of waste rock and a utility corridor to bring water and power to the Project. The Federal lands covered by unpatented mining claims and mill sites are accessible under the provisions of the Mining Law of 1872, subject to approval from the U.S. Forest Service (“USFS”) and the Bureau of Land Management (“BLM”) after the completion of an Environmental Impact Statement (“EIS”) as per the National Environmental Policy Act (“NEPA”) process and issuance of a Record of Decision.
The core of the Project mineral resource is contained within the 132 patented mining claims and mill sites that in total encompass an area of 2,004 acres (811 hectares) (the “Patented Claims”). Surrounding the Patented Claims is a contiguous package of 1,866 unpatented mining claims and mill sites with an aggregate area of more than 22,416 acres (9,072 hectares) (the “Unpatented Claims”). Associated with the Patented Claims and Unpatented Claims are 80 parcels of fee (private) land consisting of approximately 3,301 acres (1,336 hectares) (the “Associated Fee Lands”). The area covered by the Patented Claims, Unpatented Claims and Associated Fee Lands totals approximately 27,721 acres (11,218 hectares). A table of the legal descriptions, location and acreages of the Patented Claims, Unpatented Claims and Associated Fee Lands is provided in Table 4-1, Table 4-2 and Table 4-3.
TABLE 4-1: PATENTED MINING CLAIMS DESCRIPTION & LOCATION
PATENTED CLAIM PROPERTY (2021) BY PIMA COUNTY PROPERTY TAX PARCEL NO.
PARCEL NO. TAXPAYER PARCEL DESCRIPTION PROPERTY NAME ASSESSED
ACRES
305540020 ROSEMONT COPPER CO U S PAT MINE HELVETIA DIST BLACK BESS 13.54 AC SEC 13-18-15 BLACK BESS 13.540
305540030 ROSEMONT COPPER CO U S PAT MINE HELVETIA DIST FLYING DUTCHMAN 20.38 AC SEC 13-18-15 FLYING DUTCHMAN 20.380
305540040 ROSEMONT COPPER CO U S PAT MINE HELVETIA DIST WISCONSIN 20.66 AC SEC 13-18-15 WISCONSIN 20.660
305540050 ROSEMONT COPPER CO U S PAT MINE HELVETIA DIST EXCHANGE 20.66 AC SEC 13-18-15 EXCHANGE 20.660
305540060 ROSEMONT COPPER CO U S PAT MINE HELVETIA DIST EXCHANGE 2 6.59 AC SEC 13-18-15 EXCHANGE NO. 2 6.590
305540070 ROSEMONT COPPER CO U S PAT MINE HELVETIA DIST COPPER WORLD 20.66 AC SEC 13-18-15 COPPER WORLD 20.660
305540080 ROSEMONT COPPER CO U S PAT MINE HELVETIA DIST OWOSKO 20.66 AC SEC 13-18-15 OWOSKO 20.660
305540090 ROSEMONT COPPER CO U S PAT MINE HELVETIA DIST BLACK HORSE 13.81 AC SEC 13-18-15 BLACK HORSE 13.810
305540100 ROSEMONT COPPER CO U S PAT MINE HELVETIA DIST BRUNSWICK 18.66 AC SEC 13-18-15 BRUNSWICK 18.660
305540110 ROSEMONT COPPER CO U S PAT MINE HELVETIA DIST ANTELOPE 17.36 AC SEC 13-18-15 ANTELOPE 17.360
305550010 ROSEMONT COPPER CO US PAT MINE HELVETIA DIST NEWMAN 16.50 AC SEC 14-18-15 NEWMAN 16.500
305550040 ROSEMONT COPPER CO U S PAT MINE HELVETIA DIST CHANCE 20.16 AC SEC 14-18-15 CHANCE 20.160
305550050 ROSEMONT COPPER CO U S PAT MINE HELVETIA DIST BLACK HAWK 11.36 AC SEC 14-18-15 BLACK HAWK 11.360
305550060 ROSEMONT COPPER CO U S PAT MINE HELVETIA DIST TELEMETER 8.15 AC SEC 14-18-15 TELEMETER 8.150
305550070 ROSEMONT COPPER CO U S PAT MINE HELVETIA DIST WEST END 19.53 AC SEC 14-18-15 WEST END 19.530
305550080 ROSEMONT COPPER CO U S PAT MINE HELVETIA DIST HATTIE 12.19 AC SEC 14-18-15 HATTIE 12.190
305550090 ROSEMONT COPPER CO U S PAT MINE HELVETIA DIST SILVER SPUR 8.61 AC SEC 14-18-15 SILVER SPUR 8.610
305550100 ROSEMONT COPPER CO U S PAT MINE HELVETIA DIST SLIDE 12.88 AC SEC 14-18-15 SLIDE 12.880
305550110 ROSEMONT COPPER CO U S PAT MINE HELVETIA DIST BACK BONE 19.07 AC SEC 14-18-15 BACK BONE 19.070
305550130 ROSEMONT COPPER CO U S PAT MINE HELVETIA DIST BUZZARD 20.66 AC SEC 14-18-15 BUZZARD 20.660
305550140 ROSEMONT COPPER CO U S PAT MINE HELVETIA DIST HEAVY WEIGHT 20.66 AC SEC 14-18-15 HEAVY WEIGHT 20.660
305550150 ROSEMONT COPPER CO U S PAT MINE HELVETIA DIST LIGHT WEIGHT 20.66 AC SEC 14-18-15 LIGHT WEIGHT 20.660
305560040 ROSEMONT COPPER CO U S PAT MINE HELVETIA DIST PEACH 18.07 AC SEC 15-18-15 PEACH 18.070
305560050 ROSEMONT COPPER CO U S PAT MINE HELVETIA DIST SOUTH END 17.81 AC SEC 15-18-15 SOUTH END 17.810
305560060 ROSEMONT COPPER CO U S PAT MINE HELVETIA DIST MONITOR 13.32 AC SEC 15-18-15 MONITOR 13.320
305560070 ROSEMONT COPPER CO U S PAT MINE HELVETIA DIST GAP 16.25 AC SEC 15-18-15 GAP 16.250
305580080 ROSEMONT COPPER CO U S PAT MINE HELVETIA DIST WATER WISH 20.66 AC SEC 23-18-15 WATER WISH 20.660
305580090 ROSEMONT COPPER CO U S PAT MINE HELVETIA DIST NEW MEXICO 15.13 AC SEC 23-18-15 NEW MEXICO 15.130
305580100 ROSEMONT COPPER CO U S PAT MINE HELVETIA DIST GRIZZLY 20.66 AC SEC 23-18-15 GRIZZLY 20.660
305580110 ROSEMONT COPPER CO U S PAT MINE HELVETIA DIST OLD DICK 20.13 AC SEC 23-18-15 OLD DICK 20.130
305580120 ROSEMONT COPPER CO U S PAT MINE HELVETIA DIST AMERICAN 20.10 AC SEC 23-18-15 AMERICAN 20.100
305580130 ROSEMONT COPPER CO U S PAT MINE HELVETIA DIST RECORDER 6.70 AC SEC 23-18-15 RECORDER 6.700
305580140 ROSEMONT COPPER CO U S PAT MINE HELVETIA DIST MOHAWK 13.55 AC SEC 23-18-15 MOHAWK 13.550
305580150 ROSEMONT COPPER CO U S PAT MINE HELVETIA DIST WEDGE 19.31 AC SEC 23-18-15 WEDGE 19.310
305580160 ROSEMONT COPPER CO U S PAT MINE HELVETIA DIST DAN 2.48 AC SEC 23-18-15 DAN 2.480
305580170 ROSEMONT COPPER CO U S PAT MINE HELVETIA DIST GENERAL 9.17 AC SEC 23-18-15 GENERAL 9.170
305580180 ROSEMONT COPPER CO U S PAT MINE HELVETIA DIST ELGIN 14 AC SEC 23-18-15 ELGIN 14.000
305580190 ROSEMONT COPPER CO U S PAT MINE HELVETIA DIST SUNSETE .667 AC SEC 23-18-15 SUNSETE 0.667
305580200 ROSEMONT COPPER CO U S PAT MINE HELVETIA DIST TELEPHONE 18.66 AC SEC 23-18-15 TELEPHONE 18.660
305580220 ROSEMONT COPPER CO U S PAT MINE HELVETIA DIST ELGIN M S 4.994 AC SEC 23-18-15 ELGIN MILLSITE 4.994
305580250 ROSEMONT COPPER CO U S PAT MINE HELVETIA DIST DAN M S 2.856 AC SEC 23-18-15 DAN MILLSITE 2.856
305580260 ROSEMONT COPPER CO U S PAT MINE HELVETIA DIST WEDGE M S 4.987 AC SEC 23-18-15 WEDGE MILLSITE 4.987
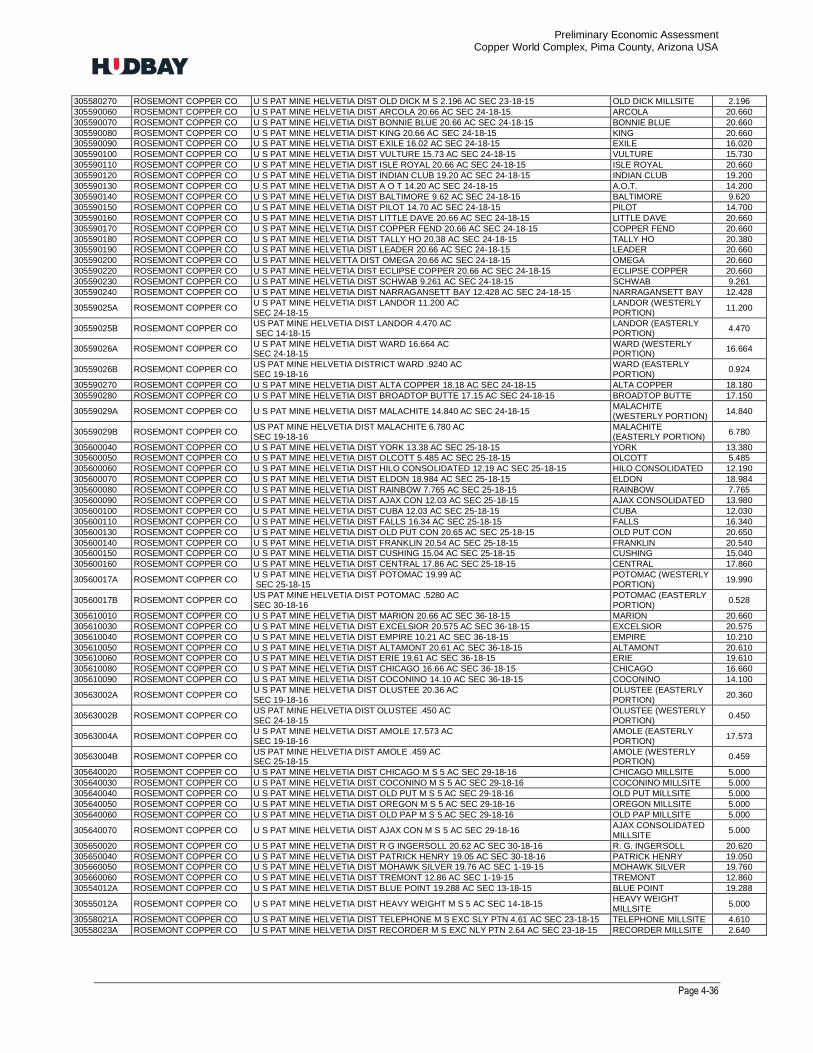
Preliminary Economic Assessment Copper World Complex, Pima County, Arizona USA
Page 4-36
305580270 ROSEMONT COPPER CO U S PAT MINE HELVETIA DIST OLD DICK M S 2.196 AC SEC 23-18-15 OLD DICK MILLSITE 2.196
305590060 ROSEMONT COPPER CO U S PAT MINE HELVETIA DIST ARCOLA 20.66 AC SEC 24-18-15 ARCOLA 20.660
305590070 ROSEMONT COPPER CO U S PAT MINE HELVETIA DIST BONNIE BLUE 20.66 AC SEC 24-18-15 BONNIE BLUE 20.660
305590080 ROSEMONT COPPER CO U S PAT MINE HELVETIA DIST KING 20.66 AC SEC 24-18-15 KING 20.660
305590090 ROSEMONT COPPER CO U S PAT MINE HELVETIA DIST EXILE 16.02 AC SEC 24-18-15 EXILE 16.020
305590100 ROSEMONT COPPER CO U S PAT MINE HELVETIA DIST VULTURE 15.73 AC SEC 24-18-15 VULTURE 15.730
305590110 ROSEMONT COPPER CO U S PAT MINE HELVETIA DIST ISLE ROYAL 20.66 AC SEC 24-18-15 ISLE ROYAL 20.660
305590120 ROSEMONT COPPER CO U S PAT MINE HELVETIA DIST INDIAN CLUB 19.20 AC SEC 24-18-15 INDIAN CLUB 19.200
305590130 ROSEMONT COPPER CO U S PAT MINE HELVETIA DIST A O T 14.20 AC SEC 24-18-15 A.O.T. 14.200
305590140 ROSEMONT COPPER CO U S PAT MINE HELVETIA DIST BALTIMORE 9.62 AC SEC 24-18-15 BALTIMORE 9.620
305590150 ROSEMONT COPPER CO U S PAT MINE HELVETIA DIST PILOT 14.70 AC SEC 24-18-15 PILOT 14.700
305590160 ROSEMONT COPPER CO U S PAT MINE HELVETIA DIST LITTLE DAVE 20.66 AC SEC 24-18-15 LITTLE DAVE 20.660
305590170 ROSEMONT COPPER CO U S PAT MINE HELVETIA DIST COPPER FEND 20.66 AC SEC 24-18-15 COPPER FEND 20.660
305590180 ROSEMONT COPPER CO U S PAT MINE HELVETIA DIST TALLY HO 20.38 AC SEC 24-18-15 TALLY HO 20.380
305590190 ROSEMONT COPPER CO U S PAT MINE HELVETIA DIST LEADER 20.66 AC SEC 24-18-15 LEADER 20.660
305590200 ROSEMONT COPPER CO U S PAT MINE HELVETTA DIST OMEGA 20.66 AC SEC 24-18-15 OMEGA 20.660
305590220 ROSEMONT COPPER CO U S PAT MINE HELVETIA DIST ECLIPSE COPPER 20.66 AC SEC 24-18-15 ECLIPSE COPPER 20.660
305590230 ROSEMONT COPPER CO U S PAT MINE HELVETIA DIST SCHWAB 9.261 AC SEC 24-18-15 SCHWAB 9.261
305590240 ROSEMONT COPPER CO U S PAT MINE HELVETIA DIST NARRAGANSETT BAY 12.428 AC SEC 24-18-15 NARRAGANSETT BAY 12.428
30559025A ROSEMONT COPPER CO U S PAT MINE HELVETIA DIST LANDOR 11.200 AC SEC 24-18-15
LANDOR (WESTERLY PORTION)
11.200
30559025B ROSEMONT COPPER CO US PAT MINE HELVETIA DIST LANDOR 4.470 AC SEC 14-18-15
LANDOR (EASTERLY PORTION)
4.470
30559026A ROSEMONT COPPER CO U S PAT MINE HELVETIA DIST WARD 16.664 AC SEC 24-18-15
WARD (WESTERLY PORTION)
16.664
30559026B ROSEMONT COPPER CO US PAT MINE HELVETIA DISTRICT WARD .9240 AC SEC 19-18-16
WARD (EASTERLY PORTION)
0.924
305590270 ROSEMONT COPPER CO U S PAT MINE HELVETIA DIST ALTA COPPER 18.18 AC SEC 24-18-15 ALTA COPPER 18.180
305590280 ROSEMONT COPPER CO U S PAT MINE HELVETIA DIST BROADTOP BUTTE 17.15 AC SEC 24-18-15 BROADTOP BUTTE 17.150
30559029A ROSEMONT COPPER CO U S PAT MINE HELVETIA DIST MALACHITE 14.840 AC SEC 24-18-15 MALACHITE (WESTERLY PORTION)
14.840
30559029B ROSEMONT COPPER CO US PAT MINE HELVETIA DIST MALACHITE 6.780 AC SEC 19-18-16
MALACHITE (EASTERLY PORTION)
6.780
305600040 ROSEMONT COPPER CO U S PAT MINE HELVETIA DIST YORK 13.38 AC SEC 25-18-15 YORK 13.380
305600050 ROSEMONT COPPER CO U S PAT MINE HELVETIA DIST OLCOTT 5.485 AC SEC 25-18-15 OLCOTT 5.485
305600060 ROSEMONT COPPER CO U S PAT MINE HELVETIA DIST HILO CONSOLIDATED 12.19 AC SEC 25-18-15 HILO CONSOLIDATED 12.190
305600070 ROSEMONT COPPER CO U S PAT MINE HELVETIA DIST ELDON 18.984 AC SEC 25-18-15 ELDON 18.984
305600080 ROSEMONT COPPER CO U S PAT MINE HELVETIA DIST RAINBOW 7.765 AC SEC 25-18-15 RAINBOW 7.765
305600090 ROSEMONT COPPER CO U S PAT MINE HELVETIA DIST AJAX CON 12.03 AC SEC 25-18-15 AJAX CONSOLIDATED 13.980
305600100 ROSEMONT COPPER CO U S PAT MINE HELVETIA DIST CUBA 12.03 AC SEC 25-18-15 CUBA 12.030
305600110 ROSEMONT COPPER CO U S PAT MINE HELVETIA DIST FALLS 16.34 AC SEC 25-18-15 FALLS 16.340
305600130 ROSEMONT COPPER CO U S PAT MINE HELVETIA DIST OLD PUT CON 20.65 AC SEC 25-18-15 OLD PUT CON 20.650
305600140 ROSEMONT COPPER CO U S PAT MINE HELVETIA DIST FRANKLIN 20.54 AC SEC 25-18-15 FRANKLIN 20.540
305600150 ROSEMONT COPPER CO U S PAT MINE HELVETIA DIST CUSHING 15.04 AC SEC 25-18-15 CUSHING 15.040
305600160 ROSEMONT COPPER CO U S PAT MINE HELVETIA DIST CENTRAL 17.86 AC SEC 25-18-15 CENTRAL 17.860
30560017A ROSEMONT COPPER CO U S PAT MINE HELVETIA DIST POTOMAC 19.99 AC SEC 25-18-15
POTOMAC (WESTERLY PORTION)
19.990
30560017B ROSEMONT COPPER CO US PAT MINE HELVETIA DIST POTOMAC .5280 AC SEC 30-18-16
POTOMAC (EASTERLY PORTION)
0.528
305610010 ROSEMONT COPPER CO U S PAT MINE HELVETIA DIST MARION 20.66 AC SEC 36-18-15 MARION 20.660
305610030 ROSEMONT COPPER CO U S PAT MINE HELVETIA DIST EXCELSIOR 20.575 AC SEC 36-18-15 EXCELSIOR 20.575
305610040 ROSEMONT COPPER CO U S PAT MINE HELVETIA DIST EMPIRE 10.21 AC SEC 36-18-15 EMPIRE 10.210
305610050 ROSEMONT COPPER CO U S PAT MINE HELVETIA DIST ALTAMONT 20.61 AC SEC 36-18-15 ALTAMONT 20.610
305610060 ROSEMONT COPPER CO U S PAT MINE HELVETIA DIST ERIE 19.61 AC SEC 36-18-15 ERIE 19.610
305610080 ROSEMONT COPPER CO U S PAT MINE HELVETIA DIST CHICAGO 16.66 AC SEC 36-18-15 CHICAGO 16.660
305610090 ROSEMONT COPPER CO U S PAT MINE HELVETIA DIST COCONINO 14.10 AC SEC 36-18-15 COCONINO 14.100
30563002A ROSEMONT COPPER CO U S PAT MINE HELVETIA DIST OLUSTEE 20.36 AC SEC 19-18-16
OLUSTEE (EASTERLY PORTION)
20.360
30563002B ROSEMONT COPPER CO US PAT MINE HELVETIA DIST OLUSTEE .450 AC SEC 24-18-15
OLUSTEE (WESTERLY PORTION)
0.450
30563004A ROSEMONT COPPER CO U S PAT MINE HELVETIA DIST AMOLE 17.573 AC SEC 19-18-16
AMOLE (EASTERLY PORTION)
17.573
30563004B ROSEMONT COPPER CO US PAT MINE HELVETIA DIST AMOLE .459 AC SEC 25-18-15
AMOLE (WESTERLY PORTION)
0.459
305640020 ROSEMONT COPPER CO U S PAT MINE HELVETIA DIST CHICAGO M S 5 AC SEC 29-18-16 CHICAGO MILLSITE 5.000
305640030 ROSEMONT COPPER CO U S PAT MINE HELVETIA DIST COCONINO M S 5 AC SEC 29-18-16 COCONINO MILLSITE 5.000
305640040 ROSEMONT COPPER CO U S PAT MINE HELVETIA DIST OLD PUT M S 5 AC SEC 29-18-16 OLD PUT MILLSITE 5.000
305640050 ROSEMONT COPPER CO U S PAT MINE HELVETIA DIST OREGON M S 5 AC SEC 29-18-16 OREGON MILLSITE 5.000
305640060 ROSEMONT COPPER CO U S PAT MINE HELVETIA DIST OLD PAP M S 5 AC SEC 29-18-16 OLD PAP MILLSITE 5.000
305640070 ROSEMONT COPPER CO U S PAT MINE HELVETIA DIST AJAX CON M S 5 AC SEC 29-18-16 AJAX CONSOLIDATED MILLSITE
5.000
305650020 ROSEMONT COPPER CO U S PAT MINE HELVETIA DIST R G INGERSOLL 20.62 AC SEC 30-18-16 R. G. INGERSOLL 20.620
305650040 ROSEMONT COPPER CO U S PAT MINE HELVETIA DIST PATRICK HENRY 19.05 AC SEC 30-18-16 PATRICK HENRY 19.050
305660050 ROSEMONT COPPER CO U S PAT MINE HELVETIA DIST MOHAWK SILVER 19.76 AC SEC 1-19-15 MOHAWK SILVER 19.760
305660060 ROSEMONT COPPER CO U S PAT MINE HELVETIA DIST TREMONT 12.86 AC SEC 1-19-15 TREMONT 12.860
30554012A ROSEMONT COPPER CO U S PAT MINE HELVETIA DIST BLUE POINT 19.288 AC SEC 13-18-15 BLUE POINT 19.288
30555012A ROSEMONT COPPER CO U S PAT MINE HELVETIA DIST HEAVY WEIGHT M S 5 AC SEC 14-18-15 HEAVY WEIGHT MILLSITE
5.000
30558021A ROSEMONT COPPER CO U S PAT MINE HELVETIA DIST TELEPHONE M S EXC SLY PTN 4.61 AC SEC 23-18-15 TELEPHONE MILLSITE 4.610
30558023A ROSEMONT COPPER CO U S PAT MINE HELVETIA DIST RECORDER M S EXC NLY PTN 2.64 AC SEC 23-18-15 RECORDER MILLSITE 2.640
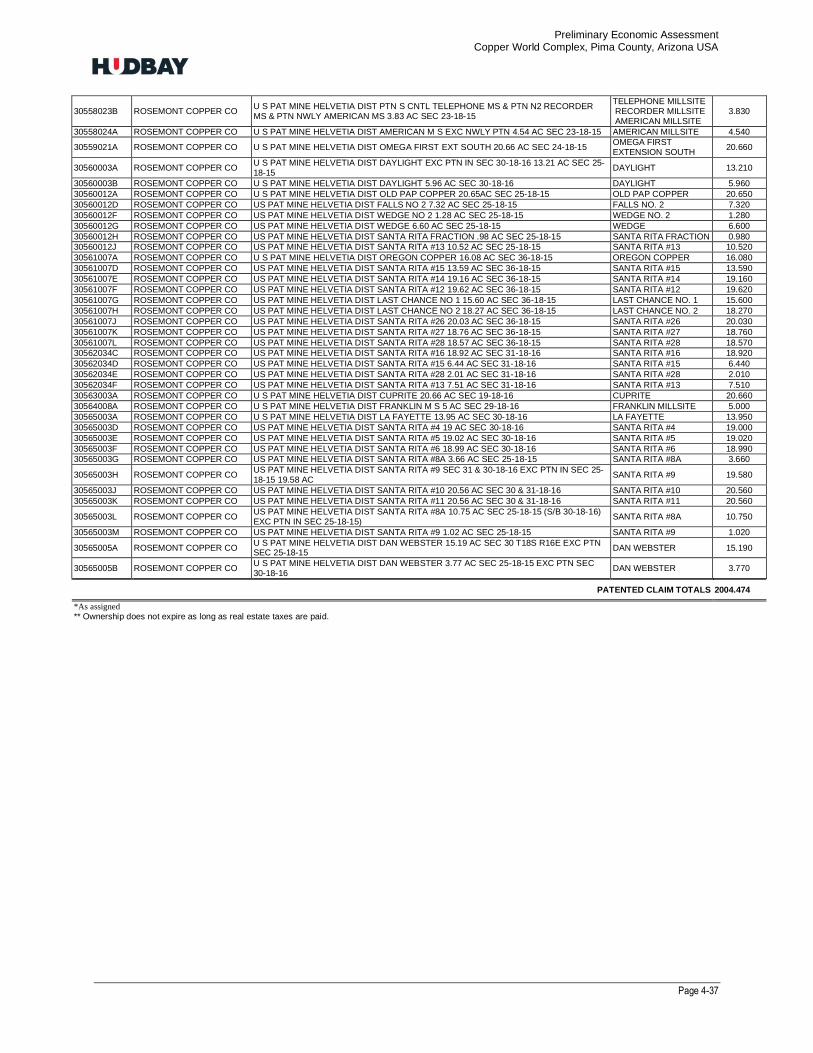
Preliminary Economic Assessment Copper World Complex, Pima County, Arizona USA
Page 4-37
30558023B ROSEMONT COPPER CO U S PAT MINE HELVETIA DIST PTN S CNTL TELEPHONE MS & PTN N2 RECORDER MS & PTN NWLY AMERICAN MS 3.83 AC SEC 23-18-15
TELEPHONE MILLSITE RECORDER MILLSITE AMERICAN MILLSITE
3.830
30558024A ROSEMONT COPPER CO U S PAT MINE HELVETIA DIST AMERICAN M S EXC NWLY PTN 4.54 AC SEC 23-18-15 AMERICAN MILLSITE 4.540
30559021A ROSEMONT COPPER CO U S PAT MINE HELVETIA DIST OMEGA FIRST EXT SOUTH 20.66 AC SEC 24-18-15 OMEGA FIRST EXTENSION SOUTH
20.660
30560003A ROSEMONT COPPER CO U S PAT MINE HELVETIA DIST DAYLIGHT EXC PTN IN SEC 30-18-16 13.21 AC SEC 25-18-15
DAYLIGHT 13.210
30560003B ROSEMONT COPPER CO U S PAT MINE HELVETIA DIST DAYLIGHT 5.96 AC SEC 30-18-16 DAYLIGHT 5.960
30560012A ROSEMONT COPPER CO U S PAT MINE HELVETIA DIST OLD PAP COPPER 20.65AC SEC 25-18-15 OLD PAP COPPER 20.650
30560012D ROSEMONT COPPER CO US PAT MINE HELVETIA DIST FALLS NO 2 7.32 AC SEC 25-18-15 FALLS NO. 2 7.320
30560012F ROSEMONT COPPER CO US PAT MINE HELVETIA DIST WEDGE NO 2 1.28 AC SEC 25-18-15 WEDGE NO. 2 1.280
30560012G ROSEMONT COPPER CO US PAT MINE HELVETIA DIST WEDGE 6.60 AC SEC 25-18-15 WEDGE 6.600
30560012H ROSEMONT COPPER CO US PAT MINE HELVETIA DIST SANTA RITA FRACTION .98 AC SEC 25-18-15 SANTA RITA FRACTION 0.980
30560012J ROSEMONT COPPER CO US PAT MINE HELVETIA DIST SANTA RITA #13 10.52 AC SEC 25-18-15 SANTA RITA #13 10.520
30561007A ROSEMONT COPPER CO U S PAT MINE HELVETIA DIST OREGON COPPER 16.08 AC SEC 36-18-15 OREGON COPPER 16.080
30561007D ROSEMONT COPPER CO US PAT MINE HELVETIA DIST SANTA RITA #15 13.59 AC SEC 36-18-15 SANTA RITA #15 13.590
30561007E ROSEMONT COPPER CO US PAT MINE HELVETIA DIST SANTA RITA #14 19.16 AC SEC 36-18-15 SANTA RITA #14 19.160
30561007F ROSEMONT COPPER CO US PAT MINE HELVETIA DIST SANTA RITA #12 19.62 AC SEC 36-18-15 SANTA RITA #12 19.620
30561007G ROSEMONT COPPER CO US PAT MINE HELVETIA DIST LAST CHANCE NO 1 15.60 AC SEC 36-18-15 LAST CHANCE NO. 1 15.600
30561007H ROSEMONT COPPER CO US PAT MINE HELVETIA DIST LAST CHANCE NO 2 18.27 AC SEC 36-18-15 LAST CHANCE NO. 2 18.270
30561007J ROSEMONT COPPER CO US PAT MINE HELVETIA DIST SANTA RITA #26 20.03 AC SEC 36-18-15 SANTA RITA #26 20.030
30561007K ROSEMONT COPPER CO US PAT MINE HELVETIA DIST SANTA RITA #27 18.76 AC SEC 36-18-15 SANTA RITA #27 18.760
30561007L ROSEMONT COPPER CO US PAT MINE HELVETIA DIST SANTA RITA #28 18.57 AC SEC 36-18-15 SANTA RITA #28 18.570
30562034C ROSEMONT COPPER CO US PAT MINE HELVETIA DIST SANTA RITA #16 18.92 AC SEC 31-18-16 SANTA RITA #16 18.920
30562034D ROSEMONT COPPER CO US PAT MINE HELVETIA DIST SANTA RITA #15 6.44 AC SEC 31-18-16 SANTA RITA #15 6.440
30562034E ROSEMONT COPPER CO US PAT MINE HELVETIA DIST SANTA RITA #28 2.01 AC SEC 31-18-16 SANTA RITA #28 2.010
30562034F ROSEMONT COPPER CO US PAT MINE HELVETIA DIST SANTA RITA #13 7.51 AC SEC 31-18-16 SANTA RITA #13 7.510
30563003A ROSEMONT COPPER CO U S PAT MINE HELVETIA DIST CUPRITE 20.66 AC SEC 19-18-16 CUPRITE 20.660
30564008A ROSEMONT COPPER CO U S PAT MINE HELVETIA DIST FRANKLIN M S 5 AC SEC 29-18-16 FRANKLIN MILLSITE 5.000
30565003A ROSEMONT COPPER CO U S PAT MINE HELVETIA DIST LA FAYETTE 13.95 AC SEC 30-18-16 LA FAYETTE 13.950
30565003D ROSEMONT COPPER CO US PAT MINE HELVETIA DIST SANTA RITA #4 19 AC SEC 30-18-16 SANTA RITA #4 19.000
30565003E ROSEMONT COPPER CO US PAT MINE HELVETIA DIST SANTA RITA #5 19.02 AC SEC 30-18-16 SANTA RITA #5 19.020
30565003F ROSEMONT COPPER CO US PAT MINE HELVETIA DIST SANTA RITA #6 18.99 AC SEC 30-18-16 SANTA RITA #6 18.990
30565003G ROSEMONT COPPER CO US PAT MINE HELVETIA DIST SANTA RITA #8A 3.66 AC SEC 25-18-15 SANTA RITA #8A 3.660
30565003H ROSEMONT COPPER CO US PAT MINE HELVETIA DIST SANTA RITA #9 SEC 31 & 30-18-16 EXC PTN IN SEC 25-18-15 19.58 AC
SANTA RITA #9 19.580
30565003J ROSEMONT COPPER CO US PAT MINE HELVETIA DIST SANTA RITA #10 20.56 AC SEC 30 & 31-18-16 SANTA RITA #10 20.560
30565003K ROSEMONT COPPER CO US PAT MINE HELVETIA DIST SANTA RITA #11 20.56 AC SEC 30 & 31-18-16 SANTA RITA #11 20.560
30565003L ROSEMONT COPPER CO US PAT MINE HELVETIA DIST SANTA RITA #8A 10.75 AC SEC 25-18-15 (S/B 30-18-16) EXC PTN IN SEC 25-18-15)
SANTA RITA #8A 10.750
30565003M ROSEMONT COPPER CO US PAT MINE HELVETIA DIST SANTA RITA #9 1.02 AC SEC 25-18-15 SANTA RITA #9 1.020
30565005A ROSEMONT COPPER CO U S PAT MINE HELVETIA DIST DAN WEBSTER 15.19 AC SEC 30 T18S R16E EXC PTN SEC 25-18-15
DAN WEBSTER 15.190
30565005B ROSEMONT COPPER CO U S PAT MINE HELVETIA DIST DAN WEBSTER 3.77 AC SEC 25-18-15 EXC PTN SEC 30-18-16
DAN WEBSTER 3.770
PATENTED CLAIM TOTALS 2004.474
*As assigned
** Ownership does not expire as long as real estate taxes are paid.

Preliminary Economic Assessment Copper World Complex, Pima County, Arizona USA
Page 4-38
TABLE 4-2: UNPATENTED MINING CLAIMS DESCRIPTION AND LOCATION
UNPATENTED CLAIM PROPERTY BY BLM SERIAL NO. (BLM ASSESSMENT YEAR 2021-2022)
The unpatented mining claims and millsites described herein are situated in the Rosemont and Helvetia Mining Districts, G&SR Meridian, Pima County, Arizona.
NAME OF UNPATENTED MINING CLAIM OR MILL SITE
PIMA COUNTY RECORDER – BOOK & PAGE NO./SEQUENCE NO.
BLM AZ STATE OFFICE SERIAL NO.
NAME OF UNPATENTED MINING CLAIM OR MILL SITE
PIMA COUNTY RECORDER – BOOK & PAGE NO./SEQUENCE NO.
BLM AZ STATE OFFICE SERIAL NO.
York Fraction Amended
2022 5436
340 804
*AMC2198 D & D II Amended
759 1062
201 544
*AMC14977
Travis #1 2nd Amended
1983 5436
253 806
*AMC2199 Frijole Amended
300 1062
277 545
*AMC14978
Jim Amended
995 5436
391 802
*AMC2200 Frijole II thru Frijole V 1062 546-549 *AMC14979 – AMC14982
Isle Royal Fraction Amended
2054 5436
188 808
*AMC2201 Frijole VII thru Frijole IX 1062 551-553 *AMC14984 – AMC14986
Indian Club Fraction Amended
2054 5436
187 809
*AMC2202 Frijole X 1070 494 *AMC14987
Pilot Fraction Amended
2051 5436
261 810
*AMC2203 Frijole XI 1454 349 *AMC14988
A.O.T. Fraction Amended
2054 5436
186 811
*AMC2204 Frijole XI Extension 1454 350 *AMC14989
Malachite Fraction Amended
2110 5436
263 807
*AMC2211 Deering Springs No. 2 A/Relocation 5636 741 *AMC15002
MAX 121 B/Relocation 5609 574 *AMC13284 Deering Springs No. 4 A/Relocation 5636 742 *AMC15003
MAX 123 B/Relocation 5609 576 *AMC13286 Deering Springs No. 6 A/Relocation 5636 743 *AMC15004
MAX 125 B thru MAX 128B /Relocation 5609 578-581 *AMC13288 – AMC13291 Deering Springs No. 8 A/Relocation 5636 744 *AMC15005
MAX 129 B/Relocation Amended
5609 6126
582 1202
*AMC13292 Deering Springs No. 10 A/Relocation 5636 745 *AMC15006
MAX 130 B thru MAX 149B/ Relocation 5609 583-602 *AMC13293 – AMC13312 Deering Springs No. 12 A/Relocation 5636 746 *AMC15007
MAX 150 B/Relocation Amended
5609 7073
603 604-605
*AMC13313 Deering Springs No. 14 A thru Deering Springs No. 16 A /Relocation
5636 747-749 *AMC15008 – AMC15010
MAX 151 B/Relocation 5609 604 *AMC13314 Deering Springs No. 17 A/Relocation Amended
5636 6126
750 1204-1205
*AMC15011
MAX 152 B/Relocation Amended
5609 7073
605 606-607
*AMC13315 Deering Springs No. 21 A thru Deering Springs No. 27 A /Relocation
5636 751-757 *AMC15012 – AMC15018
MAX 153 B/Relocation 5609 606 *AMC13316 Deering Springs No. 28 A/Relocation Amended
5636 6126
758 1206-1207
*AMC15019
MAX 154 B/Relocation Amended
5609 7073
607 608-609
*AMC13317 Deering Springs No. 29 A thru Deering Springs No. 39 A /Relocation
5636 759-769 *AMC15020 – AMC15030
MAX 155 B/Relocation 5609 608 *AMC13318 Deering Springs No. 42 A/Relocation 5636 770 *AMC15031
MAX 156 B/Relocation Amended
5609 7073
609 610-611
*AMC13319 Deering Springs No. 51 A/Relocation 5636 771 *AMC15032
Rosaland Amended
314 1062
120 539
*AMC14972 Deering Springs No. 52 A/Relocation 5636 772 *AMC15033
Michael M Amended
314 6062
117 540
*AMC14973 Kid 1 thru Kid 28 3368 529-556 *AMC25210 – AMC25237
Lydia J Amended
314 1062
119 541
*AMC14974 Kid 29 Amended
3368 6216
557 1001
*AMC25238
Ida D Amended
314 1062
118 542
*AMC14975 Kid 34 thru Kid 45 3368 562-573 *AMC25243 – AMC25254
D & D #1 Amended
759 1062
202 543
*AMC14976 Kid 46 Amended
3368 6216
574 1003
*AMC25255
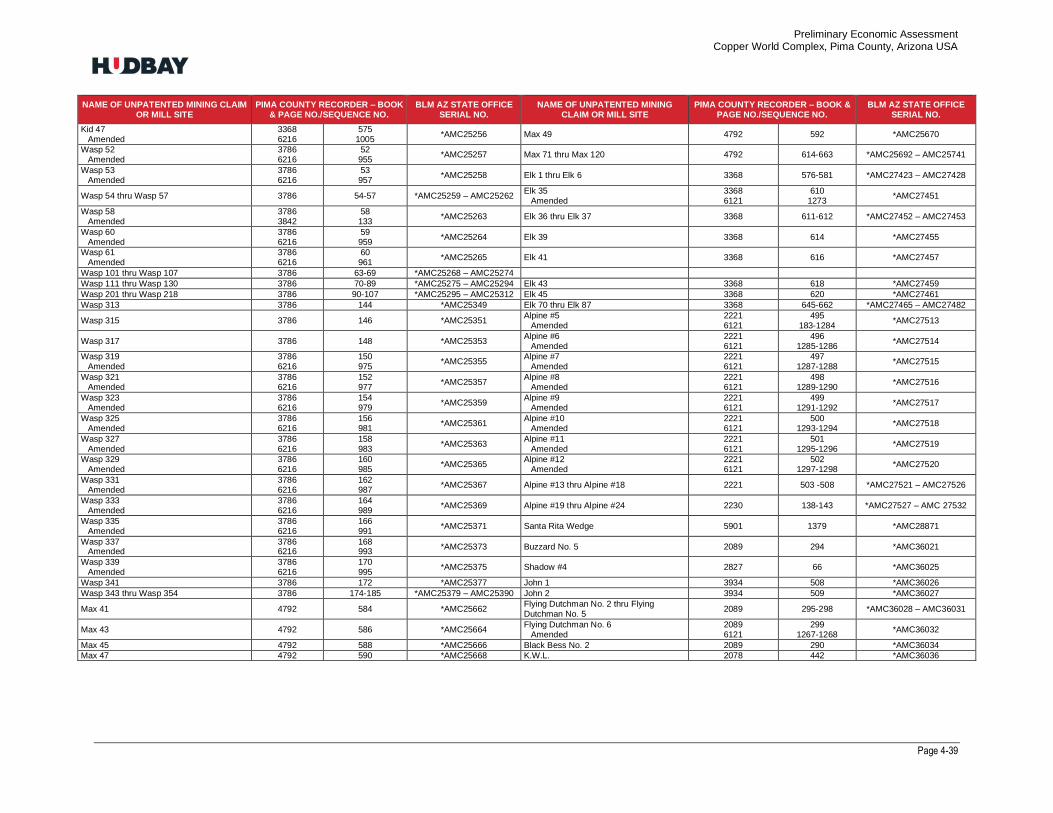
Preliminary Economic Assessment Copper World Complex, Pima County, Arizona USA
Page 4-39
NAME OF UNPATENTED MINING CLAIM OR MILL SITE
PIMA COUNTY RECORDER – BOOK & PAGE NO./SEQUENCE NO.
BLM AZ STATE OFFICE SERIAL NO.
NAME OF UNPATENTED MINING CLAIM OR MILL SITE
PIMA COUNTY RECORDER – BOOK & PAGE NO./SEQUENCE NO.
BLM AZ STATE OFFICE SERIAL NO.
Kid 47 Amended
3368 6216
575 1005
*AMC25256 Max 49 4792 592 *AMC25670
Wasp 52 Amended
3786 6216
52 955
*AMC25257 Max 71 thru Max 120 4792 614-663 *AMC25692 – AMC25741
Wasp 53 Amended
3786 6216
53 957
*AMC25258 Elk 1 thru Elk 6 3368 576-581 *AMC27423 – AMC27428
Wasp 54 thru Wasp 57 3786 54-57 *AMC25259 – AMC25262 Elk 35 Amended
3368 6121
610 1273
*AMC27451
Wasp 58 Amended
3786 3842
58 133
*AMC25263 Elk 36 thru Elk 37 3368 611-612 *AMC27452 – AMC27453
Wasp 60 Amended
3786 6216
59 959
*AMC25264 Elk 39 3368 614 *AMC27455
Wasp 61 Amended
3786 6216
60 961
*AMC25265 Elk 41 3368 616 *AMC27457
Wasp 101 thru Wasp 107 3786 63-69 *AMC25268 – AMC25274
Wasp 111 thru Wasp 130 3786 70-89 *AMC25275 – AMC25294 Elk 43 3368 618 *AMC27459
Wasp 201 thru Wasp 218 3786 90-107 *AMC25295 – AMC25312 Elk 45 3368 620 *AMC27461
Wasp 313 3786 144 *AMC25349 Elk 70 thru Elk 87 3368 645-662 *AMC27465 – AMC27482
Wasp 315 3786 146 *AMC25351 Alpine #5 Amended
2221 6121
495 183-1284
*AMC27513
Wasp 317 3786 148 *AMC25353 Alpine #6 Amended
2221 6121
496 1285-1286
*AMC27514
Wasp 319 Amended
3786 6216
150 975
*AMC25355 Alpine #7 Amended
2221 6121
497 1287-1288
*AMC27515
Wasp 321 Amended
3786 6216
152 977
*AMC25357 Alpine #8 Amended
2221 6121
498 1289-1290
*AMC27516
Wasp 323 Amended
3786 6216
154 979
*AMC25359 Alpine #9 Amended
2221 6121
499 1291-1292
*AMC27517
Wasp 325 Amended
3786 6216
156 981
*AMC25361 Alpine #10 Amended
2221 6121
500 1293-1294
*AMC27518
Wasp 327 Amended
3786 6216
158 983
*AMC25363 Alpine #11 Amended
2221 6121
501 1295-1296
*AMC27519
Wasp 329 Amended
3786 6216
160 985
*AMC25365 Alpine #12 Amended
2221 6121
502 1297-1298
*AMC27520
Wasp 331 Amended
3786 6216
162 987
*AMC25367 Alpine #13 thru Alpine #18 2221 503 -508 *AMC27521 – AMC27526
Wasp 333 Amended
3786 6216
164 989
*AMC25369 Alpine #19 thru Alpine #24 2230 138-143 *AMC27527 – AMC 27532
Wasp 335 Amended
3786 6216
166 991
*AMC25371 Santa Rita Wedge 5901 1379 *AMC28871
Wasp 337 Amended
3786 6216
168 993
*AMC25373 Buzzard No. 5 2089 294 *AMC36021
Wasp 339 Amended
3786 6216
170 995
*AMC25375 Shadow #4 2827 66 *AMC36025
Wasp 341 3786 172 *AMC25377 John 1 3934 508 *AMC36026
Wasp 343 thru Wasp 354 3786 174-185 *AMC25379 – AMC25390 John 2 3934 509 *AMC36027
Max 41 4792 584 *AMC25662 Flying Dutchman No. 2 thru Flying Dutchman No. 5
2089 295-298 *AMC36028 – AMC36031
Max 43 4792 586 *AMC25664 Flying Dutchman No. 6 Amended
2089 6121
299 1267-1268
*AMC36032
Max 45 4792 588 *AMC25666 Black Bess No. 2 2089 290 *AMC36034
Max 47 4792 590 *AMC25668 K.W.L. 2078 442 *AMC36036
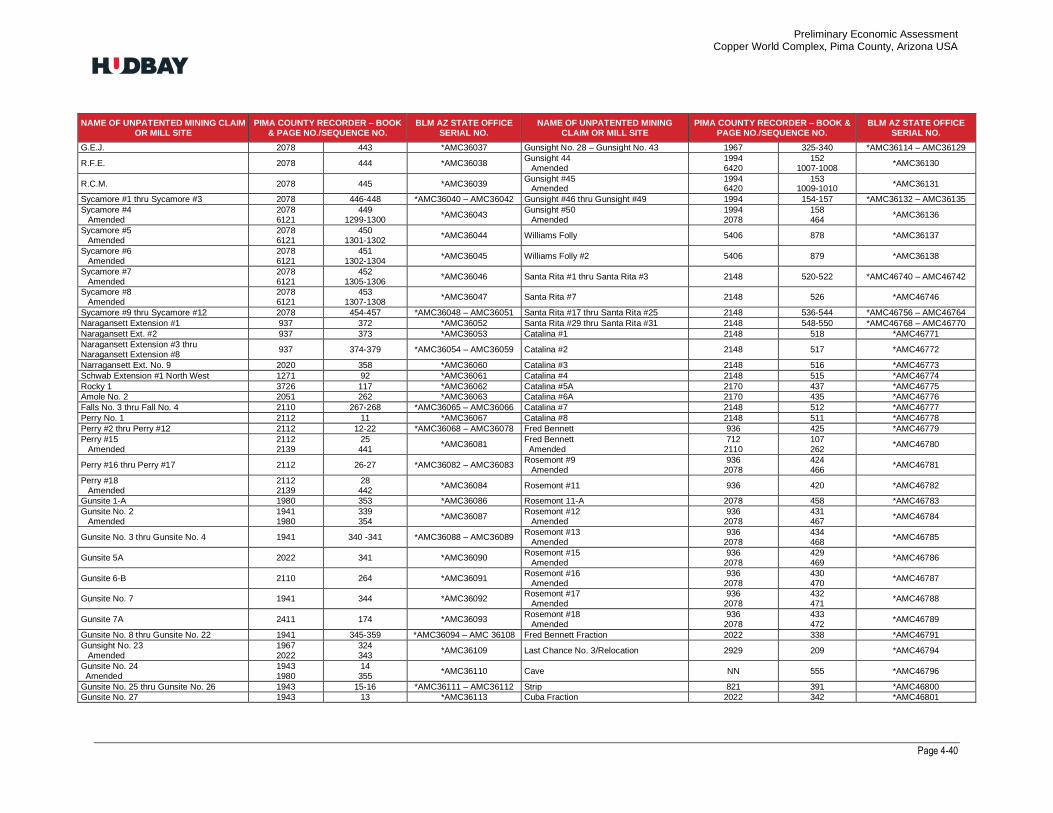
Preliminary Economic Assessment Copper World Complex, Pima County, Arizona USA
Page 4-40
NAME OF UNPATENTED MINING CLAIM
OR MILL SITE PIMA COUNTY RECORDER – BOOK
& PAGE NO./SEQUENCE NO. BLM AZ STATE OFFICE
SERIAL NO. NAME OF UNPATENTED MINING
CLAIM OR MILL SITE PIMA COUNTY RECORDER – BOOK &
PAGE NO./SEQUENCE NO. BLM AZ STATE OFFICE
SERIAL NO.
G.E.J. 2078 443 *AMC36037 Gunsight No. 28 – Gunsight No. 43 1967 325-340 *AMC36114 – AMC36129
R.F.E. 2078 444 *AMC36038 Gunsight 44 Amended
1994 6420
152 1007-1008
*AMC36130
R.C.M. 2078 445 *AMC36039 Gunsight #45 Amended
1994 6420
153 1009-1010
*AMC36131
Sycamore #1 thru Sycamore #3 2078 446-448 *AMC36040 – AMC36042 Gunsight #46 thru Gunsight #49 1994 154-157 *AMC36132 – AMC36135
Sycamore #4 Amended
2078 6121
449 1299-1300
*AMC36043 Gunsight #50 Amended
1994 2078
158 464
*AMC36136
Sycamore #5 Amended
2078 6121
450 1301-1302
*AMC36044 Williams Folly 5406 878 *AMC36137
Sycamore #6 Amended
2078 6121
451 1302-1304
*AMC36045 Williams Folly #2 5406 879 *AMC36138
Sycamore #7 Amended
2078 6121
452 1305-1306
*AMC36046 Santa Rita #1 thru Santa Rita #3 2148 520-522 *AMC46740 – AMC46742
Sycamore #8 Amended
2078 6121
453 1307-1308
*AMC36047 Santa Rita #7 2148 526 *AMC46746
Sycamore #9 thru Sycamore #12 2078 454-457 *AMC36048 – AMC36051 Santa Rita #17 thru Santa Rita #25 2148 536-544 *AMC46756 – AMC46764
Naragansett Extension #1 937 372 *AMC36052 Santa Rita #29 thru Santa Rita #31 2148 548-550 *AMC46768 – AMC46770
Naragansett Ext. #2 937 373 *AMC36053 Catalina #1 2148 518 *AMC46771
Naragansett Extension #3 thru Naragansett Extension #8
937 374-379 *AMC36054 – AMC36059 Catalina #2 2148 517 *AMC46772
Narragansett Ext. No. 9 2020 358 *AMC36060 Catalina #3 2148 516 *AMC46773
Schwab Extension #1 North West 1271 92 *AMC36061 Catalina #4 2148 515 *AMC46774
Rocky 1 3726 117 *AMC36062 Catalina #5A 2170 437 *AMC46775
Amole No. 2 2051 262 *AMC36063 Catalina #6A 2170 435 *AMC46776
Falls No. 3 thru Fall No. 4 2110 267-268 *AMC36065 – AMC36066 Catalina #7 2148 512 *AMC46777
Perry No. 1 2112 11 *AMC36067 Catalina #8 2148 511 *AMC46778
Perry #2 thru Perry #12 2112 12-22 *AMC36068 – AMC36078 Fred Bennett 936 425 *AMC46779
Perry #15 Amended
2112 2139
25 441
*AMC36081 Fred Bennett Amended
712 2110
107 262
*AMC46780
Perry #16 thru Perry #17 2112 26-27 *AMC36082 – AMC36083 Rosemont #9 Amended
936 2078
424 466
*AMC46781
Perry #18 Amended
2112 2139
28 442
*AMC36084 Rosemont #11 936 420 *AMC46782
Gunsite 1-A 1980 353 *AMC36086 Rosemont 11-A 2078 458 *AMC46783
Gunsite No. 2 Amended
1941 1980
339 354
*AMC36087 Rosemont #12 Amended
936 2078
431 467
*AMC46784
Gunsite No. 3 thru Gunsite No. 4 1941 340 -341 *AMC36088 – AMC36089 Rosemont #13 Amended
936 2078
434 468
*AMC46785
Gunsite 5A 2022 341 *AMC36090 Rosemont #15 Amended
936 2078
429 469
*AMC46786
Gunsite 6-B 2110 264 *AMC36091 Rosemont #16 Amended
936 2078
430 470
*AMC46787
Gunsite No. 7 1941 344 *AMC36092 Rosemont #17 Amended
936 2078
432 471
*AMC46788
Gunsite 7A 2411 174 *AMC36093 Rosemont #18 Amended
936 2078
433 472
*AMC46789
Gunsite No. 8 thru Gunsite No. 22 1941 345-359 *AMC36094 – AMC 36108 Fred Bennett Fraction 2022 338 *AMC46791
Gunsight No. 23 Amended
1967 2022
324 343
*AMC36109 Last Chance No. 3/Relocation 2929 209 *AMC46794
Gunsite No. 24 Amended
1943 1980
14 355
*AMC36110 Cave NN 555 *AMC46796
Gunsite No. 25 thru Gunsite No. 26 1943 15-16 *AMC36111 – AMC36112 Strip 821 391 *AMC46800
Gunsite No. 27 1943 13 *AMC36113 Cuba Fraction 2022 342 *AMC46801
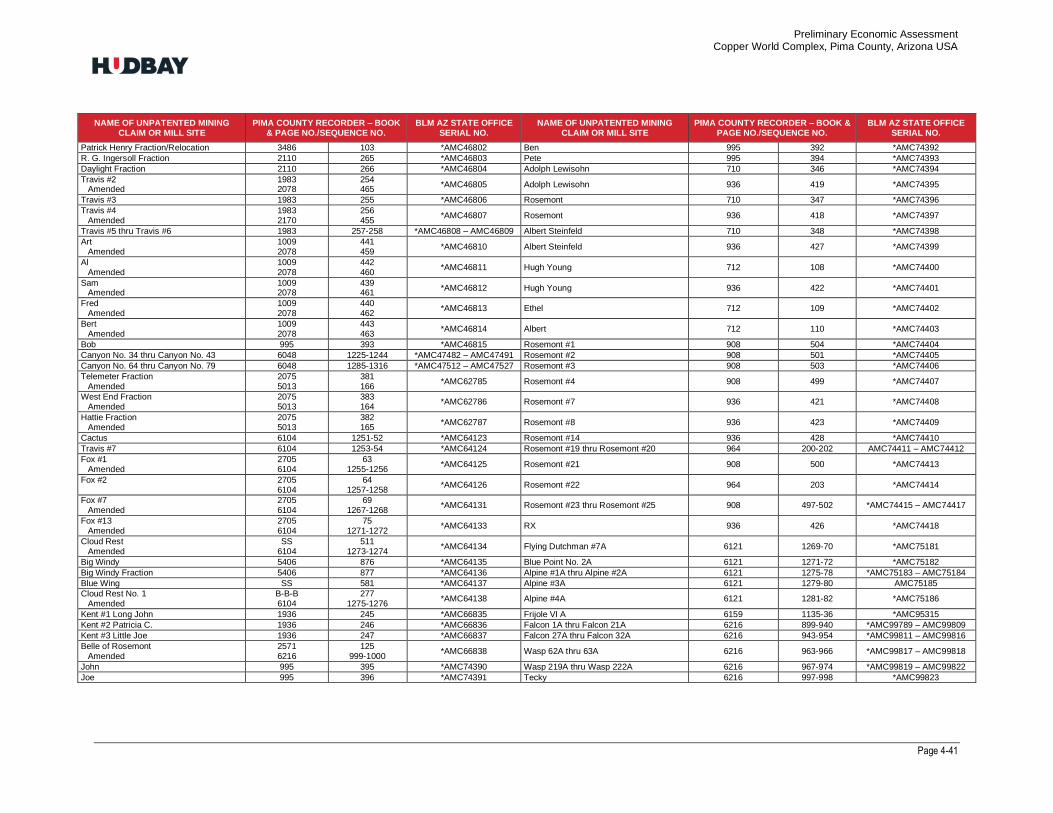
Preliminary Economic Assessment Copper World Complex, Pima County, Arizona USA
Page 4-41
NAME OF UNPATENTED MINING
CLAIM OR MILL SITE PIMA COUNTY RECORDER – BOOK
& PAGE NO./SEQUENCE NO. BLM AZ STATE OFFICE
SERIAL NO. NAME OF UNPATENTED MINING
CLAIM OR MILL SITE PIMA COUNTY RECORDER – BOOK &
PAGE NO./SEQUENCE NO. BLM AZ STATE OFFICE
SERIAL NO.
Patrick Henry Fraction/Relocation 3486 103 *AMC46802 Ben 995 392 *AMC74392
R. G. Ingersoll Fraction 2110 265 *AMC46803 Pete 995 394 *AMC74393
Daylight Fraction 2110 266 *AMC46804 Adolph Lewisohn 710 346 *AMC74394
Travis #2 Amended
1983 2078
254 465
*AMC46805 Adolph Lewisohn 936 419 *AMC74395
Travis #3 1983 255 *AMC46806 Rosemont 710 347 *AMC74396
Travis #4 Amended
1983 2170
256 455
*AMC46807 Rosemont 936 418 *AMC74397
Travis #5 thru Travis #6 1983 257-258 *AMC46808 – AMC46809 Albert Steinfeld 710 348 *AMC74398
Art Amended
1009 2078
441 459
*AMC46810 Albert Steinfeld 936 427 *AMC74399
Al Amended
1009 2078
442 460
*AMC46811 Hugh Young 712 108 *AMC74400
Sam Amended
1009 2078
439 461
*AMC46812 Hugh Young 936 422 *AMC74401
Fred Amended
1009 2078
440 462
*AMC46813 Ethel 712 109 *AMC74402
Bert Amended
1009 2078
443 463
*AMC46814 Albert 712 110 *AMC74403
Bob 995 393 *AMC46815 Rosemont #1 908 504 *AMC74404
Canyon No. 34 thru Canyon No. 43 6048 1225-1244 *AMC47482 – AMC47491 Rosemont #2 908 501 *AMC74405
Canyon No. 64 thru Canyon No. 79 6048 1285-1316 *AMC47512 – AMC47527 Rosemont #3 908 503 *AMC74406
Telemeter Fraction Amended
2075 5013
381 166
*AMC62785 Rosemont #4 908 499 *AMC74407
West End Fraction Amended
2075 5013
383 164
*AMC62786 Rosemont #7 936 421 *AMC74408
Hattie Fraction Amended
2075 5013
382 165
*AMC62787 Rosemont #8 936 423 *AMC74409
Cactus 6104 1251-52 *AMC64123 Rosemont #14 936 428 *AMC74410
Travis #7 6104 1253-54 *AMC64124 Rosemont #19 thru Rosemont #20 964 200-202 AMC74411 – AMC74412
Fox #1 Amended
2705 6104
63 1255-1256
*AMC64125 Rosemont #21 908 500 *AMC74413
Fox #2 2705 6104
64 1257-1258
*AMC64126 Rosemont #22 964 203 *AMC74414
Fox #7 Amended
2705 6104
69 1267-1268
*AMC64131 Rosemont #23 thru Rosemont #25 908 497-502 *AMC74415 – AMC74417
Fox #13 Amended
2705 6104
75 1271-1272
*AMC64133 RX 936 426 *AMC74418
Cloud Rest Amended
SS 6104
511 1273-1274
*AMC64134 Flying Dutchman #7A 6121 1269-70 *AMC75181
Big Windy 5406 876 *AMC64135 Blue Point No. 2A 6121 1271-72 *AMC75182
Big Windy Fraction 5406 877 *AMC64136 Alpine #1A thru Alpine #2A 6121 1275-78 *AMC75183 – AMC75184
Blue Wing SS 581 *AMC64137 Alpine #3A 6121 1279-80 AMC75185
Cloud Rest No. 1 Amended
B-B-B 6104
277 1275-1276
*AMC64138 Alpine #4A 6121 1281-82 *AMC75186
Kent #1 Long John 1936 245 *AMC66835 Frijole VI A 6159 1135-36 *AMC95315
Kent #2 Patricia C. 1936 246 *AMC66836 Falcon 1A thru Falcon 21A 6216 899-940 *AMC99789 – AMC99809
Kent #3 Little Joe 1936 247 *AMC66837 Falcon 27A thru Falcon 32A 6216 943-954 *AMC99811 – AMC99816
Belle of Rosemont Amended
2571 6216
125 999-1000
*AMC66838 Wasp 62A thru 63A 6216 963-966 *AMC99817 – AMC99818
John 995 395 *AMC74390 Wasp 219A thru Wasp 222A 6216 967-974 *AMC99819 – AMC99822
Joe 995 396 *AMC74391 Tecky 6216 997-998 *AMC99823

Preliminary Economic Assessment Copper World Complex, Pima County, Arizona USA
Page 4-42
NAME OF UNPATENTED MINING CLAIM OR MILL SITE
PIMA COUNTY RECORDER – BOOK & PAGE NO./SEQUENCE NO.
BLM AZ STATE OFFICE SERIAL NO.
NAME OF UNPATENTED MINING CLAIM OR MILL SITE
PIMA COUNTY RECORDER – BOOK & PAGE NO./SEQUENCE NO.
BLM AZ STATE OFFICE SERIAL NO.
MIA 1A 6420 1011-13 AMC117293 WAIT-1 thru WAIT 32 13261 375-438 AMC390084 – AMC390115
MIA 2A thru MIA 9A 6420 1014-1037 *AMC117294 –
AMC117301 FALLS FRACTION 13286 73-74 AMC391154
MIA 12A thru MIA 14A 6420 1043-1051 *AMC117304 –
AMC117306 H-69B 13286 75-76 AMC391155
BILLY C. 6522 781-782 *AMC129394 NO CHANCE No. 3 13286 77-78 AMC391156
Hope-1 thru Hope-10 8776 919-948 AMC303950 – AMC303959 SCHWAB FRACTION 13286 79-80 AMC391157
Hope-10A 8776 949-951 AMC303960 H FRAC. 1 thru H FRAC. 8 13312 195-210 AMC392445 – AMC392452
Hope-11 thru Hope-13 8776 952-960 AMC303961 – AMC303963 BILLY FRAC. Amended
13344 13358
16-17 114-115
AMC393532
Hope-14 Amended
8776 8808
961-963 596-598
AMC303964 DSM 1 thru DSM 10
13344 18 -37 AMC393533 – AMC393542
Hope-15 thru Hope-22 8776 964-987 AMC303965 – AMC303972 HV5 A 13344 38-39 AMC393543
Hope 23 Amended
8776 8808
988-990 593-595
AMC303973 MIA FRAC 1 thru MIA FRAC 2
13344 40-43 AMC393544 – AMC393545
Hope-24 thru Hope-28 8776 991-1005 AMC303974 – AMC303978 SON OF GUN 34 13360 385-386 *AMC394006
H-29 8776 1006-1008 AMC303979 RMT FRAC 1 13386 29-33 *AMC394561
Hope-30 thru Hope-31 8776 1009-1014 AMC303980 – AMC303981 RMT FRAC 2 13386 31-32 AMC394562
Hope 32 Amended
8776 8808
1015-1017 590-592
AMC303982 RMT FRAC 3
13386 33-34 AMC394563
Hope-33 thru Hope-37 8776 1018-1032 AMC303983 AMC303987 RMT FRAC 4 13386 35-36 AMC394564
H-38A thru H-199A 9018 1198-1513 AMC313532 – AMC313689 NC-CF 13534 340-341 *AMC396422
Hope No. 201 9797 2826-2827 AMC330891 Thankful 20110240238 AMC404128
Hope 201A Amended
9797 9922
2828-2829 1016
AMC330892 RCC-1 thru RCC-100 20113200711-
20113200737 AMC411964 – AMC412063
Hope No. 202 thru Hope No. 216 9797 2830-2859 AMC330893 – AMC330907 AGAVE-1 thru AGAVE-6 20113200738-
20113200743 AMC412064 – AMC412069
Hope No. 222 thru Hope No. 225 9797 2864-2871 AMC330910 – AMC330913 CONTINENTAL-1 thru CONTINENTAL-6 20113200744-
20113200749 AMC412070 – AMC412075
Hope 226A Amended
9797 9865
2872-2873 1328-1329
AMC330914 TAILOR
20131610659 *AMC423213
Hope 227A Amended
9797 9865
2874-2875 1330-1331
AMC330915 AGAVE-7 thru AGAVE-9 20142690583-
20142690585 AMC429429 – AMC429431
Hope 228A Amended
9797 9865
2876-2877 1332-1333
AMC330916 RECORDER FRACTION
20142690586 AMC429432
Hope 229A Amended
9797 9865
2878-2879 1334-1335
AMC330917 RCMS-1 thru RCMS-343
20192970888-20192971228 AMC457217 – AMC457557
Hope No. 230 thru Hope No. 246 9797 2880-2913 AMC330918 – AMC330934 RCMS-358 thru RCMS-445 20192971229-20192971314 AMC457558 – AMC457643
Hope No. 250 thru Hope No. 257 9797 2914 2929 AMC330935 – AMC 330942
RCMS-448 thru RCMS-500 20192971315-20192971367 AMC457696
Elk 47/Relocation 9797 2930-2931 AMC330943 RCMS-502 20192971368 AMC457697
H-172 B H-176 B /Relocation 9865 1336-1345 AMC331308 – AMC331312 RCMS-504 20192971369 AMC457698
MMRE 12667 606-607 AMC367652 RCMS-506 20192971370 AMC457699
HV 1 thru HV4 13029 511-518 AMC380250 – AMC380253 RCMS-508 thru RCMS-767 20192971371-20192971610 AMC457700 – AMC457939
ROSE 1 thru ROSE 9 13120 417-434 AMC385174 – AMC 385182
RCMS-771 thru RCMS-774 20192971611-20192971614 AMC457940 – AMC457943
HV 6 Amended
13190 13310
552-553 1052-1053
AMC387231 RCMS-807 20192971615 AMC457944
HV 7 thru HV13 13190 554-567 AMC387232 – AMC387238 RCMS-809 thru RCMS-811 20192971616-20192971618 AMC457945 – AMC457947
HV 23 thru HV 25 13190 572-577 AMC387241 – AMC387243 RCMS-813 20192971619 AMC457948
HV 16 thru HV 22 13261 361-372 AMC390077 – AMC390083 RCMS-828 thru RCMS-829 20192971620-20192971621 AMC457949 – AMC457950
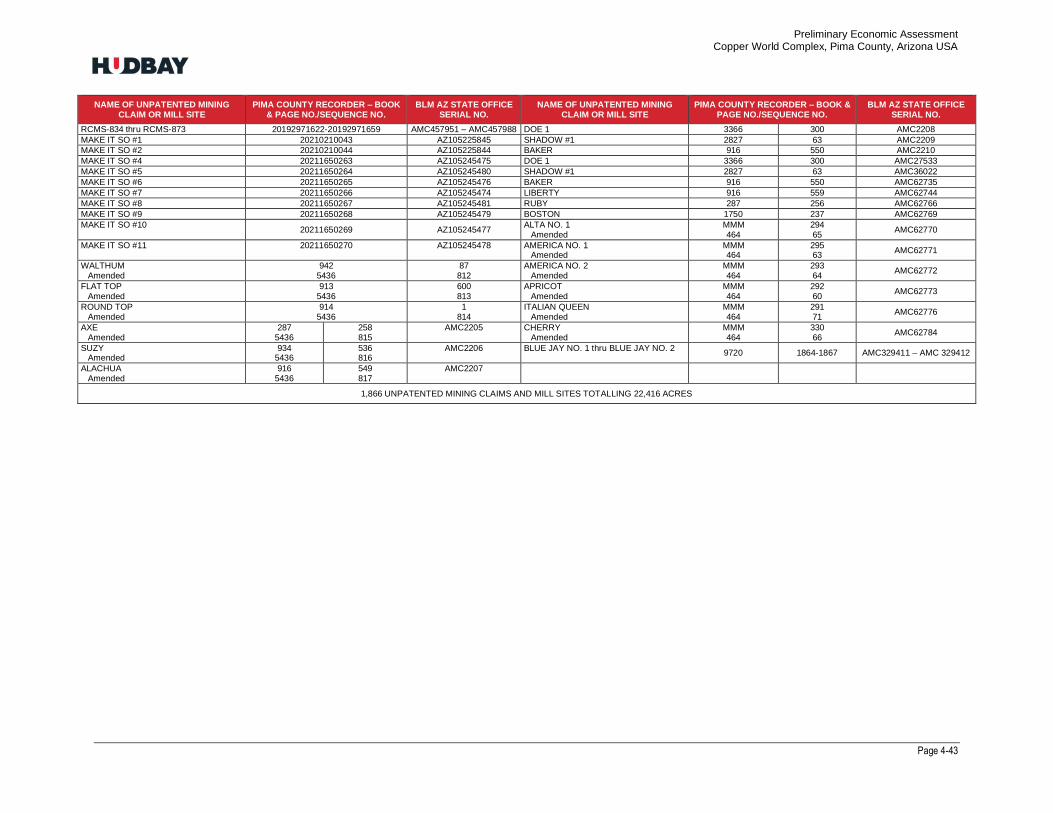
Preliminary Economic Assessment Copper World Complex, Pima County, Arizona USA
Page 4-43
NAME OF UNPATENTED MINING CLAIM OR MILL SITE
PIMA COUNTY RECORDER – BOOK & PAGE NO./SEQUENCE NO.
BLM AZ STATE OFFICE SERIAL NO.
NAME OF UNPATENTED MINING CLAIM OR MILL SITE
PIMA COUNTY RECORDER – BOOK & PAGE NO./SEQUENCE NO.
BLM AZ STATE OFFICE SERIAL NO.
RCMS-834 thru RCMS-873 20192971622-20192971659 AMC457951 – AMC457988 DOE 1 3366 300 AMC2208
MAKE IT SO #1 20210210043 AZ105225845 SHADOW #1 2827 63 AMC2209
MAKE IT SO #2 20210210044 AZ105225844 BAKER 916 550 AMC2210
MAKE IT SO #4 20211650263 AZ105245475 DOE 1 3366 300 AMC27533
MAKE IT SO #5 20211650264 AZ105245480 SHADOW #1 2827 63 AMC36022
MAKE IT SO #6 20211650265 AZ105245476 BAKER 916 550 AMC62735
MAKE IT SO #7 20211650266 AZ105245474 LIBERTY 916 559 AMC62744
MAKE IT SO #8 20211650267 AZ105245481 RUBY 287 256 AMC62766
MAKE IT SO #9 20211650268 AZ105245479 BOSTON 1750 237 AMC62769
MAKE IT SO #10 20211650269 AZ105245477
ALTA NO. 1 Amended
MMM 464
294 65
AMC62770
MAKE IT SO #11 20211650270 AZ105245478 AMERICA NO. 1 Amended
MMM 464
295 63
AMC62771
WALTHUM Amended
942 5436
87 812
AMERICA NO. 2 Amended
MMM 464
293 64
AMC62772
FLAT TOP Amended
913 5436
600 813
APRICOT Amended
MMM 464
292 60
AMC62773
ROUND TOP Amended
914 5436
1 814
ITALIAN QUEEN Amended
MMM 464
291 71
AMC62776
AXE Amended
287 5436
258 815
AMC2205 CHERRY Amended
MMM 464
330 66
AMC62784
SUZY Amended
934 5436
536 816
AMC2206 BLUE JAY NO. 1 thru BLUE JAY NO. 2 9720 1864-1867 AMC329411 – AMC 329412
ALACHUA Amended
916 5436
549 817
AMC2207
1,866 UNPATENTED MINING CLAIMS AND MILL SITES TOTALLING 22,416 ACRES

Preliminary Economic Assessment Copper World Complex, Pima County, Arizona USA
Page 4-44
TABLE 4-3: FEE OWNED PROPERTIES DESCRIPTION AND LOCATION
FEE OWNED (ASSOCIATED) PROPERTY BY PIMA COUNTY PROPERTY TAX PARCEL NO.
PARCEL
NO. TAXPAYER PROPERTY NAME ACRES
1 305580280 ROSEMONT COPPER CO HELVETIA RANCH (KILGORE/ANDERSEN) LOT 5 10.08 AC SEC 23-18-15 10.08
2 305580330 ROSEMONT COPPER CO HELVETIA RANCH ANNEX (AVRA VALLEY/LEBRECHT) NW4 SW4 EXC MINERAL RIGHTS 40.00 AC SEC 23-18-15
40.00
3 305580350 ROSEMONT COPPER CO HELVETIA RANCH ANNEX (DE LA OSSA) W/2 W/2 NW/4 SE/4 10.00 AC SEC 23-18-15 10.00
4 305580360 ROSEMONT COPPER CO HELVETIA RANCH ANNEX (AVRA VALLEY/LEBRECHT) E2 W2 NW4 SE4 10.00 AC SEC 23-18-15 10.00
5 305580370 ROSEMONT COPPER CO HELVETIA RANCH ANNEX (AVRA VALLEY/LEBRECHT) NW4 SE4 EXC W2 THEREOF 20.00 AC SEC 23-18-15 EXC MINERAL RIGHTS
20.00
6 305580420 ROSEMONT COPPER CO HELVETIA RANCH ANNEX (MAATR) SW4 SW4 40.00 AC SEC 23-18-15 40.00
7 30553002D ROSEMONT COPPER CO HELVETIA RANCH ANNEX NORTH (TERRA BELLA) N2 NW4 NW4 20 AC SEC 10-18-15 20.00
8 30553002F ROSEMONT COPPER CO HELVETIA RANCH ANNEX NORTH (TERRA BELLA) LOT 4 & NW4 SW4 & SW4 NW4 120 AC SEC 10-18-15 120.00
9 30553002G ROSEMONT COPPER CO HELVETIA RANCH ANNEX NORTH (TERRA BELLA) PTN N2 & NE4 SW4 & N2 N2 LOT 3 310 AC SEC 10-18-15
310.00
10 30553002H ROSEMONT COPPER CO HELVETIA RANCH ANNEX (AVRA VALLEY/LEBRECHT) LOT 3 EXC N2 N2 & LOTS 1 & 2 108.42 AC SEC 10-18-15
108.42
11 30553004D ROSEMONT COPPER CO HELVETIA RANCH ANNEX (AVRA VALLEY/LEBRECHT) NE4 NW4 40.00 AC SEC 27-18-15 40.00
12 30553004H ROSEMONT COPPER CO HELVETIA RANCH ANNEX (AVRA VALLEY/LEBRECHT) NE4 NE4 40.00 AC SEC 27-18-15 40.00
13 30556001B ROSEMONT COPPER CO HELVETIA RANCH ANNEX (AVRA VALLEY/LEBRECHT) LOTS 3 & 4 & S2 OF NW4 & SW4 313.11 AC SEC 15-18-15
313.11
14 30556001C ROSEMONT COPPER CO HELVETIA RANCH ANNEX (AVRA VALLEY/LEBRECHT) LOTS 1 & 2 67.80 AC SEC 15-18-15 67.80
15 30557004B ROSEMONT COPPER CO HELVETIA RANCH ANNEX (AVRA VALLEY/LEBRECHT) W2 NE4 SW4 NE4 5.00 AC SEC 22-18-15 5.00
16 30557004C ROSEMONT COPPER CO HELVETIA RANCH ANNEX (ADC/CALICA) S2 SW4 NE4 & GLO LOT 5 52.48 AC SEC 22-18-15 52.48
17 30557004D ROSEMONT COPPER CO HELVETIA RANCH (KILGORE/ANDERSEN) NW4 SW4 NE4 10.00 AC SEC 22-18-15 10.00
18 30557005B ROSEMONT COPPER CO HELVETIA RANCH ANNEX (AVRA VALLEY/LEBRECHT) E2 SE4 NW4 20 AC SEC 22-18-15 20.00
19 30557013B ROSEMONT COPPER CO HELVETIA RANCH ANNEX (AVRA VALLEY/LEBRECHT) NW4 SW4 EXC W2 NW4 THEREOF 35.00 AC SEC 22-18-15
35.00
20 30557013C ROSEMONT COPPER CO HELVETIA RANCH ANNEX (AVRA VALLEY/LEBRECHT) SW4 SW4 40.00 AC SEC 22-18-15 40.00
21 30557013D ROSEMONT COPPER CO HELVETIA RANCH ANNEX (SUTTLES) W2 NE4 SW4 20 AC SEC 22-18-15 20.00
22 30557013E ROSEMONT COPPER CO HELVETIA RANCH ANNEX (AVRA VALLEY/LEBRECHT) W2 NW4 SE4 & E2 NE4 SW4 40 AC SEC 22-18-15 40.00
23 30557022C ROSEMONT COPPER CO HELVETIA RANCH ANNEX (MAATR) NE4 SE4 40.00 AC SEC 22-18-15 (EXC MINERAL RIGHTS) 40.00
24 30558034C ROSEMONT COPPER CO HELVETIA RANCH ANNEX (PIPELINE TRIANGLE) NLY PTN Lot 3 2.19 AC SEC 23-18-15 2.19
25 30562006B* ROSEMONT COPPER CO ROSEMONT RANCH NE4 SW4 EXC PTN LYG WITHIN HWY-83 34.12 AC SEC 14-18-16 34.12
26 30562007D* ROSEMONT COPPER CO ROSEMONT RANCH SW4 SE4 40.00 AC SEC 15-18-16 40.00
27 30562007F* ROSEMONT COPPER CO ROSEMONT RANCH NW4 SE4 40.00 AC SEC 15-18-16 40.00
28 30562007G* ROSEMONT COPPER CO ROSEMONT RANCH E2 SE4 EXC PTN LYG WITHIN HWY-83 70.59 AC SEC 15-18-16 70.59
29 30562007H* ROSEMONT COPPER CO ROSEMONT RANCH N2 E2 160 AC SEC 15-18-16 160.00
30 30562008C ROSEMONT COPPER CO ROSEMONT RANCH (HIDDEN VALLEY) NELY PTN NE4 60.15 AC SEC 21-18-16 60.15
31 30562008F ROSEMONT COPPER CO ROSEMONT RANCH (HIDDEN VALLEY) NW4 NE4 EXC W660.84’ E1090.84’ S330’ THEREOF 35.06 AC SEC 21-18-16
35.06
32 30562008G ROSEMONT COPPER CO ROSEMONT RANCH (HIDDEN VALLEY) W660.84’ E1090.84’ S330’ NW4 NE4 5.01 AC SEC 21-18-16 5.01
33 30562008H ROSEMONT COPPER CO ROSEMONT RANCH (HIDDEN VALLEY) SWLY PTN NE4 EXC W1161.94’ 24.88 AC SEC 21-18-16 24.88
34 30562008J ROSEMONT COPPER CO ROSEMONT RANCH (HIDDEN VALLEY) W1161.94’ SWLY PT NE4 SEC 21-18-16 35.27 AC 35.27
35 30591021B ROSEMONT COPPER CO ROSEMONT RANCH (DAVIDSON CANYON) PTN S2 N2 LYG E OF SONOITA HWY 17.98 AC SEC 1-18-16 AKA LOT 21 EXC E 713.50’ SONOITA HILLS
17.98
36 30591020B ROSEMONT COPPER CO DAVIDSON CANYON IRR CENT PTN BNG PT OF LOT 20 OF SONOITA HILLS R/S 2/53 1.440 AC SEC1 18-16
14.40
37 30562009A* ROSEMONT COPPER CO ROSEMONT RANCH SE4 160 AC SEC 23-18-16 160.00
38 30562011A* ROSEMONT COPPER CO ROSEMONT RANCH SE4 SE4 40 AC SEC 27-18-16 40.00
39 30562012A* ROSEMONT COPPER CO ROSEMONT RANCH SE4 NW4 SW4 & SW4 NE4 SW4 SEC 32-18-16 20.00 AC 20.00
40 30562012C* ROSEMONT COPPER CO ROSEMONT RANCH E2 NW4 & SW4 NW4 & N2 N2 SW4 & SW4 NW4 SW4 & SE4 NE4 SW4 180 AC SEC 32-18-16
180.00
41 305570120 ROSEMONT COPPER CO HELVETIA RANCH ANNEX (HAWKINS) PTN W2 NW4 NW4 SW4 5.00 AC SEC 22-18-15 5.00
42 305570030 ROSEMONT COPPER CO HELVETIA NORTH ANNEX (COLE) E2 NE4 SW4 NE4 5.00 AC SEC 22-18-15 5.00
43 30553003B ROSEMONT COPPER CO. HELVETIA RANCH ANNEX (VOELLMER) E2 E2 NW4 NW4 10 AC SEC 26-18-15 22250 S Santa Rita Road (EXCLUDING MINERAL RIGHTS)
10.00
44 30557019D ROSEMONT COPPER CO HELVETIA RANCH ANNEX (VAWD) SW4 SE4 SE4 & ELY PTN SE4 SW4 SE4 12.33 AC SEC 22-18-15 12.33
45 30553003E ROSEMONT COPPER CO HELVETIA RANCH ANNEX (WOLCC) W2 NW4 NW4 20 AC SEC 26-18-15 20.00
46 30557022F ROSEMONT COPPER HELVETIA RANCH ANNEX (HETFIELD) E2 SE4 SE4 20.00 AC SEC 22-18-15 20.00
47 305380160 ROSEMONT COPPER CO STONE SPRINGS (TUSK HOLDINGS LLC) LOTS 1 2 5 7 8 & EXC PTNS OF LOTS 5 7 & 8 – 167.67 AC SEC 35-17-15
167.67
48 30553001C ROSEMONT COPPER CO STONE SPRINGS (TUSK HOLDINGS LLC) SW4 160 AC SEC 2-18-15 160.00
49 30553001B ROSEMONT COPPER CO STONE SPRINGS (ANAM INC) NW4 159.66 AC SEC 2-18-15 159.66
50 305570090 ROSEMONT COPPER CO HELVETIA RANCH ANNEX (BOWEN) N2 NE4 SW2 NW2 5.00 AC SEC 22-18-15 5.00
51 305570110 ROSEMONT COPPER CO HELVETIA RANCH ANNEX (HAWKINS) SW4 SW4 NW4 10.00 AC 10.00
ROSEMONT COPPER CO FEE OWNED (ASSOCIATED) PROPERTY- TOTAL ASSESSED ACREAGE 2926.20
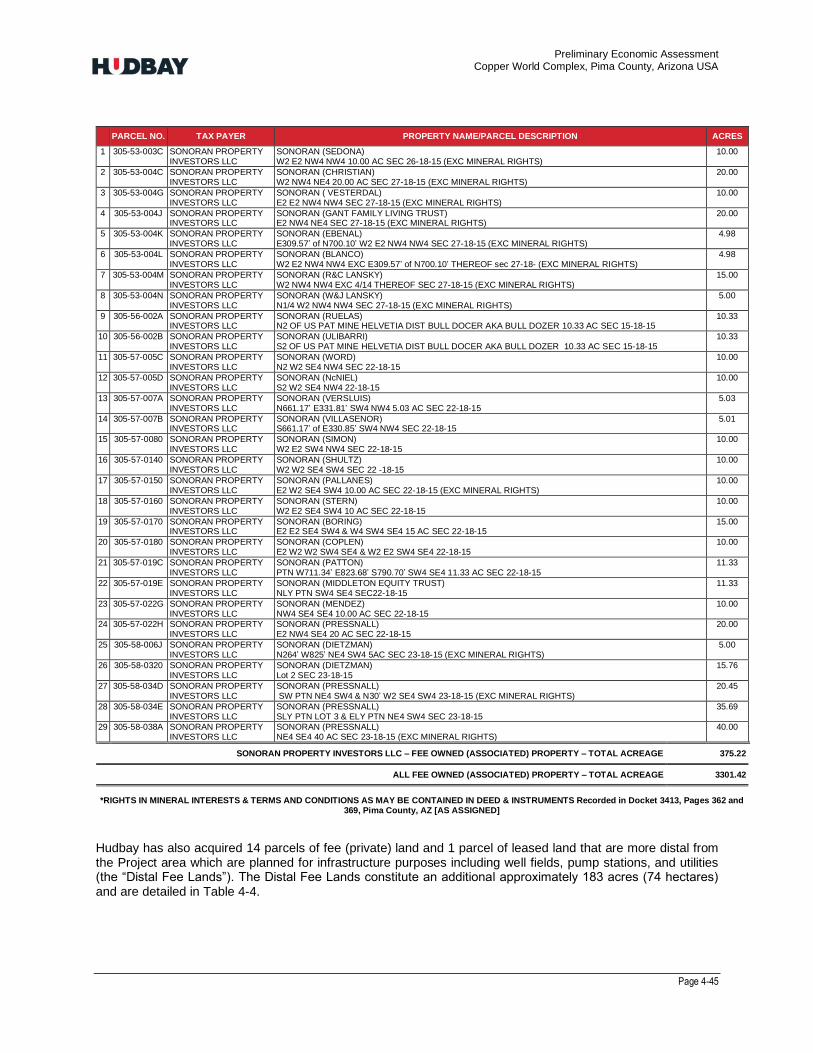
Preliminary Economic Assessment Copper World Complex, Pima County, Arizona USA
Page 4-45
PARCEL NO. TAX PAYER PROPERTY NAME/PARCEL DESCRIPTION ACRES
1 305-53-003C SONORAN PROPERTY INVESTORS LLC
SONORAN (SEDONA) W2 E2 NW4 NW4 10.00 AC SEC 26-18-15 (EXC MINERAL RIGHTS)
10.00
2 305-53-004C SONORAN PROPERTY INVESTORS LLC
SONORAN (CHRISTIAN) W2 NW4 NE4 20.00 AC SEC 27-18-15 (EXC MINERAL RIGHTS)
20.00
3 305-53-004G SONORAN PROPERTY INVESTORS LLC
SONORAN ( VESTERDAL) E2 E2 NW4 NW4 SEC 27-18-15 (EXC MINERAL RIGHTS)
10.00
4 305-53-004J SONORAN PROPERTY INVESTORS LLC
SONORAN (GANT FAMILY LIVING TRUST) E2 NW4 NE4 SEC 27-18-15 (EXC MINERAL RIGHTS)
20.00
5 305-53-004K SONORAN PROPERTY INVESTORS LLC
SONORAN (EBENAL) E309.57’ of N700.10’ W2 E2 NW4 NW4 SEC 27-18-15 (EXC MINERAL RIGHTS)
4.98
6 305-53-004L SONORAN PROPERTY INVESTORS LLC
SONORAN (BLANCO) W2 E2 NW4 NW4 EXC E309.57’ of N700.10’ THEREOF sec 27-18- (EXC MINERAL RIGHTS)
4.98
7 305-53-004M SONORAN PROPERTY INVESTORS LLC
SONORAN (R&C LANSKY) W2 NW4 NW4 EXC 4/14 THEREOF SEC 27-18-15 (EXC MINERAL RIGHTS)
15.00
8 305-53-004N SONORAN PROPERTY INVESTORS LLC
SONORAN (W&J LANSKY) N1/4 W2 NW4 NW4 SEC 27-18-15 (EXC MINERAL RIGHTS)
5.00
9 305-56-002A SONORAN PROPERTY INVESTORS LLC
SONORAN (RUELAS) N2 OF US PAT MINE HELVETIA DIST BULL DOCER AKA BULL DOZER 10.33 AC SEC 15-18-15
10.33
10 305-56-002B SONORAN PROPERTY INVESTORS LLC
SONORAN (ULIBARRI) S2 OF US PAT MINE HELVETIA DIST BULL DOCER AKA BULL DOZER 10.33 AC SEC 15-18-15
10.33
11 305-57-005C SONORAN PROPERTY INVESTORS LLC
SONORAN (WORD) N2 W2 SE4 NW4 SEC 22-18-15
10.00
12 305-57-005D SONORAN PROPERTY INVESTORS LLC
SONORAN (NcNIEL) S2 W2 SE4 NW4 22-18-15
10.00
13 305-57-007A SONORAN PROPERTY INVESTORS LLC
SONORAN (VERSLUIS) N661.17’ E331.81’ SW4 NW4 5.03 AC SEC 22-18-15
5.03
14 305-57-007B SONORAN PROPERTY INVESTORS LLC
SONORAN (VILLASENOR) S661.17’ of E330.85’ SW4 NW4 SEC 22-18-15
5.01
15 305-57-0080 SONORAN PROPERTY INVESTORS LLC
SONORAN (SIMON) W2 E2 SW4 NW4 SEC 22-18-15
10.00
16 305-57-0140 SONORAN PROPERTY INVESTORS LLC
SONORAN (SHULTZ) W2 W2 SE4 SW4 SEC 22 -18-15
10.00
17 305-57-0150 SONORAN PROPERTY INVESTORS LLC
SONORAN (PALLANES) E2 W2 SE4 SW4 10.00 AC SEC 22-18-15 (EXC MINERAL RIGHTS)
10.00
18 305-57-0160 SONORAN PROPERTY INVESTORS LLC
SONORAN (STERN) W2 E2 SE4 SW4 10 AC SEC 22-18-15
10.00
19 305-57-0170 SONORAN PROPERTY INVESTORS LLC
SONORAN (BORING) E2 E2 SE4 SW4 & W4 SW4 SE4 15 AC SEC 22-18-15
15.00
20 305-57-0180 SONORAN PROPERTY INVESTORS LLC
SONORAN (COPLEN) E2 W2 W2 SW4 SE4 & W2 E2 SW4 SE4 22-18-15
10.00
21 305-57-019C SONORAN PROPERTY INVESTORS LLC
SONORAN (PATTON) PTN W711.34’ E823.68’ S790.70’ SW4 SE4 11.33 AC SEC 22-18-15
11.33
22 305-57-019E SONORAN PROPERTY INVESTORS LLC
SONORAN (MIDDLETON EQUITY TRUST) NLY PTN SW4 SE4 SEC22-18-15
11.33
23 305-57-022G SONORAN PROPERTY INVESTORS LLC
SONORAN (MENDEZ) NW4 SE4 SE4 10.00 AC SEC 22-18-15
10.00
24 305-57-022H SONORAN PROPERTY INVESTORS LLC
SONORAN (PRESSNALL) E2 NW4 SE4 20 AC SEC 22-18-15
20.00
25 305-58-006J SONORAN PROPERTY INVESTORS LLC
SONORAN (DIETZMAN) N264’ W825’ NE4 SW4 5AC SEC 23-18-15 (EXC MINERAL RIGHTS)
5.00
26 305-58-0320 SONORAN PROPERTY INVESTORS LLC
SONORAN (DIETZMAN) Lot 2 SEC 23-18-15
15.76
27 305-58-034D SONORAN PROPERTY INVESTORS LLC
SONORAN (PRESSNALL) SW PTN NE4 SW4 & N30’ W2 SE4 SW4 23-18-15 (EXC MINERAL RIGHTS)
20.45
28 305-58-034E SONORAN PROPERTY INVESTORS LLC
SONORAN (PRESSNALL) SLY PTN LOT 3 & ELY PTN NE4 SW4 SEC 23-18-15
35.69
29 305-58-038A SONORAN PROPERTY INVESTORS LLC
SONORAN (PRESSNALL) NE4 SE4 40 AC SEC 23-18-15 (EXC MINERAL RIGHTS)
40.00
SONORAN PROPERTY INVESTORS LLC – FEE OWNED (ASSOCIATED) PROPERTY – TOTAL ACREAGE 375.22
ALL FEE OWNED (ASSOCIATED) PROPERTY – TOTAL ACREAGE 3301.42
*RIGHTS IN MINERAL INTERESTS & TERMS AND CONDITIONS AS MAY BE CONTAINED IN DEED & INSTRUMENTS Recorded in Docket 3413, Pages 362 and 369, Pima County, AZ [AS ASSIGNED]
Hudbay has also acquired 14 parcels of fee (private) land and 1 parcel of leased land that are more distal from the Project area which are planned for infrastructure purposes including well fields, pump stations, and utilities (the “Distal Fee Lands”). The Distal Fee Lands constitute an additional approximately 183 acres (74 hectares) and are detailed in Table 4-4.

Preliminary Economic Assessment Copper World Complex, Pima County, Arizona USA
Page 4-46
TABLE 4-4: FEE OWNED AND LEASED PROPERTIES DESCRIPTION AND LOCATION
FEE OWNED & LEASED (ASSOCIATED BUT DISTAL) PROPERTY BY PIMA COUNTY TAX PARCEL NO. “
PARCEL
NO. TAX PAYER PARCEL DESCRIPTION PROPERTY NAME ACRES ROYALTY INTEREST
1 303601410 ROSEMONT COPPER CO
SANRITA WEST (SANRITA PROP. /SAHAURITA 53/LAMB) SLY PTN NW4 53.50 AC SEC 17-17-14
SANRITA WEST (SANRITA PROP. /SAHUARITA 53/LAMB)
53.500
2 30354005B ROSEMONT COPPER CO
SANRITA SOUTH (SCALESE TRUST) E/2 SW/4 SE/4 EXC S30’ FOR RD 19.55 AC SEC 29-17-14
SANRITA SOUTH (SCALESE TRUST)
19.550
ANNE SCALESE TRUST, 5% NET PROFITS INTEREST (METALS) ROYALTY Recorded as Seq. No. 20110420776, Pima County, AZ
3 30363013C ROSEMONT COPPER CO
SANRITA EAST (DAWSON PROP./KANARCO) S723.30’ E2 NE4 EXC N292’ E487.53’ & EXC RDS 16.93 AC SEC 21-17-14
SANRITA EAST (DAWSON PROP./KANARCO)
16.930
4 30363013D ROSEMONT COPPER CO
SANRITA EAST (DAWSON PROP./KANARCO) N292’ S723.30’ W447.53’ E487.53’ E2 NE4 3.00 AC SEC 21-17-14
SANRITA EAST (DAWSON PROP. /KANARCO)
3.000
5 30365003C ROSEMONT COPPER CO
WILMOT JUNCTION E2 SW4 SE4 EXC E165’ M/L 15.00 AC SEC 24-17-14
WILMOT JUNCTION 15.000
6 30365003E ROSEMONT COPPER CO
WILMOT JUNCTION E720’ SE4 SE4 EXC N60’ THEREOF 20.91 AC SEC 24-17-14
WILMOT JUNCTION 20.910
7 30365003F ROSEMONT COPPER CO
WILMOT JUNCTION E165’ SW4 SE4 & SE4 SE4 EXC 720’ THEREOF 23.18 AC SEC 24-17-14
WILMOT JUNCTION 23.180
8 30365004A ROSEMONT COPPER CO
WILMOT JUNCTION E2 NE4 SE4 & N60’ E2 SE4 SE4 20.91 AC SEC 24-17-14
WILMOT JUNCTION 20.910
9 30353008D ROSEMONT COPPER CO
OLD NOGALES TRIANGLE PTN E250’ N1043.77’ NE4 NE4 4.38 AC SEC 36-17-13
OLD NOGALES TRIANGLE 4.380
10 30367001E ROSEMONT COPPER CO
OLD NOGALES TRIANGLE N318.87’ LOT 1 LYG W HWY 1.16 AC SEC 31-17-14
OLD NOGALES TRIANGLE
1.160
11 30367001F ROSEMONT COPPER CO
OLD NOGALES TRIANGLE THAT PT OF LOT 1 LYG W OF HWY EXC N465.5’ &S277’ THEREFROM 1.28 AC SEC 31-17-14
OLD NOGALES TRIANGLE 1.280
12 30367002G ROSEMONT COPPER CO
OLD NOGALES TRIANGLE PT OF LOT 2 LYG W OF HWY .26 AC SEC 31-17-14
OLD NOGALES TRIANGLE
0.260
13 30367003B ROSEMONT COPPER CO
OLD NOGALES TRIANGLE S146.68’ OF N465.55’ OF THAT PTN OF LOT 1 LYG W OF HWY .47 AC SEC 31-17-14
OLD NOGALES TRIANGLE 0.470
14 30367004B ROSEMONT COPPER CO
OLD NOGALES TRIANGLE N217’ S277’ LOT 1 LYG W OF HWY .25 AC SEC 31-17-14
OLD NOGALES TRIANGLE 0.250
FEE OWNED (DISTAL) TOTAL 180.780
1 LEASED PARCEL 30367002H
VULCAN MATERIALS CO/ ROSEMONT COPPER CO
LEASED PORTION IS 38.70 AC OUT OF: NW4 LYG ELY OF RR EXC TUC-NOGALES HWY 129.58 AC SEC 31-17-14
VULCAN MATERIALS CO LEASE
38.700
FEE LEASED (DISTAL) TOTALS 38.700
The Patented Claims are considered to be private lands that provide the owner with both surface and mineral rights. The Patented Claims, including the core of the mineral resource, are monumented in the field by surveyed brass caps on short pipes cemented into the ground. The Associated Fee Lands have been legally acquired by instruments recorded in the Pima County Recorder’s Office which describe the location of the land and ownership is insured with Policies of Title Insurance. The Patented Claims and Associated Fee Lands are subject to annual property taxes currently amounting to approximately $43,800/year.
Rights to the mineral interest on USFS and BLM lands have been vested to Rosemont Copper Company, via the location and maintenance of the Unpatented Claims that surround the Patented Claims. Notices of Location of the Unpatented Claims have been posted on the claims and recorded at the BLM and with the Pima County Recorder’s Office as required by state and federal law. Wooden posts and stone cairns mark the location of the unpatented mining claim corners, end lines and discovery monuments, all of which have been surveyed. Wooden posts mark the location of the unpatented mill site corners and location monuments, all of which have been
Preliminary Economic Assessment Copper World Complex, Pima County, Arizona USA
Page 4-47
surveyed. The Unpatented Claims are maintained on BLM and USFS land through the payment of annual maintenance fees currently set at $165.00 per claim, for a total of approximately $307,890.00, payable annually to the BLM on or before September 1st of each year.
The rights-of-way over Arizona State Land are all non-exclusive but grant Hudbay the rights to construct certain utility infrastructure connecting the well field and power supply to the Project. Two of these rights-of-way have a term of 10 years while the other four have a term of 50 years. These rights-of-way across Arizona State Land are not shown in Figure 4-1, but generally run northwest from the Project along Santa Rita Road towards the Town of Sahuarita.›
There is a 3% NSR royalty on all 132 Patented Claims, 603 of the Unpatented Claims, and 1 parcel of the Associated Fee Lands consisting of approximately 180 acres. In the original royalty deeds, a 1.5% NSR is reserved to each of (1) Dennis Lauderbach et. Ux. And (2) Pioneer Trust Company of Arizona, as Trustee under Trust No. 11778.
Precious metals production from the Project is subject to a stream agreement with Wheaton. Under the agreement, Hudbay is entitled to receive a deposit payment of $230 million against delivery of 92.5% of the gold and silver that is produced from the Project and sold to third party purchasers. Given certain ambiguities in the contract arising from the change in the development plan for the Project since the 2017 Feasibility Study, Hudbay and Wheaton have commenced discussions regarding a possible restructuring of the stream agreement based upon the new mine plan and processing plant design. The PEA presented in this Technical Report assumes an upfront deposit of $230 million in the first year of Phase I construction in exchange for the delivery of 100% of silver produced, at a fixed price of $3.90/oz.
Hudbay’s ownership in the Project was subject to an earn-in agreement and joint venture agreement dated September 16, 2010 between Rosemont Copper Company and United Copper & Moly LLC (‘‘UCM’’), pursuant to which UCM had earned a 7.95% interest and could have earn up to a 20% joint venture interest in the Project. Subsequently, all of the interest of UCM was purchased by Hudbay under that certain Acquisition Agreement dated April 25, 2019. In connection with the acquisition, Hudbay is required to pay UCM deferred cash consideration in an aggregate amount of $30 million, payable in three equal annual instalments commencing in July 2022.
The permits required to conduct the operations proposed for the Project are hereinafter described in Section 20.
Other than as disclosed in this Technical Report, there are no known environmental liabilities or significant factors or risks that may affect access, title, or the right or ability to perform the work on land associated with the Project.

Preliminary Economic Assessment Copper World Complex, Pima County, Arizona USA
Page 5-48
5. ACCESSIBILITY, CLIMATE, LOCAL RESOURCES, INFRASTRUCTURE, AND PHYSIOGRAPHY
5.1 ACCESSIBILITY
The Project is located in Pima County, Arizona, approximately 30 miles (50 km) southeast of Tucson. The main access to the Project site is from Tucson by travelling to the Town of Sahuarita via Tucson-Nogales highway (I-19), for about 20 miles (30 km), and the via Santa Rita Road which becomes an unpaved access road where the main proposed access road is to the Plant site (Figure 5-1).
FIGURE 5-1: PROJECT PROPERTY LOCATION
5.2 CLIMATE
The southern Arizona climate is typical of a semi-arid continental desert with hot summers and temperate winters. The Project area ranges from flat to mountainous topography in the northeastern and northwestern flanks of the Santa Rita Mountains at a surface elevation ranging from 4,265 to 6,280 feet (1,300 to 1,914 meters) above mean sea level (ft amsl).
Summer daily high temperatures are above 90°F (32°C) with significant cooling at night. Winter is typically drier, with mild daytime and overnight temperatures typically above freezing. Winter can have occasional low-intensity rainstorms and light snowfall patterns that can last for several days.
The average annual precipitation in the Project area is approximately 20 inches (50 cm) based on historical data from eight meteorological stations within a 30-mile radius of the Project area. More than half of the annual precipitation occurs during the monsoon season, which last from July through September. The monsoon season is characterized by afternoon thunderstorms typically of short duration, but with high-intensity rainfall that can have minor effects on a mining operation. The lowest precipitation months are April through June.
Preliminary Economic Assessment Copper World Complex, Pima County, Arizona USA
Page 5-49
A meteorological station was near the core shed at Hidden Valley, in 2015. Data from the weather station is automatically recorded and downloaded monthly by site personnel.
As with Hudbay’s other operations, the Project is subject to the physical risks of climate change which may arise in the future and could include more frequent extreme weather events, including extreme dry heat and increased frequency of storms, and reduced water availability.
5.3 LOCAL RESOURCES
The largest city near the Project area is Tucson, with a population of 542,629 based on the 2020 United States Census data. The Tucson Metropolitan Area has a population of approximately 1,043,433.
Arizona produces 66% of the copper in the USA, and Tucson is a mining industry hub in the state with nine operating copper mines within a 125 miles (200 km) radius. The cultural and educational facilities provided in the Tucson Metropolitan Area attract experienced technical staff into the area. Tucson is home to a well-established base of contractors and service providers in the mining industry.
5.4 INFRASTRUCTURE
The state and interstate highways system allow access to the Project site for all major truck deliveries. The majority of the labor and supplies for construction and operations can come from the surrounding areas in Pima, Cochise and Santa Cruz Counties.
The Union Pacific mainline east-west railroad route passes through Tucson, Arizona and generally follows I-10. The Port of Tucson has rail access from the Union Pacific mainline consisting of a two-mile (3.2 km) siding complemented by an additional 3,000-foot (914 m) siding.
The Tucson International Airport (“TIA”) is located approximately 30 miles (50 km) from the Project site and near Interstate highways I-10 and I-19. TIA provides international air passenger and air freight services to businesses in the area, with seven airlines currently providing nonstop service to 15 destinations with connections worldwide.
The power supply to the Project falls within the Tucson Electric Power (TEP) under a shared service agreement with Trico Electric Cooperative Inc. (TRICO). Since the electrical load for the mining and process operations would be located in the TEP and TRICO service territories, a joint venture business arrangement is expected to be established between TEP and TRICO to compensate both service providers by the Arizona Corporation Commission review and approval. Currently, Trico services the Helvetia Site Office with a distribution line that runs through the property. A new transmission line will be built to bring power to site and service the Project. For further description see section 18.
5.5 PHYSIOGRAPHY
The Project is located within the northern portion of the Santa Rita Mountains in the Basin and Range Physiographic Province of the southwestern United States. The province is characterized by high mountain ranges adjacent to alluvial-filled basins. The Basin and Range province has been further divided into the Mexican Highlands and Sonoran Desert sub-provinces. The Santa Rita Mountains form the boundary between the Mexican Highlands of southeastern Arizona and the Sonoran Desert sub-province to the West.
The Project occupies relatively flat to mountainous topography in the northeastern and northwestern flanks of the Santa Rita Mountains. The Santa Rita Mountains separate the Cienega Basin to the east from the Santa Cruz Basin to the west.
Vegetation in the Project area reflects the climate with the lower slopes of the Santa Rita Mountains. This area covers three main vegetation communities: the Desert (Scrub) Grasslands, the Desert and Semi-Desert Grasslands, and the Oak, juniper, Pinyon Community. As the elevation increases in the Project area, vegetation density also increases and transitions into semi-desert grassland that supports abundant catclaw acacia and mimosa, ocotillo, and yucca.
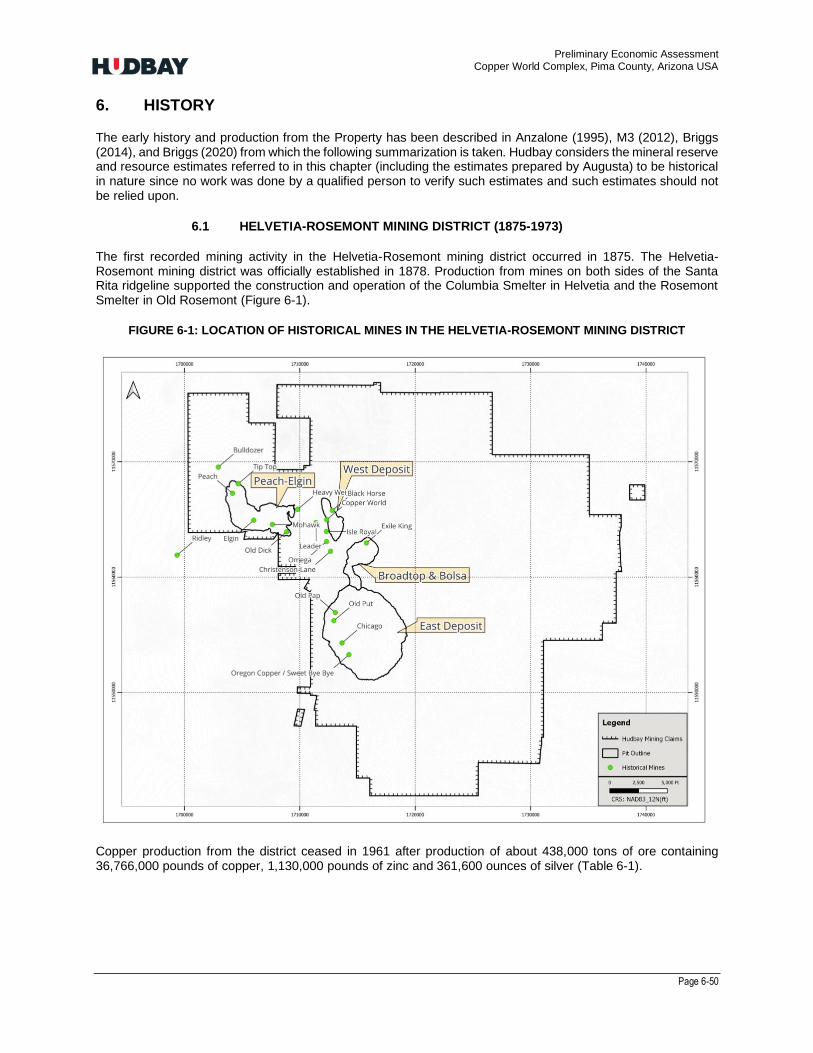
Preliminary Economic Assessment Copper World Complex, Pima County, Arizona USA
Page 6-50
6. HISTORY
The early history and production from the Property has been described in Anzalone (1995), M3 (2012), Briggs (2014), and Briggs (2020) from which the following summarization is taken. Hudbay considers the mineral reserve and resource estimates referred to in this chapter (including the estimates prepared by Augusta) to be historical in nature since no work was done by a qualified person to verify such estimates and such estimates should not be relied upon.
6.1 HELVETIA-ROSEMONT MINING DISTRICT (1875-1973)
The first recorded mining activity in the Helvetia-Rosemont mining district occurred in 1875. The Helvetia-Rosemont mining district was officially established in 1878. Production from mines on both sides of the Santa Rita ridgeline supported the construction and operation of the Columbia Smelter in Helvetia and the Rosemont Smelter in Old Rosemont (Figure 6-1).
FIGURE 6-1: LOCATION OF HISTORICAL MINES IN THE HELVETIA-ROSEMONT MINING DISTRICT
Copper production from the district ceased in 1961 after production of about 438,000 tons of ore containing 36,766,000 pounds of copper, 1,130,000 pounds of zinc and 361,600 ounces of silver (Table 6-1).
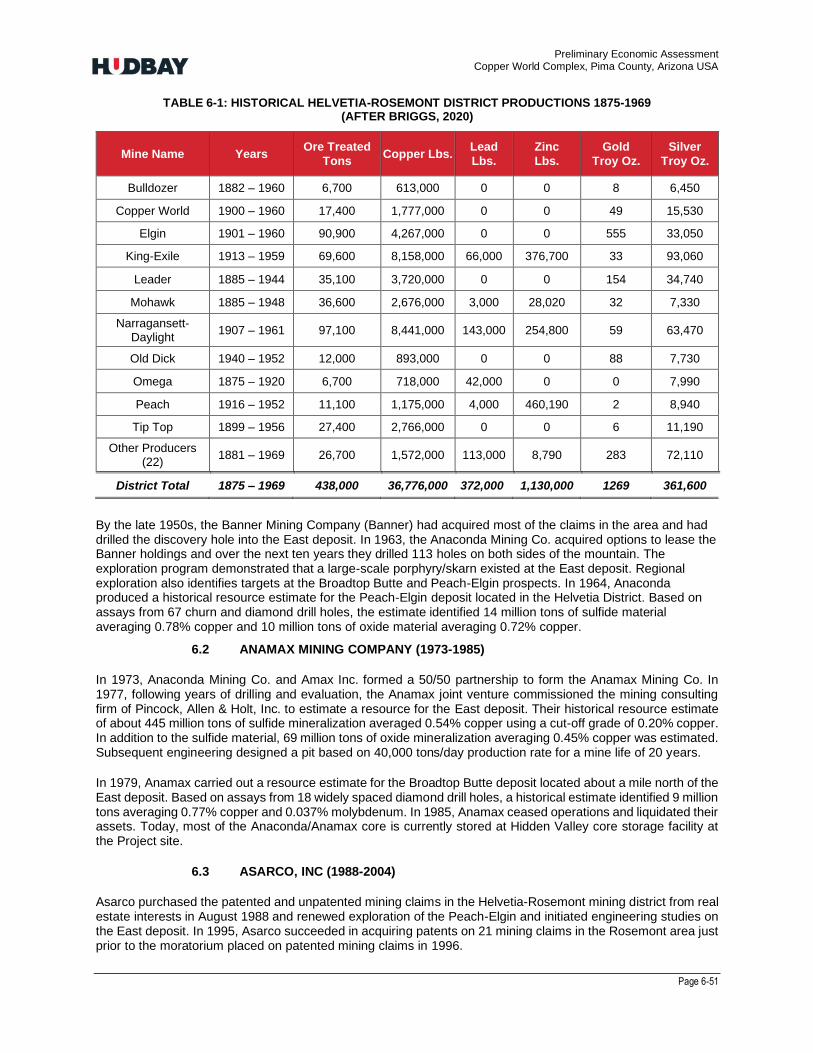
Preliminary Economic Assessment Copper World Complex, Pima County, Arizona USA
Page 6-51
TABLE 6-1: HISTORICAL HELVETIA-ROSEMONT DISTRICT PRODUCTIONS 1875-1969 (AFTER BRIGGS, 2020)
Mine Name Years Ore Treated
Tons Copper Lbs.
Lead
Lbs.
Zinc
Lbs.
Gold
Troy Oz.
Silver
Troy Oz.
Bulldozer 1882 – 1960 6,700 613,000 0 0 8 6,450
Copper World 1900 – 1960 17,400 1,777,000 0 0 49 15,530
Elgin 1901 – 1960 90,900 4,267,000 0 0 555 33,050
King-Exile 1913 – 1959 69,600 8,158,000 66,000 376,700 33 93,060
Leader 1885 – 1944 35,100 3,720,000 0 0 154 34,740
Mohawk 1885 – 1948 36,600 2,676,000 3,000 28,020 32 7,330
Narragansett-Daylight
1907 – 1961 97,100 8,441,000 143,000 254,800 59 63,470
Old Dick 1940 – 1952 12,000 893,000 0 0 88 7,730
Omega 1875 – 1920 6,700 718,000 42,000 0 0 7,990
Peach 1916 – 1952 11,100 1,175,000 4,000 460,190 2 8,940
Tip Top 1899 – 1956 27,400 2,766,000 0 0 6 11,190
Other Producers (22)
1881 – 1969 26,700 1,572,000 113,000 8,790 283 72,110
District Total 1875 – 1969 438,000 36,776,000 372,000 1,130,000 1269 361,600
By the late 1950s, the Banner Mining Company (Banner) had acquired most of the claims in the area and had drilled the discovery hole into the East deposit. In 1963, the Anaconda Mining Co. acquired options to lease the Banner holdings and over the next ten years they drilled 113 holes on both sides of the mountain. The exploration program demonstrated that a large-scale porphyry/skarn existed at the East deposit. Regional exploration also identifies targets at the Broadtop Butte and Peach-Elgin prospects. In 1964, Anaconda produced a historical resource estimate for the Peach-Elgin deposit located in the Helvetia District. Based on assays from 67 churn and diamond drill holes, the estimate identified 14 million tons of sulfide material averaging 0.78% copper and 10 million tons of oxide material averaging 0.72% copper.
6.2 ANAMAX MINING COMPANY (1973-1985)
In 1973, Anaconda Mining Co. and Amax Inc. formed a 50/50 partnership to form the Anamax Mining Co. In 1977, following years of drilling and evaluation, the Anamax joint venture commissioned the mining consulting firm of Pincock, Allen & Holt, Inc. to estimate a resource for the East deposit. Their historical resource estimate of about 445 million tons of sulfide mineralization averaged 0.54% copper using a cut-off grade of 0.20% copper. In addition to the sulfide material, 69 million tons of oxide mineralization averaging 0.45% copper was estimated. Subsequent engineering designed a pit based on 40,000 tons/day production rate for a mine life of 20 years.
In 1979, Anamax carried out a resource estimate for the Broadtop Butte deposit located about a mile north of the East deposit. Based on assays from 18 widely spaced diamond drill holes, a historical estimate identified 9 million tons averaging 0.77% copper and 0.037% molybdenum. In 1985, Anamax ceased operations and liquidated their assets. Today, most of the Anaconda/Anamax core is currently stored at Hidden Valley core storage facility at the Project site.
6.3 ASARCO, INC (1988-2004)
Asarco purchased the patented and unpatented mining claims in the Helvetia-Rosemont mining district from real estate interests in August 1988 and renewed exploration of the Peach-Elgin and initiated engineering studies on the East deposit. In 1995, Asarco succeeded in acquiring patents on 21 mining claims in the Rosemont area just prior to the moratorium placed on patented mining claims in 1996.
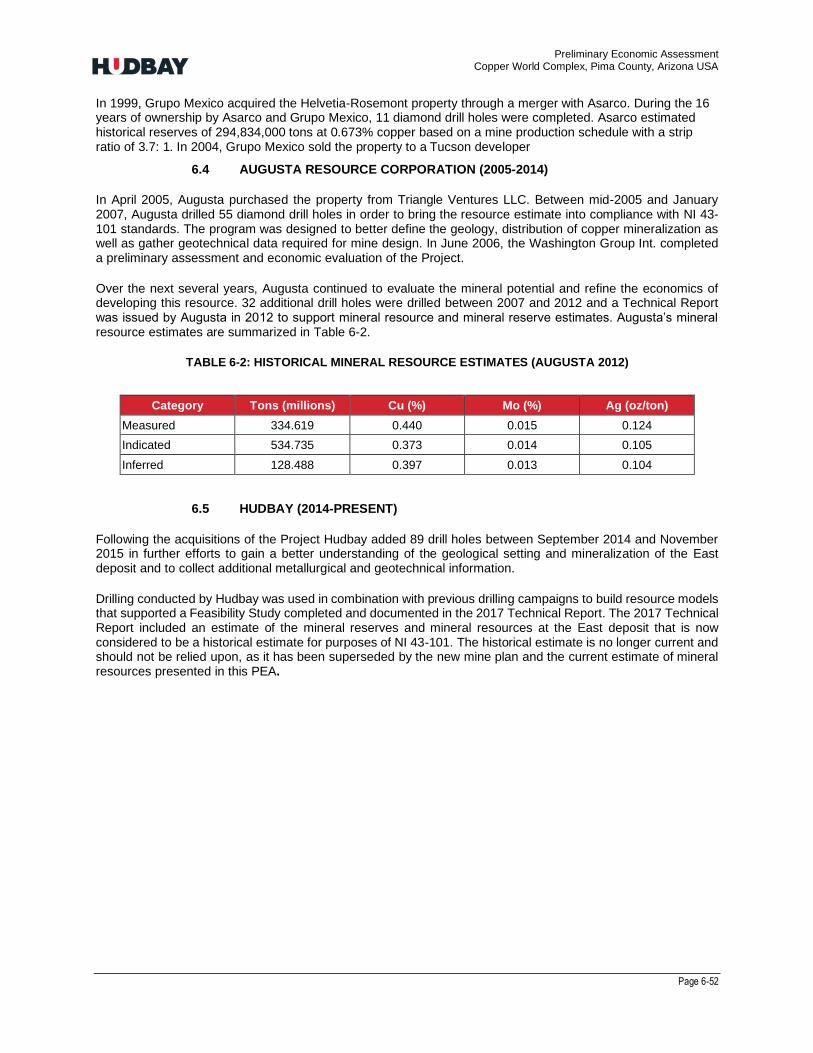
Preliminary Economic Assessment Copper World Complex, Pima County, Arizona USA
Page 6-52
In 1999, Grupo Mexico acquired the Helvetia-Rosemont property through a merger with Asarco. During the 16 years of ownership by Asarco and Grupo Mexico, 11 diamond drill holes were completed. Asarco estimated historical reserves of 294,834,000 tons at 0.673% copper based on a mine production schedule with a strip ratio of 3.7: 1. In 2004, Grupo Mexico sold the property to a Tucson developer
6.4 AUGUSTA RESOURCE CORPORATION (2005-2014)
In April 2005, Augusta purchased the property from Triangle Ventures LLC. Between mid-2005 and January 2007, Augusta drilled 55 diamond drill holes in order to bring the resource estimate into compliance with NI 43-101 standards. The program was designed to better define the geology, distribution of copper mineralization as well as gather geotechnical data required for mine design. In June 2006, the Washington Group Int. completed a preliminary assessment and economic evaluation of the Project.
Over the next several years, Augusta continued to evaluate the mineral potential and refine the economics of developing this resource. 32 additional drill holes were drilled between 2007 and 2012 and a Technical Report was issued by Augusta in 2012 to support mineral resource and mineral reserve estimates. Augusta’s mineral resource estimates are summarized in Table 6-2.
TABLE 6-2: HISTORICAL MINERAL RESOURCE ESTIMATES (AUGUSTA 2012)
Category Tons (millions) Cu (%) Mo (%) Ag (oz/ton)
Measured 334.619 0.440 0.015 0.124
Indicated 534.735 0.373 0.014 0.105
Inferred 128.488 0.397 0.013 0.104
6.5 HUDBAY (2014-PRESENT)
Following the acquisitions of the Project Hudbay added 89 drill holes between September 2014 and November 2015 in further efforts to gain a better understanding of the geological setting and mineralization of the East deposit and to collect additional metallurgical and geotechnical information.
Drilling conducted by Hudbay was used in combination with previous drilling campaigns to build resource models that supported a Feasibility Study completed and documented in the 2017 Technical Report. The 2017 Technical Report included an estimate of the mineral reserves and mineral resources at the East deposit that is now considered to be a historical estimate for purposes of NI 43-101. The historical estimate is no longer current and should not be relied upon, as it has been superseded by the new mine plan and the current estimate of mineral resources presented in this PEA.

Preliminary Economic Assessment Copper World Complex, Pima County, Arizona USA
Page 6-53
TABLE 6-3: HISTORICAL MINERAL RESERVE AND MINERAL RESOURCE ESTIMATE FOR THE STAND-ALONE ROSEMONT PROJECT
Hudbay initiated exploration drilling on targets north and west of the East deposit in October 2020. Drilling started in proximity of the historic mines including the Elgin, Copper World, Leader, Isle Royale and King Mines; as well as near previously historically drill identified targets including Broadtop Butte and Peach; and in areas exhibiting significant indication of copper oxide mineralization on surface most notably along the Bolsa area south of Broadtop Butte and north of the East deposit. Several holes were also drilled for condemnation purposes.
A total of 310 holes drilled by Hudbay and previous owners over the Copper World project area have intersected copper mineralization and were used to estimate initial mineral resource estimates for the Copper World deposits in December 2021.
Tonnes Cu (%) Mo (g/t) Ag (g/t)
Rosemont
Proven 426,100,000 0.48 120 4.96
Probable 111,000,000 0.31 100 3.09
Total proven and probable 537,100,000 0.44 116 4.57
Tonnes Cu (%) Mo (g/t) Ag (g/t)
Rosemont
Measured 161,300,000 0.38 90 2.72
Indicated 374,900,000 0.25 110 2.60
Inferred 62,300,000 0.30 100 1.58
Total Measured + Indicated 536,200,000 0.29 104 2.64
Total Inferred 62,300,000 0.30 100 1.58
2. Mineral resources are constrained within a computer generated pit using the Lerchs-Grossman algorithm. Estimate of the
mineral resource is based on the following metals prices: $3.15 per pound of copper; $11.00 per pound of molybdenum; and $18.00
3. Based on 100% ownership of the Rosemont project.
4. Mineral resources are not mineral reserves as they do not have demonstrated economic viability. The above mineral resource is
exclusive of mineral reserves.
Rosemont Mineral Reserve Estimates – January 1, 2022 (1)(2)(3)
1. Totals may not add up correctly due to rounding.
2. Estimate of the mineral reserves is based on the following metals prices: $3.15 per pound of copper; $11.00 per pound of
molybdenum; and $18.00 per ounce of silver.
3. Based on 100% ownership of the Rosemont project.
Rosemont Mineral Resource Estimates – January 1, 2022(1)(2)(3)(4)
1. Totals may not add up correctly due to rounding.

Preliminary Economic Assessment Copper World Complex, Pima County, Arizona USA
Page 7-54
7. GEOLOGICAL SETTING AND MINERALIZATION
7.1 REGIONAL GEOLOGY
The Project deposits are located in the Laramide belt, a major porphyry province that extends for approximately 600 miles (1,000 km) from Arizona to Sinaloa, Mexico (Figure 7-1), and includes a number of other world class deposits (e.g. Morenci, Resolution, and Cananea). Mesozoic subduction and associated magmatism and tectonism in the southwestern United States and northern Mexico, generated extensive and relevant porphyry copper mineralization. Compressional tectonism during the Mesozoic and early Cenozoic Laramide Orogeny caused folding and thrusting, accompanied by extensive calc-alkaline magmatism (Barra et al., 2005). Tertiary extensional tectonism followed the Laramide Orogeny, accompanied by voluminous felsic volcanism (Barra et al., 2005). Tertiary faulting juxtaposed mineralized and unmineralized rocks. The extensional tectonics culminated in the large-scale block faulting that produced the present basin and range geomorphology that is typical throughout southern Arizona (Maher, 2008).
FIGURE 7-1: LARAMIDE BELT AND ASSOCIATED PORPHYRY COPPER MINERALIZATION (BARRA ET AL., 2005)
7.2 DISTRICT GEOLOGY
The Project deposits are located in the northern block of the Santa Rita Mountains in southern Arizona (Figure 7-2). As reviewed by Rasmussen et. Al. (2012), the northern block is dominated by Precambrian granite (brown on the map), with slices of Paleozoic and Mesozoic sediments on the eastern and northern sides (blue and green on the map). This block includes small stocks and dikes of quartz monzonite or quartz latite porphyry that are related to porphyry copper and skarn mineralization. Tertiary faulting appears to have significantly segmented the original stratigraphy and deposits, juxtaposing mineralized and unmineralized rocks.
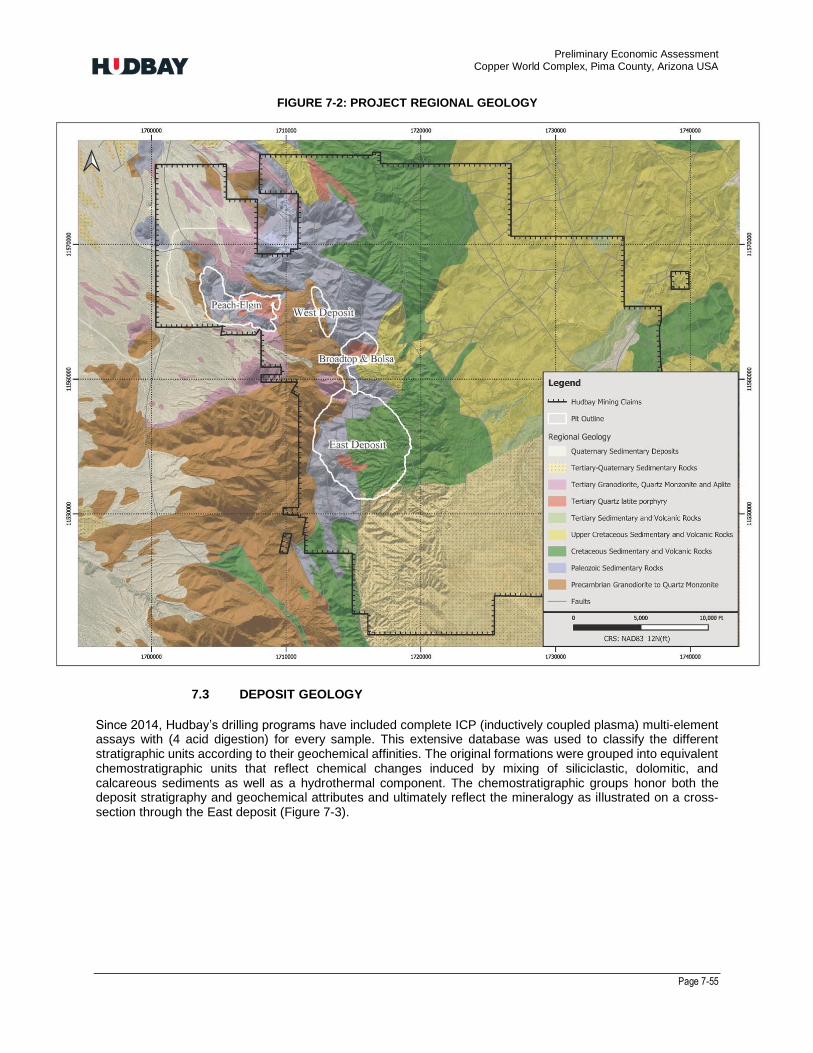
Preliminary Economic Assessment Copper World Complex, Pima County, Arizona USA
Page 7-55
FIGURE 7-2: PROJECT REGIONAL GEOLOGY
7.3 DEPOSIT GEOLOGY
Since 2014, Hudbay’s drilling programs have included complete ICP (inductively coupled plasma) multi-element assays with (4 acid digestion) for every sample. This extensive database was used to classify the different stratigraphic units according to their geochemical affinities. The original formations were grouped into equivalent chemostratigraphic units that reflect chemical changes induced by mixing of siliciclastic, dolomitic, and calcareous sediments as well as a hydrothermal component. The chemostratigraphic groups honor both the deposit stratigraphy and geochemical attributes and ultimately reflect the mineralogy as illustrated on a cross-section through the East deposit (Figure 7-3).
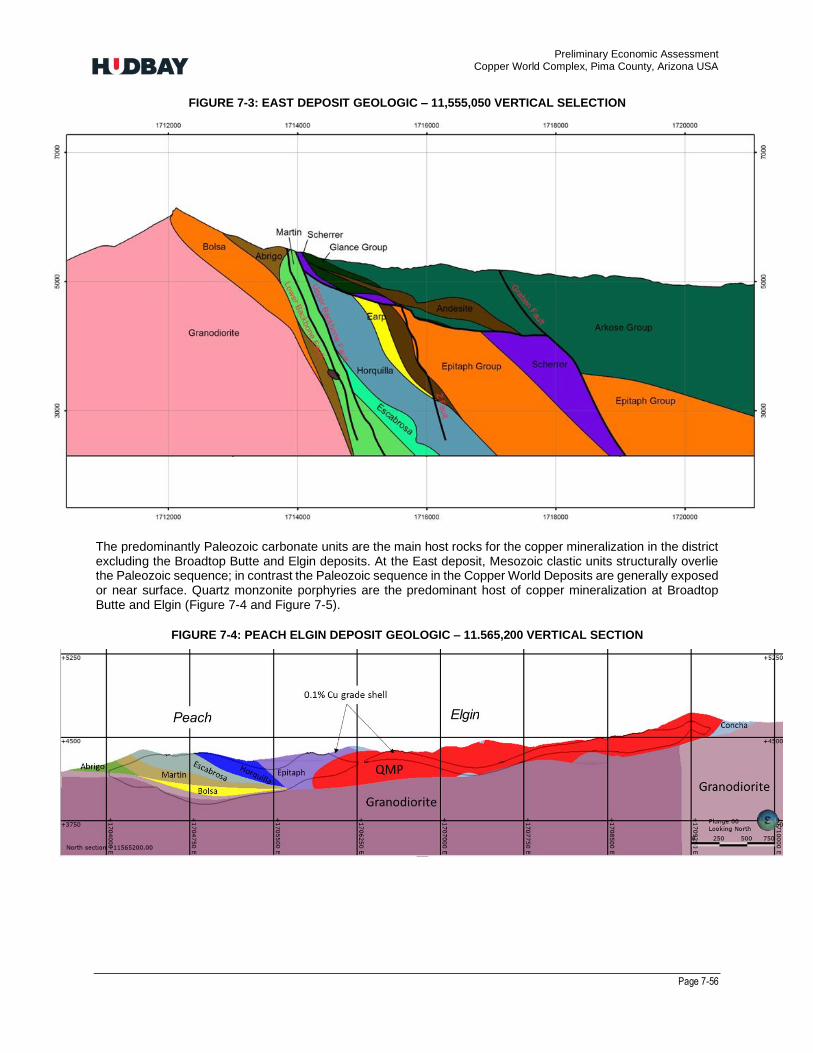
Preliminary Economic Assessment Copper World Complex, Pima County, Arizona USA
Page 7-56
FIGURE 7-3: EAST DEPOSIT GEOLOGIC – 11,555,050 VERTICAL SELECTION
The predominantly Paleozoic carbonate units are the main host rocks for the copper mineralization in the district excluding the Broadtop Butte and Elgin deposits. At the East deposit, Mesozoic clastic units structurally overlie the Paleozoic sequence; in contrast the Paleozoic sequence in the Copper World Deposits are generally exposed or near surface. Quartz monzonite porphyries are the predominant host of copper mineralization at Broadtop Butte and Elgin (Figure 7-4 and Figure 7-5).
FIGURE 7-4: PEACH ELGIN DEPOSIT GEOLOGIC – 11.565,200 VERTICAL SECTION
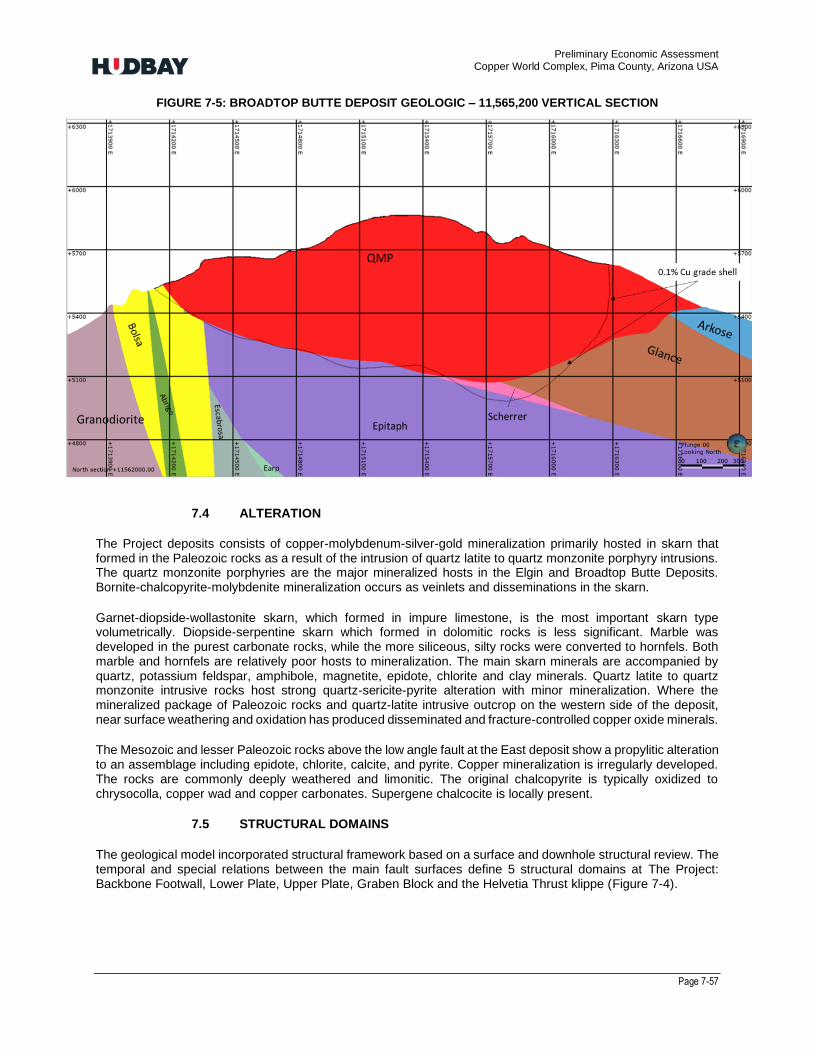
Preliminary Economic Assessment Copper World Complex, Pima County, Arizona USA
Page 7-57
FIGURE 7-5: BROADTOP BUTTE DEPOSIT GEOLOGIC – 11,565,200 VERTICAL SECTION
7.4 ALTERATION
The Project deposits consists of copper-molybdenum-silver-gold mineralization primarily hosted in skarn that formed in the Paleozoic rocks as a result of the intrusion of quartz latite to quartz monzonite porphyry intrusions. The quartz monzonite porphyries are the major mineralized hosts in the Elgin and Broadtop Butte Deposits. Bornite-chalcopyrite-molybdenite mineralization occurs as veinlets and disseminations in the skarn.
Garnet-diopside-wollastonite skarn, which formed in impure limestone, is the most important skarn type volumetrically. Diopside-serpentine skarn which formed in dolomitic rocks is less significant. Marble was developed in the purest carbonate rocks, while the more siliceous, silty rocks were converted to hornfels. Both marble and hornfels are relatively poor hosts to mineralization. The main skarn minerals are accompanied by quartz, potassium feldspar, amphibole, magnetite, epidote, chlorite and clay minerals. Quartz latite to quartz monzonite intrusive rocks host strong quartz-sericite-pyrite alteration with minor mineralization. Where the mineralized package of Paleozoic rocks and quartz-latite intrusive outcrop on the western side of the deposit, near surface weathering and oxidation has produced disseminated and fracture-controlled copper oxide minerals.
The Mesozoic and lesser Paleozoic rocks above the low angle fault at the East deposit show a propylitic alteration to an assemblage including epidote, chlorite, calcite, and pyrite. Copper mineralization is irregularly developed. The rocks are commonly deeply weathered and limonitic. The original chalcopyrite is typically oxidized to chrysocolla, copper wad and copper carbonates. Supergene chalcocite is locally present.
7.5 STRUCTURAL DOMAINS
The geological model incorporated structural framework based on a surface and downhole structural review. The temporal and special relations between the main fault surfaces define 5 structural domains at The Project: Backbone Footwall, Lower Plate, Upper Plate, Graben Block and the Helvetia Thrust klippe (Figure 7-4).

Preliminary Economic Assessment Copper World Complex, Pima County, Arizona USA
Page 7-58
FIGURE 7-6: PROJECT DEPOSIT GEOLOCAL MODEL STRUCTURAL DOMAINS PLAN VIEW
The north trending, steeply dipping Backbone Fault juxtaposes Precambrian granodiorite and Lower Paleozoic quartzite and limestone to the west (Backbone Footwall block) against a block of an homoclinical sequence of younger mineralized metamorphosed sedimentary units to the east (Lower Plate). A series of subparallel, anastomosing, curviplanar faults that generally strike north and dip steeply within the Lower Plate define a zone along the Backbone Fault strike.
The Backbone Fault generally strikes north-south at the East deposit and continues north, slightly east of the Ridgeline crossing to the west side of the ridgeline South of Broadtop Butte. The Lower Paleozoic quartzite (Bolsa Formation) and limestone (Abrigo and Martin Formations) are well mineralized in the Backbone Footwall withing the Bolsa Deposit. North of Broadtop Butte, the Backbone Fault shifts to a more northwestwardly strike, and constitutes the controlling feature of the mineralization at the West deposit.
The Low Angle Faults at the East deposit are a series of shallowly east-dipping faults that are comprised of one major fault and a series of steep to shallow splay structures. The main Low Angle Fault forms the non-conformable contact between the Upper (siliciclastics and volcanics) and Lower Plate rocks at the East Deposit. East of Gunsight Pass, a mass of quartz-monzonite porphyry on the Upper Plate comprises the core of the Broadtop Butte Deposit. Within Broadtop Butte a generally east-north-east breccia pipe is along the southern margin of the quartz-monzonite porphyry varying from a monomictic breccia of quartz-monzonite porphyry in a quartz matrix to a less abundant polymictic breccia like above but with skarn and limestone clasts.
The fifth major structural domain, the Helvetia Thrust Klippe, is on the western slope of the Santa Rita Mountains. The Helvetia Thrust places Paleozoic aged carbonate and clastic sequence intruded by Laramide aged quartz
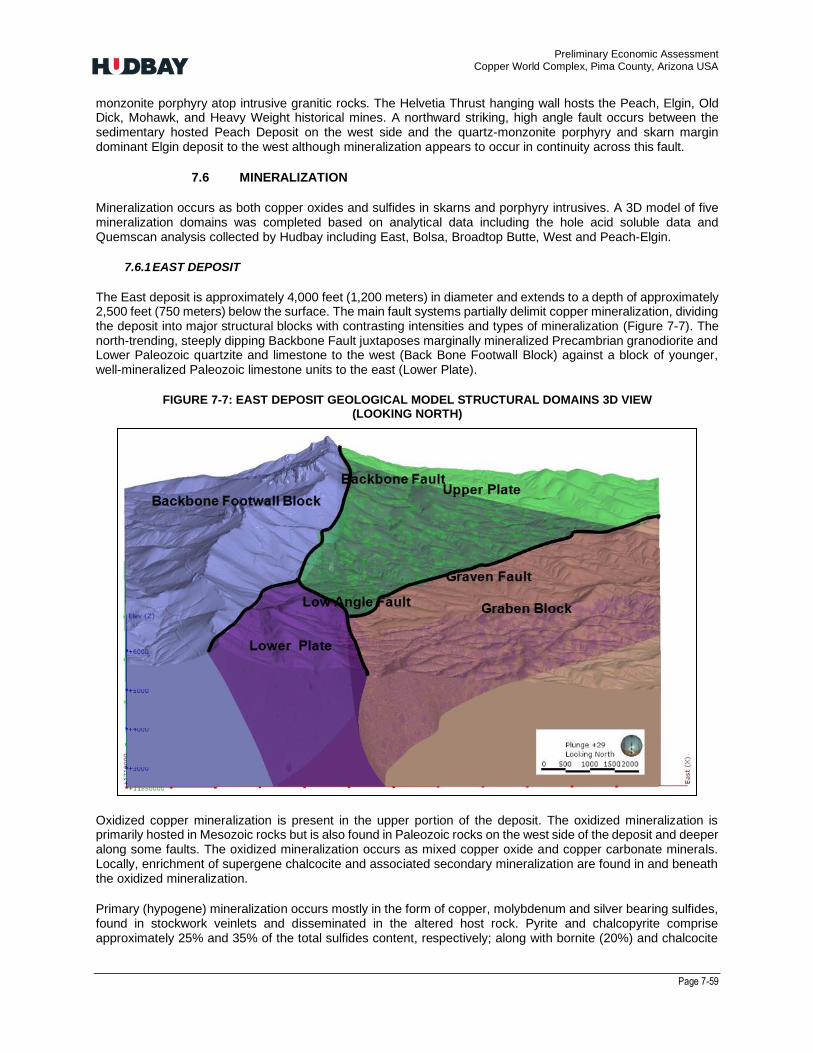
Preliminary Economic Assessment Copper World Complex, Pima County, Arizona USA
Page 7-59
monzonite porphyry atop intrusive granitic rocks. The Helvetia Thrust hanging wall hosts the Peach, Elgin, Old Dick, Mohawk, and Heavy Weight historical mines. A northward striking, high angle fault occurs between the sedimentary hosted Peach Deposit on the west side and the quartz-monzonite porphyry and skarn margin dominant Elgin deposit to the west although mineralization appears to occur in continuity across this fault.
7.6 MINERALIZATION
Mineralization occurs as both copper oxides and sulfides in skarns and porphyry intrusives. A 3D model of five mineralization domains was completed based on analytical data including the hole acid soluble data and Quemscan analysis collected by Hudbay including East, Bolsa, Broadtop Butte, West and Peach-Elgin.
7.6.1 EAST DEPOSIT
The East deposit is approximately 4,000 feet (1,200 meters) in diameter and extends to a depth of approximately 2,500 feet (750 meters) below the surface. The main fault systems partially delimit copper mineralization, dividing the deposit into major structural blocks with contrasting intensities and types of mineralization (Figure 7-7). The north-trending, steeply dipping Backbone Fault juxtaposes marginally mineralized Precambrian granodiorite and Lower Paleozoic quartzite and limestone to the west (Back Bone Footwall Block) against a block of younger, well-mineralized Paleozoic limestone units to the east (Lower Plate).
FIGURE 7-7: EAST DEPOSIT GEOLOGICAL MODEL STRUCTURAL DOMAINS 3D VIEW (LOOKING NORTH)
Oxidized copper mineralization is present in the upper portion of the deposit. The oxidized mineralization is primarily hosted in Mesozoic rocks but is also found in Paleozoic rocks on the west side of the deposit and deeper along some faults. The oxidized mineralization occurs as mixed copper oxide and copper carbonate minerals. Locally, enrichment of supergene chalcocite and associated secondary mineralization are found in and beneath the oxidized mineralization.
Primary (hypogene) mineralization occurs mostly in the form of copper, molybdenum and silver bearing sulfides, found in stockwork veinlets and disseminated in the altered host rock. Pyrite and chalcopyrite comprise approximately 25% and 35% of the total sulfides content, respectively; along with bornite (20%) and chalcocite
Preliminary Economic Assessment Copper World Complex, Pima County, Arizona USA
Page 7-60
(12%). The ratio of these main sulfide minerals is variable through the stratigraphy of the deposit owing to competing, over-printing pulses of mineralization and possible supergene effects. Molybdenite is a minor phase but appears to be distributed throughout the skarn and in peripheral portions of the deposit. Gold and silver are present in small amounts across the deposit and are thought to be contained in the primary sulfide minerals.
7.6.2 BOLSA
Drilling at Bolsa has defined a mineral resource of approximately 3,000’ along strike, generally 250 feet to 850 feet along width, over a depth of 450 feet to 850 feet. Mineralization is hosted almost exclusively in the lower Paleozoic Bolsa quartzite and Abrigo and Martin Limestone Formations within the Backbone Domain. Mineralization is truncated to the west at the disconformity with generally unmineralized granitic rocks, although weaker secondary copper oxide mineralization does occasionally occur on fractures in the granitic rock The eastern boundary is less distinctly defined by structure or stratigraphy. Mineralization in the Bolsa Quartzite is nearly entirely of non-carbonate copper oxide while composed of a mix of copper oxides and sulfides in the altered skarn in the Abrigo and Martin Formations.
7.6.3 BROADTOP BUTTE
Drilling at Broadtop Butte has defined a mineral resource 2500 feet along the east-northeast direction by 1600 feet across strike and up to 700 feet thick. Mineralization is hosted predominantly by quartz-monzonite porphyry, including an east-northeast striking brecciated zone. Skarns hosted in the Arkose Group and Glance group to the south of the quartz monzonite, and in the Glance Group, Scherrer Formation and Epitaph Formation to the north, east and below the quartz monzonite also host mineralization. Mineralization appears to be truncated on the east by the Backbone Fault. The extent of mineralization in all other directions does not appear to have strict stratigraphic or structural boundaries but seems to be related to the distance from the quartz-monzonite porphyry and its related skarn alteration halo. Mineralization in the un-brecciated quartz monzonite porphyry is dominated by sulfide mineralization; however, oxide copper mineralization is dominant in the breccia pipe portion of the deposit. Skarns at depth to the north and northeast of the quartz monzonite porphyry are relatively narrow, but with high-grade sulfide.
7.6.4 WEST DEPOSIT
The West deposit mineralization strikes at approximately 160°, parallel to the Backbone Fault for 3200 feet, ranging 400 feet to 1100 feet wide, and 300 feet to 700 feet deep. Mineralization is hosted by Paleozoic quartzites, and skarn altered carbonate units on both the footwall and hanging wall of the Backbone Fault domain. The strongest mineralization is within the Backbone Fault structural zone and is dominated by sulfide mineralization, The Hanging Wall of the main Backbone structure has lower grades and is oxide dominated. The major host stratigraphies at the West deposit are the early Paleozoic Bolsa and Abrigo Formations (Backbone Domain), and the Devonian Martin and Pennsylvanian Horquilla Formations (Hanging Wall). Mineralization nearly reaches the surface on the west slope of the low mountain that hosts the majority of the West deposit. Eastward no distinct structural or stratigraphic limit mineralization.
7.6.5 PEACH-ELGIN
The Peach Elgin mineralization sits in the Hanging wall of the low-angle Helvetia Thrust Fault which hosts several historically mined deposits including the Peach, Elgin, Mohawk, Old dick, and Heavy Weight mines. Drilling both historic and recent have connected much of the Helvetia Thrust hanging wall mineralization.
Peach is entirely in variably skarn altered sedimentary hosts and is cut by moderately shallow east dipping faults producing gaps in the stratigraphic sequence. Host stratigraphies include Bolsa, Abrigo, Martin, Escabrosa, Horquilla, and Epitaph. The Peach mineralization hosts an irregular intertwined mix of copper oxides and copper sulfide dominated units.
The remainder of the Helvetia Thrust mineralization, east of Peach in the Elgin deposit is either porphyry mineralization in the quartz-monzonite porphyry, or skarn around the perimeter, primarily in the Epitaph and Concha Formations. Very narrow massive sulfide has been intercepted in the northeast of the Helvetia Thrust hanging wall, however the bulk of mineralization is disseminated in the porphyries or in broader marginal skarns.

Preliminary Economic Assessment Copper World Complex, Pima County, Arizona USA
Page 8-61
8. DEPOSIT TYPE
The Project deposits consists of copper-molybdenum-silver mineralization hosted quartz monzonite porphyries and in skarn that formed in the Paleozoic rocks as a result of the intrusion of quartz latite to quartz monzonite porphyry intrusions. Genetically, skarns form part of the suite of deposit styles associated with porphyry copper centers. The skarns were formed as the result of thermal and metasomatic alteration of Paleozoic carbonate and to a lesser extent of Mesozoic clastic rocks. Near surface weathering has resulted in the oxidation of the sulfides in the overlying Mesozoic units at the East deposit and in the near surface Paleozoic units at the Copper World deposits.
Mineralization occurs mostly in the form of primary (hypogene) copper, molybdenum and silver bearing sulfides, found in stockwork veinlets and disseminated in the altered host rock at depth. Near surface, along structural zones, and in quartzite units oxidized copper mineralization is present. The oxidized mineralization occurs as mixed copper oxide and copper carbonate minerals. Locally, enrichment of supergene chalcocite and associated secondary mineralization are found in and beneath the oxidized mineralization.
The Twin Buttes Mine, operated by Anaconda and later by Cyprus, was developed on a deposit with a number of geologic similarities, located approximately 20 miles (32 kilometers) to the west of the Project. The Twin Buttes mine was in production from 1969 to 1994. In addition, the Asarco Mission Mine, located approximately 20 miles (32 kilometers) to the west of the Project, has also many common geologic characteristics with the deposits of the Copper World Complex..
Preliminary Economic Assessment Copper World Complex, Pima County, Arizona USA
Page 9-62
9. EXPLORATION
9.1 PREVIOUS WORK
Prospecting began in the Rosemont and Helvetia Mining Districts in the mid-1800s and by 1875 copper production was first recorded, which continued sporadically until 1951. By the late 1950s, exploration drilling had discovered the East deposit. A succession of major mining companies subsequently conducted exploratory drilling of the East deposit and the nearby Broadtop Butte, Peach Elgin and Copper World mineralized areas.
Augusta acquired the property in 2005 and performed infill drilling at the East deposit along with exploration geophysical surveys. A Titan 24 induced polarization/resistivity (“DCIP”) survey over the East deposit, performed in 2011, discovered significant chargeability anomalies which are only partially tested to this date. These anomalies appear to define mineralization and also certain unmineralized lithologic units. A regional scale airborne magnetics survey was also completed in 2008.
Two infill drilling campaigns were completed by Hudbay in and beneath the East deposit in 2014 and 2015. In addition to chemical assaying, magnetic susceptibility and conductivity measurements were taken using the Terraplus’ KT-10 & KT-20 instruments at approximately every 10-feet (3 meters) intervals of recovered core from the drilling program. The magnetic susceptibility data has been used from both drilling programs as a constraint for a 3D inversion of the deposit. A single test-line of DCIP data was collected over the East deposit using the DIAS Geophysical (3D Survey/Mapping) in April 2015 for comparison to the previously completed Titan 24 survey.
A mapping and geochemical sampling program was completed in the latter half of 2015 on the property to reassess the interpretation of the regional geology and deposit setting. This was followed by a structural interpretation using both surface and drill core measurements to aid in the geotechnical evaluation of the Project.
Hudbay initiated exploration drilling on targets within its Copper World private land in October 2020. Drill targets proximal to the historic mines included the Elgin, Copper World, Leader, Isle Royale and King Mines surroundings; historically identified drill targets included Broadtop Butte and Peach; and previously undrilled targets most notably the Bolsa area.
9.2 EXPLORATION POTENTIAL BETWEEN KNOWN DEPOSITS
The Copper World deposit remains partially open to the south. Broadtop Butte’s mineralized extent has not been fully defined to the east of the deposit. And most significantly, the Bolsa deposit remains open along strike, including roughly 600’ on the north toward Broadtop Butte, and 500 feet to the south along strike. Follow-up drilling has been conducted in these areas in 2022.
A number of geophysical targets exist outside of the known deposits. The most notable are a pair of anomalies approximately 1,400 feet north of the known West deposit on Forest Service land where Hudbay holds unpatented mining claims. Limited transects have identified numerous small exploration pits within this region, however the anomalies have never been drilled tested. Additional untested anomalies include those approximately 2,200 feet south of the West deposit and east of Broadtop Butte.
9.3 ADDITIONAL REGIONAL POTENTIAL ON HUDBAY TENEMENTS
Additional potential targets, not currently covered by IP coverage exist on Hudbay unpatented mining claims. These include targets proximal to historic mines and mapped intrusions roughly 4000 feet south and 3,000 feet south of the West deposit. Both of these targets would benefit from detailed field mapping and geophysics. Another potential target area is a northwest striking intrusive body of quartz-monzonite, approximately 8,000 feet North of the West deposit and approximately a mile northeast of the Imery’s Marbe Quarry. The intrusion was mapped by the USGS (Drewes, 1971) as the same intrusive unit that hosts porphyry mineralization at Broadtop Butte and Elgin. The target would benefit from detailed mapping and ground-penetrating geophysics, and potentiall by drilling.

Preliminary Economic Assessment Copper World Complex, Pima County, Arizona USA
Page 10-63
10. DRILLING
10.1 INTRODUCTION
Extensive drilling has been conducted by several successive property owners. The most recent drilling was done by Hudbay, with prior drilling campaigns completed by Lewisohn, Banner, Anaconda Mining Co., Anamax, Asarco and Augusta. Table 10-1 ssummarizes the drill holes used to estimate the current mineral resource estimate.
TABLE 10-1: DRILLHOLE DATABASE FOR THE PROJECT
Churn Rotary Diamond All DH type
Company Time period Holes Length (ft) Holes Length (ft) Holes Length (ft) Holes Length (ft)
Lewisohn 1956 1957 28 9,980 0 0 18 7,377 46 17,357
Banner 1961 1963 0 0 0 0 34 12,560 34 12,560
Anaconda 1961 1972 0 0 0 0 210 178,399 210 178,399
Anamax 1970 1983 0 0 29 5,974 186 127,979 215 133,953
asarco 1988 1992 0 0 0 0 12 16,094 12 16,094
Augusta 2005 2012 0 0 0 0 87 132,483 87 132,483
Hudbay 2014 2021 0 0 0 0 352 310,533 352 310,533
Summary 28 9,980 29 5,974 899 785,425 956 801,379
The drill holes in the database are mostly diamond drill holes. In some cases, the top portion of the older holes were drilled using a rock bit to set the collar or by rotary drilling methods and then switching to core drilling before intercepting mineralization. A map showing the location of the drill holes by company is provided in Figure 10-1 for the Copper World complex deposit.
Core recoveries within the mineralized zone for the Hudbay and Augusta drilling programs average over 90% lending confidence that quality samples were obtained including the oxidized intervals.

Preliminary Economic Assessment Copper World Complex, Pima County, Arizona USA
Page 10-64
FIGURE 10-1: DRILL HOLE LOCATIONS BY COMPANY
10.2 LEWISOHN AND BANNER MINING COMPANY (1953 TO 1963)
The earliest drilling recorded on the project area was conducted by Lewisohn between 1953 and 1957 and was done by churn drilling. No material is left from this drilling and only paper logs and copper assay results are available. This data was validated by conducting global statistical comparison with recent core drilling done by Hudbay over the same volume.
The first significant core drilling campaign on the Property was by Banner, beginning in about 1961. Banner completed primarily shallow diamond drill holes, many of which were subsequently deepened by Anaconda Mining Co.
Preliminary Economic Assessment Copper World Complex, Pima County, Arizona USA
Page 10-65
10.3 THE ANACONDA MINING CO., (1963 TO 1986)
Anaconda acquired Banner Rosemont Holdings around 1963 and conducted exploration at the East deposit and in adjacent mineralized areas. Between 1963 and 1973, Anaconda completed 113 diamond drill holes for a total of 136,838 feet. These holes were primarily drilled vertically. Down-hole and collar surveys completed by company surveyors were conducted during drilling or immediately following drill hole completion. Anaconda drilled approximately 85% of the larger N-size core and 15% of the smaller B-size core (1.4 inch or 36.4 mm diameter). Overall core recovery was more than 85%.
Exploration subsequently transferred to Anamax Mining Co., (an Anaconda Mining Co., and Amax Inc., joint venture), which continued diamond drilling and analytical work until 1986. Anamax completed 52 core holes for a total of 54,350 feet. These holes were almost exclusively drilled as angled holes inclined -45° to -55° to the west, approximately perpendicular to the east-dipping direction of the Paleozoic, metasedimentary host rocks. Down-hole and collar surveys by company surveyors were conducted during drilling or immediately following drill hole completion. Anamax drilled approximately 80% N-sized core and 20% B-sized core, with an overall core holes recovery of more than 88%.
10.4 ASARCO MINING CO., (1988 TO 2004)
Asarco acquired the Rosemont property in 1988 and conducted exploration until 2004, completing 11 vertical drill holes for a total of 14,695 feet. Data was available from eight of the Asarco core holes in the deposit area and were incorporated into Hudbay’s mineral resource estimates. No down-hole survey data are available for these holes. Drill hole collars were surveyed by company surveyors. The size of core collected by Asarco was predominantly N-size. Core recovery information was not available but re-logging by Augusta personnel indicated it to be of similar quality to that of other drilling campaigns.
10.5 AUGUSTA RESOURCE (2005 TO 2012)
Augusta optioned the property in 2005 and conducted diamond drilling through several campaigns, from 2005 to 2012. In total, Augusta completed 87 core holes for a total of 132,525 feet. Of these, 60 holes were drilled for the purposes of delineating the deposit and providing infill information, while six were exploration holes outside of the planned pit area, but close enough to be a part of the resource database. The remaining 21 core holes support geotechnical (13) and metallurgical (8) studies. Augusta holes were usually collared by rock-bitted through overburden, and then drilled with larger HQ-sized core as deeply as possible and finished with NQ-sized core if a reduction in core size was required due to ground conditions.
Most of the holes were oriented vertically, although a few of the holes were inclined to intercept targets from reasonably accessible drill pad locations. All drill holes were down-hole surveyed using a Reflex EZ-Shot survey instrument which measures inclination/dip and azimuth direction, with measurements generally taken every 100 feet down the hole during 2008 and every 200 or 500 feet down the hole during 2005, 2006 and 2011 to 2012 drill campaigns. The initial drill hole collar locations were surveyed by Putt Surveying of Tucson, Arizona, while all later drilling locations were measured and certified by Darling Environmental & Surveying of Tucson, Arizona.
10.6 HUDBAY (2014 TO 2015)
Shortly after acquiring the Project, Hudbay initiated a 44 diamond drill hole program in September 2014 and completed 93,122 feet of diamond drilling by December 2014. The drill program was conducted entirely within the footprint of the Augusta’s mineral resource estimates, on patented claims and was designed to gain an initial understanding of the geological setting and mineralization, provide infill drilling density along with metallurgical, geochemical and geophysical data.
Diamond drilling was primarily HQ-sized core as deeply as possible and finished with NQ-sized core if a reduction in core size was required due to ground conditions. If ground conditions warranted, drill holes were collared in larger PQ size (3.3 inch or 83 mm diameter) and reduced to HQ as ground conditions improved. Drilled length and respective recoveries were PQ 4,326 feet with 83.5% recovery, HQ 85,583 feet with 95.9% recovery, and NQ 3,213 feet (979 meters) with 92.8% recovery (statistics include HB-2119 that was abandoned due to poor ground conditions after drilling approximately 200 feet (60 meters).

Preliminary Economic Assessment Copper World Complex, Pima County, Arizona USA
Page 10-66
Forty-three of the drill holes were orientated vertically, with one inclined in order to intercept a target area from an accessible drill pad location. Down hole surveying was conducted on 200 feet intervals with either a Multishot Reflex or a Surface Recording Gyro Survey instrument, both instruments measured inclination/dip and azimuth direction. Collar locations were surveyed and certified by Darling Environmental & Surveying of Tucson, Arizona
From August to November 2015, Hudbay completed a 46 core hole, 75,164 feet diamond drill program. This drill program was also conducted entirely within the footprint of the Augusta’s mineral resource estimates, on patented claims and was designed to gain a further understanding of the geological setting and mineralization, provide infill drilling density along with metallurgical, geotechnical, geochemical, and geophysical data.
Diamond drilling was primarily HQ-sized core as deeply as possible and finished with NQ-sized core if a reduction in core size was required due to ground conditions. If ground conditions warranted, drill holes were collared in larger PQ size and reduced to HQ as ground conditions improved. Twenty-two of the drill holes were oriented vertically, with 24 inclined drill holes. Eight holes were inclined for drilling-oriented core utilizing the Reflex ACT III instrument to gather geotechnical structural data, and 16 holes were inclined in order to intercept a target area from an accessible drill pad location. Down hole surveying was conducted on 200 feet (61 m) intervals with either a Multishot Reflex or a Surface Recording Gyro Survey instrument, both instruments measured inclination/dip and azimuth direction. Collar locations were surveyed and certified by Darling Environmental & Surveying of Tucson, Arizona.
10.7 HUDBAY (2020 TO 2021)
Hudbay initiated exploration drilling on targets north and west of the East deposit in October 2020. Drilling target included areas proximal to the historic mines including the Elgin, Copper World, Leader, Isle Royale and King Mines; historically identified targets including Broadtop Butte and Peach; and previously undrilled targets most notably the Bolsa area between Broadtop Butte and the East deposit. Several holes were also drilled for condemnation purposes.
Drilling in 2020 through October 13th 2021 totaled approximately 142,480 feet from 263 drill holes. Diamond drilling was primarily HQ-sized core as deeply as possible and finished with NQ-sized core, if a reduction in core size was required due to ground conditions. If ground conditions warranted, drill holes were collared in larger PQ size and reduced to HQ as ground conditions improved. Drill holes were primarily negatively inclined to vertical; however underground-type drill rigs were used in some areas to drill holes shallower than -45 inclination including horizontal and positively inclined holes in areas of very steep terrain. Higher relief terrain in much of the Copper World Deposits generally dictated less regular spacing than at the East deposit. Leading to multiple holes being drilled from the same pads.
10.8 DRILLING METHOD AND SURVEY
Documentation from owners prior to Augusta supporting drill equipment, hole size, collar, down-hole survey methods and core recovery is not available. Inspection of drill logs and archived samples show that drill programs were carried out using RC, diamond, or a combination of both types of drilling. Core diameters varied with drill programs and were generally NQ or BQ. Diameters for RC drill programs were not recorded. Collar coordinates were likely surveyed by theodolite. Most holes have multiple down hole surveys with varying azimuth and dip. Downhole survey methods and instruments are not reported. Inspection of available archived core indicates reasonably good core recovery.
For the 2020-2021 drilling down hole surveying was conducted on 100 feet intervals with either a Multishot Reflex or a Surface Recording Gyro Survey instrument, both instruments measured inclination/dip and azimuth direction. For upward and horizontal holes, a REFLEX GYRO SPRINT-IQ survey tool was utilized. Beginning in February 2021 a TN-14 Rig Alignment Tool was also used to line up drill rigs on planned azimuths and inclinations. Collar locations of holes drilled in 2020 were surveyed and certified by Darling Environmental & Surveying of Tucson, Arizona. Collar location from the 2021 program were estimated based on surveyed and certified pad outlines. Handheld Garmin GPs units were also used to more accurately locate collar locations within the survey pad boundaries for many locations.

Preliminary Economic Assessment Copper World Complex, Pima County, Arizona USA
Page 10-67
Drill coordinates are recorded in Hudbay’s database as UTM feet, calculated by multiplying the UTM metric coordinates by 0.3048) The entire property is within zone 12 of the Universal Transverse Mercator coordinate system, North America Datum 83.
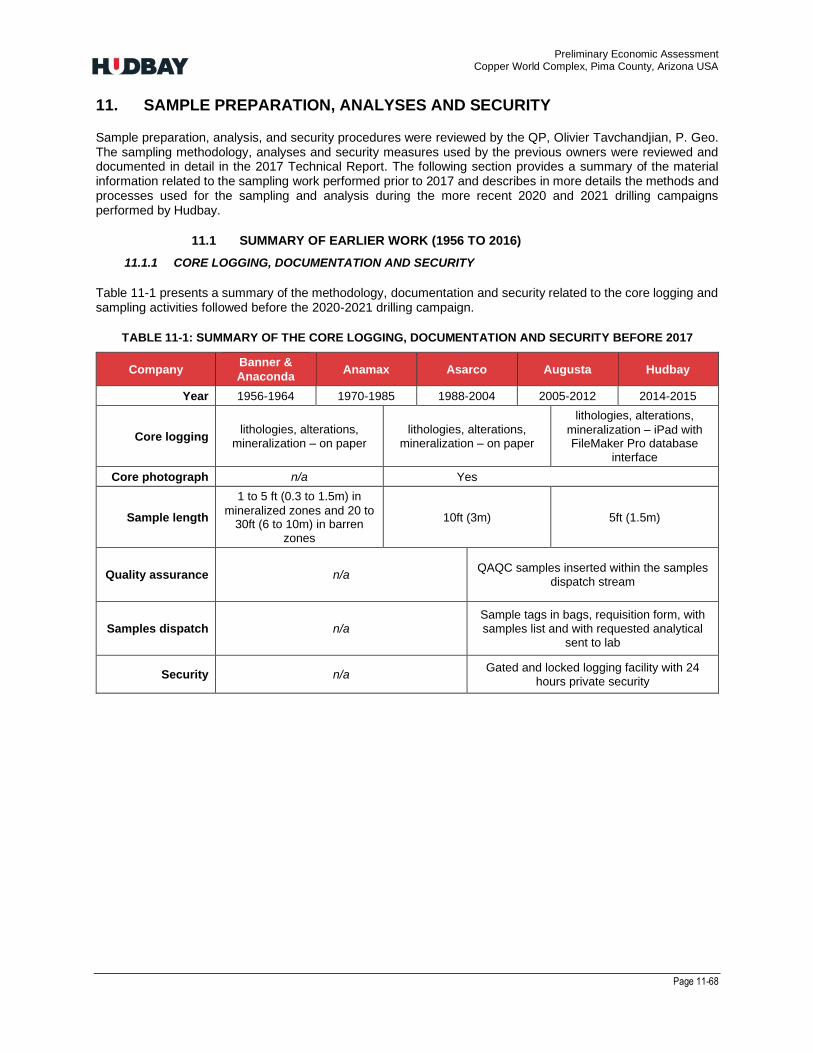
Preliminary Economic Assessment Copper World Complex, Pima County, Arizona USA
Page 11-68
11. SAMPLE PREPARATION, ANALYSES AND SECURITY
Sample preparation, analysis, and security procedures were reviewed by the QP, Olivier Tavchandjian, P. Geo. The sampling methodology, analyses and security measures used by the previous owners were reviewed and documented in detail in the 2017 Technical Report. The following section provides a summary of the material information related to the sampling work performed prior to 2017 and describes in more details the methods and processes used for the sampling and analysis during the more recent 2020 and 2021 drilling campaigns performed by Hudbay.
11.1 SUMMARY OF EARLIER WORK (1956 TO 2016)
11.1.1 CORE LOGGING, DOCUMENTATION AND SECURITY
Table 11-1 presents a summary of the methodology, documentation and security related to the core logging and sampling activities followed before the 2020-2021 drilling campaign.
TABLE 11-1: SUMMARY OF THE CORE LOGGING, DOCUMENTATION AND SECURITY BEFORE 2017
Company Banner &
Anaconda Anamax Asarco Augusta Hudbay
Year 1956-1964 1970-1985 1988-2004 2005-2012 2014-2015
Core logging lithologies, alterations,
mineralization – on paper lithologies, alterations,
mineralization – on paper
lithologies, alterations,
mineralization – iPad with FileMaker Pro database
interface
Core photograph n/a Yes
Sample length
1 to 5 ft (0.3 to 1.5m) in
mineralized zones and 20 to 30ft (6 to 10m) in barren
zones
10ft (3m) 5ft (1.5m)
Quality assurance n/a QAQC samples inserted within the samples
dispatch stream
Samples dispatch n/a Sample tags in bags, requisition form, with samples list and with requested analytical
sent to lab
Security n/a Gated and locked logging facility with 24
hours private security
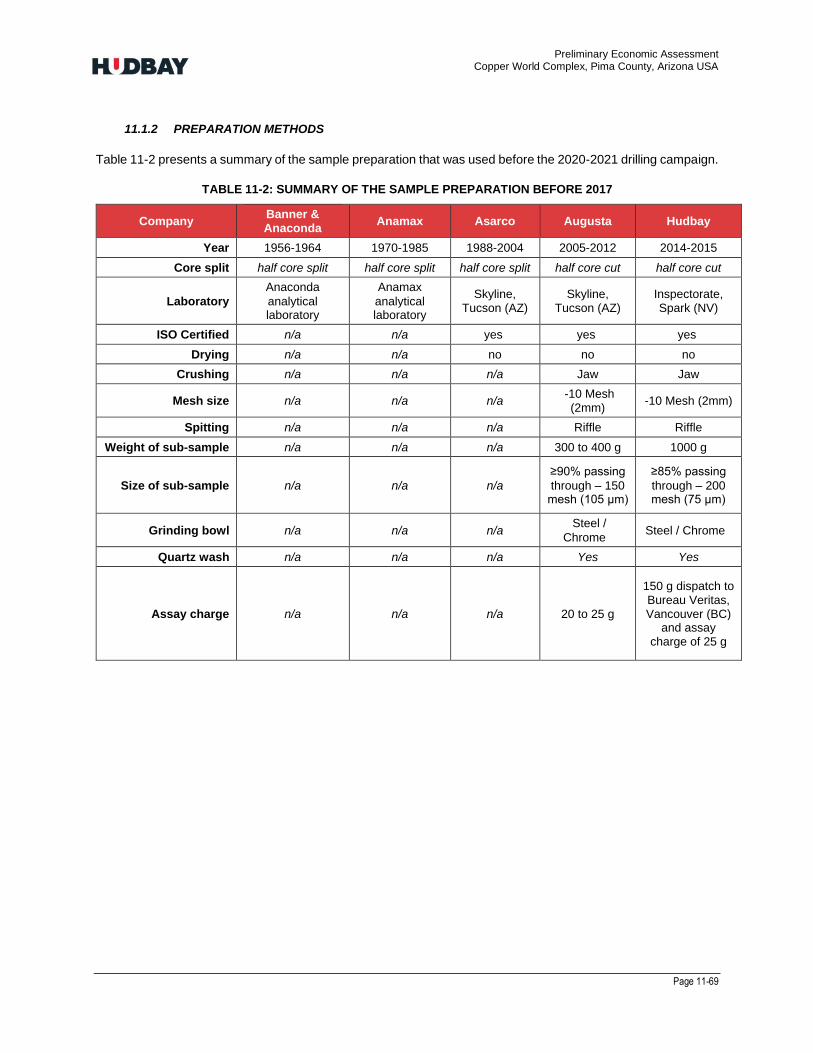
Preliminary Economic Assessment Copper World Complex, Pima County, Arizona USA
Page 11-69
11.1.2 PREPARATION METHODS
Table 11-2 presents a summary of the sample preparation that was used before the 2020-2021 drilling campaign.
TABLE 11-2: SUMMARY OF THE SAMPLE PREPARATION BEFORE 2017
Company Banner & Anaconda
Anamax Asarco Augusta Hudbay
Year 1956-1964 1970-1985 1988-2004 2005-2012 2014-2015
Core split half core split half core split half core split half core cut half core cut
Laboratory
Anaconda
analytical laboratory
Anamax
analytical laboratory
Skyline, Tucson (AZ)
Skyline, Tucson (AZ)
Inspectorate, Spark (NV)
ISO Certified n/a n/a yes yes yes
Drying n/a n/a no no no
Crushing n/a n/a n/a Jaw Jaw
Mesh size n/a n/a n/a -10 Mesh
(2mm) -10 Mesh (2mm)
Spitting n/a n/a n/a Riffle Riffle
Weight of sub-sample n/a n/a n/a 300 to 400 g 1000 g
Size of sub-sample n/a n/a n/a
≥90% passing
through – 150 mesh (105 μm)
≥85% passing
through – 200 mesh (75 μm)
Grinding bowl n/a n/a n/a Steel /
Chrome Steel / Chrome
Quartz wash n/a n/a n/a Yes Yes
Assay charge n/a n/a n/a 20 to 25 g
150 g dispatch to Bureau Veritas, Vancouver (BC)
and assay charge of 25 g
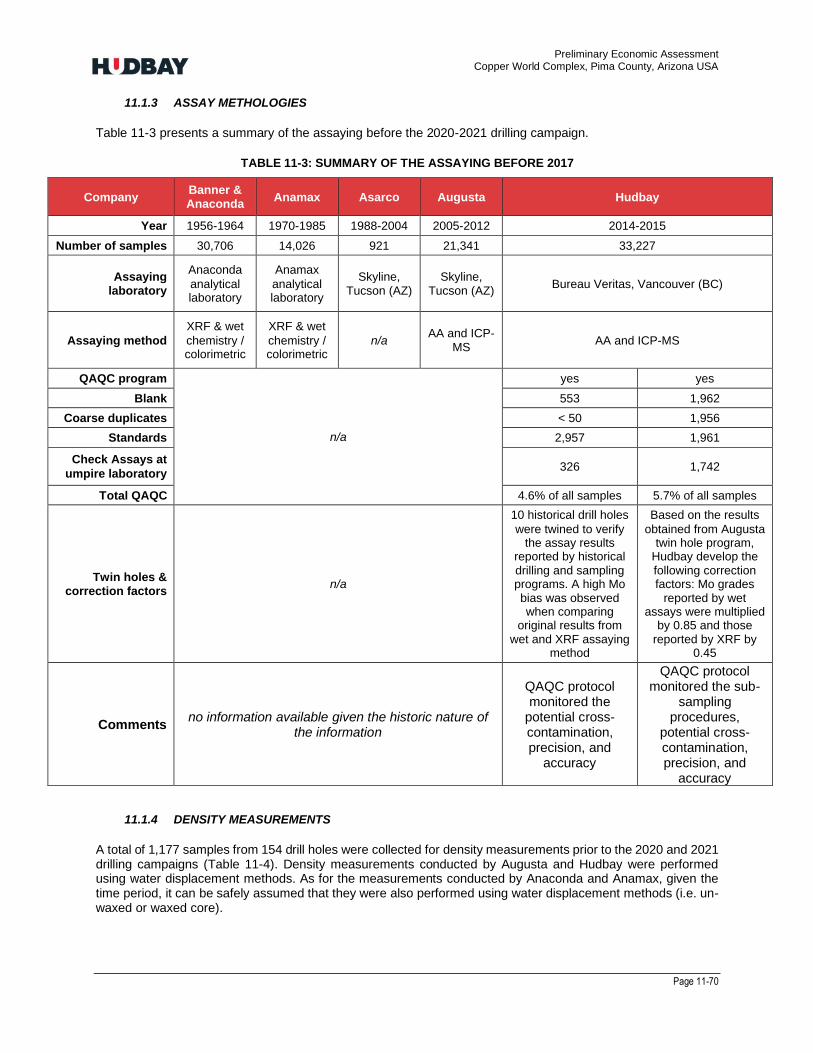
Preliminary Economic Assessment Copper World Complex, Pima County, Arizona USA
Page 11-70
11.1.3 ASSAY METHOLOGIES
Table 11-3 presents a summary of the assaying before the 2020-2021 drilling campaign.
TABLE 11-3: SUMMARY OF THE ASSAYING BEFORE 2017
Company Banner & Anaconda
Anamax Asarco Augusta Hudbay
Year 1956-1964 1970-1985 1988-2004 2005-2012 2014-2015
Number of samples 30,706 14,026 921 21,341 33,227
Assaying laboratory
Anaconda
analytical laboratory
Anamax
analytical laboratory
Skyline, Tucson (AZ)
Skyline, Tucson (AZ)
Bureau Veritas, Vancouver (BC)
Assaying method
XRF & wet
chemistry / colorimetric
XRF & wet
chemistry / colorimetric
n/a AA and ICP-
MS AA and ICP-MS
QAQC program
n/a
yes yes
Blank 553 1,962
Coarse duplicates < 50 1,956
Standards 2,957 1,961
Check Assays at
umpire laboratory 326 1,742
Total QAQC 4.6% of all samples 5.7% of all samples
Twin holes & correction factors
n/a
10 historical drill holes
were twined to verify the assay results
reported by historical drilling and sampling programs. A high Mo bias was observed when comparing
original results from wet and XRF assaying
method
Based on the results
obtained from Augusta twin hole program,
Hudbay develop the following correction factors: Mo grades
reported by wet assays were multiplied
by 0.85 and those reported by XRF by
0.45
Comments no information available given the historic nature of
the information
QAQC protocol monitored the
potential cross-contamination, precision, and
accuracy
QAQC protocol monitored the sub-
sampling procedures,
potential cross-contamination, precision, and
accuracy
11.1.4 DENSITY MEASUREMENTS
A total of 1,177 samples from 154 drill holes were collected for density measurements prior to the 2020 and 2021 drilling campaigns (Table 11-4). Density measurements conducted by Augusta and Hudbay were performed using water displacement methods. As for the measurements conducted by Anaconda and Anamax, given the time period, it can be safely assumed that they were also performed using water displacement methods (i.e. un-waxed or waxed core).
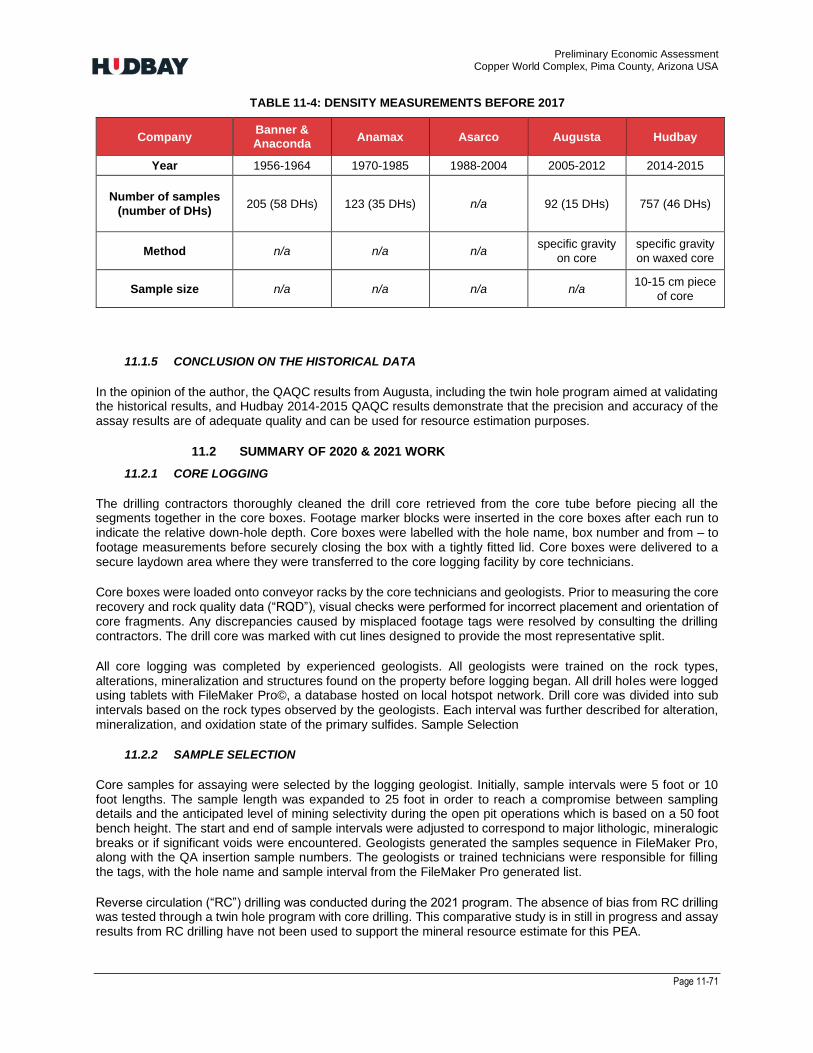
Preliminary Economic Assessment Copper World Complex, Pima County, Arizona USA
Page 11-71
TABLE 11-4: DENSITY MEASUREMENTS BEFORE 2017
Company Banner & Anaconda
Anamax Asarco Augusta Hudbay
Year 1956-1964 1970-1985 1988-2004 2005-2012 2014-2015
Number of samples
(number of DHs) 205 (58 DHs) 123 (35 DHs) n/a 92 (15 DHs) 757 (46 DHs)
Method n/a n/a n/a specific gravity
on core
specific gravity
on waxed core
Sample size n/a n/a n/a n/a 10-15 cm piece
of core
11.1.5 CONCLUSION ON THE HISTORICAL DATA
In the opinion of the author, the QAQC results from Augusta, including the twin hole program aimed at validating the historical results, and Hudbay 2014-2015 QAQC results demonstrate that the precision and accuracy of the assay results are of adequate quality and can be used for resource estimation purposes.
11.2 SUMMARY OF 2020 & 2021 WORK
11.2.1 CORE LOGGING
The drilling contractors thoroughly cleaned the drill core retrieved from the core tube before piecing all the segments together in the core boxes. Footage marker blocks were inserted in the core boxes after each run to indicate the relative down-hole depth. Core boxes were labelled with the hole name, box number and from – to footage measurements before securely closing the box with a tightly fitted lid. Core boxes were delivered to a secure laydown area where they were transferred to the core logging facility by core technicians.
Core boxes were loaded onto conveyor racks by the core technicians and geologists. Prior to measuring the core recovery and rock quality data (“RQD”), visual checks were performed for incorrect placement and orientation of core fragments. Any discrepancies caused by misplaced footage tags were resolved by consulting the drilling contractors. The drill core was marked with cut lines designed to provide the most representative split.
All core logging was completed by experienced geologists. All geologists were trained on the rock types, alterations, mineralization and structures found on the property before logging began. All drill holes were logged using tablets with FileMaker Pro©, a database hosted on local hotspot network. Drill core was divided into sub intervals based on the rock types observed by the geologists. Each interval was further described for alteration, mineralization, and oxidation state of the primary sulfides. Sample Selection
11.2.2 SAMPLE SELECTION
Core samples for assaying were selected by the logging geologist. Initially, sample intervals were 5 foot or 10 foot lengths. The sample length was expanded to 25 foot in order to reach a compromise between sampling details and the anticipated level of mining selectivity during the open pit operations which is based on a 50 foot bench height. The start and end of sample intervals were adjusted to correspond to major lithologic, mineralogic breaks or if significant voids were encountered. Geologists generated the samples sequence in FileMaker Pro, along with the QA insertion sample numbers. The geologists or trained technicians were responsible for filling the tags, with the hole name and sample interval from the FileMaker Pro generated list.
Reverse circulation (“RC”) drilling was conducted during the 2021 program. The absence of bias from RC drilling was tested through a twin hole program with core drilling. This comparative study is in still in progress and assay results from RC drilling have not been used to support the mineral resource estimate for this PEA.

Preliminary Economic Assessment Copper World Complex, Pima County, Arizona USA
Page 11-72
11.2.3 CORE PHOTOGRAPHS
Core boxes with sample tags inserted were photographed using a digital SLR camera mounted to an aluminum frame that sits atop the core boxes. The camera was attached to a tablet with the Imago© application installed which records the drill hole name, and depths in each photo. The photos were uploaded to an Imago cloud server accessible by authorized Hudbay personnel only.
11.2.4 CORE CUTTING
Prior to cutting core, geologists printed the FileMaker Pro sample list for each drill hole that included the sample identification number, hole name, sample type and the start and end footage of each sample. This list was used to label the sample bags. At the core cutting stations, buckets were lined up with the correctly labelled sample bag and the corresponding core box was placed on a worktable next to the core saw. The core samples were cut along the center of the core so approximately 50% of the core was split. For PQ sized core, roughly 1/3rd of the core was split off to prevent excessive sampler weight. In gouge and rubble intervals, an aluminum or plastic sampling scoop was used to separate the gouge into two halves in the core boxes. Filled sample bags were closed using the bag draw strings and secured at the neck using zip ties. Saws were rinsed with water after cutting each sample to prevent cross contamination.
11.2.5 SAMPLE DISPATCHING
Samples were dispatched using the dispatching module in the core logging database. A requisition form was automatically created from FileMaker Pro. The requisition forms listed the sample, job order number, requested analytical codes and any special instructions. The requisition forms and lists of samples were e-mailed to the laboratory prior or immediately after sample shipment. Hard copies of the requisition forms were also included with each shipment. QA/QC samples including blanks, duplicates and standards were introduced into samples dispatch stream. Sample bags were cross-checked with the sample requisition form before packing. Samples were either picked up by a truck dispatched by the lab or transported using a commercial carrier.
11.2.6 SAMPLE PREPARATION
For the 2020 drilling campaign, all the samples were sent to Bureau Veritas for preparation in Reno, Nevada and Hermosillo in New Mexico while the analysis were performed in Vancouver, British Columbia. As for the 2021 drilling campaign, samples were sent to three different laboratories:
• Skyline in Tucson, Arizona
• ALS (samples preparation in Tucson and analysis in Reno and North Vancouver, British Columbia)
• SGS in Burnaby, British Columbia
Table 11-5 presents a summary of the sample preparation that was used during the 2020-2021 drilling campaign.
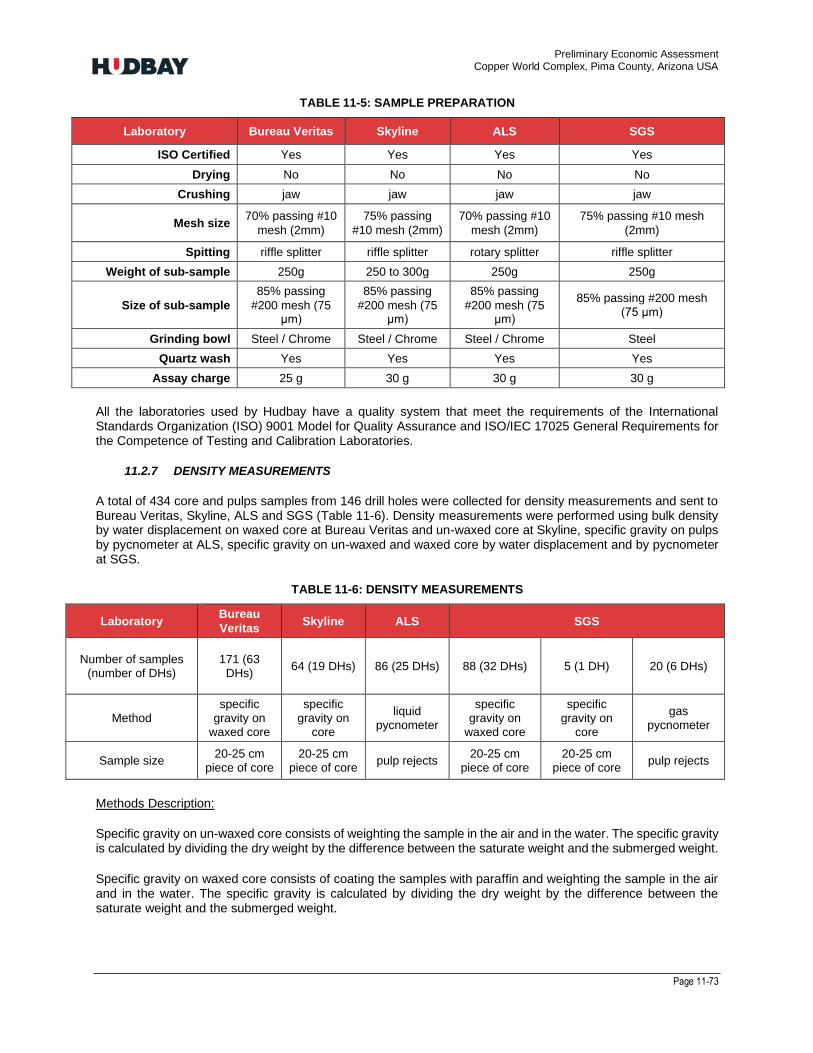
Preliminary Economic Assessment Copper World Complex, Pima County, Arizona USA
Page 11-73
TABLE 11-5: SAMPLE PREPARATION
Laboratory Bureau Veritas Skyline ALS SGS
ISO Certified Yes Yes Yes Yes
Drying No No No No
Crushing jaw jaw jaw jaw
Mesh size 70% passing #10
mesh (2mm)
75% passing
#10 mesh (2mm)
70% passing #10
mesh (2mm)
75% passing #10 mesh
(2mm)
Spitting riffle splitter riffle splitter rotary splitter riffle splitter
Weight of sub-sample 250g 250 to 300g 250g 250g
Size of sub-sample
85% passing
#200 mesh (75 μm)
85% passing
#200 mesh (75 μm)
85% passing
#200 mesh (75 μm)
85% passing #200 mesh (75 μm)
Grinding bowl Steel / Chrome Steel / Chrome Steel / Chrome Steel
Quartz wash Yes Yes Yes Yes
Assay charge 25 g 30 g 30 g 30 g
All the laboratories used by Hudbay have a quality system that meet the requirements of the International Standards Organization (ISO) 9001 Model for Quality Assurance and ISO/IEC 17025 General Requirements for the Competence of Testing and Calibration Laboratories.
11.2.7 DENSITY MEASUREMENTS
A total of 434 core and pulps samples from 146 drill holes were collected for density measurements and sent to Bureau Veritas, Skyline, ALS and SGS (Table 11-6). Density measurements were performed using bulk density by water displacement on waxed core at Bureau Veritas and un-waxed core at Skyline, specific gravity on pulps by pycnometer at ALS, specific gravity on un-waxed and waxed core by water displacement and by pycnometer at SGS.
TABLE 11-6: DENSITY MEASUREMENTS
Laboratory Bureau
Veritas Skyline ALS SGS
Number of samples (number of DHs)
171 (63 DHs)
64 (19 DHs) 86 (25 DHs) 88 (32 DHs) 5 (1 DH) 20 (6 DHs)
Method specific
gravity on waxed core
specific gravity on
core
liquid pycnometer
specific gravity on
waxed core
specific gravity on
core
gas pycnometer
Sample size 20-25 cm
piece of core 20-25 cm
piece of core pulp rejects
20-25 cm piece of core
20-25 cm piece of core
pulp rejects
Methods Description:
Specific gravity on un-waxed core consists of weighting the sample in the air and in the water. The specific gravity is calculated by dividing the dry weight by the difference between the saturate weight and the submerged weight.
Specific gravity on waxed core consists of coating the samples with paraffin and weighting the sample in the air and in the water. The specific gravity is calculated by dividing the dry weight by the difference between the saturate weight and the submerged weight.

Preliminary Economic Assessment Copper World Complex, Pima County, Arizona USA
Page 11-74
In-situ density on pulps consist of placing the samples in vessels (i.e. pycnometers) and filling the remaining volume with a liquid or a gas. The in-situ density is determined by calculating the ratio of the sample weight to the weight of the solvent displaced.
SG measurements from competent pieces of core may not necessarily reflect in-situ density during the mining operation in unconsolidated ground with natural voids. In order to quantify the potential for correction, an alternative measure of in-situ density was developed based on core box weight. Using the sample interval length and core size, the inner effective volume of the core drilled was calculated by using the cylinder volume equation (𝑉=𝜋𝑟2ℎ) in each box and its in-situ density was then derived by dividing the core box by this effective drilled volume. It must be noted that when weighted, the core in the box was dried already and as a result no additional adjustment has been applied to remove any assumed moisture content.
Results of the comparison between laboratory measurements of SG and in-situ density estimates based on core box weights are presented and discussed in section 14.
11.2.8 ASSAY METHODOLOGY
Samples were assayed following industry standard analytical protocols at four independent commercial analytical laboratories: Skyline in Tucson (AZ), SGS Canada in Burnaby (BC), ALS laboratories in North Vancouver (BC), and at Bureau Veritas, with parallel soluble copper analysis in Reno (NV) and ICP-MS and sequential soluble copper analysis in Vancouver (BC).
To ensure assays consistency between the different Laboratories, samples preparation and analytical protocols were equivalent to those that were carried out by Bureau Veritas as part of Hudbay’s 2014 and 2015 drilling programs.
Analytical assaying comprises a standard set of analytical packages with major & trace elements, base & precious metals (including Cu, Zn Pb, Mo, Ag) as well as pathfinder elements (e.g., As, Bi, Sb, Se, Sn, Te, W).
Analyses were performed using a combination of Inductively Coupled Plasma Mass Spectrometry (ICP-MS) and Inductively Coupled Plasma Emission Spectroscopy (ICP-ES), following multi acid digestion to achieve near total dissolution. Two stages copper sequential analysis (sulfuric acid leach followed by sodium cyanide leach) was performed at Skyline, ALS and SGS laboratories. At Bureau Veritas, soluble copper was analyzed in parallel for sulfuric acid leach and sodium cyanide leach. Only the results for sulfuric acid leach were used for the resource estimate. Table 11-7 presents a summary of the analytical specifications used for the 2020-2021 drilling campaigns.
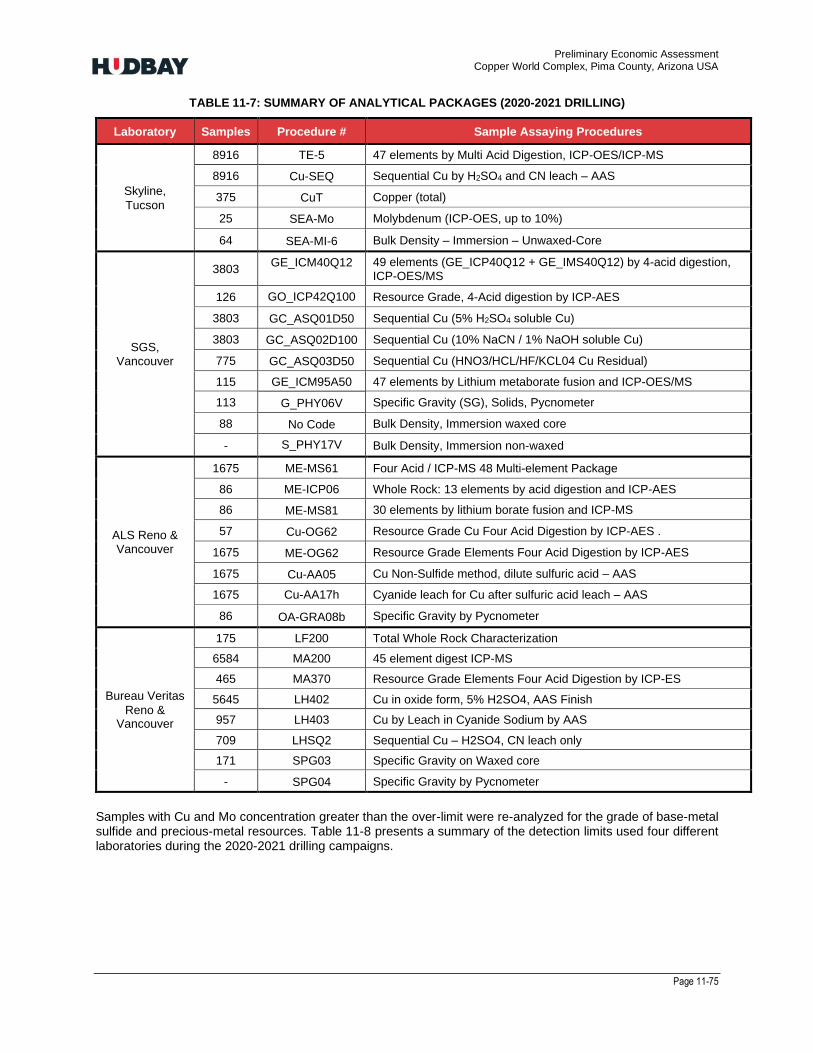
Preliminary Economic Assessment Copper World Complex, Pima County, Arizona USA
Page 11-75
TABLE 11-7: SUMMARY OF ANALYTICAL PACKAGES (2020-2021 DRILLING)
Laboratory Samples Procedure # Sample Assaying Procedures
Skyline,
Tucson
8916 TE-5 47 elements by Multi Acid Digestion, ICP-OES/ICP-MS
8916 Cu-SEQ Sequential Cu by H2SO4 and CN leach – AAS
375 CuT Copper (total)
25 SEA-Mo Molybdenum (ICP-OES, up to 10%)
64 SEA-MI-6 Bulk Density – Immersion – Unwaxed-Core
SGS, Vancouver
3803 GE_ICM40Q12 49 elements (GE_ICP40Q12 + GE_IMS40Q12) by 4-acid digestion,
ICP-OES/MS
126 GO_ICP42Q100 Resource Grade, 4-Acid digestion by ICP-AES
3803 GC_ASQ01D50 Sequential Cu (5% H2SO4 soluble Cu)
3803 GC_ASQ02D100 Sequential Cu (10% NaCN / 1% NaOH soluble Cu)
775 GC_ASQ03D50 Sequential Cu (HNO3/HCL/HF/KCL04 Cu Residual)
115 GE_ICM95A50 47 elements by Lithium metaborate fusion and ICP-OES/MS
113 G_PHY06V Specific Gravity (SG), Solids, Pycnometer
88 No Code Bulk Density, Immersion waxed core
- S_PHY17V Bulk Density, Immersion non-waxed
ALS Reno & Vancouver
1675 ME-MS61 Four Acid / ICP-MS 48 Multi-element Package
86 ME-ICP06 Whole Rock: 13 elements by acid digestion and ICP-AES
86 ME-MS81 30 elements by lithium borate fusion and ICP-MS
57 Cu-OG62 Resource Grade Cu Four Acid Digestion by ICP-AES .
1675 ME-OG62 Resource Grade Elements Four Acid Digestion by ICP-AES
1675 Cu-AA05 Cu Non-Sulfide method, dilute sulfuric acid – AAS
1675 Cu-AA17h Cyanide leach for Cu after sulfuric acid leach – AAS
86 OA-GRA08b Specific Gravity by Pycnometer
Bureau Veritas
Reno & Vancouver
175 LF200 Total Whole Rock Characterization
6584 MA200 45 element digest ICP-MS
465 MA370 Resource Grade Elements Four Acid Digestion by ICP-ES
5645 LH402 Cu in oxide form, 5% H2SO4, AAS Finish
957 LH403 Cu by Leach in Cyanide Sodium by AAS
709 LHSQ2 Sequential Cu – H2SO4, CN leach only
171 SPG03 Specific Gravity on Waxed core
- SPG04 Specific Gravity by Pycnometer
Samples with Cu and Mo concentration greater than the over-limit were re-analyzed for the grade of base-metal sulfide and precious-metal resources. Table 11-8 presents a summary of the detection limits used four different laboratories during the 2020-2021 drilling campaigns.

Preliminary Economic Assessment Copper World Complex, Pima County, Arizona USA
Page 11-76
TABLE 11-8: SUMMARY OF DETECTION LIMITS (2020-2021 DRILLING)
Laboratory Details Cu Cu>8000 Mo Mo>8000* CuSS Ag
Skyline
Unit ppm % ppm % % ppm
LDL 0.1 0.001 0.1 0.01 0.005 0.05
UDL 10000 10 1000 10 10 150
Digestion Multi Acid Multi Acid Multi Acid Multi Acid Sulphuric acid Multi Acid
Technique ICP-MS ICP-OES ICP-MS ICP-OES AAS ICP-MS
SGS
Unit ppm % ppm % % ppm
LDL 0.5 0.1 0.05 0.01 0.001 0.02
UDL 10000 30 10000 10 100 100
Digestion Multi Acid Multi Acid Multi Acid Multi Acid Sulphuric acid Multi Acid
Technique ICP-MS ICP-AES ICP-MS ICP-AES AAS ICP-MS
ALS
Unit ppm % ppm % % ppm
LDL 0.2 0.001 0.05 0.001 0.001 0.01
UDL 10000 50 10000 50 10 100
Digestion Multi Acid Multi Acid Multi Acid Multi Acid Sulphuric acid Multi Acid
Technique ICP-MS ICP-OES ICP-MS ICP-OES AAS ICP-MS
Bureau Veritas
Unit ppm % ppm % % ppm
LDL 0.1 0.001 0.1 0.001 0.001 0.1
UDL 10000 10 4000 5 10 200
Digestion Multi Acid Multi Acid Multi Acid Multi Acid Sulphuric acid Multi Acid
Technique ICP-MS ICP-ES ICP-MS ICP-ES AAS ICP-MS
11.2.9 QUALITY ASSURANCE AND QUALITY CONTROL PROGRAMS
Blanks, certified reference materials (CRM), coarse preparation duplicates and inter-lab checks were introduced in the sample stream to monitor and detect cross-contamination, samples swap, sub-sampling procedures, along with the precision and accuracy of the assay results.
The insertion rate of the CRMs (i.e. standards), blanks and coarse preparation duplicates were one in every 20 samples. Overall, Hudbay’s QAQC program included 5.2% blanks, 5.2% CRMs, 2.2% pulp duplicates and 2.1% pulp duplicate for interlaboratory checks (i.e., 499 randomly selected pulps). The standards and blanks were prepared by Ore Research and Exploration (OREAS) laboratories. Table 11-9 presents the expected values for each blank and CRM.
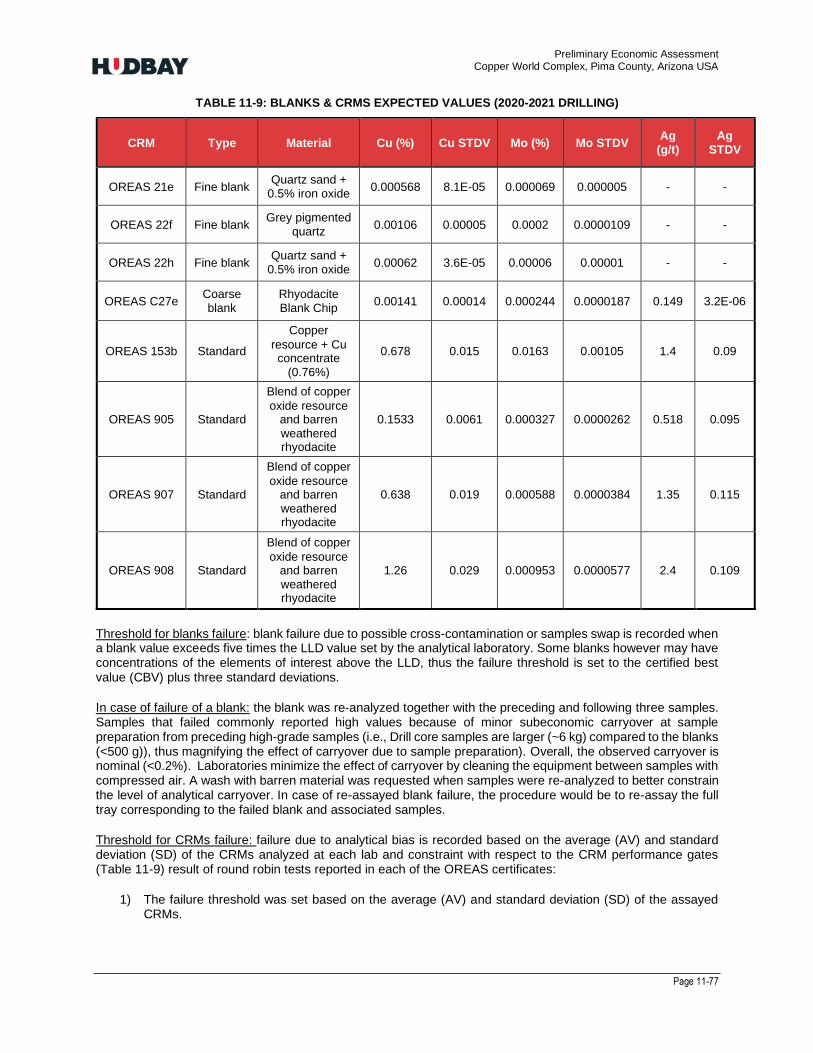
Preliminary Economic Assessment Copper World Complex, Pima County, Arizona USA
Page 11-77
TABLE 11-9: BLANKS & CRMS EXPECTED VALUES (2020-2021 DRILLING)
CRM Type Material Cu (%) Cu STDV Mo (%) Mo STDV Ag (g/t)
Ag STDV
OREAS 21e Fine blank Quartz sand +
0.5% iron oxide 0.000568 8.1E-05 0.000069 0.000005 - -
OREAS 22f Fine blank Grey pigmented
quartz 0.00106 0.00005 0.0002 0.0000109 - -
OREAS 22h Fine blank Quartz sand +
0.5% iron oxide 0.00062 3.6E-05 0.00006 0.00001 - -
OREAS C27e Coarse blank
Rhyodacite Blank Chip
0.00141 0.00014 0.000244 0.0000187 0.149 3.2E-06
OREAS 153b Standard
Copper
resource + Cu concentrate
(0.76%)
0.678 0.015 0.0163 0.00105 1.4 0.09
OREAS 905 Standard
Blend of copper
oxide resource and barren weathered rhyodacite
0.1533 0.0061 0.000327 0.0000262 0.518 0.095
OREAS 907 Standard
Blend of copper
oxide resource and barren weathered rhyodacite
0.638 0.019 0.000588 0.0000384 1.35 0.115
OREAS 908 Standard
Blend of copper
oxide resource and barren weathered rhyodacite
1.26 0.029 0.000953 0.0000577 2.4 0.109
Threshold for blanks failure: blank failure due to possible cross-contamination or samples swap is recorded when a blank value exceeds five times the LLD value set by the analytical laboratory. Some blanks however may have concentrations of the elements of interest above the LLD, thus the failure threshold is set to the certified best value (CBV) plus three standard deviations.
In case of failure of a blank: the blank was re-analyzed together with the preceding and following three samples. Samples that failed commonly reported high values because of minor subeconomic carryover at sample preparation from preceding high-grade samples (i.e., Drill core samples are larger (~6 kg) compared to the blanks (<500 g)), thus magnifying the effect of carryover due to sample preparation). Overall, the observed carryover is nominal (<0.2%). Laboratories minimize the effect of carryover by cleaning the equipment between samples with compressed air. A wash with barren material was requested when samples were re-analyzed to better constrain the level of analytical carryover. In case of re-assayed blank failure, the procedure would be to re-assay the full tray corresponding to the failed blank and associated samples.
Threshold for CRMs failure: failure due to analytical bias is recorded based on the average (AV) and standard deviation (SD) of the CRMs analyzed at each lab and constraint with respect to the CRM performance gates (Table 11-9) result of round robin tests reported in each of the OREAS certificates:
1) The failure threshold was set based on the average (AV) and standard deviation (SD) of the assayed CRMs.
Preliminary Economic Assessment Copper World Complex, Pima County, Arizona USA
Page 11-78
2) The CRM assay values were accepted when fall within AV±2SD and isolated values between AV±2SD and AV±3SD. The CRM assay values outside AV±3SD were considered to a failure.
3) The rejection limit based on the average (AV) and standard deviation (SD) of the assayed CRMs was also constrained with respect to the Certified Best Value (CBV) and SD provided for the CRMs (Table 11-9).
4) Since the analysis of the CRM data was progressive and the number of analysed CRMs increased with time, the earlier analysed batches of CRMs were reassessed based on the lates estimated average (AV) and standard deviation (SD).
In case of CRMs failure, the 3 previous and 3 following samples were re-assayed. In case of repeated failure, the procedure would be to re-assay the full tray corresponding to the failed CRM samples, but this has not been required for any of the CRMs re-assayed since 2020.
BLANKS QAQC RESULTS
Only the certified copper and molybdenum values are considered to be highly reliable in Table 11-10. The values for soluble copper and silver (except OREAS C27e) in these blanks are indicative and no values for standard deviation are reported in the certificate to properly calculate a failure threshold.
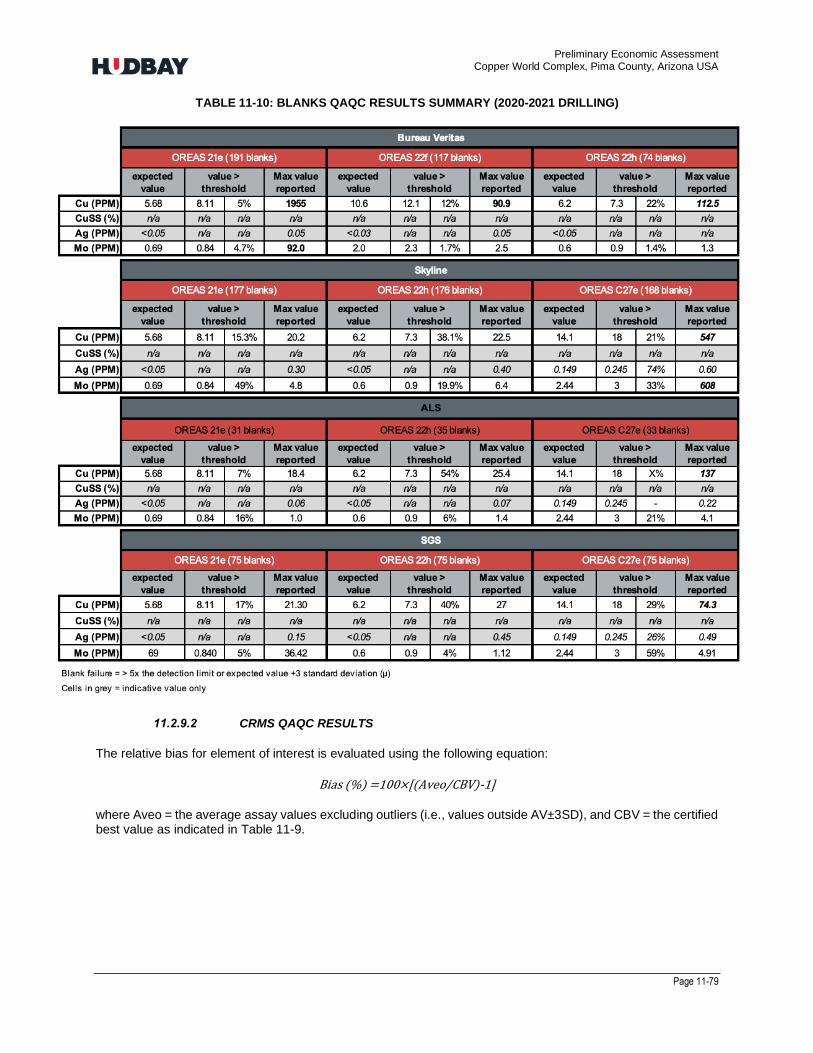
Preliminary Economic Assessment Copper World Complex, Pima County, Arizona USA
Page 11-79
TABLE 11-10: BLANKS QAQC RESULTS SUMMARY (2020-2021 DRILLING)
CRMS QAQC RESULTS
The relative bias for element of interest is evaluated using the following equation:
Bias (%) =100×[(Aveo/CBV)-1]
where Aveo = the average assay values excluding outliers (i.e., values outside AV±3SD), and CBV = the certified best value as indicated in Table 11-9.
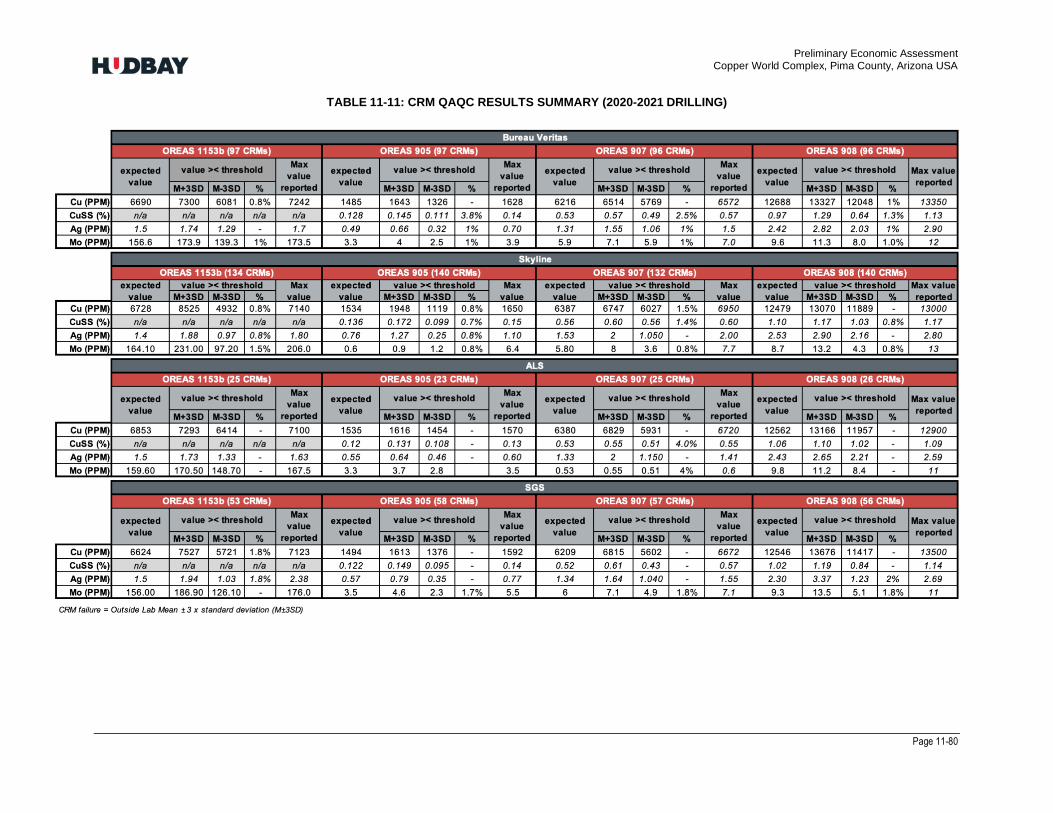
Preliminary Economic Assessment Copper World Complex, Pima County, Arizona USA
Page 11-80
TABLE 11-11: CRM QAQC RESULTS SUMMARY (2020-2021 DRILLING)

Preliminary Economic Assessment Copper World Complex, Pima County, Arizona USA
Page 11-81
Based on the results presented in Table 11-11, no significant analytical biases were observed for Cu, Mo and CuSS. The level of accuracy was within 3% for Cu in all cases, Mo showed a bias ranging from -8.3% to +5.5% with most results being less than 5%. For CuSS, the accuracy is acceptable ranging between -8.1 and 6.8%. A higher level of bias was observed for Ag usually in the -10 to +10% range except at skyline where the bias for OREAS 905 reaches 43%. It should be noted though that OREAS 905 is a low-grade sample with a significant oxidized component and likely not a reliable standard for Ag. Overall, the rate of failure was very low for all the metals. The test on failure was repeated subsequently using the certified mean value and standard deviations provided by OREAS for each standard and it was confirmed that using these parameters the rejected samples would have been the same.
COARSE PREPARATION DUPLICATES
A total 610 coarse preparation duplicates were analyzed by the commercial laboratories: 275 at Skyline, 48 at ALS, 115 at SGS and 175 at Bureau Veritas. This represents an insertion rate of 2.6%. Coarse preparation duplicates represent two splits of the same samples after crushing, then each split is pulverized and independently labelled with consecutive numbers and analyzed immediately after its original pair.
The evaluation of coarse duplicate assay results is based on the hyperbolic method developed by AMEC (Simon 2004). To evaluate the precision with this method, the relative error (RE) is used as a proxy inversely proportional to the precision, implying that the higher the RE the lower the precision and conversely. The RE is calculated as the absolute difference between the original (oi) and duplicate (di) values, relative to (i.e., divided by) the average of the sample pair. In practice the accepted RE values correspond to 1.35 for field duplicates (i.e., RE=30%), 1.22 for coarse prep duplicates (i.e., RE=20%) and 1.1 for pulp duplicates (i.e., RE=10%). If the failure rate is less than 10% of sample duplicates, the precision is considered acceptable.
TABLE 11-12: COARSE DUPLICATES QAQC RESULTS SUMMARY (2020-2021 DRILLING)
Laboratory Element No. of
Samples No. of
Failures Failure
rate PDL
BV
Cu (ppm) 172 2 1.2% 10.0
CuSS (pct) 139 10 7.2% 0.001
Ag (ppm) 172 5 2.9% 0.5
Mo (ppm) 172 5 2.9% 10.0
Skyline
Cu (ppm) 260 0 0.0% 40.0
CuSS (pct) 275 0 0.0% 0.005
Ag (ppm) 260 35 13.5% 0.05
Mo (ppm) 260 2 0.8% 10.0
ALS
Cu (ppm) 48 2 4.2% 40.0
CuSS (pct) 48 5 10.4% 0.001
Ag (ppm) 48 8 16.7% 0.01
Mo (ppm) 48 1 2.1% 10.0
SGS
Cu (ppm) 115 3 2.6% 40.0
CuSS (pct) 115 21 18.3% 0.001
Ag (ppm) 115 22 19.1% 0.02
Mo (ppm) 115 4 3.5% 10.0
Accepted Relative Error = 20%
PDL: Practical detection limit used in the hyperbolic rejection curve
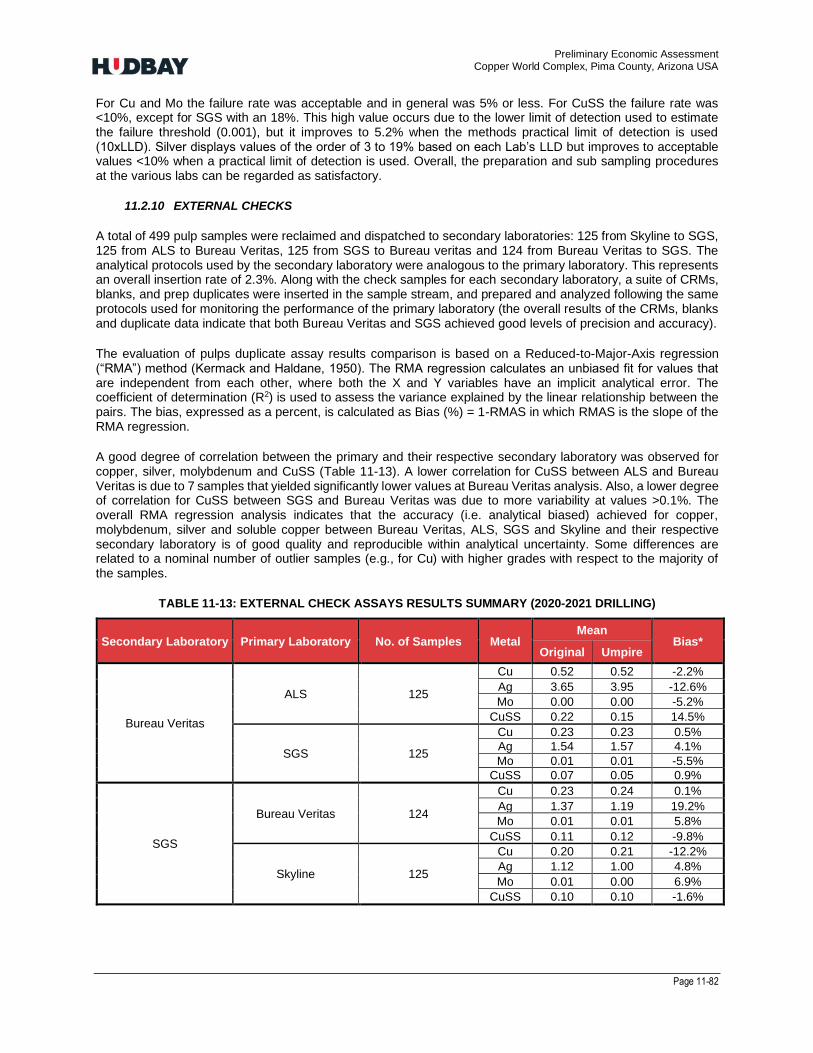
Preliminary Economic Assessment Copper World Complex, Pima County, Arizona USA
Page 11-82
For Cu and Mo the failure rate was acceptable and in general was 5% or less. For CuSS the failure rate was <10%, except for SGS with an 18%. This high value occurs due to the lower limit of detection used to estimate the failure threshold (0.001), but it improves to 5.2% when the methods practical limit of detection is used (10xLLD). Silver displays values of the order of 3 to 19% based on each Lab’s LLD but improves to acceptable values <10% when a practical limit of detection is used. Overall, the preparation and sub sampling procedures at the various labs can be regarded as satisfactory.
11.2.10 EXTERNAL CHECKS
A total of 499 pulp samples were reclaimed and dispatched to secondary laboratories: 125 from Skyline to SGS, 125 from ALS to Bureau Veritas, 125 from SGS to Bureau veritas and 124 from Bureau Veritas to SGS. The analytical protocols used by the secondary laboratory were analogous to the primary laboratory. This represents an overall insertion rate of 2.3%. Along with the check samples for each secondary laboratory, a suite of CRMs, blanks, and prep duplicates were inserted in the sample stream, and prepared and analyzed following the same protocols used for monitoring the performance of the primary laboratory (the overall results of the CRMs, blanks and duplicate data indicate that both Bureau Veritas and SGS achieved good levels of precision and accuracy).
The evaluation of pulps duplicate assay results comparison is based on a Reduced-to-Major-Axis regression (“RMA”) method (Kermack and Haldane, 1950). The RMA regression calculates an unbiased fit for values that are independent from each other, where both the X and Y variables have an implicit analytical error. The coefficient of determination (R2) is used to assess the variance explained by the linear relationship between the pairs. The bias, expressed as a percent, is calculated as Bias (%) = 1-RMAS in which RMAS is the slope of the RMA regression.
A good degree of correlation between the primary and their respective secondary laboratory was observed for copper, silver, molybdenum and CuSS (Table 11-13). A lower correlation for CuSS between ALS and Bureau Veritas is due to 7 samples that yielded significantly lower values at Bureau Veritas analysis. Also, a lower degree of correlation for CuSS between SGS and Bureau Veritas was due to more variability at values >0.1%. The overall RMA regression analysis indicates that the accuracy (i.e. analytical biased) achieved for copper, molybdenum, silver and soluble copper between Bureau Veritas, ALS, SGS and Skyline and their respective secondary laboratory is of good quality and reproducible within analytical uncertainty. Some differences are related to a nominal number of outlier samples (e.g., for Cu) with higher grades with respect to the majority of the samples.
TABLE 11-13: EXTERNAL CHECK ASSAYS RESULTS SUMMARY (2020-2021 DRILLING)
Secondary Laboratory Primary Laboratory No. of Samples Metal Mean
Bias* Original Umpire
Bureau Veritas
ALS 125
Cu 0.52 0.52 -2.2%
Ag 3.65 3.95 -12.6%
Mo 0.00 0.00 -5.2%
CuSS 0.22 0.15 14.5%
SGS 125
Cu 0.23 0.23 0.5%
Ag 1.54 1.57 4.1%
Mo 0.01 0.01 -5.5%
CuSS 0.07 0.05 0.9%
SGS
Bureau Veritas 124
Cu 0.23 0.24 0.1%
Ag 1.37 1.19 19.2%
Mo 0.01 0.01 5.8%
CuSS 0.11 0.12 -9.8%
Skyline 125
Cu 0.20 0.21 -12.2%
Ag 1.12 1.00 4.8%
Mo 0.01 0.00 6.9%
CuSS 0.10 0.10 -1.6%
Preliminary Economic Assessment Copper World Complex, Pima County, Arizona USA
Page 11-83
11.2.11 CONCLUSION
In the opinion of the author, the QAQC results from 2020-2021 drill campaigns demonstrate that the precision and accuracy of the assay results are of adequate quality and can be used for resource estimation purposes.
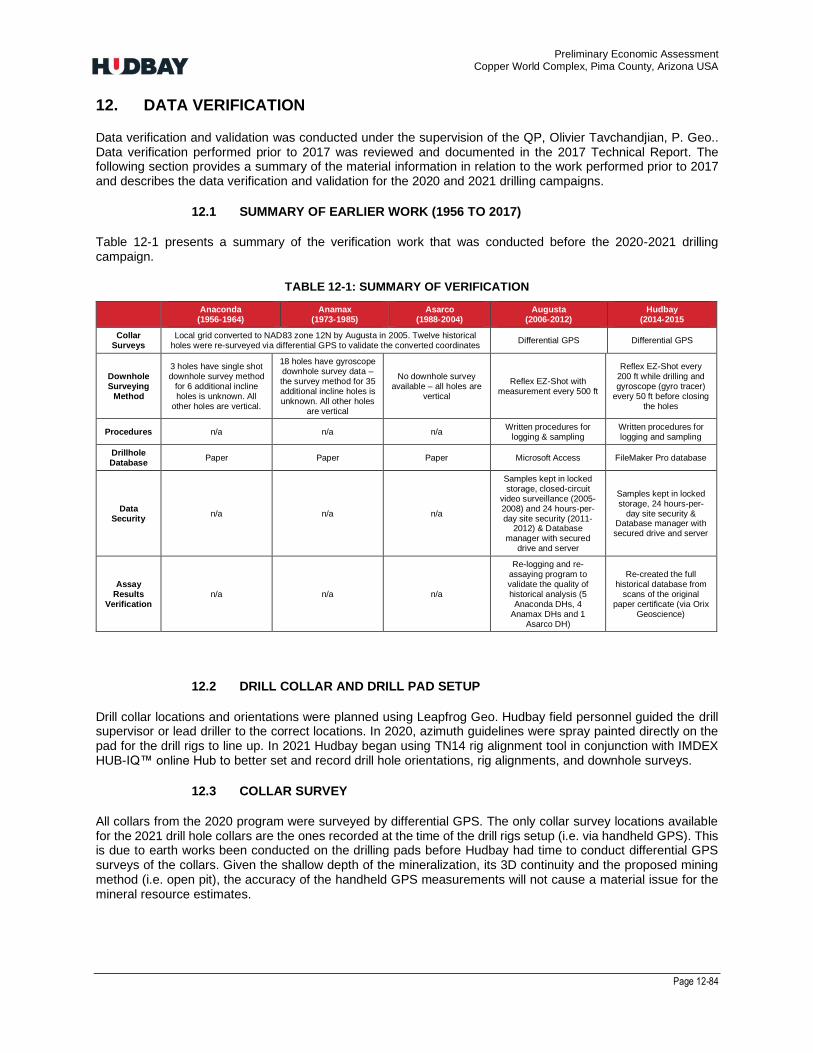
Preliminary Economic Assessment Copper World Complex, Pima County, Arizona USA
Page 12-84
12. DATA VERIFICATION
Data verification and validation was conducted under the supervision of the QP, Olivier Tavchandjian, P. Geo.. Data verification performed prior to 2017 was reviewed and documented in the 2017 Technical Report. The following section provides a summary of the material information in relation to the work performed prior to 2017 and describes the data verification and validation for the 2020 and 2021 drilling campaigns.
12.1 SUMMARY OF EARLIER WORK (1956 TO 2017)
Table 12-1 presents a summary of the verification work that was conducted before the 2020-2021 drilling campaign.
TABLE 12-1: SUMMARY OF VERIFICATION
Anaconda
(1956-1964) Anamax
(1973-1985) Asarco
(1988-2004) Augusta
(2006-2012) Hudbay
(2014-2015
Collar Surveys
Local grid converted to NAD83 zone 12N by Augusta in 2005. Twelve historical holes were re-surveyed via differential GPS to validate the converted coordinates
Differential GPS Differential GPS
Downhole Surveying
Method
3 holes have single shot downhole survey method
for 6 additional incline holes is unknown. All
other holes are vertical.
18 holes have gyroscope downhole survey data – the survey method for 35 additional incline holes is unknown. All other holes
are vertical
No downhole survey available – all holes are
vertical
Reflex EZ-Shot with measurement every 500 ft
Reflex EZ-Shot every 200 ft while drilling and gyroscope (gyro tracer)
every 50 ft before closing the holes
Procedures n/a n/a n/a Written procedures for
logging & sampling Written procedures for logging and sampling
Drillhole Database
Paper Paper Paper Microsoft Access FileMaker Pro database
Data Security
n/a n/a n/a
Samples kept in locked storage, closed-circuit
video surveillance (2005-2008) and 24 hours-per-day site security (2011-
2012) & Database manager with secured
drive and server
Samples kept in locked storage, 24 hours-per-
day site security & Database manager with secured drive and server
Assay Results
Verification n/a n/a n/a
Re-logging and re-assaying program to validate the quality of historical analysis (5
Anaconda DHs, 4 Anamax DHs and 1
Asarco DH)
Re-created the full historical database from
scans of the original paper certificate (via Orix
Geoscience)
12.2 DRILL COLLAR AND DRILL PAD SETUP
Drill collar locations and orientations were planned using Leapfrog Geo. Hudbay field personnel guided the drill supervisor or lead driller to the correct locations. In 2020, azimuth guidelines were spray painted directly on the pad for the drill rigs to line up. In 2021 Hudbay began using TN14 rig alignment tool in conjunction with IMDEX HUB-IQ™ online Hub to better set and record drill hole orientations, rig alignments, and downhole surveys.
12.3 COLLAR SURVEY
All collars from the 2020 program were surveyed by differential GPS. The only collar survey locations available for the 2021 drill hole collars are the ones recorded at the time of the drill rigs setup (i.e. via handheld GPS). This is due to earth works been conducted on the drilling pads before Hudbay had time to conduct differential GPS surveys of the collars. Given the shallow depth of the mineralization, its 3D continuity and the proposed mining method (i.e. open pit), the accuracy of the handheld GPS measurements will not cause a material issue for the mineral resource estimates.
Preliminary Economic Assessment Copper World Complex, Pima County, Arizona USA
Page 12-85
12.4 DOWNHOLE SURVEY METHOD
Drill holes were surveyed either via a Reflex EZ-GYRO™ or SPINT-IQ™ downhole survey tool at 100 foot intervals. A limited number of diamond drillholes did not have downhole survey data either because the hole had to be abandoned before the survey (eight DDHs), or the data was lost (seven DDHs). Holes without surveys were not used for the mineral resource estimate.
12.5 PROCEDURES FOR GEOLOGISTS AND TECHNICIANS
Written procedures from the 2014-2015 Hudbay drill campaigns were followed during the 2020-2021 logging and sampling program. Geologists who worked on the previous 2014-2015 campaign trained the new hires in 2020 and 2021. Geologists and technicians were supervised by more experienced staff until proven proficient. Daily task tracking and periodic review ensured procedures were being followed.
12.6 INSPECTION OF LABRATORIES BY HUDBAY PERSONNEL
All the laboratories used for recent drilling campaigns, i.e. Skyline laboratory in Tucson, Arizona and ALS preparation facility in Tucson have been visited by Hudbay personnel in 2020 and 2021. The purpose of these visits was to review the procedures, quality controls and general housekeeping of the facilities.
12.7 DRILL HOLE DATABASE
Hudbay used Filemaker Pro to store all the drilling, logging, sampling, samples dispatching, assaying, and QAQC information. This database contains all the validated historical drilling information as well as the Augusta Resources drilling and Hudbay drilling, including the information from the 2014 and 2015 drilling campaigns.
12.8 DATA SECURITY
The assay database is administered by the database manager with working copies kept on the local drive of a secure computer and backups placed on a secure location on a Hudbay server. Any requests for edits to the database are made to the database manager who updates all the copies. All the laboratory assay certificates and logs are stored on the Hudbay server.
12.9 ASSAY RESULTS VERIFICATION
In 2020, Hudbay hired Orix Geoscience to perform a validation of the existing historical drilling data for Broadtop Butte, the West deposit Peach and. The objective of this validation was to perform checks on a minimum of 20% of the samples from these drilled areas, by comparing the results entered in the database against the original certificates. Overall, approximately 1% of the data entry were found to have errors mostly due to unavailable pdf logs or assays results at the time of initial data entry and validation. The error rate was the highest for the West deposit attaining 11% but mostly affecting Ag values. Historical drilling in the West deposit represents only approximately 25% of the sample composites used for grade estimation in this zone.
Furthermore, 5% of the 2014 and 2015 assay results in the main database were validated by Hudbay against the original assay certificates. The original certificates were downloaded from the Bureau Veritas WebAccess system and imported into a clean database to create the validation set. No differences were found.
In 2021 Hudbay performed a test over the East deposit with the objective of assessing if the historical drilling results had a grade bias when compared to the more recent drilling results. Given the fact that there are no true twin holes, a pair analysis on blocks interpolated by nearest neighbours from historical drillholes (i.e. pre-Augusta) and holes drilled by Augusta & Hudbay was conducted.
Based on this analysis, no significant grade bias on copper was observed on the blocks both interpolated from historical and “new” drillholes. A 1% to 4% grade differences were observed depending on the distance subset used (respectively 200 ft and 100 ft).
Preliminary Economic Assessment Copper World Complex, Pima County, Arizona USA
Page 12-86
The same test was conducted at the Peach satellite deposit, comparing the block interpolated via the churn drillholes (historical data) and the diamond drillholes drilled by Hudbay in 2020-2021 and in this case also, no significant grade difference was observed between two data sets.
12.10 SITE VISITS
Hudbay personnel from various geological and engineering disciplines have visited the Project area to conduct site inspections, to become familiar with conditions on the property, to observe the geology and mineralization, to perform core review and to verify the work completed on the property as part of the mineral resource estimation and technical report process since 2014.
12.11 CONCLUSION
Based on these data verification procedures, the author’s opinion is that the data is of adequate quality for the purposes used in the Technical Report.
Preliminary Economic Assessment Copper World Complex, Pima County, Arizona USA
Page 13-87
13. MINERAL PROCESSING AND METALLURGICAL TESTING
13.1 HISTORICAL WORK
Historical metallurgical testing conducted by previous owners of the property, includes test programs initiated by Anamax Mining Company (1974-1975) and by Augusta Resource Corporation (2006 – 2013). Between 2005 and 2013, Augusta completed a series of metallurgical test performed on different lithologies and period composites. These early attempts to correlate metallurgical performance with specific mineralization types were met with limited success due to the differences in mineralogy and high degree of variability within the major lithologies. As such, these studies will generally not be discussed here. The only work which will be further discussed is related to column leach test work performed by Mountain State R&D International (“MSRDI”).
13.2 HUDBAY’S METALLURGICAL TESTING PROGRAMS
Following the acquisition of the project in 2014, Hudbay undertook a series of drilling, sampling and metallurgical programs focused on the East deposit. The objective of the testing campaign was to improve the correlation between mineralogy and/or geology and the metallurgical characteristics, considering mineral processing through flotation. Metallurgical and mineralogical tests were primarily performed by XPS Consulting & Testwork Services (XPS); with SGS undertaking the comminution testing.
In 2015, Base Met Laboratory (“BML”) was engaged to perform confirmation testing and additional process optimization. Bench scale testing was performed for additional metallurgical and project engineering data.
Following the discovery of the Copper World deposits in 2020, Hudbay engaged Kappes, Cassiday & Associates (KCA), Laboratorio Metalúrgico Chapi (Chapi) and SGS to perform mineralogical and metallurgical testing on Peach, Elgin, Broadtop Butte, and the East deposit transitional zone mineralization (copper present primarily as secondary copper sulfides and copper oxides). The objective of the test program was focused on correlating mineralogy of each deposit and the metallurgical response to both leaching and flotation.
13.2.1 SAMPLES AND REPRESENTATIVITY
The XPS and BML test programs studied production period and geometallurgical subtype (elevated copper oxide material, swelling clay rich material, magnesium clay rich material and hard sulfide material) composite samples from the East deposit, as well as 140 variability samples. The KCA program included a composite sample from each of Peach, Elgin, Broadtop Butte, and the East deposit transitional zone mineralization, and variability samples from each deposit (100 from East deposit and Peach, 50 from Elgin and Broadtop Butte).
Composite samples tested in the XPS and BML test program are no longer accurate when referenced to the current mine plan. However, these samples coupled with the transitional zone composite used in the KCA test program are representative of the variety of material within the East deposit. Peach and Elgin composite samples are representative of the entire mineral deposits and not separated by oxide and sulfide portions, whereas the Broadtop Butte composite is mostly representative of oxide mineralization within the deposit. Testing of oxide and sulfide specific material is included in the second phase of study initiated in 2022 and for which results are still pending and will be incorporated in future studies when available.
13.3 MINERALOGY
The XPS test program characterized variability and composite samples using X-ray diffraction (XRD) with Rietveld Refinement, Cation Exchange Capacity (CEC), Quantitative Evaluation of Minerals by Scanning Electron Microscopy (QEMSCAN) and Electron Probe Micro-analysis (EPMA). Additional mineralogy, employing SEM-EDX and XRD, was performed on the BML production period composites which validated the conclusions drawn from the XPS test program. As part of the 2021 test program, variability and composite samples were sent to SGS for mineralogical analysis. Samples were characterized by TESCAN Integrated Mineral Analyzer (TIMA) and EPMA. XRD with Rietveld Refinement, CEC and near-infrared spectroscopy (NIR) were employed to define clay content.
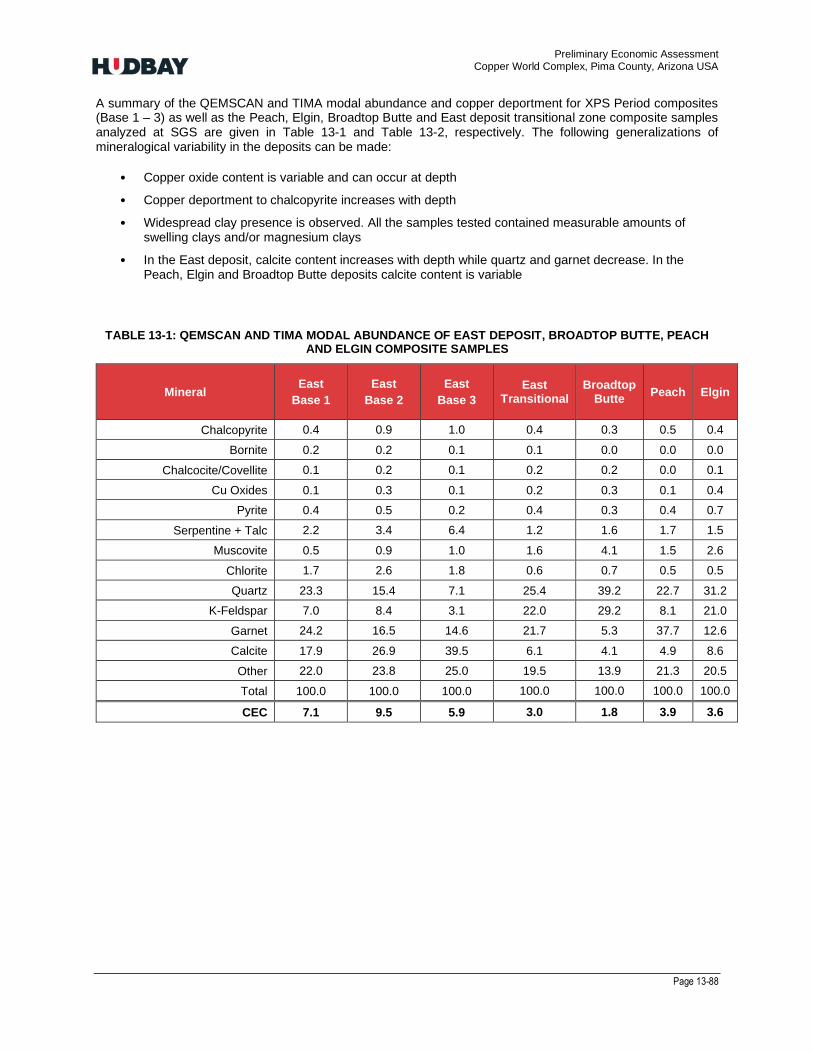
Preliminary Economic Assessment Copper World Complex, Pima County, Arizona USA
Page 13-88
A summary of the QEMSCAN and TIMA modal abundance and copper deportment for XPS Period composites (Base 1 – 3) as well as the Peach, Elgin, Broadtop Butte and East deposit transitional zone composite samples analyzed at SGS are given in Table 13-1 and Table 13-2, respectively. The following generalizations of mineralogical variability in the deposits can be made:
• Copper oxide content is variable and can occur at depth
• Copper deportment to chalcopyrite increases with depth
• Widespread clay presence is observed. All the samples tested contained measurable amounts of swelling clays and/or magnesium clays
• In the East deposit, calcite content increases with depth while quartz and garnet decrease. In the Peach, Elgin and Broadtop Butte deposits calcite content is variable
TABLE 13-1: QEMSCAN AND TIMA MODAL ABUNDANCE OF EAST DEPOSIT, BROADTOP BUTTE, PEACH AND ELGIN COMPOSITE SAMPLES
Mineral East
Base 1
East
Base 2
East
Base 3
East Transitional
Broadtop Butte
Peach Elgin
Chalcopyrite 0.4 0.9 1.0 0.4 0.3 0.5 0.4
Bornite 0.2 0.2 0.1 0.1 0.0 0.0 0.0
Chalcocite/Covellite 0.1 0.2 0.1 0.2 0.2 0.0 0.1
Cu Oxides 0.1 0.3 0.1 0.2 0.3 0.1 0.4
Pyrite 0.4 0.5 0.2 0.4 0.3 0.4 0.7
Serpentine + Talc 2.2 3.4 6.4 1.2 1.6 1.7 1.5
Muscovite 0.5 0.9 1.0 1.6 4.1 1.5 2.6
Chlorite 1.7 2.6 1.8 0.6 0.7 0.5 0.5
Quartz 23.3 15.4 7.1 25.4 39.2 22.7 31.2
K-Feldspar 7.0 8.4 3.1 22.0 29.2 8.1 21.0
Garnet 24.2 16.5 14.6 21.7 5.3 37.7 12.6
Calcite 17.9 26.9 39.5 6.1 4.1 4.9 8.6
Other 22.0 23.8 25.0 19.5 13.9 21.3 20.5
Total 100.0 100.0 100.0 100.0 100.0 100.0 100.0
CEC 7.1 9.5 5.9 3.0 1.8 3.9 3.6

Preliminary Economic Assessment Copper World Complex, Pima County, Arizona USA
Page 13-89
TABLE 13-2: COPPER DEPORTMENT BY MINERAL SPECIES IN EAST DEPOSIT, BROADTOP BUTTE, PEACH AND ELGIN COMPOSITE SAMPLES
Mineral East
Base 1
East
Base 2
East
Base 3
East Transitional
Broadtop Butte
Peach Elgin
Chalcopyrite 33.4 49.1 67.2 27.9 19.6 39.4 45.7
Bornite 31.5 18.2 16.2 14.8 1.6 5.3 9.4
Chalcocite/Covellite 26.6 23.3 8.4 32.6 29.6 8.2 28.7
Chrysocolla 0.6 2.1 0.9 0.5 3.4 1.2 0.5
Cu-Chlorite 3.6 3.6 3.3 0.2 0.2 0.4 0.2
Cu-Goethite 0.8 0.8 0.3 2.6 2.6 1.2 1.4
Other Cu Oxides 2.8 2.3 3.4 20.4 42.8 44.3 14.0
Other 0.5 0.5 0.2 1.1 0.4 0.1 0.1
Total 100.0 100.0 100.0 100.0 100.0 100.0 100.0
Total Sulfide Copper 92.0 90.9 92.1 75.2 50.7 52.9 83.7
Total Oxide Copper 8.0 9.1 7.9 24.8 49.3 47.1 16.3
13.4 COMMINUTION
As part of the XPS test program, 140 variability samples were sent to SGS for JK drop-weight (DWT), SAG Power Index (SPI®) and Bond ball mill work index (BWi) tests. BWi tests were performed with a closing size of 150
mesh (106 m). The 2021 test campaign included testing 60 variability samples from Peach, Elgin, Broadtop Butte and East deposit transitional zones for SAG Grindability Index (SGI) and BWi at Chapi. BWi tests were
performed with a closing size of 100 mesh (150 m). Chapi SGI and BWi values were corrected using the results of an internal round-robin and Qa/Qc program.
The combined statistics from the XPS Phase I and Chapi hardness tests are summarized in Table 13-3. Both DWT and BWi results ranged from very soft to hard, while SGI test results ranged from soft to very hard. The 75th percentile parameters were chosen as the basis for design of the comminution circuit.
TABLE 13-3: COMMINUTION DATA ACROSS ALL DEPOSITS
Statistic
DWT SGI
(min)
BWi
(kWh/ton) Relative Density
A x b ta
Samples Tested 33 33 33 200 200
Average 2.84 46.9 0.54 90.2 12.1
Standard Deviation 0.17 17.1 0.31 49.6 2.6
Minimum 2.56 94.2 1.49 18.9 6.1
Median 2.83 45.6 0.49 80.1 12.1
75th Percentile 2.94 37.0 0.39 113.0 13.5
90th Percentile 3.06 25.1 0.22 146.0 15.2
Maximum 3.28 18.6 0.14 401.0 20.4
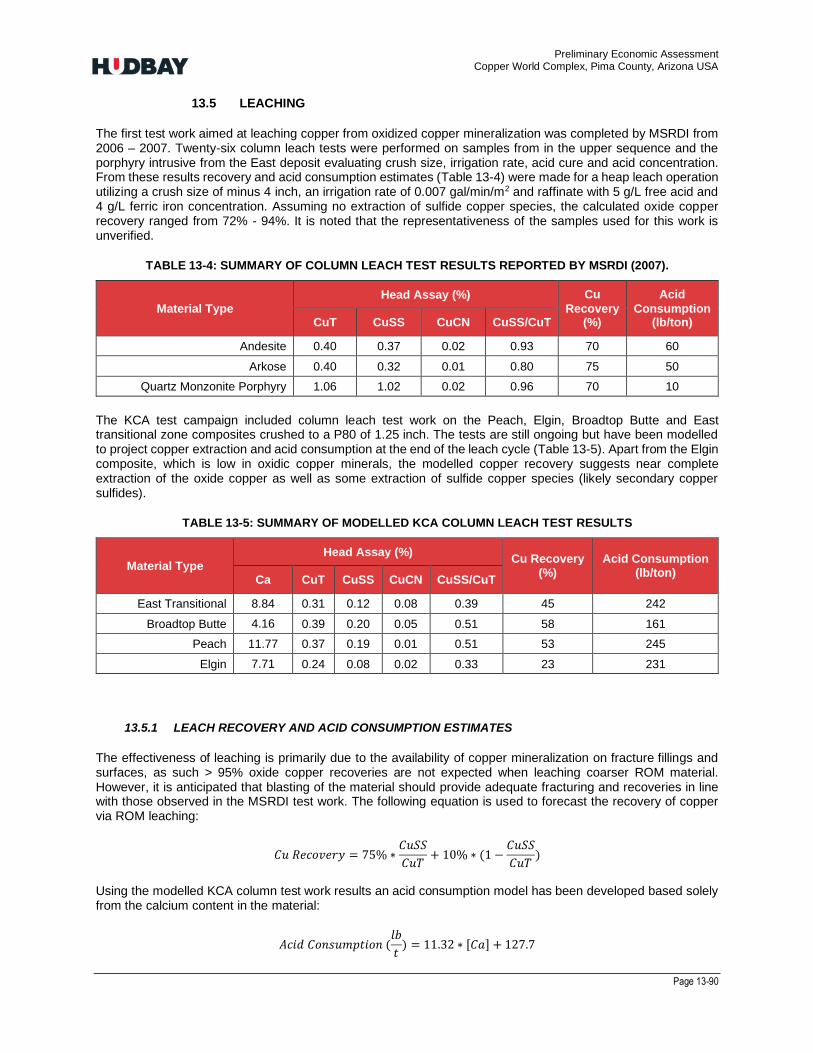
Preliminary Economic Assessment Copper World Complex, Pima County, Arizona USA
Page 13-90
13.5 LEACHING
The first test work aimed at leaching copper from oxidized copper mineralization was completed by MSRDI from 2006 – 2007. Twenty-six column leach tests were performed on samples from in the upper sequence and the porphyry intrusive from the East deposit evaluating crush size, irrigation rate, acid cure and acid concentration. From these results recovery and acid consumption estimates (Table 13-4) were made for a heap leach operation utilizing a crush size of minus 4 inch, an irrigation rate of 0.007 gal/min/m2 and raffinate with 5 g/L free acid and 4 g/L ferric iron concentration. Assuming no extraction of sulfide copper species, the calculated oxide copper recovery ranged from 72% - 94%. It is noted that the representativeness of the samples used for this work is unverified.
TABLE 13-4: SUMMARY OF COLUMN LEACH TEST RESULTS REPORTED BY MSRDI (2007).
Material Type Head Assay (%) Cu
Recovery (%)
Acid
Consumption (lb/ton) CuT CuSS CuCN CuSS/CuT
Andesite 0.40 0.37 0.02 0.93 70 60
Arkose 0.40 0.32 0.01 0.80 75 50
Quartz Monzonite Porphyry 1.06 1.02 0.02 0.96 70 10
The KCA test campaign included column leach test work on the Peach, Elgin, Broadtop Butte and East transitional zone composites crushed to a P80 of 1.25 inch. The tests are still ongoing but have been modelled to project copper extraction and acid consumption at the end of the leach cycle (Table 13-5). Apart from the Elgin composite, which is low in oxidic copper minerals, the modelled copper recovery suggests near complete extraction of the oxide copper as well as some extraction of sulfide copper species (likely secondary copper sulfides).
TABLE 13-5: SUMMARY OF MODELLED KCA COLUMN LEACH TEST RESULTS
Material Type Head Assay (%)
Cu Recovery (%)
Acid Consumption (lb/ton)
Ca CuT CuSS CuCN CuSS/CuT
East Transitional 8.84 0.31 0.12 0.08 0.39 45 242
Broadtop Butte 4.16 0.39 0.20 0.05 0.51 58 161
Peach 11.77 0.37 0.19 0.01 0.51 53 245
Elgin 7.71 0.24 0.08 0.02 0.33 23 231
13.5.1 LEACH RECOVERY AND ACID CONSUMPTION ESTIMATES
The effectiveness of leaching is primarily due to the availability of copper mineralization on fracture fillings and surfaces, as such > 95% oxide copper recoveries are not expected when leaching coarser ROM material. However, it is anticipated that blasting of the material should provide adequate fracturing and recoveries in line with those observed in the MSRDI test work. The following equation is used to forecast the recovery of copper via ROM leaching:
𝐶𝑢 𝑅𝑒𝑐𝑜𝑣𝑒𝑟𝑦 = 75% ∗𝐶𝑢𝑆𝑆
𝐶𝑢𝑇+ 10% ∗ (1 −
𝐶𝑢𝑆𝑆
𝐶𝑢𝑇)
Using the modelled KCA column test work results an acid consumption model has been developed based solely from the calcium content in the material:
𝐴𝑐𝑖𝑑 𝐶𝑜𝑛𝑠𝑢𝑚𝑝𝑡𝑖𝑜𝑛 (𝑙𝑏
𝑡) = 11.32 ∗ [𝐶𝑎] + 127.7
Preliminary Economic Assessment Copper World Complex, Pima County, Arizona USA
Page 13-91
It is assumed that ROM leaching will consume roughly half the acid observed in these tests (based on the surface area reduction). The model used to forecast acid consumption for ROM leaching is:
𝐴𝑐𝑖𝑑 𝐶𝑜𝑛𝑠𝑢𝑚𝑝𝑡𝑖𝑜𝑛 (𝑙𝑏
𝑡) = 5.66 ∗ [𝐶𝑎] + 63.85
The second phase of study initiated in 2022 includes additional column leach testing to validate the above assumptions. The 2022 test campaign will also define optimal operational parameters, such as lift height and acid concentration, to extract copper while limiting acid consumption.
13.6 FLOTATION
The XPS flotation program was developed to study the impact of key geometallurgical variables (copper oxide content, swelling clays, magnesium clays and material hardness) on copper flotation response, using traditional sulfide copper flotation reagents. Test work included 107 variability rougher kinetic flotation tests, as well as 104 kinetic flotation tests on production year and geometallurgical subtype composites to evaluate the effect of primary grind size, reagents, pH modifiers, dispersants, and rougher and cleaner pulp densities. These were run in parallel with open circuit and locked cycle testing. Additional batch and locked cycle test work was undertaken by BML to validate the XPS findings and for further process optimization. The findings can be summarized as follows:
• There was a strong relationship between copper recovery and the content of oxide copper (as determined by acid soluble copper assay) in the feed. Oxide copper species were poorly recovered but did not interfere with the flotation of sulfides, which averaged 90% recovery to the cleaner concentrate (97% rougher recovery and 93% cleaner recovery).
• Saleable concentrate grades (≥ 28%) were achieved
• Analysis of the impact of grind size on recovery indicated a 0.6% decrease in recovery per 10 m
increase in primary grind, within the P80 range of 104 – 265 m
• Elevated swelling clay content did not have a large effect on rougher performance but did cause grade to decline in the cleaners as recirculating clays built up
• Elevated magnesium clays were more toxic to flotation. High rougher mass pulls and depressed recoveries in both the rougher and the cleaners were experienced when floating samples with high magnesium clay content. Lowering the cleaner density was beneficial, but this was not tested in closed circuit where high recirculating loads may limit the degree to which low density could be maintained
To develop an understanding of the flotation response of Peach, Elgin and Broadtop Butte deposits, as well as the East deposit transitional zone, batch scale rougher kinetic tests were performed by KCA on the composite samples. The program aimed to improve the recovery of copper oxide species.
KCA conducted flotation tests to investigate the effect of sulfide ion electrode (SIE) controlled potential sulfidization (CPS), primary grind size, collector (SIBX) concentration, and pH on the four composite samples. The grind size, collector and pH tests were performed at an SIE potential of -400 mV. The kinetic parameters of sulfide and oxide copper under the best tested conditions are summarized in Table 13-6. As the tested composites have greater oxide copper content than the mill would process according to the mine plan, the best conditions were assumed to be those which maximized sulfide copper recovery. The results can be summarized as follows:
• CPS was beneficial for all the composites tested. Under the “optimal” SIE potential for each composite copper recovery increased by between 2% and 15%. Oxide copper recovery increased by between 4% and 16% and sulfide copper recovery shifted by 0% to 33%
• Without CPS, sulfide copper recovery in the Peach, Broadtop Butte and East composites was less than 80%, likely due to the mineral surfaces being oxidized. In the CPS series, bisulfide (HS-) acts as an activator by re-sulfurizing their surfaces improving their ability to float
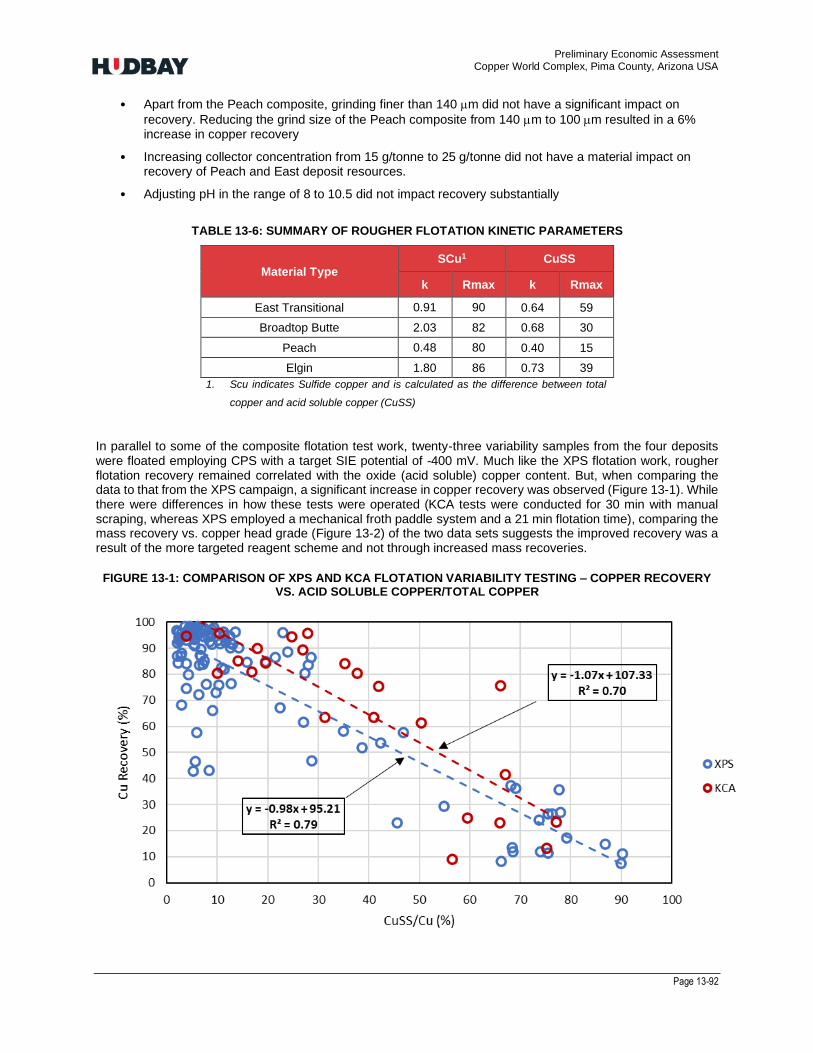
Preliminary Economic Assessment Copper World Complex, Pima County, Arizona USA
Page 13-92
• Apart from the Peach composite, grinding finer than 140 m did not have a significant impact on
recovery. Reducing the grind size of the Peach composite from 140 m to 100 m resulted in a 6% increase in copper recovery
• Increasing collector concentration from 15 g/tonne to 25 g/tonne did not have a material impact on recovery of Peach and East deposit resources.
• Adjusting pH in the range of 8 to 10.5 did not impact recovery substantially
TABLE 13-6: SUMMARY OF ROUGHER FLOTATION KINETIC PARAMETERS
Material Type SCu1 CuSS
k Rmax k Rmax
East Transitional 0.91 90 0.64 59
Broadtop Butte 2.03 82 0.68 30
Peach 0.48 80 0.40 15
Elgin 1.80 86 0.73 39
1. Scu indicates Sulfide copper and is calculated as the difference between total
copper and acid soluble copper (CuSS)
In parallel to some of the composite flotation test work, twenty-three variability samples from the four deposits were floated employing CPS with a target SIE potential of -400 mV. Much like the XPS flotation work, rougher flotation recovery remained correlated with the oxide (acid soluble) copper content. But, when comparing the data to that from the XPS campaign, a significant increase in copper recovery was observed (Figure 13-1). While there were differences in how these tests were operated (KCA tests were conducted for 30 min with manual scraping, whereas XPS employed a mechanical froth paddle system and a 21 min flotation time), comparing the mass recovery vs. copper head grade (Figure 13-2) of the two data sets suggests the improved recovery was a result of the more targeted reagent scheme and not through increased mass recoveries.
FIGURE 13-1: COMPARISON OF XPS AND KCA FLOTATION VARIABILITY TESTING – COPPER RECOVERY VS. ACID SOLUBLE COPPER/TOTAL COPPER
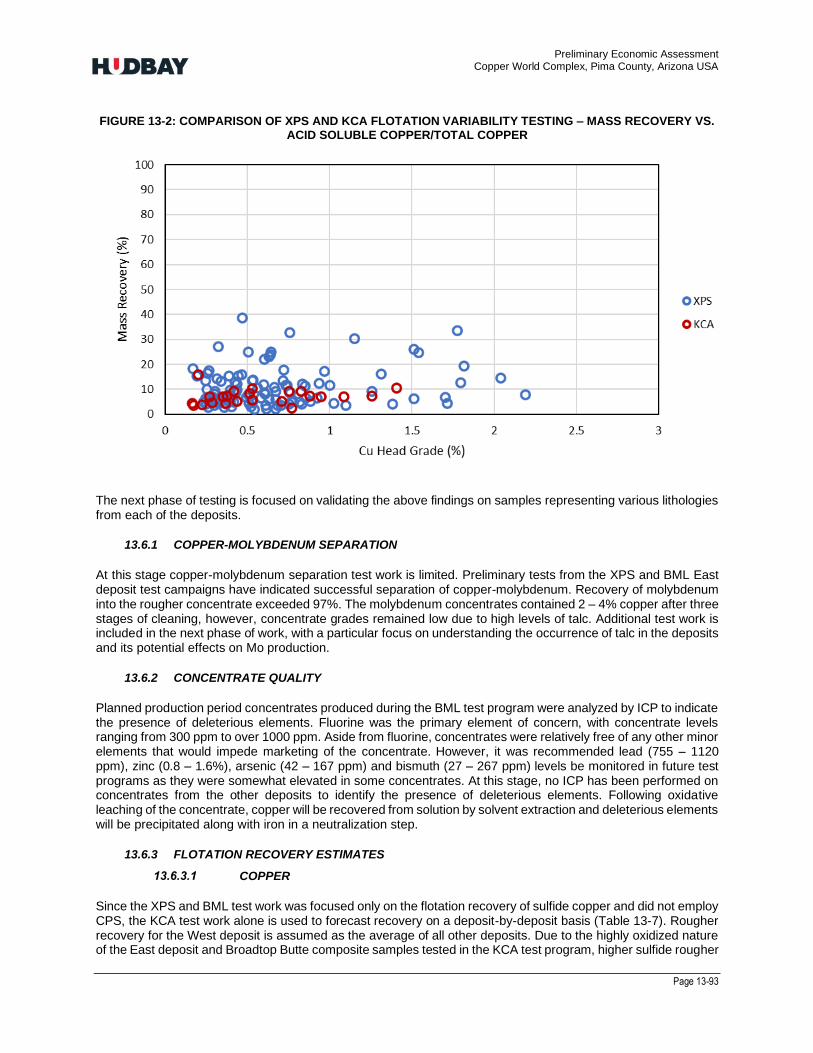
Preliminary Economic Assessment Copper World Complex, Pima County, Arizona USA
Page 13-93
FIGURE 13-2: COMPARISON OF XPS AND KCA FLOTATION VARIABILITY TESTING – MASS RECOVERY VS.
ACID SOLUBLE COPPER/TOTAL COPPER
The next phase of testing is focused on validating the above findings on samples representing various lithologies from each of the deposits.
13.6.1 COPPER-MOLYBDENUM SEPARATION
At this stage copper-molybdenum separation test work is limited. Preliminary tests from the XPS and BML East deposit test campaigns have indicated successful separation of copper-molybdenum. Recovery of molybdenum into the rougher concentrate exceeded 97%. The molybdenum concentrates contained 2 – 4% copper after three stages of cleaning, however, concentrate grades remained low due to high levels of talc. Additional test work is included in the next phase of work, with a particular focus on understanding the occurrence of talc in the deposits and its potential effects on Mo production.
13.6.2 CONCENTRATE QUALITY
Planned production period concentrates produced during the BML test program were analyzed by ICP to indicate the presence of deleterious elements. Fluorine was the primary element of concern, with concentrate levels ranging from 300 ppm to over 1000 ppm. Aside from fluorine, concentrates were relatively free of any other minor elements that would impede marketing of the concentrate. However, it was recommended lead (755 – 1120 ppm), zinc (0.8 – 1.6%), arsenic (42 – 167 ppm) and bismuth (27 – 267 ppm) levels be monitored in future test programs as they were somewhat elevated in some concentrates. At this stage, no ICP has been performed on concentrates from the other deposits to identify the presence of deleterious elements. Following oxidative leaching of the concentrate, copper will be recovered from solution by solvent extraction and deleterious elements will be precipitated along with iron in a neutralization step.
13.6.3 FLOTATION RECOVERY ESTIMATES
COPPER
Since the XPS and BML test work was focused only on the flotation recovery of sulfide copper and did not employ CPS, the KCA test work alone is used to forecast recovery on a deposit-by-deposit basis (Table 13-7). Rougher recovery for the West deposit is assumed as the average of all other deposits. Due to the highly oxidized nature of the East deposit and Broadtop Butte composite samples tested in the KCA test program, higher sulfide rougher

Preliminary Economic Assessment Copper World Complex, Pima County, Arizona USA
Page 13-94
copper recoveries are likely to be achieved than those assumed here. The BML test work indicated 97% rougher recovery of sulfide copper, and the results of the KCA test work indicate employing CPS to better recovery oxide copper should not negatively impact the recovery of copper sulfides.
At this stage, all the cleaner test work to date was focused on producing saleable concentrates. The proposed flowsheet incorporates concentrate leaching via the Albion Process™ which can accept lower grade, higher-recovery material. As such sulfide copper and oxide copper (acid soluble) cleaner recoveries are assumed to be 97.5% and 90%, respectively.
TABLE 13-7: EQUATIONS TO FORECAST COPPER RECOVERY BY DEPOSIT
Deposit Cu Recovery Equation
East deposit 𝐶𝑢 𝑅𝑒𝑐𝑜𝑣𝑒𝑟𝑦 (%) = 88 × (1 −𝐶𝑢𝑆𝑆
𝐶𝑢) + 52 × (
𝐶𝑢𝑆𝑆
𝐶𝑢)
Broadtop Butte 𝐶𝑢 𝑅𝑒𝑐𝑜𝑣𝑒𝑟𝑦 (%) = 80 × (1 −𝐶𝑢𝑆𝑆
𝐶𝑢) + 35 × (
𝐶𝑢𝑆𝑆
𝐶𝑢)
Peach 𝐶𝑢 𝑅𝑒𝑐𝑜𝑣𝑒𝑟𝑦 (%) = 78 × (1 −𝐶𝑢𝑆𝑆
𝐶𝑢) + 14 × (
𝐶𝑢𝑆𝑆
𝐶𝑢)
Elgin 𝐶𝑢 𝑅𝑒𝑐𝑜𝑣𝑒𝑟𝑦 (%) = 84 × (1 −𝐶𝑢𝑆𝑆
𝐶𝑢) + 35 × (
𝐶𝑢𝑆𝑆
𝐶𝑢)
West deposit 𝐶𝑢 𝑅𝑒𝑐𝑜𝑣𝑒𝑟𝑦 (%) = 83 × (1 −𝐶𝑢𝑆𝑆
𝐶𝑢) + 34 × (
𝐶𝑢𝑆𝑆
𝐶𝑢)
MOLYBDENUM
The ability to fully characterize molybdenum recoveries are hampered due to the limited testing. The XPS and BML test work demonstrated that copper-molybdenum separation was achievable, but target grade (> 50%) was not reached. Due to the small amount of test work to date, Molybdenum recovery estimates are based on industry benchmarking and assume 50% recovery to a 50% molybdenum concentrate. The next stage of testing will validate this assumption.
SILVER
Like copper, silver recovery is forecasted by deposit (Table 13-8), based on KCA test work with assumed cleaner recoveries of 90%.
TABLE 13-8: SILVER RECOVERY BY DEPOSIT
Deposit Ag
East deposit 56%
Broadtop Butte 48%
Peach 44%
Elgin 56%
West deposit 57%
Preliminary Economic Assessment Copper World Complex, Pima County, Arizona USA
Page 13-95
13.7 CONCENTRATE LEACHING
A class 5 AACE Engineering Study to evaluate the implementation of an Albion Process™ plant was performed by Glencore Technology using historical recovery data. A copper recovery of 98% was assumed in the leaching process with an overall sulfide oxidation of 70%. These assumptions were supported by test work results from similar concentrates to the ones expected to be treated by the Project. Confirmatory leach testing on the concentrate to be produced from the Copper World Complex will be conducted as part of the pre-Feasibility study over the coming months.
13.8 PRECIOUS METALS RECOVERY
Precious metals recovery test work is included in the next stage of testing. Precious metals recovery following an oxidative leach, such as the Albion Process, is typically > 90%1. The recovery of gold in silver in the precious metals plant is assumed to be 90%.
13.9 TAILINGS DEWATERING
Tailings samples from the East deposit were generated by XPS and tested by Andritz, Bilfinger, FLSmidth (FLS), Outotec and Pocock for water separation and recovery. As expected, clay content and size distribution had a significant effect on tailings dewatering. Samples with lower clay content generally achieved the highest thickener underflow densities. On average, the high compression thickener tests achieved underflow densities 3% to 4% higher than the high rate thickening tests. Generally, high rate thickeners could be expected to achieve an underflow density of 65% for lower clay content material, while high compression thickeners could be expected to achieve these densities even for higher clay content material.
Tailings Proctor compaction test work indicated a maximum moisture to achieve compaction of 15.2% (equivalent to a dry-weight-basis moisture of 18%). The target moisture for tailings filtration was therefore deemed to be 15%. A key outcome from the filtration test work was that membrane filters can achieve lower moisture content at higher machine throughputs compared to the chamber, or recessed plate, filter press. The 15% moisture target was generally achieved after one minute with membrane filters. Increasing feed pressure and air blowing times generally improved the results.
At this stage of testing, there is no tailings dewatering work on the other Copper World Complex deposits. Test work is included in the next phase of work to characterize the tailings properties of all deposits. The test work detailed above has been used to size dewatering equipment used for Phase I (conventional tailings) and Phase II (dry stack tailings) of the project.
13.10 CONCLUSIONS AND RECOMMENDATIONS
Based on the test work discussed above the following conclusions and recommendations can be made:
• Resource hardness is variable throughout the deposits. An SGI of 113 min and a BWi of 13.5 kWh/ton are chosen as the basis for the design of the comminution circuit
• Preliminary leach test work has indicated the resource is amenable to heap leaching. Recovery and acid consumption models have been proposed, however, additional column testing is required to validate the assumptions as well as determine optimal operating conditions
• Flotation test work has indicated that CPS can be used to improve the recovery of copper oxides and oxidized/tarnished copper sulfides via flotation. Additional testing is required to understand the flotation response to CPS for different lithologies within each of the deposits and validate recovery estimates
1 glencoretechnology.com/en/technologies/albion-process/
Preliminary Economic Assessment Copper World Complex, Pima County, Arizona USA
Page 13-96
• Preliminary copper-molybdenum separation test work has indicated successful separation of copper and molybdenum is possible, however, low molybdenum concentrates grades due to the presence of talc needs to be addressed
• Additional sulfide leach and precious metals recovery test work is required to further confirm and refine the assumptions used in this Preliminary Economic Assessment study.
• The tailings properties for the East deposit have been characterized to size dewatering equipment. Additional work is required to test tailings from the other Copper World Complex deposits and validate the selection of dewatering equipment
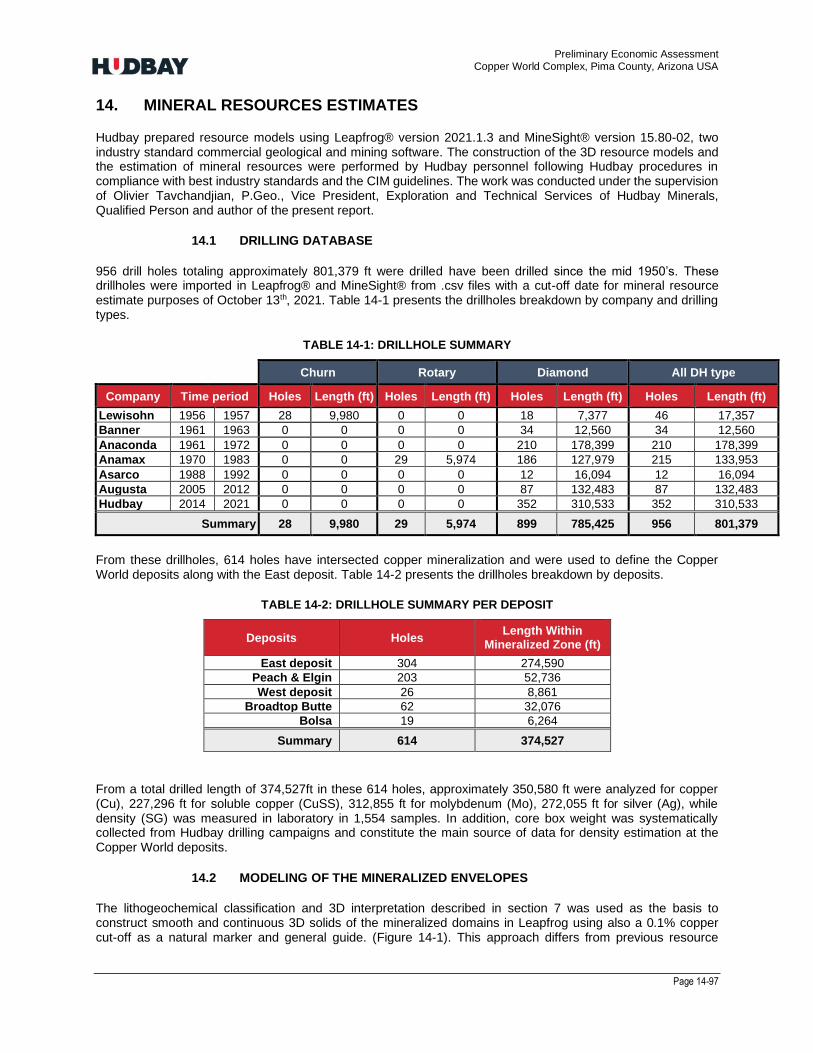
Preliminary Economic Assessment Copper World Complex, Pima County, Arizona USA
Page 14-97
14. MINERAL RESOURCES ESTIMATES
Hudbay prepared resource models using Leapfrog® version 2021.1.3 and MineSight® version 15.80-02, two industry standard commercial geological and mining software. The construction of the 3D resource models and the estimation of mineral resources were performed by Hudbay personnel following Hudbay procedures in compliance with best industry standards and the CIM guidelines. The work was conducted under the supervision of Olivier Tavchandjian, P.Geo., Vice President, Exploration and Technical Services of Hudbay Minerals, Qualified Person and author of the present report.
14.1 DRILLING DATABASE
956 drill holes totaling approximately 801,379 ft were drilled have been drilled since the mid 1950’s. These drillholes were imported in Leapfrog® and MineSight® from .csv files with a cut-off date for mineral resource estimate purposes of October 13th, 2021. Table 14-1 presents the drillholes breakdown by company and drilling types.
TABLE 14-1: DRILLHOLE SUMMARY
Churn Rotary Diamond All DH type
Company Time period Holes Length (ft) Holes Length (ft) Holes Length (ft) Holes Length (ft)
Lewisohn 1956 1957 28 9,980 0 0 18 7,377 46 17,357
Banner 1961 1963 0 0 0 0 34 12,560 34 12,560
Anaconda 1961 1972 0 0 0 0 210 178,399 210 178,399
Anamax 1970 1983 0 0 29 5,974 186 127,979 215 133,953
Asarco 1988 1992 0 0 0 0 12 16,094 12 16,094
Augusta 2005 2012 0 0 0 0 87 132,483 87 132,483
Hudbay 2014 2021 0 0 0 0 352 310,533 352 310,533
Summary 28 9,980 29 5,974 899 785,425 956 801,379
From these drillholes, 614 holes have intersected copper mineralization and were used to define the Copper World deposits along with the East deposit. Table 14-2 presents the drillholes breakdown by deposits.
TABLE 14-2: DRILLHOLE SUMMARY PER DEPOSIT
Deposits Holes Length Within
Mineralized Zone (ft)
East deposit 304 274,590
Peach & Elgin 203 52,736
West deposit 26 8,861
Broadtop Butte 62 32,076
Bolsa 19 6,264
Summary 614 374,527
From a total drilled length of 374,527ft in these 614 holes, approximately 350,580 ft were analyzed for copper (Cu), 227,296 ft for soluble copper (CuSS), 312,855 ft for molybdenum (Mo), 272,055 ft for silver (Ag), while density (SG) was measured in laboratory in 1,554 samples. In addition, core box weight was systematically collected from Hudbay drilling campaigns and constitute the main source of data for density estimation at the Copper World deposits.
14.2 MODELING OF THE MINERALIZED ENVELOPES
The lithogeochemical classification and 3D interpretation described in section 7 was used as the basis to construct smooth and continuous 3D solids of the mineralized domains in Leapfrog using also a 0.1% copper cut-off as a natural marker and general guide. (Figure 14-1). This approach differs from previous resource

Preliminary Economic Assessment Copper World Complex, Pima County, Arizona USA
Page 14-98
estimates done by Hudbay for the East deposit and documented in the March 2017 Technical Report when grade interpolation was conducted separately within each stratigraphic unit of the East deposit without any constraints with respect to metal grade distribution.
The shallow and closely spaced drilling conducted by Hudbay in 2020 and 2021 in very close proximity to the East deposit has provided new insight into the spatial distribution of the main metals of economic interest and in particular for copper. It is now understood that the control on mineralization at the East deposit is not to be limited to each stratigraphic unit but rather to 4 structural domains combining the stratigraphic classification presented in section 7 with the structural control in particular of the backbone and low-angle faults and the level of oxidation. This approach was validated externally by Golder and Associates.
The main objectives of the Golder review were to provide an assessment of the suitability of the 2021 domains for estimation purposes and as assessment on how the different approach to domain construction (between 2016 and current) may impact the resource block model. The following list summarizes the main Golder’s conclusions:
• The 2021 estimation domains are a good representation of mineralization and are suitable for use as a
control in producing Mineral Resource estimates.
• The 2021 domains are an improvement over the 2017 domains. They are more consistent with the
observed trends of mineralization.
• Refinements could be made and/or investigated to simplify the domains further.
None of the observations constitutes a fatal flaw and Golder considered the estimation domains suitable for use as a control in producing Mineral Resource estimates.
Table 14-3 presents the envelope code equivalency that will be referred through the remaining part of this section.
TABLE 14-3: MINERALIZED ENVELOPES CODE EQUIVALENCY
Figure 14-1 present a general view of the 0.1% Cu grade shells for the 5 deposits while Figure 14-2 to Figure 14-6 present more detailed views of the envelopes used as hard boundaries for grade interpolation purposes for each deposit. These five deposits are from the Northwest to the Southeast:
• Peach and Elgin (including the North Limb and South Limb zones of the Elgin porphyry intrusion disclosed separately in previous press releases but now grouped with the Peach-Elgin deposit)
• West deposit hosting skarn mineralization located in the hanging wall of the Backbone fault
• Broadtop Butte hosting mineralization in both a porphyry intrusive and in skarn
• Bolsa skarn zone equivalent to the Footwall domain of the backbone fault at the East deposit
ENVLP=0 : Granodiorite (barren)
ENVLP=1 : Footwall zone (barren)
ENVLP=2 : Lower plate (barren)
ENVLP=3 : Upper plate (barren)
ENVLP=4 : QMP (barren)
ENVLP=5 : Footwall zone (mineralized)
ENVLP=6 : Lower plate (mineralized)
ENVLP=7 : Lower plate middle oxide zone (mineralized)
ENVLP=8 : Lower plate bottom oxide zone (mineralized)
ENVLP=9 : Upper plate all oxidized - bottom (mineralized)
ENVLP=10 : QMP (mineralized)
ENVLP=11 : Upper plate all oxidized - top (mineralized)
ENVLP=12 : Peach & Elgin + Eastern extension (skarn) oxides & sulphides
ENVLP=13 : Peach & Elgin + Eastern extension (porphyry) oxides & sulphides
ENVLP=14 : West (skarn) all oxidized
ENVLP=15 : Broadtop Butte (skarn) sulphides
ENVLP=16 : Broadtop Butte (porphyry) all oxidized
ENVLP=17 : Ridge (skarn) all oxidized
East
deposit
Copper
World
deposits
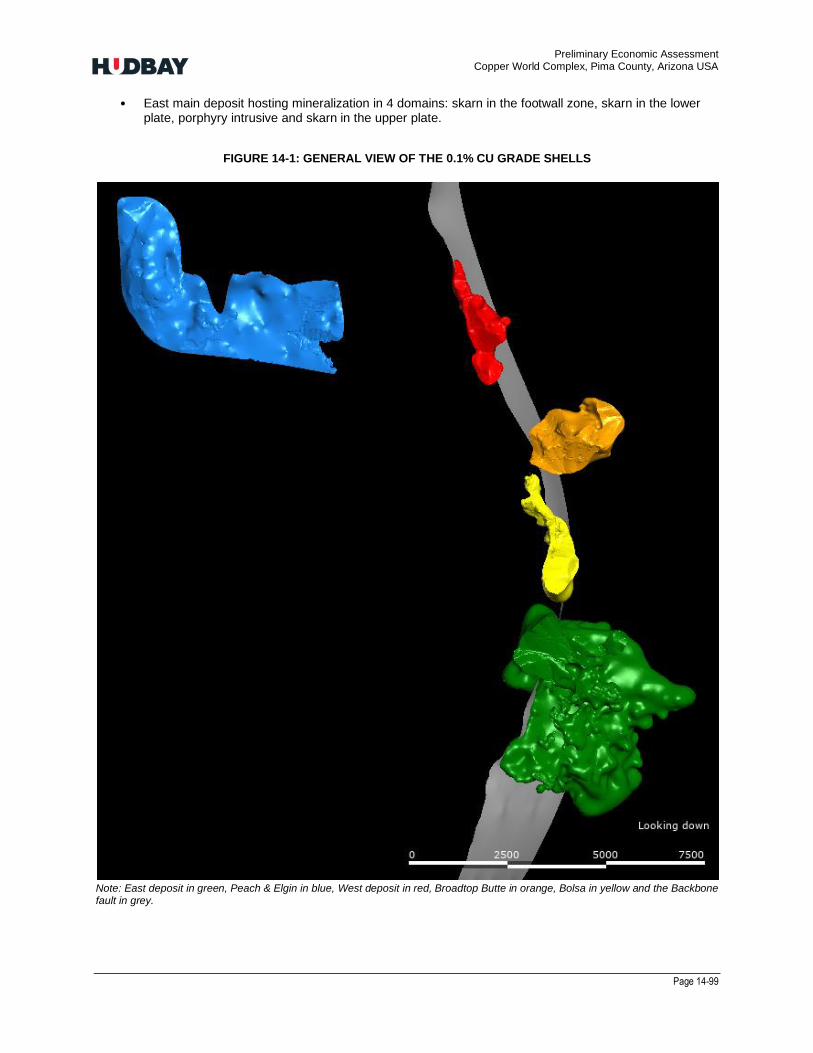
Preliminary Economic Assessment Copper World Complex, Pima County, Arizona USA
Page 14-99
• East main deposit hosting mineralization in 4 domains: skarn in the footwall zone, skarn in the lower plate, porphyry intrusive and skarn in the upper plate.
FIGURE 14-1: GENERAL VIEW OF THE 0.1% CU GRADE SHELLS
Note: East deposit in green, Peach & Elgin in blue, West deposit in red, Broadtop Butte in orange, Bolsa in yellow and the Backbone fault in grey.

Preliminary Economic Assessment Copper World Complex, Pima County, Arizona USA
Page 14-100
FIGURE 14-2: CROSS SECTION OF THE MINERALIZED DOMAINS AT THE EAST DEPOSIT
Note: Backbone fault trace = steeply dipping white line and Low Angle fault = shallow dipping white line
FIGURE 14-3: PEACH & ELGIN MINERALIZED ENVELOPES
Note: Peach & Elgin skarn mineralization in green (mix of sulfides and oxides) and porphyry mineralization in blue

Preliminary Economic Assessment Copper World Complex, Pima County, Arizona USA
Page 14-101
FIGURE 14-4: WEST DEPOSIT MINERALIZED ENVELOPE
Note: West deposit skarn mineralization in red hosts a mix of sulfides and oxides. Backbone fault in grey
FIGURE 14-5: BROADTOP BUTTE MINERALIZED ENVELOPE
Note: Broadtop Butte skarn sulfide mineralization in green and porphyry oxidized mineralization in blue

Preliminary Economic Assessment Copper World Complex, Pima County, Arizona USA
Page 14-102
FIGURE 14-6: BOLSA MINERALIZED ENVELOPES
Note: Bolsa skarn mineralization in yellow with a mix of sulfides and oxides. Backbone fault in grey.
The envelopes and the drillhole traces were loaded into MineSight® in order to ensure proper tagging of the solids to actual drillhole locations. The mineral envelopes were used as hard boundary in all cases for grade interpolation purposes to prevent spreading of mineralization into the barren zone and vice-versa.
14.3 DENSITY FOR EAST DEPOSIT
The regression formulas to calculate Specific Gravity (SGPR) from measured values by weight in air/weight in water are based on the 1,700 SG data collected by Hudbay in and at the vicinity (i.e. barren zones bounding the deposit) of the East deposit mineralized envelope.
As a first step, multi regression models for Hudbay ICP-MS data set were developed by lithological units. However, the complexity level of the multi regression models often lead to a tendency to overfit the measured data, hence rendering models with poor predictive power, even though characterized with high coefficient of determination (R2).
Grouping of the units based on their genetic affinities and their similar level of alterations as is now used for domains of metal distribution was also utilized to simplify and improve the initial multi regression model which was purely lithology based. Exempt from this are the granodiorite, the andesite and the QMP which are geologically too distinct from the other lithologies. Figure 14-7 presents a typical cross section of the East deposit with the sub grouping used to predict density.

Preliminary Economic Assessment Copper World Complex, Pima County, Arizona USA
Page 14-103
FIGURE 14-7: EAST DEPOSIT MAIN TYPICAL CROSS SECTION (LOOKING NORTH) WITH GEOLOGICAL UNITS
As expected, the grouped and simplified models have better predictive power than the lithology-based models. This improvement is driven by the increased of density measurements available and by the reduction of variables used. In all cases, the R2 of the regression models have decreased given the fact that they are not over fitting as much. Table 14-4 presents a summary of the inputs used along with the results obtained from the Hudbay data set without SG measurements
TABLE 14-4: REGRESSION MODELS FORMULAS AND STATISTICS
Note: Predicted density above and Measured density below and between
A hybrid field in the drillhole file was populated with measured density and predicted density (measured always truncate predicted). Samples without measured or predicted value from the historical holes were attributed with the average density value of the subgroup.

Preliminary Economic Assessment Copper World Complex, Pima County, Arizona USA
Page 14-104
14.4 DENSITY FOR THE COPPER WORLD DEPOSITS
413 measurements of specific gravity have been conducted for samples taken at random from the 2020-2021 drilling program at the Copper World deposits. This data includes:
• 93 measurements by pycnometer from pulps at the SGS and ALS laboratories to be used at a later stage of the project to correlate with geochemistry;
• 320 measurements from 15cm whole core samples including 64 done without wax coating at the Skyline lab; and
• 256 measurements done with wax coating at the Bureau Veritas and SGS laboratories.
As an extra step of validation, 141 of the samples for which SG was measured with wax coating at the Bureau Veritas (BV) laboratory were retested at the SGS laboratory using the same technique. These samples were recollected from the same intervals, but they are not from the same point within the 5 foot interval. The mean SG value obtained from SGS and BV are very similar indicating no bias between the two labs. The means are respectively 2.69 and 2.63 g/cm3. Figure 14-8 shows the scatterplot of density measurements by the two labs with a fairly symmetric distribution around the 1:1 line and relatively few samples plotting outside of a +/- 10% interval. The differences larger than 10% are to be expected as the core samples were collected at different points of the 5 foot sample composite.
FIGURE 14-8: DENSITY MEASUREMENTS – SGS VS BUREAU VERITAS.
SG measurements from competent pieces of core may not necessarily reflect in-situ density during the mining operation in unconsolidated ground with natural voids. In order to quantify the potential for correction and validate the core box weight as a more accurate measure of in-situ density, the sources of information were compared where available.
Using the sample interval length and core size, the inner effective volume of the core drilled was calculated by
using the cylinder volume equation (𝑉=𝜋𝑟2ℎ) in each box and its in-situ density was then derived by dividing the

Preliminary Economic Assessment Copper World Complex, Pima County, Arizona USA
Page 14-105
core box by this effective drilled volume. It must be noted that when weighted, the core in the box was dried already and as a result so additional adjustment has been applied to remove any assumed moisture content.
The 141 pairs of SG measurements used to compare the BV and SGS results were further reduced to 128 samples for which in-situ density from core box weight calculation was available and validated. For these 128 samples, the average SG measured by SGS was 2.70 g/cm3, measured by BV was 2.62 g/cm3, and calculated to be 2.51 from core box weight. Figure 14-9 illustrates the strong linear correlation between SG measured at the BV lab and from core box weights. The relative loss between average SG and in-situ density is of 4% and 7%, respectively, when core box weights are compared to the BV and SGS measurements. This loss is deemed to be related to voids that occur in these shallow and highly oxidized Copper World deposits. This difference between SG and in-situ density is deemed to be minimal and insignificant at the East deposit which is a deeper and less altered deposit.
FIGURE 14-9: DENSITY MEASUREMENT VS CORE BOX WEIGHT
Note: Bureau Veritas measurement (X axis) and core box weight (Y axis)
Until more SG results from pycnometer measurements become available and can be correlated to geochemistry, it was deemed that it would be more prudent to assign an average in-situ density by mineralized domain in the resource model of the Copper World deposits using core box weight estimates.
For this purpose, all the samples located inside the various mineralization domains from each deposit were selected from the 2020-2021 drilling campaign. A quality control process was conducted on the selected samples to remove erroneous box weight measurements. These errors occurred as the core boxes were not placed properly on the weigh scale. Only density values between 1.8 and 4.5 g/cm3 were retained. A total of 25,845 feet of core box weights located within the 6 mineral envelopes were retained following this quality control check.
Table 14-5 summarizes the average adjusted densities for the core box estimates by deposit. The average in-situ value derived from these core box weight measurements will be used for resource estimation and mine planning purposes until sufficient pycnometer measurements have been obtained and correlated with the geochemistry.
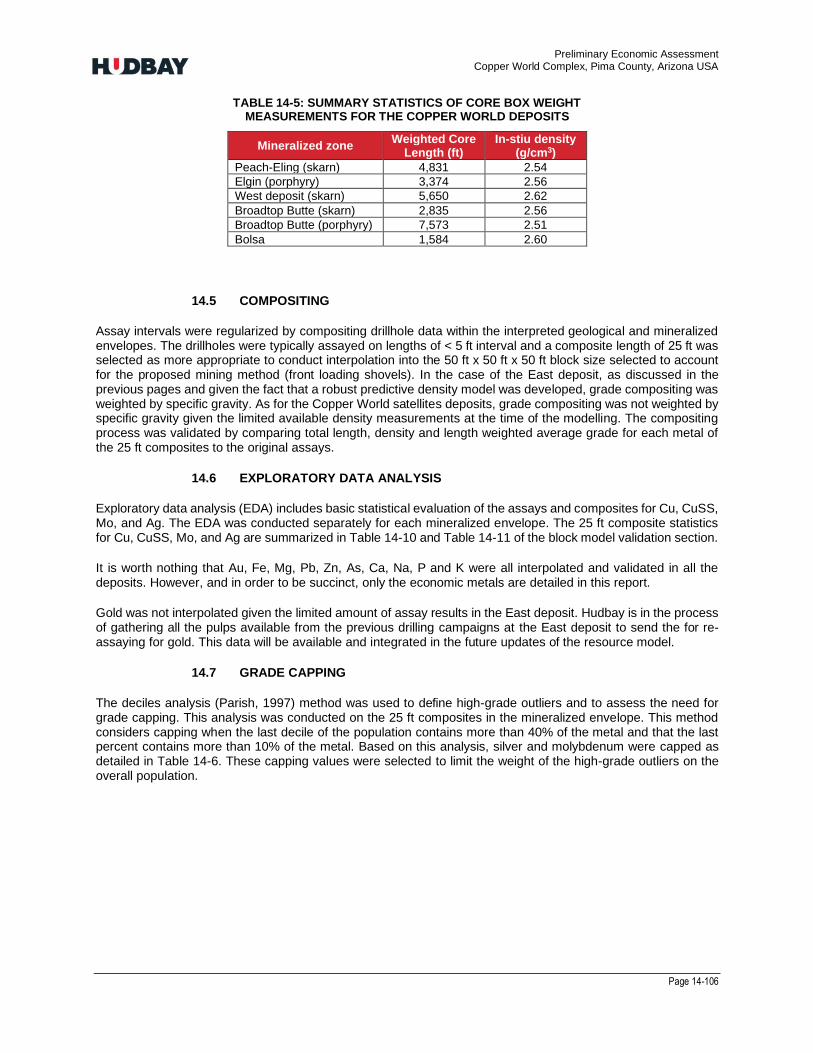
Preliminary Economic Assessment Copper World Complex, Pima County, Arizona USA
Page 14-106
TABLE 14-5: SUMMARY STATISTICS OF CORE BOX WEIGHT MEASUREMENTS FOR THE COPPER WORLD DEPOSITS
Mineralized zone Weighted Core
Length (ft) In-stiu density
(g/cm3)
Peach-Eling (skarn) 4,831 2.54
Elgin (porphyry) 3,374 2.56
West deposit (skarn) 5,650 2.62
Broadtop Butte (skarn) 2,835 2.56
Broadtop Butte (porphyry) 7,573 2.51
Bolsa 1,584 2.60
14.5 COMPOSITING
Assay intervals were regularized by compositing drillhole data within the interpreted geological and mineralized envelopes. The drillholes were typically assayed on lengths of < 5 ft interval and a composite length of 25 ft was selected as more appropriate to conduct interpolation into the 50 ft x 50 ft x 50 ft block size selected to account for the proposed mining method (front loading shovels). In the case of the East deposit, as discussed in the previous pages and given the fact that a robust predictive density model was developed, grade compositing was weighted by specific gravity. As for the Copper World satellites deposits, grade compositing was not weighted by specific gravity given the limited available density measurements at the time of the modelling. The compositing process was validated by comparing total length, density and length weighted average grade for each metal of the 25 ft composites to the original assays.
14.6 EXPLORATORY DATA ANALYSIS
Exploratory data analysis (EDA) includes basic statistical evaluation of the assays and composites for Cu, CuSS, Mo, and Ag. The EDA was conducted separately for each mineralized envelope. The 25 ft composite statistics for Cu, CuSS, Mo, and Ag are summarized in Table 14-10 and Table 14-11 of the block model validation section.
It is worth nothing that Au, Fe, Mg, Pb, Zn, As, Ca, Na, P and K were all interpolated and validated in all the deposits. However, and in order to be succinct, only the economic metals are detailed in this report.
Gold was not interpolated given the limited amount of assay results in the East deposit. Hudbay is in the process of gathering all the pulps available from the previous drilling campaigns at the East deposit to send the for re-assaying for gold. This data will be available and integrated in the future updates of the resource model.
14.7 GRADE CAPPING
The deciles analysis (Parish, 1997) method was used to define high-grade outliers and to assess the need for grade capping. This analysis was conducted on the 25 ft composites in the mineralized envelope. This method considers capping when the last decile of the population contains more than 40% of the metal and that the last percent contains more than 10% of the metal. Based on this analysis, silver and molybdenum were capped as detailed in Table 14-6. These capping values were selected to limit the weight of the high-grade outliers on the overall population.

Preliminary Economic Assessment Copper World Complex, Pima County, Arizona USA
Page 14-107
TABLE 14-6: CAPPING THRESHOLDS
14.8 VARIOGRAPHY
Down-hole and directional pairwise relative variograms for all elements were created for each individual mineral envelope (aside from ENVLP 9 & 11 which were combined) using MineSight Sigma software. The major, semi-major and minor axis were built from variogram maps. A combination of a nugget and two nested spherical models were adjusted in all cases. Once generated, a systematic visual check was conducted to ensure that the search ellipsoid would be correctly oriented with respect to the geometry of the mineral envelopes.
ENVLPCapping
threshold
# of composites
cappedMetal loss
Capping
threshold
# of composites
cappedMetal loss
5 55 5 10% n/a n/a n/a
6 50 11 < 1% n/a n/a n/a
7 10 2 3% n/a n/a n/a
8 20 4 2% n/a n/a n/a
9 n/a n/a n/a n/a n/a n/a
10 16.6 2 4% n/a n/a n/a
11 n/a n/a n/a n/a n/a n/a
12 n/a n/a n/a n/a n/a n/a
13 15 4 9% n/a n/a n/a
14 n/a n/a n/a n/a n/a n/a
15 n/a n/a n/a 1,000 2 2%
16 15 2 12% 1,055 2 1%
17 40 2 9% n/a n/a n/a
Silver Molybdenum
Ea
st
de
po
sit
Co
pp
er
Wo
rld
de
po
sit
s
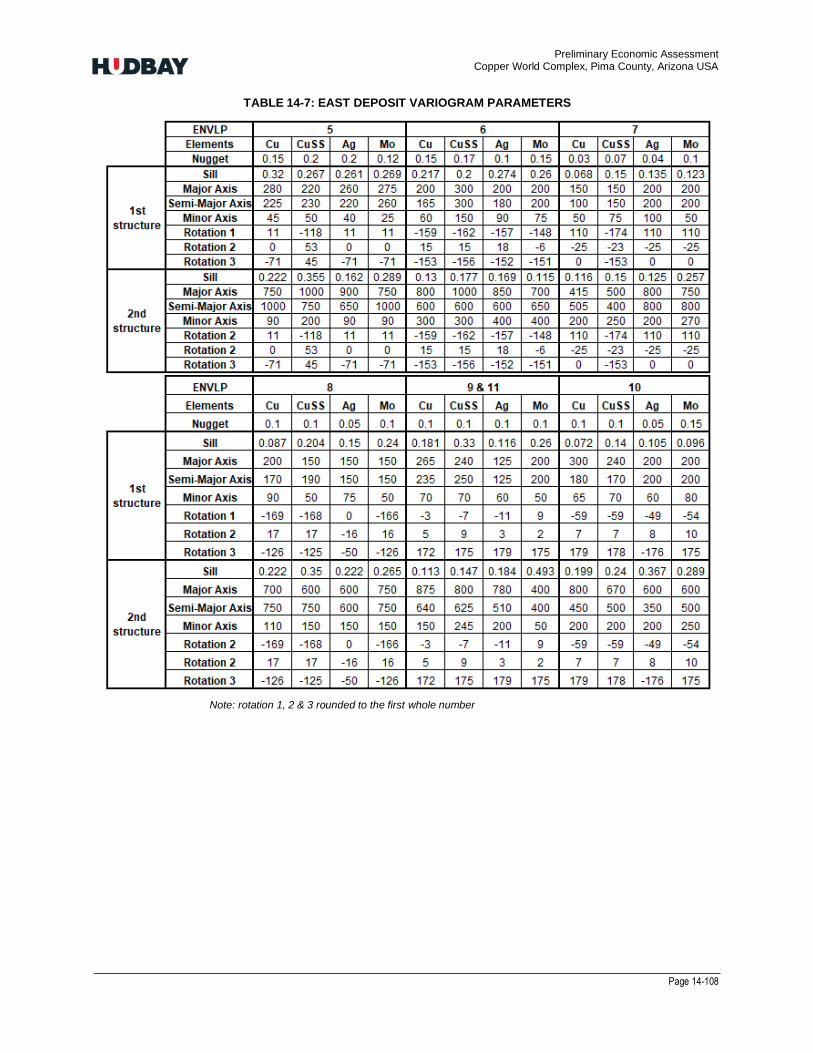
Preliminary Economic Assessment Copper World Complex, Pima County, Arizona USA
Page 14-108
TABLE 14-7: EAST DEPOSIT VARIOGRAM PARAMETERS
Note: rotation 1, 2 & 3 rounded to the first whole number

Preliminary Economic Assessment Copper World Complex, Pima County, Arizona USA
Page 14-109
TABLE 14-8: COPPER WORLD DEPOSITS VARIOGRAM PARAMETERS
Note: rotation 1, 2 & 3 rounded to the first whole number
14.9 GRADE ESTIMATION AND INTERPOLATION METHODS
The block model consists of regular blocks (50 ft along strike by 50 ft across strike by 50 ft vertically). The block dimensions were selected to match the expected smallest mining unit (SMU). Both nearest neighbor (NN) and ordinary kriging (OK) grade interpolations were completed on the uncapped and capped grades, using a strict composite and block matching code by mineralized envelope and three passes with increasing minimum information requirements (Table 14-9).
The search passes were selected to ensure best local estimates recognizing that OK has a smoothing effect but making no attempt during interpolation to reduce this smoothing as it would negatively impact the quality of the local estimates. Over-smoothing is addressed through the post-processing of the model described in sub section “smoothing assessment”.
ENVLP
Elements Cu CuSS Ag Mo Cu CuSS Ag Mo Cu CuSS Ag Mo
Nugget 0.1 0.1 0.15 0.15 0.06 0.05 0.1 0.1 0.2 0.15 0.1 0.15
Sill 0.191 0.35 0.175 0.275 0.067 0.011 0.046 0.275 0.2 0.291 0.169 0.318
Major Axis 100 250 250 300 210 250 200 200 250 200 200 200
Semi-Major Axis 160 250 200 300 200 200 200 200 200 100 150 150
Minor Axis 50 75 50 75 25 25 25 50 75 50 50 50
Rotation 1 -25 -44 -63 -60 -35 -35 -124 -123 -20 -20 -20 -20
Rotation 2 7 -1 -1 -1 -14 -14 -7 -6 0 0 0 0
Rotation 3 164 -177 -178 -180 -153 -166 168 171 -50 -50 -50 -50
Sill 0.098 0.243 0.121 0.219 0.147 0.708 0.286 0.275 0.207 0.353 0.31 0.214
Major Axis 1000 1000 1000 1200 800 650 600 600 650 800 700 650
Semi-Major Axis 400 800 500 500 400 400 400 400 400 300 200 300
Minor Axis 150 200 150 200 75 100 75 100 150 150 125 150
Rotation 2 -25 -44 -63 -60 -35 -35 -124 -123 -20 -20 -20 -20
Rotation 2 7 -1 -1 -1 -14 -14 -7 -6 0 0 0 0
Rotation 3 164 -177 -178 -180 -153 -166 168 171 -50 -50 -50 -50
ENVLP
Elements Cu CuSS Ag Mo Cu CuSS Ag Mo Cu CuSS Ag Mo
Nugget 0.15 0.1 0.1 0.15 0.03 0.1 0.05 0.05 0.1 0.1 0.1 0.075
Sill 0.19 0.272 0.37 0.173 0.0125 0.203 0.11 0.169 0.227 0.417 0.334 0.307
Major Axis 140 200 200 250 200 200 260 150 150 200 200 340
Semi-Major Axis 100 100 100 150 100 150 125 200 100 100 100 125
Minor Axis 75 75 65 75 50 50 65 50 100 75 100 60
Rotation 1 -20 -20 -20 -20 -121 -121 -126 -118 -20 -20 -20 -20
Rotation 2 0 0 0 0 3 5 8 8 0 0 0 0
Rotation 3 -20 -20 -20 -20 171 175 167 169 -80 -80 -80 -80
Sill 0.179 0.283 0.181 0.271 0.125 0.308 0.192 0.226 0.344 0.273 0.185 0.225
Major Axis 500 630 450 500 500 400 500 600 700 600 600 600
Semi-Major Axis 300 400 450 300 500 400 500 500 500 500 500 500
Minor Axis 150 150 125 125 150 150 150 150 150 150 175 125
Rotation 2 -20 -20 -20 -20 -121 -121 -126 -118 -20 -20 -20 -20
Rotation 2 0 0 0 0 3 5 8 8 0 0 0 0
Rotation 3 -20 -20 -20 -20 171 175 167 169 -80 -80 -80 -80
1st
structure
2nd
structure
141312
1st
structure
2nd
structure
15 16 17

Preliminary Economic Assessment Copper World Complex, Pima County, Arizona USA
Page 14-110
TABLE 14-9: SEARCH ELLIPSE PARAMETERS
Pass #1 Pass #2 Pass #3
Search ellipse 150% of variogram range 75% of variogram range 50% of variogram range
Minimum number if
composites 1 16 16
Maximum number of
composites 32 32 32
Maximum number of composites per hole
6 6 6
Declustering No Yes Yes
Maximum number of
composites per quadrant 32 16 10
Minimum number of quadrants
1 2 4
14.10 GRADE ESTIMATION VALIDATION
The grade estimation process was validated for each mineralized envelope to ensure appropriate honoring of the input data and subsequent unbiased resource reporting through the following steps:
• Visual checks of appropriate honoring of the input data but acknowledging that some natural smoothing should occur between samples as the grade of a sample in the middle of a block is not the average grade of the block;
• Absence of global bias by comparing the mean grade estimated by kriging to the original composite average grade and to a declustered grade obtained from a nearest neighbor interpolation;
• Assessment of the level of smoothing in the kriged model and correction for over-smoothing as per variogram model assumptions by domain of consistent drilling density and statistical properties.
14.11 VISUAL INSPECTION
Visual inspection of block grade versus composited data was systematically conducted in section view. This check confirmed a good reproduction of the data by the model. As an example, a cross sections (looking north) are presented in Figure 14-10 to Figure 14-14.
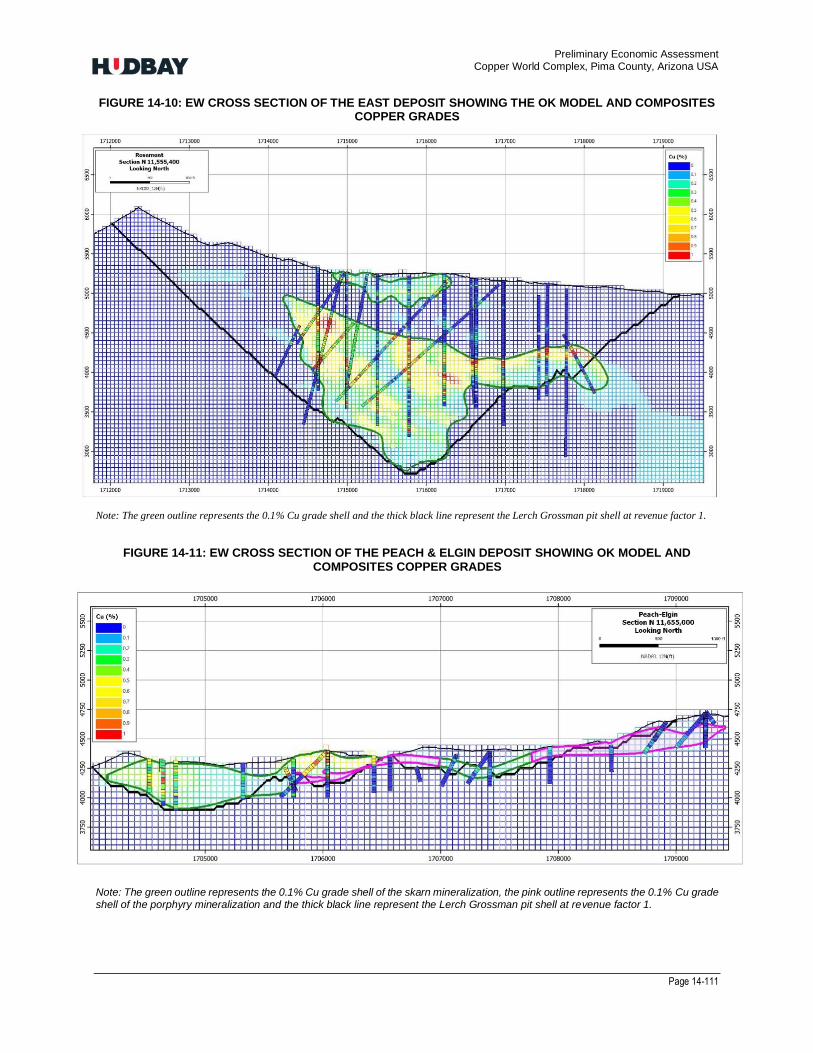
Preliminary Economic Assessment Copper World Complex, Pima County, Arizona USA
Page 14-111
FIGURE 14-10: EW CROSS SECTION OF THE EAST DEPOSIT SHOWING THE OK MODEL AND COMPOSITES COPPER GRADES
Note: The green outline represents the 0.1% Cu grade shell and the thick black line represent the Lerch Grossman pit shell at revenue factor 1.
FIGURE 14-11: EW CROSS SECTION OF THE PEACH & ELGIN DEPOSIT SHOWING OK MODEL AND COMPOSITES COPPER GRADES
Note: The green outline represents the 0.1% Cu grade shell of the skarn mineralization, the pink outline represents the 0.1% Cu grade shell of the porphyry mineralization and the thick black line represent the Lerch Grossman pit shell at revenue factor 1.

Preliminary Economic Assessment Copper World Complex, Pima County, Arizona USA
Page 14-112
FIGURE 14-12: EW CROSS SECTION OF THE WEST DEPOSIT SHOWING OK MODEL AND COMPOSITES COPPER GRADES
Note: The green outline represents the 0.1% Cu grade shell and the thick black line represent the Lerch Grossman pit shell at revenue factor 1.
FIGURE 14-13: EW CROSS SECTION OF THE BROADTOP BUTTE DEPOSIT SHOWING OK MODEL AND COMPOSITES COPPER GRADES
Note: The green outline represents the 0.1% Cu grade shell of the skarn mineralization, the pink outline represents the 0.1% Cu grade shell of the porphyry mineralization and the thick black line represent the Lerch Grossman pit shell at revenue factor 1

Preliminary Economic Assessment Copper World Complex, Pima County, Arizona USA
Page 14-113
FIGURE 14-14: EW CROSS SECTION OF THE BOLSA DEPOSIT SHOWING OK MODEL AND COMPOSITES COPPER GRADES
Note: The green outline represents the 0.1% Cu grade shell and the thick black line represent the Lerch Grossman pit shell at revenue factor 1.
14.12 GLOBAL BIAS CHECKS
This validation step consists of comparing the global average grade of each element between the composites, the nearest neighbor and the kriged block estimates.
A nearest neighbor interpolation is equivalent to the declustered statistics of the composites based on weighting each composite by its polygon of influence. The average grade obtained from this method is a useful benchmark but not a perfect one as it fails to incorporate the nugget effect measured by the variogram.
A global check was performed to verify that the kriged mean block estimate did not present any bias when compared to the composites and the nearest neighbor model. Differences between the 25 ft composites, the NN and OK grades are acceptable. The comparison of the mean and variance for each metal between the DDHs, the 25 ft composites, the NN and OK models are summarized in Table 14-10 and Table 14-11.

Preliminary Economic Assessment Copper World Complex, Pima County, Arizona USA
Page 14-114
TABLE 14-10: GLOBAL STATISTICS OF EAST DEPOSIT
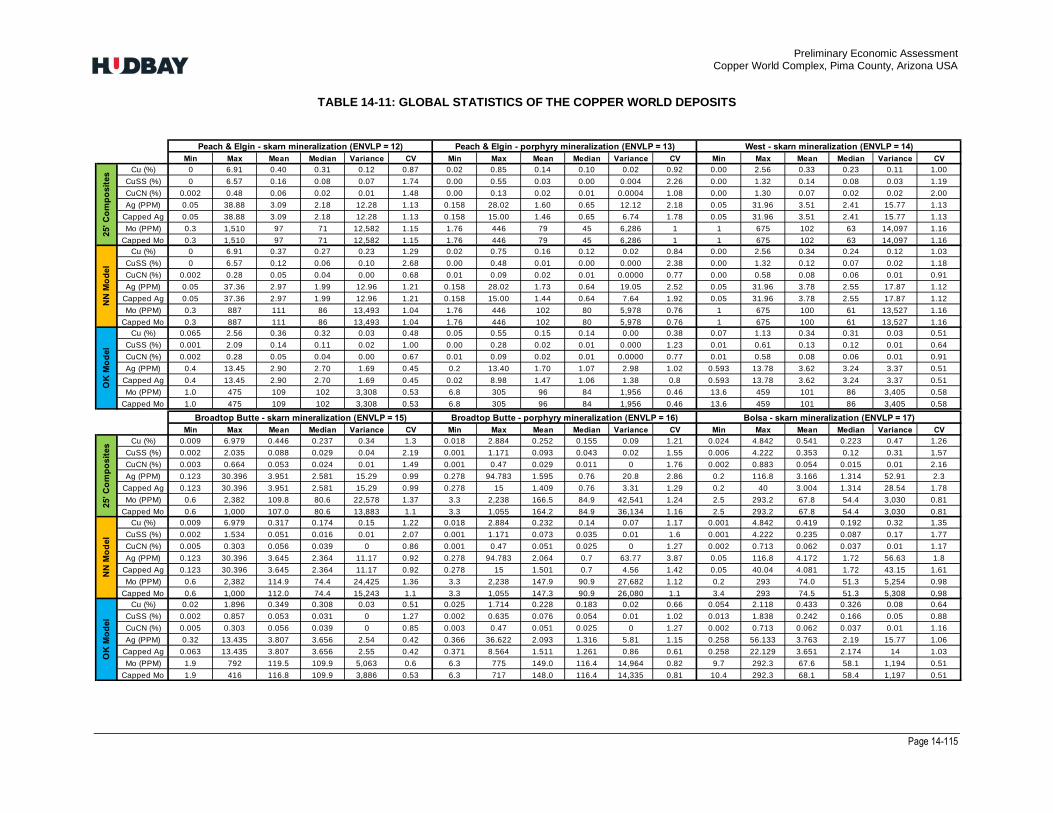
Preliminary Economic Assessment Copper World Complex, Pima County, Arizona USA
Page 14-115
TABLE 14-11: GLOBAL STATISTICS OF THE COPPER WORLD DEPOSITS
Min Max Mean Median Variance CV Min Max Mean Median Variance CV Min Max Mean Median Variance CV
Cu (%) 0 6.91 0.40 0.31 0.12 0.87 0.02 0.85 0.14 0.10 0.02 0.92 0.00 2.56 0.33 0.23 0.11 1.00
CuSS (%) 0 6.57 0.16 0.08 0.07 1.74 0.00 0.55 0.03 0.00 0.004 2.26 0.00 1.32 0.14 0.08 0.03 1.19
CuCN (%) 0.002 0.48 0.06 0.02 0.01 1.48 0.00 0.13 0.02 0.01 0.0004 1.08 0.00 1.30 0.07 0.02 0.02 2.00
Ag (PPM) 0.05 38.88 3.09 2.18 12.28 1.13 0.158 28.02 1.60 0.65 12.12 2.18 0.05 31.96 3.51 2.41 15.77 1.13
Capped Ag 0.05 38.88 3.09 2.18 12.28 1.13 0.158 15.00 1.46 0.65 6.74 1.78 0.05 31.96 3.51 2.41 15.77 1.13
Mo (PPM) 0.3 1,510 97 71 12,582 1.15 1.76 446 79 45 6,286 1 1 675 102 63 14,097 1.16
Capped Mo 0.3 1,510 97 71 12,582 1.15 1.76 446 79 45 6,286 1 1 675 102 63 14,097 1.16
Cu (%) 0 6.91 0.37 0.27 0.23 1.29 0.02 0.75 0.16 0.12 0.02 0.84 0.00 2.56 0.34 0.24 0.12 1.03
CuSS (%) 0 6.57 0.12 0.06 0.10 2.68 0.00 0.48 0.01 0.00 0.000 2.38 0.00 1.32 0.12 0.07 0.02 1.18
CuCN (%) 0.002 0.28 0.05 0.04 0.00 0.68 0.01 0.09 0.02 0.01 0.0000 0.77 0.00 0.58 0.08 0.06 0.01 0.91
Ag (PPM) 0.05 37.36 2.97 1.99 12.96 1.21 0.158 28.02 1.73 0.64 19.05 2.52 0.05 31.96 3.78 2.55 17.87 1.12
Capped Ag 0.05 37.36 2.97 1.99 12.96 1.21 0.158 15.00 1.44 0.64 7.64 1.92 0.05 31.96 3.78 2.55 17.87 1.12
Mo (PPM) 0.3 887 111 86 13,493 1.04 1.76 446 102 80 5,978 0.76 1 675 100 61 13,527 1.16
Capped Mo 0.3 887 111 86 13,493 1.04 1.76 446 102 80 5,978 0.76 1 675 100 61 13,527 1.16
Cu (%) 0.065 2.56 0.36 0.32 0.03 0.48 0.05 0.55 0.15 0.14 0.00 0.38 0.07 1.13 0.34 0.31 0.03 0.51
CuSS (%) 0.001 2.09 0.14 0.11 0.02 1.00 0.00 0.28 0.02 0.01 0.000 1.23 0.01 0.61 0.13 0.12 0.01 0.64
CuCN (%) 0.002 0.28 0.05 0.04 0.00 0.67 0.01 0.09 0.02 0.01 0.0000 0.77 0.01 0.58 0.08 0.06 0.01 0.91
Ag (PPM) 0.4 13.45 2.90 2.70 1.69 0.45 0.2 13.40 1.70 1.07 2.98 1.02 0.593 13.78 3.62 3.24 3.37 0.51
Capped Ag 0.4 13.45 2.90 2.70 1.69 0.45 0.02 8.98 1.47 1.06 1.38 0.8 0.593 13.78 3.62 3.24 3.37 0.51
Mo (PPM) 1.0 475 109 102 3,308 0.53 6.8 305 96 84 1,956 0.46 13.6 459 101 86 3,405 0.58
Capped Mo 1.0 475 109 102 3,308 0.53 6.8 305 96 84 1,956 0.46 13.6 459 101 86 3,405 0.58
Min Max Mean Median Variance CV Min Max Mean Median Variance CV Min Max Mean Median Variance CV
Cu (%) 0.009 6.979 0.446 0.237 0.34 1.3 0.018 2.884 0.252 0.155 0.09 1.21 0.024 4.842 0.541 0.223 0.47 1.26
CuSS (%) 0.002 2.035 0.088 0.029 0.04 2.19 0.001 1.171 0.093 0.043 0.02 1.55 0.006 4.222 0.353 0.12 0.31 1.57
CuCN (%) 0.003 0.664 0.053 0.024 0.01 1.49 0.001 0.47 0.029 0.011 0 1.76 0.002 0.883 0.054 0.015 0.01 2.16
Ag (PPM) 0.123 30.396 3.951 2.581 15.29 0.99 0.278 94.783 1.595 0.76 20.8 2.86 0.2 116.8 3.166 1.314 52.91 2.3
Capped Ag 0.123 30.396 3.951 2.581 15.29 0.99 0.278 15 1.409 0.76 3.31 1.29 0.2 40 3.004 1.314 28.54 1.78
Mo (PPM) 0.6 2,382 109.8 80.6 22,578 1.37 3.3 2,238 166.5 84.9 42,541 1.24 2.5 293.2 67.8 54.4 3,030 0.81
Capped Mo 0.6 1,000 107.0 80.6 13,883 1.1 3.3 1,055 164.2 84.9 36,134 1.16 2.5 293.2 67.8 54.4 3,030 0.81
Cu (%) 0.009 6.979 0.317 0.174 0.15 1.22 0.018 2.884 0.232 0.14 0.07 1.17 0.001 4.842 0.419 0.192 0.32 1.35
CuSS (%) 0.002 1.534 0.051 0.016 0.01 2.07 0.001 1.171 0.073 0.035 0.01 1.6 0.001 4.222 0.235 0.087 0.17 1.77
CuCN (%) 0.005 0.303 0.056 0.039 0 0.86 0.001 0.47 0.051 0.025 0 1.27 0.002 0.713 0.062 0.037 0.01 1.17
Ag (PPM) 0.123 30.396 3.645 2.364 11.17 0.92 0.278 94.783 2.064 0.7 63.77 3.87 0.05 116.8 4.172 1.72 56.63 1.8
Capped Ag 0.123 30.396 3.645 2.364 11.17 0.92 0.278 15 1.501 0.7 4.56 1.42 0.05 40.04 4.081 1.72 43.15 1.61
Mo (PPM) 0.6 2,382 114.9 74.4 24,425 1.36 3.3 2,238 147.9 90.9 27,682 1.12 0.2 293 74.0 51.3 5,254 0.98
Capped Mo 0.6 1,000 112.0 74.4 15,243 1.1 3.3 1,055 147.3 90.9 26,080 1.1 3.4 293 74.5 51.3 5,308 0.98
Cu (%) 0.02 1.896 0.349 0.308 0.03 0.51 0.025 1.714 0.228 0.183 0.02 0.66 0.054 2.118 0.433 0.326 0.08 0.64
CuSS (%) 0.002 0.857 0.053 0.031 0 1.27 0.002 0.635 0.076 0.054 0.01 1.02 0.013 1.838 0.242 0.166 0.05 0.88
CuCN (%) 0.005 0.303 0.056 0.039 0 0.85 0.003 0.47 0.051 0.025 0 1.27 0.002 0.713 0.062 0.037 0.01 1.16
Ag (PPM) 0.32 13.435 3.807 3.656 2.54 0.42 0.366 36.622 2.093 1.316 5.81 1.15 0.258 56.133 3.763 2.19 15.77 1.06
Capped Ag 0.063 13.435 3.807 3.656 2.55 0.42 0.371 8.564 1.511 1.261 0.86 0.61 0.258 22.129 3.651 2.174 14 1.03
Mo (PPM) 1.9 792 119.5 109.9 5,063 0.6 6.3 775 149.0 116.4 14,964 0.82 9.7 292.3 67.6 58.1 1,194 0.51
Capped Mo 1.9 416 116.8 109.9 3,886 0.53 6.3 717 148.0 116.4 14,335 0.81 10.4 292.3 68.1 58.4 1,197 0.51
OK
Mo
del
Broadtop Butte - skarn mineralization (ENVLP = 15) Broadtop Butte - porphyry mineralization (ENVLP = 16) Bolsa - skarn mineralization (ENVLP = 17)
Peach & Elgin - skarn mineralization (ENVLP = 12) Peach & Elgin - porphyry mineralization (ENVLP = 13) West - skarn mineralization (ENVLP = 14)
25' C
om
po
sit
es
NN
Mo
del
OK
Mo
del
25' C
om
po
sit
es
NN
Mo
del
Preliminary Economic Assessment Copper World Complex, Pima County, Arizona USA
Page 14-116
14.13 SMOOTHING ASSESSMENT
The visual validation conducted in sections confirmed that the block grade interpolation is consistent with the supporting composite data. The larger number of composites used for grade estimation in the block model significantly improves the individual block grade estimates but, at the same time results in a much smoother model requiring a careful assessment and in many cases a post-processing of the OK estimates.
The extent of grade ‘over-smoothing’ in the model was investigated based on material differences in grade distribution and/or drilling density. The mean and variance of the kriged estimates were compared to the variance of the composites after declustering. The expected true variance between SMUs was calculated from the variogram models summarized in Table 14-7 and Table 14 8.
Over-smoothing is a normal outcome of a sound interpolation method when the drill spacing is not sufficient to address the short-range variability in the metal grade distribution. Smoothing will gradually reduce as additional infill drilling is performed during the definition drilling phases.
14.14 SMOOTHING CORRECTION
Using the smoothed OK estimates results in an erroneous grade-tonnage curve and reporting resources or reserves at a cut-off grade different than 0% would produce biased estimates, usually over-estimating tonnes and under-estimating grade.
An indirect log-normal correction was used to perform a change of support on the kriged models in order to obtain unbiased grade tonnage curves. This correction is only valid globally and provides poorer local estimates than the smoothed OK model but does not materially alter the global average grade within each zone and provides the correct grade-tonnage curve for the variogram models fitted on the drillhole data. It is an appropriate method to predict the recoverable tonnage and grade such as the volume mined over three months of production which should be a realistic aim for a long-term resource model based on exploration drilling.
For some of the elements, the correction did not fully attain the targeted variance reflecting that the log-normal model does not perfectly fit these elements. However, the targeted variance was reached within very close limits in most cases, as illustrated in Table 14-12 and Table 14-13.

Preliminary Economic Assessment Copper World Complex, Pima County, Arizona USA
Page 14-117
TABLE 14-12: SUMMARY OF SMOOTHING CORRECTION FOR EAST DEPOSIT

Preliminary Economic Assessment Copper World Complex, Pima County, Arizona USA
Page 14-118
TABLE 14-13: SUMMARY OF SMOOTHING CORRECTION FOR THE COPPER WORLD DEPOSITS
14.15 CLASSIFICATION OF MINERAL RESOURCE
During the interpolation process, a number of control parameters were recorded for each block, e.g. number of samples, number of holes, the distance to the nearest sample and the average distance to all the samples used for the interpolation as well as the number of quadrants with samples, the kriging variance and the regression slope of kriging for each individual block estimate.
The regression slope values obtained from the kriging of copper and soluble copper grade estimates was used as the primary criteria for resource classification with 80% and 60% regression slope thresholds used respectively to separate “Measured” from “Indicated” and from “Inferred” resources. From detailed reserves to mill reconciliations exercises conducted by Hudbay at its operating mines, this criterion was found to be a reliable first pass measure of quarterly and annual performance in tonnes and grade prediction.
The block by block coding assignation was then smoothed to remove isolated blocks of one category within another. Globally, proportions of “Measured”, “Indicated” and “Inferred” category blocks were not changed significantly through this process. Figure 14-15 illustrates the classification before and after smoothing while Table 14-14 present the classification proportion before and after smoothing.
ENVLPNN model
variance
OK model
variance
Theoritical variance for 50
ft x 50 ft x50 ft blocks
Smoothing ratio for 50 ft
x 50 ft x50 ft blocks
Corrected variance in
50 ft x 50 ft x50 ft
blocks
12 0.229 0.029 0.096 3.32 0.131
13 0.019 0.003 0.008 2.58 0.009
14 0.123 0.031 0.059 1.93 0.057
15 0.151 0.031 0.070 2.27 0.068
16 0.073 0.023 0.047 2.06 0.054
17 0.323 0.077 0.199 2.57 0.172
12 0.105 0.020 0.066 3.35 0.058
13 0.001 0.000 0.0005 1.34 0.0005
14 0.019 0.007 0.010 1.45 0.009
15 0.011 0.004 0.006 1.44 0.006
16 0.014 0.006 0.008 1.27 0.007
17 0.173 0.045 0.099 2.18 0.086
12 13,493 3,308 7,680 2.32 6,538
13 5,978 1,956 3,131 1.60 2,939
14 13,527 3,405 6,446 1.89 6,332
15 15,243 3,886 8,016 2.06 7,283
16 26,080 14,335 15,573 1.09 15,363
17 5,308 1,197 2,984 2.49 2,428
12 12.96 1.69 5.48 3.24 5.57
13 7.65 1.38 3.62 2.63 3.37
14 17.87 3.37 9.68 2.87 9.97
15 11.17 2.54 5.68 2.23 5.03
16 4.56 0.86 2.80 3.25 2.55
17 43.15 14.00 24.76 1.77 22.25
Cu
(%
)C
uS
S (
%)
Mo
(P
PM
)A
g (
PP
M)

Preliminary Economic Assessment Copper World Complex, Pima County, Arizona USA
Page 14-119
FIGURE 14-15: RESOURCE CLASSIFICATION AT THE COPPER WORLD COMPLEX DEPOSITS
Note: block by block classification (left) and smoothed classification (right)
TABLE 14-14: RESOURCE CLASSIFICATION PROPORTION PRE & POST PROCESSING
Block by Block Smoothed
Measured 53% 50%
Indicated 18% 27%
Inferred 28% 23%
14.16 REASONABLE PROSPECTS OF ECONOMICS EXTRACTION AND MINERAL RESOURCE ESTIMATES
The component of the mineralization within the block model that meets the requirements for reasonable prospects of economic extraction was based on the application of the Lerchs-Grossman (LG) algorithm. The mineral resources are therefore contained within a computer-generated open pit geometry.
TABLE 14-15 COPPER WORLD COMPLEX MINERAL RESOURCE ESTIMATES
Notes:
(1) Totals may not add up correctly due to rounding.
CategotyMetric tonnes
(in million)
Short tons
(in million)Cu% Soluble Cu%
Mo
g/tonne
Mo (Troy oz
per ton)
Ag
g/tonne
Ag (Troy oz
per ton)
Measured 687 757 0.45 0.05 138 4.02 5.1 0.15
Indicated 287 316 0.36 0.06 134 3.90 3.6 0.11
M+I 973 1,073 0.42 0.05 137 3.99 4.6 0.14
Inferred 210 232 0.36 0.05 119 3.48 3.9 0.11
Measured 105 116 0.37 0.26
Indicated 94 104 0.35 0.26
M+I 200 220 0.36 0.26
Inferred 52 57 0.40 0.29
(1) Totals may not add up correctly due to rounding.
(2) Mineral resources are estimated as of 01st of May 2022.
(3) Tons and grades constraint to a Lerch Grossman revenue factor 1 pit shell.
(4) Using a 0.1% copper cutoff grade and an oxidation ratio lower than 50% for flotation material.
(5) Using a 0.1% soluble copper cutoff grade and an oxidation ratio higher than 50% for leach material.
(6) Mineral resources are not mineral reserves as they do not have demonstrated economic viability.
Flotation
material
Leach
material
Legend = Measured = Indicated = Inferred
Preliminary Economic Assessment Copper World Complex, Pima County, Arizona USA
Page 14-120
(2) Mineral resources are estimated as of May 01, 2022.
(3) Tonns and grades constrained to a Lerch Grossman pit shell with a revenue factor of 1.0 using a copper price of $3.45/lb. (4) Using a 0.1% copper cut-off grade and an oxidation ratio lower than 50% for flotation material.
(5) Using a 0.1% soluble copper cut-off grade and an oxidation ratio higher than 50% for leach material.
(6) Imperial units highlighted in grey.
(7) This mineral resource estimate does not account for marginal amounts of historical small-scale operations in the area that occurred between
1870and 1970 and is estimated to have extracted approximately 200,000 tonnes, which is within rounding approximations of the current resource estimates.
(8) Mineral resources are not mineral reserves as they do not have demonstrated economic viability.
14.17 CONCLUSION
The mineral resource estimation is well-constrained by three-dimensional wireframes representing geologically realistic volumes of mineralization. Exploratory data analysis and an external review by Golder has demonstrated that the wireframes are suitable domains for mineral resource estimation. Grade estimation has been performed using an interpolation plan designed to minimize bias and over-smoothing has been addressed in order to estimate the correct tonnes and grades of the deposits.
Mineral resources are constrained and reported using economic and technical criteria such that the mineral resource has reasonable prospects of economic extraction. The estimated mineral resources for the Project conform to the requirements of 2014 CIM Definition Standards – and NI 43-101.
14.18 RECOMMENDATIONS
The author recommends that Hudbay perform the following actions in order to transition from PEA to PFS level study:
1) Pulps rejects from Augusta and Hudbay drilling campaigns should be dispatched to an accredited laboratory and assayed for gold in order to interpolate the gold grade at the East deposit.
2) A high-resolution topographic survey covering the full extent of the property should be acquired.
Preliminary Economic Assessment Copper World Complex, Pima County, Arizona USA
Page 15-121
15. MINERAL RESERVES
There are no current mineral reserve estimates for the Project.
Preliminary Economic Assessment Copper World Complex, Pima County, Arizona USA
Page 16-122
16. MINING METHODS
16.1 MINE OVERVIEW
The mine will be a traditional open pit shovel and truck operation with bench heights of 50 and 100 foot, and 255-ton capacity haul trucks for material and waste movement.
Mining operations will use large-scale mine equipment including: 10-5/8-in. diameter rotary blast hole drills, 44 yd3 class hydraulic shovel, 36 yd3 front-end loader, and 255-ton capacity off-highway haul trucks.
The Peach-Elgin, Broadtop Butte and West pits will measure 5,600 ft on average in diameters with an average depth of 520ft while the East final pit size will measure approximately 8,200 ft in diameter and have a depth of approximately 2,250 ft. Other facilities that support the project are the Process Plants, Leach Pad, Waste Rock Facility (WRF) and Tailings Storage Facility (TSF).
The mining sequence follows a two-phase approach, where the first phase considers the exploitation of the pits within requiring only state and local permits of operation for 16 years (plus one year of pre-stripping). During this period, all waste, tailings and leach pads are disposed within the limits of Hudbay’s private land properties. After this first phase, it is assumed that all necessary permits have been obtained in order to mine and deposit tailings and waste on Federal lands.
The mine production plan contains 1,486 million tons of mill and ROM leach feed and approximately 2,437 million tons of waste, yielding a life of mine stripping ratio of 1.64 (including pre-stripping material). The mine has a 45-year life (including one-year of pre-stripping), with economic material to be delivered to both, a processing flotation plant, and a leach pad facility, based on the highest net value of the two potential processing routes. Mine operations are scheduled for 24 hours per day, 365 days per year. Annual throughput at the mill facility will begin with 19.4 million tons (53,000 tpd) the first year, achieving 21.9 million tons per year for the next 15 years, i.e. Phase I of the mining sequence. During Phase II, beginning in year 17, the annual throughput will ramp up to 25.5 million tons (70,000 tpd), and in the subsequent years will reach 32.85 million tons (90,000 tpd). The ROM leach annual production is planned to achieve 7.3 million tons (20,000 tpd) for about 33 years, and the remaining years at variable rate, depending on the availability of oxide and mixed material suitable for leaching.
During the first phase of the mining activity (from pre-stripping to year 16), the planned annual mining rate is approximately 65.0 million tons. During Phase II, the annual mining rate reaches a maximum of 122.6 million tons in order to sustain the increased mill throughput.
The final configuration of the proposed pits and associated facilities for waste rock (WRF), tailings (TSF) and leach pads (HLP) are illustrated on Figure 16-1 at the end of Phase I and on Figure 16-2 at the end of Phase II.

Preliminary Economic Assessment Copper World Complex, Pima County, Arizona USA
Page 16-123
FIGURE 16-1: PROJECT MINE PLAN SITE LAYOUT AT THE END OF PHASE I
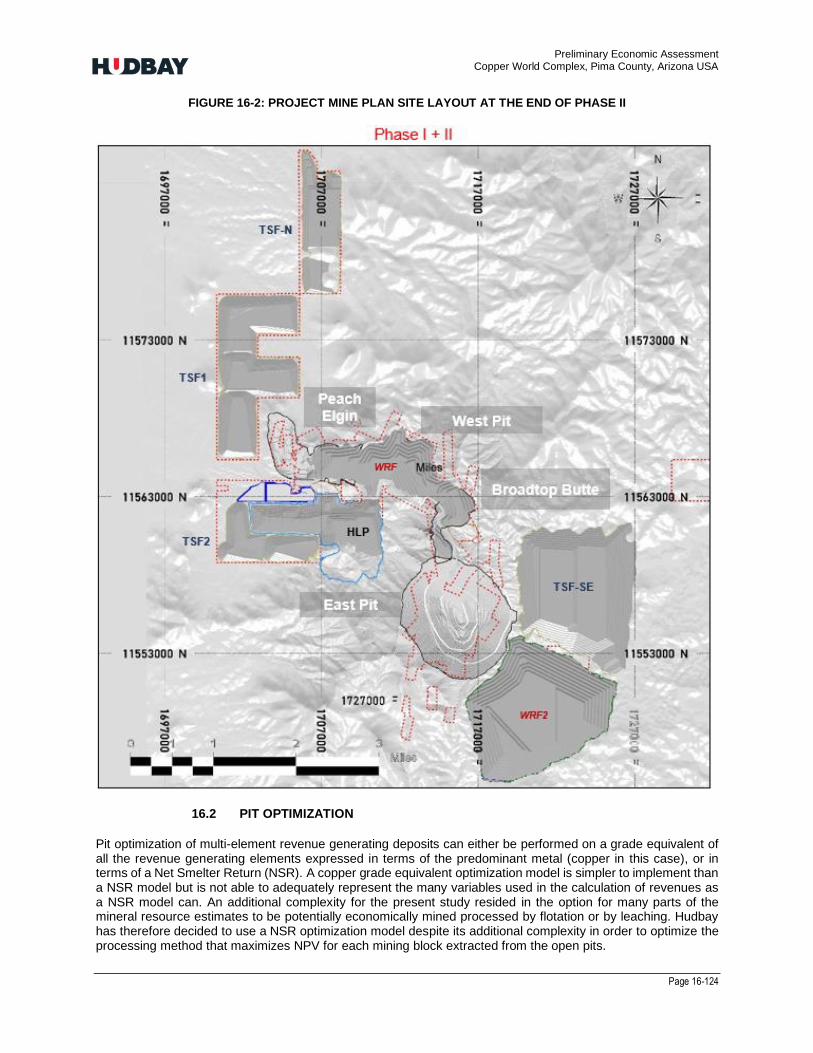
Preliminary Economic Assessment Copper World Complex, Pima County, Arizona USA
Page 16-124
FIGURE 16-2: PROJECT MINE PLAN SITE LAYOUT AT THE END OF PHASE II
16.2 PIT OPTIMIZATION
Pit optimization of multi-element revenue generating deposits can either be performed on a grade equivalent of all the revenue generating elements expressed in terms of the predominant metal (copper in this case), or in terms of a Net Smelter Return (NSR). A copper grade equivalent optimization model is simpler to implement than a NSR model but is not able to adequately represent the many variables used in the calculation of revenues as a NSR model can. An additional complexity for the present study resided in the option for many parts of the mineral resource estimates to be potentially economically mined processed by flotation or by leaching. Hudbay has therefore decided to use a NSR optimization model despite its additional complexity in order to optimize the processing method that maximizes NPV for each mining block extracted from the open pits.

Preliminary Economic Assessment Copper World Complex, Pima County, Arizona USA
Page 16-125
16.3 ECONOMIC PARAMETERS
Lerchs-Grossmann (LG) analyses were conducted using a combined resource model of all the deposits to determine the ultimate pit limits and best extraction sequence. Figure 16-1 summarizes some of the most important economic parameters and offsite costs used in the base-case LG runs. The assumed process plant recoveries for Lerchs-Grossmann evaluations are detailed in section 17 and more details on the final economic criteria used for mine planning can be found in Section 22.
TABLE 16-1: LERCHS-GROSSMAN ECONOMIC PARAMETERS
Parameter Unit Value
Metal price
Copper $/lb 3.45
Molybdenum $/lb 11.0
Silver $/oz 20.0
Mining Cost $/ton mined 1.20
Incremental Cost by bench (down) $/ton mined 0.010
Royalties
Royalties % of NSR 3.0%
FLOTATION COSTS
G&A Cost $/ton milled 1.00
Process Cost $/ton milled 4.70
ROM LEACH COSTS
Heap & SX/EW costs $/lb Cu 0.50
G&A Cost
$/ton of resource 0.55
Process Cost
Hauling $/ton of resource 0.70
Leaching* $/ton of resource 1.60
*: the cost of acid for the leaching process was estimated as a weighted average of acid produced internally with the balance being bought at a local market price
16.4 PIT SLOPE GUIDANCE
Call and Nicholas, Inc. (CNI) completed a feasibility-level pit slope geotechnical study for the 2017 Feasibility Study (CNI, 2016) stated to supersede previous pit slope geotechnical reports. Those Pit designs assumed that the operations were not restricted to the currently proposed pit size. CNI’s report documented design recommendations for life of mine (LOM) pit slopes for a pit approximately 6,000 feet by 6,000 feet at the pit crest, and with a maximum slope height of approximately 2,900 feet. It was based on the latest available geotechnical model and data for the East deposit through 2014.
The slope design recommendations provided by CNI were reviewed and considered to be appropriate and acceptable for the East Pit.
During 2022, Wood PLC (Wood) has completed a review of the CNI report and agree that the slope design recommendations appear to be generally reasonable and the rock mass characterization, slope stability analyses, conclusions and recommendations provided by CNI (2016) were used as the basis of Wood’s evaluation of the constrained East Pit. In addition, Wood developed Pre-feasibility level pit slope design recommendations for the Peach-Elgin, Broadtop Butte and Copper World pits.
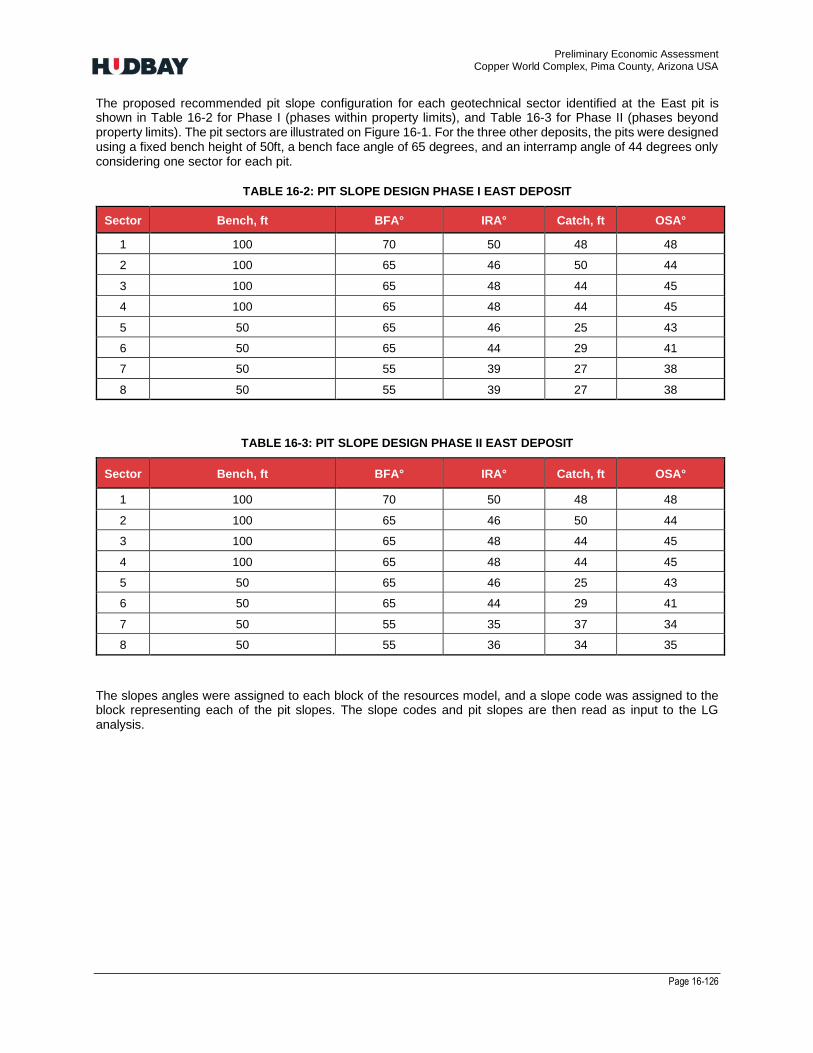
Preliminary Economic Assessment Copper World Complex, Pima County, Arizona USA
Page 16-126
The proposed recommended pit slope configuration for each geotechnical sector identified at the East pit is shown in Table 16-2 for Phase I (phases within property limits), and Table 16-3 for Phase II (phases beyond property limits). The pit sectors are illustrated on Figure 16-1. For the three other deposits, the pits were designed using a fixed bench height of 50ft, a bench face angle of 65 degrees, and an interramp angle of 44 degrees only considering one sector for each pit.
TABLE 16-2: PIT SLOPE DESIGN PHASE I EAST DEPOSIT
Sector Bench, ft BFA° IRA° Catch, ft OSA° 1 100 70 50 48 48 2 100 65 46 50 44 3 100 65 48 44 45 4 100 65 48 44 45 5 50 65 46 25 43 6 50 65 44 29 41 7 50 55 39 27 38 8 50 55 39 27 38
TABLE 16-3: PIT SLOPE DESIGN PHASE II EAST DEPOSIT
Sector Bench, ft BFA° IRA° Catch, ft OSA° 1 100 70 50 48 48 2 100 65 46 50 44 3 100 65 48 44 45 4 100 65 48 44 45 5 50 65 46 25 43 6 50 65 44 29 41 7 50 55 35 37 34 8 50 55 36 34 35
The slopes angles were assigned to each block of the resources model, and a slope code was assigned to the block representing each of the pit slopes. The slope codes and pit slopes are then read as input to the LG analysis.

Preliminary Economic Assessment Copper World Complex, Pima County, Arizona USA
Page 16-127
FIGURE 16-3: PLAN VIEW OF GEOTECHNICAL SECTORS EAST PIT
16.5 LERCHS-GROSSMANN (LG) ANALYSIS
The LG analysis was performed using the block models constructed by Hudbay as described in section 14 in combination with the economic parameters shown in Table 16-1 (for block valuation), the slope parameters shown in Table 16-2 and Table 16-3 for the East pit, fixed slope of 65 degrees for the other pits, and the original surface topography as the starting point.
Several economic analyses were developed for nested pit shells. The purpose of this assessment was to evaluate free discounted cash flow, revenue, stripping ratio, development, sustaining capital, and as guidance for internal phases, recoveries by processing route and by deposit. Figure 16-2 presents the results of the LG revenue factor sensitivity analyses. The base-case LG pit shell 17 (0.85 revenue factor) was selected as the ultimate pit for mine planning purposes (Figure 16-4).

Preliminary Economic Assessment Copper World Complex, Pima County, Arizona USA
Page 16-128
FIGURE 16-4: PROJECT PIT SHELL SENSITIVITY ANALYSIS BY REVENUE FACTOR
16.6 MINE PHASES
16.6.1 DESIGN CRITERIA
Mine phases and ultimate pit for the Project are designed for large-scale mining equipment (specifically, 44 yd3 class hydraulic shovels and 255-ton haulage trucks) and are derived from the selected LG pit shells described in the previous section. The summarized parameters used in the design of mine pit phases are presented in Table 16-4.
TABLE 16-4: PIT DESIGN PARAMETERS
Parameters East Pit Copper World Pits
Bench height 50 -100ft 50ft
Bench face angle 55 -70° 65°
Cat bench interval 25 – 50ft 28.5ft
Road width (including ditch & safety berm) 110ft 110ft
Nominal road gradient 10% 10%
Minimum pushback width 250ft 250ft
16.6.2 MINE PHASES AND ULTIMATE PIT
A total of seventeen mining phases defines the extraction sequence for the four pits. The development strategy consists of extracting the higher metal grades along with minimum strip ratios during the initial years of production, while enabling smooth transitions in waste stripping throughout the life of the mine to ensure enough exposure for a continuous mill feed. Figure 16-5 illustrates the designed phases for the various pits while Figure 16-6 to Figure 16-9 present cross sections of the mine phases highlighting the low strip ratio in the Copper World
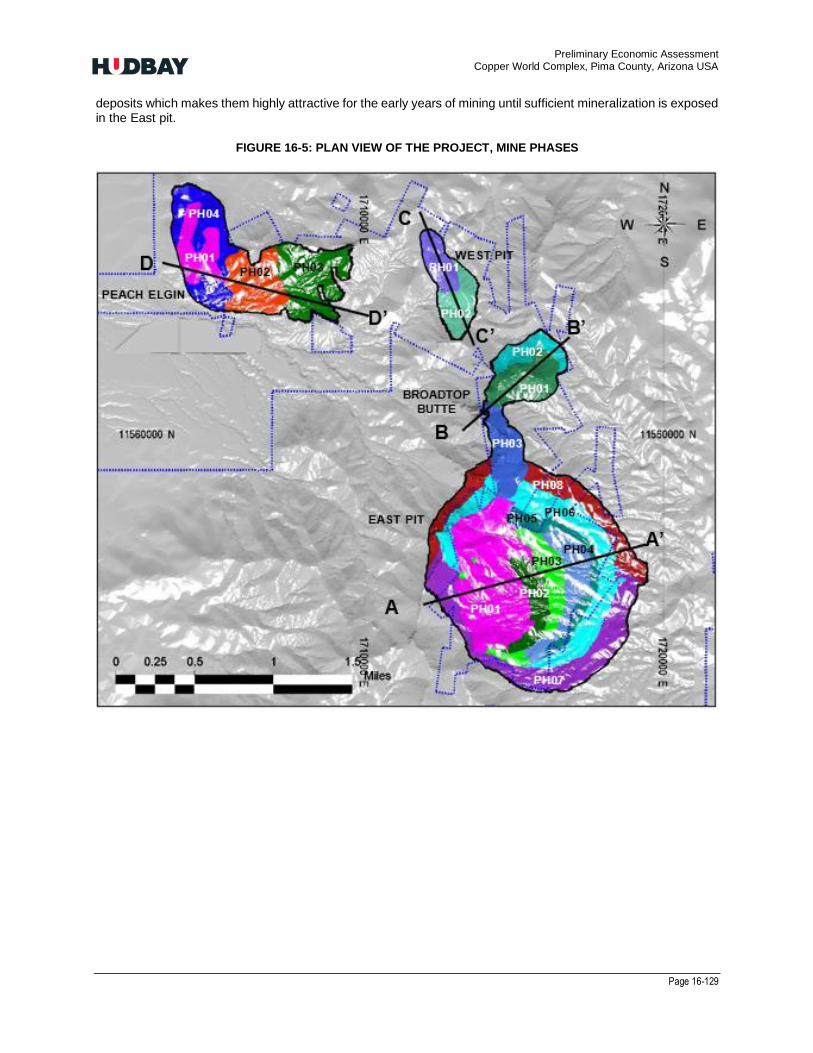
Preliminary Economic Assessment Copper World Complex, Pima County, Arizona USA
Page 16-129
deposits which makes them highly attractive for the early years of mining until sufficient mineralization is exposed in the East pit.
FIGURE 16-5: PLAN VIEW OF THE PROJECT, MINE PHASES
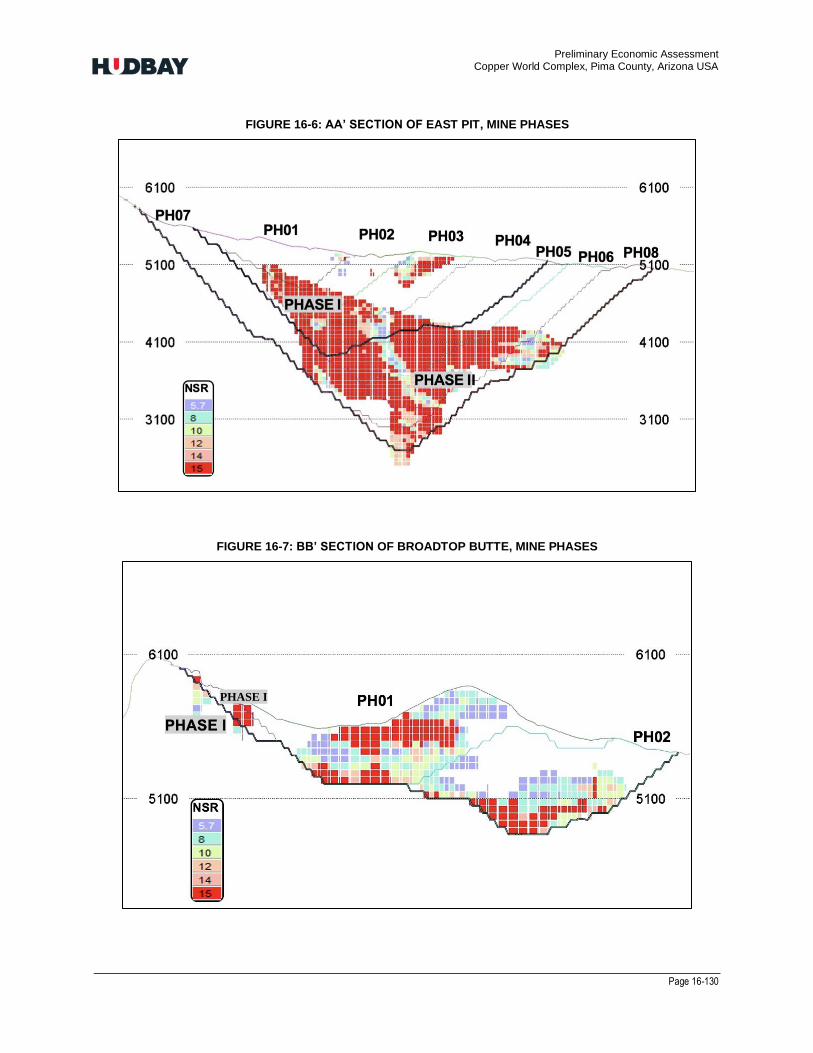
Preliminary Economic Assessment Copper World Complex, Pima County, Arizona USA
Page 16-130
FIGURE 16-6: AA’ SECTION OF EAST PIT, MINE PHASES
FIGURE 16-7: BB’ SECTION OF BROADTOP BUTTE, MINE PHASES
PHASE I

Preliminary Economic Assessment Copper World Complex, Pima County, Arizona USA
Page 16-131
FIGURE 16-8: CC’ SECTION OF WEST PIT, MINE PHASES
FIGURE 16-9: DD’ SECTION OF PEACH ELGIN, MINE PHASES
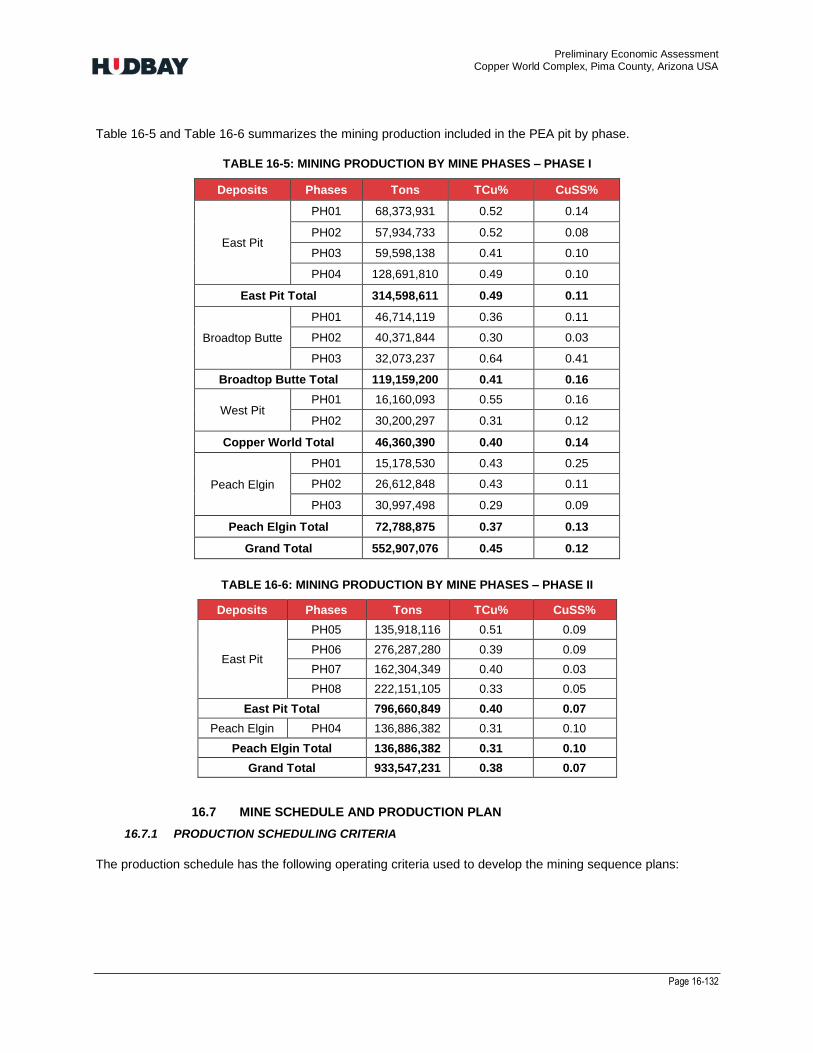
Preliminary Economic Assessment Copper World Complex, Pima County, Arizona USA
Page 16-132
Table 16-5 and Table 16-6 summarizes the mining production included in the PEA pit by phase.
TABLE 16-5: MINING PRODUCTION BY MINE PHASES – PHASE I
Deposits Phases Tons TCu% CuSS%
East Pit
PH01 68,373,931 0.52 0.14
PH02 57,934,733 0.52 0.08
PH03 59,598,138 0.41 0.10
PH04 128,691,810 0.49 0.10
East Pit Total 314,598,611 0.49 0.11
Broadtop Butte
PH01 46,714,119 0.36 0.11
PH02 40,371,844 0.30 0.03
PH03 32,073,237 0.64 0.41
Broadtop Butte Total 119,159,200 0.41 0.16
West Pit PH01 16,160,093 0.55 0.16
PH02 30,200,297 0.31 0.12
Copper World Total 46,360,390 0.40 0.14
Peach Elgin
PH01 15,178,530 0.43 0.25
PH02 26,612,848 0.43 0.11
PH03 30,997,498 0.29 0.09
Peach Elgin Total 72,788,875 0.37 0.13
Grand Total 552,907,076 0.45 0.12
TABLE 16-6: MINING PRODUCTION BY MINE PHASES – PHASE II
Deposits Phases Tons TCu% CuSS%
East Pit
PH05 135,918,116 0.51 0.09
PH06 276,287,280 0.39 0.09
PH07 162,304,349 0.40 0.03
PH08 222,151,105 0.33 0.05
East Pit Total 796,660,849 0.40 0.07
Peach Elgin PH04 136,886,382 0.31 0.10
Peach Elgin Total 136,886,382 0.31 0.10
Grand Total 933,547,231 0.38 0.07
16.7 MINE SCHEDULE AND PRODUCTION PLAN
16.7.1 PRODUCTION SCHEDULING CRITERIA
The production schedule has the following operating criteria used to develop the mining sequence plans:
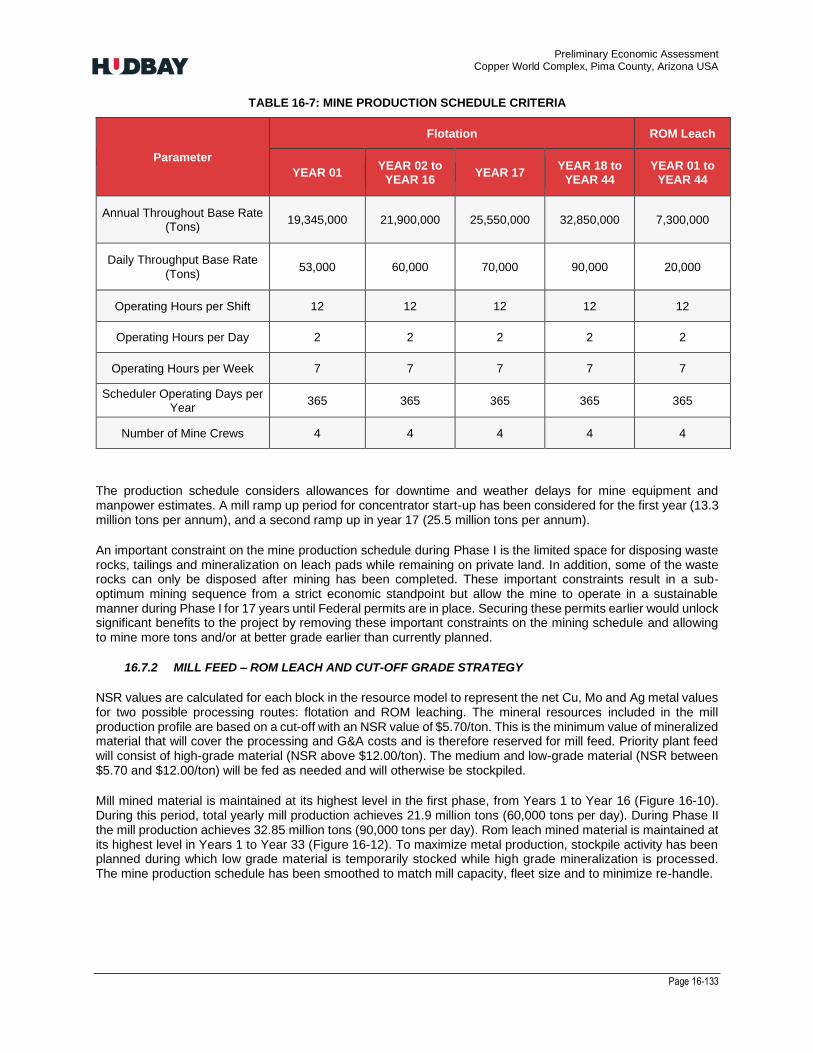
Preliminary Economic Assessment Copper World Complex, Pima County, Arizona USA
Page 16-133
TABLE 16-7: MINE PRODUCTION SCHEDULE CRITERIA
Parameter Flotation ROM Leach
YEAR 01 YEAR 02 to YEAR 16 YEAR 17 YEAR 18 to
YEAR 44 YEAR 01 to
YEAR 44
Annual Throughout Base Rate (Tons) 19,345,000 21,900,000 25,550,000 32,850,000 7,300,000
Daily Throughput Base Rate
(Tons) 53,000 60,000 70,000 90,000 20,000
Operating Hours per Shift 12 12 12 12 12
Operating Hours per Day 2 2 2 2 2
Operating Hours per Week 7 7 7 7 7 Scheduler Operating Days per
Year 365 365 365 365 365
Number of Mine Crews 4 4 4 4 4
The production schedule considers allowances for downtime and weather delays for mine equipment and manpower estimates. A mill ramp up period for concentrator start-up has been considered for the first year (13.3 million tons per annum), and a second ramp up in year 17 (25.5 million tons per annum).
An important constraint on the mine production schedule during Phase I is the limited space for disposing waste rocks, tailings and mineralization on leach pads while remaining on private land. In addition, some of the waste rocks can only be disposed after mining has been completed. These important constraints result in a sub-optimum mining sequence from a strict economic standpoint but allow the mine to operate in a sustainable manner during Phase I for 17 years until Federal permits are in place. Securing these permits earlier would unlock significant benefits to the project by removing these important constraints on the mining schedule and allowing to mine more tons and/or at better grade earlier than currently planned.
16.7.2 MILL FEED – ROM LEACH AND CUT-OFF GRADE STRATEGY
NSR values are calculated for each block in the resource model to represent the net Cu, Mo and Ag metal values for two possible processing routes: flotation and ROM leaching. The mineral resources included in the mill production profile are based on a cut-off with an NSR value of $5.70/ton. This is the minimum value of mineralized material that will cover the processing and G&A costs and is therefore reserved for mill feed. Priority plant feed will consist of high-grade material (NSR above $12.00/ton). The medium and low-grade material (NSR between $5.70 and $12.00/ton) will be fed as needed and will otherwise be stockpiled.
Mill mined material is maintained at its highest level in the first phase, from Years 1 to Year 16 (Figure 16-10). During this period, total yearly mill production achieves 21.9 million tons (60,000 tons per day). During Phase II the mill production achieves 32.85 million tons (90,000 tons per day). Rom leach mined material is maintained at its highest level in Years 1 to Year 33 (Figure 16-12). To maximize metal production, stockpile activity has been planned during which low grade material is temporarily stocked while high grade mineralization is processed. The mine production schedule has been smoothed to match mill capacity, fleet size and to minimize re-handle.

Preliminary Economic Assessment Copper World Complex, Pima County, Arizona USA
Page 16-134
FIGURE 16-10: ANNUAL MINE PLAN MOVEMENT
FIGURE 16-11: PLANT FEED MILL TONNAGES BY YEAR
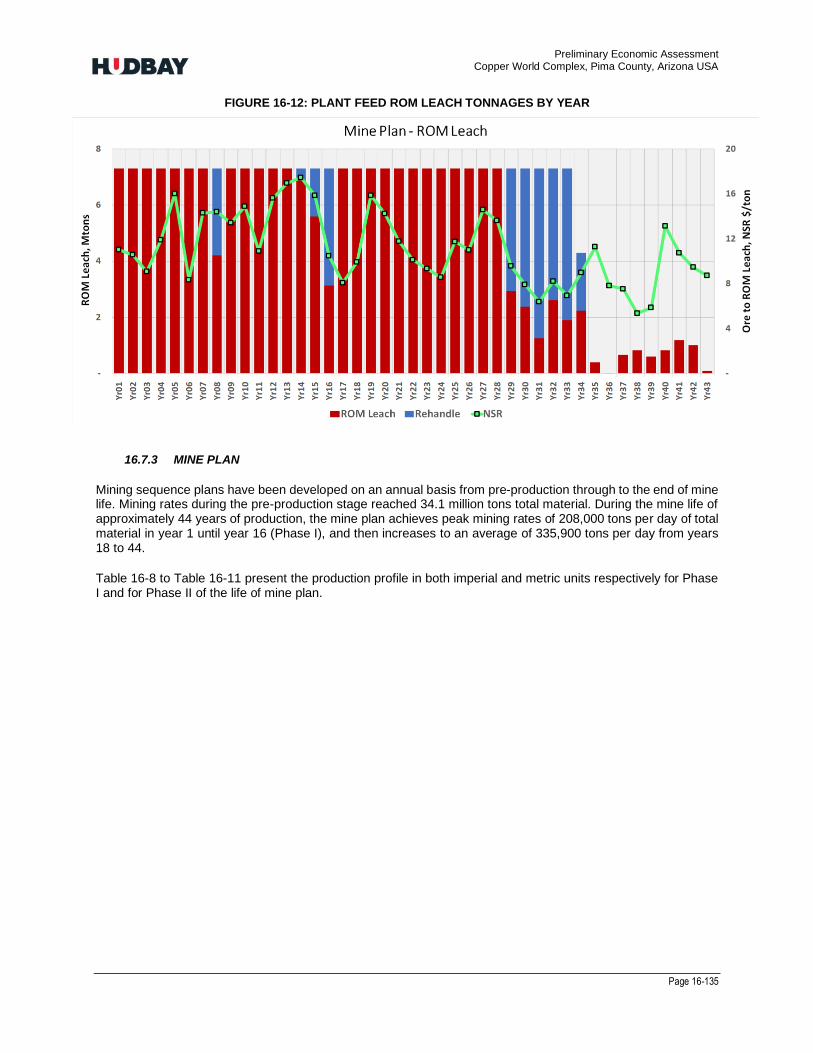
Preliminary Economic Assessment Copper World Complex, Pima County, Arizona USA
Page 16-135
FIGURE 16-12: PLANT FEED ROM LEACH TONNAGES BY YEAR
16.7.3 MINE PLAN
Mining sequence plans have been developed on an annual basis from pre-production through to the end of mine life. Mining rates during the pre-production stage reached 34.1 million tons total material. During the mine life of approximately 44 years of production, the mine plan achieves peak mining rates of 208,000 tons per day of total material in year 1 until year 16 (Phase I), and then increases to an average of 335,900 tons per day from years 18 to 44.
Table 16-8 to Table 16-11 present the production profile in both imperial and metric units respectively for Phase I and for Phase II of the life of mine plan.

Preliminary Economic Assessment Copper World Complex, Pima County, Arizona USA
Page 16-136
TABLE 16-8: PHASE I MINE PLAN (IMPERIAL UNITS)
PHASE I: PHYSICALS Unit PHASE I Y-01 Y01 Y02 Y03 Y04 Y05 Y06 Y07 Y08 Y09 Y10 Y11 Y12 Y13 Y14 Y15 Y16
Resources Mined Pre-strip
Copper World deposits 000,000 ton 238.3 23.6 26.6 29.2 28.3 23.0 19.5 3.7 10.2 12.2 8.7 10.5 7.5 8.8 4.7 9.3 12.6 0.0
East deposit 000,000 ton 247.9 - - - 1.1 11.8 7.9 24.0 19.0 13.9 20.5 23.7 21.7 20.4 24.5 19.5 14.9 25.0
Total ore mined 000,000 ton 486.2 23.6 26.6 29.2 29.4 34.8 27.3 27.7 29.2 26.1 29.2 34.2 29.2 29.2 29.2 28.8 27.5 25.0
Waste Mined Pre-strip
Copper World deposits 000,000 ton 129.8 10.6 9.9 12.1 16.8 20.4 6.9 0.9 9.9 4.0 13.8 8.6 2.5 0.7 4.6 5.4 2.8 -
East deposit 000,000 ton 474.4 - - - 11.4 14.8 35.8 41.9 33.9 42.9 30.0 30.2 41.3 43.1 39.2 38.9 42.0 29.0
Total waste mined 000,000 ton 604.2 10.6 9.9 12.1 28.2 35.2 42.7 42.8 43.8 46.9 43.8 38.8 43.8 43.8 43.8 44.2 44.8 29.0
Material Moved Pre-strip
Rehandle 000,000 ton 15.2 - - - - 2.4 1.9 1.5 - 3.1 - - - - - 0.4 1.7 4.2
Total material moved 000,000 ton 1,105.6 34.1 36.6 41.3 57.6 72.4 71.9 72.0 73.0 76.1 73.0 73.0 73.0 73.0 73.0 73.4 74.0 58.2
Strip Ratio Pre-strip
Copper World deposits X:X 0.54 0.45 0.37 0.41 0.59 0.89 0.35 0.23 0.97 0.33 1.60 0.82 0.34 0.08 0.97 0.58 0.22 -
East deposit X:X 1.91 - - - 10.77 1.25 4.55 1.75 1.79 3.09 1.46 1.27 1.90 2.11 1.60 1.99 2.82 1.16
Total strip ratio X:X 1.24 0.45 0.37 0.41 0.96 1.01 1.56 1.54 1.50 1.80 1.50 1.13 1.50 1.50 1.50 1.54 1.63 1.16
Tons Milled
Tons milled 000,000 ton 347.8 - 19.3 21.9 21.9 21.9 21.9 21.9 21.9 21.9 21.9 21.9 21.9 21.9 21.9 21.9 21.9 21.9
Headgrade - Cu % 0.47% - 0.47% 0.45% 0.45% 0.45% 0.45% 0.45% 0.56% 0.48% 0.45% 0.45% 0.45% 0.49% 0.45% 0.45% 0.45% 0.51%
Headgrade - Ag oz/ton 0.15 - 0.11 0.11 0.12 0.09 0.12 0.20 0.21 0.17 0.13 0.13 0.19 0.21 0.13 0.17 0.13 0.15
Headgrade - Mo % 0.01% - 0.01% 0.01% 0.02% 0.01% 0.01% 0.01% 0.01% 0.01% 0.01% 0.01% 0.01% 0.01% 0.01% 0.01% 0.01% 0.01%
Tons Leached
Tons leached 000,000 ton 116.8 - 7.3 7.3 7.3 7.3 7.3 7.3 7.3 7.3 7.3 7.3 7.3 7.3 7.3 7.3 7.3 7.3
Headgrade - CuSS % 0.29% - 0.24% 0.24% 0.20% 0.26% 0.36% 0.19% 0.32% 0.32% 0.30% 0.33% 0.24% 0.35% 0.38% 0.39% 0.35% 0.23%
Headgrade - Cu % 0.39% - 0.34% 0.31% 0.27% 0.36% 0.47% 0.25% 0.40% 0.42% 0.39% 0.44% 0.32% 0.46% 0.50% 0.52% 0.48% 0.31%
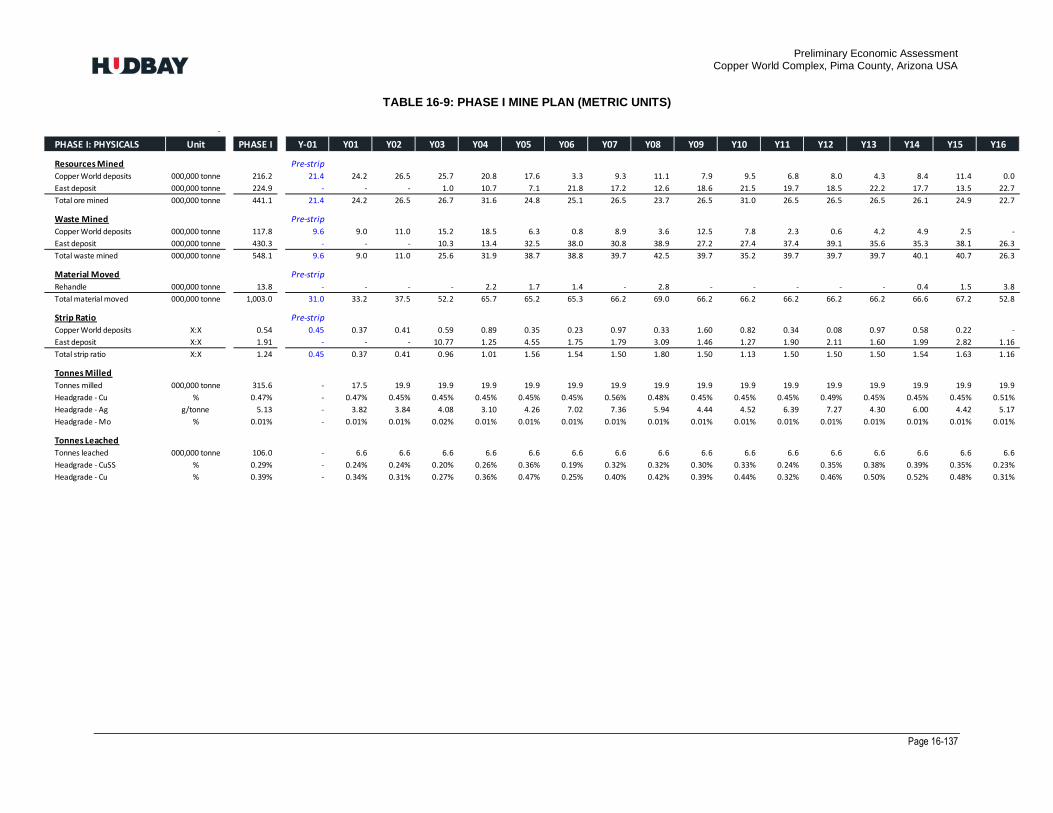
Preliminary Economic Assessment Copper World Complex, Pima County, Arizona USA
Page 16-137
TABLE 16-9: PHASE I MINE PLAN (METRIC UNITS)
-
PHASE I: PHYSICALS Unit PHASE I Y-01 Y01 Y02 Y03 Y04 Y05 Y06 Y07 Y08 Y09 Y10 Y11 Y12 Y13 Y14 Y15 Y16
Resources Mined Pre-strip
Copper World deposits 000,000 tonne 216.2 21.4 24.2 26.5 25.7 20.8 17.6 3.3 9.3 11.1 7.9 9.5 6.8 8.0 4.3 8.4 11.4 0.0
East deposit 000,000 tonne 224.9 - - - 1.0 10.7 7.1 21.8 17.2 12.6 18.6 21.5 19.7 18.5 22.2 17.7 13.5 22.7
Total ore mined 000,000 tonne 441.1 21.4 24.2 26.5 26.7 31.6 24.8 25.1 26.5 23.7 26.5 31.0 26.5 26.5 26.5 26.1 24.9 22.7
Waste Mined Pre-strip
Copper World deposits 000,000 tonne 117.8 9.6 9.0 11.0 15.2 18.5 6.3 0.8 8.9 3.6 12.5 7.8 2.3 0.6 4.2 4.9 2.5 -
East deposit 000,000 tonne 430.3 - - - 10.3 13.4 32.5 38.0 30.8 38.9 27.2 27.4 37.4 39.1 35.6 35.3 38.1 26.3
Total waste mined 000,000 tonne 548.1 9.6 9.0 11.0 25.6 31.9 38.7 38.8 39.7 42.5 39.7 35.2 39.7 39.7 39.7 40.1 40.7 26.3
Material Moved Pre-strip
Rehandle 000,000 tonne 13.8 - - - - 2.2 1.7 1.4 - 2.8 - - - - - 0.4 1.5 3.8
Total material moved 000,000 tonne 1,003.0 31.0 33.2 37.5 52.2 65.7 65.2 65.3 66.2 69.0 66.2 66.2 66.2 66.2 66.2 66.6 67.2 52.8
Strip Ratio Pre-strip
Copper World deposits X:X 0.54 0.45 0.37 0.41 0.59 0.89 0.35 0.23 0.97 0.33 1.60 0.82 0.34 0.08 0.97 0.58 0.22 -
East deposit X:X 1.91 - - - 10.77 1.25 4.55 1.75 1.79 3.09 1.46 1.27 1.90 2.11 1.60 1.99 2.82 1.16
Total strip ratio X:X 1.24 0.45 0.37 0.41 0.96 1.01 1.56 1.54 1.50 1.80 1.50 1.13 1.50 1.50 1.50 1.54 1.63 1.16
Tonnes Milled
Tonnes milled 000,000 tonne 315.6 - 17.5 19.9 19.9 19.9 19.9 19.9 19.9 19.9 19.9 19.9 19.9 19.9 19.9 19.9 19.9 19.9
Headgrade - Cu % 0.47% - 0.47% 0.45% 0.45% 0.45% 0.45% 0.45% 0.56% 0.48% 0.45% 0.45% 0.45% 0.49% 0.45% 0.45% 0.45% 0.51%
Headgrade - Ag g/tonne 5.13 - 3.82 3.84 4.08 3.10 4.26 7.02 7.36 5.94 4.44 4.52 6.39 7.27 4.30 6.00 4.42 5.17
Headgrade - Mo % 0.01% - 0.01% 0.01% 0.02% 0.01% 0.01% 0.01% 0.01% 0.01% 0.01% 0.01% 0.01% 0.01% 0.01% 0.01% 0.01% 0.01%
Tonnes Leached
Tonnes leached 000,000 tonne 106.0 - 6.6 6.6 6.6 6.6 6.6 6.6 6.6 6.6 6.6 6.6 6.6 6.6 6.6 6.6 6.6 6.6
Headgrade - CuSS % 0.29% - 0.24% 0.24% 0.20% 0.26% 0.36% 0.19% 0.32% 0.32% 0.30% 0.33% 0.24% 0.35% 0.38% 0.39% 0.35% 0.23%
Headgrade - Cu % 0.39% - 0.34% 0.31% 0.27% 0.36% 0.47% 0.25% 0.40% 0.42% 0.39% 0.44% 0.32% 0.46% 0.50% 0.52% 0.48% 0.31%
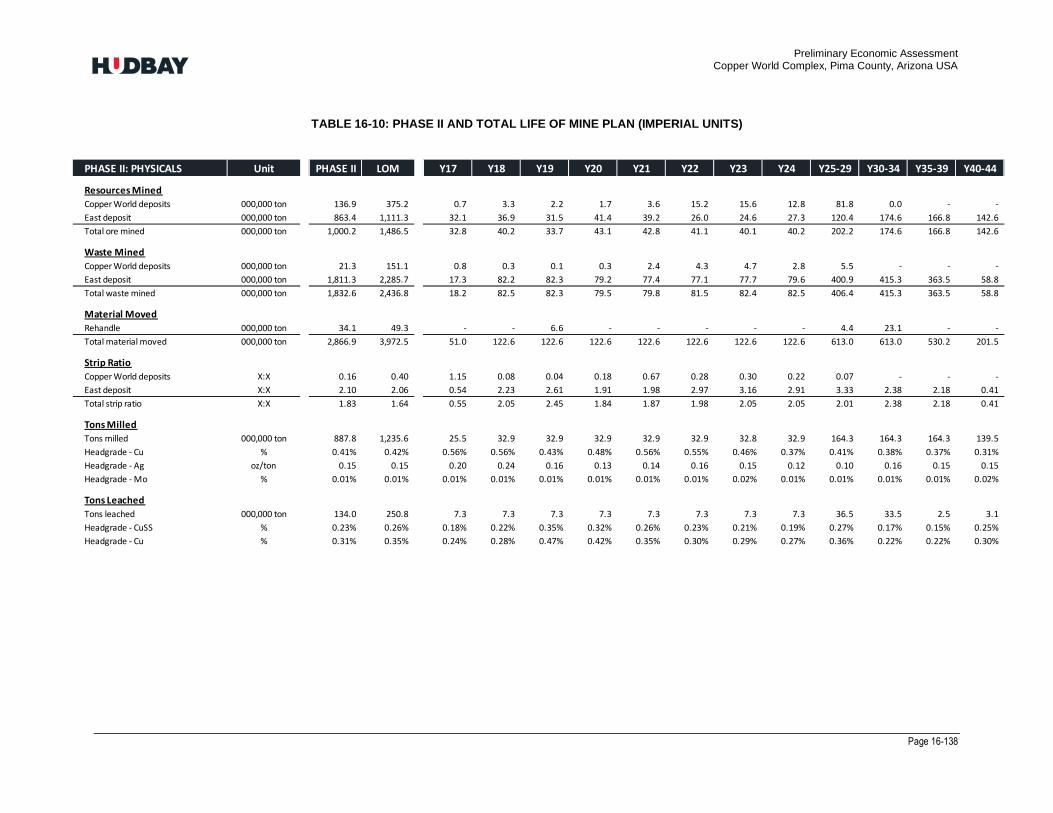
Preliminary Economic Assessment Copper World Complex, Pima County, Arizona USA
Page 16-138
TABLE 16-10: PHASE II AND TOTAL LIFE OF MINE PLAN (IMPERIAL UNITS)
PHASE II: PHYSICALS Unit PHASE II LOM Y17 Y18 Y19 Y20 Y21 Y22 Y23 Y24 Y25-29 Y30-34 Y35-39 Y40-44
Resources Mined
Copper World deposits 000,000 ton 136.9 375.2 0.7 3.3 2.2 1.7 3.6 15.2 15.6 12.8 81.8 0.0 - -
East deposit 000,000 ton 863.4 1,111.3 32.1 36.9 31.5 41.4 39.2 26.0 24.6 27.3 120.4 174.6 166.8 142.6
Total ore mined 000,000 ton 1,000.2 1,486.5 32.8 40.2 33.7 43.1 42.8 41.1 40.1 40.2 202.2 174.6 166.8 142.6
Waste Mined
Copper World deposits 000,000 ton 21.3 151.1 0.8 0.3 0.1 0.3 2.4 4.3 4.7 2.8 5.5 - - -
East deposit 000,000 ton 1,811.3 2,285.7 17.3 82.2 82.3 79.2 77.4 77.1 77.7 79.6 400.9 415.3 363.5 58.8
Total waste mined 000,000 ton 1,832.6 2,436.8 18.2 82.5 82.3 79.5 79.8 81.5 82.4 82.5 406.4 415.3 363.5 58.8
Material Moved
Rehandle 000,000 ton 34.1 49.3 - - 6.6 - - - - - 4.4 23.1 - -
Total material moved 000,000 ton 2,866.9 3,972.5 51.0 122.6 122.6 122.6 122.6 122.6 122.6 122.6 613.0 613.0 530.2 201.5
Strip Ratio
Copper World deposits X:X 0.16 0.40 1.15 0.08 0.04 0.18 0.67 0.28 0.30 0.22 0.07 - - -
East deposit X:X 2.10 2.06 0.54 2.23 2.61 1.91 1.98 2.97 3.16 2.91 3.33 2.38 2.18 0.41
Total strip ratio X:X 1.83 1.64 0.55 2.05 2.45 1.84 1.87 1.98 2.05 2.05 2.01 2.38 2.18 0.41
Tons Milled
Tons milled 000,000 ton 887.8 1,235.6 25.5 32.9 32.9 32.9 32.9 32.9 32.8 32.9 164.3 164.3 164.3 139.5
Headgrade - Cu % 0.41% 0.42% 0.56% 0.56% 0.43% 0.48% 0.56% 0.55% 0.46% 0.37% 0.41% 0.38% 0.37% 0.31%
Headgrade - Ag oz/ton 0.15 0.15 0.20 0.24 0.16 0.13 0.14 0.16 0.15 0.12 0.10 0.16 0.15 0.15
Headgrade - Mo % 0.01% 0.01% 0.01% 0.01% 0.01% 0.01% 0.01% 0.01% 0.02% 0.01% 0.01% 0.01% 0.01% 0.02%
Tons Leached
Tons leached 000,000 ton 134.0 250.8 7.3 7.3 7.3 7.3 7.3 7.3 7.3 7.3 36.5 33.5 2.5 3.1
Headgrade - CuSS % 0.23% 0.26% 0.18% 0.22% 0.35% 0.32% 0.26% 0.23% 0.21% 0.19% 0.27% 0.17% 0.15% 0.25%
Headgrade - Cu % 0.31% 0.35% 0.24% 0.28% 0.47% 0.42% 0.35% 0.30% 0.29% 0.27% 0.36% 0.22% 0.22% 0.30%
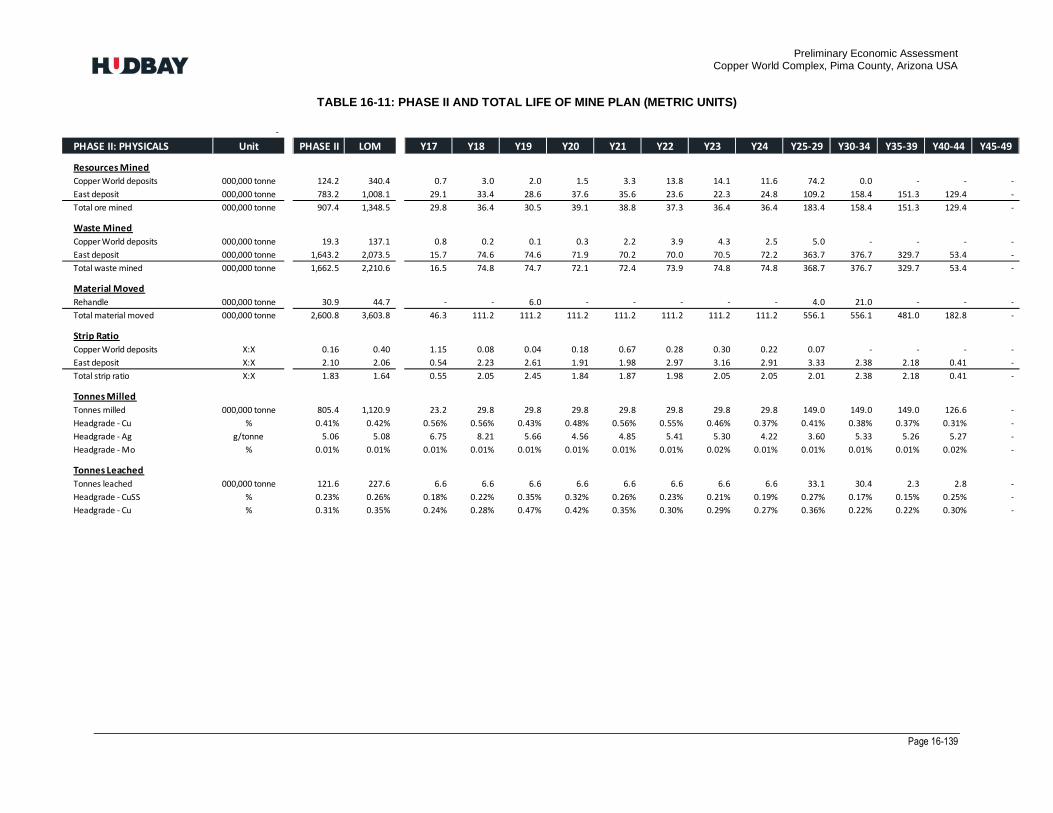
Preliminary Economic Assessment Copper World Complex, Pima County, Arizona USA
Page 16-139
TABLE 16-11: PHASE II AND TOTAL LIFE OF MINE PLAN (METRIC UNITS)
-
PHASE II: PHYSICALS Unit PHASE II LOM Y17 Y18 Y19 Y20 Y21 Y22 Y23 Y24 Y25-29 Y30-34 Y35-39 Y40-44 Y45-49
Resources Mined
Copper World deposits 000,000 tonne 124.2 340.4 0.7 3.0 2.0 1.5 3.3 13.8 14.1 11.6 74.2 0.0 - - -
East deposit 000,000 tonne 783.2 1,008.1 29.1 33.4 28.6 37.6 35.6 23.6 22.3 24.8 109.2 158.4 151.3 129.4 -
Total ore mined 000,000 tonne 907.4 1,348.5 29.8 36.4 30.5 39.1 38.8 37.3 36.4 36.4 183.4 158.4 151.3 129.4 -
Waste Mined
Copper World deposits 000,000 tonne 19.3 137.1 0.8 0.2 0.1 0.3 2.2 3.9 4.3 2.5 5.0 - - - -
East deposit 000,000 tonne 1,643.2 2,073.5 15.7 74.6 74.6 71.9 70.2 70.0 70.5 72.2 363.7 376.7 329.7 53.4 -
Total waste mined 000,000 tonne 1,662.5 2,210.6 16.5 74.8 74.7 72.1 72.4 73.9 74.8 74.8 368.7 376.7 329.7 53.4 -
Material Moved
Rehandle 000,000 tonne 30.9 44.7 - - 6.0 - - - - - 4.0 21.0 - - -
Total material moved 000,000 tonne 2,600.8 3,603.8 46.3 111.2 111.2 111.2 111.2 111.2 111.2 111.2 556.1 556.1 481.0 182.8 -
Strip Ratio
Copper World deposits X:X 0.16 0.40 1.15 0.08 0.04 0.18 0.67 0.28 0.30 0.22 0.07 - - - -
East deposit X:X 2.10 2.06 0.54 2.23 2.61 1.91 1.98 2.97 3.16 2.91 3.33 2.38 2.18 0.41 -
Total strip ratio X:X 1.83 1.64 0.55 2.05 2.45 1.84 1.87 1.98 2.05 2.05 2.01 2.38 2.18 0.41 -
Tonnes Milled
Tonnes milled 000,000 tonne 805.4 1,120.9 23.2 29.8 29.8 29.8 29.8 29.8 29.8 29.8 149.0 149.0 149.0 126.6 -
Headgrade - Cu % 0.41% 0.42% 0.56% 0.56% 0.43% 0.48% 0.56% 0.55% 0.46% 0.37% 0.41% 0.38% 0.37% 0.31% -
Headgrade - Ag g/tonne 5.06 5.08 6.75 8.21 5.66 4.56 4.85 5.41 5.30 4.22 3.60 5.33 5.26 5.27 -
Headgrade - Mo % 0.01% 0.01% 0.01% 0.01% 0.01% 0.01% 0.01% 0.01% 0.02% 0.01% 0.01% 0.01% 0.01% 0.02% -
Tonnes Leached
Tonnes leached 000,000 tonne 121.6 227.6 6.6 6.6 6.6 6.6 6.6 6.6 6.6 6.6 33.1 30.4 2.3 2.8 -
Headgrade - CuSS % 0.23% 0.26% 0.18% 0.22% 0.35% 0.32% 0.26% 0.23% 0.21% 0.19% 0.27% 0.17% 0.15% 0.25% -
Headgrade - Cu % 0.31% 0.35% 0.24% 0.28% 0.47% 0.42% 0.35% 0.30% 0.29% 0.27% 0.36% 0.22% 0.22% 0.30% -

Preliminary Economic Assessment Copper World Complex, Pima County, Arizona USA
Page 16-140
Figure 16-13 illustrates the production profile by source of material for the life of the mine highlighting that two thirds of the production extracted from the Copper World deposits is mined during Phase I when it represents 50% of the total production. During the first 5 years (including the year of pre-stripping) 90% of the mine’s production is extracted from the Peach-Elgin, West and Broadtop Butte pits. The East pit becomes a major contributor only in year 5 of the milling and leaching operation.
FIGURE 16-13: MINE PRODUCTION FROM THE COPPER WORLD COMPLEX DEPOSITS OVER THE LIFE OF THE MINE
Figure 16-14 to Figure 16-21 illustrate the evolution of the configuration of the four pits and their associated infrastructures over the life of the mine.
0%
10%
20%
30%
40%
50%
60%
70%
80%
90%
100%
-1 1 2 3 4 5 6 7 8 9 10 11 12 13 14 15 16 17 18 19 20 21 22 23 24 25 26 27 28 29 30
% M
ine
d P
rod
uctio
n
Year
Peach Elgin West Broadtop Bolsa East
Peach, Elgin, West and
Broadtop deposits contribute
~90% of mined production for
the first five years (-1 to 4)
Peach Phase 4
Phase I Phase II
~50% of mined production during
Phase I is from Peach, Elgin, West,
Broadtop and Bolsa
East deposit
contributes 100%
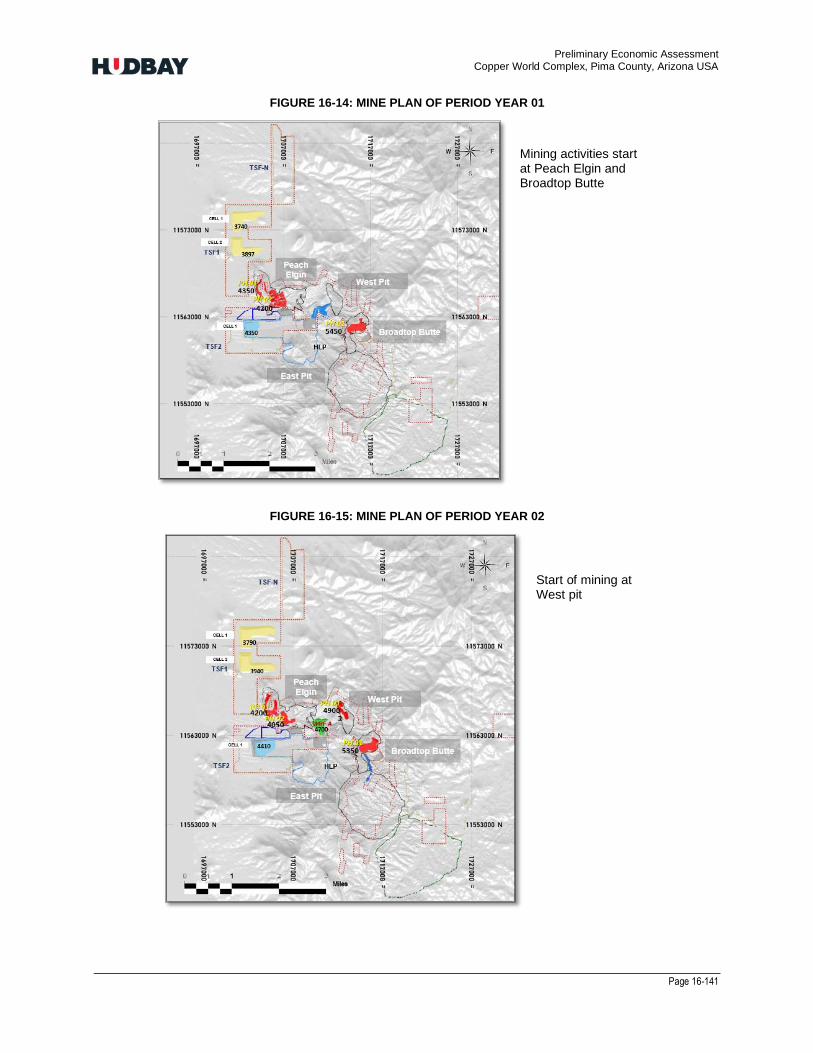
Preliminary Economic Assessment Copper World Complex, Pima County, Arizona USA
Page 16-141
FIGURE 16-14: MINE PLAN OF PERIOD YEAR 01
FIGURE 16-15: MINE PLAN OF PERIOD YEAR 02
Mining activities start at Peach Elgin and Broadtop Butte
Start of mining at West pit
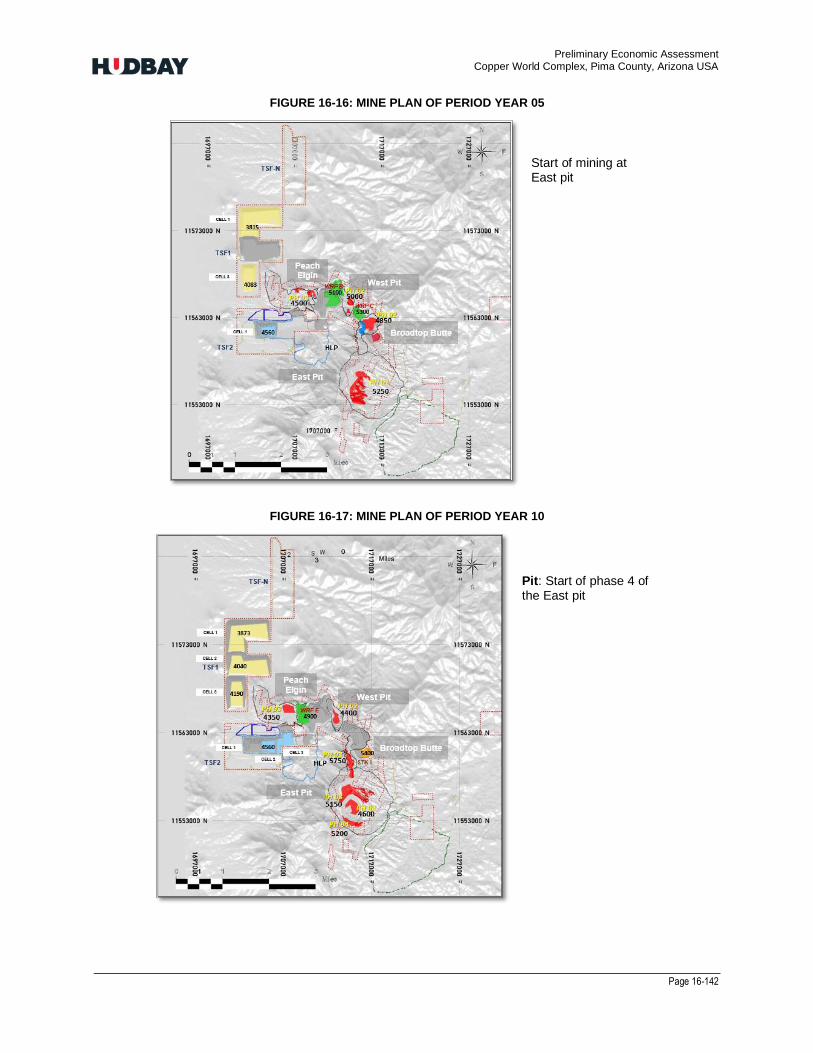
Preliminary Economic Assessment Copper World Complex, Pima County, Arizona USA
Page 16-142
FIGURE 16-16: MINE PLAN OF PERIOD YEAR 05
FIGURE 16-17: MINE PLAN OF PERIOD YEAR 10
Start of mining at East pit
Pit: Start of phase 4 of the East pit
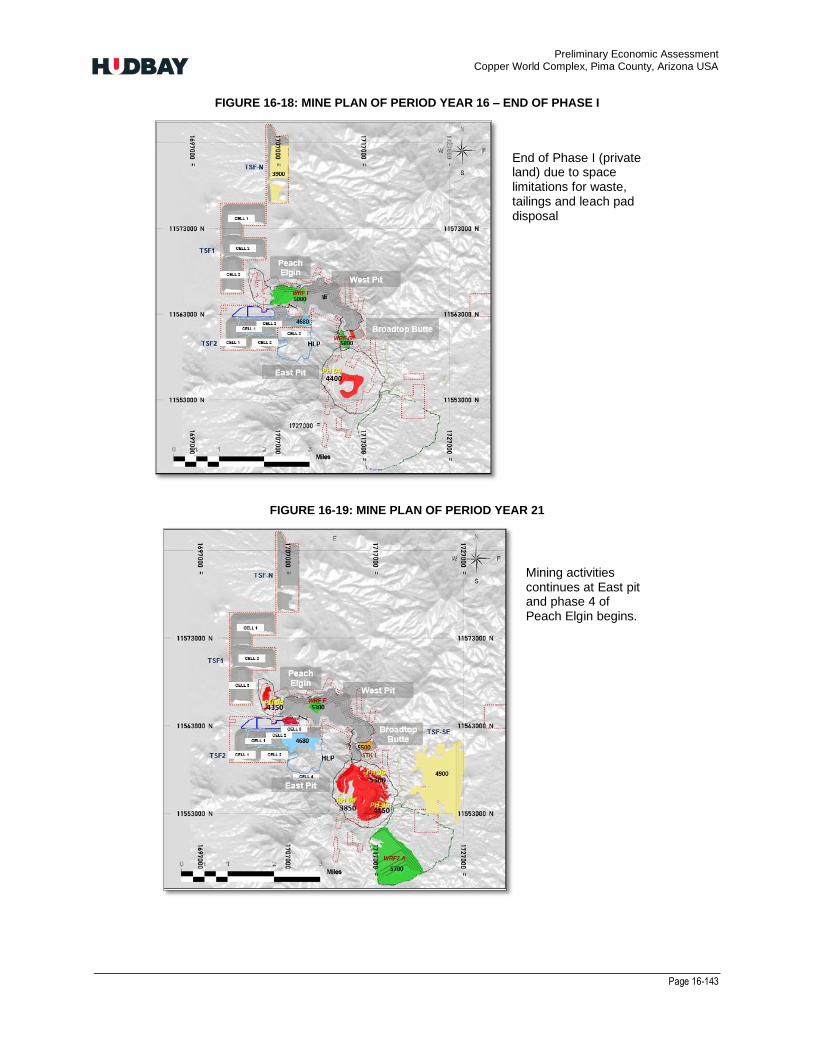
Preliminary Economic Assessment Copper World Complex, Pima County, Arizona USA
Page 16-143
FIGURE 16-18: MINE PLAN OF PERIOD YEAR 16 – END OF PHASE I
FIGURE 16-19: MINE PLAN OF PERIOD YEAR 21
End of Phase I (private land) due to space limitations for waste, tailings and leach pad disposal
Mining activities continues at East pit and phase 4 of Peach Elgin begins.

Preliminary Economic Assessment Copper World Complex, Pima County, Arizona USA
Page 16-144
FIGURE 16-20: MINE PLAN OF PERIOD YEAR 31
FIGURE 16-21: MINE PLAN FINAL CONFIGURATION (YEAR 44)
Mining activities continue from Peach Elgin, and East pit.

Preliminary Economic Assessment Copper World Complex, Pima County, Arizona USA
Page 16-145
16.8 MINE FACILITIES
16.8.1 WRF AND TSF
Overburden and other waste rock encountered in the course of mining will be placed into the WRF located to the west area of Copper World (on private land) for Phase I; and southeast of the planned East pit for Phase II. The design criteria for the WRF area and associated haul roads are summarized in Table 16-12 below. The general mine site layout is shown in Figure 16-1and Figure 16-2.
TABLE 16-12: WRF DESIGN CRITERIA
Parameter Value
Angle of Repose 37°
Average Tonnage Factor (with swell)
Overall Slope Angle
Total Height, feet
Haul Road, feet
Max Elevation, feet (AMSL)
16.02 ft3/ton
2.2H:1V
600
120
5700
The WRF loading plan will consist of haul trucks end-dumping waste rock in 100- foot lifts at the angle of repose (approximately 37°) (Figure 16-22). The WRF crests will be set back to allow simple dozing of the crests down to meet the target re-graded slope angles to support concurrent reclamation.
FIGURE 16-22: WASTE AND TAILING LOADING PLAN
16.9 MINE EQUIPMENT
16.9.1 LARGE EQUIPMENT OPERATING PARAMETER
Large mine equipment was selected based on the production requirements shown in Figure 16-22. Figure 16-23 shows the equipment requirements including the pre-production stage. The hydraulic shovels are used for stripping during mine development and will feed the crusher from the pit phases. The loader will be used in the rehandling activities and during mine phase opening activities.
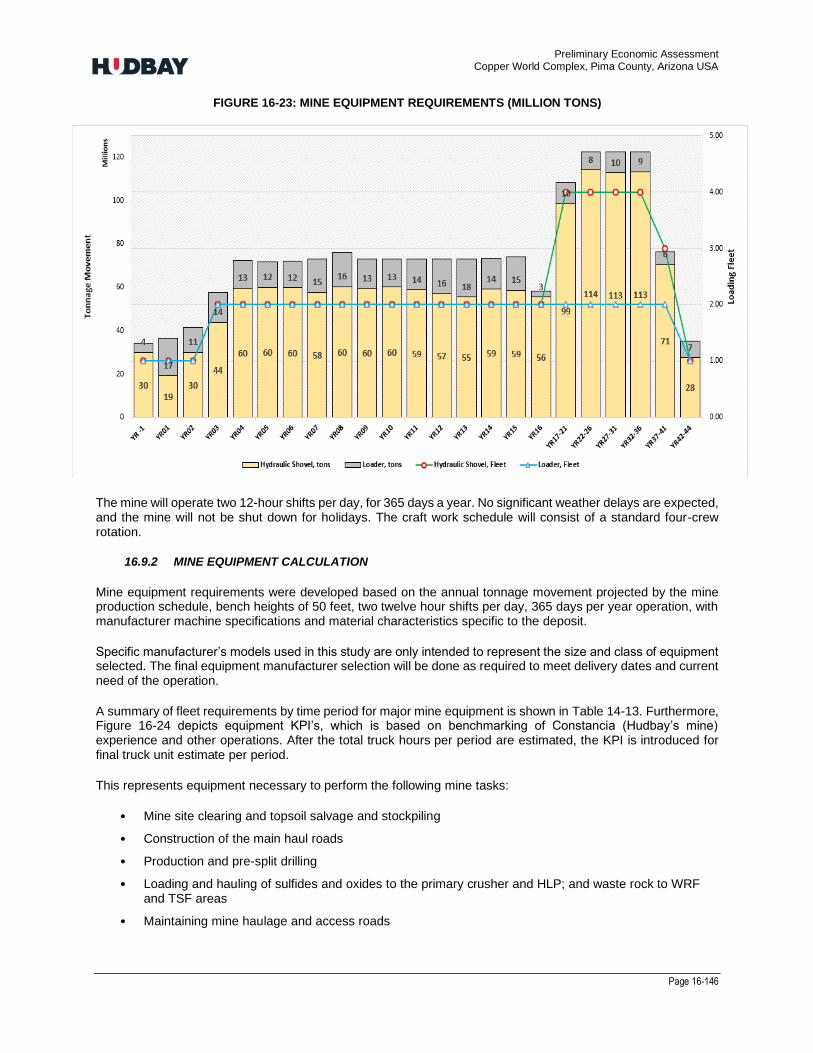
Preliminary Economic Assessment Copper World Complex, Pima County, Arizona USA
Page 16-146
FIGURE 16-23: MINE EQUIPMENT REQUIREMENTS (MILLION TONS)
The mine will operate two 12-hour shifts per day, for 365 days a year. No significant weather delays are expected, and the mine will not be shut down for holidays. The craft work schedule will consist of a standard four-crew rotation.
16.9.2 MINE EQUIPMENT CALCULATION
Mine equipment requirements were developed based on the annual tonnage movement projected by the mine production schedule, bench heights of 50 feet, two twelve hour shifts per day, 365 days per year operation, with manufacturer machine specifications and material characteristics specific to the deposit.
Specific manufacturer’s models used in this study are only intended to represent the size and class of equipment selected. The final equipment manufacturer selection will be done as required to meet delivery dates and current need of the operation.
A summary of fleet requirements by time period for major mine equipment is shown in Table 14-13. Furthermore, Figure 16-24 depicts equipment KPI’s, which is based on benchmarking of Constancia (Hudbay’s mine) experience and other operations. After the total truck hours per period are estimated, the KPI is introduced for final truck unit estimate per period.
This represents equipment necessary to perform the following mine tasks:
• Mine site clearing and topsoil salvage and stockpiling
• Construction of the main haul roads
• Production and pre-split drilling
• Loading and hauling of sulfides and oxides to the primary crusher and HLP; and waste rock to WRF and TSF areas
• Maintaining mine haulage and access roads

Preliminary Economic Assessment Copper World Complex, Pima County, Arizona USA
Page 16-147
• Maintaining WRF, TSF, berms, and re-grading of slopes and final surfaces
TABLE 16-13: MINE EQUIPMENT FLEET BY YEAR
FIGURE 16-24: HAULAGE FLEET PER YEAR
16.10 MINE OPERATIONS
16.10.1 DRILLING AND BLASTING
Controlled blasting should be assumed for all final rock slopes. Controlled blasting techniques may include trim and buffer blasting or pre-split blasting. The goal of the blast design should be to limit disturbance of the rock mass remaining in the final pit slope.
Preliminary Economic Assessment Copper World Complex, Pima County, Arizona USA
Page 16-148
16.10.2 SLOPE MONITORING
The current state of practice for slope monitoring in open pit mines in North America is based on a multi-tiered system, which may include the following:
• Visual inspections
• Theodolites (robotic or manual) and a network of survey prisms
• Mobile or fixed slope stability radar equipment
• Wire extensometers and inclinometers piezometers
Considering the proposed size of the four open pits, multiple robotic theodolites would be required to survey the pit slopes. Depending on the number of active mining fronts, two or three slope stability radar systems may also be required. This quantity of equipment is comparable to existing large open pit operations, including Hudbay’s Constancia operation.
16.10.3 LOADING
Major loading equipment consists of four 44 yd3 class hydraulic shovels and one 36 yd3 front-end loader. On average, 82% of total material movement will be handled by the hydraulic shovels and 18% by the front-end loader.
The equipment was selected to work a 50-foot bench height and load 255 ton-class trucks. For this study, the 255-ton class trucks were chosen based on economics, but the loading fleet is sized for the larger trucks to give the operator flexibility in fleet selection at a later date.
Loading 255-ton trucks with a 44 yd3 class shovel requires four passes at 35 seconds per cycle, 15 second spot and queuing for a total load time of 3.1 minutes per truck. Finally, 255-tonne trucks loaded with a 36 yd3 FEL require five passes at 40 seconds per pass, a 40-second spot time and queuing time, for total load time of 5 minutes.
Loading equipment production rates vary during equipment start up, and operator training and experience.
16.10.4 HAULING
The 255-ton class truck was chosen as best suited for the envisaged production rate. Main factors influencing the study were fuel burn, tire costs and repair costs. Truck fleet requirements vary from 8 units at the start of pre-production to 28 by year 8, the fleet remains constant to 28 units for four years. In year 12 the fleet increases to 34 units until year 15 and in year 16 requires 36 units. From year 17 to year 36 the fleet remains constant to 50 units, where starts to drop as mining production decreases.
16.10.5 SUPPORT EQUIPMENT
Major support equipment includes mine equipment that is not directly responsible for production, but which is scheduled on a regular basis to maintain in-pit and ex-pit haul roads, pit benches, WRSA and TSF and to perform miscellaneous construction work as needed. Equipment operating requirements were estimated for this equipment based on the major mine equipment support requirements. Equipment in the mine support fleet includes:
• crawler dozers,
• rubber-tire dozers,
• motor graders, and
• water trucks.

Preliminary Economic Assessment Copper World Complex, Pima County, Arizona USA
Page 16-149
In general, the rubber-tired dozers will be used in the pit to clean up around the primary loading units, with the track dozers used for haul road construction, pit development, WRSA and TF, and final re-grading requirements. The graders and water trucks will be used to maintain roads and control dust.
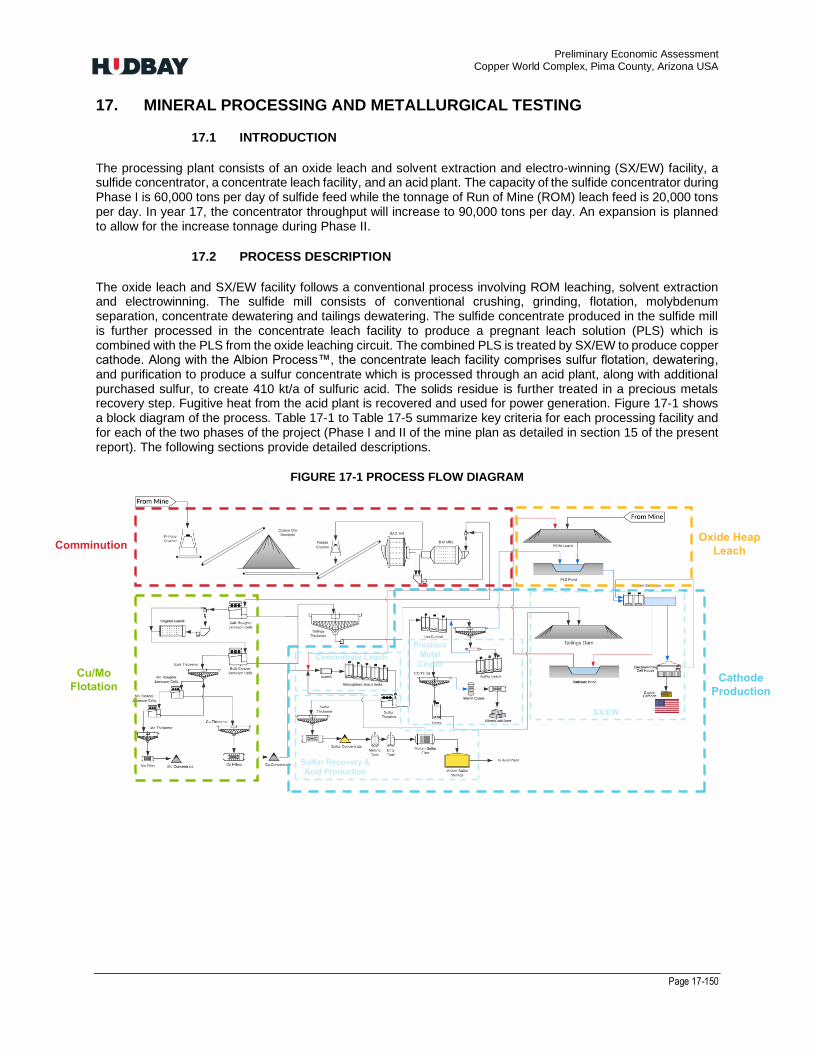
Preliminary Economic Assessment Copper World Complex, Pima County, Arizona USA
Page 17-150
17. MINERAL PROCESSING AND METALLURGICAL TESTING
17.1 INTRODUCTION
The processing plant consists of an oxide leach and solvent extraction and electro-winning (SX/EW) facility, a sulfide concentrator, a concentrate leach facility, and an acid plant. The capacity of the sulfide concentrator during Phase I is 60,000 tons per day of sulfide feed while the tonnage of Run of Mine (ROM) leach feed is 20,000 tons per day. In year 17, the concentrator throughput will increase to 90,000 tons per day. An expansion is planned to allow for the increase tonnage during Phase II.
17.2 PROCESS DESCRIPTION
The oxide leach and SX/EW facility follows a conventional process involving ROM leaching, solvent extraction and electrowinning. The sulfide mill consists of conventional crushing, grinding, flotation, molybdenum separation, concentrate dewatering and tailings dewatering. The sulfide concentrate produced in the sulfide mill is further processed in the concentrate leach facility to produce a pregnant leach solution (PLS) which is combined with the PLS from the oxide leaching circuit. The combined PLS is treated by SX/EW to produce copper cathode. Along with the Albion Process™, the concentrate leach facility comprises sulfur flotation, dewatering, and purification to produce a sulfur concentrate which is processed through an acid plant, along with additional purchased sulfur, to create 410 kt/a of sulfuric acid. The solids residue is further treated in a precious metals recovery step. Fugitive heat from the acid plant is recovered and used for power generation. Figure 17-1 shows a block diagram of the process. Table 17-1 to Table 17-5 summarize key criteria for each processing facility and for each of the two phases of the project (Phase I and II of the mine plan as detailed in section 15 of the present report). The following sections provide detailed descriptions.
FIGURE 17-1 PROCESS FLOW DIAGRAM
Oxide Heap
Leach
Cu/Mo
FlotationCathode
Production
Comminution
Concentrate Leach
Precious
Metal
Circuit
Sulfur Recovery &
Acid Production
SX/EW
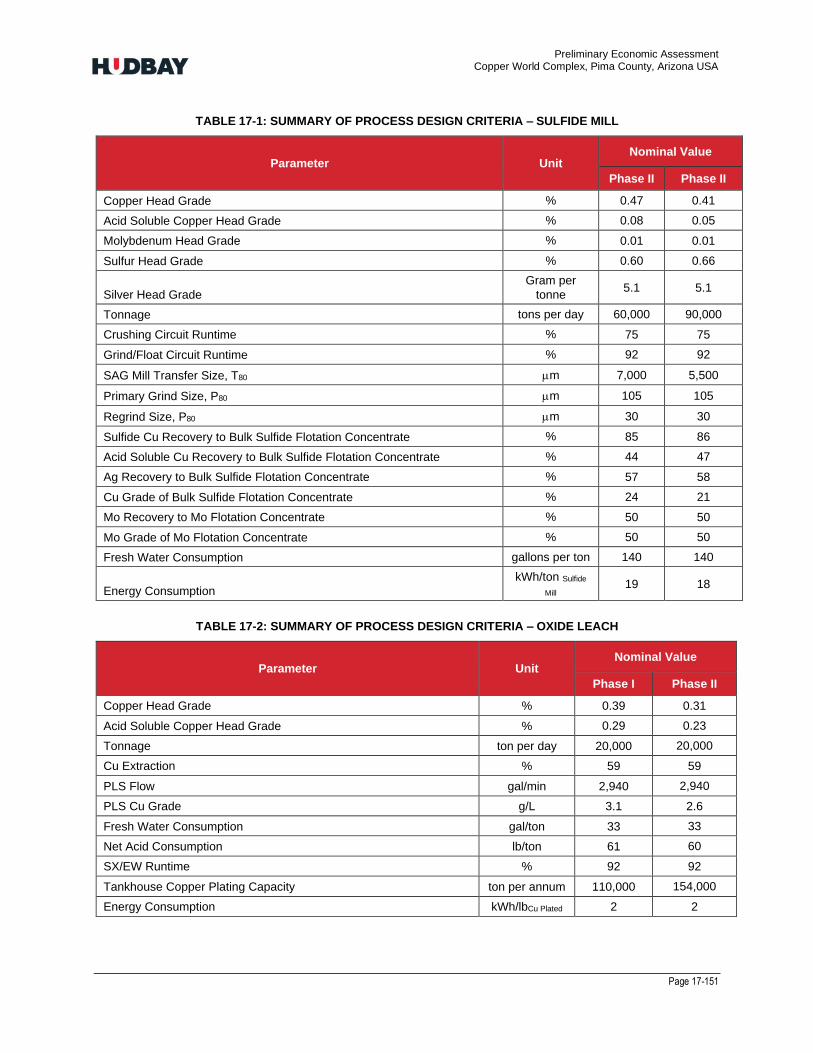
Preliminary Economic Assessment Copper World Complex, Pima County, Arizona USA
Page 17-151
TABLE 17-1: SUMMARY OF PROCESS DESIGN CRITERIA – SULFIDE MILL
Parameter Unit Nominal Value
Phase II Phase II
Copper Head Grade % 0.47 0.41
Acid Soluble Copper Head Grade % 0.08 0.05
Molybdenum Head Grade % 0.01 0.01
Sulfur Head Grade % 0.60 0.66
Silver Head Grade
Gram per
tonne 5.1 5.1
Tonnage tons per day 60,000 90,000
Crushing Circuit Runtime % 75 75
Grind/Float Circuit Runtime % 92 92
SAG Mill Transfer Size, T80 m 7,000 5,500
Primary Grind Size, P80 m 105 105
Regrind Size, P80 m 30 30
Sulfide Cu Recovery to Bulk Sulfide Flotation Concentrate % 85 86
Acid Soluble Cu Recovery to Bulk Sulfide Flotation Concentrate % 44 47
Ag Recovery to Bulk Sulfide Flotation Concentrate % 57 58
Cu Grade of Bulk Sulfide Flotation Concentrate % 24 21
Mo Recovery to Mo Flotation Concentrate % 50 50
Mo Grade of Mo Flotation Concentrate % 50 50
Fresh Water Consumption gallons per ton 140 140
Energy Consumption
kWh/ton Sulfide
Mill 19 18
TABLE 17-2: SUMMARY OF PROCESS DESIGN CRITERIA – OXIDE LEACH
Parameter Unit Nominal Value
Phase I Phase II
Copper Head Grade % 0.39 0.31
Acid Soluble Copper Head Grade % 0.29 0.23
Tonnage ton per day 20,000 20,000
Cu Extraction % 59 59
PLS Flow gal/min 2,940 2,940
PLS Cu Grade g/L 3.1 2.6
Fresh Water Consumption gal/ton 33 33
Net Acid Consumption lb/ton 61 60
SX/EW Runtime % 92 92
Tankhouse Copper Plating Capacity ton per annum 110,000 154,000
Energy Consumption kWh/lbCu Plated 2 2

Preliminary Economic Assessment Copper World Complex, Pima County, Arizona USA
Page 17-152
TABLE 17-3: SUMMARY OF PROCESS DESIGN CRITERIA – CONCENTRATE TREATMENT
Parameter Unit Nominal Value
Phase I Phase II
Tonnage Ton per day 1,100 1,650
Run Time % 92 92
Sulfide Oxidation % 70 70
Cu Recovery % 98 98
PLS Flow gal/min 790 1,230
PLS Cu Grade g/L 60 52
Energy Consumption kWh/ton Conc
Leach 82 70
TABLE 17-4: SUMMARY OF PROCESS DESIGN CRITERIA – PRECIOUS METALS PLANT
Parameter Unit Nominal Value
Phase II Phase II
Tonnage Ton per day 600 990
Run Time % 92 92
Ag Head Grade of PM plant feed Gram per
tonne 297 262
Ag Recovery % 90 90
TABLE 17-5: SUMMARY OF PROCESS DESIGN CRITERIA – ACID PLANT
Parameter Unit Nominal
Value
H2SO4 Production Capacity Ton per day 1,130
S to H2SO4 Conversion Efficiency % 98
Net Energy Production kWh/tH2SO4 186
17.3 CRUSHING
ROM sulfide feed is delivered by haul trucks to a primary crusher operating in open circuit. The nominal and design crusher feed rates for Phase I are 3,333 tph and 3,833 tph respectively, based on a crusher runtime of 75%. Trucks discharge directly into the crusher, which is set in a dump pocket designed to allow two trucks to dump simultaneously. The crusher discharges by gravity into a rail lined surge pocket. An apron feeder withdraws crushed feed from the surge pocket onto a short sacrificial conveyor. This conveyor discharges onto the sulfide stockpile feed conveyor which transports the crushed feed to the coarse material stockpile.
The coarse material stockpile has two reclaim chambers and a live capacity of 90,000 tons, equivalent to 24 hours of Phase II plant production. The sulfide stockpile is reclaimed by apron feeders which discharge onto the SAG mill feed conveyor.
The primary crusher is serviced by a fixed hydraulic crane and a rock breaker. The crushing facility is also equipped with a dust suppression system to control any dust that is generated during crushing, material loading and related operations.
Preliminary Economic Assessment Copper World Complex, Pima County, Arizona USA
Page 17-153
The Phase II expansion includes the addition of a second primary crushing line to handle the increased tonnage.
17.4 GRINDING
During Phase I, grinding is carried out using a SAG mill, two ball mills and pebble crusher in SABC-B configuration. Mill feed is drawn via the stockpile discharge feeder onto the SAG mill feed conveyor, which is equipped with a weigh scale for measuring throughput rate and an online vision system for measuring the feed size distribution. This conveyor discharges via head chute and into the SAG mill feed hopper.
The SAG mill is a 36 ft diameter by 17 ft long, grate discharge, semi-autogenous grinding mill with a 16.4 MW GMD motor. Slurry exits the mill to the SAG mill discharge screen. The discharge screen oversize is directed onto the SAG mill oversize discharge conveyor, where it is transferred to the pebble crusher feed bin. From the pebble crusher feed bin, material is fed to the pebble crusher, with the crusher product conveyed to the ball mill feed chute via the pebble crusher product conveyor.
The SAG mill circuit product is further reduced to an 80% passing size of 105 m by conventional, closed circuit ball milling. This is achieved with two 26 ft diameter by 40 ft long overflow ball mills and two cyclone packs consisting of ten 33-inch cyclones (8 online, 2 standby) each. The ball mill discharge combines with SAG mill discharge screen undersize and dilution water in the SAG mill discharge sump before being pumped to the cyclone clusters. The cyclone underflow is directed to the feed chute of the ball mill, where it combines with the pebble crusher product for further size reduction. The cyclone overflow reports to a linear trash screen for removal of woodchips and other tramp material prior to flotation. The screened cyclone overflow stream reports to a sampling station that consists of a sampling launder and an automatic sampler before reporting by gravity to the flotation circuit. The stream of woodchips and tramp plastic from the linear screen is dumped in a storage area and disposed of.
SAG mill slurry spillage is collected in a drive-in sump and then returned to process by a submersible slurry pump. The milling area is served by an overhead tower crane. Relining is achieved using a common relining machine. SAG mill grinding media is stored in a ball bunker located part-way along the mill feed belt. The bunker is served with a small spillage pump and an automatic ball charging system. Ball mill grinding media is delivered to the plant in bulk and is stored in the ball mill ball bunker. The balls are added to the ball mill feed chute via an automated ball charging system.
During Phase II, the grinding circuit will be expanded by the addition of a new grinding line. The grinding line will consist of a 10 MW SAG mill and a 10 MW ball mill operating in closed circuit with cyclones.
17.5 FLOTATION
17.5.1 BULK ROUGHER/SCAVENGER
Screened cyclone overflow serves as feed to the bulk flotation section. During Phase I, the bulk flotation circuit consists of two flotation lines each with three B8500/12 Jameson Cells. Two cells are used for roughing duty and one for scavenging. The scavenger concentrate is pumped to the 1st rougher Jameson cell and the scavenger tailings flow to the tailings dewatering circuit. Concentrate from the two rougher Jameson cells are combined and pumped to a hydrocyclone cluster. The hydrocyclone underflow is pumped to a M10000 regrind IsaMill™. The regrind mill discharge is combined with the cyclone overflow and pumped to the cleaner flotation circuit. The
target regrind size is 80% passing 30 m.
For Phase II, the flotation plant is expanded to include a third line of B8500/12 Jameson Cells to handle the additional 30,000 tons per day of mill feed. An additional regrind mill is not required as the M10000 IsaMill™ is sufficiently size for the Phase II throughput.
17.5.2 BULK CLEANERS
The reground rougher concentrate is pumped to the first of three B5400/18 Jameson cells configured in a scalper – cleaner – scavenger arrangement. The tailings from the scalper is pumped to the cleaner Jameson cell, with the tailings from this cell reporting to the scavenger cell. The scavenger concentrate returns to the cleaner

Preliminary Economic Assessment Copper World Complex, Pima County, Arizona USA
Page 17-154
Jameson cell and the scavenger tails reports to the tailings thickener, along with the rougher-scavenger tailings. The concentrate from the first two cleaner Jameson cells is combined as final Cu-Mo concentrate and pumped to the Cu-Mo concentrate thickener.
For Phase II, an additional B5400/18 Jameson scavenger cell will be added to the circuit. No other expansion of the bulk cleaner circuit will be required.
17.5.3 CU-MO SEPARATION
Underflow from the Cu-Mo concentrate thickener is pumped to a 4 m3 molybdenum rougher conditioning tank. NaHS, diesel emulsion, and CO2 are added to the conditioning tank to inhibit the flotation of copper minerals and promote the flotation of molybdenite. From the conditioning tank, slurry is pumped to a E2514/3 Jameson rougher cell. The tailings from the rougher cell are pumped to a E2514/3 Jameson scavenger cell. The scavenger tails from the copper concentrate and are pumped to the copper concentrate thickener. The scavenger concentrate is recirculated back to the rougher cell. The molybdenum rougher concentrate reports the first molybdenum cleaner conditioning tank together with the tails from the 2nd cleaner. CO2 and NaHS are added to the cleaner conditioning tank.
The molybdenum cleaner circuit consists of three stages of cleaning. Each stage utilizes a single Z1200/1 Jameson cell. From the first stage cleaner the molybdenum concentrate is pumped to the second cleaner flotation cell and the cleaner tails returned to the rougher cell. The concentrate from this cell reports to the third cleaner stage and the tailings are pumped back to the first cleaner cell. The molybdenum third cleaner tails are pumped back to the second cleaner cell and the third cleaner concentrate is the final molybdenum product which report to the molybdenum concentrate thickener.
The Cu-Mo separation plant is equipped with an online sample analyzer (OSA) and operated with nitrogen as the flotation gas. Nitrogen is fed to the plant via a main nitrogen header from the nitrogen storage tank. Conditioning tank pH is automatically controlled using CO2 gas fed from a from a CO2 storage tank and evaporator. All flotation cells, launders and feed sumps are covered and vented to a scrubber operating with dilute NaOH solution.
For Phase II of the mine plan, an additional E2514/3 Jameson rougher cell will be added to the molybdenum flotation circuit.
17.5.4 CONCENTRATE DEWATERING
Copper sulfide concentrate is pumped to the concentrate thickener sampling box and sampler before entering the copper sulfide concentrate thickener for dewatering. The thickener is equipped with rake lift, bed level detection and bed mass monitoring. Thickener overflow reports to the process water tank for recycling and underflow is pumped to the copper sulfide concentrate storage tank (or recycled to the thickener feed if of insufficient density).
Molybdenum concentrate is pumped to the molybdenum concentrate thickener-sampling box and sampler before entering the molybdenum concentrate thickener for dewatering. This thickener is also equipped with rake lift, bed level detection and bed mass monitoring. Thickener overflow reports to the process water tank for recycling, while the thickener underflow is pumped to the molybdenum concentrate storage tank (or recycled to the thickener feed if of insufficient density).
The molybdenum concentrate is pumped from the mechanically agitated storage tank to the pressure filter for dewatering. Filtrate from the pressure filter is directed to the concentrate thickener for recycling.
Molybdenum filter cake is discharged from the press via cake discharge chutes onto the cake transfer belt, which transfers cake to the rotary screw dryer. The dryer includes an indirect, diesel fired heater, inert gas blanketing system, and a wet gas scrubber. Dried concentrate is discharged to the feed hopper of a bulk bag filling station. The loaded bulk bags are auger sampled, sealed, weighed, and shipped by truck to an offtaker.

Preliminary Economic Assessment Copper World Complex, Pima County, Arizona USA
Page 17-155
Concentrate dewatering area spillage is recovered by pumping back to the respective concentrate thickener. An additional copper concentrate thickener and filter will be added when the plant is expanded to process 90,000 tons per day.
17.6 CONCENTRATE TREATMENT
17.6.1 SULFIDE LEACH
The leaching of the sulfides at low temperature consists of two steps. The first is mechanical liberation, achieved by ultrafine grinding of the sulfide concentrate using the IsaMill™ technology. The second step is chemical liberation, achieved by oxidation of the concentrate in a series of Albion Process™ leach reactors to extract copper into solution. Copper is then recovered from solution by SX/EW. The Albion Process™ was developed in 1994 by Glencore and has real world success in delivering recoveries over 99% in chalcopyrite copper concentrates. There are currently four installations in operation and two which are planned to restart in 2022. The plants treat zinc [Glencore – San Juan de Neiva, Spain (commissioned 2010); Glencore – MRM, Australia (2011); and Glencore – Nordenham, Germany (2011)], refractory gold [GeoProMining LLC – Ararat, Armenia (2014)] and copper [Glencore – MIM, Australia (2007); Jubilee Metals Group – Sable Zinc, Zambia (2018)].
The dewatered copper concentrate (and additional purchased concentrate) is pumped from the copper
concentrate storage tank to a M7500 IsaMill™ where it is ground to 80% passing 12 m. The milled concentrate is then pumped to the first of eight leach reactors operating in serial configuration with a combined residence time of 48 hours, each with a live volume of 1760 m3, where it is oxidized in an acidic oxidative leach to achieve a copper extraction of 98%. The concentrate leach plant has a design capacity of 1,870 tons per day.
Raffinate from the SX/EW plant is added to the oxidative leaching circuit with concentrated acid added as necessary to maintain an excess of about 10 g/L free acid in the output stream. Oxygen is injected into the oxidative leach reactors with the HyperSparge™ supersonic gas injectors to facilitate leaching. The oxidative leach discharge reports to sulfur flotation.
No expansion is required to the Concentrate leach plant for Phase II of the mine plan.
17.6.2 SULFUR RECOVERY
The discharge from the leaching tanks is pumped to two E1714/2 Jameson Cell to recover sulfur from the residue. The sulfur concentrate is pumped to the sulfur concentrate thickener. The thickener underflow is pumped to a belt filter, which discharges via chute to the sulfur concentrate conveyor. The filtrate is returned to the thickener. The thickener overflow is pumped to the iron control circuit along with the sulfur flotation tails.
Sulfur concentrate is conveyed to the sulfur melting tank, where it is melted prior to being filtered. The heat required to melt the sulfur is provided as waste heat from the sulfur burner. The molten sulfur filtrate is transferred to molten sulfur storage tanks and the residue reports to the precious metal recovery circuit.
17.6.3 IRON CONTROL
The sulfur flotation tails are pumped to the iron control/neutralization circuit together with the sulfur concentrate thickener overflow. Limestone is added and controlled pH precipitation is performed to remove iron, arsenic, and other deleterious dissolved elements from the leached slurry. Oxygen is injected into the neutralization reactors to convert ferrous iron to ferric prior to precipitation as goethite. The neutralization circuit consists of five reactors, each with a live volume of 400 m3. The oxidized residue is pumped to a thickener. The thickener underflow is pumped to a belt filter which discharges via chute to the oxidized residue conveyor. The filtrate is combined with the thickener overflow and pumped to the PLS pond where it is combined with PLS from the oxide heap and ROM leach and then transferred to SX/EW.
17.6.4 PRECIOUS METALS RECOVERY
The oxidized residue from the neutralization circuit is combined with the sulfur filter residue and re-pulped prior to being fed to a lime boil to decompose any silver-jarosite which may have precipitated during oxidation. From the lime boil, the slurry reports to a cyanidation circuit to leach gold and silver. The pregnant liquor and leach
Preliminary Economic Assessment Copper World Complex, Pima County, Arizona USA
Page 17-156
residue flow to solid-liquid separation and washing carried out in a countercurrent decantation (CCD) circuit. The residue is sent to tailings and the pregnant liquor to the Merrill-Crowe zinc cementation process.
From the CCD circuit the solution is clarified using leaf filters pre-coated with diatomaceous earth. Dissolved oxygen is removed from the clarified solution by passing it through a vacuum de-aeration column. Zinc dust is added to the clarified, de-aerated solution which precipitates gold and silver. The gold and silver precipitates are filtered and smelted to a doré bar.
17.7 ACID PLANT
The acid plant is a double-contact double-absorption process. Molten sulfur is pumped from the molten sulfur storage tanks to a sulfur furnace where it is mixed with high pressure air to atomize the sulfur and dry combustion air to burn it. To remove any moisture in the air prior to combustion, it is drawn in from the atmosphere by the main blower through an air filter and drying tower. In the drying tower, moisture is removed through absorption in sulfuric acid. Off-gas, containing SO2, is cooled by passing through a waste heat boiler. The SO2 is then catalytically converted to SO3 in a four-bed converter with vanadium pentoxide as the catalyst. Between each of the four converter beds, heat exchangers and economizers are used to regulate the temperature. After passing the first three converter beds the hot SO3 gas is cooled in the cold interpass exchanger and economizer before reaching the interpass adsorption tower, where it is absorbed into strong sulfuric acid. Outlet gas from the interpass tower is reheated using heat exchangers before entering the fourth converter bed, where the remaining SO2 gas is converted to SO3. The SO3 gas feeds the final absorption tower to absorb the formed SO3 into H2SO4. The acid plant has a production capacity of 1,130 tons per day of H2SO4.
Steam produced from cooling the sulfur burner is superheated and used to create electrical power in the steam turbine generator. Low-pressure steam used to start up the sulfur burner is generated by a start-up/emergency boiler. Some low-pressure steam is also extracted from the steam turbine engine to be used by the molten sulfur heating system during the acid-making process.
17.8 HEAP LEACH
ROM material is delivered directly to the leach pad using mine haul trucks and stacked in 30 ft lifts. Irrigation is provided by a drip emitter-type irrigation system designed to deliver 0.002 gallons per hour per ft2. The heap cell is placed under irrigation for a period of approximately 120 days. Pregnant leach solution (PLS) is collected from each heap cell by a series of drainpipes under the heap that transports solution to the perimeter ditches. PLS flows from the ditches to the PLS pond by gravity. The lined leach pad, collection ditch, ponds, solution pumping system, and pipelines provide full containment of operations solution.
There are two ponds included in the oxide leach area: a PLS and a raffinate pond. The PLS pond is used for recovery of PLS leaving the ROM and concentrate leach processes. The copper rich solution is sent to SX. The raffinate pond is used for containment of low copper tenor raffinate provided by SX. The PLS and raffinate ponds have a capacity of 19 ac-ft.
17.9 SOLVENT EXTRACTION AND ELECTROWINNING
From the PLS pond, PLS is pumped to the SX circuit to extract copper. During Phase I, the SX circuit consists of a single train of mixer settlers (three extraction, one washing and one stripping). In the circuit, PLS flows counter-currently through the extraction cells where it is contacted with an organic solvent. Copper is transferred from the PLS to the organic phase. The raffinate flows to the raffinate pond and the loaded organic to the loaded organic tank. Loaded organic is then pumped to the wash stage where iron is scrubbed away to reduce electrolyte iron contamination. Washed loaded organic flows into the stripping stage, where it is stripped of copper by a high-acid aqueous phase (electrolyte) and recycled back to the extraction cells. The electrolyte is pumped through electrolyte filters to the tank house where the copper is plated on stainless steel cathodes in electrowinning. Cathodes are removed from the cells with a radio-controlled overhead crane and transferred to semi-automatic robotic stripping machine. Stripped cathode blanks are returned to electrowinning and copper cathodes are bundled and stacked for shipping. In Phase II additional electrolytic cells will be added in electrowinning.
Preliminary Economic Assessment Copper World Complex, Pima County, Arizona USA
Page 17-157
17.10 TAILINGS
Conventional tailings deposition is planned for Phase I. The tailings thickening circuit consists of a tailings feed distribution box and two 164 ft diameter high compression thickeners. The rougher scavenger and the cleaner scavenger tailings are pumped to the tailings thickener feed distributor. Tailings slurry is split into two streams and directed to each thickener. Thickener overflow gravitates to the process water tank, while thickener underflow is pumped to the final tailings tank. Centrifugal pumps transfer the tailings slurry from the tailings tank to the tailings dam. Each tailings pump is served by a dedicated progressive cavity, high pressure gland service water pump pumping clean water from the clean water tank. Area spillage is returned to process by the spillage pump.
In Phase II, dry stack tailings deposition will occur. The expansion will include the addition of a third high compression thickener as well as a tailings filter plant. Thickened underflow will be pumped from the tailings thickeners to agitated filter feed tanks, before being directed to the filters. Filter cake discharges to a belt feeder which delivers filter cake to the downstream overland conveyor continuously over the full cycle time of the filter. Dried tailings are delivered to the primary or secondary stacking system. Dry tailings stacking mobile conveyors operate in series and transport tailings from the mobile tripper to the extendable mobile dry tailings stacker. During operation, the number of these conveyors required is dependent on the final tailings deposition location relative to the position of the shiftable conveyor and mobile tripper.
17.11 REAGENTS AND CONSUMABLES
17.11.1 COLLECTOR – SIBX
Sodium isobutyl xanthate (SIBX) pellets are delivered to site in 1-tonne bags and stored in the reagent storage area. Bags are added to the mixing tank via the reagent area hoist and collector loading chute. Collector is mixed to 10% solution strength within the tank, and then transferred to the storage tank, ready for distribution. The storage tank capacity and solution strength allow a batch to be mixed every 8 hours.
From the storage tank, collector solution is continuously pumped to the collector head tank which in turn overflows back to the mixing tank. Peristaltic hose pumps meter collector solution to several addition points throughout the plant.
Reagent spillage is pumped to the tailings tank for disposal on the tailings dam. The reagent area is served by a safety shower.
17.11.2 COLLECTOR – FUEL OIL
Diesel oil is delivered to the reagents area by the site fuel truck. The diesel is pumped from the truck into the reagent area diesel storage tank and distributed to the ball milling and copper-molybdenum separation circuits by dedicated peristaltic pumps.
17.11.3 FROTHER – MIBC
Liquid Methyl Isobutyl Carbinol (MIBC) is delivered to site in 1 m3 totes. As delivered (100% strength) MIBC is pumped directly to the dosing points by dedicated peristaltic pumps.
17.11.4 FLOCCULANT – MAGNAFLOC 10
Flocculant powder is delivered to site in one metric tonne bags and stored in the reagent storage area. Bags are lifted by the reagent area crane and added to the flocculant powder hopper. Powder is withdrawn by the flocculant screw feeder and blown through a venturi to a wetting head located on top of the mechanically agitated mixing tank.
From the mixing tank, mixed flocculant can be fed forward to the storage tanks or recycled back into the mixing tank to aid mixing. Once mixed, the flocculant should be left for several hours to hydrate. A storage tank provides sufficient volume for storage of flocculant while the mixed batch hydrates in the mixing tank. From the storage tank, flocculant is pumped directly to the tailings and concentrate thickeners.

Preliminary Economic Assessment Copper World Complex, Pima County, Arizona USA
Page 17-158
17.11.5 DEPRESSANT – NAHS
Sodium Hydrosulfide (NaHS) is delivered to site as a 40% solution in tanker trucks. The NaHS is off-loaded by pump transferring into the NaHS storage tanks.
17.12 PLANT SERVICES
Clean water is sourced from wells located on the western side of the Santa Rita Mountains and is pumped through a series of booster tanks and pumps to the clean water tank. From the storage tank, water is pumped around the plant for use as reagent mixing water, slurry pump gland seal water and as required for mill lubrication system cooling.
Process water is sourced from the tailings and concentrate thickener overflows and the clean water tank as required. Process water is stored in the process water pond. Process water pond pumps transfer water from the storage pond to the process water tank. Excess water in the process water tank overflows back to the process water pond.
The tailings thickener overflow streams report directly to the process water tank for immediate distribution and use. Process water pumps distribute process water to the grinding mills, copper flotation, regrind circuits.
Three separate plant air compressors provide air service throughout the plant. A filter maintains air quality. Instrument air is dried using a refrigeration drier. An air receiver is provided for compressed and instrument air lines, to allow for surges in demand.
17.13 PROCESS CONTROL STRATEGY
The process control system is an integrated plant-wide design, enabling the start-up, monitoring and control, and shutdown of equipment from the plant control rooms. Operators can control the plant via PC-based human machine interface (HMI) stations. Each HMI station provides dynamic graphical representation of the plant operation, equipment control functions, alarm displays, event logging, trending, data collection and reporting to assist in analysis of plant operations.
Where specific equipment forms part of an approved vendor package and drives are controlled from a vendor control panel, a communications interface is used to enable remote control and monitoring from the process control system. This includes digital and analogue signals for alarms; faults; instrumentation and monitoring; motor and valve control; process variables and interlock controls.
Plant instrumentation includes on-stream analyzers (OSA) that are used to continuously monitor copper, molybdenum, iron and density in key process streams and assist with optimizing concentrate grade and recovery.
Dedicated OSA systems are provided in the copper and molybdenum flotation circuits. Each OSA unit is centrally located in the respective plant and elevated to allow gravity discharge of samples to sample return pumps. Each analyzer has two 6-channel multiplexers. Sub-samples for shift composites are collected automatically.
A single particle size analyzer is installed to continuously measure the particle size of the copper regrind cyclone overflow.
A closed-circuit television (CCTV) system is used to assist control room operators in monitoring the operation of plant and equipment. The CCTV system provides real-time monitoring with archived recording for a nominal period. Camera types include fixed cameras and cameras with remote pan-tilt and/or zoom functions accessible by the control room operators.
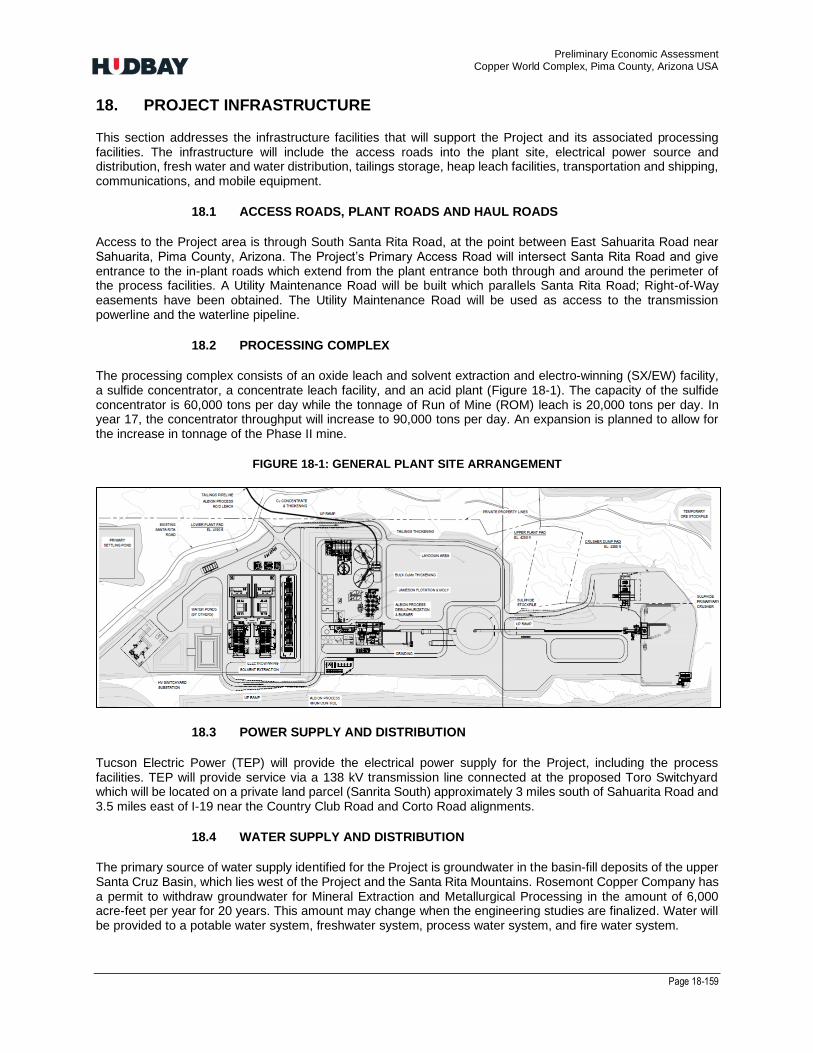
Preliminary Economic Assessment Copper World Complex, Pima County, Arizona USA
Page 18-159
18. PROJECT INFRASTRUCTURE
This section addresses the infrastructure facilities that will support the Project and its associated processing facilities. The infrastructure will include the access roads into the plant site, electrical power source and distribution, fresh water and water distribution, tailings storage, heap leach facilities, transportation and shipping, communications, and mobile equipment.
18.1 ACCESS ROADS, PLANT ROADS AND HAUL ROADS
Access to the Project area is through South Santa Rita Road, at the point between East Sahuarita Road near Sahuarita, Pima County, Arizona. The Project’s Primary Access Road will intersect Santa Rita Road and give entrance to the in-plant roads which extend from the plant entrance both through and around the perimeter of the process facilities. A Utility Maintenance Road will be built which parallels Santa Rita Road; Right-of-Way easements have been obtained. The Utility Maintenance Road will be used as access to the transmission powerline and the waterline pipeline.
18.2 PROCESSING COMPLEX
The processing complex consists of an oxide leach and solvent extraction and electro-winning (SX/EW) facility, a sulfide concentrator, a concentrate leach facility, and an acid plant (Figure 18-1). The capacity of the sulfide concentrator is 60,000 tons per day while the tonnage of Run of Mine (ROM) leach is 20,000 tons per day. In year 17, the concentrator throughput will increase to 90,000 tons per day. An expansion is planned to allow for the increase in tonnage of the Phase II mine.
FIGURE 18-1: GENERAL PLANT SITE ARRANGEMENT
18.3 POWER SUPPLY AND DISTRIBUTION
Tucson Electric Power (TEP) will provide the electrical power supply for the Project, including the process facilities. TEP will provide service via a 138 kV transmission line connected at the proposed Toro Switchyard which will be located on a private land parcel (Sanrita South) approximately 3 miles south of Sahuarita Road and 3.5 miles east of I-19 near the Country Club Road and Corto Road alignments.
18.4 WATER SUPPLY AND DISTRIBUTION
The primary source of water supply identified for the Project is groundwater in the basin-fill deposits of the upper Santa Cruz Basin, which lies west of the Project and the Santa Rita Mountains. Rosemont Copper Company has a permit to withdraw groundwater for Mineral Extraction and Metallurgical Processing in the amount of 6,000 acre-feet per year for 20 years. This amount may change when the engineering studies are finalized. Water will be provided to a potable water system, freshwater system, process water system, and fire water system.

Preliminary Economic Assessment Copper World Complex, Pima County, Arizona USA
Page 18-160
18.5 COMMUNICATIONS
High bandwidth routers and switches will be used to segment the ethernet network and to provide the ability to monitor and control traffic over the network. A voice-over Internet Protocol (VoIP) phone system will be part of the office network, and VoIP handsets will be used for voice communication. Mobile radios will be used by the mine and plant operation personnel for daily control and communications while outside the offices.
18.6 TAILINGS STORAGE FACILITY
The Project includes the construction of four Tailings Storage Facilities: TSF-1, TSF-2 and TSF-N for Phase I and TSF-E in Phase II. A conventional tailings deposition is planned for Phase I and dry stacking tailing deposition for Phase II. The dry stack tailings storage facility (TSF-E) shall be located east of the East pit and shall be constructed for Phase II of the Project as per the design criteria adopted in the 2017 Feasibility Study. (See Figure 18-2)
FIGURE 18-2: INFRASTRUCTURE ARRANGEMENTS
18.6.1 TAILINGS STORAGE FACILITY DESIGNS
The TSFs have been designed to receive tailings from the processing plant at a nominal rate of 60,000 tons per day for Phase I and for 90,000 tons per day for Phase II (Figure 18-2).
The design criteria and objectives for the TSFs for Phase I included:

Preliminary Economic Assessment Copper World Complex, Pima County, Arizona USA
Page 18-161
• Provisions storage of a minimum of 348 million tons, including TSF-1 (231 million tons), TSF-2 (47 million tons), and TSF-N (70 million tons), which is sufficient for the material to be mined and processed during the first 16 years of the mine life;
• Designs in accordance with the requirements of the Arizona Department of Environmental Quality (ADEQ) and Arizona Mining Best Available Demonstrated Control Technology (“BADCT”) Guidance Manual;
• Site-specific design criteria based on hydrological and geotechnical studies that included regional climate data, drilling, and testing programs, and laboratory characterization of subsurface and tailings samples; and
• Establishment of an effective and efficient reclamation program, with a focus on concurrent reclamation.
The tailings facility TSF-N is considered a Phase I tailings facility in the mine plan described in this report and supporting financial models. However, it is considered optional at this time and noted as such on Figure 18-2. In the current mine plan, this location would not be utilized for tailings storage until Year 14 of operations. Hudbay believes that a preferable alternative location for tailings storage can be secured by that time. For example, the federal permitting required for Phase II, which includes tailings storage on Forest Service land, may be completed by Year 14 of operations.
The tailings facilities will consist of multiple cells. For each cell, a TSF starter dam (start phase) will first be constructed using locally borrowed soil and waste rock; the main starter dam along the downgradient edge of each cell will be raised by centerline construction methods and in some areas followed by the upstream construction methods until the final dam configuration is achieved.
The subgrade areas of the TSF starter dam embankments, and the area of impoundment for the discharge control treatment, will be stripped of existing vegetation, debris, and other deleterious materials. Areas designated to receive embankment fill will be further prepared by the removal of any loose alluvial or colluvial soils. Benches will be wide enough to accommodate compaction and earth moving equipment and to allow the placement of horizontal lifts of fill.
The design criteria and objectives for the TSFs for Phase II are based on the 2017 Feasibility Study including:
• Provision of secure long-term storage of a minimum of 888 Million tons, which is sufficient for the mineral to be mined and processed during the year 17 until the end of the mine life; and
• Prevention of an airborne release of tailings solids to the environment by provision of dust suppression measures.
Advantages of the dry stacked tailings over a conventional tailings impoundment are that it eliminates the need for an engineered embankment and seepage containment system, maximizes water conservation and minimizes water makeup requirements, results in a very compact site limiting disturbance to single drainage, and allows opportunities for concurrent reclamation and provisions for dust control.
18.6.2 STABILITY ANALYSIS
Geotechnical investigations and laboratory testing were completed as part of the design process and supplemented with the historical data to form the basis of design. In addition to the field and laboratory investigation, samples of potential borrow materials were collected and tested from within the Project area for the construction of the TSFs.
PHASE I
Stability analyses were completed using critical cross-sections of the facility side slopes using the principles of limit equilibrium software assessed under static and pseudo-static conditions. Stability analyses considered the end of Phase I when the material depositions are at their respective final configurations. All factors of safety meet or exceed the minimum design criteria for static and pseudo-static loading conditions per ADEQ – BADCT guidance manual.
Preliminary Economic Assessment Copper World Complex, Pima County, Arizona USA
Page 18-162
The foundation material consists, in general, of alluvium (including GP, SP, and SW soil types), highly to completely weathered rock, and moderate to slightly weathered rock. To simplify the model assumptions and material properties, the foundation material was conservatively considered to be an alluvial/colluvial soil for the entire foundation depth evaluated, consistent with the past designs of the TSF.
To support stability analyses, steady-state seepage analyses of the critical sections were completed to assess the water and pore-water pressure conditions during the construction of the tailings dam and to evaluate dam stability at a maximum pool condition. The seepage analysis results confirmed that a phreatic surface does not develop through the embankments during all stages of construction. Based on these results, the downstream slope of the embankment is not affected by the phreatic surface. Simplified and representative piezometric surfaces were developed based on the results of seepage analysis and used for stability modeling.
PHASE II
The TSF stability analyses considered the maximum ultimate height at the maximum section through the facility for downstream and upstream stability. The tailing will be placed in a dewatered state for acceptable handleability during conveyance and trafficability of the tailing surface, which will limit susceptibility to liquefaction under dynamic loading.
Adequate factors of safety for static and pseudo-static were obtained from the stability analyses base on the selected parameters and proposed facility. The slope stability analyses performed on the outer slope indicate the dry stacking tailings operations can be constructed with overall stable slope of 3H:1V
18.7 LEACH FACILITY
The facility will be constructed to a maximum height of 430 feet. The HLP’s capacity considered for Phase I is 117 million tons, which will be increased for Phase II to approximately 251 million tons. Construction will use end dump methods with lifts of 30 feet, stacked at the angle of repose, with benching to create an overall slope of 2.3 horizontal to 1 vertical, (or 23.5 degrees). The foundation materials range from weathered rock to about 80 feet of alluvial or colluvial soils overlying weathered rock. These materials are dense and dry enough such that the possibility of liquefaction of the foundation or of the leach material is very low given the tectonic environment of the Project area (Figure 18-2).
The liner system will consist of the following BADCT components from bottom to top:
• The leach pad is proposed to be divided into several cells which will be constructed on placed and compacted (engineer-controlled) waste rock overlain with a protective layer under the Liner Bedding Material.
• Under-liner or Liner Bedding Material: A layer of geosynthetic clay liner (GCL) is currently planned. The under-liner is overlain by a geomembrane.
• The over-liner will consist of a three-foot thick layer of a well-draining material installed over the geomembrane.
Geotechnical investigations and laboratory testing were completed as part of the design process and supplemented the historical data to form the basis of design. In addition to the field and laboratory investigation, samples of potential borrow materials were collected and tested from within the Project area for the construction of the Leach pad. No risk of instability was identified as a result of this analysis.
18.8 WASTE ROCK FACILITY
The two Waste Rock Facilities (WRFs), WRF and WRF-E, will receive waste rock from the pits. WRF will be constructed on the west side area (Phase I), and WRF-E on the east side area (Phase II) of the Project. The WRF will be large enough to contain the estimated 604 million tons of waste rock generated from within the proposed limits of the Phase I pits. The WRF-E will be located east of the East Pit and will have the capacity to dispose of 1,833 million tons of waste rock generated during Phase II of the project (Figure 18-2).

Preliminary Economic Assessment Copper World Complex, Pima County, Arizona USA
Page 18-163
The WRFs will be constructed with maximum lifts of 100 ft, stacked at the angle of repose, with benching to create an overall slope of 2.2 horizontal to 1 vertical (2.2H:1V) and inter-lift slope of about 2H:1V. The foundation materials range from weathered rock to 80 ft of alluvial or colluvial soils overlying weathered rock. These materials are dense and dry enough that the possibility of liquefaction of the foundation or waste rock is very low given the tectonic environment of the Project area.
The design of the WRFs considered field and laboratory test data from the geotechnical investigation. Stability analyses were completed using critical cross-sections of the facility side slopes using the principles of limit equilibrium software assessed under static and pseudo-static conditions. Stability analyses considered the end of Phase I when the material depositions are at their respective final configurations.
18.9 SITE WATER MANAGEMENT
The site water management strategy related to the protection of the groundwater and surface water resources considered for Phase I will continue during Phase II.
18.9.1 STORMWATER MANAGEMENT FACILITIES
The stormwater management facilities will divert clean runoff from the Project site, to minimize the amount of water that must be managed or treated, via a system of designed diversion channels and collection galleries. The construction of these surface water control structures will be started during the initial construction of the Project. Diversion channels will convey water either to a natural drainage or to a stormwater collection gallery to handle runoff from 100-year, 24-hour storm event. Two stormwater ponds are proposed (HLF North Stormwater Pond and HLF South Stormwater Pond). The two stormwater ponds will be single-lined since these will primarily be for stormwater and/or contain process solutions for a short period of time during upset conditions.
18.9.2 TAILINGS STORAGE WATER MANAGEMENT
Stormwater management will be required prior to the start of the TSFs construction, it will include stormwater collection galleries and stormwater diversions. To ensure the stormwater and seepage from the TSFs are not mixed in the stormwater collection galleries, the stormwater collection gallery side that is adjacent to the TSFs in both the upstream and downstream galleries will be lined with an 80-mil geomembrane.
For the conventional impoundment design (Phase I), seepage within the TSFs will be collected in an underdrain collection system that will report flow to several seepage collection trenches located at the downgradient toe of the TSFs. Solution captured in the seepage collection trenches will be pumped to the Primary Settling Pond and recycled into the process.
The tailings storage facility constructed during Phase II of the Project, on the east side of the Santa Rita Mountains, will be dry stack tailings. The facility will receive dewatered tailings from the tailings filter plant. This material will be stacked behind a containment buttress constructed of waste rock. Stormwater run-on and run-off controls will be constructed and stormwater ponding on the surface of the dry stack will be limited during operations
18.9.3 LEACH WATER MANAGEMENT
The Leach Facility (HLP) will operate as a closed system with process solutions contained within the leach pad and the pregnant leach solution (PLS) pond. The PLS pond has been designed to contain 24 hours of drain down from the HLP in the event of pump failure, and the precipitation from a 100-year, 24-hour storm event. Stormwater contacting materials stacked on the leach pad either infiltrate through the heap materials and associated drainage system to the PLS Pond or are collected from side slope runoff in-lined perimeter channels and routed to one of two HLF Stormwater Ponds. An overflow channel also connects the PLS Pond to the Stormwater Ponds.
18.9.4 WASTE ROCK WATER MANAGEMENT
The waste rock material has been identified as non-acid generating (NAG) material and therefore does not pose a threat for the formation of acid mine drainage. During the first year of the construction, the waste rock material will be placed within the footprint of the HLF, process area, and will be used for road construction. During the

Preliminary Economic Assessment Copper World Complex, Pima County, Arizona USA
Page 18-164
operation, waste rock material will also be used to backfill three satellites pits: Elgin, West, and Broadtop Butte. The waste rock facilities will be constructed with a slight grade to promote runoff from the top and benches and the compacted surface will also promote runoff. Runoff will be conveyed by benches to a low point in the natural topography, where stormwater runoff will be collected in a temporary or permanent WRF sediment basin; and a small amount of runoff will flow into the pits to be recovered into the existing pits water management system.
18.10 MINE INFRASTRUCTURES
The mine infrastructures associated with the Project include:
• Mine Office Building: will consist of a modular building for mine staff, including open and private offices, a conference room, a copy/print room, a break room, and restrooms.
• Explosive Magazine: will consist of an enclosed building constructed on concrete pads or self-container units specifically designed for explosives storage.
• Truck Shop: activities carried out at the truck shop will consist of preventive maintenance and corrective maintenance. Major components will be removed and installed but repaired off-site. The truck shop will be an enclosed steel building constructed on a concrete pad to eliminate any possibility of discharge.
• Heavy Equipment Fuel Storage and Dispensing: will consist of storage tanks and associated pipelines located within a concrete secondary containment structure.
• Light Vehicle Fuel Station: will consist of storage tanks and associated pipelines within a concrete secondary containment structure.
• Truck Wash: will consist of an open concrete pad and will design so that all fluids will be recirculated. Water storage (tanks) will be used to hold recycled water for the facility.
• Lube Bay: will be an enclosed steel building constructed on a concrete pad. A tank farm for the various lubrication oils and antifreeze, as well as used oil and used antifreeze, will be located adjacent to the Lube Bay.

Preliminary Economic Assessment Copper World Complex, Pima County, Arizona USA
Page 19-165
19. MARKETING
The Qualified Person of this report has reviewed the studies and analysis summarized in this section and confirms that they support the assumption used in the economic analysis.
19.1 COPPER METAL
Global copper market fundamentals are expected to be strong starting in the medium term, with a structural deficit emerging. Global mine production, and ultimately smelter production, will struggle to keep pace with metal demand boosted by the megatrend of the green energy revolution (Figure 19-1 and Figure 19-2).
From a regional perspective, the US is expected to remain a net copper metal importer. Due to the presence of smelters and SX/EW production, the Arizona/Utah region will be an important domestic source of metal. Potential new projects will be a source of incremental regional production. This regional supply will be required to partially satisfy growing US metal demand related to a trend toward reshoring of American manufacturing capacity.
From a logistics perspective, copper metal produced at Copper World will be trucked to a regional transload facility where it will be transferred to rail for customers in the midwestern, United States and potentially Texas.
It is assumed that Copper World will produce a generic copper cathode quality, that will secure a premium of US 1 cent/lb Cu on a FOB mine basis.
FIGURE 19-1: GLOBAL COPPER MARKET FUNDAMENTALS
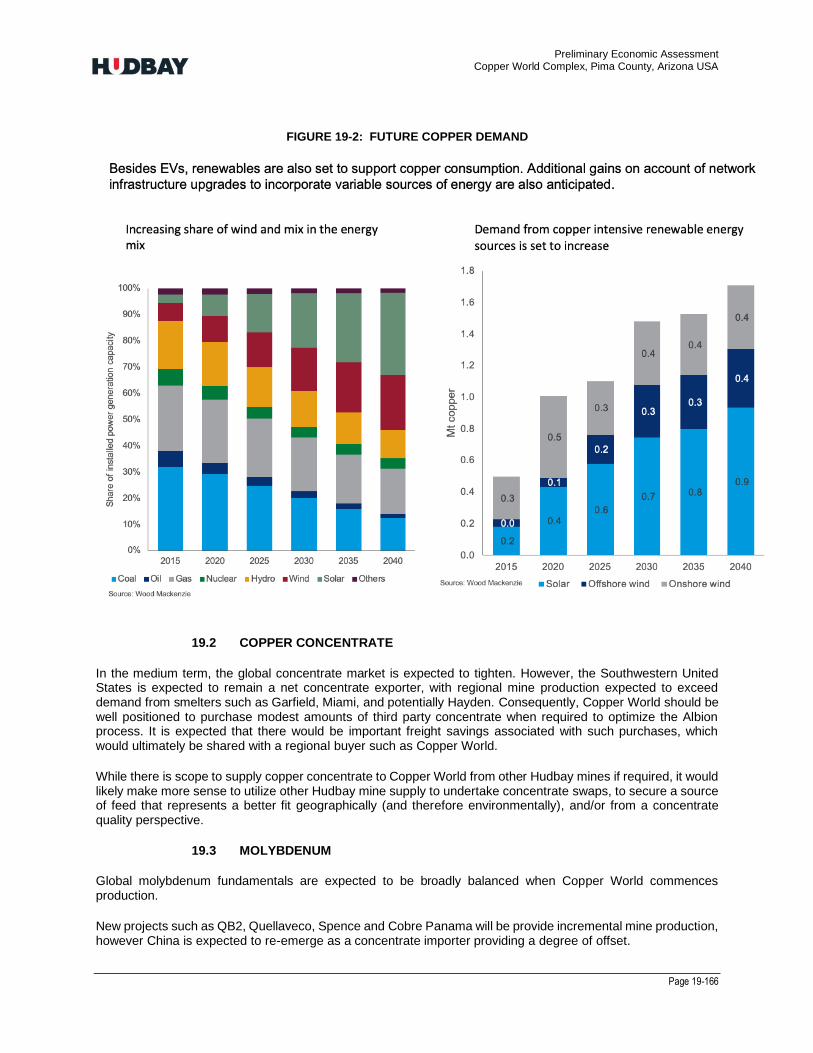
Preliminary Economic Assessment Copper World Complex, Pima County, Arizona USA
Page 19-166
FIGURE 19-2: FUTURE COPPER DEMAND
19.2 COPPER CONCENTRATE
In the medium term, the global concentrate market is expected to tighten. However, the Southwestern United States is expected to remain a net concentrate exporter, with regional mine production expected to exceed demand from smelters such as Garfield, Miami, and potentially Hayden. Consequently, Copper World should be well positioned to purchase modest amounts of third party concentrate when required to optimize the Albion process. It is expected that there would be important freight savings associated with such purchases, which would ultimately be shared with a regional buyer such as Copper World.
While there is scope to supply copper concentrate to Copper World from other Hudbay mines if required, it would likely make more sense to utilize other Hudbay mine supply to undertake concentrate swaps, to secure a source of feed that represents a better fit geographically (and therefore environmentally), and/or from a concentrate quality perspective.
19.3 MOLYBDENUM
Global molybdenum fundamentals are expected to be broadly balanced when Copper World commences production.
New projects such as QB2, Quellaveco, Spence and Cobre Panama will be provide incremental mine production, however China is expected to re-emerge as a concentrate importer providing a degree of offset.
Preliminary Economic Assessment Copper World Complex, Pima County, Arizona USA
Page 19-167
From a regional perspective, the US is also expected to be reasonably balanced in the medium term.
The molybdenum concentrate grade is expected to be 45% to 50%. The concentrate is expected to be truck delivered to processors within Arizona by truck.
19.4 SULFUR
When Copper World commences production, the global fundamentals for sulfur are expected to be strong. Fertilizer related demand will continue to be supportive of global demand. However, this comes at a time when global supply is expected to be adversely impacted by the trend toward decarbonization. As refineries produce less fuel for an auto industry trending toward electric vehicles, there will be less biproduct sulfur production. As biproduct production represents roughly 50% of global supply, this is an important trend, and one that is expected to support global prices, and international references such as the Tampa index.
The US market, and the Arizona region specifically, are net Importers of sulfur, and are expected to be more significant importers in the future. This relates in part to increased demand related to new Lithium mines, particularly in Nevada, in the event that these mines elect to install sulfur burners in order to secure their sulfur units. Further, the ratio of sulfur produced as refinery byproduct is even greater in North America, versus globally, approximating 90% of North American supply.
The imported supply required to satisfy this market is expected to come from a number of sources, including Canada, Texas and California. As Copper World will not have a rail siding, the sulfur will ultimately be trucked to the mine site using specialized trucks. As a net importing region required to incent new supply, it is expected that regional sulfur pricing on a delivered basis will trade at a premium to international references such as Tampa. Pricing is assumed to be US$ 215/tonne delivered to the Copper World mine site.
19.5 SULFURIC ACID
When Copper World commences production prices globally are expected to remain above historical pricing, in part due to constrained burnt sulfur production. This is a consequence of reduced biproduct sulfur supply related to the decarbonization trend noted above.
The US, and the Arizona region specifically, are expected to be net importers. This assumes that Grupo Mexico’s Hayden smelter remains closed. Regional demand will be supported by increased SX/EW demand from new mining operations such as Excelsior and Florence, as well as potentially increased SX/EW production at Pinto Valley. Further, in the event that new Lithium mines in Nevada ultimately elect to purchase acid, instead of installing sulfur burners, this will represent a further source of incremental demand. Assuming that is the case, sulfuric acid will be delivered regionally from a combination of sources, including smelter produced acid from Mexico, Canada and potentially Utah. This could be complemented by sulfur burnt supply from Texas, and sulfuric acid imports from offshore.
Assuming the Arizona region emerges as a sulfuric net acid importer, Copper World is expected to be well positioned to supply growing regional demand. The regional deficit is expected to contribute to prices higher than international references such as Tampa. However, given that ~30 percent of sulfuric acid production is derived as a byproduct of smelter production, that component of supply can be very price inelastic, contributing to price volatility.
Copper World is expected to produce a standard industrial grade sulfuric acid. Pricing is assumed to approximate US$145/tonne FOB mine site, representing a premium to the estimated Tampa Index due to regional pricing dynamics.
19.6 DORÉ
The silver doré grade is expected to be greater than 85% silver on average. The silver doré will be shipped to and refined by a third-party refinery. This refinery will perform refining services either as a toll refiner (fee-for-service) and subsequently crediting Hudbay with outturn precious metal credits or will refine and purchase the outturn precious metals from Hudbay. We estimate provisional payment for 95% of the metal content value upon arrival at the refiner’s premises (or other predetermined destination), with financing rates of 3% or less.

Preliminary Economic Assessment Copper World Complex, Pima County, Arizona USA
Page 19-168
Globally, there are numerous LBMA Good Delivery refiners, the majority of which reside in China and Japan. Within North America, there are several reputable refiners. Hudbay may engage one or several of these refiners at estimated refining terms that will include precious metal payabilities of 99.90%, a treatment charge of US$0.40 per gross ounce of doré and a refining charge of US$0.55 per ounce of fine gold. Transportation and freight insurance will be contracted out to one of several reputable third-party carriers.
The sale of silver produced from the mineral resources mined at the Project site is subject to a streaming agreement with Wheaton Precious metals. The sale of the silver and gold produced from external purchase of concentrate is not part of this contract.
19.7 MARKETING ASSUMPTIONS USED IN THE ECONOMIC MODEL
Table 19-1 summarizes the assumptions used for the relevant commodities to be sold and purchased in the economic evaluation of the project.
TABLE 19-1: PRICE DECK SUMMARY
Table 19-2 summarizes the other relevant marketing assumptions used in the economic evaluation of the Project in this PEA.
PRICE / RATE UNIT LONG TERM
Metals
Copper $/lb 3.50
Copper (FOB mine premium) $/lb 0.01
Moly $/lb 11.00
Gold - Offtaker $/oz 1,600.00
Silver - Offtaker $/oz 22.00
Gold - Stream $/oz 450.00
Silver - Stream $/oz 3.90
Stream Contracted Escalator % per year* 1.00
Other
Molten Sulphur - Purchases $/tonne 215.00
Molten Sulphur - Sales $/tonne 195.00
Acid - Sales $/tonne 145.00
Electricity $/kWh 0.075
NSR Royalty % 3.00
*Annual escalator begins in Year 4
PRICE DECK
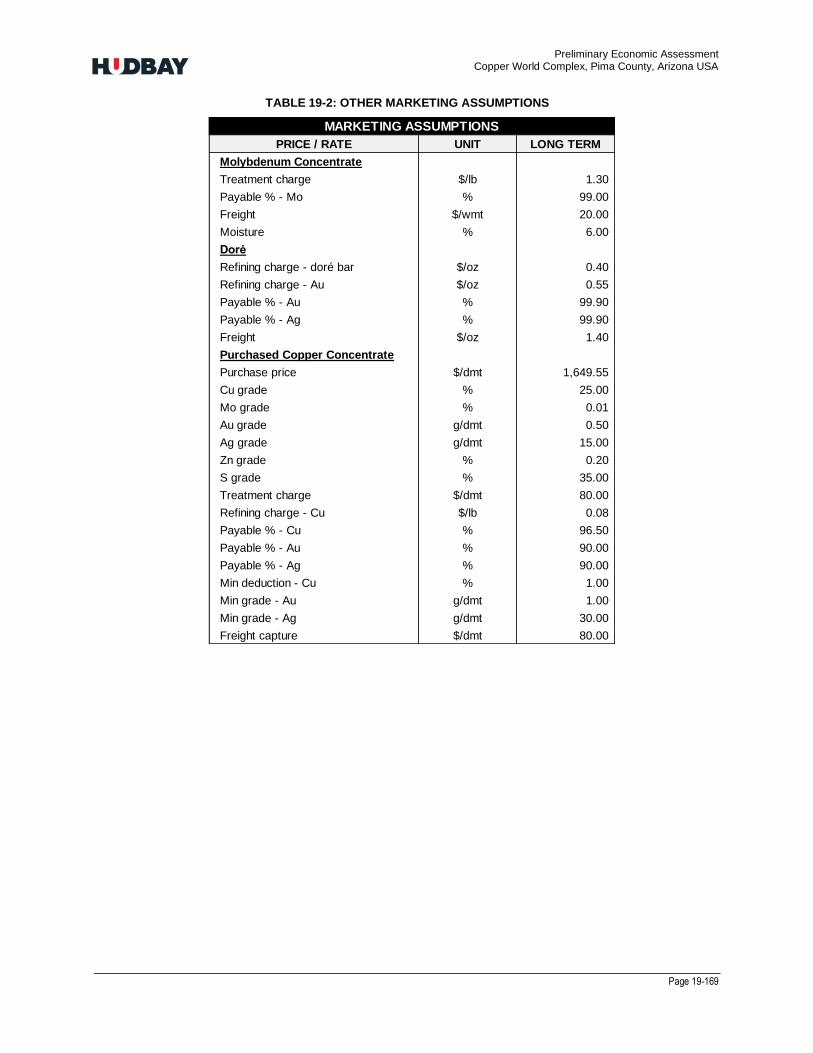
Preliminary Economic Assessment Copper World Complex, Pima County, Arizona USA
Page 19-169
TABLE 19-2: OTHER MARKETING ASSUMPTIONS
PRICE / RATE UNIT LONG TERM PRICE / RATE UNIT LONG TERM
Metals Molybdenum Concentrate
Copper $/lb 3.50 Treatment charge $/lb 1.30
Copper net premium1 $/lb 0.01 Payable % - Mo % 99.00
Molybdenum $/lb 11.00 Freight $/wmt 20.00
Gold - offtaker $/oz 1,600.00 Moisture % 6.00
Silver - offtaker $/oz 22.00 Dorė
Silver - stream $/oz 3.90 Refining charge - doré bar $/oz 0.40
Stream contracted escalator2 % per year 1.00 Refining charge - Au $/oz 0.55
Other Payable % - Au % 99.90
Molten sulfur - purchases $/tonne 215.00 Payable % - Ag % 99.90
Molten sulfur - sales $/tonne 195.00 Freight $/oz 1.40
Acid - sales $/tonne 145.00 Purchased Copper Concentrate
Electricity $/kWh 0.075 Purchase price $/dmt 1,649.55
NSR royalty % 3.00 Cu grade % 25.001Copper cathode premium net of cathode transport charge Mo grade % 0.01
2Annual escalator begins in Year 4 Au grade g/dmt 0.50
Ag grade g/dmt 15.00
Zn grade % 0.20
S grade % 35.00
Treatment charge $/dmt 80.00
Refining charge - Cu $/lb 0.08
Payable % - Cu % 96.50
Payable % - Au % 90.00
Payable % - Ag % 90.00
Min deduction - Cu % 1.00
Min grade - Au g/dmt 1.00
Min grade - Ag g/dmt 30.00
Freight capture $/dmt 80.00
PRICE DECK MARKETING ASSUMPTIONS
Preliminary Economic Assessment Copper World Complex, Pima County, Arizona USA
Page 20-170
20. ENVIRONMENTAL STUDIES, PERMITTING AND SOCIAL OR COMMUNITY IMPACT
This section provides details of the following aspects of the Project:
• A summary of environmental studies;
• Project permitting requirements, the status of any permit applications, and any known requirements to
post performance or reclamation bonds;
• Social or community related requirements and plans for the Project;
• Plans for waste and tailings disposal, site monitoring, and water management both during operations
and post mine closure; and
• Mine closure (remediation and reclamation) requirements and costs.
The PEA contemplates a two-phased mine plan with the first phase reflecting a standalone operation with processing infrastructure on Hudbay’s private land and mining occurring on patented mining claims. Phase I is expected to require only state and local permits and reflects a 16-year mine life. Phase II extends the mine life to 44 years through an expansion onto federal land to mine the entire deposits. Phase II would be subject to the federal permitting process. Phase I has been extended for as long as possible as a prudent base case for this PEA but Hudbay expects to secure federal permits much earlier which would unlock considerable value by allowing to mine more tons and/or at higher grade sooner than estimated in the mine plan presented in this report.
Permits issued for the Project will generally need to meet specific design and monitoring requirements. For example, the Project will meet the Arizona Department of Environmental Quality (ADEQ) Best Available Demonstrated Control Technology (BADCT) requirements (includes facilities such as the Waste Rock Facility, Tailings Storage Facilities and Heap Leach Facilities). Equipment specifications, such as for dust collector efficiency, will be part of permit requirements for an air quality control permit issued by ADEQ. Additional design and monitoring requirements will also be part of the Phase II federal permitting process.
20.1 ENVIRONMENTAL STUDIES
As part of both current and past project activities, numerous surveys and studies related to the biological and cultural aspects of the site have been completed. Additionally, geochemical characterization of site materials has been performed along with groundwater and surface water studies. These surveys and studies are summarized below and will support both Phase I and Phase II of the Project.
20.1.1 BIOLOGICAL
The Rosemont Copper Company has conducted biological surveys on all portions of the Phase I areas. These surveys included federally listed special status plant and animal species. In addition, Hudbay has developed a Special-Status Species Management Plan and Take Analysis for Phase I work. This plan includes best management practices (BMPs) to avoid “take” of listed species while conducting ground disturbing activities on private lands prior to, and during, Phase I of the Project. Surveys have resulted in the relocation of special-status plant species outside of activity areas and awareness and avoidance training for site personnel for both special-status plant and animal species.
It is relevant to the Project that a Biological Opinion (BO) was issued in 2013 and updated in 2016 that encompassed disturbances and impacts associated with the standalone Rosemont Copper Project contemplated by the 2017 Feasibility Study (which from time to time is referred to in this section of the Technical Report as the “Rosemont Copper Project”). The overall conclusion was that the Rosemont Copper Project would not jeopardize the existence of any listed species and would not destroy designated critical habitat for any listed species. The BO for the Rosemont Copper Project was subsequently vacated by a 2020 court decision and three issues were remanded back to the USFWS. Hudbay believes that these issues could be addressed fairly easily during re-consultation with the USFWS. These same issues would be relevant to the Project due to the similar Phase II disturbance footprint and projected impacts.

Preliminary Economic Assessment Copper World Complex, Pima County, Arizona USA
Page 20-171
20.1.2 CULTURAL
The footprint of the Rosemont Copper Project was previously surveyed for cultural resources and those resources were evaluated for eligibility for listing in the National Register of Historic Places (NRHP). The following Historic Properties Treatment Plans (HPTPs) were developed as part of that project:
• Historic Properties Treatment Plan for the Proposed Rosemont Copper Project, Pima County, Arizona.
December 2014 (by SWCA Environmental Consultants)
• A Historic Properties Treatment Plan for Rosemont Copper Utilities, Pima County, Arizona. November
2015 (by Environmental Planning Group)
Hudbay conducted additional cultural resource surveys on all remaining portions of the Phase I areas that were not included in the HPTPs. These surveys identified seven sites outside of the HPTPs that are likely eligible for listing in the NRHP.
An internal cultural resource protocol has been developed for the Phase I pre-construction period. This protocol describes how Hudbay will address cultural resources, Including the potential discovery of human remains or funerary objects. No human burial sites are known or anticipated on lands associated with Phase I of the Project.
20.1.3 GEOCHEMICAL
Geochemical characterization of the materials to be mined and placed in storage facilities has been undertaken as part of facility design. Material characterization was conducted as part of the Rosemont Copper Project as well as for Phase I of the current Project. Additionally, a waste rock management plan was developed as part of the characterization program to mitigate against the occurrence of acid mine drainage from potentially acid-generating (PAG) or acid-generating (AG) materials. Overall, the majority of waste rock is constituted of limestones and has been identified as non-acid generating (NAG). In addition, the downstream processing of the concentrate will remove most of the sulfide and therefore produce cleaner tailings than in the 2017 study. Therefore, the risk of forming of acid mine rock drainage is low based on characterization of the waste rock and active management of the materials per the management plan.
20.1.4 GROUNDWATER
A groundwater flow model has been developed for the Phase I and is largely based on two previously developed models: the Rosemont Copper Project groundwater model for the east side and the Tucson Aquifer Management Area model for the west side. The model provides groundwater drawdown predictions in addition to defining the Discharge Impact Area (DIA). Groundwater monitoring will be required during operations and post-closure at select point of compliance (POC) monitoring locations or other receptors.
20.1.5 SURFACE WATER
A site water management plan has been developed as part of Phase I permitting that incorporates the following concepts:
• To the extent practicable, diversion of unimpacted (non-contact) stormwater around and/or through the facilities to downgradient drainages during operations;
• On-site containment of process water (contact water);
• Routing of stormwater off and through reclaimed facilities at closure as much as practicable; and
• Non-degradation of surface water quality downgradient of the facilities.
During operations, stormwater management systems will handle the 100-year, 24-hour event plus operational flows. Stormwater channels constructed for closure will be designed to handle the 1,000-year, 24-hour event.
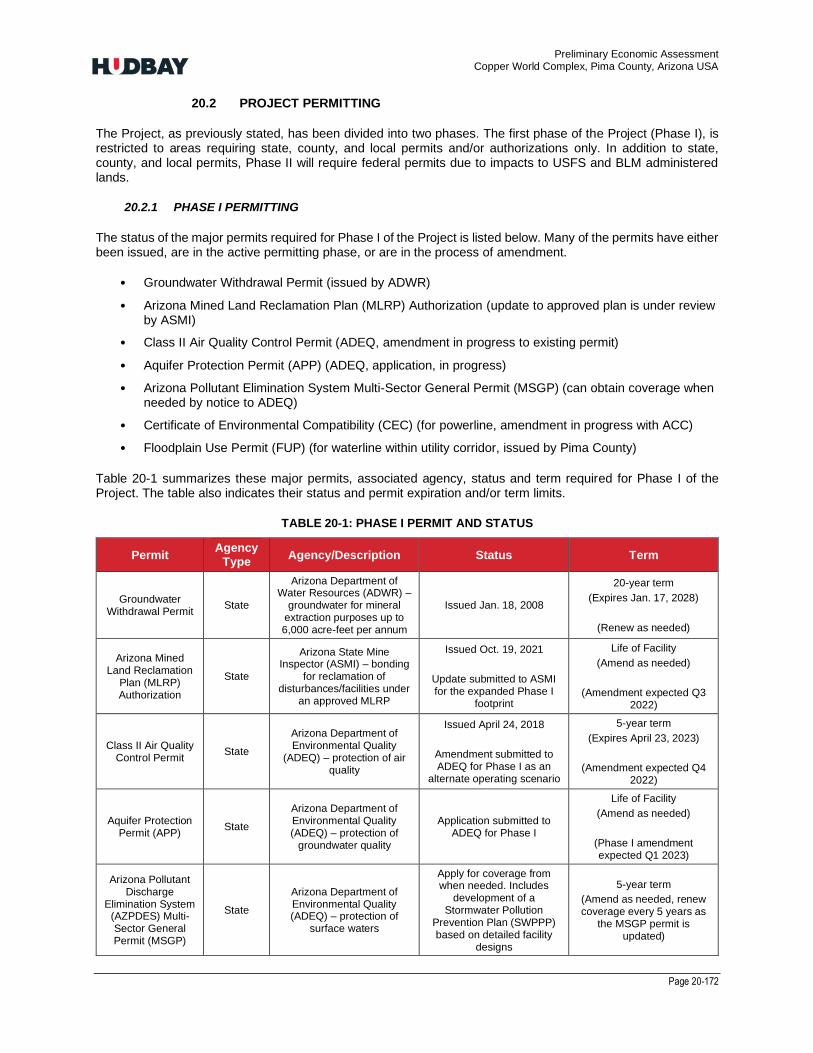
Preliminary Economic Assessment Copper World Complex, Pima County, Arizona USA
Page 20-172
20.2 PROJECT PERMITTING
The Project, as previously stated, has been divided into two phases. The first phase of the Project (Phase I), is restricted to areas requiring state, county, and local permits and/or authorizations only. In addition to state, county, and local permits, Phase II will require federal permits due to impacts to USFS and BLM administered lands.
20.2.1 PHASE I PERMITTING
The status of the major permits required for Phase I of the Project is listed below. Many of the permits have either been issued, are in the active permitting phase, or are in the process of amendment.
• Groundwater Withdrawal Permit (issued by ADWR)
• Arizona Mined Land Reclamation Plan (MLRP) Authorization (update to approved plan is under review by ASMI)
• Class II Air Quality Control Permit (ADEQ, amendment in progress to existing permit)
• Aquifer Protection Permit (APP) (ADEQ, application, in progress)
• Arizona Pollutant Elimination System Multi-Sector General Permit (MSGP) (can obtain coverage when needed by notice to ADEQ)
• Certificate of Environmental Compatibility (CEC) (for powerline, amendment in progress with ACC)
• Floodplain Use Permit (FUP) (for waterline within utility corridor, issued by Pima County)
Table 20-1 summarizes these major permits, associated agency, status and term required for Phase I of the Project. The table also indicates their status and permit expiration and/or term limits.
TABLE 20-1: PHASE I PERMIT AND STATUS
Permit Agency
Type Agency/Description Status Term
Groundwater Withdrawal Permit
State
Arizona Department of Water Resources (ADWR) –
groundwater for mineral extraction purposes up to 6,000 acre-feet per annum
Issued Jan. 18, 2008
20-year term
(Expires Jan. 17, 2028)
(Renew as needed)
Arizona Mined Land Reclamation
Plan (MLRP) Authorization
State
Arizona State Mine Inspector (ASMI) – bonding
for reclamation of disturbances/facilities under
an approved MLRP
Issued Oct. 19, 2021
Update submitted to ASMI for the expanded Phase I
footprint
Life of Facility
(Amend as needed)
(Amendment expected Q3 2022)
Class II Air Quality Control Permit
State
Arizona Department of Environmental Quality
(ADEQ) – protection of air quality
Issued April 24, 2018
Amendment submitted to ADEQ for Phase I as an
alternate operating scenario
5-year term
(Expires April 23, 2023)
(Amendment expected Q4 2022)
Aquifer Protection Permit (APP)
State
Arizona Department of Environmental Quality (ADEQ) – protection of
groundwater quality
Application submitted to ADEQ for Phase I
Life of Facility
(Amend as needed)
(Phase I amendment expected Q1 2023)
Arizona Pollutant Discharge
Elimination System (AZPDES) Multi-Sector General Permit (MSGP)
State
Arizona Department of Environmental Quality (ADEQ) – protection of
surface waters
Apply for coverage from when needed. Includes
development of a Stormwater Pollution
Prevention Plan (SWPPP) based on detailed facility
designs
5-year term
(Amend as needed, renew coverage every 5 years as
the MSGP permit is updated)

Preliminary Economic Assessment Copper World Complex, Pima County, Arizona USA
Page 20-173
Certificate of Environmental Compatibility
(CEC)
State
Arizona Corporation Commission (ACC) and the Line Siting Committee – for construction of power line (issued to Tucson Electric Power Company (TEP))
Issued Jun 12, 2012, extensions dated Sept 20, 2018 and June 29, 2022
Seven Years
(Expires 2029)
Pima County Flood Control District
Permit County
Pima County Flood Control District – floodplain use
permit (FUP) for water line Issued on June 14, 2014
Annual renewal until constructed
Right of Way Encroachment –
License Agreement
Local
Town/City
Town of Sahuarita (TOS) –license agreement for construction of water
pipeline within TOS ROW
Issued June 24, 2013 25 years
(Expires June 23, 2038)
Other state, county and local permits that may be needed for Phase I are listed below. The need for such permits will be based on final facility designs and will be obtained without impact to the execution of the mine plan as proposed.
• Floodplain Use Permit(s) issued by PC
• License Agreement and Right of Way Use Permits issued by PC (for pipeline crossings)
• Right of Way Use Permit issued by TOS (for pipeline construction)
• Septic Systems issued by ADEQ
• Drinking Water System issued by ADEQ
• Well drilling permits issued by ADWR
• Dam safety permit(s) issued by ADWR may be needed based on final designs.
The following permits are issued and will be modified as needed during construction or pre-construction activities:
• Fugitive dust permit (ADEQ)
• Construction General Permit (CGP) (ADEQ stormwater permit)
20.2.2 PHASE II PERMITTING
The major permits/authorizations for Phase II will include the approval of a Mine Plan of Operations (MPO) for which the Project will need a Final Record of Decision (ROD) from the United States Forest Service (USFS) and from the Bureau of Land Management (BLM), following the preparation of a joint Environmental Impact Statement (EIS).
The State of Arizona environmental permits and approvals issued for Phase I, such as for the Class II air permit and APP, will be amended to match the applicable Phase II federal permits. Submittal of the amendments for review by State agencies will be timed to accommodate both the layout used in the federal plan and the anticipated timing of approvals. Authorizations for the water and power line routing will remain valid for Phase II.
The federal agencies that may be involved in Phase II permitting include the following:
• Bureau of Land Management (BLM)
• United States Army Corps of Engineers (USACE)
• United States Fish and Wildlife Service (USFWS)
• United States Forest Service (USFS)
The following federal permits and/or studies will be obtained for Phase II.

Preliminary Economic Assessment Copper World Complex, Pima County, Arizona USA
Page 20-174
• Mine Plan of Operations (USFS and BLM)
o National Environmental Policy Act (NEPA) Analysis
o Consultation under Section 106 of National Historic Preservation Act (NHPA) (Tribal Consultation)
o Biological and Conference Opinion (BO) by the USFWS
o Environmental Impact Statement (EIS)
o Record of Decision (ROD)
Hudbay does not anticipate that Phase II will require a permit from the United States Army Corps of Engineers (USACE) under Section 404 of the Clean Water Act (“404 Permit”). Whether a 404 Permit will be required will depend on the definition of “waters of the United States” (WOTUS) at the time of permitting. Although the USACE issued a 404 Permit for the Rosemont Copper Project in 2019, which authorized the fill of washes within an area similar to the Phase II area of the Project, Hudbay surrendered the permit in April 2022.
It should also be noted that two groups of Project opponents provided separate notices of their intent to bring citizen suits against Copper World under the Clean Water Act. In each case, project opponents have alleged that the site contains WOTUS and that a 404 Permit is needed to advance any part of the project (including Phase I). The USACE has never determined that there are jurisdictional waters of the U.S. at the Copper World Complex and Hudbay has independently concluded through its own scientific analysis that there are no such waters in the area. As a result, Hudbay does not believe Phase I will require a 404 Permit.
As appropriate, permit conditions required by non-federal agencies, such as from ADEQ, that are protective of the environment would be pulled into the Mitigation Measures listed in the final EIS. These requirements would then be incorporated into the respective RODs and MPO. Mitigation Measures may include categories such as:
• Soils and Revegetation
• Groundwater Quality and Quantity
• Surface Water Quantity and Quality
• Seeps, Springs, and Riparian
• Geology, Minerals, and Paleontology
• Biological Resources
• Landownership and Boundary Management
• Dark Skies
• Visual Resources
• Recreation and Wilderness
• Hazardous Materials
• Transportation/Access
• Noise
• Public Health and Safety
• Cultural Resources
• Air Quality and Climate Change
• Fire and Fuels
• Power Use
• Community Programs
Preliminary Economic Assessment Copper World Complex, Pima County, Arizona USA
Page 20-175
For Phase II, a biological assessment (BA) will be developed that will detail potential impacts to species based on the Copper World Complex Project. A new or updated Biological Opinion (BO) will be developed by the USFWS based on the BA and will state whether the Project would or would not jeopardize the existence of any listed species and would or would not destroy designated critical habitat for any listed species. Updated biological surveys will be conducted on federal as well as undisturbed private lands as part of the Phase II permitting process.
For Phase II, the federal agencies will need to consult with affected tribes regarding impacts to the tribes, including impacts to cultural resources. As a result of consultation, it is presumed that a new or amended HPTP will be developed for cultural resources on federal lands and any other lands outside of the Phase I disturbance limits. Surveys will be conducted on all federal or other lands (i.e., private, state) as applicable for cultural resources prior to development of the HPTP.
20.3 SOCIAL AND COMMUNITY REQUIREMENTS AND PLANS
Hudbay is committed to ensuring that the local community benefits from the Project. This begins by soliciting input from stakeholders and understanding the challenges facing local communities. The information acquired can then be used during the development process to protect critical values and effectively mitigate for impacts that cannot be avoided.
Several of the permits described above will include public comment processes where interested stakeholders will be encouraged to share their views on the Project. In addition, Hudbay intends to engage key stakeholders to solicit their input directly. This information will then be used to develop an effective mitigation plan. Specific details of that plan will be determined as the Project progresses and the community is engaged, but a cost allowance is included in the financial model for the Project.
For example, Hudbay is committed to the preservation of historical and cultural resources and has voluntarily developed an internal data recovery protocol for cultural resources. As part of this protocol, field surveys will always be conducted prior to disturbance and data recovery plans will be developed for eligible sites to archive site artifacts and history.
Additional mitigation measures and other social commitments will be determined during development of Phase II of the Project.
20.4 FACILITY DETAILS AND MONITORING
This section provides a summary of water management associated with the major Phase I facilities, the design components of these facilities, and monitoring requirements for the Project.
20.4.1 WASTE ROCK FACILITY
Preliminary design of the Waste Rock Facility (WRF) has been completed in preparation of an Aquifer Protection Permit (APP) application to ADEQ. Additionally, geotechnical investigations and stability analysis were completed. The design incorporates temporary sediment basins to be used until the final configuration of the WRF is completed. Once each section of the WRF is completed, permanent sediment basins will be constructed. Final WRF slopes will be seeded at closure. As much a practicable, stormwater runoff from the WRF will be released offsite through these sediment basins.
A waste rock management plan has been developed to mitigate against the potential for acid generation from the waste rock material. NAG materials will preferentially be placed on the outer slopes to ensure surface water standards are met. The waste rock management plan is part of the APP application for Phase I. The management of waste rock during Phase II is anticipated to follow this same general plan.
20.4.2 TAILINGS STORAGE FACILITY
Geotechnical investigations, stability analyses and laboratory testing were completed as part of the design process and supplemented the historical data to form the basis of design. The design is in accordance with the
Preliminary Economic Assessment Copper World Complex, Pima County, Arizona USA
Page 20-176
requirements of ADEQ’s Arizona Mining Best Available Demonstrated Control Technology (BADCT) Guidance Manual (ADEQ 2004).
Tailings storage facilities (TSFs) constructed on the west side of Santa Rita Mountains will all have a conventional impoundment design. Water management for the TSFs includes the capture of drain-down solution (seepage) in an underdrain collection system for reuse in the process. Impacted stormwater is also captured and pumped to the process circuit. Unimpacted stormwater is released to downgradient drainages.
The seepage collection system for the TSFs will be operated throughout the life of the facility and into closure. In addition to managing seepage at closure, stormwater will be managed. A growth media cover will be placed on the top surface and side slopes of the TSFs and revegetated. The top surface will be graded as needed to route stormwater off the facility and into natural drainages. This will limit the potential for infiltration into the tailings from precipitation events. The use of sulfate treatment cells is also anticipated in the post-closure period.
The tailings facility constructed on the east side of the Santa Rita Mountains during Phase II of the Project will use dry stack tailings technology. The dry stack will be based on the previously permitted facility design that was part of the Rosemont Copper Project. Stormwater run-on and run-off controls will be constructed and stormwater ponding on the surface of the dry stack will be limited during operations. Concurrent reclamation of the outer slopes of the dry stack is also anticipated during operations.
At closure, a final growth media cover will be placed on the top surface of the dry stack and revegetated. The top surface will be graded as needed to route stormwater off the facility and into natural drainages. This will limit the potential for infiltration into the tailings mass from precipitation events.
20.4.3 HEAP LEACH FACILITY
Geotechnical investigations and laboratory testing as well as stability analysis were completed as part of the design process and supplemented the historical data to form the basis of design. The design is in accordance with the requirements of ADEQ’s BADCT Guidance Manual (ADEQ 2004).
The heap leach facility (HLF) design includes the following BADCT components:
• A double-lined composite liner system for process solution ponds with a leak collection and removal
system (LCRS);
• A single-lined composite liner system for stormwater ponds; and
• A single-lined composite liner system for the heap leach pad (HLP) with a drainage system (coarse overliner material and drainage piping).
The HLF will operate as a closed system with process solutions contained within the heap leach pad (HLP) and associated ponds. Stormwater contacting materials stacked on the HLP will be collected in the HLF stormwater ponds.
At closure, the top surface an side slopes of the leach pad will be graded to promote runoff and limit infiltration. A growth media cover will also be placed on the side slopes and top surface of the spent heap. The management of drain-down solutions will also occur during the closure period.
Facilities will be removed at closure, including closure of the HLF ponds. Additionally, conversion of the ponds to evaporation cells for the long-term management of drain-down from the heap is anticipated.
20.4.4 OPEN PITS
Phase I and Phase II of the Project will involve mining four open pits. These pits, from west to east, include: Peach-Elgin, West, Broadtop Butte, and East pits. Current plans include the backfilling of the Elgin, West, and Broadtop Butte areas with waste rock. The East pit will remain open at closure.
Preliminary Economic Assessment Copper World Complex, Pima County, Arizona USA
Page 20-177
Dewatering will be conducted as needed during operations for all of the open pit areas. Dewatering water will generally be used in the process or for general dust control. Stormwater collected in pit sumps will be used for dust control within the pit shells or be pumped to the process circuit.
Site investigations and pit slope stability analyses were conducted to demonstrate adherence to recommended slope safety factors.
20.4.5 PROCESS PLANT
The Plant Site area will contain four lined ponds, three of which are considered process ponds: Primary Settling Pond, Reclaim Pond, and Raffinate Pond. The fourth pond is a stormwater pond that will receive runoff from the Plant Site area during storm events.
The plant site pond designs include the following BADCT components:
• A double-lined composite liner system for the process solution ponds with a leak collection and removal system (LCRS); and
• A single-lined composite liner system for the stormwater pond.
The remaining plant site’s operational and maintenance facilities will be designed and constructed as a non-discharge facility to meet exemptions listed in Arizona Revised Statute (A.R.S.) §49-250(B).
Facilities will be removed at closure, including the plant area ponds.
20.4.6 SITE MONITORING
The following sections outline the anticipated monitoring during Phase I and Phase II operations.
PHASE I MONITORING
The following monitoring and inspections will be performed for Phase I of the Project during operations:
• Fugitive dust and stack emissions monitoring
• PM10 station monitoring (dust particulates)
• Meteorological station monitoring (wind speed, rain fall, etc.)
• Air pollution control equipment testing
• Stormwater sampling at outfalls
• Groundwater level and water quality monitoring (at POC wells)
• Waste rock testing and monitoring of material placement
• Inspection of pond liner integrity and general pond function
• Monitoring of pond leak collection and recovery system (LCRS) where applicable
• Inspections of waste rock, tailings, and heap slope stability
• Pit slope stability/ground control monitoring
• Inspection of conveyance channels
• Moisture content of tailings
• Fresh water pumping volume

Preliminary Economic Assessment Copper World Complex, Pima County, Arizona USA
Page 20-178
PHASE II MONITORING
In addition to the Phase I monitoring and inspections, Phase II is anticipated to include additional monitoring such as the following:
• Regional groundwater monitoring (water quality and water levels)
• Groundwater model updates
• Regional surface water monitoring (flow and quality)
• Pit lake water quality monitoring
• Pit lake geochemical model updates
• Spring monitoring
• Dark skies monitoring
• Special-status species monitoring
20.5 SOCIAL AND ENVIRONMENTAL BENEFITS OF THE PROJECT
The “Made in America” copper cathode produced at the Copper World Complex is expected to be sold entirely to domestic U.S. customers, thereby reducing the operation’s total energy requirements, greenhouse gas (“GHG”) and sulfur (SO2) emissions by eliminating overseas shipping, smelting and refining activities relating to copper concentrate (Figure 20-1). The company estimates that the project will reduce total energy consumption by more than 10%, including a more than 30% decline in energy consumption relating to downstream processing when compared to a project design that produces copper concentrates for overseas smelting and refining. The lower energy consumption would result in an approximate 10% to 15% reduction in scope 1, 2 and 3 greenhouse gas (“GHG") emissions. In addition, the copper cathode production from oxides will also result in lower GHG emissions. Hudbay is targeting further reductions in the project’s GHG emissions as part of the company’s specific emissions reduction targets to align with the global 50% by 2030 climate change goal. Hudbay has integrated GHG reduction initiatives as part of its project design for the Copper World Complex and the company expects to further reduce GHG emissions through advancing many green opportunities. There are several emission reduction opportunities the company will evaluate with future feasibility studies, including the potential to source renewable energy from local providers at a nominal cost, the use of autonomous or electric haul trucks at the operation and various post-reclamation land uses such as domestic renewable energy production. Also, if Hudbay is able to secure additional private land to improve the tailings configuration, there is the potential to accelerate dry stack tailings deposition into Phase I, which would reduce water consumption.
FIGURE 20-1: REDUCTION IN ENERGY CONSUMPTION AND GREENHOUSE GAS EMISSIONS RESULTING FROM THE SULFIDE AND OXIDE LEACHING
One of the many benefits of producing copper cathode on site is that the cathode is likely to be sold entirely to the domestic U.S. market, thereby reducing energy consumption, greenhouse gas and sulfur emissions by eliminating overseas shipping, smelting and refining

Preliminary Economic Assessment Copper World Complex, Pima County, Arizona USA
Page 20-179
The Copper World Complex is expected to generate significant benefits for the community and local economy in Arizona. Over the anticipated 44-year life of the operation, the company expects to contribute more than $3.4 billion in U.S. taxes, including approximately $660 million in taxes to the state of Arizona and $590 million in property taxes that directly benefit local communities. Hudbay also expects the Copper World Complex to create more than 500 direct jobs and up to 3,000 indirect jobs in Arizona.
20.6 RECLAMATION AND CLOSURE
Rosemont Copper Company assumes responsibility for reclamation of surface disturbances that are attributed to the Project. Reclamation and closure of non-federal lands (Phase I) are regulated by ADEQ and ASMI. Reclamation of surface facilities is covered under a Mined Plan Reclamation Plan (MLRP) approved by the ASMI. A Conceptual Closure Plan will be part of the APP application to ADEQ for the closure of discharging facilities. An updated MLRP has been submitted to ASMI for Phase I of the Project. A Reclamation and Closure Plan will be developed during permitting of Phase II to cover federal remediation requirements. Closure and reclamation costs attributable to ASMI and ADEQ would also be updated at that time. The Closure and Reclamation Plan will detail and apportion costs attributable to each respective agency so that double bonding is avoided.
20.6.1 RECLAMATION AND CLOSURE CONCEPTS
The proposed reclamation/closure design elements for the project include concurrent reclamation for some of the facilities, to the extent practicable.
In general, the following concepts apply to reclamation and closure of the facilities:
• Post-mining land use to include on-going ranching and wildlife habitat. Top surfaces of the post-mining reclaimed facilities will be used for grazing once vegetation is established.
• Placement of materials in their final configuration throughout the life of the project where possible. Facility slopes will be constructed at final reclamation slopes. Final reclaimed facility surfaces will consist of either suitable waste rock or salvaged soil materials.
• Facility grading and stormwater controls will be designed to route as much stormwater runoff off the reclaimed surfaces as practicable.
• Building facilities within the Plant Site will be removed and the area regraded to route stormwater runoff to down-gradient drainages. Reclaimed areas will be covered with growth media as needed (i.e., soil salvaged from the facility footprints) and revegetated.
• Reclamation of the Utility Corridor includes the removal of facilities (such as the water and power lines and pump stations) and the regrading and revegetation of disturbed areas.
Grinding &
Crushing
Flotation
Shipping
Smelting
Refining
Mine
Leaching
Solvent
Extraction
Electrowinning
Customer
Concentrate
Leaching
Eliminating shipping, smelting and refining expected to result in:
10% lower energy consumption
10-15% lower GHG emissions
and reduced sulfur emissions
Eliminates ~$750M of
overseas freight costs
Cleaner tailings
Preliminary Economic Assessment Copper World Complex, Pima County, Arizona USA
Page 20-180
• Perimeter fencing will remain, especially around pit areas. Additionally, some of the pits will be backfilled.
Additionally, the following post-closure site monitoring and activities are anticipated:
• Management of drain-down solutions from the heap and tailings facilities (active management followed by passive management)
• Groundwater monitoring at point of compliance (POC) wells
• Surface water monitoring at outfall locations
• Reclamation success monitoring and maintenance, including stormwater conveyance monitoring and maintenance (includes erosion monitoring and maintenance)
Drain-down solution management will be variable for the facilities and could be up to 30-years for the TSFs and up to 8-years for the HLF. Reclamation success monitoring and maintenance is anticipated to occur for 5-years once final covers and/or reclamation activities occur. Reclamation will be staged as needed.
Additional post-closure monitoring and mitigation activities will be defined during development of the final EIS and incorporated into the Phase II Mine Plan of Operations. Anticipated post-closure monitoring associated with the Phase II MPOs may include:
• Regional groundwater level and water quality monitoring
• Regional surface water monitoring (flow and quality)
• Management of wildlife watering locations
• Groundwater and pit lake geochemical model updates, including pit lake water quality
• Special-status species monitoring
20.6.2 CLOSURE COSTS
For the purposes of this Technical Document, closure and reclamation activities would occur following Phase II. A cost of $200 million has been estimated to cover all reclamation activities. Reclamation would occur over four years.
20.6.3 FINANCIAL ASSURANCE
Certain permits require financial assurance to ensure the success of mitigation, while others are solely to ensure that adequate funds are available at closure. The requisite bonds for the Project are expected to be obtained from the surety market with an estimated annual bond fee of 0.9% of the bond’s notional value.
For Phase I, bonds will be required for ADEQ (closure of discharging facilities) and for ASMI (reclamation of disturbances, including the removal of facilities). For Phase II, bonding with the USFS and BLM will be required to cover reclamation and closure activities on federal lands. Reclamation and closure costs would be developed for each phase of the Project and apportioned appropriately to the respective agency to avoid double-bonding.
The USACE bond, if required for Phase II, is expected to be a performance bond with a long-term management component to ensure that any proposed mitigation is successful.
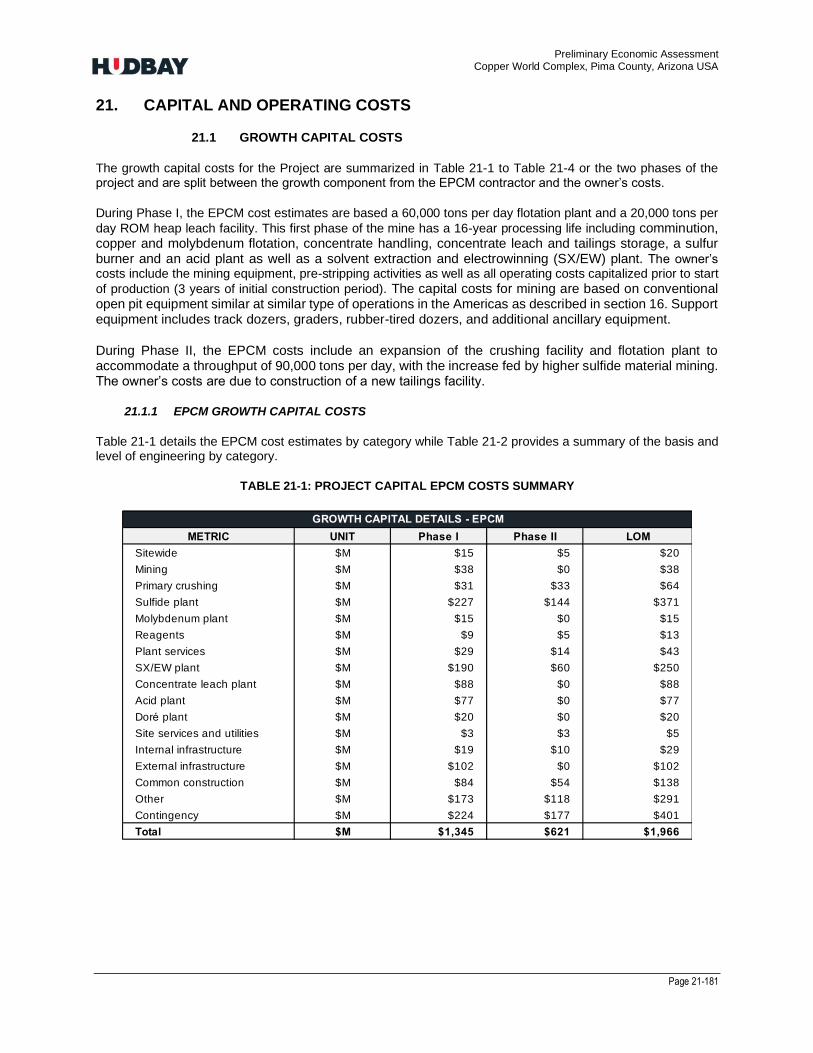
Preliminary Economic Assessment Copper World Complex, Pima County, Arizona USA
Page 21-181
21. CAPITAL AND OPERATING COSTS
21.1 GROWTH CAPITAL COSTS
The growth capital costs for the Project are summarized in Table 21-1 to Table 21-4 or the two phases of the project and are split between the growth component from the EPCM contractor and the owner’s costs.
During Phase I, the EPCM cost estimates are based a 60,000 tons per day flotation plant and a 20,000 tons per
day ROM heap leach facility. This first phase of the mine has a 16-year processing life including comminution, copper and molybdenum flotation, concentrate handling, concentrate leach and tailings storage, a sulfur burner and an acid plant as well as a solvent extraction and electrowinning (SX/EW) plant. The owner’s costs include the mining equipment, pre-stripping activities as well as all operating costs capitalized prior to start
of production (3 years of initial construction period). The capital costs for mining are based on conventional open pit equipment similar at similar type of operations in the Americas as described in section 16. Support equipment includes track dozers, graders, rubber-tired dozers, and additional ancillary equipment.
During Phase II, the EPCM costs include an expansion of the crushing facility and flotation plant to accommodate a throughput of 90,000 tons per day, with the increase fed by higher sulfide material mining. The owner’s costs are due to construction of a new tailings facility.
21.1.1 EPCM GROWTH CAPITAL COSTS
Table 21-1 details the EPCM cost estimates by category while Table 21-2 provides a summary of the basis and level of engineering by category.
TABLE 21-1: PROJECT CAPITAL EPCM COSTS SUMMARY
METRIC UNIT Phase I Phase II LOM
Growth - EPCM $M $1,345 $621 $1,966
Growth - owner's costs $M $572 $264 $836
Growth - subtotal $M $1,917 $885 $2,802
Sustaining $M $531 $967 $1,498
Deferred stripping $M $111 $456 $567
Total $M $2,559 $2,308 $4,867
METRIC UNIT Phase I Phase II LOM
Sitewide $M $15 $5 $20
Mining $M $38 $0 $38
Primary crushing $M $31 $33 $64
Sulfide plant $M $227 $144 $371
Molybdenum plant $M $15 $0 $15
Reagents $M $9 $5 $13
Plant services $M $29 $14 $43
SX/EW plant $M $190 $60 $250
Concentrate leach plant $M $88 $0 $88
Acid plant $M $77 $0 $77
Doré plant $M $20 $0 $20
Site services and utilities $M $3 $3 $5
Internal infrastructure $M $19 $10 $29
External infrastructure $M $102 $0 $102
Common construction $M $84 $54 $138
Other $M $173 $118 $291
Contingency $M $224 $177 $401
Total $M $1,345 $621 $1,966
METRIC UNIT Phase I Phase II LOM
Pre-stripping $M $57 $0 $57
Mining fleet and equipment $M $186 $0 $186
Tailings storage $M $20 $264 $284
Heap leach pad $M $45 $0 $45
Earthworks and roads $M $28 $0 $28
G&A and other $M $156 $0 $156
Indirects and contingency $M $79 $0 $79
Total $M $572 $264 $836
METRIC UNIT Phase I Phase II LOM
Mining $M $305 $439 $744
Processing $M $163 $365 $528
Admin $M $63 $163 $226
Deferred stripping $M $111 $456 $567
Total $M $642 $1,423 $2,065
GROWTH CAPITAL DETAILS - OWNER'S COSTS
SUSTAINING CAPITAL DETAILS
CAPITAL COST SUMMARY
GROWTH CAPITAL DETAILS - EPCM
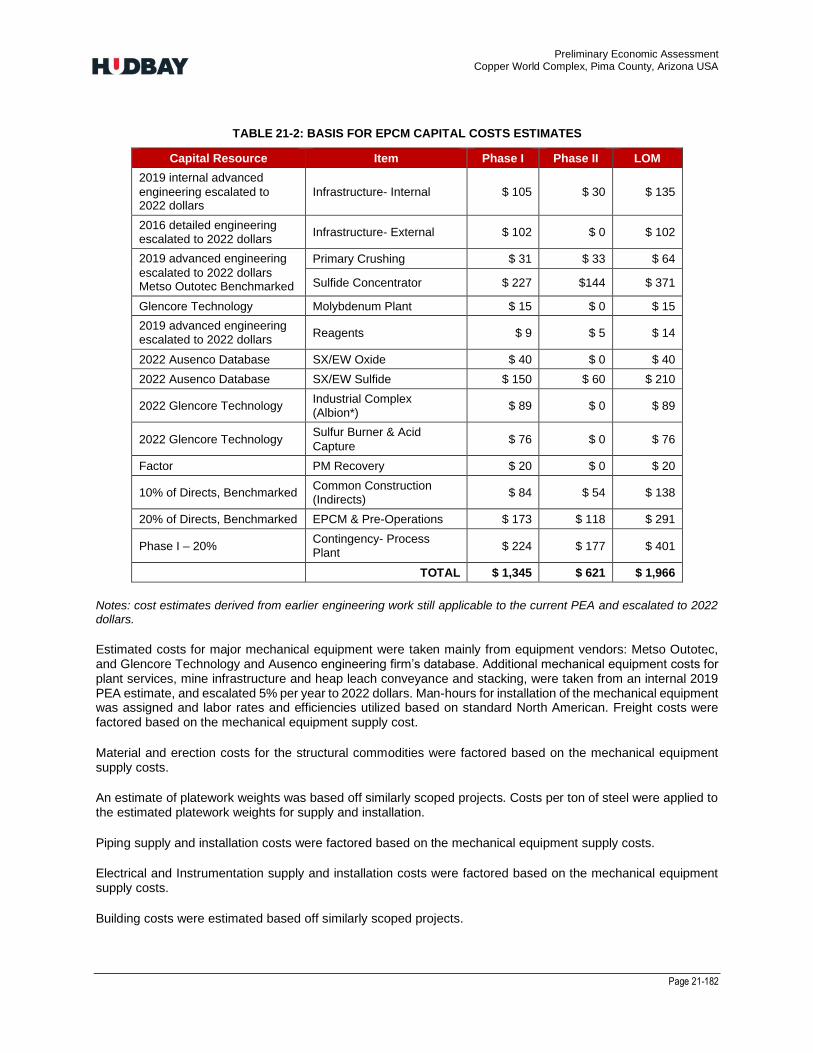
Preliminary Economic Assessment Copper World Complex, Pima County, Arizona USA
Page 21-182
TABLE 21-2: BASIS FOR EPCM CAPITAL COSTS ESTIMATES
Capital Resource Item Phase I Phase II LOM
2019 internal advanced
engineering escalated to 2022 dollars
Infrastructure- Internal $ 105 $ 30 $ 135
2016 detailed engineering escalated to 2022 dollars
Infrastructure- External $ 102 $ 0 $ 102
2019 advanced engineering
escalated to 2022 dollars Metso Outotec Benchmarked
Primary Crushing $ 31 $ 33 $ 64
Sulfide Concentrator $ 227 $144 $ 371
Glencore Technology Molybdenum Plant $ 15 $ 0 $ 15
2019 advanced engineering escalated to 2022 dollars
Reagents $ 9 $ 5 $ 14
2022 Ausenco Database SX/EW Oxide $ 40 $ 0 $ 40
2022 Ausenco Database SX/EW Sulfide $ 150 $ 60 $ 210
2022 Glencore Technology Industrial Complex (Albion*)
$ 89 $ 0 $ 89
2022 Glencore Technology Sulfur Burner & Acid
Capture $ 76 $ 0 $ 76
Factor PM Recovery $ 20 $ 0 $ 20
10% of Directs, Benchmarked Common Construction (Indirects)
$ 84 $ 54 $ 138
20% of Directs, Benchmarked EPCM & Pre-Operations $ 173 $ 118 $ 291
Phase I – 20% Contingency- Process Plant
$ 224 $ 177 $ 401
TOTAL $ 1,345 $ 621 $ 1,966
Notes: cost estimates derived from earlier engineering work still applicable to the current PEA and escalated to 2022 dollars.
Estimated costs for major mechanical equipment were taken mainly from equipment vendors: Metso Outotec, and Glencore Technology and Ausenco engineering firm’s database. Additional mechanical equipment costs for plant services, mine infrastructure and heap leach conveyance and stacking, were taken from an internal 2019 PEA estimate, and escalated 5% per year to 2022 dollars. Man-hours for installation of the mechanical equipment was assigned and labor rates and efficiencies utilized based on standard North American. Freight costs were factored based on the mechanical equipment supply cost.
Material and erection costs for the structural commodities were factored based on the mechanical equipment supply costs.
An estimate of platework weights was based off similarly scoped projects. Costs per ton of steel were applied to the estimated platework weights for supply and installation.
Piping supply and installation costs were factored based on the mechanical equipment supply costs.
Electrical and Instrumentation supply and installation costs were factored based on the mechanical equipment supply costs.
Building costs were estimated based off similarly scoped projects.
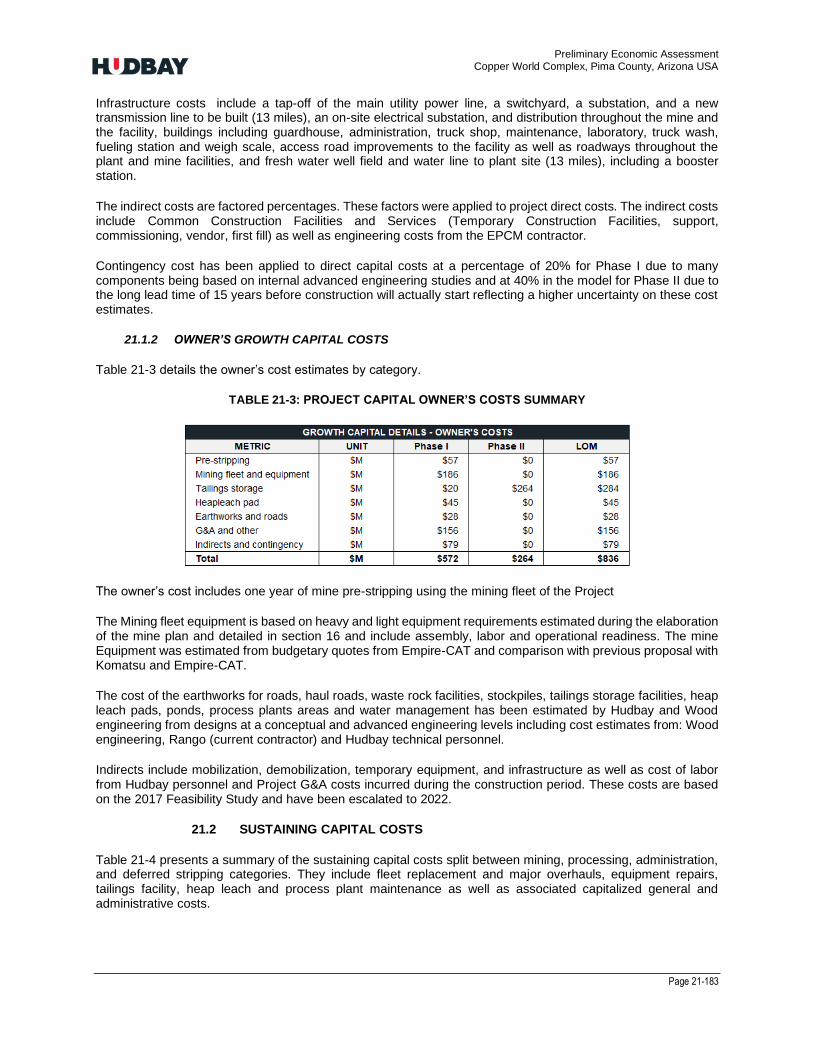
Preliminary Economic Assessment Copper World Complex, Pima County, Arizona USA
Page 21-183
Infrastructure costs include a tap-off of the main utility power line, a switchyard, a substation, and a new transmission line to be built (13 miles), an on-site electrical substation, and distribution throughout the mine and the facility, buildings including guardhouse, administration, truck shop, maintenance, laboratory, truck wash, fueling station and weigh scale, access road improvements to the facility as well as roadways throughout the plant and mine facilities, and fresh water well field and water line to plant site (13 miles), including a booster station.
The indirect costs are factored percentages. These factors were applied to project direct costs. The indirect costs include Common Construction Facilities and Services (Temporary Construction Facilities, support, commissioning, vendor, first fill) as well as engineering costs from the EPCM contractor.
Contingency cost has been applied to direct capital costs at a percentage of 20% for Phase I due to many components being based on internal advanced engineering studies and at 40% in the model for Phase II due to the long lead time of 15 years before construction will actually start reflecting a higher uncertainty on these cost estimates.
21.1.2 OWNER’S GROWTH CAPITAL COSTS
Table 21-3 details the owner’s cost estimates by category.
TABLE 21-3: PROJECT CAPITAL OWNER’S COSTS SUMMARY
The owner’s cost includes one year of mine pre-stripping using the mining fleet of the Project
The Mining fleet equipment is based on heavy and light equipment requirements estimated during the elaboration of the mine plan and detailed in section 16 and include assembly, labor and operational readiness. The mine Equipment was estimated from budgetary quotes from Empire-CAT and comparison with previous proposal with Komatsu and Empire-CAT.
The cost of the earthworks for roads, haul roads, waste rock facilities, stockpiles, tailings storage facilities, heap leach pads, ponds, process plants areas and water management has been estimated by Hudbay and Wood engineering from designs at a conceptual and advanced engineering levels including cost estimates from: Wood engineering, Rango (current contractor) and Hudbay technical personnel.
Indirects include mobilization, demobilization, temporary equipment, and infrastructure as well as cost of labor from Hudbay personnel and Project G&A costs incurred during the construction period. These costs are based on the 2017 Feasibility Study and have been escalated to 2022.
21.2 SUSTAINING CAPITAL COSTS
Table 21-4 presents a summary of the sustaining capital costs split between mining, processing, administration, and deferred stripping categories. They include fleet replacement and major overhauls, equipment repairs, tailings facility, heap leach and process plant maintenance as well as associated capitalized general and administrative costs.
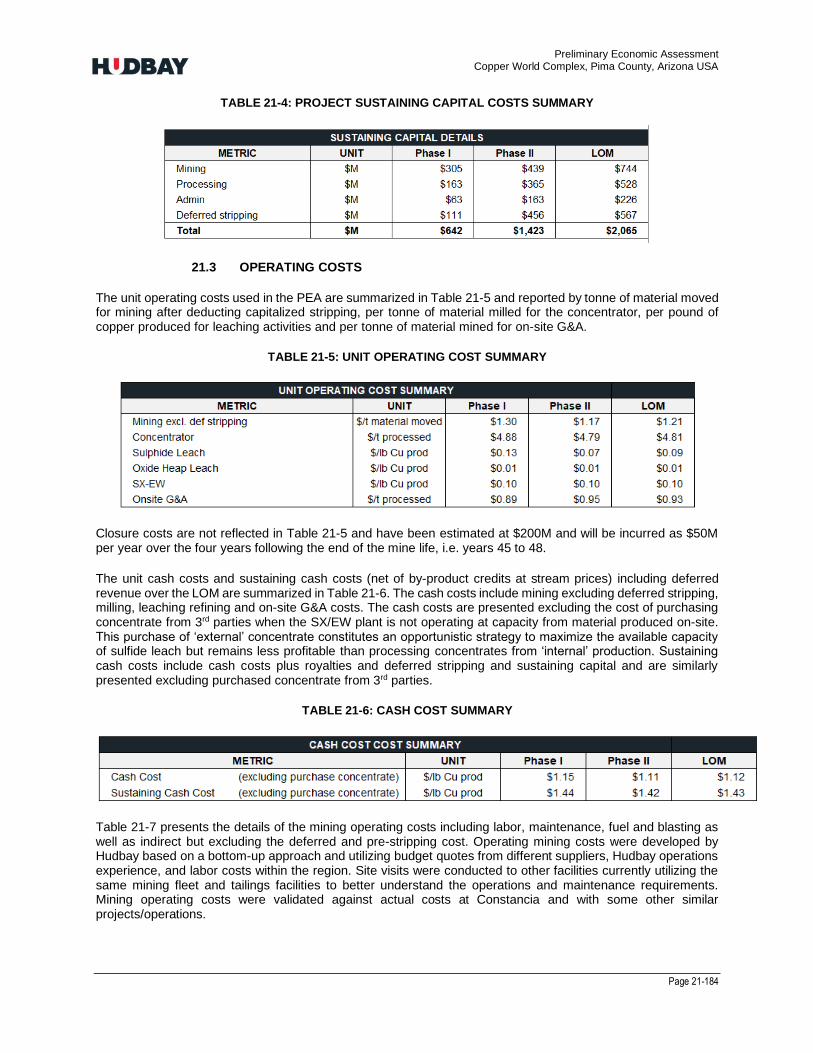
Preliminary Economic Assessment Copper World Complex, Pima County, Arizona USA
Page 21-184
TABLE 21-4: PROJECT SUSTAINING CAPITAL COSTS SUMMARY
21.3 OPERATING COSTS
The unit operating costs used in the PEA are summarized in Table 21-5 and reported by tonne of material moved for mining after deducting capitalized stripping, per tonne of material milled for the concentrator, per pound of copper produced for leaching activities and per tonne of material mined for on-site G&A.
TABLE 21-5: UNIT OPERATING COST SUMMARY
Closure costs are not reflected in Table 21-5 and have been estimated at $200M and will be incurred as $50M per year over the four years following the end of the mine life, i.e. years 45 to 48.
The unit cash costs and sustaining cash costs (net of by-product credits at stream prices) including deferred revenue over the LOM are summarized in Table 21-6. The cash costs include mining excluding deferred stripping, milling, leaching refining and on-site G&A costs. The cash costs are presented excluding the cost of purchasing concentrate from 3rd parties when the SX/EW plant is not operating at capacity from material produced on-site. This purchase of ‘external’ concentrate constitutes an opportunistic strategy to maximize the available capacity of sulfide leach but remains less profitable than processing concentrates from ‘internal’ production. Sustaining cash costs include cash costs plus royalties and deferred stripping and sustaining capital and are similarly presented excluding purchased concentrate from 3rd parties.
TABLE 21-6: CASH COST SUMMARY
Table 21-7 presents the details of the mining operating costs including labor, maintenance, fuel and blasting as well as indirect but excluding the deferred and pre-stripping cost. Operating mining costs were developed by Hudbay based on a bottom-up approach and utilizing budget quotes from different suppliers, Hudbay operations experience, and labor costs within the region. Site visits were conducted to other facilities currently utilizing the same mining fleet and tailings facilities to better understand the operations and maintenance requirements. Mining operating costs were validated against actual costs at Constancia and with some other similar projects/operations.

Preliminary Economic Assessment Copper World Complex, Pima County, Arizona USA
Page 21-185
TABLE 21-7: OPERATING MINING COST
Table 21-8 presents the details of the processing operating costs. These operating costs were derived with a first principles approach and includes bulk sulfide flotation, regrind and cleaning, molybdenum flotation, leaching through the Albion process, sulfur purification and acid burner which covers molten sulfur purchases minus electricity credits, precious metal recovery, Run of Mine (ROM) leaching and solvent extraction and electrowinning.
TABLE 21-8: OPERATING PROCESSING COST
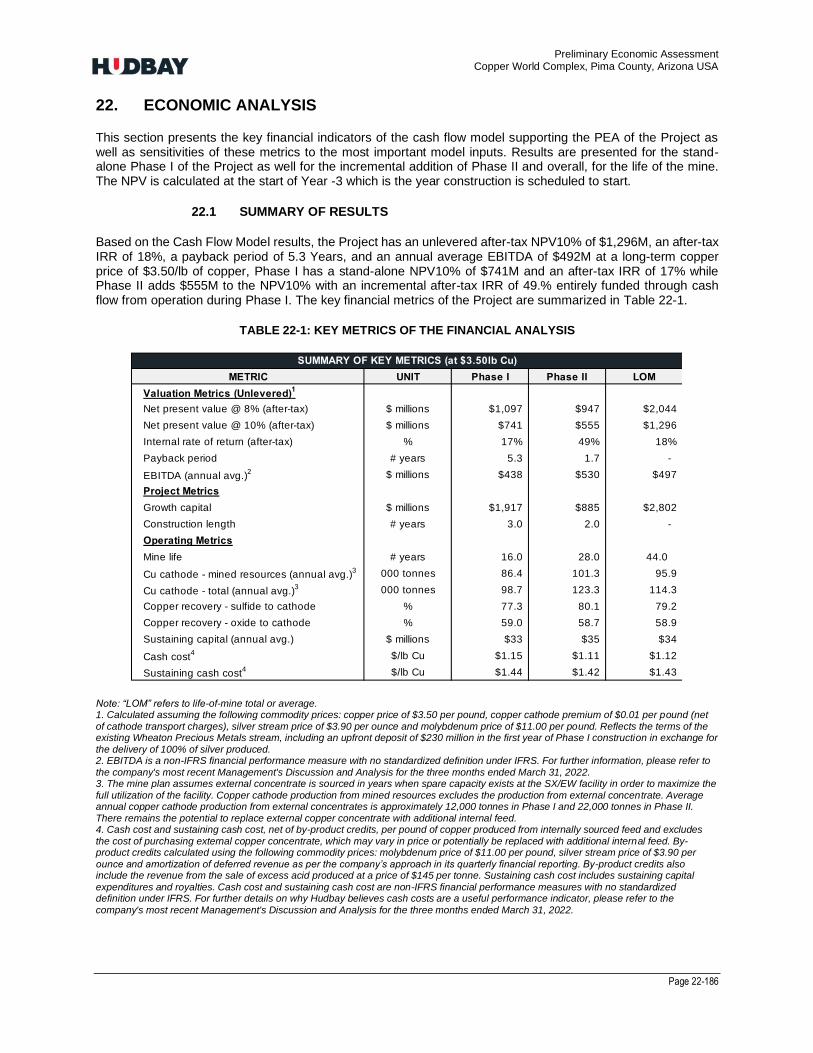
Preliminary Economic Assessment Copper World Complex, Pima County, Arizona USA
Page 22-186
22. ECONOMIC ANALYSIS
This section presents the key financial indicators of the cash flow model supporting the PEA of the Project as well as sensitivities of these metrics to the most important model inputs. Results are presented for the stand-alone Phase I of the Project as well for the incremental addition of Phase II and overall, for the life of the mine. The NPV is calculated at the start of Year -3 which is the year construction is scheduled to start.
22.1 SUMMARY OF RESULTS
Based on the Cash Flow Model results, the Project has an unlevered after-tax NPV10% of $1,296M, an after-tax IRR of 18%, a payback period of 5.3 Years, and an annual average EBITDA of $492M at a long-term copper price of $3.50/lb of copper, Phase I has a stand-alone NPV10% of $741M and an after-tax IRR of 17% while Phase II adds $555M to the NPV10% with an incremental after-tax IRR of 49.% entirely funded through cash flow from operation during Phase I. The key financial metrics of the Project are summarized in Table 22-1.
TABLE 22-1: KEY METRICS OF THE FINANCIAL ANALYSIS
Note: “LOM” refers to life-of-mine total or average. 1. Calculated assuming the following commodity prices: copper price of $3.50 per pound, copper cathode premium of $0.01 per pound (net of cathode transport charges), silver stream price of $3.90 per ounce and molybdenum price of $11.00 per pound. Reflects the terms of the existing Wheaton Precious Metals stream, including an upfront deposit of $230 million in the first year of Phase I construction in exchange for the delivery of 100% of silver produced. 2. EBITDA is a non-IFRS financial performance measure with no standardized definition under IFRS. For further information, please refer to the company's most recent Management's Discussion and Analysis for the three months ended March 31, 2022. 3. The mine plan assumes external concentrate is sourced in years when spare capacity exists at the SX/EW facility in order to maximize the full utilization of the facility. Copper cathode production from mined resources excludes the production from external concentrate. Average annual copper cathode production from external concentrates is approximately 12,000 tonnes in Phase I and 22,000 tonnes in Phase II. There remains the potential to replace external copper concentrate with additional internal feed. 4. Cash cost and sustaining cash cost, net of by-product credits, per pound of copper produced from internally sourced feed and excludes the cost of purchasing external copper concentrate, which may vary in price or potentially be replaced with additional internal feed. By-product credits calculated using the following commodity prices: molybdenum price of $11.00 per pound, silver stream price of $3.90 per ounce and amortization of deferred revenue as per the company’s approach in its quarterly financial reporting. By-product credits also include the revenue from the sale of excess acid produced at a price of $145 per tonne. Sustaining cash cost includes sustaining capital expenditures and royalties. Cash cost and sustaining cash cost are non-IFRS financial performance measures with no standardized definition under IFRS. For further details on why Hudbay believes cash costs are a useful performance indicator, please refer to the company's most recent Management's Discussion and Analysis for the three months ended March 31, 2022.
METRIC UNIT Phase I Phase II LOM
Valuation Metrics (Unlevered)1
Net present value @ 8% (after-tax) $ millions $1,097 $947 $2,044
Net present value @ 10% (after-tax) $ millions $741 $555 $1,296
Internal rate of return (after-tax) % 17% 49% 18%
Payback period # years 5.3 1.7 -
EBITDA (annual avg.)2 $ millions $438 $530 $497
Project Metrics
Growth capital $ millions $1,917 $885 $2,802
Construction length # years 3.0 2.0 -
Operating Metrics
Mine life # years 16.0 28.0 44.0
Cu cathode - mined resources (annual avg.)3 000 tonnes 86.4 101.3 95.9
Cu cathode - total (annual avg.)3 000 tonnes 98.7 123.3 114.3
Copper recovery - sulfide to cathode % 77.3 80.1 79.2
Copper recovery - oxide to cathode % 59.0 58.7 58.9
Sustaining capital (annual avg.) $ millions $33 $35 $34
Cash cost4 $/lb Cu $1.15 $1.11 $1.12
Sustaining cash cost4 $/lb Cu $1.44 $1.42 $1.43
SUMMARY OF KEY METRICS (at $3.50lb Cu)
Note: “LOM” refers to life-of-mine total or average.
1 Calculated assuming the following commodity prices: copper price of $3.50 per pound, copper cathode premium of $0.01 per pound (net of cathode transport charges), silver stream price of $3.90 per ounce and molybdenum price of $11.00 per pound. Reflects the terms of the existing Wheaton Precious Metals stream, including an upfront deposit of $230 million in the first year of Phase I construction in exchange for the delivery of 100% of silver produced.
2 EBITDA is a non-IFRS financial performance measure with no standardized definition under IFRS. For further information, please refer to the
company's most recent Management's Discussion and Analysis for the three months ended March 31, 2022.
3 The mine plan assumes external concentrate is sourced in years when spare capacity exists at the SX/EW facility in order to maximize the full utilization of the facility. Copper cathode production from mined resources excludes the production from external concentrate. Average annual copper cathode production from external concentrates is approximately 12,000 tonnes in Phase I and 22,000 tonnes in Phase II. There remains the potential to replace external copper concentrate with additional internal feed.
4 Cash cost and sustaining cash cost, net of by-product credits, per pound of copper produced from internally sourced feed and excludes the cost of purchasing external copper concentrate, which may vary in price or potentially be replaced with additional internal feed. By-product credits calculated using the following commodity prices: molybdenum price of $11.00 per pound, silver stream price of $3.90 per ounce and amortization of deferred revenue as per the company’s approach in its quarterly financial reporting. By-product credits also include the revenue from the sale of excess acid produced at a price of $145 per tonne. Sustaining cash cost includes sustaining capital expenditures and royalties.
Cash cost and sustaining cash cost are non-IFRS financial performance measures with no standardized definition under IFRS. For further details on why Hudbay believes cash costs are a useful performance indicator, please refer to the company's most recent Management's Discussion and Analysis for the three months ended March 31, 2022.
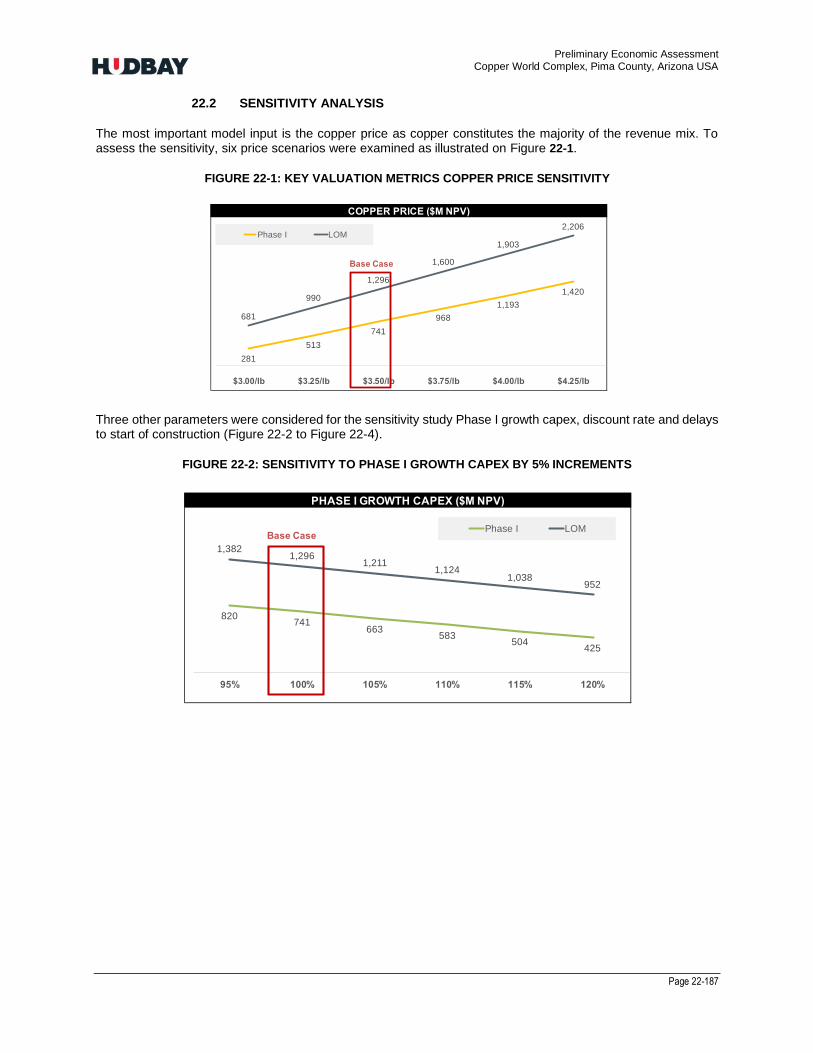
Preliminary Economic Assessment Copper World Complex, Pima County, Arizona USA
Page 22-187
22.2 SENSITIVITY ANALYSIS
The most important model input is the copper price as copper constitutes the majority of the revenue mix. To assess the sensitivity, six price scenarios were examined as illustrated on Figure 22-1.
FIGURE 22-1: KEY VALUATION METRICS COPPER PRICE SENSITIVITY
Three other parameters were considered for the sensitivity study Phase I growth capex, discount rate and delays to start of construction (Figure 22-2 to Figure 22-4).
FIGURE 22-2: SENSITIVITY TO PHASE I GROWTH CAPEX BY 5% INCREMENTS
COPPER PRICE ($M NPV) DISCOUNT RATE ($M NPV)
281
513
741
968
1,193
1,420
681
990
1,296
1,600
1,903
2,206
$3.00/lb $3.25/lb $3.50/lb $3.75/lb $4.00/lb $4.25/lb
Phase I LOM
Base Case
PHASE I GROWTH CAPEX ($M NPV) DELAYS TO CONSTRUCTION START ($M NPV)
820 741
663 583
504 425
1,382 1,296
1,211 1,124
1,038 952
95% 100% 105% 110% 115% 120%
Phase I LOMBase Case
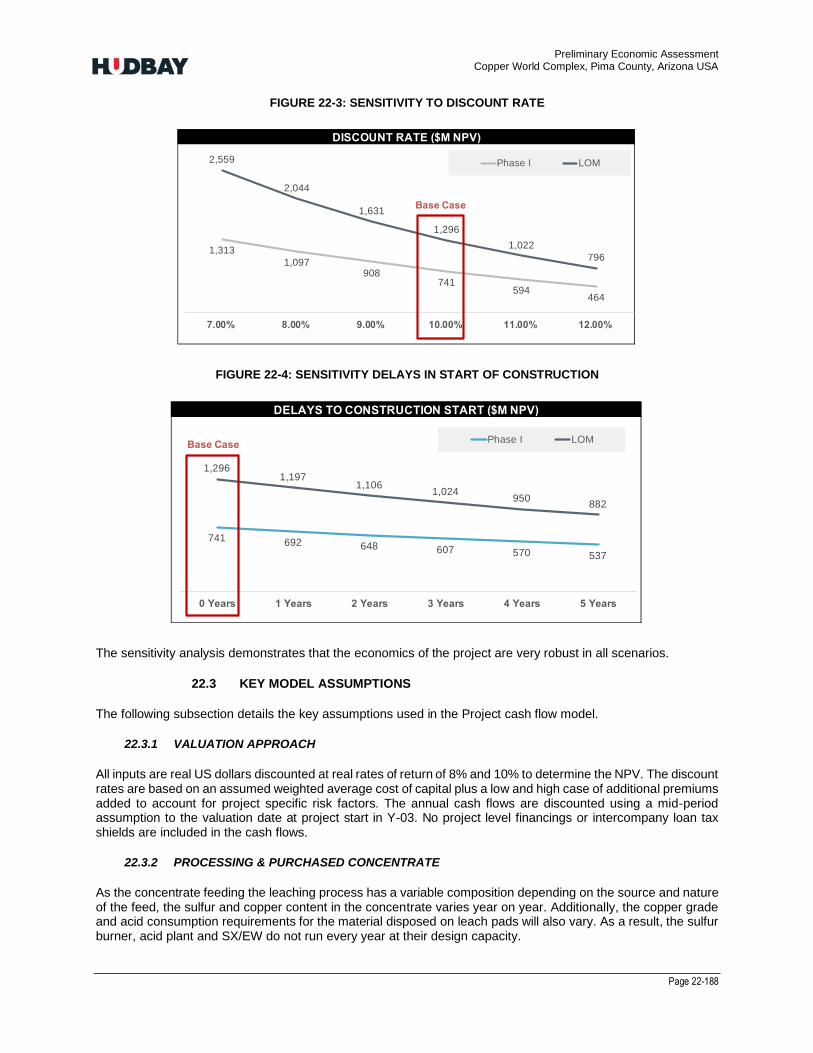
Preliminary Economic Assessment Copper World Complex, Pima County, Arizona USA
Page 22-188
FIGURE 22-3: SENSITIVITY TO DISCOUNT RATE
FIGURE 22-4: SENSITIVITY DELAYS IN START OF CONSTRUCTION
The sensitivity analysis demonstrates that the economics of the project are very robust in all scenarios.
22.3 KEY MODEL ASSUMPTIONS
The following subsection details the key assumptions used in the Project cash flow model.
22.3.1 VALUATION APPROACH
All inputs are real US dollars discounted at real rates of return of 8% and 10% to determine the NPV. The discount rates are based on an assumed weighted average cost of capital plus a low and high case of additional premiums added to account for project specific risk factors. The annual cash flows are discounted using a mid-period assumption to the valuation date at project start in Y-03. No project level financings or intercompany loan tax shields are included in the cash flows.
22.3.2 PROCESSING & PURCHASED CONCENTRATE
As the concentrate feeding the leaching process has a variable composition depending on the source and nature of the feed, the sulfur and copper content in the concentrate varies year on year. Additionally, the copper grade and acid consumption requirements for the material disposed on leach pads will also vary. As a result, the sulfur burner, acid plant and SX/EW do not run every year at their design capacity.
DISCOUNT RATE ($M NPV)
1,313
1,097 908
741 594
464
2,559
2,044
1,631
1,296
1,022
796
7.00% 8.00% 9.00% 10.00% 11.00% 12.00%
Phase I LOM
Base Case
DELAYS TO CONSTRUCTION START ($M NPV)
741 692 648 607 570 537
1,296 1,197
1,106 1,024
950 882
0 Years 1 Years 2 Years 3 Years 4 Years 5 Years
Phase I LOMBase Case

Preliminary Economic Assessment Copper World Complex, Pima County, Arizona USA
Page 22-189
When the sulfur content in concentrate is insufficient to produce all the acid requirements for the project, molten sulfur is purchased at a delivered to mine price of $215/tonne as described in section 19. Conversely, when sulfuric acid production exceeds the acid demand from the leach pads, the excess production is sold at local market price.
A value enhancing option is included in the model related to the large capacity of the leach plant which is typically not fully reached from processing internally sources of feed. When the leach plant has room, 3rd party copper concentrate is assumed purchased from local producers to top it up to the lesser of the leach plant or Electrowinning plating capacity (in most years the plating capacity is reached before the leach plant capacity due to the higher copper grade of purchased concentrate). This additional concentrate feed could also be strategically sourced from Hudbay’s other current and/or future operations providing the advantages of fully vertically integrated production and resultant synergies to Hudbay as a whole.
A significant upside opportunity not included in the model relates to the Electrowinning plating capacity. If additional Capex is invested at the start of the mine life to expand the capacity of the SX/EW plant, it would provide the needed plating capacity to completely fill the leach plant every year with purchased concentrate. The result would be a significant increase in finished cathode production with a small increase in initial capital and annual fixed cost, but this option has not been considered in the PEA.
Overall, 3rd party concentrate contributes less than 10% of the total value of the project and, while providing an attractive incremental profit margin per unit, does not provide as high a profit margin per unit as processing internally sources of feed.
22.3.3 METAL PRICE AND OTHER MARKETING ASSUMPTIONS
The metal price and other marketing assumptions used in this economic evaluation have been detailed in tables 19-1 and 19-2 with the supporting assumptions discussed as well in section 19 of this report.
22.3.4 ROYALTY
A net smelter return (NSR) royalty of 3.0% exists on the Project and is included in the economic analysis. The calculation of the royalty includes revenues from the sale of products processed from internally mined resources, assumes silver is sold at the market price, deducts offsite costs, and for finished cathodes includes customary smelter/refinery deductions for payability, treatment, refining, and freight capture.
22.3.5 STREAM
The Project is subject to a precious metal streaming agreement with Wheaton. Given certain ambiguities in the contract arising from the change in the development plan for the Project since the 2017 Feasibility Study, Hudbay and Wheaton have commenced discussions regarding a possible restructuring of the stream agreement based upon the new mine plan and processing plant design.
For the purposes of the PEA, the existing Stream arrangement terms have been included in the cash flow model. These terms include an upfront deposit of $230M to be received from Wheaton in the first year of Phase I project construction in exchange for delivery of 100% of the silver and gold produced from internally mined resources over the mine life. As silver and gold is delivered to Wheaton, Hudbay will receive cash payments equal to the lesser of (i) the market price and (ii) $3.90 per ounce for silver and $450 per ounce for gold, subject to a one percent contracted annual escalator after three years. Given gold has not been included in the resource model, there are no deliveries of gold to Wheaton included in the cash flow model.
22.3.6 FEDERAL AND STATE TAXES
Taxable income for federal income tax purposes is defined as cash revenues minus offsite costs, operating costs, royalties, tax depreciation, depletion, state taxes, and net operating loss (NOL) carry forwards. Taxable income is multiplied by the prevailing federal tax rate of 21% to determine cash taxes payable. Cash taxes are assumed paid in the year incurred. Tax depreciation rates are shown below in Table 22-2. Taxable income for state income tax purposes is defined the same except there is no deduction for state taxes and the applicable tax rate is 3.87% given 100% apportionment to Arizona.

Preliminary Economic Assessment Copper World Complex, Pima County, Arizona USA
Page 22-190
TABLE 22-2: INCOME TAX DEPRECIATION RATES
Federal and State NOL carry forwards are included in the model related to past operating losses incurred and deductible from future taxable income. Similarly, tax pool balances arising from project development activities to the end of 2021 are included as opening balances and depreciated according to applicable income tax depreciation rates (refer Table 22-2).
State severance and property taxes are calculated using applicable rates shown below in Table 22-3. Property tax is modeled separately for Phase I and Phase II utilizing the cost approach, for the first and last five years of each phase, and a 50/50 pro rata split between income and cost approaches for the intervening years of each phase.
Base Erosion and Anti Abuse (BEAT) tax and section 163(j) limitation on business interest deduction are not applicable as this is an unlevered model and does not include any intercompany interest tax shield that may be available if the project is funded via debt from corporate parent.
The Biden administration recently disclosed it is preparing a tax reform bill that could result in an increase to the Federal corporate tax rate and other changes. Due to significant uncertainty at the report date, no changes have been included in the cash flow model.

Preliminary Economic Assessment Copper World Complex, Pima County, Arizona USA
Page 22-191
TABLE 22-3: OTHER TAX ASSUMPTIONS
22.3.7 WORKING CAPITAL CHANGES
Working capital for accounts receivable and accounts payable will vary over the mine life based on revenue, operating costs and capital costs. The turnover rate is 40 days for accounts receivable and 67 days for accounts payable based on a four-year average of actual results at our Canadian and Peruvian business units adjusted to account for expected accelerated payments to prime contractors under the Arizona Prompt Pay Act. Finished goods inventory turnover is not modeled as production is assumed to equal sales.
All the working capital is assumed to be recaptured by the end of the mine life and the closing value of the accounts is zero. First fills of consumables and other operating supplies are included in project capital.
22.4 PRODUCTION PROFILE AND COST OF PRODUCTION
Figure 22-5 shows for Phase I the copper cathode production from both the projects and from 3rd party sources as well as the cash cost and the all-in sustaining cost per pound of copper. The Project produces 100,000 tonnes of copper cathodes annually in a consistent manner with the exception of year 3 due to an unusually high sulfide content in the concentrate at a cash cost of $1.15/lb of copper excluding the cost of purchasing external concentrate. During the first 6 years, approximately 20-25% of cathode production is sourced from external feed. Starting in year 7, the proportion of 3rd party concentrate decreases significantly as the production from higher grade areas reduces the available SX/EW capacity. The unit all-in sustaining cost averages $1.44/lb of copper during Phase I.
Figure 22-6 shows a similar production and cost profile for Phase II with the proportion of 3rd party feed being purchased to keep the acid burner and the SX/EW facilities at capacity varying depending on the copper grade mined from the Project. The unit cash cost averages $1.11/lb of copper during this phase. With the increased milling and SX/EW capacity during Phase II, the copper cathode production achieves the targeted 140,000 tonnes annually in many years. There are a few years where the maximum SX/EW capacity is marginally exceeded. This is deemed acceptable for a PEA and easily adjustable with little additional work in smoothing the
METRIC UNIT Phase I
Federal Income Tax
Income tax rate % 21.00%
Depletion - Federal rate % 15.00%
Depletion - net income limitation % 50.00%
State Income Tax
Income tax rate % 3.87%
Basis rate % 50.00%
Severance tax rate % 3.00%
Property Tax
Discount rate % 12.30%
Assessment ratio % 16.00%
Estimated primary tax rate % 14.43%
Income taxes allowed % 21.00%
Capex deduction per year % 10.00%
Opening Balance - NOLs
Federal $M $112
State $M $95
Opening Balance - Tax Pools
Mine development $M $277
Capitalized Exploration $M $27
Mineral Property $M $168
OTHER TAX ASSUMPTIONS
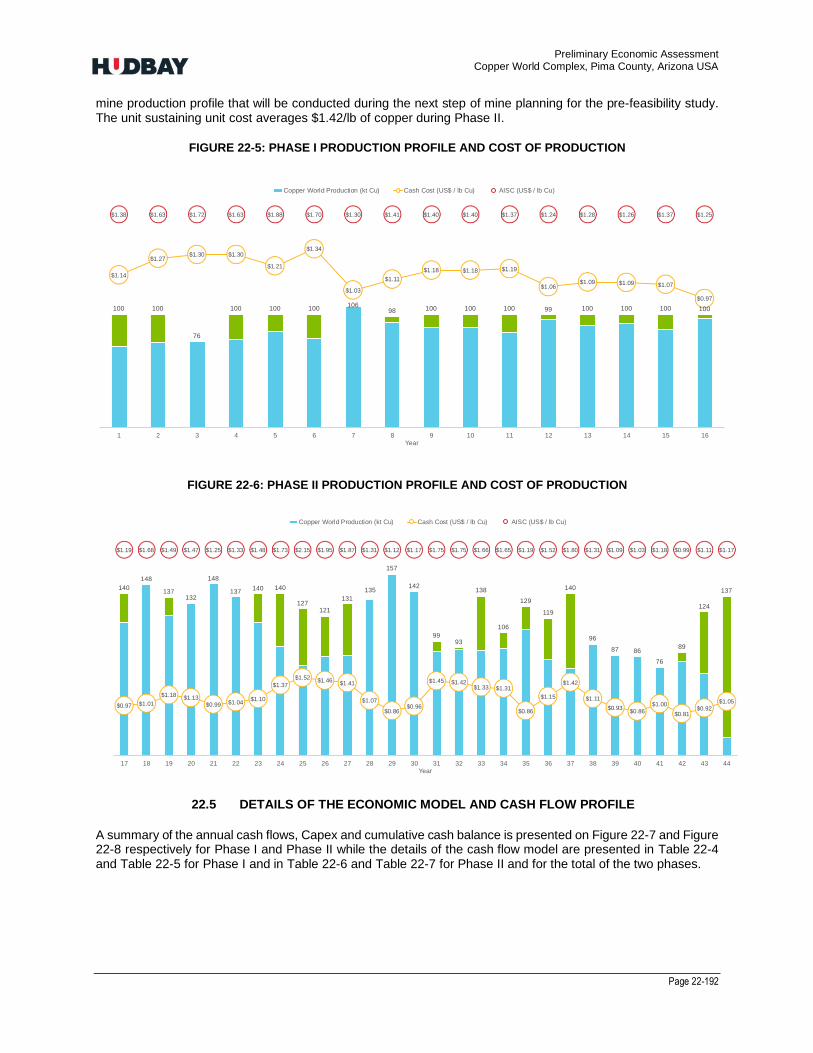
Preliminary Economic Assessment Copper World Complex, Pima County, Arizona USA
Page 22-192
mine production profile that will be conducted during the next step of mine planning for the pre-feasibility study. The unit sustaining unit cost averages $1.42/lb of copper during Phase II.
FIGURE 22-5: PHASE I PRODUCTION PROFILE AND COST OF PRODUCTION
FIGURE 22-6: PHASE II PRODUCTION PROFILE AND COST OF PRODUCTION
22.5 DETAILS OF THE ECONOMIC MODEL AND CASH FLOW PROFILE
A summary of the annual cash flows, Capex and cumulative cash balance is presented on Figure 22-7 and Figure 22-8 respectively for Phase I and Phase II while the details of the cash flow model are presented in Table 22-4 and Table 22-5 for Phase I and in Table 22-6 and Table 22-7 for Phase II and for the total of the two phases.
100 100
76
100 100 100 106
98 100 100 100 99 100 100 100 100
$1.14
$1.27 $1.30 $1.30
$1.21
$1.34
$1.03
$1.11
$1.18 $1.18 $1.19
$1.06 $1.09 $1.09 $1.07
$0.97
$1.38 $1.63 $1.72 $1.63 $1.88 $1.70 $1.30 $1.41 $1.40 $1.40 $1.37 $1.24 $1.28 $1.26 $1.37 $1.25
1 2 3 4 5 6 7 8 9 10 11 12 13 14 15 16Year
Copper World Production (kt Cu) Cash Cost (US$ / lb Cu) AISC (US$ / lb Cu)
140
148
137 132
148
137 140 140
127 121
131
135
157
142
99 93
138
106
129
119
140
96
87 86
76
89
124
137
$0.97 $1.01
$1.18 $1.13 $0.99 $1.04
$1.10
$1.37
$1.52 $1.46 $1.41
$1.07
$0.86 $0.96
$1.45 $1.42 $1.33 $1.31
$0.86
$1.15
$1.42
$1.11
$0.93 $0.86
$1.00
$0.81 $0.92
$1.05
$1.19 $1.68 $1.49 $1.47 $1.25 $1.33 $1.48 $1.73 $2.15 $1.95 $1.87 $1.31 $1.12 $1.17 $1.75 $1.75 $1.66 $1.65 $1.19 $1.52 $1.80 $1.31 $1.09 $1.03 $1.18 $0.99 $1.11 $1.17
17 18 19 20 21 22 23 24 25 26 27 28 29 30 31 32 33 34 35 36 37 38 39 40 41 42 43 44Year
Copper World Production (kt Cu) Cash Cost (US$ / lb Cu) AISC (US$ / lb Cu)
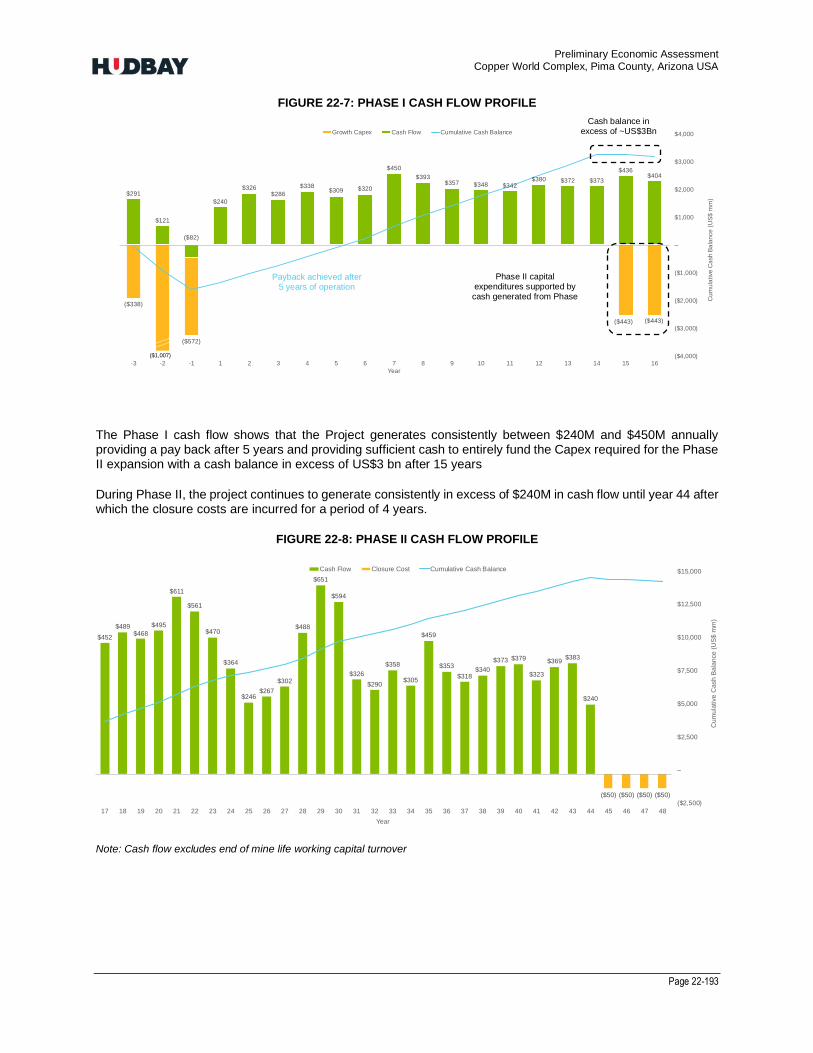
Preliminary Economic Assessment Copper World Complex, Pima County, Arizona USA
Page 22-193
FIGURE 22-7: PHASE I CASH FLOW PROFILE
The Phase I cash flow shows that the Project generates consistently between $240M and $450M annually providing a pay back after 5 years and providing sufficient cash to entirely fund the Capex required for the Phase II expansion with a cash balance in excess of US$3 bn after 15 years
During Phase II, the project continues to generate consistently in excess of $240M in cash flow until year 44 after which the closure costs are incurred for a period of 4 years.
FIGURE 22-8: PHASE II CASH FLOW PROFILE
Note: Cash flow excludes end of mine life working capital turnover
($338)
($572)
($443) ($443)
$291
$121
($82)
$240
$326 $286
$338 $309 $320
$450
$393 $357 $348 $342
$380 $372 $373
$436 $404
($4,000)
($3,000)
($2,000)
($1,000)
–
$1,000
$2,000
$3,000
$4,000
-3 -2 -1 1 2 3 4 5 6 7 8 9 10 11 12 13 14 15 16
Cu
mu
lative
Ca
sh
Ba
lan
ce
(U
S$
mm
)
Year
Growth Capex Cash Flow Cumulative Cash Balance
($1,007)
$452
$489 $468
$495
$611
$561
$470
$364
$246 $267
$302
$488
$651
$594
$326
$290
$358
$305
$459
$353
$318 $340
$373 $379
$323
$369 $383
$240
($50) ($50) ($50) ($50)
($2,500)
–
$2,500
$5,000
$7,500
$10,000
$12,500
$15,000
17 18 19 20 21 22 23 24 25 26 27 28 29 30 31 32 33 34 35 36 37 38 39 40 41 42 43 44 45 46 47 48
Cu
mu
lative
Cash
Ba
lan
ce
(U
S$
mm
)
Year
Cash Flow Closure Cost Cumulative Cash Balance
Cash balance in excess of ~US$3Bn
Phase II capital expenditures supported by cash generated from Phase
I
Payback achieved after 5 years of operation
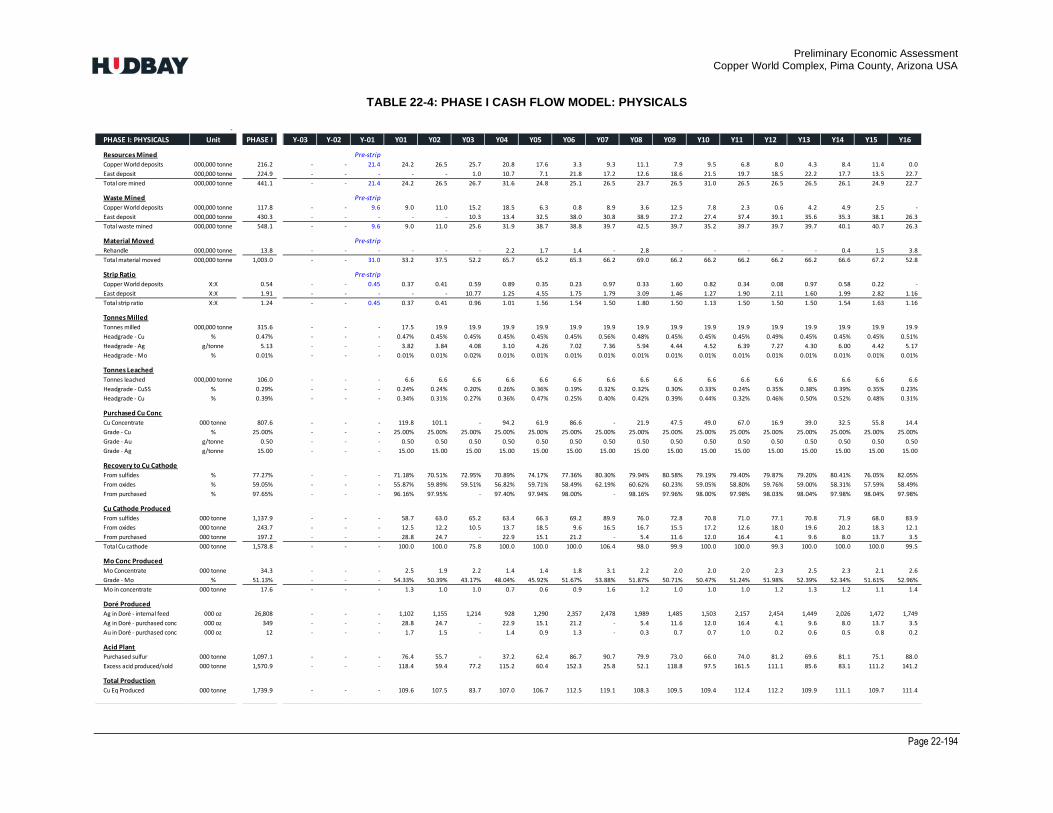
Preliminary Economic Assessment Copper World Complex, Pima County, Arizona USA
Page 22-194
TABLE 22-4: PHASE I CASH FLOW MODEL: PHYSICALS
-
PHASE I: PHYSICALS Unit PHASE I Y-03 Y-02 Y-01 Y01 Y02 Y03 Y04 Y05 Y06 Y07 Y08 Y09 Y10 Y11 Y12 Y13 Y14 Y15 Y16
Resources Mined Pre-strip
Copper World deposits 000,000 tonne 216.2 - - 21.4 24.2 26.5 25.7 20.8 17.6 3.3 9.3 11.1 7.9 9.5 6.8 8.0 4.3 8.4 11.4 0.0
East deposit 000,000 tonne 224.9 - - - - - 1.0 10.7 7.1 21.8 17.2 12.6 18.6 21.5 19.7 18.5 22.2 17.7 13.5 22.7
Total ore mined 000,000 tonne 441.1 - - 21.4 24.2 26.5 26.7 31.6 24.8 25.1 26.5 23.7 26.5 31.0 26.5 26.5 26.5 26.1 24.9 22.7
Waste Mined Pre-strip
Copper World deposits 000,000 tonne 117.8 - - 9.6 9.0 11.0 15.2 18.5 6.3 0.8 8.9 3.6 12.5 7.8 2.3 0.6 4.2 4.9 2.5 -
East deposit 000,000 tonne 430.3 - - - - - 10.3 13.4 32.5 38.0 30.8 38.9 27.2 27.4 37.4 39.1 35.6 35.3 38.1 26.3
Total waste mined 000,000 tonne 548.1 - - 9.6 9.0 11.0 25.6 31.9 38.7 38.8 39.7 42.5 39.7 35.2 39.7 39.7 39.7 40.1 40.7 26.3
Material Moved Pre-strip
Rehandle 000,000 tonne 13.8 - - - - - - 2.2 1.7 1.4 - 2.8 - - - - - 0.4 1.5 3.8
Total material moved 000,000 tonne 1,003.0 - - 31.0 33.2 37.5 52.2 65.7 65.2 65.3 66.2 69.0 66.2 66.2 66.2 66.2 66.2 66.6 67.2 52.8
Strip Ratio Pre-strip
Copper World deposits X:X 0.54 - - 0.45 0.37 0.41 0.59 0.89 0.35 0.23 0.97 0.33 1.60 0.82 0.34 0.08 0.97 0.58 0.22 -
East deposit X:X 1.91 - - - - - 10.77 1.25 4.55 1.75 1.79 3.09 1.46 1.27 1.90 2.11 1.60 1.99 2.82 1.16
Total strip ratio X:X 1.24 - - 0.45 0.37 0.41 0.96 1.01 1.56 1.54 1.50 1.80 1.50 1.13 1.50 1.50 1.50 1.54 1.63 1.16
Tonnes Milled
Tonnes milled 000,000 tonne 315.6 - - - 17.5 19.9 19.9 19.9 19.9 19.9 19.9 19.9 19.9 19.9 19.9 19.9 19.9 19.9 19.9 19.9
Headgrade - Cu % 0.47% - - - 0.47% 0.45% 0.45% 0.45% 0.45% 0.45% 0.56% 0.48% 0.45% 0.45% 0.45% 0.49% 0.45% 0.45% 0.45% 0.51%
Headgrade - Ag g/tonne 5.13 - - - 3.82 3.84 4.08 3.10 4.26 7.02 7.36 5.94 4.44 4.52 6.39 7.27 4.30 6.00 4.42 5.17
Headgrade - Mo % 0.01% - - - 0.01% 0.01% 0.02% 0.01% 0.01% 0.01% 0.01% 0.01% 0.01% 0.01% 0.01% 0.01% 0.01% 0.01% 0.01% 0.01%
Tonnes Leached
Tonnes leached 000,000 tonne 106.0 - - - 6.6 6.6 6.6 6.6 6.6 6.6 6.6 6.6 6.6 6.6 6.6 6.6 6.6 6.6 6.6 6.6
Headgrade - CuSS % 0.29% - - - 0.24% 0.24% 0.20% 0.26% 0.36% 0.19% 0.32% 0.32% 0.30% 0.33% 0.24% 0.35% 0.38% 0.39% 0.35% 0.23%
Headgrade - Cu % 0.39% - - - 0.34% 0.31% 0.27% 0.36% 0.47% 0.25% 0.40% 0.42% 0.39% 0.44% 0.32% 0.46% 0.50% 0.52% 0.48% 0.31%
Purchased Cu Conc
Cu Concentrate 000 tonne 807.6 - - - 119.8 101.1 - 94.2 61.9 86.6 - 21.9 47.5 49.0 67.0 16.9 39.0 32.5 55.8 14.4
Grade - Cu % 25.00% - - - 25.00% 25.00% 25.00% 25.00% 25.00% 25.00% 25.00% 25.00% 25.00% 25.00% 25.00% 25.00% 25.00% 25.00% 25.00% 25.00%
Grade - Au g/tonne 0.50 - - - 0.50 0.50 0.50 0.50 0.50 0.50 0.50 0.50 0.50 0.50 0.50 0.50 0.50 0.50 0.50 0.50
Grade - Ag g/tonne 15.00 - - - 15.00 15.00 15.00 15.00 15.00 15.00 15.00 15.00 15.00 15.00 15.00 15.00 15.00 15.00 15.00 15.00
Recovery to Cu Cathode
From sulfides % 77.27% - - - 71.18% 70.51% 72.95% 70.89% 74.17% 77.36% 80.30% 79.94% 80.58% 79.19% 79.40% 79.87% 79.20% 80.41% 76.05% 82.05%
From oxides % 59.05% - - - 55.87% 59.89% 59.51% 56.82% 59.71% 58.49% 62.19% 60.62% 60.23% 59.05% 58.80% 59.76% 59.00% 58.31% 57.59% 58.49%
From purchased % 97.65% - - - 96.16% 97.95% - 97.40% 97.94% 98.00% - 98.16% 97.96% 98.00% 97.98% 98.03% 98.04% 97.98% 98.04% 97.98%
Cu Cathode Produced
From sulfides 000 tonne 1,137.9 - - - 58.7 63.0 65.2 63.4 66.3 69.2 89.9 76.0 72.8 70.8 71.0 77.1 70.8 71.9 68.0 83.9
From oxides 000 tonne 243.7 - - - 12.5 12.2 10.5 13.7 18.5 9.6 16.5 16.7 15.5 17.2 12.6 18.0 19.6 20.2 18.3 12.1
From purchased 000 tonne 197.2 - - - 28.8 24.7 - 22.9 15.1 21.2 - 5.4 11.6 12.0 16.4 4.1 9.6 8.0 13.7 3.5
Total Cu cathode 000 tonne 1,578.8 - - - 100.0 100.0 75.8 100.0 100.0 100.0 106.4 98.0 99.9 100.0 100.0 99.3 100.0 100.0 100.0 99.5
Mo Conc Produced
Mo Concentrate 000 tonne 34.3 - - - 2.5 1.9 2.2 1.4 1.4 1.8 3.1 2.2 2.0 2.0 2.0 2.3 2.5 2.3 2.1 2.6
Grade - Mo % 51.13% - - - 54.33% 50.39% 43.17% 48.04% 45.92% 51.67% 53.88% 51.87% 50.71% 50.47% 51.24% 51.98% 52.39% 52.34% 51.61% 52.96%
Mo in concentrate 000 tonne 17.6 - - - 1.3 1.0 1.0 0.7 0.6 0.9 1.6 1.2 1.0 1.0 1.0 1.2 1.3 1.2 1.1 1.4
Doré Produced
Ag in Doré - internal feed 000 oz 26,808 - - - 1,102 1,155 1,214 928 1,290 2,357 2,478 1,989 1,485 1,503 2,157 2,454 1,449 2,026 1,472 1,749
Ag in Doré - purchased conc 000 oz 349 - - - 28.8 24.7 - 22.9 15.1 21.2 - 5.4 11.6 12.0 16.4 4.1 9.6 8.0 13.7 3.5
Au in Doré - purchased conc 000 oz 12 - - - 1.7 1.5 - 1.4 0.9 1.3 - 0.3 0.7 0.7 1.0 0.2 0.6 0.5 0.8 0.2
Acid Plant
Purchased sulfur 000 tonne 1,097.1 - - - 76.4 55.7 - 37.2 62.4 86.7 90.7 79.9 73.0 66.0 74.0 81.2 69.6 81.1 75.1 88.0
Excess acid produced/sold 000 tonne 1,570.9 - - - 118.4 59.4 77.2 115.2 60.4 152.3 25.8 52.1 118.8 97.5 161.5 111.1 85.6 83.1 111.2 141.2
Total Production
Cu Eq Produced 000 tonne 1,739.9 - - - 109.6 107.5 83.7 107.0 106.7 112.5 119.1 108.3 109.5 109.4 112.4 112.2 109.9 111.1 109.7 111.4
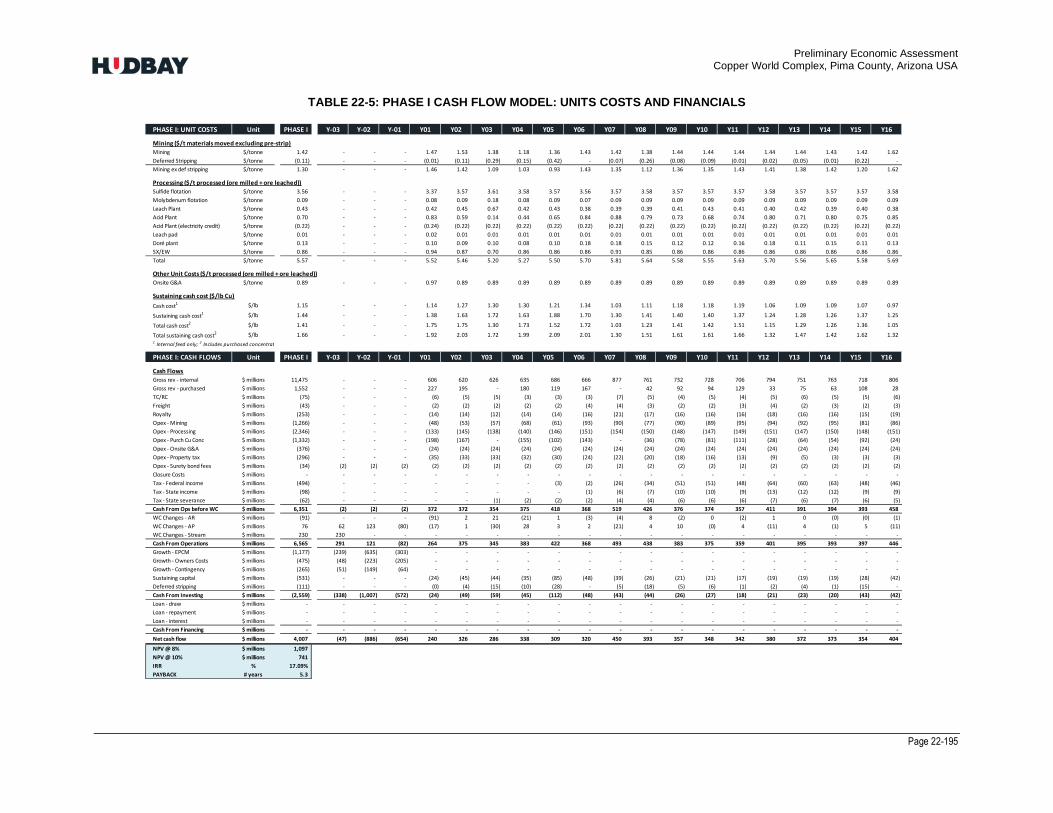
Preliminary Economic Assessment Copper World Complex, Pima County, Arizona USA
Page 22-195
TABLE 22-5: PHASE I CASH FLOW MODEL: UNITS COSTS AND FINANCIALS
Cu Eq Produced 000 tonne 1,739.9 - - - 109.6 107.5 83.7 107.0 106.7 112.5 119.1 108.3 109.5 109.4 112.4 112.2 109.9 111.1 109.7 111.4
PHASE I: UNIT COSTS Unit PHASE I Y-03 Y-02 Y-01 Y01 Y02 Y03 Y04 Y05 Y06 Y07 Y08 Y09 Y10 Y11 Y12 Y13 Y14 Y15 Y16
Mining ($/t materials moved excluding pre-strip)
Mining $/tonne 1.42 - - - 1.47 1.53 1.38 1.18 1.36 1.43 1.42 1.38 1.44 1.44 1.44 1.44 1.44 1.43 1.42 1.62
Deferred Stripping $/tonne (0.11) - - - (0.01) (0.11) (0.29) (0.15) (0.42) - (0.07) (0.26) (0.08) (0.09) (0.01) (0.02) (0.05) (0.01) (0.22) -
Mining ex def stripping $/tonne 1.30 - - - 1.46 1.42 1.09 1.03 0.93 1.43 1.35 1.12 1.36 1.35 1.43 1.41 1.38 1.42 1.20 1.62
Processing ($/t processed (ore milled + ore leached))
Sulfide flotation $/tonne 3.56 - - - 3.37 3.57 3.61 3.58 3.57 3.56 3.57 3.58 3.57 3.57 3.57 3.58 3.57 3.57 3.57 3.58
Molybdenum flotation $/tonne 0.09 - - - 0.08 0.09 0.18 0.08 0.09 0.07 0.09 0.09 0.09 0.09 0.09 0.09 0.09 0.09 0.09 0.09
Leach Plant $/tonne 0.43 - - - 0.42 0.45 0.67 0.42 0.43 0.38 0.39 0.39 0.41 0.43 0.41 0.40 0.42 0.39 0.40 0.38
Acid Plant $/tonne 0.70 - - - 0.83 0.59 0.14 0.44 0.65 0.84 0.88 0.79 0.73 0.68 0.74 0.80 0.71 0.80 0.75 0.85
Acid Plant (electricity credit) $/tonne (0.22) - - - (0.24) (0.22) (0.22) (0.22) (0.22) (0.22) (0.22) (0.22) (0.22) (0.22) (0.22) (0.22) (0.22) (0.22) (0.22) (0.22)
Leach pad $/tonne 0.01 - - - 0.02 0.01 0.01 0.01 0.01 0.01 0.01 0.01 0.01 0.01 0.01 0.01 0.01 0.01 0.01 0.01
Doré plant $/tonne 0.13 - - - 0.10 0.09 0.10 0.08 0.10 0.18 0.18 0.15 0.12 0.12 0.16 0.18 0.11 0.15 0.11 0.13
SX/EW $/tonne 0.86 - - - 0.94 0.87 0.70 0.86 0.86 0.86 0.91 0.85 0.86 0.86 0.86 0.86 0.86 0.86 0.86 0.86
Total $/tonne 5.57 - - - 5.52 5.46 5.20 5.27 5.50 5.70 5.81 5.64 5.58 5.55 5.63 5.70 5.56 5.65 5.58 5.69
Other Unit Costs ($/t processed (ore milled + ore leached))
Onsite G&A $/tonne 0.89 - - - 0.97 0.89 0.89 0.89 0.89 0.89 0.89 0.89 0.89 0.89 0.89 0.89 0.89 0.89 0.89 0.89
Sustaining cash cost ($/lb Cu)
Cash cost1 $/lb 1.15 - - - 1.14 1.27 1.30 1.30 1.21 1.34 1.03 1.11 1.18 1.18 1.19 1.06 1.09 1.09 1.07 0.97
Sustaining cash cost1 $/lb 1.44 - - - 1.38 1.63 1.72 1.63 1.88 1.70 1.30 1.41 1.40 1.40 1.37 1.24 1.28 1.26 1.37 1.25
Total cash cost2 $/lb 1.41 - - - 1.75 1.75 1.30 1.73 1.52 1.72 1.03 1.23 1.41 1.42 1.51 1.15 1.29 1.26 1.36 1.05
Total sustaining cash cost2 $/lb 1.66 - - - 1.92 2.03 1.72 1.99 2.09 2.01 1.30 1.51 1.61 1.61 1.66 1.32 1.47 1.42 1.62 1.321 Internal feed only; 2 Includes purchased concentrate
PHASE I: CASH FLOWS Unit PHASE I Y-03 Y-02 Y-01 Y01 Y02 Y03 Y04 Y05 Y06 Y07 Y08 Y09 Y10 Y11 Y12 Y13 Y14 Y15 Y16
Cash Flows
Gross rev - internal $ millions 11,475 - - - 606 620 626 635 686 666 877 761 732 728 706 794 751 763 718 806
Gross rev - purchased $ millions 1,552 - - - 227 195 - 180 119 167 - 42 92 94 129 33 75 63 108 28
TC/RC $ millions (75) - - - (6) (5) (5) (3) (3) (3) (7) (5) (4) (5) (4) (5) (6) (5) (5) (6)
Freight $ millions (43) - - - (2) (2) (2) (2) (2) (4) (4) (3) (2) (2) (3) (4) (2) (3) (2) (3)
Royalty $ millions (253) - - - (14) (14) (12) (14) (14) (16) (21) (17) (16) (16) (16) (18) (16) (16) (15) (19)
Opex - Mining $ millions (1,266) - - - (48) (53) (57) (68) (61) (93) (90) (77) (90) (89) (95) (94) (92) (95) (81) (86)
Opex - Processing $ millions (2,346) - - - (133) (145) (138) (140) (146) (151) (154) (150) (148) (147) (149) (151) (147) (150) (148) (151)
Opex - Purch Cu Conc $ millions (1,332) - - - (198) (167) - (155) (102) (143) - (36) (78) (81) (111) (28) (64) (54) (92) (24)
Opex - Onsite G&A $ millions (376) - - - (24) (24) (24) (24) (24) (24) (24) (24) (24) (24) (24) (24) (24) (24) (24) (24)
Opex - Property tax $ millions (296) - - - (35) (33) (33) (32) (30) (24) (22) (20) (18) (16) (13) (9) (5) (3) (3) (3)
Opex - Surety bond fees $ millions (34) (2) (2) (2) (2) (2) (2) (2) (2) (2) (2) (2) (2) (2) (2) (2) (2) (2) (2) (2)
Closure Costs $ millions - - - - - - - - - - - - - - - - - - - -
Tax - Federal income $ millions (494) - - - - - - - (3) (2) (26) (34) (51) (51) (48) (64) (60) (63) (48) (46)
Tax - State income $ millions (98) - - - - - - - - (1) (6) (7) (10) (10) (9) (13) (12) (12) (9) (9)
Tax - State severance $ millions (62) - - - - - (1) (2) (2) (2) (4) (4) (6) (6) (6) (7) (6) (7) (6) (5)
Cash From Ops before WC $ millions 6,351 (2) (2) (2) 372 372 354 375 418 368 519 426 376 374 357 411 391 394 393 458
WC Changes - AR $ millions (91) - - - (91) 2 21 (21) 1 (3) (4) 8 (2) 0 (2) 1 0 (0) (0) (1)
WC Changes - AP $ millions 76 62 123 (80) (17) 1 (30) 28 3 2 (21) 4 10 (0) 4 (11) 4 (1) 5 (11)
WC Changes - Stream $ millions 230 230 - - - - - - - - - - - - - - - - - -
Cash From Operations $ millions 6,565 291 121 (82) 264 375 345 383 422 368 493 438 383 375 359 401 395 393 397 446
Growth - EPCM $ millions (1,177) (239) (635) (303) - - - - - - - - - - - - - - - -
Growth - Owners Costs $ millions (475) (48) (223) (205) - - - - - - - - - - - - - - - -
Growth - Contingency $ millions (265) (51) (149) (64) - - - - - - - - - - - - - - - -
Sustaining capital $ millions (531) - - - (24) (45) (44) (35) (85) (48) (39) (26) (21) (21) (17) (19) (19) (19) (28) (42)
Deferred stripping $ millions (111) - - - (0) (4) (15) (10) (28) - (5) (18) (5) (6) (1) (2) (4) (1) (15) -
Cash From Investing $ millions (2,559) (338) (1,007) (572) (24) (49) (59) (45) (112) (48) (43) (44) (26) (27) (18) (21) (23) (20) (43) (42)
Loan - draw $ millions - - - - - - - - - - - - - - - - - - - -
Loan - repayment $ millions - - - - - - - - - - - - - - - - - - - -
Loan - interest $ millions - - - - - - - - - - - - - - - - - - - -
Cash From Financing $ millions - - - - - - - - - - - - - - - - - - - -
Net cash flow $ millions 4,007 (47) (886) (654) 240 326 286 338 309 320 450 393 357 348 342 380 372 373 354 404
NPV @ 8% $ millions 1,097
NPV @ 10% $ millions 741
IRR % 17.09%
PAYBACK # years 5.3
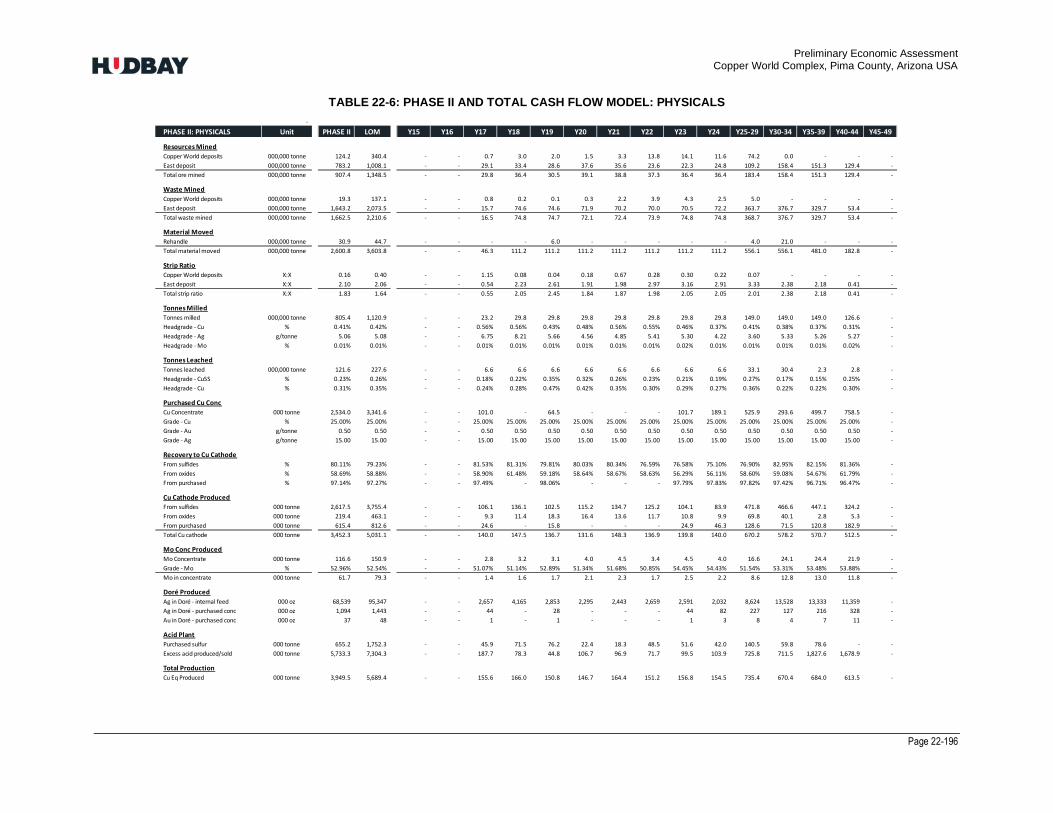
Preliminary Economic Assessment Copper World Complex, Pima County, Arizona USA
Page 22-196
TABLE 22-6: PHASE II AND TOTAL CASH FLOW MODEL: PHYSICALS
-
PHASE II: PHYSICALS Unit PHASE II LOM Y15 Y16 Y17 Y18 Y19 Y20 Y21 Y22 Y23 Y24 Y25-29 Y30-34 Y35-39 Y40-44 Y45-49
Resources Mined
Copper World deposits 000,000 tonne 124.2 340.4 - - 0.7 3.0 2.0 1.5 3.3 13.8 14.1 11.6 74.2 0.0 - - -
East deposit 000,000 tonne 783.2 1,008.1 - - 29.1 33.4 28.6 37.6 35.6 23.6 22.3 24.8 109.2 158.4 151.3 129.4 -
Total ore mined 000,000 tonne 907.4 1,348.5 - - 29.8 36.4 30.5 39.1 38.8 37.3 36.4 36.4 183.4 158.4 151.3 129.4 -
Waste Mined
Copper World deposits 000,000 tonne 19.3 137.1 - - 0.8 0.2 0.1 0.3 2.2 3.9 4.3 2.5 5.0 - - - -
East deposit 000,000 tonne 1,643.2 2,073.5 - - 15.7 74.6 74.6 71.9 70.2 70.0 70.5 72.2 363.7 376.7 329.7 53.4 -
Total waste mined 000,000 tonne 1,662.5 2,210.6 - - 16.5 74.8 74.7 72.1 72.4 73.9 74.8 74.8 368.7 376.7 329.7 53.4 -
Material Moved
Rehandle 000,000 tonne 30.9 44.7 - - - - 6.0 - - - - - 4.0 21.0 - - -
Total material moved 000,000 tonne 2,600.8 3,603.8 - - 46.3 111.2 111.2 111.2 111.2 111.2 111.2 111.2 556.1 556.1 481.0 182.8 -
Strip Ratio
Copper World deposits X:X 0.16 0.40 - - 1.15 0.08 0.04 0.18 0.67 0.28 0.30 0.22 0.07 - - - -
East deposit X:X 2.10 2.06 - - 0.54 2.23 2.61 1.91 1.98 2.97 3.16 2.91 3.33 2.38 2.18 0.41 -
Total strip ratio X:X 1.83 1.64 - - 0.55 2.05 2.45 1.84 1.87 1.98 2.05 2.05 2.01 2.38 2.18 0.41 -
Tonnes Milled
Tonnes milled 000,000 tonne 805.4 1,120.9 - - 23.2 29.8 29.8 29.8 29.8 29.8 29.8 29.8 149.0 149.0 149.0 126.6 -
Headgrade - Cu % 0.41% 0.42% - - 0.56% 0.56% 0.43% 0.48% 0.56% 0.55% 0.46% 0.37% 0.41% 0.38% 0.37% 0.31% -
Headgrade - Ag g/tonne 5.06 5.08 - - 6.75 8.21 5.66 4.56 4.85 5.41 5.30 4.22 3.60 5.33 5.26 5.27 -
Headgrade - Mo % 0.01% 0.01% - - 0.01% 0.01% 0.01% 0.01% 0.01% 0.01% 0.02% 0.01% 0.01% 0.01% 0.01% 0.02% -
Tonnes Leached
Tonnes leached 000,000 tonne 121.6 227.6 - - 6.6 6.6 6.6 6.6 6.6 6.6 6.6 6.6 33.1 30.4 2.3 2.8 -
Headgrade - CuSS % 0.23% 0.26% - - 0.18% 0.22% 0.35% 0.32% 0.26% 0.23% 0.21% 0.19% 0.27% 0.17% 0.15% 0.25% -
Headgrade - Cu % 0.31% 0.35% - - 0.24% 0.28% 0.47% 0.42% 0.35% 0.30% 0.29% 0.27% 0.36% 0.22% 0.22% 0.30% -
Purchased Cu Conc
Cu Concentrate 000 tonne 2,534.0 3,341.6 - - 101.0 - 64.5 - - - 101.7 189.1 525.9 293.6 499.7 758.5 -
Grade - Cu % 25.00% 25.00% - - 25.00% 25.00% 25.00% 25.00% 25.00% 25.00% 25.00% 25.00% 25.00% 25.00% 25.00% 25.00% -
Grade - Au g/tonne 0.50 0.50 - - 0.50 0.50 0.50 0.50 0.50 0.50 0.50 0.50 0.50 0.50 0.50 0.50 -
Grade - Ag g/tonne 15.00 15.00 - - 15.00 15.00 15.00 15.00 15.00 15.00 15.00 15.00 15.00 15.00 15.00 15.00 -
Recovery to Cu Cathode
From sulfides % 80.11% 79.23% - - 81.53% 81.31% 79.81% 80.03% 80.34% 76.59% 76.58% 75.10% 76.90% 82.95% 82.15% 81.36% -
From oxides % 58.69% 58.88% - - 58.90% 61.48% 59.18% 58.64% 58.67% 58.63% 56.29% 56.11% 58.60% 59.08% 54.67% 61.79% -
From purchased % 97.14% 97.27% - - 97.49% - 98.06% - - - 97.79% 97.83% 97.82% 97.42% 96.71% 96.47% -
Cu Cathode Produced
From sulfides 000 tonne 2,617.5 3,755.4 - - 106.1 136.1 102.5 115.2 134.7 125.2 104.1 83.9 471.8 466.6 447.1 324.2 -
From oxides 000 tonne 219.4 463.1 - - 9.3 11.4 18.3 16.4 13.6 11.7 10.8 9.9 69.8 40.1 2.8 5.3 -
From purchased 000 tonne 615.4 812.6 - - 24.6 - 15.8 - - - 24.9 46.3 128.6 71.5 120.8 182.9 -
Total Cu cathode 000 tonne 3,452.3 5,031.1 - - 140.0 147.5 136.7 131.6 148.3 136.9 139.8 140.0 670.2 578.2 570.7 512.5 -
Mo Conc Produced
Mo Concentrate 000 tonne 116.6 150.9 - - 2.8 3.2 3.1 4.0 4.5 3.4 4.5 4.0 16.6 24.1 24.4 21.9 -
Grade - Mo % 52.96% 52.54% - - 51.07% 51.14% 52.89% 51.34% 51.68% 50.85% 54.45% 54.43% 51.54% 53.31% 53.48% 53.88% -
Mo in concentrate 000 tonne 61.7 79.3 - - 1.4 1.6 1.7 2.1 2.3 1.7 2.5 2.2 8.6 12.8 13.0 11.8 -
Doré Produced
Ag in Doré - internal feed 000 oz 68,539 95,347 - - 2,657 4,165 2,853 2,295 2,443 2,659 2,591 2,032 8,624 13,528 13,333 11,359 -
Ag in Doré - purchased conc 000 oz 1,094 1,443 - - 44 - 28 - - - 44 82 227 127 216 328 -
Au in Doré - purchased conc 000 oz 37 48 - - 1 - 1 - - - 1 3 8 4 7 11 -
Acid Plant
Purchased sulfur 000 tonne 655.2 1,752.3 - - 45.9 71.5 76.2 22.4 18.3 48.5 51.6 42.0 140.5 59.8 78.6 - -
Excess acid produced/sold 000 tonne 5,733.3 7,304.3 - - 187.7 78.3 44.8 106.7 96.9 71.7 99.5 103.9 725.8 711.5 1,827.6 1,678.9 -
Total Production
Cu Eq Produced 000 tonne 3,949.5 5,689.4 - - 155.6 166.0 150.8 146.7 164.4 151.2 156.8 154.5 735.4 670.4 684.0 613.5 -
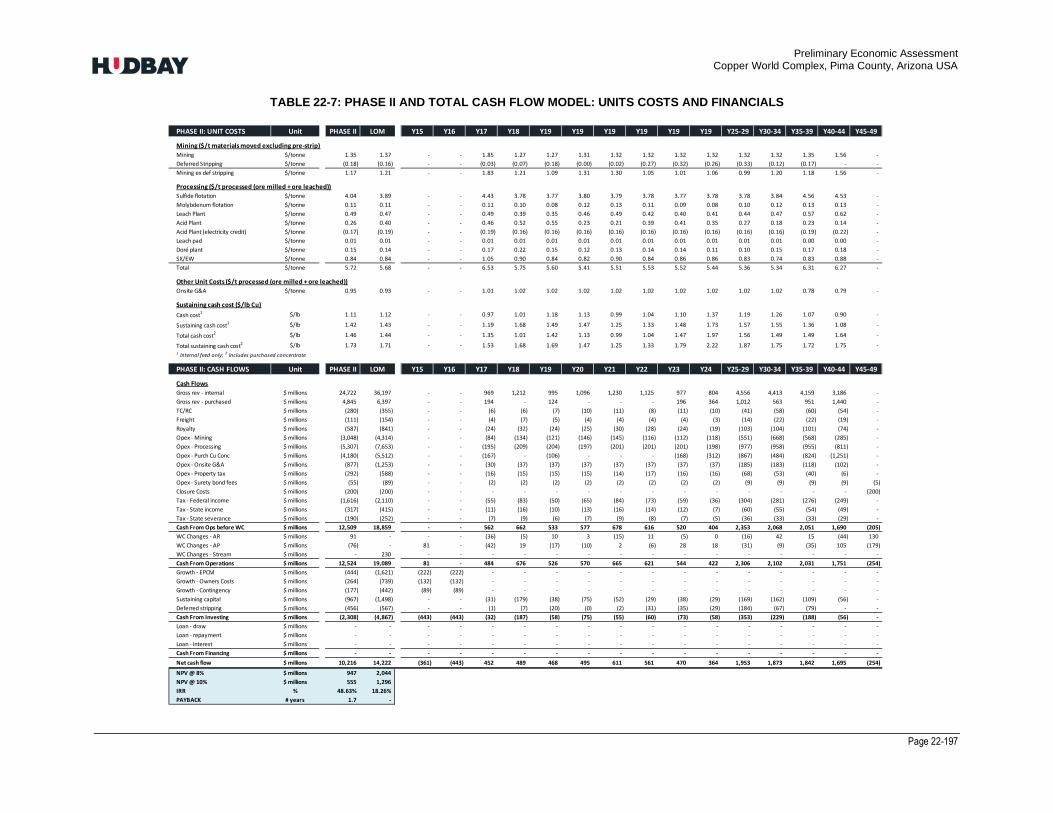
Preliminary Economic Assessment Copper World Complex, Pima County, Arizona USA
Page 22-197
TABLE 22-7: PHASE II AND TOTAL CASH FLOW MODEL: UNITS COSTS AND FINANCIALS
PHASE II: UNIT COSTS Unit PHASE II LOM Y15 Y16 Y17 Y18 Y19 Y19 Y19 Y19 Y19 Y19 Y25-29 Y30-34 Y35-39 Y40-44 Y45-49
Mining ($/t materials moved excluding pre-strip)
Mining $/tonne 1.35 1.37 - - 1.85 1.27 1.27 1.31 1.32 1.32 1.32 1.32 1.32 1.32 1.35 1.56 -
Deferred Stripping $/tonne (0.18) (0.16) - - (0.03) (0.07) (0.18) (0.00) (0.02) (0.27) (0.32) (0.26) (0.33) (0.12) (0.17) - -
Mining ex def stripping $/tonne 1.17 1.21 - - 1.83 1.21 1.09 1.31 1.30 1.05 1.01 1.06 0.99 1.20 1.18 1.56 -
Processing ($/t processed (ore milled + ore leached))
Sulfide flotation $/tonne 4.04 3.89 - - 4.43 3.78 3.77 3.80 3.79 3.78 3.77 3.78 3.78 3.84 4.56 4.53 -
Molybdenum flotation $/tonne 0.11 0.11 - - 0.11 0.10 0.08 0.12 0.13 0.11 0.09 0.08 0.10 0.12 0.13 0.13 -
Leach Plant $/tonne 0.49 0.47 - - 0.49 0.39 0.35 0.46 0.49 0.42 0.40 0.41 0.44 0.47 0.57 0.62 -
Acid Plant $/tonne 0.26 0.40 - - 0.46 0.52 0.55 0.23 0.21 0.39 0.41 0.35 0.27 0.18 0.23 0.14 -
Acid Plant (electricity credit) $/tonne (0.17) (0.19) - - (0.19) (0.16) (0.16) (0.16) (0.16) (0.16) (0.16) (0.16) (0.16) (0.16) (0.19) (0.22) -
Leach pad $/tonne 0.01 0.01 - - 0.01 0.01 0.01 0.01 0.01 0.01 0.01 0.01 0.01 0.01 0.00 0.00 -
Doré plant $/tonne 0.15 0.14 - - 0.17 0.22 0.15 0.12 0.13 0.14 0.14 0.11 0.10 0.15 0.17 0.18 -
SX/EW $/tonne 0.84 0.84 - - 1.05 0.90 0.84 0.82 0.90 0.84 0.86 0.86 0.83 0.74 0.83 0.88 -
Total $/tonne 5.72 5.68 - - 6.53 5.75 5.60 5.41 5.51 5.53 5.52 5.44 5.36 5.34 6.31 6.27 -
Other Unit Costs ($/t processed (ore milled + ore leached))
Onsite G&A $/tonne 0.95 0.93 - - 1.01 1.02 1.02 1.02 1.02 1.02 1.02 1.02 1.02 1.02 0.78 0.79 -
Sustaining cash cost ($/lb Cu)
Cash cost1 $/lb 1.11 1.12 - - 0.97 1.01 1.18 1.13 0.99 1.04 1.10 1.37 1.19 1.26 1.07 0.90 -
Sustaining cash cost1 $/lb 1.42 1.43 - - 1.19 1.68 1.49 1.47 1.25 1.33 1.48 1.73 1.57 1.55 1.36 1.08 -
Total cash cost2 $/lb 1.46 1.44 - - 1.35 1.01 1.42 1.13 0.99 1.04 1.47 1.97 1.56 1.49 1.49 1.64 -
Total sustaining cash cost2 $/lb 1.73 1.71 - - 1.53 1.68 1.69 1.47 1.25 1.33 1.79 2.22 1.87 1.75 1.72 1.75 -
1 Internal feed only; 2 Includes purchased concentrate
PHASE II: CASH FLOWS Unit PHASE II LOM Y15 Y16 Y17 Y18 Y19 Y20 Y21 Y22 Y23 Y24 Y25-29 Y30-34 Y35-39 Y40-44 Y45-49
Cash Flows
Gross rev - internal $ millions 24,722 36,197 - - 969 1,212 995 1,096 1,230 1,125 977 804 4,556 4,413 4,159 3,186 -
Gross rev - purchased $ millions 4,845 6,397 - - 194 - 124 - - - 196 364 1,012 563 951 1,440 -
TC/RC $ millions (280) (355) - - (6) (6) (7) (10) (11) (8) (11) (10) (41) (58) (60) (54) -
Freight $ millions (111) (154) - - (4) (7) (5) (4) (4) (4) (4) (3) (14) (22) (22) (19) -
Royalty $ millions (587) (841) - - (24) (32) (24) (25) (30) (28) (24) (19) (103) (104) (101) (74) -
Opex - Mining $ millions (3,048) (4,314) - - (84) (134) (121) (146) (145) (116) (112) (118) (551) (668) (568) (285) -
Opex - Processing $ millions (5,307) (7,653) - - (195) (209) (204) (197) (201) (201) (201) (198) (977) (958) (955) (811) -
Opex - Purch Cu Conc $ millions (4,180) (5,512) - - (167) - (106) - - - (168) (312) (867) (484) (824) (1,251) -
Opex - Onsite G&A $ millions (877) (1,253) - - (30) (37) (37) (37) (37) (37) (37) (37) (185) (183) (118) (102) -
Opex - Property tax $ millions (292) (588) - - (16) (15) (15) (15) (14) (17) (16) (16) (68) (53) (40) (6) -
Opex - Surety bond fees $ millions (55) (89) - - (2) (2) (2) (2) (2) (2) (2) (2) (9) (9) (9) (9) (5)
Closure Costs $ millions (200) (200) - - - - - - - - - - - - - - (200)
Tax - Federal income $ millions (1,616) (2,110) - - (55) (83) (50) (65) (84) (73) (59) (36) (304) (281) (276) (249) -
Tax - State income $ millions (317) (415) - - (11) (16) (10) (13) (16) (14) (12) (7) (60) (55) (54) (49) -
Tax - State severance $ millions (190) (252) - - (7) (9) (6) (7) (9) (8) (7) (5) (36) (33) (33) (29) -
Cash From Ops before WC $ millions 12,509 18,859 - - 562 662 533 577 678 616 520 404 2,353 2,068 2,051 1,690 (205)
WC Changes - AR $ millions 91 - - - (36) (5) 10 3 (15) 11 (5) 0 (16) 42 15 (44) 130
WC Changes - AP $ millions (76) - 81 - (42) 19 (17) (10) 2 (6) 28 18 (31) (9) (35) 105 (179)
WC Changes - Stream $ millions - 230 - - - - - - - - - - - - - - -
Cash From Operations $ millions 12,524 19,089 81 - 484 676 526 570 665 621 544 422 2,306 2,102 2,031 1,751 (254)
Growth - EPCM $ millions (444) (1,621) (222) (222) - - - - - - - - - - - - -
Growth - Owners Costs $ millions (264) (739) (132) (132) - - - - - - - - - - - - -
Growth - Contingency $ millions (177) (442) (89) (89) - - - - - - - - - - - - -
Sustaining capital $ millions (967) (1,498) - - (31) (179) (38) (75) (52) (29) (38) (29) (169) (162) (109) (56) -
Deferred stripping $ millions (456) (567) - - (1) (7) (20) (0) (2) (31) (35) (29) (184) (67) (79) - -
Cash From Investing $ millions (2,308) (4,867) (443) (443) (32) (187) (58) (75) (55) (60) (73) (58) (353) (229) (188) (56) -
Loan - draw $ millions - - - - - - - - - - - - - - - - -
Loan - repayment $ millions - - - - - - - - - - - - - - - - -
Loan - interest $ millions - - - - - - - - - - - - - - - - -
Cash From Financing $ millions - - - - - - - - - - - - - - - - -
Net cash flow $ millions 10,216 14,222 (361) (443) 452 489 468 495 611 561 470 364 1,953 1,873 1,842 1,695 (254)
NPV @ 8% $ millions 947 2,044
NPV @ 10% $ millions 555 1,296
IRR % 48.63% 18.26%
PAYBACK # years 1.7 -

Preliminary Economic Assessment Copper World Complex, Pima County, Arizona USA
Page 23-198
23. ADJACENT PROPERTIES
The author is not aware of any relevant work on properties immediately adjacent to the Project.

Preliminary Economic Assessment Copper World Complex, Pima County, Arizona USA
Page 24-199
24. OTHER RELEVANT DATA AND INFORMATION
There is no other relevant data or information material to the Project that is necessary to make this Technical Report not misleading.

Preliminary Economic Assessment Copper World Complex, Pima County, Arizona USA
Page 25-200
25. INTERPRETATION AND CONCLUSIONS
25.1 RECENT HISTORY OF THE PROJECT
Hudbay previously completed a feasibility study contemplating a standalone development plan for the East deposit and published the results in its 2017 Technical Report of the Rosemont standalone project..
While litigation over the federal permits for the standalone Rosemont project was ongoing, Hudbay commenced a comprehensive review of the exploration potential of the entire land package it acquired from Augusta Resource Corporation, along with the East deposit, in 2014. Drilling conducted in 2020 and 2021 resulted in the discovery and delineation of multiple satellite deposits, referred to collectively as “Copper World”, in almost a continuous manner over a 7km strike length adjacent to the East deposit.
The recent exploration success at Copper World and ongoing litigation uncertainty regarding the project design contemplated by the 2017 Feasibility Study caused Hudbay to evaluate alternative design options to unlock value within this prospective district. This included remodeling the 2017 mineral resources, incorporating the new mineral resources from successful exploration results and completing new metallurgical testing work, which led to a comprehensive review of the mine plan, process plant design, tailings deposition strategies and permitting requirements for the new project.
This Technical Report describes the latest resource model and mine plan and the current state of metallurgical testing, operating cost, and capital cost estimates for the combined development of the Copper World and East deposits and supersedes and replaces the 2017 Technical Report and the mineral resource and mineral reserve estimates for the East deposit stated therein.
25.2 OPEN PIT MINING
The mining sequence follows a two-phase approach, where the first phase of production considers the exploitation of the pits and their associated infrastructure over a footprint requiring only state and local permits for 16 years (plus one year of pre-stripping). During this period, all waste, tailings and leach pads are also disposed within the limits of Hudbay’s private land properties. After this first phase, it is considered that all necessary permits have been obtained in order to mine and deposit tailings and waste also on unpatented mining claims for a second production phase. The open pits are mined in a sequence consisting of 17 mining phases for a total lifetime of 44 years, plus one additional year of pre-stripping.
Through the life of mine 1,486 million tons of concentrator and leach feed and approximately 2,437 million tons of waste will be extracted, yielding a life of mine stripping ratio of 1.64 (including pre-stripping material).
An important constraint on the mine production schedule during Phase I is the limited space for disposing waste rocks, tailings and mineralization on leach pads, resulting in a sub-optimum mining sequence from a strict economic standpoint. However, the current mine plan allows the mine to operate in a sustainable manner during Phase I for 17 years until federal permits are in place. Securing these permits earlier would unlock significant benefits to the project by removing these important constraints on the mining schedule allowing more tons and/or better grades to be mined earlier than currently planned
25.3 METALLURGY AND PROCESS
Following the acquisition of the project in 2014, Hudbay undertook a series of metallurgical programs focused on the East deposit. The objective of the testing campaigns was to improve the correlation between mineralogy and the metallurgical characteristics, considering mineral processing through flotation only.
After the discovery of the Copper World deposits in 2020, Hudbay has engaged several laboratories and consultants to perform additional mineralogical and metallurgical testing on these new mineral deposits including column leach testing to model copper extraction and acid consumption. Since the original test work was focused
Preliminary Economic Assessment Copper World Complex, Pima County, Arizona USA
Page 25-201
only on the flotation recovery of sulfide copper and did not employ CPS potential (controlled potential sulfidization), recent test work was also used to update flotation recovery on a deposit-by-deposit basis.
Limited test work has also been conducted to establish the molybdenum and silver recoveries.
The processing facilities include an oxide leach and solvent extraction and electro-winning (SX/EW) facility, a sulfide concentrator, a concentrate leach facility and an acid plant. The capacity of the sulfide concentrator during Phase I is 60,000 tons per day while the tonnage of Run of Mine (ROM) leached is 20,000 tons per day. In year 17, the concentrator throughput will increase to 90,000 tons per day for the duration of Phase II.
The oxide leach and SX/EW facility follows a conventional process involving ROM leaching, solvent extraction and electrowinning. The sulfide mill consists of conventional crushing, grinding, flotation, molybdenum separation, concentrate dewatering and tailings dewatering. The sulfide concentrate produced in the sulfide mill is further processed in the concentrate leach facility to produce a pregnant leach solution (PLS) which is combined with the PLS from the oxide leaching circuit. The combined PLS is treated by SX/EW to produce copper cathode. Along an Albion Process™, the concentrate leach facility comprises sulfur flotation, dewatering and purification to produce a sulfur concentrate which is processed through an acid plant, along with additional purchased sulfur, to create 410 kt/a of sulfuric acid. The solids residue from the Albion Process™ is further treated in a precious metals recovery step.
The proposed process plant design for the Project is expected to deliver valuable optionality and meaningful environmental and social benefits, as described below.
25.4 ENVIRONMENTAL STUDIES, PERMITTING AND SOCIAL OR COMMUNITY IMPACT
Studies and surveys that have been completed for the Project include biological and cultural surveys and groundwater, surface water, and geochemical studies. Cultural and biological surveys have been completed for all of the Phase I affected areas, and for the majority of the Phase II area as part of the previous standalone Rosemont Copper Project. Geochemical, groundwater and surface water studies have also been performed in support of Phase I design and permitting. Numerous studies were also performed for the Rosemont Copper Project while developing the Environmental Impact Statement (EIS) that are pertinent to Phase II.
Phase I of the Project is expected to require only state, county, and local permits and/or authorizations. Many of the permits have either been issued, are in the active permitting phase, or are in the process of amendment.
In addition to state, county, and local permits, Phase II will require federal permits due to impacts to USFS and BLM administered lands. The State of Arizona environmental permits and approvals issued for Phase I, such as for the Class II air permit and Aquifer Protection Permit, will be amended to match the applicable Phase II federal permits. Submittal of the amendments for review by State agencies will be timed to accommodate both the layout used in the federal plan and the anticipated timing of approvals. Authorizations for the water and power line routing will remain valid for Phase II.
Hudbay is committed to the preservation of historical and cultural resources as well as the protection of endangered and other protected species. Additional mitigation measures and other commitments will be determined as part of development of the EIS for Phase II. Mitigation elements would include those listed in the BO developed by the USFWS.
The alternative development plan proposed for the Copper World Complex including the East deposit in this PEA will yield many benefits based on the redesign of the project. Copper production in the form of cathodes has the potential to be sold 100% for the US domestic market to strategically reduce reliance on imports while at the same time reducing greenhouse gas and sulfur emissions with the proposed flowsheet due to elimination of shipping, smelting and metal refining. The use of a sulfur burner to produce acid used for leaching the oxide mineralization will also contribute to reduce emissions.
The Project will also bring significant benefits for the local stakeholders. In addition to creating employment and opportunities to develop and/or sustain local businesses, property taxes over the 44 years of operation will total to an estimated $715M which will directly support local taxpayers for more than four decades.
Preliminary Economic Assessment Copper World Complex, Pima County, Arizona USA
Page 25-202
25.5 ECONOMIC ANALYSIS
Based On The Cash Flow Model results, the Project has an unlevered after-tax NPV10% of $1,296M, an after-tax IRR of 18%, a payback period Of 5.3 Years, and an annual average EBITDA of $492M at a long-term copper price of $3.50/lb of copper, Phase I has a stand-alone NPV10% of $741M and an after-tax IRR of 17% while Phase II adds $555M to the NPV10% with an incremental after-tax IRR of 49.% entirely funded through cash flow from operation during Phase I.
The project development options are sufficiently understood, and the project shows positive economics to support a decision to proceed to a PFS.
25.6 RISKS AND UNCERTAINTIES
This PEA is preliminary in nature, includes inferred mineral resources that are considered too speculative geologically to have the economic considerations applied to them that would enable them to be categorized as mineral reserves and there is no certainty that the PEA will be realized. Mineral resources that are not mineral reserves do not have demonstrated economic viability.
In addition, this PEA contains a number of assumptions and expectations that constitutes forward-looking information within the meaning of applicable Canadian and United States securities legislation. Forward looking information includes, but is not limited to, Hudbay’s expectations with respect to the cost, permitting requirements and design of the Project, the technical and economic viability of the Project and the potential to advance and improve the Project. Please refer to the Cautionary Statements at the beginning of this Technical Report for further information regarding the assumptions, risks and uncertainties associated with all such forward looking information presented in this Technical Report.

Preliminary Economic Assessment Copper World Complex, Pima County, Arizona USA
Page 26-203
26. RECOMMENDATIONS
26.1 DRILLING AND RESOURCE MODELING UPDATES
Future drilling programs should focus on converting all the inferred mineral resource estimates included in the Phase I of the mine plan to the indicated category so that a pre-feasibility study can be developed based on mineral reserve estimates for this Phase. Hudbay has already initiated this drill program which is approximately 90% completed at the date of publication of this PEA. It is further recommended to bring the mineral resource estimates mined during the payback period currently estimated at 5 years to the measured category so as to increase the confidence in the economic return of the project in order to possibly support a feasibility study if the pre-feasibility study confirms the technical and economic viability of the Project.
26.2 PRE-FEASIBILITY ENGINEERING WORK
Hudbay has developed a thorough PFS scope and detailed budget for commencement of the pre-feasibility work for Phase I of the Project. Hudbay estimates that in addition to the budget for the infill drilling recommended above, a PFS will cost approximately $17 million to complete. Hudbay has the required funding in place to complete the PFS work in 2022.
The following subsections provide some detail on some of the components of the PFS
26.2.1 GEOTECHNICAL INVESTIGATION AND DESIGN
Geotechnical investigations are needed for the main infrastructure to be developed: Pits, WRF, TSF, WRF, HLP, Process plants. This investigation will be complementary to the geotechnical investigation already carried out for the main infrastructure. The geotechnical investigation will consist of: Drilling, logging, mapping, instrumentation, laboratory testing, geotechnical analysis.
The objectives of the geotechnical investigation include:
• Foundation works for the main infrastructure: Process plants, TSF, HLP, WRF
• Stability Analysis for this main infrastructure
• Geotechnical model development based on geotechnical units and structural domains for obtaining geotechnical domains
• Slope stability design and optimization for all the pits in Coper World and East pit
• Instrumentation and monitoring plan
• Geotechnical recommendations for construction and operation
Based on the geotechnical results, confirmation/updated facility designs will be completed for:
• Pits slope configurations
• Waste Rock Facility foundations and slopes
• Tailings Storage Facility foundations, slopes, elevation, and construction sequences
• Heap Leach Facility foundations, slopes, elevation, and construction sequence
• Process Plants foundation and platforms
Preliminary Economic Assessment Copper World Complex, Pima County, Arizona USA
Page 26-204
26.2.2 HYDROGEOLOGY INVESTIGATION AND STUDY; GROUNDWATER MODEL AND PIT DEWATERING
Complementary hydrogeological investigation and studies will be carried out with focus on the Copper World area. As a result of this study, an integrated hydrology and hydrogeology model will be developed.
As part of this study, a groundwater model will also be developed to have the necessary inputs for the different technical studies and the permits.
The main work to be done includes:
• Field hydro investigation on the Copper world area
• Integrated hydrology ad hydrogeology model
• Regional hydro model
• Baseline calibration model
• Predictive mining phases and closure models
• Particle transport and mitigation
• Hydrogeological model and pit dewatering assessment
26.2.3 GEOCHEMICAL IMPACT ASSESSMENT
Complementary geochemical impact assessment will be developed in order to complete:
• Potential acid material and non-acid material analysis
• Facilities predictive seepage predictive geochemistry
• Pit backfill predictive geochemistry
• Pit lake predictive geochemistry
26.2.4 MINING
The following work will need to be completed:
• Open Pit slope stability design and pit dewatering plan
• Waste material distribution based on the geochemistry considerations
• Tailings management on the different tailings storage facilities
• Material to Crusher for flotation and material to heap based on the mine to mill approach
• Water balance and Water Management
• Capex for the owner’s cost
• Opex Cost for mining (drilling, blasting, loading, haulage, indirect)
• Sustaining Capital Cost for mining equipment, maintenance, heap leach expansion and tailings expansion as main contributors for the cost.
Preliminary Economic Assessment Copper World Complex, Pima County, Arizona USA
Page 26-205
26.2.5 METALLURGY AND PROCESSING
Additional metallurgical characterization of the deposit is recommended as follows:
• Modelling of the comminution circuit to confirm size of crushing, SAG milling, and ball milling equipment,
• Further optimization of the Cu-Mo separation circuit to verify final concentrate grade and recovery and determine reagent requirements and circuit configuration, and
• Column Leach tests to confirm Heap Leach and SX/EW requirements
• Trade-off study between the Albion process and other existing similar sulfide leaching technologies including both low and high temperature methods
• Concentrate leach bench testing for sulfide material to size the industrial complex facility
• Mineralogical study of optimized flowsheet tailings to characterize metal losses and identify potential
opportunities for additional recovery.
• Optimize the flotation reagent recipe to maximize copper flotation recovery with a particular focus on
further improving the recovery of copper oxide species.
The PFS study requires certain deliverables to be completed to support the capital cost estimate. These deliverables include:
• Process Design; Flow Diagrams, Mass Balance, Water Balance, Process Calculations, Major Plant Equipment Sizing, Surge Capacity and Reagent List
• General Arrangements; Site Layout, optimized footprint, location of all process areas and site buildings.
• Mechanical and Piping; Equipment data sheet for major and long lead items for quotes, mechanical equipment list, design criteria, large bore/major pipe material take off, location of tailings line and water lines
• Civil, Structural, Concrete; Design Criteria, Erosión Control, Material Take-Offs,
• Electrical and Instrumentation; Design Criteira, Load list, electrical equipment list, single line diagrams
• Risk Study; A Hazid study will be completed as well as a high level constructability review
26.2.6 INFRASTRUCTURE AND SITE LAYOUT
Additional testing and data is required to further define the infrastructure and site layout requirements and associated costs in these areas:
• Trade-off studies to optimize power and water infrastructure including electrical study with Trico
• Trade-off studies for modulization of the process plant include the industrial complex
• Geotechnical testing and data to further develop construction requirements for the mill, tailings and services sites,
• Hydrogeology and water quality testing on water sources surrounding the mine site to determine available volumes and quality of water required to support the mill and services infrastructure,
• Site-Layout Trade-off studies to optimize flow and constructability
• Condemnation drilling under the plant, WRF, and tailings areas, and
• Environmental and socioeconomic studies

Preliminary Economic Assessment Copper World Complex, Pima County, Arizona USA
Page 26-206
26.2.7 WASTE AND WATER MANAGEMENT
A complete hydrogeological review of water in the mining area needs to be undertaken. This entails both quantity and quality sufficient for operation of the process plant and mine. In addition, the precipitation and drainage areas need to be determined for proper estimating of diversion dam/ditches to minimize contact of fresh water with mining areas.
The tailings management facility and waste rock management facility areas need to have complete hydrological evaluations completed for surface runoff, ground water, and seepage.
ARD and metal leaching test work needs to be developed and completed for proper waste rock characterization and development of storage options.
26.2.8 ENVIRONMENTAL
Hudbay’s permitting plan for the Project is to continue the work to obtain the necessary permits discussed in Section 20.
Basic data collection needs to commence covering a wide range of diverse subjects, including weather, water flows, vegetation, wildlife, and socio-economic. A comprehensive program will need to be established to collect the required information necessary to comply with the respective agency permit application requirements.

Preliminary Economic Assessment Copper World Complex, Pima County, Arizona USA
Page 27-207
27. REFERENCES
Anzalone, S.A., 1995, The Helvetia Area Porphyry Systems, Pima County, Arizona; in Pierce, F.W., and Bolm, J.G. eds., Porphyry Copper Deposits of the American Cordillera: Tucson, Arizona Geological Society Digest 20.
Barra, F., Ruiz, J., Valencia, V. A., Ochoa-Landín, L., Chesley, J. T., & Zurcher, L. (2005). Laramide porphyry Cu-Mo mineralization in northern Mexico: Age constraints from Re-Os geochronology in molybdenite. Economic Geology,100(8), 1605-1616.
Briggs D. F., 2014. History of Helvetia-Rosemont Mining District, Pima County, Arizona. June 2014.
Briggs D. F., 2020. Helvetia-Rosemont, Arizona’s Hardscrabble Mining Camp, Conributed Report CR-20-A, Arizona Geologic Survey, July 2020
Call & Nicholas, Inc (CNI), 2015 Pit Slope Feasibility Evaluation For The Rosemont Deposit. Revision 02. January 2016.
CIM, 2014, CIM Definition standards on mineral resources and reserves https://mrmr.cim.org/en/standards/canadian-mineral-resource-and-mineral-reserve-definitions/
CIM, 2019, Estimation of Mineral Resources & Mineral Reserves Best Practice Guidelines https://mrmr.cim.org/en/best-practices/estimation-of-mineral-resources-mineral-reserves/"
Drewes, H., 1971, “Miscellaneous Geologic Investigations MAP I-613: Geologic Map of the Sahuarita Quadrangle, Southeast of Tucson, Pima, County, Arizona”, United States Geologic Survey
Glencore Technology, 2022. Personal Communication
I.S. Parrish (1997) Mining Engineering Journal, Geologist’s Gordon Knot: to cut or not to cut (pp. 45-49)
Kermack, K.A., Haldane, J.B.S., 1950. Organic Correlation and Allometry. Biometrika 37 (1/2), 30-41.
M3 Engineering and Technology Corporation, 2012. Rosemont Copper Project: NI 43-101 Technical Report, Updated Feasibility Study, Pima County, Arizona, USA. Revision 0. Project No. M3- PN 08036. Prepared for Augusta Resource Corporation. Tucson, AZ: M3 Engineering and Technology Corporation. August 28, 2012.
Maher, D. J. Reconstruction of middle Tertiary extension and Laramide porphyry copper systems, east-central Arizona: Unpublished Ph. D. Diss. thesis, University of Arizona, 2008.
Ramussen, J., Hoag, C. and Horstman, K., 2012. Geology of the Northern Santa Rita Mountains, Arizona. Arizona Geological Society Fall Field Trip September 15, 2012.
Simón, A. (2004). Evaluation of Twin and Duplicate Samples: The Hyperbolic Method. AMEC Perú Ltda. Internal document.
Related Documents