Ma ry la n d’s Labor Force Con dition s : TREN DS, CHALLEN G ES & O PPO RTUN ITIES GOVERNOR’S WORKFORCE INVESTMENT BOARD Martin O’Malley, Governor Tomas E. Perez, Secretary Anthony G. Brown, Lt. Governor William G. Robertson, Chair Eric M. Seleznow, Executive Director

Welcome message from author
This document is posted to help you gain knowledge. Please leave a comment to let me know what you think about it! Share it to your friends and learn new things together.
Transcript

Ma ry la n drsquos La bor Force Con dition s TREN DS CHALLEN G ES
amp O PPO RTUN ITIES
GOVERNORrsquoS WORKFORCE
INVESTMENT BOARD Martin OrsquoMalley Governor Thomas E Perez Secretary
Anthony G Brown Lt Governor William G Robertson Chair
Eric M Seleznow Executive Director
An Analysis of Marylandrsquos Labor Force Conditions Trends Challenges amp Opportunities
Maryland Governorrsquos Workforce Investment Board William G ldquoBillrdquo Robertson Chair Eric M Seleznow Executive Director
November 2008
This report was prepared for the Governorrsquos Workforce Investment Board (GWIB) by Towson Universityrsquos Regional Economic Studies Institute (RESI) with input and guidance from the GWIB
i
Maryland Governorrsquos Workforce Investment Board
GWIB is the statersquos chief policy-making and strategic planning body on workforce development as mandated by the federal Workforce Investment Act (WIA) of 1998 The board is a business-led group of leaders from industry education and government who are charged with advising the governor on Marylandrsquos workforce development needs
The State of Marylandrsquos Workforce
Nationally the search for skilled workers is becoming increasingly difficult due to demographic shifts the aging of the US population skill set mismatches a lack of general workforce preparation and current and predicted labor shortages The critical and increasing need to remain globally competitive presents yet another challenge We are faced with the implementation of new technologies which are automating many functions and rapidly rendering lower skill positions obsolete[1] Ignoring these emerging shifts threatens Marylandrsquos competitive edge and our ability to attract and grow jobs across all skill levels
The quality of Marylandrsquos current and future workforce is vital to the economic future of the state and the success of its residents While Maryland currently enjoys a healthy diverse business climate many industries are facing shortages of skilled workers Yet many Marylanders lack the basic education and skills necessary to succeed in the workforce Marylandrsquos challenge is to maintain its highly educated and skilled workforce while creating opportunities for all Marylanders to participate and succeed in the 21st century workplace
In short the challenge facing Marylandrsquos government business and workforce development professionals is to ensure that our workforce adapts to a wide range of emerging trends in a way that will translate into increased economic prosperity for all segments of the statersquos population
Data Timeliness
This report contains a great deal of labor market information which is subject to change due to a variety of influences including changes in economic conditions Please keep in mind that referenced data may have changed slightly or significantly since the report was written When referencing information contained within this report it is advised that the reader visit the original data source to obtain the most up-to-date information
ii
Contents 10 Executive Summary 2 20 Introduction 9 30 Historical Backdrop 10 40 Marylandrsquos Labor Supply 14
41 Population Trends and Characteristics 14 42 Workforce Trends 22 43 Marylandrsquos Educational Supply Pipeline 29
50 Marylandrsquos Labor Demand 30 51 Industry Analysis 30 52 Base Realignment and Closure Commission (BRAC) Demand 35 53 Demand for Science Technology Engineering and Mathematics (STEM) Workers 36 54 The Demand for Basic and Applied Skills 38
60 Looking Ahead Identifying Gaps Challenges and Opportunities 40 61 The Gap between Marylandrsquos Jobs and Labor Supply is Growing 40 62 The Race to Preserve Institutional Knowledge 42 63 FacultyTeacher Shortages 43 64 Increasing Age Diversity 44 65 Immigrants Continue to Grow Marylandrsquos Labor Supply 44 66 Adult Education and Engaging Workers with Barriers to Employment 47
70 Recommendations 49 71 Science Technology Engineering and Mathematics (STEM) Industries are Struggling to Attract Recruit and Retain Workers 49 72 Maryland Continues to Face Growing Teacher and Faculty Shortages 50 73 Marylandrsquos Growing Immigrant Population Opportunities and Challenges 51 74 The Need for Increased Labor Force Participation 53 75 BRAC Requires a Pipeline of Qualified Workers 56 76 There Is a Shortage of Workers with Security Clearances 58 77 Skilled Professionals Needed 59
80 Closing 61 References 62
1
Executive Summary
10 Executive Summary
Nationally the search for skilled workers is becoming increasingly complicated due not only to demographic shifts and the aging of the US population but also to a number of other factors including skill set mismatches a lack of general workforce preparation and current and predicted labor shortages The critical and increasing need to remain globally competitive presents yet another challenge Americans face growing competition from our international counterparts We also are faced with the implementation of new technologies which are automating many functions and rapidly rendering lower skill positions obsolete1 Ignoring these emerging shifts will ensure the loss of Americarsquos competitive edge and threaten our ability to attract and grow jobs across all skill levels
Maryland will not be immune to these national trends While it is true that the state currently enjoys a healthy diverse economy characterized by a highly skilled and educated workforce these strengths will be tested by the emerging challenges The graying of the statersquos population is prime among these challenges The retirement of more than one-fifth of Marylandrsquos working age population is fast approaching and will have a disproportionate effect on those regions that already are home to concentrations of older residents and workers particularly in Western Maryland and on the Eastern Shore
The pending retirement cliff has precipitated a scramble to prevent ldquobrain drainrdquo as companies focus increasingly on passing down the knowledge and skill sets of experienced workers before they retire The prospect of brain drain appears to be imminent and quite legitimate in Maryland where roughly half of the aerospace workforce is set to retire over the next 15 years and more than half of the statersquos registered nurses working in hospitals in 2005 were 48 years of age or older
In short the challenge facing Marylandrsquos government business and workforce development professionals is to ensure that our workforce adapts to a wide range of emerging trends in a way that will translate into increased economic prosperity for all segments of the statersquos population Toward this end this analysis recognizes seven critical areas that will profoundly influence Marylandrsquos current and future employer and workforce needs and makes a number of recommendations to ensure that we can meet the challenges identified
In addition to providing additional information on these seven critical areas as well as other factors affecting Marylandrsquos labor supply and demand this report includes a series of 14 recommendations The recommendations aim to address the critical issues and highlight promising initiatives and collaborative efforts already being planned or initiated The recommendations also identify additional policies and initiatives that could be leveraged in an effort to address Marylandrsquos emerging and future workforce challenges
1 National Center on Education and the Economy 2007
2
Executive Summary
Specifically these seven areas include the following
1 Growing Marylandrsquos Pool of Science Technology Engineering and Mathematics (STEM) Workers Cultivating the statersquos base of STEM workers has emerged as a major priority The expected move of thousands of jobs to Maryland as a result of the Base Realignment and Closure (BRAC) process makes this need all the more pressing
The STEM industries face a looming retirement cliff as skilled baby boomers begin to retire and separate from the workforce The statersquos aerospace industry serves as a prime example As of 2006 nearly eight out of every 10 Maryland aerospace workers was age 51 or over Fifty percent of the current aerospace workforce is set to retire by 2020
Recommendation Increase opportunities for young people to become aware of and enter STEM careers
One way to meet the need for workers in STEM careers is to expand middle- and high school-level studentsrsquo interaction with STEM professionals through expanded internship and mentorship programs GWIB Aerospace Committee identifies the need to encourage STEM-related field trips and industry participation in classes and school activities
Recommendation Expand and enhance pre-college programs such as Project Lead the Way
Project Lead the Way (PLTW) is a national pre-engineering program which aims to increase high school studentsrsquo preparation for higher education engineering programs Forty-seven (47) Maryland high schools and 15 Maryland middle schools in 18 school systems participate in the program which allows students to enroll in such courses as Principles of Engineering Computer Integrated Manufacturing Civil Engineering and Aerospace Engineering Eight school systems in Maryland will offer the newly-launched PLTW for a biomedical sciences curriculum in 2008-2009 An aerospace PLTW program also is in the planning stages
2 FacultyTeacher Shortages Particular subjects facing current and future shortages include technology education computer science English for Speakers of other Languages foreign languages mathematics science and special education
The state continues to confront shortages among teachers and faculty Marylandrsquos need for teachers outstrips our ability to produce and retain them In 2005 4350 beginning new teachers were hired to work in Marylandrsquos public schools Only 1439 (33) of the beginning new teachers had graduated from Maryland colleges and universities2
The issue of faculty shortages extends to higher education as well and is affecting a number of Maryland industries including the healthcare sector as evidenced by student waiting lists for nursing schools3 Nursing programs report an increase in the number of qualified nursing applicants being turned away due to a dearth of faculty and classroomclinical space
2 Maryland State Department of Education 2006 3 Charting New Directions Governorrsquos Healthcare Workforce Summit page 13
3
Executive Summary
Recommendation Enhance teacher retention through the expansion and enhancement of facultyteacher retention programs
Facultyteacher retention especially at the primary and secondary levels can be improved through access to quality programs which aim to enhance and improve teacher quality through continuous professional development A study of one such program in Maryland found that its teacher retention rate was 71 compared with retention rates of 35-44 for similar groups of teachers who did not participate in such programs
3 Immigrant Population Growth and Diversity These trends emphasize the need for increased investment in English as a Second Language (ESL) programs
Population shifts are impacting the demographic makeup of the state in ways that will have dramatic impacts on employer needs and workforce development Between 2000 and 2006 immigrants accounted for more than half (516) of Marylandrsquos population growth As of 2006 immigrants made up 12 of the statersquos population4
Recommendation Enhance and support initiatives and partnerships that encourage a broad spectrum of education opportunities for immigrant populations
Many of Marylandrsquos foreign-born workers are highly educated and possess applicable skills however many of Marylandrsquos immigrants are at the opposite end of the educational spectrum As of 2006 43 percent of Marylandrsquos immigrants held at least a Bachelorrsquos degree compared with 34 of US natives in Maryland At the same time 18 of immigrants in Maryland did not have a high school diploma or its equivalent compared to 12 of US-born Maryland residents5Improving these workerrsquos English skills and connecting them with high demand jobs strengthens Maryland workforce and provides a competitive edge
Recommendation Enhance and expand access to community English as a Second Language (ESL) programs
There is a need to improve access to ESL programs and to enhance the quality of these programs In 2005 Marylandrsquos adult education programs offered 40 hours of instruction per student which is inadequate for beginner or even intermediate English learners to become proficient The Maryland State Department of Education (MSDE) notes that a program that offers more than 100 hours of classroom time would better meet the needs of this population
Recommendation Coordinate efforts to promote Marylandrsquos access to seasonal immigrant (H-2B) and skilled immigrant (H-1B) workers6
4 US Census Bureau 5 US Census Bureau 2006 American Community Survey calculations based upon Maryland residents age 25 and over 6 It should be noted that this recommendation in no way advocates filling BRAC and other positions which require security clearances with H-1B and H-2B workers Given security clearance requirements filling these jobs with foreign nationals is simply not possible
4
Executive Summary
Seasonal immigrant worker shortages have adversely affected Maryland businesses for some time In recent years the annual national cap of 66000 H-2B visas which allow foreign nationals to temporarily enter the US and engage in seasonal or peak load employment opportunities has filled within the first few months of the federal fiscal year As a result many of Marylandrsquos seasonal businesses were prevented from applying for the estimated 7000+ temporary workers needed
Improving state-wide coordination efforts should increase the availability of H-1B workers The H-1B visa program targets highly-skilled internationals who work in professional fields such as computing finance law and healthcare among others The national cap for H-1B visas has fluctuated in recent years jumping from 65000 in the late 1990s to 195000 in 2000 and then dropping back to 65000 in fiscal year 2003 As with H-2B visas annual quotas are met early in the year According to the Migration Policy Institute one out of every five doctors in the US is foreign born Two of every five medical scientists one of every five computer specialists and one of every six persons in engineering or science fields are foreign born Given current and expected shortages among the science engineering technology and mathematics (STEM) fields it makes sense to explore expanding the H-1B visa option
4 Increasing Labor Force Participation and Meeting Adult Education Needs There is an opportunity to address this issue by tapping into Marylandrsquos underutilized and low-skilled adults and ensuring they receive the training they need to become more productive members of the workforce
According to a report released recently by the US Census Bureau roughly 206 percent of Marylandrsquos adult population (or 730000) was eligible for adult education services as of 2000 Specifically this population includes those adults age 16 or older who lack a high school diploma and who are not enrolled in school and adults who speak English as a second language and who have rated their ability to speak English as ldquowellrdquo ldquonot wellrdquo or ldquonot at allrdquo7
Recommendation Enhance opportunities for adult education (ie basic literacy GED services and ESL services)
Despite the pressing need for adult literacy services demand continues to severely outstrip supply According to MSDE funding constraints dictate that only three to five percent of annual demand for these services is being met resulting in waiting lists of up to 5000 persons The majority of those on waiting lists include people seeking ESL instruction and Adult Basic Education (ABE)
Recommendation Future study is necessary to identify the education and related needs of additional adult population segments
While the needs of Marylandrsquos lower literacy population have been identified there is a lack of comprehensive information on other population segments which may not be participating fully in the statersquos workforce A thorough study is needed to identify the demographic economic and
7 US Census Bureau Profiles of the Adult Education Target Population Information from the 2000 Census December 2005
5
Executive Summary
social characteristics of each Maryland population segment that is not fully represented in the workforce
Recommendation Create a statewide resource network to advance basic skills
The top occupations in Maryland (in terms of the need for replacement workers) require basic skills such as active listening speaking writing and reading comprehension
For example The majority of occupations in the Hospitality and Tourism sector require basic skills and on-the-job training yet employers are having difficulty finding workers with good active listening skills service orientation and cultural awareness and sensitivity To address these issues the report recommends creating a statewide resource network to advance basic skills
5 Developing a Base Realignment and Closure (BRAC) Worker Pipeline Not all of the current BRAC personnel will move to Maryland along with their jobs If incoming BRAC jobs go unfilled they could very well be lost The challenge for workforce development officials is to ensure that Maryland realizes as many potential BRAC jobs impacts by ensuring that new positions are filled quickly
The average age of civilian DoD workers is 45 years old As a result many current workers impacted by BRAC will approach retirement in the near future The size and scope of the BRAC units moving to Maryland could be influenced by future and current workforce availability
Recommendation Actively recruit retired government personnel and veterans to fill vacant BRAC positions
Fort Monmouth is currently actively recruiting up to 2000 Maryland workers to fill BRAC positions by 2011 Retired government personnel and veterans (especially those with security clearances) stand out as a potential labor pool worth cultivating in order to help the bases meet recruitment needs and fill any foreseeable gaps in the immediate future
Recommendation Increase interest recruitment and retention in BRAC-related fields
Since many of the BRAC jobs will require an educational background in science technology engineering and mathematics (STEM) fields and since graduation levels in many of these fields have been flat to negative in Maryland we must generate an interest in these fields before students enter college
Maryland has developed several new or planned initiatives at the high school level that if proven successful could serve as models to be duplicated elsewhere to ensure that Maryland is developing an adequate pipeline of BRAC workers
Recommendation Identify labor and education needs for spin-off BRAC jobs
6
Executive Summary
The influx of BRAC personnel and contractors to Maryland will result not only in significant construction activity but also increased demand for personal services According to a report produced by RESI in 2006 for every direct on-base job8 that comes to Maryland 196 additional spin-off jobs will be created9 Specifically Maryland will experience a rapidly growing demand for workers in construction day care and hospitality among others
6 The Security Clearance Process The lengthy and cumbersome security clearance process is hurting Marylandrsquos bottom line as companies are forced to deal with unfilled positions for months on end
The number of positions requiring security clearances as well as the level of security clearances required for existing contracts has increased dramatically since September 11 2001 The impacts are particularly strong among government agencies science and security industries and other jobs associated with BRAC Not only is the security clearance process a lengthy and onerous one but it is costly as well
Recommendation Create awareness set up a pre-screening model and expand internship opportunities
The issue of security clearance is problematic since the process is federally driven and thus largely outside the Statersquos control Still Maryland can begin to address the issue of security clearance by conducting an awareness campaign targeting high school and college students A pre-screening model could be developed in which college students begin the security clearance process prior to graduation Expanded internship opportunities represent another way to get the word out and encourage student interest in positions that require security clearances
7 The Need for Skilled Professionals Maryland needs to ensure that our pool of skilled professionals grows in step with employer demand
A review of emerging and expected labor force conditions in Maryland makes it clear that there is a need for the state to grow attract and retain skilled professionals of all types not just STEM and BRAC-related workers In a single fiscal year (2005-2006) 25000 residents exited Maryland and were replaced by 21000 immigrants10 In addition the statersquos rate of population growth is slowing Between 2020 and 2030 Marylandrsquos population is expected to grow by five percent compared to 20 percent growth between 1970 and 1980 Marylandrsquos population is aging as nearly one-fifth of the statersquos working age population is set to retire by 2020 The trend in migration coupled with the statersquos slowing population growth aging population and increasingly tight labor market conditions all point to the same conclusion Maryland needs to ensure that our pool of skilled professionals grows in step with the demand
Recommendation Launch a campaign to attract and retain skilled professionals
8 Direct on-base positions include civilian DoD positions as well as embedded private defense contractors 9 RESI of Towson University Maryland Department of Business amp Economic Development 2006 10 US Census Bureau
7
Executive Summary
Survey data suggest that nearly four out of every 10 Bachelorrsquos degree graduates of Maryland institutions elect to work outside the state Other cities states and nations have made concerted efforts to not only grow and retain skilled professionals but to entice these workers to return to their home citiesstatesnations A campaign should be developed to attract and retain skilled professionals in Maryland
A public-private coalition is recommended to spearhead such a campaign which would target skilled professionals of all ages
Recommendation Expand career and technology education
Career and technology education (CTE) programs are courses of study in K-12 and postshysecondary institutions that prepare students for careers with wide-ranging educational requirements These programs provide students with skills to compete in 21st century jobs because students are learning with skills that are transferable across careers and educational paths11 CTE programs combine rigorous and challenging academic content which leads to an industry-recognized credential or certificate an associate or bachelorrsquos degree or entry into an apprenticeship program or employment
CTE programs are currently offered in about 200 Maryland high schools and all 16 of Marylandrsquos community colleges
11 National Governorrsquos Association Retooling Career Technical Education
8
Introduction
20 Introduction
This report begins with a brief overview of the statersquos historical workforce trends and transitions into a high-level analysis of emerging trends affecting the statersquos labor supply and demand ndash both current and future The analysis concludes with a summary of key findings and priority recommendations
This report was produced by RESI of Towson University on behalf of and with input from the Governorrsquos Workforce Investment Board (GWIB) GWIB is the statersquos chief policy-making and strategic planning body on workforce development as mandated by the Federal Workforce Investment Act (WIA) of 1998 and Maryland Executive Order 0101200460 The board is a business-led group of industry education and government leaders charged with advising the governor on Marylandrsquos workforce development needs
9
Historical Backdrop
30 Historical Backdrop
Over time Marylandrsquos workforce has adapted and evolved The following quote from a 2004 New York Times article on the United Statesrsquo workforce sums up this premise nicely ldquoOur history is one of a constant churning of jobs with workers always finding the next step forward in the evolution of work ndash from farm hands to industrial workers to information handlersrdquo12
This statement certainly applies to Maryland which has transformed its economy dramatically over the years
Figure A reveals the general economic shifts the state has experienced since 1900 At that time Agriculture amp Related ranked as the leading employment sector for both Maryland (comprising 242 percent of total employment) and the nation (374 percent) Over the next five decades agricultural employment dropped precipitously comprising 72 percent of Marylandrsquos economy by 1950 and just 14 percent by 2000
Figure A Maryland Employment by Industry Percent of Total13
The rise and subsequent reduction of manufacturing employment also is reflected in the data as is the more recent domination of the services sector which continues today In 2000 manufacturing constituted 81 percent of the statersquos job base while services sector employment accounted for 411 percent Comparable national figures were 148 and 361 percent respectively
00
50
100
150
200
250
300
350
400
450
Agriculture amp Related
Services Manufacturing Wholesale amp Retail trade
Transportation amp Related
Construction Public Administration
Finance Insurance amp Real Estate
1900 1950 2000
12 Cox Richard 2004 13 US Census Bureau Public Use Micro Data
10
10
20
30
40
50
60
70
80
90
o
f Adu
lts W
ith A
t Lea
st a
HS
Dip
lom
1940 1950 1960 1970 1980 1990 2000
US MD
Historical Backdrop
Figure B Educational Attainment for US and Maryland14
These significant changes coincided with increasing labor force educational attainment levels as shown in Figure B In 1940 the first year in which educational attainment data was collected 211 percent of Marylandrsquos population age 25 and over had obtained a high school education or higher By 2000 this percentage approached 840 percent Corresponding national figures were 245 and
804 percent respectively Over the same period the percentage of the statersquos population age 25 and over with a Bachelorrsquos degree or higher skyrocketed from under 50 percent in 1940 to 315 percent in 200015 This chart reveals what employers and workforce development professionals have known for some time ndash an educated workforce has become increasingly critical to maintaining and nurturing economic success
14 Percent of Population aged 25+ with a High School Education or Higher US Census Bureau ldquoA Half-Century of Learning Historical Census Statistics on Educational Attainment in the United States 1940 to 2000rdquo 15 The corresponding national rate in 2000 was just 244 percent
11
Historical Backdrop
The increased demand for educated workers in Maryland has been broad-based and is reflected in industry-level educational attainment data Even in industries traditionally considered ldquoblue collarrdquo such as Manufacturing and Construction the educational attainment of workers has risen Data show that the proportion of workers in each Maryland industry with some college education has increased from just three percent of the statersquos manufacturing workers in 1940 to 26 percent in 2000 The proportion of Agriculture workers with some college skyrocketed from one percent in 1940 to over 20 percent in 2000
Figure C Maryland Educational Attainment by Industry 200016
By 2000 more thanHigh School or Less Some College College Degree Plus 40 of workers
Construction amp Mining 64 24 12 employed within Services Finance Agriculture amp Related 63 21 16 Insurance amp Real
Wholesale amp Retail Trade 58 28 15 Estate and Public 49 30 20 Administration had
obtained a college Transportation amp Related
Manufacturing 48 26 25 degree or higher More Services 28 26 46 than half of the workers
in Marylandrsquos Finance Insurance amp Real Estate 25 34 41 manufacturing sector
Public Administration 22 35 42 had at least some 00 200 400 600 800 1000 college or higher Other
industries employed a higher proportion of workers with a high school education or less such as Construction amp Mining (64 percent) Agriculture amp Related (63 percent) and Wholesale amp Retail Trade (58 percent)
16 RESI US Census Bureau Public Use Micro Data The graph refers to the distribution of maximum educational attainment levels by industry
12
Historical Backdrop
Today Maryland enjoys a healthy diverse economy driven by growth in services sectors such as education health care and other technical and professional services Among Marylandrsquos top 50 largest private employers are health and educational services firms (including The Johns Hopkins University and Hospital Adventist HealthCare and Helix Health System among others) defense and intelligence contractors (such as Northrop Grumman Corporation and Lockheed Martin Corporation) and other technical and professional services firms (such as Computer Sciences Corporation IBM Corporation Science Applications International Corporation and Westat Research Incorporated)17
Though life sciences firms are not generally considered to be large employment generators there is no doubt that the statersquos economy also has been shaped by the presence of industry high fliers such as MedImmune (recently acquired by AstraZeneca) and Human Genome Sciences Inc Any discussion of Maryland employers would not be complete without consideration of the statersquos proximity to and presence of federal research centers and labs
The importance of the federal government to the statersquos economy cannot be underestimated The many federal laboratories and facilities located within and near Maryland such as the Goddard Space Flight Center and the Naval Air Systems Command at Patuxent River have contributed greatly to Marylandrsquos science and security base The presence of the Food and Drug Administration (FDA) and the National Institutes of Health (NIH) have spurred growth among bioscience firms The National Security Agency (NSA) and Marylandrsquos many military installations (including Fort Detrick Fort Meade and Aberdeen Proving Ground) have been critical to building the statersquos base of science and security
17 Maryland Department of Business amp Economic Development 2006
13
Marylandrsquos Labor Supply
40 Marylandrsquos Labor Supply
41 Population Trends and Characteristics
The shifting composition and growth of Marylandrsquos population directly impacts the statersquos economy and labor force Population characteristics such as age educational attainment and diversity have a profound impact on the needs and types of services that will best ensure continued economic growth and prosperity throughout the state The extent to which policy makers educators and business leaders recognize and meet these needs can further strengthen Marylandrsquos ability to attract and retain quality jobs and workers
411 Population Growth Migration and Diversity
Marylandrsquos population exceeded 56 million in 2006 ranking the state 19th in the nation in population size The statersquos rate of population growth between July of 2005 and 2006 was just 05 percent Not only did the state lag the 10 percent national rate of population expansion but Maryland ranks among the bottom third of states (36th fastest growth) according to this measure
This sluggish rate of population growth is not characteristic of Marylandrsquos past performance Between 1990 and 1999 the statersquos population expanded at an average annual rate of 10 percent Between 2000 and 2003 Maryland recorded annual population growth ranging from 11 to 13 percent
The statersquos slower rate of population expansion in recent years can be explained by negative net migration trends In each of the three most recent years for which data are available (2004 through 2006) the state recorded negative net migration In other words more people are moving out of the state than are moving in Maryland recorded a net migration loss of 5000 in 2006 and 6800 in 2005 the largest such decline the state has seen since 198118 While it is true that net international migration continues to bolster the statersquos population growth net domestic outflows (migration between states) outweigh international migration gains Between 2005 and 2006 for instance Marylandrsquos net domestic migration outflows exceeded 25000 persons offsetting the 21000-person gain due to international migration19
It should be noted that Marylandrsquos net domestic migration decline represents a departure from recent trends Between 2000 and 2004 for instance the state recorded net domestic migration gains of more than 5400 per year20 While in the past domestic outflows have been associated with deteriorating or weakening economic conditions within the state recent trends appear to be driven by cost of living issues especially housing costs Out migration to border counties in Pennsylvania and West Virginia has increased significantly in recent years A possible explanation for this movement is the availability of affordable housing in these areas Median home values in Pennsylvania jurisdictions such as York and Franklin counties are roughly $75000 below those of Baltimore County This gap increases significantly when home values in
18 Maryland Department of Planning 19 US Census Bureau 20 US Census Bureau 2006
14
Marylandrsquos Labor Supply
Carroll and Frederick counties are considered Many former Maryland households have taken advantage of lower housing costs in these locales while still being part of Marylandrsquos job market
The good news is that this trend will likely be stemmed by the current and future Department of Defense (DoD) Base Realignment and Closure (BRAC) movements to Maryland The job movements which call for more than 15000 civilian jobs to transfer to Maryland by 2011 are expected to result in substantial household movements to Maryland as well
As previously noted international migration continues to bolster population growth both locally and throughout the nation Foreign immigration represents 443 percent of the statersquos population gain between 1990 and 2000 Marylandrsquos level of foreign-born population has grown from roughly 94000 in 1960 to more than 313000 in 1990 By 2000 nearly one out of every 10 Maryland residents (more than 518000 persons) was foreign born21
Figure E Marylandrsquos Share of Foreign-Born Population 200022
More than two-thirds of the statersquos 40 foreign-born population reports their 35 region of origin to be either Asia or
30 Latin America The most commonly reported Asian countries of origin
25 include China (which comprises 65
20 percent of the statersquos 2000 foreign-born population) India (62 percent)
15 Korea (60 percent) and the
10 Philippines (40 percent) El Salvador leads Latin American countries and
5 accounts for another 81 percent In
0 fact El Salvador comprises the single largest share of Marylandrsquos foreign-born population Jamaica and Mexico
each comprise an additional 37 percent Nigeria Vietnam Germany and the United Kingdom each comprise close to 30 percent of the statersquos foreign-born residents
Asia Latin America Europe Africa North America Oceana
Perc
ent o
f Tot
al
21 Goldstein 2006 22 US Census Bureau
15
Marylandrsquos Labor Supply
40
43
56
57
65
89
11 7
148
174
292
0 5 10 15 20 25 30 35
Figure F Foreign-Born Population as Percent of Total 200523
International migration is forecast to increase Marylandrsquos population Montgomery
by 593000 persons between 1995 Prince George s and 2025 ranking the state ninth in
Howard the nation according to this24 Maryland measure Montgomery and
Prince Georgersquos counties will Baltimore County
continue to absorb the lionrsquos share Frederick
of the statersquos international Anne Arundel
migration Foreign immigration Baltimore City accounted for 891 percent of
Montgomery Countyrsquos population Charles
gains and 719 percent of Prince Wicomico
Georgersquos Countyrsquos gains between 1990 and 2000 In 2005 foreign-
Percent of Totalborn people accounted for 292 percent of Montgomery Countyrsquos population and 174 percent of Prince Georgersquos County residents Howard County follows with 149 percent
Migration continues to increase diversity in Maryland which has recorded substantial increases in its minority population in recent years Between 2000 and 2006 the statersquos minority population expanded by roughly 327000 persons In contrast the statersquos non-Hispanic white population declined by 23000 persons over the same period Census projections indicate that by 2025 Marylandrsquos non-Hispanic white population will comprise just 543 percent of the statersquos total population down from 666 percent in 1995 Over the same period persons of Hispanic origin are expected to increase and comprise 70 percent of Marylandrsquos total population up from 36 percent in 199525
23 Goldstein 2006 24 US Census Bureau Population Division 25 US Census Bureau Population Division
16
Marylandrsquos Labor Supply
Figure G Share of Population by Selected RaceOrigin 200526
Census estimates for 2005 reveal Marylandrsquos population to be quite diverse relative to the nation African-Americans constitute 287 percent of the statersquos population more than twice the
0
10
20
30
40
50
60
70
80
White Black Hispanic or Latino (of any
race)
Asian Some other Race
Two or more races
Perc
ent o
f Tot
al
Maryland United States
60 percent in 2006 The corresponding national share for people of Hispanic or Latino origin in
national share The state also is home to a slightly larger (percent share) Asian population than is seen nationally While Marylandrsquos population of Hispanic or Latino origin has increased significantly in recent years (from roughly 230000 in 2000 to 318000 in 2005) this group comprised 58 percent of the statersquos population in 2005 and
2005 was 145 percent
412 Affluence
Recent data releases once again confirm Marylandrsquos reputation as one of the most affluent states in the nation With a 2006 median household income of $65144 Maryland ranks first in the nation according to this measure and far surpasses the comparable national income level of $48451
Poverty data reveal similar patterns Overall the statewide family poverty rate was 53 percent far below the national rate of 98 percent In 2006 only 78 percent of Marylandrsquos population lived below the poverty level the lowest rate in the nation and 55 percentage points below the national average
The fact that the statersquos households are well compensated is a reflection of Marylandrsquos highly educated and skilled workforce More than a third (351 percent) of the statersquos population age 25 and older has a Bachelorrsquos degree or higher The comparable national percentage is 270 percent The fact that Maryland has a relatively high proportion of households with two or more workers also helps to explain the statersquos high income levels In 2006 four out of 10 households fell within this category compared to 35 for the nation27
26 US Census Bureau American Community Survey 2006 27 US Census Bureau American Community Survey 2006
17
Marylandrsquos Labor Supply
Figure H Per Capita Income Levels by Maryland Workforce Investment Area (WIA)28
$20000 $25000 $30000 $35000 $40000 $45000 $50000 $55000 $60000
Montgomery Anne Arundel
Baltimore County Mid-Maryland
Maryland Frederick
Upper Shore Southern Maryland
Susquehanna Prince Georgersquos
United States Baltimore City
Lower Shore Western Maryland
Annual Per Capita Income
2005 Marylandrsquos affluence is significant for another reason Wealth offers a measure of protection from cyclical economic fluctuations Maryland may be better prepared to weather economic downturns than the balance of the nation However it should be noted
that all regions in Maryland are not equally protected Certain areas have participated less fully in recent economic recoveries than others as indicated by their per capita income levels With an annual per capita income level below $29000 Western Maryland (comprised of Allegany Garrett and Washington counties) trails all other Maryland Workforce Investment Areas (WIAs)29 The Lower Shore (which includes Somerset Wicomico and Worcester counties) also lags other areas with an annual per capita income level of just under $30000
While affluence can be considered a strength especially in the face of economic downturns it poses a challenge for other reasons Increased living costs and housing costs in particular can encourage out migration to lower cost areas a trend analysts believe has been occurring with increased frequency in Maryland for each of the last three years
28 Bureau of Economic Analysis RESI of Towson University WIA refers to Workforce Investment Area Maryland is home to 12 local WIAs each with a common labor pool and 200000 or more residents Each WIA is served by a separate Local Workforce Investment Board (LWIB) 29 In percentage terms however the Western Maryland region boasts the fastest rate of appreciation between 2004 and 2005 with growth in annual per capita income of 63 percent
18
Marylandrsquos Labor Supply
413 Educational Attainment
Figure I 2005 Education Attainment Levels Population 25 and Older30
Maryland is home to a highly educated population The state consistently ranks ahead
00
50
100
150
200
250
300
350
Max
imum
Edu
catio
nal
Atta
inm
ent A
chie
ved
Less than 9th Grade
9th-12th High School Some Associate s Bachelor s Graduate or Grade No Graduate College No Degree Degree Professional Diploma Degree Degree
Maryland United States
of the nation on a variety of education-related measures For instance the National Science Foundation ranks Maryland second in the nation in terms of doctoral scientists and engineers per 100000 population In addition in 2005 the statersquos concentration of professional and technical workers (249 percent) ranked second in the nation
Census educational attainment data tell a similar story In 2005 nearly one in four (194 percent) Marylanders age 25 and older earned a Bachelorrsquos degree as their highest level of educational attainment Approximately 157 percent of state residents have a graduate or professional degree Taken together 351 percent of Marylandrsquos population has a Bachelorrsquos degree or higher ranking Maryland third in the nation compared to 270 percent nationally The gap between Maryland and the nation has widened in recent years as Maryland has increased its proportion of highly educated residents In 1990 only 265 percent of the statersquos population had earned a Bachelorrsquos degree or higher just six percentage points ahead of national levels
30 US Census Bureau American Community Survey 2006
19
Marylandrsquos Labor Supply
Figure J Percent of Population with a Bachelorrsquos Degree or Higher by WIA31
00 100 200 300 400 500 600
Montgomery
Mid-Maryland
Anne Arundel
Frederick
Baltimore County
Prince Georgersquos
Susquehanna
Southern Maryland
Baltimore City
Lower Shore
Western Maryland
Upper Shore
2005 In 2005 Montgomery County and the Mid-Maryland region lead the state in terms of the percent of population age 25 and older with a Bachelorrsquos degree or higher with 563 and 471 percent respectively The Upper Shore and Western Maryland
lag the balance of the state with 111 and 155 percent of regional population respectively with a Bachelorrsquos degree or higher
Figure K Maryland Educational Attainment by Race 200532
Educational attainment distributions vary by race and ethnicityorigin as well While six out of every 10 Asians in Maryland has a Bachelorrsquos degree or higher less than 25 percent of African-Americans and less than 20 percent of Hispanics fall into this category Nearly 390 percent of the statersquos Hispanic population does not have a high school diploma and 242 percent
Total White Alone
Black Alone
Asian Alone
Hispanic (Any Race)
Less than 9th Grade 43 34 37 49 242
9th-12th Grade No
High School Graduate 267 261 309 141 225
117 45 146 Diploma 87 75
Some College No Degree 196 189 231 113 135
Associates Degree 63 63 63 60 54
Graduate or Professional 152 168 96 308 82 Degree
Bachelors Degree 193 209 147 284 116
Bachelors Degree or Higher 345 377 243 593 198
of Hispanics have less than a ninth grade education roughly six times the state average
31 US Census Bureau American Community Survey 2005 32 US Census Bureau American Community Survey 2005
20
Marylandrsquos Labor Supply
414 Aging Population
Many of the issues Maryland will face in terms of future workforce and economic development will be rooted in demographics Between 1970 and 1980 Marylandrsquo population grew by nearly 20 percent Between 2020 and 2030 growth is expected to be just over five percent As the statersquos population growth continues to wane finding skilled workers to fill jobs will become increasingly challenging
Figure L Historic and Projected Growth among Marylands Population Age 16+33
0
100000
200000
300000
400000
500000
600000
1970-1980 1980-1990 1990-2000 2000-2010 2010-2020 2020-2030
Popu
latio
n G
row
th
0
5
10
15
20
25
Absolute Growth
Percentage Growth
Figure M Maryland Historic and Projected Growth by Age34
The Maryland Department of Planning projects that between 2000 and 2030 the statersquos share of population age 20 to 44 will drop from 374 percent to 323 percent Over the same time frame the share of population age 65 and older will increase from 113 to 195 percent Maryland is not alone experiencing this trend though median age data indicate that the statersquos population is slightly older than that of the nation Marylandrsquos median age in 2005 was 371 years compared to a median age of 365 years for the nation as a whole
33 Maryland Department of Planning 34 Maryland Department of Planning
00
100
200
300
400
500
Perc
ent o
f Pop
ulat
ion
1990 2000 2005 2010 2015 2020 2025 2030
Aged 20-44 Aged 65+
21
Marylandrsquos Labor Supply
Census data from 2000 provide an indication of the relative median age of Marylandrsquos regions Eastern Shore jurisdictions such as Dorchester Kent and Worcester counties all have median ages over 40 years of age Talbot Countyrsquos population is the oldest in the state with a median age of 433 years of age Increased immigration of retirees to Eastern Shore locales helps to explain this trend All three Western Maryland jurisdictions also are home to older populations The trend in Western Maryland and Allegany County in particular is attributed to ongoing population decline and out migration among younger people
By 2005 more than 60 percent of the statersquos population was of working age (ie age 18 to 64) Of this population the vast majority (833 percent) fell into the 18 to 54 age range More than one fifth (207 percent) of the statersquos 2005 population of working age was comprised by the leading edge (those born between 1946 and 1955) of the baby boomers those born between 1946 and 1964 This segment of the population is set to face retirement between 2011 and 2020 By 2020 the number of baby boomers between ages 18 and 54 will increase by more than 123000 and will account for 223 percent of the statersquos working age population The data make clear that the retirement of roughly one-fifth of the statersquos working age population is fast approaching and will have a disproportionate effect on those regions that are already home to a large concentration of older residents and workers (such as Western Maryland and the Eastern Shore)
42 Workforce Trends
421 Labor Force Growth Figure N Marylands Labor Force 2000 ndash 200635
Marylandrsquos labor force topped the 3 million mark for the first time in the second quarter of 2006 The state recorded a 23 percent expansion in its labor force between 2005 and 2006
2500000
2600000
2700000
2800000
2900000
3000000
3100000
2000 2001 2002 2003 2004 2005 2006
Labo
r Fo
rce
Lev
el
-10
-05
00
05
10
15
20
25
Labo
r Fo
rce
Ann
ual G
row
th
Level Growth
surpassing the 14 percent growth rate recorded nationwide This expansion was driven by a 20 percent increase in the number of employed people and a 36 percent contraction in the number of unemployed persons The statersquos recent performance reverses a trend of diminishing growth registered between 2002 and 2004 when Maryland trailed the national rate of expansion
35 Maryland Department of Planning
22
Marylandrsquos Labor Supply
Despite this recent up tick the pace of expansion for both the state and national labor force has been slowing since 1970 Between 1970 and 1980 Marylandrsquos workforce expanded by nearly 453000 workers or 27 percent During the 1990s Marylandrsquos labor force grew by just five percent about 130000 workers According to projections from the Maryland Department of Planning the growth in Marylandrsquos labor force will slow even further in the future Between 2020 and 2030 the statersquos workforce is expected to expand by just three percent (or roughly 101000 workers) This trend is being driven by the aging of Marylandrsquos population
Figure O Labor Force Shares by WIA36
00 20 40 60 80 100 120 140 160 180
Montgomery
Prince Georges
Baltimore County
Baltimore City
Anne Arundel
Mid-Maryland
Susquehanna
Southern Maryland
Western Maryland
Frederick
Lower Shore
Upper Shore
2006 The vast majority of the statersquos labor force37 resides in the suburban jurisdictions outside Baltimore City and Washington DC In fact Montgomery and Prince Georgersquos counties are home to just under one-third of the statersquos labor force Collectively
Western Maryland and the Upper and Lower Shore regions comprise another 10 percent of Marylandrsquos labor force
36 Maryland Department of Planning 37 Refers to resident labor force or the population currently working or actively looking for a job
23
Marylandrsquos Labor Supply
-20 00 20 40 60 80 100 120 140 160
Southern Maryland
Frederick
Lower Shore
Susquehanna
Mid-Maryland
Upper Shore
Anne Arundel
Western Maryland
Montgomery
Prince Georges
Baltimore County
Baltimore City
2000-2006
expansion (62 percent) during this period
422 Unemployment Rate Analysis
Figure Q Unemployment Rates 2000 to 200739
Marylandrsquos average annual
Figure P Labor Force Growth 2000 to 200638
unemployment rate which held steady at 38 percent in 2007 remains quite healthy compared to historical and national levels The comparable US jobless rate is 46 percent
The unemployment rate measures the level of unemployed persons (persons who are not working and who are available and actively looking for work) as a percentage of the total labor
All Maryland Workforce Investment Act (WIA) areas except Baltimore City recorded resident labor force growth between 2000 and 2006 In fact with the exception of Baltimore and Prince Georgersquos counties all WIAs outpaced the national rate of
200
300
400
500
600
700
2000Q
1
2000Q
3
2001Q
1
2001Q
3
2002Q
1
2002Q
3
2003Q
1
2003Q
3
2004Q
1
2004Q
3
2005Q
1
2005Q
3
2006Q
1
2006Q
3
2007Q
1
Une
mpl
oym
ent
Rat
e
United States Maryland
force This indicator is significant because it provides a relative measure of the statersquos economic health
Marylandrsquos low unemployment rate is significant to workforce development professionals because it demonstrates that local labor market conditions are increasingly tight Most
38 Bureau of Labor Statistics 39 Bureau of Labor Statistics
24
Marylandrsquos Labor Supply
economists agree that an unemployment rate in the range of 35 to 45 percent is indicative of an economy operating at full employment Marylandrsquos jobless rate continues to fall within that range In fact the state has not recorded an unemployment rate above 45 percent since July 2003
Figure R Unemployment Rates for WIAs40
00 10 20 30 40 50 60 70
Lower Shore Baltimore City
Western Maryland Upper Shore
Prince Georges Baltimore County
Susquehanna Southern Maryland
Anne Arundel Frederick
Mid-Maryland Montgomery
Unemployment Rates (Not Seasonally Adjusted)
2000 Q1 2007 Q1
While Marylandrsquos low unemployment rate testifies to the strength of the statersquos economy persistent tight labor market conditions also have the potential to aggravate labor shortages and to apply upward pressure on wages
Not all Maryland regions boast tight labor market conditions Western Maryland Baltimore City and the Lower Shore for instance have consistently posted unemployment rates upwards of 50 and 60 percent Western Marylandrsquos high unemployment rate stems from the loss of high-wage manufacturing jobs over the past two decades due to closures of former mainstay employers While the region has since experienced job growth much of the new job creation has been in low-skill low-wage positions The fact that the region has a high share of population with less than a high school diploma makes it more difficult for these workers to find quality jobs
40 Bureau of Labor Statistics
25
Marylandrsquos Labor Supply
With an unemployment rate of 61 percent in 2007 Baltimore City also is characterized by looser labor market conditions41 Baltimore is faced with serious long-term challenges including a significant number of underemployed workers as well as large segments of population who do not participate in the workforce The city is home to the largest number of residents with less than a ninth grade education (26679 persons in 2006 or 66 percent of Baltimorersquos population age 25 and older) The cityrsquos high school dropout rate at 105 percent in the 2005-2006 school year exceeds the 35 percent rate posted statewide These dropouts pose a serious workforce development challenge for the city Helping these nontraditional segments of the population (dislocated workers veterans disabled population ex-offenders etc) participate more fully in the labor market may help alleviate the demand for workers in the face of growing skill set and worker shortages
423 Labor Force Participation Rates
Figure S Labor Force Participation Rates for WIA42
500 550 600 650 700 750 800
Mid-Maryland
Frederick
Susquehanna
Montgomery
Southern Maryland
Prince Georgersquos
Anne Arundel
Baltimore County
Upper Shore
Lower Shore
Western Maryland
Baltimore City
Labor Force Participation
2000 Marylandrsquos labor force participation rate among 16- to 64-year-olds (including military) was 782 percent in 2006 ranking the state 11th in the nation according to this measure The comparable national rate is 745 percent43
41 It should be noted however that labor market conditions have improved significantly from 2004 when the city consistently recorded unemployment rates in excess of 70 percent 42 Bureau of Labor Statistics 43 US Census Bureau American Community Survey 2006
26
Marylandrsquos Labor Supply
Figure T Labor Force Participation Rates by Age44
Shifting demographics will have an effect on the statersquos labor force going forward According to Maryland
00
200
400
600
800
1000
Labo
r Fo
rce
Paric
ipat
ion
by A
ge
16-24 25-54 55 and over
2000
Department of Planning data labor force participation rates in 2000 approached 60 percent among those age 16 to 24 years Nearly 830 percent of those aged 25 to 54 years participated in the labor force However only 439 percent of those age 55 and over were in the labor force
Analysts increasingly anticipate that older workers will remain in the workforce longer compared to previous generations Still it is clear that as Marylandrsquos population ages labor force participation will be affected
424 Commuting Patterns
Figure U Percent Change in Marylands ImportedExported Workers45
Journey-to-work data from the 25 2000 Census reveal that for
20 every Maryland worker living outside the state there are 25
15 Maryland residents who leave
5
10
Exported Workers Imported Workers Net Exported Workers
1990
- 20
00
Perc
ent C
hang
e the state for work In other words Maryland is a net exporter of workers In 2000 the state recorded net exported workers in excess of 268000
0 This trend is not surprising since 1990 commuting patterns
-5 show the same pattern However an examination of 1990 and 2000 data indicates
that the situation is improving In 1990 Maryland exported 29 resident workers for every imported worker This improvement is explained by the fact that growth among imported workers (up 208 percent between 1990 and 2000) far surpasses the growth of exported workers (up 43 percent)
44 Bureau of Labor Statistics 45 US Census Bureau
27
Marylandrsquos Labor Supply
Between 1990 and 2000 the number of out-of-state residents commuting to Maryland jumped from 151330 to 182787 In 2000 the vast majority of these workers (872 percent) resided in Washington DC Delaware Virginia and West Virginia Growth was driven especially by outflows from the latter three states While the number of workers commuting from Washington DC to Maryland increased over the period they were a smaller share of Marylandrsquos imported workers dropping from 236 percent in 1990 to 199 percent in 2000
More than 450000 Maryland residents commuted outside the state for work in 2000 The lionrsquos share of these residents worked in Washington DC (620 percent) while another 242 percent worked in Virginia Delaware and Pennsylvania comprise another 52 and 28 percent respectively The number of out commuters to Washington DC dropped by more than 11000 persons or by 39 percent between 1990 and 2000
Marylandrsquos commuting patterns data is relevant not only from a workforce perspective but also from a quality of life perspective According to the Transportation Research Board by 2000 Maryland had joined the ranks of New York New Jersey and Illinois with more than 10 percent of workers traveling over 60 minutes to get to work46 The 2006 American Community Survey figures indicate that Marylandrsquos average commute time of 306 minutes is the second longest commute time in the nation closely trailing New Yorkrsquos average commute time of 309 minutes47
46 Pisarski 2006 47 US Census Bureau American Community Survey 2006
28
Marylandrsquos Labor Supply
43 Marylandrsquos Educational Supply Pipeline
It is abundantly clear that an educated workforce is essential to Marylandrsquos economy While Marylandrsquos educational institutions produce a majority of the statersquos workers there is a substantial amount of ebb and flow of educated workers between Maryland and other areas Enrollment in Marylandrsquos educational institutions has risen greatly and is expected to continue to grow in the foreseeable future
As of the 2005-2006 academic year Maryland educational institutions yielded the following labor supply 56302 high school graduates 13715 Associatersquos degrees (or certificates) 25484 Bachelorrsquos degrees 13265 Masterrsquos degrees Another 1122 first professional degrees (ie lawyers) and 1363 Doctoral degrees
Not all of these graduates choose to remain and work in Maryland Conversely not all of Marylandrsquos labor supply comes from the statersquos higher educational institutions Survey estimates reveal that the vast majority (84 percent) of Marylandrsquos community college graduates were full-time Maryland workers at least one year after graduation The corresponding figures are 64 percent for those with Bachelorrsquos degrees and 57 percent for graduates of Marylandrsquos private career schools48 Marylandrsquos ability to connect a greater number of these graduates to local Maryland employers could help reduce the impact of worker shortages
Between 1994 and 2004 full-time undergraduate enrollment in Marylandrsquos four-year public colleges and universities grew by 25 percent and community college enrollment increased by 33 percent According to projections from the Maryland Higher Education Commission (MHEC) growth in full-time enrollment at public four-year institutions is expected to moderate to 17 percent between 2007 and 2016 Growth among full-time community college students is expected to drop to 21 percent over the same period These projections are driven by predicted demographic shifts They also account for the estimated impact of tuition increases as well as changes in per capita disposable income
Over the same period graduate enrollment among public educational institutions is expected to rise 10 percent for full-time students and 55 percent for part-time students49 Increases in part-time enrollment will continue to be driven by enhanced opportunities for distance learning and online courses offered by traditional universities as well as through programs such as the University of Maryland University College
48 Percentages refer to five-year averages based on information published in the Maryland Higher Education Commissionrsquos 2007 Trend Book 49 Maryland Higher Education Commission 2007
29
Marylandrsquos Labor Demand
50 Marylandrsquos Labor Demand
51 Industry Analysis
Between 2005 and 2006 Marylandrsquos aggregate economy expanded by 31932 employees or 13 percent The statersquos 25 million job holders enjoyed average weekly wages of $88750
Marylandrsquos rate of employment expansion during this period represents a deceleration from the 16 percent growth rate recorded between 2004 and 2005 Not only has Marylandrsquos rate of employment growth slowed but the state lags the nation according to recent quarterly employment data Marylandrsquos 14 percent expansion recorded between the second quarters of 2005 and 2006 ranks the state 27th in the nation and trails the 18 percent national average Just a few years ago in 2004 Maryland consistently ranked in the top 15 states according to this measure This trend of decelerating employment growth would be cause for greater concern if not for the anticipated influx of tens of thousands of jobs to Maryland by 2011 due to the BRAC decisions While the incoming jobs have the potential to grow Marylandrsquos employment base the challenge which Maryland is addressing actively is to fill the current and future need for workers RESI anticipates that the statersquos economy will register annual rates of employment growth in the mid-one percent range in both 2006 and 2007 While not spectacular this is by no means indicative of an economic downturn Still this trend of decelerating employment growth is an area analysts will be tracking closely in the near-term future
Figure V Employment Growth by WIA 2005 to 200651
Regional employment growth for the most recent period for which data are available (2005 to 2006) ranges from shy02 percent in Baltimore City to 33 percent in Mid-Maryland Other rapidly expanding WIA regions include the Lower Shore and Southern Maryland Employment in both of these areas expanded at a pace of more than 20 percent between 2005 and 2006
50 The 25 million employment figure (as well as the additional employment figures contained in this section of the analysis) refers to Bureau of Labor Statistics Quarterly Covered Employment amp Wage data This data represents employment by place of work data and is reported to the Bureau of Labor Statistics by the Maryland Department of Labor Licensing amp Regulation (DLLR) and includes all workers covered by the Unemployment Insurance (UI) Law of Maryland and the unemployment compensation for federal employees (UCFE) program This data series accounts for approximately 91 percent all civilian employment Excluded from this data are the self-employed 51 US Bureau of Labor Statistics Quarterly Census of Employment amp Wages (QCEW) Data
-05 00 05 10 15 20 25 30 35
Mid-Maryland Lower Shore
Southern Maryland Susquehanna
Anne Arundel Montgomery
Maryland Upper Shore
Baltimore County Frederick
Western Maryland Prince Georgersquos
Baltimore City
Employment Change
2005-2006
30
Marylandrsquos Labor Demand
Employment Composition
Approximately 180 percent of the statersquos aggregate economy falls within the public sector which is comprised of local state and federal governments As a whole the public sector grew at a 16 percent clip above the average for all major sectors and pays higher than average weekly wages of $1029 With employment just above 125000 in 2006 the federal government sector comprises 49 percent of the statersquos economy and pays average weekly wages of $1438 substantially higher than the average
The importance of the federal government to the statersquos economy cannot be underestimated The many federal laboratories and facilities located within and near Maryland such as Goddard Space Flight Center and the Naval Air Systems Command at Patuxent River have contributed greatly to Marylandrsquos aerospace industry The presence of the Food and Drug Administration (FDA) and the National Institutes of Health (NIH) has spurred growth among bioscience firms The National Security Agency and Marylandrsquos many military installations have been critical to building the statersquos base of defense-related businesses
Figure W Marylandrsquos Economic Composition 200652
1-YEAR CHANGE IN EMPLOYMENT SECTOR EMPLOYMENT
LEVEL ABSOLUTE PERCENT
WEEKLY WAGES
AGGREGATE ECONOMY 2529671 31932 13 $887 PUBLIC SECTOR 455820 7170 16 $1029
Local Government 233109 6978 31 $848 State Government 97530 826 09 $879 Federal Government 125181 -634 -05 $1438
PRIVATE SECTOR 2073851 24762 12 $856 Retail Trade 299508 906 03 $620
Healthcare amp Social Assistance 295006 8871 31 $737 Professional Scientific amp Technical Services 219155 5236 24 $1401 Accommodations amp Food Services 193278 -303 -02 $377
Construction 188357 5331 29 $926 Administrative amp Support amp Waste 157299 1275 08 $710
Manufacturing 136328 -4166 -30 $1700 Finance amp Insurance 109595 -379 -03 $1238 Wholesale Trade 94927 677 07 $1097 Other Services (Except Public Administration) 89612 466 05 $585 Educational Services 54007 -66 -01 $815 Transportation amp Warehousing 65867 2237 35 $863
Real Estate amp Rental Leasing 48004 -299 -06 $886 Information 50770 392 08 $1218 Arts Entertainment amp Recreation 36476 812 23 $644
Management of Companies amp Enterprises 17763 4199 310 $1696 Utilities 9711 -38 -04 $1709
52 RESI US Bureau of Labor Statistics Quarterly Census of Employment amp Wages (QCEW) Data
31
Marylandrsquos Labor Demand
Agriculture Forestry Fishing amp Hunting 5031 -128 -25 $573 Mining 1794 67 39 $884
Not Elsewhere Classified 1362 -327 -194 $1111
With employment in excess of 207 million the private sector comprises the lionrsquos share (820 percent) of Marylandrsquos economy One of the single largest private sector industries in the state is the Healthcare amp Social Assistance sector In 2006 employment in this sector expanded by 31 percent to just over 295000 employees Retail Trade Professional Scientific amp Technical Services and Accommodations amp Food Services also rank among the largest private sector employers within the state each employing a significant proportion of Maryland workers
Regional employment distributions across industries are fairly similar to that of the state as a whole with a few notable exceptions Both Southern Maryland (comprised of Calvert Charles and St Maryrsquos counties) and Frederick Prince Georgersquos and Montgomery counties boast high concentrations of public sector and especially federal government employment Federal government employment comprises 92 percent of Southern Marylandrsquos aggregate economy The collective share for Frederick Prince Georgersquos and Montgomery counties is 80 percent Montgomery and Frederick counties have the highest proportion of employment within Professional Scientific amp Technical Services in the state with shares of 140 percent and 135 percent respectively Western Maryland and the Upper Shore are home to a significantly higher proportion of Manufacturing employment with 113 and 123 percent respectively In both of these areas the share of Manufacturing employment is more than double that of the state as a whole
Western Maryland boasts the highest share of Transportation amp Warehousing employment (42 percent) This is reflective of the way Washington County in particular has been able to leverage successfully the regionrsquos excellent transportation infrastructure which includes access to three interstates (I-68 I-70 and I-81) and two railway lines (CSX Transportation and Norfolk Southern) to reinvent itself as a transportation hub Washington County currently is home to 151 Transportation amp Warehousing businesses including the Staples Distribution Center
Montgomery County leads the state in share of Information employment (33 percent) and boasts the highest concentration (15 percent) of employment within the Management of Companies amp Enterprises sector The Lower Shore employs a significantly large proportion of workers within the Accommodations amp Food Services sector Employment in this industry comprises 155 percent of the regionrsquos economy compared to just 76 percent for Maryland as a whole
32
Marylandrsquos Labor Demand
Among the fastest growing Maryland employment sectors are high wage sectors such as Professional Scientific amp Technical Services which expanded by more than 4900 positions or 23 percent between the third quarters of 2005 and 2006 Also growing quickly were Management of Companies amp Enterprises with growth of more than 4300 positions and Wholesale Electronic Markets amp Agents amp Brokers with growth of 2314 positions Each of these sectors pays weekly wages above $1300 well in excess of the $858 average for all Maryland industries Growth also is being led by Food amp Beverage Stores which expanded by 4543 jobs or 77 percent and the demographically driven Nursing amp Residential Care Facilities industry with growth of 3409 positions or 57 percent Specialty Trade Contractors also ranks high on the list
Figure X Top Employment Gaining Maryland Industries 2005Q3 ndash 2006Q353
RANK INDUSTRY EMPLOYMENTLEVEL 1-YEAR CHANGE IN
EMPLOYMENT ABSOLUTE PERCENT
WEEKLY WAGES
1 2 3 4 5 6 7
8 9
10
11 12 13 14 15
Professional Scientific amp Technical Services Food amp Beverage Stores Management of Companies amp Enterprises Nursing amp Residential Care Facilities Specialty Trade Contractors Ambulatory Healthcare Services Hospitals Wholesale Electronic Markets amp Agents amp Brokers Food Services amp Drinking Places Warehousing amp Storage Building Material amp Garden Equipment amp Supplies Dealers Transit amp Ground Passenger Transportation Clothing amp Clothing Accessories Stores Construction of Buildings Couriers amp Messengers
219324 63824 18065 63235
128225 95508 95046
12827 177052
10747
26550 8838
30520 45944 11393
4920 23 4543 77 4337 316 3409 57 2951 24 2635 28 2602 28
2314 220 2007 11
944 96
894 35 815 102 788 27 718 16 641 60
$1335 $465
$1421 $538 $850 $985 $896
$1434 $295 $762
$609 $457 $331 $966 $726
53 RESI US Bureau of Labor Statistics Quarterly Census of Employment amp Wages (QCEW) Data
33
Marylandrsquos Labor Demand
Industries rapidly shedding jobs are led by a mix of retail services and manufacturing sectors including General Merchandise Stores which contracted by more than 6900 positions or 127 percent between the third quarters of 2005 and 2006 Accommodations (loss of more than 2700 positions) and Insurance Carriers amp Related Activities (loss of 1116 positions) The latter industry pays weekly wages approaching $1200 well in excess of the $858 average for all Maryland industries Manufacturing sectors comprise five of the most rapidly declining industries including Computer amp Electronic Product Manufacturing Primary Metal Manufacturing Leather amp Allied Product Manufacturing Transportation Equipment Manufacturing and Wood Product Manufacturing Collectively these industries shed nearly 2600 jobs from the statersquos payrolls It is important to note that with the exception of Wood Product Manufacturing these contractions are concentrated within high-paying sectors
Figure Y Top Employment Losing Maryland Industries 2005Q3 ndash 2006Q354
RANK INDUSTRY EMPLOYMENT LEVEL
1-YEAR CHANGE IN EMPLOYMENT
ABSOLUTE PERCENT
WEEKLY WAGES
1 2 3 4
5 6 7 8
9 10 11 12 13 14 15
General Merchandise Stores Accommodations Insurance Carriers amp Related Activities Merchant Wholesalers Durable Goods Sporting Goods Hobby Book amp Music Stores Merchant Wholesalers Nondurable Goods Motion Picture amp Sound Recording Industries Motor Vehicle amp Parts Dealers Computer amp Electronic Product Manufacturing Miscellaneous Store Retailers Rental amp Leasing Services Primary Metal Manufacturing Leather amp Allied Product Manufacturing Transportation Equipment Manufacturing Wood Product Manufacturing
47619 24725 34577 52555
13161 29846 4489
38795
21786 18947 13595 3583
171 8314 3567
-6927 -127 -2729 -99 -1116 -31 -1066 -20
-1005 -71 -1002 -32
-695 -134 -659 -17
-653 -29 -634 -32 -544 -38 -533 -129 -489 -741 -465 -53 -445 -111
$365 $428
$1173 $1194
$395 $941 $444 $842
$1659 $425 $723
$1124 $911
$1164 $692
54 RESI US Bureau of Labor Statistics Quarterly Census of Employment amp Wages (QCEW) Data
34
Marylandrsquos Labor Demand
52 Base Realignment and Closure Commission (BRAC) Demand
The most recent round of BRAC decisions clearly will benefit Marylandrsquos economy and will result in thousands of new high-skill high-wage jobs moving into the state over the next five years However the anticipated influx of Department of Defense (DoD) and associated contractor positions ndash estimated at between 40000 and 60000 new jobs ndash presents its own set of challenges from a workforce development perspective
The BRAC legislation mandates that several DoD units (comprised of more than 15000 civilian DoD personnel) must move to Maryland by 2011 The extent to which current DoD employees will follow their jobs to Maryland is not clear Recent estimates indicate that between 30 and 50 percent of the civilian employees working at Fort Monmouth New Jersey plan to follow their jobs to Aberdeen55 Filling the gap with existing Maryland workers and recruiting new employees will present a significant workforce development challenge This challenge will undoubtedly escalate as existing civilian DoD workers approach retirement According to a report issued by the Pentagon in 2002 the average age of DoD employees is 452 years
The size and scope of the DoD units moving to Maryland as a result of BRAC could be influenced by future and current workforce availability In other words if jobs go unfilled they could very well be lost The challenge for workforce development officials is to ensure that Maryland gains as many potential BRAC jobs as possible The way to achieve this goal is to make sure that new positions are filled quickly Implementing an efficient security clearance process is one way to work toward this goal
Most important the Statersquos workforce development system must strive to ensure that Marylandrsquos labor pool is ready and able to fill the types of jobs that BRAC will bring to Maryland Both the Fort Monmouth and the Defense Information Systems Agency (DISA) units that are slated to move to Maryland report a high proportion of the following occupations
Electricalelectronics engineers Computer engineers Management and program analysts Computer scientists Information technology managers General engineers Telecommunications specialists
55 September 28 2007 presentation by Mark Fuhring Deputy Director of Human Resources CECOM Life Cycle Management Command
35
Marylandrsquos Labor Demand
These occupations require a Bachelorrsquos degree mainly in the engineering and sciences fields for entry-level positions For higher grade positions graduate education andor a combination of work experience is required Key skills associated with these positions include
Complex problem solving Critical thinking Judgment and decision making Systems evaluation56
Technology design57
There will be ancillary effects of BRAC to be considered as well Specifically the influx of BRAC personnel and contractors will drive significant construction activity and the demand for personal services The influx also will ramp up demand for services workers such as construction managers and workers day care workers and hospitality workers among others Community colleges in Harford and Anne Arundel counties already have begun to explore program needs associated with these occupations According to a report produced by RESI in 2006 for every direct on-base job58 job that comes to Maryland 196 additional spin-off jobs will be created59 This is an area that should be explored fully by workforce development professionals
53 Demand for Science Technology Engineering and Mathematics (STEM) Workers
In recent years upper-level degrees in science and engineering have been awarded to high proportions of foreign-born students According to the National Academy of Science 59 percent of US engineering doctorates were awarded to foreign students in 200360 In 2004 roughly 63 percent of the 147 doctoral degrees in engineering awarded by Maryland institutions went to foreign students including a small number of non-US citizens with permanent resident visa status and a much larger portion of non-US citizens with temporary visa status
This trend can benefit our economy since many foreign-born people with doctorates remain in the country to work at least for some period of time Americarsquos ratio of natural sciences and engineering degrees awarded to our college age population (57 per 100) severely lags that of Japan (8 per 100) Europe (8-13 per 100) and Taiwan and South Korea (11 per 100) Recent evidence indicates however that US institutions are facing greater competition from international schools for these students a concern noted in the Maryland Higher Education Commissionrsquos 2004 plan Increased immigration restrictions have not helped the situation In 2000 Asian universities awarded 12 million of the worldrsquos science and engineering degrees (undergraduate graduate and doctoral) while the US awarded just 500000
56 The US Department of Labor defines systems evaluation as follows Identifying measures or indicators of system performance and the actions needed to improve or correct performance relative to the goals of the system 57 Technology design is defined as Generating or adapting equipment and technology to serve user needs 58 Direct on-base positions include civilian DoD positions as well as embedded private defense contractors 59 RESI Maryland Department of Business amp Economic Development 2006 60 National Academy of Science p7 2007
36
Marylandrsquos Labor Demand
It should be noted that a 2005 Duke University study presents the US in a more competitive light61 The study notes that previously published figures on the number of engineering or computer science graduates for the US China and India are not necessarily comparable due to differences in the types of programs and program length etc According to Dukersquos findings when the number of degrees granted is normalized to account for population size (on a per one million citizen basis) the US generates 750 technology specialists compared to 500 produced by China and 200 produced by India
While the scope of the competition that US higher educational institutions currently face is debatable there is one point on which analysts agree national and local economies will face greater demand for scientists and engineers going forward Marylandrsquos demand for workers in these sectors will be exacerbated further by demographics (as many current workers approach retirement) and by the impacts of BRAC which will result in the movement of a significant number of science and engineering jobs to Maryland in the near future
According to this measure Maryland fares better than most states After all Maryland ranks second in the nation in our concentration of doctoral scientists and engineers62 as well as in our number of employed PhD scientists and engineers per 100000 workers (9385)63 We are home to a multitude of federal and university research labs and rank second in the nation in terms of federal research and development spending and first in terms of university research dollars64
Still given future demand growing our base of science and engineering degrees must remain a high priority
Various Maryland entities recognize this need including GWIBrsquos Aerospace Industry Steering Committee which recommended several initiatives aimed at promoting science technology engineering and mathematics (STEM) education in Maryland Among these is the recommendation for the creation of a STEM Center of Excellence as well as the development of articulation agreements between high school pre-engineering programs and college programs Industry internships and mentorships also are identified as a means to grow Marylandrsquos supply of scientists and engineers
The Maryland State Department of Education (MSDE) also is well aware of the need for more scientists and engineers and began implementing Project Lead the Way (PLTW) in 2003-2004 PLTW is a pre-engineering program which aims to increase preparation among high schools students for higher education engineering programs Forty-three (43) Maryland high schools in 16 school systems participate in the program which allows students to enroll in such courses as Principles of Engineering Computer Integrated Manufacturing Civil Engineering and Aerospace Engineering Maryland recently received the Joseph H Oakley Excellence in Education Award for its PLTW progress Maryland also will be piloting the newly-launched PLTW for the biomedical sciences curriculum An aerospace PLTW program also is in the planning stages
61 Duke University 2005 62 National Science Foundation 2003 63 National Science Foundation State Science amp Technology Institute 2003 64 Maryland Higher Education Commission 2004
37
Marylandrsquos Labor Demand
Another MSDE program that focuses on this area is the Super Stem Project which partners higher education (the University of Maryland Baltimore County) with the Baltimore County Public Schools and MSDE The program is funded by the National Science Foundation and targets improving student achievement teacher quantity and quality specifically within STEM programs
54 The Demand for Basic and Applied Skills
The Conference Board in collaboration with several other organizations conducted a survey of US firms in 2006 to determine how employers rate new entrants to the workforce65 The results were not positive Overall employers do not consider recent graduates (high school graduates as well as graduates of two- and four-year institutions) to be adequately prepared for the workforce Specifically firms identified the following shortcomings among these populations
Figure Z Deficiencies of New Entrants to the US Workforce as Specified by Employers66
High School Graduates are bull ldquoDeficientrdquo in the basic knowledge and skills of Writing in English Mathematics and Reading Comprehension bull ldquoDeficientrdquo in Written Communications and Critical ThinkingProblem Solving
both of which may be dependent on basic knowledge and skills bull ldquoDeficientrdquo in ProfessionalismWork Ethic and bull ldquoAdequaterdquo in three ldquovery importantrdquo applied skills Information Technology Application
Diversity and TeamworkCollaboration Two-Year and Four-Year-College Graduates are bull Better prepared than high school graduates for the entry-level jobs they fill bull ldquoDeficientrdquo in Writing in English and Written Communications and bull ldquoDeficientrdquo in Leadership
65 The Conference Board 66 The Conference Board p11
38
Marylandrsquos Labor Demand
GWIBrsquos Industry Monograph for Marylandrsquos Hospitality amp Tourism Industry confirms these findings The GWIB report identifies a critical mismatch between the ldquojob-readinessrdquo or basic skills required for the majority of occupations within the sector and the skill levels of new entrants to the field The majority of occupations within this sector require basic skills and on-the-job training In fact only one occupation out of 35 requires a Bachelorrsquos degree or higher (General and Operational Managers) Yet for the balance of occupations employers are having difficulty finding workers with good active listening skills service orientation and cultural awareness and sensitivity Finding job entrants with the ability to read write and understand standard and spoken English also is a critical priority for the industry To address these issues the report recommends creating a statewide resource network to advance basic skills and to support tax incentives for worker training in English as a Second Language among other recommendations
According to occupational projections updated by the Maryland Department of Labor Licensing amp Regulation (DLLR) the top four occupations in which we expect to see the greatest level of replacement openings between 2004 and 2014 include67
Cashiers (33780 replacement openings) Retail salespersons (31670) Waiters and waitresses (21585) Combined food preparation and serving workers (17035)
This list is not surprising as these occupations have been associated traditionally with limited career paths and high turnover rates However this list also brings the issue of basic skills to the forefront Not only do these occupations rank high in terms of projected turnover they also lead the state in terms of total projected job openings between 2004 and 2014 Using US Department of Labor occupational data (ONET)68 one can determine that these occupations require basic skills (as defined by the Department of Labor) such as active listening speaking writing and reading comprehension
The Conference Board also indicates that while both basic skills and applied skills69 are paramount for new entrants to the workforce applied skills tend to be rated as the most critical 21st century skills employers are seeking The four top-rated skills are considered to be applied skills according to the study They include (1) ProfessionalismWork Ethic (2) Oral and Written Communications (3) TeamworkCollaboration and (4) Critical ThinkingProblem Solving
67 Maryland Department of Labor Licensing amp Regulation Office of Workforce Information and Performance and Office of Labor Statistics 2007 68 The US Department of Laborlsquos online information system (ONET) The ONET online system provides occupational information as well as information on key attributes and characteristics of workers and occupations 69 Examples of basic skills noted in the study include reading comprehension spoken and written English mathematics science knowledge of a foreign language etc Applied skills include lifelong learningself direction creativityinnovation leadership etc
39
Looking Ahead Identifying Gaps Challenges and Opportunities
60 Looking Ahead Identifying Gaps Challenges and Opportunities
61 The Gap between Marylandrsquos Jobs and Labor Supply is Growing
The gap between the size of Marylandrsquos labor force and the statersquos inventory of jobs is widening70 The number of jobs in Maryland has outnumbered the statersquos resident labor force for several decades In 1970 the gap was roughly 46000 By 1990 this figure had more than doubled to nearly 120000 By 2020 this gap is expected to exceed 528000 The situation is not as dire as it appears to be on the surface since workers residing in neighboring states will continue to fill some portion of these jobs however the widening gap certainly will translate into greater competition for available labor
Figure AA Historic and Projected Maryland Resident Labor Force and Jobs by Place of Work71
Labor Force Number of Jobs
4000000
3500000
3000000
2500000
2000000
1500000
1000000
1970 1980 1990 2000 2010 2020 2030
Lab
or F
orce
Jo
bs
After 2010 labor force growth is expected to slow Between 2010 and 2020 for example the statersquos labor force is expected to increase by roughly 200000 (down from expected growth of more than 360000 over the previous decade) Much of the anticipated slowdown in labor force growth is attributable to the graying of our population For years experts have been anticipating the dramatic ways in which our aging workforce will affect national state and local economies The implications of this megatrend are enormous They range from the need for employers to adapt to increasing generational diversity and generational differences in the workplace to the need for companies to ensure that knowledge and skills are retained as older workers retire Maryland must confront the impacts of these demographic shifts along with the rest of the nation
70 The Maryland Department of Planning projects jobs by place of work using historical data released by the Bureau of Economic Analysis These are jobs which are located in Maryland but are filled by both state and non-state residents The statersquos resident labor force also is projected by the Maryland Department of Planning based on historical Bureau of Economic Analysis data Projections were updated in November 2006 71 Maryland Department of Planning November 2006
40
Looking Ahead Identifying Gaps Challenges and Opportunities
The following chart details Marylandrsquos historical current and projected labor force composition by age The proportion of adults age 55 years old and older who are active in the workforce is projected to increase from roughly 12 percent in 1990 to 26 percent by 2020 The proportion of Marylandrsquos workforce comprised of adults age 35 to 54 years old on the other hand is expected to decrease from 43 percent to 39 percent over the same period As previously mentioned this trend is due to the graying of the population ndash there are simply fewer people making up Generations X and Y compared to the size of the baby boomer generation
Figure AB Historic and Projected Proportion of Marylands Labor Force by Age72
Perc
ent o
f Lab
or F
orce
00
100
200
300
400
500
600
1990 2000 2010 2020 2030
16-34
35-54
55+
72 Maryland Department of Planning 2006
41
Looking Ahead Identifying Gaps Challenges and Opportunities
62 The Race to Preserve Institutional Knowledge
The impacts of Marylandrsquos aging population are not limited simply to the issue of filling jobs Shifting demographics and the approaching retirement of older workers will place increased pressure on firms to preserve institutional knowledge Simply put companies and industry are scrambling to prevent ldquobrain drainrdquo for good reasons
The dearth of qualified nuclear engineers and related workers illustrates this issue perfectly According to the Nuclear Energy Institute (NEI) the US nuclear industry faces a critical shortage of workers by 2010 In fact NEI finds that less than eight percent of industry employees are younger than 32 years of age and more than half are age 47 or older Expected shortages will affect a broad cross section of occupations within the industry ranging from health physicists and plant operators to technicians welders and maintenance workers73 The timing is especially problematic as the Nuclear Regulatory Commission expects an influx of applications for nearly three dozen new reactors by 2008 including Constellation Energy Grouprsquos application to build a new nuclear reactor at Calvert Cliffs74 Clearly industry and workforce development professionals must ensure that institutional knowledge within this critical industry is preserved and a sufficient pipeline of future workers is developed
The nuclear engineer example is not an isolated case According to findings from GWIBrsquos Aerospace Industry Initiative Workforce Summit conducted in January 2006 50 percent of the aerospace workforce in Maryland is expected to retire in the next 15 years A 2002 Accenture publication notes that ldquoThe vast majority of US and European chemical companies are concerned about problems posed by their aging workforce Estimates that 50 percent of employees will become retirement eligible in a particular function in the next decade are not uncommon in the US and Europerdquo75 Marylandrsquos Educational Services sector which already is feeling the impact of critical shortages ranks among those industries with a high proportion of older workers (roughly 18 percent are age 55 plus)76 The Healthcare sector is another that has begun to feel the impact of an aging workforce In 1998 nearly 24 percent of Marylandrsquos registered nurses working in hospitals were between the ages of 48 and 57 years old and another 19 percent were over the age of 58 By 2005 these proportions had grown to 28 and 25 percent respectively77 According to GWIBrsquos Healthcare Workforce Summit monograph vacancy rates in 2002 for registered nurses (156 percent) radiation therapy technicians (211 percent) and licensed practical nurses (129 percent) at Maryland hospitals already are high The issue of brain drain and shortages undoubtedly will be compounded as the demand for healthcare services increases due to the graying of the population78
73 Nuclear Energy Institute 2007 74 Baltimore Sun Constellation Energy files partial plan for reactor July 31 2007 75 DeLong page 3 76 Carroll 2004 77 Maryland Board of Nursing 78 One recommendation developed from GWIBrsquos Healthcare Workforce Summit involves transitioning retired military personnel to the private sector Many of these personnel have accumulated vast experience and training but lack proper certification ProVET (Providing Re-employment Opportunities to Veterans) is one program Maryland has launched in recent years to provide transition assistance for those veterans who are interested in securing private sector employment
42
Looking Ahead Identifying Gaps Challenges and Opportunities
63 FacultyTeacher Shortages
It is not the intention of this analysis to minimize the significance of labor shortages already occurring in Maryland industry sectors ndash for example that of registered nurses and other healthcare professionals However given that much already has been written about these shortages this analysis instead targets the issue of faculty shortages
Marylandrsquos need for teachers outstrips the statersquos ability to produce and retain them In 2005 school systems throughout the state hired roughly 8000 teachers of which 4350 were beginning new hires Only one-third (1439) of the beginning new hires had graduated from Maryland colleges and universities
Particular subjects facing current and future shortages include Technology education Computer science English for Speakers of other Languages Foreign languages Mathematics Science Special education
The issue of faculty shortages extends to higher education as well and is affecting a range of Maryland industries including the healthcare sector As noted in GWIBrsquos HealthCare Monograph ldquothe amount of faculty and learning facilities is inadequatehelliprdquo to train the statersquos healthcare workforce These shortcomings are evidenced by student waiting lists at local nursing schools79 Indeed nursing programs both locally and nationally report an increase in the number of qualified nursing applicants being turned away due to a dearth of faculty and classroomclinical space In 2005 the number of applicants denied admission due to a lack of faculty or classroom and clinical space jumped to 29424 nationally and 1850 in Maryland
According to a 2005 survey80 the statersquos 24 nursing degree programs reported that 305 percent of full-time faculty positions were vacant Local shortages are attributed to both the aging of the statersquos faculty population as well as the difficulties in growing the pool of potential educators These difficulties range from structural barriers like limited local capacity of graduate programs in nursing education to market-driven trends (eg compensation for practicing nurses often exceeds that for nursing educators) These trends undoubtedly will be exacerbated as Marylandrsquos nursing faculty population continues to age and approach retirement The average age of nursing faculty at Maryland institutions as reported to the Board of Nursing in 2005 ranges from 42 to 55 years and nationally the average age of faculty retirement is 625 years81
79 Charting New Directions Governorrsquos Healthcare Workforce Summit page 13 80 Maryland Council of Directors of Associate Degree and Baccalaureate Programs Survey 81 Nursing Faculty Shortage Causes Effects and Suggestions for Resolution Maryland Statewide Commission on the Crisis in Nursing 2005
43
Looking Ahead Identifying Gaps Challenges and Opportunities
64 Increasing Age Diversity
Business and industry also will need to accommodate increased age diversity in the workplace According to a 2005 Forbes magazine article ldquoEmployers need to examine whether their policies programs and practices are age neutral For example is the company offering dependent care geared only toward children when the workforce may be at an age where elderparent care has more valuerdquo82
Adjusting to differences in generational attitudes and preferences in the workplace will present its own set of challenges For instance the chemical industry has become accustomed to low voluntary turnover among managers and professionals As younger generation workers (Generation X and Y in particular) replace retirees the industry will need to adapt to an increased tendency for voluntary attrition as these workers tend to be more willing to seek out better job opportunities83 Many today consider employee loyalty to be a thing of the past especially among todayrsquos younger workers who are perceived to be constantly on the prowl for bigger and better opportunities
The aging of our population also has implications for education As the age of students at postshysecondary educational institutions rises and as workers continue to pursue lifelong learning campuses and faculty increasingly will require additional flexibility in terms of location timing etc MHEC recognized this need in their 2004 plan and set a goal to enhance alternative approaches for educational delivery ndash namely distance learning and regional higher education centers The Statersquos academic institutions already have begun to respond to these needs as evidenced by institutional expansion to satellite campuses the expansion of 2+2 programs84 and increased investments in and access to distance learning programs that are part of Marylandrsquos higher education system
65 Immigrants Continue to Grow Marylandrsquos Labor Supply
Marylandrsquos workforce is expected to benefit from international migration at both ends of the employment spectrum as immigrants fill low-wage low-skill jobs as well as high-wage high-skill positions Low-skill jobs such as Combined Food Preparation amp Serving Workers for example continue to rank among the top occupations demanded in Maryland According to data published by the Urban Institute immigrants comprise a disproportionately high share (20 percent) of low-wage workers in the US Immigrant workers represent an especially large proportion of low-wage occupations within the farming and private household sectors According to 2002 estimates immigrants compose 37 and 42 percent of employment in these sectors respectively85 The Pew Hispanic Center reports that short-term unauthorized immigrants are concentrated heavily in the low-wage construction (including building and
82 Reeves 200583 Accenture Institute for Strategic Change 2002 84 2+2 is a program in which the first two years of post-secondary education are completed at a community college and the remainder is completed at a partner four-year institution85 Capps 2003
44
Looking Ahead Identifying Gaps Challenges and Opportunities
grounds cleaning and maintenance occupations) and hospitality industries (including food preparation and service occupations)86
GWIBrsquos Hospitality and Tourism monograph reveals the importance of this workforce to local industry The report documents Marylandrsquos reliance on immigrant workers seasonal and otherwise to fill a variety of occupations within this sector ranging from food service occupations such as bartenders hosts and hostesses cooks dishwashers and food preparation workers to grounds keeping workers desk clerks receptionists maids and housekeeping cleaners and security guards etc The report finds that the need for these workers outstrips supply The limited number of H-2B worker visas which allow for the temporary hiring of foreign workers granted to Maryland businesses is not enough to fill the vacant positions
Other immigrant segments are expected to continue to fill high-wage high-skill jobs in such occupations as scientists and engineers The Migration Policy Institute analyzed Census 2000 data and found that one out of every five doctors in the US is foreign born Two of every five medical scientists one of every five computer specialists and one of every six people in the engineering or science fields are foreign born In addition the proportion of foreign-born workers in other skilled fields such as nursing has grown significantly in recent years a trend which is expected to continue87
86 Pew Hispanic Center 2006 87 Kaushal 2006
45
Looking Ahead Identifying Gaps Challenges and Opportunities
0
20000
40000
60000
80000
100000
120000
1980 1990 2000Peop
le W
ho S
peak
Eng
lish
Not
Wel
l o
r N
ot a
t All
Figure AC Maryland Population Who Speak English ldquoNot Wellrdquo or ldquoNot at Allrdquo
From a workforce development perspective the movement of immigrants into Maryland will require increased investment in English as a Second Language (ESL) programs According to the decennial census data the percentage of people who reported to the Census Bureau that they spoke English ldquonot wellrdquo or ldquonot at allrdquo increased nearly 74 percent since 1990 (Figure AC) Of the more than 246000 persons who indicated that they spoke English ldquoless than very wellrdquo 44
percent reported Spanish as their native language while another 26 percent indicated an Asian language (particularly Korean Chinese and Vietnamese) as their native language Much of this population represents non-English speaking immigrants who present new challenges in terms of labor force training and education Recognizing this need organizations such as US Hispanic Youth Entrepreneur Education (USHYEE) in partnership with the Maryland State Department of Education (MSDE) and colleges and universities within the state are working together to provide Hispanic youth with scholarships along with technical and life skills that will encourage this segment of the population to seek higher education opportunities
The statersquos growing immigrant population has the potential to fill another significant role in Marylandrsquos economy As commerce and industry become more global knowledge of a foreign language is becoming increasingly critical to local businesses In fact a recent survey of US employers confirms that speaking a foreign language is expected to be a highly demanded skill in the 21st century Survey results indicate that while only 11 percent of employers currently rate this skill as ldquovery importantrdquo approximately two-thirds indicate that knowledge of a foreign language will increase in importance over the next five years In fact knowledge of a foreign language was singled out as the top basic skill expected to increase in importance88 In 2005 145 percent of Marylanders age five and older spoke a language other than English at home89 a trend that clearly will benefit the state in its efforts to meet foreign language needs
88 The Conference Board p11 89 US Census Bureau American Community Survey 2005
46
Looking Ahead Identifying Gaps Challenges and Opportunities
66 Adult Education and Engaging Workers with Barriers to Employment
Todayrsquos jobs and the jobs of tomorrow will require an increasingly complex array of skills including but not limited to verbal mathematical organizational and interpersonal skills This further complicates matters for the one million potential Maryland workers who have barriers to employment They include Marylandrsquos veteran population people with lower literacy ex-offenders people with disabilities and those receiving unemployment insurance benefits90
Preparing these workers for the jobs of the future presents another challenge for the Statersquos workforce development system As previously mentioned these populations are a potentially untapped labor supply If workforce development professionals can help this population transition more fully into the workforce tight labor market conditions may be alleviated
Veterans Population
As of 2005 more than 427000 people or 119 percent of the statersquos population 18 and over were veterans The vast majority of Maryland veterans (89 percent) are male Not surprisingly female veterans tend to be younger than their male counterparts A total of 776 percent of female veterans are between 18 and 54 years of age compared to 372 percent of male veterans91
Ex-Offenders
The number of offenders released from Maryland Department of Public Safety and Correctional Services facilities in 2006 approached 14000 Approximately six out of 10 or 8685 people were released in Baltimore City As of April 2007 nonviolent offenders constituted 426 percent of the nearly 23000 inmates housed in Maryland facilities More than 20 percent of this population is age 25 or under and another 171 percent are between 25 and 30 years of age Nearly 3400 of them or 149 percent of this population are serving a sentence of 36 months or less
Transitioning ex-offenders into the workforce is critical not only from a workforce development perspective but from a public safety perspective as well To the extent that this population can become engaged in the workforce the likelihood of recidivism is expected to decline
Lower Literacy Population
According to a report released recently by the US Department of Education roughly 206 percent of Marylandrsquos adult population (or 730000) was eligible for adult education services as of 2000 This population includes individuals who ldquolack sufficient mastery of basic educational skills to enable the individuals to function effectively in societyrdquo lack a high school diploma or equivalent or (are) ldquohellipunable to speak read or write the English languagerdquo Specifically this
90 Examples of other population segments that could be targeted include homeless persons welfare recipients and youth out of school among others 91 US Census Bureau American Community Survey 2005
47
Looking Ahead Identifying Gaps Challenges and Opportunities
population includes those adults age 16 or older who lack a high school diploma and who are not enrolled in school and adults who speak English as a second language and who have rated their ability to speak English as ldquowellrdquo ldquonot wellrdquo or ldquonot at allrdquo92
The vast majority of this adult education population (601 percent) is of working age (from 16 to 59 years old) yet in 2000 well over half of them (348717 persons) did not participate in the statersquos labor force Another 28484 reported they were unemployed Basic literacy and English as a Second Language instruction is needed to help transition this group more fully into the workplace More than 105000 of Marylandrsquos adult education population speak English as a second language and nearly half of this group (51952) identify themselves as speaking English ldquonot wellrdquo or ldquonot well at allrdquo93
People with Disabilities
Maryland is home to more than 376000 working age (from 16 to 64) people with disabilities Only about 43 percent of these people are employed compared to 78 percent for the remainder of the statersquos working age population94 The low employment rate for people with disabilities combined with the fact that many of them can become employed with or without accommodations are reasons that the GWIB views people with disabilities as an untapped workforce
Unemployed Persons and Persons Receiving Unemployment Insurance Benefits
As of August 2007 the number of unemployed Marylanders is on track to approach last yearrsquos level of roughly 116000 persons This population includes people who are not working but who are actively seeking work They are counted as part of Marylandrsquos labor force Though the number of unemployed people in Maryland has been on the decline since 2004 they still represent a substantial potential labor pool
More than 18000 initial unemployment claims were filed in Maryland in June 2007 The extent to which the State can link these persons with employment opportunities will help to decrease the number of people filing for initial and continuing unemployment insurance claims and will help increase Marylandrsquos available labor pool
92 US Census Bureau Profiles of the Adult Education Target Population Information from the 2000 Census December 2005 93 US Census Bureau Profiles of the Adult Education Target Population Information from the 2000 Census December 2005 94 US Census Bureau 2006 American Community Survey
48
Recommendations
70 Recommendations
This section of the analysis highlights a number of emerging challenges that will test the statersquos economic and workforce strengths over the next one to five years and provides priority recommendations to address these challenges
71 Science Technology Engineering and Mathematics (STEM) Industries are Struggling to Attract Recruit and Retain Workers
As in other industries many of Marylandrsquos science technology engineering and mathematics (STEM) industries face a looming retirement cliff as skilled baby boomers begin to retire and leave the workforce Compounding the problem is anecdotal and other evidence which suggests that the pool of qualified technical students graduating from college is actually diminishing The statersquos aerospace industry serves as a prime example According to the GWIB Aerospace Industry Steering Committee in 2006 nearly eight out of every 10 Maryland aerospace workers was age 51 or over and 50 percent of the current aerospace workforce is set to retire by 2020
Recommendation Increase opportunities for young people to become aware of and enter science technology engineering and mathematics (STEM) careers
One way to meet the need for workers in science technology engineering and mathematics (STEM) careers is to expand middle- and high school-level studentsrsquo interaction with STEM professionals through expanded internship and mentorship programs GWIBrsquos Aerospace Monograph also identifies the need to encourage STEM-related field trips and other applied activities and to invite industry professionals to classes or school activities The Johns Hopkins Universityrsquos Applied Physics Labrsquos (APL) Mentor Program is a perfect example of such interaction The program is conducted in conjunction with the Howard County Public Schools and other nearby schools and pairs high school students with volunteer APL professional staff The program enables students to work on science projects with their mentors during the school year
Encouraging qualified underrepresented population segments (ie females and minorities) to pursue studies in science and mathematics is another way to boost interest APL and a number of university partners are involved in a program that targets this issue The Maryland Mathematics Engineering Science Achievement program (MESA) is a pre-college program in which MESA partners work directly with teachers and schools in order to encourage K-12 interest in STEM fields The program targets minorities and females
Recommendation Expand and enhance pre-college programs such as Project Lead the Way
Expanding programs such as MSDErsquos Project Lead the Way (PLTW) is another approach PLTW is a pre-engineering program which aims to increase preparation among high school students for higher education engineering programs Forty-three (43) Maryland high schools in 16 school systems participate in the program which allows students to enroll in such courses as Principles of Engineering Computer Integrated Manufacturing Civil Engineering and
49
Recommendations
Aerospace Engineering Maryland soon will pilot the newly-launched PLTW for a biomedical curriculum An aerospace PLTW program also is in the planning stages
72 Maryland Continues to Face Growing Teacher and Faculty Shortages
The state continues to confront shortages among teachers and faculty Marylandrsquos need for teachers outstrips our ability to produce and retain them In 2005 roughly 8000 new teachers were hired in the state of Maryland Of the 4390 teachers who were new hires only 1439 (33) were graduates of Maryland colleges and universities95 Subjects with current and future teacher shortages include technology education computer science English for Speakers of other Languages foreign languages mathematics science (including physical science physics chemistry and earthspace science) and special education
The issue of faculty shortages extends to higher education as well and is affecting a number of Maryland industries including the healthcare sector As noted in GWIBrsquos HealthCare Monograph ldquothe amount of faculty and learning facilities is inadequatehelliprdquo to train the statersquos healthcare workforce These shortcomings are evidenced by student waiting lists for local nursing schools96 Nursing programs both locally and nationally report an increase in the number of qualified nursing applicants being turned away due to a dearth of faculty and classroomclinical space In 2005 the number of applicants denied admission for these reasons totaled 29424 for the nation and 1850 in Maryland
According to a 2005 survey97 Marylandrsquos 24 nursing degree programs reported that 305 percent of full-time faculty positions were vacant Local shortages can be attributed to both the aging of the statersquos population as well as difficulties in growing the pool of potential educators These difficulties range from structural barriers such as the limited local capacity of graduate programs in nursing education to market-driven trends (eg compensation for practicing nurses often exceeds that for nursing educators) These trends will undoubtedly be exacerbated as Marylandrsquos nursing faculty population continues to age and approach retirement The average age of nursing faculty at Maryland institutions as reported to the Board of Nursing in 2005 ranges from 42 to 55 years and the average age nationally for faculty retirement is 625 years98
Recommendation Enhance teacher retention through the expansion and enhancement of Professional Development School (PDS) networks
It appears that facultyteacher retention especially at the primary and secondary levels can be improved through access to quality Professional Development School (PDS) networks One example is Towson Universityrsquos PDS network which has been recognized at both the state and national levels as a successful model that relies on a partnership between a college or university and local school systems PDS networks aim to enhance and improve teacher quality through
95 Maryland State Department of Education 2006 96 Charting New Directions Governorrsquos Healthcare Workforce Summit page 13 97 Maryland Council of Directors of Associate Degree and Baccalaureate Programs Survey 98 Nursing Faculty Shortage Causes Effects and Suggestions for Resolution Maryland Statewide Commission on the Crisis in Nursing 2005
50
Recommendations
continuous professional development The network targets all stages of a teacherrsquos career offering professional development activities throughout the entire career An analysis of Towson Universityrsquos PDS network in 2001 showed that its teacher-graduates were retained at a much higher rate than other new teachers According to the study schools within the PDS network were associated with teacher retention rates of 80 percent after four years and 71 percent after five years This compares to non-PDS network retention rates of 45 and 34 percent respectively99
73 Marylandrsquos Growing Immigrant Population Opportunities and Challenges
Population shifts are impacting the demographic makeup of the state in ways that will have dramatic impacts on employer needs and workforce development Between 2000 and 2006 immigrants accounted for more than half (516) of Marylandrsquos population growth As of 2006 immigrants account for 12 of the statersquos population
Marylandrsquos workforce is expected to benefit from international migration at both ends of the employment spectrum as immigrants fill low-wage low-skill jobs as well as high-wage high-skill positions From a workforce development perspective this movement into Maryland will require increased investment in English as a Second Language (ESL) programs According to decennial census data the percentage of people who report to the Census Bureau that they speak English ldquonot wellrdquo or ldquonot at allrdquo has increased nearly 74 percent since 1990 Much of this population represents non-English speaking immigrants who present new challenges in terms of labor force training and education
Despite the pressing need for adult literacy services in Maryland demand continues to severely outstrip supply According to MSDE funding constraints dictate that a small percentage of annual demand is being met resulting in annual waiting lists of up to 5000 people Many of the people on waiting lists (47 percent) are waiting for access to ESL programs100
Recommendation Enhance and expand access to community English as a Second Language (ESL) programs
Not only is there a need for improved access to English as a Second Language programs but MSDE also notes the need to improve the quality of the statersquos ESL programs In 2005 Marylandrsquos adult education programs offered 40 hours of instruction per student which is not adequate for beginner or even intermediate English learners to become proficient Many of these ESL students lack advanced literacy skills in their native language and thus require additional intensive classroom time MSDE notes that a program that offers more than 100 hours of classroom time would better meet the needs of this population
Recommendation Enhance and support initiatives and partnerships that encourage a broad spectrum of education opportunities for immigrant populations
99 Pilato Maryland State Department of Education 100 Maryland State Department of Education December 2005
51
Recommendations
Many of Marylandrsquos foreign-born workers are highly educated and possess applicable skills however many of Marylandrsquos immigrants are at the opposite end of the educational spectrum As of 2006 43 percent of Marylandrsquos immigrants held at least a Bachelorrsquos degree compared with 34 of US natives in Maryland At the same time 18 of immigrants in Maryland did not have a high school diploma or its equivalent compared to 12 of US born Maryland residents101
Organizations such as US Hispanic Youth Entrepreneur Education (USHYEE) in partnership with MSDE and colleges and universities within the state are working together to provide Hispanic youth with scholarships along with technical and life skills that will encourage this segment of the population to seek higher education opportunities
Recommendation Coordinate efforts to promote Marylandrsquos access to seasonal immigrant (H-2B) and skilled immigrant (H-1B) workers102
Seasonal immigrant worker shortages have adversely affected Maryland businesses for some time In 2005 the national cap of 66000 H-2B visas which allow foreign nationals to temporarily enter the US and take advantage of seasonal or peak load employment opportunities was filled just a few months into the federal fiscal year As a result the lionrsquos share of Maryland businesses were prevented from applying for the estimated 7000+ temporary workers needed to sustain Marylandrsquos seasonal businesses A diverse group of Maryland industries are affected by the seasonal worker shortage including tourism and hospitality-driven businesses and agriculture and seafood processing firms as well as other types of service firms such as landscaping businesses
The State has recognized the importance of this issue In fact local political leaders continue to be actively involved in drafting legislation to increase the national cap and exempt returning seasonal workers from being subject to it GWIBrsquos Hospitality amp Tourism Monograph emphasizes Marylandrsquos need for seasonal immigrant workers and recommends that a state liaison office for immigration issues be established The GWIB report notes that in addition to being actively involved in immigration policy and advocacy the liaison office could work to connect foreign-born workers with Maryland businesses in need of temporary workers
A liaison office also could coordinate efforts to increase the availability of H-1B workers The H-1B visa program targets highly-skilled internationals who work in professional fields such as computing finance law and healthcare among others The national cap for H-1B visas has fluctuated in recent years jumping from 65000 in the late 1990s to 195000 in 2000 and then dropping back to 65000 in fiscal year 2003 As with H-2B visas annual quotas are met early in the year According to the Migration Policy Institute one out of every five doctors in the US is foreign born Two of every five medical scientists one of every five computer specialists and
101 US Census Bureau 2006 American Community Survey calculations based upon Maryland residents age 25 and over 102 It should be noted that this recommendation in no way advocates filling BRAC and other positions which require security clearances with H-1B and H-2B workers Given security clearance requirements filling these jobs with foreign nationals is simply not possible
52
Recommendations
one of every six persons in engineering or science fields are foreign born Given current and expected shortages among the science engineering technology and mathematics (STEM) fields it makes sense to explore expanding the H-1B visa option
74 The Need for Increased Labor Force Participation
The statersquos low jobless rate (39 percent in 2006) signifies not only that Marylandrsquos economy is healthy but also that local labor market conditions remain tight Most economists agree that an unemployment rate in the range of 35 to 45 percent is indicative of an economy operating at full employment and Marylandrsquos jobless rate continues to fall within that range In fact the state has not recorded an unemployment rate above the 45 percent mark since July 2003
Tight labor market conditions have the potential to aggravate labor shortages and apply upwards pressure on wages Since nearly one-sixth of Marylandrsquos existing labor force is expected to retire in the next decade these conditions are likely to worsen going forward Continued local labor supply shortages makes leveraging our underutilized and potential labor supply all the more important There is an opportunity to address this issue by tapping adult population segments that are underrepresented in the workforce including veterans ex-offenders and the statersquos disabled and lower literacy populations
According to a report released recently by the US Census Bureau roughly 175 percent of the statersquos adult population (or nearly 618000 persons) was eligible for adult education services as of 2000 This population includes individuals who ldquolack sufficient mastery of basic educational skills to enable the individuals to function effectively in societyrdquo103 Specifically this population includes those adults age 16 or older who lack a high school diploma and who are not enrolled in school In order to more fully integrate them into the statersquos labor force we need to expand access to basic literacy instruction GED services and English as a Second Language (ESL) classes
Recommendation Enhance opportunities for adult education (ie basic literacy GED services and ESL classes)
Despite the pressing need for adult literacy services demand continues to severely outstrip supply According to MSDE funding constraints dictate that only three to five percent of annual demand for these services is being met resulting in annual waiting lists of up to 5000 people The majority of those on waiting lists include people seeking ESL instruction and Adult Basic Education (ABE) If the State can increase the availability of these educational programs Marylandrsquos economy will benefit
103 US Census Bureau Profiles of the Adult Education Target Population Information from the 2000 Census December 2005
53
Recommendations
Recommendation Future study is necessary to identify the education and related needs of additional adult population segments
While the needs of Marylandrsquos lower literacy population have been identified there exists a lack of comprehensive information on other population segments which may not be participating fully in the statersquos workforce A thorough study is needed to identify the demographic economic and social characteristics of each Maryland population segment (ie veterans ex-offenders disabled population etc) With this information the education and hard or soft skill levels of these populations could be identified in addition to the identification of barriers preventing them from participating more fully in the workplace A synthesis of this information also would help to identify specific occupations that could serve as an entreacutee to career tracks for each of these population segments
Recommendation Create a statewide resource network to advance basic skills
Basic skills are in demand In fact the Maryland Department of Labor Licensing amp Regulation projects that the top four occupations expected to see the greatest level of replacement openings between 2004 and 2014 include104
Cashiers (33780 replacement openings) Retail salespersons (31670) Waiters and waitresses (21585) Combined food preparation and serving workers (17035)
These occupations require such basic skills as active listening speaking writing and reading comprehension
A recent GWIB report targeting Marylandrsquos Tourism amp Hospitality sector identifies a critical mismatch between the ldquojob-readinessrdquo or basic skills required for most occupations in the sector and the skill levels of new entrants to the field The majority of occupations in this sector require basic skills and on-the-job training yet employers are having difficulty finding workers with good active listening skills service orientation and cultural awareness and sensitivity Finding job entrants with the ability to read write and understand standard and spoken English also is a critical priority for the industry To address these issues the report recommends creating a statewide resource network to advance basic skills
104 Maryland Department of Labor Licensing amp Regulation Office of Workforce Information and Performance and Office of Labor Statistics 2007
54
Recommendations
55
Recommendations
1 BRAC Requires a Pipeline of Qualified Workers
Not all of the current BRAC personnel will move to Maryland along with their jobs Since the average civilian DoD worker is 45 years old many current workers will approach retirement in the near-term future The short-term implications of this trend are highly relevant given that the size and scope of the DoD BRAC units moving to Maryland could be influenced by current and near-term future workforce availability In other words if jobs go unfilled they could very well be lost through downsizing or reconfiguration of BRAC units The challenge for workforce development officials is to ensure that Maryland realizes as many potential BRAC jobs as possible The way to achieve this goal is to make sure that new positions are filled quickly
The statersquos workforce development system must strive to ensure that Marylandrsquos labor pool is ready and able to fill the types of jobs that BRAC will yield Both the Fort Monmouth and Defense Information Systems Agency (DISA) units that are slated to move to Maryland report a high proportion of the following occupations
Engineers (specifically electronicselectrical engineers computer engineers software engineers and engineers in general)
Managers (federal contract managers logistics managers inventory managers and information technology managers)
Computer scientists Telecommunications specialists Analysts (budget analysts and managementprogram analysts) and Technical writers and editors
These occupations require a Bachelorrsquos degree mainly in the engineering and sciences fields for entry-level positions For higher grade positions graduate education andor a combination of work experience is required Key skills associated with these positions include
Complex problem solving Critical thinking Judgment and decision making Systems evaluation105
Technology design106
105 The US Department of Labor defines systems evaluation as follows Identifying measures or indicators of system performance and the actions needed to improve or correct performance relative to the goals of the system 106 Technology design is defined as Generating or adapting equipment and technology to serve user needs
56
Recommendations
Recommendation Actively recruit retired government personnel and veterans to fill vacant BRAC positions
Fort Monmouth is currently in the process of actively recruiting up to 2000 Maryland workers to fill BRAC positions by 2011 Retired government personnel and veterans (especially those with security clearances) stand out as a potential labor pool worth cultivating in order to help the bases meet recruitment needs and fill any foreseeable gaps in the immediate future
Recommendation Increase interest recruitment and retention in BRAC-related fields
Since many of the BRAC jobs will require an educational background in science technology engineering and mathematics (STEM) fields and since graduation levels in many of these fields have been flat to negative in Maryland we must generate an interest in these fields before students enter college
Maryland has developed several new or planned initiatives at the high school level that if proven successful could serve as models to be deployed elsewhere in order to ensure that Maryland is developing an adequate pipeline of BRAC workers One such initiative is the Homeland Security and Emergency Preparedness Magnet Program at Joppatowne High School in Harford County The program which was launched in the fall of 2007 consists of three curricular tracks including Criminal JusticeLaw Enforcement InformationCommunications and Technology and Homeland Security Sciences The curricular content of these tracks is often applied For example the InformationCommunications and Technology track enables students to attain certification in both Cisco and SPACESTARS professional programs While the program aims to prepare high school students for careers in the homeland security field it also is designed to create a network linking students with government and industry partners
The Science and Mathematics Academy at Aberdeen High School is another example This program funded with federal state and local funds was launched in fall 2004 after several years of planning The program originated with the Army Alliance and other professionals affiliated with Aberdeen Proving Ground (APG) A critical program component provides students with the opportunity to interact regularly with professional scientists and mathematicians Another unique feature allows high school seniors to perform original research with the guidance of a program mentor
Recommendation Identify labor and education needs for spin-off BRAC jobs
The influx of BRAC personnel and contractors to Maryland will result not only in significant construction activity but also increased demand for personal services According to a report produced by RESI in 2006 for every direct on-base job107 that comes to Maryland 196 additional spin-off jobs will be created108 Specifically Maryland will experience a rapidly growing demand for construction managers and workers day care workers and hospitality workers among others Local community colleges in Harford and Anne Arundel counties
107 Direct on-base positions include both civilian DoD positions as well as embedded private defense contractors 108 RESI of Towson University Maryland Department of Business amp Economic Development 2006
57
Recommendations
already have begun to explore program needs associated with such occupations This is an area that should be explored fully by workforce development professionals
75 There Is a Shortage of Workers with Security Clearances
The number of positions requiring security clearances as well as the level of security clearances required for existing contracts has increased dramatically since September 11 2001 This increased demand has exacerbated processing times and resulted in a frenzy of competition and ldquopoachingrdquo from the limited pool of cleared workers many of whom are concentrated within science technology engineering or mathematics (STEM) fields Not only is the security clearance process a lengthy and onerous one but it is costly as well Processing delays can cause jobs to remain unfilled for months on end and the cost of sponsorship is quite high
Recommendation Spread the word set up a pre-screening model and expand internship opportunities
The issue of security clearances is a tricky one since the process is federally driven and thus largely outside the Statersquos control Still Maryland can begin to address the security clearance issue by disseminating information An awareness campaign especially targeting high school and college students is needed to get the word out We must emphasize the multitude of job opportunities available to Marylandrsquos youth and inform them what they need to do (or rather avoid) in order to obtain positions requiring security clearances
Also key to resolving Marylandrsquos excess clearance demand is to spearhead the clearance process by targeting prospective workers while they are still students To achieve this goal a pre-screening model could be developed whereby prior to graduation college students begin the security clearance process A Towson University study performed on behalf of DBED notes however that such a model would enhance the process only if the federal government addresses process issues at the national level109 Once the model is in place matching funds could be established (between defense contractors and other organizations as well as private andor public sources) in order to sponsor students to begin the security clearance process
Expanded internship prospects represent another area of opportunity to get the word out and encourage student interest in positions that require security clearances The Johns Hopkins Universityrsquos Applied Physics Lab (APL) summer internship program is one such example APL funds and processes interim student clearances for temporary summer positions APL also funds the full clearance process for students who remain with the lab beyond the summer
109 Division of Economic and Community Outreach of Towson University Maryland Department of Business amp Economic Development 2006
58
Recommendations
76 Skilled Professionals Needed
A review of emerging and expected labor force conditions in Maryland makes it clear that there is a need for the state to grow attract and retain skilled professionals of all types (not just STEM and BRAC-related workers) There is a need to attract and retain these professionals both as workers and residents in Maryland Admittedly this particular finding overlaps with previously mentioned findings (ie the need for STEM and BRAC workers) The evidence is so compelling that the authors of this report felt that a separate recommendation is justified
Recent migration trends in Maryland bring this issue to the forefront In each of the three most recent years for which data are available (2004 through 2006) the state has recorded negative net migration In other words more people are moving out of the state than are moving in Between 2005 and 2006 for instance net domestic migration outflows exceeded 25000 people offsetting the 21000-person gain due to international migration110 In other words in a single year 25000 residents left Maryland and were replaced by 21000 immigrants
This exodus of Maryland residents has significant implications for the statersquos workforce Many of the residents leaving the state are skilled professionals who are being replaced increasingly by less educated immigrants Certainly many new immigrants to Maryland are highly educated but the amount of time during which these skilled immigrants will remain in Marylandrsquos workforce is not certain In addition many of the statersquos out-migrants continue to commute to Maryland for work How long will these workers put up with longer commutes After all the state has a notoriously lengthy average commute time of 306 minutes second only to that of New York City (309 minutes)
The statersquos rate of population growth is slowing Between 2020 and 2030 Marylandrsquos population is expected to grow by five percent compared to 20 percent growth between 1970 and 1980 Marylandrsquos population is aging as nearly one-fifth of the statersquos working age population is set to retire by 2020 The trend in migration coupled with the statersquos slowing population growth aging population and increasingly tight labor market conditions all point to the same conclusion Maryland needs to ensure that our pool of skilled professionals grows in step with the demand
110 US Census Bureau
59
Recommendations
Recommendation Launch a campaign to attract and retain skilled professionals
Nations such as India and China and even mid-Atlantic cities and states such as Philadelphia and West Virginia have made concerted efforts to not only grow and retain skilled professionals but to entice these workers to return to their home citiesstatesnations This analysis recommends that a campaign be developed to both attract and retain skilled professionals in Maryland
A public-private coalition is recommended to spearhead such a campaign which would target skilled professionals of all ages As a start the initiative could target the emerging pipeline of professional workers ndash namely college students The campaign could be two-pronged focusing on retaining Maryland college students in the statersquos workforce as well as attracting college students from other areas to Maryland After all the survey data suggest that nearly four out of every 10 Bachelorrsquos degree graduates of Maryland institutions elect to work outside the state The campaign could target additional locales with a significant presence of colleges and universities (ie Greater Boston Research Triangle Park Greater Philadelphia etc) in an effort to attract current students to Maryland after graduation Such a campaign should incorporate incentives for first-time homebuyers and affordable housing currently offered in Maryland
60
Closing
80 Closing
Marylanders live and work in a state characterized by a healthy diverse economy and low unemployment The statersquos highly educated workforce and the presence of and proximity to federal agencies and laboratories also are major advantages Marylandrsquos excellent quality of life continues to attract workers and residents to the state In order to meet the many challenges posed by a rapidly changing demographic and economic landscape Maryland must be prepared to preserve and build on these existing strengths
This report highlights a number of current and predicted labor force trends that will drive the future of Marylandrsquos labor and jobs markets These trends pose several challenges to the state that will require the attention of educators workforce development professionals the business community and residents alike Tackling these challenges through a combination of public and private initiatives will serve to enable Maryland to maintain its existing strengths and enhance the statersquos ability to compete in an ever-changing global economy Hopefully the trends and recommendations highlighted in this report will aid in this effort
61
References
References
American Community Survey US Census Bureau 2005
Altbach P R Berdahl and P Gumport American Higher Education in the Twenty-First Century 2nd ed Johns Hopkins University Press April 2005
Americarsquos Career InfoNet httpwwwacinetorg
Associated Press State amp Local Wire ldquoLimit on Seasonal Workers Vexes Employersrdquo February 28 2005 Lexis-Nexis
Baltimore Business Journal ldquoLift Cap on Temporary Visa Programrdquo American City Business Journals Inc July 30 2004
Baltimore Sun ldquoConstellation Energy Files Partial Plan for Reactorrdquo Bloomberg News July 31 2007
Barlow ED ldquoStorm Warnings and What You Can Do To Preparerdquo 2006 Governorrsquos Workforce Conference Maryland May 8 2006
Brugger Robert J Maryland A Middle Temperament 1634-1980 Johns Hopkins University Press 1988
Buhler Patricia M ldquoThe New Workforce Five Sweeping Trends That Will Shape Your Companyrsquos Futurerdquo AMA Business Brief wwwamanetorg
Bureau of Labor Statistics ldquoHigh-paying Occupations with Many Openings Projected 2002shy12rdquo Occupational Outlook Quarterly Spring 2004 httpwwwblsgovopubooq2004springoochartpdf
Campbell Doug ldquoThe Illegal Immigrant Effectrdquo Region Focus 2006
Campbell Paul R ldquoPopulation Projections for States by Age Sex Race and Hispanic Origin 1995-2025rdquo US Census Bureau Population Division 1996
Capps Randy Michael Fix Jeffrey Passel Jason Oust and Dan Perez-Lopez ldquoImmigrant Families and Workers A Profile of the Low Wage Immigrant Workforcerdquo Urban Institute November 2003
Carroll Nick and C Taeuber ldquoA Profile of Older Workers in Marylandrdquo US Department of Commerce Economics and Statistics Administration US Census Bureau August 2004
Conte and Carr ldquoOutline of the US Economyrdquo US Department of State httpusinfostategov
62
References
Cox Michael R Alm and N Holmes ldquoWhere the Jobs Arerdquo The New York Times May 13 2004 late edition ProQuest Information and Learning Company httpproquestumicompqdwebdid=636777401ampsid=5ampFmt=3ampclientld=41150ampRQT=309amp VName=PQD
De Long David W ldquoConfronting the Chemical Industry Brain Drain A Strategic Framework for Organizational Knowledge Retentionrdquo Accenture-Institute for Strategic Change April 2002
Division of Economic and Community Outreach ldquoBRAC Government and Corporate Need for Workers with Security Clearancesrdquo Towson University June 2006
ldquoDomestic Net Migration in the United States 2000 to 2004rdquo US Census Bureau April 2006
Drucker Peter ldquoThe Future Has Already Happenedrdquo Futurist 32 no 8 (1998) 16 MAS Ultra-School Edition
Duderstadt James J ldquoLeading Higher Education in an Era of Rapid Changerdquo July 2001
ElBoghdady Dina ldquoDISA Fights Turnover with Telecommutingrdquo The Washington Post January 25 2006
Fahrenthold David A ldquoMaryland Crab Industry Angles for Help Seasonal Worker Cap Job Abundance Leave Seafood Processors Short-Staffedrdquo The Washington Post February 28 2005 Lexis-Nexis
Federal Reserve Bank of Dallas ldquo2003 Annual Report The Evolution of Workrdquo wwwdallasfedorg
Franz Maximilian ldquoCommentary The Chesapeake Traditionrdquo The Daily Record May 7 2002 Lexis-Nexis
Gereffi Gary and V Wadhwa ldquoFraming the Engineering Outsourcing Debate Placing the United States on a Level Playing Field with China and Indiardquo Master of Engineering Management Program Duke University December 2005
Goldstein Mark ldquoMarylandrsquos Changing Demographicsrdquo Presentation on behalf of the Maryland Department of Planning June 2006
Governorrsquos Workforce Investment Board 2003 ldquoGovernorrsquos Healthcare Workforce Summit Monographrdquo Maryland Department of Labor Licensing amp Regulation
Governorrsquos Workforce Investment Board 2006 ldquoMaryland Aerospace Industry Monographrdquo Maryland Department of Labor Licensing amp Regulation
63
References
Governorrsquos Workforce Investment Board 2007 ldquoMaryland Hospitality amp Tourism Industry Monographrdquo Maryland Department of Labor Licensing amp Regulation
H1Base ldquoH1-B Visa Information amp Service Centerrdquo httph1basecompageaspid=312
Hankin Harriet The New Workforce New York AMACOM 2005
Heller Barbara R ldquoMarylandrsquos Nursing Shortage A Workforce Crisisrdquo University of Maryland March 2003
Hewitt Associates LLC ldquoWorkforce Planning in the 21st Century - Back to the Futurerdquo International Report October 2003
Huether David ldquoThe Case of the Missing Jobsrdquo National Association of Manufacturers httpwwwnamorgs_namdoc1aspCID=201416ampDID=236655
Karoly Lynn A and Constantijn W A Panis The 21st Century at Work Forces Shaping Lifelong Learning Trends A Profile of Continuing Higher Education 7th ed University Continuing Education Association April 2002
Kaushal Neerja and Michael Fix ldquoThe Contributions of High-Skilled Immigrantsrdquo Migration Policy Institute July 2006
Keller Michael J ldquoA Study of the Capacity of Marylandrsquos Teacher Preparation Programsrdquo Maryland Higher Education Commission March 2006
Kobell Rona and C Guy ldquoWork-visa Limit Snags Shore Employers Business Relying on Immigrant Labor Might Not Have Anyone to Do the Workrdquo The Sun January 24 2005 final edition ProQuest
Lasater Beth and Barbara Elliot ldquoProfiles of the Adult Education Target Populationrdquo Center for the Research in Education RTI International December 2005 httpwwwedgovaboutofficeslistovaepiAdultEdcensus1pdf
Lorefice Alejandro A ldquoJust in Time Manufacturing Introduction and Major Componentsrdquo New York 1998
Lyons Michael and Pearson Ian Business 2010 Mapping the New Commercial Landscape London 2003
Maryland Board of Nursing httpwwwmbonorgmainphp
Maryland Career and Workforce Information httpdllrstatemdus
Maryland Department of Business amp Economic Development Economic Pulse January-February 2007
64
References
Maryland Department of Business amp Economic Development ldquoLargest Employers in Marylandrdquo March 2006
Maryland Department of Labor Licensing amp Regulation ldquoMarylandrsquos Demand-Driven Two-Year Workforce Investment Planrdquo July 2005-June 2007
Maryland Department of Labor Licensing amp Regulation Office of Workforce Information and Performance and Office of Labor Statistics March 2007
Maryland Governorrsquos Workforce Investment Board ldquoGovernorrsquos Healthcare Workforce Summit Monographrdquo August 2003 httpwwwmdworkforcecomlibpdfhcmonographpdf
Maryland Higher Education Commission ldquoEnrollment Projections 2007-2016 Maryland Public Colleges and Universitiesrdquo June 2007
Maryland Higher Education Commission ldquoTrends in Degrees Awarded at Maryland Higher Education Institutionsrdquo March 2005
Maryland Higher Education Commission ldquoTrends in Enrollment by Program Maryland Higher Education Institutionsrdquo April 2005
Maryland Higher Education Commission ldquo2004 Maryland State Plan for Postsecondary Educationrdquo December 2004
Maryland Higher Education Commission 2006 Trend Book 1 3 19-24 29-32 49-54 78-84 91-93 August 2006
Maryland Higher Education Commission 2005 Data Book 1 August 2004
Maryland Higher Education Commission 2006 Data Book 1 August 2005
Maryland Higher Education Commission 2007 Data Book 1 7 14-16 38 August 2006
Maryland State Department of Education ldquoStepping Up to the Future Adult Literacy Challenges at Work at Home and in the Maryland Communityrdquo December 2005
Maryland Independent College and University Association Connection ldquoLearn About the Five Factsrdquo httpwwwmicuaconnectioncommythsasp
Maryland Independent College and University Association ldquoFast Facts About MICUA 2007 ndash Enrollment Countsrdquo 2002 httpwwwmicuaorgffenrollmentcountspdf
McGee Marianne Kolbasuk and Alice LaPlante ldquoTalent Search The Myths Facts and Emotions That Will Keep the H1-B Visa Issue From Going Awayrdquo InformationWeek July 23 2007 Lexis Nexis
65
References
Mittuch Eugene W Averting a Pending Department of Defense Civilian Personnel Crisis The Need for a Corporate Recruiting Strategy May 2002 httpwwwstormingmediaus898946A894604html
National Academy of Science ldquoRising Above the Gathering Storm Energizing and Employing America for a Brighter Economic Futurerdquo 2006
National Center on Education and the Economy ldquoTough Choices Tough Times The Report of the New Commission on the Skills of the American Workforcerdquo 2007 httpwwwskillscommissionorgpdfexec_sumToughChoices_EXECSUMpdf
National Science Foundation 2003 httpwwwnsfgov
Nuclear Energy Institute ldquoNuclear Energy Industry Initiatives Target Looming Shortage of Skilled Workersrdquo January 2007 wwwneiorg
OECD ldquoWhat Schools for the Futurerdquo October 2001
Pew Hispanic Center ldquoFact Sheet The Labor Force Status of Short Term Unauthorized Workersrdquo April 2006
Pilato Virginia ldquoMSDE and The Impact of Different Models of Teacher Preparation on Teacher Retention A Progress Reportrdquo presented by Dr Tom Proffitt and Ms Karen Schafer Towson University
Pisarski Alan ldquoCommunity in Americardquo Transportation Research Board 2006
RAND Corporation ldquoThe Future Workforce and Workplace in the United Statesrdquo 2004
Reeves Scott ldquoAn Aging Workforcersquos Effect On US Employersrdquo Forbes September 29 2005 wwwForbescom
RESI study performed on behalf of the Maryland Department of Business amp Economic Development Jobs and Household Allocations and Expected Tax Revenues
Snyder Thomas D ldquoDigest of Education Statistics 2005rdquo National Center for Education Statistics June 2006 httpncesedgovprogramsdigestd05ch_3asp
Sparshott Jeffrey ldquoBay Firms Depend on Foreign Workersrdquo The Washington Times June 1 2005 Lexis-Nexis
States News Service ldquoMikulski Scores Senate Victory for Americarsquos Small Businessesrdquo April 19 2005 Lexis Nexis
66
References
The Conference Board Partnership for 21st Century Skills Corporate Voices for Working Families and Society for Human Resource Management ldquoAre They Really Ready To Workrdquo 2006 http21stcenturyskillsorgdocumentsFINAL_REPORT_PDF09-29-06pdf
Therrien Roger C Bridges R Meyerhoff and J Baker ldquoConnecticut Workforce Demands and the Implications for Educationrdquo Connecticut Department of Labor July 2003
Three Rivers Workforce Investment Board ldquoManaging the Changing Workforce in Southwestern Pennsylvaniardquo Executive Summary June 2006 httpwwwtrwiborgreportsagingexecsummarypdf
Towards Knowledge Societies UNESCO Publishing 2005
UMD ldquoProtecting Marylandrsquos Competitive Edgerdquo An Action Summit Hosted by the University of Maryland April 2006 httpwwwcompetitive-edgeumdedusnapshothtml
US Department of Education ldquoState Nonfiscal Survey of Public ElementarySecondary Educationrdquo National Center for Education Statistics November 2005 httpncesedgovprogramsprojectionstablestable_25CTaspreferrer=tablenotes
VisaPro ldquoFrequently Asked Questionsrdquo httpfaqvisaprocomH2B-Visa-FAQ3aspQ1
67
Executive Summary
Recommendation Enhance teacher retention through the expansion and enhancement of facultyteacher retention programs
Facultyteacher retention especially at the primary and secondary levels can be improved through access to quality programs which aim to enhance and improve teacher quality through continuous professional development A study of one such program in Maryland found that its teacher retention rate was 71 compared with retention rates of 35-44 for similar groups of teachers who did not participate in such programs
3 Immigrant Population Growth and Diversity These trends emphasize the need for increased investment in English as a Second Language (ESL) programs
Population shifts are impacting the demographic makeup of the state in ways that will have dramatic impacts on employer needs and workforce development Between 2000 and 2006 immigrants accounted for more than half (516) of Marylandrsquos population growth As of 2006 immigrants made up 12 of the statersquos population4
Recommendation Enhance and support initiatives and partnerships that encourage a broad spectrum of education opportunities for immigrant populations
Many of Marylandrsquos foreign-born workers are highly educated and possess applicable skills however many of Marylandrsquos immigrants are at the opposite end of the educational spectrum As of 2006 43 percent of Marylandrsquos immigrants held at least a Bachelorrsquos degree compared with 34 of US natives in Maryland At the same time 18 of immigrants in Maryland did not have a high school diploma or its equivalent compared to 12 of US-born Maryland residents5Improving these workerrsquos English skills and connecting them with high demand jobs strengthens Maryland workforce and provides a competitive edge
Recommendation Enhance and expand access to community English as a Second Language (ESL) programs
There is a need to improve access to ESL programs and to enhance the quality of these programs In 2005 Marylandrsquos adult education programs offered 40 hours of instruction per student which is inadequate for beginner or even intermediate English learners to become proficient The Maryland State Department of Education (MSDE) notes that a program that offers more than 100 hours of classroom time would better meet the needs of this population
Recommendation Coordinate efforts to promote Marylandrsquos access to seasonal immigrant (H-2B) and skilled immigrant (H-1B) workers6
4 US Census Bureau 5 US Census Bureau 2006 American Community Survey calculations based upon Maryland residents age 25 and over 6 It should be noted that this recommendation in no way advocates filling BRAC and other positions which require security clearances with H-1B and H-2B workers Given security clearance requirements filling these jobs with foreign nationals is simply not possible
4
Executive Summary
Seasonal immigrant worker shortages have adversely affected Maryland businesses for some time In recent years the annual national cap of 66000 H-2B visas which allow foreign nationals to temporarily enter the US and engage in seasonal or peak load employment opportunities has filled within the first few months of the federal fiscal year As a result many of Marylandrsquos seasonal businesses were prevented from applying for the estimated 7000+ temporary workers needed
Improving state-wide coordination efforts should increase the availability of H-1B workers The H-1B visa program targets highly-skilled internationals who work in professional fields such as computing finance law and healthcare among others The national cap for H-1B visas has fluctuated in recent years jumping from 65000 in the late 1990s to 195000 in 2000 and then dropping back to 65000 in fiscal year 2003 As with H-2B visas annual quotas are met early in the year According to the Migration Policy Institute one out of every five doctors in the US is foreign born Two of every five medical scientists one of every five computer specialists and one of every six persons in engineering or science fields are foreign born Given current and expected shortages among the science engineering technology and mathematics (STEM) fields it makes sense to explore expanding the H-1B visa option
4 Increasing Labor Force Participation and Meeting Adult Education Needs There is an opportunity to address this issue by tapping into Marylandrsquos underutilized and low-skilled adults and ensuring they receive the training they need to become more productive members of the workforce
According to a report released recently by the US Census Bureau roughly 206 percent of Marylandrsquos adult population (or 730000) was eligible for adult education services as of 2000 Specifically this population includes those adults age 16 or older who lack a high school diploma and who are not enrolled in school and adults who speak English as a second language and who have rated their ability to speak English as ldquowellrdquo ldquonot wellrdquo or ldquonot at allrdquo7
Recommendation Enhance opportunities for adult education (ie basic literacy GED services and ESL services)
Despite the pressing need for adult literacy services demand continues to severely outstrip supply According to MSDE funding constraints dictate that only three to five percent of annual demand for these services is being met resulting in waiting lists of up to 5000 persons The majority of those on waiting lists include people seeking ESL instruction and Adult Basic Education (ABE)
Recommendation Future study is necessary to identify the education and related needs of additional adult population segments
While the needs of Marylandrsquos lower literacy population have been identified there is a lack of comprehensive information on other population segments which may not be participating fully in the statersquos workforce A thorough study is needed to identify the demographic economic and
7 US Census Bureau Profiles of the Adult Education Target Population Information from the 2000 Census December 2005
5
Executive Summary
social characteristics of each Maryland population segment that is not fully represented in the workforce
Recommendation Create a statewide resource network to advance basic skills
The top occupations in Maryland (in terms of the need for replacement workers) require basic skills such as active listening speaking writing and reading comprehension
For example The majority of occupations in the Hospitality and Tourism sector require basic skills and on-the-job training yet employers are having difficulty finding workers with good active listening skills service orientation and cultural awareness and sensitivity To address these issues the report recommends creating a statewide resource network to advance basic skills
5 Developing a Base Realignment and Closure (BRAC) Worker Pipeline Not all of the current BRAC personnel will move to Maryland along with their jobs If incoming BRAC jobs go unfilled they could very well be lost The challenge for workforce development officials is to ensure that Maryland realizes as many potential BRAC jobs impacts by ensuring that new positions are filled quickly
The average age of civilian DoD workers is 45 years old As a result many current workers impacted by BRAC will approach retirement in the near future The size and scope of the BRAC units moving to Maryland could be influenced by future and current workforce availability
Recommendation Actively recruit retired government personnel and veterans to fill vacant BRAC positions
Fort Monmouth is currently actively recruiting up to 2000 Maryland workers to fill BRAC positions by 2011 Retired government personnel and veterans (especially those with security clearances) stand out as a potential labor pool worth cultivating in order to help the bases meet recruitment needs and fill any foreseeable gaps in the immediate future
Recommendation Increase interest recruitment and retention in BRAC-related fields
Since many of the BRAC jobs will require an educational background in science technology engineering and mathematics (STEM) fields and since graduation levels in many of these fields have been flat to negative in Maryland we must generate an interest in these fields before students enter college
Maryland has developed several new or planned initiatives at the high school level that if proven successful could serve as models to be duplicated elsewhere to ensure that Maryland is developing an adequate pipeline of BRAC workers
Recommendation Identify labor and education needs for spin-off BRAC jobs
6
Executive Summary
The influx of BRAC personnel and contractors to Maryland will result not only in significant construction activity but also increased demand for personal services According to a report produced by RESI in 2006 for every direct on-base job8 that comes to Maryland 196 additional spin-off jobs will be created9 Specifically Maryland will experience a rapidly growing demand for workers in construction day care and hospitality among others
6 The Security Clearance Process The lengthy and cumbersome security clearance process is hurting Marylandrsquos bottom line as companies are forced to deal with unfilled positions for months on end
The number of positions requiring security clearances as well as the level of security clearances required for existing contracts has increased dramatically since September 11 2001 The impacts are particularly strong among government agencies science and security industries and other jobs associated with BRAC Not only is the security clearance process a lengthy and onerous one but it is costly as well
Recommendation Create awareness set up a pre-screening model and expand internship opportunities
The issue of security clearance is problematic since the process is federally driven and thus largely outside the Statersquos control Still Maryland can begin to address the issue of security clearance by conducting an awareness campaign targeting high school and college students A pre-screening model could be developed in which college students begin the security clearance process prior to graduation Expanded internship opportunities represent another way to get the word out and encourage student interest in positions that require security clearances
7 The Need for Skilled Professionals Maryland needs to ensure that our pool of skilled professionals grows in step with employer demand
A review of emerging and expected labor force conditions in Maryland makes it clear that there is a need for the state to grow attract and retain skilled professionals of all types not just STEM and BRAC-related workers In a single fiscal year (2005-2006) 25000 residents exited Maryland and were replaced by 21000 immigrants10 In addition the statersquos rate of population growth is slowing Between 2020 and 2030 Marylandrsquos population is expected to grow by five percent compared to 20 percent growth between 1970 and 1980 Marylandrsquos population is aging as nearly one-fifth of the statersquos working age population is set to retire by 2020 The trend in migration coupled with the statersquos slowing population growth aging population and increasingly tight labor market conditions all point to the same conclusion Maryland needs to ensure that our pool of skilled professionals grows in step with the demand
Recommendation Launch a campaign to attract and retain skilled professionals
8 Direct on-base positions include civilian DoD positions as well as embedded private defense contractors 9 RESI of Towson University Maryland Department of Business amp Economic Development 2006 10 US Census Bureau
7
Executive Summary
Survey data suggest that nearly four out of every 10 Bachelorrsquos degree graduates of Maryland institutions elect to work outside the state Other cities states and nations have made concerted efforts to not only grow and retain skilled professionals but to entice these workers to return to their home citiesstatesnations A campaign should be developed to attract and retain skilled professionals in Maryland
A public-private coalition is recommended to spearhead such a campaign which would target skilled professionals of all ages
Recommendation Expand career and technology education
Career and technology education (CTE) programs are courses of study in K-12 and postshysecondary institutions that prepare students for careers with wide-ranging educational requirements These programs provide students with skills to compete in 21st century jobs because students are learning with skills that are transferable across careers and educational paths11 CTE programs combine rigorous and challenging academic content which leads to an industry-recognized credential or certificate an associate or bachelorrsquos degree or entry into an apprenticeship program or employment
CTE programs are currently offered in about 200 Maryland high schools and all 16 of Marylandrsquos community colleges
11 National Governorrsquos Association Retooling Career Technical Education
8
Introduction
20 Introduction
This report begins with a brief overview of the statersquos historical workforce trends and transitions into a high-level analysis of emerging trends affecting the statersquos labor supply and demand ndash both current and future The analysis concludes with a summary of key findings and priority recommendations
This report was produced by RESI of Towson University on behalf of and with input from the Governorrsquos Workforce Investment Board (GWIB) GWIB is the statersquos chief policy-making and strategic planning body on workforce development as mandated by the Federal Workforce Investment Act (WIA) of 1998 and Maryland Executive Order 0101200460 The board is a business-led group of industry education and government leaders charged with advising the governor on Marylandrsquos workforce development needs
9
Historical Backdrop
30 Historical Backdrop
Over time Marylandrsquos workforce has adapted and evolved The following quote from a 2004 New York Times article on the United Statesrsquo workforce sums up this premise nicely ldquoOur history is one of a constant churning of jobs with workers always finding the next step forward in the evolution of work ndash from farm hands to industrial workers to information handlersrdquo12
This statement certainly applies to Maryland which has transformed its economy dramatically over the years
Figure A reveals the general economic shifts the state has experienced since 1900 At that time Agriculture amp Related ranked as the leading employment sector for both Maryland (comprising 242 percent of total employment) and the nation (374 percent) Over the next five decades agricultural employment dropped precipitously comprising 72 percent of Marylandrsquos economy by 1950 and just 14 percent by 2000
Figure A Maryland Employment by Industry Percent of Total13
The rise and subsequent reduction of manufacturing employment also is reflected in the data as is the more recent domination of the services sector which continues today In 2000 manufacturing constituted 81 percent of the statersquos job base while services sector employment accounted for 411 percent Comparable national figures were 148 and 361 percent respectively
00
50
100
150
200
250
300
350
400
450
Agriculture amp Related
Services Manufacturing Wholesale amp Retail trade
Transportation amp Related
Construction Public Administration
Finance Insurance amp Real Estate
1900 1950 2000
12 Cox Richard 2004 13 US Census Bureau Public Use Micro Data
10
10
20
30
40
50
60
70
80
90
o
f Adu
lts W
ith A
t Lea
st a
HS
Dip
lom
1940 1950 1960 1970 1980 1990 2000
US MD
Historical Backdrop
Figure B Educational Attainment for US and Maryland14
These significant changes coincided with increasing labor force educational attainment levels as shown in Figure B In 1940 the first year in which educational attainment data was collected 211 percent of Marylandrsquos population age 25 and over had obtained a high school education or higher By 2000 this percentage approached 840 percent Corresponding national figures were 245 and
804 percent respectively Over the same period the percentage of the statersquos population age 25 and over with a Bachelorrsquos degree or higher skyrocketed from under 50 percent in 1940 to 315 percent in 200015 This chart reveals what employers and workforce development professionals have known for some time ndash an educated workforce has become increasingly critical to maintaining and nurturing economic success
14 Percent of Population aged 25+ with a High School Education or Higher US Census Bureau ldquoA Half-Century of Learning Historical Census Statistics on Educational Attainment in the United States 1940 to 2000rdquo 15 The corresponding national rate in 2000 was just 244 percent
11
Historical Backdrop
The increased demand for educated workers in Maryland has been broad-based and is reflected in industry-level educational attainment data Even in industries traditionally considered ldquoblue collarrdquo such as Manufacturing and Construction the educational attainment of workers has risen Data show that the proportion of workers in each Maryland industry with some college education has increased from just three percent of the statersquos manufacturing workers in 1940 to 26 percent in 2000 The proportion of Agriculture workers with some college skyrocketed from one percent in 1940 to over 20 percent in 2000
Figure C Maryland Educational Attainment by Industry 200016
By 2000 more thanHigh School or Less Some College College Degree Plus 40 of workers
Construction amp Mining 64 24 12 employed within Services Finance Agriculture amp Related 63 21 16 Insurance amp Real
Wholesale amp Retail Trade 58 28 15 Estate and Public 49 30 20 Administration had
obtained a college Transportation amp Related
Manufacturing 48 26 25 degree or higher More Services 28 26 46 than half of the workers
in Marylandrsquos Finance Insurance amp Real Estate 25 34 41 manufacturing sector
Public Administration 22 35 42 had at least some 00 200 400 600 800 1000 college or higher Other
industries employed a higher proportion of workers with a high school education or less such as Construction amp Mining (64 percent) Agriculture amp Related (63 percent) and Wholesale amp Retail Trade (58 percent)
16 RESI US Census Bureau Public Use Micro Data The graph refers to the distribution of maximum educational attainment levels by industry
12
Historical Backdrop
Today Maryland enjoys a healthy diverse economy driven by growth in services sectors such as education health care and other technical and professional services Among Marylandrsquos top 50 largest private employers are health and educational services firms (including The Johns Hopkins University and Hospital Adventist HealthCare and Helix Health System among others) defense and intelligence contractors (such as Northrop Grumman Corporation and Lockheed Martin Corporation) and other technical and professional services firms (such as Computer Sciences Corporation IBM Corporation Science Applications International Corporation and Westat Research Incorporated)17
Though life sciences firms are not generally considered to be large employment generators there is no doubt that the statersquos economy also has been shaped by the presence of industry high fliers such as MedImmune (recently acquired by AstraZeneca) and Human Genome Sciences Inc Any discussion of Maryland employers would not be complete without consideration of the statersquos proximity to and presence of federal research centers and labs
The importance of the federal government to the statersquos economy cannot be underestimated The many federal laboratories and facilities located within and near Maryland such as the Goddard Space Flight Center and the Naval Air Systems Command at Patuxent River have contributed greatly to Marylandrsquos science and security base The presence of the Food and Drug Administration (FDA) and the National Institutes of Health (NIH) have spurred growth among bioscience firms The National Security Agency (NSA) and Marylandrsquos many military installations (including Fort Detrick Fort Meade and Aberdeen Proving Ground) have been critical to building the statersquos base of science and security
17 Maryland Department of Business amp Economic Development 2006
13
Marylandrsquos Labor Supply
40 Marylandrsquos Labor Supply
41 Population Trends and Characteristics
The shifting composition and growth of Marylandrsquos population directly impacts the statersquos economy and labor force Population characteristics such as age educational attainment and diversity have a profound impact on the needs and types of services that will best ensure continued economic growth and prosperity throughout the state The extent to which policy makers educators and business leaders recognize and meet these needs can further strengthen Marylandrsquos ability to attract and retain quality jobs and workers
411 Population Growth Migration and Diversity
Marylandrsquos population exceeded 56 million in 2006 ranking the state 19th in the nation in population size The statersquos rate of population growth between July of 2005 and 2006 was just 05 percent Not only did the state lag the 10 percent national rate of population expansion but Maryland ranks among the bottom third of states (36th fastest growth) according to this measure
This sluggish rate of population growth is not characteristic of Marylandrsquos past performance Between 1990 and 1999 the statersquos population expanded at an average annual rate of 10 percent Between 2000 and 2003 Maryland recorded annual population growth ranging from 11 to 13 percent
The statersquos slower rate of population expansion in recent years can be explained by negative net migration trends In each of the three most recent years for which data are available (2004 through 2006) the state recorded negative net migration In other words more people are moving out of the state than are moving in Maryland recorded a net migration loss of 5000 in 2006 and 6800 in 2005 the largest such decline the state has seen since 198118 While it is true that net international migration continues to bolster the statersquos population growth net domestic outflows (migration between states) outweigh international migration gains Between 2005 and 2006 for instance Marylandrsquos net domestic migration outflows exceeded 25000 persons offsetting the 21000-person gain due to international migration19
It should be noted that Marylandrsquos net domestic migration decline represents a departure from recent trends Between 2000 and 2004 for instance the state recorded net domestic migration gains of more than 5400 per year20 While in the past domestic outflows have been associated with deteriorating or weakening economic conditions within the state recent trends appear to be driven by cost of living issues especially housing costs Out migration to border counties in Pennsylvania and West Virginia has increased significantly in recent years A possible explanation for this movement is the availability of affordable housing in these areas Median home values in Pennsylvania jurisdictions such as York and Franklin counties are roughly $75000 below those of Baltimore County This gap increases significantly when home values in
18 Maryland Department of Planning 19 US Census Bureau 20 US Census Bureau 2006
14
Marylandrsquos Labor Supply
Carroll and Frederick counties are considered Many former Maryland households have taken advantage of lower housing costs in these locales while still being part of Marylandrsquos job market
The good news is that this trend will likely be stemmed by the current and future Department of Defense (DoD) Base Realignment and Closure (BRAC) movements to Maryland The job movements which call for more than 15000 civilian jobs to transfer to Maryland by 2011 are expected to result in substantial household movements to Maryland as well
As previously noted international migration continues to bolster population growth both locally and throughout the nation Foreign immigration represents 443 percent of the statersquos population gain between 1990 and 2000 Marylandrsquos level of foreign-born population has grown from roughly 94000 in 1960 to more than 313000 in 1990 By 2000 nearly one out of every 10 Maryland residents (more than 518000 persons) was foreign born21
Figure E Marylandrsquos Share of Foreign-Born Population 200022
More than two-thirds of the statersquos 40 foreign-born population reports their 35 region of origin to be either Asia or
30 Latin America The most commonly reported Asian countries of origin
25 include China (which comprises 65
20 percent of the statersquos 2000 foreign-born population) India (62 percent)
15 Korea (60 percent) and the
10 Philippines (40 percent) El Salvador leads Latin American countries and
5 accounts for another 81 percent In
0 fact El Salvador comprises the single largest share of Marylandrsquos foreign-born population Jamaica and Mexico
each comprise an additional 37 percent Nigeria Vietnam Germany and the United Kingdom each comprise close to 30 percent of the statersquos foreign-born residents
Asia Latin America Europe Africa North America Oceana
Perc
ent o
f Tot
al
21 Goldstein 2006 22 US Census Bureau
15
Marylandrsquos Labor Supply
40
43
56
57
65
89
11 7
148
174
292
0 5 10 15 20 25 30 35
Figure F Foreign-Born Population as Percent of Total 200523
International migration is forecast to increase Marylandrsquos population Montgomery
by 593000 persons between 1995 Prince George s and 2025 ranking the state ninth in
Howard the nation according to this24 Maryland measure Montgomery and
Prince Georgersquos counties will Baltimore County
continue to absorb the lionrsquos share Frederick
of the statersquos international Anne Arundel
migration Foreign immigration Baltimore City accounted for 891 percent of
Montgomery Countyrsquos population Charles
gains and 719 percent of Prince Wicomico
Georgersquos Countyrsquos gains between 1990 and 2000 In 2005 foreign-
Percent of Totalborn people accounted for 292 percent of Montgomery Countyrsquos population and 174 percent of Prince Georgersquos County residents Howard County follows with 149 percent
Migration continues to increase diversity in Maryland which has recorded substantial increases in its minority population in recent years Between 2000 and 2006 the statersquos minority population expanded by roughly 327000 persons In contrast the statersquos non-Hispanic white population declined by 23000 persons over the same period Census projections indicate that by 2025 Marylandrsquos non-Hispanic white population will comprise just 543 percent of the statersquos total population down from 666 percent in 1995 Over the same period persons of Hispanic origin are expected to increase and comprise 70 percent of Marylandrsquos total population up from 36 percent in 199525
23 Goldstein 2006 24 US Census Bureau Population Division 25 US Census Bureau Population Division
16
Marylandrsquos Labor Supply
Figure G Share of Population by Selected RaceOrigin 200526
Census estimates for 2005 reveal Marylandrsquos population to be quite diverse relative to the nation African-Americans constitute 287 percent of the statersquos population more than twice the
0
10
20
30
40
50
60
70
80
White Black Hispanic or Latino (of any
race)
Asian Some other Race
Two or more races
Perc
ent o
f Tot
al
Maryland United States
60 percent in 2006 The corresponding national share for people of Hispanic or Latino origin in
national share The state also is home to a slightly larger (percent share) Asian population than is seen nationally While Marylandrsquos population of Hispanic or Latino origin has increased significantly in recent years (from roughly 230000 in 2000 to 318000 in 2005) this group comprised 58 percent of the statersquos population in 2005 and
2005 was 145 percent
412 Affluence
Recent data releases once again confirm Marylandrsquos reputation as one of the most affluent states in the nation With a 2006 median household income of $65144 Maryland ranks first in the nation according to this measure and far surpasses the comparable national income level of $48451
Poverty data reveal similar patterns Overall the statewide family poverty rate was 53 percent far below the national rate of 98 percent In 2006 only 78 percent of Marylandrsquos population lived below the poverty level the lowest rate in the nation and 55 percentage points below the national average
The fact that the statersquos households are well compensated is a reflection of Marylandrsquos highly educated and skilled workforce More than a third (351 percent) of the statersquos population age 25 and older has a Bachelorrsquos degree or higher The comparable national percentage is 270 percent The fact that Maryland has a relatively high proportion of households with two or more workers also helps to explain the statersquos high income levels In 2006 four out of 10 households fell within this category compared to 35 for the nation27
26 US Census Bureau American Community Survey 2006 27 US Census Bureau American Community Survey 2006
17
Marylandrsquos Labor Supply
Figure H Per Capita Income Levels by Maryland Workforce Investment Area (WIA)28
$20000 $25000 $30000 $35000 $40000 $45000 $50000 $55000 $60000
Montgomery Anne Arundel
Baltimore County Mid-Maryland
Maryland Frederick
Upper Shore Southern Maryland
Susquehanna Prince Georgersquos
United States Baltimore City
Lower Shore Western Maryland
Annual Per Capita Income
2005 Marylandrsquos affluence is significant for another reason Wealth offers a measure of protection from cyclical economic fluctuations Maryland may be better prepared to weather economic downturns than the balance of the nation However it should be noted
that all regions in Maryland are not equally protected Certain areas have participated less fully in recent economic recoveries than others as indicated by their per capita income levels With an annual per capita income level below $29000 Western Maryland (comprised of Allegany Garrett and Washington counties) trails all other Maryland Workforce Investment Areas (WIAs)29 The Lower Shore (which includes Somerset Wicomico and Worcester counties) also lags other areas with an annual per capita income level of just under $30000
While affluence can be considered a strength especially in the face of economic downturns it poses a challenge for other reasons Increased living costs and housing costs in particular can encourage out migration to lower cost areas a trend analysts believe has been occurring with increased frequency in Maryland for each of the last three years
28 Bureau of Economic Analysis RESI of Towson University WIA refers to Workforce Investment Area Maryland is home to 12 local WIAs each with a common labor pool and 200000 or more residents Each WIA is served by a separate Local Workforce Investment Board (LWIB) 29 In percentage terms however the Western Maryland region boasts the fastest rate of appreciation between 2004 and 2005 with growth in annual per capita income of 63 percent
18
Marylandrsquos Labor Supply
413 Educational Attainment
Figure I 2005 Education Attainment Levels Population 25 and Older30
Maryland is home to a highly educated population The state consistently ranks ahead
00
50
100
150
200
250
300
350
Max
imum
Edu
catio
nal
Atta
inm
ent A
chie
ved
Less than 9th Grade
9th-12th High School Some Associate s Bachelor s Graduate or Grade No Graduate College No Degree Degree Professional Diploma Degree Degree
Maryland United States
of the nation on a variety of education-related measures For instance the National Science Foundation ranks Maryland second in the nation in terms of doctoral scientists and engineers per 100000 population In addition in 2005 the statersquos concentration of professional and technical workers (249 percent) ranked second in the nation
Census educational attainment data tell a similar story In 2005 nearly one in four (194 percent) Marylanders age 25 and older earned a Bachelorrsquos degree as their highest level of educational attainment Approximately 157 percent of state residents have a graduate or professional degree Taken together 351 percent of Marylandrsquos population has a Bachelorrsquos degree or higher ranking Maryland third in the nation compared to 270 percent nationally The gap between Maryland and the nation has widened in recent years as Maryland has increased its proportion of highly educated residents In 1990 only 265 percent of the statersquos population had earned a Bachelorrsquos degree or higher just six percentage points ahead of national levels
30 US Census Bureau American Community Survey 2006
19
Marylandrsquos Labor Supply
Figure J Percent of Population with a Bachelorrsquos Degree or Higher by WIA31
00 100 200 300 400 500 600
Montgomery
Mid-Maryland
Anne Arundel
Frederick
Baltimore County
Prince Georgersquos
Susquehanna
Southern Maryland
Baltimore City
Lower Shore
Western Maryland
Upper Shore
2005 In 2005 Montgomery County and the Mid-Maryland region lead the state in terms of the percent of population age 25 and older with a Bachelorrsquos degree or higher with 563 and 471 percent respectively The Upper Shore and Western Maryland
lag the balance of the state with 111 and 155 percent of regional population respectively with a Bachelorrsquos degree or higher
Figure K Maryland Educational Attainment by Race 200532
Educational attainment distributions vary by race and ethnicityorigin as well While six out of every 10 Asians in Maryland has a Bachelorrsquos degree or higher less than 25 percent of African-Americans and less than 20 percent of Hispanics fall into this category Nearly 390 percent of the statersquos Hispanic population does not have a high school diploma and 242 percent
Total White Alone
Black Alone
Asian Alone
Hispanic (Any Race)
Less than 9th Grade 43 34 37 49 242
9th-12th Grade No
High School Graduate 267 261 309 141 225
117 45 146 Diploma 87 75
Some College No Degree 196 189 231 113 135
Associates Degree 63 63 63 60 54
Graduate or Professional 152 168 96 308 82 Degree
Bachelors Degree 193 209 147 284 116
Bachelors Degree or Higher 345 377 243 593 198
of Hispanics have less than a ninth grade education roughly six times the state average
31 US Census Bureau American Community Survey 2005 32 US Census Bureau American Community Survey 2005
20
Marylandrsquos Labor Supply
414 Aging Population
Many of the issues Maryland will face in terms of future workforce and economic development will be rooted in demographics Between 1970 and 1980 Marylandrsquo population grew by nearly 20 percent Between 2020 and 2030 growth is expected to be just over five percent As the statersquos population growth continues to wane finding skilled workers to fill jobs will become increasingly challenging
Figure L Historic and Projected Growth among Marylands Population Age 16+33
0
100000
200000
300000
400000
500000
600000
1970-1980 1980-1990 1990-2000 2000-2010 2010-2020 2020-2030
Popu
latio
n G
row
th
0
5
10
15
20
25
Absolute Growth
Percentage Growth
Figure M Maryland Historic and Projected Growth by Age34
The Maryland Department of Planning projects that between 2000 and 2030 the statersquos share of population age 20 to 44 will drop from 374 percent to 323 percent Over the same time frame the share of population age 65 and older will increase from 113 to 195 percent Maryland is not alone experiencing this trend though median age data indicate that the statersquos population is slightly older than that of the nation Marylandrsquos median age in 2005 was 371 years compared to a median age of 365 years for the nation as a whole
33 Maryland Department of Planning 34 Maryland Department of Planning
00
100
200
300
400
500
Perc
ent o
f Pop
ulat
ion
1990 2000 2005 2010 2015 2020 2025 2030
Aged 20-44 Aged 65+
21
Marylandrsquos Labor Supply
Census data from 2000 provide an indication of the relative median age of Marylandrsquos regions Eastern Shore jurisdictions such as Dorchester Kent and Worcester counties all have median ages over 40 years of age Talbot Countyrsquos population is the oldest in the state with a median age of 433 years of age Increased immigration of retirees to Eastern Shore locales helps to explain this trend All three Western Maryland jurisdictions also are home to older populations The trend in Western Maryland and Allegany County in particular is attributed to ongoing population decline and out migration among younger people
By 2005 more than 60 percent of the statersquos population was of working age (ie age 18 to 64) Of this population the vast majority (833 percent) fell into the 18 to 54 age range More than one fifth (207 percent) of the statersquos 2005 population of working age was comprised by the leading edge (those born between 1946 and 1955) of the baby boomers those born between 1946 and 1964 This segment of the population is set to face retirement between 2011 and 2020 By 2020 the number of baby boomers between ages 18 and 54 will increase by more than 123000 and will account for 223 percent of the statersquos working age population The data make clear that the retirement of roughly one-fifth of the statersquos working age population is fast approaching and will have a disproportionate effect on those regions that are already home to a large concentration of older residents and workers (such as Western Maryland and the Eastern Shore)
42 Workforce Trends
421 Labor Force Growth Figure N Marylands Labor Force 2000 ndash 200635
Marylandrsquos labor force topped the 3 million mark for the first time in the second quarter of 2006 The state recorded a 23 percent expansion in its labor force between 2005 and 2006
2500000
2600000
2700000
2800000
2900000
3000000
3100000
2000 2001 2002 2003 2004 2005 2006
Labo
r Fo
rce
Lev
el
-10
-05
00
05
10
15
20
25
Labo
r Fo
rce
Ann
ual G
row
th
Level Growth
surpassing the 14 percent growth rate recorded nationwide This expansion was driven by a 20 percent increase in the number of employed people and a 36 percent contraction in the number of unemployed persons The statersquos recent performance reverses a trend of diminishing growth registered between 2002 and 2004 when Maryland trailed the national rate of expansion
35 Maryland Department of Planning
22
Marylandrsquos Labor Supply
Despite this recent up tick the pace of expansion for both the state and national labor force has been slowing since 1970 Between 1970 and 1980 Marylandrsquos workforce expanded by nearly 453000 workers or 27 percent During the 1990s Marylandrsquos labor force grew by just five percent about 130000 workers According to projections from the Maryland Department of Planning the growth in Marylandrsquos labor force will slow even further in the future Between 2020 and 2030 the statersquos workforce is expected to expand by just three percent (or roughly 101000 workers) This trend is being driven by the aging of Marylandrsquos population
Figure O Labor Force Shares by WIA36
00 20 40 60 80 100 120 140 160 180
Montgomery
Prince Georges
Baltimore County
Baltimore City
Anne Arundel
Mid-Maryland
Susquehanna
Southern Maryland
Western Maryland
Frederick
Lower Shore
Upper Shore
2006 The vast majority of the statersquos labor force37 resides in the suburban jurisdictions outside Baltimore City and Washington DC In fact Montgomery and Prince Georgersquos counties are home to just under one-third of the statersquos labor force Collectively
Western Maryland and the Upper and Lower Shore regions comprise another 10 percent of Marylandrsquos labor force
36 Maryland Department of Planning 37 Refers to resident labor force or the population currently working or actively looking for a job
23
Marylandrsquos Labor Supply
-20 00 20 40 60 80 100 120 140 160
Southern Maryland
Frederick
Lower Shore
Susquehanna
Mid-Maryland
Upper Shore
Anne Arundel
Western Maryland
Montgomery
Prince Georges
Baltimore County
Baltimore City
2000-2006
expansion (62 percent) during this period
422 Unemployment Rate Analysis
Figure Q Unemployment Rates 2000 to 200739
Marylandrsquos average annual
Figure P Labor Force Growth 2000 to 200638
unemployment rate which held steady at 38 percent in 2007 remains quite healthy compared to historical and national levels The comparable US jobless rate is 46 percent
The unemployment rate measures the level of unemployed persons (persons who are not working and who are available and actively looking for work) as a percentage of the total labor
All Maryland Workforce Investment Act (WIA) areas except Baltimore City recorded resident labor force growth between 2000 and 2006 In fact with the exception of Baltimore and Prince Georgersquos counties all WIAs outpaced the national rate of
200
300
400
500
600
700
2000Q
1
2000Q
3
2001Q
1
2001Q
3
2002Q
1
2002Q
3
2003Q
1
2003Q
3
2004Q
1
2004Q
3
2005Q
1
2005Q
3
2006Q
1
2006Q
3
2007Q
1
Une
mpl
oym
ent
Rat
e
United States Maryland
force This indicator is significant because it provides a relative measure of the statersquos economic health
Marylandrsquos low unemployment rate is significant to workforce development professionals because it demonstrates that local labor market conditions are increasingly tight Most
38 Bureau of Labor Statistics 39 Bureau of Labor Statistics
24
Marylandrsquos Labor Supply
economists agree that an unemployment rate in the range of 35 to 45 percent is indicative of an economy operating at full employment Marylandrsquos jobless rate continues to fall within that range In fact the state has not recorded an unemployment rate above 45 percent since July 2003
Figure R Unemployment Rates for WIAs40
00 10 20 30 40 50 60 70
Lower Shore Baltimore City
Western Maryland Upper Shore
Prince Georges Baltimore County
Susquehanna Southern Maryland
Anne Arundel Frederick
Mid-Maryland Montgomery
Unemployment Rates (Not Seasonally Adjusted)
2000 Q1 2007 Q1
While Marylandrsquos low unemployment rate testifies to the strength of the statersquos economy persistent tight labor market conditions also have the potential to aggravate labor shortages and to apply upward pressure on wages
Not all Maryland regions boast tight labor market conditions Western Maryland Baltimore City and the Lower Shore for instance have consistently posted unemployment rates upwards of 50 and 60 percent Western Marylandrsquos high unemployment rate stems from the loss of high-wage manufacturing jobs over the past two decades due to closures of former mainstay employers While the region has since experienced job growth much of the new job creation has been in low-skill low-wage positions The fact that the region has a high share of population with less than a high school diploma makes it more difficult for these workers to find quality jobs
40 Bureau of Labor Statistics
25
Marylandrsquos Labor Supply
With an unemployment rate of 61 percent in 2007 Baltimore City also is characterized by looser labor market conditions41 Baltimore is faced with serious long-term challenges including a significant number of underemployed workers as well as large segments of population who do not participate in the workforce The city is home to the largest number of residents with less than a ninth grade education (26679 persons in 2006 or 66 percent of Baltimorersquos population age 25 and older) The cityrsquos high school dropout rate at 105 percent in the 2005-2006 school year exceeds the 35 percent rate posted statewide These dropouts pose a serious workforce development challenge for the city Helping these nontraditional segments of the population (dislocated workers veterans disabled population ex-offenders etc) participate more fully in the labor market may help alleviate the demand for workers in the face of growing skill set and worker shortages
423 Labor Force Participation Rates
Figure S Labor Force Participation Rates for WIA42
500 550 600 650 700 750 800
Mid-Maryland
Frederick
Susquehanna
Montgomery
Southern Maryland
Prince Georgersquos
Anne Arundel
Baltimore County
Upper Shore
Lower Shore
Western Maryland
Baltimore City
Labor Force Participation
2000 Marylandrsquos labor force participation rate among 16- to 64-year-olds (including military) was 782 percent in 2006 ranking the state 11th in the nation according to this measure The comparable national rate is 745 percent43
41 It should be noted however that labor market conditions have improved significantly from 2004 when the city consistently recorded unemployment rates in excess of 70 percent 42 Bureau of Labor Statistics 43 US Census Bureau American Community Survey 2006
26
Marylandrsquos Labor Supply
Figure T Labor Force Participation Rates by Age44
Shifting demographics will have an effect on the statersquos labor force going forward According to Maryland
00
200
400
600
800
1000
Labo
r Fo
rce
Paric
ipat
ion
by A
ge
16-24 25-54 55 and over
2000
Department of Planning data labor force participation rates in 2000 approached 60 percent among those age 16 to 24 years Nearly 830 percent of those aged 25 to 54 years participated in the labor force However only 439 percent of those age 55 and over were in the labor force
Analysts increasingly anticipate that older workers will remain in the workforce longer compared to previous generations Still it is clear that as Marylandrsquos population ages labor force participation will be affected
424 Commuting Patterns
Figure U Percent Change in Marylands ImportedExported Workers45
Journey-to-work data from the 25 2000 Census reveal that for
20 every Maryland worker living outside the state there are 25
15 Maryland residents who leave
5
10
Exported Workers Imported Workers Net Exported Workers
1990
- 20
00
Perc
ent C
hang
e the state for work In other words Maryland is a net exporter of workers In 2000 the state recorded net exported workers in excess of 268000
0 This trend is not surprising since 1990 commuting patterns
-5 show the same pattern However an examination of 1990 and 2000 data indicates
that the situation is improving In 1990 Maryland exported 29 resident workers for every imported worker This improvement is explained by the fact that growth among imported workers (up 208 percent between 1990 and 2000) far surpasses the growth of exported workers (up 43 percent)
44 Bureau of Labor Statistics 45 US Census Bureau
27
Marylandrsquos Labor Supply
Between 1990 and 2000 the number of out-of-state residents commuting to Maryland jumped from 151330 to 182787 In 2000 the vast majority of these workers (872 percent) resided in Washington DC Delaware Virginia and West Virginia Growth was driven especially by outflows from the latter three states While the number of workers commuting from Washington DC to Maryland increased over the period they were a smaller share of Marylandrsquos imported workers dropping from 236 percent in 1990 to 199 percent in 2000
More than 450000 Maryland residents commuted outside the state for work in 2000 The lionrsquos share of these residents worked in Washington DC (620 percent) while another 242 percent worked in Virginia Delaware and Pennsylvania comprise another 52 and 28 percent respectively The number of out commuters to Washington DC dropped by more than 11000 persons or by 39 percent between 1990 and 2000
Marylandrsquos commuting patterns data is relevant not only from a workforce perspective but also from a quality of life perspective According to the Transportation Research Board by 2000 Maryland had joined the ranks of New York New Jersey and Illinois with more than 10 percent of workers traveling over 60 minutes to get to work46 The 2006 American Community Survey figures indicate that Marylandrsquos average commute time of 306 minutes is the second longest commute time in the nation closely trailing New Yorkrsquos average commute time of 309 minutes47
46 Pisarski 2006 47 US Census Bureau American Community Survey 2006
28
Marylandrsquos Labor Supply
43 Marylandrsquos Educational Supply Pipeline
It is abundantly clear that an educated workforce is essential to Marylandrsquos economy While Marylandrsquos educational institutions produce a majority of the statersquos workers there is a substantial amount of ebb and flow of educated workers between Maryland and other areas Enrollment in Marylandrsquos educational institutions has risen greatly and is expected to continue to grow in the foreseeable future
As of the 2005-2006 academic year Maryland educational institutions yielded the following labor supply 56302 high school graduates 13715 Associatersquos degrees (or certificates) 25484 Bachelorrsquos degrees 13265 Masterrsquos degrees Another 1122 first professional degrees (ie lawyers) and 1363 Doctoral degrees
Not all of these graduates choose to remain and work in Maryland Conversely not all of Marylandrsquos labor supply comes from the statersquos higher educational institutions Survey estimates reveal that the vast majority (84 percent) of Marylandrsquos community college graduates were full-time Maryland workers at least one year after graduation The corresponding figures are 64 percent for those with Bachelorrsquos degrees and 57 percent for graduates of Marylandrsquos private career schools48 Marylandrsquos ability to connect a greater number of these graduates to local Maryland employers could help reduce the impact of worker shortages
Between 1994 and 2004 full-time undergraduate enrollment in Marylandrsquos four-year public colleges and universities grew by 25 percent and community college enrollment increased by 33 percent According to projections from the Maryland Higher Education Commission (MHEC) growth in full-time enrollment at public four-year institutions is expected to moderate to 17 percent between 2007 and 2016 Growth among full-time community college students is expected to drop to 21 percent over the same period These projections are driven by predicted demographic shifts They also account for the estimated impact of tuition increases as well as changes in per capita disposable income
Over the same period graduate enrollment among public educational institutions is expected to rise 10 percent for full-time students and 55 percent for part-time students49 Increases in part-time enrollment will continue to be driven by enhanced opportunities for distance learning and online courses offered by traditional universities as well as through programs such as the University of Maryland University College
48 Percentages refer to five-year averages based on information published in the Maryland Higher Education Commissionrsquos 2007 Trend Book 49 Maryland Higher Education Commission 2007
29
Marylandrsquos Labor Demand
50 Marylandrsquos Labor Demand
51 Industry Analysis
Between 2005 and 2006 Marylandrsquos aggregate economy expanded by 31932 employees or 13 percent The statersquos 25 million job holders enjoyed average weekly wages of $88750
Marylandrsquos rate of employment expansion during this period represents a deceleration from the 16 percent growth rate recorded between 2004 and 2005 Not only has Marylandrsquos rate of employment growth slowed but the state lags the nation according to recent quarterly employment data Marylandrsquos 14 percent expansion recorded between the second quarters of 2005 and 2006 ranks the state 27th in the nation and trails the 18 percent national average Just a few years ago in 2004 Maryland consistently ranked in the top 15 states according to this measure This trend of decelerating employment growth would be cause for greater concern if not for the anticipated influx of tens of thousands of jobs to Maryland by 2011 due to the BRAC decisions While the incoming jobs have the potential to grow Marylandrsquos employment base the challenge which Maryland is addressing actively is to fill the current and future need for workers RESI anticipates that the statersquos economy will register annual rates of employment growth in the mid-one percent range in both 2006 and 2007 While not spectacular this is by no means indicative of an economic downturn Still this trend of decelerating employment growth is an area analysts will be tracking closely in the near-term future
Figure V Employment Growth by WIA 2005 to 200651
Regional employment growth for the most recent period for which data are available (2005 to 2006) ranges from shy02 percent in Baltimore City to 33 percent in Mid-Maryland Other rapidly expanding WIA regions include the Lower Shore and Southern Maryland Employment in both of these areas expanded at a pace of more than 20 percent between 2005 and 2006
50 The 25 million employment figure (as well as the additional employment figures contained in this section of the analysis) refers to Bureau of Labor Statistics Quarterly Covered Employment amp Wage data This data represents employment by place of work data and is reported to the Bureau of Labor Statistics by the Maryland Department of Labor Licensing amp Regulation (DLLR) and includes all workers covered by the Unemployment Insurance (UI) Law of Maryland and the unemployment compensation for federal employees (UCFE) program This data series accounts for approximately 91 percent all civilian employment Excluded from this data are the self-employed 51 US Bureau of Labor Statistics Quarterly Census of Employment amp Wages (QCEW) Data
-05 00 05 10 15 20 25 30 35
Mid-Maryland Lower Shore
Southern Maryland Susquehanna
Anne Arundel Montgomery
Maryland Upper Shore
Baltimore County Frederick
Western Maryland Prince Georgersquos
Baltimore City
Employment Change
2005-2006
30
Marylandrsquos Labor Demand
Employment Composition
Approximately 180 percent of the statersquos aggregate economy falls within the public sector which is comprised of local state and federal governments As a whole the public sector grew at a 16 percent clip above the average for all major sectors and pays higher than average weekly wages of $1029 With employment just above 125000 in 2006 the federal government sector comprises 49 percent of the statersquos economy and pays average weekly wages of $1438 substantially higher than the average
The importance of the federal government to the statersquos economy cannot be underestimated The many federal laboratories and facilities located within and near Maryland such as Goddard Space Flight Center and the Naval Air Systems Command at Patuxent River have contributed greatly to Marylandrsquos aerospace industry The presence of the Food and Drug Administration (FDA) and the National Institutes of Health (NIH) has spurred growth among bioscience firms The National Security Agency and Marylandrsquos many military installations have been critical to building the statersquos base of defense-related businesses
Figure W Marylandrsquos Economic Composition 200652
1-YEAR CHANGE IN EMPLOYMENT SECTOR EMPLOYMENT
LEVEL ABSOLUTE PERCENT
WEEKLY WAGES
AGGREGATE ECONOMY 2529671 31932 13 $887 PUBLIC SECTOR 455820 7170 16 $1029
Local Government 233109 6978 31 $848 State Government 97530 826 09 $879 Federal Government 125181 -634 -05 $1438
PRIVATE SECTOR 2073851 24762 12 $856 Retail Trade 299508 906 03 $620
Healthcare amp Social Assistance 295006 8871 31 $737 Professional Scientific amp Technical Services 219155 5236 24 $1401 Accommodations amp Food Services 193278 -303 -02 $377
Construction 188357 5331 29 $926 Administrative amp Support amp Waste 157299 1275 08 $710
Manufacturing 136328 -4166 -30 $1700 Finance amp Insurance 109595 -379 -03 $1238 Wholesale Trade 94927 677 07 $1097 Other Services (Except Public Administration) 89612 466 05 $585 Educational Services 54007 -66 -01 $815 Transportation amp Warehousing 65867 2237 35 $863
Real Estate amp Rental Leasing 48004 -299 -06 $886 Information 50770 392 08 $1218 Arts Entertainment amp Recreation 36476 812 23 $644
Management of Companies amp Enterprises 17763 4199 310 $1696 Utilities 9711 -38 -04 $1709
52 RESI US Bureau of Labor Statistics Quarterly Census of Employment amp Wages (QCEW) Data
31
Marylandrsquos Labor Demand
Agriculture Forestry Fishing amp Hunting 5031 -128 -25 $573 Mining 1794 67 39 $884
Not Elsewhere Classified 1362 -327 -194 $1111
With employment in excess of 207 million the private sector comprises the lionrsquos share (820 percent) of Marylandrsquos economy One of the single largest private sector industries in the state is the Healthcare amp Social Assistance sector In 2006 employment in this sector expanded by 31 percent to just over 295000 employees Retail Trade Professional Scientific amp Technical Services and Accommodations amp Food Services also rank among the largest private sector employers within the state each employing a significant proportion of Maryland workers
Regional employment distributions across industries are fairly similar to that of the state as a whole with a few notable exceptions Both Southern Maryland (comprised of Calvert Charles and St Maryrsquos counties) and Frederick Prince Georgersquos and Montgomery counties boast high concentrations of public sector and especially federal government employment Federal government employment comprises 92 percent of Southern Marylandrsquos aggregate economy The collective share for Frederick Prince Georgersquos and Montgomery counties is 80 percent Montgomery and Frederick counties have the highest proportion of employment within Professional Scientific amp Technical Services in the state with shares of 140 percent and 135 percent respectively Western Maryland and the Upper Shore are home to a significantly higher proportion of Manufacturing employment with 113 and 123 percent respectively In both of these areas the share of Manufacturing employment is more than double that of the state as a whole
Western Maryland boasts the highest share of Transportation amp Warehousing employment (42 percent) This is reflective of the way Washington County in particular has been able to leverage successfully the regionrsquos excellent transportation infrastructure which includes access to three interstates (I-68 I-70 and I-81) and two railway lines (CSX Transportation and Norfolk Southern) to reinvent itself as a transportation hub Washington County currently is home to 151 Transportation amp Warehousing businesses including the Staples Distribution Center
Montgomery County leads the state in share of Information employment (33 percent) and boasts the highest concentration (15 percent) of employment within the Management of Companies amp Enterprises sector The Lower Shore employs a significantly large proportion of workers within the Accommodations amp Food Services sector Employment in this industry comprises 155 percent of the regionrsquos economy compared to just 76 percent for Maryland as a whole
32
Marylandrsquos Labor Demand
Among the fastest growing Maryland employment sectors are high wage sectors such as Professional Scientific amp Technical Services which expanded by more than 4900 positions or 23 percent between the third quarters of 2005 and 2006 Also growing quickly were Management of Companies amp Enterprises with growth of more than 4300 positions and Wholesale Electronic Markets amp Agents amp Brokers with growth of 2314 positions Each of these sectors pays weekly wages above $1300 well in excess of the $858 average for all Maryland industries Growth also is being led by Food amp Beverage Stores which expanded by 4543 jobs or 77 percent and the demographically driven Nursing amp Residential Care Facilities industry with growth of 3409 positions or 57 percent Specialty Trade Contractors also ranks high on the list
Figure X Top Employment Gaining Maryland Industries 2005Q3 ndash 2006Q353
RANK INDUSTRY EMPLOYMENTLEVEL 1-YEAR CHANGE IN
EMPLOYMENT ABSOLUTE PERCENT
WEEKLY WAGES
1 2 3 4 5 6 7
8 9
10
11 12 13 14 15
Professional Scientific amp Technical Services Food amp Beverage Stores Management of Companies amp Enterprises Nursing amp Residential Care Facilities Specialty Trade Contractors Ambulatory Healthcare Services Hospitals Wholesale Electronic Markets amp Agents amp Brokers Food Services amp Drinking Places Warehousing amp Storage Building Material amp Garden Equipment amp Supplies Dealers Transit amp Ground Passenger Transportation Clothing amp Clothing Accessories Stores Construction of Buildings Couriers amp Messengers
219324 63824 18065 63235
128225 95508 95046
12827 177052
10747
26550 8838
30520 45944 11393
4920 23 4543 77 4337 316 3409 57 2951 24 2635 28 2602 28
2314 220 2007 11
944 96
894 35 815 102 788 27 718 16 641 60
$1335 $465
$1421 $538 $850 $985 $896
$1434 $295 $762
$609 $457 $331 $966 $726
53 RESI US Bureau of Labor Statistics Quarterly Census of Employment amp Wages (QCEW) Data
33
Marylandrsquos Labor Demand
Industries rapidly shedding jobs are led by a mix of retail services and manufacturing sectors including General Merchandise Stores which contracted by more than 6900 positions or 127 percent between the third quarters of 2005 and 2006 Accommodations (loss of more than 2700 positions) and Insurance Carriers amp Related Activities (loss of 1116 positions) The latter industry pays weekly wages approaching $1200 well in excess of the $858 average for all Maryland industries Manufacturing sectors comprise five of the most rapidly declining industries including Computer amp Electronic Product Manufacturing Primary Metal Manufacturing Leather amp Allied Product Manufacturing Transportation Equipment Manufacturing and Wood Product Manufacturing Collectively these industries shed nearly 2600 jobs from the statersquos payrolls It is important to note that with the exception of Wood Product Manufacturing these contractions are concentrated within high-paying sectors
Figure Y Top Employment Losing Maryland Industries 2005Q3 ndash 2006Q354
RANK INDUSTRY EMPLOYMENT LEVEL
1-YEAR CHANGE IN EMPLOYMENT
ABSOLUTE PERCENT
WEEKLY WAGES
1 2 3 4
5 6 7 8
9 10 11 12 13 14 15
General Merchandise Stores Accommodations Insurance Carriers amp Related Activities Merchant Wholesalers Durable Goods Sporting Goods Hobby Book amp Music Stores Merchant Wholesalers Nondurable Goods Motion Picture amp Sound Recording Industries Motor Vehicle amp Parts Dealers Computer amp Electronic Product Manufacturing Miscellaneous Store Retailers Rental amp Leasing Services Primary Metal Manufacturing Leather amp Allied Product Manufacturing Transportation Equipment Manufacturing Wood Product Manufacturing
47619 24725 34577 52555
13161 29846 4489
38795
21786 18947 13595 3583
171 8314 3567
-6927 -127 -2729 -99 -1116 -31 -1066 -20
-1005 -71 -1002 -32
-695 -134 -659 -17
-653 -29 -634 -32 -544 -38 -533 -129 -489 -741 -465 -53 -445 -111
$365 $428
$1173 $1194
$395 $941 $444 $842
$1659 $425 $723
$1124 $911
$1164 $692
54 RESI US Bureau of Labor Statistics Quarterly Census of Employment amp Wages (QCEW) Data
34
Marylandrsquos Labor Demand
52 Base Realignment and Closure Commission (BRAC) Demand
The most recent round of BRAC decisions clearly will benefit Marylandrsquos economy and will result in thousands of new high-skill high-wage jobs moving into the state over the next five years However the anticipated influx of Department of Defense (DoD) and associated contractor positions ndash estimated at between 40000 and 60000 new jobs ndash presents its own set of challenges from a workforce development perspective
The BRAC legislation mandates that several DoD units (comprised of more than 15000 civilian DoD personnel) must move to Maryland by 2011 The extent to which current DoD employees will follow their jobs to Maryland is not clear Recent estimates indicate that between 30 and 50 percent of the civilian employees working at Fort Monmouth New Jersey plan to follow their jobs to Aberdeen55 Filling the gap with existing Maryland workers and recruiting new employees will present a significant workforce development challenge This challenge will undoubtedly escalate as existing civilian DoD workers approach retirement According to a report issued by the Pentagon in 2002 the average age of DoD employees is 452 years
The size and scope of the DoD units moving to Maryland as a result of BRAC could be influenced by future and current workforce availability In other words if jobs go unfilled they could very well be lost The challenge for workforce development officials is to ensure that Maryland gains as many potential BRAC jobs as possible The way to achieve this goal is to make sure that new positions are filled quickly Implementing an efficient security clearance process is one way to work toward this goal
Most important the Statersquos workforce development system must strive to ensure that Marylandrsquos labor pool is ready and able to fill the types of jobs that BRAC will bring to Maryland Both the Fort Monmouth and the Defense Information Systems Agency (DISA) units that are slated to move to Maryland report a high proportion of the following occupations
Electricalelectronics engineers Computer engineers Management and program analysts Computer scientists Information technology managers General engineers Telecommunications specialists
55 September 28 2007 presentation by Mark Fuhring Deputy Director of Human Resources CECOM Life Cycle Management Command
35
Marylandrsquos Labor Demand
These occupations require a Bachelorrsquos degree mainly in the engineering and sciences fields for entry-level positions For higher grade positions graduate education andor a combination of work experience is required Key skills associated with these positions include
Complex problem solving Critical thinking Judgment and decision making Systems evaluation56
Technology design57
There will be ancillary effects of BRAC to be considered as well Specifically the influx of BRAC personnel and contractors will drive significant construction activity and the demand for personal services The influx also will ramp up demand for services workers such as construction managers and workers day care workers and hospitality workers among others Community colleges in Harford and Anne Arundel counties already have begun to explore program needs associated with these occupations According to a report produced by RESI in 2006 for every direct on-base job58 job that comes to Maryland 196 additional spin-off jobs will be created59 This is an area that should be explored fully by workforce development professionals
53 Demand for Science Technology Engineering and Mathematics (STEM) Workers
In recent years upper-level degrees in science and engineering have been awarded to high proportions of foreign-born students According to the National Academy of Science 59 percent of US engineering doctorates were awarded to foreign students in 200360 In 2004 roughly 63 percent of the 147 doctoral degrees in engineering awarded by Maryland institutions went to foreign students including a small number of non-US citizens with permanent resident visa status and a much larger portion of non-US citizens with temporary visa status
This trend can benefit our economy since many foreign-born people with doctorates remain in the country to work at least for some period of time Americarsquos ratio of natural sciences and engineering degrees awarded to our college age population (57 per 100) severely lags that of Japan (8 per 100) Europe (8-13 per 100) and Taiwan and South Korea (11 per 100) Recent evidence indicates however that US institutions are facing greater competition from international schools for these students a concern noted in the Maryland Higher Education Commissionrsquos 2004 plan Increased immigration restrictions have not helped the situation In 2000 Asian universities awarded 12 million of the worldrsquos science and engineering degrees (undergraduate graduate and doctoral) while the US awarded just 500000
56 The US Department of Labor defines systems evaluation as follows Identifying measures or indicators of system performance and the actions needed to improve or correct performance relative to the goals of the system 57 Technology design is defined as Generating or adapting equipment and technology to serve user needs 58 Direct on-base positions include civilian DoD positions as well as embedded private defense contractors 59 RESI Maryland Department of Business amp Economic Development 2006 60 National Academy of Science p7 2007
36
Marylandrsquos Labor Demand
It should be noted that a 2005 Duke University study presents the US in a more competitive light61 The study notes that previously published figures on the number of engineering or computer science graduates for the US China and India are not necessarily comparable due to differences in the types of programs and program length etc According to Dukersquos findings when the number of degrees granted is normalized to account for population size (on a per one million citizen basis) the US generates 750 technology specialists compared to 500 produced by China and 200 produced by India
While the scope of the competition that US higher educational institutions currently face is debatable there is one point on which analysts agree national and local economies will face greater demand for scientists and engineers going forward Marylandrsquos demand for workers in these sectors will be exacerbated further by demographics (as many current workers approach retirement) and by the impacts of BRAC which will result in the movement of a significant number of science and engineering jobs to Maryland in the near future
According to this measure Maryland fares better than most states After all Maryland ranks second in the nation in our concentration of doctoral scientists and engineers62 as well as in our number of employed PhD scientists and engineers per 100000 workers (9385)63 We are home to a multitude of federal and university research labs and rank second in the nation in terms of federal research and development spending and first in terms of university research dollars64
Still given future demand growing our base of science and engineering degrees must remain a high priority
Various Maryland entities recognize this need including GWIBrsquos Aerospace Industry Steering Committee which recommended several initiatives aimed at promoting science technology engineering and mathematics (STEM) education in Maryland Among these is the recommendation for the creation of a STEM Center of Excellence as well as the development of articulation agreements between high school pre-engineering programs and college programs Industry internships and mentorships also are identified as a means to grow Marylandrsquos supply of scientists and engineers
The Maryland State Department of Education (MSDE) also is well aware of the need for more scientists and engineers and began implementing Project Lead the Way (PLTW) in 2003-2004 PLTW is a pre-engineering program which aims to increase preparation among high schools students for higher education engineering programs Forty-three (43) Maryland high schools in 16 school systems participate in the program which allows students to enroll in such courses as Principles of Engineering Computer Integrated Manufacturing Civil Engineering and Aerospace Engineering Maryland recently received the Joseph H Oakley Excellence in Education Award for its PLTW progress Maryland also will be piloting the newly-launched PLTW for the biomedical sciences curriculum An aerospace PLTW program also is in the planning stages
61 Duke University 2005 62 National Science Foundation 2003 63 National Science Foundation State Science amp Technology Institute 2003 64 Maryland Higher Education Commission 2004
37
Marylandrsquos Labor Demand
Another MSDE program that focuses on this area is the Super Stem Project which partners higher education (the University of Maryland Baltimore County) with the Baltimore County Public Schools and MSDE The program is funded by the National Science Foundation and targets improving student achievement teacher quantity and quality specifically within STEM programs
54 The Demand for Basic and Applied Skills
The Conference Board in collaboration with several other organizations conducted a survey of US firms in 2006 to determine how employers rate new entrants to the workforce65 The results were not positive Overall employers do not consider recent graduates (high school graduates as well as graduates of two- and four-year institutions) to be adequately prepared for the workforce Specifically firms identified the following shortcomings among these populations
Figure Z Deficiencies of New Entrants to the US Workforce as Specified by Employers66
High School Graduates are bull ldquoDeficientrdquo in the basic knowledge and skills of Writing in English Mathematics and Reading Comprehension bull ldquoDeficientrdquo in Written Communications and Critical ThinkingProblem Solving
both of which may be dependent on basic knowledge and skills bull ldquoDeficientrdquo in ProfessionalismWork Ethic and bull ldquoAdequaterdquo in three ldquovery importantrdquo applied skills Information Technology Application
Diversity and TeamworkCollaboration Two-Year and Four-Year-College Graduates are bull Better prepared than high school graduates for the entry-level jobs they fill bull ldquoDeficientrdquo in Writing in English and Written Communications and bull ldquoDeficientrdquo in Leadership
65 The Conference Board 66 The Conference Board p11
38
Marylandrsquos Labor Demand
GWIBrsquos Industry Monograph for Marylandrsquos Hospitality amp Tourism Industry confirms these findings The GWIB report identifies a critical mismatch between the ldquojob-readinessrdquo or basic skills required for the majority of occupations within the sector and the skill levels of new entrants to the field The majority of occupations within this sector require basic skills and on-the-job training In fact only one occupation out of 35 requires a Bachelorrsquos degree or higher (General and Operational Managers) Yet for the balance of occupations employers are having difficulty finding workers with good active listening skills service orientation and cultural awareness and sensitivity Finding job entrants with the ability to read write and understand standard and spoken English also is a critical priority for the industry To address these issues the report recommends creating a statewide resource network to advance basic skills and to support tax incentives for worker training in English as a Second Language among other recommendations
According to occupational projections updated by the Maryland Department of Labor Licensing amp Regulation (DLLR) the top four occupations in which we expect to see the greatest level of replacement openings between 2004 and 2014 include67
Cashiers (33780 replacement openings) Retail salespersons (31670) Waiters and waitresses (21585) Combined food preparation and serving workers (17035)
This list is not surprising as these occupations have been associated traditionally with limited career paths and high turnover rates However this list also brings the issue of basic skills to the forefront Not only do these occupations rank high in terms of projected turnover they also lead the state in terms of total projected job openings between 2004 and 2014 Using US Department of Labor occupational data (ONET)68 one can determine that these occupations require basic skills (as defined by the Department of Labor) such as active listening speaking writing and reading comprehension
The Conference Board also indicates that while both basic skills and applied skills69 are paramount for new entrants to the workforce applied skills tend to be rated as the most critical 21st century skills employers are seeking The four top-rated skills are considered to be applied skills according to the study They include (1) ProfessionalismWork Ethic (2) Oral and Written Communications (3) TeamworkCollaboration and (4) Critical ThinkingProblem Solving
67 Maryland Department of Labor Licensing amp Regulation Office of Workforce Information and Performance and Office of Labor Statistics 2007 68 The US Department of Laborlsquos online information system (ONET) The ONET online system provides occupational information as well as information on key attributes and characteristics of workers and occupations 69 Examples of basic skills noted in the study include reading comprehension spoken and written English mathematics science knowledge of a foreign language etc Applied skills include lifelong learningself direction creativityinnovation leadership etc
39
Looking Ahead Identifying Gaps Challenges and Opportunities
60 Looking Ahead Identifying Gaps Challenges and Opportunities
61 The Gap between Marylandrsquos Jobs and Labor Supply is Growing
The gap between the size of Marylandrsquos labor force and the statersquos inventory of jobs is widening70 The number of jobs in Maryland has outnumbered the statersquos resident labor force for several decades In 1970 the gap was roughly 46000 By 1990 this figure had more than doubled to nearly 120000 By 2020 this gap is expected to exceed 528000 The situation is not as dire as it appears to be on the surface since workers residing in neighboring states will continue to fill some portion of these jobs however the widening gap certainly will translate into greater competition for available labor
Figure AA Historic and Projected Maryland Resident Labor Force and Jobs by Place of Work71
Labor Force Number of Jobs
4000000
3500000
3000000
2500000
2000000
1500000
1000000
1970 1980 1990 2000 2010 2020 2030
Lab
or F
orce
Jo
bs
After 2010 labor force growth is expected to slow Between 2010 and 2020 for example the statersquos labor force is expected to increase by roughly 200000 (down from expected growth of more than 360000 over the previous decade) Much of the anticipated slowdown in labor force growth is attributable to the graying of our population For years experts have been anticipating the dramatic ways in which our aging workforce will affect national state and local economies The implications of this megatrend are enormous They range from the need for employers to adapt to increasing generational diversity and generational differences in the workplace to the need for companies to ensure that knowledge and skills are retained as older workers retire Maryland must confront the impacts of these demographic shifts along with the rest of the nation
70 The Maryland Department of Planning projects jobs by place of work using historical data released by the Bureau of Economic Analysis These are jobs which are located in Maryland but are filled by both state and non-state residents The statersquos resident labor force also is projected by the Maryland Department of Planning based on historical Bureau of Economic Analysis data Projections were updated in November 2006 71 Maryland Department of Planning November 2006
40
Looking Ahead Identifying Gaps Challenges and Opportunities
The following chart details Marylandrsquos historical current and projected labor force composition by age The proportion of adults age 55 years old and older who are active in the workforce is projected to increase from roughly 12 percent in 1990 to 26 percent by 2020 The proportion of Marylandrsquos workforce comprised of adults age 35 to 54 years old on the other hand is expected to decrease from 43 percent to 39 percent over the same period As previously mentioned this trend is due to the graying of the population ndash there are simply fewer people making up Generations X and Y compared to the size of the baby boomer generation
Figure AB Historic and Projected Proportion of Marylands Labor Force by Age72
Perc
ent o
f Lab
or F
orce
00
100
200
300
400
500
600
1990 2000 2010 2020 2030
16-34
35-54
55+
72 Maryland Department of Planning 2006
41
Looking Ahead Identifying Gaps Challenges and Opportunities
62 The Race to Preserve Institutional Knowledge
The impacts of Marylandrsquos aging population are not limited simply to the issue of filling jobs Shifting demographics and the approaching retirement of older workers will place increased pressure on firms to preserve institutional knowledge Simply put companies and industry are scrambling to prevent ldquobrain drainrdquo for good reasons
The dearth of qualified nuclear engineers and related workers illustrates this issue perfectly According to the Nuclear Energy Institute (NEI) the US nuclear industry faces a critical shortage of workers by 2010 In fact NEI finds that less than eight percent of industry employees are younger than 32 years of age and more than half are age 47 or older Expected shortages will affect a broad cross section of occupations within the industry ranging from health physicists and plant operators to technicians welders and maintenance workers73 The timing is especially problematic as the Nuclear Regulatory Commission expects an influx of applications for nearly three dozen new reactors by 2008 including Constellation Energy Grouprsquos application to build a new nuclear reactor at Calvert Cliffs74 Clearly industry and workforce development professionals must ensure that institutional knowledge within this critical industry is preserved and a sufficient pipeline of future workers is developed
The nuclear engineer example is not an isolated case According to findings from GWIBrsquos Aerospace Industry Initiative Workforce Summit conducted in January 2006 50 percent of the aerospace workforce in Maryland is expected to retire in the next 15 years A 2002 Accenture publication notes that ldquoThe vast majority of US and European chemical companies are concerned about problems posed by their aging workforce Estimates that 50 percent of employees will become retirement eligible in a particular function in the next decade are not uncommon in the US and Europerdquo75 Marylandrsquos Educational Services sector which already is feeling the impact of critical shortages ranks among those industries with a high proportion of older workers (roughly 18 percent are age 55 plus)76 The Healthcare sector is another that has begun to feel the impact of an aging workforce In 1998 nearly 24 percent of Marylandrsquos registered nurses working in hospitals were between the ages of 48 and 57 years old and another 19 percent were over the age of 58 By 2005 these proportions had grown to 28 and 25 percent respectively77 According to GWIBrsquos Healthcare Workforce Summit monograph vacancy rates in 2002 for registered nurses (156 percent) radiation therapy technicians (211 percent) and licensed practical nurses (129 percent) at Maryland hospitals already are high The issue of brain drain and shortages undoubtedly will be compounded as the demand for healthcare services increases due to the graying of the population78
73 Nuclear Energy Institute 2007 74 Baltimore Sun Constellation Energy files partial plan for reactor July 31 2007 75 DeLong page 3 76 Carroll 2004 77 Maryland Board of Nursing 78 One recommendation developed from GWIBrsquos Healthcare Workforce Summit involves transitioning retired military personnel to the private sector Many of these personnel have accumulated vast experience and training but lack proper certification ProVET (Providing Re-employment Opportunities to Veterans) is one program Maryland has launched in recent years to provide transition assistance for those veterans who are interested in securing private sector employment
42
Looking Ahead Identifying Gaps Challenges and Opportunities
63 FacultyTeacher Shortages
It is not the intention of this analysis to minimize the significance of labor shortages already occurring in Maryland industry sectors ndash for example that of registered nurses and other healthcare professionals However given that much already has been written about these shortages this analysis instead targets the issue of faculty shortages
Marylandrsquos need for teachers outstrips the statersquos ability to produce and retain them In 2005 school systems throughout the state hired roughly 8000 teachers of which 4350 were beginning new hires Only one-third (1439) of the beginning new hires had graduated from Maryland colleges and universities
Particular subjects facing current and future shortages include Technology education Computer science English for Speakers of other Languages Foreign languages Mathematics Science Special education
The issue of faculty shortages extends to higher education as well and is affecting a range of Maryland industries including the healthcare sector As noted in GWIBrsquos HealthCare Monograph ldquothe amount of faculty and learning facilities is inadequatehelliprdquo to train the statersquos healthcare workforce These shortcomings are evidenced by student waiting lists at local nursing schools79 Indeed nursing programs both locally and nationally report an increase in the number of qualified nursing applicants being turned away due to a dearth of faculty and classroomclinical space In 2005 the number of applicants denied admission due to a lack of faculty or classroom and clinical space jumped to 29424 nationally and 1850 in Maryland
According to a 2005 survey80 the statersquos 24 nursing degree programs reported that 305 percent of full-time faculty positions were vacant Local shortages are attributed to both the aging of the statersquos faculty population as well as the difficulties in growing the pool of potential educators These difficulties range from structural barriers like limited local capacity of graduate programs in nursing education to market-driven trends (eg compensation for practicing nurses often exceeds that for nursing educators) These trends undoubtedly will be exacerbated as Marylandrsquos nursing faculty population continues to age and approach retirement The average age of nursing faculty at Maryland institutions as reported to the Board of Nursing in 2005 ranges from 42 to 55 years and nationally the average age of faculty retirement is 625 years81
79 Charting New Directions Governorrsquos Healthcare Workforce Summit page 13 80 Maryland Council of Directors of Associate Degree and Baccalaureate Programs Survey 81 Nursing Faculty Shortage Causes Effects and Suggestions for Resolution Maryland Statewide Commission on the Crisis in Nursing 2005
43
Looking Ahead Identifying Gaps Challenges and Opportunities
64 Increasing Age Diversity
Business and industry also will need to accommodate increased age diversity in the workplace According to a 2005 Forbes magazine article ldquoEmployers need to examine whether their policies programs and practices are age neutral For example is the company offering dependent care geared only toward children when the workforce may be at an age where elderparent care has more valuerdquo82
Adjusting to differences in generational attitudes and preferences in the workplace will present its own set of challenges For instance the chemical industry has become accustomed to low voluntary turnover among managers and professionals As younger generation workers (Generation X and Y in particular) replace retirees the industry will need to adapt to an increased tendency for voluntary attrition as these workers tend to be more willing to seek out better job opportunities83 Many today consider employee loyalty to be a thing of the past especially among todayrsquos younger workers who are perceived to be constantly on the prowl for bigger and better opportunities
The aging of our population also has implications for education As the age of students at postshysecondary educational institutions rises and as workers continue to pursue lifelong learning campuses and faculty increasingly will require additional flexibility in terms of location timing etc MHEC recognized this need in their 2004 plan and set a goal to enhance alternative approaches for educational delivery ndash namely distance learning and regional higher education centers The Statersquos academic institutions already have begun to respond to these needs as evidenced by institutional expansion to satellite campuses the expansion of 2+2 programs84 and increased investments in and access to distance learning programs that are part of Marylandrsquos higher education system
65 Immigrants Continue to Grow Marylandrsquos Labor Supply
Marylandrsquos workforce is expected to benefit from international migration at both ends of the employment spectrum as immigrants fill low-wage low-skill jobs as well as high-wage high-skill positions Low-skill jobs such as Combined Food Preparation amp Serving Workers for example continue to rank among the top occupations demanded in Maryland According to data published by the Urban Institute immigrants comprise a disproportionately high share (20 percent) of low-wage workers in the US Immigrant workers represent an especially large proportion of low-wage occupations within the farming and private household sectors According to 2002 estimates immigrants compose 37 and 42 percent of employment in these sectors respectively85 The Pew Hispanic Center reports that short-term unauthorized immigrants are concentrated heavily in the low-wage construction (including building and
82 Reeves 200583 Accenture Institute for Strategic Change 2002 84 2+2 is a program in which the first two years of post-secondary education are completed at a community college and the remainder is completed at a partner four-year institution85 Capps 2003
44
Looking Ahead Identifying Gaps Challenges and Opportunities
grounds cleaning and maintenance occupations) and hospitality industries (including food preparation and service occupations)86
GWIBrsquos Hospitality and Tourism monograph reveals the importance of this workforce to local industry The report documents Marylandrsquos reliance on immigrant workers seasonal and otherwise to fill a variety of occupations within this sector ranging from food service occupations such as bartenders hosts and hostesses cooks dishwashers and food preparation workers to grounds keeping workers desk clerks receptionists maids and housekeeping cleaners and security guards etc The report finds that the need for these workers outstrips supply The limited number of H-2B worker visas which allow for the temporary hiring of foreign workers granted to Maryland businesses is not enough to fill the vacant positions
Other immigrant segments are expected to continue to fill high-wage high-skill jobs in such occupations as scientists and engineers The Migration Policy Institute analyzed Census 2000 data and found that one out of every five doctors in the US is foreign born Two of every five medical scientists one of every five computer specialists and one of every six people in the engineering or science fields are foreign born In addition the proportion of foreign-born workers in other skilled fields such as nursing has grown significantly in recent years a trend which is expected to continue87
86 Pew Hispanic Center 2006 87 Kaushal 2006
45
Looking Ahead Identifying Gaps Challenges and Opportunities
0
20000
40000
60000
80000
100000
120000
1980 1990 2000Peop
le W
ho S
peak
Eng
lish
Not
Wel
l o
r N
ot a
t All
Figure AC Maryland Population Who Speak English ldquoNot Wellrdquo or ldquoNot at Allrdquo
From a workforce development perspective the movement of immigrants into Maryland will require increased investment in English as a Second Language (ESL) programs According to the decennial census data the percentage of people who reported to the Census Bureau that they spoke English ldquonot wellrdquo or ldquonot at allrdquo increased nearly 74 percent since 1990 (Figure AC) Of the more than 246000 persons who indicated that they spoke English ldquoless than very wellrdquo 44
percent reported Spanish as their native language while another 26 percent indicated an Asian language (particularly Korean Chinese and Vietnamese) as their native language Much of this population represents non-English speaking immigrants who present new challenges in terms of labor force training and education Recognizing this need organizations such as US Hispanic Youth Entrepreneur Education (USHYEE) in partnership with the Maryland State Department of Education (MSDE) and colleges and universities within the state are working together to provide Hispanic youth with scholarships along with technical and life skills that will encourage this segment of the population to seek higher education opportunities
The statersquos growing immigrant population has the potential to fill another significant role in Marylandrsquos economy As commerce and industry become more global knowledge of a foreign language is becoming increasingly critical to local businesses In fact a recent survey of US employers confirms that speaking a foreign language is expected to be a highly demanded skill in the 21st century Survey results indicate that while only 11 percent of employers currently rate this skill as ldquovery importantrdquo approximately two-thirds indicate that knowledge of a foreign language will increase in importance over the next five years In fact knowledge of a foreign language was singled out as the top basic skill expected to increase in importance88 In 2005 145 percent of Marylanders age five and older spoke a language other than English at home89 a trend that clearly will benefit the state in its efforts to meet foreign language needs
88 The Conference Board p11 89 US Census Bureau American Community Survey 2005
46
Looking Ahead Identifying Gaps Challenges and Opportunities
66 Adult Education and Engaging Workers with Barriers to Employment
Todayrsquos jobs and the jobs of tomorrow will require an increasingly complex array of skills including but not limited to verbal mathematical organizational and interpersonal skills This further complicates matters for the one million potential Maryland workers who have barriers to employment They include Marylandrsquos veteran population people with lower literacy ex-offenders people with disabilities and those receiving unemployment insurance benefits90
Preparing these workers for the jobs of the future presents another challenge for the Statersquos workforce development system As previously mentioned these populations are a potentially untapped labor supply If workforce development professionals can help this population transition more fully into the workforce tight labor market conditions may be alleviated
Veterans Population
As of 2005 more than 427000 people or 119 percent of the statersquos population 18 and over were veterans The vast majority of Maryland veterans (89 percent) are male Not surprisingly female veterans tend to be younger than their male counterparts A total of 776 percent of female veterans are between 18 and 54 years of age compared to 372 percent of male veterans91
Ex-Offenders
The number of offenders released from Maryland Department of Public Safety and Correctional Services facilities in 2006 approached 14000 Approximately six out of 10 or 8685 people were released in Baltimore City As of April 2007 nonviolent offenders constituted 426 percent of the nearly 23000 inmates housed in Maryland facilities More than 20 percent of this population is age 25 or under and another 171 percent are between 25 and 30 years of age Nearly 3400 of them or 149 percent of this population are serving a sentence of 36 months or less
Transitioning ex-offenders into the workforce is critical not only from a workforce development perspective but from a public safety perspective as well To the extent that this population can become engaged in the workforce the likelihood of recidivism is expected to decline
Lower Literacy Population
According to a report released recently by the US Department of Education roughly 206 percent of Marylandrsquos adult population (or 730000) was eligible for adult education services as of 2000 This population includes individuals who ldquolack sufficient mastery of basic educational skills to enable the individuals to function effectively in societyrdquo lack a high school diploma or equivalent or (are) ldquohellipunable to speak read or write the English languagerdquo Specifically this
90 Examples of other population segments that could be targeted include homeless persons welfare recipients and youth out of school among others 91 US Census Bureau American Community Survey 2005
47
Looking Ahead Identifying Gaps Challenges and Opportunities
population includes those adults age 16 or older who lack a high school diploma and who are not enrolled in school and adults who speak English as a second language and who have rated their ability to speak English as ldquowellrdquo ldquonot wellrdquo or ldquonot at allrdquo92
The vast majority of this adult education population (601 percent) is of working age (from 16 to 59 years old) yet in 2000 well over half of them (348717 persons) did not participate in the statersquos labor force Another 28484 reported they were unemployed Basic literacy and English as a Second Language instruction is needed to help transition this group more fully into the workplace More than 105000 of Marylandrsquos adult education population speak English as a second language and nearly half of this group (51952) identify themselves as speaking English ldquonot wellrdquo or ldquonot well at allrdquo93
People with Disabilities
Maryland is home to more than 376000 working age (from 16 to 64) people with disabilities Only about 43 percent of these people are employed compared to 78 percent for the remainder of the statersquos working age population94 The low employment rate for people with disabilities combined with the fact that many of them can become employed with or without accommodations are reasons that the GWIB views people with disabilities as an untapped workforce
Unemployed Persons and Persons Receiving Unemployment Insurance Benefits
As of August 2007 the number of unemployed Marylanders is on track to approach last yearrsquos level of roughly 116000 persons This population includes people who are not working but who are actively seeking work They are counted as part of Marylandrsquos labor force Though the number of unemployed people in Maryland has been on the decline since 2004 they still represent a substantial potential labor pool
More than 18000 initial unemployment claims were filed in Maryland in June 2007 The extent to which the State can link these persons with employment opportunities will help to decrease the number of people filing for initial and continuing unemployment insurance claims and will help increase Marylandrsquos available labor pool
92 US Census Bureau Profiles of the Adult Education Target Population Information from the 2000 Census December 2005 93 US Census Bureau Profiles of the Adult Education Target Population Information from the 2000 Census December 2005 94 US Census Bureau 2006 American Community Survey
48
Recommendations
70 Recommendations
This section of the analysis highlights a number of emerging challenges that will test the statersquos economic and workforce strengths over the next one to five years and provides priority recommendations to address these challenges
71 Science Technology Engineering and Mathematics (STEM) Industries are Struggling to Attract Recruit and Retain Workers
As in other industries many of Marylandrsquos science technology engineering and mathematics (STEM) industries face a looming retirement cliff as skilled baby boomers begin to retire and leave the workforce Compounding the problem is anecdotal and other evidence which suggests that the pool of qualified technical students graduating from college is actually diminishing The statersquos aerospace industry serves as a prime example According to the GWIB Aerospace Industry Steering Committee in 2006 nearly eight out of every 10 Maryland aerospace workers was age 51 or over and 50 percent of the current aerospace workforce is set to retire by 2020
Recommendation Increase opportunities for young people to become aware of and enter science technology engineering and mathematics (STEM) careers
One way to meet the need for workers in science technology engineering and mathematics (STEM) careers is to expand middle- and high school-level studentsrsquo interaction with STEM professionals through expanded internship and mentorship programs GWIBrsquos Aerospace Monograph also identifies the need to encourage STEM-related field trips and other applied activities and to invite industry professionals to classes or school activities The Johns Hopkins Universityrsquos Applied Physics Labrsquos (APL) Mentor Program is a perfect example of such interaction The program is conducted in conjunction with the Howard County Public Schools and other nearby schools and pairs high school students with volunteer APL professional staff The program enables students to work on science projects with their mentors during the school year
Encouraging qualified underrepresented population segments (ie females and minorities) to pursue studies in science and mathematics is another way to boost interest APL and a number of university partners are involved in a program that targets this issue The Maryland Mathematics Engineering Science Achievement program (MESA) is a pre-college program in which MESA partners work directly with teachers and schools in order to encourage K-12 interest in STEM fields The program targets minorities and females
Recommendation Expand and enhance pre-college programs such as Project Lead the Way
Expanding programs such as MSDErsquos Project Lead the Way (PLTW) is another approach PLTW is a pre-engineering program which aims to increase preparation among high school students for higher education engineering programs Forty-three (43) Maryland high schools in 16 school systems participate in the program which allows students to enroll in such courses as Principles of Engineering Computer Integrated Manufacturing Civil Engineering and
49
Recommendations
Aerospace Engineering Maryland soon will pilot the newly-launched PLTW for a biomedical curriculum An aerospace PLTW program also is in the planning stages
72 Maryland Continues to Face Growing Teacher and Faculty Shortages
The state continues to confront shortages among teachers and faculty Marylandrsquos need for teachers outstrips our ability to produce and retain them In 2005 roughly 8000 new teachers were hired in the state of Maryland Of the 4390 teachers who were new hires only 1439 (33) were graduates of Maryland colleges and universities95 Subjects with current and future teacher shortages include technology education computer science English for Speakers of other Languages foreign languages mathematics science (including physical science physics chemistry and earthspace science) and special education
The issue of faculty shortages extends to higher education as well and is affecting a number of Maryland industries including the healthcare sector As noted in GWIBrsquos HealthCare Monograph ldquothe amount of faculty and learning facilities is inadequatehelliprdquo to train the statersquos healthcare workforce These shortcomings are evidenced by student waiting lists for local nursing schools96 Nursing programs both locally and nationally report an increase in the number of qualified nursing applicants being turned away due to a dearth of faculty and classroomclinical space In 2005 the number of applicants denied admission for these reasons totaled 29424 for the nation and 1850 in Maryland
According to a 2005 survey97 Marylandrsquos 24 nursing degree programs reported that 305 percent of full-time faculty positions were vacant Local shortages can be attributed to both the aging of the statersquos population as well as difficulties in growing the pool of potential educators These difficulties range from structural barriers such as the limited local capacity of graduate programs in nursing education to market-driven trends (eg compensation for practicing nurses often exceeds that for nursing educators) These trends will undoubtedly be exacerbated as Marylandrsquos nursing faculty population continues to age and approach retirement The average age of nursing faculty at Maryland institutions as reported to the Board of Nursing in 2005 ranges from 42 to 55 years and the average age nationally for faculty retirement is 625 years98
Recommendation Enhance teacher retention through the expansion and enhancement of Professional Development School (PDS) networks
It appears that facultyteacher retention especially at the primary and secondary levels can be improved through access to quality Professional Development School (PDS) networks One example is Towson Universityrsquos PDS network which has been recognized at both the state and national levels as a successful model that relies on a partnership between a college or university and local school systems PDS networks aim to enhance and improve teacher quality through
95 Maryland State Department of Education 2006 96 Charting New Directions Governorrsquos Healthcare Workforce Summit page 13 97 Maryland Council of Directors of Associate Degree and Baccalaureate Programs Survey 98 Nursing Faculty Shortage Causes Effects and Suggestions for Resolution Maryland Statewide Commission on the Crisis in Nursing 2005
50
Recommendations
continuous professional development The network targets all stages of a teacherrsquos career offering professional development activities throughout the entire career An analysis of Towson Universityrsquos PDS network in 2001 showed that its teacher-graduates were retained at a much higher rate than other new teachers According to the study schools within the PDS network were associated with teacher retention rates of 80 percent after four years and 71 percent after five years This compares to non-PDS network retention rates of 45 and 34 percent respectively99
73 Marylandrsquos Growing Immigrant Population Opportunities and Challenges
Population shifts are impacting the demographic makeup of the state in ways that will have dramatic impacts on employer needs and workforce development Between 2000 and 2006 immigrants accounted for more than half (516) of Marylandrsquos population growth As of 2006 immigrants account for 12 of the statersquos population
Marylandrsquos workforce is expected to benefit from international migration at both ends of the employment spectrum as immigrants fill low-wage low-skill jobs as well as high-wage high-skill positions From a workforce development perspective this movement into Maryland will require increased investment in English as a Second Language (ESL) programs According to decennial census data the percentage of people who report to the Census Bureau that they speak English ldquonot wellrdquo or ldquonot at allrdquo has increased nearly 74 percent since 1990 Much of this population represents non-English speaking immigrants who present new challenges in terms of labor force training and education
Despite the pressing need for adult literacy services in Maryland demand continues to severely outstrip supply According to MSDE funding constraints dictate that a small percentage of annual demand is being met resulting in annual waiting lists of up to 5000 people Many of the people on waiting lists (47 percent) are waiting for access to ESL programs100
Recommendation Enhance and expand access to community English as a Second Language (ESL) programs
Not only is there a need for improved access to English as a Second Language programs but MSDE also notes the need to improve the quality of the statersquos ESL programs In 2005 Marylandrsquos adult education programs offered 40 hours of instruction per student which is not adequate for beginner or even intermediate English learners to become proficient Many of these ESL students lack advanced literacy skills in their native language and thus require additional intensive classroom time MSDE notes that a program that offers more than 100 hours of classroom time would better meet the needs of this population
Recommendation Enhance and support initiatives and partnerships that encourage a broad spectrum of education opportunities for immigrant populations
99 Pilato Maryland State Department of Education 100 Maryland State Department of Education December 2005
51
Recommendations
Many of Marylandrsquos foreign-born workers are highly educated and possess applicable skills however many of Marylandrsquos immigrants are at the opposite end of the educational spectrum As of 2006 43 percent of Marylandrsquos immigrants held at least a Bachelorrsquos degree compared with 34 of US natives in Maryland At the same time 18 of immigrants in Maryland did not have a high school diploma or its equivalent compared to 12 of US born Maryland residents101
Organizations such as US Hispanic Youth Entrepreneur Education (USHYEE) in partnership with MSDE and colleges and universities within the state are working together to provide Hispanic youth with scholarships along with technical and life skills that will encourage this segment of the population to seek higher education opportunities
Recommendation Coordinate efforts to promote Marylandrsquos access to seasonal immigrant (H-2B) and skilled immigrant (H-1B) workers102
Seasonal immigrant worker shortages have adversely affected Maryland businesses for some time In 2005 the national cap of 66000 H-2B visas which allow foreign nationals to temporarily enter the US and take advantage of seasonal or peak load employment opportunities was filled just a few months into the federal fiscal year As a result the lionrsquos share of Maryland businesses were prevented from applying for the estimated 7000+ temporary workers needed to sustain Marylandrsquos seasonal businesses A diverse group of Maryland industries are affected by the seasonal worker shortage including tourism and hospitality-driven businesses and agriculture and seafood processing firms as well as other types of service firms such as landscaping businesses
The State has recognized the importance of this issue In fact local political leaders continue to be actively involved in drafting legislation to increase the national cap and exempt returning seasonal workers from being subject to it GWIBrsquos Hospitality amp Tourism Monograph emphasizes Marylandrsquos need for seasonal immigrant workers and recommends that a state liaison office for immigration issues be established The GWIB report notes that in addition to being actively involved in immigration policy and advocacy the liaison office could work to connect foreign-born workers with Maryland businesses in need of temporary workers
A liaison office also could coordinate efforts to increase the availability of H-1B workers The H-1B visa program targets highly-skilled internationals who work in professional fields such as computing finance law and healthcare among others The national cap for H-1B visas has fluctuated in recent years jumping from 65000 in the late 1990s to 195000 in 2000 and then dropping back to 65000 in fiscal year 2003 As with H-2B visas annual quotas are met early in the year According to the Migration Policy Institute one out of every five doctors in the US is foreign born Two of every five medical scientists one of every five computer specialists and
101 US Census Bureau 2006 American Community Survey calculations based upon Maryland residents age 25 and over 102 It should be noted that this recommendation in no way advocates filling BRAC and other positions which require security clearances with H-1B and H-2B workers Given security clearance requirements filling these jobs with foreign nationals is simply not possible
52
Recommendations
one of every six persons in engineering or science fields are foreign born Given current and expected shortages among the science engineering technology and mathematics (STEM) fields it makes sense to explore expanding the H-1B visa option
74 The Need for Increased Labor Force Participation
The statersquos low jobless rate (39 percent in 2006) signifies not only that Marylandrsquos economy is healthy but also that local labor market conditions remain tight Most economists agree that an unemployment rate in the range of 35 to 45 percent is indicative of an economy operating at full employment and Marylandrsquos jobless rate continues to fall within that range In fact the state has not recorded an unemployment rate above the 45 percent mark since July 2003
Tight labor market conditions have the potential to aggravate labor shortages and apply upwards pressure on wages Since nearly one-sixth of Marylandrsquos existing labor force is expected to retire in the next decade these conditions are likely to worsen going forward Continued local labor supply shortages makes leveraging our underutilized and potential labor supply all the more important There is an opportunity to address this issue by tapping adult population segments that are underrepresented in the workforce including veterans ex-offenders and the statersquos disabled and lower literacy populations
According to a report released recently by the US Census Bureau roughly 175 percent of the statersquos adult population (or nearly 618000 persons) was eligible for adult education services as of 2000 This population includes individuals who ldquolack sufficient mastery of basic educational skills to enable the individuals to function effectively in societyrdquo103 Specifically this population includes those adults age 16 or older who lack a high school diploma and who are not enrolled in school In order to more fully integrate them into the statersquos labor force we need to expand access to basic literacy instruction GED services and English as a Second Language (ESL) classes
Recommendation Enhance opportunities for adult education (ie basic literacy GED services and ESL classes)
Despite the pressing need for adult literacy services demand continues to severely outstrip supply According to MSDE funding constraints dictate that only three to five percent of annual demand for these services is being met resulting in annual waiting lists of up to 5000 people The majority of those on waiting lists include people seeking ESL instruction and Adult Basic Education (ABE) If the State can increase the availability of these educational programs Marylandrsquos economy will benefit
103 US Census Bureau Profiles of the Adult Education Target Population Information from the 2000 Census December 2005
53
Recommendations
Recommendation Future study is necessary to identify the education and related needs of additional adult population segments
While the needs of Marylandrsquos lower literacy population have been identified there exists a lack of comprehensive information on other population segments which may not be participating fully in the statersquos workforce A thorough study is needed to identify the demographic economic and social characteristics of each Maryland population segment (ie veterans ex-offenders disabled population etc) With this information the education and hard or soft skill levels of these populations could be identified in addition to the identification of barriers preventing them from participating more fully in the workplace A synthesis of this information also would help to identify specific occupations that could serve as an entreacutee to career tracks for each of these population segments
Recommendation Create a statewide resource network to advance basic skills
Basic skills are in demand In fact the Maryland Department of Labor Licensing amp Regulation projects that the top four occupations expected to see the greatest level of replacement openings between 2004 and 2014 include104
Cashiers (33780 replacement openings) Retail salespersons (31670) Waiters and waitresses (21585) Combined food preparation and serving workers (17035)
These occupations require such basic skills as active listening speaking writing and reading comprehension
A recent GWIB report targeting Marylandrsquos Tourism amp Hospitality sector identifies a critical mismatch between the ldquojob-readinessrdquo or basic skills required for most occupations in the sector and the skill levels of new entrants to the field The majority of occupations in this sector require basic skills and on-the-job training yet employers are having difficulty finding workers with good active listening skills service orientation and cultural awareness and sensitivity Finding job entrants with the ability to read write and understand standard and spoken English also is a critical priority for the industry To address these issues the report recommends creating a statewide resource network to advance basic skills
104 Maryland Department of Labor Licensing amp Regulation Office of Workforce Information and Performance and Office of Labor Statistics 2007
54
Recommendations
55
Recommendations
1 BRAC Requires a Pipeline of Qualified Workers
Not all of the current BRAC personnel will move to Maryland along with their jobs Since the average civilian DoD worker is 45 years old many current workers will approach retirement in the near-term future The short-term implications of this trend are highly relevant given that the size and scope of the DoD BRAC units moving to Maryland could be influenced by current and near-term future workforce availability In other words if jobs go unfilled they could very well be lost through downsizing or reconfiguration of BRAC units The challenge for workforce development officials is to ensure that Maryland realizes as many potential BRAC jobs as possible The way to achieve this goal is to make sure that new positions are filled quickly
The statersquos workforce development system must strive to ensure that Marylandrsquos labor pool is ready and able to fill the types of jobs that BRAC will yield Both the Fort Monmouth and Defense Information Systems Agency (DISA) units that are slated to move to Maryland report a high proportion of the following occupations
Engineers (specifically electronicselectrical engineers computer engineers software engineers and engineers in general)
Managers (federal contract managers logistics managers inventory managers and information technology managers)
Computer scientists Telecommunications specialists Analysts (budget analysts and managementprogram analysts) and Technical writers and editors
These occupations require a Bachelorrsquos degree mainly in the engineering and sciences fields for entry-level positions For higher grade positions graduate education andor a combination of work experience is required Key skills associated with these positions include
Complex problem solving Critical thinking Judgment and decision making Systems evaluation105
Technology design106
105 The US Department of Labor defines systems evaluation as follows Identifying measures or indicators of system performance and the actions needed to improve or correct performance relative to the goals of the system 106 Technology design is defined as Generating or adapting equipment and technology to serve user needs
56
Recommendations
Recommendation Actively recruit retired government personnel and veterans to fill vacant BRAC positions
Fort Monmouth is currently in the process of actively recruiting up to 2000 Maryland workers to fill BRAC positions by 2011 Retired government personnel and veterans (especially those with security clearances) stand out as a potential labor pool worth cultivating in order to help the bases meet recruitment needs and fill any foreseeable gaps in the immediate future
Recommendation Increase interest recruitment and retention in BRAC-related fields
Since many of the BRAC jobs will require an educational background in science technology engineering and mathematics (STEM) fields and since graduation levels in many of these fields have been flat to negative in Maryland we must generate an interest in these fields before students enter college
Maryland has developed several new or planned initiatives at the high school level that if proven successful could serve as models to be deployed elsewhere in order to ensure that Maryland is developing an adequate pipeline of BRAC workers One such initiative is the Homeland Security and Emergency Preparedness Magnet Program at Joppatowne High School in Harford County The program which was launched in the fall of 2007 consists of three curricular tracks including Criminal JusticeLaw Enforcement InformationCommunications and Technology and Homeland Security Sciences The curricular content of these tracks is often applied For example the InformationCommunications and Technology track enables students to attain certification in both Cisco and SPACESTARS professional programs While the program aims to prepare high school students for careers in the homeland security field it also is designed to create a network linking students with government and industry partners
The Science and Mathematics Academy at Aberdeen High School is another example This program funded with federal state and local funds was launched in fall 2004 after several years of planning The program originated with the Army Alliance and other professionals affiliated with Aberdeen Proving Ground (APG) A critical program component provides students with the opportunity to interact regularly with professional scientists and mathematicians Another unique feature allows high school seniors to perform original research with the guidance of a program mentor
Recommendation Identify labor and education needs for spin-off BRAC jobs
The influx of BRAC personnel and contractors to Maryland will result not only in significant construction activity but also increased demand for personal services According to a report produced by RESI in 2006 for every direct on-base job107 that comes to Maryland 196 additional spin-off jobs will be created108 Specifically Maryland will experience a rapidly growing demand for construction managers and workers day care workers and hospitality workers among others Local community colleges in Harford and Anne Arundel counties
107 Direct on-base positions include both civilian DoD positions as well as embedded private defense contractors 108 RESI of Towson University Maryland Department of Business amp Economic Development 2006
57
Recommendations
already have begun to explore program needs associated with such occupations This is an area that should be explored fully by workforce development professionals
75 There Is a Shortage of Workers with Security Clearances
The number of positions requiring security clearances as well as the level of security clearances required for existing contracts has increased dramatically since September 11 2001 This increased demand has exacerbated processing times and resulted in a frenzy of competition and ldquopoachingrdquo from the limited pool of cleared workers many of whom are concentrated within science technology engineering or mathematics (STEM) fields Not only is the security clearance process a lengthy and onerous one but it is costly as well Processing delays can cause jobs to remain unfilled for months on end and the cost of sponsorship is quite high
Recommendation Spread the word set up a pre-screening model and expand internship opportunities
The issue of security clearances is a tricky one since the process is federally driven and thus largely outside the Statersquos control Still Maryland can begin to address the security clearance issue by disseminating information An awareness campaign especially targeting high school and college students is needed to get the word out We must emphasize the multitude of job opportunities available to Marylandrsquos youth and inform them what they need to do (or rather avoid) in order to obtain positions requiring security clearances
Also key to resolving Marylandrsquos excess clearance demand is to spearhead the clearance process by targeting prospective workers while they are still students To achieve this goal a pre-screening model could be developed whereby prior to graduation college students begin the security clearance process A Towson University study performed on behalf of DBED notes however that such a model would enhance the process only if the federal government addresses process issues at the national level109 Once the model is in place matching funds could be established (between defense contractors and other organizations as well as private andor public sources) in order to sponsor students to begin the security clearance process
Expanded internship prospects represent another area of opportunity to get the word out and encourage student interest in positions that require security clearances The Johns Hopkins Universityrsquos Applied Physics Lab (APL) summer internship program is one such example APL funds and processes interim student clearances for temporary summer positions APL also funds the full clearance process for students who remain with the lab beyond the summer
109 Division of Economic and Community Outreach of Towson University Maryland Department of Business amp Economic Development 2006
58
Recommendations
76 Skilled Professionals Needed
A review of emerging and expected labor force conditions in Maryland makes it clear that there is a need for the state to grow attract and retain skilled professionals of all types (not just STEM and BRAC-related workers) There is a need to attract and retain these professionals both as workers and residents in Maryland Admittedly this particular finding overlaps with previously mentioned findings (ie the need for STEM and BRAC workers) The evidence is so compelling that the authors of this report felt that a separate recommendation is justified
Recent migration trends in Maryland bring this issue to the forefront In each of the three most recent years for which data are available (2004 through 2006) the state has recorded negative net migration In other words more people are moving out of the state than are moving in Between 2005 and 2006 for instance net domestic migration outflows exceeded 25000 people offsetting the 21000-person gain due to international migration110 In other words in a single year 25000 residents left Maryland and were replaced by 21000 immigrants
This exodus of Maryland residents has significant implications for the statersquos workforce Many of the residents leaving the state are skilled professionals who are being replaced increasingly by less educated immigrants Certainly many new immigrants to Maryland are highly educated but the amount of time during which these skilled immigrants will remain in Marylandrsquos workforce is not certain In addition many of the statersquos out-migrants continue to commute to Maryland for work How long will these workers put up with longer commutes After all the state has a notoriously lengthy average commute time of 306 minutes second only to that of New York City (309 minutes)
The statersquos rate of population growth is slowing Between 2020 and 2030 Marylandrsquos population is expected to grow by five percent compared to 20 percent growth between 1970 and 1980 Marylandrsquos population is aging as nearly one-fifth of the statersquos working age population is set to retire by 2020 The trend in migration coupled with the statersquos slowing population growth aging population and increasingly tight labor market conditions all point to the same conclusion Maryland needs to ensure that our pool of skilled professionals grows in step with the demand
110 US Census Bureau
59
Recommendations
Recommendation Launch a campaign to attract and retain skilled professionals
Nations such as India and China and even mid-Atlantic cities and states such as Philadelphia and West Virginia have made concerted efforts to not only grow and retain skilled professionals but to entice these workers to return to their home citiesstatesnations This analysis recommends that a campaign be developed to both attract and retain skilled professionals in Maryland
A public-private coalition is recommended to spearhead such a campaign which would target skilled professionals of all ages As a start the initiative could target the emerging pipeline of professional workers ndash namely college students The campaign could be two-pronged focusing on retaining Maryland college students in the statersquos workforce as well as attracting college students from other areas to Maryland After all the survey data suggest that nearly four out of every 10 Bachelorrsquos degree graduates of Maryland institutions elect to work outside the state The campaign could target additional locales with a significant presence of colleges and universities (ie Greater Boston Research Triangle Park Greater Philadelphia etc) in an effort to attract current students to Maryland after graduation Such a campaign should incorporate incentives for first-time homebuyers and affordable housing currently offered in Maryland
60
Closing
80 Closing
Marylanders live and work in a state characterized by a healthy diverse economy and low unemployment The statersquos highly educated workforce and the presence of and proximity to federal agencies and laboratories also are major advantages Marylandrsquos excellent quality of life continues to attract workers and residents to the state In order to meet the many challenges posed by a rapidly changing demographic and economic landscape Maryland must be prepared to preserve and build on these existing strengths
This report highlights a number of current and predicted labor force trends that will drive the future of Marylandrsquos labor and jobs markets These trends pose several challenges to the state that will require the attention of educators workforce development professionals the business community and residents alike Tackling these challenges through a combination of public and private initiatives will serve to enable Maryland to maintain its existing strengths and enhance the statersquos ability to compete in an ever-changing global economy Hopefully the trends and recommendations highlighted in this report will aid in this effort
61
References
References
American Community Survey US Census Bureau 2005
Altbach P R Berdahl and P Gumport American Higher Education in the Twenty-First Century 2nd ed Johns Hopkins University Press April 2005
Americarsquos Career InfoNet httpwwwacinetorg
Associated Press State amp Local Wire ldquoLimit on Seasonal Workers Vexes Employersrdquo February 28 2005 Lexis-Nexis
Baltimore Business Journal ldquoLift Cap on Temporary Visa Programrdquo American City Business Journals Inc July 30 2004
Baltimore Sun ldquoConstellation Energy Files Partial Plan for Reactorrdquo Bloomberg News July 31 2007
Barlow ED ldquoStorm Warnings and What You Can Do To Preparerdquo 2006 Governorrsquos Workforce Conference Maryland May 8 2006
Brugger Robert J Maryland A Middle Temperament 1634-1980 Johns Hopkins University Press 1988
Buhler Patricia M ldquoThe New Workforce Five Sweeping Trends That Will Shape Your Companyrsquos Futurerdquo AMA Business Brief wwwamanetorg
Bureau of Labor Statistics ldquoHigh-paying Occupations with Many Openings Projected 2002shy12rdquo Occupational Outlook Quarterly Spring 2004 httpwwwblsgovopubooq2004springoochartpdf
Campbell Doug ldquoThe Illegal Immigrant Effectrdquo Region Focus 2006
Campbell Paul R ldquoPopulation Projections for States by Age Sex Race and Hispanic Origin 1995-2025rdquo US Census Bureau Population Division 1996
Capps Randy Michael Fix Jeffrey Passel Jason Oust and Dan Perez-Lopez ldquoImmigrant Families and Workers A Profile of the Low Wage Immigrant Workforcerdquo Urban Institute November 2003
Carroll Nick and C Taeuber ldquoA Profile of Older Workers in Marylandrdquo US Department of Commerce Economics and Statistics Administration US Census Bureau August 2004
Conte and Carr ldquoOutline of the US Economyrdquo US Department of State httpusinfostategov
62
References
Cox Michael R Alm and N Holmes ldquoWhere the Jobs Arerdquo The New York Times May 13 2004 late edition ProQuest Information and Learning Company httpproquestumicompqdwebdid=636777401ampsid=5ampFmt=3ampclientld=41150ampRQT=309amp VName=PQD
De Long David W ldquoConfronting the Chemical Industry Brain Drain A Strategic Framework for Organizational Knowledge Retentionrdquo Accenture-Institute for Strategic Change April 2002
Division of Economic and Community Outreach ldquoBRAC Government and Corporate Need for Workers with Security Clearancesrdquo Towson University June 2006
ldquoDomestic Net Migration in the United States 2000 to 2004rdquo US Census Bureau April 2006
Drucker Peter ldquoThe Future Has Already Happenedrdquo Futurist 32 no 8 (1998) 16 MAS Ultra-School Edition
Duderstadt James J ldquoLeading Higher Education in an Era of Rapid Changerdquo July 2001
ElBoghdady Dina ldquoDISA Fights Turnover with Telecommutingrdquo The Washington Post January 25 2006
Fahrenthold David A ldquoMaryland Crab Industry Angles for Help Seasonal Worker Cap Job Abundance Leave Seafood Processors Short-Staffedrdquo The Washington Post February 28 2005 Lexis-Nexis
Federal Reserve Bank of Dallas ldquo2003 Annual Report The Evolution of Workrdquo wwwdallasfedorg
Franz Maximilian ldquoCommentary The Chesapeake Traditionrdquo The Daily Record May 7 2002 Lexis-Nexis
Gereffi Gary and V Wadhwa ldquoFraming the Engineering Outsourcing Debate Placing the United States on a Level Playing Field with China and Indiardquo Master of Engineering Management Program Duke University December 2005
Goldstein Mark ldquoMarylandrsquos Changing Demographicsrdquo Presentation on behalf of the Maryland Department of Planning June 2006
Governorrsquos Workforce Investment Board 2003 ldquoGovernorrsquos Healthcare Workforce Summit Monographrdquo Maryland Department of Labor Licensing amp Regulation
Governorrsquos Workforce Investment Board 2006 ldquoMaryland Aerospace Industry Monographrdquo Maryland Department of Labor Licensing amp Regulation
63
References
Governorrsquos Workforce Investment Board 2007 ldquoMaryland Hospitality amp Tourism Industry Monographrdquo Maryland Department of Labor Licensing amp Regulation
H1Base ldquoH1-B Visa Information amp Service Centerrdquo httph1basecompageaspid=312
Hankin Harriet The New Workforce New York AMACOM 2005
Heller Barbara R ldquoMarylandrsquos Nursing Shortage A Workforce Crisisrdquo University of Maryland March 2003
Hewitt Associates LLC ldquoWorkforce Planning in the 21st Century - Back to the Futurerdquo International Report October 2003
Huether David ldquoThe Case of the Missing Jobsrdquo National Association of Manufacturers httpwwwnamorgs_namdoc1aspCID=201416ampDID=236655
Karoly Lynn A and Constantijn W A Panis The 21st Century at Work Forces Shaping Lifelong Learning Trends A Profile of Continuing Higher Education 7th ed University Continuing Education Association April 2002
Kaushal Neerja and Michael Fix ldquoThe Contributions of High-Skilled Immigrantsrdquo Migration Policy Institute July 2006
Keller Michael J ldquoA Study of the Capacity of Marylandrsquos Teacher Preparation Programsrdquo Maryland Higher Education Commission March 2006
Kobell Rona and C Guy ldquoWork-visa Limit Snags Shore Employers Business Relying on Immigrant Labor Might Not Have Anyone to Do the Workrdquo The Sun January 24 2005 final edition ProQuest
Lasater Beth and Barbara Elliot ldquoProfiles of the Adult Education Target Populationrdquo Center for the Research in Education RTI International December 2005 httpwwwedgovaboutofficeslistovaepiAdultEdcensus1pdf
Lorefice Alejandro A ldquoJust in Time Manufacturing Introduction and Major Componentsrdquo New York 1998
Lyons Michael and Pearson Ian Business 2010 Mapping the New Commercial Landscape London 2003
Maryland Board of Nursing httpwwwmbonorgmainphp
Maryland Career and Workforce Information httpdllrstatemdus
Maryland Department of Business amp Economic Development Economic Pulse January-February 2007
64
References
Maryland Department of Business amp Economic Development ldquoLargest Employers in Marylandrdquo March 2006
Maryland Department of Labor Licensing amp Regulation ldquoMarylandrsquos Demand-Driven Two-Year Workforce Investment Planrdquo July 2005-June 2007
Maryland Department of Labor Licensing amp Regulation Office of Workforce Information and Performance and Office of Labor Statistics March 2007
Maryland Governorrsquos Workforce Investment Board ldquoGovernorrsquos Healthcare Workforce Summit Monographrdquo August 2003 httpwwwmdworkforcecomlibpdfhcmonographpdf
Maryland Higher Education Commission ldquoEnrollment Projections 2007-2016 Maryland Public Colleges and Universitiesrdquo June 2007
Maryland Higher Education Commission ldquoTrends in Degrees Awarded at Maryland Higher Education Institutionsrdquo March 2005
Maryland Higher Education Commission ldquoTrends in Enrollment by Program Maryland Higher Education Institutionsrdquo April 2005
Maryland Higher Education Commission ldquo2004 Maryland State Plan for Postsecondary Educationrdquo December 2004
Maryland Higher Education Commission 2006 Trend Book 1 3 19-24 29-32 49-54 78-84 91-93 August 2006
Maryland Higher Education Commission 2005 Data Book 1 August 2004
Maryland Higher Education Commission 2006 Data Book 1 August 2005
Maryland Higher Education Commission 2007 Data Book 1 7 14-16 38 August 2006
Maryland State Department of Education ldquoStepping Up to the Future Adult Literacy Challenges at Work at Home and in the Maryland Communityrdquo December 2005
Maryland Independent College and University Association Connection ldquoLearn About the Five Factsrdquo httpwwwmicuaconnectioncommythsasp
Maryland Independent College and University Association ldquoFast Facts About MICUA 2007 ndash Enrollment Countsrdquo 2002 httpwwwmicuaorgffenrollmentcountspdf
McGee Marianne Kolbasuk and Alice LaPlante ldquoTalent Search The Myths Facts and Emotions That Will Keep the H1-B Visa Issue From Going Awayrdquo InformationWeek July 23 2007 Lexis Nexis
65
References
Mittuch Eugene W Averting a Pending Department of Defense Civilian Personnel Crisis The Need for a Corporate Recruiting Strategy May 2002 httpwwwstormingmediaus898946A894604html
National Academy of Science ldquoRising Above the Gathering Storm Energizing and Employing America for a Brighter Economic Futurerdquo 2006
National Center on Education and the Economy ldquoTough Choices Tough Times The Report of the New Commission on the Skills of the American Workforcerdquo 2007 httpwwwskillscommissionorgpdfexec_sumToughChoices_EXECSUMpdf
National Science Foundation 2003 httpwwwnsfgov
Nuclear Energy Institute ldquoNuclear Energy Industry Initiatives Target Looming Shortage of Skilled Workersrdquo January 2007 wwwneiorg
OECD ldquoWhat Schools for the Futurerdquo October 2001
Pew Hispanic Center ldquoFact Sheet The Labor Force Status of Short Term Unauthorized Workersrdquo April 2006
Pilato Virginia ldquoMSDE and The Impact of Different Models of Teacher Preparation on Teacher Retention A Progress Reportrdquo presented by Dr Tom Proffitt and Ms Karen Schafer Towson University
Pisarski Alan ldquoCommunity in Americardquo Transportation Research Board 2006
RAND Corporation ldquoThe Future Workforce and Workplace in the United Statesrdquo 2004
Reeves Scott ldquoAn Aging Workforcersquos Effect On US Employersrdquo Forbes September 29 2005 wwwForbescom
RESI study performed on behalf of the Maryland Department of Business amp Economic Development Jobs and Household Allocations and Expected Tax Revenues
Snyder Thomas D ldquoDigest of Education Statistics 2005rdquo National Center for Education Statistics June 2006 httpncesedgovprogramsdigestd05ch_3asp
Sparshott Jeffrey ldquoBay Firms Depend on Foreign Workersrdquo The Washington Times June 1 2005 Lexis-Nexis
States News Service ldquoMikulski Scores Senate Victory for Americarsquos Small Businessesrdquo April 19 2005 Lexis Nexis
66
References
The Conference Board Partnership for 21st Century Skills Corporate Voices for Working Families and Society for Human Resource Management ldquoAre They Really Ready To Workrdquo 2006 http21stcenturyskillsorgdocumentsFINAL_REPORT_PDF09-29-06pdf
Therrien Roger C Bridges R Meyerhoff and J Baker ldquoConnecticut Workforce Demands and the Implications for Educationrdquo Connecticut Department of Labor July 2003
Three Rivers Workforce Investment Board ldquoManaging the Changing Workforce in Southwestern Pennsylvaniardquo Executive Summary June 2006 httpwwwtrwiborgreportsagingexecsummarypdf
Towards Knowledge Societies UNESCO Publishing 2005
UMD ldquoProtecting Marylandrsquos Competitive Edgerdquo An Action Summit Hosted by the University of Maryland April 2006 httpwwwcompetitive-edgeumdedusnapshothtml
US Department of Education ldquoState Nonfiscal Survey of Public ElementarySecondary Educationrdquo National Center for Education Statistics November 2005 httpncesedgovprogramsprojectionstablestable_25CTaspreferrer=tablenotes
VisaPro ldquoFrequently Asked Questionsrdquo httpfaqvisaprocomH2B-Visa-FAQ3aspQ1
67

Executive Summary
Seasonal immigrant worker shortages have adversely affected Maryland businesses for some time In recent years the annual national cap of 66000 H-2B visas which allow foreign nationals to temporarily enter the US and engage in seasonal or peak load employment opportunities has filled within the first few months of the federal fiscal year As a result many of Marylandrsquos seasonal businesses were prevented from applying for the estimated 7000+ temporary workers needed
Improving state-wide coordination efforts should increase the availability of H-1B workers The H-1B visa program targets highly-skilled internationals who work in professional fields such as computing finance law and healthcare among others The national cap for H-1B visas has fluctuated in recent years jumping from 65000 in the late 1990s to 195000 in 2000 and then dropping back to 65000 in fiscal year 2003 As with H-2B visas annual quotas are met early in the year According to the Migration Policy Institute one out of every five doctors in the US is foreign born Two of every five medical scientists one of every five computer specialists and one of every six persons in engineering or science fields are foreign born Given current and expected shortages among the science engineering technology and mathematics (STEM) fields it makes sense to explore expanding the H-1B visa option
4 Increasing Labor Force Participation and Meeting Adult Education Needs There is an opportunity to address this issue by tapping into Marylandrsquos underutilized and low-skilled adults and ensuring they receive the training they need to become more productive members of the workforce
According to a report released recently by the US Census Bureau roughly 206 percent of Marylandrsquos adult population (or 730000) was eligible for adult education services as of 2000 Specifically this population includes those adults age 16 or older who lack a high school diploma and who are not enrolled in school and adults who speak English as a second language and who have rated their ability to speak English as ldquowellrdquo ldquonot wellrdquo or ldquonot at allrdquo7
Recommendation Enhance opportunities for adult education (ie basic literacy GED services and ESL services)
Despite the pressing need for adult literacy services demand continues to severely outstrip supply According to MSDE funding constraints dictate that only three to five percent of annual demand for these services is being met resulting in waiting lists of up to 5000 persons The majority of those on waiting lists include people seeking ESL instruction and Adult Basic Education (ABE)
Recommendation Future study is necessary to identify the education and related needs of additional adult population segments
While the needs of Marylandrsquos lower literacy population have been identified there is a lack of comprehensive information on other population segments which may not be participating fully in the statersquos workforce A thorough study is needed to identify the demographic economic and
7 US Census Bureau Profiles of the Adult Education Target Population Information from the 2000 Census December 2005
5
Executive Summary
social characteristics of each Maryland population segment that is not fully represented in the workforce
Recommendation Create a statewide resource network to advance basic skills
The top occupations in Maryland (in terms of the need for replacement workers) require basic skills such as active listening speaking writing and reading comprehension
For example The majority of occupations in the Hospitality and Tourism sector require basic skills and on-the-job training yet employers are having difficulty finding workers with good active listening skills service orientation and cultural awareness and sensitivity To address these issues the report recommends creating a statewide resource network to advance basic skills
5 Developing a Base Realignment and Closure (BRAC) Worker Pipeline Not all of the current BRAC personnel will move to Maryland along with their jobs If incoming BRAC jobs go unfilled they could very well be lost The challenge for workforce development officials is to ensure that Maryland realizes as many potential BRAC jobs impacts by ensuring that new positions are filled quickly
The average age of civilian DoD workers is 45 years old As a result many current workers impacted by BRAC will approach retirement in the near future The size and scope of the BRAC units moving to Maryland could be influenced by future and current workforce availability
Recommendation Actively recruit retired government personnel and veterans to fill vacant BRAC positions
Fort Monmouth is currently actively recruiting up to 2000 Maryland workers to fill BRAC positions by 2011 Retired government personnel and veterans (especially those with security clearances) stand out as a potential labor pool worth cultivating in order to help the bases meet recruitment needs and fill any foreseeable gaps in the immediate future
Recommendation Increase interest recruitment and retention in BRAC-related fields
Since many of the BRAC jobs will require an educational background in science technology engineering and mathematics (STEM) fields and since graduation levels in many of these fields have been flat to negative in Maryland we must generate an interest in these fields before students enter college
Maryland has developed several new or planned initiatives at the high school level that if proven successful could serve as models to be duplicated elsewhere to ensure that Maryland is developing an adequate pipeline of BRAC workers
Recommendation Identify labor and education needs for spin-off BRAC jobs
6
Executive Summary
The influx of BRAC personnel and contractors to Maryland will result not only in significant construction activity but also increased demand for personal services According to a report produced by RESI in 2006 for every direct on-base job8 that comes to Maryland 196 additional spin-off jobs will be created9 Specifically Maryland will experience a rapidly growing demand for workers in construction day care and hospitality among others
6 The Security Clearance Process The lengthy and cumbersome security clearance process is hurting Marylandrsquos bottom line as companies are forced to deal with unfilled positions for months on end
The number of positions requiring security clearances as well as the level of security clearances required for existing contracts has increased dramatically since September 11 2001 The impacts are particularly strong among government agencies science and security industries and other jobs associated with BRAC Not only is the security clearance process a lengthy and onerous one but it is costly as well
Recommendation Create awareness set up a pre-screening model and expand internship opportunities
The issue of security clearance is problematic since the process is federally driven and thus largely outside the Statersquos control Still Maryland can begin to address the issue of security clearance by conducting an awareness campaign targeting high school and college students A pre-screening model could be developed in which college students begin the security clearance process prior to graduation Expanded internship opportunities represent another way to get the word out and encourage student interest in positions that require security clearances
7 The Need for Skilled Professionals Maryland needs to ensure that our pool of skilled professionals grows in step with employer demand
A review of emerging and expected labor force conditions in Maryland makes it clear that there is a need for the state to grow attract and retain skilled professionals of all types not just STEM and BRAC-related workers In a single fiscal year (2005-2006) 25000 residents exited Maryland and were replaced by 21000 immigrants10 In addition the statersquos rate of population growth is slowing Between 2020 and 2030 Marylandrsquos population is expected to grow by five percent compared to 20 percent growth between 1970 and 1980 Marylandrsquos population is aging as nearly one-fifth of the statersquos working age population is set to retire by 2020 The trend in migration coupled with the statersquos slowing population growth aging population and increasingly tight labor market conditions all point to the same conclusion Maryland needs to ensure that our pool of skilled professionals grows in step with the demand
Recommendation Launch a campaign to attract and retain skilled professionals
8 Direct on-base positions include civilian DoD positions as well as embedded private defense contractors 9 RESI of Towson University Maryland Department of Business amp Economic Development 2006 10 US Census Bureau
7
Executive Summary
Survey data suggest that nearly four out of every 10 Bachelorrsquos degree graduates of Maryland institutions elect to work outside the state Other cities states and nations have made concerted efforts to not only grow and retain skilled professionals but to entice these workers to return to their home citiesstatesnations A campaign should be developed to attract and retain skilled professionals in Maryland
A public-private coalition is recommended to spearhead such a campaign which would target skilled professionals of all ages
Recommendation Expand career and technology education
Career and technology education (CTE) programs are courses of study in K-12 and postshysecondary institutions that prepare students for careers with wide-ranging educational requirements These programs provide students with skills to compete in 21st century jobs because students are learning with skills that are transferable across careers and educational paths11 CTE programs combine rigorous and challenging academic content which leads to an industry-recognized credential or certificate an associate or bachelorrsquos degree or entry into an apprenticeship program or employment
CTE programs are currently offered in about 200 Maryland high schools and all 16 of Marylandrsquos community colleges
11 National Governorrsquos Association Retooling Career Technical Education
8
Introduction
20 Introduction
This report begins with a brief overview of the statersquos historical workforce trends and transitions into a high-level analysis of emerging trends affecting the statersquos labor supply and demand ndash both current and future The analysis concludes with a summary of key findings and priority recommendations
This report was produced by RESI of Towson University on behalf of and with input from the Governorrsquos Workforce Investment Board (GWIB) GWIB is the statersquos chief policy-making and strategic planning body on workforce development as mandated by the Federal Workforce Investment Act (WIA) of 1998 and Maryland Executive Order 0101200460 The board is a business-led group of industry education and government leaders charged with advising the governor on Marylandrsquos workforce development needs
9
Historical Backdrop
30 Historical Backdrop
Over time Marylandrsquos workforce has adapted and evolved The following quote from a 2004 New York Times article on the United Statesrsquo workforce sums up this premise nicely ldquoOur history is one of a constant churning of jobs with workers always finding the next step forward in the evolution of work ndash from farm hands to industrial workers to information handlersrdquo12
This statement certainly applies to Maryland which has transformed its economy dramatically over the years
Figure A reveals the general economic shifts the state has experienced since 1900 At that time Agriculture amp Related ranked as the leading employment sector for both Maryland (comprising 242 percent of total employment) and the nation (374 percent) Over the next five decades agricultural employment dropped precipitously comprising 72 percent of Marylandrsquos economy by 1950 and just 14 percent by 2000
Figure A Maryland Employment by Industry Percent of Total13
The rise and subsequent reduction of manufacturing employment also is reflected in the data as is the more recent domination of the services sector which continues today In 2000 manufacturing constituted 81 percent of the statersquos job base while services sector employment accounted for 411 percent Comparable national figures were 148 and 361 percent respectively
00
50
100
150
200
250
300
350
400
450
Agriculture amp Related
Services Manufacturing Wholesale amp Retail trade
Transportation amp Related
Construction Public Administration
Finance Insurance amp Real Estate
1900 1950 2000
12 Cox Richard 2004 13 US Census Bureau Public Use Micro Data
10
10
20
30
40
50
60
70
80
90
o
f Adu
lts W
ith A
t Lea
st a
HS
Dip
lom
1940 1950 1960 1970 1980 1990 2000
US MD
Historical Backdrop
Figure B Educational Attainment for US and Maryland14
These significant changes coincided with increasing labor force educational attainment levels as shown in Figure B In 1940 the first year in which educational attainment data was collected 211 percent of Marylandrsquos population age 25 and over had obtained a high school education or higher By 2000 this percentage approached 840 percent Corresponding national figures were 245 and
804 percent respectively Over the same period the percentage of the statersquos population age 25 and over with a Bachelorrsquos degree or higher skyrocketed from under 50 percent in 1940 to 315 percent in 200015 This chart reveals what employers and workforce development professionals have known for some time ndash an educated workforce has become increasingly critical to maintaining and nurturing economic success
14 Percent of Population aged 25+ with a High School Education or Higher US Census Bureau ldquoA Half-Century of Learning Historical Census Statistics on Educational Attainment in the United States 1940 to 2000rdquo 15 The corresponding national rate in 2000 was just 244 percent
11
Historical Backdrop
The increased demand for educated workers in Maryland has been broad-based and is reflected in industry-level educational attainment data Even in industries traditionally considered ldquoblue collarrdquo such as Manufacturing and Construction the educational attainment of workers has risen Data show that the proportion of workers in each Maryland industry with some college education has increased from just three percent of the statersquos manufacturing workers in 1940 to 26 percent in 2000 The proportion of Agriculture workers with some college skyrocketed from one percent in 1940 to over 20 percent in 2000
Figure C Maryland Educational Attainment by Industry 200016
By 2000 more thanHigh School or Less Some College College Degree Plus 40 of workers
Construction amp Mining 64 24 12 employed within Services Finance Agriculture amp Related 63 21 16 Insurance amp Real
Wholesale amp Retail Trade 58 28 15 Estate and Public 49 30 20 Administration had
obtained a college Transportation amp Related
Manufacturing 48 26 25 degree or higher More Services 28 26 46 than half of the workers
in Marylandrsquos Finance Insurance amp Real Estate 25 34 41 manufacturing sector
Public Administration 22 35 42 had at least some 00 200 400 600 800 1000 college or higher Other
industries employed a higher proportion of workers with a high school education or less such as Construction amp Mining (64 percent) Agriculture amp Related (63 percent) and Wholesale amp Retail Trade (58 percent)
16 RESI US Census Bureau Public Use Micro Data The graph refers to the distribution of maximum educational attainment levels by industry
12
Historical Backdrop
Today Maryland enjoys a healthy diverse economy driven by growth in services sectors such as education health care and other technical and professional services Among Marylandrsquos top 50 largest private employers are health and educational services firms (including The Johns Hopkins University and Hospital Adventist HealthCare and Helix Health System among others) defense and intelligence contractors (such as Northrop Grumman Corporation and Lockheed Martin Corporation) and other technical and professional services firms (such as Computer Sciences Corporation IBM Corporation Science Applications International Corporation and Westat Research Incorporated)17
Though life sciences firms are not generally considered to be large employment generators there is no doubt that the statersquos economy also has been shaped by the presence of industry high fliers such as MedImmune (recently acquired by AstraZeneca) and Human Genome Sciences Inc Any discussion of Maryland employers would not be complete without consideration of the statersquos proximity to and presence of federal research centers and labs
The importance of the federal government to the statersquos economy cannot be underestimated The many federal laboratories and facilities located within and near Maryland such as the Goddard Space Flight Center and the Naval Air Systems Command at Patuxent River have contributed greatly to Marylandrsquos science and security base The presence of the Food and Drug Administration (FDA) and the National Institutes of Health (NIH) have spurred growth among bioscience firms The National Security Agency (NSA) and Marylandrsquos many military installations (including Fort Detrick Fort Meade and Aberdeen Proving Ground) have been critical to building the statersquos base of science and security
17 Maryland Department of Business amp Economic Development 2006
13
Marylandrsquos Labor Supply
40 Marylandrsquos Labor Supply
41 Population Trends and Characteristics
The shifting composition and growth of Marylandrsquos population directly impacts the statersquos economy and labor force Population characteristics such as age educational attainment and diversity have a profound impact on the needs and types of services that will best ensure continued economic growth and prosperity throughout the state The extent to which policy makers educators and business leaders recognize and meet these needs can further strengthen Marylandrsquos ability to attract and retain quality jobs and workers
411 Population Growth Migration and Diversity
Marylandrsquos population exceeded 56 million in 2006 ranking the state 19th in the nation in population size The statersquos rate of population growth between July of 2005 and 2006 was just 05 percent Not only did the state lag the 10 percent national rate of population expansion but Maryland ranks among the bottom third of states (36th fastest growth) according to this measure
This sluggish rate of population growth is not characteristic of Marylandrsquos past performance Between 1990 and 1999 the statersquos population expanded at an average annual rate of 10 percent Between 2000 and 2003 Maryland recorded annual population growth ranging from 11 to 13 percent
The statersquos slower rate of population expansion in recent years can be explained by negative net migration trends In each of the three most recent years for which data are available (2004 through 2006) the state recorded negative net migration In other words more people are moving out of the state than are moving in Maryland recorded a net migration loss of 5000 in 2006 and 6800 in 2005 the largest such decline the state has seen since 198118 While it is true that net international migration continues to bolster the statersquos population growth net domestic outflows (migration between states) outweigh international migration gains Between 2005 and 2006 for instance Marylandrsquos net domestic migration outflows exceeded 25000 persons offsetting the 21000-person gain due to international migration19
It should be noted that Marylandrsquos net domestic migration decline represents a departure from recent trends Between 2000 and 2004 for instance the state recorded net domestic migration gains of more than 5400 per year20 While in the past domestic outflows have been associated with deteriorating or weakening economic conditions within the state recent trends appear to be driven by cost of living issues especially housing costs Out migration to border counties in Pennsylvania and West Virginia has increased significantly in recent years A possible explanation for this movement is the availability of affordable housing in these areas Median home values in Pennsylvania jurisdictions such as York and Franklin counties are roughly $75000 below those of Baltimore County This gap increases significantly when home values in
18 Maryland Department of Planning 19 US Census Bureau 20 US Census Bureau 2006
14
Marylandrsquos Labor Supply
Carroll and Frederick counties are considered Many former Maryland households have taken advantage of lower housing costs in these locales while still being part of Marylandrsquos job market
The good news is that this trend will likely be stemmed by the current and future Department of Defense (DoD) Base Realignment and Closure (BRAC) movements to Maryland The job movements which call for more than 15000 civilian jobs to transfer to Maryland by 2011 are expected to result in substantial household movements to Maryland as well
As previously noted international migration continues to bolster population growth both locally and throughout the nation Foreign immigration represents 443 percent of the statersquos population gain between 1990 and 2000 Marylandrsquos level of foreign-born population has grown from roughly 94000 in 1960 to more than 313000 in 1990 By 2000 nearly one out of every 10 Maryland residents (more than 518000 persons) was foreign born21
Figure E Marylandrsquos Share of Foreign-Born Population 200022
More than two-thirds of the statersquos 40 foreign-born population reports their 35 region of origin to be either Asia or
30 Latin America The most commonly reported Asian countries of origin
25 include China (which comprises 65
20 percent of the statersquos 2000 foreign-born population) India (62 percent)
15 Korea (60 percent) and the
10 Philippines (40 percent) El Salvador leads Latin American countries and
5 accounts for another 81 percent In
0 fact El Salvador comprises the single largest share of Marylandrsquos foreign-born population Jamaica and Mexico
each comprise an additional 37 percent Nigeria Vietnam Germany and the United Kingdom each comprise close to 30 percent of the statersquos foreign-born residents
Asia Latin America Europe Africa North America Oceana
Perc
ent o
f Tot
al
21 Goldstein 2006 22 US Census Bureau
15
Marylandrsquos Labor Supply
40
43
56
57
65
89
11 7
148
174
292
0 5 10 15 20 25 30 35
Figure F Foreign-Born Population as Percent of Total 200523
International migration is forecast to increase Marylandrsquos population Montgomery
by 593000 persons between 1995 Prince George s and 2025 ranking the state ninth in
Howard the nation according to this24 Maryland measure Montgomery and
Prince Georgersquos counties will Baltimore County
continue to absorb the lionrsquos share Frederick
of the statersquos international Anne Arundel
migration Foreign immigration Baltimore City accounted for 891 percent of
Montgomery Countyrsquos population Charles
gains and 719 percent of Prince Wicomico
Georgersquos Countyrsquos gains between 1990 and 2000 In 2005 foreign-
Percent of Totalborn people accounted for 292 percent of Montgomery Countyrsquos population and 174 percent of Prince Georgersquos County residents Howard County follows with 149 percent
Migration continues to increase diversity in Maryland which has recorded substantial increases in its minority population in recent years Between 2000 and 2006 the statersquos minority population expanded by roughly 327000 persons In contrast the statersquos non-Hispanic white population declined by 23000 persons over the same period Census projections indicate that by 2025 Marylandrsquos non-Hispanic white population will comprise just 543 percent of the statersquos total population down from 666 percent in 1995 Over the same period persons of Hispanic origin are expected to increase and comprise 70 percent of Marylandrsquos total population up from 36 percent in 199525
23 Goldstein 2006 24 US Census Bureau Population Division 25 US Census Bureau Population Division
16
Marylandrsquos Labor Supply
Figure G Share of Population by Selected RaceOrigin 200526
Census estimates for 2005 reveal Marylandrsquos population to be quite diverse relative to the nation African-Americans constitute 287 percent of the statersquos population more than twice the
0
10
20
30
40
50
60
70
80
White Black Hispanic or Latino (of any
race)
Asian Some other Race
Two or more races
Perc
ent o
f Tot
al
Maryland United States
60 percent in 2006 The corresponding national share for people of Hispanic or Latino origin in
national share The state also is home to a slightly larger (percent share) Asian population than is seen nationally While Marylandrsquos population of Hispanic or Latino origin has increased significantly in recent years (from roughly 230000 in 2000 to 318000 in 2005) this group comprised 58 percent of the statersquos population in 2005 and
2005 was 145 percent
412 Affluence
Recent data releases once again confirm Marylandrsquos reputation as one of the most affluent states in the nation With a 2006 median household income of $65144 Maryland ranks first in the nation according to this measure and far surpasses the comparable national income level of $48451
Poverty data reveal similar patterns Overall the statewide family poverty rate was 53 percent far below the national rate of 98 percent In 2006 only 78 percent of Marylandrsquos population lived below the poverty level the lowest rate in the nation and 55 percentage points below the national average
The fact that the statersquos households are well compensated is a reflection of Marylandrsquos highly educated and skilled workforce More than a third (351 percent) of the statersquos population age 25 and older has a Bachelorrsquos degree or higher The comparable national percentage is 270 percent The fact that Maryland has a relatively high proportion of households with two or more workers also helps to explain the statersquos high income levels In 2006 four out of 10 households fell within this category compared to 35 for the nation27
26 US Census Bureau American Community Survey 2006 27 US Census Bureau American Community Survey 2006
17
Marylandrsquos Labor Supply
Figure H Per Capita Income Levels by Maryland Workforce Investment Area (WIA)28
$20000 $25000 $30000 $35000 $40000 $45000 $50000 $55000 $60000
Montgomery Anne Arundel
Baltimore County Mid-Maryland
Maryland Frederick
Upper Shore Southern Maryland
Susquehanna Prince Georgersquos
United States Baltimore City
Lower Shore Western Maryland
Annual Per Capita Income
2005 Marylandrsquos affluence is significant for another reason Wealth offers a measure of protection from cyclical economic fluctuations Maryland may be better prepared to weather economic downturns than the balance of the nation However it should be noted
that all regions in Maryland are not equally protected Certain areas have participated less fully in recent economic recoveries than others as indicated by their per capita income levels With an annual per capita income level below $29000 Western Maryland (comprised of Allegany Garrett and Washington counties) trails all other Maryland Workforce Investment Areas (WIAs)29 The Lower Shore (which includes Somerset Wicomico and Worcester counties) also lags other areas with an annual per capita income level of just under $30000
While affluence can be considered a strength especially in the face of economic downturns it poses a challenge for other reasons Increased living costs and housing costs in particular can encourage out migration to lower cost areas a trend analysts believe has been occurring with increased frequency in Maryland for each of the last three years
28 Bureau of Economic Analysis RESI of Towson University WIA refers to Workforce Investment Area Maryland is home to 12 local WIAs each with a common labor pool and 200000 or more residents Each WIA is served by a separate Local Workforce Investment Board (LWIB) 29 In percentage terms however the Western Maryland region boasts the fastest rate of appreciation between 2004 and 2005 with growth in annual per capita income of 63 percent
18
Marylandrsquos Labor Supply
413 Educational Attainment
Figure I 2005 Education Attainment Levels Population 25 and Older30
Maryland is home to a highly educated population The state consistently ranks ahead
00
50
100
150
200
250
300
350
Max
imum
Edu
catio
nal
Atta
inm
ent A
chie
ved
Less than 9th Grade
9th-12th High School Some Associate s Bachelor s Graduate or Grade No Graduate College No Degree Degree Professional Diploma Degree Degree
Maryland United States
of the nation on a variety of education-related measures For instance the National Science Foundation ranks Maryland second in the nation in terms of doctoral scientists and engineers per 100000 population In addition in 2005 the statersquos concentration of professional and technical workers (249 percent) ranked second in the nation
Census educational attainment data tell a similar story In 2005 nearly one in four (194 percent) Marylanders age 25 and older earned a Bachelorrsquos degree as their highest level of educational attainment Approximately 157 percent of state residents have a graduate or professional degree Taken together 351 percent of Marylandrsquos population has a Bachelorrsquos degree or higher ranking Maryland third in the nation compared to 270 percent nationally The gap between Maryland and the nation has widened in recent years as Maryland has increased its proportion of highly educated residents In 1990 only 265 percent of the statersquos population had earned a Bachelorrsquos degree or higher just six percentage points ahead of national levels
30 US Census Bureau American Community Survey 2006
19
Marylandrsquos Labor Supply
Figure J Percent of Population with a Bachelorrsquos Degree or Higher by WIA31
00 100 200 300 400 500 600
Montgomery
Mid-Maryland
Anne Arundel
Frederick
Baltimore County
Prince Georgersquos
Susquehanna
Southern Maryland
Baltimore City
Lower Shore
Western Maryland
Upper Shore
2005 In 2005 Montgomery County and the Mid-Maryland region lead the state in terms of the percent of population age 25 and older with a Bachelorrsquos degree or higher with 563 and 471 percent respectively The Upper Shore and Western Maryland
lag the balance of the state with 111 and 155 percent of regional population respectively with a Bachelorrsquos degree or higher
Figure K Maryland Educational Attainment by Race 200532
Educational attainment distributions vary by race and ethnicityorigin as well While six out of every 10 Asians in Maryland has a Bachelorrsquos degree or higher less than 25 percent of African-Americans and less than 20 percent of Hispanics fall into this category Nearly 390 percent of the statersquos Hispanic population does not have a high school diploma and 242 percent
Total White Alone
Black Alone
Asian Alone
Hispanic (Any Race)
Less than 9th Grade 43 34 37 49 242
9th-12th Grade No
High School Graduate 267 261 309 141 225
117 45 146 Diploma 87 75
Some College No Degree 196 189 231 113 135
Associates Degree 63 63 63 60 54
Graduate or Professional 152 168 96 308 82 Degree
Bachelors Degree 193 209 147 284 116
Bachelors Degree or Higher 345 377 243 593 198
of Hispanics have less than a ninth grade education roughly six times the state average
31 US Census Bureau American Community Survey 2005 32 US Census Bureau American Community Survey 2005
20
Marylandrsquos Labor Supply
414 Aging Population
Many of the issues Maryland will face in terms of future workforce and economic development will be rooted in demographics Between 1970 and 1980 Marylandrsquo population grew by nearly 20 percent Between 2020 and 2030 growth is expected to be just over five percent As the statersquos population growth continues to wane finding skilled workers to fill jobs will become increasingly challenging
Figure L Historic and Projected Growth among Marylands Population Age 16+33
0
100000
200000
300000
400000
500000
600000
1970-1980 1980-1990 1990-2000 2000-2010 2010-2020 2020-2030
Popu
latio
n G
row
th
0
5
10
15
20
25
Absolute Growth
Percentage Growth
Figure M Maryland Historic and Projected Growth by Age34
The Maryland Department of Planning projects that between 2000 and 2030 the statersquos share of population age 20 to 44 will drop from 374 percent to 323 percent Over the same time frame the share of population age 65 and older will increase from 113 to 195 percent Maryland is not alone experiencing this trend though median age data indicate that the statersquos population is slightly older than that of the nation Marylandrsquos median age in 2005 was 371 years compared to a median age of 365 years for the nation as a whole
33 Maryland Department of Planning 34 Maryland Department of Planning
00
100
200
300
400
500
Perc
ent o
f Pop
ulat
ion
1990 2000 2005 2010 2015 2020 2025 2030
Aged 20-44 Aged 65+
21
Marylandrsquos Labor Supply
Census data from 2000 provide an indication of the relative median age of Marylandrsquos regions Eastern Shore jurisdictions such as Dorchester Kent and Worcester counties all have median ages over 40 years of age Talbot Countyrsquos population is the oldest in the state with a median age of 433 years of age Increased immigration of retirees to Eastern Shore locales helps to explain this trend All three Western Maryland jurisdictions also are home to older populations The trend in Western Maryland and Allegany County in particular is attributed to ongoing population decline and out migration among younger people
By 2005 more than 60 percent of the statersquos population was of working age (ie age 18 to 64) Of this population the vast majority (833 percent) fell into the 18 to 54 age range More than one fifth (207 percent) of the statersquos 2005 population of working age was comprised by the leading edge (those born between 1946 and 1955) of the baby boomers those born between 1946 and 1964 This segment of the population is set to face retirement between 2011 and 2020 By 2020 the number of baby boomers between ages 18 and 54 will increase by more than 123000 and will account for 223 percent of the statersquos working age population The data make clear that the retirement of roughly one-fifth of the statersquos working age population is fast approaching and will have a disproportionate effect on those regions that are already home to a large concentration of older residents and workers (such as Western Maryland and the Eastern Shore)
42 Workforce Trends
421 Labor Force Growth Figure N Marylands Labor Force 2000 ndash 200635
Marylandrsquos labor force topped the 3 million mark for the first time in the second quarter of 2006 The state recorded a 23 percent expansion in its labor force between 2005 and 2006
2500000
2600000
2700000
2800000
2900000
3000000
3100000
2000 2001 2002 2003 2004 2005 2006
Labo
r Fo
rce
Lev
el
-10
-05
00
05
10
15
20
25
Labo
r Fo
rce
Ann
ual G
row
th
Level Growth
surpassing the 14 percent growth rate recorded nationwide This expansion was driven by a 20 percent increase in the number of employed people and a 36 percent contraction in the number of unemployed persons The statersquos recent performance reverses a trend of diminishing growth registered between 2002 and 2004 when Maryland trailed the national rate of expansion
35 Maryland Department of Planning
22
Marylandrsquos Labor Supply
Despite this recent up tick the pace of expansion for both the state and national labor force has been slowing since 1970 Between 1970 and 1980 Marylandrsquos workforce expanded by nearly 453000 workers or 27 percent During the 1990s Marylandrsquos labor force grew by just five percent about 130000 workers According to projections from the Maryland Department of Planning the growth in Marylandrsquos labor force will slow even further in the future Between 2020 and 2030 the statersquos workforce is expected to expand by just three percent (or roughly 101000 workers) This trend is being driven by the aging of Marylandrsquos population
Figure O Labor Force Shares by WIA36
00 20 40 60 80 100 120 140 160 180
Montgomery
Prince Georges
Baltimore County
Baltimore City
Anne Arundel
Mid-Maryland
Susquehanna
Southern Maryland
Western Maryland
Frederick
Lower Shore
Upper Shore
2006 The vast majority of the statersquos labor force37 resides in the suburban jurisdictions outside Baltimore City and Washington DC In fact Montgomery and Prince Georgersquos counties are home to just under one-third of the statersquos labor force Collectively
Western Maryland and the Upper and Lower Shore regions comprise another 10 percent of Marylandrsquos labor force
36 Maryland Department of Planning 37 Refers to resident labor force or the population currently working or actively looking for a job
23
Marylandrsquos Labor Supply
-20 00 20 40 60 80 100 120 140 160
Southern Maryland
Frederick
Lower Shore
Susquehanna
Mid-Maryland
Upper Shore
Anne Arundel
Western Maryland
Montgomery
Prince Georges
Baltimore County
Baltimore City
2000-2006
expansion (62 percent) during this period
422 Unemployment Rate Analysis
Figure Q Unemployment Rates 2000 to 200739
Marylandrsquos average annual
Figure P Labor Force Growth 2000 to 200638
unemployment rate which held steady at 38 percent in 2007 remains quite healthy compared to historical and national levels The comparable US jobless rate is 46 percent
The unemployment rate measures the level of unemployed persons (persons who are not working and who are available and actively looking for work) as a percentage of the total labor
All Maryland Workforce Investment Act (WIA) areas except Baltimore City recorded resident labor force growth between 2000 and 2006 In fact with the exception of Baltimore and Prince Georgersquos counties all WIAs outpaced the national rate of
200
300
400
500
600
700
2000Q
1
2000Q
3
2001Q
1
2001Q
3
2002Q
1
2002Q
3
2003Q
1
2003Q
3
2004Q
1
2004Q
3
2005Q
1
2005Q
3
2006Q
1
2006Q
3
2007Q
1
Une
mpl
oym
ent
Rat
e
United States Maryland
force This indicator is significant because it provides a relative measure of the statersquos economic health
Marylandrsquos low unemployment rate is significant to workforce development professionals because it demonstrates that local labor market conditions are increasingly tight Most
38 Bureau of Labor Statistics 39 Bureau of Labor Statistics
24
Marylandrsquos Labor Supply
economists agree that an unemployment rate in the range of 35 to 45 percent is indicative of an economy operating at full employment Marylandrsquos jobless rate continues to fall within that range In fact the state has not recorded an unemployment rate above 45 percent since July 2003
Figure R Unemployment Rates for WIAs40
00 10 20 30 40 50 60 70
Lower Shore Baltimore City
Western Maryland Upper Shore
Prince Georges Baltimore County
Susquehanna Southern Maryland
Anne Arundel Frederick
Mid-Maryland Montgomery
Unemployment Rates (Not Seasonally Adjusted)
2000 Q1 2007 Q1
While Marylandrsquos low unemployment rate testifies to the strength of the statersquos economy persistent tight labor market conditions also have the potential to aggravate labor shortages and to apply upward pressure on wages
Not all Maryland regions boast tight labor market conditions Western Maryland Baltimore City and the Lower Shore for instance have consistently posted unemployment rates upwards of 50 and 60 percent Western Marylandrsquos high unemployment rate stems from the loss of high-wage manufacturing jobs over the past two decades due to closures of former mainstay employers While the region has since experienced job growth much of the new job creation has been in low-skill low-wage positions The fact that the region has a high share of population with less than a high school diploma makes it more difficult for these workers to find quality jobs
40 Bureau of Labor Statistics
25
Marylandrsquos Labor Supply
With an unemployment rate of 61 percent in 2007 Baltimore City also is characterized by looser labor market conditions41 Baltimore is faced with serious long-term challenges including a significant number of underemployed workers as well as large segments of population who do not participate in the workforce The city is home to the largest number of residents with less than a ninth grade education (26679 persons in 2006 or 66 percent of Baltimorersquos population age 25 and older) The cityrsquos high school dropout rate at 105 percent in the 2005-2006 school year exceeds the 35 percent rate posted statewide These dropouts pose a serious workforce development challenge for the city Helping these nontraditional segments of the population (dislocated workers veterans disabled population ex-offenders etc) participate more fully in the labor market may help alleviate the demand for workers in the face of growing skill set and worker shortages
423 Labor Force Participation Rates
Figure S Labor Force Participation Rates for WIA42
500 550 600 650 700 750 800
Mid-Maryland
Frederick
Susquehanna
Montgomery
Southern Maryland
Prince Georgersquos
Anne Arundel
Baltimore County
Upper Shore
Lower Shore
Western Maryland
Baltimore City
Labor Force Participation
2000 Marylandrsquos labor force participation rate among 16- to 64-year-olds (including military) was 782 percent in 2006 ranking the state 11th in the nation according to this measure The comparable national rate is 745 percent43
41 It should be noted however that labor market conditions have improved significantly from 2004 when the city consistently recorded unemployment rates in excess of 70 percent 42 Bureau of Labor Statistics 43 US Census Bureau American Community Survey 2006
26
Marylandrsquos Labor Supply
Figure T Labor Force Participation Rates by Age44
Shifting demographics will have an effect on the statersquos labor force going forward According to Maryland
00
200
400
600
800
1000
Labo
r Fo
rce
Paric
ipat
ion
by A
ge
16-24 25-54 55 and over
2000
Department of Planning data labor force participation rates in 2000 approached 60 percent among those age 16 to 24 years Nearly 830 percent of those aged 25 to 54 years participated in the labor force However only 439 percent of those age 55 and over were in the labor force
Analysts increasingly anticipate that older workers will remain in the workforce longer compared to previous generations Still it is clear that as Marylandrsquos population ages labor force participation will be affected
424 Commuting Patterns
Figure U Percent Change in Marylands ImportedExported Workers45
Journey-to-work data from the 25 2000 Census reveal that for
20 every Maryland worker living outside the state there are 25
15 Maryland residents who leave
5
10
Exported Workers Imported Workers Net Exported Workers
1990
- 20
00
Perc
ent C
hang
e the state for work In other words Maryland is a net exporter of workers In 2000 the state recorded net exported workers in excess of 268000
0 This trend is not surprising since 1990 commuting patterns
-5 show the same pattern However an examination of 1990 and 2000 data indicates
that the situation is improving In 1990 Maryland exported 29 resident workers for every imported worker This improvement is explained by the fact that growth among imported workers (up 208 percent between 1990 and 2000) far surpasses the growth of exported workers (up 43 percent)
44 Bureau of Labor Statistics 45 US Census Bureau
27
Marylandrsquos Labor Supply
Between 1990 and 2000 the number of out-of-state residents commuting to Maryland jumped from 151330 to 182787 In 2000 the vast majority of these workers (872 percent) resided in Washington DC Delaware Virginia and West Virginia Growth was driven especially by outflows from the latter three states While the number of workers commuting from Washington DC to Maryland increased over the period they were a smaller share of Marylandrsquos imported workers dropping from 236 percent in 1990 to 199 percent in 2000
More than 450000 Maryland residents commuted outside the state for work in 2000 The lionrsquos share of these residents worked in Washington DC (620 percent) while another 242 percent worked in Virginia Delaware and Pennsylvania comprise another 52 and 28 percent respectively The number of out commuters to Washington DC dropped by more than 11000 persons or by 39 percent between 1990 and 2000
Marylandrsquos commuting patterns data is relevant not only from a workforce perspective but also from a quality of life perspective According to the Transportation Research Board by 2000 Maryland had joined the ranks of New York New Jersey and Illinois with more than 10 percent of workers traveling over 60 minutes to get to work46 The 2006 American Community Survey figures indicate that Marylandrsquos average commute time of 306 minutes is the second longest commute time in the nation closely trailing New Yorkrsquos average commute time of 309 minutes47
46 Pisarski 2006 47 US Census Bureau American Community Survey 2006
28
Marylandrsquos Labor Supply
43 Marylandrsquos Educational Supply Pipeline
It is abundantly clear that an educated workforce is essential to Marylandrsquos economy While Marylandrsquos educational institutions produce a majority of the statersquos workers there is a substantial amount of ebb and flow of educated workers between Maryland and other areas Enrollment in Marylandrsquos educational institutions has risen greatly and is expected to continue to grow in the foreseeable future
As of the 2005-2006 academic year Maryland educational institutions yielded the following labor supply 56302 high school graduates 13715 Associatersquos degrees (or certificates) 25484 Bachelorrsquos degrees 13265 Masterrsquos degrees Another 1122 first professional degrees (ie lawyers) and 1363 Doctoral degrees
Not all of these graduates choose to remain and work in Maryland Conversely not all of Marylandrsquos labor supply comes from the statersquos higher educational institutions Survey estimates reveal that the vast majority (84 percent) of Marylandrsquos community college graduates were full-time Maryland workers at least one year after graduation The corresponding figures are 64 percent for those with Bachelorrsquos degrees and 57 percent for graduates of Marylandrsquos private career schools48 Marylandrsquos ability to connect a greater number of these graduates to local Maryland employers could help reduce the impact of worker shortages
Between 1994 and 2004 full-time undergraduate enrollment in Marylandrsquos four-year public colleges and universities grew by 25 percent and community college enrollment increased by 33 percent According to projections from the Maryland Higher Education Commission (MHEC) growth in full-time enrollment at public four-year institutions is expected to moderate to 17 percent between 2007 and 2016 Growth among full-time community college students is expected to drop to 21 percent over the same period These projections are driven by predicted demographic shifts They also account for the estimated impact of tuition increases as well as changes in per capita disposable income
Over the same period graduate enrollment among public educational institutions is expected to rise 10 percent for full-time students and 55 percent for part-time students49 Increases in part-time enrollment will continue to be driven by enhanced opportunities for distance learning and online courses offered by traditional universities as well as through programs such as the University of Maryland University College
48 Percentages refer to five-year averages based on information published in the Maryland Higher Education Commissionrsquos 2007 Trend Book 49 Maryland Higher Education Commission 2007
29
Marylandrsquos Labor Demand
50 Marylandrsquos Labor Demand
51 Industry Analysis
Between 2005 and 2006 Marylandrsquos aggregate economy expanded by 31932 employees or 13 percent The statersquos 25 million job holders enjoyed average weekly wages of $88750
Marylandrsquos rate of employment expansion during this period represents a deceleration from the 16 percent growth rate recorded between 2004 and 2005 Not only has Marylandrsquos rate of employment growth slowed but the state lags the nation according to recent quarterly employment data Marylandrsquos 14 percent expansion recorded between the second quarters of 2005 and 2006 ranks the state 27th in the nation and trails the 18 percent national average Just a few years ago in 2004 Maryland consistently ranked in the top 15 states according to this measure This trend of decelerating employment growth would be cause for greater concern if not for the anticipated influx of tens of thousands of jobs to Maryland by 2011 due to the BRAC decisions While the incoming jobs have the potential to grow Marylandrsquos employment base the challenge which Maryland is addressing actively is to fill the current and future need for workers RESI anticipates that the statersquos economy will register annual rates of employment growth in the mid-one percent range in both 2006 and 2007 While not spectacular this is by no means indicative of an economic downturn Still this trend of decelerating employment growth is an area analysts will be tracking closely in the near-term future
Figure V Employment Growth by WIA 2005 to 200651
Regional employment growth for the most recent period for which data are available (2005 to 2006) ranges from shy02 percent in Baltimore City to 33 percent in Mid-Maryland Other rapidly expanding WIA regions include the Lower Shore and Southern Maryland Employment in both of these areas expanded at a pace of more than 20 percent between 2005 and 2006
50 The 25 million employment figure (as well as the additional employment figures contained in this section of the analysis) refers to Bureau of Labor Statistics Quarterly Covered Employment amp Wage data This data represents employment by place of work data and is reported to the Bureau of Labor Statistics by the Maryland Department of Labor Licensing amp Regulation (DLLR) and includes all workers covered by the Unemployment Insurance (UI) Law of Maryland and the unemployment compensation for federal employees (UCFE) program This data series accounts for approximately 91 percent all civilian employment Excluded from this data are the self-employed 51 US Bureau of Labor Statistics Quarterly Census of Employment amp Wages (QCEW) Data
-05 00 05 10 15 20 25 30 35
Mid-Maryland Lower Shore
Southern Maryland Susquehanna
Anne Arundel Montgomery
Maryland Upper Shore
Baltimore County Frederick
Western Maryland Prince Georgersquos
Baltimore City
Employment Change
2005-2006
30
Marylandrsquos Labor Demand
Employment Composition
Approximately 180 percent of the statersquos aggregate economy falls within the public sector which is comprised of local state and federal governments As a whole the public sector grew at a 16 percent clip above the average for all major sectors and pays higher than average weekly wages of $1029 With employment just above 125000 in 2006 the federal government sector comprises 49 percent of the statersquos economy and pays average weekly wages of $1438 substantially higher than the average
The importance of the federal government to the statersquos economy cannot be underestimated The many federal laboratories and facilities located within and near Maryland such as Goddard Space Flight Center and the Naval Air Systems Command at Patuxent River have contributed greatly to Marylandrsquos aerospace industry The presence of the Food and Drug Administration (FDA) and the National Institutes of Health (NIH) has spurred growth among bioscience firms The National Security Agency and Marylandrsquos many military installations have been critical to building the statersquos base of defense-related businesses
Figure W Marylandrsquos Economic Composition 200652
1-YEAR CHANGE IN EMPLOYMENT SECTOR EMPLOYMENT
LEVEL ABSOLUTE PERCENT
WEEKLY WAGES
AGGREGATE ECONOMY 2529671 31932 13 $887 PUBLIC SECTOR 455820 7170 16 $1029
Local Government 233109 6978 31 $848 State Government 97530 826 09 $879 Federal Government 125181 -634 -05 $1438
PRIVATE SECTOR 2073851 24762 12 $856 Retail Trade 299508 906 03 $620
Healthcare amp Social Assistance 295006 8871 31 $737 Professional Scientific amp Technical Services 219155 5236 24 $1401 Accommodations amp Food Services 193278 -303 -02 $377
Construction 188357 5331 29 $926 Administrative amp Support amp Waste 157299 1275 08 $710
Manufacturing 136328 -4166 -30 $1700 Finance amp Insurance 109595 -379 -03 $1238 Wholesale Trade 94927 677 07 $1097 Other Services (Except Public Administration) 89612 466 05 $585 Educational Services 54007 -66 -01 $815 Transportation amp Warehousing 65867 2237 35 $863
Real Estate amp Rental Leasing 48004 -299 -06 $886 Information 50770 392 08 $1218 Arts Entertainment amp Recreation 36476 812 23 $644
Management of Companies amp Enterprises 17763 4199 310 $1696 Utilities 9711 -38 -04 $1709
52 RESI US Bureau of Labor Statistics Quarterly Census of Employment amp Wages (QCEW) Data
31
Marylandrsquos Labor Demand
Agriculture Forestry Fishing amp Hunting 5031 -128 -25 $573 Mining 1794 67 39 $884
Not Elsewhere Classified 1362 -327 -194 $1111
With employment in excess of 207 million the private sector comprises the lionrsquos share (820 percent) of Marylandrsquos economy One of the single largest private sector industries in the state is the Healthcare amp Social Assistance sector In 2006 employment in this sector expanded by 31 percent to just over 295000 employees Retail Trade Professional Scientific amp Technical Services and Accommodations amp Food Services also rank among the largest private sector employers within the state each employing a significant proportion of Maryland workers
Regional employment distributions across industries are fairly similar to that of the state as a whole with a few notable exceptions Both Southern Maryland (comprised of Calvert Charles and St Maryrsquos counties) and Frederick Prince Georgersquos and Montgomery counties boast high concentrations of public sector and especially federal government employment Federal government employment comprises 92 percent of Southern Marylandrsquos aggregate economy The collective share for Frederick Prince Georgersquos and Montgomery counties is 80 percent Montgomery and Frederick counties have the highest proportion of employment within Professional Scientific amp Technical Services in the state with shares of 140 percent and 135 percent respectively Western Maryland and the Upper Shore are home to a significantly higher proportion of Manufacturing employment with 113 and 123 percent respectively In both of these areas the share of Manufacturing employment is more than double that of the state as a whole
Western Maryland boasts the highest share of Transportation amp Warehousing employment (42 percent) This is reflective of the way Washington County in particular has been able to leverage successfully the regionrsquos excellent transportation infrastructure which includes access to three interstates (I-68 I-70 and I-81) and two railway lines (CSX Transportation and Norfolk Southern) to reinvent itself as a transportation hub Washington County currently is home to 151 Transportation amp Warehousing businesses including the Staples Distribution Center
Montgomery County leads the state in share of Information employment (33 percent) and boasts the highest concentration (15 percent) of employment within the Management of Companies amp Enterprises sector The Lower Shore employs a significantly large proportion of workers within the Accommodations amp Food Services sector Employment in this industry comprises 155 percent of the regionrsquos economy compared to just 76 percent for Maryland as a whole
32
Marylandrsquos Labor Demand
Among the fastest growing Maryland employment sectors are high wage sectors such as Professional Scientific amp Technical Services which expanded by more than 4900 positions or 23 percent between the third quarters of 2005 and 2006 Also growing quickly were Management of Companies amp Enterprises with growth of more than 4300 positions and Wholesale Electronic Markets amp Agents amp Brokers with growth of 2314 positions Each of these sectors pays weekly wages above $1300 well in excess of the $858 average for all Maryland industries Growth also is being led by Food amp Beverage Stores which expanded by 4543 jobs or 77 percent and the demographically driven Nursing amp Residential Care Facilities industry with growth of 3409 positions or 57 percent Specialty Trade Contractors also ranks high on the list
Figure X Top Employment Gaining Maryland Industries 2005Q3 ndash 2006Q353
RANK INDUSTRY EMPLOYMENTLEVEL 1-YEAR CHANGE IN
EMPLOYMENT ABSOLUTE PERCENT
WEEKLY WAGES
1 2 3 4 5 6 7
8 9
10
11 12 13 14 15
Professional Scientific amp Technical Services Food amp Beverage Stores Management of Companies amp Enterprises Nursing amp Residential Care Facilities Specialty Trade Contractors Ambulatory Healthcare Services Hospitals Wholesale Electronic Markets amp Agents amp Brokers Food Services amp Drinking Places Warehousing amp Storage Building Material amp Garden Equipment amp Supplies Dealers Transit amp Ground Passenger Transportation Clothing amp Clothing Accessories Stores Construction of Buildings Couriers amp Messengers
219324 63824 18065 63235
128225 95508 95046
12827 177052
10747
26550 8838
30520 45944 11393
4920 23 4543 77 4337 316 3409 57 2951 24 2635 28 2602 28
2314 220 2007 11
944 96
894 35 815 102 788 27 718 16 641 60
$1335 $465
$1421 $538 $850 $985 $896
$1434 $295 $762
$609 $457 $331 $966 $726
53 RESI US Bureau of Labor Statistics Quarterly Census of Employment amp Wages (QCEW) Data
33
Marylandrsquos Labor Demand
Industries rapidly shedding jobs are led by a mix of retail services and manufacturing sectors including General Merchandise Stores which contracted by more than 6900 positions or 127 percent between the third quarters of 2005 and 2006 Accommodations (loss of more than 2700 positions) and Insurance Carriers amp Related Activities (loss of 1116 positions) The latter industry pays weekly wages approaching $1200 well in excess of the $858 average for all Maryland industries Manufacturing sectors comprise five of the most rapidly declining industries including Computer amp Electronic Product Manufacturing Primary Metal Manufacturing Leather amp Allied Product Manufacturing Transportation Equipment Manufacturing and Wood Product Manufacturing Collectively these industries shed nearly 2600 jobs from the statersquos payrolls It is important to note that with the exception of Wood Product Manufacturing these contractions are concentrated within high-paying sectors
Figure Y Top Employment Losing Maryland Industries 2005Q3 ndash 2006Q354
RANK INDUSTRY EMPLOYMENT LEVEL
1-YEAR CHANGE IN EMPLOYMENT
ABSOLUTE PERCENT
WEEKLY WAGES
1 2 3 4
5 6 7 8
9 10 11 12 13 14 15
General Merchandise Stores Accommodations Insurance Carriers amp Related Activities Merchant Wholesalers Durable Goods Sporting Goods Hobby Book amp Music Stores Merchant Wholesalers Nondurable Goods Motion Picture amp Sound Recording Industries Motor Vehicle amp Parts Dealers Computer amp Electronic Product Manufacturing Miscellaneous Store Retailers Rental amp Leasing Services Primary Metal Manufacturing Leather amp Allied Product Manufacturing Transportation Equipment Manufacturing Wood Product Manufacturing
47619 24725 34577 52555
13161 29846 4489
38795
21786 18947 13595 3583
171 8314 3567
-6927 -127 -2729 -99 -1116 -31 -1066 -20
-1005 -71 -1002 -32
-695 -134 -659 -17
-653 -29 -634 -32 -544 -38 -533 -129 -489 -741 -465 -53 -445 -111
$365 $428
$1173 $1194
$395 $941 $444 $842
$1659 $425 $723
$1124 $911
$1164 $692
54 RESI US Bureau of Labor Statistics Quarterly Census of Employment amp Wages (QCEW) Data
34
Marylandrsquos Labor Demand
52 Base Realignment and Closure Commission (BRAC) Demand
The most recent round of BRAC decisions clearly will benefit Marylandrsquos economy and will result in thousands of new high-skill high-wage jobs moving into the state over the next five years However the anticipated influx of Department of Defense (DoD) and associated contractor positions ndash estimated at between 40000 and 60000 new jobs ndash presents its own set of challenges from a workforce development perspective
The BRAC legislation mandates that several DoD units (comprised of more than 15000 civilian DoD personnel) must move to Maryland by 2011 The extent to which current DoD employees will follow their jobs to Maryland is not clear Recent estimates indicate that between 30 and 50 percent of the civilian employees working at Fort Monmouth New Jersey plan to follow their jobs to Aberdeen55 Filling the gap with existing Maryland workers and recruiting new employees will present a significant workforce development challenge This challenge will undoubtedly escalate as existing civilian DoD workers approach retirement According to a report issued by the Pentagon in 2002 the average age of DoD employees is 452 years
The size and scope of the DoD units moving to Maryland as a result of BRAC could be influenced by future and current workforce availability In other words if jobs go unfilled they could very well be lost The challenge for workforce development officials is to ensure that Maryland gains as many potential BRAC jobs as possible The way to achieve this goal is to make sure that new positions are filled quickly Implementing an efficient security clearance process is one way to work toward this goal
Most important the Statersquos workforce development system must strive to ensure that Marylandrsquos labor pool is ready and able to fill the types of jobs that BRAC will bring to Maryland Both the Fort Monmouth and the Defense Information Systems Agency (DISA) units that are slated to move to Maryland report a high proportion of the following occupations
Electricalelectronics engineers Computer engineers Management and program analysts Computer scientists Information technology managers General engineers Telecommunications specialists
55 September 28 2007 presentation by Mark Fuhring Deputy Director of Human Resources CECOM Life Cycle Management Command
35
Marylandrsquos Labor Demand
These occupations require a Bachelorrsquos degree mainly in the engineering and sciences fields for entry-level positions For higher grade positions graduate education andor a combination of work experience is required Key skills associated with these positions include
Complex problem solving Critical thinking Judgment and decision making Systems evaluation56
Technology design57
There will be ancillary effects of BRAC to be considered as well Specifically the influx of BRAC personnel and contractors will drive significant construction activity and the demand for personal services The influx also will ramp up demand for services workers such as construction managers and workers day care workers and hospitality workers among others Community colleges in Harford and Anne Arundel counties already have begun to explore program needs associated with these occupations According to a report produced by RESI in 2006 for every direct on-base job58 job that comes to Maryland 196 additional spin-off jobs will be created59 This is an area that should be explored fully by workforce development professionals
53 Demand for Science Technology Engineering and Mathematics (STEM) Workers
In recent years upper-level degrees in science and engineering have been awarded to high proportions of foreign-born students According to the National Academy of Science 59 percent of US engineering doctorates were awarded to foreign students in 200360 In 2004 roughly 63 percent of the 147 doctoral degrees in engineering awarded by Maryland institutions went to foreign students including a small number of non-US citizens with permanent resident visa status and a much larger portion of non-US citizens with temporary visa status
This trend can benefit our economy since many foreign-born people with doctorates remain in the country to work at least for some period of time Americarsquos ratio of natural sciences and engineering degrees awarded to our college age population (57 per 100) severely lags that of Japan (8 per 100) Europe (8-13 per 100) and Taiwan and South Korea (11 per 100) Recent evidence indicates however that US institutions are facing greater competition from international schools for these students a concern noted in the Maryland Higher Education Commissionrsquos 2004 plan Increased immigration restrictions have not helped the situation In 2000 Asian universities awarded 12 million of the worldrsquos science and engineering degrees (undergraduate graduate and doctoral) while the US awarded just 500000
56 The US Department of Labor defines systems evaluation as follows Identifying measures or indicators of system performance and the actions needed to improve or correct performance relative to the goals of the system 57 Technology design is defined as Generating or adapting equipment and technology to serve user needs 58 Direct on-base positions include civilian DoD positions as well as embedded private defense contractors 59 RESI Maryland Department of Business amp Economic Development 2006 60 National Academy of Science p7 2007
36
Marylandrsquos Labor Demand
It should be noted that a 2005 Duke University study presents the US in a more competitive light61 The study notes that previously published figures on the number of engineering or computer science graduates for the US China and India are not necessarily comparable due to differences in the types of programs and program length etc According to Dukersquos findings when the number of degrees granted is normalized to account for population size (on a per one million citizen basis) the US generates 750 technology specialists compared to 500 produced by China and 200 produced by India
While the scope of the competition that US higher educational institutions currently face is debatable there is one point on which analysts agree national and local economies will face greater demand for scientists and engineers going forward Marylandrsquos demand for workers in these sectors will be exacerbated further by demographics (as many current workers approach retirement) and by the impacts of BRAC which will result in the movement of a significant number of science and engineering jobs to Maryland in the near future
According to this measure Maryland fares better than most states After all Maryland ranks second in the nation in our concentration of doctoral scientists and engineers62 as well as in our number of employed PhD scientists and engineers per 100000 workers (9385)63 We are home to a multitude of federal and university research labs and rank second in the nation in terms of federal research and development spending and first in terms of university research dollars64
Still given future demand growing our base of science and engineering degrees must remain a high priority
Various Maryland entities recognize this need including GWIBrsquos Aerospace Industry Steering Committee which recommended several initiatives aimed at promoting science technology engineering and mathematics (STEM) education in Maryland Among these is the recommendation for the creation of a STEM Center of Excellence as well as the development of articulation agreements between high school pre-engineering programs and college programs Industry internships and mentorships also are identified as a means to grow Marylandrsquos supply of scientists and engineers
The Maryland State Department of Education (MSDE) also is well aware of the need for more scientists and engineers and began implementing Project Lead the Way (PLTW) in 2003-2004 PLTW is a pre-engineering program which aims to increase preparation among high schools students for higher education engineering programs Forty-three (43) Maryland high schools in 16 school systems participate in the program which allows students to enroll in such courses as Principles of Engineering Computer Integrated Manufacturing Civil Engineering and Aerospace Engineering Maryland recently received the Joseph H Oakley Excellence in Education Award for its PLTW progress Maryland also will be piloting the newly-launched PLTW for the biomedical sciences curriculum An aerospace PLTW program also is in the planning stages
61 Duke University 2005 62 National Science Foundation 2003 63 National Science Foundation State Science amp Technology Institute 2003 64 Maryland Higher Education Commission 2004
37
Marylandrsquos Labor Demand
Another MSDE program that focuses on this area is the Super Stem Project which partners higher education (the University of Maryland Baltimore County) with the Baltimore County Public Schools and MSDE The program is funded by the National Science Foundation and targets improving student achievement teacher quantity and quality specifically within STEM programs
54 The Demand for Basic and Applied Skills
The Conference Board in collaboration with several other organizations conducted a survey of US firms in 2006 to determine how employers rate new entrants to the workforce65 The results were not positive Overall employers do not consider recent graduates (high school graduates as well as graduates of two- and four-year institutions) to be adequately prepared for the workforce Specifically firms identified the following shortcomings among these populations
Figure Z Deficiencies of New Entrants to the US Workforce as Specified by Employers66
High School Graduates are bull ldquoDeficientrdquo in the basic knowledge and skills of Writing in English Mathematics and Reading Comprehension bull ldquoDeficientrdquo in Written Communications and Critical ThinkingProblem Solving
both of which may be dependent on basic knowledge and skills bull ldquoDeficientrdquo in ProfessionalismWork Ethic and bull ldquoAdequaterdquo in three ldquovery importantrdquo applied skills Information Technology Application
Diversity and TeamworkCollaboration Two-Year and Four-Year-College Graduates are bull Better prepared than high school graduates for the entry-level jobs they fill bull ldquoDeficientrdquo in Writing in English and Written Communications and bull ldquoDeficientrdquo in Leadership
65 The Conference Board 66 The Conference Board p11
38
Marylandrsquos Labor Demand
GWIBrsquos Industry Monograph for Marylandrsquos Hospitality amp Tourism Industry confirms these findings The GWIB report identifies a critical mismatch between the ldquojob-readinessrdquo or basic skills required for the majority of occupations within the sector and the skill levels of new entrants to the field The majority of occupations within this sector require basic skills and on-the-job training In fact only one occupation out of 35 requires a Bachelorrsquos degree or higher (General and Operational Managers) Yet for the balance of occupations employers are having difficulty finding workers with good active listening skills service orientation and cultural awareness and sensitivity Finding job entrants with the ability to read write and understand standard and spoken English also is a critical priority for the industry To address these issues the report recommends creating a statewide resource network to advance basic skills and to support tax incentives for worker training in English as a Second Language among other recommendations
According to occupational projections updated by the Maryland Department of Labor Licensing amp Regulation (DLLR) the top four occupations in which we expect to see the greatest level of replacement openings between 2004 and 2014 include67
Cashiers (33780 replacement openings) Retail salespersons (31670) Waiters and waitresses (21585) Combined food preparation and serving workers (17035)
This list is not surprising as these occupations have been associated traditionally with limited career paths and high turnover rates However this list also brings the issue of basic skills to the forefront Not only do these occupations rank high in terms of projected turnover they also lead the state in terms of total projected job openings between 2004 and 2014 Using US Department of Labor occupational data (ONET)68 one can determine that these occupations require basic skills (as defined by the Department of Labor) such as active listening speaking writing and reading comprehension
The Conference Board also indicates that while both basic skills and applied skills69 are paramount for new entrants to the workforce applied skills tend to be rated as the most critical 21st century skills employers are seeking The four top-rated skills are considered to be applied skills according to the study They include (1) ProfessionalismWork Ethic (2) Oral and Written Communications (3) TeamworkCollaboration and (4) Critical ThinkingProblem Solving
67 Maryland Department of Labor Licensing amp Regulation Office of Workforce Information and Performance and Office of Labor Statistics 2007 68 The US Department of Laborlsquos online information system (ONET) The ONET online system provides occupational information as well as information on key attributes and characteristics of workers and occupations 69 Examples of basic skills noted in the study include reading comprehension spoken and written English mathematics science knowledge of a foreign language etc Applied skills include lifelong learningself direction creativityinnovation leadership etc
39
Looking Ahead Identifying Gaps Challenges and Opportunities
60 Looking Ahead Identifying Gaps Challenges and Opportunities
61 The Gap between Marylandrsquos Jobs and Labor Supply is Growing
The gap between the size of Marylandrsquos labor force and the statersquos inventory of jobs is widening70 The number of jobs in Maryland has outnumbered the statersquos resident labor force for several decades In 1970 the gap was roughly 46000 By 1990 this figure had more than doubled to nearly 120000 By 2020 this gap is expected to exceed 528000 The situation is not as dire as it appears to be on the surface since workers residing in neighboring states will continue to fill some portion of these jobs however the widening gap certainly will translate into greater competition for available labor
Figure AA Historic and Projected Maryland Resident Labor Force and Jobs by Place of Work71
Labor Force Number of Jobs
4000000
3500000
3000000
2500000
2000000
1500000
1000000
1970 1980 1990 2000 2010 2020 2030
Lab
or F
orce
Jo
bs
After 2010 labor force growth is expected to slow Between 2010 and 2020 for example the statersquos labor force is expected to increase by roughly 200000 (down from expected growth of more than 360000 over the previous decade) Much of the anticipated slowdown in labor force growth is attributable to the graying of our population For years experts have been anticipating the dramatic ways in which our aging workforce will affect national state and local economies The implications of this megatrend are enormous They range from the need for employers to adapt to increasing generational diversity and generational differences in the workplace to the need for companies to ensure that knowledge and skills are retained as older workers retire Maryland must confront the impacts of these demographic shifts along with the rest of the nation
70 The Maryland Department of Planning projects jobs by place of work using historical data released by the Bureau of Economic Analysis These are jobs which are located in Maryland but are filled by both state and non-state residents The statersquos resident labor force also is projected by the Maryland Department of Planning based on historical Bureau of Economic Analysis data Projections were updated in November 2006 71 Maryland Department of Planning November 2006
40
Looking Ahead Identifying Gaps Challenges and Opportunities
The following chart details Marylandrsquos historical current and projected labor force composition by age The proportion of adults age 55 years old and older who are active in the workforce is projected to increase from roughly 12 percent in 1990 to 26 percent by 2020 The proportion of Marylandrsquos workforce comprised of adults age 35 to 54 years old on the other hand is expected to decrease from 43 percent to 39 percent over the same period As previously mentioned this trend is due to the graying of the population ndash there are simply fewer people making up Generations X and Y compared to the size of the baby boomer generation
Figure AB Historic and Projected Proportion of Marylands Labor Force by Age72
Perc
ent o
f Lab
or F
orce
00
100
200
300
400
500
600
1990 2000 2010 2020 2030
16-34
35-54
55+
72 Maryland Department of Planning 2006
41
Looking Ahead Identifying Gaps Challenges and Opportunities
62 The Race to Preserve Institutional Knowledge
The impacts of Marylandrsquos aging population are not limited simply to the issue of filling jobs Shifting demographics and the approaching retirement of older workers will place increased pressure on firms to preserve institutional knowledge Simply put companies and industry are scrambling to prevent ldquobrain drainrdquo for good reasons
The dearth of qualified nuclear engineers and related workers illustrates this issue perfectly According to the Nuclear Energy Institute (NEI) the US nuclear industry faces a critical shortage of workers by 2010 In fact NEI finds that less than eight percent of industry employees are younger than 32 years of age and more than half are age 47 or older Expected shortages will affect a broad cross section of occupations within the industry ranging from health physicists and plant operators to technicians welders and maintenance workers73 The timing is especially problematic as the Nuclear Regulatory Commission expects an influx of applications for nearly three dozen new reactors by 2008 including Constellation Energy Grouprsquos application to build a new nuclear reactor at Calvert Cliffs74 Clearly industry and workforce development professionals must ensure that institutional knowledge within this critical industry is preserved and a sufficient pipeline of future workers is developed
The nuclear engineer example is not an isolated case According to findings from GWIBrsquos Aerospace Industry Initiative Workforce Summit conducted in January 2006 50 percent of the aerospace workforce in Maryland is expected to retire in the next 15 years A 2002 Accenture publication notes that ldquoThe vast majority of US and European chemical companies are concerned about problems posed by their aging workforce Estimates that 50 percent of employees will become retirement eligible in a particular function in the next decade are not uncommon in the US and Europerdquo75 Marylandrsquos Educational Services sector which already is feeling the impact of critical shortages ranks among those industries with a high proportion of older workers (roughly 18 percent are age 55 plus)76 The Healthcare sector is another that has begun to feel the impact of an aging workforce In 1998 nearly 24 percent of Marylandrsquos registered nurses working in hospitals were between the ages of 48 and 57 years old and another 19 percent were over the age of 58 By 2005 these proportions had grown to 28 and 25 percent respectively77 According to GWIBrsquos Healthcare Workforce Summit monograph vacancy rates in 2002 for registered nurses (156 percent) radiation therapy technicians (211 percent) and licensed practical nurses (129 percent) at Maryland hospitals already are high The issue of brain drain and shortages undoubtedly will be compounded as the demand for healthcare services increases due to the graying of the population78
73 Nuclear Energy Institute 2007 74 Baltimore Sun Constellation Energy files partial plan for reactor July 31 2007 75 DeLong page 3 76 Carroll 2004 77 Maryland Board of Nursing 78 One recommendation developed from GWIBrsquos Healthcare Workforce Summit involves transitioning retired military personnel to the private sector Many of these personnel have accumulated vast experience and training but lack proper certification ProVET (Providing Re-employment Opportunities to Veterans) is one program Maryland has launched in recent years to provide transition assistance for those veterans who are interested in securing private sector employment
42
Looking Ahead Identifying Gaps Challenges and Opportunities
63 FacultyTeacher Shortages
It is not the intention of this analysis to minimize the significance of labor shortages already occurring in Maryland industry sectors ndash for example that of registered nurses and other healthcare professionals However given that much already has been written about these shortages this analysis instead targets the issue of faculty shortages
Marylandrsquos need for teachers outstrips the statersquos ability to produce and retain them In 2005 school systems throughout the state hired roughly 8000 teachers of which 4350 were beginning new hires Only one-third (1439) of the beginning new hires had graduated from Maryland colleges and universities
Particular subjects facing current and future shortages include Technology education Computer science English for Speakers of other Languages Foreign languages Mathematics Science Special education
The issue of faculty shortages extends to higher education as well and is affecting a range of Maryland industries including the healthcare sector As noted in GWIBrsquos HealthCare Monograph ldquothe amount of faculty and learning facilities is inadequatehelliprdquo to train the statersquos healthcare workforce These shortcomings are evidenced by student waiting lists at local nursing schools79 Indeed nursing programs both locally and nationally report an increase in the number of qualified nursing applicants being turned away due to a dearth of faculty and classroomclinical space In 2005 the number of applicants denied admission due to a lack of faculty or classroom and clinical space jumped to 29424 nationally and 1850 in Maryland
According to a 2005 survey80 the statersquos 24 nursing degree programs reported that 305 percent of full-time faculty positions were vacant Local shortages are attributed to both the aging of the statersquos faculty population as well as the difficulties in growing the pool of potential educators These difficulties range from structural barriers like limited local capacity of graduate programs in nursing education to market-driven trends (eg compensation for practicing nurses often exceeds that for nursing educators) These trends undoubtedly will be exacerbated as Marylandrsquos nursing faculty population continues to age and approach retirement The average age of nursing faculty at Maryland institutions as reported to the Board of Nursing in 2005 ranges from 42 to 55 years and nationally the average age of faculty retirement is 625 years81
79 Charting New Directions Governorrsquos Healthcare Workforce Summit page 13 80 Maryland Council of Directors of Associate Degree and Baccalaureate Programs Survey 81 Nursing Faculty Shortage Causes Effects and Suggestions for Resolution Maryland Statewide Commission on the Crisis in Nursing 2005
43
Looking Ahead Identifying Gaps Challenges and Opportunities
64 Increasing Age Diversity
Business and industry also will need to accommodate increased age diversity in the workplace According to a 2005 Forbes magazine article ldquoEmployers need to examine whether their policies programs and practices are age neutral For example is the company offering dependent care geared only toward children when the workforce may be at an age where elderparent care has more valuerdquo82
Adjusting to differences in generational attitudes and preferences in the workplace will present its own set of challenges For instance the chemical industry has become accustomed to low voluntary turnover among managers and professionals As younger generation workers (Generation X and Y in particular) replace retirees the industry will need to adapt to an increased tendency for voluntary attrition as these workers tend to be more willing to seek out better job opportunities83 Many today consider employee loyalty to be a thing of the past especially among todayrsquos younger workers who are perceived to be constantly on the prowl for bigger and better opportunities
The aging of our population also has implications for education As the age of students at postshysecondary educational institutions rises and as workers continue to pursue lifelong learning campuses and faculty increasingly will require additional flexibility in terms of location timing etc MHEC recognized this need in their 2004 plan and set a goal to enhance alternative approaches for educational delivery ndash namely distance learning and regional higher education centers The Statersquos academic institutions already have begun to respond to these needs as evidenced by institutional expansion to satellite campuses the expansion of 2+2 programs84 and increased investments in and access to distance learning programs that are part of Marylandrsquos higher education system
65 Immigrants Continue to Grow Marylandrsquos Labor Supply
Marylandrsquos workforce is expected to benefit from international migration at both ends of the employment spectrum as immigrants fill low-wage low-skill jobs as well as high-wage high-skill positions Low-skill jobs such as Combined Food Preparation amp Serving Workers for example continue to rank among the top occupations demanded in Maryland According to data published by the Urban Institute immigrants comprise a disproportionately high share (20 percent) of low-wage workers in the US Immigrant workers represent an especially large proportion of low-wage occupations within the farming and private household sectors According to 2002 estimates immigrants compose 37 and 42 percent of employment in these sectors respectively85 The Pew Hispanic Center reports that short-term unauthorized immigrants are concentrated heavily in the low-wage construction (including building and
82 Reeves 200583 Accenture Institute for Strategic Change 2002 84 2+2 is a program in which the first two years of post-secondary education are completed at a community college and the remainder is completed at a partner four-year institution85 Capps 2003
44
Looking Ahead Identifying Gaps Challenges and Opportunities
grounds cleaning and maintenance occupations) and hospitality industries (including food preparation and service occupations)86
GWIBrsquos Hospitality and Tourism monograph reveals the importance of this workforce to local industry The report documents Marylandrsquos reliance on immigrant workers seasonal and otherwise to fill a variety of occupations within this sector ranging from food service occupations such as bartenders hosts and hostesses cooks dishwashers and food preparation workers to grounds keeping workers desk clerks receptionists maids and housekeeping cleaners and security guards etc The report finds that the need for these workers outstrips supply The limited number of H-2B worker visas which allow for the temporary hiring of foreign workers granted to Maryland businesses is not enough to fill the vacant positions
Other immigrant segments are expected to continue to fill high-wage high-skill jobs in such occupations as scientists and engineers The Migration Policy Institute analyzed Census 2000 data and found that one out of every five doctors in the US is foreign born Two of every five medical scientists one of every five computer specialists and one of every six people in the engineering or science fields are foreign born In addition the proportion of foreign-born workers in other skilled fields such as nursing has grown significantly in recent years a trend which is expected to continue87
86 Pew Hispanic Center 2006 87 Kaushal 2006
45
Looking Ahead Identifying Gaps Challenges and Opportunities
0
20000
40000
60000
80000
100000
120000
1980 1990 2000Peop
le W
ho S
peak
Eng
lish
Not
Wel
l o
r N
ot a
t All
Figure AC Maryland Population Who Speak English ldquoNot Wellrdquo or ldquoNot at Allrdquo
From a workforce development perspective the movement of immigrants into Maryland will require increased investment in English as a Second Language (ESL) programs According to the decennial census data the percentage of people who reported to the Census Bureau that they spoke English ldquonot wellrdquo or ldquonot at allrdquo increased nearly 74 percent since 1990 (Figure AC) Of the more than 246000 persons who indicated that they spoke English ldquoless than very wellrdquo 44
percent reported Spanish as their native language while another 26 percent indicated an Asian language (particularly Korean Chinese and Vietnamese) as their native language Much of this population represents non-English speaking immigrants who present new challenges in terms of labor force training and education Recognizing this need organizations such as US Hispanic Youth Entrepreneur Education (USHYEE) in partnership with the Maryland State Department of Education (MSDE) and colleges and universities within the state are working together to provide Hispanic youth with scholarships along with technical and life skills that will encourage this segment of the population to seek higher education opportunities
The statersquos growing immigrant population has the potential to fill another significant role in Marylandrsquos economy As commerce and industry become more global knowledge of a foreign language is becoming increasingly critical to local businesses In fact a recent survey of US employers confirms that speaking a foreign language is expected to be a highly demanded skill in the 21st century Survey results indicate that while only 11 percent of employers currently rate this skill as ldquovery importantrdquo approximately two-thirds indicate that knowledge of a foreign language will increase in importance over the next five years In fact knowledge of a foreign language was singled out as the top basic skill expected to increase in importance88 In 2005 145 percent of Marylanders age five and older spoke a language other than English at home89 a trend that clearly will benefit the state in its efforts to meet foreign language needs
88 The Conference Board p11 89 US Census Bureau American Community Survey 2005
46
Looking Ahead Identifying Gaps Challenges and Opportunities
66 Adult Education and Engaging Workers with Barriers to Employment
Todayrsquos jobs and the jobs of tomorrow will require an increasingly complex array of skills including but not limited to verbal mathematical organizational and interpersonal skills This further complicates matters for the one million potential Maryland workers who have barriers to employment They include Marylandrsquos veteran population people with lower literacy ex-offenders people with disabilities and those receiving unemployment insurance benefits90
Preparing these workers for the jobs of the future presents another challenge for the Statersquos workforce development system As previously mentioned these populations are a potentially untapped labor supply If workforce development professionals can help this population transition more fully into the workforce tight labor market conditions may be alleviated
Veterans Population
As of 2005 more than 427000 people or 119 percent of the statersquos population 18 and over were veterans The vast majority of Maryland veterans (89 percent) are male Not surprisingly female veterans tend to be younger than their male counterparts A total of 776 percent of female veterans are between 18 and 54 years of age compared to 372 percent of male veterans91
Ex-Offenders
The number of offenders released from Maryland Department of Public Safety and Correctional Services facilities in 2006 approached 14000 Approximately six out of 10 or 8685 people were released in Baltimore City As of April 2007 nonviolent offenders constituted 426 percent of the nearly 23000 inmates housed in Maryland facilities More than 20 percent of this population is age 25 or under and another 171 percent are between 25 and 30 years of age Nearly 3400 of them or 149 percent of this population are serving a sentence of 36 months or less
Transitioning ex-offenders into the workforce is critical not only from a workforce development perspective but from a public safety perspective as well To the extent that this population can become engaged in the workforce the likelihood of recidivism is expected to decline
Lower Literacy Population
According to a report released recently by the US Department of Education roughly 206 percent of Marylandrsquos adult population (or 730000) was eligible for adult education services as of 2000 This population includes individuals who ldquolack sufficient mastery of basic educational skills to enable the individuals to function effectively in societyrdquo lack a high school diploma or equivalent or (are) ldquohellipunable to speak read or write the English languagerdquo Specifically this
90 Examples of other population segments that could be targeted include homeless persons welfare recipients and youth out of school among others 91 US Census Bureau American Community Survey 2005
47
Looking Ahead Identifying Gaps Challenges and Opportunities
population includes those adults age 16 or older who lack a high school diploma and who are not enrolled in school and adults who speak English as a second language and who have rated their ability to speak English as ldquowellrdquo ldquonot wellrdquo or ldquonot at allrdquo92
The vast majority of this adult education population (601 percent) is of working age (from 16 to 59 years old) yet in 2000 well over half of them (348717 persons) did not participate in the statersquos labor force Another 28484 reported they were unemployed Basic literacy and English as a Second Language instruction is needed to help transition this group more fully into the workplace More than 105000 of Marylandrsquos adult education population speak English as a second language and nearly half of this group (51952) identify themselves as speaking English ldquonot wellrdquo or ldquonot well at allrdquo93
People with Disabilities
Maryland is home to more than 376000 working age (from 16 to 64) people with disabilities Only about 43 percent of these people are employed compared to 78 percent for the remainder of the statersquos working age population94 The low employment rate for people with disabilities combined with the fact that many of them can become employed with or without accommodations are reasons that the GWIB views people with disabilities as an untapped workforce
Unemployed Persons and Persons Receiving Unemployment Insurance Benefits
As of August 2007 the number of unemployed Marylanders is on track to approach last yearrsquos level of roughly 116000 persons This population includes people who are not working but who are actively seeking work They are counted as part of Marylandrsquos labor force Though the number of unemployed people in Maryland has been on the decline since 2004 they still represent a substantial potential labor pool
More than 18000 initial unemployment claims were filed in Maryland in June 2007 The extent to which the State can link these persons with employment opportunities will help to decrease the number of people filing for initial and continuing unemployment insurance claims and will help increase Marylandrsquos available labor pool
92 US Census Bureau Profiles of the Adult Education Target Population Information from the 2000 Census December 2005 93 US Census Bureau Profiles of the Adult Education Target Population Information from the 2000 Census December 2005 94 US Census Bureau 2006 American Community Survey
48
Recommendations
70 Recommendations
This section of the analysis highlights a number of emerging challenges that will test the statersquos economic and workforce strengths over the next one to five years and provides priority recommendations to address these challenges
71 Science Technology Engineering and Mathematics (STEM) Industries are Struggling to Attract Recruit and Retain Workers
As in other industries many of Marylandrsquos science technology engineering and mathematics (STEM) industries face a looming retirement cliff as skilled baby boomers begin to retire and leave the workforce Compounding the problem is anecdotal and other evidence which suggests that the pool of qualified technical students graduating from college is actually diminishing The statersquos aerospace industry serves as a prime example According to the GWIB Aerospace Industry Steering Committee in 2006 nearly eight out of every 10 Maryland aerospace workers was age 51 or over and 50 percent of the current aerospace workforce is set to retire by 2020
Recommendation Increase opportunities for young people to become aware of and enter science technology engineering and mathematics (STEM) careers
One way to meet the need for workers in science technology engineering and mathematics (STEM) careers is to expand middle- and high school-level studentsrsquo interaction with STEM professionals through expanded internship and mentorship programs GWIBrsquos Aerospace Monograph also identifies the need to encourage STEM-related field trips and other applied activities and to invite industry professionals to classes or school activities The Johns Hopkins Universityrsquos Applied Physics Labrsquos (APL) Mentor Program is a perfect example of such interaction The program is conducted in conjunction with the Howard County Public Schools and other nearby schools and pairs high school students with volunteer APL professional staff The program enables students to work on science projects with their mentors during the school year
Encouraging qualified underrepresented population segments (ie females and minorities) to pursue studies in science and mathematics is another way to boost interest APL and a number of university partners are involved in a program that targets this issue The Maryland Mathematics Engineering Science Achievement program (MESA) is a pre-college program in which MESA partners work directly with teachers and schools in order to encourage K-12 interest in STEM fields The program targets minorities and females
Recommendation Expand and enhance pre-college programs such as Project Lead the Way
Expanding programs such as MSDErsquos Project Lead the Way (PLTW) is another approach PLTW is a pre-engineering program which aims to increase preparation among high school students for higher education engineering programs Forty-three (43) Maryland high schools in 16 school systems participate in the program which allows students to enroll in such courses as Principles of Engineering Computer Integrated Manufacturing Civil Engineering and
49
Recommendations
Aerospace Engineering Maryland soon will pilot the newly-launched PLTW for a biomedical curriculum An aerospace PLTW program also is in the planning stages
72 Maryland Continues to Face Growing Teacher and Faculty Shortages
The state continues to confront shortages among teachers and faculty Marylandrsquos need for teachers outstrips our ability to produce and retain them In 2005 roughly 8000 new teachers were hired in the state of Maryland Of the 4390 teachers who were new hires only 1439 (33) were graduates of Maryland colleges and universities95 Subjects with current and future teacher shortages include technology education computer science English for Speakers of other Languages foreign languages mathematics science (including physical science physics chemistry and earthspace science) and special education
The issue of faculty shortages extends to higher education as well and is affecting a number of Maryland industries including the healthcare sector As noted in GWIBrsquos HealthCare Monograph ldquothe amount of faculty and learning facilities is inadequatehelliprdquo to train the statersquos healthcare workforce These shortcomings are evidenced by student waiting lists for local nursing schools96 Nursing programs both locally and nationally report an increase in the number of qualified nursing applicants being turned away due to a dearth of faculty and classroomclinical space In 2005 the number of applicants denied admission for these reasons totaled 29424 for the nation and 1850 in Maryland
According to a 2005 survey97 Marylandrsquos 24 nursing degree programs reported that 305 percent of full-time faculty positions were vacant Local shortages can be attributed to both the aging of the statersquos population as well as difficulties in growing the pool of potential educators These difficulties range from structural barriers such as the limited local capacity of graduate programs in nursing education to market-driven trends (eg compensation for practicing nurses often exceeds that for nursing educators) These trends will undoubtedly be exacerbated as Marylandrsquos nursing faculty population continues to age and approach retirement The average age of nursing faculty at Maryland institutions as reported to the Board of Nursing in 2005 ranges from 42 to 55 years and the average age nationally for faculty retirement is 625 years98
Recommendation Enhance teacher retention through the expansion and enhancement of Professional Development School (PDS) networks
It appears that facultyteacher retention especially at the primary and secondary levels can be improved through access to quality Professional Development School (PDS) networks One example is Towson Universityrsquos PDS network which has been recognized at both the state and national levels as a successful model that relies on a partnership between a college or university and local school systems PDS networks aim to enhance and improve teacher quality through
95 Maryland State Department of Education 2006 96 Charting New Directions Governorrsquos Healthcare Workforce Summit page 13 97 Maryland Council of Directors of Associate Degree and Baccalaureate Programs Survey 98 Nursing Faculty Shortage Causes Effects and Suggestions for Resolution Maryland Statewide Commission on the Crisis in Nursing 2005
50
Recommendations
continuous professional development The network targets all stages of a teacherrsquos career offering professional development activities throughout the entire career An analysis of Towson Universityrsquos PDS network in 2001 showed that its teacher-graduates were retained at a much higher rate than other new teachers According to the study schools within the PDS network were associated with teacher retention rates of 80 percent after four years and 71 percent after five years This compares to non-PDS network retention rates of 45 and 34 percent respectively99
73 Marylandrsquos Growing Immigrant Population Opportunities and Challenges
Population shifts are impacting the demographic makeup of the state in ways that will have dramatic impacts on employer needs and workforce development Between 2000 and 2006 immigrants accounted for more than half (516) of Marylandrsquos population growth As of 2006 immigrants account for 12 of the statersquos population
Marylandrsquos workforce is expected to benefit from international migration at both ends of the employment spectrum as immigrants fill low-wage low-skill jobs as well as high-wage high-skill positions From a workforce development perspective this movement into Maryland will require increased investment in English as a Second Language (ESL) programs According to decennial census data the percentage of people who report to the Census Bureau that they speak English ldquonot wellrdquo or ldquonot at allrdquo has increased nearly 74 percent since 1990 Much of this population represents non-English speaking immigrants who present new challenges in terms of labor force training and education
Despite the pressing need for adult literacy services in Maryland demand continues to severely outstrip supply According to MSDE funding constraints dictate that a small percentage of annual demand is being met resulting in annual waiting lists of up to 5000 people Many of the people on waiting lists (47 percent) are waiting for access to ESL programs100
Recommendation Enhance and expand access to community English as a Second Language (ESL) programs
Not only is there a need for improved access to English as a Second Language programs but MSDE also notes the need to improve the quality of the statersquos ESL programs In 2005 Marylandrsquos adult education programs offered 40 hours of instruction per student which is not adequate for beginner or even intermediate English learners to become proficient Many of these ESL students lack advanced literacy skills in their native language and thus require additional intensive classroom time MSDE notes that a program that offers more than 100 hours of classroom time would better meet the needs of this population
Recommendation Enhance and support initiatives and partnerships that encourage a broad spectrum of education opportunities for immigrant populations
99 Pilato Maryland State Department of Education 100 Maryland State Department of Education December 2005
51
Recommendations
Many of Marylandrsquos foreign-born workers are highly educated and possess applicable skills however many of Marylandrsquos immigrants are at the opposite end of the educational spectrum As of 2006 43 percent of Marylandrsquos immigrants held at least a Bachelorrsquos degree compared with 34 of US natives in Maryland At the same time 18 of immigrants in Maryland did not have a high school diploma or its equivalent compared to 12 of US born Maryland residents101
Organizations such as US Hispanic Youth Entrepreneur Education (USHYEE) in partnership with MSDE and colleges and universities within the state are working together to provide Hispanic youth with scholarships along with technical and life skills that will encourage this segment of the population to seek higher education opportunities
Recommendation Coordinate efforts to promote Marylandrsquos access to seasonal immigrant (H-2B) and skilled immigrant (H-1B) workers102
Seasonal immigrant worker shortages have adversely affected Maryland businesses for some time In 2005 the national cap of 66000 H-2B visas which allow foreign nationals to temporarily enter the US and take advantage of seasonal or peak load employment opportunities was filled just a few months into the federal fiscal year As a result the lionrsquos share of Maryland businesses were prevented from applying for the estimated 7000+ temporary workers needed to sustain Marylandrsquos seasonal businesses A diverse group of Maryland industries are affected by the seasonal worker shortage including tourism and hospitality-driven businesses and agriculture and seafood processing firms as well as other types of service firms such as landscaping businesses
The State has recognized the importance of this issue In fact local political leaders continue to be actively involved in drafting legislation to increase the national cap and exempt returning seasonal workers from being subject to it GWIBrsquos Hospitality amp Tourism Monograph emphasizes Marylandrsquos need for seasonal immigrant workers and recommends that a state liaison office for immigration issues be established The GWIB report notes that in addition to being actively involved in immigration policy and advocacy the liaison office could work to connect foreign-born workers with Maryland businesses in need of temporary workers
A liaison office also could coordinate efforts to increase the availability of H-1B workers The H-1B visa program targets highly-skilled internationals who work in professional fields such as computing finance law and healthcare among others The national cap for H-1B visas has fluctuated in recent years jumping from 65000 in the late 1990s to 195000 in 2000 and then dropping back to 65000 in fiscal year 2003 As with H-2B visas annual quotas are met early in the year According to the Migration Policy Institute one out of every five doctors in the US is foreign born Two of every five medical scientists one of every five computer specialists and
101 US Census Bureau 2006 American Community Survey calculations based upon Maryland residents age 25 and over 102 It should be noted that this recommendation in no way advocates filling BRAC and other positions which require security clearances with H-1B and H-2B workers Given security clearance requirements filling these jobs with foreign nationals is simply not possible
52
Recommendations
one of every six persons in engineering or science fields are foreign born Given current and expected shortages among the science engineering technology and mathematics (STEM) fields it makes sense to explore expanding the H-1B visa option
74 The Need for Increased Labor Force Participation
The statersquos low jobless rate (39 percent in 2006) signifies not only that Marylandrsquos economy is healthy but also that local labor market conditions remain tight Most economists agree that an unemployment rate in the range of 35 to 45 percent is indicative of an economy operating at full employment and Marylandrsquos jobless rate continues to fall within that range In fact the state has not recorded an unemployment rate above the 45 percent mark since July 2003
Tight labor market conditions have the potential to aggravate labor shortages and apply upwards pressure on wages Since nearly one-sixth of Marylandrsquos existing labor force is expected to retire in the next decade these conditions are likely to worsen going forward Continued local labor supply shortages makes leveraging our underutilized and potential labor supply all the more important There is an opportunity to address this issue by tapping adult population segments that are underrepresented in the workforce including veterans ex-offenders and the statersquos disabled and lower literacy populations
According to a report released recently by the US Census Bureau roughly 175 percent of the statersquos adult population (or nearly 618000 persons) was eligible for adult education services as of 2000 This population includes individuals who ldquolack sufficient mastery of basic educational skills to enable the individuals to function effectively in societyrdquo103 Specifically this population includes those adults age 16 or older who lack a high school diploma and who are not enrolled in school In order to more fully integrate them into the statersquos labor force we need to expand access to basic literacy instruction GED services and English as a Second Language (ESL) classes
Recommendation Enhance opportunities for adult education (ie basic literacy GED services and ESL classes)
Despite the pressing need for adult literacy services demand continues to severely outstrip supply According to MSDE funding constraints dictate that only three to five percent of annual demand for these services is being met resulting in annual waiting lists of up to 5000 people The majority of those on waiting lists include people seeking ESL instruction and Adult Basic Education (ABE) If the State can increase the availability of these educational programs Marylandrsquos economy will benefit
103 US Census Bureau Profiles of the Adult Education Target Population Information from the 2000 Census December 2005
53
Recommendations
Recommendation Future study is necessary to identify the education and related needs of additional adult population segments
While the needs of Marylandrsquos lower literacy population have been identified there exists a lack of comprehensive information on other population segments which may not be participating fully in the statersquos workforce A thorough study is needed to identify the demographic economic and social characteristics of each Maryland population segment (ie veterans ex-offenders disabled population etc) With this information the education and hard or soft skill levels of these populations could be identified in addition to the identification of barriers preventing them from participating more fully in the workplace A synthesis of this information also would help to identify specific occupations that could serve as an entreacutee to career tracks for each of these population segments
Recommendation Create a statewide resource network to advance basic skills
Basic skills are in demand In fact the Maryland Department of Labor Licensing amp Regulation projects that the top four occupations expected to see the greatest level of replacement openings between 2004 and 2014 include104
Cashiers (33780 replacement openings) Retail salespersons (31670) Waiters and waitresses (21585) Combined food preparation and serving workers (17035)
These occupations require such basic skills as active listening speaking writing and reading comprehension
A recent GWIB report targeting Marylandrsquos Tourism amp Hospitality sector identifies a critical mismatch between the ldquojob-readinessrdquo or basic skills required for most occupations in the sector and the skill levels of new entrants to the field The majority of occupations in this sector require basic skills and on-the-job training yet employers are having difficulty finding workers with good active listening skills service orientation and cultural awareness and sensitivity Finding job entrants with the ability to read write and understand standard and spoken English also is a critical priority for the industry To address these issues the report recommends creating a statewide resource network to advance basic skills
104 Maryland Department of Labor Licensing amp Regulation Office of Workforce Information and Performance and Office of Labor Statistics 2007
54
Recommendations
55
Recommendations
1 BRAC Requires a Pipeline of Qualified Workers
Not all of the current BRAC personnel will move to Maryland along with their jobs Since the average civilian DoD worker is 45 years old many current workers will approach retirement in the near-term future The short-term implications of this trend are highly relevant given that the size and scope of the DoD BRAC units moving to Maryland could be influenced by current and near-term future workforce availability In other words if jobs go unfilled they could very well be lost through downsizing or reconfiguration of BRAC units The challenge for workforce development officials is to ensure that Maryland realizes as many potential BRAC jobs as possible The way to achieve this goal is to make sure that new positions are filled quickly
The statersquos workforce development system must strive to ensure that Marylandrsquos labor pool is ready and able to fill the types of jobs that BRAC will yield Both the Fort Monmouth and Defense Information Systems Agency (DISA) units that are slated to move to Maryland report a high proportion of the following occupations
Engineers (specifically electronicselectrical engineers computer engineers software engineers and engineers in general)
Managers (federal contract managers logistics managers inventory managers and information technology managers)
Computer scientists Telecommunications specialists Analysts (budget analysts and managementprogram analysts) and Technical writers and editors
These occupations require a Bachelorrsquos degree mainly in the engineering and sciences fields for entry-level positions For higher grade positions graduate education andor a combination of work experience is required Key skills associated with these positions include
Complex problem solving Critical thinking Judgment and decision making Systems evaluation105
Technology design106
105 The US Department of Labor defines systems evaluation as follows Identifying measures or indicators of system performance and the actions needed to improve or correct performance relative to the goals of the system 106 Technology design is defined as Generating or adapting equipment and technology to serve user needs
56
Recommendations
Recommendation Actively recruit retired government personnel and veterans to fill vacant BRAC positions
Fort Monmouth is currently in the process of actively recruiting up to 2000 Maryland workers to fill BRAC positions by 2011 Retired government personnel and veterans (especially those with security clearances) stand out as a potential labor pool worth cultivating in order to help the bases meet recruitment needs and fill any foreseeable gaps in the immediate future
Recommendation Increase interest recruitment and retention in BRAC-related fields
Since many of the BRAC jobs will require an educational background in science technology engineering and mathematics (STEM) fields and since graduation levels in many of these fields have been flat to negative in Maryland we must generate an interest in these fields before students enter college
Maryland has developed several new or planned initiatives at the high school level that if proven successful could serve as models to be deployed elsewhere in order to ensure that Maryland is developing an adequate pipeline of BRAC workers One such initiative is the Homeland Security and Emergency Preparedness Magnet Program at Joppatowne High School in Harford County The program which was launched in the fall of 2007 consists of three curricular tracks including Criminal JusticeLaw Enforcement InformationCommunications and Technology and Homeland Security Sciences The curricular content of these tracks is often applied For example the InformationCommunications and Technology track enables students to attain certification in both Cisco and SPACESTARS professional programs While the program aims to prepare high school students for careers in the homeland security field it also is designed to create a network linking students with government and industry partners
The Science and Mathematics Academy at Aberdeen High School is another example This program funded with federal state and local funds was launched in fall 2004 after several years of planning The program originated with the Army Alliance and other professionals affiliated with Aberdeen Proving Ground (APG) A critical program component provides students with the opportunity to interact regularly with professional scientists and mathematicians Another unique feature allows high school seniors to perform original research with the guidance of a program mentor
Recommendation Identify labor and education needs for spin-off BRAC jobs
The influx of BRAC personnel and contractors to Maryland will result not only in significant construction activity but also increased demand for personal services According to a report produced by RESI in 2006 for every direct on-base job107 that comes to Maryland 196 additional spin-off jobs will be created108 Specifically Maryland will experience a rapidly growing demand for construction managers and workers day care workers and hospitality workers among others Local community colleges in Harford and Anne Arundel counties
107 Direct on-base positions include both civilian DoD positions as well as embedded private defense contractors 108 RESI of Towson University Maryland Department of Business amp Economic Development 2006
57
Recommendations
already have begun to explore program needs associated with such occupations This is an area that should be explored fully by workforce development professionals
75 There Is a Shortage of Workers with Security Clearances
The number of positions requiring security clearances as well as the level of security clearances required for existing contracts has increased dramatically since September 11 2001 This increased demand has exacerbated processing times and resulted in a frenzy of competition and ldquopoachingrdquo from the limited pool of cleared workers many of whom are concentrated within science technology engineering or mathematics (STEM) fields Not only is the security clearance process a lengthy and onerous one but it is costly as well Processing delays can cause jobs to remain unfilled for months on end and the cost of sponsorship is quite high
Recommendation Spread the word set up a pre-screening model and expand internship opportunities
The issue of security clearances is a tricky one since the process is federally driven and thus largely outside the Statersquos control Still Maryland can begin to address the security clearance issue by disseminating information An awareness campaign especially targeting high school and college students is needed to get the word out We must emphasize the multitude of job opportunities available to Marylandrsquos youth and inform them what they need to do (or rather avoid) in order to obtain positions requiring security clearances
Also key to resolving Marylandrsquos excess clearance demand is to spearhead the clearance process by targeting prospective workers while they are still students To achieve this goal a pre-screening model could be developed whereby prior to graduation college students begin the security clearance process A Towson University study performed on behalf of DBED notes however that such a model would enhance the process only if the federal government addresses process issues at the national level109 Once the model is in place matching funds could be established (between defense contractors and other organizations as well as private andor public sources) in order to sponsor students to begin the security clearance process
Expanded internship prospects represent another area of opportunity to get the word out and encourage student interest in positions that require security clearances The Johns Hopkins Universityrsquos Applied Physics Lab (APL) summer internship program is one such example APL funds and processes interim student clearances for temporary summer positions APL also funds the full clearance process for students who remain with the lab beyond the summer
109 Division of Economic and Community Outreach of Towson University Maryland Department of Business amp Economic Development 2006
58
Recommendations
76 Skilled Professionals Needed
A review of emerging and expected labor force conditions in Maryland makes it clear that there is a need for the state to grow attract and retain skilled professionals of all types (not just STEM and BRAC-related workers) There is a need to attract and retain these professionals both as workers and residents in Maryland Admittedly this particular finding overlaps with previously mentioned findings (ie the need for STEM and BRAC workers) The evidence is so compelling that the authors of this report felt that a separate recommendation is justified
Recent migration trends in Maryland bring this issue to the forefront In each of the three most recent years for which data are available (2004 through 2006) the state has recorded negative net migration In other words more people are moving out of the state than are moving in Between 2005 and 2006 for instance net domestic migration outflows exceeded 25000 people offsetting the 21000-person gain due to international migration110 In other words in a single year 25000 residents left Maryland and were replaced by 21000 immigrants
This exodus of Maryland residents has significant implications for the statersquos workforce Many of the residents leaving the state are skilled professionals who are being replaced increasingly by less educated immigrants Certainly many new immigrants to Maryland are highly educated but the amount of time during which these skilled immigrants will remain in Marylandrsquos workforce is not certain In addition many of the statersquos out-migrants continue to commute to Maryland for work How long will these workers put up with longer commutes After all the state has a notoriously lengthy average commute time of 306 minutes second only to that of New York City (309 minutes)
The statersquos rate of population growth is slowing Between 2020 and 2030 Marylandrsquos population is expected to grow by five percent compared to 20 percent growth between 1970 and 1980 Marylandrsquos population is aging as nearly one-fifth of the statersquos working age population is set to retire by 2020 The trend in migration coupled with the statersquos slowing population growth aging population and increasingly tight labor market conditions all point to the same conclusion Maryland needs to ensure that our pool of skilled professionals grows in step with the demand
110 US Census Bureau
59
Recommendations
Recommendation Launch a campaign to attract and retain skilled professionals
Nations such as India and China and even mid-Atlantic cities and states such as Philadelphia and West Virginia have made concerted efforts to not only grow and retain skilled professionals but to entice these workers to return to their home citiesstatesnations This analysis recommends that a campaign be developed to both attract and retain skilled professionals in Maryland
A public-private coalition is recommended to spearhead such a campaign which would target skilled professionals of all ages As a start the initiative could target the emerging pipeline of professional workers ndash namely college students The campaign could be two-pronged focusing on retaining Maryland college students in the statersquos workforce as well as attracting college students from other areas to Maryland After all the survey data suggest that nearly four out of every 10 Bachelorrsquos degree graduates of Maryland institutions elect to work outside the state The campaign could target additional locales with a significant presence of colleges and universities (ie Greater Boston Research Triangle Park Greater Philadelphia etc) in an effort to attract current students to Maryland after graduation Such a campaign should incorporate incentives for first-time homebuyers and affordable housing currently offered in Maryland
60
Closing
80 Closing
Marylanders live and work in a state characterized by a healthy diverse economy and low unemployment The statersquos highly educated workforce and the presence of and proximity to federal agencies and laboratories also are major advantages Marylandrsquos excellent quality of life continues to attract workers and residents to the state In order to meet the many challenges posed by a rapidly changing demographic and economic landscape Maryland must be prepared to preserve and build on these existing strengths
This report highlights a number of current and predicted labor force trends that will drive the future of Marylandrsquos labor and jobs markets These trends pose several challenges to the state that will require the attention of educators workforce development professionals the business community and residents alike Tackling these challenges through a combination of public and private initiatives will serve to enable Maryland to maintain its existing strengths and enhance the statersquos ability to compete in an ever-changing global economy Hopefully the trends and recommendations highlighted in this report will aid in this effort
61
References
References
American Community Survey US Census Bureau 2005
Altbach P R Berdahl and P Gumport American Higher Education in the Twenty-First Century 2nd ed Johns Hopkins University Press April 2005
Americarsquos Career InfoNet httpwwwacinetorg
Associated Press State amp Local Wire ldquoLimit on Seasonal Workers Vexes Employersrdquo February 28 2005 Lexis-Nexis
Baltimore Business Journal ldquoLift Cap on Temporary Visa Programrdquo American City Business Journals Inc July 30 2004
Baltimore Sun ldquoConstellation Energy Files Partial Plan for Reactorrdquo Bloomberg News July 31 2007
Barlow ED ldquoStorm Warnings and What You Can Do To Preparerdquo 2006 Governorrsquos Workforce Conference Maryland May 8 2006
Brugger Robert J Maryland A Middle Temperament 1634-1980 Johns Hopkins University Press 1988
Buhler Patricia M ldquoThe New Workforce Five Sweeping Trends That Will Shape Your Companyrsquos Futurerdquo AMA Business Brief wwwamanetorg
Bureau of Labor Statistics ldquoHigh-paying Occupations with Many Openings Projected 2002shy12rdquo Occupational Outlook Quarterly Spring 2004 httpwwwblsgovopubooq2004springoochartpdf
Campbell Doug ldquoThe Illegal Immigrant Effectrdquo Region Focus 2006
Campbell Paul R ldquoPopulation Projections for States by Age Sex Race and Hispanic Origin 1995-2025rdquo US Census Bureau Population Division 1996
Capps Randy Michael Fix Jeffrey Passel Jason Oust and Dan Perez-Lopez ldquoImmigrant Families and Workers A Profile of the Low Wage Immigrant Workforcerdquo Urban Institute November 2003
Carroll Nick and C Taeuber ldquoA Profile of Older Workers in Marylandrdquo US Department of Commerce Economics and Statistics Administration US Census Bureau August 2004
Conte and Carr ldquoOutline of the US Economyrdquo US Department of State httpusinfostategov
62
References
Cox Michael R Alm and N Holmes ldquoWhere the Jobs Arerdquo The New York Times May 13 2004 late edition ProQuest Information and Learning Company httpproquestumicompqdwebdid=636777401ampsid=5ampFmt=3ampclientld=41150ampRQT=309amp VName=PQD
De Long David W ldquoConfronting the Chemical Industry Brain Drain A Strategic Framework for Organizational Knowledge Retentionrdquo Accenture-Institute for Strategic Change April 2002
Division of Economic and Community Outreach ldquoBRAC Government and Corporate Need for Workers with Security Clearancesrdquo Towson University June 2006
ldquoDomestic Net Migration in the United States 2000 to 2004rdquo US Census Bureau April 2006
Drucker Peter ldquoThe Future Has Already Happenedrdquo Futurist 32 no 8 (1998) 16 MAS Ultra-School Edition
Duderstadt James J ldquoLeading Higher Education in an Era of Rapid Changerdquo July 2001
ElBoghdady Dina ldquoDISA Fights Turnover with Telecommutingrdquo The Washington Post January 25 2006
Fahrenthold David A ldquoMaryland Crab Industry Angles for Help Seasonal Worker Cap Job Abundance Leave Seafood Processors Short-Staffedrdquo The Washington Post February 28 2005 Lexis-Nexis
Federal Reserve Bank of Dallas ldquo2003 Annual Report The Evolution of Workrdquo wwwdallasfedorg
Franz Maximilian ldquoCommentary The Chesapeake Traditionrdquo The Daily Record May 7 2002 Lexis-Nexis
Gereffi Gary and V Wadhwa ldquoFraming the Engineering Outsourcing Debate Placing the United States on a Level Playing Field with China and Indiardquo Master of Engineering Management Program Duke University December 2005
Goldstein Mark ldquoMarylandrsquos Changing Demographicsrdquo Presentation on behalf of the Maryland Department of Planning June 2006
Governorrsquos Workforce Investment Board 2003 ldquoGovernorrsquos Healthcare Workforce Summit Monographrdquo Maryland Department of Labor Licensing amp Regulation
Governorrsquos Workforce Investment Board 2006 ldquoMaryland Aerospace Industry Monographrdquo Maryland Department of Labor Licensing amp Regulation
63
References
Governorrsquos Workforce Investment Board 2007 ldquoMaryland Hospitality amp Tourism Industry Monographrdquo Maryland Department of Labor Licensing amp Regulation
H1Base ldquoH1-B Visa Information amp Service Centerrdquo httph1basecompageaspid=312
Hankin Harriet The New Workforce New York AMACOM 2005
Heller Barbara R ldquoMarylandrsquos Nursing Shortage A Workforce Crisisrdquo University of Maryland March 2003
Hewitt Associates LLC ldquoWorkforce Planning in the 21st Century - Back to the Futurerdquo International Report October 2003
Huether David ldquoThe Case of the Missing Jobsrdquo National Association of Manufacturers httpwwwnamorgs_namdoc1aspCID=201416ampDID=236655
Karoly Lynn A and Constantijn W A Panis The 21st Century at Work Forces Shaping Lifelong Learning Trends A Profile of Continuing Higher Education 7th ed University Continuing Education Association April 2002
Kaushal Neerja and Michael Fix ldquoThe Contributions of High-Skilled Immigrantsrdquo Migration Policy Institute July 2006
Keller Michael J ldquoA Study of the Capacity of Marylandrsquos Teacher Preparation Programsrdquo Maryland Higher Education Commission March 2006
Kobell Rona and C Guy ldquoWork-visa Limit Snags Shore Employers Business Relying on Immigrant Labor Might Not Have Anyone to Do the Workrdquo The Sun January 24 2005 final edition ProQuest
Lasater Beth and Barbara Elliot ldquoProfiles of the Adult Education Target Populationrdquo Center for the Research in Education RTI International December 2005 httpwwwedgovaboutofficeslistovaepiAdultEdcensus1pdf
Lorefice Alejandro A ldquoJust in Time Manufacturing Introduction and Major Componentsrdquo New York 1998
Lyons Michael and Pearson Ian Business 2010 Mapping the New Commercial Landscape London 2003
Maryland Board of Nursing httpwwwmbonorgmainphp
Maryland Career and Workforce Information httpdllrstatemdus
Maryland Department of Business amp Economic Development Economic Pulse January-February 2007
64
References
Maryland Department of Business amp Economic Development ldquoLargest Employers in Marylandrdquo March 2006
Maryland Department of Labor Licensing amp Regulation ldquoMarylandrsquos Demand-Driven Two-Year Workforce Investment Planrdquo July 2005-June 2007
Maryland Department of Labor Licensing amp Regulation Office of Workforce Information and Performance and Office of Labor Statistics March 2007
Maryland Governorrsquos Workforce Investment Board ldquoGovernorrsquos Healthcare Workforce Summit Monographrdquo August 2003 httpwwwmdworkforcecomlibpdfhcmonographpdf
Maryland Higher Education Commission ldquoEnrollment Projections 2007-2016 Maryland Public Colleges and Universitiesrdquo June 2007
Maryland Higher Education Commission ldquoTrends in Degrees Awarded at Maryland Higher Education Institutionsrdquo March 2005
Maryland Higher Education Commission ldquoTrends in Enrollment by Program Maryland Higher Education Institutionsrdquo April 2005
Maryland Higher Education Commission ldquo2004 Maryland State Plan for Postsecondary Educationrdquo December 2004
Maryland Higher Education Commission 2006 Trend Book 1 3 19-24 29-32 49-54 78-84 91-93 August 2006
Maryland Higher Education Commission 2005 Data Book 1 August 2004
Maryland Higher Education Commission 2006 Data Book 1 August 2005
Maryland Higher Education Commission 2007 Data Book 1 7 14-16 38 August 2006
Maryland State Department of Education ldquoStepping Up to the Future Adult Literacy Challenges at Work at Home and in the Maryland Communityrdquo December 2005
Maryland Independent College and University Association Connection ldquoLearn About the Five Factsrdquo httpwwwmicuaconnectioncommythsasp
Maryland Independent College and University Association ldquoFast Facts About MICUA 2007 ndash Enrollment Countsrdquo 2002 httpwwwmicuaorgffenrollmentcountspdf
McGee Marianne Kolbasuk and Alice LaPlante ldquoTalent Search The Myths Facts and Emotions That Will Keep the H1-B Visa Issue From Going Awayrdquo InformationWeek July 23 2007 Lexis Nexis
65
References
Mittuch Eugene W Averting a Pending Department of Defense Civilian Personnel Crisis The Need for a Corporate Recruiting Strategy May 2002 httpwwwstormingmediaus898946A894604html
National Academy of Science ldquoRising Above the Gathering Storm Energizing and Employing America for a Brighter Economic Futurerdquo 2006
National Center on Education and the Economy ldquoTough Choices Tough Times The Report of the New Commission on the Skills of the American Workforcerdquo 2007 httpwwwskillscommissionorgpdfexec_sumToughChoices_EXECSUMpdf
National Science Foundation 2003 httpwwwnsfgov
Nuclear Energy Institute ldquoNuclear Energy Industry Initiatives Target Looming Shortage of Skilled Workersrdquo January 2007 wwwneiorg
OECD ldquoWhat Schools for the Futurerdquo October 2001
Pew Hispanic Center ldquoFact Sheet The Labor Force Status of Short Term Unauthorized Workersrdquo April 2006
Pilato Virginia ldquoMSDE and The Impact of Different Models of Teacher Preparation on Teacher Retention A Progress Reportrdquo presented by Dr Tom Proffitt and Ms Karen Schafer Towson University
Pisarski Alan ldquoCommunity in Americardquo Transportation Research Board 2006
RAND Corporation ldquoThe Future Workforce and Workplace in the United Statesrdquo 2004
Reeves Scott ldquoAn Aging Workforcersquos Effect On US Employersrdquo Forbes September 29 2005 wwwForbescom
RESI study performed on behalf of the Maryland Department of Business amp Economic Development Jobs and Household Allocations and Expected Tax Revenues
Snyder Thomas D ldquoDigest of Education Statistics 2005rdquo National Center for Education Statistics June 2006 httpncesedgovprogramsdigestd05ch_3asp
Sparshott Jeffrey ldquoBay Firms Depend on Foreign Workersrdquo The Washington Times June 1 2005 Lexis-Nexis
States News Service ldquoMikulski Scores Senate Victory for Americarsquos Small Businessesrdquo April 19 2005 Lexis Nexis
66
References
The Conference Board Partnership for 21st Century Skills Corporate Voices for Working Families and Society for Human Resource Management ldquoAre They Really Ready To Workrdquo 2006 http21stcenturyskillsorgdocumentsFINAL_REPORT_PDF09-29-06pdf
Therrien Roger C Bridges R Meyerhoff and J Baker ldquoConnecticut Workforce Demands and the Implications for Educationrdquo Connecticut Department of Labor July 2003
Three Rivers Workforce Investment Board ldquoManaging the Changing Workforce in Southwestern Pennsylvaniardquo Executive Summary June 2006 httpwwwtrwiborgreportsagingexecsummarypdf
Towards Knowledge Societies UNESCO Publishing 2005
UMD ldquoProtecting Marylandrsquos Competitive Edgerdquo An Action Summit Hosted by the University of Maryland April 2006 httpwwwcompetitive-edgeumdedusnapshothtml
US Department of Education ldquoState Nonfiscal Survey of Public ElementarySecondary Educationrdquo National Center for Education Statistics November 2005 httpncesedgovprogramsprojectionstablestable_25CTaspreferrer=tablenotes
VisaPro ldquoFrequently Asked Questionsrdquo httpfaqvisaprocomH2B-Visa-FAQ3aspQ1
67
Executive Summary
Survey data suggest that nearly four out of every 10 Bachelorrsquos degree graduates of Maryland institutions elect to work outside the state Other cities states and nations have made concerted efforts to not only grow and retain skilled professionals but to entice these workers to return to their home citiesstatesnations A campaign should be developed to attract and retain skilled professionals in Maryland
A public-private coalition is recommended to spearhead such a campaign which would target skilled professionals of all ages
Recommendation Expand career and technology education
Career and technology education (CTE) programs are courses of study in K-12 and postshysecondary institutions that prepare students for careers with wide-ranging educational requirements These programs provide students with skills to compete in 21st century jobs because students are learning with skills that are transferable across careers and educational paths11 CTE programs combine rigorous and challenging academic content which leads to an industry-recognized credential or certificate an associate or bachelorrsquos degree or entry into an apprenticeship program or employment
CTE programs are currently offered in about 200 Maryland high schools and all 16 of Marylandrsquos community colleges
11 National Governorrsquos Association Retooling Career Technical Education
8
Introduction
20 Introduction
This report begins with a brief overview of the statersquos historical workforce trends and transitions into a high-level analysis of emerging trends affecting the statersquos labor supply and demand ndash both current and future The analysis concludes with a summary of key findings and priority recommendations
This report was produced by RESI of Towson University on behalf of and with input from the Governorrsquos Workforce Investment Board (GWIB) GWIB is the statersquos chief policy-making and strategic planning body on workforce development as mandated by the Federal Workforce Investment Act (WIA) of 1998 and Maryland Executive Order 0101200460 The board is a business-led group of industry education and government leaders charged with advising the governor on Marylandrsquos workforce development needs
9
Historical Backdrop
30 Historical Backdrop
Over time Marylandrsquos workforce has adapted and evolved The following quote from a 2004 New York Times article on the United Statesrsquo workforce sums up this premise nicely ldquoOur history is one of a constant churning of jobs with workers always finding the next step forward in the evolution of work ndash from farm hands to industrial workers to information handlersrdquo12
This statement certainly applies to Maryland which has transformed its economy dramatically over the years
Figure A reveals the general economic shifts the state has experienced since 1900 At that time Agriculture amp Related ranked as the leading employment sector for both Maryland (comprising 242 percent of total employment) and the nation (374 percent) Over the next five decades agricultural employment dropped precipitously comprising 72 percent of Marylandrsquos economy by 1950 and just 14 percent by 2000
Figure A Maryland Employment by Industry Percent of Total13
The rise and subsequent reduction of manufacturing employment also is reflected in the data as is the more recent domination of the services sector which continues today In 2000 manufacturing constituted 81 percent of the statersquos job base while services sector employment accounted for 411 percent Comparable national figures were 148 and 361 percent respectively
00
50
100
150
200
250
300
350
400
450
Agriculture amp Related
Services Manufacturing Wholesale amp Retail trade
Transportation amp Related
Construction Public Administration
Finance Insurance amp Real Estate
1900 1950 2000
12 Cox Richard 2004 13 US Census Bureau Public Use Micro Data
10
10
20
30
40
50
60
70
80
90
o
f Adu
lts W
ith A
t Lea
st a
HS
Dip
lom
1940 1950 1960 1970 1980 1990 2000
US MD
Historical Backdrop
Figure B Educational Attainment for US and Maryland14
These significant changes coincided with increasing labor force educational attainment levels as shown in Figure B In 1940 the first year in which educational attainment data was collected 211 percent of Marylandrsquos population age 25 and over had obtained a high school education or higher By 2000 this percentage approached 840 percent Corresponding national figures were 245 and
804 percent respectively Over the same period the percentage of the statersquos population age 25 and over with a Bachelorrsquos degree or higher skyrocketed from under 50 percent in 1940 to 315 percent in 200015 This chart reveals what employers and workforce development professionals have known for some time ndash an educated workforce has become increasingly critical to maintaining and nurturing economic success
14 Percent of Population aged 25+ with a High School Education or Higher US Census Bureau ldquoA Half-Century of Learning Historical Census Statistics on Educational Attainment in the United States 1940 to 2000rdquo 15 The corresponding national rate in 2000 was just 244 percent
11
Historical Backdrop
The increased demand for educated workers in Maryland has been broad-based and is reflected in industry-level educational attainment data Even in industries traditionally considered ldquoblue collarrdquo such as Manufacturing and Construction the educational attainment of workers has risen Data show that the proportion of workers in each Maryland industry with some college education has increased from just three percent of the statersquos manufacturing workers in 1940 to 26 percent in 2000 The proportion of Agriculture workers with some college skyrocketed from one percent in 1940 to over 20 percent in 2000
Figure C Maryland Educational Attainment by Industry 200016
By 2000 more thanHigh School or Less Some College College Degree Plus 40 of workers
Construction amp Mining 64 24 12 employed within Services Finance Agriculture amp Related 63 21 16 Insurance amp Real
Wholesale amp Retail Trade 58 28 15 Estate and Public 49 30 20 Administration had
obtained a college Transportation amp Related
Manufacturing 48 26 25 degree or higher More Services 28 26 46 than half of the workers
in Marylandrsquos Finance Insurance amp Real Estate 25 34 41 manufacturing sector
Public Administration 22 35 42 had at least some 00 200 400 600 800 1000 college or higher Other
industries employed a higher proportion of workers with a high school education or less such as Construction amp Mining (64 percent) Agriculture amp Related (63 percent) and Wholesale amp Retail Trade (58 percent)
16 RESI US Census Bureau Public Use Micro Data The graph refers to the distribution of maximum educational attainment levels by industry
12
Historical Backdrop
Today Maryland enjoys a healthy diverse economy driven by growth in services sectors such as education health care and other technical and professional services Among Marylandrsquos top 50 largest private employers are health and educational services firms (including The Johns Hopkins University and Hospital Adventist HealthCare and Helix Health System among others) defense and intelligence contractors (such as Northrop Grumman Corporation and Lockheed Martin Corporation) and other technical and professional services firms (such as Computer Sciences Corporation IBM Corporation Science Applications International Corporation and Westat Research Incorporated)17
Though life sciences firms are not generally considered to be large employment generators there is no doubt that the statersquos economy also has been shaped by the presence of industry high fliers such as MedImmune (recently acquired by AstraZeneca) and Human Genome Sciences Inc Any discussion of Maryland employers would not be complete without consideration of the statersquos proximity to and presence of federal research centers and labs
The importance of the federal government to the statersquos economy cannot be underestimated The many federal laboratories and facilities located within and near Maryland such as the Goddard Space Flight Center and the Naval Air Systems Command at Patuxent River have contributed greatly to Marylandrsquos science and security base The presence of the Food and Drug Administration (FDA) and the National Institutes of Health (NIH) have spurred growth among bioscience firms The National Security Agency (NSA) and Marylandrsquos many military installations (including Fort Detrick Fort Meade and Aberdeen Proving Ground) have been critical to building the statersquos base of science and security
17 Maryland Department of Business amp Economic Development 2006
13
Marylandrsquos Labor Supply
40 Marylandrsquos Labor Supply
41 Population Trends and Characteristics
The shifting composition and growth of Marylandrsquos population directly impacts the statersquos economy and labor force Population characteristics such as age educational attainment and diversity have a profound impact on the needs and types of services that will best ensure continued economic growth and prosperity throughout the state The extent to which policy makers educators and business leaders recognize and meet these needs can further strengthen Marylandrsquos ability to attract and retain quality jobs and workers
411 Population Growth Migration and Diversity
Marylandrsquos population exceeded 56 million in 2006 ranking the state 19th in the nation in population size The statersquos rate of population growth between July of 2005 and 2006 was just 05 percent Not only did the state lag the 10 percent national rate of population expansion but Maryland ranks among the bottom third of states (36th fastest growth) according to this measure
This sluggish rate of population growth is not characteristic of Marylandrsquos past performance Between 1990 and 1999 the statersquos population expanded at an average annual rate of 10 percent Between 2000 and 2003 Maryland recorded annual population growth ranging from 11 to 13 percent
The statersquos slower rate of population expansion in recent years can be explained by negative net migration trends In each of the three most recent years for which data are available (2004 through 2006) the state recorded negative net migration In other words more people are moving out of the state than are moving in Maryland recorded a net migration loss of 5000 in 2006 and 6800 in 2005 the largest such decline the state has seen since 198118 While it is true that net international migration continues to bolster the statersquos population growth net domestic outflows (migration between states) outweigh international migration gains Between 2005 and 2006 for instance Marylandrsquos net domestic migration outflows exceeded 25000 persons offsetting the 21000-person gain due to international migration19
It should be noted that Marylandrsquos net domestic migration decline represents a departure from recent trends Between 2000 and 2004 for instance the state recorded net domestic migration gains of more than 5400 per year20 While in the past domestic outflows have been associated with deteriorating or weakening economic conditions within the state recent trends appear to be driven by cost of living issues especially housing costs Out migration to border counties in Pennsylvania and West Virginia has increased significantly in recent years A possible explanation for this movement is the availability of affordable housing in these areas Median home values in Pennsylvania jurisdictions such as York and Franklin counties are roughly $75000 below those of Baltimore County This gap increases significantly when home values in
18 Maryland Department of Planning 19 US Census Bureau 20 US Census Bureau 2006
14
Marylandrsquos Labor Supply
Carroll and Frederick counties are considered Many former Maryland households have taken advantage of lower housing costs in these locales while still being part of Marylandrsquos job market
The good news is that this trend will likely be stemmed by the current and future Department of Defense (DoD) Base Realignment and Closure (BRAC) movements to Maryland The job movements which call for more than 15000 civilian jobs to transfer to Maryland by 2011 are expected to result in substantial household movements to Maryland as well
As previously noted international migration continues to bolster population growth both locally and throughout the nation Foreign immigration represents 443 percent of the statersquos population gain between 1990 and 2000 Marylandrsquos level of foreign-born population has grown from roughly 94000 in 1960 to more than 313000 in 1990 By 2000 nearly one out of every 10 Maryland residents (more than 518000 persons) was foreign born21
Figure E Marylandrsquos Share of Foreign-Born Population 200022
More than two-thirds of the statersquos 40 foreign-born population reports their 35 region of origin to be either Asia or
30 Latin America The most commonly reported Asian countries of origin
25 include China (which comprises 65
20 percent of the statersquos 2000 foreign-born population) India (62 percent)
15 Korea (60 percent) and the
10 Philippines (40 percent) El Salvador leads Latin American countries and
5 accounts for another 81 percent In
0 fact El Salvador comprises the single largest share of Marylandrsquos foreign-born population Jamaica and Mexico
each comprise an additional 37 percent Nigeria Vietnam Germany and the United Kingdom each comprise close to 30 percent of the statersquos foreign-born residents
Asia Latin America Europe Africa North America Oceana
Perc
ent o
f Tot
al
21 Goldstein 2006 22 US Census Bureau
15
Marylandrsquos Labor Supply
40
43
56
57
65
89
11 7
148
174
292
0 5 10 15 20 25 30 35
Figure F Foreign-Born Population as Percent of Total 200523
International migration is forecast to increase Marylandrsquos population Montgomery
by 593000 persons between 1995 Prince George s and 2025 ranking the state ninth in
Howard the nation according to this24 Maryland measure Montgomery and
Prince Georgersquos counties will Baltimore County
continue to absorb the lionrsquos share Frederick
of the statersquos international Anne Arundel
migration Foreign immigration Baltimore City accounted for 891 percent of
Montgomery Countyrsquos population Charles
gains and 719 percent of Prince Wicomico
Georgersquos Countyrsquos gains between 1990 and 2000 In 2005 foreign-
Percent of Totalborn people accounted for 292 percent of Montgomery Countyrsquos population and 174 percent of Prince Georgersquos County residents Howard County follows with 149 percent
Migration continues to increase diversity in Maryland which has recorded substantial increases in its minority population in recent years Between 2000 and 2006 the statersquos minority population expanded by roughly 327000 persons In contrast the statersquos non-Hispanic white population declined by 23000 persons over the same period Census projections indicate that by 2025 Marylandrsquos non-Hispanic white population will comprise just 543 percent of the statersquos total population down from 666 percent in 1995 Over the same period persons of Hispanic origin are expected to increase and comprise 70 percent of Marylandrsquos total population up from 36 percent in 199525
23 Goldstein 2006 24 US Census Bureau Population Division 25 US Census Bureau Population Division
16
Marylandrsquos Labor Supply
Figure G Share of Population by Selected RaceOrigin 200526
Census estimates for 2005 reveal Marylandrsquos population to be quite diverse relative to the nation African-Americans constitute 287 percent of the statersquos population more than twice the
0
10
20
30
40
50
60
70
80
White Black Hispanic or Latino (of any
race)
Asian Some other Race
Two or more races
Perc
ent o
f Tot
al
Maryland United States
60 percent in 2006 The corresponding national share for people of Hispanic or Latino origin in
national share The state also is home to a slightly larger (percent share) Asian population than is seen nationally While Marylandrsquos population of Hispanic or Latino origin has increased significantly in recent years (from roughly 230000 in 2000 to 318000 in 2005) this group comprised 58 percent of the statersquos population in 2005 and
2005 was 145 percent
412 Affluence
Recent data releases once again confirm Marylandrsquos reputation as one of the most affluent states in the nation With a 2006 median household income of $65144 Maryland ranks first in the nation according to this measure and far surpasses the comparable national income level of $48451
Poverty data reveal similar patterns Overall the statewide family poverty rate was 53 percent far below the national rate of 98 percent In 2006 only 78 percent of Marylandrsquos population lived below the poverty level the lowest rate in the nation and 55 percentage points below the national average
The fact that the statersquos households are well compensated is a reflection of Marylandrsquos highly educated and skilled workforce More than a third (351 percent) of the statersquos population age 25 and older has a Bachelorrsquos degree or higher The comparable national percentage is 270 percent The fact that Maryland has a relatively high proportion of households with two or more workers also helps to explain the statersquos high income levels In 2006 four out of 10 households fell within this category compared to 35 for the nation27
26 US Census Bureau American Community Survey 2006 27 US Census Bureau American Community Survey 2006
17
Marylandrsquos Labor Supply
Figure H Per Capita Income Levels by Maryland Workforce Investment Area (WIA)28
$20000 $25000 $30000 $35000 $40000 $45000 $50000 $55000 $60000
Montgomery Anne Arundel
Baltimore County Mid-Maryland
Maryland Frederick
Upper Shore Southern Maryland
Susquehanna Prince Georgersquos
United States Baltimore City
Lower Shore Western Maryland
Annual Per Capita Income
2005 Marylandrsquos affluence is significant for another reason Wealth offers a measure of protection from cyclical economic fluctuations Maryland may be better prepared to weather economic downturns than the balance of the nation However it should be noted
that all regions in Maryland are not equally protected Certain areas have participated less fully in recent economic recoveries than others as indicated by their per capita income levels With an annual per capita income level below $29000 Western Maryland (comprised of Allegany Garrett and Washington counties) trails all other Maryland Workforce Investment Areas (WIAs)29 The Lower Shore (which includes Somerset Wicomico and Worcester counties) also lags other areas with an annual per capita income level of just under $30000
While affluence can be considered a strength especially in the face of economic downturns it poses a challenge for other reasons Increased living costs and housing costs in particular can encourage out migration to lower cost areas a trend analysts believe has been occurring with increased frequency in Maryland for each of the last three years
28 Bureau of Economic Analysis RESI of Towson University WIA refers to Workforce Investment Area Maryland is home to 12 local WIAs each with a common labor pool and 200000 or more residents Each WIA is served by a separate Local Workforce Investment Board (LWIB) 29 In percentage terms however the Western Maryland region boasts the fastest rate of appreciation between 2004 and 2005 with growth in annual per capita income of 63 percent
18
Marylandrsquos Labor Supply
413 Educational Attainment
Figure I 2005 Education Attainment Levels Population 25 and Older30
Maryland is home to a highly educated population The state consistently ranks ahead
00
50
100
150
200
250
300
350
Max
imum
Edu
catio
nal
Atta
inm
ent A
chie
ved
Less than 9th Grade
9th-12th High School Some Associate s Bachelor s Graduate or Grade No Graduate College No Degree Degree Professional Diploma Degree Degree
Maryland United States
of the nation on a variety of education-related measures For instance the National Science Foundation ranks Maryland second in the nation in terms of doctoral scientists and engineers per 100000 population In addition in 2005 the statersquos concentration of professional and technical workers (249 percent) ranked second in the nation
Census educational attainment data tell a similar story In 2005 nearly one in four (194 percent) Marylanders age 25 and older earned a Bachelorrsquos degree as their highest level of educational attainment Approximately 157 percent of state residents have a graduate or professional degree Taken together 351 percent of Marylandrsquos population has a Bachelorrsquos degree or higher ranking Maryland third in the nation compared to 270 percent nationally The gap between Maryland and the nation has widened in recent years as Maryland has increased its proportion of highly educated residents In 1990 only 265 percent of the statersquos population had earned a Bachelorrsquos degree or higher just six percentage points ahead of national levels
30 US Census Bureau American Community Survey 2006
19
Marylandrsquos Labor Supply
Figure J Percent of Population with a Bachelorrsquos Degree or Higher by WIA31
00 100 200 300 400 500 600
Montgomery
Mid-Maryland
Anne Arundel
Frederick
Baltimore County
Prince Georgersquos
Susquehanna
Southern Maryland
Baltimore City
Lower Shore
Western Maryland
Upper Shore
2005 In 2005 Montgomery County and the Mid-Maryland region lead the state in terms of the percent of population age 25 and older with a Bachelorrsquos degree or higher with 563 and 471 percent respectively The Upper Shore and Western Maryland
lag the balance of the state with 111 and 155 percent of regional population respectively with a Bachelorrsquos degree or higher
Figure K Maryland Educational Attainment by Race 200532
Educational attainment distributions vary by race and ethnicityorigin as well While six out of every 10 Asians in Maryland has a Bachelorrsquos degree or higher less than 25 percent of African-Americans and less than 20 percent of Hispanics fall into this category Nearly 390 percent of the statersquos Hispanic population does not have a high school diploma and 242 percent
Total White Alone
Black Alone
Asian Alone
Hispanic (Any Race)
Less than 9th Grade 43 34 37 49 242
9th-12th Grade No
High School Graduate 267 261 309 141 225
117 45 146 Diploma 87 75
Some College No Degree 196 189 231 113 135
Associates Degree 63 63 63 60 54
Graduate or Professional 152 168 96 308 82 Degree
Bachelors Degree 193 209 147 284 116
Bachelors Degree or Higher 345 377 243 593 198
of Hispanics have less than a ninth grade education roughly six times the state average
31 US Census Bureau American Community Survey 2005 32 US Census Bureau American Community Survey 2005
20
Marylandrsquos Labor Supply
414 Aging Population
Many of the issues Maryland will face in terms of future workforce and economic development will be rooted in demographics Between 1970 and 1980 Marylandrsquo population grew by nearly 20 percent Between 2020 and 2030 growth is expected to be just over five percent As the statersquos population growth continues to wane finding skilled workers to fill jobs will become increasingly challenging
Figure L Historic and Projected Growth among Marylands Population Age 16+33
0
100000
200000
300000
400000
500000
600000
1970-1980 1980-1990 1990-2000 2000-2010 2010-2020 2020-2030
Popu
latio
n G
row
th
0
5
10
15
20
25
Absolute Growth
Percentage Growth
Figure M Maryland Historic and Projected Growth by Age34
The Maryland Department of Planning projects that between 2000 and 2030 the statersquos share of population age 20 to 44 will drop from 374 percent to 323 percent Over the same time frame the share of population age 65 and older will increase from 113 to 195 percent Maryland is not alone experiencing this trend though median age data indicate that the statersquos population is slightly older than that of the nation Marylandrsquos median age in 2005 was 371 years compared to a median age of 365 years for the nation as a whole
33 Maryland Department of Planning 34 Maryland Department of Planning
00
100
200
300
400
500
Perc
ent o
f Pop
ulat
ion
1990 2000 2005 2010 2015 2020 2025 2030
Aged 20-44 Aged 65+
21
Marylandrsquos Labor Supply
Census data from 2000 provide an indication of the relative median age of Marylandrsquos regions Eastern Shore jurisdictions such as Dorchester Kent and Worcester counties all have median ages over 40 years of age Talbot Countyrsquos population is the oldest in the state with a median age of 433 years of age Increased immigration of retirees to Eastern Shore locales helps to explain this trend All three Western Maryland jurisdictions also are home to older populations The trend in Western Maryland and Allegany County in particular is attributed to ongoing population decline and out migration among younger people
By 2005 more than 60 percent of the statersquos population was of working age (ie age 18 to 64) Of this population the vast majority (833 percent) fell into the 18 to 54 age range More than one fifth (207 percent) of the statersquos 2005 population of working age was comprised by the leading edge (those born between 1946 and 1955) of the baby boomers those born between 1946 and 1964 This segment of the population is set to face retirement between 2011 and 2020 By 2020 the number of baby boomers between ages 18 and 54 will increase by more than 123000 and will account for 223 percent of the statersquos working age population The data make clear that the retirement of roughly one-fifth of the statersquos working age population is fast approaching and will have a disproportionate effect on those regions that are already home to a large concentration of older residents and workers (such as Western Maryland and the Eastern Shore)
42 Workforce Trends
421 Labor Force Growth Figure N Marylands Labor Force 2000 ndash 200635
Marylandrsquos labor force topped the 3 million mark for the first time in the second quarter of 2006 The state recorded a 23 percent expansion in its labor force between 2005 and 2006
2500000
2600000
2700000
2800000
2900000
3000000
3100000
2000 2001 2002 2003 2004 2005 2006
Labo
r Fo
rce
Lev
el
-10
-05
00
05
10
15
20
25
Labo
r Fo
rce
Ann
ual G
row
th
Level Growth
surpassing the 14 percent growth rate recorded nationwide This expansion was driven by a 20 percent increase in the number of employed people and a 36 percent contraction in the number of unemployed persons The statersquos recent performance reverses a trend of diminishing growth registered between 2002 and 2004 when Maryland trailed the national rate of expansion
35 Maryland Department of Planning
22
Marylandrsquos Labor Supply
Despite this recent up tick the pace of expansion for both the state and national labor force has been slowing since 1970 Between 1970 and 1980 Marylandrsquos workforce expanded by nearly 453000 workers or 27 percent During the 1990s Marylandrsquos labor force grew by just five percent about 130000 workers According to projections from the Maryland Department of Planning the growth in Marylandrsquos labor force will slow even further in the future Between 2020 and 2030 the statersquos workforce is expected to expand by just three percent (or roughly 101000 workers) This trend is being driven by the aging of Marylandrsquos population
Figure O Labor Force Shares by WIA36
00 20 40 60 80 100 120 140 160 180
Montgomery
Prince Georges
Baltimore County
Baltimore City
Anne Arundel
Mid-Maryland
Susquehanna
Southern Maryland
Western Maryland
Frederick
Lower Shore
Upper Shore
2006 The vast majority of the statersquos labor force37 resides in the suburban jurisdictions outside Baltimore City and Washington DC In fact Montgomery and Prince Georgersquos counties are home to just under one-third of the statersquos labor force Collectively
Western Maryland and the Upper and Lower Shore regions comprise another 10 percent of Marylandrsquos labor force
36 Maryland Department of Planning 37 Refers to resident labor force or the population currently working or actively looking for a job
23
Marylandrsquos Labor Supply
-20 00 20 40 60 80 100 120 140 160
Southern Maryland
Frederick
Lower Shore
Susquehanna
Mid-Maryland
Upper Shore
Anne Arundel
Western Maryland
Montgomery
Prince Georges
Baltimore County
Baltimore City
2000-2006
expansion (62 percent) during this period
422 Unemployment Rate Analysis
Figure Q Unemployment Rates 2000 to 200739
Marylandrsquos average annual
Figure P Labor Force Growth 2000 to 200638
unemployment rate which held steady at 38 percent in 2007 remains quite healthy compared to historical and national levels The comparable US jobless rate is 46 percent
The unemployment rate measures the level of unemployed persons (persons who are not working and who are available and actively looking for work) as a percentage of the total labor
All Maryland Workforce Investment Act (WIA) areas except Baltimore City recorded resident labor force growth between 2000 and 2006 In fact with the exception of Baltimore and Prince Georgersquos counties all WIAs outpaced the national rate of
200
300
400
500
600
700
2000Q
1
2000Q
3
2001Q
1
2001Q
3
2002Q
1
2002Q
3
2003Q
1
2003Q
3
2004Q
1
2004Q
3
2005Q
1
2005Q
3
2006Q
1
2006Q
3
2007Q
1
Une
mpl
oym
ent
Rat
e
United States Maryland
force This indicator is significant because it provides a relative measure of the statersquos economic health
Marylandrsquos low unemployment rate is significant to workforce development professionals because it demonstrates that local labor market conditions are increasingly tight Most
38 Bureau of Labor Statistics 39 Bureau of Labor Statistics
24
Marylandrsquos Labor Supply
economists agree that an unemployment rate in the range of 35 to 45 percent is indicative of an economy operating at full employment Marylandrsquos jobless rate continues to fall within that range In fact the state has not recorded an unemployment rate above 45 percent since July 2003
Figure R Unemployment Rates for WIAs40
00 10 20 30 40 50 60 70
Lower Shore Baltimore City
Western Maryland Upper Shore
Prince Georges Baltimore County
Susquehanna Southern Maryland
Anne Arundel Frederick
Mid-Maryland Montgomery
Unemployment Rates (Not Seasonally Adjusted)
2000 Q1 2007 Q1
While Marylandrsquos low unemployment rate testifies to the strength of the statersquos economy persistent tight labor market conditions also have the potential to aggravate labor shortages and to apply upward pressure on wages
Not all Maryland regions boast tight labor market conditions Western Maryland Baltimore City and the Lower Shore for instance have consistently posted unemployment rates upwards of 50 and 60 percent Western Marylandrsquos high unemployment rate stems from the loss of high-wage manufacturing jobs over the past two decades due to closures of former mainstay employers While the region has since experienced job growth much of the new job creation has been in low-skill low-wage positions The fact that the region has a high share of population with less than a high school diploma makes it more difficult for these workers to find quality jobs
40 Bureau of Labor Statistics
25
Marylandrsquos Labor Supply
With an unemployment rate of 61 percent in 2007 Baltimore City also is characterized by looser labor market conditions41 Baltimore is faced with serious long-term challenges including a significant number of underemployed workers as well as large segments of population who do not participate in the workforce The city is home to the largest number of residents with less than a ninth grade education (26679 persons in 2006 or 66 percent of Baltimorersquos population age 25 and older) The cityrsquos high school dropout rate at 105 percent in the 2005-2006 school year exceeds the 35 percent rate posted statewide These dropouts pose a serious workforce development challenge for the city Helping these nontraditional segments of the population (dislocated workers veterans disabled population ex-offenders etc) participate more fully in the labor market may help alleviate the demand for workers in the face of growing skill set and worker shortages
423 Labor Force Participation Rates
Figure S Labor Force Participation Rates for WIA42
500 550 600 650 700 750 800
Mid-Maryland
Frederick
Susquehanna
Montgomery
Southern Maryland
Prince Georgersquos
Anne Arundel
Baltimore County
Upper Shore
Lower Shore
Western Maryland
Baltimore City
Labor Force Participation
2000 Marylandrsquos labor force participation rate among 16- to 64-year-olds (including military) was 782 percent in 2006 ranking the state 11th in the nation according to this measure The comparable national rate is 745 percent43
41 It should be noted however that labor market conditions have improved significantly from 2004 when the city consistently recorded unemployment rates in excess of 70 percent 42 Bureau of Labor Statistics 43 US Census Bureau American Community Survey 2006
26
Marylandrsquos Labor Supply
Figure T Labor Force Participation Rates by Age44
Shifting demographics will have an effect on the statersquos labor force going forward According to Maryland
00
200
400
600
800
1000
Labo
r Fo
rce
Paric
ipat
ion
by A
ge
16-24 25-54 55 and over
2000
Department of Planning data labor force participation rates in 2000 approached 60 percent among those age 16 to 24 years Nearly 830 percent of those aged 25 to 54 years participated in the labor force However only 439 percent of those age 55 and over were in the labor force
Analysts increasingly anticipate that older workers will remain in the workforce longer compared to previous generations Still it is clear that as Marylandrsquos population ages labor force participation will be affected
424 Commuting Patterns
Figure U Percent Change in Marylands ImportedExported Workers45
Journey-to-work data from the 25 2000 Census reveal that for
20 every Maryland worker living outside the state there are 25
15 Maryland residents who leave
5
10
Exported Workers Imported Workers Net Exported Workers
1990
- 20
00
Perc
ent C
hang
e the state for work In other words Maryland is a net exporter of workers In 2000 the state recorded net exported workers in excess of 268000
0 This trend is not surprising since 1990 commuting patterns
-5 show the same pattern However an examination of 1990 and 2000 data indicates
that the situation is improving In 1990 Maryland exported 29 resident workers for every imported worker This improvement is explained by the fact that growth among imported workers (up 208 percent between 1990 and 2000) far surpasses the growth of exported workers (up 43 percent)
44 Bureau of Labor Statistics 45 US Census Bureau
27
Marylandrsquos Labor Supply
Between 1990 and 2000 the number of out-of-state residents commuting to Maryland jumped from 151330 to 182787 In 2000 the vast majority of these workers (872 percent) resided in Washington DC Delaware Virginia and West Virginia Growth was driven especially by outflows from the latter three states While the number of workers commuting from Washington DC to Maryland increased over the period they were a smaller share of Marylandrsquos imported workers dropping from 236 percent in 1990 to 199 percent in 2000
More than 450000 Maryland residents commuted outside the state for work in 2000 The lionrsquos share of these residents worked in Washington DC (620 percent) while another 242 percent worked in Virginia Delaware and Pennsylvania comprise another 52 and 28 percent respectively The number of out commuters to Washington DC dropped by more than 11000 persons or by 39 percent between 1990 and 2000
Marylandrsquos commuting patterns data is relevant not only from a workforce perspective but also from a quality of life perspective According to the Transportation Research Board by 2000 Maryland had joined the ranks of New York New Jersey and Illinois with more than 10 percent of workers traveling over 60 minutes to get to work46 The 2006 American Community Survey figures indicate that Marylandrsquos average commute time of 306 minutes is the second longest commute time in the nation closely trailing New Yorkrsquos average commute time of 309 minutes47
46 Pisarski 2006 47 US Census Bureau American Community Survey 2006
28
Marylandrsquos Labor Supply
43 Marylandrsquos Educational Supply Pipeline
It is abundantly clear that an educated workforce is essential to Marylandrsquos economy While Marylandrsquos educational institutions produce a majority of the statersquos workers there is a substantial amount of ebb and flow of educated workers between Maryland and other areas Enrollment in Marylandrsquos educational institutions has risen greatly and is expected to continue to grow in the foreseeable future
As of the 2005-2006 academic year Maryland educational institutions yielded the following labor supply 56302 high school graduates 13715 Associatersquos degrees (or certificates) 25484 Bachelorrsquos degrees 13265 Masterrsquos degrees Another 1122 first professional degrees (ie lawyers) and 1363 Doctoral degrees
Not all of these graduates choose to remain and work in Maryland Conversely not all of Marylandrsquos labor supply comes from the statersquos higher educational institutions Survey estimates reveal that the vast majority (84 percent) of Marylandrsquos community college graduates were full-time Maryland workers at least one year after graduation The corresponding figures are 64 percent for those with Bachelorrsquos degrees and 57 percent for graduates of Marylandrsquos private career schools48 Marylandrsquos ability to connect a greater number of these graduates to local Maryland employers could help reduce the impact of worker shortages
Between 1994 and 2004 full-time undergraduate enrollment in Marylandrsquos four-year public colleges and universities grew by 25 percent and community college enrollment increased by 33 percent According to projections from the Maryland Higher Education Commission (MHEC) growth in full-time enrollment at public four-year institutions is expected to moderate to 17 percent between 2007 and 2016 Growth among full-time community college students is expected to drop to 21 percent over the same period These projections are driven by predicted demographic shifts They also account for the estimated impact of tuition increases as well as changes in per capita disposable income
Over the same period graduate enrollment among public educational institutions is expected to rise 10 percent for full-time students and 55 percent for part-time students49 Increases in part-time enrollment will continue to be driven by enhanced opportunities for distance learning and online courses offered by traditional universities as well as through programs such as the University of Maryland University College
48 Percentages refer to five-year averages based on information published in the Maryland Higher Education Commissionrsquos 2007 Trend Book 49 Maryland Higher Education Commission 2007
29
Marylandrsquos Labor Demand
50 Marylandrsquos Labor Demand
51 Industry Analysis
Between 2005 and 2006 Marylandrsquos aggregate economy expanded by 31932 employees or 13 percent The statersquos 25 million job holders enjoyed average weekly wages of $88750
Marylandrsquos rate of employment expansion during this period represents a deceleration from the 16 percent growth rate recorded between 2004 and 2005 Not only has Marylandrsquos rate of employment growth slowed but the state lags the nation according to recent quarterly employment data Marylandrsquos 14 percent expansion recorded between the second quarters of 2005 and 2006 ranks the state 27th in the nation and trails the 18 percent national average Just a few years ago in 2004 Maryland consistently ranked in the top 15 states according to this measure This trend of decelerating employment growth would be cause for greater concern if not for the anticipated influx of tens of thousands of jobs to Maryland by 2011 due to the BRAC decisions While the incoming jobs have the potential to grow Marylandrsquos employment base the challenge which Maryland is addressing actively is to fill the current and future need for workers RESI anticipates that the statersquos economy will register annual rates of employment growth in the mid-one percent range in both 2006 and 2007 While not spectacular this is by no means indicative of an economic downturn Still this trend of decelerating employment growth is an area analysts will be tracking closely in the near-term future
Figure V Employment Growth by WIA 2005 to 200651
Regional employment growth for the most recent period for which data are available (2005 to 2006) ranges from shy02 percent in Baltimore City to 33 percent in Mid-Maryland Other rapidly expanding WIA regions include the Lower Shore and Southern Maryland Employment in both of these areas expanded at a pace of more than 20 percent between 2005 and 2006
50 The 25 million employment figure (as well as the additional employment figures contained in this section of the analysis) refers to Bureau of Labor Statistics Quarterly Covered Employment amp Wage data This data represents employment by place of work data and is reported to the Bureau of Labor Statistics by the Maryland Department of Labor Licensing amp Regulation (DLLR) and includes all workers covered by the Unemployment Insurance (UI) Law of Maryland and the unemployment compensation for federal employees (UCFE) program This data series accounts for approximately 91 percent all civilian employment Excluded from this data are the self-employed 51 US Bureau of Labor Statistics Quarterly Census of Employment amp Wages (QCEW) Data
-05 00 05 10 15 20 25 30 35
Mid-Maryland Lower Shore
Southern Maryland Susquehanna
Anne Arundel Montgomery
Maryland Upper Shore
Baltimore County Frederick
Western Maryland Prince Georgersquos
Baltimore City
Employment Change
2005-2006
30
Marylandrsquos Labor Demand
Employment Composition
Approximately 180 percent of the statersquos aggregate economy falls within the public sector which is comprised of local state and federal governments As a whole the public sector grew at a 16 percent clip above the average for all major sectors and pays higher than average weekly wages of $1029 With employment just above 125000 in 2006 the federal government sector comprises 49 percent of the statersquos economy and pays average weekly wages of $1438 substantially higher than the average
The importance of the federal government to the statersquos economy cannot be underestimated The many federal laboratories and facilities located within and near Maryland such as Goddard Space Flight Center and the Naval Air Systems Command at Patuxent River have contributed greatly to Marylandrsquos aerospace industry The presence of the Food and Drug Administration (FDA) and the National Institutes of Health (NIH) has spurred growth among bioscience firms The National Security Agency and Marylandrsquos many military installations have been critical to building the statersquos base of defense-related businesses
Figure W Marylandrsquos Economic Composition 200652
1-YEAR CHANGE IN EMPLOYMENT SECTOR EMPLOYMENT
LEVEL ABSOLUTE PERCENT
WEEKLY WAGES
AGGREGATE ECONOMY 2529671 31932 13 $887 PUBLIC SECTOR 455820 7170 16 $1029
Local Government 233109 6978 31 $848 State Government 97530 826 09 $879 Federal Government 125181 -634 -05 $1438
PRIVATE SECTOR 2073851 24762 12 $856 Retail Trade 299508 906 03 $620
Healthcare amp Social Assistance 295006 8871 31 $737 Professional Scientific amp Technical Services 219155 5236 24 $1401 Accommodations amp Food Services 193278 -303 -02 $377
Construction 188357 5331 29 $926 Administrative amp Support amp Waste 157299 1275 08 $710
Manufacturing 136328 -4166 -30 $1700 Finance amp Insurance 109595 -379 -03 $1238 Wholesale Trade 94927 677 07 $1097 Other Services (Except Public Administration) 89612 466 05 $585 Educational Services 54007 -66 -01 $815 Transportation amp Warehousing 65867 2237 35 $863
Real Estate amp Rental Leasing 48004 -299 -06 $886 Information 50770 392 08 $1218 Arts Entertainment amp Recreation 36476 812 23 $644
Management of Companies amp Enterprises 17763 4199 310 $1696 Utilities 9711 -38 -04 $1709
52 RESI US Bureau of Labor Statistics Quarterly Census of Employment amp Wages (QCEW) Data
31
Marylandrsquos Labor Demand
Agriculture Forestry Fishing amp Hunting 5031 -128 -25 $573 Mining 1794 67 39 $884
Not Elsewhere Classified 1362 -327 -194 $1111
With employment in excess of 207 million the private sector comprises the lionrsquos share (820 percent) of Marylandrsquos economy One of the single largest private sector industries in the state is the Healthcare amp Social Assistance sector In 2006 employment in this sector expanded by 31 percent to just over 295000 employees Retail Trade Professional Scientific amp Technical Services and Accommodations amp Food Services also rank among the largest private sector employers within the state each employing a significant proportion of Maryland workers
Regional employment distributions across industries are fairly similar to that of the state as a whole with a few notable exceptions Both Southern Maryland (comprised of Calvert Charles and St Maryrsquos counties) and Frederick Prince Georgersquos and Montgomery counties boast high concentrations of public sector and especially federal government employment Federal government employment comprises 92 percent of Southern Marylandrsquos aggregate economy The collective share for Frederick Prince Georgersquos and Montgomery counties is 80 percent Montgomery and Frederick counties have the highest proportion of employment within Professional Scientific amp Technical Services in the state with shares of 140 percent and 135 percent respectively Western Maryland and the Upper Shore are home to a significantly higher proportion of Manufacturing employment with 113 and 123 percent respectively In both of these areas the share of Manufacturing employment is more than double that of the state as a whole
Western Maryland boasts the highest share of Transportation amp Warehousing employment (42 percent) This is reflective of the way Washington County in particular has been able to leverage successfully the regionrsquos excellent transportation infrastructure which includes access to three interstates (I-68 I-70 and I-81) and two railway lines (CSX Transportation and Norfolk Southern) to reinvent itself as a transportation hub Washington County currently is home to 151 Transportation amp Warehousing businesses including the Staples Distribution Center
Montgomery County leads the state in share of Information employment (33 percent) and boasts the highest concentration (15 percent) of employment within the Management of Companies amp Enterprises sector The Lower Shore employs a significantly large proportion of workers within the Accommodations amp Food Services sector Employment in this industry comprises 155 percent of the regionrsquos economy compared to just 76 percent for Maryland as a whole
32
Marylandrsquos Labor Demand
Among the fastest growing Maryland employment sectors are high wage sectors such as Professional Scientific amp Technical Services which expanded by more than 4900 positions or 23 percent between the third quarters of 2005 and 2006 Also growing quickly were Management of Companies amp Enterprises with growth of more than 4300 positions and Wholesale Electronic Markets amp Agents amp Brokers with growth of 2314 positions Each of these sectors pays weekly wages above $1300 well in excess of the $858 average for all Maryland industries Growth also is being led by Food amp Beverage Stores which expanded by 4543 jobs or 77 percent and the demographically driven Nursing amp Residential Care Facilities industry with growth of 3409 positions or 57 percent Specialty Trade Contractors also ranks high on the list
Figure X Top Employment Gaining Maryland Industries 2005Q3 ndash 2006Q353
RANK INDUSTRY EMPLOYMENTLEVEL 1-YEAR CHANGE IN
EMPLOYMENT ABSOLUTE PERCENT
WEEKLY WAGES
1 2 3 4 5 6 7
8 9
10
11 12 13 14 15
Professional Scientific amp Technical Services Food amp Beverage Stores Management of Companies amp Enterprises Nursing amp Residential Care Facilities Specialty Trade Contractors Ambulatory Healthcare Services Hospitals Wholesale Electronic Markets amp Agents amp Brokers Food Services amp Drinking Places Warehousing amp Storage Building Material amp Garden Equipment amp Supplies Dealers Transit amp Ground Passenger Transportation Clothing amp Clothing Accessories Stores Construction of Buildings Couriers amp Messengers
219324 63824 18065 63235
128225 95508 95046
12827 177052
10747
26550 8838
30520 45944 11393
4920 23 4543 77 4337 316 3409 57 2951 24 2635 28 2602 28
2314 220 2007 11
944 96
894 35 815 102 788 27 718 16 641 60
$1335 $465
$1421 $538 $850 $985 $896
$1434 $295 $762
$609 $457 $331 $966 $726
53 RESI US Bureau of Labor Statistics Quarterly Census of Employment amp Wages (QCEW) Data
33
Marylandrsquos Labor Demand
Industries rapidly shedding jobs are led by a mix of retail services and manufacturing sectors including General Merchandise Stores which contracted by more than 6900 positions or 127 percent between the third quarters of 2005 and 2006 Accommodations (loss of more than 2700 positions) and Insurance Carriers amp Related Activities (loss of 1116 positions) The latter industry pays weekly wages approaching $1200 well in excess of the $858 average for all Maryland industries Manufacturing sectors comprise five of the most rapidly declining industries including Computer amp Electronic Product Manufacturing Primary Metal Manufacturing Leather amp Allied Product Manufacturing Transportation Equipment Manufacturing and Wood Product Manufacturing Collectively these industries shed nearly 2600 jobs from the statersquos payrolls It is important to note that with the exception of Wood Product Manufacturing these contractions are concentrated within high-paying sectors
Figure Y Top Employment Losing Maryland Industries 2005Q3 ndash 2006Q354
RANK INDUSTRY EMPLOYMENT LEVEL
1-YEAR CHANGE IN EMPLOYMENT
ABSOLUTE PERCENT
WEEKLY WAGES
1 2 3 4
5 6 7 8
9 10 11 12 13 14 15
General Merchandise Stores Accommodations Insurance Carriers amp Related Activities Merchant Wholesalers Durable Goods Sporting Goods Hobby Book amp Music Stores Merchant Wholesalers Nondurable Goods Motion Picture amp Sound Recording Industries Motor Vehicle amp Parts Dealers Computer amp Electronic Product Manufacturing Miscellaneous Store Retailers Rental amp Leasing Services Primary Metal Manufacturing Leather amp Allied Product Manufacturing Transportation Equipment Manufacturing Wood Product Manufacturing
47619 24725 34577 52555
13161 29846 4489
38795
21786 18947 13595 3583
171 8314 3567
-6927 -127 -2729 -99 -1116 -31 -1066 -20
-1005 -71 -1002 -32
-695 -134 -659 -17
-653 -29 -634 -32 -544 -38 -533 -129 -489 -741 -465 -53 -445 -111
$365 $428
$1173 $1194
$395 $941 $444 $842
$1659 $425 $723
$1124 $911
$1164 $692
54 RESI US Bureau of Labor Statistics Quarterly Census of Employment amp Wages (QCEW) Data
34
Marylandrsquos Labor Demand
52 Base Realignment and Closure Commission (BRAC) Demand
The most recent round of BRAC decisions clearly will benefit Marylandrsquos economy and will result in thousands of new high-skill high-wage jobs moving into the state over the next five years However the anticipated influx of Department of Defense (DoD) and associated contractor positions ndash estimated at between 40000 and 60000 new jobs ndash presents its own set of challenges from a workforce development perspective
The BRAC legislation mandates that several DoD units (comprised of more than 15000 civilian DoD personnel) must move to Maryland by 2011 The extent to which current DoD employees will follow their jobs to Maryland is not clear Recent estimates indicate that between 30 and 50 percent of the civilian employees working at Fort Monmouth New Jersey plan to follow their jobs to Aberdeen55 Filling the gap with existing Maryland workers and recruiting new employees will present a significant workforce development challenge This challenge will undoubtedly escalate as existing civilian DoD workers approach retirement According to a report issued by the Pentagon in 2002 the average age of DoD employees is 452 years
The size and scope of the DoD units moving to Maryland as a result of BRAC could be influenced by future and current workforce availability In other words if jobs go unfilled they could very well be lost The challenge for workforce development officials is to ensure that Maryland gains as many potential BRAC jobs as possible The way to achieve this goal is to make sure that new positions are filled quickly Implementing an efficient security clearance process is one way to work toward this goal
Most important the Statersquos workforce development system must strive to ensure that Marylandrsquos labor pool is ready and able to fill the types of jobs that BRAC will bring to Maryland Both the Fort Monmouth and the Defense Information Systems Agency (DISA) units that are slated to move to Maryland report a high proportion of the following occupations
Electricalelectronics engineers Computer engineers Management and program analysts Computer scientists Information technology managers General engineers Telecommunications specialists
55 September 28 2007 presentation by Mark Fuhring Deputy Director of Human Resources CECOM Life Cycle Management Command
35
Marylandrsquos Labor Demand
These occupations require a Bachelorrsquos degree mainly in the engineering and sciences fields for entry-level positions For higher grade positions graduate education andor a combination of work experience is required Key skills associated with these positions include
Complex problem solving Critical thinking Judgment and decision making Systems evaluation56
Technology design57
There will be ancillary effects of BRAC to be considered as well Specifically the influx of BRAC personnel and contractors will drive significant construction activity and the demand for personal services The influx also will ramp up demand for services workers such as construction managers and workers day care workers and hospitality workers among others Community colleges in Harford and Anne Arundel counties already have begun to explore program needs associated with these occupations According to a report produced by RESI in 2006 for every direct on-base job58 job that comes to Maryland 196 additional spin-off jobs will be created59 This is an area that should be explored fully by workforce development professionals
53 Demand for Science Technology Engineering and Mathematics (STEM) Workers
In recent years upper-level degrees in science and engineering have been awarded to high proportions of foreign-born students According to the National Academy of Science 59 percent of US engineering doctorates were awarded to foreign students in 200360 In 2004 roughly 63 percent of the 147 doctoral degrees in engineering awarded by Maryland institutions went to foreign students including a small number of non-US citizens with permanent resident visa status and a much larger portion of non-US citizens with temporary visa status
This trend can benefit our economy since many foreign-born people with doctorates remain in the country to work at least for some period of time Americarsquos ratio of natural sciences and engineering degrees awarded to our college age population (57 per 100) severely lags that of Japan (8 per 100) Europe (8-13 per 100) and Taiwan and South Korea (11 per 100) Recent evidence indicates however that US institutions are facing greater competition from international schools for these students a concern noted in the Maryland Higher Education Commissionrsquos 2004 plan Increased immigration restrictions have not helped the situation In 2000 Asian universities awarded 12 million of the worldrsquos science and engineering degrees (undergraduate graduate and doctoral) while the US awarded just 500000
56 The US Department of Labor defines systems evaluation as follows Identifying measures or indicators of system performance and the actions needed to improve or correct performance relative to the goals of the system 57 Technology design is defined as Generating or adapting equipment and technology to serve user needs 58 Direct on-base positions include civilian DoD positions as well as embedded private defense contractors 59 RESI Maryland Department of Business amp Economic Development 2006 60 National Academy of Science p7 2007
36
Marylandrsquos Labor Demand
It should be noted that a 2005 Duke University study presents the US in a more competitive light61 The study notes that previously published figures on the number of engineering or computer science graduates for the US China and India are not necessarily comparable due to differences in the types of programs and program length etc According to Dukersquos findings when the number of degrees granted is normalized to account for population size (on a per one million citizen basis) the US generates 750 technology specialists compared to 500 produced by China and 200 produced by India
While the scope of the competition that US higher educational institutions currently face is debatable there is one point on which analysts agree national and local economies will face greater demand for scientists and engineers going forward Marylandrsquos demand for workers in these sectors will be exacerbated further by demographics (as many current workers approach retirement) and by the impacts of BRAC which will result in the movement of a significant number of science and engineering jobs to Maryland in the near future
According to this measure Maryland fares better than most states After all Maryland ranks second in the nation in our concentration of doctoral scientists and engineers62 as well as in our number of employed PhD scientists and engineers per 100000 workers (9385)63 We are home to a multitude of federal and university research labs and rank second in the nation in terms of federal research and development spending and first in terms of university research dollars64
Still given future demand growing our base of science and engineering degrees must remain a high priority
Various Maryland entities recognize this need including GWIBrsquos Aerospace Industry Steering Committee which recommended several initiatives aimed at promoting science technology engineering and mathematics (STEM) education in Maryland Among these is the recommendation for the creation of a STEM Center of Excellence as well as the development of articulation agreements between high school pre-engineering programs and college programs Industry internships and mentorships also are identified as a means to grow Marylandrsquos supply of scientists and engineers
The Maryland State Department of Education (MSDE) also is well aware of the need for more scientists and engineers and began implementing Project Lead the Way (PLTW) in 2003-2004 PLTW is a pre-engineering program which aims to increase preparation among high schools students for higher education engineering programs Forty-three (43) Maryland high schools in 16 school systems participate in the program which allows students to enroll in such courses as Principles of Engineering Computer Integrated Manufacturing Civil Engineering and Aerospace Engineering Maryland recently received the Joseph H Oakley Excellence in Education Award for its PLTW progress Maryland also will be piloting the newly-launched PLTW for the biomedical sciences curriculum An aerospace PLTW program also is in the planning stages
61 Duke University 2005 62 National Science Foundation 2003 63 National Science Foundation State Science amp Technology Institute 2003 64 Maryland Higher Education Commission 2004
37
Marylandrsquos Labor Demand
Another MSDE program that focuses on this area is the Super Stem Project which partners higher education (the University of Maryland Baltimore County) with the Baltimore County Public Schools and MSDE The program is funded by the National Science Foundation and targets improving student achievement teacher quantity and quality specifically within STEM programs
54 The Demand for Basic and Applied Skills
The Conference Board in collaboration with several other organizations conducted a survey of US firms in 2006 to determine how employers rate new entrants to the workforce65 The results were not positive Overall employers do not consider recent graduates (high school graduates as well as graduates of two- and four-year institutions) to be adequately prepared for the workforce Specifically firms identified the following shortcomings among these populations
Figure Z Deficiencies of New Entrants to the US Workforce as Specified by Employers66
High School Graduates are bull ldquoDeficientrdquo in the basic knowledge and skills of Writing in English Mathematics and Reading Comprehension bull ldquoDeficientrdquo in Written Communications and Critical ThinkingProblem Solving
both of which may be dependent on basic knowledge and skills bull ldquoDeficientrdquo in ProfessionalismWork Ethic and bull ldquoAdequaterdquo in three ldquovery importantrdquo applied skills Information Technology Application
Diversity and TeamworkCollaboration Two-Year and Four-Year-College Graduates are bull Better prepared than high school graduates for the entry-level jobs they fill bull ldquoDeficientrdquo in Writing in English and Written Communications and bull ldquoDeficientrdquo in Leadership
65 The Conference Board 66 The Conference Board p11
38
Marylandrsquos Labor Demand
GWIBrsquos Industry Monograph for Marylandrsquos Hospitality amp Tourism Industry confirms these findings The GWIB report identifies a critical mismatch between the ldquojob-readinessrdquo or basic skills required for the majority of occupations within the sector and the skill levels of new entrants to the field The majority of occupations within this sector require basic skills and on-the-job training In fact only one occupation out of 35 requires a Bachelorrsquos degree or higher (General and Operational Managers) Yet for the balance of occupations employers are having difficulty finding workers with good active listening skills service orientation and cultural awareness and sensitivity Finding job entrants with the ability to read write and understand standard and spoken English also is a critical priority for the industry To address these issues the report recommends creating a statewide resource network to advance basic skills and to support tax incentives for worker training in English as a Second Language among other recommendations
According to occupational projections updated by the Maryland Department of Labor Licensing amp Regulation (DLLR) the top four occupations in which we expect to see the greatest level of replacement openings between 2004 and 2014 include67
Cashiers (33780 replacement openings) Retail salespersons (31670) Waiters and waitresses (21585) Combined food preparation and serving workers (17035)
This list is not surprising as these occupations have been associated traditionally with limited career paths and high turnover rates However this list also brings the issue of basic skills to the forefront Not only do these occupations rank high in terms of projected turnover they also lead the state in terms of total projected job openings between 2004 and 2014 Using US Department of Labor occupational data (ONET)68 one can determine that these occupations require basic skills (as defined by the Department of Labor) such as active listening speaking writing and reading comprehension
The Conference Board also indicates that while both basic skills and applied skills69 are paramount for new entrants to the workforce applied skills tend to be rated as the most critical 21st century skills employers are seeking The four top-rated skills are considered to be applied skills according to the study They include (1) ProfessionalismWork Ethic (2) Oral and Written Communications (3) TeamworkCollaboration and (4) Critical ThinkingProblem Solving
67 Maryland Department of Labor Licensing amp Regulation Office of Workforce Information and Performance and Office of Labor Statistics 2007 68 The US Department of Laborlsquos online information system (ONET) The ONET online system provides occupational information as well as information on key attributes and characteristics of workers and occupations 69 Examples of basic skills noted in the study include reading comprehension spoken and written English mathematics science knowledge of a foreign language etc Applied skills include lifelong learningself direction creativityinnovation leadership etc
39
Looking Ahead Identifying Gaps Challenges and Opportunities
60 Looking Ahead Identifying Gaps Challenges and Opportunities
61 The Gap between Marylandrsquos Jobs and Labor Supply is Growing
The gap between the size of Marylandrsquos labor force and the statersquos inventory of jobs is widening70 The number of jobs in Maryland has outnumbered the statersquos resident labor force for several decades In 1970 the gap was roughly 46000 By 1990 this figure had more than doubled to nearly 120000 By 2020 this gap is expected to exceed 528000 The situation is not as dire as it appears to be on the surface since workers residing in neighboring states will continue to fill some portion of these jobs however the widening gap certainly will translate into greater competition for available labor
Figure AA Historic and Projected Maryland Resident Labor Force and Jobs by Place of Work71
Labor Force Number of Jobs
4000000
3500000
3000000
2500000
2000000
1500000
1000000
1970 1980 1990 2000 2010 2020 2030
Lab
or F
orce
Jo
bs
After 2010 labor force growth is expected to slow Between 2010 and 2020 for example the statersquos labor force is expected to increase by roughly 200000 (down from expected growth of more than 360000 over the previous decade) Much of the anticipated slowdown in labor force growth is attributable to the graying of our population For years experts have been anticipating the dramatic ways in which our aging workforce will affect national state and local economies The implications of this megatrend are enormous They range from the need for employers to adapt to increasing generational diversity and generational differences in the workplace to the need for companies to ensure that knowledge and skills are retained as older workers retire Maryland must confront the impacts of these demographic shifts along with the rest of the nation
70 The Maryland Department of Planning projects jobs by place of work using historical data released by the Bureau of Economic Analysis These are jobs which are located in Maryland but are filled by both state and non-state residents The statersquos resident labor force also is projected by the Maryland Department of Planning based on historical Bureau of Economic Analysis data Projections were updated in November 2006 71 Maryland Department of Planning November 2006
40
Looking Ahead Identifying Gaps Challenges and Opportunities
The following chart details Marylandrsquos historical current and projected labor force composition by age The proportion of adults age 55 years old and older who are active in the workforce is projected to increase from roughly 12 percent in 1990 to 26 percent by 2020 The proportion of Marylandrsquos workforce comprised of adults age 35 to 54 years old on the other hand is expected to decrease from 43 percent to 39 percent over the same period As previously mentioned this trend is due to the graying of the population ndash there are simply fewer people making up Generations X and Y compared to the size of the baby boomer generation
Figure AB Historic and Projected Proportion of Marylands Labor Force by Age72
Perc
ent o
f Lab
or F
orce
00
100
200
300
400
500
600
1990 2000 2010 2020 2030
16-34
35-54
55+
72 Maryland Department of Planning 2006
41
Looking Ahead Identifying Gaps Challenges and Opportunities
62 The Race to Preserve Institutional Knowledge
The impacts of Marylandrsquos aging population are not limited simply to the issue of filling jobs Shifting demographics and the approaching retirement of older workers will place increased pressure on firms to preserve institutional knowledge Simply put companies and industry are scrambling to prevent ldquobrain drainrdquo for good reasons
The dearth of qualified nuclear engineers and related workers illustrates this issue perfectly According to the Nuclear Energy Institute (NEI) the US nuclear industry faces a critical shortage of workers by 2010 In fact NEI finds that less than eight percent of industry employees are younger than 32 years of age and more than half are age 47 or older Expected shortages will affect a broad cross section of occupations within the industry ranging from health physicists and plant operators to technicians welders and maintenance workers73 The timing is especially problematic as the Nuclear Regulatory Commission expects an influx of applications for nearly three dozen new reactors by 2008 including Constellation Energy Grouprsquos application to build a new nuclear reactor at Calvert Cliffs74 Clearly industry and workforce development professionals must ensure that institutional knowledge within this critical industry is preserved and a sufficient pipeline of future workers is developed
The nuclear engineer example is not an isolated case According to findings from GWIBrsquos Aerospace Industry Initiative Workforce Summit conducted in January 2006 50 percent of the aerospace workforce in Maryland is expected to retire in the next 15 years A 2002 Accenture publication notes that ldquoThe vast majority of US and European chemical companies are concerned about problems posed by their aging workforce Estimates that 50 percent of employees will become retirement eligible in a particular function in the next decade are not uncommon in the US and Europerdquo75 Marylandrsquos Educational Services sector which already is feeling the impact of critical shortages ranks among those industries with a high proportion of older workers (roughly 18 percent are age 55 plus)76 The Healthcare sector is another that has begun to feel the impact of an aging workforce In 1998 nearly 24 percent of Marylandrsquos registered nurses working in hospitals were between the ages of 48 and 57 years old and another 19 percent were over the age of 58 By 2005 these proportions had grown to 28 and 25 percent respectively77 According to GWIBrsquos Healthcare Workforce Summit monograph vacancy rates in 2002 for registered nurses (156 percent) radiation therapy technicians (211 percent) and licensed practical nurses (129 percent) at Maryland hospitals already are high The issue of brain drain and shortages undoubtedly will be compounded as the demand for healthcare services increases due to the graying of the population78
73 Nuclear Energy Institute 2007 74 Baltimore Sun Constellation Energy files partial plan for reactor July 31 2007 75 DeLong page 3 76 Carroll 2004 77 Maryland Board of Nursing 78 One recommendation developed from GWIBrsquos Healthcare Workforce Summit involves transitioning retired military personnel to the private sector Many of these personnel have accumulated vast experience and training but lack proper certification ProVET (Providing Re-employment Opportunities to Veterans) is one program Maryland has launched in recent years to provide transition assistance for those veterans who are interested in securing private sector employment
42
Looking Ahead Identifying Gaps Challenges and Opportunities
63 FacultyTeacher Shortages
It is not the intention of this analysis to minimize the significance of labor shortages already occurring in Maryland industry sectors ndash for example that of registered nurses and other healthcare professionals However given that much already has been written about these shortages this analysis instead targets the issue of faculty shortages
Marylandrsquos need for teachers outstrips the statersquos ability to produce and retain them In 2005 school systems throughout the state hired roughly 8000 teachers of which 4350 were beginning new hires Only one-third (1439) of the beginning new hires had graduated from Maryland colleges and universities
Particular subjects facing current and future shortages include Technology education Computer science English for Speakers of other Languages Foreign languages Mathematics Science Special education
The issue of faculty shortages extends to higher education as well and is affecting a range of Maryland industries including the healthcare sector As noted in GWIBrsquos HealthCare Monograph ldquothe amount of faculty and learning facilities is inadequatehelliprdquo to train the statersquos healthcare workforce These shortcomings are evidenced by student waiting lists at local nursing schools79 Indeed nursing programs both locally and nationally report an increase in the number of qualified nursing applicants being turned away due to a dearth of faculty and classroomclinical space In 2005 the number of applicants denied admission due to a lack of faculty or classroom and clinical space jumped to 29424 nationally and 1850 in Maryland
According to a 2005 survey80 the statersquos 24 nursing degree programs reported that 305 percent of full-time faculty positions were vacant Local shortages are attributed to both the aging of the statersquos faculty population as well as the difficulties in growing the pool of potential educators These difficulties range from structural barriers like limited local capacity of graduate programs in nursing education to market-driven trends (eg compensation for practicing nurses often exceeds that for nursing educators) These trends undoubtedly will be exacerbated as Marylandrsquos nursing faculty population continues to age and approach retirement The average age of nursing faculty at Maryland institutions as reported to the Board of Nursing in 2005 ranges from 42 to 55 years and nationally the average age of faculty retirement is 625 years81
79 Charting New Directions Governorrsquos Healthcare Workforce Summit page 13 80 Maryland Council of Directors of Associate Degree and Baccalaureate Programs Survey 81 Nursing Faculty Shortage Causes Effects and Suggestions for Resolution Maryland Statewide Commission on the Crisis in Nursing 2005
43
Looking Ahead Identifying Gaps Challenges and Opportunities
64 Increasing Age Diversity
Business and industry also will need to accommodate increased age diversity in the workplace According to a 2005 Forbes magazine article ldquoEmployers need to examine whether their policies programs and practices are age neutral For example is the company offering dependent care geared only toward children when the workforce may be at an age where elderparent care has more valuerdquo82
Adjusting to differences in generational attitudes and preferences in the workplace will present its own set of challenges For instance the chemical industry has become accustomed to low voluntary turnover among managers and professionals As younger generation workers (Generation X and Y in particular) replace retirees the industry will need to adapt to an increased tendency for voluntary attrition as these workers tend to be more willing to seek out better job opportunities83 Many today consider employee loyalty to be a thing of the past especially among todayrsquos younger workers who are perceived to be constantly on the prowl for bigger and better opportunities
The aging of our population also has implications for education As the age of students at postshysecondary educational institutions rises and as workers continue to pursue lifelong learning campuses and faculty increasingly will require additional flexibility in terms of location timing etc MHEC recognized this need in their 2004 plan and set a goal to enhance alternative approaches for educational delivery ndash namely distance learning and regional higher education centers The Statersquos academic institutions already have begun to respond to these needs as evidenced by institutional expansion to satellite campuses the expansion of 2+2 programs84 and increased investments in and access to distance learning programs that are part of Marylandrsquos higher education system
65 Immigrants Continue to Grow Marylandrsquos Labor Supply
Marylandrsquos workforce is expected to benefit from international migration at both ends of the employment spectrum as immigrants fill low-wage low-skill jobs as well as high-wage high-skill positions Low-skill jobs such as Combined Food Preparation amp Serving Workers for example continue to rank among the top occupations demanded in Maryland According to data published by the Urban Institute immigrants comprise a disproportionately high share (20 percent) of low-wage workers in the US Immigrant workers represent an especially large proportion of low-wage occupations within the farming and private household sectors According to 2002 estimates immigrants compose 37 and 42 percent of employment in these sectors respectively85 The Pew Hispanic Center reports that short-term unauthorized immigrants are concentrated heavily in the low-wage construction (including building and
82 Reeves 200583 Accenture Institute for Strategic Change 2002 84 2+2 is a program in which the first two years of post-secondary education are completed at a community college and the remainder is completed at a partner four-year institution85 Capps 2003
44
Looking Ahead Identifying Gaps Challenges and Opportunities
grounds cleaning and maintenance occupations) and hospitality industries (including food preparation and service occupations)86
GWIBrsquos Hospitality and Tourism monograph reveals the importance of this workforce to local industry The report documents Marylandrsquos reliance on immigrant workers seasonal and otherwise to fill a variety of occupations within this sector ranging from food service occupations such as bartenders hosts and hostesses cooks dishwashers and food preparation workers to grounds keeping workers desk clerks receptionists maids and housekeeping cleaners and security guards etc The report finds that the need for these workers outstrips supply The limited number of H-2B worker visas which allow for the temporary hiring of foreign workers granted to Maryland businesses is not enough to fill the vacant positions
Other immigrant segments are expected to continue to fill high-wage high-skill jobs in such occupations as scientists and engineers The Migration Policy Institute analyzed Census 2000 data and found that one out of every five doctors in the US is foreign born Two of every five medical scientists one of every five computer specialists and one of every six people in the engineering or science fields are foreign born In addition the proportion of foreign-born workers in other skilled fields such as nursing has grown significantly in recent years a trend which is expected to continue87
86 Pew Hispanic Center 2006 87 Kaushal 2006
45
Looking Ahead Identifying Gaps Challenges and Opportunities
0
20000
40000
60000
80000
100000
120000
1980 1990 2000Peop
le W
ho S
peak
Eng
lish
Not
Wel
l o
r N
ot a
t All
Figure AC Maryland Population Who Speak English ldquoNot Wellrdquo or ldquoNot at Allrdquo
From a workforce development perspective the movement of immigrants into Maryland will require increased investment in English as a Second Language (ESL) programs According to the decennial census data the percentage of people who reported to the Census Bureau that they spoke English ldquonot wellrdquo or ldquonot at allrdquo increased nearly 74 percent since 1990 (Figure AC) Of the more than 246000 persons who indicated that they spoke English ldquoless than very wellrdquo 44
percent reported Spanish as their native language while another 26 percent indicated an Asian language (particularly Korean Chinese and Vietnamese) as their native language Much of this population represents non-English speaking immigrants who present new challenges in terms of labor force training and education Recognizing this need organizations such as US Hispanic Youth Entrepreneur Education (USHYEE) in partnership with the Maryland State Department of Education (MSDE) and colleges and universities within the state are working together to provide Hispanic youth with scholarships along with technical and life skills that will encourage this segment of the population to seek higher education opportunities
The statersquos growing immigrant population has the potential to fill another significant role in Marylandrsquos economy As commerce and industry become more global knowledge of a foreign language is becoming increasingly critical to local businesses In fact a recent survey of US employers confirms that speaking a foreign language is expected to be a highly demanded skill in the 21st century Survey results indicate that while only 11 percent of employers currently rate this skill as ldquovery importantrdquo approximately two-thirds indicate that knowledge of a foreign language will increase in importance over the next five years In fact knowledge of a foreign language was singled out as the top basic skill expected to increase in importance88 In 2005 145 percent of Marylanders age five and older spoke a language other than English at home89 a trend that clearly will benefit the state in its efforts to meet foreign language needs
88 The Conference Board p11 89 US Census Bureau American Community Survey 2005
46
Looking Ahead Identifying Gaps Challenges and Opportunities
66 Adult Education and Engaging Workers with Barriers to Employment
Todayrsquos jobs and the jobs of tomorrow will require an increasingly complex array of skills including but not limited to verbal mathematical organizational and interpersonal skills This further complicates matters for the one million potential Maryland workers who have barriers to employment They include Marylandrsquos veteran population people with lower literacy ex-offenders people with disabilities and those receiving unemployment insurance benefits90
Preparing these workers for the jobs of the future presents another challenge for the Statersquos workforce development system As previously mentioned these populations are a potentially untapped labor supply If workforce development professionals can help this population transition more fully into the workforce tight labor market conditions may be alleviated
Veterans Population
As of 2005 more than 427000 people or 119 percent of the statersquos population 18 and over were veterans The vast majority of Maryland veterans (89 percent) are male Not surprisingly female veterans tend to be younger than their male counterparts A total of 776 percent of female veterans are between 18 and 54 years of age compared to 372 percent of male veterans91
Ex-Offenders
The number of offenders released from Maryland Department of Public Safety and Correctional Services facilities in 2006 approached 14000 Approximately six out of 10 or 8685 people were released in Baltimore City As of April 2007 nonviolent offenders constituted 426 percent of the nearly 23000 inmates housed in Maryland facilities More than 20 percent of this population is age 25 or under and another 171 percent are between 25 and 30 years of age Nearly 3400 of them or 149 percent of this population are serving a sentence of 36 months or less
Transitioning ex-offenders into the workforce is critical not only from a workforce development perspective but from a public safety perspective as well To the extent that this population can become engaged in the workforce the likelihood of recidivism is expected to decline
Lower Literacy Population
According to a report released recently by the US Department of Education roughly 206 percent of Marylandrsquos adult population (or 730000) was eligible for adult education services as of 2000 This population includes individuals who ldquolack sufficient mastery of basic educational skills to enable the individuals to function effectively in societyrdquo lack a high school diploma or equivalent or (are) ldquohellipunable to speak read or write the English languagerdquo Specifically this
90 Examples of other population segments that could be targeted include homeless persons welfare recipients and youth out of school among others 91 US Census Bureau American Community Survey 2005
47
Looking Ahead Identifying Gaps Challenges and Opportunities
population includes those adults age 16 or older who lack a high school diploma and who are not enrolled in school and adults who speak English as a second language and who have rated their ability to speak English as ldquowellrdquo ldquonot wellrdquo or ldquonot at allrdquo92
The vast majority of this adult education population (601 percent) is of working age (from 16 to 59 years old) yet in 2000 well over half of them (348717 persons) did not participate in the statersquos labor force Another 28484 reported they were unemployed Basic literacy and English as a Second Language instruction is needed to help transition this group more fully into the workplace More than 105000 of Marylandrsquos adult education population speak English as a second language and nearly half of this group (51952) identify themselves as speaking English ldquonot wellrdquo or ldquonot well at allrdquo93
People with Disabilities
Maryland is home to more than 376000 working age (from 16 to 64) people with disabilities Only about 43 percent of these people are employed compared to 78 percent for the remainder of the statersquos working age population94 The low employment rate for people with disabilities combined with the fact that many of them can become employed with or without accommodations are reasons that the GWIB views people with disabilities as an untapped workforce
Unemployed Persons and Persons Receiving Unemployment Insurance Benefits
As of August 2007 the number of unemployed Marylanders is on track to approach last yearrsquos level of roughly 116000 persons This population includes people who are not working but who are actively seeking work They are counted as part of Marylandrsquos labor force Though the number of unemployed people in Maryland has been on the decline since 2004 they still represent a substantial potential labor pool
More than 18000 initial unemployment claims were filed in Maryland in June 2007 The extent to which the State can link these persons with employment opportunities will help to decrease the number of people filing for initial and continuing unemployment insurance claims and will help increase Marylandrsquos available labor pool
92 US Census Bureau Profiles of the Adult Education Target Population Information from the 2000 Census December 2005 93 US Census Bureau Profiles of the Adult Education Target Population Information from the 2000 Census December 2005 94 US Census Bureau 2006 American Community Survey
48
Recommendations
70 Recommendations
This section of the analysis highlights a number of emerging challenges that will test the statersquos economic and workforce strengths over the next one to five years and provides priority recommendations to address these challenges
71 Science Technology Engineering and Mathematics (STEM) Industries are Struggling to Attract Recruit and Retain Workers
As in other industries many of Marylandrsquos science technology engineering and mathematics (STEM) industries face a looming retirement cliff as skilled baby boomers begin to retire and leave the workforce Compounding the problem is anecdotal and other evidence which suggests that the pool of qualified technical students graduating from college is actually diminishing The statersquos aerospace industry serves as a prime example According to the GWIB Aerospace Industry Steering Committee in 2006 nearly eight out of every 10 Maryland aerospace workers was age 51 or over and 50 percent of the current aerospace workforce is set to retire by 2020
Recommendation Increase opportunities for young people to become aware of and enter science technology engineering and mathematics (STEM) careers
One way to meet the need for workers in science technology engineering and mathematics (STEM) careers is to expand middle- and high school-level studentsrsquo interaction with STEM professionals through expanded internship and mentorship programs GWIBrsquos Aerospace Monograph also identifies the need to encourage STEM-related field trips and other applied activities and to invite industry professionals to classes or school activities The Johns Hopkins Universityrsquos Applied Physics Labrsquos (APL) Mentor Program is a perfect example of such interaction The program is conducted in conjunction with the Howard County Public Schools and other nearby schools and pairs high school students with volunteer APL professional staff The program enables students to work on science projects with their mentors during the school year
Encouraging qualified underrepresented population segments (ie females and minorities) to pursue studies in science and mathematics is another way to boost interest APL and a number of university partners are involved in a program that targets this issue The Maryland Mathematics Engineering Science Achievement program (MESA) is a pre-college program in which MESA partners work directly with teachers and schools in order to encourage K-12 interest in STEM fields The program targets minorities and females
Recommendation Expand and enhance pre-college programs such as Project Lead the Way
Expanding programs such as MSDErsquos Project Lead the Way (PLTW) is another approach PLTW is a pre-engineering program which aims to increase preparation among high school students for higher education engineering programs Forty-three (43) Maryland high schools in 16 school systems participate in the program which allows students to enroll in such courses as Principles of Engineering Computer Integrated Manufacturing Civil Engineering and
49
Recommendations
Aerospace Engineering Maryland soon will pilot the newly-launched PLTW for a biomedical curriculum An aerospace PLTW program also is in the planning stages
72 Maryland Continues to Face Growing Teacher and Faculty Shortages
The state continues to confront shortages among teachers and faculty Marylandrsquos need for teachers outstrips our ability to produce and retain them In 2005 roughly 8000 new teachers were hired in the state of Maryland Of the 4390 teachers who were new hires only 1439 (33) were graduates of Maryland colleges and universities95 Subjects with current and future teacher shortages include technology education computer science English for Speakers of other Languages foreign languages mathematics science (including physical science physics chemistry and earthspace science) and special education
The issue of faculty shortages extends to higher education as well and is affecting a number of Maryland industries including the healthcare sector As noted in GWIBrsquos HealthCare Monograph ldquothe amount of faculty and learning facilities is inadequatehelliprdquo to train the statersquos healthcare workforce These shortcomings are evidenced by student waiting lists for local nursing schools96 Nursing programs both locally and nationally report an increase in the number of qualified nursing applicants being turned away due to a dearth of faculty and classroomclinical space In 2005 the number of applicants denied admission for these reasons totaled 29424 for the nation and 1850 in Maryland
According to a 2005 survey97 Marylandrsquos 24 nursing degree programs reported that 305 percent of full-time faculty positions were vacant Local shortages can be attributed to both the aging of the statersquos population as well as difficulties in growing the pool of potential educators These difficulties range from structural barriers such as the limited local capacity of graduate programs in nursing education to market-driven trends (eg compensation for practicing nurses often exceeds that for nursing educators) These trends will undoubtedly be exacerbated as Marylandrsquos nursing faculty population continues to age and approach retirement The average age of nursing faculty at Maryland institutions as reported to the Board of Nursing in 2005 ranges from 42 to 55 years and the average age nationally for faculty retirement is 625 years98
Recommendation Enhance teacher retention through the expansion and enhancement of Professional Development School (PDS) networks
It appears that facultyteacher retention especially at the primary and secondary levels can be improved through access to quality Professional Development School (PDS) networks One example is Towson Universityrsquos PDS network which has been recognized at both the state and national levels as a successful model that relies on a partnership between a college or university and local school systems PDS networks aim to enhance and improve teacher quality through
95 Maryland State Department of Education 2006 96 Charting New Directions Governorrsquos Healthcare Workforce Summit page 13 97 Maryland Council of Directors of Associate Degree and Baccalaureate Programs Survey 98 Nursing Faculty Shortage Causes Effects and Suggestions for Resolution Maryland Statewide Commission on the Crisis in Nursing 2005
50
Recommendations
continuous professional development The network targets all stages of a teacherrsquos career offering professional development activities throughout the entire career An analysis of Towson Universityrsquos PDS network in 2001 showed that its teacher-graduates were retained at a much higher rate than other new teachers According to the study schools within the PDS network were associated with teacher retention rates of 80 percent after four years and 71 percent after five years This compares to non-PDS network retention rates of 45 and 34 percent respectively99
73 Marylandrsquos Growing Immigrant Population Opportunities and Challenges
Population shifts are impacting the demographic makeup of the state in ways that will have dramatic impacts on employer needs and workforce development Between 2000 and 2006 immigrants accounted for more than half (516) of Marylandrsquos population growth As of 2006 immigrants account for 12 of the statersquos population
Marylandrsquos workforce is expected to benefit from international migration at both ends of the employment spectrum as immigrants fill low-wage low-skill jobs as well as high-wage high-skill positions From a workforce development perspective this movement into Maryland will require increased investment in English as a Second Language (ESL) programs According to decennial census data the percentage of people who report to the Census Bureau that they speak English ldquonot wellrdquo or ldquonot at allrdquo has increased nearly 74 percent since 1990 Much of this population represents non-English speaking immigrants who present new challenges in terms of labor force training and education
Despite the pressing need for adult literacy services in Maryland demand continues to severely outstrip supply According to MSDE funding constraints dictate that a small percentage of annual demand is being met resulting in annual waiting lists of up to 5000 people Many of the people on waiting lists (47 percent) are waiting for access to ESL programs100
Recommendation Enhance and expand access to community English as a Second Language (ESL) programs
Not only is there a need for improved access to English as a Second Language programs but MSDE also notes the need to improve the quality of the statersquos ESL programs In 2005 Marylandrsquos adult education programs offered 40 hours of instruction per student which is not adequate for beginner or even intermediate English learners to become proficient Many of these ESL students lack advanced literacy skills in their native language and thus require additional intensive classroom time MSDE notes that a program that offers more than 100 hours of classroom time would better meet the needs of this population
Recommendation Enhance and support initiatives and partnerships that encourage a broad spectrum of education opportunities for immigrant populations
99 Pilato Maryland State Department of Education 100 Maryland State Department of Education December 2005
51
Recommendations
Many of Marylandrsquos foreign-born workers are highly educated and possess applicable skills however many of Marylandrsquos immigrants are at the opposite end of the educational spectrum As of 2006 43 percent of Marylandrsquos immigrants held at least a Bachelorrsquos degree compared with 34 of US natives in Maryland At the same time 18 of immigrants in Maryland did not have a high school diploma or its equivalent compared to 12 of US born Maryland residents101
Organizations such as US Hispanic Youth Entrepreneur Education (USHYEE) in partnership with MSDE and colleges and universities within the state are working together to provide Hispanic youth with scholarships along with technical and life skills that will encourage this segment of the population to seek higher education opportunities
Recommendation Coordinate efforts to promote Marylandrsquos access to seasonal immigrant (H-2B) and skilled immigrant (H-1B) workers102
Seasonal immigrant worker shortages have adversely affected Maryland businesses for some time In 2005 the national cap of 66000 H-2B visas which allow foreign nationals to temporarily enter the US and take advantage of seasonal or peak load employment opportunities was filled just a few months into the federal fiscal year As a result the lionrsquos share of Maryland businesses were prevented from applying for the estimated 7000+ temporary workers needed to sustain Marylandrsquos seasonal businesses A diverse group of Maryland industries are affected by the seasonal worker shortage including tourism and hospitality-driven businesses and agriculture and seafood processing firms as well as other types of service firms such as landscaping businesses
The State has recognized the importance of this issue In fact local political leaders continue to be actively involved in drafting legislation to increase the national cap and exempt returning seasonal workers from being subject to it GWIBrsquos Hospitality amp Tourism Monograph emphasizes Marylandrsquos need for seasonal immigrant workers and recommends that a state liaison office for immigration issues be established The GWIB report notes that in addition to being actively involved in immigration policy and advocacy the liaison office could work to connect foreign-born workers with Maryland businesses in need of temporary workers
A liaison office also could coordinate efforts to increase the availability of H-1B workers The H-1B visa program targets highly-skilled internationals who work in professional fields such as computing finance law and healthcare among others The national cap for H-1B visas has fluctuated in recent years jumping from 65000 in the late 1990s to 195000 in 2000 and then dropping back to 65000 in fiscal year 2003 As with H-2B visas annual quotas are met early in the year According to the Migration Policy Institute one out of every five doctors in the US is foreign born Two of every five medical scientists one of every five computer specialists and
101 US Census Bureau 2006 American Community Survey calculations based upon Maryland residents age 25 and over 102 It should be noted that this recommendation in no way advocates filling BRAC and other positions which require security clearances with H-1B and H-2B workers Given security clearance requirements filling these jobs with foreign nationals is simply not possible
52
Recommendations
one of every six persons in engineering or science fields are foreign born Given current and expected shortages among the science engineering technology and mathematics (STEM) fields it makes sense to explore expanding the H-1B visa option
74 The Need for Increased Labor Force Participation
The statersquos low jobless rate (39 percent in 2006) signifies not only that Marylandrsquos economy is healthy but also that local labor market conditions remain tight Most economists agree that an unemployment rate in the range of 35 to 45 percent is indicative of an economy operating at full employment and Marylandrsquos jobless rate continues to fall within that range In fact the state has not recorded an unemployment rate above the 45 percent mark since July 2003
Tight labor market conditions have the potential to aggravate labor shortages and apply upwards pressure on wages Since nearly one-sixth of Marylandrsquos existing labor force is expected to retire in the next decade these conditions are likely to worsen going forward Continued local labor supply shortages makes leveraging our underutilized and potential labor supply all the more important There is an opportunity to address this issue by tapping adult population segments that are underrepresented in the workforce including veterans ex-offenders and the statersquos disabled and lower literacy populations
According to a report released recently by the US Census Bureau roughly 175 percent of the statersquos adult population (or nearly 618000 persons) was eligible for adult education services as of 2000 This population includes individuals who ldquolack sufficient mastery of basic educational skills to enable the individuals to function effectively in societyrdquo103 Specifically this population includes those adults age 16 or older who lack a high school diploma and who are not enrolled in school In order to more fully integrate them into the statersquos labor force we need to expand access to basic literacy instruction GED services and English as a Second Language (ESL) classes
Recommendation Enhance opportunities for adult education (ie basic literacy GED services and ESL classes)
Despite the pressing need for adult literacy services demand continues to severely outstrip supply According to MSDE funding constraints dictate that only three to five percent of annual demand for these services is being met resulting in annual waiting lists of up to 5000 people The majority of those on waiting lists include people seeking ESL instruction and Adult Basic Education (ABE) If the State can increase the availability of these educational programs Marylandrsquos economy will benefit
103 US Census Bureau Profiles of the Adult Education Target Population Information from the 2000 Census December 2005
53
Recommendations
Recommendation Future study is necessary to identify the education and related needs of additional adult population segments
While the needs of Marylandrsquos lower literacy population have been identified there exists a lack of comprehensive information on other population segments which may not be participating fully in the statersquos workforce A thorough study is needed to identify the demographic economic and social characteristics of each Maryland population segment (ie veterans ex-offenders disabled population etc) With this information the education and hard or soft skill levels of these populations could be identified in addition to the identification of barriers preventing them from participating more fully in the workplace A synthesis of this information also would help to identify specific occupations that could serve as an entreacutee to career tracks for each of these population segments
Recommendation Create a statewide resource network to advance basic skills
Basic skills are in demand In fact the Maryland Department of Labor Licensing amp Regulation projects that the top four occupations expected to see the greatest level of replacement openings between 2004 and 2014 include104
Cashiers (33780 replacement openings) Retail salespersons (31670) Waiters and waitresses (21585) Combined food preparation and serving workers (17035)
These occupations require such basic skills as active listening speaking writing and reading comprehension
A recent GWIB report targeting Marylandrsquos Tourism amp Hospitality sector identifies a critical mismatch between the ldquojob-readinessrdquo or basic skills required for most occupations in the sector and the skill levels of new entrants to the field The majority of occupations in this sector require basic skills and on-the-job training yet employers are having difficulty finding workers with good active listening skills service orientation and cultural awareness and sensitivity Finding job entrants with the ability to read write and understand standard and spoken English also is a critical priority for the industry To address these issues the report recommends creating a statewide resource network to advance basic skills
104 Maryland Department of Labor Licensing amp Regulation Office of Workforce Information and Performance and Office of Labor Statistics 2007
54
Recommendations
55
Recommendations
1 BRAC Requires a Pipeline of Qualified Workers
Not all of the current BRAC personnel will move to Maryland along with their jobs Since the average civilian DoD worker is 45 years old many current workers will approach retirement in the near-term future The short-term implications of this trend are highly relevant given that the size and scope of the DoD BRAC units moving to Maryland could be influenced by current and near-term future workforce availability In other words if jobs go unfilled they could very well be lost through downsizing or reconfiguration of BRAC units The challenge for workforce development officials is to ensure that Maryland realizes as many potential BRAC jobs as possible The way to achieve this goal is to make sure that new positions are filled quickly
The statersquos workforce development system must strive to ensure that Marylandrsquos labor pool is ready and able to fill the types of jobs that BRAC will yield Both the Fort Monmouth and Defense Information Systems Agency (DISA) units that are slated to move to Maryland report a high proportion of the following occupations
Engineers (specifically electronicselectrical engineers computer engineers software engineers and engineers in general)
Managers (federal contract managers logistics managers inventory managers and information technology managers)
Computer scientists Telecommunications specialists Analysts (budget analysts and managementprogram analysts) and Technical writers and editors
These occupations require a Bachelorrsquos degree mainly in the engineering and sciences fields for entry-level positions For higher grade positions graduate education andor a combination of work experience is required Key skills associated with these positions include
Complex problem solving Critical thinking Judgment and decision making Systems evaluation105
Technology design106
105 The US Department of Labor defines systems evaluation as follows Identifying measures or indicators of system performance and the actions needed to improve or correct performance relative to the goals of the system 106 Technology design is defined as Generating or adapting equipment and technology to serve user needs
56
Recommendations
Recommendation Actively recruit retired government personnel and veterans to fill vacant BRAC positions
Fort Monmouth is currently in the process of actively recruiting up to 2000 Maryland workers to fill BRAC positions by 2011 Retired government personnel and veterans (especially those with security clearances) stand out as a potential labor pool worth cultivating in order to help the bases meet recruitment needs and fill any foreseeable gaps in the immediate future
Recommendation Increase interest recruitment and retention in BRAC-related fields
Since many of the BRAC jobs will require an educational background in science technology engineering and mathematics (STEM) fields and since graduation levels in many of these fields have been flat to negative in Maryland we must generate an interest in these fields before students enter college
Maryland has developed several new or planned initiatives at the high school level that if proven successful could serve as models to be deployed elsewhere in order to ensure that Maryland is developing an adequate pipeline of BRAC workers One such initiative is the Homeland Security and Emergency Preparedness Magnet Program at Joppatowne High School in Harford County The program which was launched in the fall of 2007 consists of three curricular tracks including Criminal JusticeLaw Enforcement InformationCommunications and Technology and Homeland Security Sciences The curricular content of these tracks is often applied For example the InformationCommunications and Technology track enables students to attain certification in both Cisco and SPACESTARS professional programs While the program aims to prepare high school students for careers in the homeland security field it also is designed to create a network linking students with government and industry partners
The Science and Mathematics Academy at Aberdeen High School is another example This program funded with federal state and local funds was launched in fall 2004 after several years of planning The program originated with the Army Alliance and other professionals affiliated with Aberdeen Proving Ground (APG) A critical program component provides students with the opportunity to interact regularly with professional scientists and mathematicians Another unique feature allows high school seniors to perform original research with the guidance of a program mentor
Recommendation Identify labor and education needs for spin-off BRAC jobs
The influx of BRAC personnel and contractors to Maryland will result not only in significant construction activity but also increased demand for personal services According to a report produced by RESI in 2006 for every direct on-base job107 that comes to Maryland 196 additional spin-off jobs will be created108 Specifically Maryland will experience a rapidly growing demand for construction managers and workers day care workers and hospitality workers among others Local community colleges in Harford and Anne Arundel counties
107 Direct on-base positions include both civilian DoD positions as well as embedded private defense contractors 108 RESI of Towson University Maryland Department of Business amp Economic Development 2006
57
Recommendations
already have begun to explore program needs associated with such occupations This is an area that should be explored fully by workforce development professionals
75 There Is a Shortage of Workers with Security Clearances
The number of positions requiring security clearances as well as the level of security clearances required for existing contracts has increased dramatically since September 11 2001 This increased demand has exacerbated processing times and resulted in a frenzy of competition and ldquopoachingrdquo from the limited pool of cleared workers many of whom are concentrated within science technology engineering or mathematics (STEM) fields Not only is the security clearance process a lengthy and onerous one but it is costly as well Processing delays can cause jobs to remain unfilled for months on end and the cost of sponsorship is quite high
Recommendation Spread the word set up a pre-screening model and expand internship opportunities
The issue of security clearances is a tricky one since the process is federally driven and thus largely outside the Statersquos control Still Maryland can begin to address the security clearance issue by disseminating information An awareness campaign especially targeting high school and college students is needed to get the word out We must emphasize the multitude of job opportunities available to Marylandrsquos youth and inform them what they need to do (or rather avoid) in order to obtain positions requiring security clearances
Also key to resolving Marylandrsquos excess clearance demand is to spearhead the clearance process by targeting prospective workers while they are still students To achieve this goal a pre-screening model could be developed whereby prior to graduation college students begin the security clearance process A Towson University study performed on behalf of DBED notes however that such a model would enhance the process only if the federal government addresses process issues at the national level109 Once the model is in place matching funds could be established (between defense contractors and other organizations as well as private andor public sources) in order to sponsor students to begin the security clearance process
Expanded internship prospects represent another area of opportunity to get the word out and encourage student interest in positions that require security clearances The Johns Hopkins Universityrsquos Applied Physics Lab (APL) summer internship program is one such example APL funds and processes interim student clearances for temporary summer positions APL also funds the full clearance process for students who remain with the lab beyond the summer
109 Division of Economic and Community Outreach of Towson University Maryland Department of Business amp Economic Development 2006
58
Recommendations
76 Skilled Professionals Needed
A review of emerging and expected labor force conditions in Maryland makes it clear that there is a need for the state to grow attract and retain skilled professionals of all types (not just STEM and BRAC-related workers) There is a need to attract and retain these professionals both as workers and residents in Maryland Admittedly this particular finding overlaps with previously mentioned findings (ie the need for STEM and BRAC workers) The evidence is so compelling that the authors of this report felt that a separate recommendation is justified
Recent migration trends in Maryland bring this issue to the forefront In each of the three most recent years for which data are available (2004 through 2006) the state has recorded negative net migration In other words more people are moving out of the state than are moving in Between 2005 and 2006 for instance net domestic migration outflows exceeded 25000 people offsetting the 21000-person gain due to international migration110 In other words in a single year 25000 residents left Maryland and were replaced by 21000 immigrants
This exodus of Maryland residents has significant implications for the statersquos workforce Many of the residents leaving the state are skilled professionals who are being replaced increasingly by less educated immigrants Certainly many new immigrants to Maryland are highly educated but the amount of time during which these skilled immigrants will remain in Marylandrsquos workforce is not certain In addition many of the statersquos out-migrants continue to commute to Maryland for work How long will these workers put up with longer commutes After all the state has a notoriously lengthy average commute time of 306 minutes second only to that of New York City (309 minutes)
The statersquos rate of population growth is slowing Between 2020 and 2030 Marylandrsquos population is expected to grow by five percent compared to 20 percent growth between 1970 and 1980 Marylandrsquos population is aging as nearly one-fifth of the statersquos working age population is set to retire by 2020 The trend in migration coupled with the statersquos slowing population growth aging population and increasingly tight labor market conditions all point to the same conclusion Maryland needs to ensure that our pool of skilled professionals grows in step with the demand
110 US Census Bureau
59
Recommendations
Recommendation Launch a campaign to attract and retain skilled professionals
Nations such as India and China and even mid-Atlantic cities and states such as Philadelphia and West Virginia have made concerted efforts to not only grow and retain skilled professionals but to entice these workers to return to their home citiesstatesnations This analysis recommends that a campaign be developed to both attract and retain skilled professionals in Maryland
A public-private coalition is recommended to spearhead such a campaign which would target skilled professionals of all ages As a start the initiative could target the emerging pipeline of professional workers ndash namely college students The campaign could be two-pronged focusing on retaining Maryland college students in the statersquos workforce as well as attracting college students from other areas to Maryland After all the survey data suggest that nearly four out of every 10 Bachelorrsquos degree graduates of Maryland institutions elect to work outside the state The campaign could target additional locales with a significant presence of colleges and universities (ie Greater Boston Research Triangle Park Greater Philadelphia etc) in an effort to attract current students to Maryland after graduation Such a campaign should incorporate incentives for first-time homebuyers and affordable housing currently offered in Maryland
60
Closing
80 Closing
Marylanders live and work in a state characterized by a healthy diverse economy and low unemployment The statersquos highly educated workforce and the presence of and proximity to federal agencies and laboratories also are major advantages Marylandrsquos excellent quality of life continues to attract workers and residents to the state In order to meet the many challenges posed by a rapidly changing demographic and economic landscape Maryland must be prepared to preserve and build on these existing strengths
This report highlights a number of current and predicted labor force trends that will drive the future of Marylandrsquos labor and jobs markets These trends pose several challenges to the state that will require the attention of educators workforce development professionals the business community and residents alike Tackling these challenges through a combination of public and private initiatives will serve to enable Maryland to maintain its existing strengths and enhance the statersquos ability to compete in an ever-changing global economy Hopefully the trends and recommendations highlighted in this report will aid in this effort
61
References
References
American Community Survey US Census Bureau 2005
Altbach P R Berdahl and P Gumport American Higher Education in the Twenty-First Century 2nd ed Johns Hopkins University Press April 2005
Americarsquos Career InfoNet httpwwwacinetorg
Associated Press State amp Local Wire ldquoLimit on Seasonal Workers Vexes Employersrdquo February 28 2005 Lexis-Nexis
Baltimore Business Journal ldquoLift Cap on Temporary Visa Programrdquo American City Business Journals Inc July 30 2004
Baltimore Sun ldquoConstellation Energy Files Partial Plan for Reactorrdquo Bloomberg News July 31 2007
Barlow ED ldquoStorm Warnings and What You Can Do To Preparerdquo 2006 Governorrsquos Workforce Conference Maryland May 8 2006
Brugger Robert J Maryland A Middle Temperament 1634-1980 Johns Hopkins University Press 1988
Buhler Patricia M ldquoThe New Workforce Five Sweeping Trends That Will Shape Your Companyrsquos Futurerdquo AMA Business Brief wwwamanetorg
Bureau of Labor Statistics ldquoHigh-paying Occupations with Many Openings Projected 2002shy12rdquo Occupational Outlook Quarterly Spring 2004 httpwwwblsgovopubooq2004springoochartpdf
Campbell Doug ldquoThe Illegal Immigrant Effectrdquo Region Focus 2006
Campbell Paul R ldquoPopulation Projections for States by Age Sex Race and Hispanic Origin 1995-2025rdquo US Census Bureau Population Division 1996
Capps Randy Michael Fix Jeffrey Passel Jason Oust and Dan Perez-Lopez ldquoImmigrant Families and Workers A Profile of the Low Wage Immigrant Workforcerdquo Urban Institute November 2003
Carroll Nick and C Taeuber ldquoA Profile of Older Workers in Marylandrdquo US Department of Commerce Economics and Statistics Administration US Census Bureau August 2004
Conte and Carr ldquoOutline of the US Economyrdquo US Department of State httpusinfostategov
62
References
Cox Michael R Alm and N Holmes ldquoWhere the Jobs Arerdquo The New York Times May 13 2004 late edition ProQuest Information and Learning Company httpproquestumicompqdwebdid=636777401ampsid=5ampFmt=3ampclientld=41150ampRQT=309amp VName=PQD
De Long David W ldquoConfronting the Chemical Industry Brain Drain A Strategic Framework for Organizational Knowledge Retentionrdquo Accenture-Institute for Strategic Change April 2002
Division of Economic and Community Outreach ldquoBRAC Government and Corporate Need for Workers with Security Clearancesrdquo Towson University June 2006
ldquoDomestic Net Migration in the United States 2000 to 2004rdquo US Census Bureau April 2006
Drucker Peter ldquoThe Future Has Already Happenedrdquo Futurist 32 no 8 (1998) 16 MAS Ultra-School Edition
Duderstadt James J ldquoLeading Higher Education in an Era of Rapid Changerdquo July 2001
ElBoghdady Dina ldquoDISA Fights Turnover with Telecommutingrdquo The Washington Post January 25 2006
Fahrenthold David A ldquoMaryland Crab Industry Angles for Help Seasonal Worker Cap Job Abundance Leave Seafood Processors Short-Staffedrdquo The Washington Post February 28 2005 Lexis-Nexis
Federal Reserve Bank of Dallas ldquo2003 Annual Report The Evolution of Workrdquo wwwdallasfedorg
Franz Maximilian ldquoCommentary The Chesapeake Traditionrdquo The Daily Record May 7 2002 Lexis-Nexis
Gereffi Gary and V Wadhwa ldquoFraming the Engineering Outsourcing Debate Placing the United States on a Level Playing Field with China and Indiardquo Master of Engineering Management Program Duke University December 2005
Goldstein Mark ldquoMarylandrsquos Changing Demographicsrdquo Presentation on behalf of the Maryland Department of Planning June 2006
Governorrsquos Workforce Investment Board 2003 ldquoGovernorrsquos Healthcare Workforce Summit Monographrdquo Maryland Department of Labor Licensing amp Regulation
Governorrsquos Workforce Investment Board 2006 ldquoMaryland Aerospace Industry Monographrdquo Maryland Department of Labor Licensing amp Regulation
63
References
Governorrsquos Workforce Investment Board 2007 ldquoMaryland Hospitality amp Tourism Industry Monographrdquo Maryland Department of Labor Licensing amp Regulation
H1Base ldquoH1-B Visa Information amp Service Centerrdquo httph1basecompageaspid=312
Hankin Harriet The New Workforce New York AMACOM 2005
Heller Barbara R ldquoMarylandrsquos Nursing Shortage A Workforce Crisisrdquo University of Maryland March 2003
Hewitt Associates LLC ldquoWorkforce Planning in the 21st Century - Back to the Futurerdquo International Report October 2003
Huether David ldquoThe Case of the Missing Jobsrdquo National Association of Manufacturers httpwwwnamorgs_namdoc1aspCID=201416ampDID=236655
Karoly Lynn A and Constantijn W A Panis The 21st Century at Work Forces Shaping Lifelong Learning Trends A Profile of Continuing Higher Education 7th ed University Continuing Education Association April 2002
Kaushal Neerja and Michael Fix ldquoThe Contributions of High-Skilled Immigrantsrdquo Migration Policy Institute July 2006
Keller Michael J ldquoA Study of the Capacity of Marylandrsquos Teacher Preparation Programsrdquo Maryland Higher Education Commission March 2006
Kobell Rona and C Guy ldquoWork-visa Limit Snags Shore Employers Business Relying on Immigrant Labor Might Not Have Anyone to Do the Workrdquo The Sun January 24 2005 final edition ProQuest
Lasater Beth and Barbara Elliot ldquoProfiles of the Adult Education Target Populationrdquo Center for the Research in Education RTI International December 2005 httpwwwedgovaboutofficeslistovaepiAdultEdcensus1pdf
Lorefice Alejandro A ldquoJust in Time Manufacturing Introduction and Major Componentsrdquo New York 1998
Lyons Michael and Pearson Ian Business 2010 Mapping the New Commercial Landscape London 2003
Maryland Board of Nursing httpwwwmbonorgmainphp
Maryland Career and Workforce Information httpdllrstatemdus
Maryland Department of Business amp Economic Development Economic Pulse January-February 2007
64
References
Maryland Department of Business amp Economic Development ldquoLargest Employers in Marylandrdquo March 2006
Maryland Department of Labor Licensing amp Regulation ldquoMarylandrsquos Demand-Driven Two-Year Workforce Investment Planrdquo July 2005-June 2007
Maryland Department of Labor Licensing amp Regulation Office of Workforce Information and Performance and Office of Labor Statistics March 2007
Maryland Governorrsquos Workforce Investment Board ldquoGovernorrsquos Healthcare Workforce Summit Monographrdquo August 2003 httpwwwmdworkforcecomlibpdfhcmonographpdf
Maryland Higher Education Commission ldquoEnrollment Projections 2007-2016 Maryland Public Colleges and Universitiesrdquo June 2007
Maryland Higher Education Commission ldquoTrends in Degrees Awarded at Maryland Higher Education Institutionsrdquo March 2005
Maryland Higher Education Commission ldquoTrends in Enrollment by Program Maryland Higher Education Institutionsrdquo April 2005
Maryland Higher Education Commission ldquo2004 Maryland State Plan for Postsecondary Educationrdquo December 2004
Maryland Higher Education Commission 2006 Trend Book 1 3 19-24 29-32 49-54 78-84 91-93 August 2006
Maryland Higher Education Commission 2005 Data Book 1 August 2004
Maryland Higher Education Commission 2006 Data Book 1 August 2005
Maryland Higher Education Commission 2007 Data Book 1 7 14-16 38 August 2006
Maryland State Department of Education ldquoStepping Up to the Future Adult Literacy Challenges at Work at Home and in the Maryland Communityrdquo December 2005
Maryland Independent College and University Association Connection ldquoLearn About the Five Factsrdquo httpwwwmicuaconnectioncommythsasp
Maryland Independent College and University Association ldquoFast Facts About MICUA 2007 ndash Enrollment Countsrdquo 2002 httpwwwmicuaorgffenrollmentcountspdf
McGee Marianne Kolbasuk and Alice LaPlante ldquoTalent Search The Myths Facts and Emotions That Will Keep the H1-B Visa Issue From Going Awayrdquo InformationWeek July 23 2007 Lexis Nexis
65
References
Mittuch Eugene W Averting a Pending Department of Defense Civilian Personnel Crisis The Need for a Corporate Recruiting Strategy May 2002 httpwwwstormingmediaus898946A894604html
National Academy of Science ldquoRising Above the Gathering Storm Energizing and Employing America for a Brighter Economic Futurerdquo 2006
National Center on Education and the Economy ldquoTough Choices Tough Times The Report of the New Commission on the Skills of the American Workforcerdquo 2007 httpwwwskillscommissionorgpdfexec_sumToughChoices_EXECSUMpdf
National Science Foundation 2003 httpwwwnsfgov
Nuclear Energy Institute ldquoNuclear Energy Industry Initiatives Target Looming Shortage of Skilled Workersrdquo January 2007 wwwneiorg
OECD ldquoWhat Schools for the Futurerdquo October 2001
Pew Hispanic Center ldquoFact Sheet The Labor Force Status of Short Term Unauthorized Workersrdquo April 2006
Pilato Virginia ldquoMSDE and The Impact of Different Models of Teacher Preparation on Teacher Retention A Progress Reportrdquo presented by Dr Tom Proffitt and Ms Karen Schafer Towson University
Pisarski Alan ldquoCommunity in Americardquo Transportation Research Board 2006
RAND Corporation ldquoThe Future Workforce and Workplace in the United Statesrdquo 2004
Reeves Scott ldquoAn Aging Workforcersquos Effect On US Employersrdquo Forbes September 29 2005 wwwForbescom
RESI study performed on behalf of the Maryland Department of Business amp Economic Development Jobs and Household Allocations and Expected Tax Revenues
Snyder Thomas D ldquoDigest of Education Statistics 2005rdquo National Center for Education Statistics June 2006 httpncesedgovprogramsdigestd05ch_3asp
Sparshott Jeffrey ldquoBay Firms Depend on Foreign Workersrdquo The Washington Times June 1 2005 Lexis-Nexis
States News Service ldquoMikulski Scores Senate Victory for Americarsquos Small Businessesrdquo April 19 2005 Lexis Nexis
66
References
The Conference Board Partnership for 21st Century Skills Corporate Voices for Working Families and Society for Human Resource Management ldquoAre They Really Ready To Workrdquo 2006 http21stcenturyskillsorgdocumentsFINAL_REPORT_PDF09-29-06pdf
Therrien Roger C Bridges R Meyerhoff and J Baker ldquoConnecticut Workforce Demands and the Implications for Educationrdquo Connecticut Department of Labor July 2003
Three Rivers Workforce Investment Board ldquoManaging the Changing Workforce in Southwestern Pennsylvaniardquo Executive Summary June 2006 httpwwwtrwiborgreportsagingexecsummarypdf
Towards Knowledge Societies UNESCO Publishing 2005
UMD ldquoProtecting Marylandrsquos Competitive Edgerdquo An Action Summit Hosted by the University of Maryland April 2006 httpwwwcompetitive-edgeumdedusnapshothtml
US Department of Education ldquoState Nonfiscal Survey of Public ElementarySecondary Educationrdquo National Center for Education Statistics November 2005 httpncesedgovprogramsprojectionstablestable_25CTaspreferrer=tablenotes
VisaPro ldquoFrequently Asked Questionsrdquo httpfaqvisaprocomH2B-Visa-FAQ3aspQ1
67
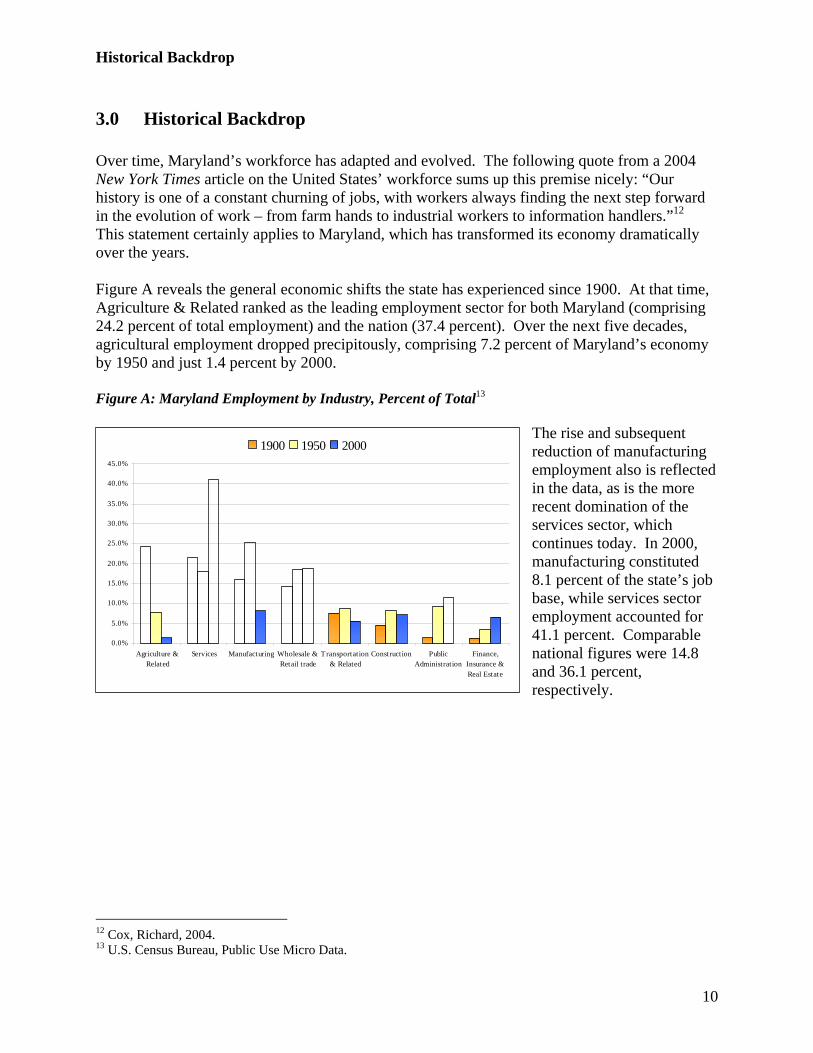
Historical Backdrop
30 Historical Backdrop
Over time Marylandrsquos workforce has adapted and evolved The following quote from a 2004 New York Times article on the United Statesrsquo workforce sums up this premise nicely ldquoOur history is one of a constant churning of jobs with workers always finding the next step forward in the evolution of work ndash from farm hands to industrial workers to information handlersrdquo12
This statement certainly applies to Maryland which has transformed its economy dramatically over the years
Figure A reveals the general economic shifts the state has experienced since 1900 At that time Agriculture amp Related ranked as the leading employment sector for both Maryland (comprising 242 percent of total employment) and the nation (374 percent) Over the next five decades agricultural employment dropped precipitously comprising 72 percent of Marylandrsquos economy by 1950 and just 14 percent by 2000
Figure A Maryland Employment by Industry Percent of Total13
The rise and subsequent reduction of manufacturing employment also is reflected in the data as is the more recent domination of the services sector which continues today In 2000 manufacturing constituted 81 percent of the statersquos job base while services sector employment accounted for 411 percent Comparable national figures were 148 and 361 percent respectively
00
50
100
150
200
250
300
350
400
450
Agriculture amp Related
Services Manufacturing Wholesale amp Retail trade
Transportation amp Related
Construction Public Administration
Finance Insurance amp Real Estate
1900 1950 2000
12 Cox Richard 2004 13 US Census Bureau Public Use Micro Data
10
10
20
30
40
50
60
70
80
90
o
f Adu
lts W
ith A
t Lea
st a
HS
Dip
lom
1940 1950 1960 1970 1980 1990 2000
US MD
Historical Backdrop
Figure B Educational Attainment for US and Maryland14
These significant changes coincided with increasing labor force educational attainment levels as shown in Figure B In 1940 the first year in which educational attainment data was collected 211 percent of Marylandrsquos population age 25 and over had obtained a high school education or higher By 2000 this percentage approached 840 percent Corresponding national figures were 245 and
804 percent respectively Over the same period the percentage of the statersquos population age 25 and over with a Bachelorrsquos degree or higher skyrocketed from under 50 percent in 1940 to 315 percent in 200015 This chart reveals what employers and workforce development professionals have known for some time ndash an educated workforce has become increasingly critical to maintaining and nurturing economic success
14 Percent of Population aged 25+ with a High School Education or Higher US Census Bureau ldquoA Half-Century of Learning Historical Census Statistics on Educational Attainment in the United States 1940 to 2000rdquo 15 The corresponding national rate in 2000 was just 244 percent
11
Historical Backdrop
The increased demand for educated workers in Maryland has been broad-based and is reflected in industry-level educational attainment data Even in industries traditionally considered ldquoblue collarrdquo such as Manufacturing and Construction the educational attainment of workers has risen Data show that the proportion of workers in each Maryland industry with some college education has increased from just three percent of the statersquos manufacturing workers in 1940 to 26 percent in 2000 The proportion of Agriculture workers with some college skyrocketed from one percent in 1940 to over 20 percent in 2000
Figure C Maryland Educational Attainment by Industry 200016
By 2000 more thanHigh School or Less Some College College Degree Plus 40 of workers
Construction amp Mining 64 24 12 employed within Services Finance Agriculture amp Related 63 21 16 Insurance amp Real
Wholesale amp Retail Trade 58 28 15 Estate and Public 49 30 20 Administration had
obtained a college Transportation amp Related
Manufacturing 48 26 25 degree or higher More Services 28 26 46 than half of the workers
in Marylandrsquos Finance Insurance amp Real Estate 25 34 41 manufacturing sector
Public Administration 22 35 42 had at least some 00 200 400 600 800 1000 college or higher Other
industries employed a higher proportion of workers with a high school education or less such as Construction amp Mining (64 percent) Agriculture amp Related (63 percent) and Wholesale amp Retail Trade (58 percent)
16 RESI US Census Bureau Public Use Micro Data The graph refers to the distribution of maximum educational attainment levels by industry
12
Historical Backdrop
Today Maryland enjoys a healthy diverse economy driven by growth in services sectors such as education health care and other technical and professional services Among Marylandrsquos top 50 largest private employers are health and educational services firms (including The Johns Hopkins University and Hospital Adventist HealthCare and Helix Health System among others) defense and intelligence contractors (such as Northrop Grumman Corporation and Lockheed Martin Corporation) and other technical and professional services firms (such as Computer Sciences Corporation IBM Corporation Science Applications International Corporation and Westat Research Incorporated)17
Though life sciences firms are not generally considered to be large employment generators there is no doubt that the statersquos economy also has been shaped by the presence of industry high fliers such as MedImmune (recently acquired by AstraZeneca) and Human Genome Sciences Inc Any discussion of Maryland employers would not be complete without consideration of the statersquos proximity to and presence of federal research centers and labs
The importance of the federal government to the statersquos economy cannot be underestimated The many federal laboratories and facilities located within and near Maryland such as the Goddard Space Flight Center and the Naval Air Systems Command at Patuxent River have contributed greatly to Marylandrsquos science and security base The presence of the Food and Drug Administration (FDA) and the National Institutes of Health (NIH) have spurred growth among bioscience firms The National Security Agency (NSA) and Marylandrsquos many military installations (including Fort Detrick Fort Meade and Aberdeen Proving Ground) have been critical to building the statersquos base of science and security
17 Maryland Department of Business amp Economic Development 2006
13
Marylandrsquos Labor Supply
40 Marylandrsquos Labor Supply
41 Population Trends and Characteristics
The shifting composition and growth of Marylandrsquos population directly impacts the statersquos economy and labor force Population characteristics such as age educational attainment and diversity have a profound impact on the needs and types of services that will best ensure continued economic growth and prosperity throughout the state The extent to which policy makers educators and business leaders recognize and meet these needs can further strengthen Marylandrsquos ability to attract and retain quality jobs and workers
411 Population Growth Migration and Diversity
Marylandrsquos population exceeded 56 million in 2006 ranking the state 19th in the nation in population size The statersquos rate of population growth between July of 2005 and 2006 was just 05 percent Not only did the state lag the 10 percent national rate of population expansion but Maryland ranks among the bottom third of states (36th fastest growth) according to this measure
This sluggish rate of population growth is not characteristic of Marylandrsquos past performance Between 1990 and 1999 the statersquos population expanded at an average annual rate of 10 percent Between 2000 and 2003 Maryland recorded annual population growth ranging from 11 to 13 percent
The statersquos slower rate of population expansion in recent years can be explained by negative net migration trends In each of the three most recent years for which data are available (2004 through 2006) the state recorded negative net migration In other words more people are moving out of the state than are moving in Maryland recorded a net migration loss of 5000 in 2006 and 6800 in 2005 the largest such decline the state has seen since 198118 While it is true that net international migration continues to bolster the statersquos population growth net domestic outflows (migration between states) outweigh international migration gains Between 2005 and 2006 for instance Marylandrsquos net domestic migration outflows exceeded 25000 persons offsetting the 21000-person gain due to international migration19
It should be noted that Marylandrsquos net domestic migration decline represents a departure from recent trends Between 2000 and 2004 for instance the state recorded net domestic migration gains of more than 5400 per year20 While in the past domestic outflows have been associated with deteriorating or weakening economic conditions within the state recent trends appear to be driven by cost of living issues especially housing costs Out migration to border counties in Pennsylvania and West Virginia has increased significantly in recent years A possible explanation for this movement is the availability of affordable housing in these areas Median home values in Pennsylvania jurisdictions such as York and Franklin counties are roughly $75000 below those of Baltimore County This gap increases significantly when home values in
18 Maryland Department of Planning 19 US Census Bureau 20 US Census Bureau 2006
14
Marylandrsquos Labor Supply
Carroll and Frederick counties are considered Many former Maryland households have taken advantage of lower housing costs in these locales while still being part of Marylandrsquos job market
The good news is that this trend will likely be stemmed by the current and future Department of Defense (DoD) Base Realignment and Closure (BRAC) movements to Maryland The job movements which call for more than 15000 civilian jobs to transfer to Maryland by 2011 are expected to result in substantial household movements to Maryland as well
As previously noted international migration continues to bolster population growth both locally and throughout the nation Foreign immigration represents 443 percent of the statersquos population gain between 1990 and 2000 Marylandrsquos level of foreign-born population has grown from roughly 94000 in 1960 to more than 313000 in 1990 By 2000 nearly one out of every 10 Maryland residents (more than 518000 persons) was foreign born21
Figure E Marylandrsquos Share of Foreign-Born Population 200022
More than two-thirds of the statersquos 40 foreign-born population reports their 35 region of origin to be either Asia or
30 Latin America The most commonly reported Asian countries of origin
25 include China (which comprises 65
20 percent of the statersquos 2000 foreign-born population) India (62 percent)
15 Korea (60 percent) and the
10 Philippines (40 percent) El Salvador leads Latin American countries and
5 accounts for another 81 percent In
0 fact El Salvador comprises the single largest share of Marylandrsquos foreign-born population Jamaica and Mexico
each comprise an additional 37 percent Nigeria Vietnam Germany and the United Kingdom each comprise close to 30 percent of the statersquos foreign-born residents
Asia Latin America Europe Africa North America Oceana
Perc
ent o
f Tot
al
21 Goldstein 2006 22 US Census Bureau
15
Marylandrsquos Labor Supply
40
43
56
57
65
89
11 7
148
174
292
0 5 10 15 20 25 30 35
Figure F Foreign-Born Population as Percent of Total 200523
International migration is forecast to increase Marylandrsquos population Montgomery
by 593000 persons between 1995 Prince George s and 2025 ranking the state ninth in
Howard the nation according to this24 Maryland measure Montgomery and
Prince Georgersquos counties will Baltimore County
continue to absorb the lionrsquos share Frederick
of the statersquos international Anne Arundel
migration Foreign immigration Baltimore City accounted for 891 percent of
Montgomery Countyrsquos population Charles
gains and 719 percent of Prince Wicomico
Georgersquos Countyrsquos gains between 1990 and 2000 In 2005 foreign-
Percent of Totalborn people accounted for 292 percent of Montgomery Countyrsquos population and 174 percent of Prince Georgersquos County residents Howard County follows with 149 percent
Migration continues to increase diversity in Maryland which has recorded substantial increases in its minority population in recent years Between 2000 and 2006 the statersquos minority population expanded by roughly 327000 persons In contrast the statersquos non-Hispanic white population declined by 23000 persons over the same period Census projections indicate that by 2025 Marylandrsquos non-Hispanic white population will comprise just 543 percent of the statersquos total population down from 666 percent in 1995 Over the same period persons of Hispanic origin are expected to increase and comprise 70 percent of Marylandrsquos total population up from 36 percent in 199525
23 Goldstein 2006 24 US Census Bureau Population Division 25 US Census Bureau Population Division
16
Marylandrsquos Labor Supply
Figure G Share of Population by Selected RaceOrigin 200526
Census estimates for 2005 reveal Marylandrsquos population to be quite diverse relative to the nation African-Americans constitute 287 percent of the statersquos population more than twice the
0
10
20
30
40
50
60
70
80
White Black Hispanic or Latino (of any
race)
Asian Some other Race
Two or more races
Perc
ent o
f Tot
al
Maryland United States
60 percent in 2006 The corresponding national share for people of Hispanic or Latino origin in
national share The state also is home to a slightly larger (percent share) Asian population than is seen nationally While Marylandrsquos population of Hispanic or Latino origin has increased significantly in recent years (from roughly 230000 in 2000 to 318000 in 2005) this group comprised 58 percent of the statersquos population in 2005 and
2005 was 145 percent
412 Affluence
Recent data releases once again confirm Marylandrsquos reputation as one of the most affluent states in the nation With a 2006 median household income of $65144 Maryland ranks first in the nation according to this measure and far surpasses the comparable national income level of $48451
Poverty data reveal similar patterns Overall the statewide family poverty rate was 53 percent far below the national rate of 98 percent In 2006 only 78 percent of Marylandrsquos population lived below the poverty level the lowest rate in the nation and 55 percentage points below the national average
The fact that the statersquos households are well compensated is a reflection of Marylandrsquos highly educated and skilled workforce More than a third (351 percent) of the statersquos population age 25 and older has a Bachelorrsquos degree or higher The comparable national percentage is 270 percent The fact that Maryland has a relatively high proportion of households with two or more workers also helps to explain the statersquos high income levels In 2006 four out of 10 households fell within this category compared to 35 for the nation27
26 US Census Bureau American Community Survey 2006 27 US Census Bureau American Community Survey 2006
17
Marylandrsquos Labor Supply
Figure H Per Capita Income Levels by Maryland Workforce Investment Area (WIA)28
$20000 $25000 $30000 $35000 $40000 $45000 $50000 $55000 $60000
Montgomery Anne Arundel
Baltimore County Mid-Maryland
Maryland Frederick
Upper Shore Southern Maryland
Susquehanna Prince Georgersquos
United States Baltimore City
Lower Shore Western Maryland
Annual Per Capita Income
2005 Marylandrsquos affluence is significant for another reason Wealth offers a measure of protection from cyclical economic fluctuations Maryland may be better prepared to weather economic downturns than the balance of the nation However it should be noted
that all regions in Maryland are not equally protected Certain areas have participated less fully in recent economic recoveries than others as indicated by their per capita income levels With an annual per capita income level below $29000 Western Maryland (comprised of Allegany Garrett and Washington counties) trails all other Maryland Workforce Investment Areas (WIAs)29 The Lower Shore (which includes Somerset Wicomico and Worcester counties) also lags other areas with an annual per capita income level of just under $30000
While affluence can be considered a strength especially in the face of economic downturns it poses a challenge for other reasons Increased living costs and housing costs in particular can encourage out migration to lower cost areas a trend analysts believe has been occurring with increased frequency in Maryland for each of the last three years
28 Bureau of Economic Analysis RESI of Towson University WIA refers to Workforce Investment Area Maryland is home to 12 local WIAs each with a common labor pool and 200000 or more residents Each WIA is served by a separate Local Workforce Investment Board (LWIB) 29 In percentage terms however the Western Maryland region boasts the fastest rate of appreciation between 2004 and 2005 with growth in annual per capita income of 63 percent
18
Marylandrsquos Labor Supply
413 Educational Attainment
Figure I 2005 Education Attainment Levels Population 25 and Older30
Maryland is home to a highly educated population The state consistently ranks ahead
00
50
100
150
200
250
300
350
Max
imum
Edu
catio
nal
Atta
inm
ent A
chie
ved
Less than 9th Grade
9th-12th High School Some Associate s Bachelor s Graduate or Grade No Graduate College No Degree Degree Professional Diploma Degree Degree
Maryland United States
of the nation on a variety of education-related measures For instance the National Science Foundation ranks Maryland second in the nation in terms of doctoral scientists and engineers per 100000 population In addition in 2005 the statersquos concentration of professional and technical workers (249 percent) ranked second in the nation
Census educational attainment data tell a similar story In 2005 nearly one in four (194 percent) Marylanders age 25 and older earned a Bachelorrsquos degree as their highest level of educational attainment Approximately 157 percent of state residents have a graduate or professional degree Taken together 351 percent of Marylandrsquos population has a Bachelorrsquos degree or higher ranking Maryland third in the nation compared to 270 percent nationally The gap between Maryland and the nation has widened in recent years as Maryland has increased its proportion of highly educated residents In 1990 only 265 percent of the statersquos population had earned a Bachelorrsquos degree or higher just six percentage points ahead of national levels
30 US Census Bureau American Community Survey 2006
19
Marylandrsquos Labor Supply
Figure J Percent of Population with a Bachelorrsquos Degree or Higher by WIA31
00 100 200 300 400 500 600
Montgomery
Mid-Maryland
Anne Arundel
Frederick
Baltimore County
Prince Georgersquos
Susquehanna
Southern Maryland
Baltimore City
Lower Shore
Western Maryland
Upper Shore
2005 In 2005 Montgomery County and the Mid-Maryland region lead the state in terms of the percent of population age 25 and older with a Bachelorrsquos degree or higher with 563 and 471 percent respectively The Upper Shore and Western Maryland
lag the balance of the state with 111 and 155 percent of regional population respectively with a Bachelorrsquos degree or higher
Figure K Maryland Educational Attainment by Race 200532
Educational attainment distributions vary by race and ethnicityorigin as well While six out of every 10 Asians in Maryland has a Bachelorrsquos degree or higher less than 25 percent of African-Americans and less than 20 percent of Hispanics fall into this category Nearly 390 percent of the statersquos Hispanic population does not have a high school diploma and 242 percent
Total White Alone
Black Alone
Asian Alone
Hispanic (Any Race)
Less than 9th Grade 43 34 37 49 242
9th-12th Grade No
High School Graduate 267 261 309 141 225
117 45 146 Diploma 87 75
Some College No Degree 196 189 231 113 135
Associates Degree 63 63 63 60 54
Graduate or Professional 152 168 96 308 82 Degree
Bachelors Degree 193 209 147 284 116
Bachelors Degree or Higher 345 377 243 593 198
of Hispanics have less than a ninth grade education roughly six times the state average
31 US Census Bureau American Community Survey 2005 32 US Census Bureau American Community Survey 2005
20
Marylandrsquos Labor Supply
414 Aging Population
Many of the issues Maryland will face in terms of future workforce and economic development will be rooted in demographics Between 1970 and 1980 Marylandrsquo population grew by nearly 20 percent Between 2020 and 2030 growth is expected to be just over five percent As the statersquos population growth continues to wane finding skilled workers to fill jobs will become increasingly challenging
Figure L Historic and Projected Growth among Marylands Population Age 16+33
0
100000
200000
300000
400000
500000
600000
1970-1980 1980-1990 1990-2000 2000-2010 2010-2020 2020-2030
Popu
latio
n G
row
th
0
5
10
15
20
25
Absolute Growth
Percentage Growth
Figure M Maryland Historic and Projected Growth by Age34
The Maryland Department of Planning projects that between 2000 and 2030 the statersquos share of population age 20 to 44 will drop from 374 percent to 323 percent Over the same time frame the share of population age 65 and older will increase from 113 to 195 percent Maryland is not alone experiencing this trend though median age data indicate that the statersquos population is slightly older than that of the nation Marylandrsquos median age in 2005 was 371 years compared to a median age of 365 years for the nation as a whole
33 Maryland Department of Planning 34 Maryland Department of Planning
00
100
200
300
400
500
Perc
ent o
f Pop
ulat
ion
1990 2000 2005 2010 2015 2020 2025 2030
Aged 20-44 Aged 65+
21
Marylandrsquos Labor Supply
Census data from 2000 provide an indication of the relative median age of Marylandrsquos regions Eastern Shore jurisdictions such as Dorchester Kent and Worcester counties all have median ages over 40 years of age Talbot Countyrsquos population is the oldest in the state with a median age of 433 years of age Increased immigration of retirees to Eastern Shore locales helps to explain this trend All three Western Maryland jurisdictions also are home to older populations The trend in Western Maryland and Allegany County in particular is attributed to ongoing population decline and out migration among younger people
By 2005 more than 60 percent of the statersquos population was of working age (ie age 18 to 64) Of this population the vast majority (833 percent) fell into the 18 to 54 age range More than one fifth (207 percent) of the statersquos 2005 population of working age was comprised by the leading edge (those born between 1946 and 1955) of the baby boomers those born between 1946 and 1964 This segment of the population is set to face retirement between 2011 and 2020 By 2020 the number of baby boomers between ages 18 and 54 will increase by more than 123000 and will account for 223 percent of the statersquos working age population The data make clear that the retirement of roughly one-fifth of the statersquos working age population is fast approaching and will have a disproportionate effect on those regions that are already home to a large concentration of older residents and workers (such as Western Maryland and the Eastern Shore)
42 Workforce Trends
421 Labor Force Growth Figure N Marylands Labor Force 2000 ndash 200635
Marylandrsquos labor force topped the 3 million mark for the first time in the second quarter of 2006 The state recorded a 23 percent expansion in its labor force between 2005 and 2006
2500000
2600000
2700000
2800000
2900000
3000000
3100000
2000 2001 2002 2003 2004 2005 2006
Labo
r Fo
rce
Lev
el
-10
-05
00
05
10
15
20
25
Labo
r Fo
rce
Ann
ual G
row
th
Level Growth
surpassing the 14 percent growth rate recorded nationwide This expansion was driven by a 20 percent increase in the number of employed people and a 36 percent contraction in the number of unemployed persons The statersquos recent performance reverses a trend of diminishing growth registered between 2002 and 2004 when Maryland trailed the national rate of expansion
35 Maryland Department of Planning
22
Marylandrsquos Labor Supply
Despite this recent up tick the pace of expansion for both the state and national labor force has been slowing since 1970 Between 1970 and 1980 Marylandrsquos workforce expanded by nearly 453000 workers or 27 percent During the 1990s Marylandrsquos labor force grew by just five percent about 130000 workers According to projections from the Maryland Department of Planning the growth in Marylandrsquos labor force will slow even further in the future Between 2020 and 2030 the statersquos workforce is expected to expand by just three percent (or roughly 101000 workers) This trend is being driven by the aging of Marylandrsquos population
Figure O Labor Force Shares by WIA36
00 20 40 60 80 100 120 140 160 180
Montgomery
Prince Georges
Baltimore County
Baltimore City
Anne Arundel
Mid-Maryland
Susquehanna
Southern Maryland
Western Maryland
Frederick
Lower Shore
Upper Shore
2006 The vast majority of the statersquos labor force37 resides in the suburban jurisdictions outside Baltimore City and Washington DC In fact Montgomery and Prince Georgersquos counties are home to just under one-third of the statersquos labor force Collectively
Western Maryland and the Upper and Lower Shore regions comprise another 10 percent of Marylandrsquos labor force
36 Maryland Department of Planning 37 Refers to resident labor force or the population currently working or actively looking for a job
23
Marylandrsquos Labor Supply
-20 00 20 40 60 80 100 120 140 160
Southern Maryland
Frederick
Lower Shore
Susquehanna
Mid-Maryland
Upper Shore
Anne Arundel
Western Maryland
Montgomery
Prince Georges
Baltimore County
Baltimore City
2000-2006
expansion (62 percent) during this period
422 Unemployment Rate Analysis
Figure Q Unemployment Rates 2000 to 200739
Marylandrsquos average annual
Figure P Labor Force Growth 2000 to 200638
unemployment rate which held steady at 38 percent in 2007 remains quite healthy compared to historical and national levels The comparable US jobless rate is 46 percent
The unemployment rate measures the level of unemployed persons (persons who are not working and who are available and actively looking for work) as a percentage of the total labor
All Maryland Workforce Investment Act (WIA) areas except Baltimore City recorded resident labor force growth between 2000 and 2006 In fact with the exception of Baltimore and Prince Georgersquos counties all WIAs outpaced the national rate of
200
300
400
500
600
700
2000Q
1
2000Q
3
2001Q
1
2001Q
3
2002Q
1
2002Q
3
2003Q
1
2003Q
3
2004Q
1
2004Q
3
2005Q
1
2005Q
3
2006Q
1
2006Q
3
2007Q
1
Une
mpl
oym
ent
Rat
e
United States Maryland
force This indicator is significant because it provides a relative measure of the statersquos economic health
Marylandrsquos low unemployment rate is significant to workforce development professionals because it demonstrates that local labor market conditions are increasingly tight Most
38 Bureau of Labor Statistics 39 Bureau of Labor Statistics
24
Marylandrsquos Labor Supply
economists agree that an unemployment rate in the range of 35 to 45 percent is indicative of an economy operating at full employment Marylandrsquos jobless rate continues to fall within that range In fact the state has not recorded an unemployment rate above 45 percent since July 2003
Figure R Unemployment Rates for WIAs40
00 10 20 30 40 50 60 70
Lower Shore Baltimore City
Western Maryland Upper Shore
Prince Georges Baltimore County
Susquehanna Southern Maryland
Anne Arundel Frederick
Mid-Maryland Montgomery
Unemployment Rates (Not Seasonally Adjusted)
2000 Q1 2007 Q1
While Marylandrsquos low unemployment rate testifies to the strength of the statersquos economy persistent tight labor market conditions also have the potential to aggravate labor shortages and to apply upward pressure on wages
Not all Maryland regions boast tight labor market conditions Western Maryland Baltimore City and the Lower Shore for instance have consistently posted unemployment rates upwards of 50 and 60 percent Western Marylandrsquos high unemployment rate stems from the loss of high-wage manufacturing jobs over the past two decades due to closures of former mainstay employers While the region has since experienced job growth much of the new job creation has been in low-skill low-wage positions The fact that the region has a high share of population with less than a high school diploma makes it more difficult for these workers to find quality jobs
40 Bureau of Labor Statistics
25
Marylandrsquos Labor Supply
With an unemployment rate of 61 percent in 2007 Baltimore City also is characterized by looser labor market conditions41 Baltimore is faced with serious long-term challenges including a significant number of underemployed workers as well as large segments of population who do not participate in the workforce The city is home to the largest number of residents with less than a ninth grade education (26679 persons in 2006 or 66 percent of Baltimorersquos population age 25 and older) The cityrsquos high school dropout rate at 105 percent in the 2005-2006 school year exceeds the 35 percent rate posted statewide These dropouts pose a serious workforce development challenge for the city Helping these nontraditional segments of the population (dislocated workers veterans disabled population ex-offenders etc) participate more fully in the labor market may help alleviate the demand for workers in the face of growing skill set and worker shortages
423 Labor Force Participation Rates
Figure S Labor Force Participation Rates for WIA42
500 550 600 650 700 750 800
Mid-Maryland
Frederick
Susquehanna
Montgomery
Southern Maryland
Prince Georgersquos
Anne Arundel
Baltimore County
Upper Shore
Lower Shore
Western Maryland
Baltimore City
Labor Force Participation
2000 Marylandrsquos labor force participation rate among 16- to 64-year-olds (including military) was 782 percent in 2006 ranking the state 11th in the nation according to this measure The comparable national rate is 745 percent43
41 It should be noted however that labor market conditions have improved significantly from 2004 when the city consistently recorded unemployment rates in excess of 70 percent 42 Bureau of Labor Statistics 43 US Census Bureau American Community Survey 2006
26
Marylandrsquos Labor Supply
Figure T Labor Force Participation Rates by Age44
Shifting demographics will have an effect on the statersquos labor force going forward According to Maryland
00
200
400
600
800
1000
Labo
r Fo
rce
Paric
ipat
ion
by A
ge
16-24 25-54 55 and over
2000
Department of Planning data labor force participation rates in 2000 approached 60 percent among those age 16 to 24 years Nearly 830 percent of those aged 25 to 54 years participated in the labor force However only 439 percent of those age 55 and over were in the labor force
Analysts increasingly anticipate that older workers will remain in the workforce longer compared to previous generations Still it is clear that as Marylandrsquos population ages labor force participation will be affected
424 Commuting Patterns
Figure U Percent Change in Marylands ImportedExported Workers45
Journey-to-work data from the 25 2000 Census reveal that for
20 every Maryland worker living outside the state there are 25
15 Maryland residents who leave
5
10
Exported Workers Imported Workers Net Exported Workers
1990
- 20
00
Perc
ent C
hang
e the state for work In other words Maryland is a net exporter of workers In 2000 the state recorded net exported workers in excess of 268000
0 This trend is not surprising since 1990 commuting patterns
-5 show the same pattern However an examination of 1990 and 2000 data indicates
that the situation is improving In 1990 Maryland exported 29 resident workers for every imported worker This improvement is explained by the fact that growth among imported workers (up 208 percent between 1990 and 2000) far surpasses the growth of exported workers (up 43 percent)
44 Bureau of Labor Statistics 45 US Census Bureau
27
Marylandrsquos Labor Supply
Between 1990 and 2000 the number of out-of-state residents commuting to Maryland jumped from 151330 to 182787 In 2000 the vast majority of these workers (872 percent) resided in Washington DC Delaware Virginia and West Virginia Growth was driven especially by outflows from the latter three states While the number of workers commuting from Washington DC to Maryland increased over the period they were a smaller share of Marylandrsquos imported workers dropping from 236 percent in 1990 to 199 percent in 2000
More than 450000 Maryland residents commuted outside the state for work in 2000 The lionrsquos share of these residents worked in Washington DC (620 percent) while another 242 percent worked in Virginia Delaware and Pennsylvania comprise another 52 and 28 percent respectively The number of out commuters to Washington DC dropped by more than 11000 persons or by 39 percent between 1990 and 2000
Marylandrsquos commuting patterns data is relevant not only from a workforce perspective but also from a quality of life perspective According to the Transportation Research Board by 2000 Maryland had joined the ranks of New York New Jersey and Illinois with more than 10 percent of workers traveling over 60 minutes to get to work46 The 2006 American Community Survey figures indicate that Marylandrsquos average commute time of 306 minutes is the second longest commute time in the nation closely trailing New Yorkrsquos average commute time of 309 minutes47
46 Pisarski 2006 47 US Census Bureau American Community Survey 2006
28
Marylandrsquos Labor Supply
43 Marylandrsquos Educational Supply Pipeline
It is abundantly clear that an educated workforce is essential to Marylandrsquos economy While Marylandrsquos educational institutions produce a majority of the statersquos workers there is a substantial amount of ebb and flow of educated workers between Maryland and other areas Enrollment in Marylandrsquos educational institutions has risen greatly and is expected to continue to grow in the foreseeable future
As of the 2005-2006 academic year Maryland educational institutions yielded the following labor supply 56302 high school graduates 13715 Associatersquos degrees (or certificates) 25484 Bachelorrsquos degrees 13265 Masterrsquos degrees Another 1122 first professional degrees (ie lawyers) and 1363 Doctoral degrees
Not all of these graduates choose to remain and work in Maryland Conversely not all of Marylandrsquos labor supply comes from the statersquos higher educational institutions Survey estimates reveal that the vast majority (84 percent) of Marylandrsquos community college graduates were full-time Maryland workers at least one year after graduation The corresponding figures are 64 percent for those with Bachelorrsquos degrees and 57 percent for graduates of Marylandrsquos private career schools48 Marylandrsquos ability to connect a greater number of these graduates to local Maryland employers could help reduce the impact of worker shortages
Between 1994 and 2004 full-time undergraduate enrollment in Marylandrsquos four-year public colleges and universities grew by 25 percent and community college enrollment increased by 33 percent According to projections from the Maryland Higher Education Commission (MHEC) growth in full-time enrollment at public four-year institutions is expected to moderate to 17 percent between 2007 and 2016 Growth among full-time community college students is expected to drop to 21 percent over the same period These projections are driven by predicted demographic shifts They also account for the estimated impact of tuition increases as well as changes in per capita disposable income
Over the same period graduate enrollment among public educational institutions is expected to rise 10 percent for full-time students and 55 percent for part-time students49 Increases in part-time enrollment will continue to be driven by enhanced opportunities for distance learning and online courses offered by traditional universities as well as through programs such as the University of Maryland University College
48 Percentages refer to five-year averages based on information published in the Maryland Higher Education Commissionrsquos 2007 Trend Book 49 Maryland Higher Education Commission 2007
29
Marylandrsquos Labor Demand
50 Marylandrsquos Labor Demand
51 Industry Analysis
Between 2005 and 2006 Marylandrsquos aggregate economy expanded by 31932 employees or 13 percent The statersquos 25 million job holders enjoyed average weekly wages of $88750
Marylandrsquos rate of employment expansion during this period represents a deceleration from the 16 percent growth rate recorded between 2004 and 2005 Not only has Marylandrsquos rate of employment growth slowed but the state lags the nation according to recent quarterly employment data Marylandrsquos 14 percent expansion recorded between the second quarters of 2005 and 2006 ranks the state 27th in the nation and trails the 18 percent national average Just a few years ago in 2004 Maryland consistently ranked in the top 15 states according to this measure This trend of decelerating employment growth would be cause for greater concern if not for the anticipated influx of tens of thousands of jobs to Maryland by 2011 due to the BRAC decisions While the incoming jobs have the potential to grow Marylandrsquos employment base the challenge which Maryland is addressing actively is to fill the current and future need for workers RESI anticipates that the statersquos economy will register annual rates of employment growth in the mid-one percent range in both 2006 and 2007 While not spectacular this is by no means indicative of an economic downturn Still this trend of decelerating employment growth is an area analysts will be tracking closely in the near-term future
Figure V Employment Growth by WIA 2005 to 200651
Regional employment growth for the most recent period for which data are available (2005 to 2006) ranges from shy02 percent in Baltimore City to 33 percent in Mid-Maryland Other rapidly expanding WIA regions include the Lower Shore and Southern Maryland Employment in both of these areas expanded at a pace of more than 20 percent between 2005 and 2006
50 The 25 million employment figure (as well as the additional employment figures contained in this section of the analysis) refers to Bureau of Labor Statistics Quarterly Covered Employment amp Wage data This data represents employment by place of work data and is reported to the Bureau of Labor Statistics by the Maryland Department of Labor Licensing amp Regulation (DLLR) and includes all workers covered by the Unemployment Insurance (UI) Law of Maryland and the unemployment compensation for federal employees (UCFE) program This data series accounts for approximately 91 percent all civilian employment Excluded from this data are the self-employed 51 US Bureau of Labor Statistics Quarterly Census of Employment amp Wages (QCEW) Data
-05 00 05 10 15 20 25 30 35
Mid-Maryland Lower Shore
Southern Maryland Susquehanna
Anne Arundel Montgomery
Maryland Upper Shore
Baltimore County Frederick
Western Maryland Prince Georgersquos
Baltimore City
Employment Change
2005-2006
30
Marylandrsquos Labor Demand
Employment Composition
Approximately 180 percent of the statersquos aggregate economy falls within the public sector which is comprised of local state and federal governments As a whole the public sector grew at a 16 percent clip above the average for all major sectors and pays higher than average weekly wages of $1029 With employment just above 125000 in 2006 the federal government sector comprises 49 percent of the statersquos economy and pays average weekly wages of $1438 substantially higher than the average
The importance of the federal government to the statersquos economy cannot be underestimated The many federal laboratories and facilities located within and near Maryland such as Goddard Space Flight Center and the Naval Air Systems Command at Patuxent River have contributed greatly to Marylandrsquos aerospace industry The presence of the Food and Drug Administration (FDA) and the National Institutes of Health (NIH) has spurred growth among bioscience firms The National Security Agency and Marylandrsquos many military installations have been critical to building the statersquos base of defense-related businesses
Figure W Marylandrsquos Economic Composition 200652
1-YEAR CHANGE IN EMPLOYMENT SECTOR EMPLOYMENT
LEVEL ABSOLUTE PERCENT
WEEKLY WAGES
AGGREGATE ECONOMY 2529671 31932 13 $887 PUBLIC SECTOR 455820 7170 16 $1029
Local Government 233109 6978 31 $848 State Government 97530 826 09 $879 Federal Government 125181 -634 -05 $1438
PRIVATE SECTOR 2073851 24762 12 $856 Retail Trade 299508 906 03 $620
Healthcare amp Social Assistance 295006 8871 31 $737 Professional Scientific amp Technical Services 219155 5236 24 $1401 Accommodations amp Food Services 193278 -303 -02 $377
Construction 188357 5331 29 $926 Administrative amp Support amp Waste 157299 1275 08 $710
Manufacturing 136328 -4166 -30 $1700 Finance amp Insurance 109595 -379 -03 $1238 Wholesale Trade 94927 677 07 $1097 Other Services (Except Public Administration) 89612 466 05 $585 Educational Services 54007 -66 -01 $815 Transportation amp Warehousing 65867 2237 35 $863
Real Estate amp Rental Leasing 48004 -299 -06 $886 Information 50770 392 08 $1218 Arts Entertainment amp Recreation 36476 812 23 $644
Management of Companies amp Enterprises 17763 4199 310 $1696 Utilities 9711 -38 -04 $1709
52 RESI US Bureau of Labor Statistics Quarterly Census of Employment amp Wages (QCEW) Data
31
Marylandrsquos Labor Demand
Agriculture Forestry Fishing amp Hunting 5031 -128 -25 $573 Mining 1794 67 39 $884
Not Elsewhere Classified 1362 -327 -194 $1111
With employment in excess of 207 million the private sector comprises the lionrsquos share (820 percent) of Marylandrsquos economy One of the single largest private sector industries in the state is the Healthcare amp Social Assistance sector In 2006 employment in this sector expanded by 31 percent to just over 295000 employees Retail Trade Professional Scientific amp Technical Services and Accommodations amp Food Services also rank among the largest private sector employers within the state each employing a significant proportion of Maryland workers
Regional employment distributions across industries are fairly similar to that of the state as a whole with a few notable exceptions Both Southern Maryland (comprised of Calvert Charles and St Maryrsquos counties) and Frederick Prince Georgersquos and Montgomery counties boast high concentrations of public sector and especially federal government employment Federal government employment comprises 92 percent of Southern Marylandrsquos aggregate economy The collective share for Frederick Prince Georgersquos and Montgomery counties is 80 percent Montgomery and Frederick counties have the highest proportion of employment within Professional Scientific amp Technical Services in the state with shares of 140 percent and 135 percent respectively Western Maryland and the Upper Shore are home to a significantly higher proportion of Manufacturing employment with 113 and 123 percent respectively In both of these areas the share of Manufacturing employment is more than double that of the state as a whole
Western Maryland boasts the highest share of Transportation amp Warehousing employment (42 percent) This is reflective of the way Washington County in particular has been able to leverage successfully the regionrsquos excellent transportation infrastructure which includes access to three interstates (I-68 I-70 and I-81) and two railway lines (CSX Transportation and Norfolk Southern) to reinvent itself as a transportation hub Washington County currently is home to 151 Transportation amp Warehousing businesses including the Staples Distribution Center
Montgomery County leads the state in share of Information employment (33 percent) and boasts the highest concentration (15 percent) of employment within the Management of Companies amp Enterprises sector The Lower Shore employs a significantly large proportion of workers within the Accommodations amp Food Services sector Employment in this industry comprises 155 percent of the regionrsquos economy compared to just 76 percent for Maryland as a whole
32
Marylandrsquos Labor Demand
Among the fastest growing Maryland employment sectors are high wage sectors such as Professional Scientific amp Technical Services which expanded by more than 4900 positions or 23 percent between the third quarters of 2005 and 2006 Also growing quickly were Management of Companies amp Enterprises with growth of more than 4300 positions and Wholesale Electronic Markets amp Agents amp Brokers with growth of 2314 positions Each of these sectors pays weekly wages above $1300 well in excess of the $858 average for all Maryland industries Growth also is being led by Food amp Beverage Stores which expanded by 4543 jobs or 77 percent and the demographically driven Nursing amp Residential Care Facilities industry with growth of 3409 positions or 57 percent Specialty Trade Contractors also ranks high on the list
Figure X Top Employment Gaining Maryland Industries 2005Q3 ndash 2006Q353
RANK INDUSTRY EMPLOYMENTLEVEL 1-YEAR CHANGE IN
EMPLOYMENT ABSOLUTE PERCENT
WEEKLY WAGES
1 2 3 4 5 6 7
8 9
10
11 12 13 14 15
Professional Scientific amp Technical Services Food amp Beverage Stores Management of Companies amp Enterprises Nursing amp Residential Care Facilities Specialty Trade Contractors Ambulatory Healthcare Services Hospitals Wholesale Electronic Markets amp Agents amp Brokers Food Services amp Drinking Places Warehousing amp Storage Building Material amp Garden Equipment amp Supplies Dealers Transit amp Ground Passenger Transportation Clothing amp Clothing Accessories Stores Construction of Buildings Couriers amp Messengers
219324 63824 18065 63235
128225 95508 95046
12827 177052
10747
26550 8838
30520 45944 11393
4920 23 4543 77 4337 316 3409 57 2951 24 2635 28 2602 28
2314 220 2007 11
944 96
894 35 815 102 788 27 718 16 641 60
$1335 $465
$1421 $538 $850 $985 $896
$1434 $295 $762
$609 $457 $331 $966 $726
53 RESI US Bureau of Labor Statistics Quarterly Census of Employment amp Wages (QCEW) Data
33
Marylandrsquos Labor Demand
Industries rapidly shedding jobs are led by a mix of retail services and manufacturing sectors including General Merchandise Stores which contracted by more than 6900 positions or 127 percent between the third quarters of 2005 and 2006 Accommodations (loss of more than 2700 positions) and Insurance Carriers amp Related Activities (loss of 1116 positions) The latter industry pays weekly wages approaching $1200 well in excess of the $858 average for all Maryland industries Manufacturing sectors comprise five of the most rapidly declining industries including Computer amp Electronic Product Manufacturing Primary Metal Manufacturing Leather amp Allied Product Manufacturing Transportation Equipment Manufacturing and Wood Product Manufacturing Collectively these industries shed nearly 2600 jobs from the statersquos payrolls It is important to note that with the exception of Wood Product Manufacturing these contractions are concentrated within high-paying sectors
Figure Y Top Employment Losing Maryland Industries 2005Q3 ndash 2006Q354
RANK INDUSTRY EMPLOYMENT LEVEL
1-YEAR CHANGE IN EMPLOYMENT
ABSOLUTE PERCENT
WEEKLY WAGES
1 2 3 4
5 6 7 8
9 10 11 12 13 14 15
General Merchandise Stores Accommodations Insurance Carriers amp Related Activities Merchant Wholesalers Durable Goods Sporting Goods Hobby Book amp Music Stores Merchant Wholesalers Nondurable Goods Motion Picture amp Sound Recording Industries Motor Vehicle amp Parts Dealers Computer amp Electronic Product Manufacturing Miscellaneous Store Retailers Rental amp Leasing Services Primary Metal Manufacturing Leather amp Allied Product Manufacturing Transportation Equipment Manufacturing Wood Product Manufacturing
47619 24725 34577 52555
13161 29846 4489
38795
21786 18947 13595 3583
171 8314 3567
-6927 -127 -2729 -99 -1116 -31 -1066 -20
-1005 -71 -1002 -32
-695 -134 -659 -17
-653 -29 -634 -32 -544 -38 -533 -129 -489 -741 -465 -53 -445 -111
$365 $428
$1173 $1194
$395 $941 $444 $842
$1659 $425 $723
$1124 $911
$1164 $692
54 RESI US Bureau of Labor Statistics Quarterly Census of Employment amp Wages (QCEW) Data
34
Marylandrsquos Labor Demand
52 Base Realignment and Closure Commission (BRAC) Demand
The most recent round of BRAC decisions clearly will benefit Marylandrsquos economy and will result in thousands of new high-skill high-wage jobs moving into the state over the next five years However the anticipated influx of Department of Defense (DoD) and associated contractor positions ndash estimated at between 40000 and 60000 new jobs ndash presents its own set of challenges from a workforce development perspective
The BRAC legislation mandates that several DoD units (comprised of more than 15000 civilian DoD personnel) must move to Maryland by 2011 The extent to which current DoD employees will follow their jobs to Maryland is not clear Recent estimates indicate that between 30 and 50 percent of the civilian employees working at Fort Monmouth New Jersey plan to follow their jobs to Aberdeen55 Filling the gap with existing Maryland workers and recruiting new employees will present a significant workforce development challenge This challenge will undoubtedly escalate as existing civilian DoD workers approach retirement According to a report issued by the Pentagon in 2002 the average age of DoD employees is 452 years
The size and scope of the DoD units moving to Maryland as a result of BRAC could be influenced by future and current workforce availability In other words if jobs go unfilled they could very well be lost The challenge for workforce development officials is to ensure that Maryland gains as many potential BRAC jobs as possible The way to achieve this goal is to make sure that new positions are filled quickly Implementing an efficient security clearance process is one way to work toward this goal
Most important the Statersquos workforce development system must strive to ensure that Marylandrsquos labor pool is ready and able to fill the types of jobs that BRAC will bring to Maryland Both the Fort Monmouth and the Defense Information Systems Agency (DISA) units that are slated to move to Maryland report a high proportion of the following occupations
Electricalelectronics engineers Computer engineers Management and program analysts Computer scientists Information technology managers General engineers Telecommunications specialists
55 September 28 2007 presentation by Mark Fuhring Deputy Director of Human Resources CECOM Life Cycle Management Command
35
Marylandrsquos Labor Demand
These occupations require a Bachelorrsquos degree mainly in the engineering and sciences fields for entry-level positions For higher grade positions graduate education andor a combination of work experience is required Key skills associated with these positions include
Complex problem solving Critical thinking Judgment and decision making Systems evaluation56
Technology design57
There will be ancillary effects of BRAC to be considered as well Specifically the influx of BRAC personnel and contractors will drive significant construction activity and the demand for personal services The influx also will ramp up demand for services workers such as construction managers and workers day care workers and hospitality workers among others Community colleges in Harford and Anne Arundel counties already have begun to explore program needs associated with these occupations According to a report produced by RESI in 2006 for every direct on-base job58 job that comes to Maryland 196 additional spin-off jobs will be created59 This is an area that should be explored fully by workforce development professionals
53 Demand for Science Technology Engineering and Mathematics (STEM) Workers
In recent years upper-level degrees in science and engineering have been awarded to high proportions of foreign-born students According to the National Academy of Science 59 percent of US engineering doctorates were awarded to foreign students in 200360 In 2004 roughly 63 percent of the 147 doctoral degrees in engineering awarded by Maryland institutions went to foreign students including a small number of non-US citizens with permanent resident visa status and a much larger portion of non-US citizens with temporary visa status
This trend can benefit our economy since many foreign-born people with doctorates remain in the country to work at least for some period of time Americarsquos ratio of natural sciences and engineering degrees awarded to our college age population (57 per 100) severely lags that of Japan (8 per 100) Europe (8-13 per 100) and Taiwan and South Korea (11 per 100) Recent evidence indicates however that US institutions are facing greater competition from international schools for these students a concern noted in the Maryland Higher Education Commissionrsquos 2004 plan Increased immigration restrictions have not helped the situation In 2000 Asian universities awarded 12 million of the worldrsquos science and engineering degrees (undergraduate graduate and doctoral) while the US awarded just 500000
56 The US Department of Labor defines systems evaluation as follows Identifying measures or indicators of system performance and the actions needed to improve or correct performance relative to the goals of the system 57 Technology design is defined as Generating or adapting equipment and technology to serve user needs 58 Direct on-base positions include civilian DoD positions as well as embedded private defense contractors 59 RESI Maryland Department of Business amp Economic Development 2006 60 National Academy of Science p7 2007
36
Marylandrsquos Labor Demand
It should be noted that a 2005 Duke University study presents the US in a more competitive light61 The study notes that previously published figures on the number of engineering or computer science graduates for the US China and India are not necessarily comparable due to differences in the types of programs and program length etc According to Dukersquos findings when the number of degrees granted is normalized to account for population size (on a per one million citizen basis) the US generates 750 technology specialists compared to 500 produced by China and 200 produced by India
While the scope of the competition that US higher educational institutions currently face is debatable there is one point on which analysts agree national and local economies will face greater demand for scientists and engineers going forward Marylandrsquos demand for workers in these sectors will be exacerbated further by demographics (as many current workers approach retirement) and by the impacts of BRAC which will result in the movement of a significant number of science and engineering jobs to Maryland in the near future
According to this measure Maryland fares better than most states After all Maryland ranks second in the nation in our concentration of doctoral scientists and engineers62 as well as in our number of employed PhD scientists and engineers per 100000 workers (9385)63 We are home to a multitude of federal and university research labs and rank second in the nation in terms of federal research and development spending and first in terms of university research dollars64
Still given future demand growing our base of science and engineering degrees must remain a high priority
Various Maryland entities recognize this need including GWIBrsquos Aerospace Industry Steering Committee which recommended several initiatives aimed at promoting science technology engineering and mathematics (STEM) education in Maryland Among these is the recommendation for the creation of a STEM Center of Excellence as well as the development of articulation agreements between high school pre-engineering programs and college programs Industry internships and mentorships also are identified as a means to grow Marylandrsquos supply of scientists and engineers
The Maryland State Department of Education (MSDE) also is well aware of the need for more scientists and engineers and began implementing Project Lead the Way (PLTW) in 2003-2004 PLTW is a pre-engineering program which aims to increase preparation among high schools students for higher education engineering programs Forty-three (43) Maryland high schools in 16 school systems participate in the program which allows students to enroll in such courses as Principles of Engineering Computer Integrated Manufacturing Civil Engineering and Aerospace Engineering Maryland recently received the Joseph H Oakley Excellence in Education Award for its PLTW progress Maryland also will be piloting the newly-launched PLTW for the biomedical sciences curriculum An aerospace PLTW program also is in the planning stages
61 Duke University 2005 62 National Science Foundation 2003 63 National Science Foundation State Science amp Technology Institute 2003 64 Maryland Higher Education Commission 2004
37
Marylandrsquos Labor Demand
Another MSDE program that focuses on this area is the Super Stem Project which partners higher education (the University of Maryland Baltimore County) with the Baltimore County Public Schools and MSDE The program is funded by the National Science Foundation and targets improving student achievement teacher quantity and quality specifically within STEM programs
54 The Demand for Basic and Applied Skills
The Conference Board in collaboration with several other organizations conducted a survey of US firms in 2006 to determine how employers rate new entrants to the workforce65 The results were not positive Overall employers do not consider recent graduates (high school graduates as well as graduates of two- and four-year institutions) to be adequately prepared for the workforce Specifically firms identified the following shortcomings among these populations
Figure Z Deficiencies of New Entrants to the US Workforce as Specified by Employers66
High School Graduates are bull ldquoDeficientrdquo in the basic knowledge and skills of Writing in English Mathematics and Reading Comprehension bull ldquoDeficientrdquo in Written Communications and Critical ThinkingProblem Solving
both of which may be dependent on basic knowledge and skills bull ldquoDeficientrdquo in ProfessionalismWork Ethic and bull ldquoAdequaterdquo in three ldquovery importantrdquo applied skills Information Technology Application
Diversity and TeamworkCollaboration Two-Year and Four-Year-College Graduates are bull Better prepared than high school graduates for the entry-level jobs they fill bull ldquoDeficientrdquo in Writing in English and Written Communications and bull ldquoDeficientrdquo in Leadership
65 The Conference Board 66 The Conference Board p11
38
Marylandrsquos Labor Demand
GWIBrsquos Industry Monograph for Marylandrsquos Hospitality amp Tourism Industry confirms these findings The GWIB report identifies a critical mismatch between the ldquojob-readinessrdquo or basic skills required for the majority of occupations within the sector and the skill levels of new entrants to the field The majority of occupations within this sector require basic skills and on-the-job training In fact only one occupation out of 35 requires a Bachelorrsquos degree or higher (General and Operational Managers) Yet for the balance of occupations employers are having difficulty finding workers with good active listening skills service orientation and cultural awareness and sensitivity Finding job entrants with the ability to read write and understand standard and spoken English also is a critical priority for the industry To address these issues the report recommends creating a statewide resource network to advance basic skills and to support tax incentives for worker training in English as a Second Language among other recommendations
According to occupational projections updated by the Maryland Department of Labor Licensing amp Regulation (DLLR) the top four occupations in which we expect to see the greatest level of replacement openings between 2004 and 2014 include67
Cashiers (33780 replacement openings) Retail salespersons (31670) Waiters and waitresses (21585) Combined food preparation and serving workers (17035)
This list is not surprising as these occupations have been associated traditionally with limited career paths and high turnover rates However this list also brings the issue of basic skills to the forefront Not only do these occupations rank high in terms of projected turnover they also lead the state in terms of total projected job openings between 2004 and 2014 Using US Department of Labor occupational data (ONET)68 one can determine that these occupations require basic skills (as defined by the Department of Labor) such as active listening speaking writing and reading comprehension
The Conference Board also indicates that while both basic skills and applied skills69 are paramount for new entrants to the workforce applied skills tend to be rated as the most critical 21st century skills employers are seeking The four top-rated skills are considered to be applied skills according to the study They include (1) ProfessionalismWork Ethic (2) Oral and Written Communications (3) TeamworkCollaboration and (4) Critical ThinkingProblem Solving
67 Maryland Department of Labor Licensing amp Regulation Office of Workforce Information and Performance and Office of Labor Statistics 2007 68 The US Department of Laborlsquos online information system (ONET) The ONET online system provides occupational information as well as information on key attributes and characteristics of workers and occupations 69 Examples of basic skills noted in the study include reading comprehension spoken and written English mathematics science knowledge of a foreign language etc Applied skills include lifelong learningself direction creativityinnovation leadership etc
39
Looking Ahead Identifying Gaps Challenges and Opportunities
60 Looking Ahead Identifying Gaps Challenges and Opportunities
61 The Gap between Marylandrsquos Jobs and Labor Supply is Growing
The gap between the size of Marylandrsquos labor force and the statersquos inventory of jobs is widening70 The number of jobs in Maryland has outnumbered the statersquos resident labor force for several decades In 1970 the gap was roughly 46000 By 1990 this figure had more than doubled to nearly 120000 By 2020 this gap is expected to exceed 528000 The situation is not as dire as it appears to be on the surface since workers residing in neighboring states will continue to fill some portion of these jobs however the widening gap certainly will translate into greater competition for available labor
Figure AA Historic and Projected Maryland Resident Labor Force and Jobs by Place of Work71
Labor Force Number of Jobs
4000000
3500000
3000000
2500000
2000000
1500000
1000000
1970 1980 1990 2000 2010 2020 2030
Lab
or F
orce
Jo
bs
After 2010 labor force growth is expected to slow Between 2010 and 2020 for example the statersquos labor force is expected to increase by roughly 200000 (down from expected growth of more than 360000 over the previous decade) Much of the anticipated slowdown in labor force growth is attributable to the graying of our population For years experts have been anticipating the dramatic ways in which our aging workforce will affect national state and local economies The implications of this megatrend are enormous They range from the need for employers to adapt to increasing generational diversity and generational differences in the workplace to the need for companies to ensure that knowledge and skills are retained as older workers retire Maryland must confront the impacts of these demographic shifts along with the rest of the nation
70 The Maryland Department of Planning projects jobs by place of work using historical data released by the Bureau of Economic Analysis These are jobs which are located in Maryland but are filled by both state and non-state residents The statersquos resident labor force also is projected by the Maryland Department of Planning based on historical Bureau of Economic Analysis data Projections were updated in November 2006 71 Maryland Department of Planning November 2006
40
Looking Ahead Identifying Gaps Challenges and Opportunities
The following chart details Marylandrsquos historical current and projected labor force composition by age The proportion of adults age 55 years old and older who are active in the workforce is projected to increase from roughly 12 percent in 1990 to 26 percent by 2020 The proportion of Marylandrsquos workforce comprised of adults age 35 to 54 years old on the other hand is expected to decrease from 43 percent to 39 percent over the same period As previously mentioned this trend is due to the graying of the population ndash there are simply fewer people making up Generations X and Y compared to the size of the baby boomer generation
Figure AB Historic and Projected Proportion of Marylands Labor Force by Age72
Perc
ent o
f Lab
or F
orce
00
100
200
300
400
500
600
1990 2000 2010 2020 2030
16-34
35-54
55+
72 Maryland Department of Planning 2006
41
Looking Ahead Identifying Gaps Challenges and Opportunities
62 The Race to Preserve Institutional Knowledge
The impacts of Marylandrsquos aging population are not limited simply to the issue of filling jobs Shifting demographics and the approaching retirement of older workers will place increased pressure on firms to preserve institutional knowledge Simply put companies and industry are scrambling to prevent ldquobrain drainrdquo for good reasons
The dearth of qualified nuclear engineers and related workers illustrates this issue perfectly According to the Nuclear Energy Institute (NEI) the US nuclear industry faces a critical shortage of workers by 2010 In fact NEI finds that less than eight percent of industry employees are younger than 32 years of age and more than half are age 47 or older Expected shortages will affect a broad cross section of occupations within the industry ranging from health physicists and plant operators to technicians welders and maintenance workers73 The timing is especially problematic as the Nuclear Regulatory Commission expects an influx of applications for nearly three dozen new reactors by 2008 including Constellation Energy Grouprsquos application to build a new nuclear reactor at Calvert Cliffs74 Clearly industry and workforce development professionals must ensure that institutional knowledge within this critical industry is preserved and a sufficient pipeline of future workers is developed
The nuclear engineer example is not an isolated case According to findings from GWIBrsquos Aerospace Industry Initiative Workforce Summit conducted in January 2006 50 percent of the aerospace workforce in Maryland is expected to retire in the next 15 years A 2002 Accenture publication notes that ldquoThe vast majority of US and European chemical companies are concerned about problems posed by their aging workforce Estimates that 50 percent of employees will become retirement eligible in a particular function in the next decade are not uncommon in the US and Europerdquo75 Marylandrsquos Educational Services sector which already is feeling the impact of critical shortages ranks among those industries with a high proportion of older workers (roughly 18 percent are age 55 plus)76 The Healthcare sector is another that has begun to feel the impact of an aging workforce In 1998 nearly 24 percent of Marylandrsquos registered nurses working in hospitals were between the ages of 48 and 57 years old and another 19 percent were over the age of 58 By 2005 these proportions had grown to 28 and 25 percent respectively77 According to GWIBrsquos Healthcare Workforce Summit monograph vacancy rates in 2002 for registered nurses (156 percent) radiation therapy technicians (211 percent) and licensed practical nurses (129 percent) at Maryland hospitals already are high The issue of brain drain and shortages undoubtedly will be compounded as the demand for healthcare services increases due to the graying of the population78
73 Nuclear Energy Institute 2007 74 Baltimore Sun Constellation Energy files partial plan for reactor July 31 2007 75 DeLong page 3 76 Carroll 2004 77 Maryland Board of Nursing 78 One recommendation developed from GWIBrsquos Healthcare Workforce Summit involves transitioning retired military personnel to the private sector Many of these personnel have accumulated vast experience and training but lack proper certification ProVET (Providing Re-employment Opportunities to Veterans) is one program Maryland has launched in recent years to provide transition assistance for those veterans who are interested in securing private sector employment
42
Looking Ahead Identifying Gaps Challenges and Opportunities
63 FacultyTeacher Shortages
It is not the intention of this analysis to minimize the significance of labor shortages already occurring in Maryland industry sectors ndash for example that of registered nurses and other healthcare professionals However given that much already has been written about these shortages this analysis instead targets the issue of faculty shortages
Marylandrsquos need for teachers outstrips the statersquos ability to produce and retain them In 2005 school systems throughout the state hired roughly 8000 teachers of which 4350 were beginning new hires Only one-third (1439) of the beginning new hires had graduated from Maryland colleges and universities
Particular subjects facing current and future shortages include Technology education Computer science English for Speakers of other Languages Foreign languages Mathematics Science Special education
The issue of faculty shortages extends to higher education as well and is affecting a range of Maryland industries including the healthcare sector As noted in GWIBrsquos HealthCare Monograph ldquothe amount of faculty and learning facilities is inadequatehelliprdquo to train the statersquos healthcare workforce These shortcomings are evidenced by student waiting lists at local nursing schools79 Indeed nursing programs both locally and nationally report an increase in the number of qualified nursing applicants being turned away due to a dearth of faculty and classroomclinical space In 2005 the number of applicants denied admission due to a lack of faculty or classroom and clinical space jumped to 29424 nationally and 1850 in Maryland
According to a 2005 survey80 the statersquos 24 nursing degree programs reported that 305 percent of full-time faculty positions were vacant Local shortages are attributed to both the aging of the statersquos faculty population as well as the difficulties in growing the pool of potential educators These difficulties range from structural barriers like limited local capacity of graduate programs in nursing education to market-driven trends (eg compensation for practicing nurses often exceeds that for nursing educators) These trends undoubtedly will be exacerbated as Marylandrsquos nursing faculty population continues to age and approach retirement The average age of nursing faculty at Maryland institutions as reported to the Board of Nursing in 2005 ranges from 42 to 55 years and nationally the average age of faculty retirement is 625 years81
79 Charting New Directions Governorrsquos Healthcare Workforce Summit page 13 80 Maryland Council of Directors of Associate Degree and Baccalaureate Programs Survey 81 Nursing Faculty Shortage Causes Effects and Suggestions for Resolution Maryland Statewide Commission on the Crisis in Nursing 2005
43
Looking Ahead Identifying Gaps Challenges and Opportunities
64 Increasing Age Diversity
Business and industry also will need to accommodate increased age diversity in the workplace According to a 2005 Forbes magazine article ldquoEmployers need to examine whether their policies programs and practices are age neutral For example is the company offering dependent care geared only toward children when the workforce may be at an age where elderparent care has more valuerdquo82
Adjusting to differences in generational attitudes and preferences in the workplace will present its own set of challenges For instance the chemical industry has become accustomed to low voluntary turnover among managers and professionals As younger generation workers (Generation X and Y in particular) replace retirees the industry will need to adapt to an increased tendency for voluntary attrition as these workers tend to be more willing to seek out better job opportunities83 Many today consider employee loyalty to be a thing of the past especially among todayrsquos younger workers who are perceived to be constantly on the prowl for bigger and better opportunities
The aging of our population also has implications for education As the age of students at postshysecondary educational institutions rises and as workers continue to pursue lifelong learning campuses and faculty increasingly will require additional flexibility in terms of location timing etc MHEC recognized this need in their 2004 plan and set a goal to enhance alternative approaches for educational delivery ndash namely distance learning and regional higher education centers The Statersquos academic institutions already have begun to respond to these needs as evidenced by institutional expansion to satellite campuses the expansion of 2+2 programs84 and increased investments in and access to distance learning programs that are part of Marylandrsquos higher education system
65 Immigrants Continue to Grow Marylandrsquos Labor Supply
Marylandrsquos workforce is expected to benefit from international migration at both ends of the employment spectrum as immigrants fill low-wage low-skill jobs as well as high-wage high-skill positions Low-skill jobs such as Combined Food Preparation amp Serving Workers for example continue to rank among the top occupations demanded in Maryland According to data published by the Urban Institute immigrants comprise a disproportionately high share (20 percent) of low-wage workers in the US Immigrant workers represent an especially large proportion of low-wage occupations within the farming and private household sectors According to 2002 estimates immigrants compose 37 and 42 percent of employment in these sectors respectively85 The Pew Hispanic Center reports that short-term unauthorized immigrants are concentrated heavily in the low-wage construction (including building and
82 Reeves 200583 Accenture Institute for Strategic Change 2002 84 2+2 is a program in which the first two years of post-secondary education are completed at a community college and the remainder is completed at a partner four-year institution85 Capps 2003
44
Looking Ahead Identifying Gaps Challenges and Opportunities
grounds cleaning and maintenance occupations) and hospitality industries (including food preparation and service occupations)86
GWIBrsquos Hospitality and Tourism monograph reveals the importance of this workforce to local industry The report documents Marylandrsquos reliance on immigrant workers seasonal and otherwise to fill a variety of occupations within this sector ranging from food service occupations such as bartenders hosts and hostesses cooks dishwashers and food preparation workers to grounds keeping workers desk clerks receptionists maids and housekeeping cleaners and security guards etc The report finds that the need for these workers outstrips supply The limited number of H-2B worker visas which allow for the temporary hiring of foreign workers granted to Maryland businesses is not enough to fill the vacant positions
Other immigrant segments are expected to continue to fill high-wage high-skill jobs in such occupations as scientists and engineers The Migration Policy Institute analyzed Census 2000 data and found that one out of every five doctors in the US is foreign born Two of every five medical scientists one of every five computer specialists and one of every six people in the engineering or science fields are foreign born In addition the proportion of foreign-born workers in other skilled fields such as nursing has grown significantly in recent years a trend which is expected to continue87
86 Pew Hispanic Center 2006 87 Kaushal 2006
45
Looking Ahead Identifying Gaps Challenges and Opportunities
0
20000
40000
60000
80000
100000
120000
1980 1990 2000Peop
le W
ho S
peak
Eng
lish
Not
Wel
l o
r N
ot a
t All
Figure AC Maryland Population Who Speak English ldquoNot Wellrdquo or ldquoNot at Allrdquo
From a workforce development perspective the movement of immigrants into Maryland will require increased investment in English as a Second Language (ESL) programs According to the decennial census data the percentage of people who reported to the Census Bureau that they spoke English ldquonot wellrdquo or ldquonot at allrdquo increased nearly 74 percent since 1990 (Figure AC) Of the more than 246000 persons who indicated that they spoke English ldquoless than very wellrdquo 44
percent reported Spanish as their native language while another 26 percent indicated an Asian language (particularly Korean Chinese and Vietnamese) as their native language Much of this population represents non-English speaking immigrants who present new challenges in terms of labor force training and education Recognizing this need organizations such as US Hispanic Youth Entrepreneur Education (USHYEE) in partnership with the Maryland State Department of Education (MSDE) and colleges and universities within the state are working together to provide Hispanic youth with scholarships along with technical and life skills that will encourage this segment of the population to seek higher education opportunities
The statersquos growing immigrant population has the potential to fill another significant role in Marylandrsquos economy As commerce and industry become more global knowledge of a foreign language is becoming increasingly critical to local businesses In fact a recent survey of US employers confirms that speaking a foreign language is expected to be a highly demanded skill in the 21st century Survey results indicate that while only 11 percent of employers currently rate this skill as ldquovery importantrdquo approximately two-thirds indicate that knowledge of a foreign language will increase in importance over the next five years In fact knowledge of a foreign language was singled out as the top basic skill expected to increase in importance88 In 2005 145 percent of Marylanders age five and older spoke a language other than English at home89 a trend that clearly will benefit the state in its efforts to meet foreign language needs
88 The Conference Board p11 89 US Census Bureau American Community Survey 2005
46
Looking Ahead Identifying Gaps Challenges and Opportunities
66 Adult Education and Engaging Workers with Barriers to Employment
Todayrsquos jobs and the jobs of tomorrow will require an increasingly complex array of skills including but not limited to verbal mathematical organizational and interpersonal skills This further complicates matters for the one million potential Maryland workers who have barriers to employment They include Marylandrsquos veteran population people with lower literacy ex-offenders people with disabilities and those receiving unemployment insurance benefits90
Preparing these workers for the jobs of the future presents another challenge for the Statersquos workforce development system As previously mentioned these populations are a potentially untapped labor supply If workforce development professionals can help this population transition more fully into the workforce tight labor market conditions may be alleviated
Veterans Population
As of 2005 more than 427000 people or 119 percent of the statersquos population 18 and over were veterans The vast majority of Maryland veterans (89 percent) are male Not surprisingly female veterans tend to be younger than their male counterparts A total of 776 percent of female veterans are between 18 and 54 years of age compared to 372 percent of male veterans91
Ex-Offenders
The number of offenders released from Maryland Department of Public Safety and Correctional Services facilities in 2006 approached 14000 Approximately six out of 10 or 8685 people were released in Baltimore City As of April 2007 nonviolent offenders constituted 426 percent of the nearly 23000 inmates housed in Maryland facilities More than 20 percent of this population is age 25 or under and another 171 percent are between 25 and 30 years of age Nearly 3400 of them or 149 percent of this population are serving a sentence of 36 months or less
Transitioning ex-offenders into the workforce is critical not only from a workforce development perspective but from a public safety perspective as well To the extent that this population can become engaged in the workforce the likelihood of recidivism is expected to decline
Lower Literacy Population
According to a report released recently by the US Department of Education roughly 206 percent of Marylandrsquos adult population (or 730000) was eligible for adult education services as of 2000 This population includes individuals who ldquolack sufficient mastery of basic educational skills to enable the individuals to function effectively in societyrdquo lack a high school diploma or equivalent or (are) ldquohellipunable to speak read or write the English languagerdquo Specifically this
90 Examples of other population segments that could be targeted include homeless persons welfare recipients and youth out of school among others 91 US Census Bureau American Community Survey 2005
47
Looking Ahead Identifying Gaps Challenges and Opportunities
population includes those adults age 16 or older who lack a high school diploma and who are not enrolled in school and adults who speak English as a second language and who have rated their ability to speak English as ldquowellrdquo ldquonot wellrdquo or ldquonot at allrdquo92
The vast majority of this adult education population (601 percent) is of working age (from 16 to 59 years old) yet in 2000 well over half of them (348717 persons) did not participate in the statersquos labor force Another 28484 reported they were unemployed Basic literacy and English as a Second Language instruction is needed to help transition this group more fully into the workplace More than 105000 of Marylandrsquos adult education population speak English as a second language and nearly half of this group (51952) identify themselves as speaking English ldquonot wellrdquo or ldquonot well at allrdquo93
People with Disabilities
Maryland is home to more than 376000 working age (from 16 to 64) people with disabilities Only about 43 percent of these people are employed compared to 78 percent for the remainder of the statersquos working age population94 The low employment rate for people with disabilities combined with the fact that many of them can become employed with or without accommodations are reasons that the GWIB views people with disabilities as an untapped workforce
Unemployed Persons and Persons Receiving Unemployment Insurance Benefits
As of August 2007 the number of unemployed Marylanders is on track to approach last yearrsquos level of roughly 116000 persons This population includes people who are not working but who are actively seeking work They are counted as part of Marylandrsquos labor force Though the number of unemployed people in Maryland has been on the decline since 2004 they still represent a substantial potential labor pool
More than 18000 initial unemployment claims were filed in Maryland in June 2007 The extent to which the State can link these persons with employment opportunities will help to decrease the number of people filing for initial and continuing unemployment insurance claims and will help increase Marylandrsquos available labor pool
92 US Census Bureau Profiles of the Adult Education Target Population Information from the 2000 Census December 2005 93 US Census Bureau Profiles of the Adult Education Target Population Information from the 2000 Census December 2005 94 US Census Bureau 2006 American Community Survey
48
Recommendations
70 Recommendations
This section of the analysis highlights a number of emerging challenges that will test the statersquos economic and workforce strengths over the next one to five years and provides priority recommendations to address these challenges
71 Science Technology Engineering and Mathematics (STEM) Industries are Struggling to Attract Recruit and Retain Workers
As in other industries many of Marylandrsquos science technology engineering and mathematics (STEM) industries face a looming retirement cliff as skilled baby boomers begin to retire and leave the workforce Compounding the problem is anecdotal and other evidence which suggests that the pool of qualified technical students graduating from college is actually diminishing The statersquos aerospace industry serves as a prime example According to the GWIB Aerospace Industry Steering Committee in 2006 nearly eight out of every 10 Maryland aerospace workers was age 51 or over and 50 percent of the current aerospace workforce is set to retire by 2020
Recommendation Increase opportunities for young people to become aware of and enter science technology engineering and mathematics (STEM) careers
One way to meet the need for workers in science technology engineering and mathematics (STEM) careers is to expand middle- and high school-level studentsrsquo interaction with STEM professionals through expanded internship and mentorship programs GWIBrsquos Aerospace Monograph also identifies the need to encourage STEM-related field trips and other applied activities and to invite industry professionals to classes or school activities The Johns Hopkins Universityrsquos Applied Physics Labrsquos (APL) Mentor Program is a perfect example of such interaction The program is conducted in conjunction with the Howard County Public Schools and other nearby schools and pairs high school students with volunteer APL professional staff The program enables students to work on science projects with their mentors during the school year
Encouraging qualified underrepresented population segments (ie females and minorities) to pursue studies in science and mathematics is another way to boost interest APL and a number of university partners are involved in a program that targets this issue The Maryland Mathematics Engineering Science Achievement program (MESA) is a pre-college program in which MESA partners work directly with teachers and schools in order to encourage K-12 interest in STEM fields The program targets minorities and females
Recommendation Expand and enhance pre-college programs such as Project Lead the Way
Expanding programs such as MSDErsquos Project Lead the Way (PLTW) is another approach PLTW is a pre-engineering program which aims to increase preparation among high school students for higher education engineering programs Forty-three (43) Maryland high schools in 16 school systems participate in the program which allows students to enroll in such courses as Principles of Engineering Computer Integrated Manufacturing Civil Engineering and
49
Recommendations
Aerospace Engineering Maryland soon will pilot the newly-launched PLTW for a biomedical curriculum An aerospace PLTW program also is in the planning stages
72 Maryland Continues to Face Growing Teacher and Faculty Shortages
The state continues to confront shortages among teachers and faculty Marylandrsquos need for teachers outstrips our ability to produce and retain them In 2005 roughly 8000 new teachers were hired in the state of Maryland Of the 4390 teachers who were new hires only 1439 (33) were graduates of Maryland colleges and universities95 Subjects with current and future teacher shortages include technology education computer science English for Speakers of other Languages foreign languages mathematics science (including physical science physics chemistry and earthspace science) and special education
The issue of faculty shortages extends to higher education as well and is affecting a number of Maryland industries including the healthcare sector As noted in GWIBrsquos HealthCare Monograph ldquothe amount of faculty and learning facilities is inadequatehelliprdquo to train the statersquos healthcare workforce These shortcomings are evidenced by student waiting lists for local nursing schools96 Nursing programs both locally and nationally report an increase in the number of qualified nursing applicants being turned away due to a dearth of faculty and classroomclinical space In 2005 the number of applicants denied admission for these reasons totaled 29424 for the nation and 1850 in Maryland
According to a 2005 survey97 Marylandrsquos 24 nursing degree programs reported that 305 percent of full-time faculty positions were vacant Local shortages can be attributed to both the aging of the statersquos population as well as difficulties in growing the pool of potential educators These difficulties range from structural barriers such as the limited local capacity of graduate programs in nursing education to market-driven trends (eg compensation for practicing nurses often exceeds that for nursing educators) These trends will undoubtedly be exacerbated as Marylandrsquos nursing faculty population continues to age and approach retirement The average age of nursing faculty at Maryland institutions as reported to the Board of Nursing in 2005 ranges from 42 to 55 years and the average age nationally for faculty retirement is 625 years98
Recommendation Enhance teacher retention through the expansion and enhancement of Professional Development School (PDS) networks
It appears that facultyteacher retention especially at the primary and secondary levels can be improved through access to quality Professional Development School (PDS) networks One example is Towson Universityrsquos PDS network which has been recognized at both the state and national levels as a successful model that relies on a partnership between a college or university and local school systems PDS networks aim to enhance and improve teacher quality through
95 Maryland State Department of Education 2006 96 Charting New Directions Governorrsquos Healthcare Workforce Summit page 13 97 Maryland Council of Directors of Associate Degree and Baccalaureate Programs Survey 98 Nursing Faculty Shortage Causes Effects and Suggestions for Resolution Maryland Statewide Commission on the Crisis in Nursing 2005
50
Recommendations
continuous professional development The network targets all stages of a teacherrsquos career offering professional development activities throughout the entire career An analysis of Towson Universityrsquos PDS network in 2001 showed that its teacher-graduates were retained at a much higher rate than other new teachers According to the study schools within the PDS network were associated with teacher retention rates of 80 percent after four years and 71 percent after five years This compares to non-PDS network retention rates of 45 and 34 percent respectively99
73 Marylandrsquos Growing Immigrant Population Opportunities and Challenges
Population shifts are impacting the demographic makeup of the state in ways that will have dramatic impacts on employer needs and workforce development Between 2000 and 2006 immigrants accounted for more than half (516) of Marylandrsquos population growth As of 2006 immigrants account for 12 of the statersquos population
Marylandrsquos workforce is expected to benefit from international migration at both ends of the employment spectrum as immigrants fill low-wage low-skill jobs as well as high-wage high-skill positions From a workforce development perspective this movement into Maryland will require increased investment in English as a Second Language (ESL) programs According to decennial census data the percentage of people who report to the Census Bureau that they speak English ldquonot wellrdquo or ldquonot at allrdquo has increased nearly 74 percent since 1990 Much of this population represents non-English speaking immigrants who present new challenges in terms of labor force training and education
Despite the pressing need for adult literacy services in Maryland demand continues to severely outstrip supply According to MSDE funding constraints dictate that a small percentage of annual demand is being met resulting in annual waiting lists of up to 5000 people Many of the people on waiting lists (47 percent) are waiting for access to ESL programs100
Recommendation Enhance and expand access to community English as a Second Language (ESL) programs
Not only is there a need for improved access to English as a Second Language programs but MSDE also notes the need to improve the quality of the statersquos ESL programs In 2005 Marylandrsquos adult education programs offered 40 hours of instruction per student which is not adequate for beginner or even intermediate English learners to become proficient Many of these ESL students lack advanced literacy skills in their native language and thus require additional intensive classroom time MSDE notes that a program that offers more than 100 hours of classroom time would better meet the needs of this population
Recommendation Enhance and support initiatives and partnerships that encourage a broad spectrum of education opportunities for immigrant populations
99 Pilato Maryland State Department of Education 100 Maryland State Department of Education December 2005
51
Recommendations
Many of Marylandrsquos foreign-born workers are highly educated and possess applicable skills however many of Marylandrsquos immigrants are at the opposite end of the educational spectrum As of 2006 43 percent of Marylandrsquos immigrants held at least a Bachelorrsquos degree compared with 34 of US natives in Maryland At the same time 18 of immigrants in Maryland did not have a high school diploma or its equivalent compared to 12 of US born Maryland residents101
Organizations such as US Hispanic Youth Entrepreneur Education (USHYEE) in partnership with MSDE and colleges and universities within the state are working together to provide Hispanic youth with scholarships along with technical and life skills that will encourage this segment of the population to seek higher education opportunities
Recommendation Coordinate efforts to promote Marylandrsquos access to seasonal immigrant (H-2B) and skilled immigrant (H-1B) workers102
Seasonal immigrant worker shortages have adversely affected Maryland businesses for some time In 2005 the national cap of 66000 H-2B visas which allow foreign nationals to temporarily enter the US and take advantage of seasonal or peak load employment opportunities was filled just a few months into the federal fiscal year As a result the lionrsquos share of Maryland businesses were prevented from applying for the estimated 7000+ temporary workers needed to sustain Marylandrsquos seasonal businesses A diverse group of Maryland industries are affected by the seasonal worker shortage including tourism and hospitality-driven businesses and agriculture and seafood processing firms as well as other types of service firms such as landscaping businesses
The State has recognized the importance of this issue In fact local political leaders continue to be actively involved in drafting legislation to increase the national cap and exempt returning seasonal workers from being subject to it GWIBrsquos Hospitality amp Tourism Monograph emphasizes Marylandrsquos need for seasonal immigrant workers and recommends that a state liaison office for immigration issues be established The GWIB report notes that in addition to being actively involved in immigration policy and advocacy the liaison office could work to connect foreign-born workers with Maryland businesses in need of temporary workers
A liaison office also could coordinate efforts to increase the availability of H-1B workers The H-1B visa program targets highly-skilled internationals who work in professional fields such as computing finance law and healthcare among others The national cap for H-1B visas has fluctuated in recent years jumping from 65000 in the late 1990s to 195000 in 2000 and then dropping back to 65000 in fiscal year 2003 As with H-2B visas annual quotas are met early in the year According to the Migration Policy Institute one out of every five doctors in the US is foreign born Two of every five medical scientists one of every five computer specialists and
101 US Census Bureau 2006 American Community Survey calculations based upon Maryland residents age 25 and over 102 It should be noted that this recommendation in no way advocates filling BRAC and other positions which require security clearances with H-1B and H-2B workers Given security clearance requirements filling these jobs with foreign nationals is simply not possible
52
Recommendations
one of every six persons in engineering or science fields are foreign born Given current and expected shortages among the science engineering technology and mathematics (STEM) fields it makes sense to explore expanding the H-1B visa option
74 The Need for Increased Labor Force Participation
The statersquos low jobless rate (39 percent in 2006) signifies not only that Marylandrsquos economy is healthy but also that local labor market conditions remain tight Most economists agree that an unemployment rate in the range of 35 to 45 percent is indicative of an economy operating at full employment and Marylandrsquos jobless rate continues to fall within that range In fact the state has not recorded an unemployment rate above the 45 percent mark since July 2003
Tight labor market conditions have the potential to aggravate labor shortages and apply upwards pressure on wages Since nearly one-sixth of Marylandrsquos existing labor force is expected to retire in the next decade these conditions are likely to worsen going forward Continued local labor supply shortages makes leveraging our underutilized and potential labor supply all the more important There is an opportunity to address this issue by tapping adult population segments that are underrepresented in the workforce including veterans ex-offenders and the statersquos disabled and lower literacy populations
According to a report released recently by the US Census Bureau roughly 175 percent of the statersquos adult population (or nearly 618000 persons) was eligible for adult education services as of 2000 This population includes individuals who ldquolack sufficient mastery of basic educational skills to enable the individuals to function effectively in societyrdquo103 Specifically this population includes those adults age 16 or older who lack a high school diploma and who are not enrolled in school In order to more fully integrate them into the statersquos labor force we need to expand access to basic literacy instruction GED services and English as a Second Language (ESL) classes
Recommendation Enhance opportunities for adult education (ie basic literacy GED services and ESL classes)
Despite the pressing need for adult literacy services demand continues to severely outstrip supply According to MSDE funding constraints dictate that only three to five percent of annual demand for these services is being met resulting in annual waiting lists of up to 5000 people The majority of those on waiting lists include people seeking ESL instruction and Adult Basic Education (ABE) If the State can increase the availability of these educational programs Marylandrsquos economy will benefit
103 US Census Bureau Profiles of the Adult Education Target Population Information from the 2000 Census December 2005
53
Recommendations
Recommendation Future study is necessary to identify the education and related needs of additional adult population segments
While the needs of Marylandrsquos lower literacy population have been identified there exists a lack of comprehensive information on other population segments which may not be participating fully in the statersquos workforce A thorough study is needed to identify the demographic economic and social characteristics of each Maryland population segment (ie veterans ex-offenders disabled population etc) With this information the education and hard or soft skill levels of these populations could be identified in addition to the identification of barriers preventing them from participating more fully in the workplace A synthesis of this information also would help to identify specific occupations that could serve as an entreacutee to career tracks for each of these population segments
Recommendation Create a statewide resource network to advance basic skills
Basic skills are in demand In fact the Maryland Department of Labor Licensing amp Regulation projects that the top four occupations expected to see the greatest level of replacement openings between 2004 and 2014 include104
Cashiers (33780 replacement openings) Retail salespersons (31670) Waiters and waitresses (21585) Combined food preparation and serving workers (17035)
These occupations require such basic skills as active listening speaking writing and reading comprehension
A recent GWIB report targeting Marylandrsquos Tourism amp Hospitality sector identifies a critical mismatch between the ldquojob-readinessrdquo or basic skills required for most occupations in the sector and the skill levels of new entrants to the field The majority of occupations in this sector require basic skills and on-the-job training yet employers are having difficulty finding workers with good active listening skills service orientation and cultural awareness and sensitivity Finding job entrants with the ability to read write and understand standard and spoken English also is a critical priority for the industry To address these issues the report recommends creating a statewide resource network to advance basic skills
104 Maryland Department of Labor Licensing amp Regulation Office of Workforce Information and Performance and Office of Labor Statistics 2007
54
Recommendations
55
Recommendations
1 BRAC Requires a Pipeline of Qualified Workers
Not all of the current BRAC personnel will move to Maryland along with their jobs Since the average civilian DoD worker is 45 years old many current workers will approach retirement in the near-term future The short-term implications of this trend are highly relevant given that the size and scope of the DoD BRAC units moving to Maryland could be influenced by current and near-term future workforce availability In other words if jobs go unfilled they could very well be lost through downsizing or reconfiguration of BRAC units The challenge for workforce development officials is to ensure that Maryland realizes as many potential BRAC jobs as possible The way to achieve this goal is to make sure that new positions are filled quickly
The statersquos workforce development system must strive to ensure that Marylandrsquos labor pool is ready and able to fill the types of jobs that BRAC will yield Both the Fort Monmouth and Defense Information Systems Agency (DISA) units that are slated to move to Maryland report a high proportion of the following occupations
Engineers (specifically electronicselectrical engineers computer engineers software engineers and engineers in general)
Managers (federal contract managers logistics managers inventory managers and information technology managers)
Computer scientists Telecommunications specialists Analysts (budget analysts and managementprogram analysts) and Technical writers and editors
These occupations require a Bachelorrsquos degree mainly in the engineering and sciences fields for entry-level positions For higher grade positions graduate education andor a combination of work experience is required Key skills associated with these positions include
Complex problem solving Critical thinking Judgment and decision making Systems evaluation105
Technology design106
105 The US Department of Labor defines systems evaluation as follows Identifying measures or indicators of system performance and the actions needed to improve or correct performance relative to the goals of the system 106 Technology design is defined as Generating or adapting equipment and technology to serve user needs
56
Recommendations
Recommendation Actively recruit retired government personnel and veterans to fill vacant BRAC positions
Fort Monmouth is currently in the process of actively recruiting up to 2000 Maryland workers to fill BRAC positions by 2011 Retired government personnel and veterans (especially those with security clearances) stand out as a potential labor pool worth cultivating in order to help the bases meet recruitment needs and fill any foreseeable gaps in the immediate future
Recommendation Increase interest recruitment and retention in BRAC-related fields
Since many of the BRAC jobs will require an educational background in science technology engineering and mathematics (STEM) fields and since graduation levels in many of these fields have been flat to negative in Maryland we must generate an interest in these fields before students enter college
Maryland has developed several new or planned initiatives at the high school level that if proven successful could serve as models to be deployed elsewhere in order to ensure that Maryland is developing an adequate pipeline of BRAC workers One such initiative is the Homeland Security and Emergency Preparedness Magnet Program at Joppatowne High School in Harford County The program which was launched in the fall of 2007 consists of three curricular tracks including Criminal JusticeLaw Enforcement InformationCommunications and Technology and Homeland Security Sciences The curricular content of these tracks is often applied For example the InformationCommunications and Technology track enables students to attain certification in both Cisco and SPACESTARS professional programs While the program aims to prepare high school students for careers in the homeland security field it also is designed to create a network linking students with government and industry partners
The Science and Mathematics Academy at Aberdeen High School is another example This program funded with federal state and local funds was launched in fall 2004 after several years of planning The program originated with the Army Alliance and other professionals affiliated with Aberdeen Proving Ground (APG) A critical program component provides students with the opportunity to interact regularly with professional scientists and mathematicians Another unique feature allows high school seniors to perform original research with the guidance of a program mentor
Recommendation Identify labor and education needs for spin-off BRAC jobs
The influx of BRAC personnel and contractors to Maryland will result not only in significant construction activity but also increased demand for personal services According to a report produced by RESI in 2006 for every direct on-base job107 that comes to Maryland 196 additional spin-off jobs will be created108 Specifically Maryland will experience a rapidly growing demand for construction managers and workers day care workers and hospitality workers among others Local community colleges in Harford and Anne Arundel counties
107 Direct on-base positions include both civilian DoD positions as well as embedded private defense contractors 108 RESI of Towson University Maryland Department of Business amp Economic Development 2006
57
Recommendations
already have begun to explore program needs associated with such occupations This is an area that should be explored fully by workforce development professionals
75 There Is a Shortage of Workers with Security Clearances
The number of positions requiring security clearances as well as the level of security clearances required for existing contracts has increased dramatically since September 11 2001 This increased demand has exacerbated processing times and resulted in a frenzy of competition and ldquopoachingrdquo from the limited pool of cleared workers many of whom are concentrated within science technology engineering or mathematics (STEM) fields Not only is the security clearance process a lengthy and onerous one but it is costly as well Processing delays can cause jobs to remain unfilled for months on end and the cost of sponsorship is quite high
Recommendation Spread the word set up a pre-screening model and expand internship opportunities
The issue of security clearances is a tricky one since the process is federally driven and thus largely outside the Statersquos control Still Maryland can begin to address the security clearance issue by disseminating information An awareness campaign especially targeting high school and college students is needed to get the word out We must emphasize the multitude of job opportunities available to Marylandrsquos youth and inform them what they need to do (or rather avoid) in order to obtain positions requiring security clearances
Also key to resolving Marylandrsquos excess clearance demand is to spearhead the clearance process by targeting prospective workers while they are still students To achieve this goal a pre-screening model could be developed whereby prior to graduation college students begin the security clearance process A Towson University study performed on behalf of DBED notes however that such a model would enhance the process only if the federal government addresses process issues at the national level109 Once the model is in place matching funds could be established (between defense contractors and other organizations as well as private andor public sources) in order to sponsor students to begin the security clearance process
Expanded internship prospects represent another area of opportunity to get the word out and encourage student interest in positions that require security clearances The Johns Hopkins Universityrsquos Applied Physics Lab (APL) summer internship program is one such example APL funds and processes interim student clearances for temporary summer positions APL also funds the full clearance process for students who remain with the lab beyond the summer
109 Division of Economic and Community Outreach of Towson University Maryland Department of Business amp Economic Development 2006
58
Recommendations
76 Skilled Professionals Needed
A review of emerging and expected labor force conditions in Maryland makes it clear that there is a need for the state to grow attract and retain skilled professionals of all types (not just STEM and BRAC-related workers) There is a need to attract and retain these professionals both as workers and residents in Maryland Admittedly this particular finding overlaps with previously mentioned findings (ie the need for STEM and BRAC workers) The evidence is so compelling that the authors of this report felt that a separate recommendation is justified
Recent migration trends in Maryland bring this issue to the forefront In each of the three most recent years for which data are available (2004 through 2006) the state has recorded negative net migration In other words more people are moving out of the state than are moving in Between 2005 and 2006 for instance net domestic migration outflows exceeded 25000 people offsetting the 21000-person gain due to international migration110 In other words in a single year 25000 residents left Maryland and were replaced by 21000 immigrants
This exodus of Maryland residents has significant implications for the statersquos workforce Many of the residents leaving the state are skilled professionals who are being replaced increasingly by less educated immigrants Certainly many new immigrants to Maryland are highly educated but the amount of time during which these skilled immigrants will remain in Marylandrsquos workforce is not certain In addition many of the statersquos out-migrants continue to commute to Maryland for work How long will these workers put up with longer commutes After all the state has a notoriously lengthy average commute time of 306 minutes second only to that of New York City (309 minutes)
The statersquos rate of population growth is slowing Between 2020 and 2030 Marylandrsquos population is expected to grow by five percent compared to 20 percent growth between 1970 and 1980 Marylandrsquos population is aging as nearly one-fifth of the statersquos working age population is set to retire by 2020 The trend in migration coupled with the statersquos slowing population growth aging population and increasingly tight labor market conditions all point to the same conclusion Maryland needs to ensure that our pool of skilled professionals grows in step with the demand
110 US Census Bureau
59
Recommendations
Recommendation Launch a campaign to attract and retain skilled professionals
Nations such as India and China and even mid-Atlantic cities and states such as Philadelphia and West Virginia have made concerted efforts to not only grow and retain skilled professionals but to entice these workers to return to their home citiesstatesnations This analysis recommends that a campaign be developed to both attract and retain skilled professionals in Maryland
A public-private coalition is recommended to spearhead such a campaign which would target skilled professionals of all ages As a start the initiative could target the emerging pipeline of professional workers ndash namely college students The campaign could be two-pronged focusing on retaining Maryland college students in the statersquos workforce as well as attracting college students from other areas to Maryland After all the survey data suggest that nearly four out of every 10 Bachelorrsquos degree graduates of Maryland institutions elect to work outside the state The campaign could target additional locales with a significant presence of colleges and universities (ie Greater Boston Research Triangle Park Greater Philadelphia etc) in an effort to attract current students to Maryland after graduation Such a campaign should incorporate incentives for first-time homebuyers and affordable housing currently offered in Maryland
60
Closing
80 Closing
Marylanders live and work in a state characterized by a healthy diverse economy and low unemployment The statersquos highly educated workforce and the presence of and proximity to federal agencies and laboratories also are major advantages Marylandrsquos excellent quality of life continues to attract workers and residents to the state In order to meet the many challenges posed by a rapidly changing demographic and economic landscape Maryland must be prepared to preserve and build on these existing strengths
This report highlights a number of current and predicted labor force trends that will drive the future of Marylandrsquos labor and jobs markets These trends pose several challenges to the state that will require the attention of educators workforce development professionals the business community and residents alike Tackling these challenges through a combination of public and private initiatives will serve to enable Maryland to maintain its existing strengths and enhance the statersquos ability to compete in an ever-changing global economy Hopefully the trends and recommendations highlighted in this report will aid in this effort
61
References
References
American Community Survey US Census Bureau 2005
Altbach P R Berdahl and P Gumport American Higher Education in the Twenty-First Century 2nd ed Johns Hopkins University Press April 2005
Americarsquos Career InfoNet httpwwwacinetorg
Associated Press State amp Local Wire ldquoLimit on Seasonal Workers Vexes Employersrdquo February 28 2005 Lexis-Nexis
Baltimore Business Journal ldquoLift Cap on Temporary Visa Programrdquo American City Business Journals Inc July 30 2004
Baltimore Sun ldquoConstellation Energy Files Partial Plan for Reactorrdquo Bloomberg News July 31 2007
Barlow ED ldquoStorm Warnings and What You Can Do To Preparerdquo 2006 Governorrsquos Workforce Conference Maryland May 8 2006
Brugger Robert J Maryland A Middle Temperament 1634-1980 Johns Hopkins University Press 1988
Buhler Patricia M ldquoThe New Workforce Five Sweeping Trends That Will Shape Your Companyrsquos Futurerdquo AMA Business Brief wwwamanetorg
Bureau of Labor Statistics ldquoHigh-paying Occupations with Many Openings Projected 2002shy12rdquo Occupational Outlook Quarterly Spring 2004 httpwwwblsgovopubooq2004springoochartpdf
Campbell Doug ldquoThe Illegal Immigrant Effectrdquo Region Focus 2006
Campbell Paul R ldquoPopulation Projections for States by Age Sex Race and Hispanic Origin 1995-2025rdquo US Census Bureau Population Division 1996
Capps Randy Michael Fix Jeffrey Passel Jason Oust and Dan Perez-Lopez ldquoImmigrant Families and Workers A Profile of the Low Wage Immigrant Workforcerdquo Urban Institute November 2003
Carroll Nick and C Taeuber ldquoA Profile of Older Workers in Marylandrdquo US Department of Commerce Economics and Statistics Administration US Census Bureau August 2004
Conte and Carr ldquoOutline of the US Economyrdquo US Department of State httpusinfostategov
62
References
Cox Michael R Alm and N Holmes ldquoWhere the Jobs Arerdquo The New York Times May 13 2004 late edition ProQuest Information and Learning Company httpproquestumicompqdwebdid=636777401ampsid=5ampFmt=3ampclientld=41150ampRQT=309amp VName=PQD
De Long David W ldquoConfronting the Chemical Industry Brain Drain A Strategic Framework for Organizational Knowledge Retentionrdquo Accenture-Institute for Strategic Change April 2002
Division of Economic and Community Outreach ldquoBRAC Government and Corporate Need for Workers with Security Clearancesrdquo Towson University June 2006
ldquoDomestic Net Migration in the United States 2000 to 2004rdquo US Census Bureau April 2006
Drucker Peter ldquoThe Future Has Already Happenedrdquo Futurist 32 no 8 (1998) 16 MAS Ultra-School Edition
Duderstadt James J ldquoLeading Higher Education in an Era of Rapid Changerdquo July 2001
ElBoghdady Dina ldquoDISA Fights Turnover with Telecommutingrdquo The Washington Post January 25 2006
Fahrenthold David A ldquoMaryland Crab Industry Angles for Help Seasonal Worker Cap Job Abundance Leave Seafood Processors Short-Staffedrdquo The Washington Post February 28 2005 Lexis-Nexis
Federal Reserve Bank of Dallas ldquo2003 Annual Report The Evolution of Workrdquo wwwdallasfedorg
Franz Maximilian ldquoCommentary The Chesapeake Traditionrdquo The Daily Record May 7 2002 Lexis-Nexis
Gereffi Gary and V Wadhwa ldquoFraming the Engineering Outsourcing Debate Placing the United States on a Level Playing Field with China and Indiardquo Master of Engineering Management Program Duke University December 2005
Goldstein Mark ldquoMarylandrsquos Changing Demographicsrdquo Presentation on behalf of the Maryland Department of Planning June 2006
Governorrsquos Workforce Investment Board 2003 ldquoGovernorrsquos Healthcare Workforce Summit Monographrdquo Maryland Department of Labor Licensing amp Regulation
Governorrsquos Workforce Investment Board 2006 ldquoMaryland Aerospace Industry Monographrdquo Maryland Department of Labor Licensing amp Regulation
63
References
Governorrsquos Workforce Investment Board 2007 ldquoMaryland Hospitality amp Tourism Industry Monographrdquo Maryland Department of Labor Licensing amp Regulation
H1Base ldquoH1-B Visa Information amp Service Centerrdquo httph1basecompageaspid=312
Hankin Harriet The New Workforce New York AMACOM 2005
Heller Barbara R ldquoMarylandrsquos Nursing Shortage A Workforce Crisisrdquo University of Maryland March 2003
Hewitt Associates LLC ldquoWorkforce Planning in the 21st Century - Back to the Futurerdquo International Report October 2003
Huether David ldquoThe Case of the Missing Jobsrdquo National Association of Manufacturers httpwwwnamorgs_namdoc1aspCID=201416ampDID=236655
Karoly Lynn A and Constantijn W A Panis The 21st Century at Work Forces Shaping Lifelong Learning Trends A Profile of Continuing Higher Education 7th ed University Continuing Education Association April 2002
Kaushal Neerja and Michael Fix ldquoThe Contributions of High-Skilled Immigrantsrdquo Migration Policy Institute July 2006
Keller Michael J ldquoA Study of the Capacity of Marylandrsquos Teacher Preparation Programsrdquo Maryland Higher Education Commission March 2006
Kobell Rona and C Guy ldquoWork-visa Limit Snags Shore Employers Business Relying on Immigrant Labor Might Not Have Anyone to Do the Workrdquo The Sun January 24 2005 final edition ProQuest
Lasater Beth and Barbara Elliot ldquoProfiles of the Adult Education Target Populationrdquo Center for the Research in Education RTI International December 2005 httpwwwedgovaboutofficeslistovaepiAdultEdcensus1pdf
Lorefice Alejandro A ldquoJust in Time Manufacturing Introduction and Major Componentsrdquo New York 1998
Lyons Michael and Pearson Ian Business 2010 Mapping the New Commercial Landscape London 2003
Maryland Board of Nursing httpwwwmbonorgmainphp
Maryland Career and Workforce Information httpdllrstatemdus
Maryland Department of Business amp Economic Development Economic Pulse January-February 2007
64
References
Maryland Department of Business amp Economic Development ldquoLargest Employers in Marylandrdquo March 2006
Maryland Department of Labor Licensing amp Regulation ldquoMarylandrsquos Demand-Driven Two-Year Workforce Investment Planrdquo July 2005-June 2007
Maryland Department of Labor Licensing amp Regulation Office of Workforce Information and Performance and Office of Labor Statistics March 2007
Maryland Governorrsquos Workforce Investment Board ldquoGovernorrsquos Healthcare Workforce Summit Monographrdquo August 2003 httpwwwmdworkforcecomlibpdfhcmonographpdf
Maryland Higher Education Commission ldquoEnrollment Projections 2007-2016 Maryland Public Colleges and Universitiesrdquo June 2007
Maryland Higher Education Commission ldquoTrends in Degrees Awarded at Maryland Higher Education Institutionsrdquo March 2005
Maryland Higher Education Commission ldquoTrends in Enrollment by Program Maryland Higher Education Institutionsrdquo April 2005
Maryland Higher Education Commission ldquo2004 Maryland State Plan for Postsecondary Educationrdquo December 2004
Maryland Higher Education Commission 2006 Trend Book 1 3 19-24 29-32 49-54 78-84 91-93 August 2006
Maryland Higher Education Commission 2005 Data Book 1 August 2004
Maryland Higher Education Commission 2006 Data Book 1 August 2005
Maryland Higher Education Commission 2007 Data Book 1 7 14-16 38 August 2006
Maryland State Department of Education ldquoStepping Up to the Future Adult Literacy Challenges at Work at Home and in the Maryland Communityrdquo December 2005
Maryland Independent College and University Association Connection ldquoLearn About the Five Factsrdquo httpwwwmicuaconnectioncommythsasp
Maryland Independent College and University Association ldquoFast Facts About MICUA 2007 ndash Enrollment Countsrdquo 2002 httpwwwmicuaorgffenrollmentcountspdf
McGee Marianne Kolbasuk and Alice LaPlante ldquoTalent Search The Myths Facts and Emotions That Will Keep the H1-B Visa Issue From Going Awayrdquo InformationWeek July 23 2007 Lexis Nexis
65
References
Mittuch Eugene W Averting a Pending Department of Defense Civilian Personnel Crisis The Need for a Corporate Recruiting Strategy May 2002 httpwwwstormingmediaus898946A894604html
National Academy of Science ldquoRising Above the Gathering Storm Energizing and Employing America for a Brighter Economic Futurerdquo 2006
National Center on Education and the Economy ldquoTough Choices Tough Times The Report of the New Commission on the Skills of the American Workforcerdquo 2007 httpwwwskillscommissionorgpdfexec_sumToughChoices_EXECSUMpdf
National Science Foundation 2003 httpwwwnsfgov
Nuclear Energy Institute ldquoNuclear Energy Industry Initiatives Target Looming Shortage of Skilled Workersrdquo January 2007 wwwneiorg
OECD ldquoWhat Schools for the Futurerdquo October 2001
Pew Hispanic Center ldquoFact Sheet The Labor Force Status of Short Term Unauthorized Workersrdquo April 2006
Pilato Virginia ldquoMSDE and The Impact of Different Models of Teacher Preparation on Teacher Retention A Progress Reportrdquo presented by Dr Tom Proffitt and Ms Karen Schafer Towson University
Pisarski Alan ldquoCommunity in Americardquo Transportation Research Board 2006
RAND Corporation ldquoThe Future Workforce and Workplace in the United Statesrdquo 2004
Reeves Scott ldquoAn Aging Workforcersquos Effect On US Employersrdquo Forbes September 29 2005 wwwForbescom
RESI study performed on behalf of the Maryland Department of Business amp Economic Development Jobs and Household Allocations and Expected Tax Revenues
Snyder Thomas D ldquoDigest of Education Statistics 2005rdquo National Center for Education Statistics June 2006 httpncesedgovprogramsdigestd05ch_3asp
Sparshott Jeffrey ldquoBay Firms Depend on Foreign Workersrdquo The Washington Times June 1 2005 Lexis-Nexis
States News Service ldquoMikulski Scores Senate Victory for Americarsquos Small Businessesrdquo April 19 2005 Lexis Nexis
66
References
The Conference Board Partnership for 21st Century Skills Corporate Voices for Working Families and Society for Human Resource Management ldquoAre They Really Ready To Workrdquo 2006 http21stcenturyskillsorgdocumentsFINAL_REPORT_PDF09-29-06pdf
Therrien Roger C Bridges R Meyerhoff and J Baker ldquoConnecticut Workforce Demands and the Implications for Educationrdquo Connecticut Department of Labor July 2003
Three Rivers Workforce Investment Board ldquoManaging the Changing Workforce in Southwestern Pennsylvaniardquo Executive Summary June 2006 httpwwwtrwiborgreportsagingexecsummarypdf
Towards Knowledge Societies UNESCO Publishing 2005
UMD ldquoProtecting Marylandrsquos Competitive Edgerdquo An Action Summit Hosted by the University of Maryland April 2006 httpwwwcompetitive-edgeumdedusnapshothtml
US Department of Education ldquoState Nonfiscal Survey of Public ElementarySecondary Educationrdquo National Center for Education Statistics November 2005 httpncesedgovprogramsprojectionstablestable_25CTaspreferrer=tablenotes
VisaPro ldquoFrequently Asked Questionsrdquo httpfaqvisaprocomH2B-Visa-FAQ3aspQ1
67
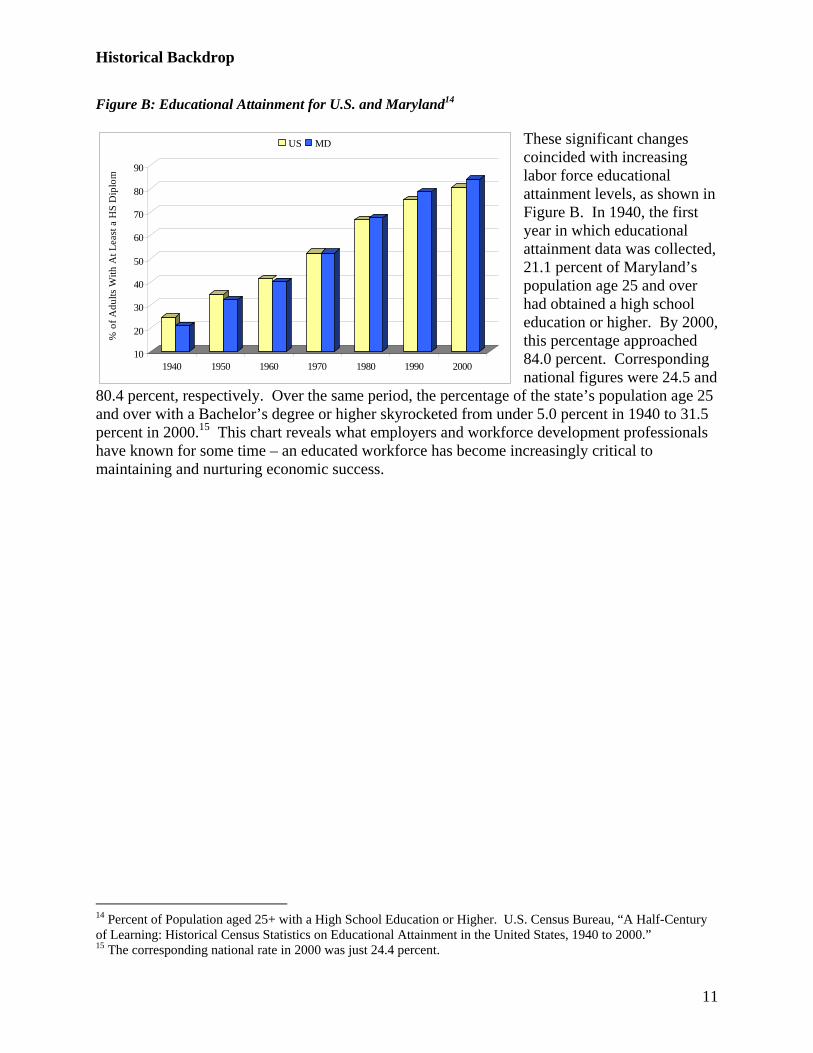
10
20
30
40
50
60
70
80
90
o
f Adu
lts W
ith A
t Lea
st a
HS
Dip
lom
1940 1950 1960 1970 1980 1990 2000
US MD
Historical Backdrop
Figure B Educational Attainment for US and Maryland14
These significant changes coincided with increasing labor force educational attainment levels as shown in Figure B In 1940 the first year in which educational attainment data was collected 211 percent of Marylandrsquos population age 25 and over had obtained a high school education or higher By 2000 this percentage approached 840 percent Corresponding national figures were 245 and
804 percent respectively Over the same period the percentage of the statersquos population age 25 and over with a Bachelorrsquos degree or higher skyrocketed from under 50 percent in 1940 to 315 percent in 200015 This chart reveals what employers and workforce development professionals have known for some time ndash an educated workforce has become increasingly critical to maintaining and nurturing economic success
14 Percent of Population aged 25+ with a High School Education or Higher US Census Bureau ldquoA Half-Century of Learning Historical Census Statistics on Educational Attainment in the United States 1940 to 2000rdquo 15 The corresponding national rate in 2000 was just 244 percent
11
Historical Backdrop
The increased demand for educated workers in Maryland has been broad-based and is reflected in industry-level educational attainment data Even in industries traditionally considered ldquoblue collarrdquo such as Manufacturing and Construction the educational attainment of workers has risen Data show that the proportion of workers in each Maryland industry with some college education has increased from just three percent of the statersquos manufacturing workers in 1940 to 26 percent in 2000 The proportion of Agriculture workers with some college skyrocketed from one percent in 1940 to over 20 percent in 2000
Figure C Maryland Educational Attainment by Industry 200016
By 2000 more thanHigh School or Less Some College College Degree Plus 40 of workers
Construction amp Mining 64 24 12 employed within Services Finance Agriculture amp Related 63 21 16 Insurance amp Real
Wholesale amp Retail Trade 58 28 15 Estate and Public 49 30 20 Administration had
obtained a college Transportation amp Related
Manufacturing 48 26 25 degree or higher More Services 28 26 46 than half of the workers
in Marylandrsquos Finance Insurance amp Real Estate 25 34 41 manufacturing sector
Public Administration 22 35 42 had at least some 00 200 400 600 800 1000 college or higher Other
industries employed a higher proportion of workers with a high school education or less such as Construction amp Mining (64 percent) Agriculture amp Related (63 percent) and Wholesale amp Retail Trade (58 percent)
16 RESI US Census Bureau Public Use Micro Data The graph refers to the distribution of maximum educational attainment levels by industry
12
Historical Backdrop
Today Maryland enjoys a healthy diverse economy driven by growth in services sectors such as education health care and other technical and professional services Among Marylandrsquos top 50 largest private employers are health and educational services firms (including The Johns Hopkins University and Hospital Adventist HealthCare and Helix Health System among others) defense and intelligence contractors (such as Northrop Grumman Corporation and Lockheed Martin Corporation) and other technical and professional services firms (such as Computer Sciences Corporation IBM Corporation Science Applications International Corporation and Westat Research Incorporated)17
Though life sciences firms are not generally considered to be large employment generators there is no doubt that the statersquos economy also has been shaped by the presence of industry high fliers such as MedImmune (recently acquired by AstraZeneca) and Human Genome Sciences Inc Any discussion of Maryland employers would not be complete without consideration of the statersquos proximity to and presence of federal research centers and labs
The importance of the federal government to the statersquos economy cannot be underestimated The many federal laboratories and facilities located within and near Maryland such as the Goddard Space Flight Center and the Naval Air Systems Command at Patuxent River have contributed greatly to Marylandrsquos science and security base The presence of the Food and Drug Administration (FDA) and the National Institutes of Health (NIH) have spurred growth among bioscience firms The National Security Agency (NSA) and Marylandrsquos many military installations (including Fort Detrick Fort Meade and Aberdeen Proving Ground) have been critical to building the statersquos base of science and security
17 Maryland Department of Business amp Economic Development 2006
13
Marylandrsquos Labor Supply
40 Marylandrsquos Labor Supply
41 Population Trends and Characteristics
The shifting composition and growth of Marylandrsquos population directly impacts the statersquos economy and labor force Population characteristics such as age educational attainment and diversity have a profound impact on the needs and types of services that will best ensure continued economic growth and prosperity throughout the state The extent to which policy makers educators and business leaders recognize and meet these needs can further strengthen Marylandrsquos ability to attract and retain quality jobs and workers
411 Population Growth Migration and Diversity
Marylandrsquos population exceeded 56 million in 2006 ranking the state 19th in the nation in population size The statersquos rate of population growth between July of 2005 and 2006 was just 05 percent Not only did the state lag the 10 percent national rate of population expansion but Maryland ranks among the bottom third of states (36th fastest growth) according to this measure
This sluggish rate of population growth is not characteristic of Marylandrsquos past performance Between 1990 and 1999 the statersquos population expanded at an average annual rate of 10 percent Between 2000 and 2003 Maryland recorded annual population growth ranging from 11 to 13 percent
The statersquos slower rate of population expansion in recent years can be explained by negative net migration trends In each of the three most recent years for which data are available (2004 through 2006) the state recorded negative net migration In other words more people are moving out of the state than are moving in Maryland recorded a net migration loss of 5000 in 2006 and 6800 in 2005 the largest such decline the state has seen since 198118 While it is true that net international migration continues to bolster the statersquos population growth net domestic outflows (migration between states) outweigh international migration gains Between 2005 and 2006 for instance Marylandrsquos net domestic migration outflows exceeded 25000 persons offsetting the 21000-person gain due to international migration19
It should be noted that Marylandrsquos net domestic migration decline represents a departure from recent trends Between 2000 and 2004 for instance the state recorded net domestic migration gains of more than 5400 per year20 While in the past domestic outflows have been associated with deteriorating or weakening economic conditions within the state recent trends appear to be driven by cost of living issues especially housing costs Out migration to border counties in Pennsylvania and West Virginia has increased significantly in recent years A possible explanation for this movement is the availability of affordable housing in these areas Median home values in Pennsylvania jurisdictions such as York and Franklin counties are roughly $75000 below those of Baltimore County This gap increases significantly when home values in
18 Maryland Department of Planning 19 US Census Bureau 20 US Census Bureau 2006
14
Marylandrsquos Labor Supply
Carroll and Frederick counties are considered Many former Maryland households have taken advantage of lower housing costs in these locales while still being part of Marylandrsquos job market
The good news is that this trend will likely be stemmed by the current and future Department of Defense (DoD) Base Realignment and Closure (BRAC) movements to Maryland The job movements which call for more than 15000 civilian jobs to transfer to Maryland by 2011 are expected to result in substantial household movements to Maryland as well
As previously noted international migration continues to bolster population growth both locally and throughout the nation Foreign immigration represents 443 percent of the statersquos population gain between 1990 and 2000 Marylandrsquos level of foreign-born population has grown from roughly 94000 in 1960 to more than 313000 in 1990 By 2000 nearly one out of every 10 Maryland residents (more than 518000 persons) was foreign born21
Figure E Marylandrsquos Share of Foreign-Born Population 200022
More than two-thirds of the statersquos 40 foreign-born population reports their 35 region of origin to be either Asia or
30 Latin America The most commonly reported Asian countries of origin
25 include China (which comprises 65
20 percent of the statersquos 2000 foreign-born population) India (62 percent)
15 Korea (60 percent) and the
10 Philippines (40 percent) El Salvador leads Latin American countries and
5 accounts for another 81 percent In
0 fact El Salvador comprises the single largest share of Marylandrsquos foreign-born population Jamaica and Mexico
each comprise an additional 37 percent Nigeria Vietnam Germany and the United Kingdom each comprise close to 30 percent of the statersquos foreign-born residents
Asia Latin America Europe Africa North America Oceana
Perc
ent o
f Tot
al
21 Goldstein 2006 22 US Census Bureau
15
Marylandrsquos Labor Supply
40
43
56
57
65
89
11 7
148
174
292
0 5 10 15 20 25 30 35
Figure F Foreign-Born Population as Percent of Total 200523
International migration is forecast to increase Marylandrsquos population Montgomery
by 593000 persons between 1995 Prince George s and 2025 ranking the state ninth in
Howard the nation according to this24 Maryland measure Montgomery and
Prince Georgersquos counties will Baltimore County
continue to absorb the lionrsquos share Frederick
of the statersquos international Anne Arundel
migration Foreign immigration Baltimore City accounted for 891 percent of
Montgomery Countyrsquos population Charles
gains and 719 percent of Prince Wicomico
Georgersquos Countyrsquos gains between 1990 and 2000 In 2005 foreign-
Percent of Totalborn people accounted for 292 percent of Montgomery Countyrsquos population and 174 percent of Prince Georgersquos County residents Howard County follows with 149 percent
Migration continues to increase diversity in Maryland which has recorded substantial increases in its minority population in recent years Between 2000 and 2006 the statersquos minority population expanded by roughly 327000 persons In contrast the statersquos non-Hispanic white population declined by 23000 persons over the same period Census projections indicate that by 2025 Marylandrsquos non-Hispanic white population will comprise just 543 percent of the statersquos total population down from 666 percent in 1995 Over the same period persons of Hispanic origin are expected to increase and comprise 70 percent of Marylandrsquos total population up from 36 percent in 199525
23 Goldstein 2006 24 US Census Bureau Population Division 25 US Census Bureau Population Division
16
Marylandrsquos Labor Supply
Figure G Share of Population by Selected RaceOrigin 200526
Census estimates for 2005 reveal Marylandrsquos population to be quite diverse relative to the nation African-Americans constitute 287 percent of the statersquos population more than twice the
0
10
20
30
40
50
60
70
80
White Black Hispanic or Latino (of any
race)
Asian Some other Race
Two or more races
Perc
ent o
f Tot
al
Maryland United States
60 percent in 2006 The corresponding national share for people of Hispanic or Latino origin in
national share The state also is home to a slightly larger (percent share) Asian population than is seen nationally While Marylandrsquos population of Hispanic or Latino origin has increased significantly in recent years (from roughly 230000 in 2000 to 318000 in 2005) this group comprised 58 percent of the statersquos population in 2005 and
2005 was 145 percent
412 Affluence
Recent data releases once again confirm Marylandrsquos reputation as one of the most affluent states in the nation With a 2006 median household income of $65144 Maryland ranks first in the nation according to this measure and far surpasses the comparable national income level of $48451
Poverty data reveal similar patterns Overall the statewide family poverty rate was 53 percent far below the national rate of 98 percent In 2006 only 78 percent of Marylandrsquos population lived below the poverty level the lowest rate in the nation and 55 percentage points below the national average
The fact that the statersquos households are well compensated is a reflection of Marylandrsquos highly educated and skilled workforce More than a third (351 percent) of the statersquos population age 25 and older has a Bachelorrsquos degree or higher The comparable national percentage is 270 percent The fact that Maryland has a relatively high proportion of households with two or more workers also helps to explain the statersquos high income levels In 2006 four out of 10 households fell within this category compared to 35 for the nation27
26 US Census Bureau American Community Survey 2006 27 US Census Bureau American Community Survey 2006
17
Marylandrsquos Labor Supply
Figure H Per Capita Income Levels by Maryland Workforce Investment Area (WIA)28
$20000 $25000 $30000 $35000 $40000 $45000 $50000 $55000 $60000
Montgomery Anne Arundel
Baltimore County Mid-Maryland
Maryland Frederick
Upper Shore Southern Maryland
Susquehanna Prince Georgersquos
United States Baltimore City
Lower Shore Western Maryland
Annual Per Capita Income
2005 Marylandrsquos affluence is significant for another reason Wealth offers a measure of protection from cyclical economic fluctuations Maryland may be better prepared to weather economic downturns than the balance of the nation However it should be noted
that all regions in Maryland are not equally protected Certain areas have participated less fully in recent economic recoveries than others as indicated by their per capita income levels With an annual per capita income level below $29000 Western Maryland (comprised of Allegany Garrett and Washington counties) trails all other Maryland Workforce Investment Areas (WIAs)29 The Lower Shore (which includes Somerset Wicomico and Worcester counties) also lags other areas with an annual per capita income level of just under $30000
While affluence can be considered a strength especially in the face of economic downturns it poses a challenge for other reasons Increased living costs and housing costs in particular can encourage out migration to lower cost areas a trend analysts believe has been occurring with increased frequency in Maryland for each of the last three years
28 Bureau of Economic Analysis RESI of Towson University WIA refers to Workforce Investment Area Maryland is home to 12 local WIAs each with a common labor pool and 200000 or more residents Each WIA is served by a separate Local Workforce Investment Board (LWIB) 29 In percentage terms however the Western Maryland region boasts the fastest rate of appreciation between 2004 and 2005 with growth in annual per capita income of 63 percent
18
Marylandrsquos Labor Supply
413 Educational Attainment
Figure I 2005 Education Attainment Levels Population 25 and Older30
Maryland is home to a highly educated population The state consistently ranks ahead
00
50
100
150
200
250
300
350
Max
imum
Edu
catio
nal
Atta
inm
ent A
chie
ved
Less than 9th Grade
9th-12th High School Some Associate s Bachelor s Graduate or Grade No Graduate College No Degree Degree Professional Diploma Degree Degree
Maryland United States
of the nation on a variety of education-related measures For instance the National Science Foundation ranks Maryland second in the nation in terms of doctoral scientists and engineers per 100000 population In addition in 2005 the statersquos concentration of professional and technical workers (249 percent) ranked second in the nation
Census educational attainment data tell a similar story In 2005 nearly one in four (194 percent) Marylanders age 25 and older earned a Bachelorrsquos degree as their highest level of educational attainment Approximately 157 percent of state residents have a graduate or professional degree Taken together 351 percent of Marylandrsquos population has a Bachelorrsquos degree or higher ranking Maryland third in the nation compared to 270 percent nationally The gap between Maryland and the nation has widened in recent years as Maryland has increased its proportion of highly educated residents In 1990 only 265 percent of the statersquos population had earned a Bachelorrsquos degree or higher just six percentage points ahead of national levels
30 US Census Bureau American Community Survey 2006
19
Marylandrsquos Labor Supply
Figure J Percent of Population with a Bachelorrsquos Degree or Higher by WIA31
00 100 200 300 400 500 600
Montgomery
Mid-Maryland
Anne Arundel
Frederick
Baltimore County
Prince Georgersquos
Susquehanna
Southern Maryland
Baltimore City
Lower Shore
Western Maryland
Upper Shore
2005 In 2005 Montgomery County and the Mid-Maryland region lead the state in terms of the percent of population age 25 and older with a Bachelorrsquos degree or higher with 563 and 471 percent respectively The Upper Shore and Western Maryland
lag the balance of the state with 111 and 155 percent of regional population respectively with a Bachelorrsquos degree or higher
Figure K Maryland Educational Attainment by Race 200532
Educational attainment distributions vary by race and ethnicityorigin as well While six out of every 10 Asians in Maryland has a Bachelorrsquos degree or higher less than 25 percent of African-Americans and less than 20 percent of Hispanics fall into this category Nearly 390 percent of the statersquos Hispanic population does not have a high school diploma and 242 percent
Total White Alone
Black Alone
Asian Alone
Hispanic (Any Race)
Less than 9th Grade 43 34 37 49 242
9th-12th Grade No
High School Graduate 267 261 309 141 225
117 45 146 Diploma 87 75
Some College No Degree 196 189 231 113 135
Associates Degree 63 63 63 60 54
Graduate or Professional 152 168 96 308 82 Degree
Bachelors Degree 193 209 147 284 116
Bachelors Degree or Higher 345 377 243 593 198
of Hispanics have less than a ninth grade education roughly six times the state average
31 US Census Bureau American Community Survey 2005 32 US Census Bureau American Community Survey 2005
20
Marylandrsquos Labor Supply
414 Aging Population
Many of the issues Maryland will face in terms of future workforce and economic development will be rooted in demographics Between 1970 and 1980 Marylandrsquo population grew by nearly 20 percent Between 2020 and 2030 growth is expected to be just over five percent As the statersquos population growth continues to wane finding skilled workers to fill jobs will become increasingly challenging
Figure L Historic and Projected Growth among Marylands Population Age 16+33
0
100000
200000
300000
400000
500000
600000
1970-1980 1980-1990 1990-2000 2000-2010 2010-2020 2020-2030
Popu
latio
n G
row
th
0
5
10
15
20
25
Absolute Growth
Percentage Growth
Figure M Maryland Historic and Projected Growth by Age34
The Maryland Department of Planning projects that between 2000 and 2030 the statersquos share of population age 20 to 44 will drop from 374 percent to 323 percent Over the same time frame the share of population age 65 and older will increase from 113 to 195 percent Maryland is not alone experiencing this trend though median age data indicate that the statersquos population is slightly older than that of the nation Marylandrsquos median age in 2005 was 371 years compared to a median age of 365 years for the nation as a whole
33 Maryland Department of Planning 34 Maryland Department of Planning
00
100
200
300
400
500
Perc
ent o
f Pop
ulat
ion
1990 2000 2005 2010 2015 2020 2025 2030
Aged 20-44 Aged 65+
21
Marylandrsquos Labor Supply
Census data from 2000 provide an indication of the relative median age of Marylandrsquos regions Eastern Shore jurisdictions such as Dorchester Kent and Worcester counties all have median ages over 40 years of age Talbot Countyrsquos population is the oldest in the state with a median age of 433 years of age Increased immigration of retirees to Eastern Shore locales helps to explain this trend All three Western Maryland jurisdictions also are home to older populations The trend in Western Maryland and Allegany County in particular is attributed to ongoing population decline and out migration among younger people
By 2005 more than 60 percent of the statersquos population was of working age (ie age 18 to 64) Of this population the vast majority (833 percent) fell into the 18 to 54 age range More than one fifth (207 percent) of the statersquos 2005 population of working age was comprised by the leading edge (those born between 1946 and 1955) of the baby boomers those born between 1946 and 1964 This segment of the population is set to face retirement between 2011 and 2020 By 2020 the number of baby boomers between ages 18 and 54 will increase by more than 123000 and will account for 223 percent of the statersquos working age population The data make clear that the retirement of roughly one-fifth of the statersquos working age population is fast approaching and will have a disproportionate effect on those regions that are already home to a large concentration of older residents and workers (such as Western Maryland and the Eastern Shore)
42 Workforce Trends
421 Labor Force Growth Figure N Marylands Labor Force 2000 ndash 200635
Marylandrsquos labor force topped the 3 million mark for the first time in the second quarter of 2006 The state recorded a 23 percent expansion in its labor force between 2005 and 2006
2500000
2600000
2700000
2800000
2900000
3000000
3100000
2000 2001 2002 2003 2004 2005 2006
Labo
r Fo
rce
Lev
el
-10
-05
00
05
10
15
20
25
Labo
r Fo
rce
Ann
ual G
row
th
Level Growth
surpassing the 14 percent growth rate recorded nationwide This expansion was driven by a 20 percent increase in the number of employed people and a 36 percent contraction in the number of unemployed persons The statersquos recent performance reverses a trend of diminishing growth registered between 2002 and 2004 when Maryland trailed the national rate of expansion
35 Maryland Department of Planning
22
Marylandrsquos Labor Supply
Despite this recent up tick the pace of expansion for both the state and national labor force has been slowing since 1970 Between 1970 and 1980 Marylandrsquos workforce expanded by nearly 453000 workers or 27 percent During the 1990s Marylandrsquos labor force grew by just five percent about 130000 workers According to projections from the Maryland Department of Planning the growth in Marylandrsquos labor force will slow even further in the future Between 2020 and 2030 the statersquos workforce is expected to expand by just three percent (or roughly 101000 workers) This trend is being driven by the aging of Marylandrsquos population
Figure O Labor Force Shares by WIA36
00 20 40 60 80 100 120 140 160 180
Montgomery
Prince Georges
Baltimore County
Baltimore City
Anne Arundel
Mid-Maryland
Susquehanna
Southern Maryland
Western Maryland
Frederick
Lower Shore
Upper Shore
2006 The vast majority of the statersquos labor force37 resides in the suburban jurisdictions outside Baltimore City and Washington DC In fact Montgomery and Prince Georgersquos counties are home to just under one-third of the statersquos labor force Collectively
Western Maryland and the Upper and Lower Shore regions comprise another 10 percent of Marylandrsquos labor force
36 Maryland Department of Planning 37 Refers to resident labor force or the population currently working or actively looking for a job
23
Marylandrsquos Labor Supply
-20 00 20 40 60 80 100 120 140 160
Southern Maryland
Frederick
Lower Shore
Susquehanna
Mid-Maryland
Upper Shore
Anne Arundel
Western Maryland
Montgomery
Prince Georges
Baltimore County
Baltimore City
2000-2006
expansion (62 percent) during this period
422 Unemployment Rate Analysis
Figure Q Unemployment Rates 2000 to 200739
Marylandrsquos average annual
Figure P Labor Force Growth 2000 to 200638
unemployment rate which held steady at 38 percent in 2007 remains quite healthy compared to historical and national levels The comparable US jobless rate is 46 percent
The unemployment rate measures the level of unemployed persons (persons who are not working and who are available and actively looking for work) as a percentage of the total labor
All Maryland Workforce Investment Act (WIA) areas except Baltimore City recorded resident labor force growth between 2000 and 2006 In fact with the exception of Baltimore and Prince Georgersquos counties all WIAs outpaced the national rate of
200
300
400
500
600
700
2000Q
1
2000Q
3
2001Q
1
2001Q
3
2002Q
1
2002Q
3
2003Q
1
2003Q
3
2004Q
1
2004Q
3
2005Q
1
2005Q
3
2006Q
1
2006Q
3
2007Q
1
Une
mpl
oym
ent
Rat
e
United States Maryland
force This indicator is significant because it provides a relative measure of the statersquos economic health
Marylandrsquos low unemployment rate is significant to workforce development professionals because it demonstrates that local labor market conditions are increasingly tight Most
38 Bureau of Labor Statistics 39 Bureau of Labor Statistics
24
Marylandrsquos Labor Supply
economists agree that an unemployment rate in the range of 35 to 45 percent is indicative of an economy operating at full employment Marylandrsquos jobless rate continues to fall within that range In fact the state has not recorded an unemployment rate above 45 percent since July 2003
Figure R Unemployment Rates for WIAs40
00 10 20 30 40 50 60 70
Lower Shore Baltimore City
Western Maryland Upper Shore
Prince Georges Baltimore County
Susquehanna Southern Maryland
Anne Arundel Frederick
Mid-Maryland Montgomery
Unemployment Rates (Not Seasonally Adjusted)
2000 Q1 2007 Q1
While Marylandrsquos low unemployment rate testifies to the strength of the statersquos economy persistent tight labor market conditions also have the potential to aggravate labor shortages and to apply upward pressure on wages
Not all Maryland regions boast tight labor market conditions Western Maryland Baltimore City and the Lower Shore for instance have consistently posted unemployment rates upwards of 50 and 60 percent Western Marylandrsquos high unemployment rate stems from the loss of high-wage manufacturing jobs over the past two decades due to closures of former mainstay employers While the region has since experienced job growth much of the new job creation has been in low-skill low-wage positions The fact that the region has a high share of population with less than a high school diploma makes it more difficult for these workers to find quality jobs
40 Bureau of Labor Statistics
25
Marylandrsquos Labor Supply
With an unemployment rate of 61 percent in 2007 Baltimore City also is characterized by looser labor market conditions41 Baltimore is faced with serious long-term challenges including a significant number of underemployed workers as well as large segments of population who do not participate in the workforce The city is home to the largest number of residents with less than a ninth grade education (26679 persons in 2006 or 66 percent of Baltimorersquos population age 25 and older) The cityrsquos high school dropout rate at 105 percent in the 2005-2006 school year exceeds the 35 percent rate posted statewide These dropouts pose a serious workforce development challenge for the city Helping these nontraditional segments of the population (dislocated workers veterans disabled population ex-offenders etc) participate more fully in the labor market may help alleviate the demand for workers in the face of growing skill set and worker shortages
423 Labor Force Participation Rates
Figure S Labor Force Participation Rates for WIA42
500 550 600 650 700 750 800
Mid-Maryland
Frederick
Susquehanna
Montgomery
Southern Maryland
Prince Georgersquos
Anne Arundel
Baltimore County
Upper Shore
Lower Shore
Western Maryland
Baltimore City
Labor Force Participation
2000 Marylandrsquos labor force participation rate among 16- to 64-year-olds (including military) was 782 percent in 2006 ranking the state 11th in the nation according to this measure The comparable national rate is 745 percent43
41 It should be noted however that labor market conditions have improved significantly from 2004 when the city consistently recorded unemployment rates in excess of 70 percent 42 Bureau of Labor Statistics 43 US Census Bureau American Community Survey 2006
26
Marylandrsquos Labor Supply
Figure T Labor Force Participation Rates by Age44
Shifting demographics will have an effect on the statersquos labor force going forward According to Maryland
00
200
400
600
800
1000
Labo
r Fo
rce
Paric
ipat
ion
by A
ge
16-24 25-54 55 and over
2000
Department of Planning data labor force participation rates in 2000 approached 60 percent among those age 16 to 24 years Nearly 830 percent of those aged 25 to 54 years participated in the labor force However only 439 percent of those age 55 and over were in the labor force
Analysts increasingly anticipate that older workers will remain in the workforce longer compared to previous generations Still it is clear that as Marylandrsquos population ages labor force participation will be affected
424 Commuting Patterns
Figure U Percent Change in Marylands ImportedExported Workers45
Journey-to-work data from the 25 2000 Census reveal that for
20 every Maryland worker living outside the state there are 25
15 Maryland residents who leave
5
10
Exported Workers Imported Workers Net Exported Workers
1990
- 20
00
Perc
ent C
hang
e the state for work In other words Maryland is a net exporter of workers In 2000 the state recorded net exported workers in excess of 268000
0 This trend is not surprising since 1990 commuting patterns
-5 show the same pattern However an examination of 1990 and 2000 data indicates
that the situation is improving In 1990 Maryland exported 29 resident workers for every imported worker This improvement is explained by the fact that growth among imported workers (up 208 percent between 1990 and 2000) far surpasses the growth of exported workers (up 43 percent)
44 Bureau of Labor Statistics 45 US Census Bureau
27
Marylandrsquos Labor Supply
Between 1990 and 2000 the number of out-of-state residents commuting to Maryland jumped from 151330 to 182787 In 2000 the vast majority of these workers (872 percent) resided in Washington DC Delaware Virginia and West Virginia Growth was driven especially by outflows from the latter three states While the number of workers commuting from Washington DC to Maryland increased over the period they were a smaller share of Marylandrsquos imported workers dropping from 236 percent in 1990 to 199 percent in 2000
More than 450000 Maryland residents commuted outside the state for work in 2000 The lionrsquos share of these residents worked in Washington DC (620 percent) while another 242 percent worked in Virginia Delaware and Pennsylvania comprise another 52 and 28 percent respectively The number of out commuters to Washington DC dropped by more than 11000 persons or by 39 percent between 1990 and 2000
Marylandrsquos commuting patterns data is relevant not only from a workforce perspective but also from a quality of life perspective According to the Transportation Research Board by 2000 Maryland had joined the ranks of New York New Jersey and Illinois with more than 10 percent of workers traveling over 60 minutes to get to work46 The 2006 American Community Survey figures indicate that Marylandrsquos average commute time of 306 minutes is the second longest commute time in the nation closely trailing New Yorkrsquos average commute time of 309 minutes47
46 Pisarski 2006 47 US Census Bureau American Community Survey 2006
28
Marylandrsquos Labor Supply
43 Marylandrsquos Educational Supply Pipeline
It is abundantly clear that an educated workforce is essential to Marylandrsquos economy While Marylandrsquos educational institutions produce a majority of the statersquos workers there is a substantial amount of ebb and flow of educated workers between Maryland and other areas Enrollment in Marylandrsquos educational institutions has risen greatly and is expected to continue to grow in the foreseeable future
As of the 2005-2006 academic year Maryland educational institutions yielded the following labor supply 56302 high school graduates 13715 Associatersquos degrees (or certificates) 25484 Bachelorrsquos degrees 13265 Masterrsquos degrees Another 1122 first professional degrees (ie lawyers) and 1363 Doctoral degrees
Not all of these graduates choose to remain and work in Maryland Conversely not all of Marylandrsquos labor supply comes from the statersquos higher educational institutions Survey estimates reveal that the vast majority (84 percent) of Marylandrsquos community college graduates were full-time Maryland workers at least one year after graduation The corresponding figures are 64 percent for those with Bachelorrsquos degrees and 57 percent for graduates of Marylandrsquos private career schools48 Marylandrsquos ability to connect a greater number of these graduates to local Maryland employers could help reduce the impact of worker shortages
Between 1994 and 2004 full-time undergraduate enrollment in Marylandrsquos four-year public colleges and universities grew by 25 percent and community college enrollment increased by 33 percent According to projections from the Maryland Higher Education Commission (MHEC) growth in full-time enrollment at public four-year institutions is expected to moderate to 17 percent between 2007 and 2016 Growth among full-time community college students is expected to drop to 21 percent over the same period These projections are driven by predicted demographic shifts They also account for the estimated impact of tuition increases as well as changes in per capita disposable income
Over the same period graduate enrollment among public educational institutions is expected to rise 10 percent for full-time students and 55 percent for part-time students49 Increases in part-time enrollment will continue to be driven by enhanced opportunities for distance learning and online courses offered by traditional universities as well as through programs such as the University of Maryland University College
48 Percentages refer to five-year averages based on information published in the Maryland Higher Education Commissionrsquos 2007 Trend Book 49 Maryland Higher Education Commission 2007
29
Marylandrsquos Labor Demand
50 Marylandrsquos Labor Demand
51 Industry Analysis
Between 2005 and 2006 Marylandrsquos aggregate economy expanded by 31932 employees or 13 percent The statersquos 25 million job holders enjoyed average weekly wages of $88750
Marylandrsquos rate of employment expansion during this period represents a deceleration from the 16 percent growth rate recorded between 2004 and 2005 Not only has Marylandrsquos rate of employment growth slowed but the state lags the nation according to recent quarterly employment data Marylandrsquos 14 percent expansion recorded between the second quarters of 2005 and 2006 ranks the state 27th in the nation and trails the 18 percent national average Just a few years ago in 2004 Maryland consistently ranked in the top 15 states according to this measure This trend of decelerating employment growth would be cause for greater concern if not for the anticipated influx of tens of thousands of jobs to Maryland by 2011 due to the BRAC decisions While the incoming jobs have the potential to grow Marylandrsquos employment base the challenge which Maryland is addressing actively is to fill the current and future need for workers RESI anticipates that the statersquos economy will register annual rates of employment growth in the mid-one percent range in both 2006 and 2007 While not spectacular this is by no means indicative of an economic downturn Still this trend of decelerating employment growth is an area analysts will be tracking closely in the near-term future
Figure V Employment Growth by WIA 2005 to 200651
Regional employment growth for the most recent period for which data are available (2005 to 2006) ranges from shy02 percent in Baltimore City to 33 percent in Mid-Maryland Other rapidly expanding WIA regions include the Lower Shore and Southern Maryland Employment in both of these areas expanded at a pace of more than 20 percent between 2005 and 2006
50 The 25 million employment figure (as well as the additional employment figures contained in this section of the analysis) refers to Bureau of Labor Statistics Quarterly Covered Employment amp Wage data This data represents employment by place of work data and is reported to the Bureau of Labor Statistics by the Maryland Department of Labor Licensing amp Regulation (DLLR) and includes all workers covered by the Unemployment Insurance (UI) Law of Maryland and the unemployment compensation for federal employees (UCFE) program This data series accounts for approximately 91 percent all civilian employment Excluded from this data are the self-employed 51 US Bureau of Labor Statistics Quarterly Census of Employment amp Wages (QCEW) Data
-05 00 05 10 15 20 25 30 35
Mid-Maryland Lower Shore
Southern Maryland Susquehanna
Anne Arundel Montgomery
Maryland Upper Shore
Baltimore County Frederick
Western Maryland Prince Georgersquos
Baltimore City
Employment Change
2005-2006
30
Marylandrsquos Labor Demand
Employment Composition
Approximately 180 percent of the statersquos aggregate economy falls within the public sector which is comprised of local state and federal governments As a whole the public sector grew at a 16 percent clip above the average for all major sectors and pays higher than average weekly wages of $1029 With employment just above 125000 in 2006 the federal government sector comprises 49 percent of the statersquos economy and pays average weekly wages of $1438 substantially higher than the average
The importance of the federal government to the statersquos economy cannot be underestimated The many federal laboratories and facilities located within and near Maryland such as Goddard Space Flight Center and the Naval Air Systems Command at Patuxent River have contributed greatly to Marylandrsquos aerospace industry The presence of the Food and Drug Administration (FDA) and the National Institutes of Health (NIH) has spurred growth among bioscience firms The National Security Agency and Marylandrsquos many military installations have been critical to building the statersquos base of defense-related businesses
Figure W Marylandrsquos Economic Composition 200652
1-YEAR CHANGE IN EMPLOYMENT SECTOR EMPLOYMENT
LEVEL ABSOLUTE PERCENT
WEEKLY WAGES
AGGREGATE ECONOMY 2529671 31932 13 $887 PUBLIC SECTOR 455820 7170 16 $1029
Local Government 233109 6978 31 $848 State Government 97530 826 09 $879 Federal Government 125181 -634 -05 $1438
PRIVATE SECTOR 2073851 24762 12 $856 Retail Trade 299508 906 03 $620
Healthcare amp Social Assistance 295006 8871 31 $737 Professional Scientific amp Technical Services 219155 5236 24 $1401 Accommodations amp Food Services 193278 -303 -02 $377
Construction 188357 5331 29 $926 Administrative amp Support amp Waste 157299 1275 08 $710
Manufacturing 136328 -4166 -30 $1700 Finance amp Insurance 109595 -379 -03 $1238 Wholesale Trade 94927 677 07 $1097 Other Services (Except Public Administration) 89612 466 05 $585 Educational Services 54007 -66 -01 $815 Transportation amp Warehousing 65867 2237 35 $863
Real Estate amp Rental Leasing 48004 -299 -06 $886 Information 50770 392 08 $1218 Arts Entertainment amp Recreation 36476 812 23 $644
Management of Companies amp Enterprises 17763 4199 310 $1696 Utilities 9711 -38 -04 $1709
52 RESI US Bureau of Labor Statistics Quarterly Census of Employment amp Wages (QCEW) Data
31
Marylandrsquos Labor Demand
Agriculture Forestry Fishing amp Hunting 5031 -128 -25 $573 Mining 1794 67 39 $884
Not Elsewhere Classified 1362 -327 -194 $1111
With employment in excess of 207 million the private sector comprises the lionrsquos share (820 percent) of Marylandrsquos economy One of the single largest private sector industries in the state is the Healthcare amp Social Assistance sector In 2006 employment in this sector expanded by 31 percent to just over 295000 employees Retail Trade Professional Scientific amp Technical Services and Accommodations amp Food Services also rank among the largest private sector employers within the state each employing a significant proportion of Maryland workers
Regional employment distributions across industries are fairly similar to that of the state as a whole with a few notable exceptions Both Southern Maryland (comprised of Calvert Charles and St Maryrsquos counties) and Frederick Prince Georgersquos and Montgomery counties boast high concentrations of public sector and especially federal government employment Federal government employment comprises 92 percent of Southern Marylandrsquos aggregate economy The collective share for Frederick Prince Georgersquos and Montgomery counties is 80 percent Montgomery and Frederick counties have the highest proportion of employment within Professional Scientific amp Technical Services in the state with shares of 140 percent and 135 percent respectively Western Maryland and the Upper Shore are home to a significantly higher proportion of Manufacturing employment with 113 and 123 percent respectively In both of these areas the share of Manufacturing employment is more than double that of the state as a whole
Western Maryland boasts the highest share of Transportation amp Warehousing employment (42 percent) This is reflective of the way Washington County in particular has been able to leverage successfully the regionrsquos excellent transportation infrastructure which includes access to three interstates (I-68 I-70 and I-81) and two railway lines (CSX Transportation and Norfolk Southern) to reinvent itself as a transportation hub Washington County currently is home to 151 Transportation amp Warehousing businesses including the Staples Distribution Center
Montgomery County leads the state in share of Information employment (33 percent) and boasts the highest concentration (15 percent) of employment within the Management of Companies amp Enterprises sector The Lower Shore employs a significantly large proportion of workers within the Accommodations amp Food Services sector Employment in this industry comprises 155 percent of the regionrsquos economy compared to just 76 percent for Maryland as a whole
32
Marylandrsquos Labor Demand
Among the fastest growing Maryland employment sectors are high wage sectors such as Professional Scientific amp Technical Services which expanded by more than 4900 positions or 23 percent between the third quarters of 2005 and 2006 Also growing quickly were Management of Companies amp Enterprises with growth of more than 4300 positions and Wholesale Electronic Markets amp Agents amp Brokers with growth of 2314 positions Each of these sectors pays weekly wages above $1300 well in excess of the $858 average for all Maryland industries Growth also is being led by Food amp Beverage Stores which expanded by 4543 jobs or 77 percent and the demographically driven Nursing amp Residential Care Facilities industry with growth of 3409 positions or 57 percent Specialty Trade Contractors also ranks high on the list
Figure X Top Employment Gaining Maryland Industries 2005Q3 ndash 2006Q353
RANK INDUSTRY EMPLOYMENTLEVEL 1-YEAR CHANGE IN
EMPLOYMENT ABSOLUTE PERCENT
WEEKLY WAGES
1 2 3 4 5 6 7
8 9
10
11 12 13 14 15
Professional Scientific amp Technical Services Food amp Beverage Stores Management of Companies amp Enterprises Nursing amp Residential Care Facilities Specialty Trade Contractors Ambulatory Healthcare Services Hospitals Wholesale Electronic Markets amp Agents amp Brokers Food Services amp Drinking Places Warehousing amp Storage Building Material amp Garden Equipment amp Supplies Dealers Transit amp Ground Passenger Transportation Clothing amp Clothing Accessories Stores Construction of Buildings Couriers amp Messengers
219324 63824 18065 63235
128225 95508 95046
12827 177052
10747
26550 8838
30520 45944 11393
4920 23 4543 77 4337 316 3409 57 2951 24 2635 28 2602 28
2314 220 2007 11
944 96
894 35 815 102 788 27 718 16 641 60
$1335 $465
$1421 $538 $850 $985 $896
$1434 $295 $762
$609 $457 $331 $966 $726
53 RESI US Bureau of Labor Statistics Quarterly Census of Employment amp Wages (QCEW) Data
33
Marylandrsquos Labor Demand
Industries rapidly shedding jobs are led by a mix of retail services and manufacturing sectors including General Merchandise Stores which contracted by more than 6900 positions or 127 percent between the third quarters of 2005 and 2006 Accommodations (loss of more than 2700 positions) and Insurance Carriers amp Related Activities (loss of 1116 positions) The latter industry pays weekly wages approaching $1200 well in excess of the $858 average for all Maryland industries Manufacturing sectors comprise five of the most rapidly declining industries including Computer amp Electronic Product Manufacturing Primary Metal Manufacturing Leather amp Allied Product Manufacturing Transportation Equipment Manufacturing and Wood Product Manufacturing Collectively these industries shed nearly 2600 jobs from the statersquos payrolls It is important to note that with the exception of Wood Product Manufacturing these contractions are concentrated within high-paying sectors
Figure Y Top Employment Losing Maryland Industries 2005Q3 ndash 2006Q354
RANK INDUSTRY EMPLOYMENT LEVEL
1-YEAR CHANGE IN EMPLOYMENT
ABSOLUTE PERCENT
WEEKLY WAGES
1 2 3 4
5 6 7 8
9 10 11 12 13 14 15
General Merchandise Stores Accommodations Insurance Carriers amp Related Activities Merchant Wholesalers Durable Goods Sporting Goods Hobby Book amp Music Stores Merchant Wholesalers Nondurable Goods Motion Picture amp Sound Recording Industries Motor Vehicle amp Parts Dealers Computer amp Electronic Product Manufacturing Miscellaneous Store Retailers Rental amp Leasing Services Primary Metal Manufacturing Leather amp Allied Product Manufacturing Transportation Equipment Manufacturing Wood Product Manufacturing
47619 24725 34577 52555
13161 29846 4489
38795
21786 18947 13595 3583
171 8314 3567
-6927 -127 -2729 -99 -1116 -31 -1066 -20
-1005 -71 -1002 -32
-695 -134 -659 -17
-653 -29 -634 -32 -544 -38 -533 -129 -489 -741 -465 -53 -445 -111
$365 $428
$1173 $1194
$395 $941 $444 $842
$1659 $425 $723
$1124 $911
$1164 $692
54 RESI US Bureau of Labor Statistics Quarterly Census of Employment amp Wages (QCEW) Data
34
Marylandrsquos Labor Demand
52 Base Realignment and Closure Commission (BRAC) Demand
The most recent round of BRAC decisions clearly will benefit Marylandrsquos economy and will result in thousands of new high-skill high-wage jobs moving into the state over the next five years However the anticipated influx of Department of Defense (DoD) and associated contractor positions ndash estimated at between 40000 and 60000 new jobs ndash presents its own set of challenges from a workforce development perspective
The BRAC legislation mandates that several DoD units (comprised of more than 15000 civilian DoD personnel) must move to Maryland by 2011 The extent to which current DoD employees will follow their jobs to Maryland is not clear Recent estimates indicate that between 30 and 50 percent of the civilian employees working at Fort Monmouth New Jersey plan to follow their jobs to Aberdeen55 Filling the gap with existing Maryland workers and recruiting new employees will present a significant workforce development challenge This challenge will undoubtedly escalate as existing civilian DoD workers approach retirement According to a report issued by the Pentagon in 2002 the average age of DoD employees is 452 years
The size and scope of the DoD units moving to Maryland as a result of BRAC could be influenced by future and current workforce availability In other words if jobs go unfilled they could very well be lost The challenge for workforce development officials is to ensure that Maryland gains as many potential BRAC jobs as possible The way to achieve this goal is to make sure that new positions are filled quickly Implementing an efficient security clearance process is one way to work toward this goal
Most important the Statersquos workforce development system must strive to ensure that Marylandrsquos labor pool is ready and able to fill the types of jobs that BRAC will bring to Maryland Both the Fort Monmouth and the Defense Information Systems Agency (DISA) units that are slated to move to Maryland report a high proportion of the following occupations
Electricalelectronics engineers Computer engineers Management and program analysts Computer scientists Information technology managers General engineers Telecommunications specialists
55 September 28 2007 presentation by Mark Fuhring Deputy Director of Human Resources CECOM Life Cycle Management Command
35
Marylandrsquos Labor Demand
These occupations require a Bachelorrsquos degree mainly in the engineering and sciences fields for entry-level positions For higher grade positions graduate education andor a combination of work experience is required Key skills associated with these positions include
Complex problem solving Critical thinking Judgment and decision making Systems evaluation56
Technology design57
There will be ancillary effects of BRAC to be considered as well Specifically the influx of BRAC personnel and contractors will drive significant construction activity and the demand for personal services The influx also will ramp up demand for services workers such as construction managers and workers day care workers and hospitality workers among others Community colleges in Harford and Anne Arundel counties already have begun to explore program needs associated with these occupations According to a report produced by RESI in 2006 for every direct on-base job58 job that comes to Maryland 196 additional spin-off jobs will be created59 This is an area that should be explored fully by workforce development professionals
53 Demand for Science Technology Engineering and Mathematics (STEM) Workers
In recent years upper-level degrees in science and engineering have been awarded to high proportions of foreign-born students According to the National Academy of Science 59 percent of US engineering doctorates were awarded to foreign students in 200360 In 2004 roughly 63 percent of the 147 doctoral degrees in engineering awarded by Maryland institutions went to foreign students including a small number of non-US citizens with permanent resident visa status and a much larger portion of non-US citizens with temporary visa status
This trend can benefit our economy since many foreign-born people with doctorates remain in the country to work at least for some period of time Americarsquos ratio of natural sciences and engineering degrees awarded to our college age population (57 per 100) severely lags that of Japan (8 per 100) Europe (8-13 per 100) and Taiwan and South Korea (11 per 100) Recent evidence indicates however that US institutions are facing greater competition from international schools for these students a concern noted in the Maryland Higher Education Commissionrsquos 2004 plan Increased immigration restrictions have not helped the situation In 2000 Asian universities awarded 12 million of the worldrsquos science and engineering degrees (undergraduate graduate and doctoral) while the US awarded just 500000
56 The US Department of Labor defines systems evaluation as follows Identifying measures or indicators of system performance and the actions needed to improve or correct performance relative to the goals of the system 57 Technology design is defined as Generating or adapting equipment and technology to serve user needs 58 Direct on-base positions include civilian DoD positions as well as embedded private defense contractors 59 RESI Maryland Department of Business amp Economic Development 2006 60 National Academy of Science p7 2007
36
Marylandrsquos Labor Demand
It should be noted that a 2005 Duke University study presents the US in a more competitive light61 The study notes that previously published figures on the number of engineering or computer science graduates for the US China and India are not necessarily comparable due to differences in the types of programs and program length etc According to Dukersquos findings when the number of degrees granted is normalized to account for population size (on a per one million citizen basis) the US generates 750 technology specialists compared to 500 produced by China and 200 produced by India
While the scope of the competition that US higher educational institutions currently face is debatable there is one point on which analysts agree national and local economies will face greater demand for scientists and engineers going forward Marylandrsquos demand for workers in these sectors will be exacerbated further by demographics (as many current workers approach retirement) and by the impacts of BRAC which will result in the movement of a significant number of science and engineering jobs to Maryland in the near future
According to this measure Maryland fares better than most states After all Maryland ranks second in the nation in our concentration of doctoral scientists and engineers62 as well as in our number of employed PhD scientists and engineers per 100000 workers (9385)63 We are home to a multitude of federal and university research labs and rank second in the nation in terms of federal research and development spending and first in terms of university research dollars64
Still given future demand growing our base of science and engineering degrees must remain a high priority
Various Maryland entities recognize this need including GWIBrsquos Aerospace Industry Steering Committee which recommended several initiatives aimed at promoting science technology engineering and mathematics (STEM) education in Maryland Among these is the recommendation for the creation of a STEM Center of Excellence as well as the development of articulation agreements between high school pre-engineering programs and college programs Industry internships and mentorships also are identified as a means to grow Marylandrsquos supply of scientists and engineers
The Maryland State Department of Education (MSDE) also is well aware of the need for more scientists and engineers and began implementing Project Lead the Way (PLTW) in 2003-2004 PLTW is a pre-engineering program which aims to increase preparation among high schools students for higher education engineering programs Forty-three (43) Maryland high schools in 16 school systems participate in the program which allows students to enroll in such courses as Principles of Engineering Computer Integrated Manufacturing Civil Engineering and Aerospace Engineering Maryland recently received the Joseph H Oakley Excellence in Education Award for its PLTW progress Maryland also will be piloting the newly-launched PLTW for the biomedical sciences curriculum An aerospace PLTW program also is in the planning stages
61 Duke University 2005 62 National Science Foundation 2003 63 National Science Foundation State Science amp Technology Institute 2003 64 Maryland Higher Education Commission 2004
37
Marylandrsquos Labor Demand
Another MSDE program that focuses on this area is the Super Stem Project which partners higher education (the University of Maryland Baltimore County) with the Baltimore County Public Schools and MSDE The program is funded by the National Science Foundation and targets improving student achievement teacher quantity and quality specifically within STEM programs
54 The Demand for Basic and Applied Skills
The Conference Board in collaboration with several other organizations conducted a survey of US firms in 2006 to determine how employers rate new entrants to the workforce65 The results were not positive Overall employers do not consider recent graduates (high school graduates as well as graduates of two- and four-year institutions) to be adequately prepared for the workforce Specifically firms identified the following shortcomings among these populations
Figure Z Deficiencies of New Entrants to the US Workforce as Specified by Employers66
High School Graduates are bull ldquoDeficientrdquo in the basic knowledge and skills of Writing in English Mathematics and Reading Comprehension bull ldquoDeficientrdquo in Written Communications and Critical ThinkingProblem Solving
both of which may be dependent on basic knowledge and skills bull ldquoDeficientrdquo in ProfessionalismWork Ethic and bull ldquoAdequaterdquo in three ldquovery importantrdquo applied skills Information Technology Application
Diversity and TeamworkCollaboration Two-Year and Four-Year-College Graduates are bull Better prepared than high school graduates for the entry-level jobs they fill bull ldquoDeficientrdquo in Writing in English and Written Communications and bull ldquoDeficientrdquo in Leadership
65 The Conference Board 66 The Conference Board p11
38
Marylandrsquos Labor Demand
GWIBrsquos Industry Monograph for Marylandrsquos Hospitality amp Tourism Industry confirms these findings The GWIB report identifies a critical mismatch between the ldquojob-readinessrdquo or basic skills required for the majority of occupations within the sector and the skill levels of new entrants to the field The majority of occupations within this sector require basic skills and on-the-job training In fact only one occupation out of 35 requires a Bachelorrsquos degree or higher (General and Operational Managers) Yet for the balance of occupations employers are having difficulty finding workers with good active listening skills service orientation and cultural awareness and sensitivity Finding job entrants with the ability to read write and understand standard and spoken English also is a critical priority for the industry To address these issues the report recommends creating a statewide resource network to advance basic skills and to support tax incentives for worker training in English as a Second Language among other recommendations
According to occupational projections updated by the Maryland Department of Labor Licensing amp Regulation (DLLR) the top four occupations in which we expect to see the greatest level of replacement openings between 2004 and 2014 include67
Cashiers (33780 replacement openings) Retail salespersons (31670) Waiters and waitresses (21585) Combined food preparation and serving workers (17035)
This list is not surprising as these occupations have been associated traditionally with limited career paths and high turnover rates However this list also brings the issue of basic skills to the forefront Not only do these occupations rank high in terms of projected turnover they also lead the state in terms of total projected job openings between 2004 and 2014 Using US Department of Labor occupational data (ONET)68 one can determine that these occupations require basic skills (as defined by the Department of Labor) such as active listening speaking writing and reading comprehension
The Conference Board also indicates that while both basic skills and applied skills69 are paramount for new entrants to the workforce applied skills tend to be rated as the most critical 21st century skills employers are seeking The four top-rated skills are considered to be applied skills according to the study They include (1) ProfessionalismWork Ethic (2) Oral and Written Communications (3) TeamworkCollaboration and (4) Critical ThinkingProblem Solving
67 Maryland Department of Labor Licensing amp Regulation Office of Workforce Information and Performance and Office of Labor Statistics 2007 68 The US Department of Laborlsquos online information system (ONET) The ONET online system provides occupational information as well as information on key attributes and characteristics of workers and occupations 69 Examples of basic skills noted in the study include reading comprehension spoken and written English mathematics science knowledge of a foreign language etc Applied skills include lifelong learningself direction creativityinnovation leadership etc
39
Looking Ahead Identifying Gaps Challenges and Opportunities
60 Looking Ahead Identifying Gaps Challenges and Opportunities
61 The Gap between Marylandrsquos Jobs and Labor Supply is Growing
The gap between the size of Marylandrsquos labor force and the statersquos inventory of jobs is widening70 The number of jobs in Maryland has outnumbered the statersquos resident labor force for several decades In 1970 the gap was roughly 46000 By 1990 this figure had more than doubled to nearly 120000 By 2020 this gap is expected to exceed 528000 The situation is not as dire as it appears to be on the surface since workers residing in neighboring states will continue to fill some portion of these jobs however the widening gap certainly will translate into greater competition for available labor
Figure AA Historic and Projected Maryland Resident Labor Force and Jobs by Place of Work71
Labor Force Number of Jobs
4000000
3500000
3000000
2500000
2000000
1500000
1000000
1970 1980 1990 2000 2010 2020 2030
Lab
or F
orce
Jo
bs
After 2010 labor force growth is expected to slow Between 2010 and 2020 for example the statersquos labor force is expected to increase by roughly 200000 (down from expected growth of more than 360000 over the previous decade) Much of the anticipated slowdown in labor force growth is attributable to the graying of our population For years experts have been anticipating the dramatic ways in which our aging workforce will affect national state and local economies The implications of this megatrend are enormous They range from the need for employers to adapt to increasing generational diversity and generational differences in the workplace to the need for companies to ensure that knowledge and skills are retained as older workers retire Maryland must confront the impacts of these demographic shifts along with the rest of the nation
70 The Maryland Department of Planning projects jobs by place of work using historical data released by the Bureau of Economic Analysis These are jobs which are located in Maryland but are filled by both state and non-state residents The statersquos resident labor force also is projected by the Maryland Department of Planning based on historical Bureau of Economic Analysis data Projections were updated in November 2006 71 Maryland Department of Planning November 2006
40
Looking Ahead Identifying Gaps Challenges and Opportunities
The following chart details Marylandrsquos historical current and projected labor force composition by age The proportion of adults age 55 years old and older who are active in the workforce is projected to increase from roughly 12 percent in 1990 to 26 percent by 2020 The proportion of Marylandrsquos workforce comprised of adults age 35 to 54 years old on the other hand is expected to decrease from 43 percent to 39 percent over the same period As previously mentioned this trend is due to the graying of the population ndash there are simply fewer people making up Generations X and Y compared to the size of the baby boomer generation
Figure AB Historic and Projected Proportion of Marylands Labor Force by Age72
Perc
ent o
f Lab
or F
orce
00
100
200
300
400
500
600
1990 2000 2010 2020 2030
16-34
35-54
55+
72 Maryland Department of Planning 2006
41
Looking Ahead Identifying Gaps Challenges and Opportunities
62 The Race to Preserve Institutional Knowledge
The impacts of Marylandrsquos aging population are not limited simply to the issue of filling jobs Shifting demographics and the approaching retirement of older workers will place increased pressure on firms to preserve institutional knowledge Simply put companies and industry are scrambling to prevent ldquobrain drainrdquo for good reasons
The dearth of qualified nuclear engineers and related workers illustrates this issue perfectly According to the Nuclear Energy Institute (NEI) the US nuclear industry faces a critical shortage of workers by 2010 In fact NEI finds that less than eight percent of industry employees are younger than 32 years of age and more than half are age 47 or older Expected shortages will affect a broad cross section of occupations within the industry ranging from health physicists and plant operators to technicians welders and maintenance workers73 The timing is especially problematic as the Nuclear Regulatory Commission expects an influx of applications for nearly three dozen new reactors by 2008 including Constellation Energy Grouprsquos application to build a new nuclear reactor at Calvert Cliffs74 Clearly industry and workforce development professionals must ensure that institutional knowledge within this critical industry is preserved and a sufficient pipeline of future workers is developed
The nuclear engineer example is not an isolated case According to findings from GWIBrsquos Aerospace Industry Initiative Workforce Summit conducted in January 2006 50 percent of the aerospace workforce in Maryland is expected to retire in the next 15 years A 2002 Accenture publication notes that ldquoThe vast majority of US and European chemical companies are concerned about problems posed by their aging workforce Estimates that 50 percent of employees will become retirement eligible in a particular function in the next decade are not uncommon in the US and Europerdquo75 Marylandrsquos Educational Services sector which already is feeling the impact of critical shortages ranks among those industries with a high proportion of older workers (roughly 18 percent are age 55 plus)76 The Healthcare sector is another that has begun to feel the impact of an aging workforce In 1998 nearly 24 percent of Marylandrsquos registered nurses working in hospitals were between the ages of 48 and 57 years old and another 19 percent were over the age of 58 By 2005 these proportions had grown to 28 and 25 percent respectively77 According to GWIBrsquos Healthcare Workforce Summit monograph vacancy rates in 2002 for registered nurses (156 percent) radiation therapy technicians (211 percent) and licensed practical nurses (129 percent) at Maryland hospitals already are high The issue of brain drain and shortages undoubtedly will be compounded as the demand for healthcare services increases due to the graying of the population78
73 Nuclear Energy Institute 2007 74 Baltimore Sun Constellation Energy files partial plan for reactor July 31 2007 75 DeLong page 3 76 Carroll 2004 77 Maryland Board of Nursing 78 One recommendation developed from GWIBrsquos Healthcare Workforce Summit involves transitioning retired military personnel to the private sector Many of these personnel have accumulated vast experience and training but lack proper certification ProVET (Providing Re-employment Opportunities to Veterans) is one program Maryland has launched in recent years to provide transition assistance for those veterans who are interested in securing private sector employment
42
Looking Ahead Identifying Gaps Challenges and Opportunities
63 FacultyTeacher Shortages
It is not the intention of this analysis to minimize the significance of labor shortages already occurring in Maryland industry sectors ndash for example that of registered nurses and other healthcare professionals However given that much already has been written about these shortages this analysis instead targets the issue of faculty shortages
Marylandrsquos need for teachers outstrips the statersquos ability to produce and retain them In 2005 school systems throughout the state hired roughly 8000 teachers of which 4350 were beginning new hires Only one-third (1439) of the beginning new hires had graduated from Maryland colleges and universities
Particular subjects facing current and future shortages include Technology education Computer science English for Speakers of other Languages Foreign languages Mathematics Science Special education
The issue of faculty shortages extends to higher education as well and is affecting a range of Maryland industries including the healthcare sector As noted in GWIBrsquos HealthCare Monograph ldquothe amount of faculty and learning facilities is inadequatehelliprdquo to train the statersquos healthcare workforce These shortcomings are evidenced by student waiting lists at local nursing schools79 Indeed nursing programs both locally and nationally report an increase in the number of qualified nursing applicants being turned away due to a dearth of faculty and classroomclinical space In 2005 the number of applicants denied admission due to a lack of faculty or classroom and clinical space jumped to 29424 nationally and 1850 in Maryland
According to a 2005 survey80 the statersquos 24 nursing degree programs reported that 305 percent of full-time faculty positions were vacant Local shortages are attributed to both the aging of the statersquos faculty population as well as the difficulties in growing the pool of potential educators These difficulties range from structural barriers like limited local capacity of graduate programs in nursing education to market-driven trends (eg compensation for practicing nurses often exceeds that for nursing educators) These trends undoubtedly will be exacerbated as Marylandrsquos nursing faculty population continues to age and approach retirement The average age of nursing faculty at Maryland institutions as reported to the Board of Nursing in 2005 ranges from 42 to 55 years and nationally the average age of faculty retirement is 625 years81
79 Charting New Directions Governorrsquos Healthcare Workforce Summit page 13 80 Maryland Council of Directors of Associate Degree and Baccalaureate Programs Survey 81 Nursing Faculty Shortage Causes Effects and Suggestions for Resolution Maryland Statewide Commission on the Crisis in Nursing 2005
43
Looking Ahead Identifying Gaps Challenges and Opportunities
64 Increasing Age Diversity
Business and industry also will need to accommodate increased age diversity in the workplace According to a 2005 Forbes magazine article ldquoEmployers need to examine whether their policies programs and practices are age neutral For example is the company offering dependent care geared only toward children when the workforce may be at an age where elderparent care has more valuerdquo82
Adjusting to differences in generational attitudes and preferences in the workplace will present its own set of challenges For instance the chemical industry has become accustomed to low voluntary turnover among managers and professionals As younger generation workers (Generation X and Y in particular) replace retirees the industry will need to adapt to an increased tendency for voluntary attrition as these workers tend to be more willing to seek out better job opportunities83 Many today consider employee loyalty to be a thing of the past especially among todayrsquos younger workers who are perceived to be constantly on the prowl for bigger and better opportunities
The aging of our population also has implications for education As the age of students at postshysecondary educational institutions rises and as workers continue to pursue lifelong learning campuses and faculty increasingly will require additional flexibility in terms of location timing etc MHEC recognized this need in their 2004 plan and set a goal to enhance alternative approaches for educational delivery ndash namely distance learning and regional higher education centers The Statersquos academic institutions already have begun to respond to these needs as evidenced by institutional expansion to satellite campuses the expansion of 2+2 programs84 and increased investments in and access to distance learning programs that are part of Marylandrsquos higher education system
65 Immigrants Continue to Grow Marylandrsquos Labor Supply
Marylandrsquos workforce is expected to benefit from international migration at both ends of the employment spectrum as immigrants fill low-wage low-skill jobs as well as high-wage high-skill positions Low-skill jobs such as Combined Food Preparation amp Serving Workers for example continue to rank among the top occupations demanded in Maryland According to data published by the Urban Institute immigrants comprise a disproportionately high share (20 percent) of low-wage workers in the US Immigrant workers represent an especially large proportion of low-wage occupations within the farming and private household sectors According to 2002 estimates immigrants compose 37 and 42 percent of employment in these sectors respectively85 The Pew Hispanic Center reports that short-term unauthorized immigrants are concentrated heavily in the low-wage construction (including building and
82 Reeves 200583 Accenture Institute for Strategic Change 2002 84 2+2 is a program in which the first two years of post-secondary education are completed at a community college and the remainder is completed at a partner four-year institution85 Capps 2003
44
Looking Ahead Identifying Gaps Challenges and Opportunities
grounds cleaning and maintenance occupations) and hospitality industries (including food preparation and service occupations)86
GWIBrsquos Hospitality and Tourism monograph reveals the importance of this workforce to local industry The report documents Marylandrsquos reliance on immigrant workers seasonal and otherwise to fill a variety of occupations within this sector ranging from food service occupations such as bartenders hosts and hostesses cooks dishwashers and food preparation workers to grounds keeping workers desk clerks receptionists maids and housekeeping cleaners and security guards etc The report finds that the need for these workers outstrips supply The limited number of H-2B worker visas which allow for the temporary hiring of foreign workers granted to Maryland businesses is not enough to fill the vacant positions
Other immigrant segments are expected to continue to fill high-wage high-skill jobs in such occupations as scientists and engineers The Migration Policy Institute analyzed Census 2000 data and found that one out of every five doctors in the US is foreign born Two of every five medical scientists one of every five computer specialists and one of every six people in the engineering or science fields are foreign born In addition the proportion of foreign-born workers in other skilled fields such as nursing has grown significantly in recent years a trend which is expected to continue87
86 Pew Hispanic Center 2006 87 Kaushal 2006
45
Looking Ahead Identifying Gaps Challenges and Opportunities
0
20000
40000
60000
80000
100000
120000
1980 1990 2000Peop
le W
ho S
peak
Eng
lish
Not
Wel
l o
r N
ot a
t All
Figure AC Maryland Population Who Speak English ldquoNot Wellrdquo or ldquoNot at Allrdquo
From a workforce development perspective the movement of immigrants into Maryland will require increased investment in English as a Second Language (ESL) programs According to the decennial census data the percentage of people who reported to the Census Bureau that they spoke English ldquonot wellrdquo or ldquonot at allrdquo increased nearly 74 percent since 1990 (Figure AC) Of the more than 246000 persons who indicated that they spoke English ldquoless than very wellrdquo 44
percent reported Spanish as their native language while another 26 percent indicated an Asian language (particularly Korean Chinese and Vietnamese) as their native language Much of this population represents non-English speaking immigrants who present new challenges in terms of labor force training and education Recognizing this need organizations such as US Hispanic Youth Entrepreneur Education (USHYEE) in partnership with the Maryland State Department of Education (MSDE) and colleges and universities within the state are working together to provide Hispanic youth with scholarships along with technical and life skills that will encourage this segment of the population to seek higher education opportunities
The statersquos growing immigrant population has the potential to fill another significant role in Marylandrsquos economy As commerce and industry become more global knowledge of a foreign language is becoming increasingly critical to local businesses In fact a recent survey of US employers confirms that speaking a foreign language is expected to be a highly demanded skill in the 21st century Survey results indicate that while only 11 percent of employers currently rate this skill as ldquovery importantrdquo approximately two-thirds indicate that knowledge of a foreign language will increase in importance over the next five years In fact knowledge of a foreign language was singled out as the top basic skill expected to increase in importance88 In 2005 145 percent of Marylanders age five and older spoke a language other than English at home89 a trend that clearly will benefit the state in its efforts to meet foreign language needs
88 The Conference Board p11 89 US Census Bureau American Community Survey 2005
46
Looking Ahead Identifying Gaps Challenges and Opportunities
66 Adult Education and Engaging Workers with Barriers to Employment
Todayrsquos jobs and the jobs of tomorrow will require an increasingly complex array of skills including but not limited to verbal mathematical organizational and interpersonal skills This further complicates matters for the one million potential Maryland workers who have barriers to employment They include Marylandrsquos veteran population people with lower literacy ex-offenders people with disabilities and those receiving unemployment insurance benefits90
Preparing these workers for the jobs of the future presents another challenge for the Statersquos workforce development system As previously mentioned these populations are a potentially untapped labor supply If workforce development professionals can help this population transition more fully into the workforce tight labor market conditions may be alleviated
Veterans Population
As of 2005 more than 427000 people or 119 percent of the statersquos population 18 and over were veterans The vast majority of Maryland veterans (89 percent) are male Not surprisingly female veterans tend to be younger than their male counterparts A total of 776 percent of female veterans are between 18 and 54 years of age compared to 372 percent of male veterans91
Ex-Offenders
The number of offenders released from Maryland Department of Public Safety and Correctional Services facilities in 2006 approached 14000 Approximately six out of 10 or 8685 people were released in Baltimore City As of April 2007 nonviolent offenders constituted 426 percent of the nearly 23000 inmates housed in Maryland facilities More than 20 percent of this population is age 25 or under and another 171 percent are between 25 and 30 years of age Nearly 3400 of them or 149 percent of this population are serving a sentence of 36 months or less
Transitioning ex-offenders into the workforce is critical not only from a workforce development perspective but from a public safety perspective as well To the extent that this population can become engaged in the workforce the likelihood of recidivism is expected to decline
Lower Literacy Population
According to a report released recently by the US Department of Education roughly 206 percent of Marylandrsquos adult population (or 730000) was eligible for adult education services as of 2000 This population includes individuals who ldquolack sufficient mastery of basic educational skills to enable the individuals to function effectively in societyrdquo lack a high school diploma or equivalent or (are) ldquohellipunable to speak read or write the English languagerdquo Specifically this
90 Examples of other population segments that could be targeted include homeless persons welfare recipients and youth out of school among others 91 US Census Bureau American Community Survey 2005
47
Looking Ahead Identifying Gaps Challenges and Opportunities
population includes those adults age 16 or older who lack a high school diploma and who are not enrolled in school and adults who speak English as a second language and who have rated their ability to speak English as ldquowellrdquo ldquonot wellrdquo or ldquonot at allrdquo92
The vast majority of this adult education population (601 percent) is of working age (from 16 to 59 years old) yet in 2000 well over half of them (348717 persons) did not participate in the statersquos labor force Another 28484 reported they were unemployed Basic literacy and English as a Second Language instruction is needed to help transition this group more fully into the workplace More than 105000 of Marylandrsquos adult education population speak English as a second language and nearly half of this group (51952) identify themselves as speaking English ldquonot wellrdquo or ldquonot well at allrdquo93
People with Disabilities
Maryland is home to more than 376000 working age (from 16 to 64) people with disabilities Only about 43 percent of these people are employed compared to 78 percent for the remainder of the statersquos working age population94 The low employment rate for people with disabilities combined with the fact that many of them can become employed with or without accommodations are reasons that the GWIB views people with disabilities as an untapped workforce
Unemployed Persons and Persons Receiving Unemployment Insurance Benefits
As of August 2007 the number of unemployed Marylanders is on track to approach last yearrsquos level of roughly 116000 persons This population includes people who are not working but who are actively seeking work They are counted as part of Marylandrsquos labor force Though the number of unemployed people in Maryland has been on the decline since 2004 they still represent a substantial potential labor pool
More than 18000 initial unemployment claims were filed in Maryland in June 2007 The extent to which the State can link these persons with employment opportunities will help to decrease the number of people filing for initial and continuing unemployment insurance claims and will help increase Marylandrsquos available labor pool
92 US Census Bureau Profiles of the Adult Education Target Population Information from the 2000 Census December 2005 93 US Census Bureau Profiles of the Adult Education Target Population Information from the 2000 Census December 2005 94 US Census Bureau 2006 American Community Survey
48
Recommendations
70 Recommendations
This section of the analysis highlights a number of emerging challenges that will test the statersquos economic and workforce strengths over the next one to five years and provides priority recommendations to address these challenges
71 Science Technology Engineering and Mathematics (STEM) Industries are Struggling to Attract Recruit and Retain Workers
As in other industries many of Marylandrsquos science technology engineering and mathematics (STEM) industries face a looming retirement cliff as skilled baby boomers begin to retire and leave the workforce Compounding the problem is anecdotal and other evidence which suggests that the pool of qualified technical students graduating from college is actually diminishing The statersquos aerospace industry serves as a prime example According to the GWIB Aerospace Industry Steering Committee in 2006 nearly eight out of every 10 Maryland aerospace workers was age 51 or over and 50 percent of the current aerospace workforce is set to retire by 2020
Recommendation Increase opportunities for young people to become aware of and enter science technology engineering and mathematics (STEM) careers
One way to meet the need for workers in science technology engineering and mathematics (STEM) careers is to expand middle- and high school-level studentsrsquo interaction with STEM professionals through expanded internship and mentorship programs GWIBrsquos Aerospace Monograph also identifies the need to encourage STEM-related field trips and other applied activities and to invite industry professionals to classes or school activities The Johns Hopkins Universityrsquos Applied Physics Labrsquos (APL) Mentor Program is a perfect example of such interaction The program is conducted in conjunction with the Howard County Public Schools and other nearby schools and pairs high school students with volunteer APL professional staff The program enables students to work on science projects with their mentors during the school year
Encouraging qualified underrepresented population segments (ie females and minorities) to pursue studies in science and mathematics is another way to boost interest APL and a number of university partners are involved in a program that targets this issue The Maryland Mathematics Engineering Science Achievement program (MESA) is a pre-college program in which MESA partners work directly with teachers and schools in order to encourage K-12 interest in STEM fields The program targets minorities and females
Recommendation Expand and enhance pre-college programs such as Project Lead the Way
Expanding programs such as MSDErsquos Project Lead the Way (PLTW) is another approach PLTW is a pre-engineering program which aims to increase preparation among high school students for higher education engineering programs Forty-three (43) Maryland high schools in 16 school systems participate in the program which allows students to enroll in such courses as Principles of Engineering Computer Integrated Manufacturing Civil Engineering and
49
Recommendations
Aerospace Engineering Maryland soon will pilot the newly-launched PLTW for a biomedical curriculum An aerospace PLTW program also is in the planning stages
72 Maryland Continues to Face Growing Teacher and Faculty Shortages
The state continues to confront shortages among teachers and faculty Marylandrsquos need for teachers outstrips our ability to produce and retain them In 2005 roughly 8000 new teachers were hired in the state of Maryland Of the 4390 teachers who were new hires only 1439 (33) were graduates of Maryland colleges and universities95 Subjects with current and future teacher shortages include technology education computer science English for Speakers of other Languages foreign languages mathematics science (including physical science physics chemistry and earthspace science) and special education
The issue of faculty shortages extends to higher education as well and is affecting a number of Maryland industries including the healthcare sector As noted in GWIBrsquos HealthCare Monograph ldquothe amount of faculty and learning facilities is inadequatehelliprdquo to train the statersquos healthcare workforce These shortcomings are evidenced by student waiting lists for local nursing schools96 Nursing programs both locally and nationally report an increase in the number of qualified nursing applicants being turned away due to a dearth of faculty and classroomclinical space In 2005 the number of applicants denied admission for these reasons totaled 29424 for the nation and 1850 in Maryland
According to a 2005 survey97 Marylandrsquos 24 nursing degree programs reported that 305 percent of full-time faculty positions were vacant Local shortages can be attributed to both the aging of the statersquos population as well as difficulties in growing the pool of potential educators These difficulties range from structural barriers such as the limited local capacity of graduate programs in nursing education to market-driven trends (eg compensation for practicing nurses often exceeds that for nursing educators) These trends will undoubtedly be exacerbated as Marylandrsquos nursing faculty population continues to age and approach retirement The average age of nursing faculty at Maryland institutions as reported to the Board of Nursing in 2005 ranges from 42 to 55 years and the average age nationally for faculty retirement is 625 years98
Recommendation Enhance teacher retention through the expansion and enhancement of Professional Development School (PDS) networks
It appears that facultyteacher retention especially at the primary and secondary levels can be improved through access to quality Professional Development School (PDS) networks One example is Towson Universityrsquos PDS network which has been recognized at both the state and national levels as a successful model that relies on a partnership between a college or university and local school systems PDS networks aim to enhance and improve teacher quality through
95 Maryland State Department of Education 2006 96 Charting New Directions Governorrsquos Healthcare Workforce Summit page 13 97 Maryland Council of Directors of Associate Degree and Baccalaureate Programs Survey 98 Nursing Faculty Shortage Causes Effects and Suggestions for Resolution Maryland Statewide Commission on the Crisis in Nursing 2005
50
Recommendations
continuous professional development The network targets all stages of a teacherrsquos career offering professional development activities throughout the entire career An analysis of Towson Universityrsquos PDS network in 2001 showed that its teacher-graduates were retained at a much higher rate than other new teachers According to the study schools within the PDS network were associated with teacher retention rates of 80 percent after four years and 71 percent after five years This compares to non-PDS network retention rates of 45 and 34 percent respectively99
73 Marylandrsquos Growing Immigrant Population Opportunities and Challenges
Population shifts are impacting the demographic makeup of the state in ways that will have dramatic impacts on employer needs and workforce development Between 2000 and 2006 immigrants accounted for more than half (516) of Marylandrsquos population growth As of 2006 immigrants account for 12 of the statersquos population
Marylandrsquos workforce is expected to benefit from international migration at both ends of the employment spectrum as immigrants fill low-wage low-skill jobs as well as high-wage high-skill positions From a workforce development perspective this movement into Maryland will require increased investment in English as a Second Language (ESL) programs According to decennial census data the percentage of people who report to the Census Bureau that they speak English ldquonot wellrdquo or ldquonot at allrdquo has increased nearly 74 percent since 1990 Much of this population represents non-English speaking immigrants who present new challenges in terms of labor force training and education
Despite the pressing need for adult literacy services in Maryland demand continues to severely outstrip supply According to MSDE funding constraints dictate that a small percentage of annual demand is being met resulting in annual waiting lists of up to 5000 people Many of the people on waiting lists (47 percent) are waiting for access to ESL programs100
Recommendation Enhance and expand access to community English as a Second Language (ESL) programs
Not only is there a need for improved access to English as a Second Language programs but MSDE also notes the need to improve the quality of the statersquos ESL programs In 2005 Marylandrsquos adult education programs offered 40 hours of instruction per student which is not adequate for beginner or even intermediate English learners to become proficient Many of these ESL students lack advanced literacy skills in their native language and thus require additional intensive classroom time MSDE notes that a program that offers more than 100 hours of classroom time would better meet the needs of this population
Recommendation Enhance and support initiatives and partnerships that encourage a broad spectrum of education opportunities for immigrant populations
99 Pilato Maryland State Department of Education 100 Maryland State Department of Education December 2005
51
Recommendations
Many of Marylandrsquos foreign-born workers are highly educated and possess applicable skills however many of Marylandrsquos immigrants are at the opposite end of the educational spectrum As of 2006 43 percent of Marylandrsquos immigrants held at least a Bachelorrsquos degree compared with 34 of US natives in Maryland At the same time 18 of immigrants in Maryland did not have a high school diploma or its equivalent compared to 12 of US born Maryland residents101
Organizations such as US Hispanic Youth Entrepreneur Education (USHYEE) in partnership with MSDE and colleges and universities within the state are working together to provide Hispanic youth with scholarships along with technical and life skills that will encourage this segment of the population to seek higher education opportunities
Recommendation Coordinate efforts to promote Marylandrsquos access to seasonal immigrant (H-2B) and skilled immigrant (H-1B) workers102
Seasonal immigrant worker shortages have adversely affected Maryland businesses for some time In 2005 the national cap of 66000 H-2B visas which allow foreign nationals to temporarily enter the US and take advantage of seasonal or peak load employment opportunities was filled just a few months into the federal fiscal year As a result the lionrsquos share of Maryland businesses were prevented from applying for the estimated 7000+ temporary workers needed to sustain Marylandrsquos seasonal businesses A diverse group of Maryland industries are affected by the seasonal worker shortage including tourism and hospitality-driven businesses and agriculture and seafood processing firms as well as other types of service firms such as landscaping businesses
The State has recognized the importance of this issue In fact local political leaders continue to be actively involved in drafting legislation to increase the national cap and exempt returning seasonal workers from being subject to it GWIBrsquos Hospitality amp Tourism Monograph emphasizes Marylandrsquos need for seasonal immigrant workers and recommends that a state liaison office for immigration issues be established The GWIB report notes that in addition to being actively involved in immigration policy and advocacy the liaison office could work to connect foreign-born workers with Maryland businesses in need of temporary workers
A liaison office also could coordinate efforts to increase the availability of H-1B workers The H-1B visa program targets highly-skilled internationals who work in professional fields such as computing finance law and healthcare among others The national cap for H-1B visas has fluctuated in recent years jumping from 65000 in the late 1990s to 195000 in 2000 and then dropping back to 65000 in fiscal year 2003 As with H-2B visas annual quotas are met early in the year According to the Migration Policy Institute one out of every five doctors in the US is foreign born Two of every five medical scientists one of every five computer specialists and
101 US Census Bureau 2006 American Community Survey calculations based upon Maryland residents age 25 and over 102 It should be noted that this recommendation in no way advocates filling BRAC and other positions which require security clearances with H-1B and H-2B workers Given security clearance requirements filling these jobs with foreign nationals is simply not possible
52
Recommendations
one of every six persons in engineering or science fields are foreign born Given current and expected shortages among the science engineering technology and mathematics (STEM) fields it makes sense to explore expanding the H-1B visa option
74 The Need for Increased Labor Force Participation
The statersquos low jobless rate (39 percent in 2006) signifies not only that Marylandrsquos economy is healthy but also that local labor market conditions remain tight Most economists agree that an unemployment rate in the range of 35 to 45 percent is indicative of an economy operating at full employment and Marylandrsquos jobless rate continues to fall within that range In fact the state has not recorded an unemployment rate above the 45 percent mark since July 2003
Tight labor market conditions have the potential to aggravate labor shortages and apply upwards pressure on wages Since nearly one-sixth of Marylandrsquos existing labor force is expected to retire in the next decade these conditions are likely to worsen going forward Continued local labor supply shortages makes leveraging our underutilized and potential labor supply all the more important There is an opportunity to address this issue by tapping adult population segments that are underrepresented in the workforce including veterans ex-offenders and the statersquos disabled and lower literacy populations
According to a report released recently by the US Census Bureau roughly 175 percent of the statersquos adult population (or nearly 618000 persons) was eligible for adult education services as of 2000 This population includes individuals who ldquolack sufficient mastery of basic educational skills to enable the individuals to function effectively in societyrdquo103 Specifically this population includes those adults age 16 or older who lack a high school diploma and who are not enrolled in school In order to more fully integrate them into the statersquos labor force we need to expand access to basic literacy instruction GED services and English as a Second Language (ESL) classes
Recommendation Enhance opportunities for adult education (ie basic literacy GED services and ESL classes)
Despite the pressing need for adult literacy services demand continues to severely outstrip supply According to MSDE funding constraints dictate that only three to five percent of annual demand for these services is being met resulting in annual waiting lists of up to 5000 people The majority of those on waiting lists include people seeking ESL instruction and Adult Basic Education (ABE) If the State can increase the availability of these educational programs Marylandrsquos economy will benefit
103 US Census Bureau Profiles of the Adult Education Target Population Information from the 2000 Census December 2005
53
Recommendations
Recommendation Future study is necessary to identify the education and related needs of additional adult population segments
While the needs of Marylandrsquos lower literacy population have been identified there exists a lack of comprehensive information on other population segments which may not be participating fully in the statersquos workforce A thorough study is needed to identify the demographic economic and social characteristics of each Maryland population segment (ie veterans ex-offenders disabled population etc) With this information the education and hard or soft skill levels of these populations could be identified in addition to the identification of barriers preventing them from participating more fully in the workplace A synthesis of this information also would help to identify specific occupations that could serve as an entreacutee to career tracks for each of these population segments
Recommendation Create a statewide resource network to advance basic skills
Basic skills are in demand In fact the Maryland Department of Labor Licensing amp Regulation projects that the top four occupations expected to see the greatest level of replacement openings between 2004 and 2014 include104
Cashiers (33780 replacement openings) Retail salespersons (31670) Waiters and waitresses (21585) Combined food preparation and serving workers (17035)
These occupations require such basic skills as active listening speaking writing and reading comprehension
A recent GWIB report targeting Marylandrsquos Tourism amp Hospitality sector identifies a critical mismatch between the ldquojob-readinessrdquo or basic skills required for most occupations in the sector and the skill levels of new entrants to the field The majority of occupations in this sector require basic skills and on-the-job training yet employers are having difficulty finding workers with good active listening skills service orientation and cultural awareness and sensitivity Finding job entrants with the ability to read write and understand standard and spoken English also is a critical priority for the industry To address these issues the report recommends creating a statewide resource network to advance basic skills
104 Maryland Department of Labor Licensing amp Regulation Office of Workforce Information and Performance and Office of Labor Statistics 2007
54
Recommendations
55
Recommendations
1 BRAC Requires a Pipeline of Qualified Workers
Not all of the current BRAC personnel will move to Maryland along with their jobs Since the average civilian DoD worker is 45 years old many current workers will approach retirement in the near-term future The short-term implications of this trend are highly relevant given that the size and scope of the DoD BRAC units moving to Maryland could be influenced by current and near-term future workforce availability In other words if jobs go unfilled they could very well be lost through downsizing or reconfiguration of BRAC units The challenge for workforce development officials is to ensure that Maryland realizes as many potential BRAC jobs as possible The way to achieve this goal is to make sure that new positions are filled quickly
The statersquos workforce development system must strive to ensure that Marylandrsquos labor pool is ready and able to fill the types of jobs that BRAC will yield Both the Fort Monmouth and Defense Information Systems Agency (DISA) units that are slated to move to Maryland report a high proportion of the following occupations
Engineers (specifically electronicselectrical engineers computer engineers software engineers and engineers in general)
Managers (federal contract managers logistics managers inventory managers and information technology managers)
Computer scientists Telecommunications specialists Analysts (budget analysts and managementprogram analysts) and Technical writers and editors
These occupations require a Bachelorrsquos degree mainly in the engineering and sciences fields for entry-level positions For higher grade positions graduate education andor a combination of work experience is required Key skills associated with these positions include
Complex problem solving Critical thinking Judgment and decision making Systems evaluation105
Technology design106
105 The US Department of Labor defines systems evaluation as follows Identifying measures or indicators of system performance and the actions needed to improve or correct performance relative to the goals of the system 106 Technology design is defined as Generating or adapting equipment and technology to serve user needs
56
Recommendations
Recommendation Actively recruit retired government personnel and veterans to fill vacant BRAC positions
Fort Monmouth is currently in the process of actively recruiting up to 2000 Maryland workers to fill BRAC positions by 2011 Retired government personnel and veterans (especially those with security clearances) stand out as a potential labor pool worth cultivating in order to help the bases meet recruitment needs and fill any foreseeable gaps in the immediate future
Recommendation Increase interest recruitment and retention in BRAC-related fields
Since many of the BRAC jobs will require an educational background in science technology engineering and mathematics (STEM) fields and since graduation levels in many of these fields have been flat to negative in Maryland we must generate an interest in these fields before students enter college
Maryland has developed several new or planned initiatives at the high school level that if proven successful could serve as models to be deployed elsewhere in order to ensure that Maryland is developing an adequate pipeline of BRAC workers One such initiative is the Homeland Security and Emergency Preparedness Magnet Program at Joppatowne High School in Harford County The program which was launched in the fall of 2007 consists of three curricular tracks including Criminal JusticeLaw Enforcement InformationCommunications and Technology and Homeland Security Sciences The curricular content of these tracks is often applied For example the InformationCommunications and Technology track enables students to attain certification in both Cisco and SPACESTARS professional programs While the program aims to prepare high school students for careers in the homeland security field it also is designed to create a network linking students with government and industry partners
The Science and Mathematics Academy at Aberdeen High School is another example This program funded with federal state and local funds was launched in fall 2004 after several years of planning The program originated with the Army Alliance and other professionals affiliated with Aberdeen Proving Ground (APG) A critical program component provides students with the opportunity to interact regularly with professional scientists and mathematicians Another unique feature allows high school seniors to perform original research with the guidance of a program mentor
Recommendation Identify labor and education needs for spin-off BRAC jobs
The influx of BRAC personnel and contractors to Maryland will result not only in significant construction activity but also increased demand for personal services According to a report produced by RESI in 2006 for every direct on-base job107 that comes to Maryland 196 additional spin-off jobs will be created108 Specifically Maryland will experience a rapidly growing demand for construction managers and workers day care workers and hospitality workers among others Local community colleges in Harford and Anne Arundel counties
107 Direct on-base positions include both civilian DoD positions as well as embedded private defense contractors 108 RESI of Towson University Maryland Department of Business amp Economic Development 2006
57
Recommendations
already have begun to explore program needs associated with such occupations This is an area that should be explored fully by workforce development professionals
75 There Is a Shortage of Workers with Security Clearances
The number of positions requiring security clearances as well as the level of security clearances required for existing contracts has increased dramatically since September 11 2001 This increased demand has exacerbated processing times and resulted in a frenzy of competition and ldquopoachingrdquo from the limited pool of cleared workers many of whom are concentrated within science technology engineering or mathematics (STEM) fields Not only is the security clearance process a lengthy and onerous one but it is costly as well Processing delays can cause jobs to remain unfilled for months on end and the cost of sponsorship is quite high
Recommendation Spread the word set up a pre-screening model and expand internship opportunities
The issue of security clearances is a tricky one since the process is federally driven and thus largely outside the Statersquos control Still Maryland can begin to address the security clearance issue by disseminating information An awareness campaign especially targeting high school and college students is needed to get the word out We must emphasize the multitude of job opportunities available to Marylandrsquos youth and inform them what they need to do (or rather avoid) in order to obtain positions requiring security clearances
Also key to resolving Marylandrsquos excess clearance demand is to spearhead the clearance process by targeting prospective workers while they are still students To achieve this goal a pre-screening model could be developed whereby prior to graduation college students begin the security clearance process A Towson University study performed on behalf of DBED notes however that such a model would enhance the process only if the federal government addresses process issues at the national level109 Once the model is in place matching funds could be established (between defense contractors and other organizations as well as private andor public sources) in order to sponsor students to begin the security clearance process
Expanded internship prospects represent another area of opportunity to get the word out and encourage student interest in positions that require security clearances The Johns Hopkins Universityrsquos Applied Physics Lab (APL) summer internship program is one such example APL funds and processes interim student clearances for temporary summer positions APL also funds the full clearance process for students who remain with the lab beyond the summer
109 Division of Economic and Community Outreach of Towson University Maryland Department of Business amp Economic Development 2006
58
Recommendations
76 Skilled Professionals Needed
A review of emerging and expected labor force conditions in Maryland makes it clear that there is a need for the state to grow attract and retain skilled professionals of all types (not just STEM and BRAC-related workers) There is a need to attract and retain these professionals both as workers and residents in Maryland Admittedly this particular finding overlaps with previously mentioned findings (ie the need for STEM and BRAC workers) The evidence is so compelling that the authors of this report felt that a separate recommendation is justified
Recent migration trends in Maryland bring this issue to the forefront In each of the three most recent years for which data are available (2004 through 2006) the state has recorded negative net migration In other words more people are moving out of the state than are moving in Between 2005 and 2006 for instance net domestic migration outflows exceeded 25000 people offsetting the 21000-person gain due to international migration110 In other words in a single year 25000 residents left Maryland and were replaced by 21000 immigrants
This exodus of Maryland residents has significant implications for the statersquos workforce Many of the residents leaving the state are skilled professionals who are being replaced increasingly by less educated immigrants Certainly many new immigrants to Maryland are highly educated but the amount of time during which these skilled immigrants will remain in Marylandrsquos workforce is not certain In addition many of the statersquos out-migrants continue to commute to Maryland for work How long will these workers put up with longer commutes After all the state has a notoriously lengthy average commute time of 306 minutes second only to that of New York City (309 minutes)
The statersquos rate of population growth is slowing Between 2020 and 2030 Marylandrsquos population is expected to grow by five percent compared to 20 percent growth between 1970 and 1980 Marylandrsquos population is aging as nearly one-fifth of the statersquos working age population is set to retire by 2020 The trend in migration coupled with the statersquos slowing population growth aging population and increasingly tight labor market conditions all point to the same conclusion Maryland needs to ensure that our pool of skilled professionals grows in step with the demand
110 US Census Bureau
59
Recommendations
Recommendation Launch a campaign to attract and retain skilled professionals
Nations such as India and China and even mid-Atlantic cities and states such as Philadelphia and West Virginia have made concerted efforts to not only grow and retain skilled professionals but to entice these workers to return to their home citiesstatesnations This analysis recommends that a campaign be developed to both attract and retain skilled professionals in Maryland
A public-private coalition is recommended to spearhead such a campaign which would target skilled professionals of all ages As a start the initiative could target the emerging pipeline of professional workers ndash namely college students The campaign could be two-pronged focusing on retaining Maryland college students in the statersquos workforce as well as attracting college students from other areas to Maryland After all the survey data suggest that nearly four out of every 10 Bachelorrsquos degree graduates of Maryland institutions elect to work outside the state The campaign could target additional locales with a significant presence of colleges and universities (ie Greater Boston Research Triangle Park Greater Philadelphia etc) in an effort to attract current students to Maryland after graduation Such a campaign should incorporate incentives for first-time homebuyers and affordable housing currently offered in Maryland
60
Closing
80 Closing
Marylanders live and work in a state characterized by a healthy diverse economy and low unemployment The statersquos highly educated workforce and the presence of and proximity to federal agencies and laboratories also are major advantages Marylandrsquos excellent quality of life continues to attract workers and residents to the state In order to meet the many challenges posed by a rapidly changing demographic and economic landscape Maryland must be prepared to preserve and build on these existing strengths
This report highlights a number of current and predicted labor force trends that will drive the future of Marylandrsquos labor and jobs markets These trends pose several challenges to the state that will require the attention of educators workforce development professionals the business community and residents alike Tackling these challenges through a combination of public and private initiatives will serve to enable Maryland to maintain its existing strengths and enhance the statersquos ability to compete in an ever-changing global economy Hopefully the trends and recommendations highlighted in this report will aid in this effort
61
References
References
American Community Survey US Census Bureau 2005
Altbach P R Berdahl and P Gumport American Higher Education in the Twenty-First Century 2nd ed Johns Hopkins University Press April 2005
Americarsquos Career InfoNet httpwwwacinetorg
Associated Press State amp Local Wire ldquoLimit on Seasonal Workers Vexes Employersrdquo February 28 2005 Lexis-Nexis
Baltimore Business Journal ldquoLift Cap on Temporary Visa Programrdquo American City Business Journals Inc July 30 2004
Baltimore Sun ldquoConstellation Energy Files Partial Plan for Reactorrdquo Bloomberg News July 31 2007
Barlow ED ldquoStorm Warnings and What You Can Do To Preparerdquo 2006 Governorrsquos Workforce Conference Maryland May 8 2006
Brugger Robert J Maryland A Middle Temperament 1634-1980 Johns Hopkins University Press 1988
Buhler Patricia M ldquoThe New Workforce Five Sweeping Trends That Will Shape Your Companyrsquos Futurerdquo AMA Business Brief wwwamanetorg
Bureau of Labor Statistics ldquoHigh-paying Occupations with Many Openings Projected 2002shy12rdquo Occupational Outlook Quarterly Spring 2004 httpwwwblsgovopubooq2004springoochartpdf
Campbell Doug ldquoThe Illegal Immigrant Effectrdquo Region Focus 2006
Campbell Paul R ldquoPopulation Projections for States by Age Sex Race and Hispanic Origin 1995-2025rdquo US Census Bureau Population Division 1996
Capps Randy Michael Fix Jeffrey Passel Jason Oust and Dan Perez-Lopez ldquoImmigrant Families and Workers A Profile of the Low Wage Immigrant Workforcerdquo Urban Institute November 2003
Carroll Nick and C Taeuber ldquoA Profile of Older Workers in Marylandrdquo US Department of Commerce Economics and Statistics Administration US Census Bureau August 2004
Conte and Carr ldquoOutline of the US Economyrdquo US Department of State httpusinfostategov
62
References
Cox Michael R Alm and N Holmes ldquoWhere the Jobs Arerdquo The New York Times May 13 2004 late edition ProQuest Information and Learning Company httpproquestumicompqdwebdid=636777401ampsid=5ampFmt=3ampclientld=41150ampRQT=309amp VName=PQD
De Long David W ldquoConfronting the Chemical Industry Brain Drain A Strategic Framework for Organizational Knowledge Retentionrdquo Accenture-Institute for Strategic Change April 2002
Division of Economic and Community Outreach ldquoBRAC Government and Corporate Need for Workers with Security Clearancesrdquo Towson University June 2006
ldquoDomestic Net Migration in the United States 2000 to 2004rdquo US Census Bureau April 2006
Drucker Peter ldquoThe Future Has Already Happenedrdquo Futurist 32 no 8 (1998) 16 MAS Ultra-School Edition
Duderstadt James J ldquoLeading Higher Education in an Era of Rapid Changerdquo July 2001
ElBoghdady Dina ldquoDISA Fights Turnover with Telecommutingrdquo The Washington Post January 25 2006
Fahrenthold David A ldquoMaryland Crab Industry Angles for Help Seasonal Worker Cap Job Abundance Leave Seafood Processors Short-Staffedrdquo The Washington Post February 28 2005 Lexis-Nexis
Federal Reserve Bank of Dallas ldquo2003 Annual Report The Evolution of Workrdquo wwwdallasfedorg
Franz Maximilian ldquoCommentary The Chesapeake Traditionrdquo The Daily Record May 7 2002 Lexis-Nexis
Gereffi Gary and V Wadhwa ldquoFraming the Engineering Outsourcing Debate Placing the United States on a Level Playing Field with China and Indiardquo Master of Engineering Management Program Duke University December 2005
Goldstein Mark ldquoMarylandrsquos Changing Demographicsrdquo Presentation on behalf of the Maryland Department of Planning June 2006
Governorrsquos Workforce Investment Board 2003 ldquoGovernorrsquos Healthcare Workforce Summit Monographrdquo Maryland Department of Labor Licensing amp Regulation
Governorrsquos Workforce Investment Board 2006 ldquoMaryland Aerospace Industry Monographrdquo Maryland Department of Labor Licensing amp Regulation
63
References
Governorrsquos Workforce Investment Board 2007 ldquoMaryland Hospitality amp Tourism Industry Monographrdquo Maryland Department of Labor Licensing amp Regulation
H1Base ldquoH1-B Visa Information amp Service Centerrdquo httph1basecompageaspid=312
Hankin Harriet The New Workforce New York AMACOM 2005
Heller Barbara R ldquoMarylandrsquos Nursing Shortage A Workforce Crisisrdquo University of Maryland March 2003
Hewitt Associates LLC ldquoWorkforce Planning in the 21st Century - Back to the Futurerdquo International Report October 2003
Huether David ldquoThe Case of the Missing Jobsrdquo National Association of Manufacturers httpwwwnamorgs_namdoc1aspCID=201416ampDID=236655
Karoly Lynn A and Constantijn W A Panis The 21st Century at Work Forces Shaping Lifelong Learning Trends A Profile of Continuing Higher Education 7th ed University Continuing Education Association April 2002
Kaushal Neerja and Michael Fix ldquoThe Contributions of High-Skilled Immigrantsrdquo Migration Policy Institute July 2006
Keller Michael J ldquoA Study of the Capacity of Marylandrsquos Teacher Preparation Programsrdquo Maryland Higher Education Commission March 2006
Kobell Rona and C Guy ldquoWork-visa Limit Snags Shore Employers Business Relying on Immigrant Labor Might Not Have Anyone to Do the Workrdquo The Sun January 24 2005 final edition ProQuest
Lasater Beth and Barbara Elliot ldquoProfiles of the Adult Education Target Populationrdquo Center for the Research in Education RTI International December 2005 httpwwwedgovaboutofficeslistovaepiAdultEdcensus1pdf
Lorefice Alejandro A ldquoJust in Time Manufacturing Introduction and Major Componentsrdquo New York 1998
Lyons Michael and Pearson Ian Business 2010 Mapping the New Commercial Landscape London 2003
Maryland Board of Nursing httpwwwmbonorgmainphp
Maryland Career and Workforce Information httpdllrstatemdus
Maryland Department of Business amp Economic Development Economic Pulse January-February 2007
64
References
Maryland Department of Business amp Economic Development ldquoLargest Employers in Marylandrdquo March 2006
Maryland Department of Labor Licensing amp Regulation ldquoMarylandrsquos Demand-Driven Two-Year Workforce Investment Planrdquo July 2005-June 2007
Maryland Department of Labor Licensing amp Regulation Office of Workforce Information and Performance and Office of Labor Statistics March 2007
Maryland Governorrsquos Workforce Investment Board ldquoGovernorrsquos Healthcare Workforce Summit Monographrdquo August 2003 httpwwwmdworkforcecomlibpdfhcmonographpdf
Maryland Higher Education Commission ldquoEnrollment Projections 2007-2016 Maryland Public Colleges and Universitiesrdquo June 2007
Maryland Higher Education Commission ldquoTrends in Degrees Awarded at Maryland Higher Education Institutionsrdquo March 2005
Maryland Higher Education Commission ldquoTrends in Enrollment by Program Maryland Higher Education Institutionsrdquo April 2005
Maryland Higher Education Commission ldquo2004 Maryland State Plan for Postsecondary Educationrdquo December 2004
Maryland Higher Education Commission 2006 Trend Book 1 3 19-24 29-32 49-54 78-84 91-93 August 2006
Maryland Higher Education Commission 2005 Data Book 1 August 2004
Maryland Higher Education Commission 2006 Data Book 1 August 2005
Maryland Higher Education Commission 2007 Data Book 1 7 14-16 38 August 2006
Maryland State Department of Education ldquoStepping Up to the Future Adult Literacy Challenges at Work at Home and in the Maryland Communityrdquo December 2005
Maryland Independent College and University Association Connection ldquoLearn About the Five Factsrdquo httpwwwmicuaconnectioncommythsasp
Maryland Independent College and University Association ldquoFast Facts About MICUA 2007 ndash Enrollment Countsrdquo 2002 httpwwwmicuaorgffenrollmentcountspdf
McGee Marianne Kolbasuk and Alice LaPlante ldquoTalent Search The Myths Facts and Emotions That Will Keep the H1-B Visa Issue From Going Awayrdquo InformationWeek July 23 2007 Lexis Nexis
65
References
Mittuch Eugene W Averting a Pending Department of Defense Civilian Personnel Crisis The Need for a Corporate Recruiting Strategy May 2002 httpwwwstormingmediaus898946A894604html
National Academy of Science ldquoRising Above the Gathering Storm Energizing and Employing America for a Brighter Economic Futurerdquo 2006
National Center on Education and the Economy ldquoTough Choices Tough Times The Report of the New Commission on the Skills of the American Workforcerdquo 2007 httpwwwskillscommissionorgpdfexec_sumToughChoices_EXECSUMpdf
National Science Foundation 2003 httpwwwnsfgov
Nuclear Energy Institute ldquoNuclear Energy Industry Initiatives Target Looming Shortage of Skilled Workersrdquo January 2007 wwwneiorg
OECD ldquoWhat Schools for the Futurerdquo October 2001
Pew Hispanic Center ldquoFact Sheet The Labor Force Status of Short Term Unauthorized Workersrdquo April 2006
Pilato Virginia ldquoMSDE and The Impact of Different Models of Teacher Preparation on Teacher Retention A Progress Reportrdquo presented by Dr Tom Proffitt and Ms Karen Schafer Towson University
Pisarski Alan ldquoCommunity in Americardquo Transportation Research Board 2006
RAND Corporation ldquoThe Future Workforce and Workplace in the United Statesrdquo 2004
Reeves Scott ldquoAn Aging Workforcersquos Effect On US Employersrdquo Forbes September 29 2005 wwwForbescom
RESI study performed on behalf of the Maryland Department of Business amp Economic Development Jobs and Household Allocations and Expected Tax Revenues
Snyder Thomas D ldquoDigest of Education Statistics 2005rdquo National Center for Education Statistics June 2006 httpncesedgovprogramsdigestd05ch_3asp
Sparshott Jeffrey ldquoBay Firms Depend on Foreign Workersrdquo The Washington Times June 1 2005 Lexis-Nexis
States News Service ldquoMikulski Scores Senate Victory for Americarsquos Small Businessesrdquo April 19 2005 Lexis Nexis
66
References
The Conference Board Partnership for 21st Century Skills Corporate Voices for Working Families and Society for Human Resource Management ldquoAre They Really Ready To Workrdquo 2006 http21stcenturyskillsorgdocumentsFINAL_REPORT_PDF09-29-06pdf
Therrien Roger C Bridges R Meyerhoff and J Baker ldquoConnecticut Workforce Demands and the Implications for Educationrdquo Connecticut Department of Labor July 2003
Three Rivers Workforce Investment Board ldquoManaging the Changing Workforce in Southwestern Pennsylvaniardquo Executive Summary June 2006 httpwwwtrwiborgreportsagingexecsummarypdf
Towards Knowledge Societies UNESCO Publishing 2005
UMD ldquoProtecting Marylandrsquos Competitive Edgerdquo An Action Summit Hosted by the University of Maryland April 2006 httpwwwcompetitive-edgeumdedusnapshothtml
US Department of Education ldquoState Nonfiscal Survey of Public ElementarySecondary Educationrdquo National Center for Education Statistics November 2005 httpncesedgovprogramsprojectionstablestable_25CTaspreferrer=tablenotes
VisaPro ldquoFrequently Asked Questionsrdquo httpfaqvisaprocomH2B-Visa-FAQ3aspQ1
67
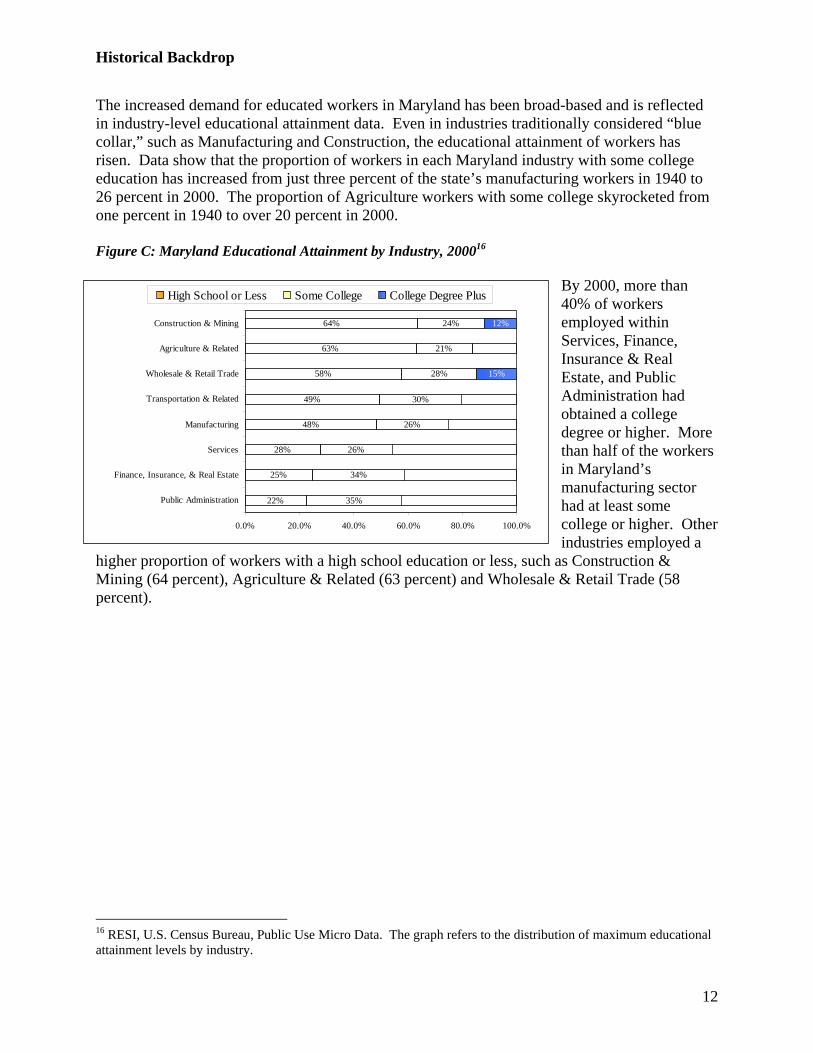
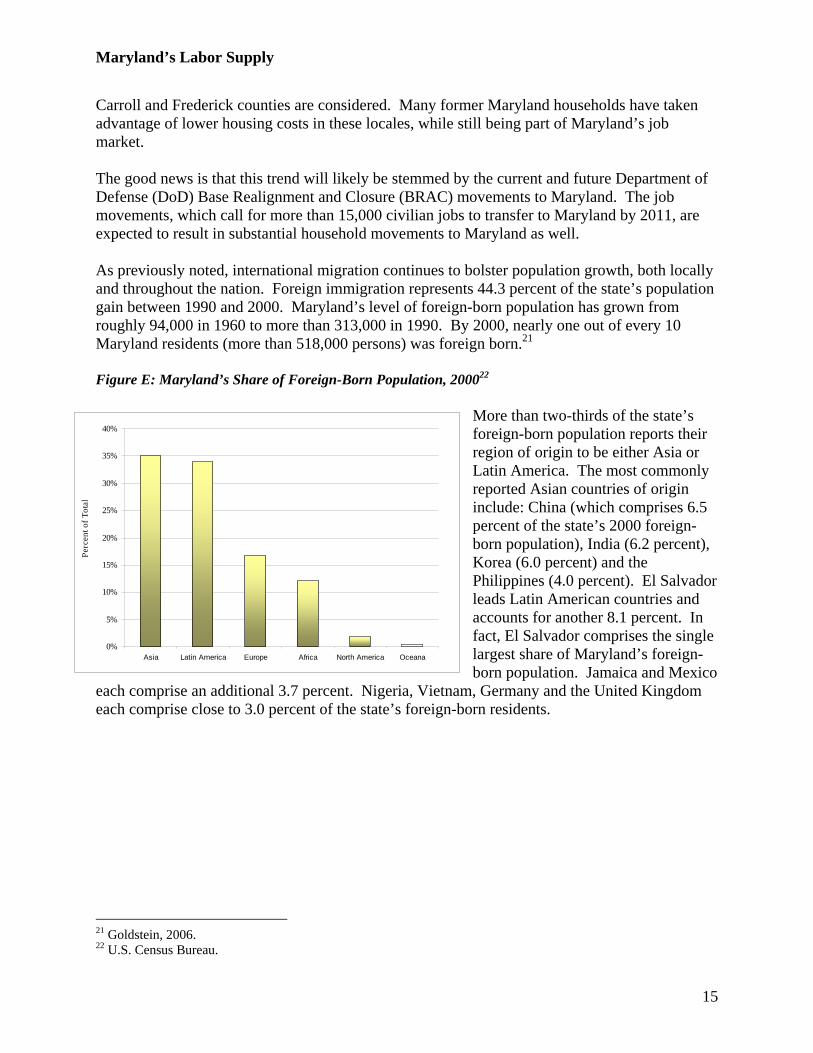
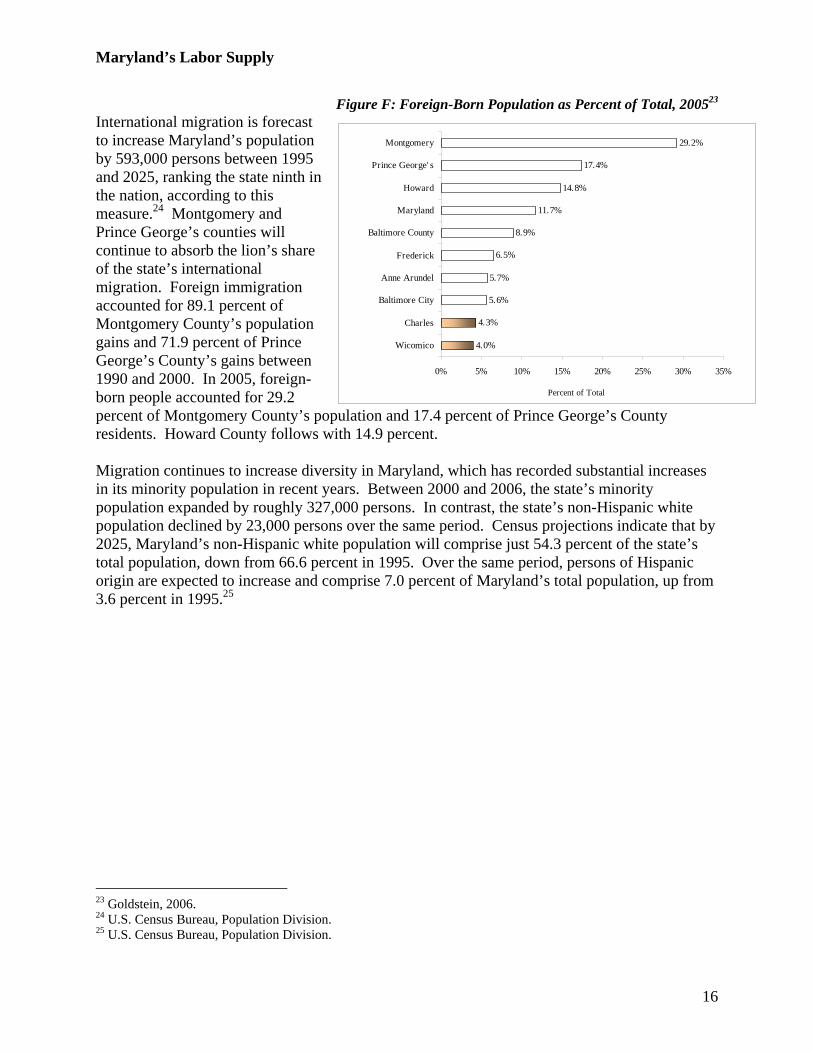
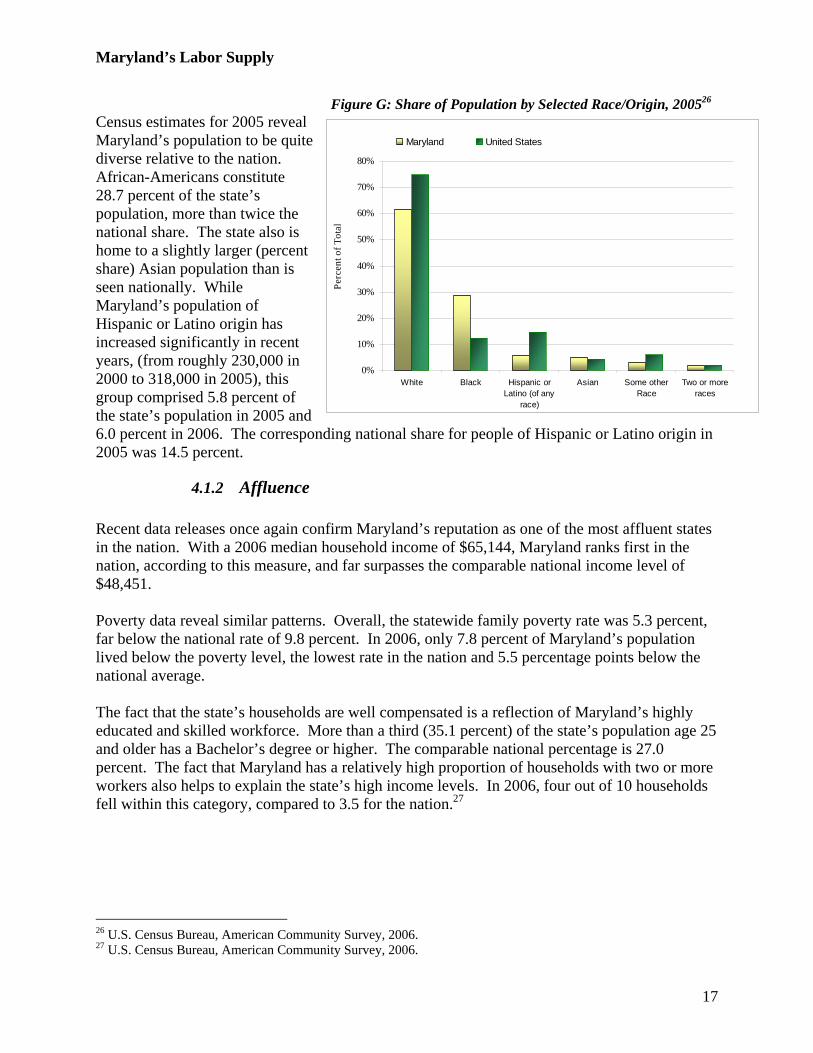
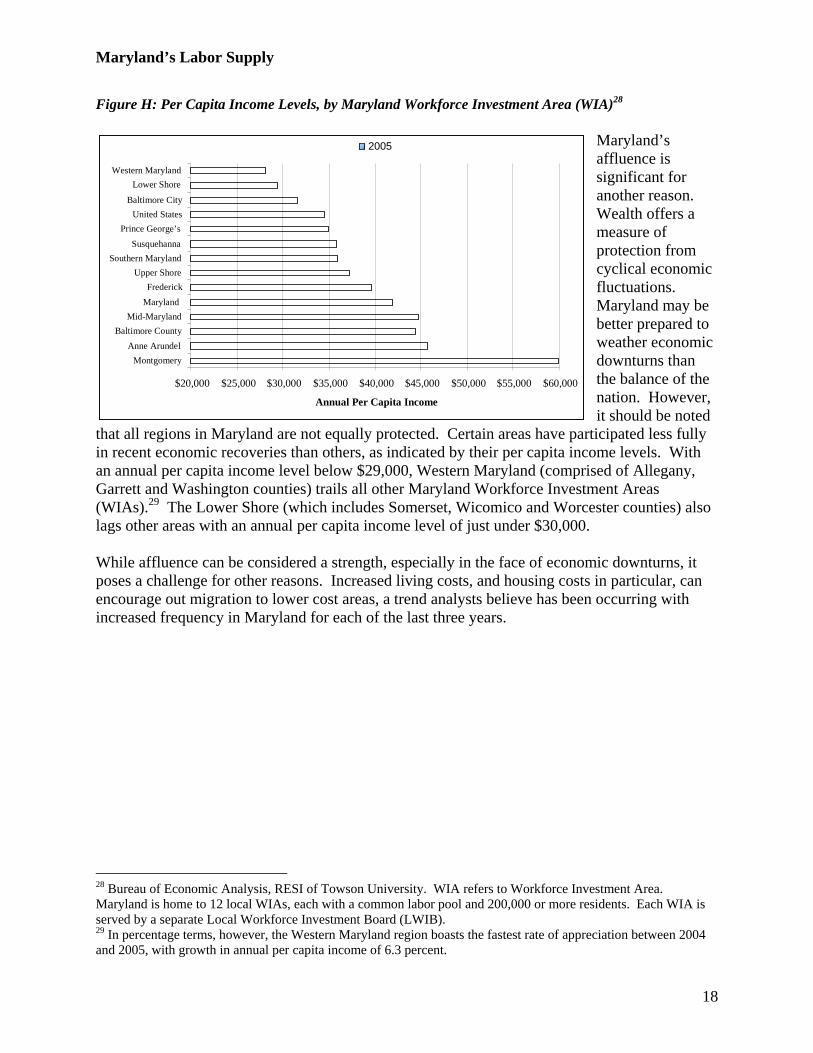
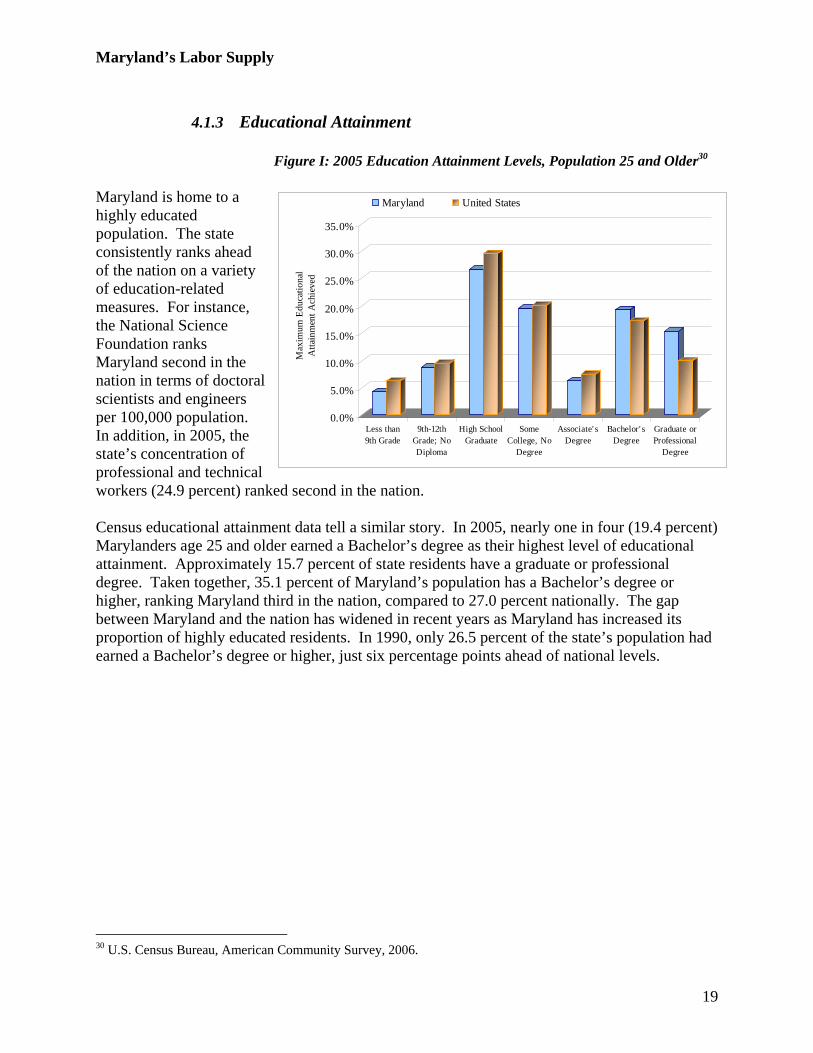
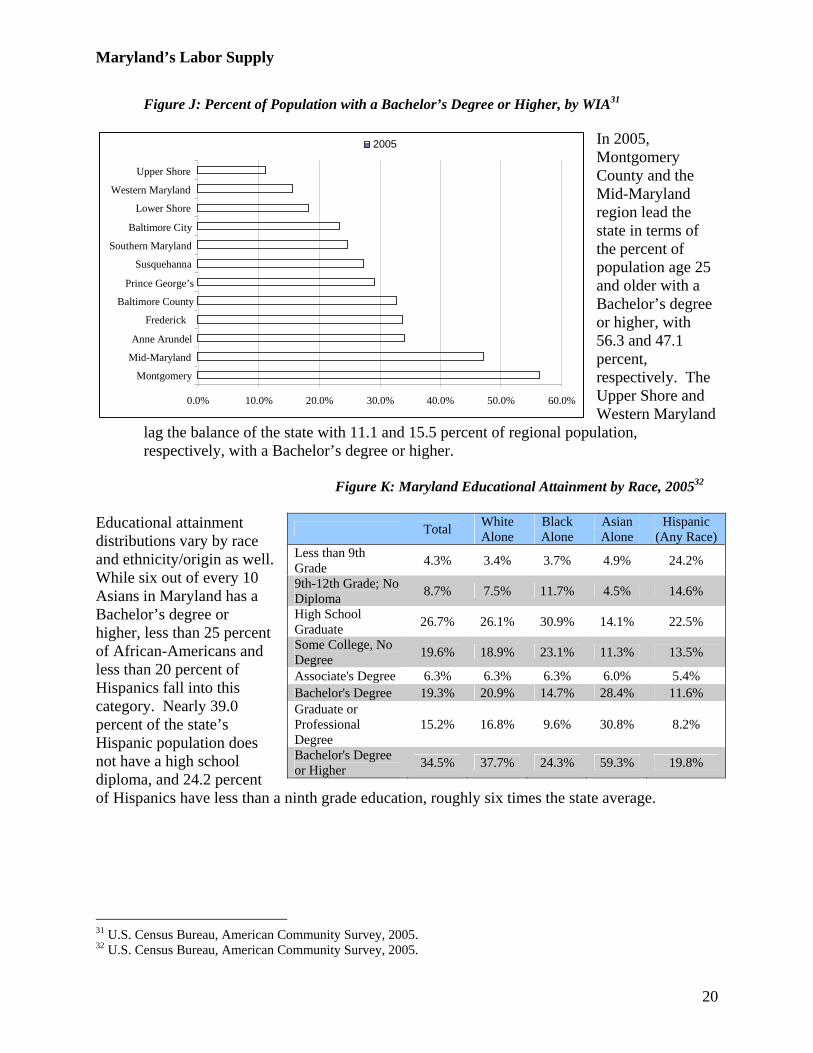
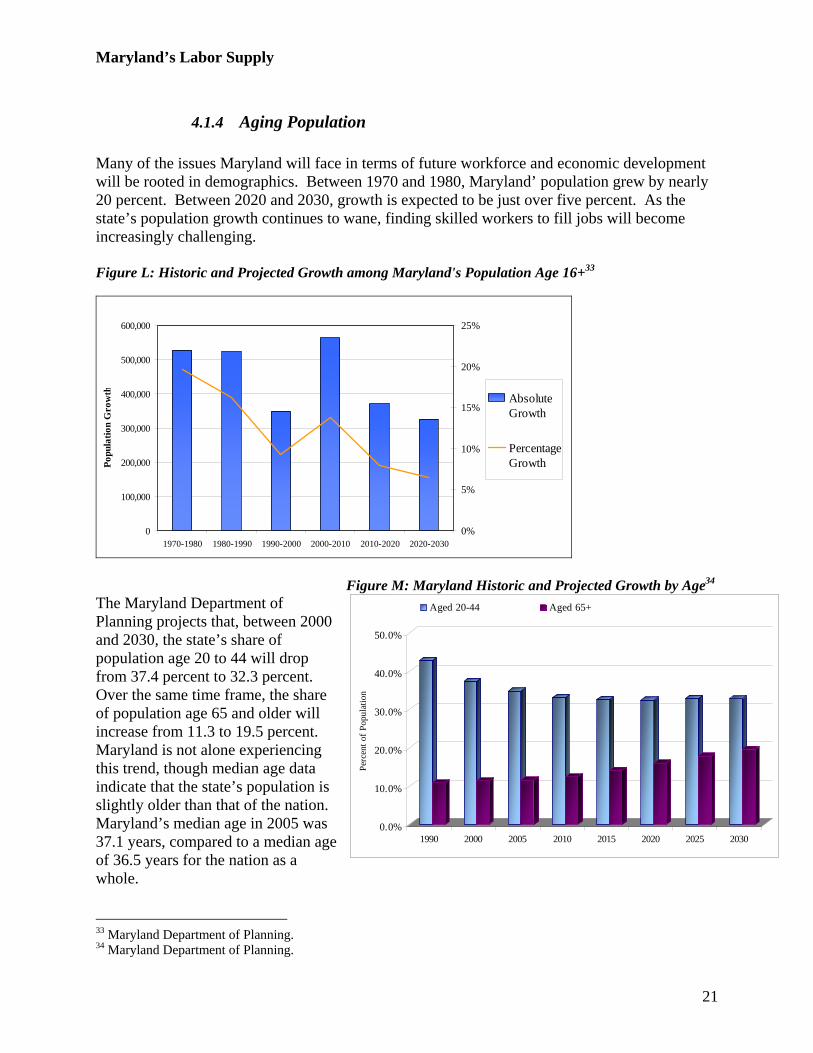
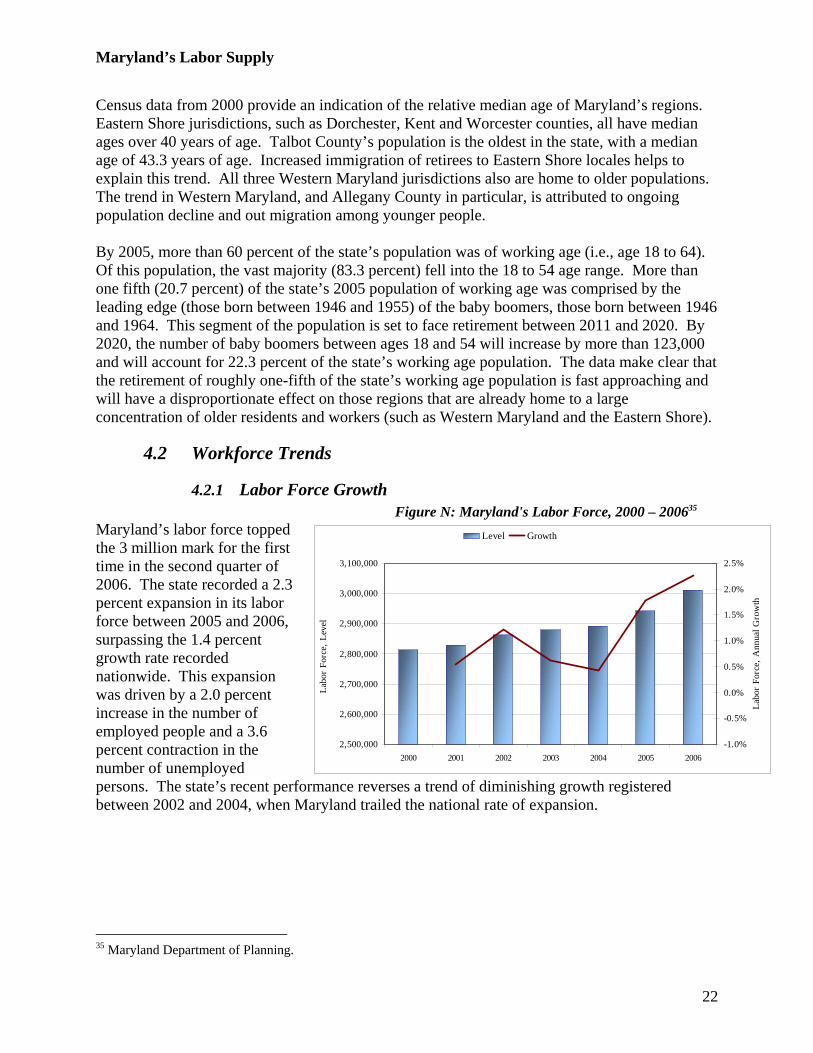
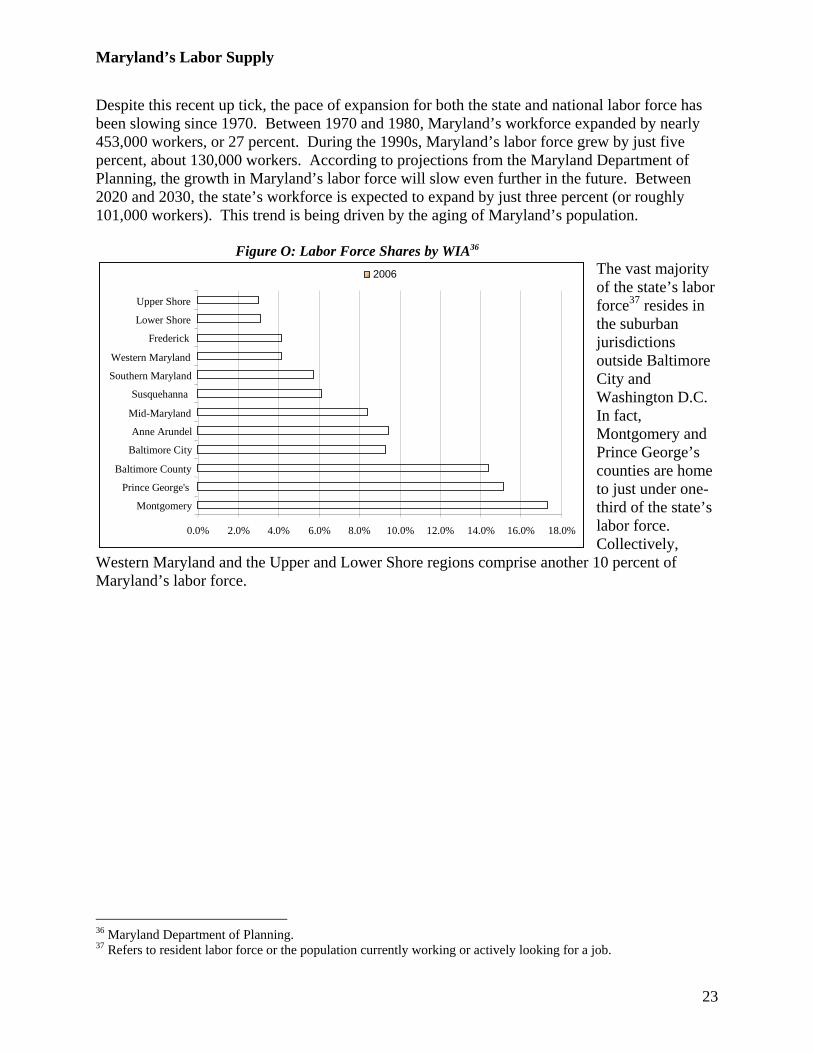
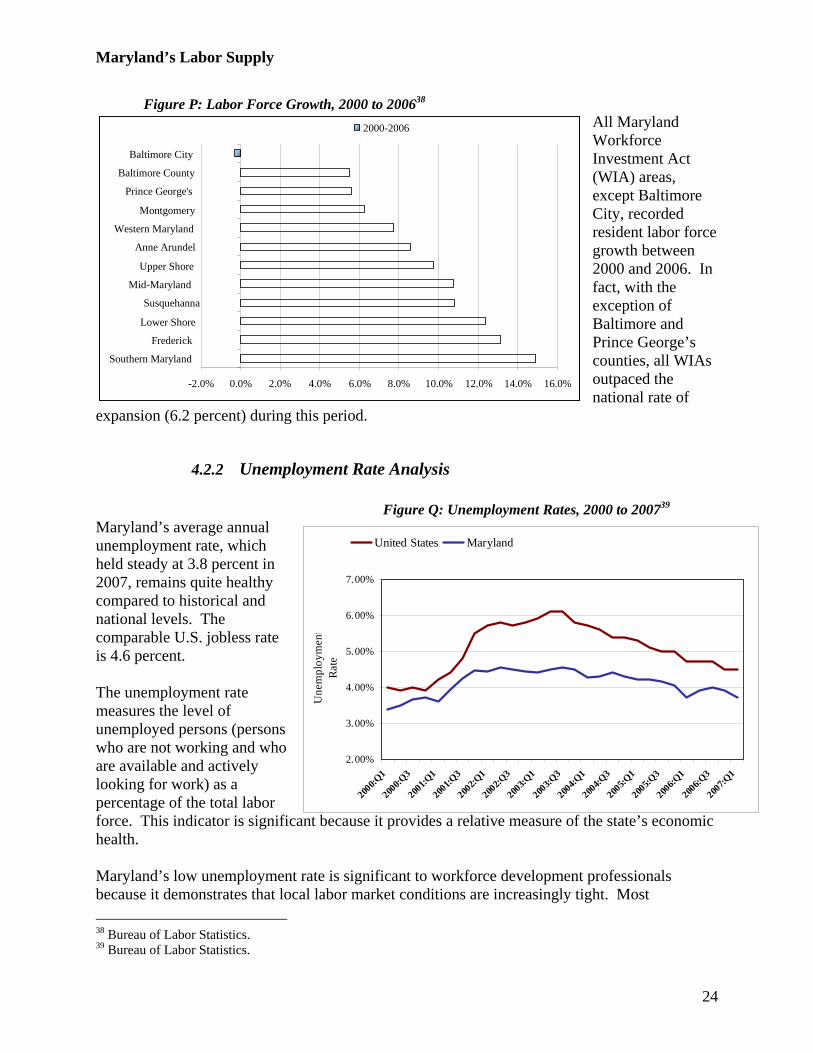
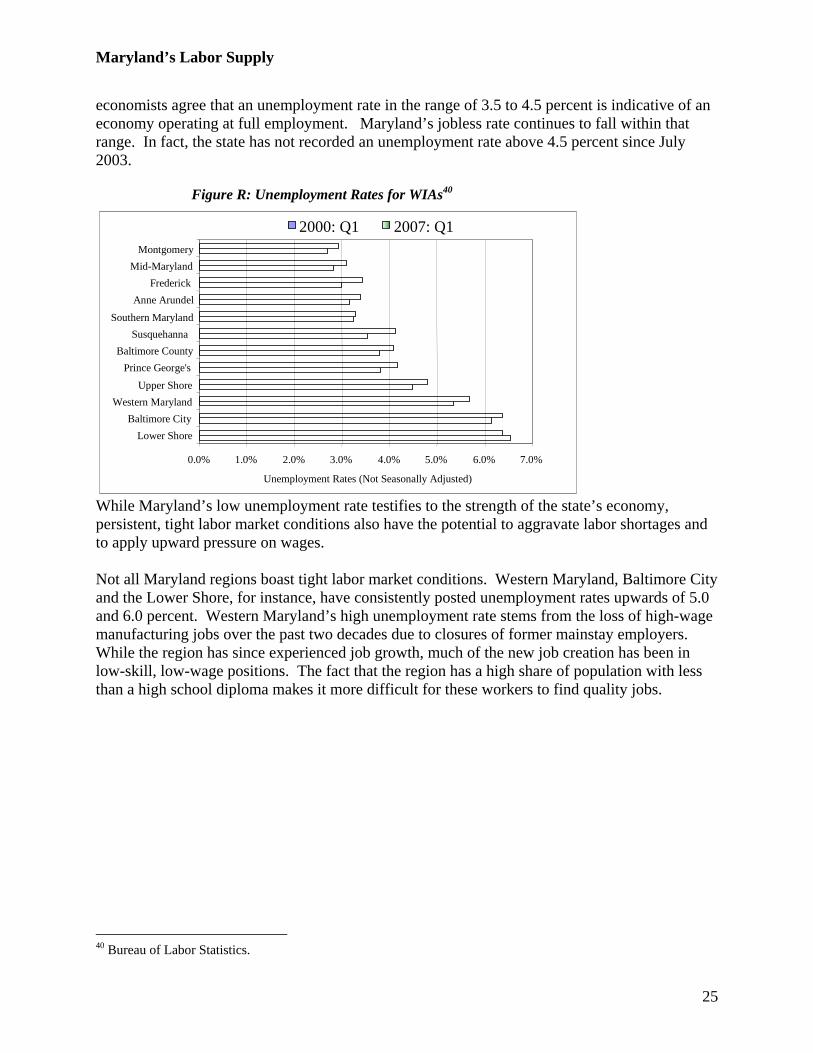
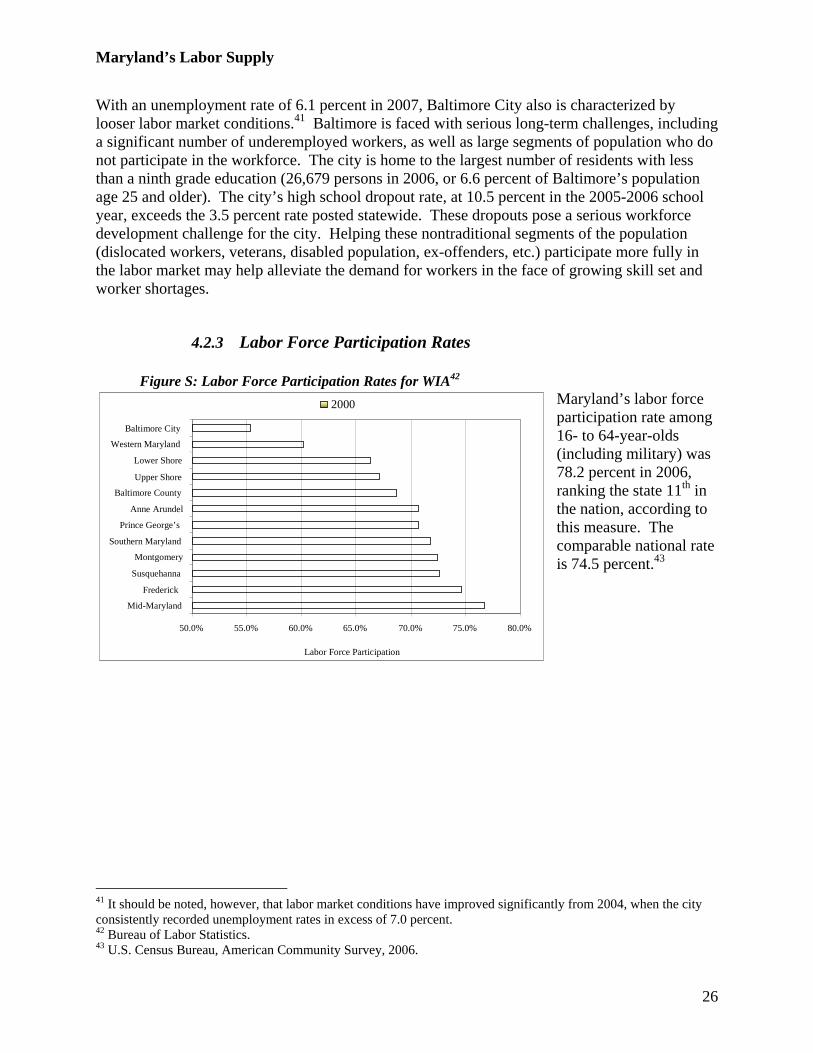
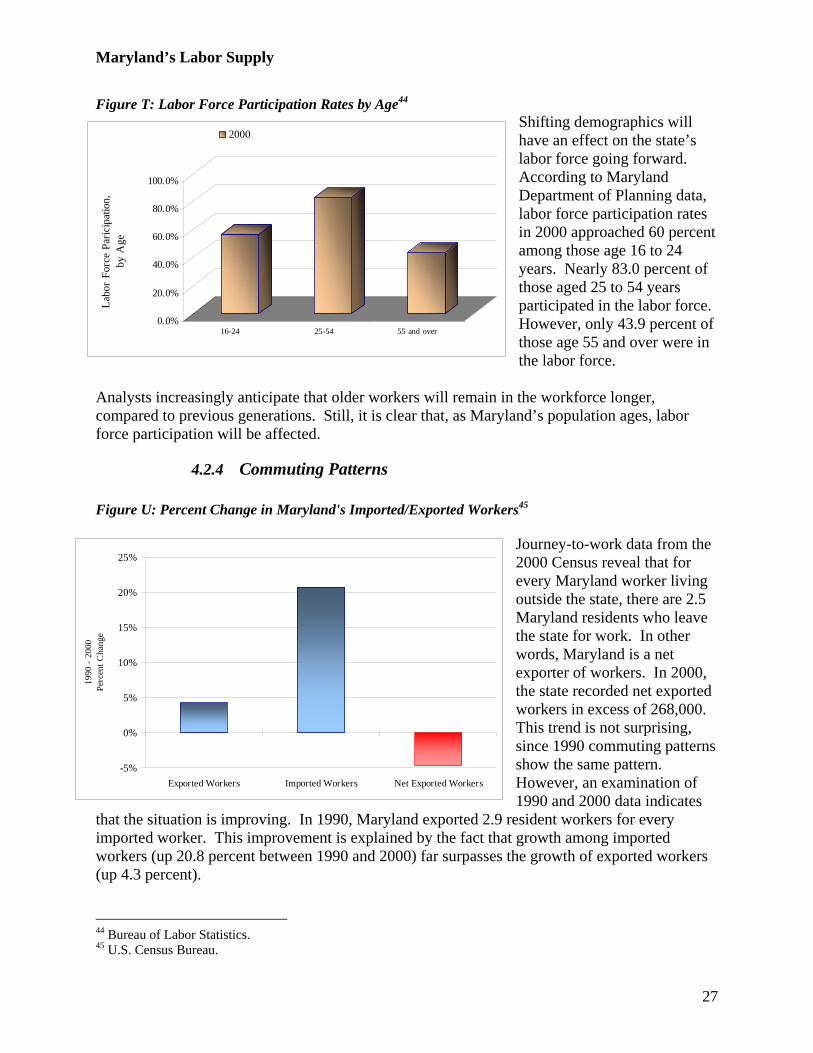
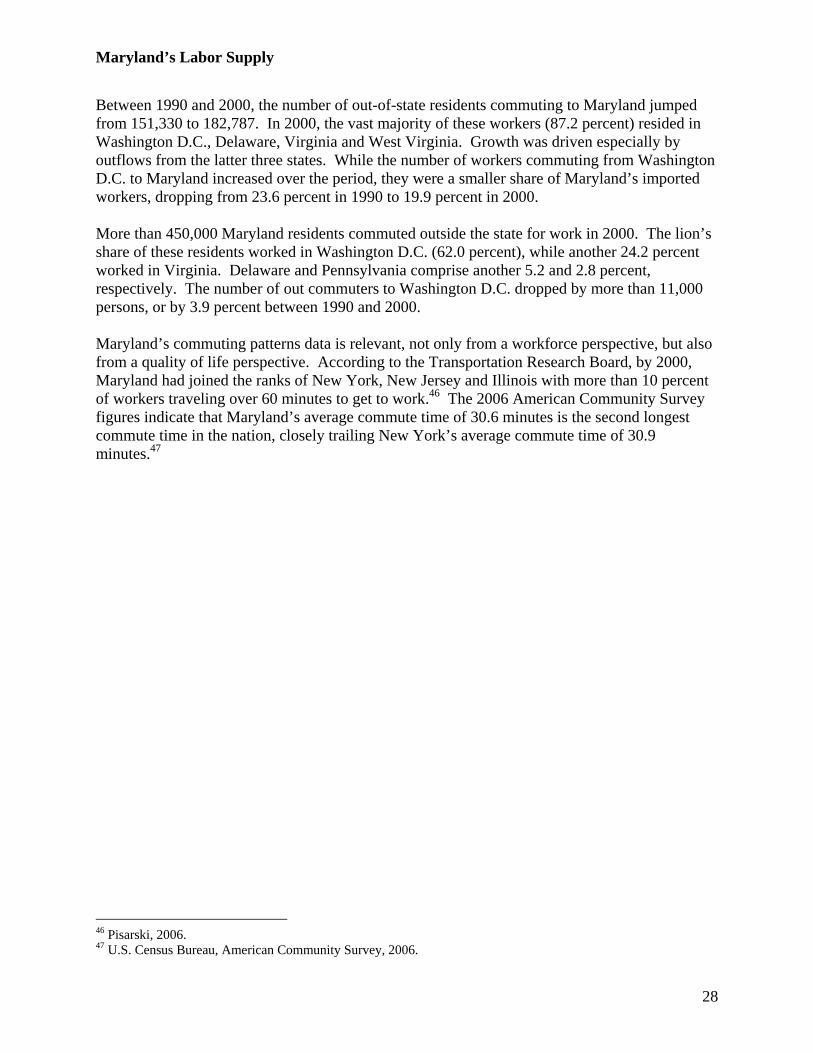
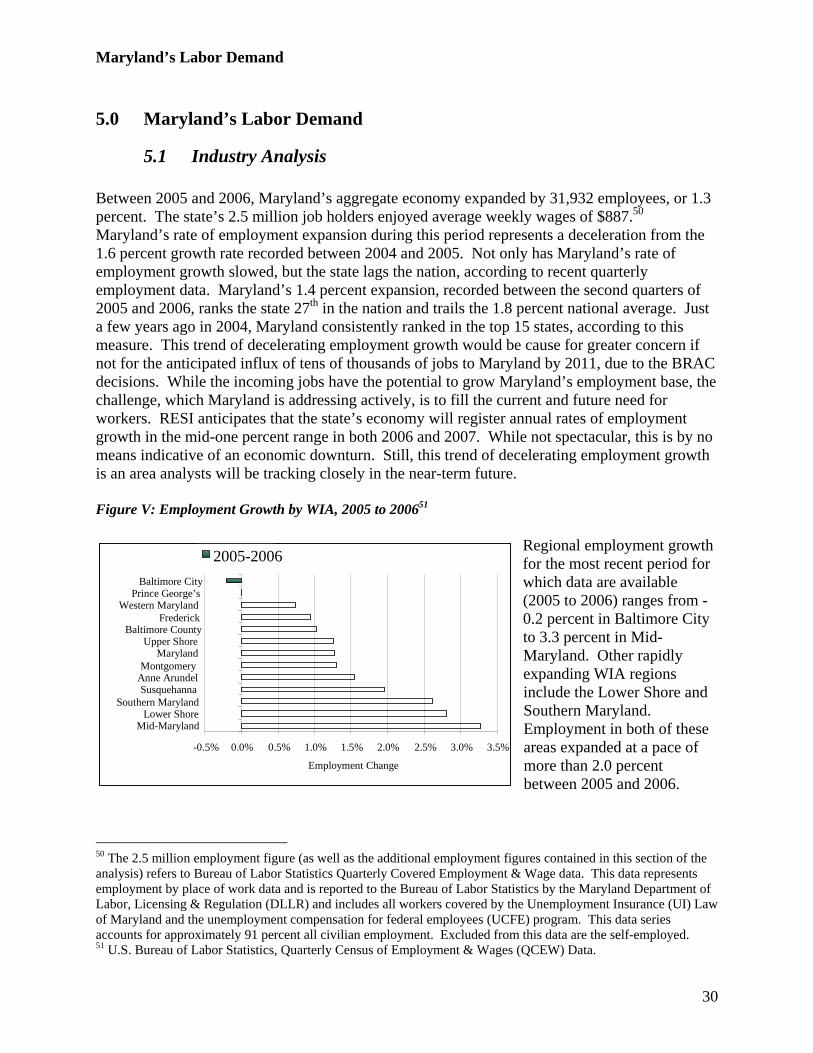
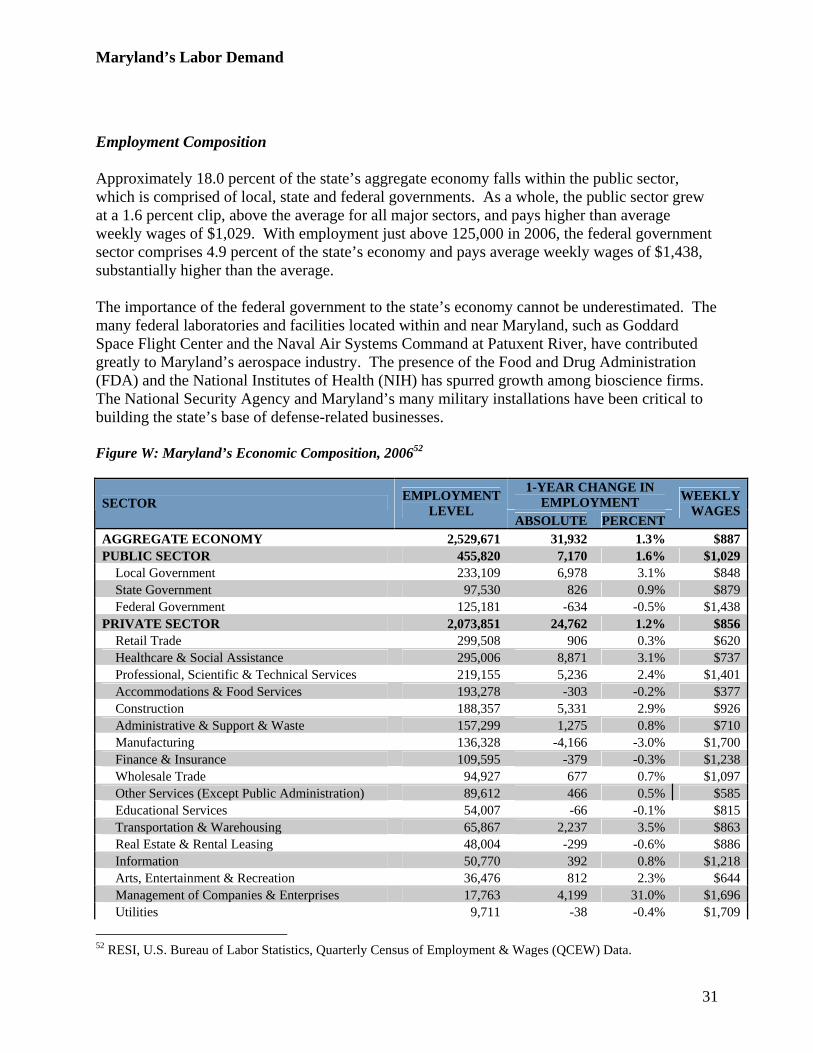
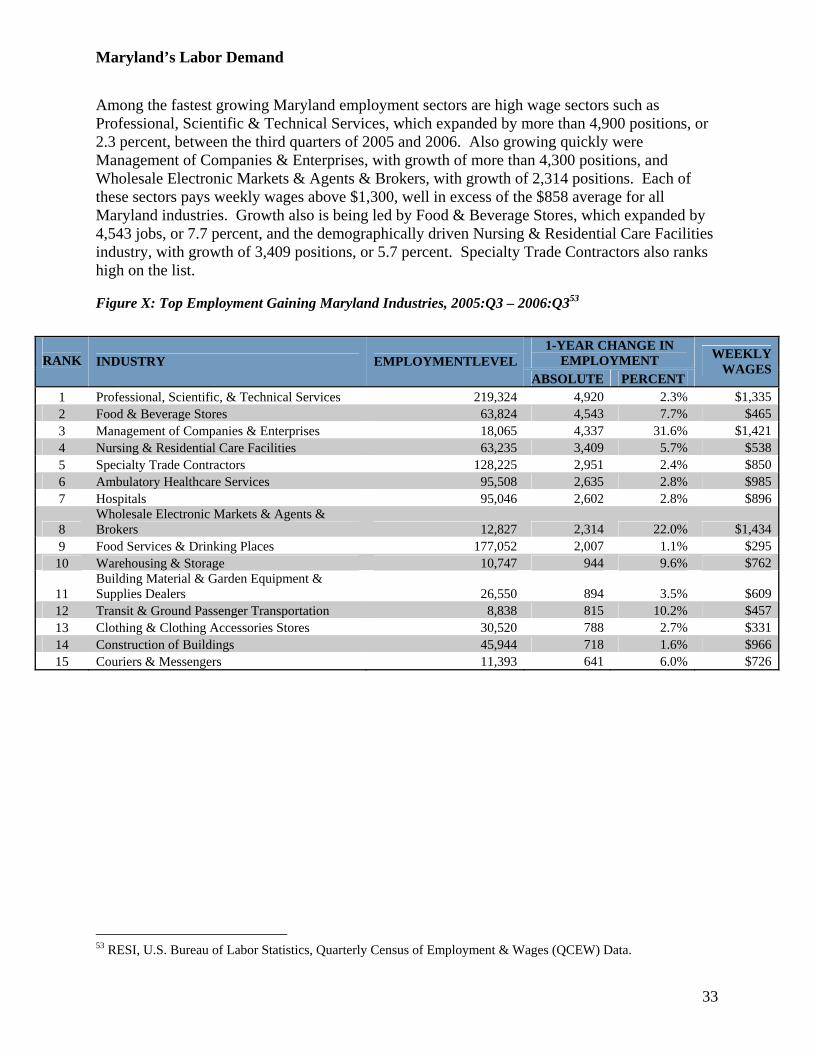
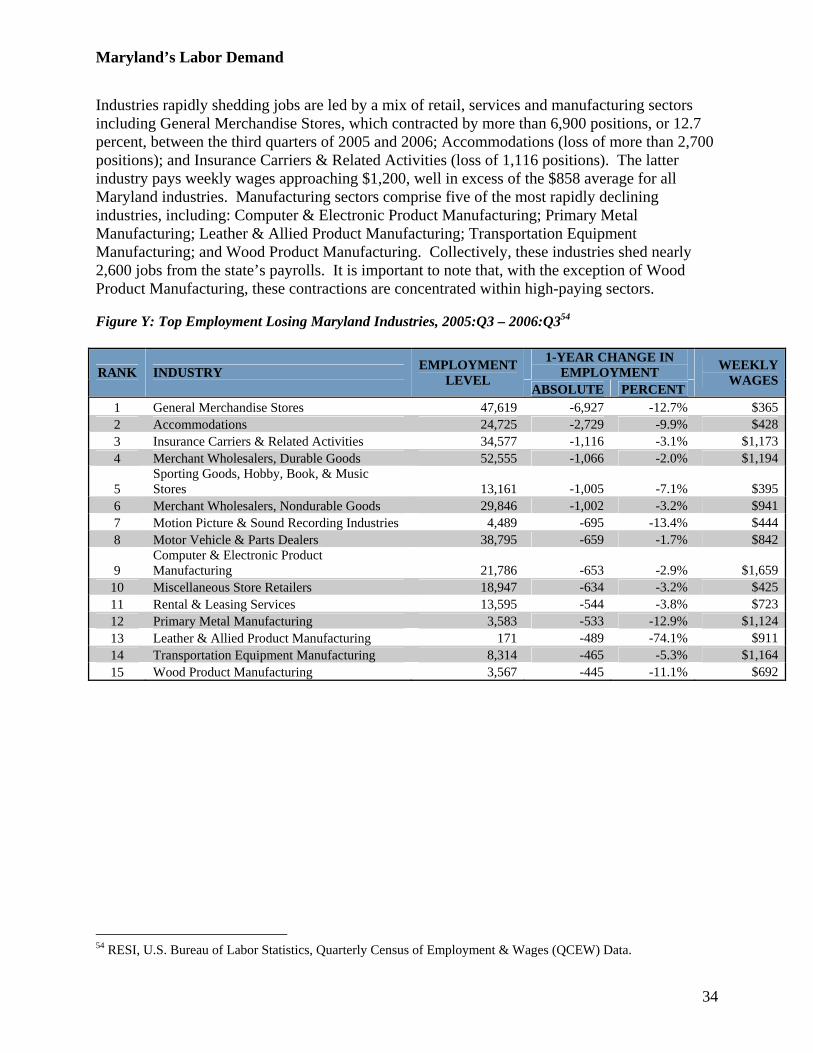

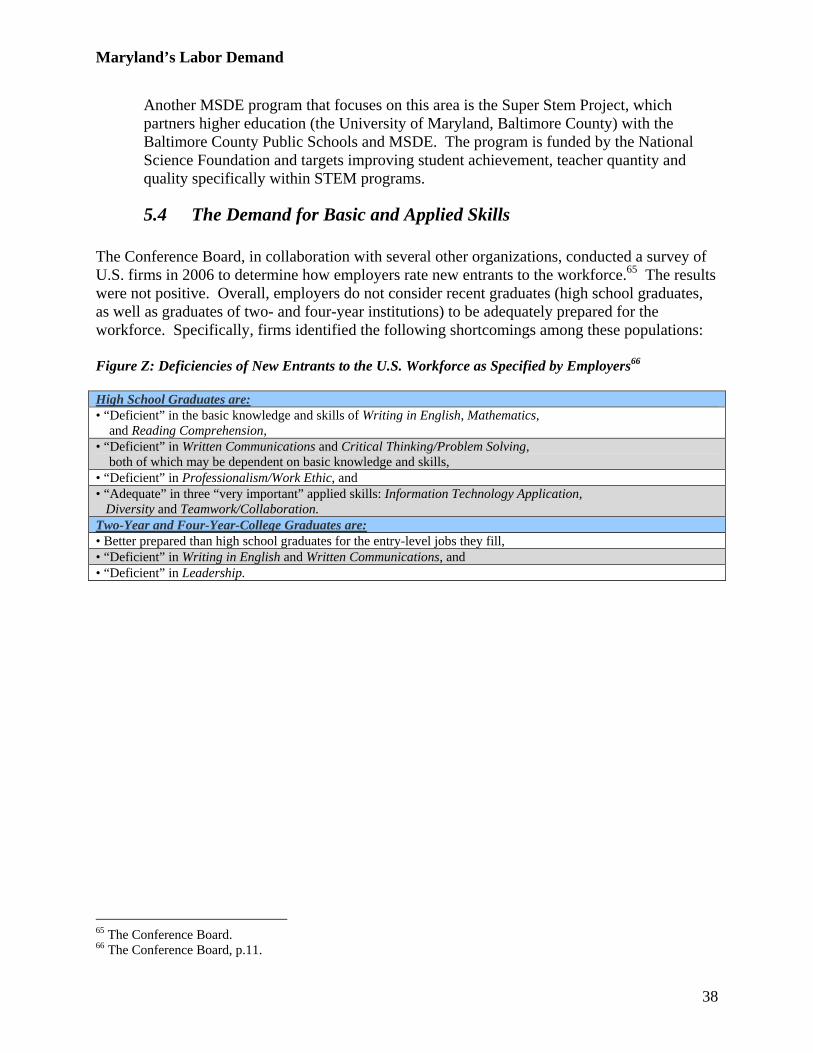
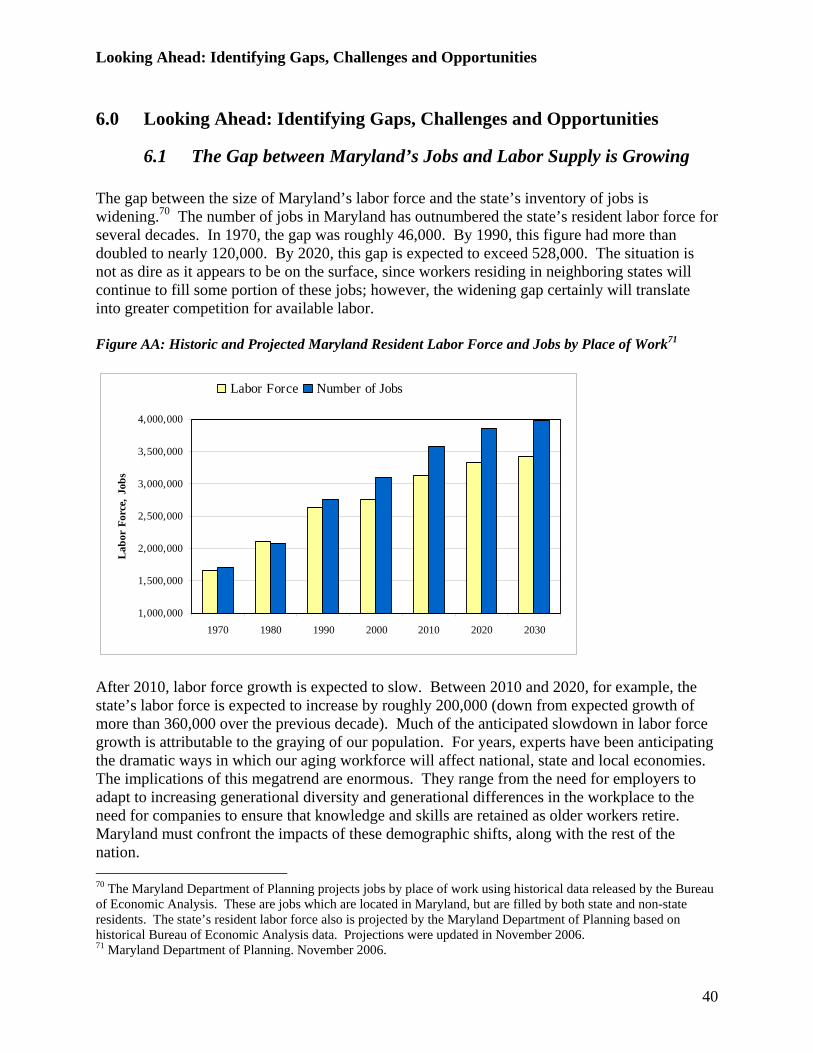
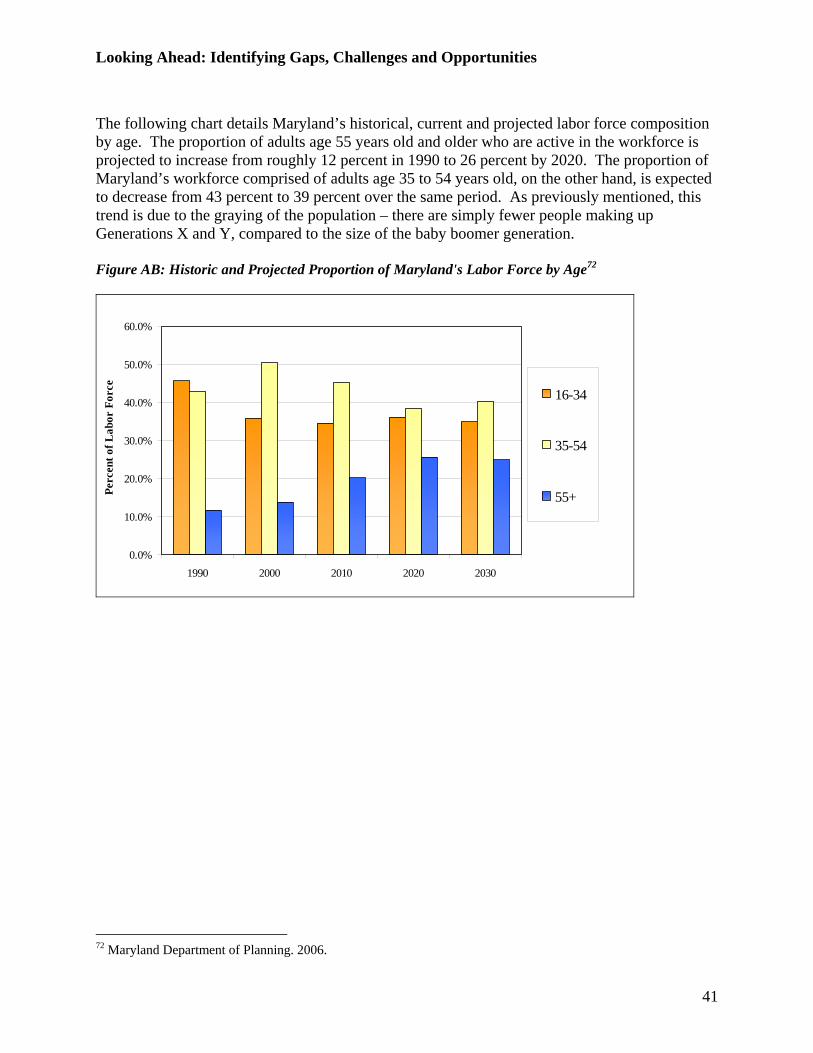
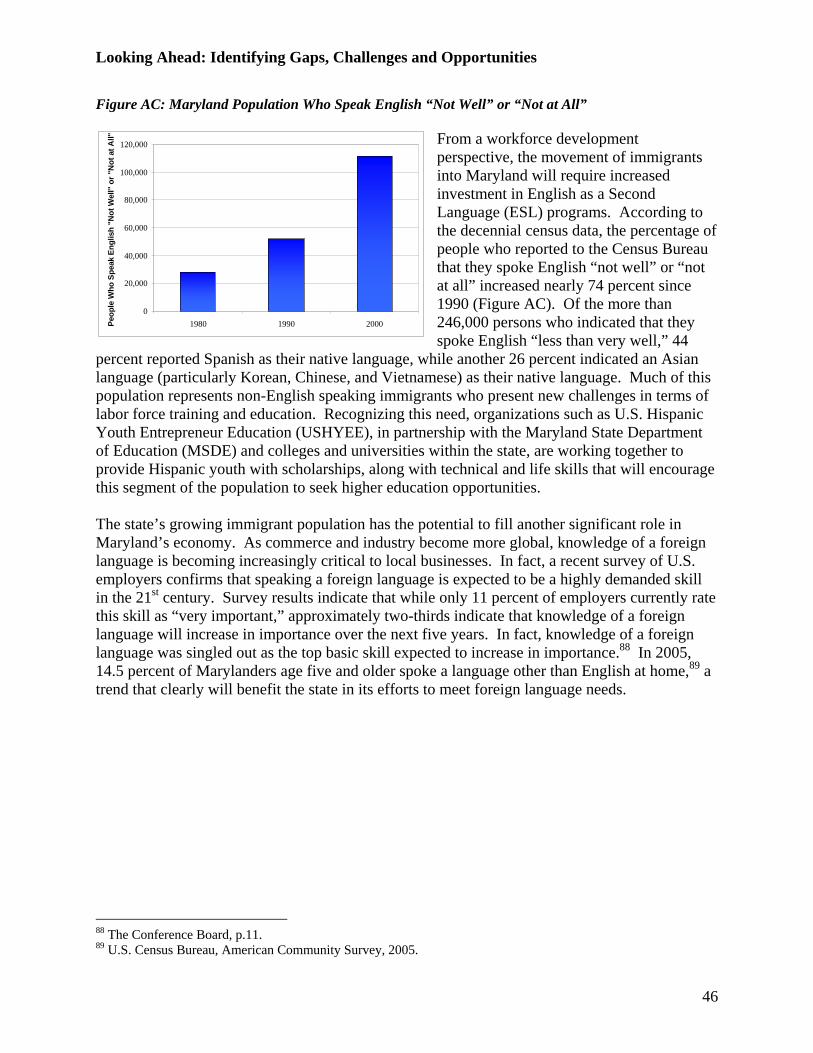


Related Documents