Mary Buchanan, Project Manager [email protected] New Haven, Connecticut DATAHAVEN Data for Community Action Income Inequality and Change in Connecticut’s neighborhoods: Brought to you by DataHaven and NCDB

Mary Buchanan, Project Manager [email protected] New Haven, Connecticut DATAHAVEN Data for Community Action Income Inequality and Change in Connecticut’s.
Dec 24, 2015
Welcome message from author
This document is posted to help you gain knowledge. Please leave a comment to let me know what you think about it! Share it to your friends and learn new things together.
Transcript

Mary Buchanan, Project Manager [email protected] New Haven, Connecticut
DATAHAVENData for Community Action
Income Inequality and Change in Connecticut’s neighborhoods:
Brought to you by DataHaven and NCDB

Neighborhood Segregation – Summary
• High number of neighborhoods that are both economically segregated areas AND racially segregated
• 2x more affluent & segregated neighborhoods than poor & segregated neighborhoods in CT
• Racially and economically segregated neighborhoods more highly concentrated in CT than in most other large metro areas
DATAHAVENData for Community Action

Neighborhood Segregation - Methodology
Census tracts defined as:• Racially Concentrated Area of Affluence (RCAA)
– 90% or more of population is white– Median household income is at least 4 times federal poverty line
(FPL) (adjusted for cost of living)
• Racially Concentrated Area of Poverty (RCAP):– Less than 50% of population is white– 40% or more of population has a household income below FPL
• Near-Racially Concentrated Area of Poverty (Near RCAP):– Less than 50% of population is white– 20% or more of population has a household income below FPL
• Based on methodology from University of Minnesota
DATAHAVENData for Community Action

Neighborhood Segregation – Findings
• 13% of CT population lives in segregated neighborhood– 3% poor, majority non-white vs. 10% wealthy, majority white
• Affluent, white neighborhood household income = $120,008/yr~ 5.5x more than poor, non-white neighborhood income ~1.75x more than state average
DATAHAVENData for Community Action

Neighborhood Segregation – Findings
DATAHAVENData for Community Action
• RCAPs in urban centers• RCAAs in peripheral
suburban towns• Rural areas devoid of
segregated areas• RCAAs and RCAPs rarely
border each other• Fairfield County 7x more
wealthy neighborhoods than poor ones
Neighborhood Segregation – Findings
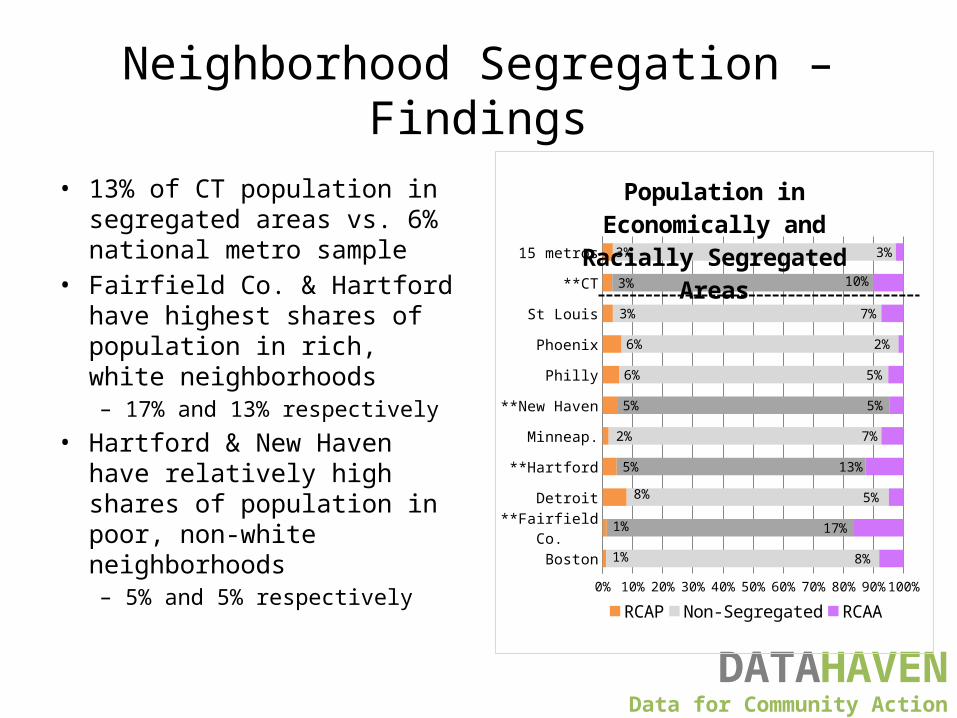
• 13% of CT population in segregated areas vs. 6% national metro sample
• Fairfield Co. & Hartford have highest shares of population in rich, white neighborhoods– 17% and 13% respectively
• Hartford & New Haven have relatively high shares of population in poor, non-white neighborhoods– 5% and 5% respectively
DATAHAVENData for Community Action
Boston
**Fairfield Co.
Detroit
**Hartford
Minneap.
**New Haven
Philly
Phoenix
St Louis
**CT
15 metros
0% 10% 20% 30% 40% 50% 60% 70% 80% 90% 100%
1%
1%
8%
5%
2%
5%
6%
6%
3%
3%
3%
8%
17%
5%
13%
7%
5%
5%
2%
7%
10%
3%
Population in Economically and Racially Segregated Areas
RCAP Non-Segregated RCAA

Neighborhood Segregation – Findings
Higher concentration of households earning at least $200,000/yr in CT than in other metros• 27% of top-earning
households in CT live in neighborhoods that are wealthy and majority white– Compared to 10% in
national metro sample
• Highest concentration of wealthy households in RCAAs in Fairfield County and HartfordDATAHAVEN
Data for Community Action
Boston
**Fairfield Co
Detroit
**Hartford
Minneap.
**New Haven
Philly
Phoenix
St. Louis
**CT
15 metros
19%
37%
17%
26%
20%
14%
16%
8%
23%
27%
10%
Pct of region's top-earning households in racially
concentrated affluent ar-eas

Neighborhood Segregation – Findings
Some CT cities have high shares of poor people also living in concentrated poverty neighborhoods (“Double Jeopardy”)• In CT, 15% of people in
poverty live in neighborhoods that are poor and racially segregated– Compared to 12% in national
metro sample
• High concentration of poor in RCAPs in Hartford and New Haven DATAHAVEN
Data for Community Action
Boston
**Fairfield Co
Detroit
**Hartford
Minneap.
**New Haven
Philly
Phoenix
St. Louis
**CT
15 metros
5%
8%
25%
22%
10%
18%
22%
20%
13%
15%
12%
Pct of region's poor residents living in RCAPs

Neighborhood Segregation - Presentation and Coverage
• Interactive map of neighborhoods on CartoDB
• CT Mirror: Connecticut has more concentrated poverty (and wealth) than most metros
• New Haven Register: Data show Connecticut remains segregated, but work being done to lessen it
DATAHAVENData for Community Action

Neighborhood Income Change - Summary
• From 1980 to 2013– The share of CT residents living in middle-
income neighborhoods decreased– The share of CT residents living in areas of
concentrated wealth or poverty grew
• By 2013, of CT residents, 25% lived in “extreme-income” neighborhoods– Very Affluent, Concentrated Poverty
DATAHAVENData for Community Action
Neighborhood Income Change - Methodology
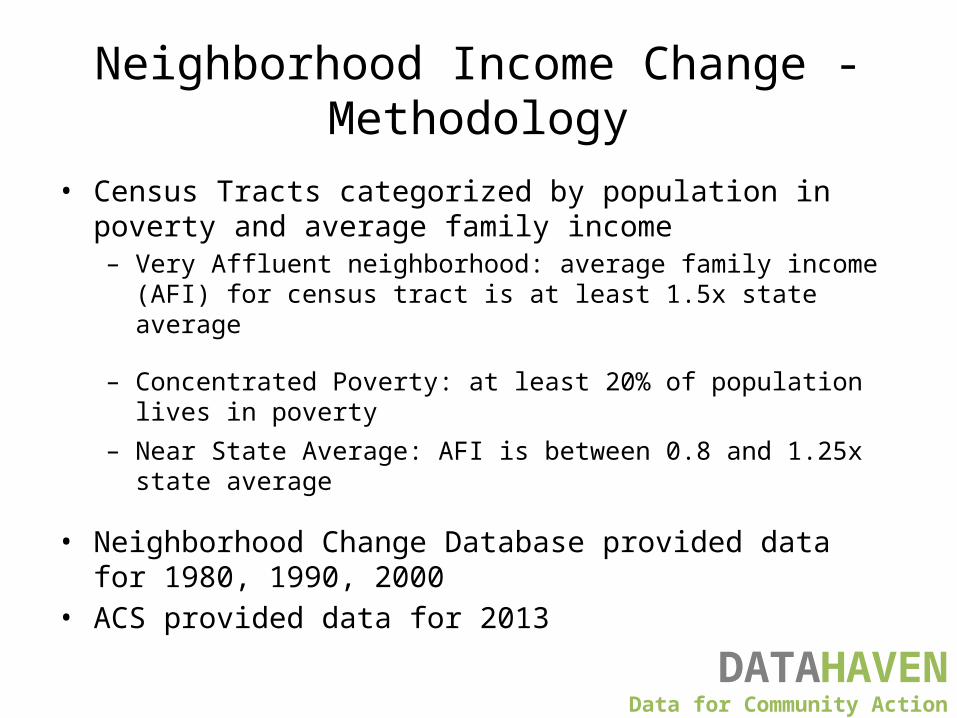
• Census Tracts categorized by population in poverty and average family income– Very Affluent neighborhood: average family income (AFI) for
census tract is at least 1.5x state average
– Concentrated Poverty: at least 20% of population lives in poverty
– Near State Average: AFI is between 0.8 and 1.25x state average
• Neighborhood Change Database provided data for 1980, 1990, 2000
• ACS provided data for 2013
DATAHAVENData for Community Action

Neighborhood Income Change - Findings
• From 1980 to 2013, a 28% decrease in percent of CT residents living in neighborhoods with income near state average– 56% of all residents in 1980 vs. 40% in 2013
• A 30% increase in percent of CT residents living in neighborhoods with extreme income– 19% of all residents in 1980 vs. 25% in 2013
DATAHAVENData for Community Action
Neighborhood Income Change - Findings
Extreme-income neighborhood change, 1980 to 2013
• 47% increase in percent of CT residents living in very affluent neighborhoods– 7% of all residents in 1980 vs. 10% in 2013
• 20% increase in percent of CT residents living in concentrated poverty neighborhoods– 12% of all residents in 1980 vs. 15% in 2013
• A 66% increase in percent of poor CT residents living in concentrated poverty neighborhoods– 3% of all residents in 1980 vs. 4% in 2013
DATAHAVENData for Community Action

Neighborhood Income Change - Findings
• Urban and Suburban areas impacted by change– Growth of very affluent neighborhoods in Fairfield County
and other peripheral suburban areas– Growth of concentrated poverty in cities and inner suburbs
• Neighborhood income in “rural” areas stable from 1980-2013
DATAHAVENData for Community Action
Neighborhood Income Change - Presentation and Coverage
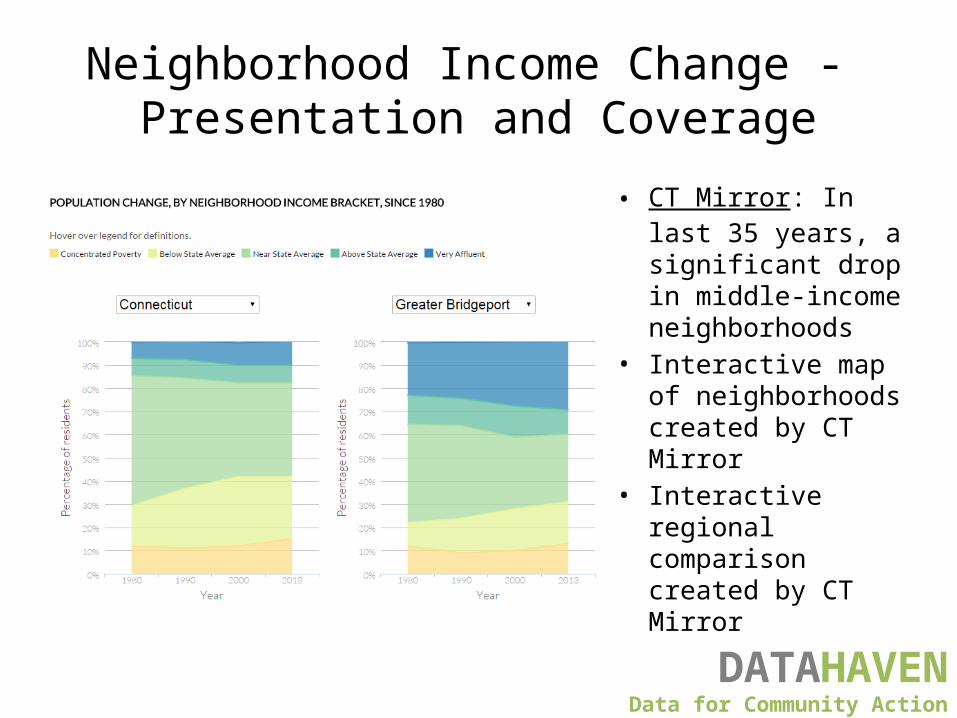
• CT Mirror: In last 35 years, a significant drop in middle-income neighborhoods
• Interactive map of neighborhoods created by CT Mirror
• Interactive regional comparison created by CT Mirror DATAHAVEN
Data for Community Action

Neighborhood Income Follow-upsPotential extensions of these analyses include:• Characteristics of “Rebounding
neighborhoods”• In depth regional analyses for community
assessment reports - 2016 Community Index– Greater New Haven and Lower Naugatuck Valley
regions
Other suggestions ? Questions ?Contact Mary at [email protected]
DATAHAVENData for Community Action
Related Documents


