Martin Obschonka, Michael Stuetzer, P. Jason Rentfrow, Neil Lee, Jeff Potter, Samuel D. Gosling Fear, populism, and the geopolitical landscape: the “sleeper effect” of neurotic personality traits on regional voting behavior in the 2016 Brexit and Trump elections Article (Accepted version) (Refereed) Original citation: Obschonka, Martin and Stuetzer, Michael and Rentfrow, P. Jason and Lee, Neil and Potter, Jeff and Gosling, Samuel D. (2018) Fear, populism, and the geopolitical landscape: the “sleeper effect” of neurotic personality traits on regional voting behavior in the 2016 Brexit and Trump elections. Social Psychological and Personality Science. ISSN 1948-5506 © 2018 The Authors This version available at: http://eprints.lse.ac.uk/86482/ Available in LSE Research Online: January 2018 LSE has developed LSE Research Online so that users may access research output of the School. Copyright © and Moral Rights for the papers on this site are retained by the individual authors and/or other copyright owners. Users may download and/or print one copy of any article(s) in LSE Research Online to facilitate their private study or for non-commercial research. You may not engage in further distribution of the material or use it for any profit-making activities or any commercial gain. You may freely distribute the URL (http://eprints.lse.ac.uk) of the LSE Research Online website. This document is the author’s final accepted version of the journal article. There may be differences between this version and the published version. You are advised to consult the publisher’s version if you wish to cite from it.

Welcome message from author
This document is posted to help you gain knowledge. Please leave a comment to let me know what you think about it! Share it to your friends and learn new things together.
Transcript

Martin Obschonka, Michael Stuetzer, P. Jason Rentfrow, Neil Lee, Jeff Potter, Samuel D. Gosling
Fear, populism, and the geopolitical landscape: the “sleeper effect” of neurotic personality traits on regional voting behavior in the 2016 Brexit and Trump elections
Article (Accepted version) (Refereed)
Original citation: Obschonka, Martin and Stuetzer, Michael and Rentfrow, P. Jason and Lee, Neil and Potter, Jeff and Gosling, Samuel D. (2018) Fear, populism, and the geopolitical landscape: the “sleeper effect” of neurotic personality traits on regional voting behavior in the 2016 Brexit and Trump elections. Social Psychological and Personality Science. ISSN 1948-5506 © 2018 The Authors This version available at: http://eprints.lse.ac.uk/86482/ Available in LSE Research Online: January 2018 LSE has developed LSE Research Online so that users may access research output of the School. Copyright © and Moral Rights for the papers on this site are retained by the individual authors and/or other copyright owners. Users may download and/or print one copy of any article(s) in LSE Research Online to facilitate their private study or for non-commercial research. You may not engage in further distribution of the material or use it for any profit-making activities or any commercial gain. You may freely distribute the URL (http://eprints.lse.ac.uk) of the LSE Research Online website. This document is the author’s final accepted version of the journal article. There may be differences between this version and the published version. You are advised to consult the publisher’s version if you wish to cite from it.
Neuroticism and Brexit and Trump votes 1
Fear, populism, and the geopolitical landscape: The “sleeper effect” of neurotic
personality traits on regional voting behavior in the 2016 Brexit and Trump votes
Martin Obschonka1*, Michael Stuetzer2,3, P. Jason Rentfrow4, Neil Lee5, Jeff Potter6, Samuel
D. Gosling7,8
Accepted for publication in
Social Psychological and Personality Science
1QUT Business School, Queensland University of Technology, Australia
2Baden Wuerttemberg Cooperative State University, Germany
3Faculty of Economic Sciences and Media, Institute of Economics, Ilmenau University of
Technology, Germany
4Department of Psychology, University of Cambridge, UK
5Department of Geography and Environment, London School of Economics and Political
Science, UK
6Atof Inc., Cambridge, Massachusetts
7Department of Psychology, University of Texas at Austin, USA
8School of Psychological Sciences, University of Melbourne, Parkville, VIC, Australia
*Corresponding author

Neuroticism and Brexit and Trump votes 2
Abstract
Two recent electoral results - Donald Trump’s election as US president and the UK’s Brexit
vote - have re-ignited debate on the psychological factors underlying voting behavior. Both
campaigns promoted themes of fear, lost pride, and loss aversion, which are relevant to the
personality dimension of Neuroticism, a construct previously not associated with voting
behavior. To that end, we investigate whether regional prevalence of neurotic personality traits
(Neuroticism, Anxiety, Depression) predicted voting behavior in the US (N = 3,167,041) and
the UK (N = 417,217), comparing these effects with previous models, which have emphasized
the roles of Openness and Conscientiousness. Neurotic traits positively predicted share of
Brexit and Trump votes and Trump gains from Romney. Many of these effects persisted in
additional robustness tests controlling for regional industrial heritage, political attitude, and
socio-economic features, particularly in the US. The “sleeper effect” of neurotic traits may
profoundly impact the geopolitical landscape.

Neuroticism and Brexit and Trump votes 3
Fear, populism, and the geopolitical landscape: The “sleeper effect” of neurotic
personality traits on regional voting behavior in the 2016 Brexit and Trump votes
In 2016, the United Kingdom (UK) voted to leave the European Union (EU) (a decision
known as “Brexit”) and Donald J. Trump was elected as President of the United States (US).
The widespread media coverage of the Brexit and Trump campaigns characterized them as
being quite unlike other recent campaigns, particularly in their use of so-called populist themes
(Inglehart & Norris, 2016; Pettigrew, 2017).
The Brexit and Trump campaigns were different in many ways, but one thing they had
in common, according to one popular media narrative, was their focus on stoking fears in the
electorate. In Britain, the Vote Leave campaign and the UK Independence Party (UKIP), for
example, stoked citizens’ worries about immigration and terrorism; the UKIP campaigned to
“Take Back Control” from the EU by establishing firm borders to reduce the threats of
multiculturalism on economic independence and freedom. In the US, Donald Trump’s
campaign to “Make America Great Again” followed populist themes and was based on appeals
to fear (Nai & Maier, 2018); specifically, the campaign appealed to a belief that an influx of
immigrants has weakened the nation’s values, economy, and security (The Atlantic, 2016). The
fact that such rhetoric resonated with so many voters surprised many people, including political
analysts, right up to the moment when the final results were announced.
Even sophisticated forecasting models that used historical voting records and
demographic data, predicted victories for the Vote Remain and Clinton campaigns (see, for
example, Millward, 2016). Evidently, the models traditionally used for predicting and
explaining political behavior did not capture an essential factor that influenced people’s voting
decisions in 2016. So how are we to understand the changing geopolitical landscape? What

Neuroticism and Brexit and Trump votes 4
factors might account for the surprising receptivity to this recent emergence of populist
campaigns?
Research has long highlighted the role of psychological factors in influencing political
ideology and political behavior, including voting behavior in major elections (Avery, Lester, &
Yang, 2015; Barbaranelli, Caprara, Vecchione, & Fraley, 2007; Choma & Hanoch, 2017; Jost
et al., 2003; Pesta & McDaniel, 2014). In the domain of personality, political orientation
(typically defined in terms a liberal vs. conservative continuum) has been linked to the
dimensions of the Big Five model (John & Srivastava, 1999); in particular, studies point to a
moderate to large association between political conservatism and low Openness and a small but
reliable association between conservatism and high Conscientiousness (Carney, Jost, Gosling,
& Potter, 2008; Jost, 2006; McCrae, 1996; Sibley, Osborne, & Duckitt, 2012). Similar findings
were revealed by studies undertaken at the regional level (Rentfrow et al., 2013; Rentfrow, Jost,
Gosling, & Potter, 2009).
However, the recent populist campaigns, which have played upon voters’ fears, point to
the possible role of another personality dimension—the one most closely tied to anxiety, anger,
and fear, namely Neuroticism (Barlow, Ellard, Sauer-Zavala, Bullis, & Carl, 2014; Digman,
1990; Eysenck, 1947). In personality research, Neuroticism is usually defined as emotional
instability characterized by more extreme and maladaptive responses to stressors and a higher
likelihood of negative emotions (e.g., anxiety, anger, and fear). One integrative summary of
various conceptions of the Big Five dimensions, characterizes Neuroticism in terms of a
reactivity to negative events or stressors and to environmental and social threats (Denissen &
Penke, 2008). This conception of Neuroticism as a lowered threshold for detecting and
responding to stimuli as threatening or dangerous, suggests that individuals high on this trait
will be more receptive to campaigns, such as populism, which specifically prey on fears of
looming threats and dangers. Research shows that once these fears have been activated, they

Neuroticism and Brexit and Trump votes 5
can affect decisions of all kinds, including voting behavior (Alesina & Passarelli, 2015). As a
result, regions higher in Neuroticism should show particularly big swings in the populist
directions. As such, we propose that Neuroticism might be responsible for a kind of “sleeper
effect,” such that, under normal conditions it has no influence, but in certain circumstances
(e.g., the rise of populism) it can play a significant role in determining consequential outcomes.
Here we test potential “sleeper effects” of Neuroticism by investigating the links
between regional levels of neurotic traits and votes for Brexit and Trump in the 2016 elections.
In particular, we test the hypothesis that regions with high scores on neurotic traits, namely
Trait Neuroticism and two sub-facets, Trait Anxiety and Trait Depression (Soto & John, 2009),
are associated with support for Brexit and Trump. We compare the effects of these neurotic
traits with those of Openness and Conscientiousness, which are the known regional personality
correlates of political orientation and voting behavior. We also control for alternative
explanations, namely historical industrial decline (lost pride), political attitude (liberal),
education, race, and current economic hardship.
Method
Here we summarize the key elements of the design; for details of the samples,
selection procedures, representativeness, challenges to validity, focal variables, and control
variables, see Online Supplementary Materials).
Regional level. We conduct our analysis at the county level in the US. In the UK, we
analyze the Local Authority District (LAD) level; there we focus only on regions in Scotland,
England, and Wales because the control variables are not available for Northern Ireland.
Personality data. The UK personality data (N=417,217) come from a large Internet-
based survey designed and administered between 2009 and 2011 in collaboration with the
British Broadcasting Corporation (BBC UK Lab project; see Rentfrow, Jokela, & Lamb,
2015); participants were spread across 379 LADs with at least 100 participants in each. The

Neuroticism and Brexit and Trump votes 6
US personality data (N=3,167,041) come from the Gosling-Potter Internet Project, collected
between 2003 and 2015 and divided into 2,082 counties, with at least 100 participants in each.
Personality data were collected using the 44-item Big Five Inventory (BFI; John &
Srivastava, 1999). We focus on neurotic traits: Neuroticism as a broad Big Five trait and
Anxiety and Depression as established sub-facets of Neuroticism. We aggregated the
individual-level scores based on the LAD/county in which the participants lived. We compare
the neurotic traits to the role of Openness and Conscientiousness, the established regional
personality correlates of voting behavior.
Election data. We focus on two kinds of DVs. The first is the simple vote share for
Brexit and Trump, testing the idea that regions high on Neuroticism were particularly likely to
be swayed by populist campaigns. This DV mirrors those used in previous analyses and allows
us to test whether the 2016 elections differed from previous ones in now showing associations
with regional Neuroticism where previous votes had been associated only with regional
Openness and Conscientiousness.
The second kind of DV, which we can measure only in the US analyses, focuses on that
part of Trump’s vote that is not merely due to him being the Republican candidate. In other
words, we examine the shift to Trump, over and above the region’s historical tendency to vote
for Republican candidates. We thus aim at capturing the specific impact (and success) of
Trump’s populist campaign, with its clearer focus on fears and (potential) losses than seen in
previous campaigns (Inglehart & Norris, 2016). It has been suggested that it was these particular
shifts to Trump (e.g., in battlefield states) that lead to his victory (The Washington Post, 2016).
Data on the Brexit results are available at the LAD level from the UK Electoral
Commission (2016). The dependent variable was the share of votes for Brexit among the valid
votes (M = 53.17%, SD = 10.42).

Neuroticism and Brexit and Trump votes 7
US election data come from open data sources (Github 2017; OpenDataSoft 2016). For
the first dependent variable, we use the share of Trump vote which is calculated as the two-
party vote share for the Republicans in 2016 (henceforth: Trump votes) (M = 63.4, SD = 15.65).
To examine the shift to Trump over and above the existing tendency to vote Republican,
we compute the change of the Republican two-party vote from 2012 to 2016. For example if
Trump as the Republican candidate in 2016 had a 50% two-party vote share and Romney as the
2012 candidate had a 40% two-party vote share, the gain would be 10%. This gain in the two-
party vote share (henceforth: Trump gains) is our second dependent variable for the US analysis
(M = 5.22, SD = 5.28). Naturally, such a gain equals the corresponding loss of the Democratic
candidate.
Control variables. We control for an array of variables which could potentially explain
voting behavior.
First, we control for population density because voters in regions with higher population
density (e.g. larger cities) tend not to vote for conservative candidates. In the UK analysis, we
also included country dummies for Scotland and Wales. Scotland and Wales are special cases
because of simmering independence movements and local culture. For example, there are strong
economic motives in Scotland to remain in the EU even after a potential independence from the
UK because a small country, like Scotland disproportionally gains from free trade in the EU
(Schiff, 1997).
Second, we consider the regions’ industrial heritage. Recent studies and popular
narratives suggest that voters in the industrialized heartlands of the UK and US were
particularly likely to vote for Brexit and Donald Trump. One reason could be that the
industrialized areas (e.g., the Rust Belt in the US) are in a long phase of decline (Autor et al.,
2013; Autor et al., 2017). One major promise of the Trump campaign was a policy shift away
from free trade to protect jobs in the industrialized heartland (“bringing back the

Neuroticism and Brexit and Trump votes 8
manufacturing”). Additionally, popular narratives suggest that the workforce in these industries
viewed themselves with a lot of pride and the loss of this pride during the industrial decline
might have made them susceptible to populist campaigns (see also Inglehart & Norris, 2016).
To capture the effect of the historical industrial decline in the old industrial centers, we include
the employment share in manufacturing and mining in the US for the year 1970 (M = 25.3%,
SD = 11.76) and in the UK for the year 1971 as controls (M = 34.33%, SD = 12.34). We chose
data from the early 1970s over later time periods because they provide good estimates of the
industrial structure before de-industrialization accelerated from the 1980s onwards.
Third, we consider political attitudes of the regional populace. Prior research has shown
that people who consider themselves as liberal tend to vote for left-wing parties and people who
consider themselves as conservatives tend to vote for right-wing parties (e.g., Langer & Cohen,
2004). So here we examine whether neurotic traits add any incremental predictive validity
beyond a simple effect of political attitudes. Specifically, we include a control variable
reflecting the liberal political attitude of the regional populace (single item: “I see myself as
someone who is politically liberal”, ranging from 1=strongly disagree to 5=strongly agree). The
individual-level data come from the Gosling-Potter Internet Project in both countries and were
aggregated to the corresponding regional levels in the US (M = 2.74, SD = 0.24) and UK (M =
2.97, SD = 0.21).
Fourth, the Trump and Brexit campaigns were reported to stir up racial tensions with
regard to migration (e.g., Major, Blodorn, & Blascovich, 2016) and racial composition of the
population can predict voting behavior (e.g. Rentfrow et al., 2015; Autor et al., 2015). We
therefore included the share of white inhabitants (US: M = 83.29%, SD = 15.24; UK M =
90.39%, SD = 12.28).
Fifth, we consider current economic hardship in the region. Voters suffering from poor
economic conditions can voice their dissent with current economic policy by voting for the
Neuroticism and Brexit and Trump votes 9
opposition (Republicans in the 2016 US election) or the Brexit campaign. We include the
unemployment share and earnings in our analysis. In the US case, we use the 2015
unemployment data from the Bureau of Labor Statistics (M = 5.56%, SD = 1.74) and the yearly
income per capita in the 2010-2014 period from the American Community Survey (ACS) (M =
$24.688, SD = 5.829). In the UK, we use the unemployment data from the 2011 Census (M =
6.13%, SD = 2.07) and the weekly income in 2011 from Annual Survey of Hours and Earnings
(M = £490.83, SD = 114.56).
Finally, we also use the educational attainment of the population as a control variable
because education can also predict election results (Rentfrow et al., 2013). We expect
educational attainment to be important for two reasons. First, better educated people have
profited in the last decades from free trade in terms of better job chances and higher earnings
(Autor, 2014). This makes it more likely that they will vote against Trump and Brexit, which
have isolationistic tendencies. Second, populist campaigns may offer simplified solutions to
complex problems and better educated people might find these simplified solutions unrealistic
and thus vote against these campaigns (Seligson, 2007). In the US, we use the population share
with a bachelor degree or higher. The data come from the 2010 ACS 5yr estimates in the US
(M = 21.92%, SD = 9.56). In the UK, we use the population share with NVQ level 4
qualification or above, roughly equivalent to degree level. The data come from the 2011 Census
(M = 26.91%, SD = 7.67).
All variables and their sources are reported in Table 1.
[Table 1 about here]
Results
Tables 2 and 3 report correlations between the variables of interest in the UK and the
US. In the UK case, there were moderate correlations between Brexit votes and the neurotic
traits (Neuroticism: r = 0.26, p < 0.05; Anxiety: r = 0.36, p < 0.05; Depression: r = 0.11, p <

Neuroticism and Brexit and Trump votes 10
0.05). The correlations between Trump shares and the neurotic traits were also moderate in size
(Neuroticism: r = 0.37, p < 0.05; Anxiety: r = 0.38, p < 0.05; Depression: r = 0.22, p < 0.05),
whereas the correlations between Trump Gains and the neurotic traits were slightly larger
(Neuroticism: r = 0.44, p < 0.05; Anxiety: r = 0.45, p < 0.05; Depression: r = 0.29, p < 0.05).
The main correlation between Neuroticism and Brexit votes is illustrated in Figures 1 and 2,
which map the regional distribution of both variables for the UK. Visual inspection of the maps
suggests that rural areas in the East of England and the industrialized centers have higher
neurotic traits and higher Brexit votes. Likewise, the corresponding US maps (Figure 3 and 4)
illustrate the observed correlation between Neuroticism and election results for Trump. We use
the map for Trump gains (and not for absolute Trump votes) in Figure 3 because we believe
that these gains are a better indicator for the specific receptivity to campaigns addressing fears,
as explained above. Those Trump gains, which are widely believed to be decisive in the 2016
presidential election (The Washington Post, 2016), and higher neurotic traits indeed overlap in
the maps. Both are found predominantly in the North East and around the Great Lakes where
many battlefield states such as Pennsylvania, Wisconsin, and Ohio went from Democratic in
2012 to Republican 2016. The old industrial center of the US, the “Rust Belt” also shows a
concentration of both Neuroticism and Trump gains.
[Tables 2 and 3 about here]
[Figures 1-4 about here]
Next, we present OLS regression results for both countries. All variables were z-
standardized to ease interpretation of the coefficients. We tested the Neuroticism (or its
subfacets) model against the Openness and Conscientiousness model, and also included
different sets of control variables (e.g., to consider potential overlap between economic
hardship and education levels, which might lead to multicollinearity). We tested six models in
each country: The first model included the effects of Neuroticism and of basic controls. The

Neuroticism and Brexit and Trump votes 11
second model included the effects of Openness and Conscientiousness (but not Neuroticism)
and the basic controls. The third model included Neuroticism and also Openness and
Conscientiousness plus the basic controls. The fourth model added the historical industrial
decline (historical industry structure) to control for the “lost pride” effect. The fifth model added
political attitudes, race, and current economic hardship. The sixth model replaced economic
hardship with education. We also regressed models including economic hardship and education
at the same time but the correlation of these control variables was very high, which led to
unstable regression results due to multicollinearity. Thus, we do not present a model including
all control variables at one time.
All the models throughout the paper were tested using OLS as the regression technique.
Note that in most models the Breusch-Pagan test reveals heteroscedasticity, which biases the t-
statistics and leads to erroneous conclusions about statistical significance. To avoid this
problem, we use heteroscedasticity robust standard errors.
Models 1, 2, and 3 were conducted to evaluate the extent to which regional differences
in Neuroticism, Openness, and Conscientiousness contributed to Brexit and Trump votes. As
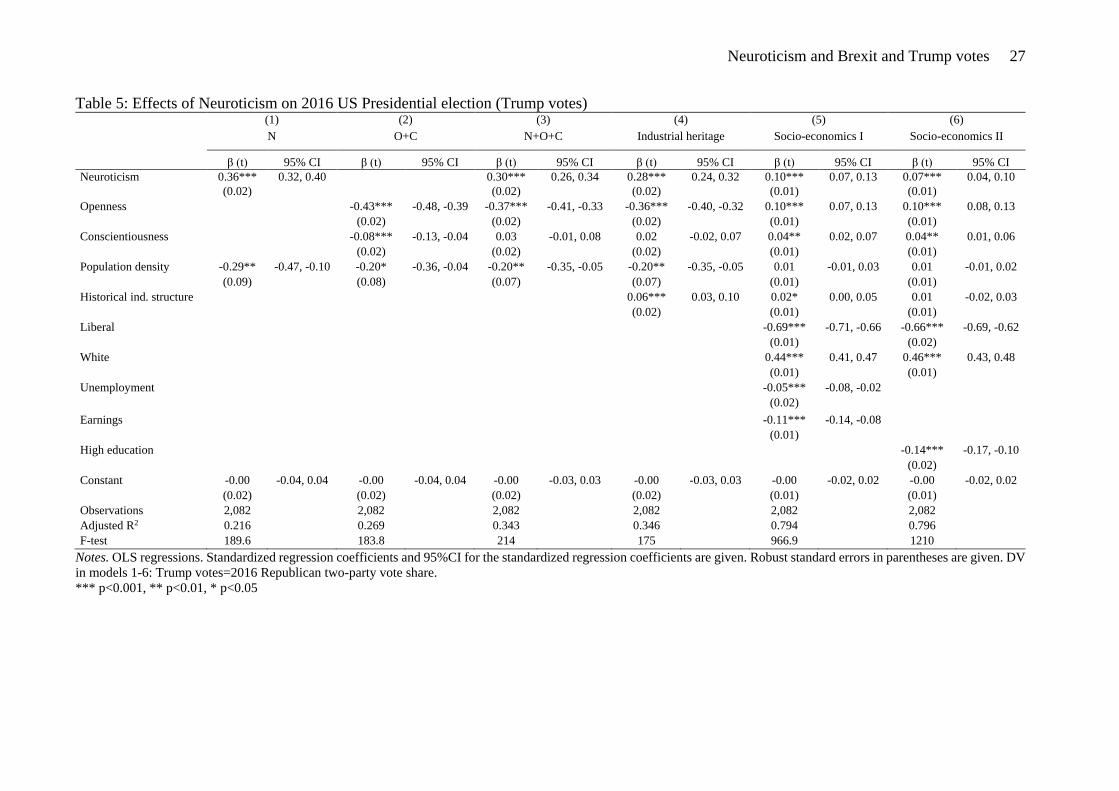
can be seen in Tables 4 (Brexit), 5 (Trump votes), and 6 (Trump gains), the results from model
1 revealed that Neuroticism positively predicted Brexit votes (leave) (Table 4: β = 0.30, SE =
0.04, p < 0.001), Trump votes (Table 5: β = 0.36, SE = 0.02, p < 0.001), and Trump gains (Table
6: β = 0.43, SE = 0.02, p < 0.001). The addition of Neuroticism (model 3) to the model that
included only Openness and Conscientiousness (model 2) led to an increase in explained
variance of 3% in the prediction of Brexit votes, 7% in the prediction of Trump votes, and 11%
in the prediction of Tramp gains. Higher population density was negatively related to Brexit
votes (Table 4: β = -0.53, SE = 0.04, p < 0.001), Trump votes (Table 5: β = -0.29, SE = 0.02, p
< 0.01), and Trump gains (Table 6: β = -0.16, SE = 0.02, p < 0.01). Additionally, Brexit votes
were lower in Scottish LADs (Table 4: β = -0.47, SE = 0.03, p < 0.001) and Welsh LADs (Table

Neuroticism and Brexit and Trump votes 12
4: β = -0.13, SE = 0.03, p < 0.001). The results for model 2 indicated that Openness negatively
predicted Brexit votes (Table 4: β = -0.61, SE = 0.04, p < 0.001), Trump votes (Table 5: β = -
0.43, SE = 0.02, p < 0.001), and Trump gains (Table 6: β = -0.47, SE = 0.02, p < 0.001).
Conscientiousness showed no effect on Brexit votes (Table 4), but had a small and negative
effect on Trump votes (Table 5: β = -0.08, SE = 0.02, p < 0.001) and Trump gains (Table 6: β
= -0.11, SE = 0.02, p < 0.001). In model 3, which tested Neuroticism, Openness and
Conscientiousness together, the results revealed similar effects for the traits with the exception
that the negative effect of Conscientiousness became slightly positive and non-significant in
both countries.
Models 4, 5, and 6 represent relatively conservative tests because we not only consider
political attitudes (liberal attitudes) but also those regional socio-economic conditions (e.g.,
historical industry patterns and current economic hardship and education levels) that might be
interrelated, and may actually “co-develop” over time, with regional Neuroticism (Obschonka
et al., 2017). The positive correlations between regional Neuroticism and such control variables
(Tables 2 and 3) are in line with such an assumption.
The results for model 4 indicated that historical industrial structure had a positive effect
on Brexit votes (Table 4: β = 0.10, SE = 0.04, p < 0.01), Trump votes (Table 5: β = 0.06, SE =
0.02, p < 0.001), and Trump gains (Table 6: β = 0.09, SE = 0.02, p < 0.001).
Models 5 and 6 include the socio-economic controls capturing race, recent economic
hardship, political attitudes, and education levels. In model 5, the liberal political attitude of the
regional populace negatively predicted Brexit votes (Table 4: β = -0.37, SE = 0.04, p < 0.001)
and Trump votes (Table 5: β = -0.69, SE = 0.01, p < 0.001), but positively predicted Trump
gains (Table 6: β = 0.13, SE = 0.02, p < 0.001). The differing result of liberal political attitude
on Trump votes and gains needs a short explanation. The raw correlation of liberalism and
Trump gains is -.3, so the Trump gains were smaller in liberal regions, but the additional control

Neuroticism and Brexit and Trump votes 13
for Openness reversed this relationship so that Trump gains were larger in liberal areas. Among
the other control variables in these models, the share of white people positively predicted Brexit
votes (Table 4: β = 0.14, SE = 0.05, p < 0.01), Trump votes (Table 5: β = 0.44, SE = 0.01, p <
0.001), and Trump gains (Table 6: β = 0.36, SE = 0.02, p < 0.001) in model 5. This effect was
no longer significant in model 6 in the UK analysis. Model 5 also revealed that unemployment
positively predicted Brexit votes (Table 4: β = 0.22, SE = 0.04, p < 0.001), negatively predicts
Trump votes (Table 5: β = -0.05, SE = 0.02, p < 0.001), and did not predict Trump gains (Table
6: β = 0.04, SE = 0.03, p > 0.05). Earnings, in turn, negatively predicted Brexit votes (Table 4:
β = -0.15, SE = 0.05, p < 0.01), Trump votes (Table 5: β = -0.11, SE = 0.01, p < 0.001), and
Trump gains (Table 6: β = -0.29, SE = 0.02, p < 0.001).
Finally, model 6 shows that high education had a negative effect on Brexit votes (Table
4: β = -0.60, SE = 0.04, p < 0.001), Trump votes (Table 5: β = -0.14, SE = 0.02, p < 0.001, and
Trump gains (Table 6: β = -0.63, SE = 0.02, p < 0.001). We observed that the relationship
between the Big Five traits in these models on the one side, and Brexit votes, Trump votes, and
Trump gains on the other got weaker when successively including more control variables
(except for the effect of Conscientiousness).
[Tables 4, 5, and 6 about here]
Taken together, the results support the assumption that Neuroticism was positively
related to voting behavior in both the Brexit referendum and Trump election. This effect was
robust when tested against Openness and Conscientiousness (with only Openness showing a
robust effect). The effect of Neuroticism on Brexit votes diminished when socio-economic
control variables were included in the analysis, but the effect on support for Trump persisted
albeit with smaller effect sizes (β ranging from 0.07 to 0.20 depending on model and DV). We
observed similar results when looking at the subfacets of Neuroticism (Anxiety and Depression)
(see Table A1 for Brexit votes, A2 for Trump votes, and A3 for Trump gains). We also found

Neuroticism and Brexit and Trump votes 14
indications that historical industrial decline as well as race, liberal attitudes, recent economic
hardship, and education levels were related to Brexit votes and Trump votes and gains.
As a robustness check, we tested whether the results changed when the other Big Five
traits, Agreeableness and Extraversion, were added to the regressions. These models are shown
in Online Appendix Table A4 for Brexit votes and in Table A5 for Trump votes and Trump
gains. In general, the effects of Neuroticism and Openness as identified in our main analysis
did not change. We also conducted a robustness check regarding the representativeness of the
regional samples by weighting the individual observations in the Personality samples by age
and gender when computing the regional traits. These results are displayed in Online Appendix
Table A6 for both countries. The results do not differ much from our main regression in Tables
1-3, although the size of the regression coefficients of the traits are slightly reduced in some
models.
Discussion
The populist political campaigns of 2016 were widely believed to differ from previous
campaigns, particularly in their focus on generating fears and stoking nationalist fervor.
Theoretically, campaigns that draw on fear should be particularly compelling to people already
prone to being anxious. Consequently, regions with high numbers of anxious people should be
more likely to vote for populist issues (e.g., Brexit) and candidates (e.g., Trump) than regions
with lower numbers of anxious people. This logic would suggest that regional levels of
Neuroticism—a dimension not previously associated with voting trends—should be associated
with support for populist issues and, as a result, influence the geopolitical landscape.
When comparing the effect of neurotic traits to the effects of other Big Five traits
(models 1-3 in the regressions), our analyses generally supported this “sleeper effect”
prediction. Neurotic traits positively predicted share of Brexit and Trump votes and Trump
gains from Romney when controlling for Openness and Conscientiousness. Particularly in the

Neuroticism and Brexit and Trump votes 15
US analyses, many of these effects of neurotic traits persisted in additional tests controlling for
regional industrial heritage, political attitude, and socio-economic features. We observed
stronger effects of neurotic traits when examining Trump gains (from Romney), compared to
the simple share of Brexit and Trump votes, which underscores our initial assumption that it is
particularly the shift in voting behavior towards such campaigns addressing fears that reflects
the interplay between regional Neuroticism and the success of these campaigns.
One key question remains whether fear can be harnessed by any political campaign or
whether it is better suited to some positions or policies than to others. For example, could the
Remain campaign in the UK or Hillary Clinton in the US have pursued fear-based populist
campaigns as successfully as those pursued by the Leave and Trump campaigns? We do not
have any direct evidence to address this question but recent theory and research provides
indirect evidence to suggest that campaigns built on fear and threat are better suited to
conservative campaigns than liberal ones. Specifically, theoretical work suggests that
existential needs to reduce threat are associated with political conservatism (Jost, Glaser,
Kruglanski, & Sulloway, 2003) and a preponderance of empirical evidence suggests that
individuals’ subjective perceptions of threat, as well as objectively threatening circumstances,
lead to shifts toward conservatism (Jost, Stern, Rule, & Sterling, 2017). Concomitantly,
experimentally increasing individuals’ feelings of physical safety leads to shifts away from
conservatism (Napier, Huang, Vonasch, & Bargh, in press). In short, the activation of fear in
the electorate would seem to be suited more to conservative positions than to liberal positions.
Our study contributes to a wide range of research demonstrating important effects of
Neuroticism on various socio-economic outcomes at the individual (Barlow et al., 2014) and
regional levels; regional levels of Neuroticism predict lower economic resilience at times of
major recession (Obschonka et al., 2016), low mental and physical health (Rentfrow, Jokela, &
Lamb, 2015), and substantial costs for society (Lahey, 2009). An analysis of the concrete

Neuroticism and Brexit and Trump votes 16
economic costs to society (e.g., health-service uptake in primary and secondary mental-health
care, out-of-pocket costs, production losses) associated with Neuroticism concluded that they
are “enormous and exceed those of common mental disorders” (p. 1086; Cuijperset al., 2010).
The established associations between regional Neuroticism and so many consequential
outcomes raise the question of how the regional differences in Neuroticism and other traits get
established in the first place and then maintained over time. A number of mechanisms have
been proposed (Rentfrow et al., 2008) but such research is still scarce. In the case of regional
variation in Neuroticism there is evidence that present-day Neuroticism may be associated with
major historical events, such as the Industrial Revolution (Obschonka et al., 2017b) or mass
societal trauma, such as the bombing campaigns of the Second World War (Obschonka et al.,
2017a).
Clearly more work is needed to understand both the causes and consequences of regional
differences in Neuroticism. Future research could take a closer look, for example, at the
potential interplay between the personality structure of candidates (e.g., Obschonka & Fisch, in
press) and regional personality patterns. One key message of the present research is that the
consequences of regional Neuroticism may remain hidden until certain conditions are met. For
example, the regions that are high on Neuroticism in 2016 were likely to be high on Neuroticism
during previous elections and votes too (in fact, our measurement of regional Neuroticism
rested on this assumption). However, we argue that it was not until the 2016 populist campaigns
were launched that the potential effects of regional Neuroticism were expressed. This finding
raises the possibility that there may be other regional characteristics that have the potential to
influence geopolitical events but the necessary conditions have not yet materialized.
Conclusion
Our analyses provide support for the widespread account of the appeal of the populist
messages promoted by the Brexit and Trump campaigns. Consistent with the idea that populist

Neuroticism and Brexit and Trump votes 17
campaigns played on the fears of the voters, those regions high in Neuroticism were more likely
to vote in the populist direction. The role of regional Neuroticism in predicting voting behavior
has not been identified before, suggesting that it could have been a latent factor lying dormant
until the right conditions—in this case populist political campaigns—were realized. In other
words, Neuroticism seems to exert a “sleeper effect” with the potential to have a profound
impact on the geopolitical landscape, especially in light of the rise of populism across the globe.
Neuroticism and Brexit and Trump votes 18
References
Alesina, A., & Passarelli, F. (2015). Loss aversion in politics (No. w21077). National Bureau
of Economic Research.
Autor, D. H., Dorn, D., & Hanson, G. (2013). The Geography of Trade and Technology
Shocks in the United States. American Economic Review, 103(3), 220-225.
Autor, D. H., Dorn, D., Hanson, G., Majlesi, K. (2017). A note on the effect of rising trade
exposure on the 2016 Presidential Election. MIT Working Paper. Downloaded from:
https://economics.mit.edu/files/12418.
Avery, J. M., Lester, D., & Yang, B. (2015). State-level personality and presidential vote share
in the 2008 and 2012 presidential elections. The Social Science Journal, 52(2), 112-122.
Barbaranelli, C., Caprara, G. V., Vecchione, M., & Fraley, C. R. (2007). Voters’ personality
traits in presidential elections. Personality and Individual Differences, 42(7), 1199-
1208.
Barlow, D. H., Ellard, K. K., Sauer-Zavala, S., Bullis, J. R., & Carl, J. R. (2014). The origins
of neuroticism. Perspectives on Psychological Science, 9(5), 481-496.
Carney, D. R., Jost, J. T., Gosling, S. D., & Potter, J. (2008). The secret lives of liberals and
conservatives: Personality profiles, interaction styles, and the things they leave behind.
Political Psychology, 29, 807-840.
Choma, B. L., & Hanoch, Y. (2017). Cognitive ability and authoritarianism: Understanding
support for Trump and Clinton. Personality and Individual Differences, 106, 287-291.
Cuijpers, P., Smit, F., Penninx, B. W., de Graaf, R., ten Have, M., & Beekman, A. T. (2010).
Economic costs of neuroticism: a population-based study. Archives of General
Psychiatry, 67(10), 1086-1093.

Neuroticism and Brexit and Trump votes 19
Denissen, J. J. A., & Penke, L. (2008). Motivational individual reaction norms underlying the
Five-Factor model of personality: First steps towards a theory-based conceptual
framework. Journal of Research in Personality, 42, 1285-1302.
Digman, J. (1990). Personality structure: Emergence of the five-factor model. Annual Review
of Psychology, 41, 417–440.
Elleman, L. G., Condon, D. M., Russin, S. E., and Revelle, W. (2017). The personality stability
of U.S. states from 1999 to 2015. Journal of Research in Personality. DOI:
10.1016/j.jrp.2017.11.004
Eysenck, H. J. (1947). Dimensions of Personality. Oxford, England: Kegan Paul.
Gebauer, J. E., Bleidorn, W., Gosling, S. D., Rentfrow, P. J., Lamb, M. E., & Potter, J. (2014).
Cross-cultural variations in Big Five relationships with religiosity: A sociocultural
motives perspective. Journal of Personality and Social Psychology, 107, 1064-1091.
Github (2017): USA 2016 Presidential Election by County, Available from:
https://github.com/tonmcg/County_Level_Election_Results_12-
16/blob/9db796f730956d0a506d51fa653f583a6eef70a3/2016_US_County_Level_Pres
idential_Results.csv [Accessed 3rd March 2017].
Inglehart, R., & Norris, P. (2016). Trump, Brexit, and the Rise of Populism: Economic Have-
Nots and Cultural Backlash. HKS Working Paper No. RWP16-026. Available at
SSRN: https://ssrn.com/abstract=2818659
John, O. P., & Srivastava, S. (1999). The Big Five trait taxonomy: History, measurement, and
theoretical perspectives. In L. A. Pervin, & O. P. John (Eds.), Handbook of personality:
Theory and research (2nd ed., pp. 102-138). New York: Guilford.
Jost, J. T. (2006). The end of the end of ideology. American Psychologist, 61, 651–670.
Jost, J.T., Glaser, J., Kruglanski, A.W., & Sulloway, F. (2003). Political conservatism as
motivated social cognition. Psychological Bulletin, 129, 339-375

Neuroticism and Brexit and Trump votes 20
Jost, J. T., Stern, C., Rule, N. O., & Sterling, J. (2017). The politics of fear: Is there an
ideological asymmetry in existential motivation? Social cognition, 35, 324-353.
Lahey, B. B. (2009). Public health significance of neuroticism. American Psychologist, 64,
241–256.
Langer, G., & Cohen, J. (2005). Voters and values in the 2004 election. Public Opinion
Quarterly, 69(5), 744-759.
Major, B., Blodorn, A., & Blascovich, G. M. (2016). The threat of increasing diversity: Why
many White Americans support Trump in the 2016 presidential election. Group
Processes & Intergroup Relations, 1368430216677304.
McCrae, R. R. (1996). Social consequences of experiential openness. Psychological Bulletin,
120, 323–337.
Millward, D. (2016). How the pollsters got the US election wrong - just like Brexit. Daily
Telegraph, 9th November 2016.
Nai, A., & Maier, J. (2018). Perceived personality and campaign style of Hillary Clinton and
Donald Trump. Personality and Individual Differences, 121, 80-83.
Napier, J. L., Huang, J., Vonasch, A. J., & Bargh, J. A. (in press). Superheroes for change:
Physical safety promotes socially (but not economically) progressive attitudes among
conservatives. European Journal of Social Psychology. DOI: 10.1002/ejsp.2315
Obschonka, M., & Fisch, C. (in press). Entrepreneurial personalities in political leadership.
Small Business Economics. DOI 10.1007/s11187-017-9901-7
Obschonka, M., Stuetzer, M., Audretsch, D. B., Rentfrow, P. J., Potter, J., & Gosling, S. D.
(2016). Macropsychological factors predict regional economic resilience during a
major economic crisis. Social Psychological and Personality Science, 7(2), 95-104.
Obschonka, M., Stuetzer, M., Rentfrow, J. P., Potter, J., & Gosling, S. D. (2017a). Did
Strategic Bombing in the Second World War lead to “German Angst”?: A large-scale

Neuroticism and Brexit and Trump votes 21
empirical test across 89 German cities. European Journal of Personality, 31(3), 234-
257.
Obschonka, M., Stuetzer, M., Rentfrow, P. J., Shaw-Taylor, L., Satchell, M., Silbereisen, R.
K., Potter, J., & Gosling, S. D. (2017b). In the shadow of coal: How large-scale
industries contributed to present-day regional differences in personality and well-
being. Journal of Personality and Social Psychology. DOI: 10.1037/pspp0000175
OpenDataSoft (2016). USA 2016 Presidential Election by County, Available from:
https://data.opendatasoft.com/explore/dataset/usa-2016-presidential-election-by-
county%40public/map/?basemap=mapbox.light&location=10,33.94735,-
102.29507 [Accessed 16th November 2016].
Pesta, B. J., & McDaniel, M. A. (2014). State IQ, well-being and racial composition as
predictors of US presidential election outcomes. Intelligence, 42, 107-114.
Pettigrew, T. F. (2017). Social Psychological Perspectives on Trump Supporters. Journal of
Social and Political Psychology, 5(1), 107-116.
Rentfrow, P. J., Gosling, S. D., & Potter, J. (2008). A theory of the emergence, persistence, and
expression of geographic variation in psychological characteristics. Perspectives on
Psychological Science, 3(5), 339–369.
Rentfrow, P. J., Jokela, M., & Lamb, M. E. (2015). Regional personality differences in Great
Britain. PloS One, 10(3), e0122245.
Rentfrow, P. J., Jost, J. T., Gosling, S. D., & Potter, J. (2009). Statewide differences in
personality predict voting patterns in 1996–2004 US presidential elections. Social and
psychological bases of ideology and system justification, 1, 314-349.
Rentfrow, P. J., Gosling, S. D., Jokela, M., Stillwell, D. J., Kosinski, M., & Potter, J. (2013).
Divided we stand: Three psychological regions of the United States and their political,
economic, social, and health correlates. Journal of Personality and Social

Neuroticism and Brexit and Trump votes 22
Psychology, 105(6), 996.
Schiff, M. (1997). Small is beautiful: Preferential trade agreements and the impact of country
size, market share and smuggling. Journal of Economic Integration, 12(3), 359-387,
Seligson, M. A (2007). The rise of populism and the left in Latin America. Journal of
Democracy, 18(3), 81-95.
Soto, C. J., & John, O. P. (2009). Ten facet scales for the Big Five Inventory: Convergence with
NEO PI-R facets, self-peer agreement, and discriminant validity. Journal of Research
in Personality, 43(1), 84-90.
Sibley, C. G., Osborne, D., & Duckitt, J. (2012). Personality and political orientation: Meta-
analysis and test of a Threat-Constraint Model. Journal of Research in
Personality, 46(6), 664-677.
Electoral commission (2016): UK Brexit results, Available from:
https://www.electoralcommission.org.uk/our-work/our-research/electoral-
data/electoral-data-new [Accessed 16th November 2016].
The Atlantic (Sept. 2, 2016). Donald Trump and the Politics of Fear.
https://www.theatlantic.com/politics/archive/2016/09/donald-trump-and-the-politics-
of-fear/498116/
The Washington Post (Nov. 11, 2016). How Trump won the presidency with razor-thin
margins in swing states. https://www.washingtonpost.com/graphics/politics/2016-
election/swing-state-margins/

Neuroticism and Brexit and Trump votes 23
Table 1: Overview of variables and data sources
US UK
Voting Trump votes: 2016 Republican two-party
vote share
Trump gains: Gain in the Republican two-
party vote share from 2012 to 2016
Source 2012 data: OpenDataSoft (2016)
Source 2016 data: Gifthub (2017)
Share voting leave
Source: UK Electoral commission (2016)
Trait Neuroticism Gosling-Potter Internet project BBC UK Lab dataset
Item scales ranging from 1=disagree
strongly to 5=agree strongly
Trait Anxiety Gosling-Potter Internet project BBC UK Lab dataset
Items scales ranging from 1=disagree
strongly to 5=agree strongly
Trait Depression Gosling-Potter Internet project BBC UK Lab dataset
Item scales ranging from 1=disagree
strongly to 5=agree strongly
Population
density
Population per square mile
Source: 2010 US Census
Population per square km
Source: 2011 Census of England and Wales
Source: 2011 Census of Scotland
Scotland --- Dummy: 1=Scottish county
Wales --- Dummy: 1=Welsh county
Historical
industry structure
Employment share in mining and
manufacturing in 1970
Source: 1970 Census of Population and
Housing (ICPSR 7507)
http://www.icpsr.umich.edu/icpsrweb/ICPS
R/studies/24722
Employment share in mining and
manufacturing in 1971
Source: Source: Census of England and
Wales SAS28, Downloaded from
http://casweb.ukdataservice.ac.uk/step0.cfm
Source: Census of Scotland SAS28,
Downloaded from
http://casweb.ukdataservice.ac.uk/step0.cfm
Liberal Regional average of the variable: “I see
myself as someone who is politically
liberal” ranging from 1=strongly disagree
to 5=strongly agree
Source: Gosling-Potter Internet project
Regional average of the variable: “I see
myself as someone who is politically
liberal” ranging from 1=strongly disagree to
5=strongly agree
Source: Gosling-Potter Internet project
White Population share white 2010-2014
Source: 2010 ACS five-year estimates
Population share white 2011
Source: Census of England and Wales,
KS201EW
Source: Census of Scotland DC2101SC
Unemployment Unemployment rate 2015
Source: US Bureau of Labor Statistics
Unemployment rate 2011
Source: Census of England and Wales
KS601EW to KS603EW
Source: Census of Scotland QS601SC_CA
Earnings Yearly income per capita in $, 2010-2014
Source: 2010 ACS five-year estimates
Weekly income 2011 in £, 2011
Source: Annual Survey of Hours and
Earnings
High education Population share (25 years or above) with
bachelor degree or higher, 2010-2014
Source: 2010 ACS five-year estimates
Population share (16 years or above) with
Level 4 qualifications or above, 2011
Source: 2011 Census of England and Wales
KS501EW
Source 2011 Census of Scotland KS501SC

Neuroticism and Brexit and Trump votes 24
Table 2: Correlations in UK
Mean SD 1 2 3 4 5 6 7 8 9 10 11 12 13 14
1 Brexit Vote: Leave 53.17 10.42 1.00
2 Neuroticism1 2.97 0.05 0.26 1.00
3 Anxiety1 2.96 0.05 0.36 0.92 1.00
4 Depression1 2.87 0.07 0.11 0.84 0.59 1.00
5 Openness1 3.66 0.07 -0.67 -0.14 -0.36 0.13 1.00
6 Conscientiousness1 3.66 0.06 0.31 -0.43 -0.22 -0.62 -0.43 1.00
7 Population density 1,491.85 2,248.11 -0.42 0.11 -0.10 0.38 0.60 -0.55 1.00
8 Scotland 0.08 0.28 -0.41 -0.07 -0.04 -0.09 0.00 -0.06 -0.14 1.00
9 Wales 0.06 0.23 0.00 0.11 0.04 0.20 0.01 -0.16 -0.12 -0.08 1.00
10 Historical industry structure 34.33 12.34 0.34 0.39 0.38 0.36 -0.34 -0.17 -0.03 -0.05 0.00 1.00
11 Liberal1 2.97 0.21 -0.65 -0.14 -0.25 -0.01 0.62 -0.24 0.49 -0.07 -0.05 -0.35 1.00
12 White 90.39 12.28 0.35 -0.07 0.10 -0.31 -0.46 0.50 -0.77 0.17 0.13 -0.08 -0.39 1.00
13 Unemployment 6.13 2.07 0.08 0.49 0.34 0.67 0.09 -0.59 0.44 0.11 0.10 0.44 -0.10 -0.41 1.00
14 Earnings 490.83 114.56 -0.51 -0.31 -0.36 -0.20 0.41 -0.04 0.38 -0.09 -0.16 -0.28 0.51 -0.31 -0.31 1.00
15 High education 26.91 7.67 -0.77 -0.42 -0.48 -0.29 0.64 -0.09 0.39 -0.06 -0.09 -0.46 0.70 -0.35 -0.42 0.80 1.00
Notes. Correlations above |0.1| are significant at the 5% level. 1Ranging from 1=low to 5=high.

Neuroticism and Brexit and Trump votes 25
Table 3: Correlations in US
Mean SD 1 2 3 4 5 6 7 8 9 10 11 12 13 14
1 Trump votes 63.40 15.65 1.00
2 Trump gains 5.22 5.28 0.43 1.00
3 Neuroticism1 2.93 0.09 0.37 0.44 1.00
4 Anxiety1 2.91 0.09 0.38 0.45 0.94 1.00
5 Depression1 2.83 0.1 0.22 0.29 0.85 0.65 1.00
6 Openness1 3.61 0.09 -0.48 -0.48 -0.20 -0.33 0.09 1.00
7 Conscientiousness1 3.59 0.08 -0.05 -0.08 -0.38 -0.34 -0.35 -0.06 1.00
8 Population density 381.93 2150.78 -0.30 -0.18 -0.03 -0.05 0.02 0.24 -0.04 1.00
9 Historical industry structure 25.36 11.73 0.21 0.25 0.26 0.28 0.19 -0.17 0.08 -0.04 1.00
10 Liberal1 2.74 0.24 -0.76 -0.30 -0.16 -0.20 -0.03 0.60 -0.15 0.30 -0.17 1.00
11 White 83.33 15.24 0.55 0.43 0.38 0.40 0.25 -0.23 -0.36 -0.21 0.09 -0.14 1.00
12 Unemployment 5.55 1.74 -0.07 0.08 0.08 0.05 0.13 0.00 0.20 -0.03 0.17 -0.09 -0.34 1.00
13 Earnings 24,666.21 5815.75 -0.35 -0.38 -0.19 -0.20 -0.12 0.35 -0.21 0.26 -0.20 0.46 0.11 -0.49 1.00
14 High education 21.92 9.56 -0.55 -0.62 -0.36 -0.35 -0.26 0.49 -0.12 0.24 -0.32 0.62 -0.06 -0.44 0.80 1.00
Notes. Correlations above |0.1| are significant at the 5% level. 1Ranging from 1=low to 5=high.

Neuroticism and Brexit and Trump votes 26
Table 4: Effects of Neuroticism on 2016 Brexit votes (leave) (1) (2) (3) (4) (5) (6)
N O+C N+O+C Industrial heritage Socio-economics I Socio-economics II
β (t) 95% CI β (t) 95% CI β (t) 95% CI β (t) 95% CI β (t) 95% CI β (t) 95% CI
Neuroticism 0.30*** 0.22, 0.38 0.21*** 0.12, 0.29 0.19*** 0.10, 0.27 0.08* 0.02, 0.15 0.01 -0.05, 0.06
(0.04) (0.04) (0.04) (0.03) (0.03)
Openness -0.61*** -0.69, -0.52 -0.52*** -0.61, -0.43 -0.48*** -0.57, -0.39 -0.29*** -0.37, -0.21 -0.13*** -0.18, -0.07
(0.04) (0.04) (0.05) (0.04) (0.03)
Conscientiousness -0.07 -0.15, 0.01 0.05 -0.03, 0.14 0.08 -0.00, 0.16 0.13*** 0.05, 0.20 0.08* 0.02, 0.14
(0.04) (0.04) (0.04) (0.04) (0.03)
Population density -0.53*** -0.60, -0.46 -0.16*** -0.25, -0.07 -0.16*** -0.25, -0.08 -0.17*** -0.25, -0.08 -0.05 -0.15, 0.05 -0.04 -0.12, 0.04
(0.04) (0.04) (0.04) (0.04) (0.05) (0.04)
Scotland -0.47*** -0.53, -0.41 -0.44*** -0.50, -0.37 -0.42*** -0.48, -0.35 -0.41*** -0.48, -0.34 -0.49*** -0.55, -0.44 -0.47*** -0.52, -0.42
(0.03) (0.03) (0.03) (0.04) (0.03) (0.02)
Wales -0.13*** -0.18, -0.07 -0.06* -0.11, -0.00 -0.06* -0.11, -0.01 -0.05* -0.10, -0.01 -0.10*** -0.14, -0.06 -0.09*** -0.13, -0.06
(0.03) (0.03) (0.03) (0.02) (0.02) (0.02)
Historical ind. structure 0.10** 0.03, 0.16 -0.02 -0.08, 0.04 -0.04 -0.08, 0.01
(0.03) (0.03) (0.02)
Liberal -0.30*** -0.37, -0.23 -0.15*** -0.20, -0.10
(0.04) (0.03)
White 0.14** 0.05, 0.23 0.04 -0.03, 0.11
(0.05) (0.04)
Unemployment 0.22*** 0.14, 0.31
(0.04)
Earnings -0.15** -0.24, -0.06
(0.05)
High education -0.60*** -0.68, -0.52
(0.04)
Constant 0.00 -0.07, 0.07 -0.00 -0.06, 0.06 -0.00 -0.06, 0.06 -0.00 -0.06, 0.06 0.00 -0.04, 0.04 0.00 -0.03, 0.03
(0.04) (0.03) (0.03) (0.03) (0.02) (0.02)
Observations 379 379 379 379 379 379
Adjusted R2 0.487 0.627 0.656 0.662 0.804 0.882
F-test 108.5 133 108.4 93.54 118.2 156.6
Notes. OLS regressions. Standardized regression coefficients and 95%CI for the standardized regression coefficients are given. Robust standard errors in parentheses are given. DV in
models 1-6: Share Brexit leave votes.
*** p<0.001, ** p<0.01, * p<0.05
Neuroticism and Brexit and Trump votes 27
Table 5: Effects of Neuroticism on 2016 US Presidential election (Trump votes) (1) (2) (3) (4) (5) (6)
N O+C N+O+C Industrial heritage Socio-economics I Socio-economics II
β (t) 95% CI β (t) 95% CI β (t) 95% CI β (t) 95% CI β (t) 95% CI β (t) 95% CI
Neuroticism 0.36*** 0.32, 0.40 0.30*** 0.26, 0.34 0.28*** 0.24, 0.32 0.10*** 0.07, 0.13 0.07*** 0.04, 0.10
(0.02) (0.02) (0.02) (0.01) (0.01)
Openness -0.43*** -0.48, -0.39 -0.37*** -0.41, -0.33 -0.36*** -0.40, -0.32 0.10*** 0.07, 0.13 0.10*** 0.08, 0.13
(0.02) (0.02) (0.02) (0.01) (0.01)
Conscientiousness -0.08*** -0.13, -0.04 0.03 -0.01, 0.08 0.02 -0.02, 0.07 0.04** 0.02, 0.07 0.04** 0.01, 0.06
(0.02) (0.02) (0.02) (0.01) (0.01)
Population density -0.29** -0.47, -0.10 -0.20* -0.36, -0.04 -0.20** -0.35, -0.05 -0.20** -0.35, -0.05 0.01 -0.01, 0.03 0.01 -0.01, 0.02
(0.09) (0.08) (0.07) (0.07) (0.01) (0.01)
Historical ind. structure 0.06*** 0.03, 0.10 0.02* 0.00, 0.05 0.01 -0.02, 0.03
(0.02) (0.01) (0.01)
Liberal -0.69*** -0.71, -0.66 -0.66*** -0.69, -0.62
(0.01) (0.02)
White 0.44*** 0.41, 0.47 0.46*** 0.43, 0.48
(0.01) (0.01)
Unemployment -0.05*** -0.08, -0.02
(0.02)
Earnings -0.11*** -0.14, -0.08
(0.01)
High education -0.14*** -0.17, -0.10
(0.02)
Constant -0.00 -0.04, 0.04 -0.00 -0.04, 0.04 -0.00 -0.03, 0.03 -0.00 -0.03, 0.03 -0.00 -0.02, 0.02 -0.00 -0.02, 0.02
(0.02) (0.02) (0.02) (0.02) (0.01) (0.01)
Observations 2,082 2,082 2,082 2,082 2,082 2,082
Adjusted R2 0.216 0.269 0.343 0.346 0.794 0.796
F-test 189.6 183.8 214 175 966.9 1210
Notes. OLS regressions. Standardized regression coefficients and 95%CI for the standardized regression coefficients are given. Robust standard errors in parentheses are given. DV
in models 1-6: Trump votes=2016 Republican two-party vote share.
*** p<0.001, ** p<0.01, * p<0.05

Neuroticism and Brexit and Trump votes 28
Table 6: Effects of Neuroticism on 2016 US Presidential election (Trump gains) (1) (2) (3) (4) (5) (6)
N O+C N+O+C Industrial heritage Socio-economics I Socio-economics II
β (t) 95% CI β (t) 95% CI β (t) 95% CI β (t) 95% CI β (t) 95% CI β (t) 95% CI
Neuroticism 0.43*** 0.39, 0.47 0.37*** 0.33, 0.41 0.34*** 0.30, 0.39 0.20*** 0.16, 0.25 0.09*** 0.05, 0.13
(0.02) (0.02) (0.02) (0.02) (0.02)
Openness -0.47*** -0.51, -0.43 -0.39*** -0.43, -0.35 -0.38*** -0.42, -0.34 -0.33*** -0.37, -0.28 -0.26*** -0.30, -0.23
(0.02) (0.02) (0.02) (0.02) (0.02)
Conscientiousness -0.11*** -0.14, -0.07 0.03 -0.00, 0.07 0.02 -0.02, 0.06 0.06** 0.02, 0.10 0.04* 0.00, 0.07
(0.02) (0.02) (0.02) (0.02) (0.02)
Population density -0.16** -0.27, -0.05 -0.07 -0.15, 0.01 -0.07* -0.14, -0.01 -0.07* -0.14, -0.01 0.02 -0.00, 0.05 0.02** 0.01, 0.03
(0.06) (0.04) (0.03) (0.03) (0.01) (0.01)
Historical ind. structure 0.09*** 0.06, 0.13 0.07*** 0.03, 0.10 0.00 -0.03, 0.03
(0.02) (0.02) (0.02)
Liberal 0.13*** 0.08, 0.18 0.31*** 0.27, 0.35
(0.02) (0.02)
White 0.36*** 0.32, 0.41 0.36*** 0.32, 0.39
(0.02) (0.02)
Unemployment 0.04 -0.01, 0.10
(0.03)
Earnings -0.29*** -0.33, -0.24
(0.02)
High education -0.63*** -0.67, -0.58
(0.02)
Constant 0.00 -0.04, 0.04 0.00 -0.04, 0.04 0.00 -0.03, 0.03 0.00 -0.03, 0.03 0.00 -0.03, 0.03 0.00 -0.03, 0.03
(0.02) (0.02) (0.02) (0.02) (0.02) (0.01)
Observations 2,082 2,082 2,082 2,082 2,082 2,082
Adjusted R2 0.216 0.245 0.356 0.363 0.480 0.607
F-test 219.7 199.6 217.6 191.5 185.9 357.7
Notes. OLS regressions. Standardized regression coefficients and 95%CI for the standardized regression coefficients are given. Robust standard errors in parentheses are given. DV
in models 1-6: Trump Gains=Gain in the Republican two-party vote share between 2012 and 2016.
*** p<0.001, ** p<0.01, * p<0.05

Neuroticism and Brexit and Trump votes 29
Figure 1. Brexit votes (leave) across UK LADs.

Neuroticism and Brexit and Trump votes 30
Figure 2. Regional distribution of Neuroticism across UK LADs.

Neuroticism and Brexit and Trump votes 31
Figure 3. Trump gains (= Gain in Republican two-party vote share between the 2012 and the 2016 election) across US counties. White
areas are counties that were dropped because of too few observations in the personality data set.

Neuroticism and Brexit and Trump votes 32
Figure 4. Regional distribution of Neuroticism across US counties. White areas are counties that were dropped because of too few
observations in the personality data set.

Neuroticism and Brexit and Trump votes 33
Online Supplementary Materials
METHODS
Regional level. We conduct our analysis at the county level in the US. In the UK, we
analyze the Local Authority District (LAD) level; there we focus only on regions in Scotland,
England, and Wales because the control variables are not available for Northern Ireland.
Personality data. For the UK, personality data (N=417,217) come from a large Internet-
based survey designed and administered between 2009 and 2011 in collaboration with the British
Broadcasting Corporation (BBC UK Lab project; see Rentfrow, Jokela, & Lamb, 2015; for details
of sample selection see Online Supplementary Methods). Between 2009 and 2011, approximately
588,014 individuals completed the survey. Participants reported the postcode in which they lived
at the time. The postcode information was used to determine the LAD in which participants lived.
We excluded participants with missing personality data and participants who could not be allocated
to LADs. To generate stable estimates of the personality scores, each LAD needed to have at least
100 respondents to be included (only the Isles of Scilly did not). These criteria resulted in a total
sample of 417,217 respondents in 379 LADs. The LAD sample size ranged from 115 (Orkney
Islands) to 6,201 (Birmingham), with a mean of 1,101 (SD = 816). The mean age of respondents
was 36 years (SD = 14 years) and 64% of the respondents were female. See [removed for blind
review] and [removed for blind review] for more information about the collection procedure,
sample structure, and representativeness of the data.
For the US, we use personality data from the Gosling-Potter Internet Project that started in
1999. The project collects personality data via a noncommercial Internet website, which can be
reached via several channels (e.g., search engines, unsolicited links on other webpages). People
can voluntarily participate in this study by completing a questionnaire on socio-demographic
variables, personality traits, and zip codes. As an incentive, participants received a personality

Neuroticism and Brexit and Trump votes 34
evaluation based on their responses. For this research, we used a dataset comprising 3,669,165
participants collected from 2003 (the first time respondents were asked to provide their ZIP code)
to 2015. Applying the same selection critieria as those used for the UK resulted in a sample of
3,167,041 respondents from 2,082 counties.1 The county sample sizes ranged from 100 (Kalkaska,
Michigan) to 78,789 (Los Angeles, California) with a mean of 1,521 (SD = 3,713). The mean age
of respondents was 26 years (SD = 12 years) and 64% of the respondents were female.
In both countries, the personality data were collected using the Big Five Inventory (BFI;
John & Srivastava, 1999), which consists of 44 items (5-point Likert scale, 1 = disagree strongly,
5 = agree strongly) (see also Rentfrow et al., 2015). We focus on neurotic traits, namely
Neuroticism as a broad Big Five trait, and Anxiety and Depression as established sub-facets of
Neuroticism. Following Soto and John (2009), Neuroticism was measured with eight items,
Anxiety with four items, and Depression with two items. The scales yielded acceptable levels of
internal consistency (e.g., α =.84 in the US and α =.83 in GB for Neuroticism). We aggregated the
individual-level observations based on the LAD/county in which the participants lived when the
survey took place. Across LADs in the UK, Neuroticism had a mean of 2.97 (SD = 0.05), Anxiety
had a mean of 2.96 (SD = 0.05), and Depression had a mean of 2.87 (SD = 0.07). Across counties
in the US, Neuroticism had a mean of 2.93 (SD = 0.09), Anxiety had a mean of 2.91 (SD = 0.09),
and Depression had a mean of 2.83 (SD = 0.10).
As mentioned above, we compare the neurotic traits to the role of Openness (UK: M = 3.66,
SD = 0.07; US: M = 3.61, SD = 0.09) and Conscientiousness (UK: M = 3.66, SD = 0.06; US: M =
3.59, SD = 0.08), which are the established regional personality correlates of voting behavior.
1 1,048 counties were dropped because of a sample size of less than 100. These counties are mainly rural areas in the
Midwest and Mountain Regions. We additionally exclude all 29 Alaska counties because election results are not
available at the county level in Alaska. The final sample still covers roughly two thirds of the US counties.

Neuroticism and Brexit and Trump votes 35
These data for Openness and Conscientiousness also come from the personality data sets described
above.
One potential issue of the personality data is representativeness because the data were
collected via an Internet-based survey. To assess the representativeness of the region-level
samples, we compared the demographic characteristics of the personality samples with data from
the 2011 UK Census data and American Community Survey (2010 ACS 5yr estimates). We
correlated the percentage of respondents in several major demographic categories from the
personality sample with the percentage of the population from that group within each region. The
representativeness of our samples varied considerably across variables. Regarding race, the
correlation between the regional share of White/Caucasian respondents and White/Caucasian
population share was 0.94 in both countries. The correlation between the respondent share with a
bachelor degree or higher and the respective population share was 0.78 in the UK and 0.52 in the
US. The correlation between the regional share of female respondents and female population
share was 0.34 in the UK and 0.06 in the US. With regard to age, the correlations of the
population share in specific age groups at the regional level in the UK were 0.22 (under 20
years), 0.64 (20-34 years), 0.83 (35-49 years), 0.81 (50-64 years) and 0.76 (over 65 years). In the
US the correlations were -0.01 (under 18 years), 0.62 (18-24 years), 0.27 (25-44 years), 0.40 (45-
64 years) and 0.38 (over 65 years). In short, the Personality samples are fairly representative
regarding race and education but not regarding age and gender. We also address this concern
regarding the representativeness of the samples with a robustness check in which we weight the
individual respondents in the personality sample – which are used for the computation of the
regional neurotic traits – by age and gender. The results of this robustness check did not differ
much from our main regressions (and are reported in detail in Online Appendix Table A6).

Neuroticism and Brexit and Trump votes 36
Note also that the personality data were collected via self-reports and were measured at a
slightly different time than the voting behavior. To the extent that these factors diminished the
validity of the personality estimates, the effects reported here are likely to be diminished too, so
any effects should be interpreted as conservative estimates. However, indirect evidence for the
validity of the personality estimates is provided by previous research undertaken at regional
levels, which has shown convergence between analyses based on self-reports and informant
reports (e.g., Gebauer et al., 2014) and has demonstrated reasonably strong levels of state-level
stability Elleman, Condon, Russin, & Revelle, 2017; Rentfrow et al., 2013).
Election data. We focus on two kinds of DVs. The first is the simple vote share for
Brexit and Trump, testing the idea that regions high on Neuroticism were particularly likely to be
swayed by populist campaigns. This DV mirrors those used in previous analyses and allows us to
test whether the 2016 elections differed from previous ones in now showing associations with
regional Neuroticism where previous votes had been associated only with regional Openness and
Conscientiousness.
The second kind of DV, which we can measure only in the US analyses, focuses on that
part of Trump’s vote that is not merely due to him being the Republican candidate. In other words,
we examine the shift to Trump, over and above the region’s historical tendency to vote for
Republican candidates. We thus aim at capturing the specific impact (and success) of Trump’s
populist campaign, with its clearer focus on fears and (potential) losses than seen in previous
campaigns (Inglehart & Norris, 2016). It has been suggested that it was these particular shifts to
Trump (e.g., in battlefield states) that lead to his victory (The Washington Post, 2016).

Neuroticism and Brexit and Trump votes 37
Data on the Brexit results are available at the LAD level from the UK Electoral
Commission (2016). The dependent variable was the share of votes for Brexit among the valid
votes (M = 53.17%, SD = 10.42).
US election data come from open data sources (Github 2017; OpenDataSoft 2016). For the
first dependent variable we use the share of Trump vote which is calculated as the two-party vote
share for the Republicans in 2016 (henceforth: Trump votes) (M = 63.4, SD = 15.65).2 The two-
party vote share ignores votes going to third parties such as the Green or Liberal Party.
To examine the shift to Trump over and above the existing tendency to vote Republican,
we compute the change of the Republican two-party vote from 2012 to 2016. For example if Trump
as the Republican candidate in 2016 had a 50% two-party vote share and Romney as the 2012
candidate had a 40% two-party vote share, the gain would be 10%. This gain in the two-party vote
share (henceforth: Trump gains) is our second dependent variable for the US analysis (M = 5.22,
SD = 5.28)3. Naturally, such a gain equals the corresponding loss of the Democratic candidate.
Control variables. We control for an array of variables which could potentially explain
voting behavior.
First, we control for population density because voters in regions with higher population
density (e.g. larger cities) tend not to vote for conservative candidates. In the UK analysis, we also
included country dummies for Scotland and Wales. Scotland and Wales are special cases because
of simmering independence movements and local culture. For example, there are strong economic
2 We report the average of the Republican two-party vote share at the county level. There are many more counties
that voted in favor of Trump than in favor of Clinton. But many of the counties Trump won are less populous
counties in rural areas. In contrast, many of the populous counties were won by Clinton as the overall popular vote. 3 This mean and standard deviation of the gain in the Republican two-party vote share was computed only for the
2,082 counties for which we have a sufficiently large number of respondents (100+ respondents) in the personality
data set. This corresponds to roughly two thirds of all US counties.

Neuroticism and Brexit and Trump votes 38
motives in Scotland to remain in the EU even after a potential independence from the UK because
a small country, like Scotland disproportionally gains from free trade in the EU (Schiff, 1997).
Second, we consider the regions’ industrial heritage. Recent studies and popular narratives
suggest that voters in the industrialized heartlands of the UK and US were particularly likely to
vote for Brexit and Donald Trump. One reason could be that the industrialized areas (e.g., the Rust
Belt in the US) are in a long phase of decline (Autor, Dorn, & Hansen, 2013; Autor et al., 2017).
One major promise of the Trump campaign was a policy shift away from free trade to protect jobs
in the industrialized heartland (“bringing back the manufacturing”). Additionally, popular
narratives suggest that the workforce in these industries viewed themselves with a lot of pride and
the loss of this pride during the industrial decline might have made them susceptible to populist
campaigns (see also Inglehart & Norris, 2016). To capture the effect of the historical industrial
decline in the old industrial centers, we include the employment share in manufacturing and mining
in the US for the year 1970 (M = 25.3%, SD = 11.76) and in the UK for the year 1971 as controls
(M = 34.33%, SD = 12.34). We chose data from the early 1970s over later time periods because
they provide good estimates of the industrial structure before de-industrialization accelerated from
the 1980s onwards.
Third, we consider political attitudes of the regional populace. Prior research has shown
that people who consider themselves as liberal tend to vote for left-wing parties and people who
consider themselves as conservatives tend to vote for right-wing parties (e.g., Langer & Cohen,
2004). So here we examine whether neurotic traits add any incremental predictive validity beyond
a simple effect of political attitudes. Specifically, we include a control variable reflecting the liberal
political attitude of the regional populace (single item: “I see myself as someone who is politically
liberal”, ranging from 1=strongly disagree to 5=strongly agree). The individual-level data come

Neuroticism and Brexit and Trump votes 39
from the Gosling-Potter Internet Project in both countries and were aggregated to the
corresponding regional levels in the US (M = 2.74, SD = 0.24) and UK (M = 2.97, SD = 0.21).
Fourth, the Trump and Brexit campaigns were reported to stir up racial tensions with regard
to migration (e.g., Major, Blodorn, & Blascovich, 2016) and racial composition of the population
can predict voting behavior (e.g. Rentfrow et al., 2015; Autor et al., 2015). We therefore included
the share of white inhabitants (US: M = 83.29%, SD = 15.24; UK M = 90.39%, SD = 12.28).
Fifth, we consider current economic hardship in the region. Voters suffering from poor
economic conditions can voice their dissent with current economic policy by voting for the
opposition (Republicans in the 2016 US election) or the Brexit campaign. We include the
unemployment share and earnings in our analysis. In the US case, we use the 2015 unemployment
data from the Bureau of Labor Statistics (M = 5.56%, SD = 1.74) and the yearly income per capita
in the 2010-2014 period from the American Community Survey (ACS) (M = $24.688, SD = 5.829).
In the UK, we use the unemployment data from the 2011 Census (M = 6.13%, SD = 2.07) and the
weekly income in 2011 from Annual Survey of Hours and Earnings (M = £490.83, SD = 114.56).
Finally, we also use the educational attainment of the population as a control variable
because education can also predict election results (Rentfrow et al., 2013). We expect educational
attainment to be important for two reasons. First, better educated people have profited in the last
decades from free trade in terms of better job chances and higher earnings (Autor, 2014). This
makes it more likely that they will vote against Trump and Brexit, which have isolationistic
tendencies. Second, populist campaigns may offer simplified solutions to complex problems and
better educated people might find these simplified solutions unrealistic and thus vote against these
campaigns (Seligson, 2007). In the US, we use the population share with a bachelor degree or
higher. The data come from the 2010 ACS 5yr estimates in the US (M = 21.92%, SD = 9.56). In

Neuroticism and Brexit and Trump votes 40
the UK, we use the population share with NVQ level 4 qualification or above, roughly equivalent
to degree level. The data come from the 2011 Census (M = 26.91%, SD = 7.67).
All variables and their sources are reported in Table 1.

Neuroticism and Brexit and Trump votes 41
Table A1: Effects of Anxiety and Depression on 2016 Brexit votes (leave) (1) (2) (3) (4) (5) (6)
N O+C N+O+C Industrial heritage Socio-economics I Socio-economics II
β (t) 95% CI β (t) 95% CI β (t) 95% CI β (t) 95% CI β (t) 95% CI β (t) 95% CI
Panel A (Anxiety)
Anxiety 0.30*** 0.22, 0.37 0.14** 0.05, 0.22 0.12** 0.03, 0.20 0.04 -0.02, 0.10 -0.01 -0.06, 0.03
(0.04) (0.04) (0.04) (0.03) (0.02)
Openness -0.61*** -0.69, -0.52 -0.53*** -0.63, -0.44 -0.48*** -0.58, -0.38 -0.29*** -0.37, -0.21 -0.13*** -0.19, -0.07
(0.04) (0.05) (0.05) (0.04) (0.03)
Conscientiousness -0.07 -0.15, 0.01 -0.00 -0.09, 0.08 0.03 -0.05, 0.11 0.11** 0.03, 0.18 0.07* 0.01, 0.13
(0.04) (0.04) (0.04) (0.04) (0.03)
Controls Yes Yes Yes Yes Yes Yes Yes
Observations 379 379 379 379 379 379
Adjusted R2 0.486 0.627 0.639 0.648 0.801 0.882
Panel B (Depression)
Depression 0.35*** 0.27, 0.43 0.33*** 0.25, 0.42 0.31*** 0.23, 0.40 0.15*** 0.07, 0.22 0.03 -0.03, 0.10
(0.04) (0.04) (0.04) (0.04) (0.04)
Openness -0.61*** -0.69, -0.52 -0.52*** -0.61, -0.44 -0.49*** -0.58, -0.41 -0.31*** -0.38, -0.23 -0.13*** -0.19, -0.07
(0.04) (0.04) (0.04) (0.04) (0.03)
Conscientiousness -0.07 -0.15, 0.01 0.13** 0.05, 0.22 0.14*** 0.06, 0.23 0.15*** 0.07, 0.23 0.09** 0.03, 0.15
(0.04) (0.04) (0.04) (0.04) (0.03)
Controls Yes Yes Yes Yes Yes Yes
Observations 379 379 379 379 379 379
Adjusted R2 0.496 0.627 0.688 0.690 0.810 0.882
Notes. OLS regressions. Standardized regression coefficients are given. Robust standard errors in parentheses are given. DV in models 1-6: Share Brexit leave votes. Panel A:
Models with Anxiety as IV. Panel B: Models with Depression as IV. The control variables are the same as in Table 4 but are suppressed due to brevity.
*** p<0.001, ** p<0.01, * p<0.05

Neuroticism and Brexit and Trump votes 42
Table A2: Effects of Anxiety and Depression on 2016 US Presidential election (Trump votes) (1) (2) (3) (4) (5) (6)
N O+C N+O+C Industrial heritage Socio-economics I Socio-economics II
β (t) 95% CI β (t) 95% CI β (t) 95% CI β (t) 95% CI β (t) 95% CI β (t) 95% CI
Panel A (Anxiety)
Anxiety 0.37*** 0.33, 0.40 0.26*** 0.22, 0.30 0.23*** 0.19, 0.28 0.09*** 0.06, 0.12 0.07*** 0.04, 0.10
(0.02) (0.02) (0.02) (0.01) (0.01)
Openness -0.43*** -0.48, -0.39 -0.34*** -0.38, -0.30 -0.34*** -0.38, -0.29 0.12*** 0.09, 0.14 0.12*** 0.09, 0.14
(0.02) (0.02) (0.02) (0.01) (0.01)
Conscientiousness -0.08*** -0.13, -0.04 0.01 -0.03, 0.05 -0.00 -0.05, 0.04 0.03** 0.01, 0.06 0.03** 0.01, 0.06
(0.02) (0.02) (0.02) (0.01) (0.01)
Controls Yes Yes Yes Yes Yes Yes
Observations 2,082 2,082 2,082 2,082 2,082 2,082
Adjusted R2 0.222 0.269 0.320 0.325 0.793 0.796
Panel B (Depression)
Depression 0.23*** 0.19, 0.27 0.27*** 0.24, 0.31 0.25*** 0.21, 0.29 0.08*** 0.05, 0.11 0.05** 0.02, 0.08
(0.02) (0.02) (0.02) (0.01) (0.01)
Openness -0.43*** -0.48, -0.39 -0.45*** -0.50, -0.41 -0.44*** -0.48, -0.40 0.07*** 0.04, 0.10 0.09*** 0.06, 0.11
(0.02) (0.02) (0.02) (0.01) (0.01)
Conscientiousness -0.08*** -0.13, -0.04 0.01 -0.03, 0.06 -0.00 -0.04, 0.04 0.03** 0.01, 0.06 0.03* 0.00, 0.05
(0.02) (0.02) (0.02) (0.01) (0.01)
Controls Yes Yes Yes Yes Yes Yes
Observations 2,082 2,082 2,082 2,082 2,082 2,082
Adjusted R2 0.140 0.269 0.334 0.339 0.792 0.795
Notes. OLS regressions. Standardized regression coefficients and 95%CI for the standardized regression coefficients are given. Robust standard errors in parentheses are given. DV
in models 1-6: Trump votes=2016 Republican two-party vote share. Panel A: Models with Anxiety as IV. Panel B: Models with Depression as IV. The control variables are the
same as in Tables 5 and 6 but are suppressed due to brevity.
*** p<0.001, ** p<0.01, * p<0.05

Neuroticism and Brexit and Trump votes 43
Table A3: Effects of Anxiety and Depression on 2016 US Presidential election (Trump gains) (1) (2) (3) (4) (5) (6)
N O+C N+O+C Industrial heritage Socio-economics I Socio-economics II
β (t) 95% CI β (t) 95% CI β (t) 95% CI β (t) 95% CI β (t) 95% CI β (t) 95% CI
Panel A (Anxiety)
Anxiety 0.44*** 0.40, 0.48 0.33*** 0.28, 0.37 0.29*** 0.25, 0.34 0.14*** 0.10, 0.19 0.05** 0.02, 0.09
(0.02) (0.02) (0.02) (0.02) (0.02)
Openness -0.47*** -0.51, -0.43 -0.35*** -0.39, -0.31 -0.35*** -0.39, -0.30 -0.30*** -0.35, -0.26 -0.25*** -0.29, -0.22
(0.02) (0.02) (0.02) (0.02) (0.02)
Conscientiousness -0.11*** -0.14, -0.07 0.01 -0.03, 0.05 -0.01 -0.05, 0.03 0.03 -0.01, 0.07 0.02 -0.01, 0.06
(0.02) (0.02) (0.02) (0.02) (0.02)
Controls Yes Yes Yes Yes Yes Yes
Observations 2,082 2,082 2,082 2,082 2,082 2,082
Adjusted R2 0.222 0.245 0.325 0.336 0.466 0.604
Panel B (Depression)
Depression 0.30*** 0.25, 0.34 0.34*** 0.30, 0.38 0.31*** 0.27, 0.35 0.20*** 0.16, 0.25 0.09*** 0.05, 0.12
(0.02) (0.02) (0.02) (0.02) (0.02)
Openness -0.47*** -0.51, -0.43 -0.49*** -0.53, -0.45 -0.47*** -0.51, -0.43 -0.39*** -0.44, -0.34 -0.29*** -0.33, -0.25
(0.02) (0.02) (0.02) (0.02) (0.02)
Conscientiousness -0.11*** -0.14, -0.07 0.01 -0.03, 0.05 -0.01 -0.05, 0.03 0.05** 0.02, 0.09 0.04* 0.00, 0.07
(0.02) (0.02) (0.02) (0.02) (0.02)
Controls Yes Yes Yes Yes Yes Yes
Observations 2,082 2,082 2,082 2,082 2,082 2,082
Adjusted R2 0.118 0.245 0.346 0.357 0.483 0.607
Notes. OLS regressions. Standardized regression coefficients and 95%CI for the standardized regression coefficients are given. Robust standard errors in parentheses are given. DV
in models 1-6: Trump gains=Gain in the Republican two-party vote share between 2012 and 2016. Panel A: Models with Anxiety as IV. Panel B: Models with Depression as IV.
The control variables are the same as in Tables 5 and 6 but are suppressed due to brevity.
*** p<0.001, ** p<0.01, * p<0.05

Neuroticism and Brexit and Trump votes 44
Table A4: Robustness Checks with all Big Five traits: Effects of Neuroticism on 2016 Brexit votes (leave) (1) (2) (3) (4) (5) (6)
N O+C N+O+C Industrial heritage Socio-economics I Socio-economics II
β (t) 95% CI β (t) 95% CI β (t) 95% CI β (t) 95% CI β (t) 95% CI β (t) 95% CI
Neuroticism 0.30*** 0.22, 0.38 0.14** 0.05, 0.23 0.12** 0.03, 0.21 0.05 -0.01, 0.11 -0.01 -0.07, 0.04
(0.04) (0.05) (0.05) (0.03) (0.03)
Openness -0.52*** -0.60, -0.43 -0.48*** -0.57, -0.40 -0.44*** -0.54, -0.35 -0.29*** -0.37, -0.21 -0.13*** -0.18, -0.07
(0.04) (0.05) (0.05) (0.04) (0.03)
Conscientiousness -0.04 -0.12, 0.04 0.02 -0.07, 0.11 0.05 -0.04, 0.13 0.14*** 0.07, 0.22 0.11*** 0.05, 0.17
(0.04) (0.04) (0.04) (0.04) (0.03)
Agreeableness 0.05 -0.03, 0.13 0.07 -0.01, 0.15 0.06 -0.02, 0.15 -0.06 -0.14, 0.02 -0.09** -0.15, -0.03
(0.04) (0.04) (0.04) (0.04) (0.03)
Extraversion -0.21*** -0.28, -0.15 -0.15*** -0.23, -0.07 -0.15*** -0.23, -0.07 -0.04 -0.11, 0.02 -0.00 -0.05, 0.05
(0.03) (0.04) (0.04) (0.03) (0.03)
Controls Yes Yes Yes Yes Yes Yes
Observations 379 379 379 379 379 379
Adjusted R2 0.487 0.661 0.671 0.677 0.806 0.885
Notes. OLS regressions. Standardized regression coefficients and 95%CI for the standardized regression coefficients are given. Robust standard errors in parentheses are given. DV
in models 1-6: Share Brexit leave votes. The control variables are the same as in Table 4 but are suppressed due to brevity.
*** p<0.001, ** p<0.01, * p<0.05

Neuroticism and Brexit and Trump votes 45
Table A5: Robustness Checks with all Big Five traits: Effects of Neuroticism on 2016 US Presidential election (Trump votes and
Trump gains) (1) (2) (3) (4) (5) (6)
N O+C N+O+C Industrial heritage Socio-economics I Socio-economics II
β (t) 95% CI β (t) 95% CI β (t) 95% CI β (t) 95% CI β (t) 95% CI β (t) 95% CI
Panel A (Trump
votes)
Neuroticism 0.36*** 0.32, 0.40 0.30*** 0.25, 0.34 0.27*** 0.22, 0.31 0.10*** 0.07, 0.14 0.07*** 0.04, 0.11
(0.02) (0.02) (0.02) (0.02) (0.02)
Openness -0.48*** -0.52, -
0.43
-0.38*** -0.42, -0.34 -0.38*** -0.42, -
0.34
0.10*** 0.07, 0.13 0.11*** 0.08, 0.14
(0.02) (0.02) (0.02) (0.01) (0.01)
Conscientiousness 0.08** 0.02, 0.13 0.14*** 0.09, 0.19 0.13*** 0.08, 0.19 0.03 -0.00, 0.06 0.02 -0.01, 0.05
(0.03) (0.03) (0.03) (0.02) (0.02)
Agreeableness -0.23*** -0.28, -
0.17
-0.17*** -0.22, -0.11 -0.18*** -0.24, -
0.13
0.03 -0.01, 0.06 0.03 -0.01, 0.06
(0.03) (0.03) (0.03) (0.02) (0.02)
Extraversion -0.06*** -0.10, -
0.03
0.05** 0.01, 0.09 0.05* 0.01, 0.09 -0.00 -0.03, 0.02 -0.01 -0.03, 0.02
(0.02) (0.02) (0.02) (0.01) (0.01)
Controls Yes Yes Yes Yes Yes Yes
Observations 2,082 2,082 2,082 2,082 2,082 2,082
Adjusted R2 0.216 0.302 0.357 0.362 0.794 0.797
Panel B (Trump
gains)
Neuroticism 0.43*** 0.39, 0.47 0.39*** 0.35, 0.44 0.35*** 0.30, 0.40 0.22*** 0.17, 0.27 0.11*** 0.06, 0.15
(0.02) (0.02) (0.02) (0.03) (0.02)
Openness -0.50*** -0.55, -
0.46
-0.38*** -0.42, -0.34 -0.38*** -0.42, -
0.33
-0.33*** -0.38, -
0.28
-0.27*** -0.31, -
0.23 (0.02) (0.02) (0.02) (0.02) (0.02)
Conscientiousness 0.03 -0.02, 0.08 0.11*** 0.06, 0.16 0.10*** 0.05, 0.15 0.11*** 0.06, 0.16 0.09*** 0.05, 0.13
(0.03) (0.03) (0.03) (0.02) (0.02)
Agreeableness -0.19*** -0.24, -
0.14
-0.11*** -0.16, -0.06 -0.13*** -0.18, -
0.08
-0.10*** -0.15, -
0.05
-0.09*** -0.13, -
0.05 (0.03) (0.03) (0.03) (0.03) (0.02)
Extraversion -0.07*** -0.11, -
0.03
0.09*** 0.05, 0.13 0.08*** 0.04, 0.12 0.06** 0.02, 0.10 0.06*** 0.03, 0.10
(0.02) (0.02) (0.02) (0.02) (0.02)
Controls Yes Yes Yes Yes Yes Yes
Observations 2,082 2,082 2,082 2,082 2,082 2,082
Adjusted R2 0.216 0.270 0.366 0.375 0.485 0.612
Notes. OLS regressions. Standardized regression coefficients and 95%CI for the standardized regression coefficients are given. Robust standard errors in
parentheses are given. DV in models 1-6: Panel A: Models with DV Trump votes=2016 Republican two-party vote share. Panel B: Models with DV Trump
gains=Gain in the Republican two-party vote share between 2012 and 2016. The control variables are the same as in Tables 5 and 6 but are suppressed due to
brevity.
*** p<0.001, ** p<0.01, * p<0.05

Neuroticism and Brexit and Trump votes 46
Table A6: Robustness Checks with weighted traits: Effects of weighted Neuroticism on 2016 Brexit votes (leave) and on 2016 US
Presidential election (Trump votes and Trump gains) (1) (2) (3) (4) (5) (6)
N O+C N+O+C Industrial heritage Socio-economics I Socio-economics II
β (t) 95% CI β (t) 95% CI β (t) 95% CI β (t) 95% CI β (t) 95% CI β (t) 95% CI
Panel A (Brexit)
Neuroticism 0.24*** 0.17, 0.32 0.20*** 0.12, 0.27 0.16*** 0.08, 0.24 0.08** 0.02, 0.14 0.00 -0.04, 0.05
(0.04) (0.04) (0.04) (0.03) (0.02)
Openness -0.49*** -0.58, -
0.41
-0.44*** -0.53, -0.36 -0.39*** -0.48, -
0.30
-0.22*** -0.29, -
0.15
-0.08** -0.13, -
0.03 (0.04) (0.04) (0.04) (0.04) (0.03)
Conscientiousness -0.01 -0.09, 0.07 0.07 -0.01, 0.16 0.06 -0.02, 0.15 0.09** 0.02, 0.15 0.04 -0.01, 0.09
(0.04) (0.04) (0.04) (0.03) (0.03)
Controls Yes Yes Yes Yes Yes Yes Yes
Adjusted R2 0.457 0.574 0.606 0.621 0.784 0.875
Panel B (Trump
votes)
Neuroticism 0.24*** 0.20, 0.28 0.19*** 0.15, 0.23 0.16*** 0.12, 0.21 0.06*** 0.04, 0.09 0.05*** 0.02, 0.07
(0.02) (0.02) (0.02) (0.01) (0.01)
Openness -0.39*** -0.43, -
0.34
-0.35*** -0.39, -0.30 -0.33*** -0.38, -
0.29
0.05*** 0.02, 0.07 0.05*** 0.03, 0.08
(0.02) (0.02) (0.02) (0.01) (0.01)
Conscientiousness -0.04 -0.09, 0.00 0.05* 0.00, 0.10 0.02 -0.03, 0.07 0.01 -0.02, 0.03 -0.00 -0.03, 0.02
(0.02) (0.02) (0.02) (0.01) (0.01)
Controls Yes Yes Yes Yes Yes Yes Yes
Adjusted R2 0.145 0.233 0.260 0.272 0.786 0.790 0.145
Panel C (Trump
gains)
Neuroticism 0.29*** 0.25, 0.34 0.30*** 0.25, 0.34 0.26*** 0.21, 0.30 0.13*** 0.09, 0.17 0.07*** 0.03, 0.11
(0.02) (0.02) (0.02) (0.02) (0.02)
Openness -0.35*** -0.39, -
0.31
-0.28*** -0.33, -0.24 -0.27*** -0.31, -
0.23
-0.20*** -0.24, -
0.16
-0.15*** -0.19, -
0.12 (0.02) (0.02) (0.02) (0.02) (0.02)
Conscientiousness -0.01 -0.04, 0.03 0.13*** 0.09, 0.17 0.09*** 0.05, 0.14 0.11*** 0.07, 0.15 0.09*** 0.05, 0.12
(0.02) (0.02) (0.02) (0.02) (0.02)
Controls Yes Yes Yes Yes Yes Yes
Adjusted R2 0.117 0.149 0.214 0.233 0.431 0.583
Notes. OLS regressions. Standardized regression coefficients and 95%CI for the standardized regression coefficients are given. Robust standard errors in
parentheses are given. DV in models 1-6: Panel A: Models with DV Brexit leave votes. Panel B: Models with DV Trump votes=2016 Republican two-party vote
share. Panel C: Models with DV Trump gains=Gain in the Republican two-party vote share between 2012 and 2016. The traits neuroticism, openness and
conscientiousness are weighted by age and gender to match the regional age-gender distribution. The control variables are the same as in Tables 4, 5 and 6 but are
suppressed due to brevity. *** p<0.001, ** p<0.01, * p<0.05.

Neuroticism and Brexit and Trump votes 47
Related Documents