Welcome message from author
This document is posted to help you gain knowledge. Please leave a comment to let me know what you think about it! Share it to your friends and learn new things together.
Transcript

FISCAL YEAR 2010 ADOPTED OPERATING & CAPITAL FUNDS BUDGET
(JULY 1, 2009 THROUGH JUNE 30, 2010)
MARTA OFFICE OF MANAGEMENT AND BUDGET 2424 PIEDMONT ROAD · ATLANTA, GA
PHONE (404) 848-5000 · FAX (404) 848-5683 http://www.itsmarta.com
The Government Finance Officers Association of the United States and Canada (GFOA) presented a Distinguished Budget Presentation Award to the Metropolitan Atlanta Rapid Transit Authority (MARTA) for its annual budget for the fiscal year beginning July 1, 2008. In order to receive this award, a governmental unit must publish a budget document that meets program criteria as a policy document, as an operations guide, as a financial plan, and as a communications device. MARTA has been the consistent recipient of this award since 1993. This award is valid for a period of one year only. We believe our current budget continues to conform to program requirements, and we are submitting it to GFOA to determine its eligibility for another award.
FY10 OPERATING & CAPITAL BUDGETS
LETTER FROM THE GENERAL MANAGER/CEO
December 10, 2009 As MARTA marks its 30th Anniversary in the metro region, we are extremely proud of the services we provide to our riders, to the region and the state. Over the past three decades, MARTA has made huge contributions to Georgia’s economic growth, to our environment and our overall quality of life. MARTA matters because we proudly provide more than one-half million trips every day, ensuring that customers throughout our service area and beyond get to their jobs, to doctors’ offices, to schools and universities, commercial centers and to the world’s busiest airport.
MARTA matters because we have helped attract scores of new companies, thousands of new jobs and billions of dollars worth of economic development. MARTA matters because transit helps sustain the convention and tourism industry that is the mainstay of our economy. MARTA matters because by removing approximately 185,000 cars from congested roads and highways every weekday, we enhance mobility, increase productivity and reduce millions of tons of carbon emissions. It’s hard to imagine metro Atlanta and the state of Georgia without MARTA. The region would lack $2.3 billion in economic activity we pump annually into the economy. Metro Atlanta would never have experienced the historic achievement of hosting the Centennial Olympic Games. Without MARTA, there would be more traffic that would choke the region by making it harder to attract and retain corporations, jobs and residents. Our environment would suffer greatly and we would not enjoy our status as one of the top convention centers in the world. We are proud of those accomplishments as we mark 30 years of service, and we are thankful for the visionary leadership and sustained support of our member jurisdictions -- DeKalb and Fulton Counties and the City of Atlanta.
Today, however, we are at a crossroads, and the visionary leadership that gave birth to MARTA 30 years ago is again needed to ensure its survival. The time is now for our expanded region and state to make a serious commitment to investing in quality regional transit that builds on the significant investment of the past 30 years. Without new vision, new funding partners and action to expand quality regional transit, we will see many of our achievements slip away. For years, MARTA has warned regional and state leaders that the current funding structure for mass transit is inadequate and outmoded. Only Fulton, DeKalb and the City of Atlanta, provide sales-tax funding for a mass transit system that serves us all and is now 30 years old. To continue providing quality service, new transit funding partners are needed at the regional and state level. MARTA has taken dramatic steps to address the current funding crisis and to live within its means. We have increased fares for the first time since 2001, and adjusted service levels to achieve new efficiencies and cost savings. MARTA employees are sacrificing greatly to help reduce costs, including higher health care contributions, the elimination of all annual merit increases and 10 days of unpaid furloughs for non-represented employees. Those savings will reduce costs by $70.4 million through fiscal year 2012. But they are not enough to offset massive losses in revenues. Only new sources of revenue from the state and the region can help MARTA and other transit providers continue to provide current levels of service and expand. Despite an economic downturn that has affected us all, communities across the United States are showing the vision to forge ahead with significant new investments in transit. Those investments will help them to compete in a revived economy for new industry, new jobs, new investment and a cleaner environment. To stay competitive and help our economy continue to grow, the region and state must come together to invest in a regional transit system.
FY10 OPERATING & CAPITAL BUDGETS
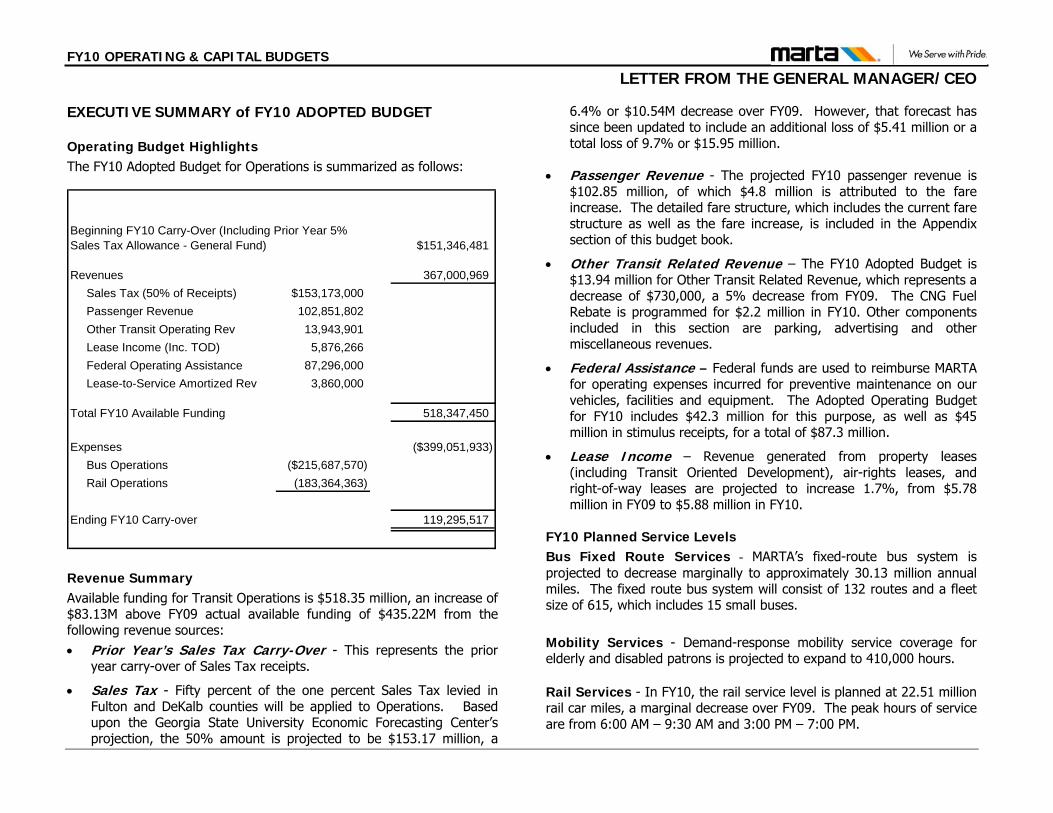
LETTER FROM THE GENERAL MANAGER/CEO EXECUTIVE SUMMARY of FY10 ADOPTED BUDGET Operating Budget Highlights The FY10 Adopted Budget for Operations is summarized as follows:
$151,346,481
Revenues 367,000,969 Sales Tax (50% of Receipts) $153,173,000Passenger Revenue 102,851,802 Other Transit Operating Rev 13,943,901 Lease Income (Inc. TOD) 5,876,266 Federal Operating Assistance 87,296,000 Lease-to-Service Amortized Rev 3,860,000
Total FY10 Available Funding 518,347,450
Expenses ($399,051,933)Bus Operations ($215,687,570)Rail Operations (183,364,363)
Ending FY10 Carry-over 119,295,517
Beginning FY10 Carry-Over (Including Prior Year 5% Sales Tax Allowance - General Fund)
Revenue Summary Available funding for Transit Operations is $518.35 million, an increase of $83.13M above FY09 actual available funding of $435.22M from the following revenue sources: • Prior Year’s Sales Tax Carry-Over - This represents the prior
year carry-over of Sales Tax receipts.
• Sales Tax - Fifty percent of the one percent Sales Tax levied in Fulton and DeKalb counties will be applied to Operations. Based upon the Georgia State University Economic Forecasting Center’s projection, the 50% amount is projected to be $153.17 million, a
6.4% or $10.54M decrease over FY09. However, that forecast has since been updated to include an additional loss of $5.41 million or a total loss of 9.7% or $15.95 million.
• Passenger Revenue - The projected FY10 passenger revenue is $102.85 million, of which $4.8 million is attributed to the fare increase. The detailed fare structure, which includes the current fare structure as well as the fare increase, is included in the Appendix section of this budget book.
• Other Transit Related Revenue – The FY10 Adopted Budget is $13.94 million for Other Transit Related Revenue, which represents a decrease of $730,000, a 5% decrease from FY09. The CNG Fuel Rebate is programmed for $2.2 million in FY10. Other components included in this section are parking, advertising and other miscellaneous revenues.
• Federal Assistance – Federal funds are used to reimburse MARTA for operating expenses incurred for preventive maintenance on our vehicles, facilities and equipment. The Adopted Operating Budget for FY10 includes $42.3 million for this purpose, as well as $45 million in stimulus receipts, for a total of $87.3 million.
• Lease Income – Revenue generated from property leases (including Transit Oriented Development), air-rights leases, and right-of-way leases are projected to increase 1.7%, from $5.78 million in FY09 to $5.88 million in FY10.
FY10 Planned Service Levels Bus Fixed Route Services - MARTA’s fixed-route bus system is projected to decrease marginally to approximately 30.13 million annual miles. The fixed route bus system will consist of 132 routes and a fleet size of 615, which includes 15 small buses. Mobility Services - Demand-response mobility service coverage for elderly and disabled patrons is projected to expand to 410,000 hours. Rail Services - In FY10, the rail service level is planned at 22.51 million rail car miles, a marginal decrease over FY09. The peak hours of service are from 6:00 AM – 9:30 AM and 3:00 PM – 7:00 PM.
FY10 OPERATING & CAPITAL BUDGETS
LETTER FROM THE GENERAL MANAGER/CEO Capital Improvements
Marta is responsible for maintaining and improving $6.4 billion in infrastructure that has been built over the years with taxpayer dollars, but the funding needed to protect that investment is woefully inadequate. These severe financial constraints have limited our ability to plan for the future and ideally position ourselves to take advantage of federal transportation opportunities, going forward. Our capital improvement program has been seriously impacted by the protracted economic downturn and MARTA is struggling to keep pace with regulatory state of good repair and federal safety standards that are constantly being updated. Despite these challenges, MARTA completed a life system safety review in FY09 and remains absolutely focused on critical safety needs. In addition, numerous improvement programs are underway that will enhance MARTA in the next few years. These include upgrades to lighting and escalators in the stations; continued acquisition of clean fuel buses and new L-vans for Paratransit service; rebuilding and upgrading trackway; and the completion of the rail car rehabilitation program. The budget also anticipates several new initiatives including:
• Implementation of a configuration management program
• Environmental/sustainability initiatives
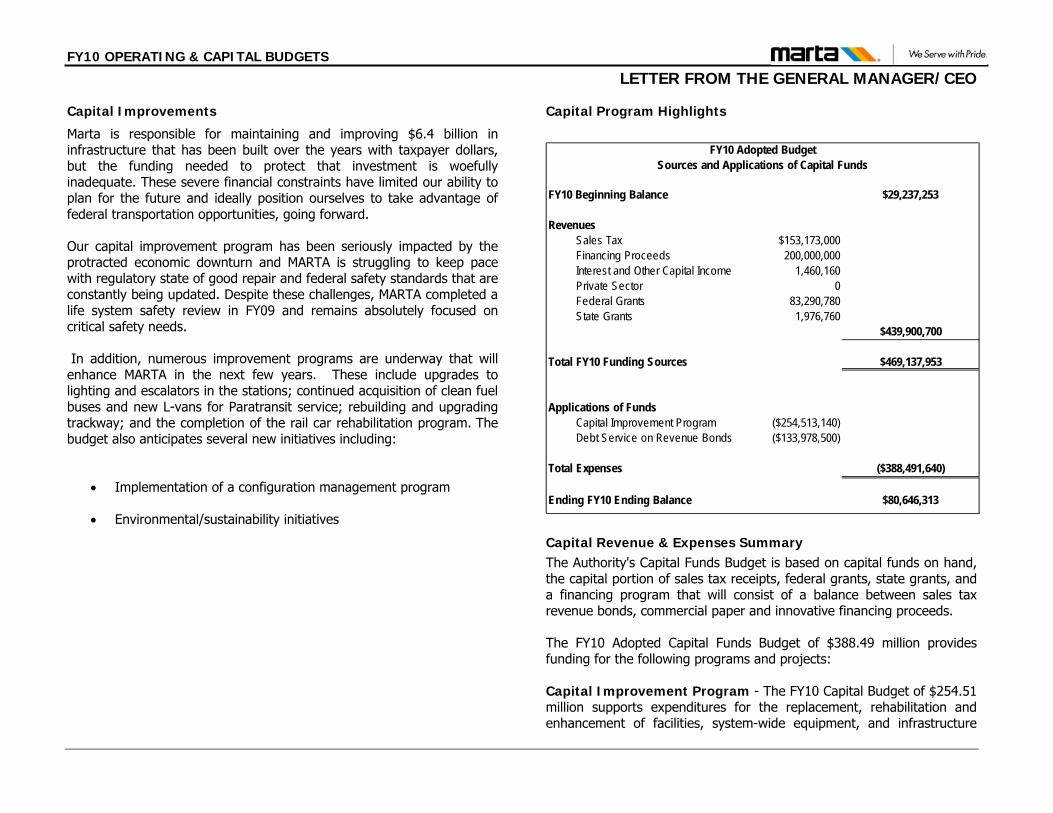
Capital Program Highlights
$29,237,253
Sales Tax $153,173,000 Financing Proceeds 200,000,000Interest and Other Capital Income 1,460,160Private Sector 0Federal Grants 83,290,780State Grants 1,976,760
$439,900,700
$469,137,953
Capital Improvement Program ($254,513,140)Debt Service on Revenue Bonds ($133,978,500)
($388,491,640)
$80,646,313
Total Expenses
Ending FY10 Ending Balance
Applications of Funds
Total FY10 Funding Sources
FY10 Beginning Balance
Revenues
FY10 Adopted BudgetSources and Applications of Capital Funds
Capital Revenue & Expenses Summary The Authority's Capital Funds Budget is based on capital funds on hand, the capital portion of sales tax receipts, federal grants, state grants, and a financing program that will consist of a balance between sales tax revenue bonds, commercial paper and innovative financing proceeds. The FY10 Adopted Capital Funds Budget of $388.49 million provides funding for the following programs and projects: Capital Improvement Program - The FY10 Capital Budget of $254.51 million supports expenditures for the replacement, rehabilitation and enhancement of facilities, system-wide equipment, and infrastructure
FY10 OPERATING & CAPITAL BUDGETS
LETTER FROM THE GENERAL MANAGER/CEO related to the support of Transit Operations; Non-Operating Expense Projects; and Transit Planning Program activities. Examples of these programs include the rehabilitation of existing facilities; system-wide equipment and infrastructure upgrades and replacements; continued implementation of ADA modifications; the track renovation program; security improvements; information technology upgrades and replacement; and the replacement of revenue and support vehicles. Also included in these programs is the effort to support clean air, highlighted by the continued delivery of new Compressed Natural Gas and/or clean diesel powered buses. Bond Debt Service and Other Financing Programs - A total of $133.98 million is programmed for the principal and interest payments on outstanding and new debt. Summary MARTA delivers tremendous benefits to the region and the state by attracting new businesses and new jobs, improving workforce productivity, lessening traffic congestion and improving the air we breathe. Those benefits could be lost, however, if we fail to adequately fund and expand transit in our region. We need for our region and our state to join us as funding partners in order to continue to provide these important benefits. This budget allows us to do so for the current fiscal year. But an anticipated loss of $1.4 billion in revenues portends an uncertain future for regional transit. The loss of transit means the loss of economic growth, new jobs and businesses that keep our region thriving. The loss or diminution of transit will also hurt our environment, increase traffic congestion, and make metro Atlanta a less-desirable place to live, work or to locate a business. We call on our region and state to join us in an effort to expand transit, and in doing so, to help our region to thrive and grow. Consequently, throughout FY10 we will make our case for “MARTA Matters” to detail the value we bring for Quality of Life, Economic Impact and Mobility/Access for our region and state.
FY10 OPERATING & CAPITAL BUDGETS
BOARD OF DIRECTORS
i
Officers and Directors
Michael Walls, City of Atlanta, Chairman
JoAnn Godfrey McClinton, DeKalb County, Vice Chair
Michael W. Tyler, Fulton County, Secretary
Barbara Babbit Kaufman, Fulton County, Treasurer
Juanita Jones Abernathy, City of Atlanta
Clara H. Axam, City of Atlanta
Gloria Leonard, City of Atlanta
George E. Glaze, Clayton County
Keith E. Adams, DeKalb County
Harold Buckley, Sr., DeKalb County
Edmund J. Wall, DeKalb County
Walter L. Kimbrough, Fulton County
Bruce E. LeVell, Gwinnett County
FY10 OPERATING & CAPITAL BUDGETS
BOARD OF DIRECTORS
ii
Ex-Officio Members
Vance C. Smith, Jr., Commissioner, Georgia Department of Transportation
Richard A. Anderson, Executive Director, Georgia Regional Transportation Authority
Bart L. Graham, Commissioner, Georgia Department of Revenue
Steve Stancil, State Properties Officer, Georgia Building Authority
General Counsel
Charles N. Pursley, Jr., Pursley, Lowery & Meeks
FY10 OPERATING & CAPITAL BUDGETS
EXECUTIVE MANAGEMENT
iii
Dr. Beverly A. Scott – General Manager/Chief Executive Officer – (404.848.4676)
Dwight Ferrell- Deputy General Manager/ (COO)-(404.848.4227)
Ted Basta - Chief of Business Support Services- (404.848.4225)
Davis Allen – Assistant General Manager of Finance/Chief Financial Officer - (404.848.5763)
Jonnie Keith - Assistant General Manager of Internal Audit – (404.848.5594)
Elizabeth O’Neill – Assistant General Manager of Legal Services – (404.848.5220)
Ryland McClendon –Assistant General Manager of Communications & External Affairs (404.848.5100)
Cheryl King - Assistant General Manager of Planning (404.848.4401)
Richard Krisak – Assistant General Manager of Rail Operations (404.848.5107)
Mary Ann Jackson – Assistant General Manager of Bus Operations (404.848.5585)
Vacant- Assistant General Manager of Infrastructure
Wanda Dunham – Assistant General Manager of Police – (404.848.4918)
Ben Graham – Assistant General Manager of Technology – (404.848.4075)
Gary Pritchett- Assistant General Manager of Contracts, Procurement & Materials (404.848.5266)
Debra Dawson- Assistant General Manager of Human Resources (404.848.5778)
FY10 OPERATING & CAPITAL BUDGETS
SENIOR MANAGEMENT
iv
Reginald Diamond – Executive Director of Diversity & Equal Opportunity – (404.848.4639)
B.K. Trivedi – Director of Information Technology Audit – (404.848.5494)
Donna Jennings - Director of Risk Management – (404.848.4501)
Vacant – Director of Transit Oriented Development – (404.848.5176)
Johnny Dunning Jr. – Sr. Director of Transit System Planning – (404.848.5653)
Rhonda Briggins- Sr. Director of External Affairs- (404.848.5736)
Jennifer Jinadu - Director of Marketing & Sales – (404.848.4663)
Tony Merriweather - Director of Customer Services – (404.848.5190)
Lyle Harris – Chief Spokesperson of Media Relations – (404.848.3982)
Scott Haggard - Director of Government & Constituent Relations – (404.848.5177)
David Springstead – Senior Director of Maintenance – (404.848.3438)
John Weber - Director of Rail Services – (404.848.3048)
Joe Erves - Director of Rail Car Maintenance – (404.848.3245)
Garry Free – Acting Director Maintenance of Way – (404-848-3195)
Vacant- Director of Facilities
Vacant- Director of Communications & Customer Information
Lavoise Magee - Director of Bus Transportation – (404.848.6810)
Anton Bryant - Director of Bus Maintenance – (404.848.4363)
Vacant – Director of Engineering
Rick Shay – Director of Program & Contract Management – (404.848.5484)
Connie Krisak – Director of Architecture & Design – (404.848.5188)
Tim White – Acting Executive Director of Safety – (404.848.6512)
Sharon Crenchaw – Director of Mobility Services – (404.848.4216)
FY10 OPERATING & CAPITAL BUDGETS
SENIOR MANAGEMENT
v
Jayant Patel- Director of Quality Assurance & Configuration Management – (404.848.5171)
Louis D. Hudson - Director of Labor Relations – (404.848.5654)
David Wright - Director of Training – (404.848.6279)
Cynthia Moss Beasley – Director of Accounting – (404.848.5314)
Walter Jones – Director of Management & Budget – (404.848.5457)
Hubert Gee – Acting Director of Revenue Operations – (404.848.3353)
Richard Marsh – Sr. Director of Treasury Services - (404.848.5489)
Knox O’Callaghan – Director of Federal & State Programs - (404.848.5610)
Vacant- Director of Business Analysis & Assessment
Lowell Detamore- Director of Administrative Services- (404.848.6972)
Carol Smith – Director of Research & Analysis – (404.848.5727)
LaTeekey Andrews – Director of Employee Availability – (404.848.4088)
Barbara Kirkland - Director of Human Resources– (404.848.5148)
Lisa DeGrace - Director of Contracts & Procurement – (404.848.5467)
Vacant - Director of Technology Infrastructure & Operations
Tara Balakrishnan – Director of Technology Enterprise Applications – (404.848.5253)
Vacant - Director of Technology Programs Management
FY10 OPERATING & CAPITAL BUDGETS
GUIDE TO BOOK CONTENTS
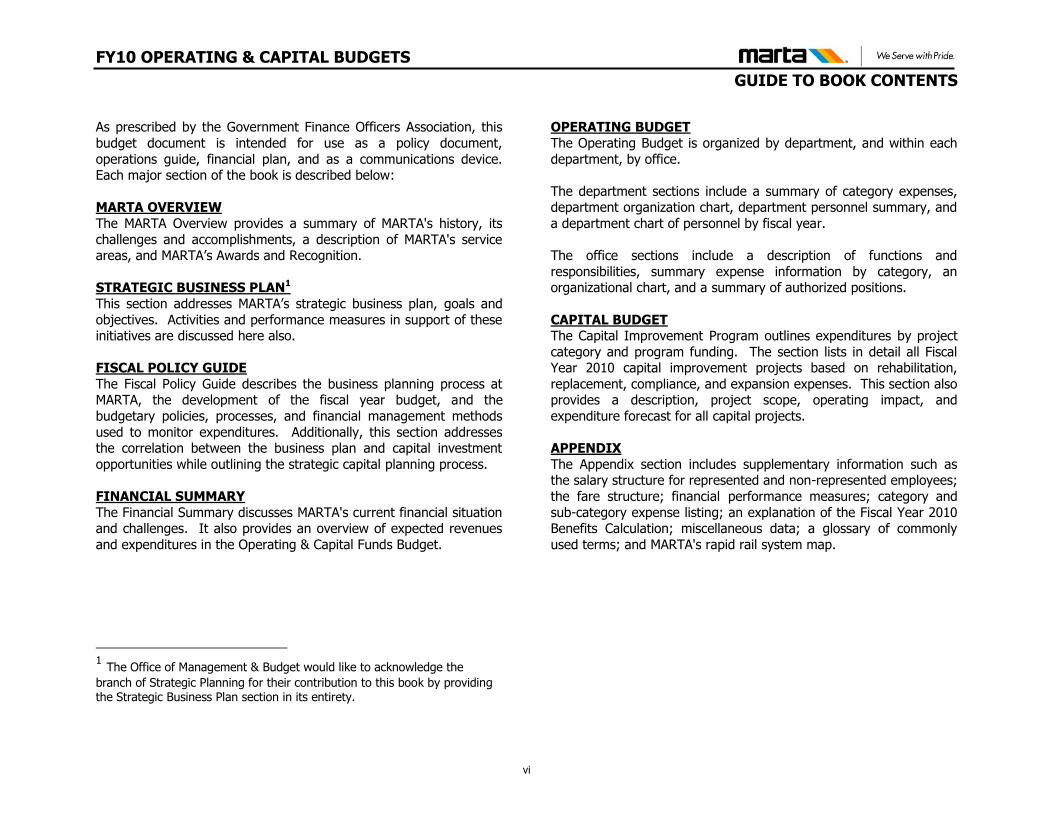
As prescribed by the Government Finance Officers Association, this
budget document is intended for use as a policy document,
operations guide, financial plan, and as a communications device. Each major section of the book is described below:
MARTA OVERVIEW
The MARTA Overview provides a summary of MARTA's history, its
challenges and accomplishments, a description of MARTA's service areas, and MARTA’s Awards and Recognition.
STRATEGIC BUSINESS PLAN1
This section addresses MARTA’s strategic business plan, goals and
objectives. Activities and performance measures in support of these initiatives are discussed here also.
FISCAL POLICY GUIDE
The Fiscal Policy Guide describes the business planning process at MARTA, the development of the fiscal year budget, and the
budgetary policies, processes, and financial management methods
used to monitor expenditures. Additionally, this section addresses the correlation between the business plan and capital investment
opportunities while outlining the strategic capital planning process.
FINANCIAL SUMMARY
The Financial Summary discusses MARTA's current financial situation and challenges. It also provides an overview of expected revenues
and expenditures in the Operating & Capital Funds Budget.
1 The Office of Management & Budget would like to acknowledge the
branch of Strategic Planning for their contribution to this book by providing the Strategic Business Plan section in its entirety.
OPERATING BUDGET
The Operating Budget is organized by department, and within each
department, by office.
The department sections include a summary of category expenses, department organization chart, department personnel summary, and
a department chart of personnel by fiscal year.
The office sections include a description of functions and
responsibilities, summary expense information by category, an organizational chart, and a summary of authorized positions.
CAPITAL BUDGET The Capital Improvement Program outlines expenditures by project
category and program funding. The section lists in detail all Fiscal Year 2010 capital improvement projects based on rehabilitation,
replacement, compliance, and expansion expenses. This section also provides a description, project scope, operating impact, and
expenditure forecast for all capital projects.
APPENDIX
The Appendix section includes supplementary information such as the salary structure for represented and non-represented employees;
the fare structure; financial performance measures; category and
sub-category expense listing; an explanation of the Fiscal Year 2010 Benefits Calculation; miscellaneous data; a glossary of commonly
used terms; and MARTA's rapid rail system map.
vi
The Office of Management & Budget would like to thank all
MARTA staff and management personnel for their assistance in producing and publishing this document.

TABLE OF CONTENTS
FY10 OPERATING & CAPITAL BUDGETS
TABLE OF CONTENTS
LETTER FROM THE GENERAL MANAGER/CEO PREFACE Directory of Officials ............................................................. i Executive Staff Listing ........................................................ iii Senior Staff Listing .............................................................. iv Guide to Book Contents ....................................................... vi Graph of Personnel by Class .............................................. 73 MARTA OVERVIEW History & Overview ............................................................ 1 STRATEGIC BUSINESS PLAN ............................................... 9 FISCAL POLICY GUIDE Strategic Planning Process at MARTA ................................. 15 Fiscal Year Budget Development ........................................ 20 Financial and Budgetary Policies ......................................... 23 Revenue Policies ............................................................... 28 Expenditure Policies .......................................................... 30 Source Documents ............................................................ 32 FINANCIAL SUMMARY Financial Overview ............................................................ 36 Sources and Uses of Funds ................................................ 39 Summary of Operating Revenues ....................................... 42 Operating Budget Expenditures .......................................... 53 Summary of Transit Subsidy – Table 6 ................................ 47 Capital Program Funding ................................................... 49 AUTHORITY OPERATING BUDGET Summary of Category Expenses ......................................... 53 Chart of Expenses by Category ......................................... 54 Graph of Expenses by Fiscal Year ...................................... 55
Summary of Expense by Organization ................................. 56 Organization Chart ............................................................. 62 Summary of Personnel ...................................................... 63 Graph of Personnel by Status ............................................ 72
Graph of Total Authority Personnel .................................... 74 ORGANIZATIONAL UNITS DIVISION OF THE GENERAL MANAGER/CEO ...................... 75 DEPARTMENT OF THE GENERAL MANAGER/CEO ................. 77 Office of General Manager/CEO .......................................... 79 Office of Board of Directors ................................................ 83 DEPARTMENT OF INTERNAL AUDIT .................................. 87 Office of AGM of Internal Audit ........................................... 89 Office of Information System Audit ..................................... 93 DEPARTMENT OF LEGAL SERVICES ................................... 97 Office of AGM of Legal Services .......................................... 99 Office of Risk Management............................................... 103 DEPARTMENT OF PLANNING ......................................... 107 Office of AGM of Planning ................................................ 109 Office of Transit Oriented Development ............................ 113 Office of Transit System Planning ..................................... 117 Office of Regional Service Coordination & Special Projects…122 DEPARTMENT OF COMMUNICATIONS & EXTERNAL AFFAIRS 127 Office of AGM of Communications & External Affairs .......... 129 Office of External Affairs .................................................. 133 Office of Marketing & Sales .............................................. 137
FY10 OPERATING & CAPITAL BUDGETS
TABLE OF CONTENTS
Office of Government & Constituent Relations .................... 143 Office of Customer Services .............................................. 148 Office of Media Relations .................................................. 154 DIVISION OF OPERATIONS ........................................... 159 DEPARTMENT OF THE DEPUTY GENERAL MANAGER/COO .... 161 Office of Deputy General Manager ..................................... 163 Office of Mobility Services ................................................. 167 Office of Safety ................................................................ 172 Office of Quality Assurance & Configuration Management ... 177 DEPARTMENT OF BUS OPERATIONS ................................ 183 Office of AGM of Bus Operations ....................................... 185 Office of Bus Transportation ............................................. 189 Office of Bus Maintenance ................................................ 194 Office of Clayton County Transit ........................................ 199 DEPARTMENT OF RAIL OPERATIONS ............................... 203 Office of AGM of Rail Operations ....................................... 205 Office of Rail System Engineering ...................................... 209 Office of Rail Services ....................................................... 213 Office of Rail Car Maintenance .......................................... 218 Office of Maintenance of Way ........................................... 223 Office of Communications & Customer Information ............ 228 DEPARTMENT OF INFRASTRUCTURE ................................ 233 Office of AGM of Infrastructure ......................................... 235 Office of Engineering ........................................................ 239 Office of Architecture and Design ...................................... 243 Office of Facilities ............................................................. 247 Office of Program & Contracts Management ...................... 252 DEPARTMENT OF POLICE SERVICES ................................ 257 Office of AGM of Police Services ........................................ 259
DIVISION OF CHIEF OF BUSINESS SUPPORT SERVICES ....... 265 DEPARTMENT OF CHIEF OF BUSINESS SUPPORT SERVICES .. 267 Office of Chief of Business Support Services ...................... 269 Office of Business Analysis & Assessment .......................... 273 Office of Research & Analysis ........................................... 277 DEPARTMENT OF FINANCE ........................................... 283 Office of AGM of Finance .................................................. 285 Office of Accounting ........................................................ 289 Office of Management & Budget ....................................... 293 Office of Revenue Operations ........................................... 297 Office of Treasury Services ............................................... 303 Office of Federal & State Programs ................................... 307 DEPARTMENT OF CONTRACTS & PROCUREMENT ............... 311 Office of AGM of Contracts & Procurement ........................ 313 Office of Contracts & Procurement and Materials ............... 317 Office of Administrative Services ....................................... 322 DEPARTMENT OF HUMAN RESOURCES ............................. 328 Office of AGM of Human Resources .................................. 330 Office of Human Resources .............................................. 335 Office of Labor Relations .................................................. 344 Office of Training ............................................................. 348 Office of Employee Availability .......................................... 356 Office of Diversity and Equal Opportunity .......................... 365 DEPARTMENT OF TECHNOLOGY .................................... 367 Office of AGM of Technology ........................................... 369 Office of Technology Infrastructure & Operations .............. 373 Office of Technology Enterprise Applications ..................... 378 Office of Technology Programs Management ..................... 383
FY10 OPERATING & CAPITAL BUDGETS
TABLE OF CONTENTS
CAPITAL BUDGET Capital Budget Overview ................................................... 389 Capital Improvement Program Infrastructure ..................... 389 Planning Program Overview .............................................. 402 Sources and Applications of Funds .................................... 408 Approved Capital Budget Summary ................................... 411 Approved Projects Ten-year Forecast ................................ 416 Approved Projects Detail ................................................... 426 Federal Grant Detail ......................................................... 498
APPENDIX Salary Structure for all Employees .................................... 523 Fare Structure ................................................................. 541 Financial Performance Measures ....................................... 547 Category and Sub-Category Expense Listing ...................... 548 FY10 Benefits Calculation ......................................... 549 MARTA Facts ................................................................... 550 MARTA Fare History ......................................................... 546 Glossary of Terms ............................................................ 553 INDEX ................................................................... 557 Rapid Transit System Map ................................................ 560
MARTA OVERVIEW This section provides a summary of MARTA’s history and a profile of the service area.
FY10 OPERATING & CAPITAL BUDGETS
OVERVIEW
History of Atlanta
The following brief history of Atlanta is an excerpt from the Metro Atlanta Chamber of Commerce’s “A Look at Atlanta, An Executive Profile”, May 20061
1Atlanta began as the site for the southern terminus of the state‐owned Western & Atlantic Railroad in 1837. Its first buildings were the homes and offices of railroad workers. This village was simply called Terminus until 1843, when it was incorporated as Marthasville in honor of the daughter of a former Georgia governor. In 1845, the town’s charter was amended to Atlanta, a feminized version of Atlantic derived from the original railroads name.
Less than 20 years later, Atlanta had become the hub of four railroads and a major manufacturing center. At the outbreak of the Civil War, the city’s strategic position and importance as a major distribution center for the Confederate Army’s goods made it a primary target of the Union Army. In 1864, after his victory in the Battle of Atlanta, General William Tecumseh Sherman reduced the city to ashes. The city was rebuilt by determined citizens and emerged as a new metropolis.
Atlanta is the cradle of the U.S. Civil Rights movement and home to the late civil rights leader, Dr. Martin Luther King, Jr., who propelled Atlanta and the U.S. forward to realize his dream “that all would be guaranteed the inalienable rights of life, liberty and the pursuit of happiness,” regardless of one’s skin color.
Metro Atlanta’s openness has proven to be an alluring magnet for the world’s foremost companies. One of Atlanta’s oldest and most well‐known companies, Coca‐Cola, made its start in Atlanta when Dr. John Pemberton, an Atlanta pharmacist concocted the coca‐cola soft drink formula in a brass kettle in his backyard, trying to discover a headache tonic. Coca‐Cola was incorporated in Atlanta in 1888 and is now one of the top 100 companies in revenue in the United States. Another home‐grown success story, Home Depot, started in Atlanta in 1978 and is now the 13th largest company in the United States. In the 1970s and 80s, companies and organizations such as Georgia‐Pacific and the American Cancer Society moved their headquarters to Atlanta – and the trend has continued with UPS, the world’s largest shipper, ING Americas, Holiday Inn and InterContinental Hotels, CARE International, Philips Consumer Electronics, GE Energy, Porsche Cars North America, Newell Rubbermaid, Novelis and Spectrum Brands (Rayovac Batteries) ‐‐ all moving their headquarters to Atlanta in the last 10 years.
In 1996, Atlanta was the honored city to host the Centennial Olympic Games, the first time the Summer Games were held in the eastern U.S. Approximately 8 million tickets were sold to Olympic events in Atlanta venues. It is estimated that the Olympics brought between 1.5 and 3 million people to the city and an estimated $5.1 billion in economic impact.
1http://www.realpropertyatlanta.com/documents/ALookAtAtlanta.pdf.
1
FY10 OPERATING & CAPITAL BUDGETS
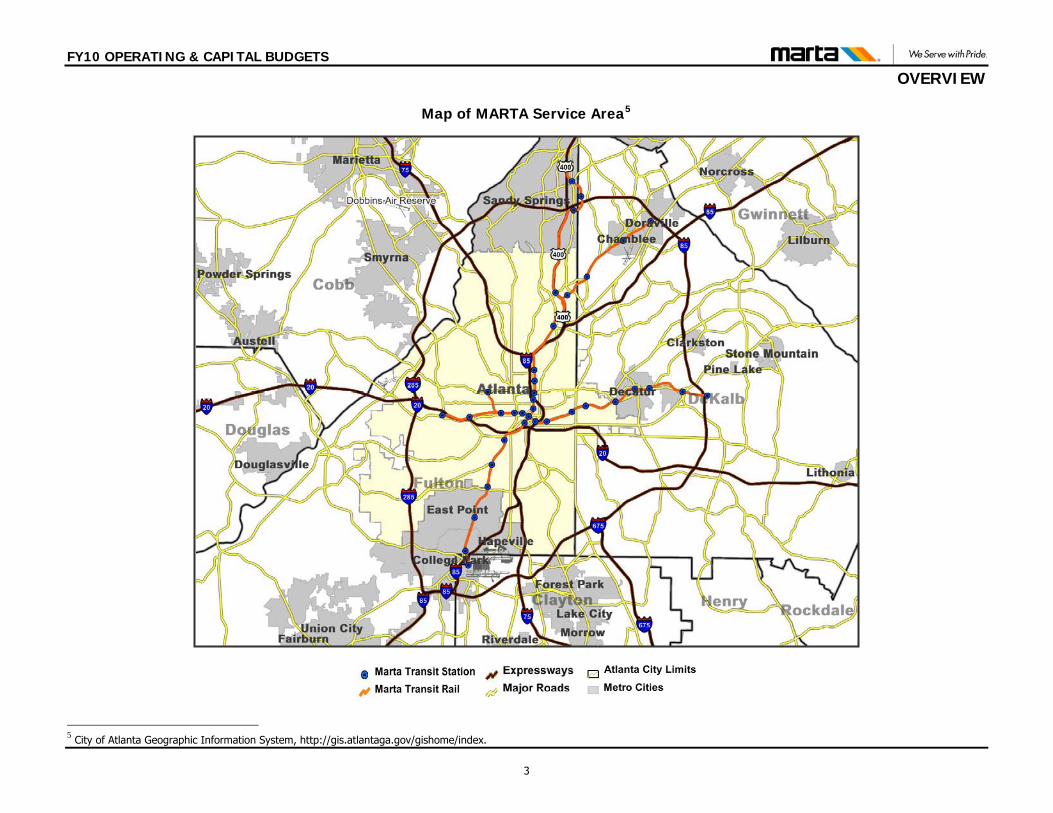
OVERVIEW MARTA’s History The year 2009 marked MARTA’s 30th year of providing rail service in the Atlanta Metropolitan area. MARTA was created by the Georgia General Assembly in 1965 and began bus operations in 1972. Formed from the Atlanta Transit System, a system of trackless trolleys and buses, which operated from 1950 to 1972, construction began on the MARTA system in 1975, with the first rail service commencing on June 30, 1979. MARTA’s 38 rail stations are linked by 48 miles of track and an extensive network of buses in Fulton and DeKalb counties. Today, MARTA is the principal transit agency in Atlanta and the ninth largest in the United States. Service Area MARTA operates in the Atlanta metropolitan area, commonly referred to as metro Atlanta. The Atlanta metropolitan area is the ninth-largest metropolitan area in the United States and consists of 28 counties in Georgia. With no natural boundaries, the metropolitan area sprawls over 8,376 square miles and encompasses 140 municipalities.2 Residents from all 28 counties that constitute the Greater Metropolitan Atlanta Region regularly use the system; however, MARTA’s operations are exclusively in Fulton and DeKalb County. MARTA serves Atlanta’s Downtown, Midtown, Buckhead and the Central Perimeter neighborhoods with direct access to Hartsfield-Jackson Airport. MARTA riders are able to transfer for free to transit systems in other metro Atlanta counties: Gwinnett, Cobb and Clayton, and to 20 GRTA Xpress routes in 12 metropolitan counties.3 (See Map of MARTA’s Service Area on the following page.)
4,263,255
5,473,846
6,453,347
7,377,951
8,256,323
1,940,1752,797,292 2,699,950
3,304,4063,835,118
4,472,567
3,063,026
-
1,000,000
2,000,000
3,000,000
4,000,000
5,000,000
6,000,000
7,000,000
8,000,000
9,000,000
1990 2000 2010 2020 2030 2040
Population Employment
Area Population and Demographics3
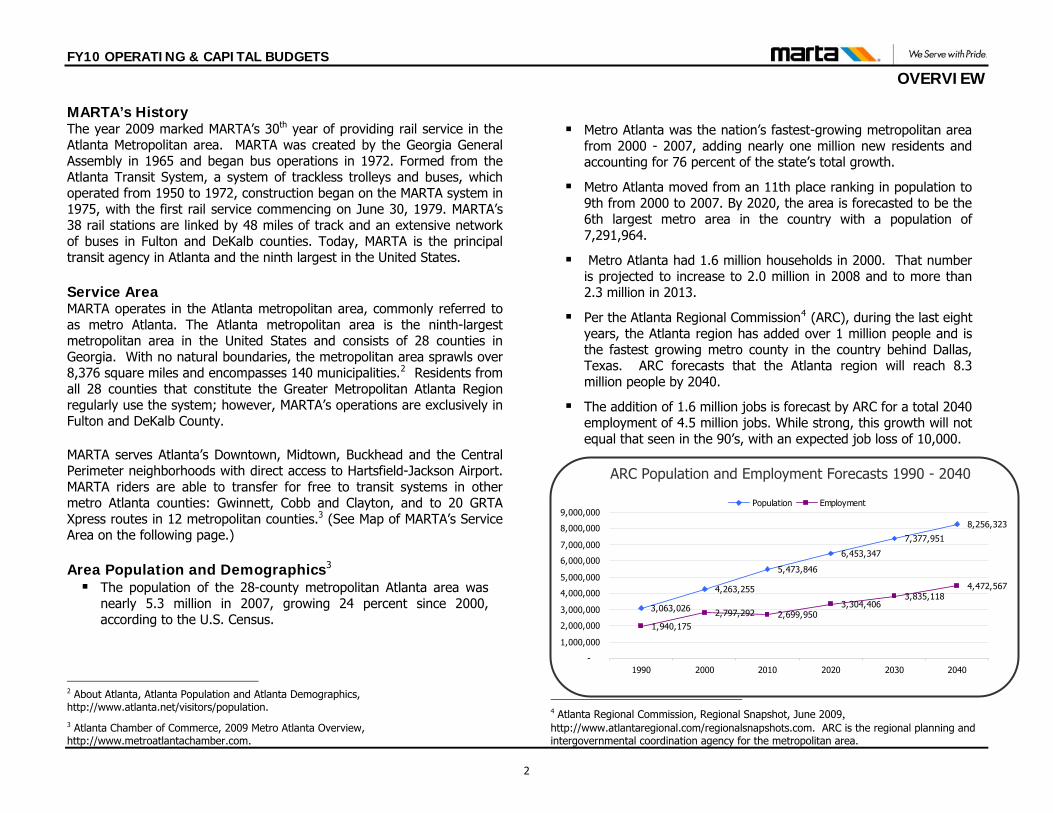
The population of the 28-county metropolitan Atlanta area was nearly 5.3 million in 2007, growing 24 percent since 2000, according to the U.S. Census.
2 About Atlanta, Atlanta Population and Atlanta Demographics, http://www.atlanta.net/visitors/population. 3 Atlanta Chamber of Commerce, 2009 Metro Atlanta Overview, http://www.metroatlantachamber.com.
Metro Atlanta was the nation’s fastest-growing metropolitan area
from 2000 - 2007, adding nearly one million new residents and accounting for 76 percent of the state’s total growth.
Metro Atlanta moved from an 11th place ranking in population to 9th from 2000 to 2007. By 2020, the area is forecasted to be the 6th largest metro area in the country with a population of 7,291,964.
Metro Atlanta had 1.6 million households in 2000. That number is projected to increase to 2.0 million in 2008 and to more than 2.3 million in 2013.
Per the Atlanta Regional Commission4 (ARC), during the last eight years, the Atlanta region has added over 1 million people and is the fastest growing metro county in the country behind Dallas, Texas. ARC forecasts that the Atlanta region will reach 8.3 million people by 2040.
The addition of 1.6 million jobs is forecast by ARC for a total 2040 employment of 4.5 million jobs. While strong, this growth will not equal that seen in the 90’s, with an expected job loss of 10,000.
ARC Population and Employment Forecasts 1990 - 2040
4 Atlanta Regional Commission, Regional Snapshot, June 2009, http://www.atlantaregional.com/regionalsnapshots.com. ARC is the regional planning and intergovernmental coordination agency for the metropolitan area.
2
FY10 OPERATING & CAPITAL BUDGETS
OVERVIEW
Map of MARTA Service Area5
5 City of Atlanta Geographic Information System, http://gis.atlantaga.gov/gishome/index.
3
FY10 OPERATING & CAPITAL BUDGETS
OVERVIEW Regional Transportation Infrastructure6
Transportation has always been important to Atlanta’s growth and development. MARTA is an integral part of the regional transportation infrastructure that includes commercial and general aviation, rail and intermodal operations, and interstate roadways and intermodal connections. Along with the transportation advantages listed below, MARTA is vital to and contributes to the regions economic growth and development:
Hartsfield-Jackson Airport moved more than 90 million air travelers in 2008, securing its hold as the world’s top airport in passenger traffic every year this decade.
Atlanta’s location puts it within a two-hour flight of 80 percent of the U.S. population and 119 of the nation’s 150 largest metro areas.
Approximately 730,000 metric tons of freight and express mail move through Hartsfield-Jackson every year.
CSX, the largest intermodal carrier in the U.S., runs freight to 70 ports and more than 166 bulk intermodal terminals in more than 23 states, D.C. and Canada on 23,400 miles of track. It operates a 24-hour terminal in Fairburn, and its Hulsey yard processes 1,000 trucks and 16 trains daily. Atlanta is CSX’s fourth largest metro operation in lift volume.
Norfolk Southern, which operates 21,800 miles of track in 22 states, is investing $11 million to expand its intermodal hub in Cobb County. Inman Yard in Atlanta is its largest intermodal facility, and its East Point Yard is the largest Road Railer hub in the world. At least two stack trains leave Atlanta daily for the West Coast.
Between CSX and Norfolk Southern, there are nine intermodal yards in Georgia and five in metro Atlanta.
Three interstates – I-20, I-75 and I-85 – converge in downtown Atlanta, which is circled by I-285.
6 Atlanta Chamber of Commerce, 2009 Metro Atlanta Overview, http://www.metroatlantachamber.com.
Local and Regional Partnerships MARTA is part of the regional solution to transportation, and is working across the region with transit partners and planning agencies. MARTA is integral to environmental and traffic alleviation goals and is planning new services, upgrades, transit partnerships, and is part of new transit solutions such as the Beltline, a transportation project that will add 22-miles of light rail transit that will connect with MARTA and the proposed Peachtree Streetcar. In 2006, MARTA joined the Atlanta Regional Commission and the Georgia Regional Transportation Authority in partnership to create the Transit Planning Board. The mission of the Transit Planning Board is to create the next regional plan for expanding and funding public transportation for the entire Atlanta Region. Other agencies and organizations that partner with MARTA are:
Georgia Regional Transportation Authority (GRTA) - the State of Georgia authority working to improve Georgia's mobility, air quality, and land use practices. The governor and state legislature created GRTA as a catalyst to move the Atlanta region forward. The Atlanta Regional Commission (ARC) is the regional planning and intergovernmental coordination agency for the 10-county area including Cherokee, Clayton, Cobb, DeKalb, Douglas, Fayette, Fulton, Gwinnett, Henry and Rockdale counties, as well as the City of Atlanta. And the following local organizations: Riders for Progressive Transportation Central Atlanta Progress PEDS Transit Implementation Board Metro Atlanta Community Improvement District (CID) Transit Management Association Center for Transportation Excellence
Get Georgia Moving
4
FY10 OPERATING & CAPITAL BUDGETS
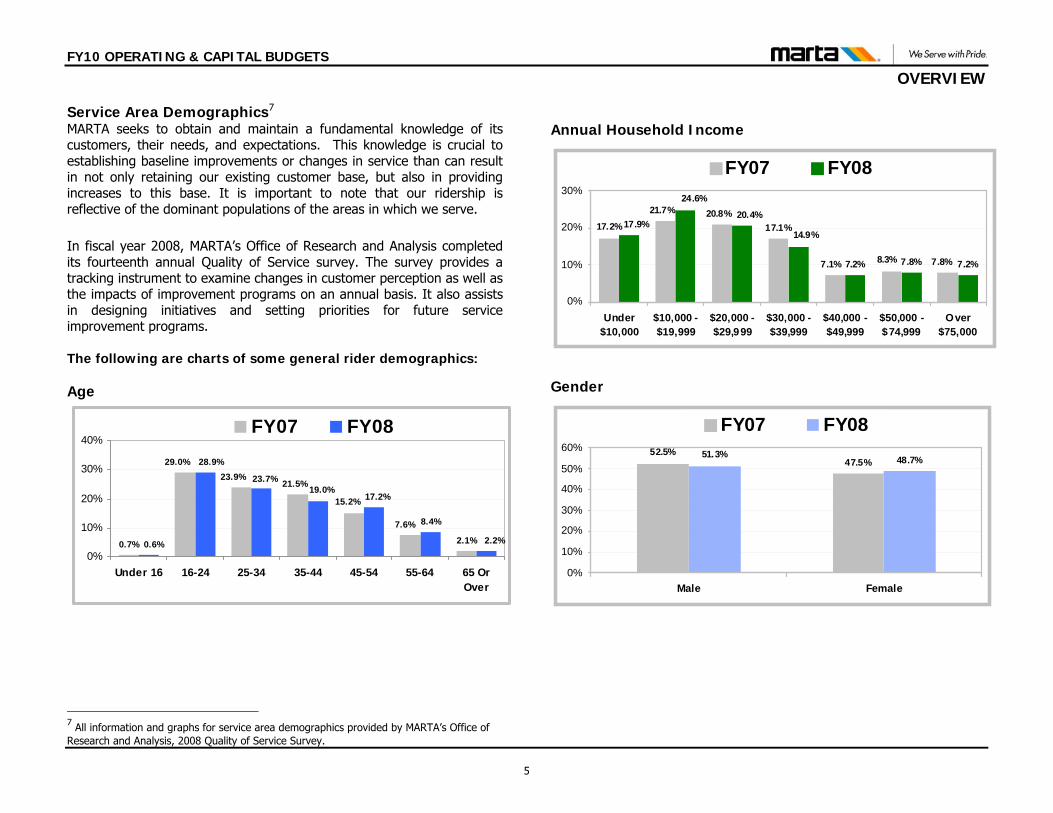
OVERVIEW Service Area Demographics7
MARTA seeks to obtain and maintain a fundamental knowledge of its customers, their needs, and expectations. This knowledge is crucial to establishing baseline improvements or changes in service than can result in not only retaining our existing customer base, but also in providing increases to this base. It is important to note that our ridership is reflective of the dominant populations of the areas in which we serve.
In fiscal year 2008, MARTA’s Office of Research and Analysis completed its fourteenth annual Quality of Service survey. The survey provides a tracking instrument to examine changes in customer perception as well as the impacts of improvement programs on an annual basis. It also assists in designing initiatives and setting priorities for future service improvement programs. The following are charts of some general rider demographics: Age
7 All information and graphs for service area demographics provided by MARTA’s Office of Research and Analysis, 2008 Quality of Service Survey.
Annual Household Income
17.2% 17.1%
7.2% 7.8% 7.2%7.1% 7.8%8.3%
20.8%21.7%
14.9%
20.4%
24.6%
17.9%
0%
10%
20%
30%
Under$10,000
$10,000 -$19,999
$20,000 -$29,999
$30,000 -$39,999
$40,000 -$49,999
$50,000 -$74,999
Over$75,000
FY07 FY08
Gender
52.5%47.5%
51.3% 48.7%
0%
10%
20%
30%
40%
50%
60%
Male Female
FY07 FY08
0.7% 2.1%
8.4%
15.2%
23.9%29.0%
7.6%
21.5%19.0%
28.9%
2.2%
17.2%
23.7%
0.6%0%
10%
20%
30%
40%
Under 16 16-24 25-34 35-44 45-54 55-64 65 OrOver
FY07 FY08
5
FY10 OPERATING & CAPITAL BUDGETS
OVERVIEW Residency
37.0%
12.1%
34.4%
16.5%
38.6%
15.4%
34.1%
11.9%
0%
10%
20%
30%
40%
50%
60%
Atlanta Fulton DeKalb Outside ServiceArea
FY07 FY08
Education
2.1%
13.3%
31.5% 31.8%
13.4%7.9%
0%
10%
20%
30%
40%
Less
than
9th
grad
e
From
9th
grad
e to
12t
hgr
ade
Hig
h sc
hool
grad
uate
Som
e co
llege
but n
oba
chel
or's
degr
ee
Bac
helo
r'sde
gree
Gra
duat
ew
ork
and
post
grad
uate
degr
ee
FY08
Trip Purpose
53.7%
10.8%4.6% 1.8% 5.0%2.3%2.3% 3.7%
18.1%
1.6%2.8%8.1%
4.7%9.6%
53.6%
17.3%
0%10%20%30%40%50%60%
Wor
k
Non-
wor
kpe
rson
albu
sine
ss
Scho
ol
Shop
ping
Spec
ial
even
ts
Med
ical
Airp
ort
Oth
er
FY07 FY08
Method of Paying Fare
Method of Paying Fare
49.9%
8.3% 8.4%
33.4%
0%
10%
20%
30%
40%
50%
FY0860%
Cash/token Half-fare Breeze Regular Breeze Mobility Breeze
6
FY10 OPERATING & CAPITAL BUDGETS
OVERVIEW Number of Years Riding MARTA
2.2%
10.5% 9.7%5.8%
21.1%
12.0%
22.8%
32.1%
16.5%
31.0%
23.5%
6.6%6.2%
0%
10%
20%
30%
40%
Less than1 year
1 to lessthan 4years
4 to lessthan 6Years
6 to lessthan 11Years
11 to lessthan 16years
16 to lessthan 21Years
21 ormoreyears
FY07 FY08
Transit Dependency
47.0%53.0%
46.1%
53.9%
0%
10%
20%
30%
40%
50%
60%
Transit Reliant Transit Choice
FY07 FY08
Preferred Mode
22.3%
2.2%
75.5%
20.9%
3.5%
75.6%
0%10%20%30%40%50%60%70%80%
Rail only Bus only Both Bus & Rail
FY07 FY08
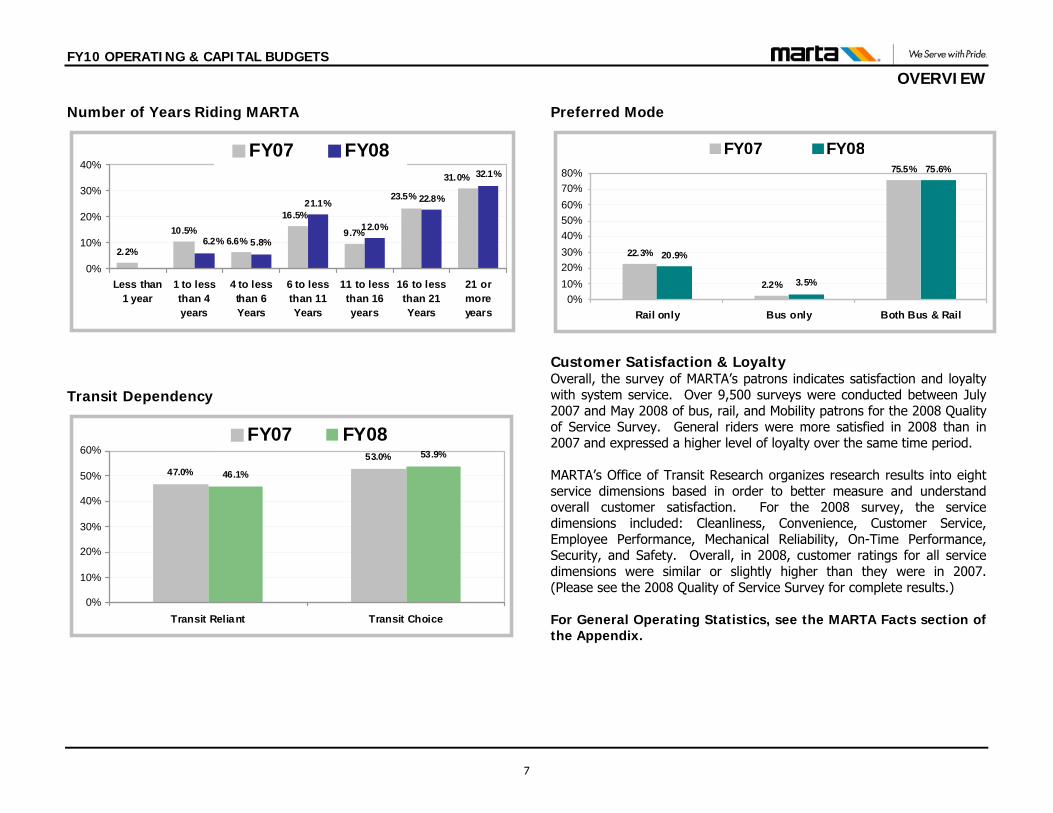
Customer Satisfaction & Loyalty Overall, the survey of MARTA’s patrons indicates satisfaction and loyalty with system service. Over 9,500 surveys were conducted between July 2007 and May 2008 of bus, rail, and Mobility patrons for the 2008 Quality of Service Survey. General riders were more satisfied in 2008 than in 2007 and expressed a higher level of loyalty over the same time period. MARTA’s Office of Transit Research organizes research results into eight service dimensions based in order to better measure and understand overall customer satisfaction. For the 2008 survey, the service dimensions included: Cleanliness, Convenience, Customer Service, Employee Performance, Mechanical Reliability, On-Time Performance, Security, and Safety. Overall, in 2008, customer ratings for all service dimensions were similar or slightly higher than they were in 2007. (Please see the 2008 Quality of Service Survey for complete results.) For General Operating Statistics, see the MARTA Facts section of the Appendix.
7

This page intentionally left blank
8
STRATEGIC BUSINESS PLAN This section explains the strategic direction of the Authority with a description of its strategic values, business plan, long-range vision, priorities, goals and objectives.
FY10 OPERATING & CAPITAL BUDGETS
STRATEGIC PLAN INTRODUCTION The Fiscal Year 2010 Strategic Business Plan (FY10 SBP) is designed to provide all members of the MARTA team with a clear direction as to how their jobs are linked to the overall effort of implementing the Authority’s Mission and enabling them to work in a coordinated, collaborative fashion toward successfully achieving its Vision. The FY10 SBP paves the way for MARTA to convert its resources, organizational culture and employee knowledge into expected tangible outcomes. Financial challenges facing MARTA since at least the mid 1990’s have been significantly worsened by the current serious economic downturn. In response to the resulting financial shortfall, a series of deficit reduction strategies have been advanced for the consideration by the MARTA Board of Directors. These potential actions include internal cost containment measures, fare and parking fee increases, legislative relief aimed at the removal of sales tax and interest use restrictions, the development of new revenue streams, transit service reductions, and the use of one-time federal economic recovery funds for eligible preventive maintenance purposes.
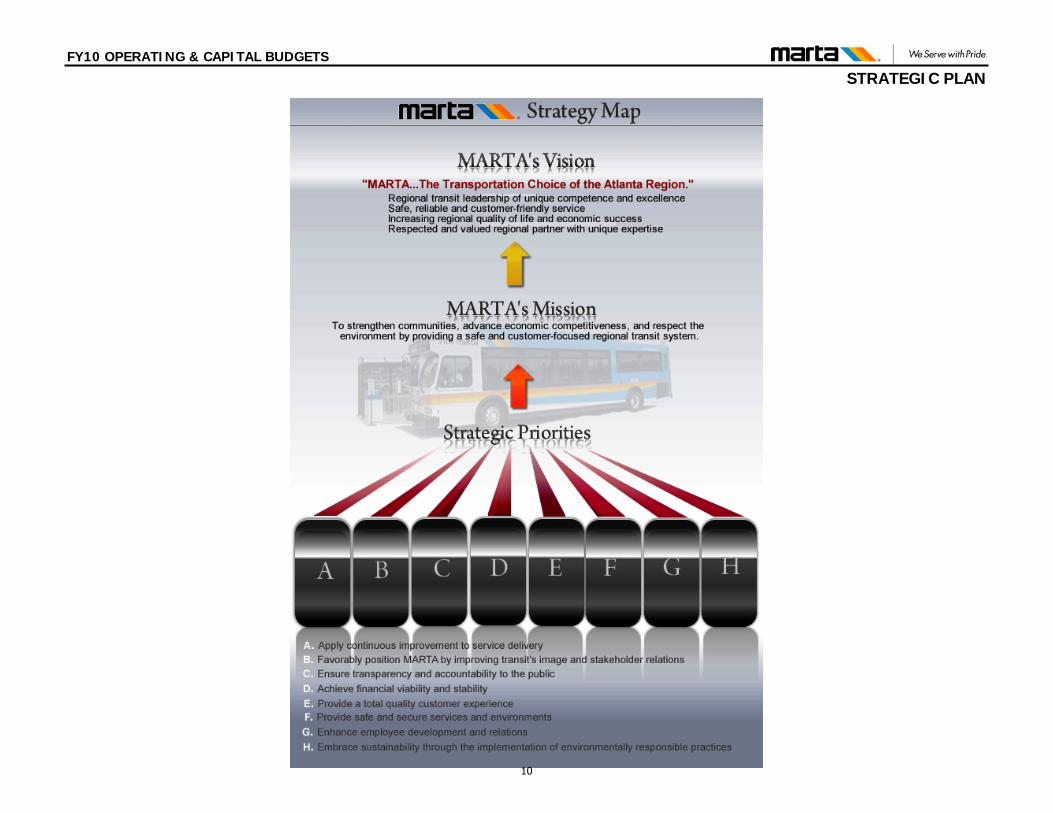
At the December 2008 Retreat, the MARTA Board of Directors adopted Strategic Priorities for incorporation and use in the FY10 SBP as reflected by the enclosed strategy map. The strategy map links the Authority’s Vision and Mission statements with Strategic Priorities and Strategic Key Performance Indicators (KPI) that are specifically designed to measure the achievement of these Strategic Priorities over time. Detailed definitions, ownership designations and data source descriptions for each Key Performance Indicator are provided in the comprehensive Strategic Business Plan document, as well as the Balanced Scorecard tool accessible via MARTAnet. In order to provide the MARTA Board of Directors with pertinent and timely information, and to maintain accountability in governing the Authority and managing its day-to-day operations, MARTA’s Executive Staff routinely reports on a variety of selected Key Performance Indicator’s at the each of the respective MARTA Board of Directors monthly committee meetings.
9
FY10 OPERATING & CAPITAL BUDGETS
STRATEGIC PLAN
10
FY10 OPERATING & CAPITAL BUDGETS
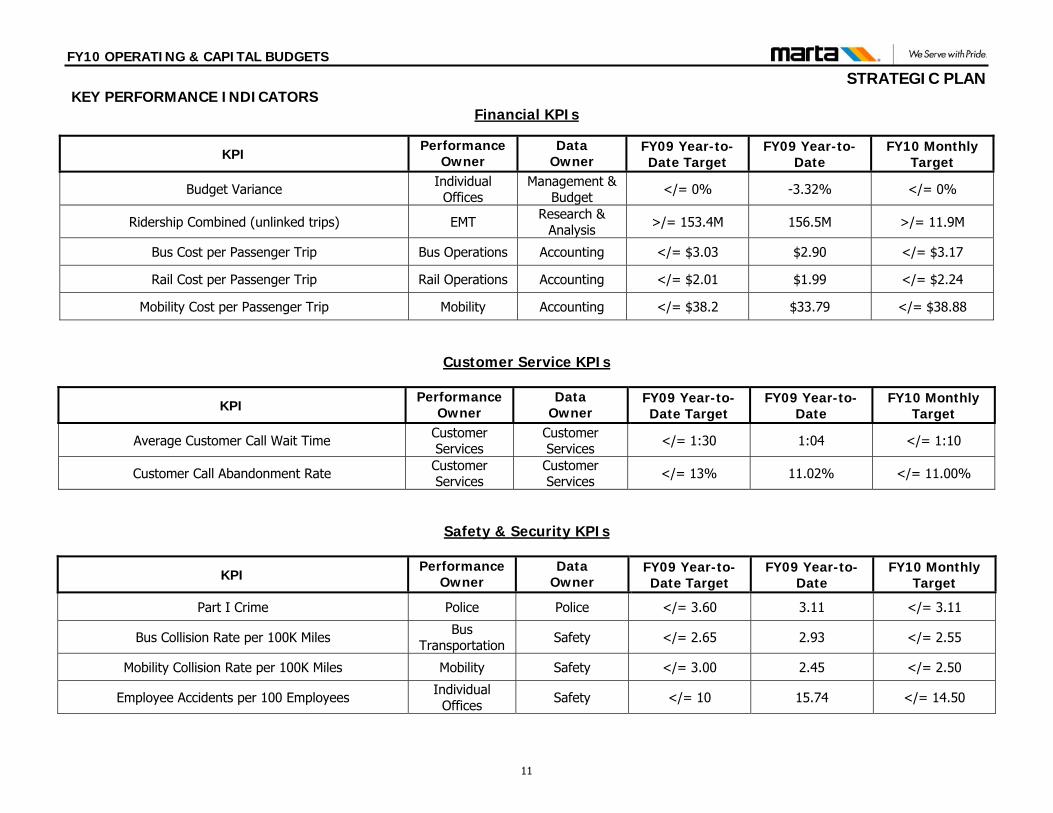
STRATEGIC PLAN KEY PERFORMANCE INDICATORS
Financial KPIs
KPI Performance
Owner Data
Owner FY09 Year-to-Date Target
FY09 Year-to-Date
FY10 Monthly Target
Budget Variance Individual Offices
Management & Budget </= 0% -3.32% </= 0%
Ridership Combined (unlinked trips) EMT Research & Analysis >/= 153.4M 156.5M >/= 11.9M
Bus Cost per Passenger Trip Bus Operations Accounting </= $3.03 $2.90 </= $3.17
Rail Cost per Passenger Trip Rail Operations Accounting </= $2.01 $1.99 </= $2.24
Mobility Cost per Passenger Trip Mobility Accounting </= $38.2 $33.79 </= $38.88
Customer Service KPIs
KPI Performance
Owner Data
Owner FY09 Year-to-Date Target
FY09 Year-to-Date
FY10 Monthly Target
Average Customer Call Wait Time Customer Services
Customer Services </= 1:30 1:04 </= 1:10
Customer Call Abandonment Rate Customer Services
Customer Services </= 13% 11.02% </= 11.00%
Safety & Security KPIs
KPI Performance
Owner Data
Owner FY09 Year-to-Date Target
FY09 Year-to-Date
FY10 Monthly Target
Part I Crime Police Police </= 3.60 3.11 </= 3.11
Bus Collision Rate per 100K Miles Bus Transportation Safety </= 2.65 2.93 </= 2.55
Mobility Collision Rate per 100K Miles Mobility Safety </= 3.00 2.45 </= 2.50
Employee Accidents per 100 Employees Individual Offices Safety </= 10 15.74 </= 14.50
11
FY10 OPERATING & CAPITAL BUDGETS
STRATEGIC PLAN
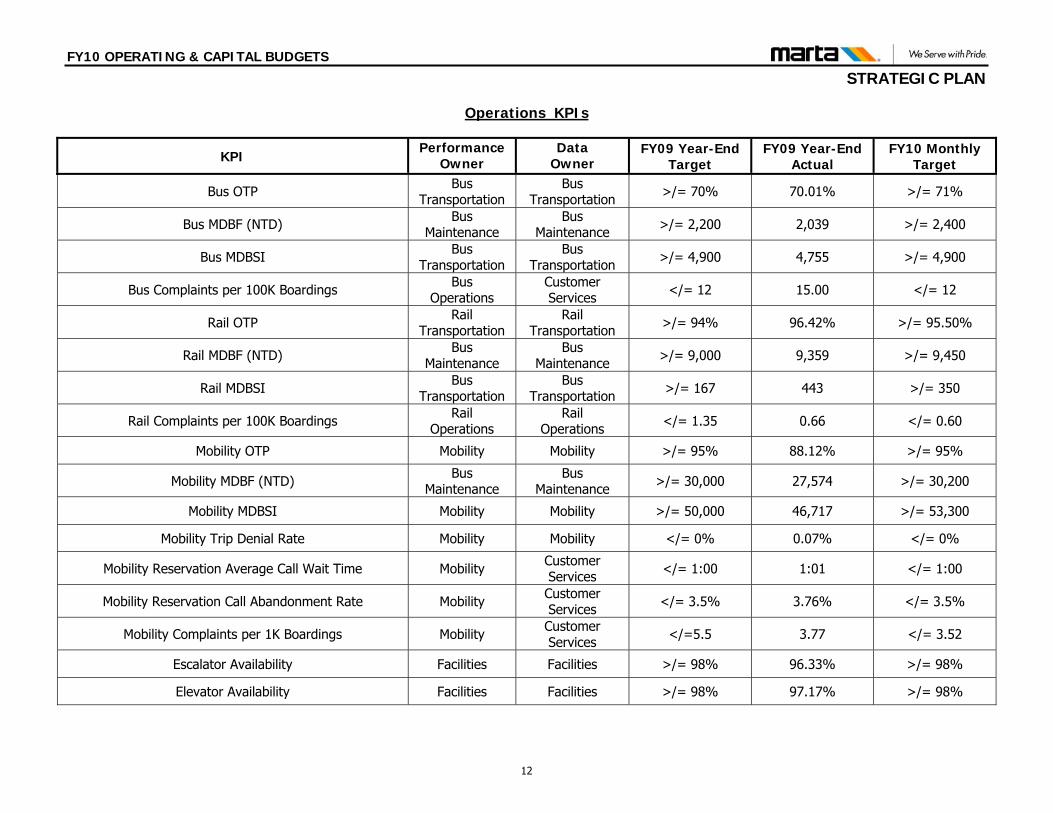
Operations KPIs
KPI Performance
Owner Data
Owner FY09 Year-End
Target FY09 Year-End
Actual FY10 Monthly
Target
Bus OTP Bus Transportation
Bus Transportation >/= 70% 70.01% >/= 71%
Bus MDBF (NTD) Bus Maintenance
Bus Maintenance >/= 2,200 2,039 >/= 2,400
Bus MDBSI Bus Transportation
Bus Transportation >/= 4,900 4,755 >/= 4,900
Bus Complaints per 100K Boardings Bus Operations
Customer Services </= 12 15.00 </= 12
Rail OTP Rail Transportation
Rail Transportation >/= 94% 96.42% >/= 95.50%
Rail MDBF (NTD) Bus Maintenance
Bus Maintenance >/= 9,000 9,359 >/= 9,450
Rail MDBSI Bus Transportation
Bus Transportation >/= 167 443 >/= 350
Rail Complaints per 100K Boardings Rail Operations
Rail Operations </= 1.35 0.66 </= 0.60
Mobility OTP Mobility Mobility >/= 95% 88.12% >/= 95%
Mobility MDBF (NTD) Bus Maintenance
Bus Maintenance >/= 30,000 27,574 >/= 30,200
Mobility MDBSI Mobility Mobility >/= 50,000 46,717 >/= 53,300
Mobility Trip Denial Rate Mobility Mobility </= 0% 0.07% </= 0%
Mobility Reservation Average Call Wait Time Mobility Customer Services </= 1:00 1:01 </= 1:00
Mobility Reservation Call Abandonment Rate Mobility Customer Services </= 3.5% 3.76% </= 3.5%
Mobility Complaints per 1K Boardings Mobility Customer Services </=5.5 3.77 </= 3.52
Escalator Availability Facilities Facilities >/= 98% 96.33% >/= 98%
Elevator Availability Facilities Facilities >/= 98% 97.17% >/= 98%
12
FY10 OPERATING & CAPITAL BUDGETS
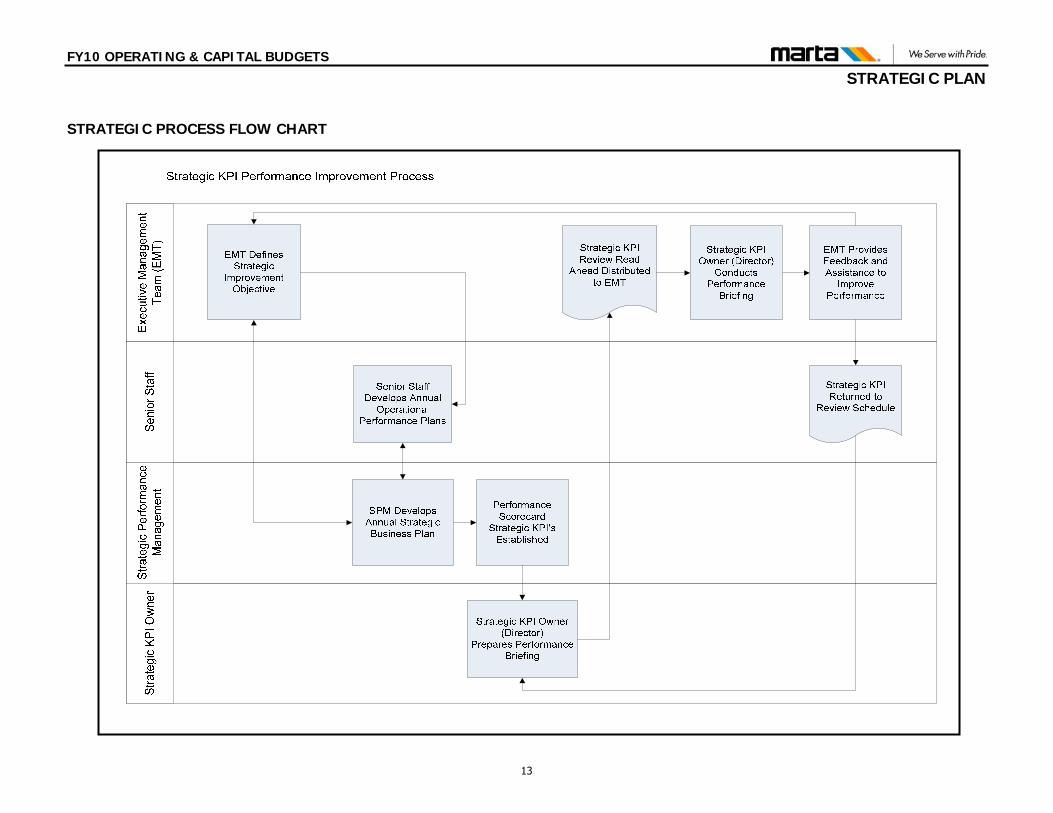
STRATEGIC PLAN STRATEGIC PROCESS FLOW CHART
13

This page intentionally left blank
14
FISCAL POLICY GUIDE This section summarizes the Business Planning Process at MARTA, the development of the fiscal year budget, and the financial management methods used to monitor expenditures. This section also explains the relationship between the business plan and capital investment opportunities.
FY10 OPERATING & CAPITAL BUDGETS FISCAL POLICY GUIDE
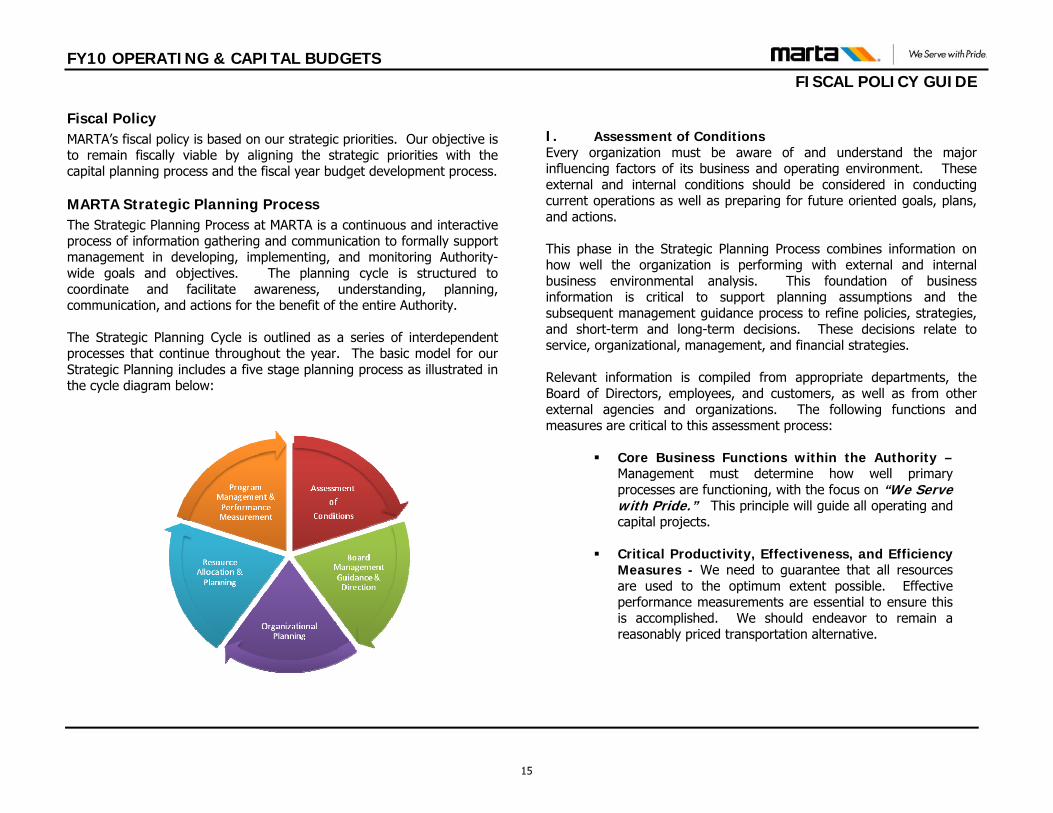
Fiscal Policy MARTA’s fiscal policy is based on our strategic priorities. Our objective is to remain fiscally viable by aligning the strategic priorities with the capital planning process and the fiscal year budget development process. MARTA Strategic Planning Process The Strategic Planning Process at MARTA is a continuous and interactive process of information gathering and communication to formally support management in developing, implementing, and monitoring Authority-wide goals and objectives. The planning cycle is structured to coordinate and facilitate awareness, understanding, planning, communication, and actions for the benefit of the entire Authority. The Strategic Planning Cycle is outlined as a series of interdependent processes that continue throughout the year. The basic model for our Strategic Planning includes a five stage planning process as illustrated in the cycle diagram below:
I. Assessment of Conditions Every organization must be aware of and understand the major influencing factors of its business and operating environment. These external and internal conditions should be considered in conducting current operations as well as preparing for future oriented goals, plans, and actions. This phase in the Strategic Planning Process combines information on how well the organization is performing with external and internal business environmental analysis. This foundation of business information is critical to support planning assumptions and the subsequent management guidance process to refine policies, strategies, and short-term and long-term decisions. These decisions relate to service, organizational, management, and financial strategies. Relevant information is compiled from appropriate departments, the Board of Directors, employees, and customers, as well as from other external agencies and organizations. The following functions and measures are critical to this assessment process:
Core Business Functions within the Authority –
Management must determine how well primary processes are functioning, with the focus on “We Serve with Pride.” This principle will guide all operating and capital projects.
Critical Productivity, Effectiveness, and Efficiency
Measures - We need to guarantee that all resources are used to the optimum extent possible. Effective performance measurements are essential to ensure this is accomplished. We should endeavor to remain a reasonably priced transportation alternative.
15
FY10 OPERATING & CAPITAL BUDGETS FISCAL POLICY GUIDE
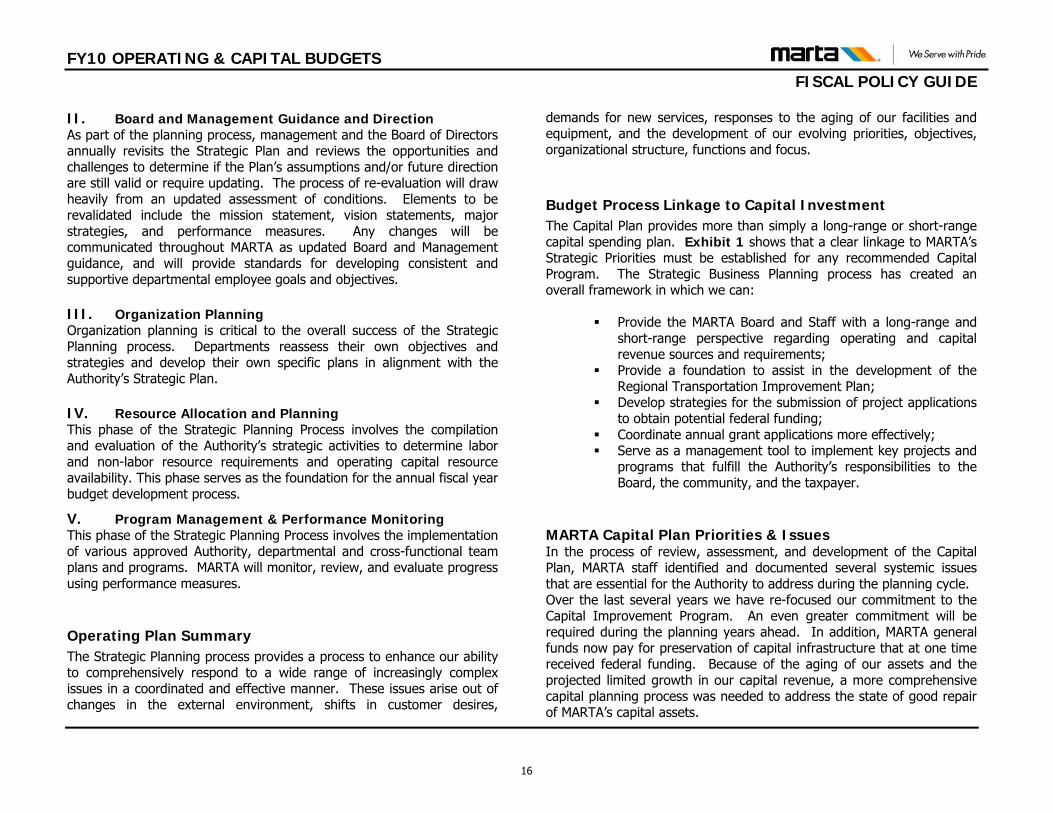
II. Board and Management Guidance and Direction As part of the planning process, management and the Board of Directors annually revisits the Strategic Plan and reviews the opportunities and challenges to determine if the Plan’s assumptions and/or future direction are still valid or require updating. The process of re-evaluation will draw heavily from an updated assessment of conditions. Elements to be revalidated include the mission statement, vision statements, major strategies, and performance measures. Any changes will be communicated throughout MARTA as updated Board and Management guidance, and will provide standards for developing consistent and supportive departmental employee goals and objectives. III. Organization Planning Organization planning is critical to the overall success of the Strategic Planning process. Departments reassess their own objectives and strategies and develop their own specific plans in alignment with the Authority’s Strategic Plan. IV. Resource Allocation and Planning This phase of the Strategic Planning Process involves the compilation and evaluation of the Authority’s strategic activities to determine labor and non-labor resource requirements and operating capital resource availability. This phase serves as the foundation for the annual fiscal year budget development process.
V. Program Management & Performance Monitoring This phase of the Strategic Planning Process involves the implementation of various approved Authority, departmental and cross-functional team plans and programs. MARTA will monitor, review, and evaluate progress using performance measures. Operating Plan Summary The Strategic Planning process provides a process to enhance our ability to comprehensively respond to a wide range of increasingly complex issues in a coordinated and effective manner. These issues arise out of changes in the external environment, shifts in customer desires,
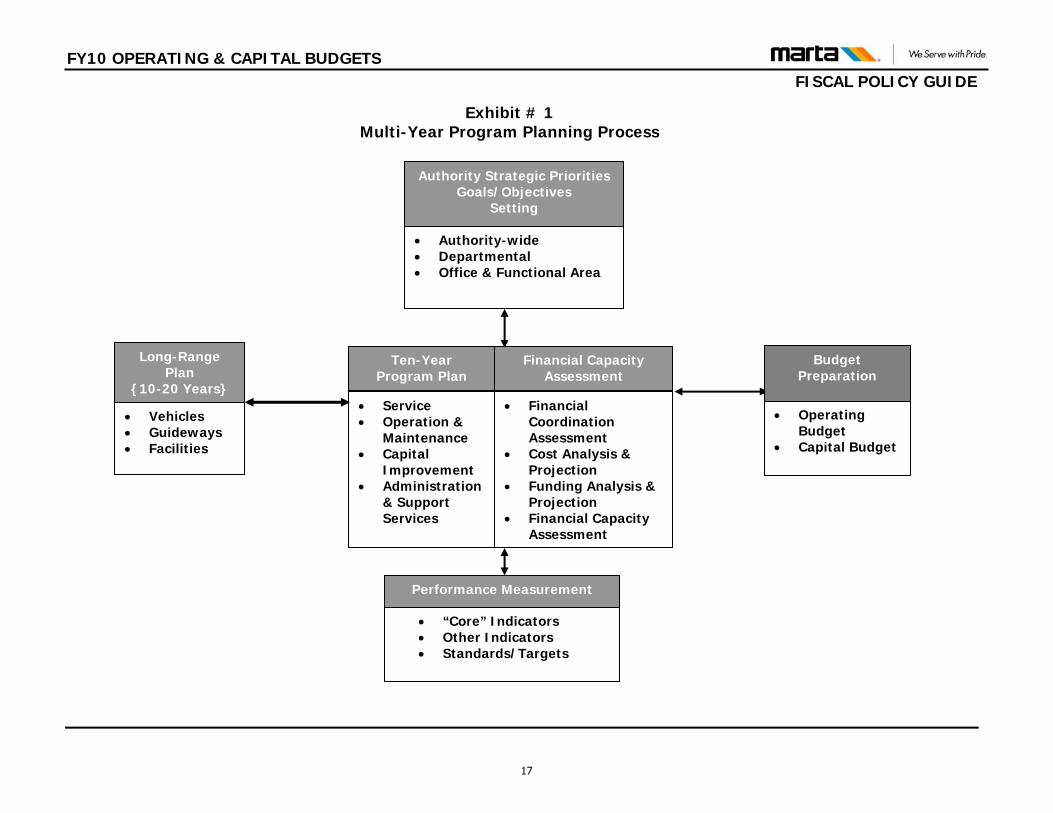
demands for new services, responses to the aging of our facilities and equipment, and the development of our evolving priorities, objectives, organizational structure, functions and focus. Budget Process Linkage to Capital Investment The Capital Plan provides more than simply a long-range or short-range capital spending plan. Exhibit 1 shows that a clear linkage to MARTA’s Strategic Priorities must be established for any recommended Capital Program. The Strategic Business Planning process has created an overall framework in which we can:
Provide the MARTA Board and Staff with a long-range and short-range perspective regarding operating and capital revenue sources and requirements;
Provide a foundation to assist in the development of the Regional Transportation Improvement Plan;
Develop strategies for the submission of project applications to obtain potential federal funding;
Coordinate annual grant applications more effectively; Serve as a management tool to implement key projects and
programs that fulfill the Authority’s responsibilities to the Board, the community, and the taxpayer.
MARTA Capital Plan Priorities & Issues In the process of review, assessment, and development of the Capital Plan, MARTA staff identified and documented several systemic issues that are essential for the Authority to address during the planning cycle. Over the last several years we have re-focused our commitment to the Capital Improvement Program. An even greater commitment will be required during the planning years ahead. In addition, MARTA general funds now pay for preservation of capital infrastructure that at one time received federal funding. Because of the aging of our assets and the projected limited growth in our capital revenue, a more comprehensive capital planning process was needed to address the state of good repair of MARTA’s capital assets.
16
FY10 OPERATING & CAPITAL BUDGETS
FISCAL POLICY GUIDE
Exhibit # 1 Multi-Year Program Planning Process
Authority Strategic Priorities Goals/Objectives
Setting
• Authority-wide • Departmental • Office & Functional Area
Long-Range Ten-Year Program Plan
Financial Capacity Assessment Plan
{10-20 Years}
• Vehicles • Guideways
• Operating Budget
• Capital Budget
• Service • Operation &
Maintenance • Capital
Improvement • Administration
& Support Services
• Financial Coordination Assessment
• Cost Analysis & Projection
• Funding Analysis & Projection
• Financial Capacity
• Facilities
Budget Preparation
Assessment
Performance Measurement
• “Core” Indicators • Other Indicators • Standards/Targets
17
FY10 OPERATING & CAPITAL BUDGETS FISCAL POLICY GUIDE
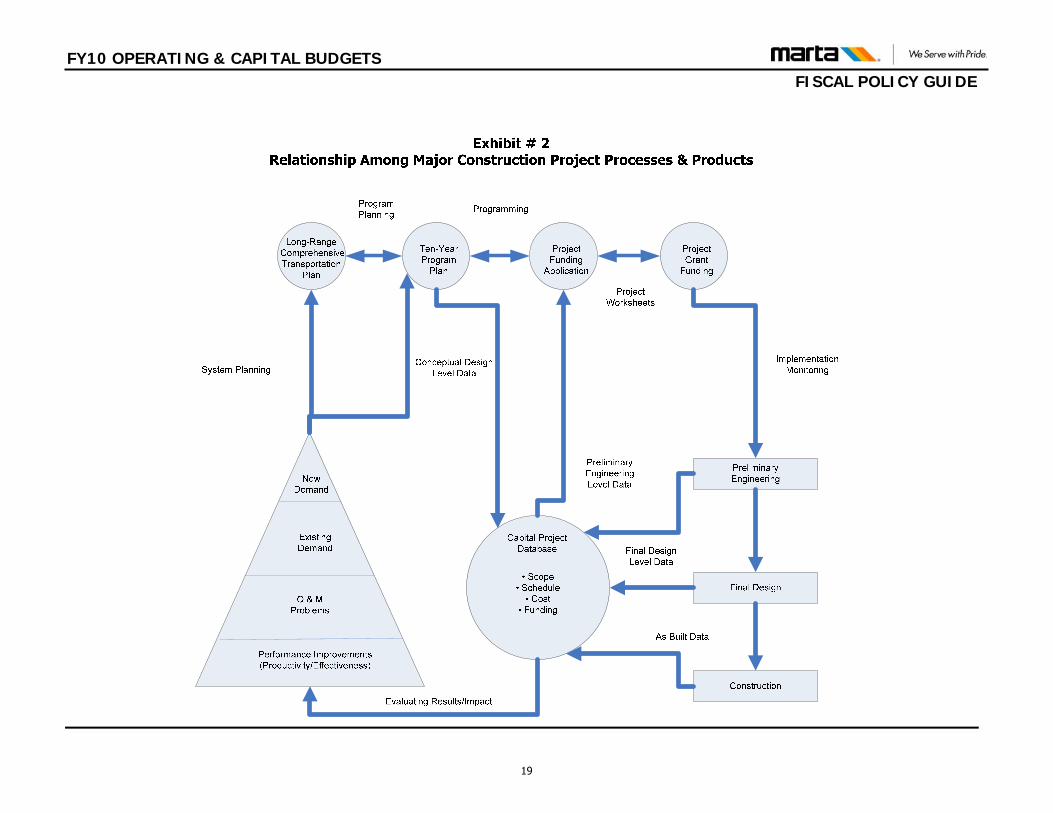
Capital Planning Process Exhibit 2 identifies the relationship among the major construction project processes and final products. It identifies two plans that will be essential to ensure long-term success: The Authority-wide Long-Range Comprehensive
Transportation Plan – This plan focuses on long-range, system-level planning. It will identify and analyze overall transit service issues, opportunities, problems, documented needs, and priorities from the Capital Improvement Program. This will provide management with the “big picture” of the capital program to ensure coordination among departments and the Authority’s ability to fund these programs and projects.
Ten-Year Program Plan – This plan is a comprehensive ten-year Capital Program that must be in place to address
service and capital improvements to be made in each year of the plan. Plans to coordinate such service and capital improvements among bus and rail modes and customer service areas will be defined. The Ten-Year Program Plan is the “catalyst” for the Executive Management Team to manage the planning and implementation of capital programs, projects, and procurements. To do so, the Ten-Year Program Plan has:
a) A clear linkage to the long-range comprehensive capital plan, as well as operating and capital budgets.
b) Goals, objectives, and performance measures to
be used internally for periodic evaluation of the progress in implementing the program’s plans.
18
FY10 OPERATING & CAPITAL BUDGETS FISCAL POLICY GUIDE
19
FY10 OPERATING & CAPITAL BUDGETS FISCAL POLICY GUIDE
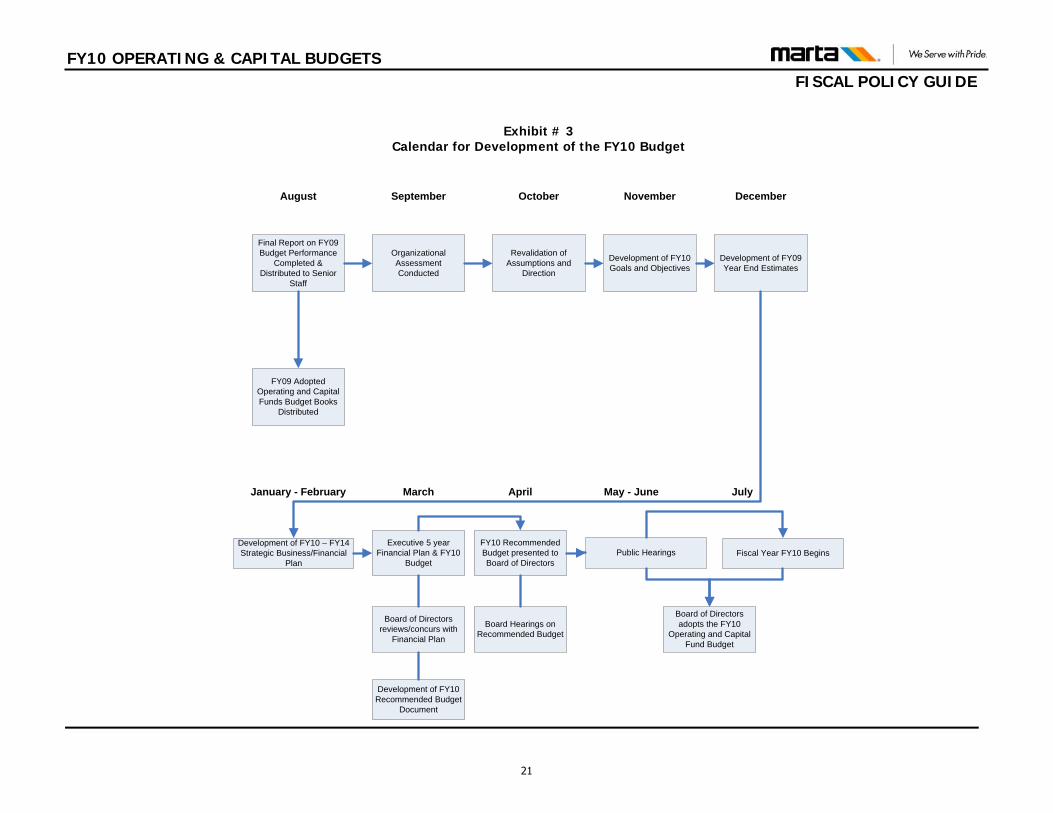
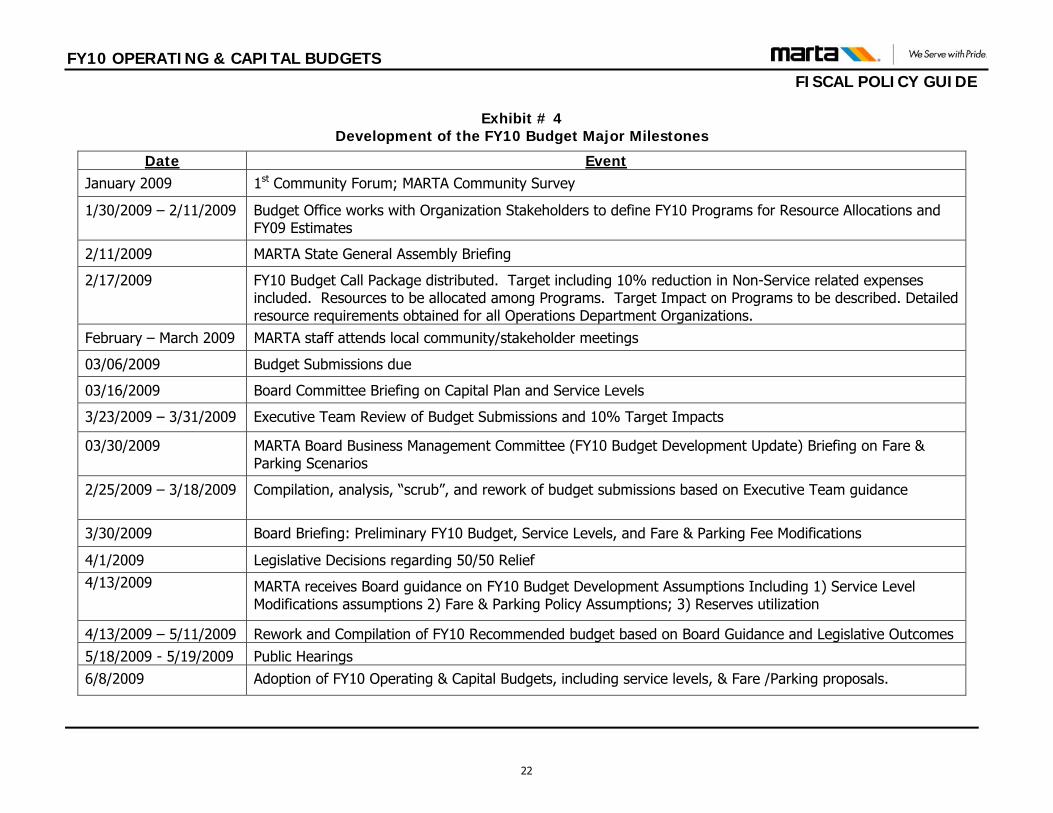
Fiscal Year Budget Development The Authority conducts an extensive review of the fiscal year budgets, validates current and projected expenditures, and identifies outstanding issues for consideration during departmental budget reviews with the Executive Management Team. This takes place in April as shown in Exhibit 3 and Exhibit 4. The Recommended Budget considers estimates of current year spending and revenues, work program priorities, proposed expenditures, and projected revenues. The General Manager presents the Recommended Budget to the Board of Directors in April, focusing on the current financial position and the financial implications of the recommended plan. Building upon last fiscal year’s objectives, the following approach to developing the budget was again implemented:
1) C – Capitalize all eligible costs as aggressively as possible. 2) O – Optimize work flows & processes to reduce delay or
waste of time & resources (shorten production time), reduce or eliminate duplicity of efforts, or seek automation of certain efforts. RE-ENGINEER TO DO MORE WITH LESS.
3) R – Reallocation of resources across categories of expense and across Departments in order to shift the Authority’s resources toward core services (Rail Service, Bus Service and Para-transit Service).
4) E – Employee Downsizing must be considered. Each Office must consider the realities of deletions and plan accordingly.
In May or June, a summary of the Recommended Budget is presented to the citizens of Fulton and DeKalb counties at public hearings. Prior to
and after the hearings, copies of the Recommended Budget are made available to the public. At the public hearing, citizens are encouraged to comment verbally or in writing on the Authority's operational plan for the coming fiscal year. Senior Staff members and the General Manager are present at the hearings, and any questions that cannot be appropriately addressed at the hearings are forwarded to the respective areas for a response. In addition to the budget development phase, opportunities for public comment occur formally and informally throughout the year. On an informal basis, Customer Question and Answer sessions are held at MARTA's rail stations periodically. On a formal basis, significant route changes or applications for a major federal capital grant may require a public hearing that provides further opportunities for public comment. The budget is adopted on or before June 30th, the last day of the fiscal year, by resolution of the Board of Directors. The Adopted Budget Book is distributed to internal Authority personnel, local governments, and to private citizens or other interested parties upon request. In case an amendment to the Adopted Budget is necessary due to changes in economic conditions or emergencies which cause the Fiscal Year Budget to increase beyond the Adopted Budget’s Total Expenses, the Board may propose an amendment to the annual Adopted Budget by following the same procedure described above for adopting the original budget. Requests for organizational changes that may arise during the fiscal year include requests to add or delete individual positions, or to change the organizational structure and/or functions of the division. Organizational changes must include a funding plan and supporting information justifying the request. Approval of organizational change requests is handled via the General Manager’s authority.
20
FY10 OPERATING & CAPITAL BUDGETS FISCAL POLICY GUIDE
Exhibit # 3Calendar for Development of the FY10 Budget
December
January - February
August September October November
Final Report on FY09Budget Performance
Completed & Distributed to Senior
Staff
Organizational Assessment Conducted
Revalidation of Assumptions and
Direction
Development of FY10 Goals and Objectives
Development of FY09 Year End Estimates
FY09 Adopted Operating and Capital Funds Budget Books
Distributed
Development of FY10 – FY14Strategic Business/Financial
Plan
March April May - June July
Executive 5 year Financial Plan & FY10
Budget
Board of Directors reviews/concurs with
Financial Plan
Development of FY10 Recommended Budget
Document
FY10 Recommended Budget presented to Board of Directors
Board Hearings on Recommended Budget
Public Hearings Fiscal Year FY10 Begins
Board of Directors adopts the FY10
Operating and Capital Fund Budget
21
FY10 OPERATING & CAPITAL BUDGETS FISCAL POLICY GUIDE
Date Event January 2009 1st Community Forum; MARTA Community Survey
1/30/2009 – 2/11/2009 Budget Office works with Organization Stakeholders to define FY10 Programs for Resource Allocations and FY09 Estimates
2/11/2009 MARTA State General Assembly Briefing
2/17/2009 FY10 Budget Call Package distributed. Target including 10% reduction in Non-Service related expenses included. Resources to be allocated among Programs. Target Impact on Programs to be described. Detailed resource requirements obtained for all Operations Department Organizations.
February – March 2009 MARTA staff attends local community/stakeholder meetings
03/06/2009 Budget Submissions due
03/16/2009 Board Committee Briefing on Capital Plan and Service Levels
3/23/2009 – 3/31/2009 Executive Team Review of Budget Submissions and 10% Target Impacts
03/30/2009 MARTA Board Business Management Committee (FY10 Budget Development Update) Briefing on Fare & Parking Scenarios
2/25/2009 – 3/18/2009 Compilation, analysis, “scrub”, and rework of budget submissions based on Executive Team guidance
3/30/2009 Board Briefing: Preliminary FY10 Budget, Service Levels, and Fare & Parking Fee Modifications
4/1/2009 Legislative Decisions regarding 50/50 Relief 4/13/2009 MARTA receives Board guidance on FY10 Budget Development Assumptions Including 1) Service Level
Modifications assumptions 2) Fare & Parking Policy Assumptions; 3) Reserves utilization
4/13/2009 – 5/11/2009 Rework and Compilation of FY10 Recommended budget based on Board Guidance and Legislative Outcomes 5/18/2009 - 5/19/2009 Public Hearings 6/8/2009 Adoption of FY10 Operating & Capital Budgets, including service levels, & Fare /Parking proposals.
Exhibit # 4 Development of the FY10 Budget Major Milestones
22
FY10 OPERATING & CAPITAL BUDGETS FISCAL POLICY GUIDE
Transportation Improvement Program (TIP) The Atlanta Regional Transportation Improvement Program (TIP) is published each summer by the Atlanta Regional Commission (ARC). This document outlines the long-term transportation plan for the Atlanta Region based on input from MARTA and the Georgia Department of Transportation, as well as governmental and community groups in the member counties of Barrow, Bartow, Cherokee, Clayton, Cobb, Coweta, DeKalb, Douglas, Fayette, Forsyth, Fulton, Gwinnett, Hall, Henry, Newton, Paulding, Rockdale, Spalding, and Walton. The MARTA TIP process begins each November and continues until March when the ARC begins to compile input from each of the participants. The initial input received for the MARTA Strategic Business Plan is used as a vehicle for TIP development. The TIP documents a six-year program, broken down by two, three-year periods. MARTA Grant Process MARTA receives grant funds from the Federal Transit Administration (FTA) and other sources such as the Department of Homeland Security and the State of Georgia to support its operating and capital programs. Grant funds are available under various “sections” of the Federal Transit Act and are appropriated annually in conjunction with the federal budget cycle. MARTA generally applies for grant assistance during the first quarter of the Federal fiscal year. Due to the Federal appropriation cycle, adjustments of grants must sometimes be made later to reflect actual appropriation. Funds are typically awarded in February; however, the grant cycle continues as programs are re-evaluated and grants are amended and revised. A key factor in the grant process is the TIP cycle described above. Grant and TIP cycles are closely linked since federal assistance will only be granted to plans and programs approved by the Atlanta Regional Commission in the TIP. Financial & Budgetary Policies 1) Creation and Organization The Metropolitan Atlanta Rapid Transit Authority (MARTA)
was formed as a joint public instrumentality of the City of Atlanta and the counties of Fulton, DeKalb, Cobb, Clayton, and Gwinnett by action of the General Assembly of the State
of Georgia (the MARTA Act), to design and implement a rapid transit system for the Atlanta metropolitan area. MARTA operates a bus and rapid rail transportation system and continues to develop and construct further improvements to its integrated bus/rail transportation system.
As required by the terms of MARTA’s Sales Tax Revenue Bond Trust Indentures, the financial activities of MARTA are accounted for using three separate funds, all of which are related to Capital or Debt Service, with the exception of a single Operating Fund. Such funds are combined for financial reporting purposes in order to present the financial position and results of operations of MARTA as a whole. They are as follows:
1) General Operating Fund – MARTA uses a General Operating Fund for all operating activities and financial resources with the exception of those accounted for in another fund. This principle is in accordance with GAAP.
2) Debt Service Funds – MARTA uses separate funds for the Sinking Funds (Debt Service) to accumulate financial resources for the payment of long-term debt principal and interest. This principle is in accordance with GAAP.
3) Capital Projects Funds - MARTA uses separate funds for major capital acquisition, construction and Authority’s planning needs that are financed through borrowings or contributions. This principle is in accordance with GAAP.
The State of Georgia determined oversight responsibility based on consideration of financial interdependency, selection of governing authority, designation of management, the ability to significantly influence management, and accountability for fiscal matters. No governmental units other than MARTA itself are included in the Authority reporting entity.
23
FY10 OPERATING & CAPITAL BUDGETS FISCAL POLICY GUIDE
MARTA is not included within the reporting entity of the City of Atlanta or any of the counties because these governments do not exercise significant influence over MARTA, and the city and counties are not accountable for MARTA’s fiscal matters.
MARTA is governed by an 18-member board of directors. MARTA has implemented the provisions of Statement No. 14 of the Governmental Accounting Standards Board (GASB), The Financial Reporting Entity, including additional guidance promulgated by GASB No. 39. As defined by the GASB, the financial reporting entity is comprised of the primary government and its component units. The primary government includes all departments and operations of MARTA, which are not legally separate organizations. Component units are legally separate organizations, which are fiscally dependent on MARTA or for which MARTA is financially accountable, or which raises and holds economic resources for the direct benefit of MARTA. An organization is fiscally dependent if it must receive MARTA’s approval for its budget, levying of taxes or issuance of debt. MARTA is financially accountable for an organization if it appoints a majority of the organization’s board, and either a) has the ability to impose its will on the organization or b) there is the potential for the organization to provide a financial benefit to or impose a financial burden on MARTA. The reporting entity of MARTA consists solely of the primary government. MARTA has no component units.
Of its eighteen member board, three members are appointed by Fulton County, five members by DeKalb County, four members by the City of Atlanta, and one member by each County of Clayton and Gwinnett. In addition, the Commissioner of the State Department of Transportation, the Commissioner of the State Department of Revenue, the Executive Director of the State Properties Commission, and the Executive Director of the Georgia Regional Transportation Authority serve as ex-officio members of the Board. None of the participating
governments appoints a majority of MARTA’s Board and none has an ongoing financial interest or responsibility.
2) Balanced Budget In order to measure the costs of providing mass
transportation services, the revenues from those services and required subsidies, MARTA has adopted the accounting principles and methods appropriate for a governmental enterprise fund. In accordance with accounting standards applicable to enterprise funds, MARTA has elected not to apply pronouncements issued by the Financial Accounting Standards Board after November 30, 1989. This complies with the MARTA Act and Sales Tax Bond Trust Indentures legal requirements that all accounting systems and records, auditing procedures and standards, and financial reporting shall conform to generally accepted principles of governmental accounting.
MARTA’s financial statements are prepared on the accrual basis of accounting in accordance with accounting principles generally accepted in the United States of America as promulgated by the Governmental Accounting Standards Board. The budget is prepared on the same basis of accounting as the financial statements, except that depreciation and interest expense are not budgeted. MARTA is structured as a single enterprise fund with revenues recognized when earned and measurable, not when they are received. Expenses are recognized when they are incurred, not when they are paid. Capital assets are capitalized and (except land) are depreciated over their useful lives. Cash amounts are restricted for debt service.
The operating and capital budgets combined are balanced when expenditures do not exceed the sources of revenue. For FY10 the total uses are $787.5M, and the total sources are $987.5M, which leaves a surplus of funds of $199.94M. MARTA has several sources of revenue as explained below.
MARTA receives proceeds from the collections of sales and use tax under the Rapid Transit Contract and Assistance
24
FY10 OPERATING & CAPITAL BUDGETS FISCAL POLICY GUIDE
Agreement with the City of Atlanta and the Counties of Fulton and DeKalb. The tax is levied at a rate of 1% until June 30, 2047 and .5% until June 30, 2057.
Under the law authorizing the levy of the sales and use tax, as amended May 10, 2002, MARTA is restricted as to its use of the tax proceeds as follows:
1) No more than 50% of the annual sales and use tax proceeds can be used to subsidize the net operating costs, as defined, of the system, exclusive of depreciation and amortization, and other costs and charges as defined in Section 25(I) of the MARTA Act, except for the period beginning January 1, 2002 and ending December 31, 2008 when no more than 55% shall be used. The additional 5% of the Sales tax revenues may be applied to the operations of the transit system, to be used at the discretion of the General Manager.
2) If more than the legislative provided percentage of the annual sales and use tax proceeds is used to subsidize the net operating costs in any one year, the deficit in operations must be made up during a period not to exceed the three succeeding years.
3) If less than the legislative provided percentage of the annual sales and use tax proceeds is used to subsidize the net operating costs in any one year, the excess may, at the discretion of MARTA’s Board of Directors, be reserved and later used to provide an additional subsidy for operations in any future fiscal year or years.
The Georgia General Assembly approved certain amendments to the MARTA Act which provided that, commencing on July 1, 1988 until December 31, 2008, interest earnings from the real estate reserve and the capital rehabilitation replacement reserve may be treated as “transit” related operating revenue” for purposes of the legislative provided percentage requirement. The Board of Directors unanimously approved a resolution to use the
interest earnings on these reserve funds to pay operating costs of the system through fiscal year 1995. Fiscal years 1996 through 2001 earnings were reserved for future use as either operating or capital expenditures. The fiscal years 2002, 2003, and 2004 budget resolutions provided for the use of the future use reserved interest.
The Authority shall fund and maintain an operating budget reserve of ten percent (10%) of the Authority’s prior year operating budget revenues. For purposes of this section, the term 'operating budget revenues' shall mean all funds received from federal, state, or local sources, including but not limited to grants, distributions from federal and state formula funds, or direct federal and state appropriations for projects or programs of the Authority, as well as fare box revenues and revenues received from rentals on property owned or operated by the Authority. Said operating budget reserve shall be utilized for ongoing operating expenses only in those circumstances requiring its use due to worsened economic conditions in the Atlanta region, or catastrophic loss such as an act of God or terrorism, which conditions cause a temporary shortfall in the Authority’s anticipated revenues. The temporary operating revenue shortfall so noted shall be for a period of not less than six consecutive months during which total anticipated revenues are not less than two and one-half percent (2.5%) below the revenues received during the preceding fiscal year for the same six-month period. The first three percent (3%) of the reserve shall not be used in any six-month period. The purpose of said reserve shall be exclusively to pay the ongoing operating expenses during times of economic downturn and shall not be considered to be an available recurring revenue for operating budget purposes and under no circumstances shall the operating budget reserve be used to permanently replace the revenues which are reduced due to the economic conditions set forth above. Upon cessation of such economic downturn, as evidenced by cessation of the revenue shortfall required for the use of the reserve for
25
FY10 OPERATING & CAPITAL BUDGETS FISCAL POLICY GUIDE
Authority operating expenses, the operating budget reserve shall be replenished.
During each fiscal year the Board shall propose an annual operating budget for the ensuing fiscal year and hold a public hearing thereon. After such public hearing the Board shall review its proposed budget, and, on or before the last day of the fiscal year, it shall adopt an annual operating budget for the ensuing fiscal year.
The Board shall propose and adopt an annual capital improvements budget. The proposed capital improvements budget shall show all capital improvement projects in process of completion, those to be undertaken during the ensuing fiscal year and those anticipated to be undertaken during the ensuing ten years. The proposed budget shall also show the proposed method of financing each proposed project and the effect thereof on the debt structure of the Authority. After a public hearing the Board shall review its proposed budget and on or before the last day of the fiscal year it shall adopt an annual capital improvements budget for the ensuing fiscal year. No contract for the purchase or construction of any capital improvement project shall be authorized, except to meet a public emergency certified as such by the Board, unless it is included in the annual capital improvements budget; however, the Board may propose and adopt an amendment to the annual capital improvements budget by following the procedure herein prescribed for adopting the original budget.
MARTA receives grant funds from the Federal Transportation Administration (FTA) for a substantial portion of its capital acquisitions. Assets acquired in connection with capital grant funds are included in property and equipment. These grants generally require a local funding match by MARTA at a stipulated percentage of total project costs. Capital grant agreements with the FTA enable the FTA to hold a continuing interest in properties acquired and restricts their use to the provision of mass transportation services.
The FTA also provides funds for subsidizing operating costs involved in preventive maintenance of vehicles, system and equipment under Section 5307 of the Federal Transit Act.
3) Long-Range Planning MARTA receives proceeds from the collections of sales and
use tax under the Rapid Transit Contract and Assistance Agreement with the City of Atlanta and the Counties of Fulton and DeKalb. The tax is levied at a rate of 1% until June 30, 2047 and .5% until June 30, 2057.
MARTA issues Sales and Use Tax Revenue Bonds and Commercial Paper to raise capital funds for construction, expansion, and rehabilitation of the transit system. During fiscal year 2007, MARTA initiated its current commercial paper program to provide flexibility and optimization to the issuance of debt. The bonds and notes are payable from and secured by a first, second, and third liens on sales and use tax receipts.
The FTA has also authorized other grant funds for the construction of bus transit facilities, replacement and rehabilitation of transit operating equipment, development work for construction support techniques, purchase and installation of a computer, and other purposes not directly related to the rail construction program. MARTA plans to fund its committed projects through the unencumbered capital portion of its sales tax, future bond proceeds, issuance of commercial paper and federal and state capital grants. MARTA also has lease and interest revenue and capital reserves available to supplement its needs.
MARTA has entered into forward contracts to purchase low sulfur heating oil and natural gas at a specified time in the future at a guaranteed price. MARTA enters into these contracts to help plan its low sulfur diesel and natural gas costs for the year and to protect itself against market risk of the commodity. It is possible that the market price before or at the specified time to purchase low sulfur diesel and natural gas may be lower than the price at which the MARTA
26
FY10 OPERATING & CAPITAL BUDGETS FISCAL POLICY GUIDE
is committed to buy. This would reduce the value of the contract. MARTA could sell the forward contract at a loss, or if it were to continue to hold the contract, MARTA may make a termination payment to the counterparty to cancel its obligation under the contract and then buy low sulfur diesel and natural gas on the open market. These contracts expire on June 30, 2010.
MARTA considers all highly liquid debt securities with an original maturity of no more than three months at date of purchase to be cash equivalents except repurchase agreements and restricted investments, which are considered investments.
Georgia statutes authorize MARTA to invest in U.S. Government obligations, U.S. Government agency obligations, obligations of any instrumentality of the U.S. Government, or in repurchase agreement collateralized by any of the aforesaid securities, prime Bankers’ Acceptances or in State of Georgia obligations, or in the State of Georgia sponsored investment pool or in other obligations or instruments as allowed by Georgia Law. Under the terms of MARTA’s Sales Tax Revenue Bond Trust Indenture, the Authority may not invest in securities with a remaining term to maturity greater than five years from the purchase date. In addition, MARTA requires that repurchase agreement collateral must have a market value ranging from 101% to 102% of the cost of the repurchase agreement, depending upon the maturity date and type of security. MARTA’s policy states that collateral pledged for repurchase agreements and not delivered to MARTA’s safekeeping agent must be held in custody or account agreeable to MARTA in MARTA’s name.
With the exception of those in the deferred compensation plan, investments are carried at cost or amortized cost plus accrued interest (which approximates market value). Investments in the deferred compensation plan are carried at market value.
Reservations of Retained Earnings are used to indicate that a portion of retained earnings is legally segregated for a
specific future use. Designations of retained earnings are not legally required reserves but are segregated for a specific purpose by an act of the Board of Directors of MARTA.
MARTA’s long range plan is derived from the vision articulated within by the Transit Planning Board Concept 3 Plan and has been formalized by the MARTA Board of Directors. This vision recognizes MARTA’s role as the core of the regional transit system needed to accommodate the anticipated growth in the Atlanta region over the next 25 years. The vision also features expanding the existing system in 10 corridors (please see the MARTA History & System Overview section for a detailed listing of the expansion corridors). These corridors were identified as priorities in no particular ranking, and were included in the approved 12th and 13th Amendments to the Rapid Transit Contract and Assistance Agreement. 4) Asset Inventory The largest portion of MARTA’s net assets each year represents its investment in capital assets (e.g., land, rail system, buildings, and transportation equipment); less any related outstanding debt used to acquire those assets. MARTA uses these capital assets to provide services to its customers; consequently, these assets are not available for future spending. Although MARTA’s investment in its capital assets is reported net of related debt, it should be noted that the resources to repay this debt must be provided from other sources, since the capital assets themselves cannot be used to liquidate these liabilities. Capital Assets are carried at cost and depreciated using the
straight-line method based on the estimated useful lives of the related assets, as follows:
Rail system and buildings 5-50 years Transportation equipment 5-20 years Other property and equipment 4-20 years MARTA uses a three-hundred-dollar capitalization threshold
for its capital assets. Donated properties are stated at their fair value on the date donated. When assets are sold or retired, the cost of the asset and related accumulated depreciation is removed from the accounts and the resulting
27
FY10 OPERATING & CAPITAL BUDGETS FISCAL POLICY GUIDE
gain or loss, if any, is charged to non-operating revenue or expense. Ordinary maintenance and repairs are charged to expense as incurred, while property additions and betterments are capitalized. MARTA capitalizes, as a cost of its constructed assets, the interest expense based upon the weighted average cost of borrowings of MARTA.
Materials (principally maintenance parts) and supplies inventories are stated at average cost and expenditure is based on the consumption method. MARTA has a complete capital asset inventory every two years, as required by FTA.
Donated properties are stated at their fair market value on the date donated. Depreciation expense on assets acquired with federal capital grant funds is transferred to contributed capital. When assets are sold or retired, the cost of the asset and related accumulated depreciation is removed from the accounts and the resulting gain or loss, if any, is charged against either contributed capital or non-operating expenses. The portion charged to contributed capital represents the un-depreciated portion of the asset that was originally purchased with federal capital grant funds. The remaining gain or loss is charged against non-operating expenses as it represents MARTA’s share. Ordinary maintenance and repairs are charged to expenses as incurred, while property additions and betterments are capitalized. MARTA capitalizes, as a cost of its constructed assets, the interest expense based upon the weighted average cost of borrowing.
Revenue Policies 1) Revenue Diversification The operating budget is funded through three primary
sources (Sales Tax, Operating Revenues and Federal Sources), as well as any Revenue Adjustments. The Authority’s capital budget is based on the availability of Federal grants and local matching funds, and its ability to issue bonds secured by future sales tax revenue.
Fare and parking revenue from transporting passengers, concessions, and advertising are reported as operating revenues. Transactions that are capital, financing or investing related, or which cannot be attributed to MARTA’s transportation focus, are reported as non-operating revenues.
Bond Proceeds, Discount, Issue Costs and Losses on Refunding- Proceeds from the issuance of Sales Tax Revenue Bonds are initially deposited with the Bond Trustee in a Construction Fund as required by the Trust Indenture between MARTA and the Trustee. MARTA requisitions the funds as needed for construction, rehabilitation and replacement of the transit system. Bond discount and issue costs are amortized, principally using the interest method, over the term of the related debt. Losses on debt refunding are deferred and amortized over the shorter of the life of the refunded debt or the new debt, on a basis consistent with the interest method.
Passenger fares are recorded as revenue at the time services are performed. The MARTA Act places certain requirements on the rate that MARTA is to charge for transportation services. The rates charged to the public for transportation services must be such that the total transit-related revenues, exclusive of any federal operating subsidy, sales and use tax proceeds, and other non-transportation related revenues received during each fiscal year, must be no less than 35% of the operating costs, exclusive of depreciation and amortization, of the preceding fiscal year. Under provisions of amendments to the MARTA Act, lease income, and interest earned on certain restricted investments (as discussed below), which are included in the non-operating revenues in the MARTA statement of revenues and expenses, are included in transit related revenues for the purposes of this calculation.
MARTA receives grant funds from the Federal Transportation Administration (FTA) for a substantial portion of its capital acquisitions. Assets acquired in connection with capital grant
28
FY10 OPERATING & CAPITAL BUDGETS FISCAL POLICY GUIDE
funds are included in capital assets. These grants generally require a local funding match by MARTA at a stipulated percentage of total project costs. Capital grant agreements with FTA provide for FTA holding a continuing interest in properties acquired and restrict the use of such properties to providing mass transportation services. Grants for capital asset acquisition, facility development, and rehabilitation are reported in the Statement of Revenues, Expenses, and Changes in Net Assets, after non-operating revenues and expenses as capital grants.
During the year ended June 30, 2001, MARTA began construction of a Transit Oriented Development (TOD) Program whereby MARTA would lease office, retail, and residential space. The BellSouth towers and related parking and retail space were completed in October 2002. Several lease agreements have been signed, the terms of which provide for various payments to be made to MARTA over a variety of years. Since that time several other TOD projects have been initiated and completed while others are still ongoing.
AGL constructed a refueling station on MARTA’s property at Perry Boulevard. MARTA leases this refueling station under an operating lease. The non-cancelable lease term is for five years after which the lease provides three renewal options of five years each but does not include a bargain renewal option. MARTA has the option to purchase the refueling station at the remaining value of the outstanding options valued at $125 per year. Total cost for such lease was $538 for the year ended June 30, 2005 and $574 for year ended June 30, 2004. The minimum future rental payments for year FY2006 is $540. MARTA leases air rights and ground leases over and adjacent to its stations to third parties for the construction of office and other developments.
Deferred revenue includes the remaining unamortized balance of the deferred amounts from the lease/leaseback arrangements in 2001, 2002, 2003, and 2004 and the sale/leaseback arrangements in 1987 and 1988 of certain rail
cars and buses. The deferred gains are being amortized over the remaining lives of the respective vehicles.
2) Fees and Charges The MARTA Act places certain requirements on the rates
that MARTA is to charge for transportation services provided. The rates charged to the public for transportation services must be such that the total transit related revenues are no less than 35% of the operating costs, exclusive of depreciation and amortization, and other costs and charges as provided in the Act, of the preceding fiscal year. Under provisions of amendments to the MARTA Act, all revenues, except the sales and use taxes, are included in transit related revenues for purposes of this calculation.
Except with regard to fixing, altering, charging, and collecting fares for charter, group, and party bus services, as provided in Section 9(f) of this Act, the power to fix, alter, charge, and collect fares, rates, rentals, and other charges for its facilities by zones or otherwise at reasonable rates to be determined exclusively by the Board, subject to judicial review as hereinafter provided.
3) Use of One-time Revenues MARTA’s enabling legislation, the MARTA Act, states that the
Board shall make provisions for an annual operating budget and an annual capital improvements budget. Every budget, proposed or as finally adopted, shall conform to generally accepted budgetary standards of public bodies. In the annual operating budget each operating fund shall be set forth separately and show an estimate of the fund balance to be available at the beginning of the year, an estimate of anticipated credits during the year according to source, an estimate of anticipated charges, including capital outlay or debt service properly to be financed from anticipated revenues, and comparative data on the last two completed fiscal years and similar data, actual or estimated, for the current year. In complying with this requirement the use of
29
FY10 OPERATING & CAPITAL BUDGETS FISCAL POLICY GUIDE
revenues must be planned well in advanced. MARTA’s finances are structured such that all revenues flow into a “General Operating and Capital Fund”. One time or unpredictable revenues serve to increase these fund balance and appear as carry forward balances in futures years to be addressed in subsequent planning and budgeting cycles.
4) Use of Unpredictable Revenues MARTA’s enabling legislation, the MARTA Act, states that the
Board shall make provisions for an annual operating budget and an annual capital improvements budget. Every budget, proposed or as finally adopted, shall conform to generally accepted budgetary standards of public bodies. In the annual operating budget each operating fund shall be set forth separately and show an estimate of the fund balance to be available at the beginning of the year, an estimate of anticipated credits during the year according to source, an estimate of anticipated charges, including capital outlay or debt service properly to be financed from anticipated revenues, and comparative data on the last two completed fiscal years and similar data, actual or estimated, for the current year. In complying with this requirement the use of revenues must be planned well in advanced. MARTA’s finances are structured such that all revenues flow into a “General Operating and Capital Fund”. One time or unpredictable revenues serve to increase these fund balance and appear as carry forward balances in futures years to be addressed in subsequent planning and budgeting cycles.
Expenditure Policies 1) Debt Capacity, Issuance, and Management All expenses related to operating the bus and rail system are
reported as operating expenses. Interest expense, financing costs, and planning costs are reported as non-operating expenses.
MARTA issues Sales and Use Tax Revenue Bonds and Bond Anticipation Notes (Commercial Paper) to raise capital funds
for construction and expansion, and rehabilitation of the transit system. During fiscal year 2005, MARTA initiated its commercial paper program, in the form of Bond Anticipation Notes, to provide flexibility and optimization to the issuance of debt. The bonds and notes are payable from and secured by a first, second, and third liens on sales and use tax receipts.
Legally, MARTA’s estimated sales tax receipts must be at least twice the total debt service. MARTA’s Board has placed an additional restriction on the debt service coverage requirement, limiting the maximum estimated annual debt service to no more than 45 percent of the corresponding year’s estimated sale tax receipts.
MARTA has a Swap & Derivative Policy that is governed by the Issuer's use and management of all Agreements. The Issuer is authorized under Section 8 of an Act approved March 10, 1965 (Ga. L. 1965, p. 2243), as amended, i.e. the “Metropolitan Atlanta Rapid Transit Authority Act of 1965” (hereinafter the “MARTA Act”), to enter into such Agreements to manage or reduce the amount and duration of the interest rate, spread, or similar risk when used in combination with the issuance of bonds and outstanding bonds of the Issuer.
Contingent upon the approval of the Issuer’s Board of Directors, the Issuer may enter into credit enhancement or liquidity agreements in connection with any Agreement containing such terms and conditions as the Issuer determines are necessary or desirable, provided that any such credit enhancement or liquidity agreement as the same source of payment as the related interest rate management agreement.
In conjunction with the Debt Management Policy, the Policy shall be reviewed and, if necessary, updated at least annually. The General Manager/CEO, Assistant General Manager of Finance/CFO, Director of Treasury Services and the Manager of Financial Planning & Analysis are the designated administrators of the Issuer's Swap Policy (the
30
FY10 OPERATING & CAPITAL BUDGETS FISCAL POLICY GUIDE
“Policy Administrators”). The Director of Treasury Services and the Manager of Financial Planning & Analysis shall have the day-to-day responsibility for managing interest rate swaps.
With respect to all or any portion of any of the Issuer’s debt that it is authorized to issue under section 10 of the MARTA Act, as amended, that it has either issued or anticipates that will be issued, the Issuer may enter into, terminate, amend, or otherwise modify a Qualified Interest Rate Management Agreement under such terms and conditions as the Issuer may determine, including, without limitation, provisions permitting the Issuer to pay to or receive from any person or entity any loss of benefits under such agreement upon early termination thereof or default under such agreement.
In fiscal 1994, MARTA adopted GASB Statement of Standards No. 23, “Accounting and Reporting for Refunding of Debt Reported by Proprietary Activities.” As such, losses on these transactions are deferred and amortized over the life of the new debt on a straight-line basis.
2) Reserve or Stabilization Accounts The Georgia General Assembly approved certain
amendments to the MARTA Act which provided that, commencing on July 1, 1988 until December 31, 2008, interest earnings from the real estate reserve and the capital rehabilitation replacement reserve may be treated as “transit related operating revenue” for purposes of the legislative provided percentage requirement. The Board of Directors unanimously approved a resolution to use the interest earnings on these reserve funds to pay operating costs of the system through fiscal year 1995. Fiscal years 1996 through 2001 earnings were reserved for future use as either operating or capital expenditures. The fiscal years 2002, 2003, and 2004 budget resolutions provided for the use of the future use reserved interest.
3) Operating & Capital Expenditure Accountability
An annual operating and capital budget is developed by MARTA’s Management. After a public hearing, the proposed budget is revised, if necessary, finalized and adopted by MARTA’s Board of Directors. The budget is prepared on the same basis of accounting as the financial statements except that depreciation, interest expense, gain/loss on sale of property, and non-operating general and administrative expenses are not budgeted. Management control for the operating budget is maintained at expenditure category levels. Management has flexibility of reprogramming funds in respective cost centers with approval of budget staff as long as the total budget authorization is not exceeded. Capital expenditures are controlled at the budget line item.
MARTA allocates certain general and administrative expenses to transit operations and also capitalizes certain of these expenses in construction in progress based on its cost allocation plan prepared in accordance with FTA guidelines. General and administrative expenses not allocable to either transit operations or construction in progress under FTA guidelines are reflected as non-operating general and administrative expense in the accompanying statement of revenues, expenses, and changes in net assets.
MARTA adopts its Operating and Capital Budget in June of each year. Once adopted, total budgeted revenues and/or expenses cannot change. Budgets are allocated to monthly spending levels and a monthly Budget Performance Report is prepared. The monthly Budget Performance Report analyzes expenditures by office relative to monthly and total budgets, and revenues anticipated for the reporting period.
Budgets are controlled through accounting systems at a hierarchal level by account numbers within each expense category. Categories include labor related cost categories (salaries and benefits) and non-labor related cost categories (services, materials & supplies, utilities, casualty & liability, taxes, etc.).
When expenditures are incurred or encumbered, funds must be sufficient within the category of the department's budget
31
FY10 OPERATING & CAPITAL BUDGETS FISCAL POLICY GUIDE
in order for processing the requisition, purchase order or invoice. If funds are non sufficient, the division must request a transfer of funds from one of the other non-labor categories.
In the past, the Authority has determined that other means to bring the budget into balance were necessary. These included:
1) Mandatory furloughs for all Non-Represented employees.
2) A policy of freezing all merit-based increases for Non-Represented and no negotiated wage increase for Represented employees.
3) An ongoing commitment from staff to reduce General and Administrative (G&A) costs and to realize improvements in efficiency and effectiveness. This included Bus Service and Rail Service Modifications, as well as other Reduction-In-Force (RIF) initiatives.
4) Revenue enhancement initiatives as follows: a. Partnership Discount Modification
– maximum allowable volume discount is reduced from 8% to 5%
b. Visitor Pass Modification - $1 increase in the cost of all visitor passes
c. Braves Shuttle Fees - $1 fare each way
d. HiFi Shuttle Fees - $1 fare each way e. Long Term Parking Modification -
$1 increase on all long term parking
Source Documents The information used to develop the fiscal policy guide is provided by a variety of both internal and external sources1. A listing of the major resources is provided below.
1 MARTA Act
Rapid Transit Contract and Assistance Agreement
Americans with Disabilities Act
Regional Transportation Plan
MARTA Strategic Plan
The Bond Trust Indentures
MARTA Investment Guidelines
Georgia State University (GSU) Sales tax Forecast
MARTA's Fixed Asset Management and Capital Policy
1990 Clean Air Act
Safe, Accountable, Flexible, Efficient Transportation Equity Act: A Legacy for Users (SAFETEA-LU)
Sales Tax Bond Trust Indenture
Governmental Accounting Standards Board (GASB)
FTA Guidelines
MARTA’s Swap & Derivative Policy
MARTA’s Debt Management Policy
32
FINANCIAL SUMMARY This section discusses MARTA’s current financial position within the context of revenues, expenditures, and the development of strategies consistent with our business plan to ensure fiscal stability.
FY10 OPERATING & CAPITAL BUDGETS FINANCIAL SUMMARY
MARTA’S MULTI--YEAR FINANCIAL FORECAST & FY 2010 BUDGET DEVELOPMENT The financial challenges facing MARTA go back a number of years and, in fact, have produced a dependency on the use of operating reserves at least since the mid to late 1990's while the search for a long-term dedicated and sustainable funding source has been sought. This condition has been significantly exacerbated by the current serious economic downturn. In the development of the FY 2008 budget in 2007, it was realized and anticipated that subsequent annual multi-year financial plans would depend heavily on funding through the use of operating reserves. For FY 2007, the Authority anticipated a robust growth of sales tax revenues based on the forecasted projections from the Georgia State Economic Forecasting Center (GSUEFC). After experiencing an 11.8% growth in sales tax in FY 2006, and based on the GSUEFC’s forecast for the next five years, the Authority implemented a Mid Year 2007 Budget Adjustment. The individual re-investment increases were aimed at improving the quality of service provided to MARTA customers. These improvements consisted of adding back over 600 positions into the areas of Customer Service and Cleanliness, Reliability & Safety, Service (Regular and Mobility) Delivery, and an Expanded Uniformed Presence. Despite the projected receipt of robust levels of tax revenues over the five year period ending June 2011, the reinvested service improvements were projected to deplete MARTA’s operating reserves by the end of FY 2010. This reinvestment strategy anticipated the Authority receiving an additional dedicated and sustainable source of revenue–in the order of $50M (Million) per year for operations by FY 2010. This new revenue stream planned to result from increased State/Regional transportation investment would ensure the Authority’s fiscal viability beyond FY 2010. In January 2008, MARTA recognized that the predicted sales tax growth was not being realized and, as such, implemented a number of cost containment initiatives that ultimately produced savings in excess of $10M. These “early on” actions resulted in the Authority’s ability to reduce its use of Operating Reserves – from $21.35 Million budgeted for use in FY 2008 – to $6.88M (a budget savings of $14.5 Million or 68%) by fiscal year-end 2008. This fiscal performance improvement allowed the
Authority to carry $136.87M in sales tax revenues (including the 55/45 flex funds) into FY 2009. Early in FY 2009, it was recognized that the projected impact on 2009’s budgeted use of reserves would be $56.7M. By the end of the first quarter of FY 2009, the Authority’s fiscal challenges were further exacerbated by the severe international economic downturn. The results of the GSUEFC's revised sales tax projection for FY 2009 depicted a $30M loss from budget, 50% of which is dedicated to operations. A second reforecast, received in December 2008, further reduced the annual sales tax forecast to a total of $40M in FY 2009 and over $1.2 Billion through FY 2018. Additional internal cost containment initiatives of approximately $11 Million were implemented for FY 2009 in December 2008, and were expanded as cost containment initiatives in the FY 2010-12 time period. At the outset of the FY 2010-12 Operating Budget Financial Plan and FY 2010 Operating Budget Development process, a total multi-year (2009-2012) financial shortfall of $441.5M has been forecasted. This total includes $27.8 Million in new investments over the next three years in conjunction with providing resources to address safety issues identified in a recently completed TRA Safety Assessment review, and bringing Breeze fare gate maintenance in-house. In response to this multi-year financial shortfall, a series of deficit reduction strategies were advanced for Board consideration over the last several months. Those potential actions included, but were not limited to, internal cost containment measures, fare and parking fee increases, legislative relief aimed at the removal of 50/50 sales tax and interest use restrictions, the development of additional and/or new revenue streams, core service modifications and/or service reductions, and the use of one-time economic recovery funds. As noted, the FY 2009-12 Financial Shortfall is projected at $441.5M. At this time, MARTA is advancing the following recommendations to the Board of Directors for their consideration as a means to address this multi-year financial shortfall.
33
FY10 OPERATING & CAPITAL BUDGETS FINANCIAL SUMMARY
Internal Productivity and Cost Containment Measures MARTA is advancing a total of $70.4M over the FY 2009-12 periods in a series of cost containment measures that include: 1. The elimination of non-represented based merit increases; 2. The implementation of a ten (10) day furlough for non-represented
employees excluding police and operating supervisors 3. An increase in the share that non-represented employees pay for
Healthcare; 4. The elimination of non-represented employee vacancies; 5. An improvement in represented employee availability; and 6. A reduction in Non-Labor (Other Than Personnel Services) expenses. It is anticipated that these actions will reduce the multi-year FY 2009-12 shortfalls to $371.2 M. Fare Increase and Parking Fees The last fare increase was in 2001, when the fare was increased from $1.50 to $1.75. At that time, there was a Board commitment to hold the fare constant for five (5) years. At the present time, MARTA is advancing a fare increase of 25 cents to the base fare, raising it from $1.75 to $2.00. Additionally, MARTA further proposes to increase the “multiple” from 30 in FY 2010 to 32 in FY 2011 and to 34 in FY 2012. The increase in base fare and “multiples” will be feathered in over three (3) years for our Mobility and Half Fare customers. These actions are expected to generate $22.1M over the FY 2010-12 time period. It is anticipated that these additional revenues will reduce the multi-year FY10-12 shortfall to $349.1M. Finally, MARTA is recommending that, as a short-term approach, overnight parking fees be raised from $4 to $5 and from $7 to $8, respectively at the nine (9) stations currently charging for this service. While relatively negligible at $300K to $500K (Kilo / thousand) per annum, this additional revenue – which has not as yet been counted towards the multi-year deficit – will be generated over an 18-month period during which a long term parking strategy is developed and implemented. This strategy will include the ability to provide variable based fees for customers outside the core MARTA service area, as well as potentially contracting out of parking services.
Core Service Adjustments Proposed core service adjustments were framed by MARTA’s adopted Standards for Bus and Rail Service and several guiding principles. The proposal recommends adjustments to service by identifying unproductive service per the Service Standards and operational adjustments based on utilization on the bus and rail systems. The cost savings associated with unproductive service, rider utilization-based adjustments and rail service modifications are estimated @ $1.2M, $2.2M and $5.0M, respectively. This equated to a total annual savings of $8.4M per year. The guiding principles for the proposed core service adjustments include: preservation of all lifeline services people to jobs, medical facilities, and non-discretionary destinations; retention of a quality of service that is a viable option for use as a lifestyle choice; safeguarding the seamlessness of the regional system as service reductions on the MARTA system have regional ripple effects on the other systems; maintaining Equity and system connectivity by including modifications to bus and rail service; observing Ridership utilization and trends on bus and rail to ascertain the use of the system and identify areas of minimal impact to the customer; and the impacts to Complementary Mobility Services (CPS) were to ensure compliance with requirements pursuant to the Americans with Disabilities Act (ADA).1 Over the multi-year shortfall period, savings are estimated at $25.2M and will reduce the overall shortfall to $323.9M if all recommended measures are adopted by the Authority's Board of Directors. New Revenue Sources The recent passage of Georgia Assembly Bill SB 89 – which now allows food and drink in MARTA rail stations – has opened potential new future revenue streams for the agency.
1 Lifeline services are defined as routes serving areas of high concentration of low income and transit dependent households. Transit dependent households are defined as having 0 vehicles available, have children less than 18 years and non-institutionalized citizens over 65 years. The threshold for these groups is the service area average (e.g., the service area average for 0-car HH is 29.7%).
34
FY10 OPERATING & CAPITAL BUDGETS FINANCIAL SUMMARY
Use of MARTA Reserves MARTA currently has two (2) reserve accounts that can, with Board approval, be used to supplement the multi-year financial shortfall. One, the Operating Reserve, is currently valued at approximately $145M and the second, a Real Estate Reserve, is valued at $55M. While insufficient to cover the remaining shortfall of $323.9M, these reserves when combined – less a “super reserve” of $52M pegged at 15% of the prior year’s net expenses – totals $148M that will be used as a financial bridge to FY 2012 when it is imperative that a new dedicated and sustainable revenue stream will be in place for transit operations. This multi-year use of Reserve Funds – less the “super reserve of $52M – reduces the FY 2009-12 financial shortfalls to $175.9M. Of this total, $45M remains in FY 2010, $40.2M in FY 2011, and $90.7M in FY 2012.2 Use of ARRA ‘Stimulus’ Funds To assist in reducing, on a one-year assistance basis, the remaining multi-year financial shortfall … MARTA is recommending that $20M of $63M recently provided by the government in new “Stimulus” dollars be flexed to preventive maintenance (PM) activities in FY 2010. This “one time” use reduces the FY 2010 shortfall to $25M, with FY 2011 and FY 2012 remaining at $40.2M and $90.7M, respectively. Use of Capital Reserves MARTA’s multi-year financial plan has been dependent – from its inception – upon the passage of “Self Help” legislation that would remove the 50/50 sales tax split requirement between operating and capital expenses and the use of capital reserve interest for operations. Such legislation was advanced during the 2009 Legislative Session as SB 120 and, if passed, would give MARTA access to $65M held in Capital Reserves. When coupled with the other actions described above, MARTA’s financial plan would be in balance through FY 2011 without initiating severe levels of service reductions. Unfortunately, SB 120 was not approved. While outer year financial gaps remain, the $25M budget gap in FY 2010 requires immediate attention.
2 As per Government Finance Officers Association (GFOA) statement that prudent business practice warrants a 5-15% annual reserve based on either prior year’s revenues or annual expenses.
MARTA has, until just recently, only one remaining option to close the $25M budget gap in FY 2010. Service reductions involving the closure of the system on one weekday a week throughout the year, or elimination of all Sunday service and one of two scenarios on partial/full closure on Saturdays, would each yield the required savings. Neither of these options is practical for a system the size and complexity as MARTA’s; however, no other short term option – with the exception of allocating scarce reserve dollars under a “spend and burn” philosophy of fiscal stewardship – is available. Based on an April 8th recommendation by the Atlanta Regional Commission's (ARC) TAQC Committee, and in subsequent discussions with ARC staff and other regional transit partners, it was determined that another short-term one-year funding alternative was available to MARTA. Essentially the ARC could flex up to $25 Million in unallocated ARRA, STP, or CMAQ funds to MARTA for use in FY 2010, and MARTA would identify capital funding from its Capital Reserves’ account in support of unfunded regional initiatives that had a clear nexus to MARTA services and facilities. It is important to note that these regional initiatives must be otherwise eligible for MARTA Capital Fund use as statutorily provided for in the MARTA ACT. Following the approval of this approach in concept by the TAQC Committee, ARC and MARTA have engaged in jointly identifying potential project candidates. Project categories included, but not limited to, areas such as: Smart Corridors; Pedestrian, ADA Access, and Bicycle Enhancements to MARTA
facilities; Regional Deployment of Breeze Infrastructure; Regional Bus and Mobility Vehicle Procurements; and, Regional Bus Facilities When considering this option, it is important to note that some rescheduling of existing MARTA Board Committee dates has been necessary.
35
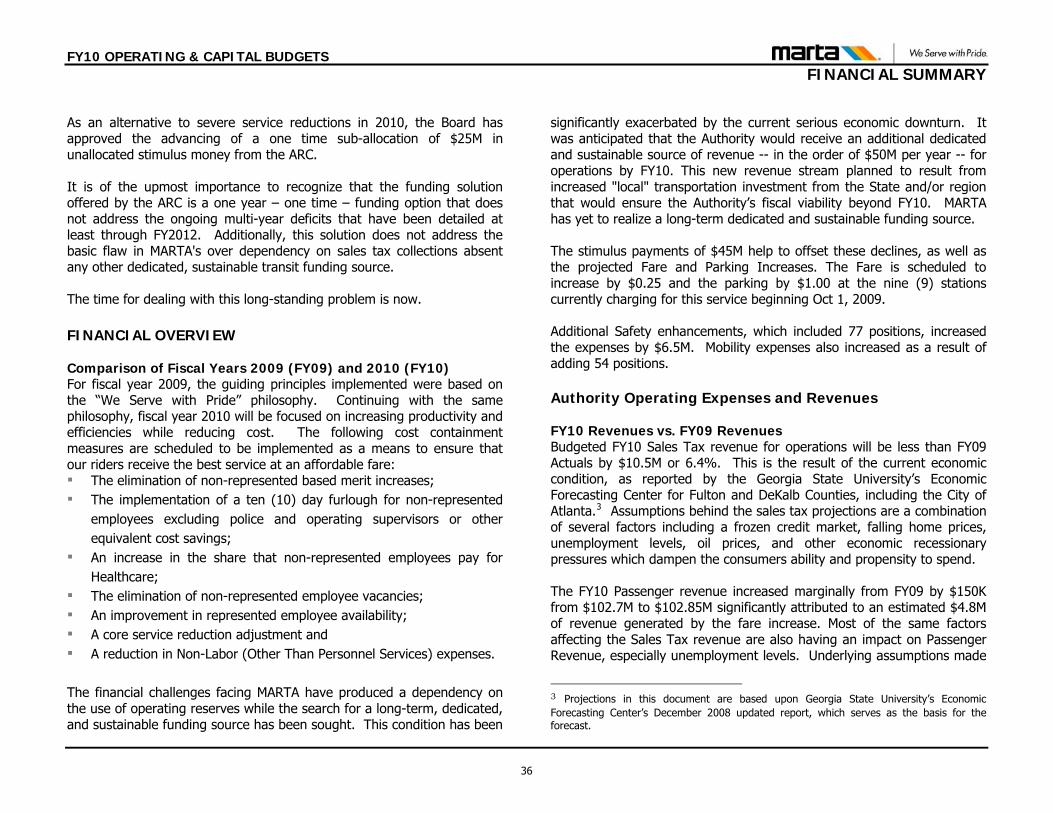
FY10 OPERATING & CAPITAL BUDGETS FINANCIAL SUMMARY
As an alternative to severe service reductions in 2010, the Board has approved the advancing of a one time sub-allocation of $25M in unallocated stimulus money from the ARC. It is of the upmost importance to recognize that the funding solution offered by the ARC is a one year – one time – funding option that does not address the ongoing multi-year deficits that have been detailed at least through FY2012. Additionally, this solution does not address the basic flaw in MARTA's over dependency on sales tax collections absent any other dedicated, sustainable transit funding source. The time for dealing with this long-standing problem is now. FINANCIAL OVERVIEW Comparison of Fiscal Years 2009 (FY09) and 2010 (FY10) For fiscal year 2009, the guiding principles implemented were based on the “We Serve with Pride” philosophy. Continuing with the same philosophy, fiscal year 2010 will be focused on increasing productivity and efficiencies while reducing cost. The following cost containment measures are scheduled to be implemented as a means to ensure that our riders receive the best service at an affordable fare: The elimination of non-represented based merit increases; The implementation of a ten (10) day furlough for non-represented
employees excluding police and operating supervisors or other equivalent cost savings;
An increase in the share that non-represented employees pay for Healthcare;
The elimination of non-represented employee vacancies; An improvement in represented employee availability; A core service reduction adjustment and A reduction in Non-Labor (Other Than Personnel Services) expenses. The financial challenges facing MARTA have produced a dependency on the use of operating reserves while the search for a long-term, dedicated, and sustainable funding source has been sought. This condition has been
significantly exacerbated by the current serious economic downturn. It was anticipated that the Authority would receive an additional dedicated and sustainable source of revenue -- in the order of $50M per year -- for operations by FY10. This new revenue stream planned to result from increased "local" transportation investment from the State and/or region that would ensure the Authority’s fiscal viability beyond FY10. MARTA has yet to realize a long-term dedicated and sustainable funding source. The stimulus payments of $45M help to offset these declines, as well as the projected Fare and Parking Increases. The Fare is scheduled to increase by $0.25 and the parking by $1.00 at the nine (9) stations currently charging for this service beginning Oct 1, 2009. Additional Safety enhancements, which included 77 positions, increased the expenses by $6.5M. Mobility expenses also increased as a result of adding 54 positions. Authority Operating Expenses and Revenues FY10 Revenues vs. FY09 Revenues Budgeted FY10 Sales Tax revenue for operations will be less than FY09 Actuals by $10.5M or 6.4%. This is the result of the current economic condition, as reported by the Georgia State University’s Economic Forecasting Center for Fulton and DeKalb Counties, including the City of Atlanta.3 Assumptions behind the sales tax projections are a combination of several factors including a frozen credit market, falling home prices, unemployment levels, oil prices, and other economic recessionary pressures which dampen the consumers ability and propensity to spend. The FY10 Passenger revenue increased marginally from FY09 by $150K from $102.7M to $102.85M significantly attributed to an estimated $4.8M of revenue generated by the fare increase. Most of the same factors affecting the Sales Tax revenue are also having an impact on Passenger Revenue, especially unemployment levels. Underlying assumptions made
3 Projections in this document are based upon Georgia State University’s Economic Forecasting Center’s December 2008 updated report, which serves as the basis for the forecast.
36
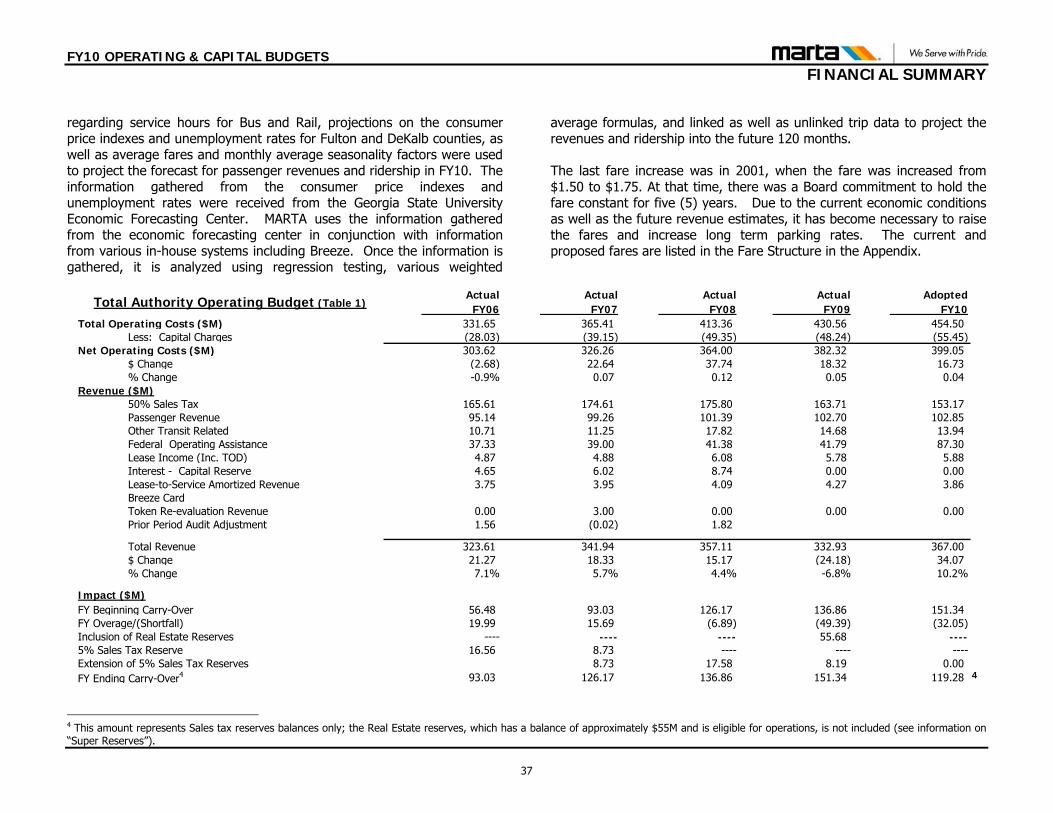
FY10 OPERATING & CAPITAL BUDGETS FINANCIAL SUMMARY
regarding service hours for Bus and Rail, projections on the consumer price indexes and unemployment rates for Fulton and DeKalb counties, as well as average fares and monthly average seasonality factors were used to project the forecast for passenger revenues and ridership in FY10. The information gathered from the consumer price indexes and unemployment rates were received from the Georgia State University Economic Forecasting Center. MARTA uses the information gathered from the economic forecasting center in conjunction with information from various in-house systems including Breeze. Once the information is gathered, it is analyzed using regression testing, various weighted
average formulas, and linked as well as unlinked trip data to project the revenues and ridership into the future 120 months. The last fare increase was in 2001, when the fare was increased from $1.50 to $1.75. At that time, there was a Board commitment to hold the fare constant for five (5) years. Due to the current economic conditions as well as the future revenue estimates, it has become necessary to raise the fares and increase long term parking rates. The current and proposed fares are listed in the Fare Structure in the Appendix.
Actual Actual Actual Actual Adopted
FY06 FY07 FY08 FY09 FY10Total Operating Costs ($M) 331.65 365.41 413.36 430.56 454.50
Less: Capital Charges (28.03) (39.15) (49.35) (48.24) (55.45)Net Operating Costs ($M) 303.62 326.26 364.00 382.32 399.05
$ Change (2.68) 22.64 37.74 18.32 16.73% Change -0.9% 0.07 0.12 0.05 0.04
Revenue ($M)50% Sales Tax 165.61 174.61 175.80 163.71 153.17Passenger Revenue 95.14 99.26 101.39 102.70 102.85Other Transit Related 10.71 11.25 17.82 14.68 13.94Federal Operating Assistance 37.33 39.00 41.38 41.79 87.30Lease Income (Inc. TOD) 4.87 4.88 6.08 5.78 5.88Interest - Capital Reserve 4.65 6.02 8.74 0.00 0.00Lease-to-Service Amortized Revenue 3.75 3.95 4.09 4.27 3.86Breeze CardToken Re-evaluation Revenue 0.00 3.00 0.00 0.00 0.00Prior Period Audit Adjustment 1.56 (0.02) 1.82
Total Revenue 323.61 341.94 357.11 332.93 367.00$ Change 21.27 18.33 15.17 (24.18) 34.07% Change 7.1% 5.7% 4.4% -6.8% 10.2%
Impact ($M)FY Beginning Carry-Over 56.48 93.03 126.17 136.86 151.34FY Overage/(Shortfall) 19.99 15.69 (6.89) (49.39) (32.05)Inclusion of Real Estate Reserves ---- ---- ---- 55.68 ----5% Sales Tax Reserve 16.56 8.73 ---- ---- ----Extension of 5% Sales Tax Reserves 8.73 17.58 8.19 0.00FY Ending Carry-Over4 93.03 126.17 136.86 151.34 119.28
Total Authority Operating Budget (Table 1)
4
4 This amount represents Sales tax reserves balances only; the Real Estate reserves, which has a balance of approximately $55M and is eligible for operations, is not included (see information on “Super Reserves”).
37
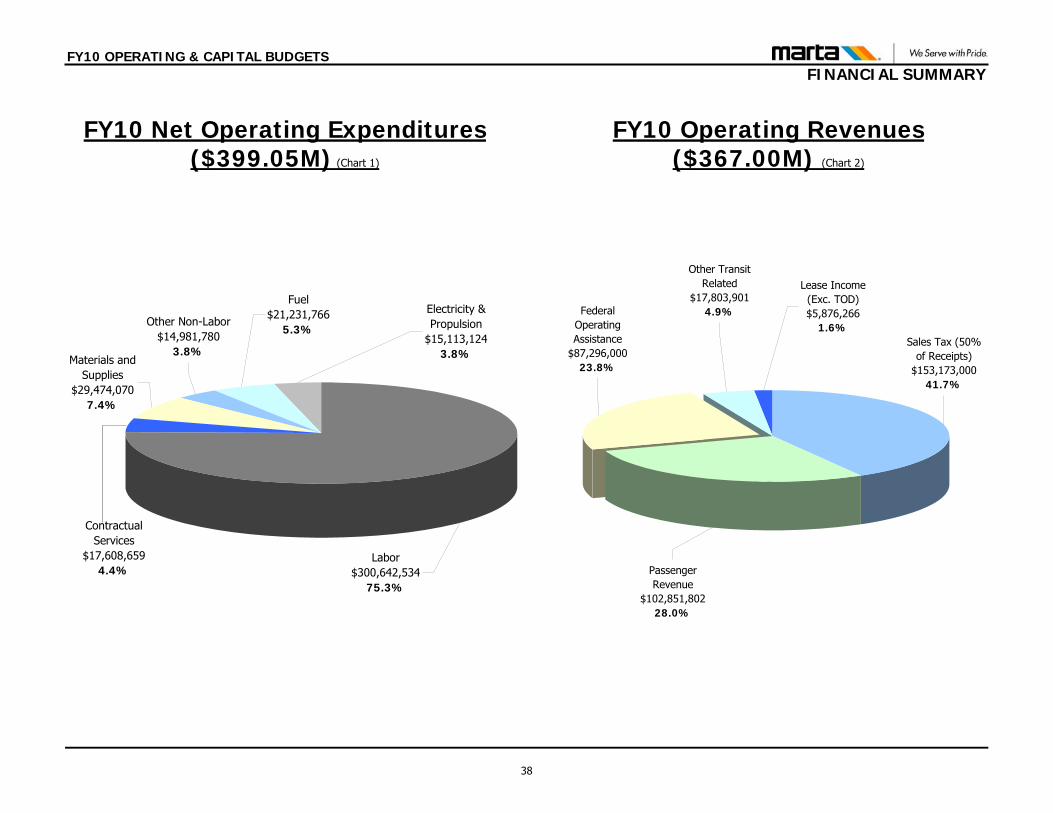
FY10 OPERATING & CAPITAL BUDGETS FINANCIAL SUMMARY
FY10 Net Operating Expenditures ($399.05M) (Chart 1)
Labor$300,642,534
75.3%
Contractual Services
$17,608,6594.4%
Materials and Supplies
$29,474,0707.4%
Other Non-Labor$14,981,780
3.8%
Fuel$21,231,766
5.3%
Electricity & Propulsion
$15,113,1243.8%
FY10 Operating Revenues ($367.00M) (Chart 2)
Sales Tax (50% of Receipts)
$153,173,000 41.7%
Passenger Revenue
$102,851,802 28.0%
Federal Operating Assistance
$87,296,000 23.8%
Other Transit Related
$17,803,901 4.9%
Lease Income (Exc. TOD) $5,876,266
1.6%
38
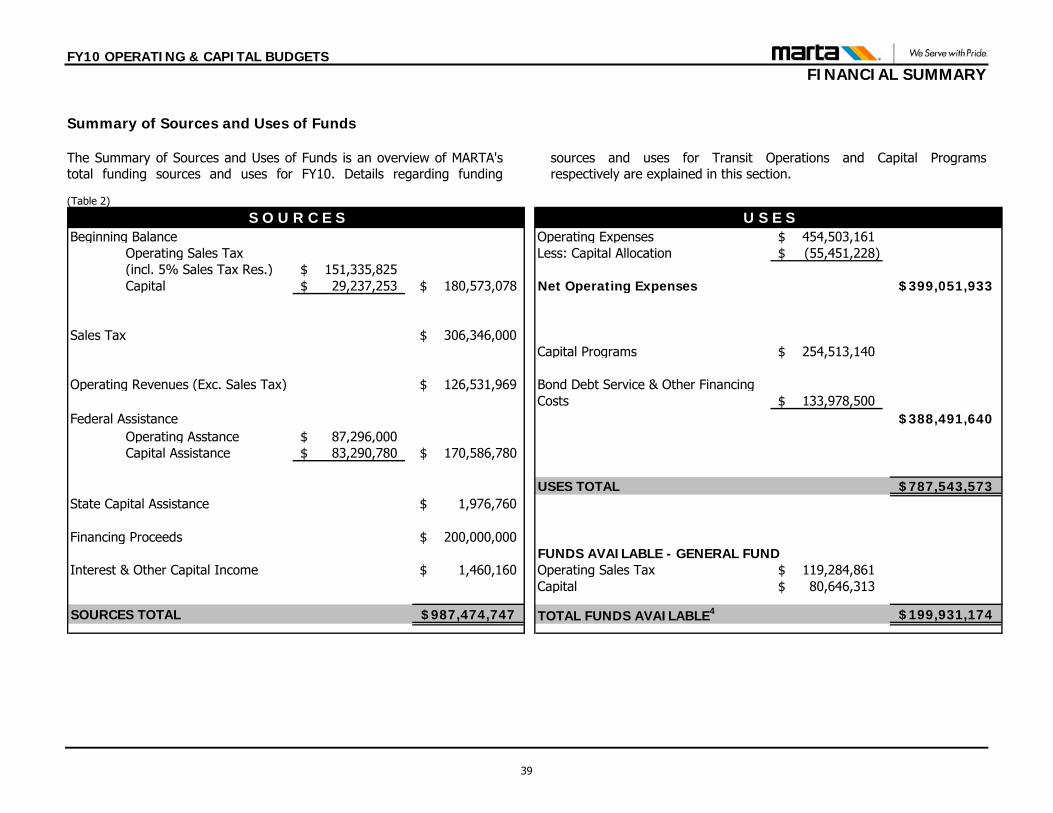
FY10 OPERATING & CAPITAL BUDGETS FINANCIAL SUMMARY
Summary of Sources and Uses of Funds The Summary of Sources and Uses of Funds is an overview of MARTA's total funding sources and uses for FY10. Details regarding funding
sources and uses for Transit Operations and Capital Programs respectively are explained in this section.
(Table 2)
Beginning Balance Operating Expenses 454,503,161$ Operating Sales Tax Less: Capital Allocation (55,451,228)$ (incl. 5% Sales Tax Res.) 151,335,825$ Capital 29,237,253$ 180,573,078$ Net Operating Expenses 399,051,933$
Sales Tax 306,346,000$ Capital Programs 254,513,140$
Operating Revenues (Exc. Sales Tax) 126,531,969$ Bond Debt Service & Other Financing Costs 133,978,500$
Federal Assistance 388,491,640$ Operating Asstance 87,296,000$ Capital Assistance 83,290,780$ 170,586,780$
USES TOTAL 787,543,573$ State Capital Assistance 1,976,760$
Financing Proceeds 200,000,000$ FUNDS AVAILABLE - GENERAL FUND
Interest & Other Capital Income 1,460,160$ Operating Sales Tax 119,284,861$ Capital 80,646,313$
SOURCES TOTAL 987,474,747$ TOTAL FUNDS AVAILABLE4 199,931,174$
U S E SS O U R C E S
39
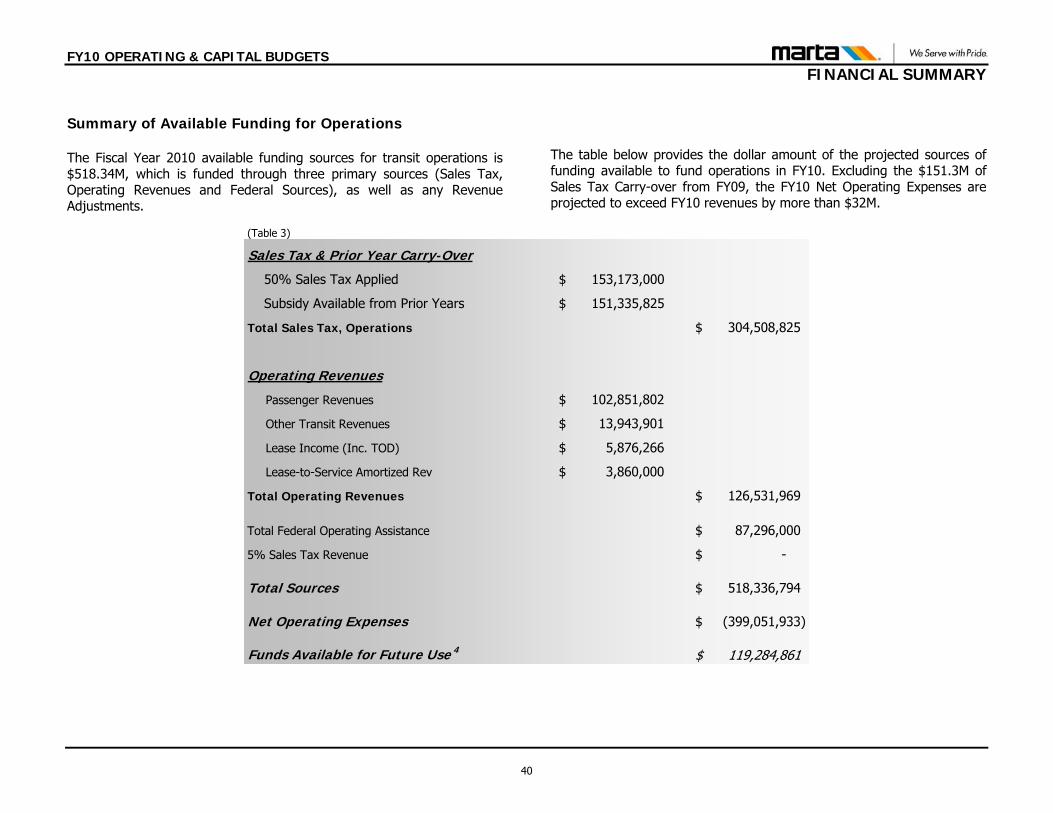
FY10 OPERATING & CAPITAL BUDGETS FINANCIAL SUMMARY
Summary of Available Funding for Operations The Fiscal Year 2010 available funding sources for transit operations is $518.34M, which is funded through three primary sources (Sales Tax, Operating Revenues and Federal Sources), as well as any Revenue Adjustments.
The table below provides the dollar amount of the projected sources of funding available to fund operations in FY10. Excluding the $151.3M of Sales Tax Carry-over from FY09, the FY10 Net Operating Expenses are projected to exceed FY10 revenues by more than $32M.
(Table 3)
Sales Tax & Prior Year Carry-Over
50% Sales Tax Applied 153,173,000$
Subsidy Available from Prior Years 151,335,825$
Total Sales Tax, Operations 304,508,825$
Operating Revenues
Passenger Revenues 102,851,802$
Other Transit Revenues 13,943,901$
Lease Income (Inc. TOD) 5,876,266$
Lease-to-Service Amortized Rev 3,860,000$
Total Operating Revenues 126,531,969$
Total Federal Operating Assistance 87,296,000$
5% Sales Tax Revenue -$
Total Sources 518,336,794$
Net Operating Expenses (399,051,933)$
Funds Available for Future Use 4 119,284,861$
40
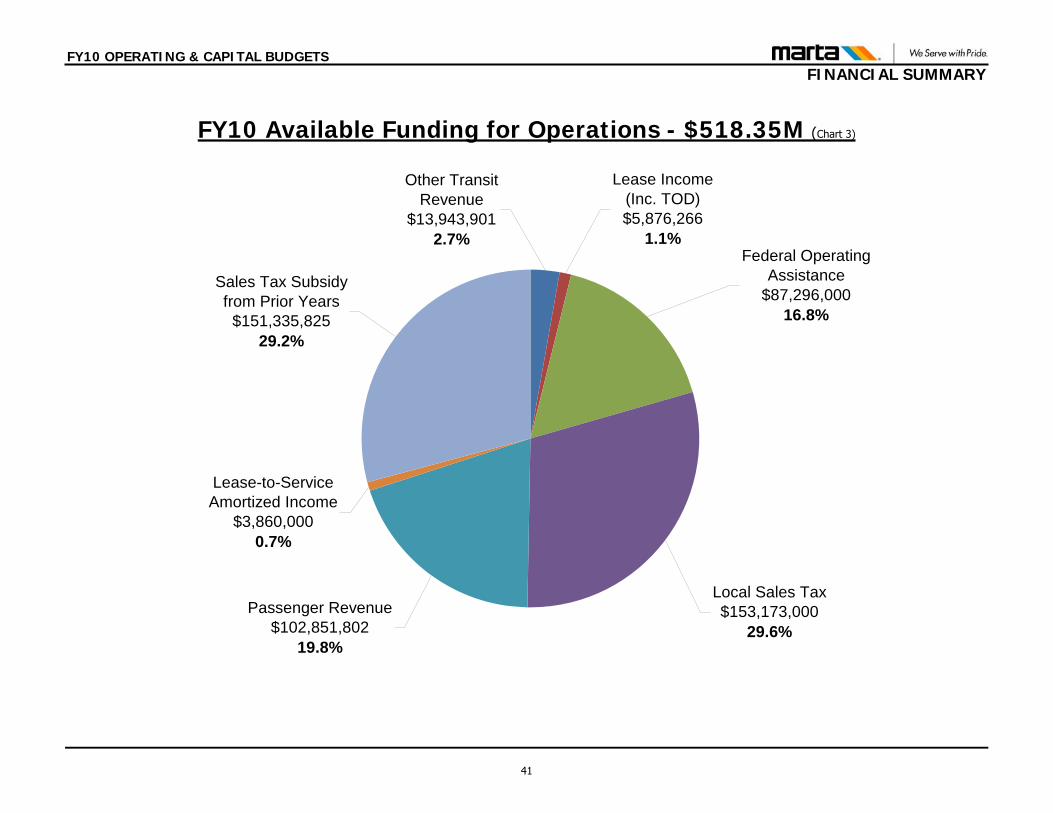
FY10 OPERATING & CAPITAL BUDGETS FINANCIAL SUMMARY
FY10 Available Funding for Operations - $518.35M (Chart 3)
Other Transit Revenue
$13,943,9012.7%
Lease Income (Inc. TOD)$5,876,266
1.1%Federal Operating
Assistance$87,296,000
16.8%
Local Sales Tax$153,173,000
29.6%Passenger Revenue
$102,851,80219.8%
Lease-to-Service Amortized Income
$3,860,0000.7%
Sales Tax Subsidy from Prior Years
$151,335,82529.2%
41
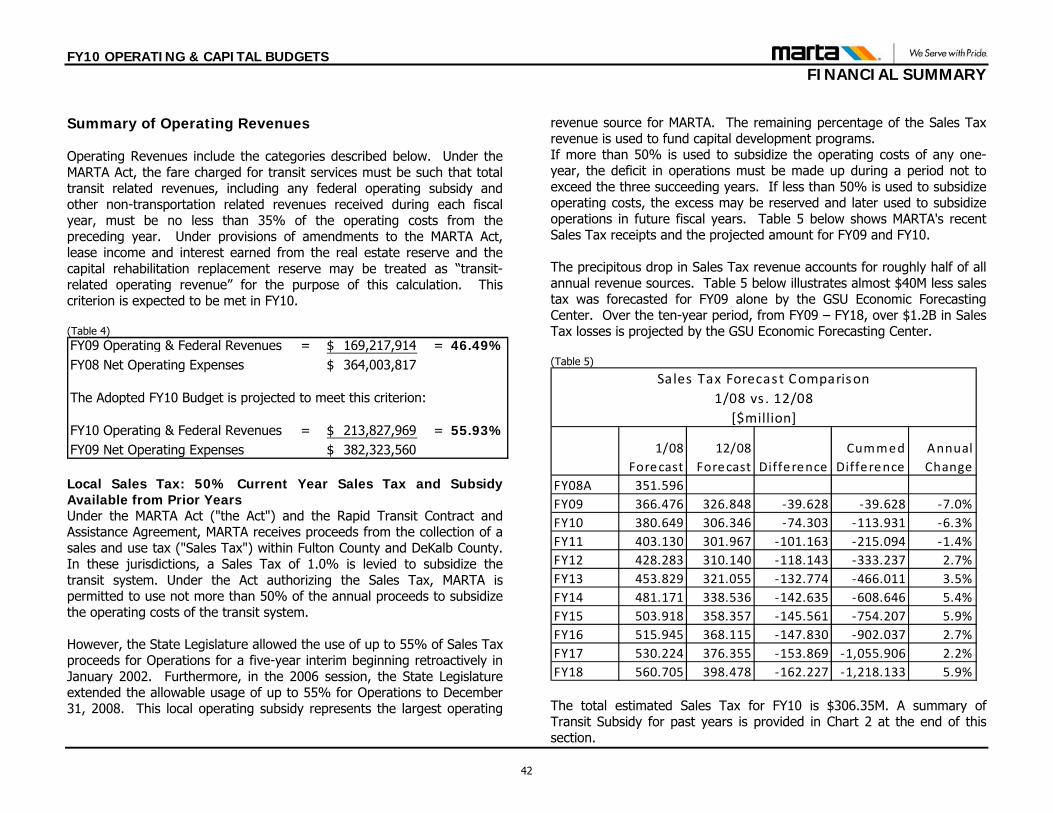
FY10 OPERATING & CAPITAL BUDGETS FINANCIAL SUMMARY
Summary of Operating Revenues Operating Revenues include the categories described below. Under the MARTA Act, the fare charged for transit services must be such that total transit related revenues, including any federal operating subsidy and other non-transportation related revenues received during each fiscal year, must be no less than 35% of the operating costs from the preceding year. Under provisions of amendments to the MARTA Act, lease income and interest earned from the real estate reserve and the capital rehabilitation replacement reserve may be treated as “transit-related operating revenue” for the purpose of this calculation. This criterion is expected to be met in FY10. (Table 4) FY09 Operating & Federal Revenues = 169,217,914$ = 46.49%FY08 Net Operating Expenses 364,003,817$
The Adopted FY10 Budget is projected to meet this criterion:
FY10 Operating & Federal Revenues = 213,827,969$ = 55.93%FY09 Net Operating Expenses 382,323,560$ Local Sales Tax: 50% Current Year Sales Tax and Subsidy Available from Prior Years Under the MARTA Act ("the Act") and the Rapid Transit Contract and Assistance Agreement, MARTA receives proceeds from the collection of a sales and use tax ("Sales Tax") within Fulton County and DeKalb County. In these jurisdictions, a Sales Tax of 1.0% is levied to subsidize the transit system. Under the Act authorizing the Sales Tax, MARTA is permitted to use not more than 50% of the annual proceeds to subsidize the operating costs of the transit system. However, the State Legislature allowed the use of up to 55% of Sales Tax proceeds for Operations for a five-year interim beginning retroactively in January 2002. Furthermore, in the 2006 session, the State Legislature extended the allowable usage of up to 55% for Operations to December 31, 2008. This local operating subsidy represents the largest operating
revenue source for MARTA. The remaining percentage of the Sales Tax revenue is used to fund capital development programs. If more than 50% is used to subsidize the operating costs of any one-year, the deficit in operations must be made up during a period not to exceed the three succeeding years. If less than 50% is used to subsidize operating costs, the excess may be reserved and later used to subsidize operations in future fiscal years. Table 5 below shows MARTA's recent Sales Tax receipts and the projected amount for FY09 and FY10. The precipitous drop in Sales Tax revenue accounts for roughly half of all annual revenue sources. Table 5 below illustrates almost $40M less sales tax was forecasted for FY09 alone by the GSU Economic Forecasting Center. Over the ten-year period, from FY09 – FY18, over $1.2B in Sales Tax losses is projected by the GSU Economic Forecasting Center. (Table 5)
1/08 Forecast
12/08 Forecast Difference
Cummed Difference
Annual Change
FY08A 351.596FY09 366.476 326.848 ‐39.628 ‐39.628 ‐7.0%FY10 380.649 306.346 ‐74.303 ‐113.931 ‐6.3%FY11 403.130 301.967 ‐101.163 ‐215.094 ‐1.4%FY12 428.283 310.140 ‐118.143 ‐333.237 2.7%FY13 453.829 321.055 ‐132.774 ‐466.011 3.5%FY14 481.171 338.536 ‐142.635 ‐608.646 5.4%FY15 503.918 358.357 ‐145.561 ‐754.207 5.9%FY16 515.945 368.115 ‐147.830 ‐902.037 2.7%FY17 530.224 376.355 ‐153.869 ‐1,055.906 2.2%FY18 560.705 398.478 ‐162.227 ‐1,218.133 5.9%
Sales Tax Forecast Comparison1/08 vs . 12/08
[$million]
The total estimated Sales Tax for FY10 is $306.35M. A summary of Transit Subsidy for past years is provided in Chart 2 at the end of this section.
42
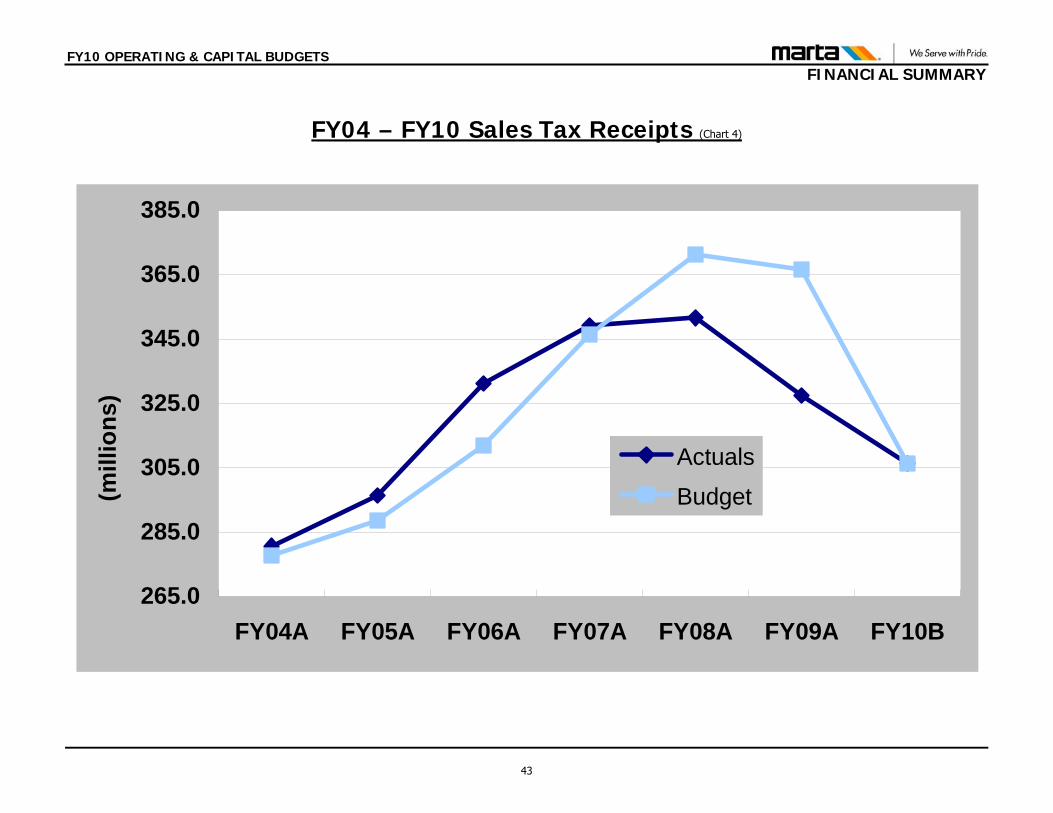
FY10 OPERATING & CAPITAL BUDGETS FINANCIAL SUMMARY
FY04 – FY10 Sales Tax Receipts (Chart 4)
265.0
285.0
305.0
325.0
345.0
365.0
385.0
FY04A FY05A FY06A FY07A FY08A FY09A FY10B
(mill
ions
)
ActualsBudget
43
FY10 OPERATING & CAPITAL BUDGETS FINANCIAL SUMMARY
In FY10, the Adopted Net Transit Operations expenditures are $399.05M. Operating revenues from passenger revenues, other transit related revenues, lease income, other operating revenue, and federal operating assistance income are projected at a total of $213.83M. This leaves a requirement of $185.22M. We forecast the Operating share (50%) of FY10 Sales Tax Revenue to be $153.17M. This will require the use of $32.05M from other sources. Also, all of the 5% Sales Tax allowance collected since January 2002 will be available for operations. The balance of Subsidy Available from Prior Years at the end of FY09 is $151.35M, which is sufficient to cover the shortfall without the Board approved utilization of other emergency reserves. The Sales Tax Subsidy carryover is included in the Super Reserves section referenced below; it is referred to as the Operating Reserve. Passenger Revenue The FY10 projected Passenger Revenues total of $102.85M is based on planned service levels, passenger projections and a fare increase. Average fare per rider is expected to increase to $0.72 in FY10. Ridership is expected to decrease moderately from 156 million in FY09 to 143 million in FY10, for a total decrease of 13M annual boardings. This represents a decrease of 8.3% in ridership. Fare Increase The last fare increase was in 2001, when the fare was increased from $1.50 to $1.75. At that time, there was a Board commitment to hold the fare constant for five (5) years. At the present time, MARTA is advancing a fare increase of 25 cents to the base fare, raising it from $1.75 to $2.00. Additionally, MARTA further proposes to increase the pass “multiple” (one of the lowest in the country) from 30 in FY 2010 to 32 in FY 2011 and to 34 in FY 2012. The increase in base fare and “multiples” is proposed to be implemented over three (3) years for Mobility and Half Fare customers. These actions are expected to generate $22.1M over the FY 2010-12 time period. It is anticipated that these additional revenues will reduce the multi-year FY10 - FY12 shortfall to $355.1M. The fare is scheduled to increase effective October 1st 2009, as indicated in the Fare Structure in the Appendix.
Other Transit Related Revenue Other Transit Revenue totals $13.94M, which includes fees for overnight parking at Lenox, Lindbergh, Brookhaven, Doraville, Dunwoody, Medical Center, College Park, Kensington, North Springs and Sandy Springs; advertising fees paid to MARTA for use of space on rail cars, buses and other facilities; interest income; and pay telephone and newspaper vending commissions. New revenue sources such as vending opportunities and new avenues of advertising are also being considered. Additionally, MARTA is recommending that, as a short-term approach, overnight parking fees be raised from $4 to $5 and from $7 to $8, respectively at the nine (9) stations currently charging for this service. This additional revenue will be generated over an 18-month period during which time a long-term parking strategy is developed and implemented. This strategy will include the ability to provide variable based fares (distance and/or time of day) for customers as well as potentially contracting out of parking services, including charging premium parking fees for customers outside the MARTA service area. Lease Income Lease income totaling $5.88M from property leases (especially TOD), air-rights leases and right-of-way leases, including fiber optics and antennae sites, will be applied to operating expenses. The primary leasing locations are located at Lindbergh City Center and One Atlantic Center. Federal Sources FTA authorizes the use of Federal Section 5307 funds to be used to fund preventive maintenance. We have elected to use these funds in such a manner. Based on Federal Register information, we anticipate receiving $42.30M in federal funds for preventive maintenance of our rolling stock and facilities. To assist in reducing, on a one (1) year assistance basis, the remaining multi-year financial shortfall MARTA is recommending that $20M of $63M recently provided by the government in new “stimulus” dollars be flexed to preventive maintenance (PM) activities in FY 2010. Based on an April 8, 2009 recommendation by the Atlanta Regional Commission’s (ARC) TAQC Committee, and in subsequent discussions with ARC staff and other regional transit partners, it was determined that another short-term one (1) year funding alternative was available to MARTA. Essentially the ARC could flex up to $25M in unallocated ARRA, Surface Transportation Program (STP), or Congestion Mitigation Air
44
FY10 OPERATING & CAPITAL BUDGETS FINANCIAL SUMMARY
Quality (CMAQ) funds to MARTA for use in FY 2010, and MARTA would identify capital funding from its Capital Reserves account in support of unfunded regional initiatives that had a clear nexus to MARTA services and facilities. It is important to note that these regional initiatives must be otherwise eligible for MARTA Capital Fund use as statutorily provided for in the MARTA Act. Super Reserves MARTA currently has two (2) reserve accounts that can, with Board approval, be used to offset the projected financial shortfall. One, the Operating Reserve, is currently valued at approximately $145M and the second, a Real Estate Reserve, is valued at $55M. While insufficient to cover the remaining shortfall of $309.9M, these reserves when combined – less a “super reserve” of $52M that is initially pegged at 15%2 of the prior year’s net expenses – totals $148M that will be used as a financial bridge to FY 2012 when it is imperative that a new, dedicated, and sustainable revenue stream will be in place for transit operations. This multi-year use of Reserve Funds – less the “super reserve” of $52M – reduces the FY 2009-12 financial shortfalls to $161.9M. Of this total, $32.05M remains in FY 2010, $94.99M in FY 2011, and $101.33M in FY 2012. Summary of Operating Budget Expenditures The FY10 Gross Adopted Budget for Operating Expenditures totals $454.50M. Of this amount, $399.05M is required for Net Transit Operations to pay the costs of providing bus and rail service. The remaining $55.45M includes expenses associated with the Capital Program and expenses associated with operating bus and Mobility services in Clayton County. Additional internal cost containment initiatives of approximately $11M were implemented for FY 2009 in December 2008, and were expanded as cost containment initiatives in the FY 2010-12 time period. At the outset of the FY 2010-12 Operating Budget Financial Plan and FY 2010 Operating Budget Development process, a total multi-year (2009-2012) financial shortfall of $441.5M had been forecasted. This total includes $27.8M in new investments over the next three (3) years in conjunction with providing resources to address safety issues identified in a recently
completed TRA Safety Assessment review, bringing Breeze fare gate maintenance in-house and making provisions for future pension contributions to offset significant impacts from the market downturn this past year. Additionally, two (2) additional multi-year resource-needs have been identified. The first addresses the increased demand for Mobility services, which has increased substantially over the past year. To meet a 13% increase in trip demand, while also maintaining a mandated "0" denial rate, an additional 45 Mobility Operators are being added to the FY 2010 budget at a cost of $2M per annum. This necessary addition increases the FY09 - FY12 multi-year financial shortfall by $6M, from $441.5M to $447.5M. In response to this multi-year financial shortfall, a series of deficit reduction strategies have been approved by the Board. These actions include, but are not limited to internal cost containment measures as previously stated, fare and parking fee increases, legislative relief aimed at the removal of sales tax and interest use restrictions, the development of new revenue streams, transit service reductions, and the use of one-time federal economic recovery funds for eligible preventive maintenance purposes. FY10 Budget was approved by the full MARTA Board of Directors following the formal budget review and public hearing comment period. Operating Budget Expenditures by Account Category The FY10 Gross Adopted Budget for Operating Expenditures totals $454.50M. Of this amount, $399.05M is required for Net Transit Operations to pay the costs of providing bus and rail service. The remaining $55.45M includes $47.47M in expenses associated with the Capital Program and $7.98M for expenses associated with operating bus and Mobility services in Clayton County. Salaries & Wages The FY10 Adopted Budget for salaries reflects an increase of $11.85M or 4.8% more than FY09 actuals. This includes an increase of 77 positions to address safety issues identified in a recently completed TRA Safety Assessment review, 45 FT Mobility Operators to address the 13% increase in trip demand while maintaining 0% denial rate (a Federal requirement), and 45 IT personnel that moved from the
45
FY10 OPERATING & CAPITAL BUDGETS FINANCIAL SUMMARY
Capital Budget to the Operating Budget because of realized savings related to less carrying costs. Financial constraints mandated that the Authority mitigate the aforementioned increases by implementing several cost containment measures which included: 1. The elimination of non-represented merit increases; 2. The implementation of a ten (10) day furlough for non-represented
employees excluding police and operating supervisors or other equivalent cost savings;
3. The elimination of non-represented employee vacancies; and 4. An improvement in represented employee availability Benefits Benefits will increase $8.4M or 7.66% above FY09 actual expenses commensurate with the expenses related to the increased headcount for the TRA Safety Assessment related personnel and Mobility personnel increases. Furthermore, the fiscal burden of medical insurance for the share that non-represented employees pay was increased from 8% to 15%. Contractual Services Contractual Services will decrease of ($0.45M) or (2.58%). This reduction is due to cost containment efforts and efficiency improvements related to maintenance activities. Materials & Supplies Materials and Supplies show an increase of $2.9.M or 4.1% from FY09. This is attributable to CPI and a 33% increase in fuel costs.
Other Operating Expenses Other Operating Expenses reflect a $0.13 increase or 3.38% increase from FY09. This is primarily attributable to an increase in the cost of electricity & propulsion power. Casualty & Liability Costs Casualty and Liability is projected to increase $0.9M or 9.86% over FY09 expenses. An anomaly occurred in FY09 due to the settlement of three cases each exceeding $1M causing unusually high expenses in the category. Miscellaneous Expenses Miscellaneous Expenses reflect a decrease of ($0.06M) or (10.88%) from FY09 for CPI. Other Non-Operating Expenses Other Non-Operating expenses reflect a decrease of ($0.73M) or (49.3%) below FY09. This is related to aggressive cost containment initiatives limiting discretionary travel. Contingency - Operating FY10 includes a contingency fund of $1.0M that is under the control of the General Manager/CEO to meet unexpected or emergency requirements in the operating budget. Capitalized Expenditures A total of $55.45M is projected for capitalization of certain expenditures related to the design and construction of Technology Infrastructure, as well as various capital improvement projects. These capital expenses are based on a cost allocation plan prepared in accordance with FTA guidelines.
46
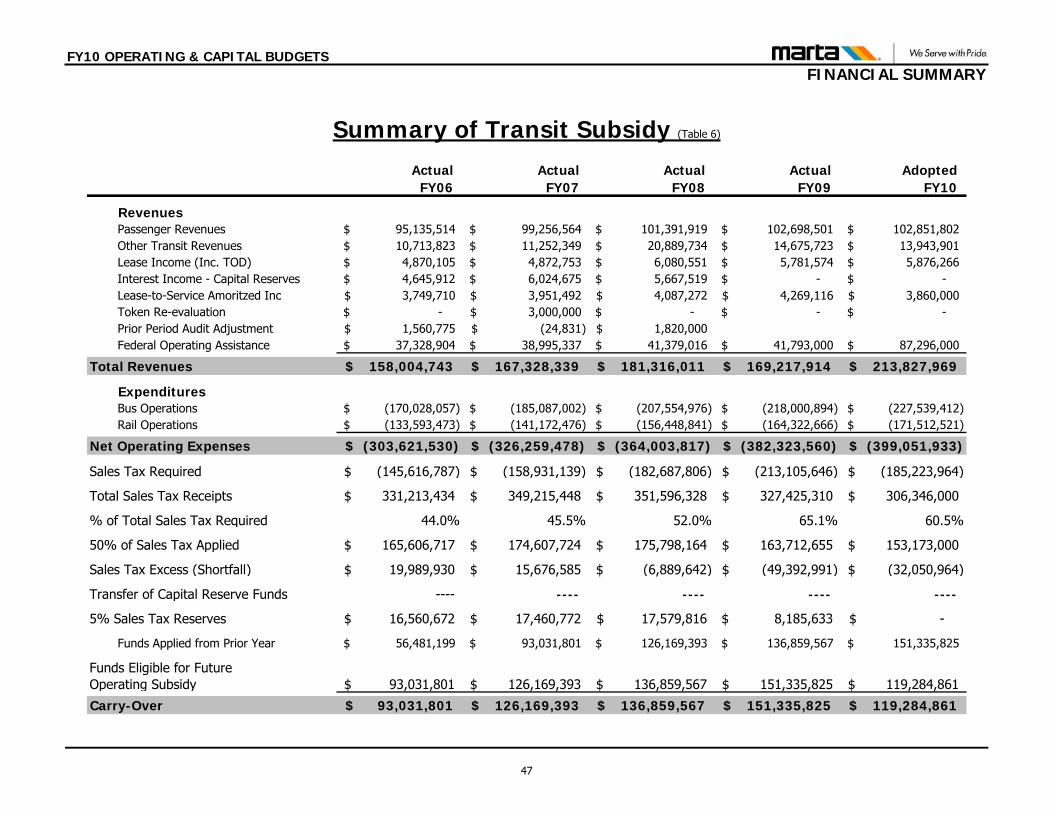
FY10 OPERATING & CAPITAL BUDGETS FINANCIAL SUMMARY
Summary of Transit Subsidy (Table 6)
Actual Actual Actual Actual AdoptedFY06 FY07 FY08 FY09 FY10
RevenuesPassenger Revenues 95,135,514$ 99,256,564$ 101,391,919$ 102,698,501$ 102,851,802$ Other Transit Revenues 10,713,823$ 11,252,349$ 20,889,734$ 14,675,723$ 13,943,901$ Lease Income (Inc. TOD) 4,870,105$ 4,872,753$ 6,080,551$ 5,781,574$ 5,876,266$ Interest Income - Capital Reserves 4,645,912$ 6,024,675$ 5,667,519$ -$ -$ Lease-to-Service Amoritzed Inc 3,749,710$ 3,951,492$ 4,087,272$ 4,269,116$ 3,860,000$ Token Re-evaluation -$ 3,000,000$ -$ -$ -$ Prior Period Audit Adjustment 1,560,775$ (24,831)$ 1,820,000$ Federal Operating Assistance 37,328,904$ 38,995,337$ 41,379,016$ 41,793,000$ 87,296,000$
Total Revenues 158,004,743$ 167,328,339$ 181,316,011$ 169,217,914$ 213,827,969$
ExpendituresBus Operations (170,028,057)$ (185,087,002)$ (207,554,976)$ (218,000,894)$ (227,539,412)$ Rail Operations (133,593,473)$ (141,172,476)$ (156,448,841)$ (164,322,666)$ (171,512,521)$
Net Operating Expenses (303,621,530)$ (326,259,478)$ (364,003,817)$ (382,323,560)$ (399,051,933)$
Sales Tax Required (145,616,787)$ (158,931,139)$ (182,687,806)$ (213,105,646)$ (185,223,964)$
Total Sales Tax Receipts 331,213,434$ 349,215,448$ 351,596,328$ 327,425,310$ 306,346,000$
% of Total Sales Tax Required 44.0% 45.5% 52.0% 65.1% 60.5%
50% of Sales Tax Applied 165,606,717$ 174,607,724$ 175,798,164$ 163,712,655$ 153,173,000$
Sales Tax Excess (Shortfall) 19,989,930$ 15,676,585$ (6,889,642)$ (49,392,991)$ (32,050,964)$
Transfer of Capital Reserve Funds ---- ---- ---- ---- ----
5% Sales Tax Reserves 16,560,672$ 17,460,772$ 17,579,816$ 8,185,633$ -$
Funds Applied from Prior Year 56,481,199$ 93,031,801$ 126,169,393$ 136,859,567$ 151,335,825$
Funds Eligible for Future Operating Subsidy 93,031,801$ 126,169,393$ 136,859,567$ 151,335,825$ 119,284,861$
Carry-Over 93,031,801$ 126,169,393$ 136,859,567$ 151,335,825$ 119,284,861$
47
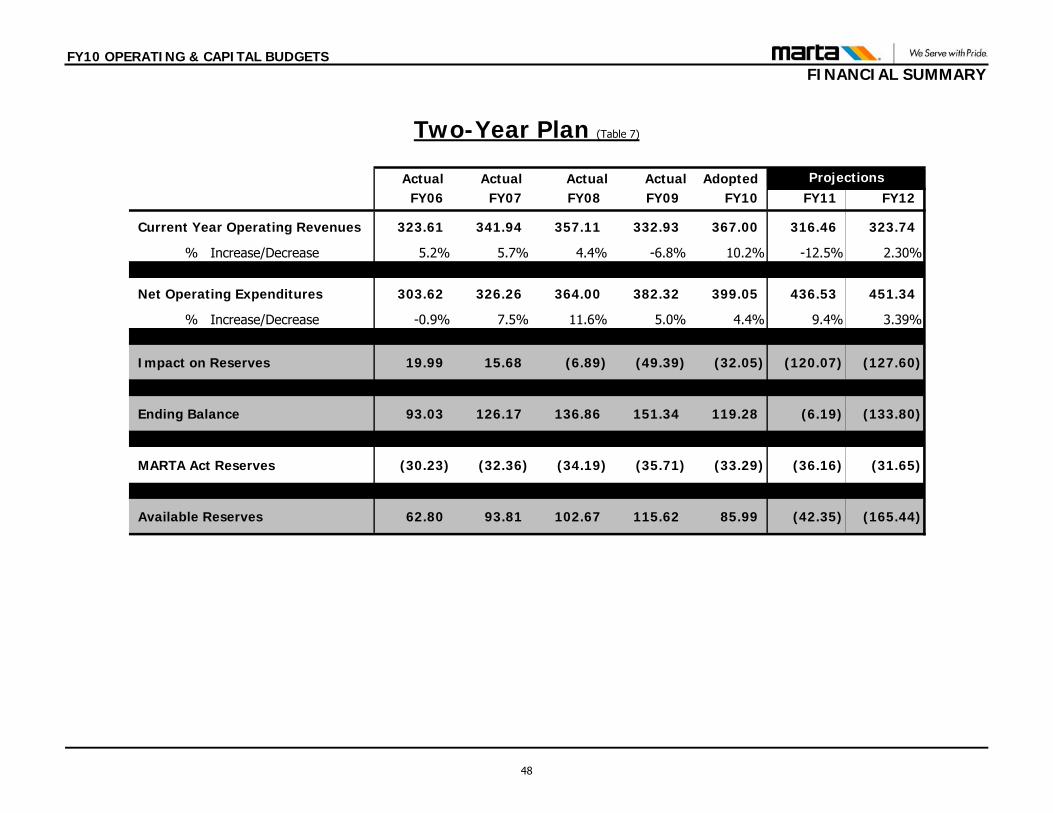
FY10 OPERATING & CAPITAL BUDGETS FINANCIAL SUMMARY
Two-Year Plan (Table 7)
Actual Actual Actual Actual AdoptedFY06 FY07 FY08 FY09 FY10 FY11 FY12
Current Year Operating Revenues 323.61 341.94 357.11 332.93 367.00 316.46 323.74
% Increase/Decrease 5.2% 5.7% 4.4% -6.8% 10.2% -12.5% 2.30%
Net Operating Expenditures 303.62 326.26 364.00 382.32 399.05 436.53 451.34
% Increase/Decrease -0.9% 7.5% 11.6% 5.0% 4.4% 9.4% 3.39%
Impact on Reserves 19.99 15.68 (6.89) (49.39) (32.05) (120.07) (127.60)
Ending Balance 93.03 126.17 136.86 151.34 119.28 (6.19) (133.80)
MARTA Act Reserves (30.23) (32.36) (34.19) (35.71) (33.29) (36.16) (31.65)
Available Reserves 62.80 93.81 102.67 115.62 85.99 (42.35) (165.44)
Projections
48
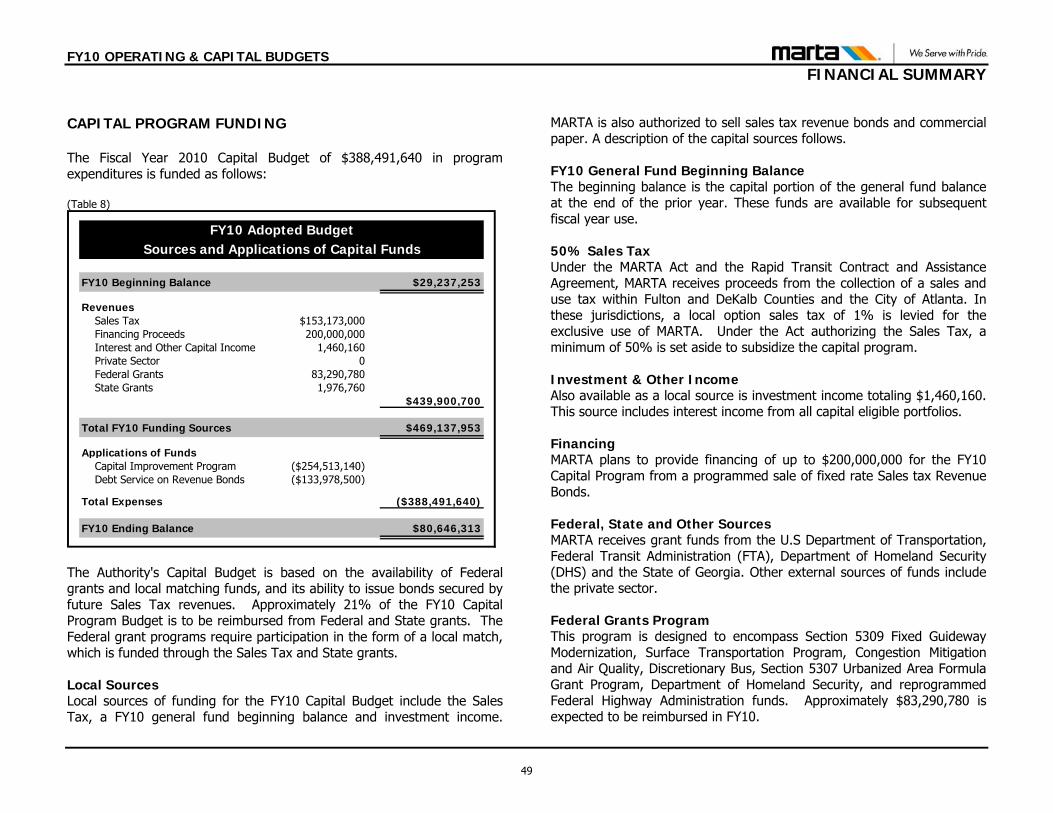
FY10 OPERATING & CAPITAL BUDGETS FINANCIAL SUMMARY
CAPITAL PROGRAM FUNDING The Fiscal Year 2010 Capital Budget of $388,491,640 in program expenditures is funded as follows: (Table 8)
FY10 Beginning Balance $29,237,253
Revenues Sales Tax $153,173,000 Financing Proceeds 200,000,000 Interest and Other Capital Income 1,460,160 Private Sector 0 Federal Grants 83,290,780 State Grants 1,976,760
$439,900,700
Total FY10 Funding Sources $469,137,953
Applications of Funds Capital Improvement Program ($254,513,140) Debt Service on Revenue Bonds ($133,978,500)
Total Expenses ($388,491,640)
FY10 Ending Balance $80,646,313
Sources and Applications of Capital FundsFY10 Adopted Budget
The Authority's Capital Budget is based on the availability of Federal grants and local matching funds, and its ability to issue bonds secured by future Sales Tax revenues. Approximately 21% of the FY10 Capital Program Budget is to be reimbursed from Federal and State grants. The Federal grant programs require participation in the form of a local match, which is funded through the Sales Tax and State grants. Local Sources Local sources of funding for the FY10 Capital Budget include the Sales Tax, a FY10 general fund beginning balance and investment income.
MARTA is also authorized to sell sales tax revenue bonds and commercial paper. A description of the capital sources follows. FY10 General Fund Beginning Balance The beginning balance is the capital portion of the general fund balance at the end of the prior year. These funds are available for subsequent fiscal year use. 50% Sales Tax Under the MARTA Act and the Rapid Transit Contract and Assistance Agreement, MARTA receives proceeds from the collection of a sales and use tax within Fulton and DeKalb Counties and the City of Atlanta. In these jurisdictions, a local option sales tax of 1% is levied for the exclusive use of MARTA. Under the Act authorizing the Sales Tax, a minimum of 50% is set aside to subsidize the capital program. Investment & Other Income Also available as a local source is investment income totaling $1,460,160. This source includes interest income from all capital eligible portfolios. Financing MARTA plans to provide financing of up to $200,000,000 for the FY10 Capital Program from a programmed sale of fixed rate Sales tax Revenue Bonds. Federal, State and Other Sources MARTA receives grant funds from the U.S Department of Transportation, Federal Transit Administration (FTA), Department of Homeland Security (DHS) and the State of Georgia. Other external sources of funds include the private sector. Federal Grants Program This program is designed to encompass Section 5309 Fixed Guideway Modernization, Surface Transportation Program, Congestion Mitigation and Air Quality, Discretionary Bus, Section 5307 Urbanized Area Formula Grant Program, Department of Homeland Security, and reprogrammed Federal Highway Administration funds. Approximately $83,290,780 is expected to be reimbursed in FY10.
49
FY10 OPERATING & CAPITAL BUDGETS FINANCIAL SUMMARY
In February 2009, the ARRA (American Recovery and Reinvestment Act) was signed into law. This act made funding available in an effort to help stimulate the economy. The first phase of the funding allocation provided $62.3 million directly to MARTA that has been programmed for fiscal years 2010 and 2011. In the second phase of the funding allocation, MARTA received $25 million programmed in fiscal year 2010. State Grants Program The State of Georgia participates in the procurement of clean fuel buses, rail projects, and Americans with Disabilities Act Mobility vehicles and assistance. Funding from the State in FY10 is expected to total approximately $1,976,760. These funds are from various State fiscal year appropriations. MARTA requisitions the funds as needed for construction, replacement
and rehabilitation of the transit system. Bond discount and issue costs are amortized, principally using the interest method, over the term of the related debt. The principal on all bonds is payable in an annual installment on July 1; interest is payable semi-annually on January 1 and July 1.
Capital Expenditures The total Capital Budget of $388,491,640 for FY10 provides funding for the Capital Improvement Program and debt service expenses. These items are outlined below. Capital Improvement Program The Capital Improvement Program provides for the replacement, rehabilitation and enhancement of facilities and equipment required to support transit operations, regulatory requirements, and system safety. The program ensures that the transit system is maintained to enable the continued delivery of high quality service. Total projects and procurements of $254,513,140, to include ARRA funding for the fire suppression and bus procurement projects, are budgeted for FY10. The
Transit Planning Program is also funded from within the Capital Improvement Program and provides for Regional Transit Planning, Transit Financial Planning, Short-Range and Long-Range Transit Planning and Special Planning Projects. Debt Service Expenses When necessary, MARTA raises additional local capital funds above the direct capital portion of sales tax receipts for the Capital Program by the issuance of Sales Tax Revenue Bonds and/or Tax Exempt Commercial Paper in the municipal markets. The proceeds are initially deposited with the Bond Trustee in a Construction Fund, as required by the Trust Indenture between MARTA and the Trustee.
The bonds are payable from, and secured by, a first, second, and third liens on amounts deposited in the Sinking Funds (Debt Service) from sales and use tax receipts. Annual sales and use tax revenues are initially deposited into a Sinking Fund (Debt Service) held by the bond trustee as required by the Trust Indenture. Debt service expenses for FY10 are expected to total $133,978,500.
50
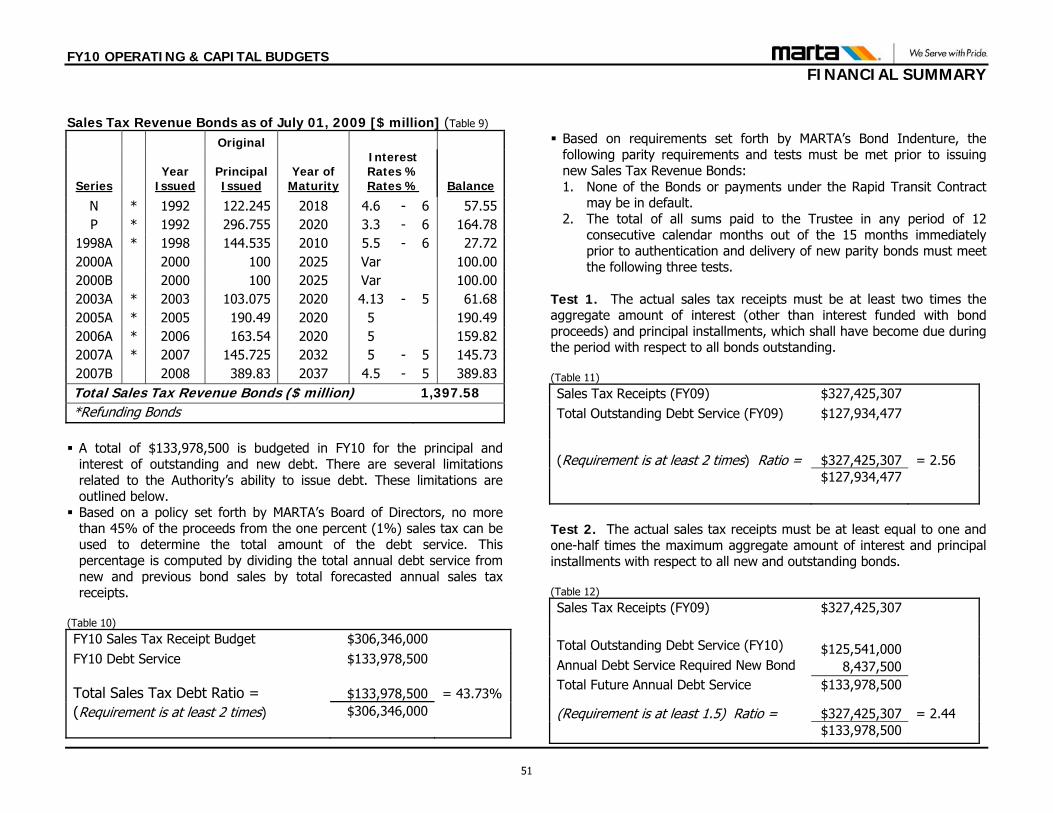
FY10 OPERATING & CAPITAL BUDGETS FINANCIAL SUMMARY
Sales Tax Revenue Bonds as of July 01, 2009 [$ million] (Table 9)
Original
Year Principal Year of Interest Rates %
Series Issued Issued Maturity Rates % Balance
N * 1992 122.245 2018 4.6 - 6 57.55P * 1992 296.755 2020 3.3 - 6 164.78
1998A * 1998 144.535 2010 5.5 - 6 27.722000A 2000 100 2025 Var 100.002000B 2000 100 2025 Var 100.002003A * 2003 103.075 2020 4.13 - 5 61.682005A * 2005 190.49 2020 5 190.492006A * 2006 163.54 2020 5 159.822007A * 2007 145.725 2032 5 - 5 145.732007B 2008 389.83 2037 4.5 - 5 389.83Total Sales Tax Revenue Bonds ($ million) 1,397.58 *Refunding Bonds
A total of $133,978,500 is budgeted in FY10 for the principal and
interest of outstanding and new debt. There are several limitations related to the Authority’s ability to issue debt. These limitations are outlined below. Based on a policy set forth by MARTA’s Board of Directors, no more
than 45% of the proceeds from the one percent (1%) sales tax can be used to determine the total amount of the debt service. This percentage is computed by dividing the total annual debt service from new and previous bond sales by total forecasted annual sales tax receipts.
(Table 10)
FY10 Sales Tax Receipt Budget $306,346,000 FY10 Debt Service $133,978,500
Total Sales Tax Debt Ratio = $133,978,500 = 43.73% (Requirement is at least 2 times) $306,346,000
Based on requirements set forth by MARTA’s Bond Indenture, the
following parity requirements and tests must be met prior to issuing new Sales Tax Revenue Bonds: 1. None of the Bonds or payments under the Rapid Transit Contract
may be in default. 2. The total of all sums paid to the Trustee in any period of 12
consecutive calendar months out of the 15 months immediately prior to authentication and delivery of new parity bonds must meet the following three tests.
Test 1. The actual sales tax receipts must be at least two times the aggregate amount of interest (other than interest funded with bond proceeds) and principal installments, which shall have become due during the period with respect to all bonds outstanding. (Table 11)
Sales Tax Receipts (FY09) $327,425,307 Total Outstanding Debt Service (FY09) $127,934,477
(Requirement is at least 2 times) Ratio = $327,425,307 = 2.56 $127,934,477
Test 2. The actual sales tax receipts must be at least equal to one and one-half times the maximum aggregate amount of interest and principal installments with respect to all new and outstanding bonds. (Table 12)
Sales Tax Receipts (FY09) $327,425,307 Total Outstanding Debt Service (FY10) $125,541,000
Annual Debt Service Required New Bond 8,437,500 Total Future Annual Debt Service $133,978,500
(Requirement is at least 1.5) Ratio = $327,425,307 = 2.44 $133,978,500
51
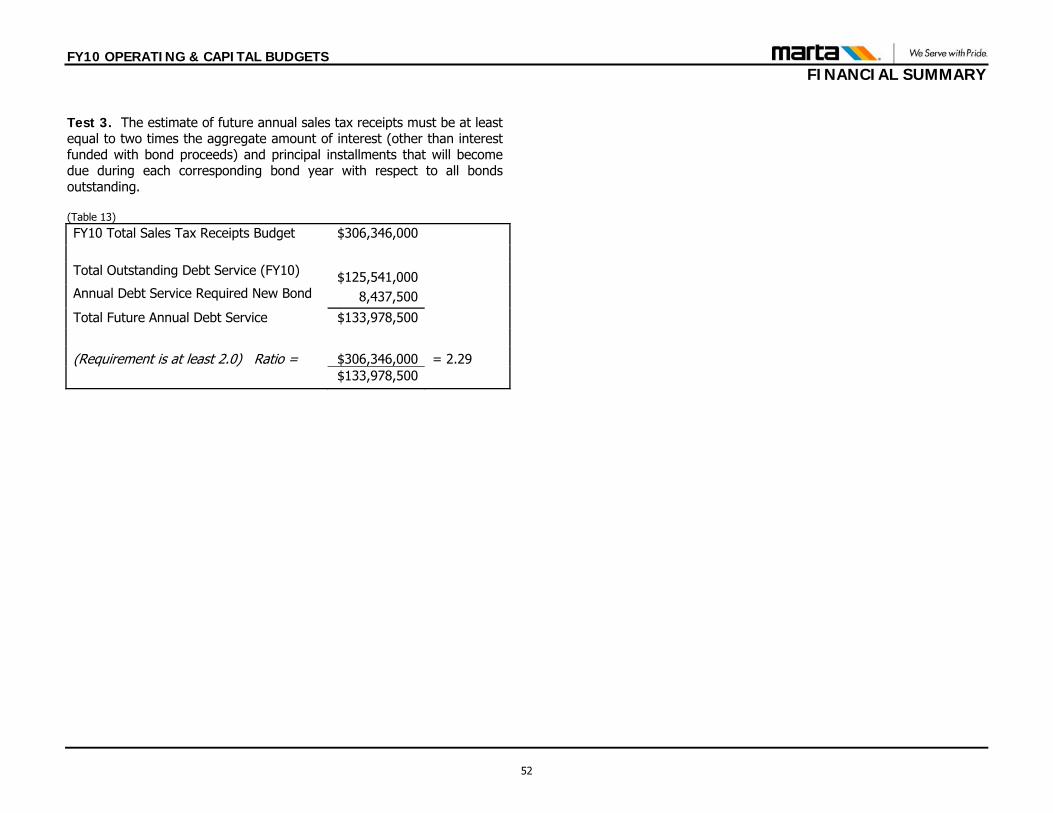
FY10 OPERATING & CAPITAL BUDGETS FINANCIAL SUMMARY
Test 3. The estimate of future annual sales tax receipts must be at least equal to two times the aggregate amount of interest (other than interest funded with bond proceeds) and principal installments that will become due during each corresponding bond year with respect to all bonds outstanding. (Table 13)
FY10 Total Sales Tax Receipts Budget $306,346,000
Total Outstanding Debt Service (FY10) $125,541,000
Annual Debt Service Required New Bond 8,437,500
Total Future Annual Debt Service $133,978,500
(Requirement is at least 2.0) Ratio = $306,346,000 = 2.29 $133,978,500
52
OPERATING BUDGET This section provides an overall view of the operating budget for the Authority, including expenses by category and organizational structure.
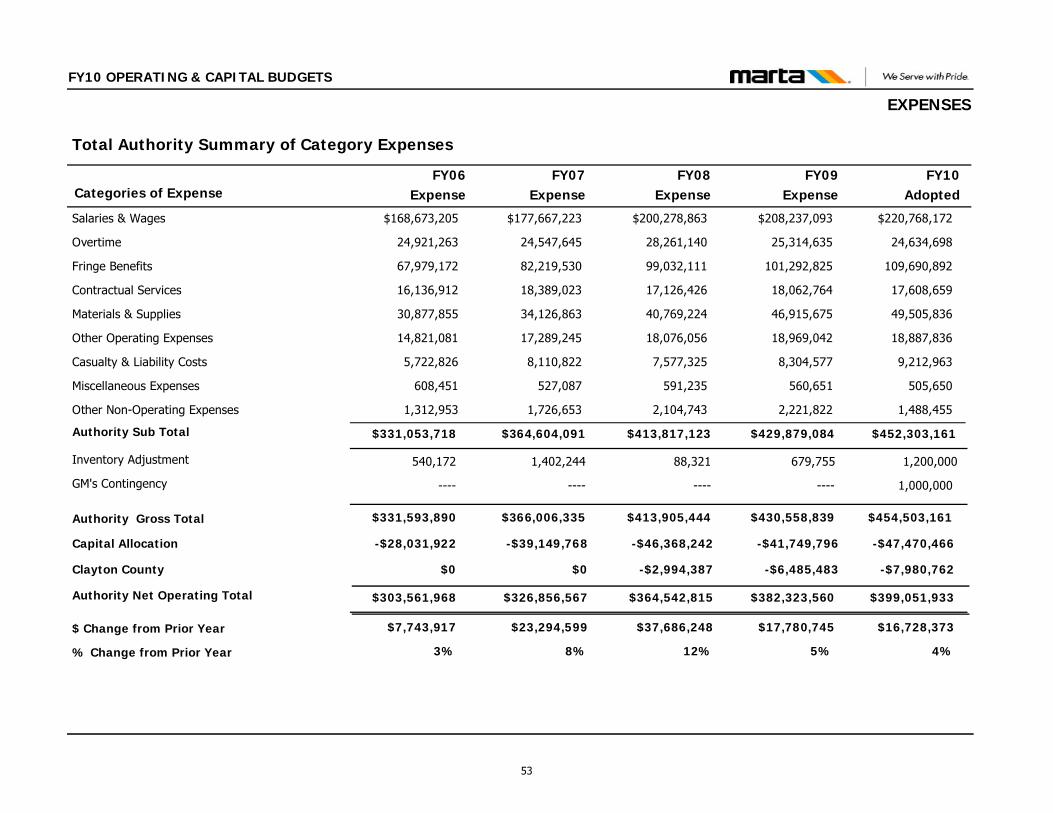
Categories of Expense
Total Authority Summary of Category Expenses
FY06Expense
FY07Expense
FY10Adopted
FY08Expense
FY09Expense
FY10 OPERATING & CAPITAL BUDGETS
EXPENSES
Salaries & Wages $168,673,205 $177,667,223 $220,768,172 $200,278,863 $208,237,093
Overtime 24,921,263 24,547,645 24,634,698 28,261,140 25,314,635
Fringe Benefits 67,979,172 82,219,530 109,690,892 99,032,111 101,292,825
Contractual Services 16,136,912 18,389,023 17,608,659 17,126,426 18,062,764
Materials & Supplies 30,877,855 34,126,863 49,505,836 40,769,224 46,915,675
Other Operating Expenses 14,821,081 17,289,245 18,887,836 18,076,056 18,969,042
Casualty & Liability Costs 5,722,826 8,110,822 9,212,963 7,577,325 8,304,577
Miscellaneous Expenses 608,451 527,087 505,650 591,235 560,651
Other Non-Operating Expenses 1,312,953 1,726,653 1,488,455 2,104,743 2,221,822
Authority Gross Total
Inventory Adjustment
GM's Contingency
540,172 1,402,244
$364,604,091Authority Sub Total $331,053,718
$326,856,567Authority Net Operating Total $303,561,968
$23,294,599
8%
$ Change from Prior Year
% Change from Prior Year
$454,503,161
1,200,000
$452,303,161
$399,051,933
1,000,000
$16,728,373
4%
----
$331,593,890
$7,743,917
3%
$366,006,335
----
88,321
$413,817,123
$364,542,815
$37,686,248
12%
$413,905,444
----
679,755
$429,879,084
$382,323,560
$17,780,745
5%
$430,558,839
----
-$39,149,768Capital Allocation -$28,031,922 -$47,470,466-$46,368,242 -$41,749,796
$0Clayton County $0 -$7,980,762-$2,994,387 -$6,485,483
53
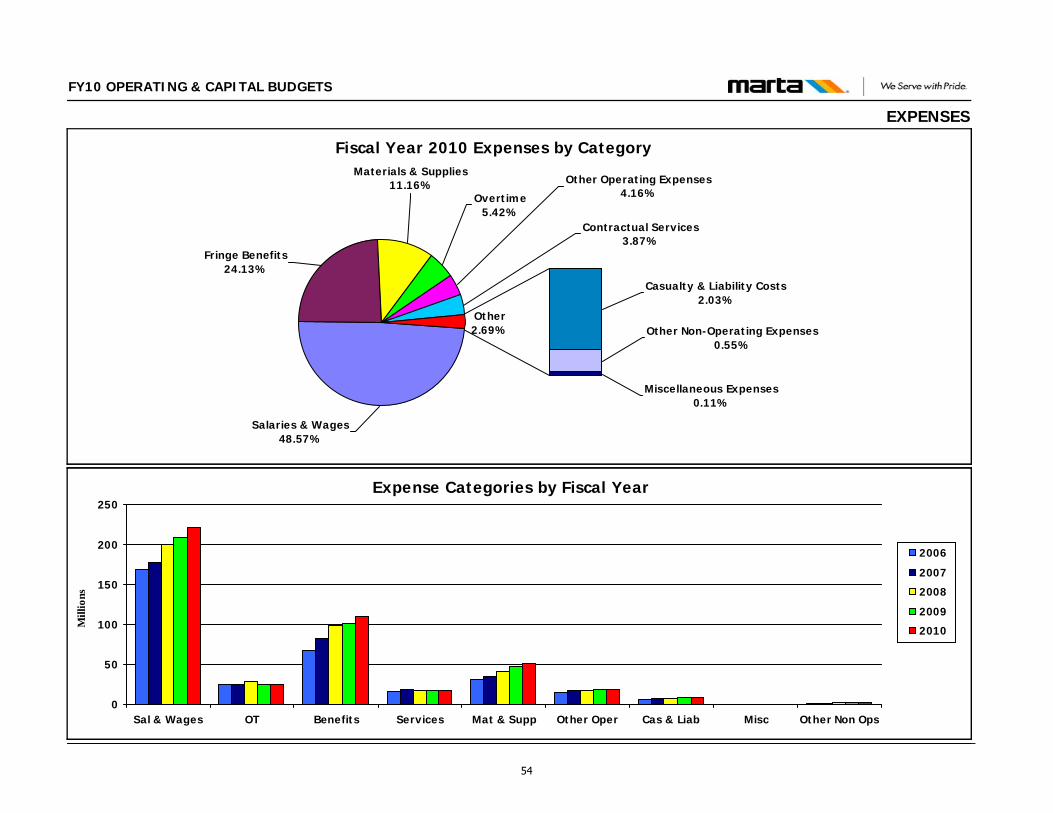
FY10 OPERATING & CAPITAL BUDGETS
EXPENSES
Expense Categories by Fiscal Year
0
50
100
150
200
250
Sal & Wages OT Benefits Services Mat & Supp Other Oper Cas & Liab Misc Other Non Ops
Mill
ions
2006
2007
2008
2009
2010
Fiscal Year 2010 Expenses by Category
Other2.69%
Fringe Benefits24.13%
Salaries & Wages48.57%
Materials & Supplies11.16%
Overtime5.42%
Other Operating Expenses4.16%
Miscellaneous Expenses0.11%
Contractual Services3.87%
Casualty & Liability Costs2.03%
Other Non-Operating Expenses0.55%
54
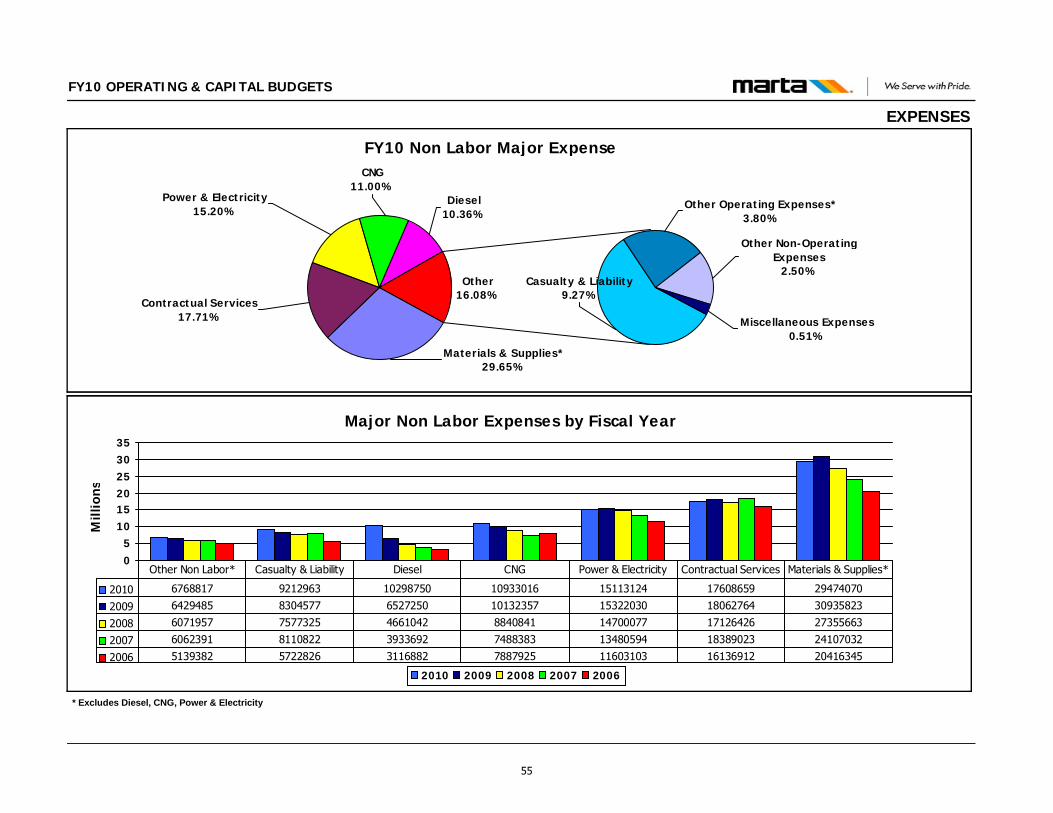
FY10 OPERATING & CAPITAL BUDGETS
EXPENSES
Major Non Labor Expenses by Fiscal Year
05
101520253035
Mill
ions
2010 2009 2008 2007 2006
2010 6768817 9212963 10298750 10933016 15113124 17608659 29474070
2009 6429485 8304577 6527250 10132357 15322030 18062764 30935823
2008 6071957 7577325 4661042 8840841 14700077 17126426 27355663
2007 6062391 8110822 3933692 7488383 13480594 18389023 24107032
2006 5139382 5722826 3116882 7887925 11603103 16136912 20416345
Other Non Labor* Casualty & Liability Diesel CNG Power & Electricity Contractual Services Materials & Supplies*
FY10 Non Labor Major Expense
Other16.08%
Contractual Services17.71%
Materials & Supplies*29.65%
Power & Electricity15.20%
CNG11.00%
Diesel10.36%
Miscellaneous Expenses0.51%
Casualty & Liability9.27%
Other Operating Expenses*3.80%
Other Non-Operating Expenses
2.50%
* Excludes Diesel, CNG, Power & Electricity
55
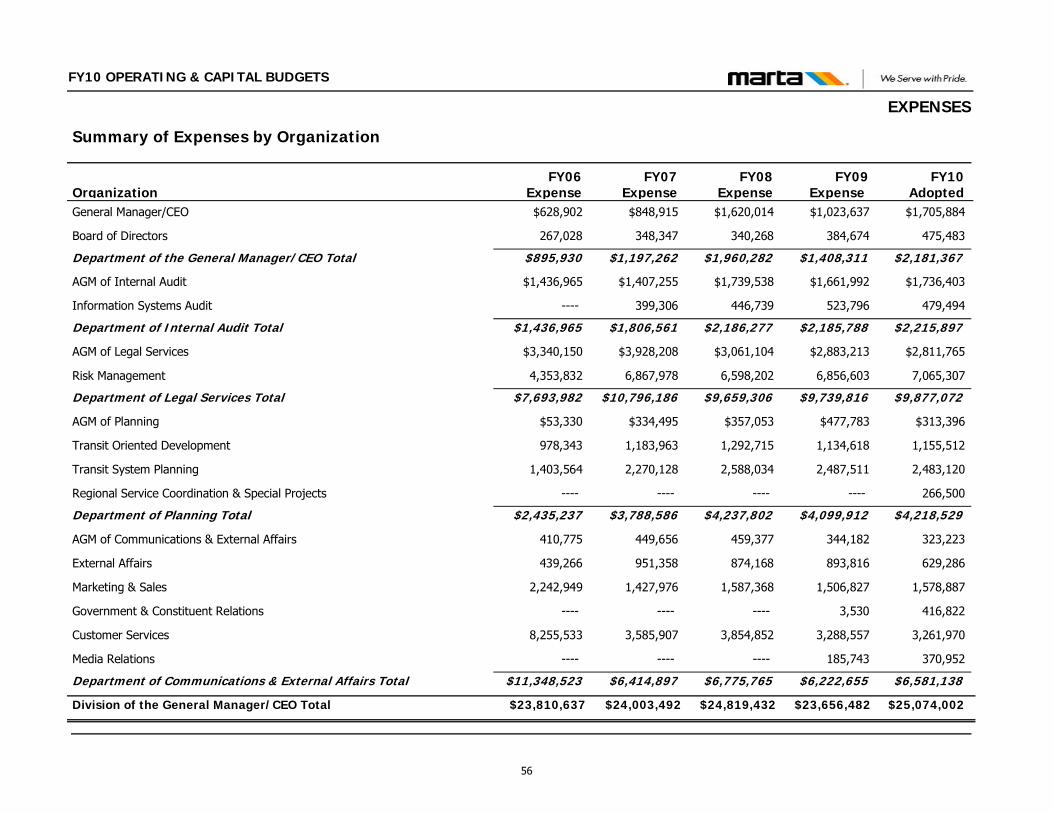
Organization
Summary of Expenses by Organization
FY06Expense
FY08Expense
FY09Expense
FY07Expense
FY10Adopted
FY10 OPERATING & CAPITAL BUDGETS
EXPENSES
General Manager/CEO $628,902 $1,620,014 $1,023,637 $848,915 $1,705,884
Board of Directors 267,028 340,268 384,674 348,347 475,483
Department of the General Manager/CEO Total $895,930 $1,960,282 $1,408,311$1,197,262 $2,181,367
AGM of Internal Audit $1,436,965 $1,739,538 $1,661,992 $1,407,255 $1,736,403
Information Systems Audit ---- 446,739 523,796 399,306 479,494
Department of Internal Audit Total $1,436,965 $2,186,277 $2,185,788$1,806,561 $2,215,897
AGM of Legal Services $3,340,150 $3,061,104 $2,883,213 $3,928,208 $2,811,765
Risk Management 4,353,832 6,598,202 6,856,603 6,867,978 7,065,307
Department of Legal Services Total $7,693,982 $9,659,306 $9,739,816$10,796,186 $9,877,072
AGM of Planning $53,330 $357,053 $477,783 $334,495 $313,396
Transit Oriented Development 978,343 1,292,715 1,134,618 1,183,963 1,155,512
Transit System Planning 1,403,564 2,588,034 2,487,511 2,270,128 2,483,120
Regional Service Coordination & Special Projects ---- ---- ---- ---- 266,500
Department of Planning Total $2,435,237 $4,237,802 $4,099,912$3,788,586 $4,218,529
AGM of Communications & External Affairs 410,775 459,377 344,182 449,656 323,223
External Affairs 439,266 874,168 893,816 951,358 629,286
Marketing & Sales 2,242,949 1,587,368 1,506,827 1,427,976 1,578,887
Government & Constituent Relations ---- ---- 3,530 ---- 416,822
Customer Services 8,255,533 3,854,852 3,288,557 3,585,907 3,261,970
Media Relations ---- ---- 185,743 ---- 370,952
Department of Communications & External Affairs Total $11,348,523 $6,775,765 $6,222,655$6,414,897 $6,581,138
Division of the General Manager/CEO Total $23,810,637 $24,819,432 $23,656,482$24,003,492 $25,074,002
56
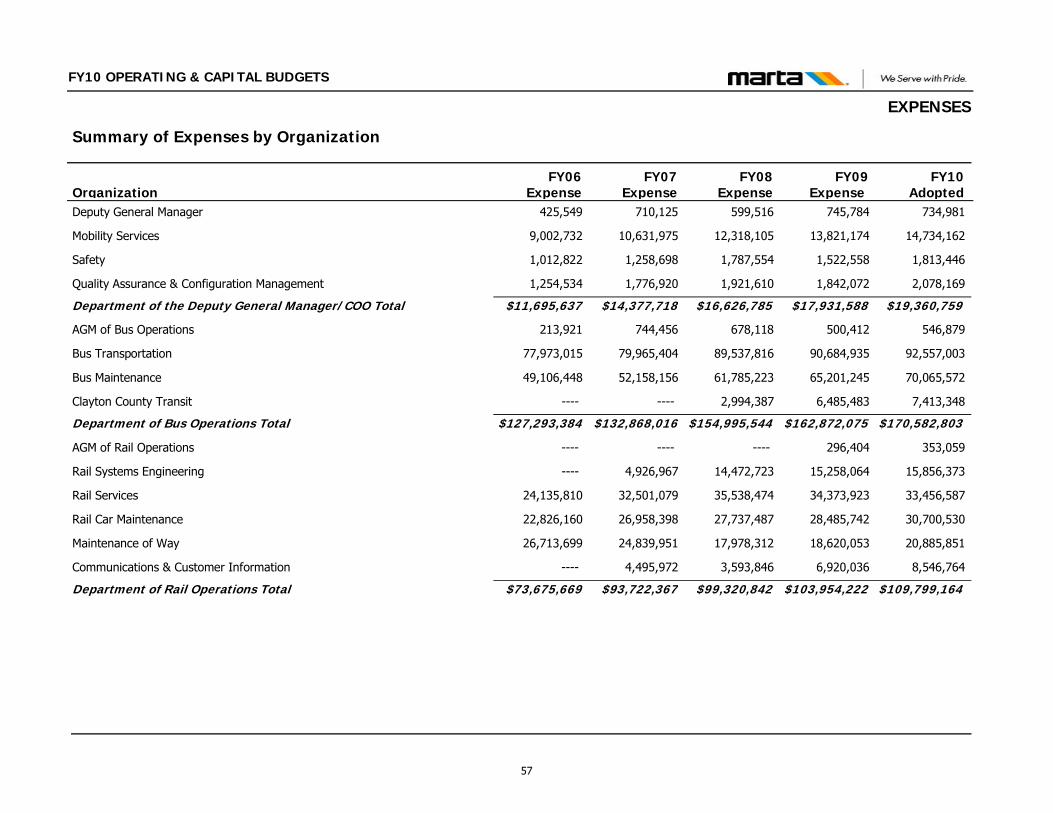
Organization
Summary of Expenses by Organization
FY06Expense
FY08Expense
FY09Expense
FY07Expense
FY10Adopted
FY10 OPERATING & CAPITAL BUDGETS
EXPENSES
Deputy General Manager 425,549 599,516 745,784 710,125 734,981
Mobility Services 9,002,732 12,318,105 13,821,174 10,631,975 14,734,162
Safety 1,012,822 1,787,554 1,522,558 1,258,698 1,813,446
Quality Assurance & Configuration Management 1,254,534 1,921,610 1,842,072 1,776,920 2,078,169
Department of the Deputy General Manager/COO Total $11,695,637 $16,626,785 $17,931,588$14,377,718 $19,360,759
AGM of Bus Operations 213,921 678,118 500,412 744,456 546,879
Bus Transportation 77,973,015 89,537,816 90,684,935 79,965,404 92,557,003
Bus Maintenance 49,106,448 61,785,223 65,201,245 52,158,156 70,065,572
Clayton County Transit ---- 2,994,387 6,485,483 ---- 7,413,348
Department of Bus Operations Total $127,293,384 $154,995,544 $162,872,075$132,868,016 $170,582,803
AGM of Rail Operations ---- ---- 296,404 ---- 353,059
Rail Systems Engineering ---- 14,472,723 15,258,064 4,926,967 15,856,373
Rail Services 24,135,810 35,538,474 34,373,923 32,501,079 33,456,587
Rail Car Maintenance 22,826,160 27,737,487 28,485,742 26,958,398 30,700,530
Maintenance of Way 26,713,699 17,978,312 18,620,053 24,839,951 20,885,851
Communications & Customer Information ---- 3,593,846 6,920,036 4,495,972 8,546,764
Department of Rail Operations Total $73,675,669 $99,320,842 $103,954,222$93,722,367 $109,799,164
57
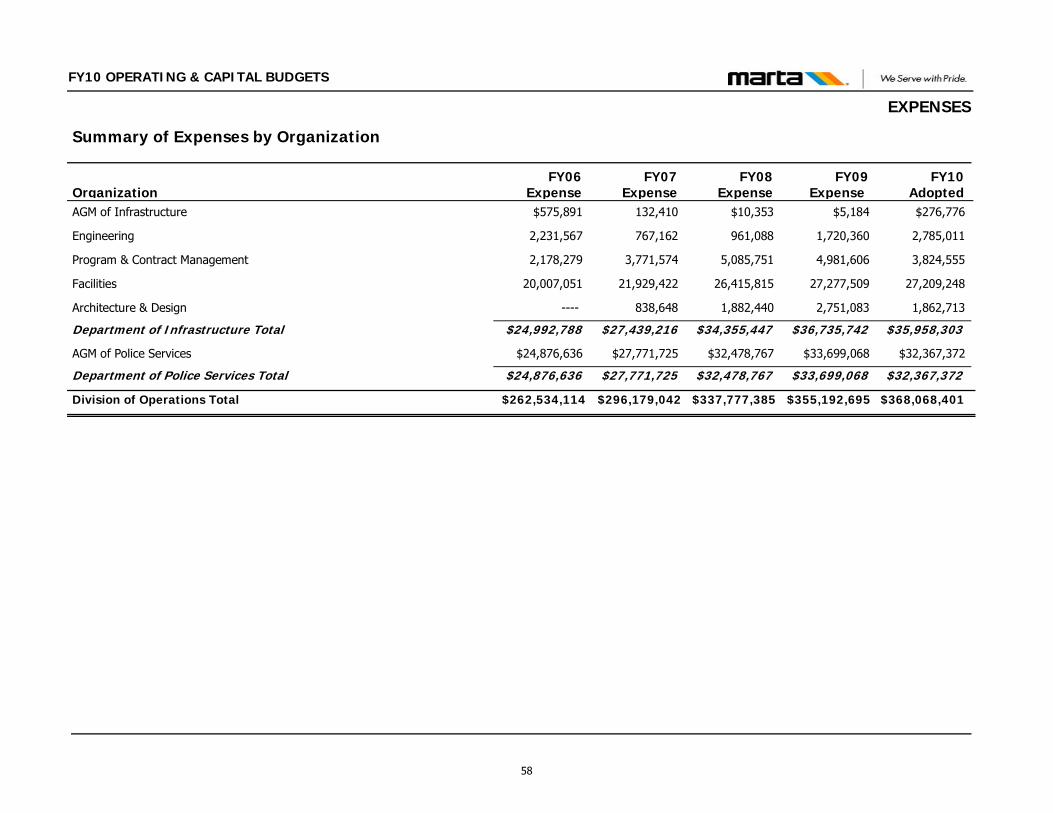
Organization
Summary of Expenses by Organization
FY06Expense
FY08Expense
FY09Expense
FY07Expense
FY10Adopted
FY10 OPERATING & CAPITAL BUDGETS
EXPENSES
AGM of Infrastructure $575,891 $10,353 $5,184 132,410 $276,776
Engineering 2,231,567 961,088 1,720,360 767,162 2,785,011
Program & Contract Management 2,178,279 5,085,751 4,981,606 3,771,574 3,824,555
Facilities 20,007,051 26,415,815 27,277,509 21,929,422 27,209,248
Architecture & Design ---- 1,882,440 2,751,083 838,648 1,862,713
Department of Infrastructure Total $24,992,788 $34,355,447 $36,735,742$27,439,216 $35,958,303
AGM of Police Services $24,876,636 $32,478,767 $33,699,068 $27,771,725 $32,367,372
Department of Police Services Total $24,876,636 $32,478,767 $33,699,068$27,771,725 $32,367,372
Division of Operations Total $262,534,114 $337,777,385 $355,192,695$296,179,042 $368,068,401
58
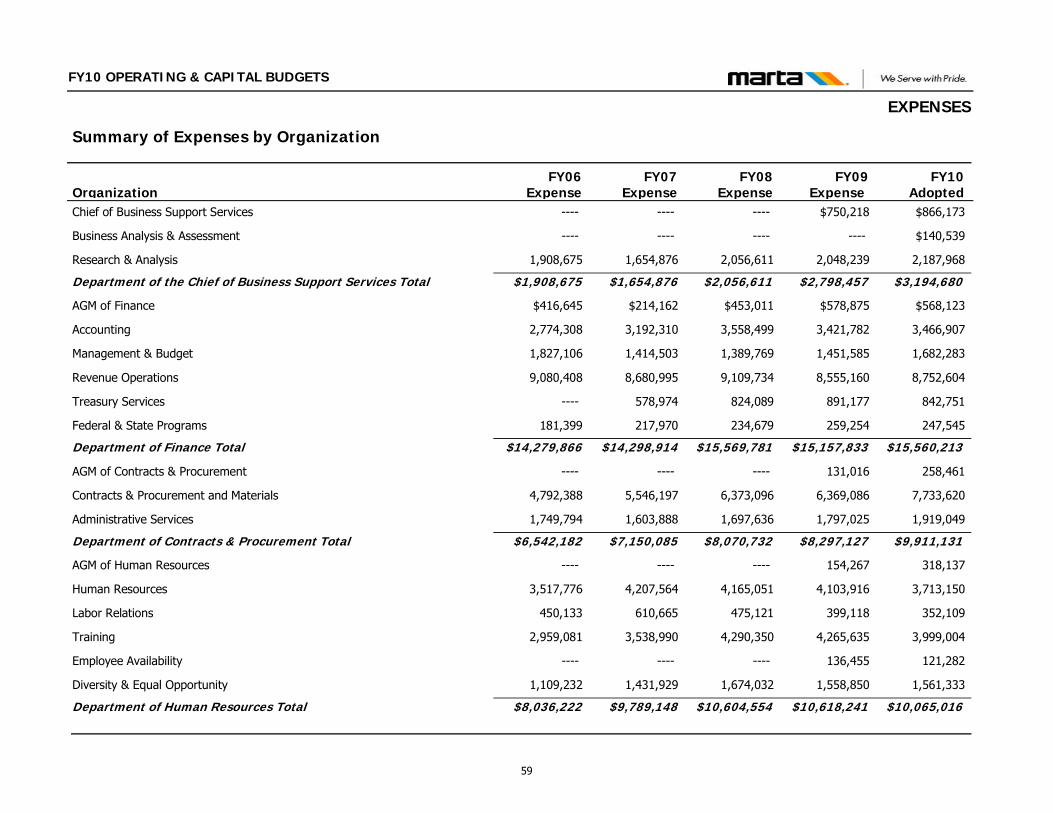
Organization
Summary of Expenses by Organization
FY06Expense
FY08Expense
FY09Expense
FY07Expense
FY10Adopted
FY10 OPERATING & CAPITAL BUDGETS
EXPENSES
Chief of Business Support Services ---- ---- $750,218 ---- $866,173
Business Analysis & Assessment ---- ---- ---- ---- $140,539
Research & Analysis 1,908,675 2,056,611 2,048,239 1,654,876 2,187,968
Department of the Chief of Business Support Services Total $1,908,675 $2,056,611 $2,798,457$1,654,876 $3,194,680
AGM of Finance $416,645 $453,011 $578,875 $214,162 $568,123
Accounting 2,774,308 3,558,499 3,421,782 3,192,310 3,466,907
Management & Budget 1,827,106 1,389,769 1,451,585 1,414,503 1,682,283
Revenue Operations 9,080,408 9,109,734 8,555,160 8,680,995 8,752,604
Treasury Services ---- 824,089 891,177 578,974 842,751
Federal & State Programs 181,399 234,679 259,254 217,970 247,545
Department of Finance Total $14,279,866 $15,569,781 $15,157,833$14,298,914 $15,560,213
AGM of Contracts & Procurement ---- ---- 131,016 ---- 258,461
Contracts & Procurement and Materials 4,792,388 6,373,096 6,369,086 5,546,197 7,733,620
Administrative Services 1,749,794 1,697,636 1,797,025 1,603,888 1,919,049
Department of Contracts & Procurement Total $6,542,182 $8,070,732 $8,297,127$7,150,085 $9,911,131
AGM of Human Resources ---- ---- 154,267 ---- 318,137
Human Resources 3,517,776 4,165,051 4,103,916 4,207,564 3,713,150
Labor Relations 450,133 475,121 399,118 610,665 352,109
Training 2,959,081 4,290,350 4,265,635 3,538,990 3,999,004
Employee Availability ---- ---- 136,455 ---- 121,282
Diversity & Equal Opportunity 1,109,232 1,674,032 1,558,850 1,431,929 1,561,333
Department of Human Resources Total $8,036,222 $10,604,554 $10,618,241$9,789,148 $10,065,016
59
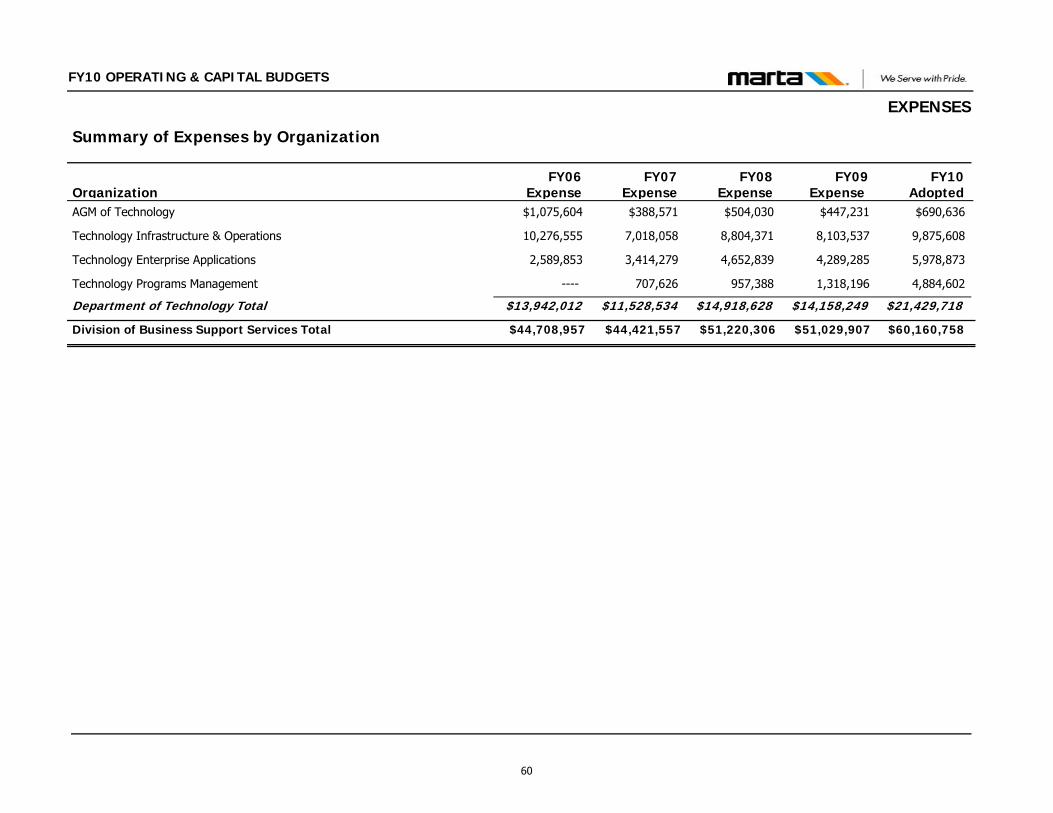
Organization
Summary of Expenses by Organization
FY06Expense
FY08Expense
FY09Expense
FY07Expense
FY10Adopted
FY10 OPERATING & CAPITAL BUDGETS
EXPENSES
AGM of Technology $1,075,604 $504,030 $447,231 $388,571 $690,636
Technology Infrastructure & Operations 10,276,555 8,804,371 8,103,537 7,018,058 9,875,608
Technology Enterprise Applications 2,589,853 4,652,839 4,289,285 3,414,279 5,978,873
Technology Programs Management ---- 957,388 1,318,196 707,626 4,884,602
Department of Technology Total $13,942,012 $14,918,628 $14,158,249$11,528,534 $21,429,718
Division of Business Support Services Total $44,708,957 $51,220,306 $51,029,907$44,421,557 $60,160,758
60
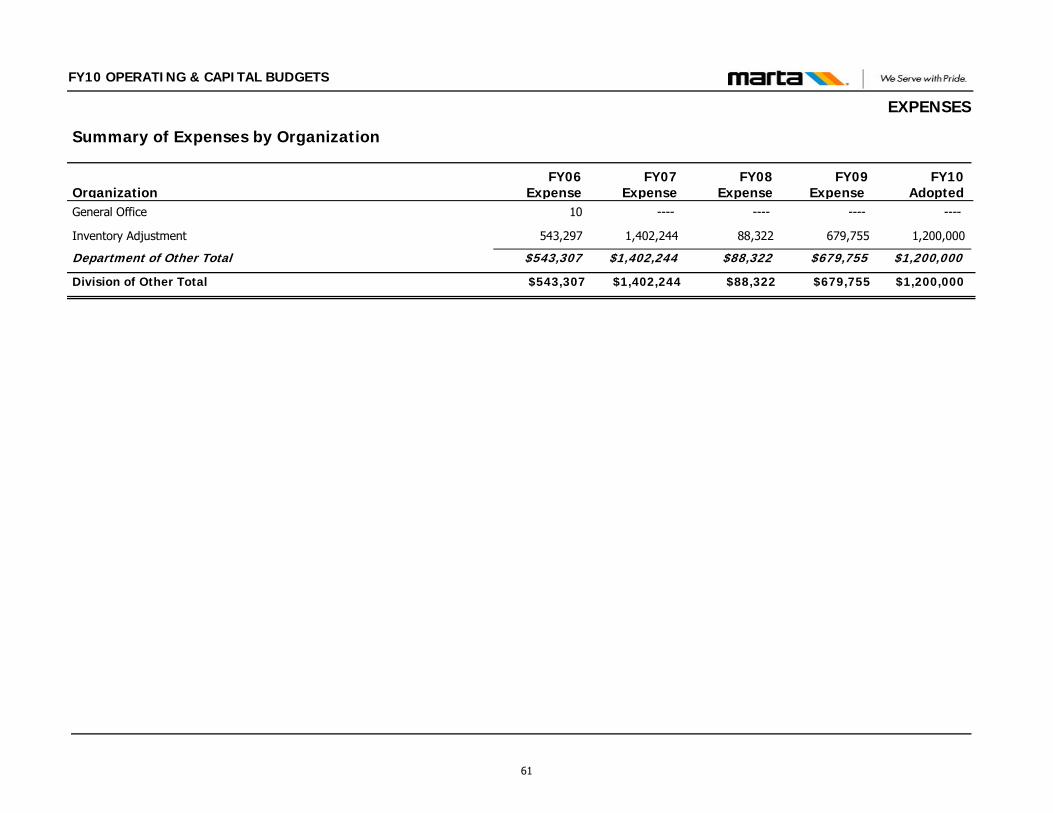
Organization
Summary of Expenses by Organization
FY06Expense
FY08Expense
FY09Expense
FY07Expense
FY10Adopted
FY10 OPERATING & CAPITAL BUDGETS
EXPENSES
General Office 10 ---- ---- ---- ----
Inventory Adjustment 543,297 88,322 679,755 1,402,244 1,200,000
Department of Other Total $543,307 $88,322 $679,755$1,402,244 $1,200,000
Division of Other Total $543,307 $88,322 $679,755$1,402,244 $1,200,000
61
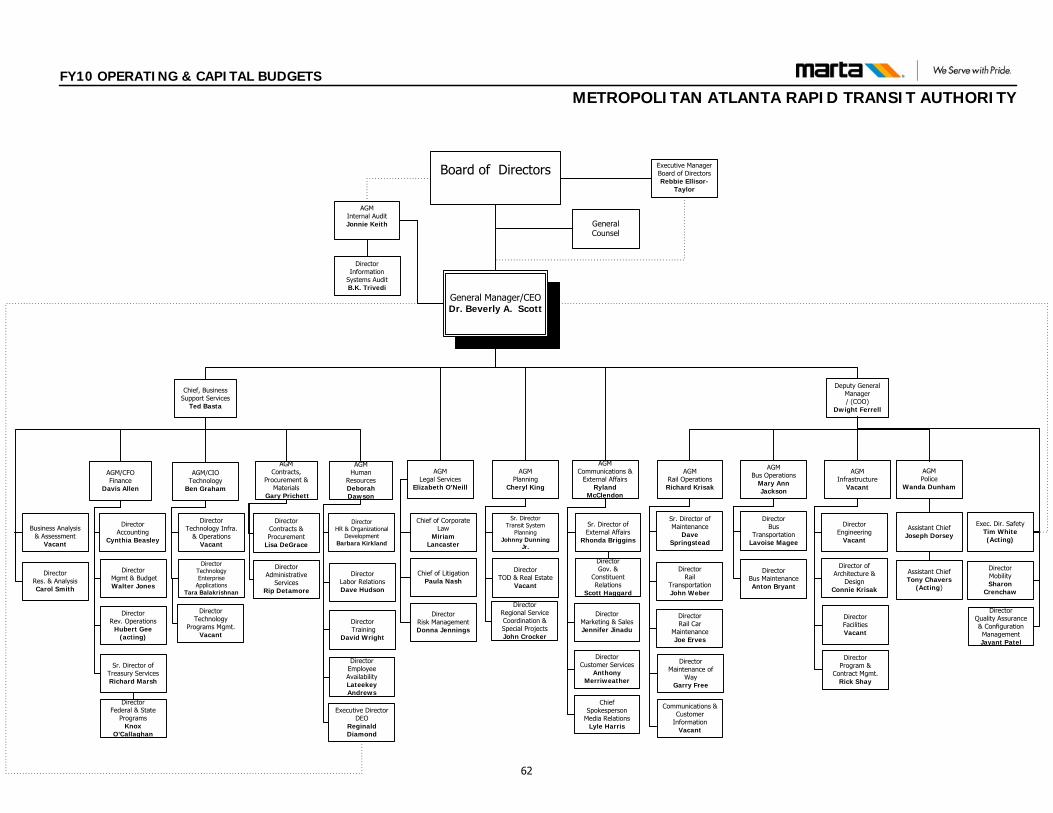
Director Marketing & SalesJennifer Jinadu
DirectorCustomer Services
Anthony Merriweather
AGM/CFOFinance
Davis Allen
DirectorAccounting
Cynthia Beasley
Director Mgmt & BudgetWalter Jones
AGMPolice
Wanda Dunham
AGMInternal AuditJonnie Keith
DirectorBus
TransportationLavoise Magee
DirectorRev. Operations
Hubert Gee (acting)
Director Bus MaintenanceAnton Bryant
Director MobilitySharon
Crenchaw
DirectorRail Car
MaintenanceJoe Erves
DirectorRail
TransportationJohn Weber
Board of Directors
General Manager/CEODr. Beverly A. Scott
General Counsel
AGMPlanning
Cheryl King
Sr. DirectorTransit System
PlanningJohnny Dunning
Jr.
DirectorRes. & AnalysisCarol Smith
DirectorTOD & Real Estate
Vacant
AGM Communications &
External AffairsRyland
McClendon
DirectorFacilitiesVacant
DirectorEngineering
Vacant
DirectorContracts & Procurement
Lisa DeGrace
AGMLegal Services
Elizabeth O’Neill
Director Risk ManagementDonna Jennings
Executive DirectorDEO
Reginald Diamond
DirectorHR & Organizational
DevelopmentBarbara Kirkland
Sr. Director of Treasury ServicesRichard Marsh
Director Training
David Wright
Exec. Dir. SafetyTim White (Acting)
Deputy General Manager/ (COO)
Dwight Ferrell
Chief, Business Support Services
Ted Basta
Business Analysis & Assessment
Vacant
Director Quality Assurance & Configuration Management Jayant Patel
AGMInfrastructure
Vacant
Sr. Director of Maintenance
Dave Springstead
Chief Spokesperson
Media Relations Lyle Harris
Director Maintenance of
WayGarry Free
AGM/CIOTechnology
Ben Graham
Director Technology Infra.
& OperationsVacant
DirectorTechnology Enterprise
ApplicationsTara Balakrishnan
AGMContracts,
Procurement & Materials
Gary Prichett
AGM Human
ResourcesDeborah Dawson
AGMBus Operations
Mary Ann Jackson
AGM Rail Operations
Richard Krisak
Sr. Director of External Affairs
Rhonda Briggins
Director of Architecture &
DesignConnie Krisak
DirectorLabor RelationsDave Hudson
DirectorInformation
Systems AuditB.K. Trivedi
Chief of Corporate Law
Miriam Lancaster
Chief of LitigationPaula Nash
Assistant Chief Joseph Dorsey
Assistant Chief Tony Chavers
(Acting)
Executive Manager Board of DirectorsRebbie Ellisor-
Taylor
Director Gov. &
Constituent Relations
Scott Haggard
Communications & Customer
InformationVacant
Director Federal & State
ProgramsKnox
O’Callaghan
Director Regional Service Coordination & Special ProjectsJohn Crocker
DirectorEmployee AvailabilityLateekey Andrews
DirectorAdministrative
ServicesRip Detamore
DirectorProgram &
Contract Mgmt.Rick Shay
DirectorTechnology
Programs Mgmt.Vacant
FY10 OPERATING & CAPITAL BUDGETS
METROPOLITAN ATLANTA RAPID TRANSIT AUTHORITY
62
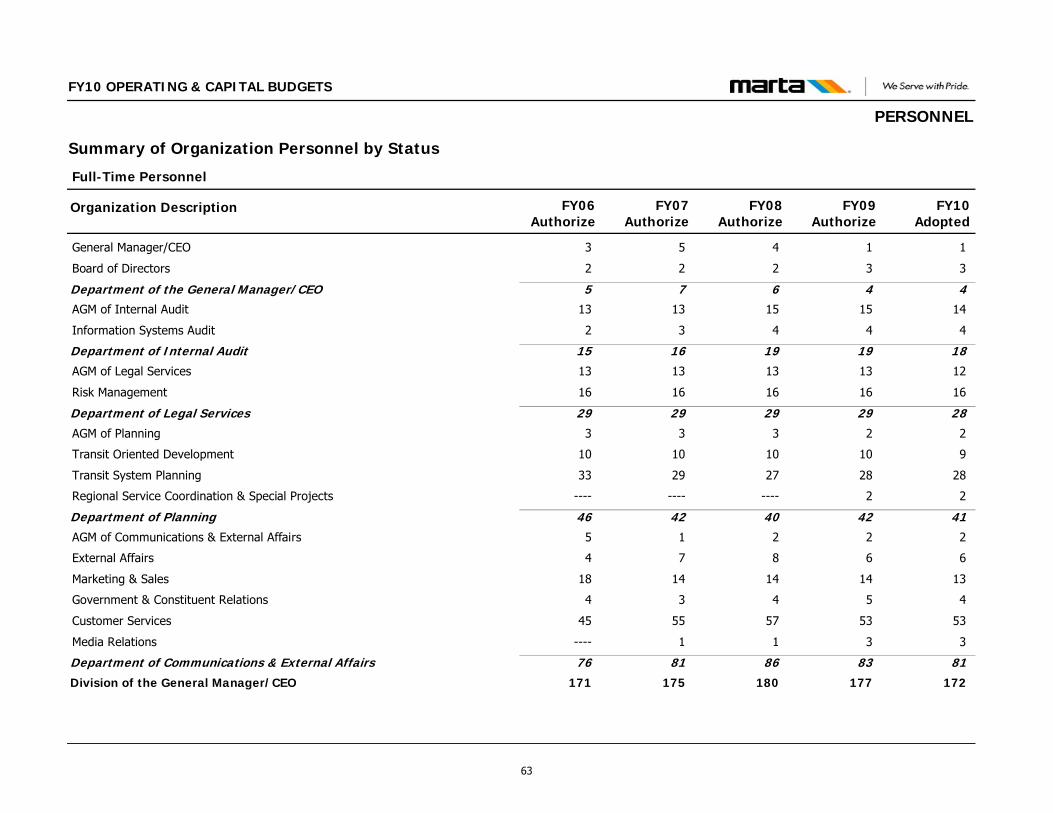
FY10 OPERATING & CAPITAL BUDGETS
PERSONNEL
Summary of Organization Personnel by Status
Full-Time Personnel
FY07Authorize
FY08Authorize
FY09Authorize
FY06Authorize
Organization Description FY10Adopted
5General Manager/CEO 4 13 1
2Board of Directors 2 32 3
7Department of the General Manager/CEO 6 45 413AGM of Internal Audit 15 1513 14
3Information Systems Audit 4 42 4
16Department of Internal Audit 19 1915 1813AGM of Legal Services 13 1313 12
16Risk Management 16 1616 16
29Department of Legal Services 29 2929 283AGM of Planning 3 23 2
10Transit Oriented Development 10 1010 9
29Transit System Planning 27 2833 28
---- Regional Service Coordination & Special Projects ---- 2---- 2
42Department of Planning 40 4246 411AGM of Communications & External Affairs 2 25 2
7External Affairs 8 64 6
14Marketing & Sales 14 1418 13
3Government & Constituent Relations 4 54 4
55Customer Services 57 5345 53
1Media Relations 1 3---- 3
81Department of Communications & External Affairs 86 8376 81175Division of the General Manager/CEO 180 177171 172
63
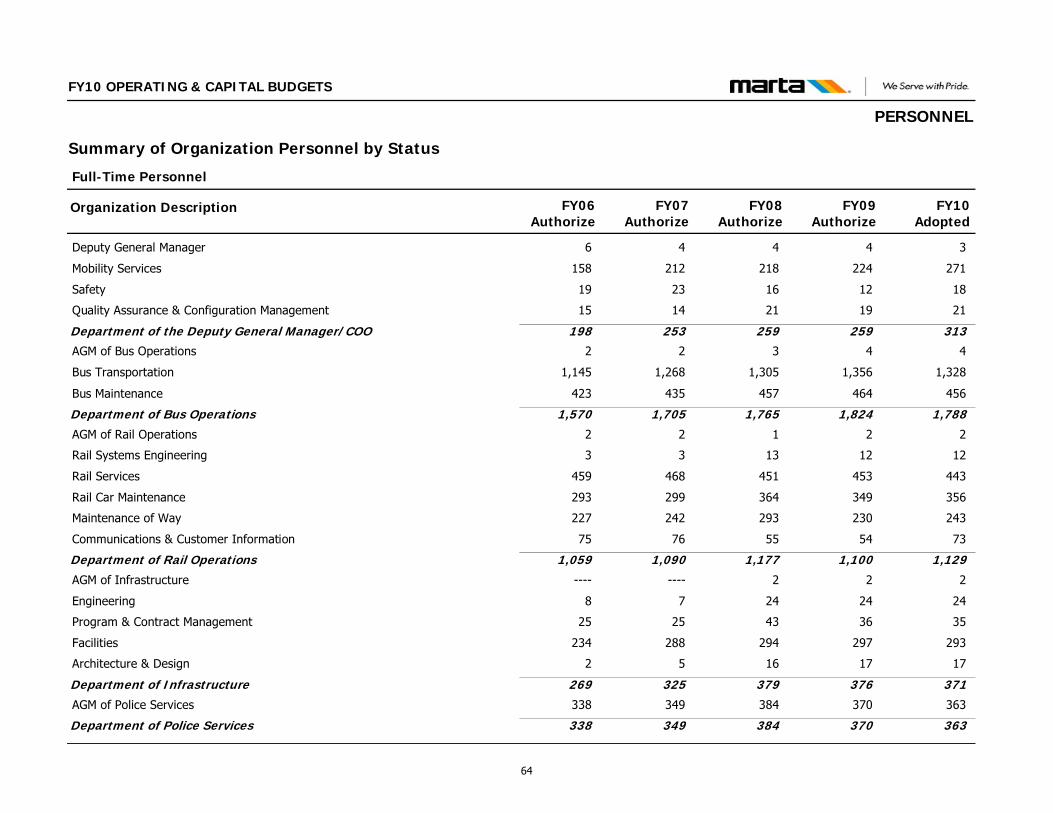
FY10 OPERATING & CAPITAL BUDGETS
PERSONNEL
Summary of Organization Personnel by Status
Full-Time Personnel
FY07Authorize
FY08Authorize
FY09Authorize
FY06Authorize
Organization Description FY10Adopted
4Deputy General Manager 4 46 3
212Mobility Services 218 224158 271
23Safety 16 1219 18
14Quality Assurance & Configuration Management 21 1915 21
253Department of the Deputy General Manager/COO 259 259198 3132AGM of Bus Operations 3 42 4
1,268Bus Transportation 1,305 1,3561,145 1,328
435Bus Maintenance 457 464423 456
1,705Department of Bus Operations 1,765 1,8241,570 1,7882AGM of Rail Operations 1 22 2
3Rail Systems Engineering 13 123 12
468Rail Services 451 453459 443
299Rail Car Maintenance 364 349293 356
242Maintenance of Way 293 230227 243
76Communications & Customer Information 55 5475 73
1,090Department of Rail Operations 1,177 1,1001,059 1,129---- AGM of Infrastructure 2 2---- 2
7Engineering 24 248 24
25Program & Contract Management 43 3625 35
288Facilities 294 297234 293
5Architecture & Design 16 172 17
325Department of Infrastructure 379 376269 371349AGM of Police Services 384 370338 363
349Department of Police Services 384 370338 363
64
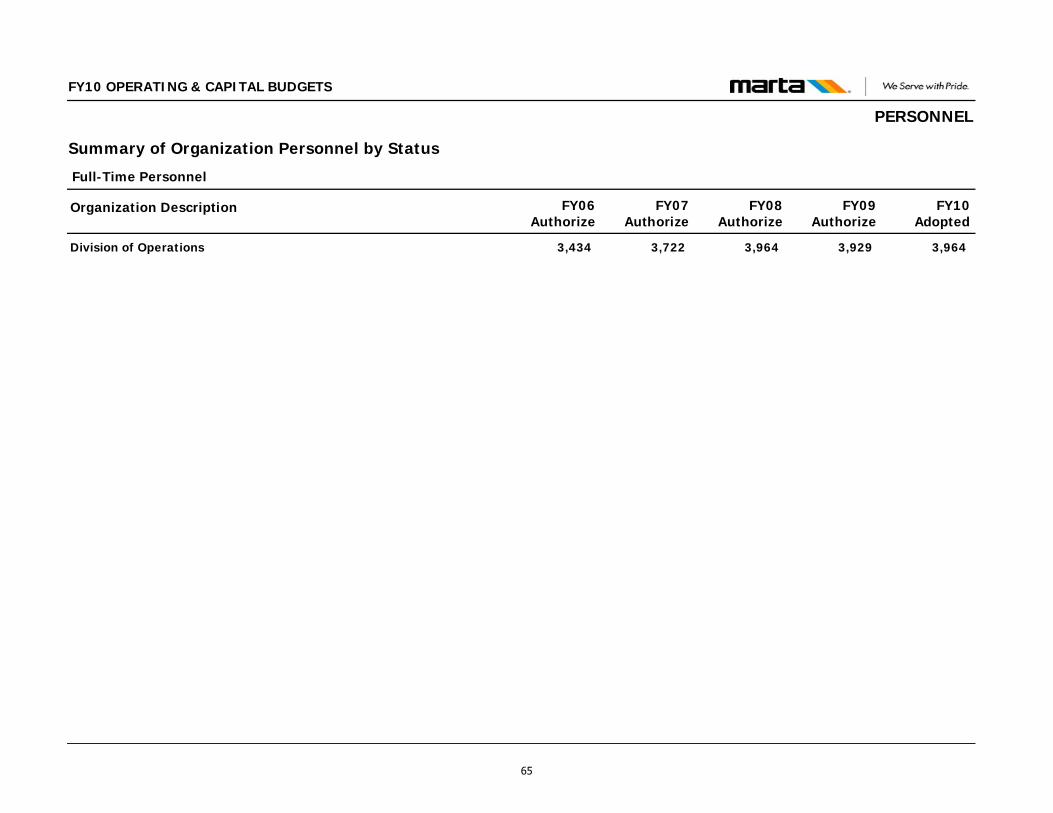
FY10 OPERATING & CAPITAL BUDGETS
PERSONNEL
Summary of Organization Personnel by Status
Full-Time Personnel
FY07Authorize
FY08Authorize
FY09Authorize
FY06Authorize
Organization Description FY10Adopted
3,722Division of Operations 3,964 3,9293,434 3,964
65
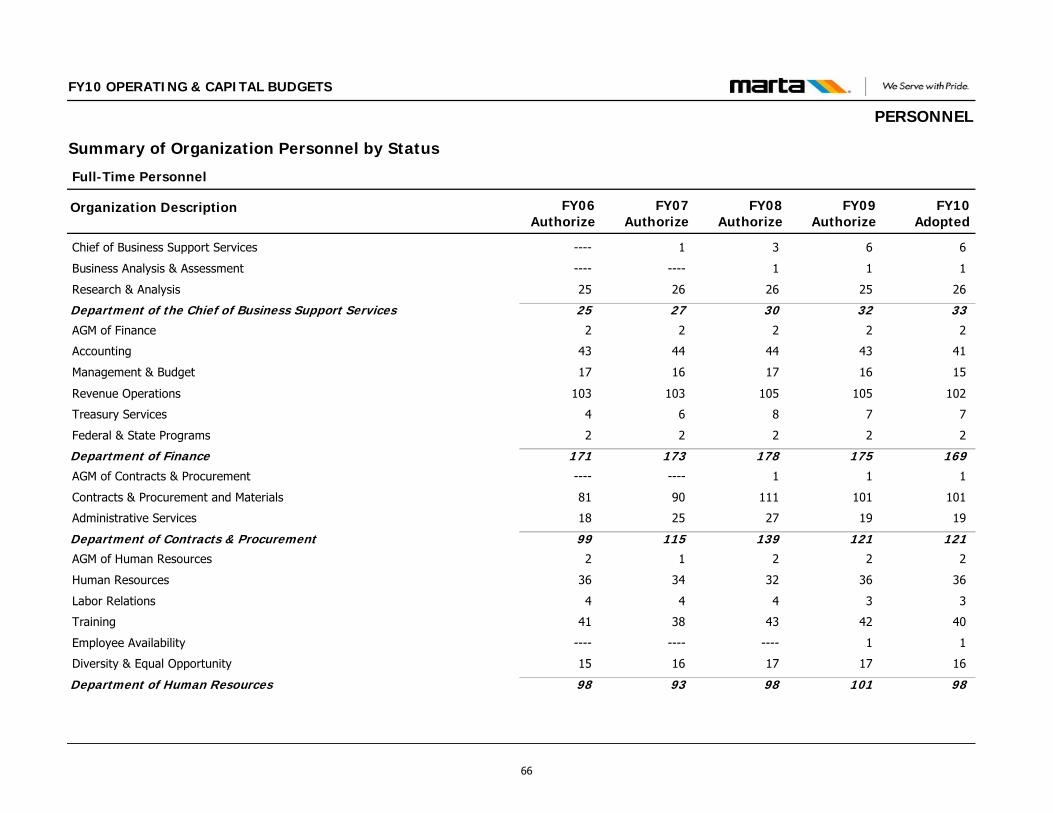
FY10 OPERATING & CAPITAL BUDGETS
PERSONNEL
Summary of Organization Personnel by Status
Full-Time Personnel
FY07Authorize
FY08Authorize
FY09Authorize
FY06Authorize
Organization Description FY10Adopted
1Chief of Business Support Services 3 6---- 6
---- Business Analysis & Assessment 1 1---- 1
26Research & Analysis 26 2525 26
27Department of the Chief of Business Support Services 30 3225 332AGM of Finance 2 22 2
44Accounting 44 4343 41
16Management & Budget 17 1617 15
103Revenue Operations 105 105103 102
6Treasury Services 8 74 7
2Federal & State Programs 2 22 2
173Department of Finance 178 175171 169---- AGM of Contracts & Procurement 1 1---- 1
90Contracts & Procurement and Materials 111 10181 101
25Administrative Services 27 1918 19
115Department of Contracts & Procurement 139 12199 1211AGM of Human Resources 2 22 2
34Human Resources 32 3636 36
4Labor Relations 4 34 3
38Training 43 4241 40
---- Employee Availability ---- 1---- 1
16Diversity & Equal Opportunity 17 1715 16
93Department of Human Resources 98 10198 98
66
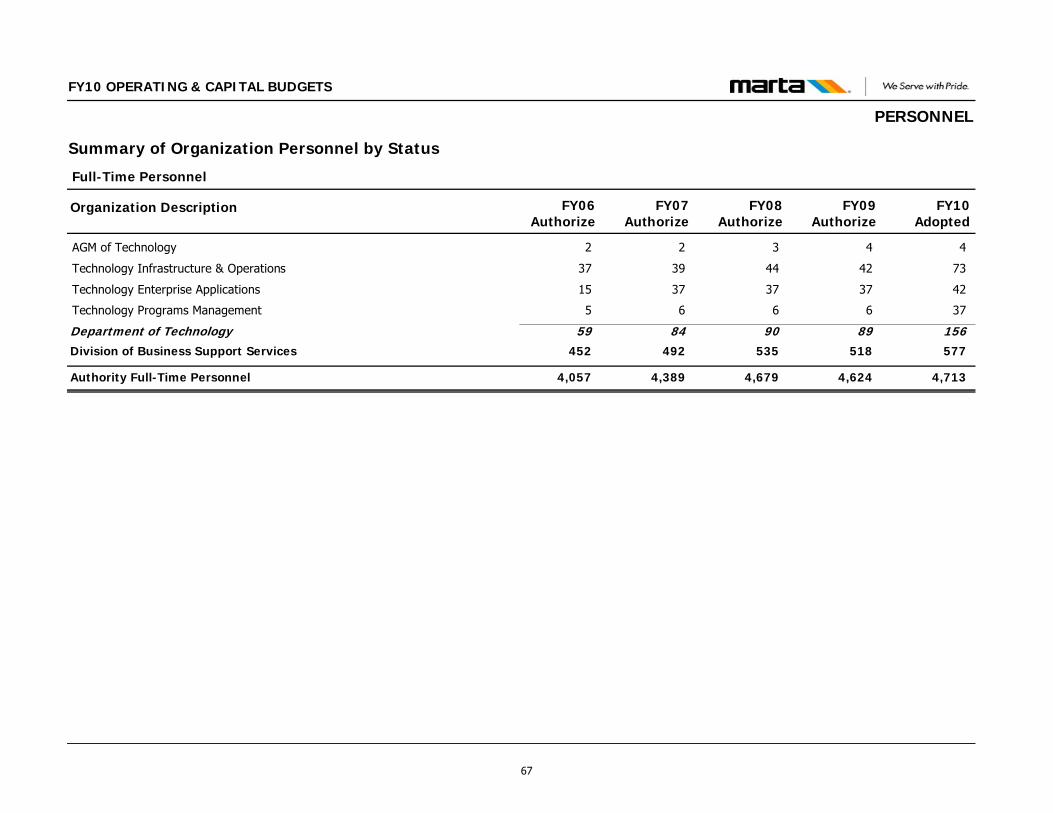
FY10 OPERATING & CAPITAL BUDGETS
PERSONNEL
Summary of Organization Personnel by Status
Full-Time Personnel
FY07Authorize
FY08Authorize
FY09Authorize
FY06Authorize
Organization Description FY10Adopted
2AGM of Technology 3 42 4
39Technology Infrastructure & Operations 44 4237 73
37Technology Enterprise Applications 37 3715 42
6Technology Programs Management 6 65 37
84Department of Technology 90 8959 156492Division of Business Support Services 535 518452 577
Authority Full-Time Personnel 4,389 4,679 4,6244,057 4,713
67
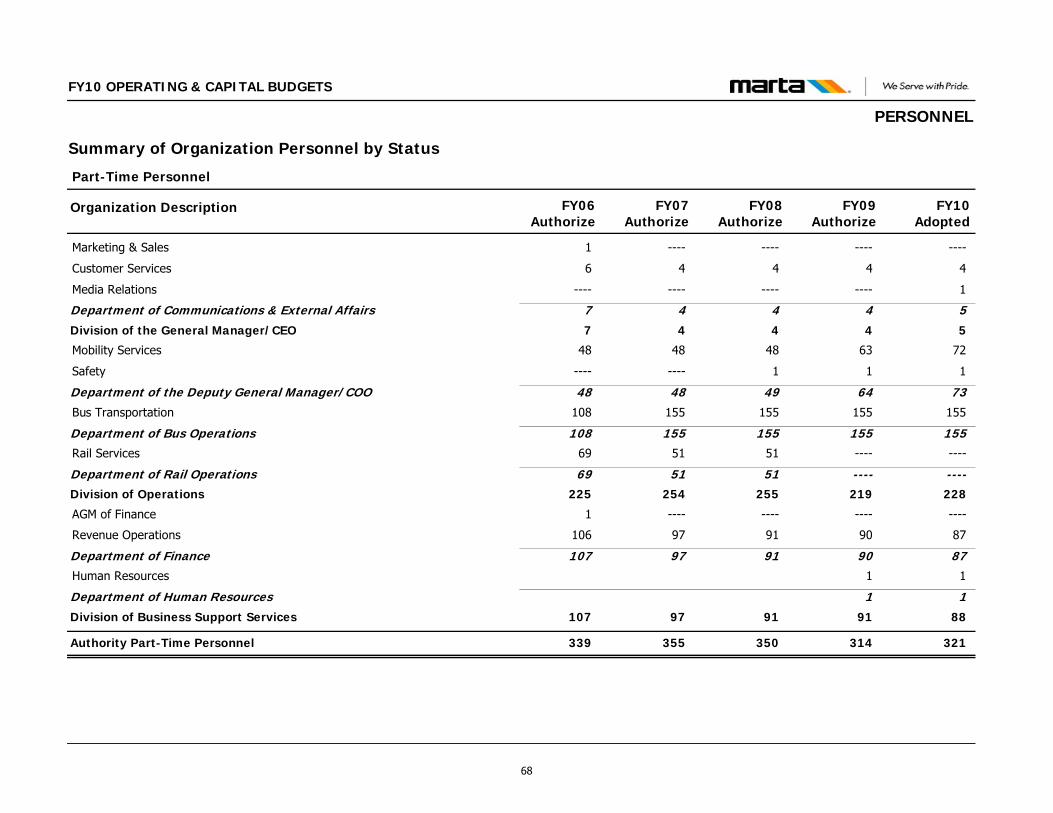
FY10 OPERATING & CAPITAL BUDGETS
PERSONNEL
Summary of Organization Personnel by Status
Part-Time Personnel
FY07Authorize
FY08Authorize
FY09Authorize
FY06Authorize
Organization Description FY10Adopted
---- Marketing & Sales ---- ---- 1 ----
4Customer Services 4 46 4
---- Media Relations ---- ---- ---- 1
4Department of Communications & External Affairs 4 47 54Division of the General Manager/CEO 4 47 5
48Mobility Services 48 6348 72
---- Safety 1 1---- 1
48Department of the Deputy General Manager/COO 49 6448 73155Bus Transportation 155 155108 155
155Department of Bus Operations 155 155108 15551Rail Services 51 ---- 69 ----
51Department of Rail Operations 51 ---- 69 ---- 254Division of Operations 255 219225 228
---- AGM of Finance ---- ---- 1 ----
97Revenue Operations 91 90106 87
97Department of Finance 91 90107 87Human Resources 1 1
Department of Human Resources 1 197Division of Business Support Services 91 91107 88
Authority Part-Time Personnel 355 350 314339 321
68
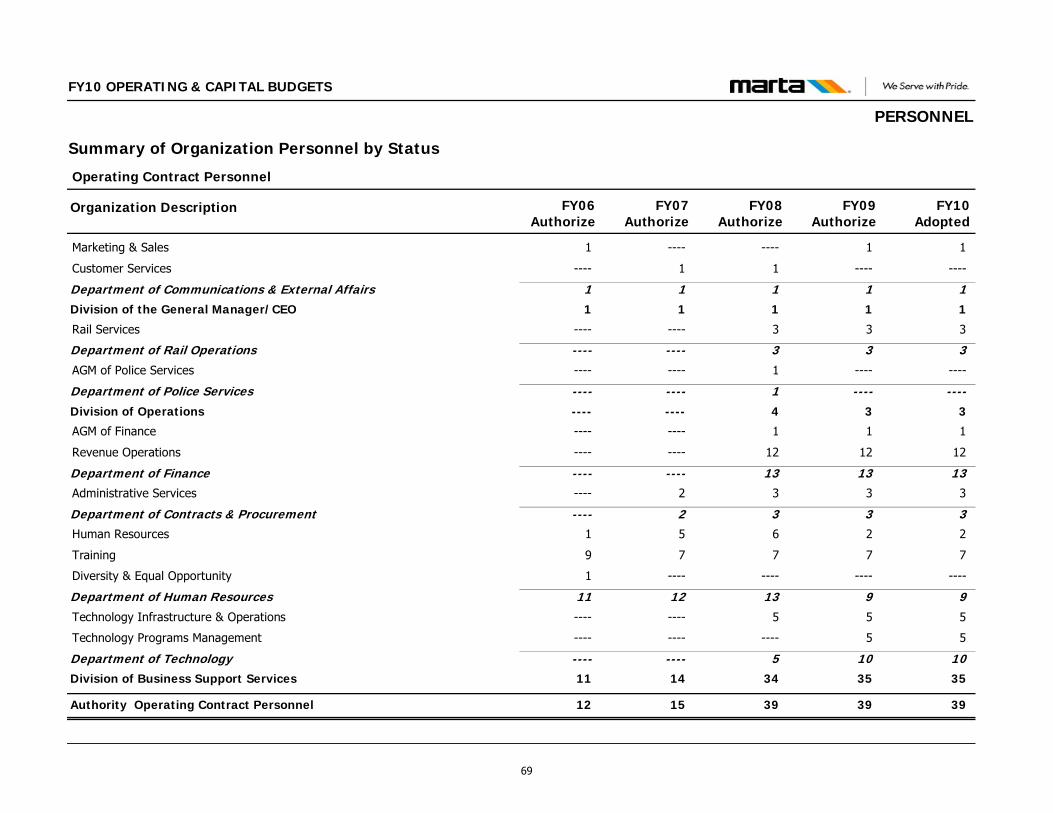
FY10 OPERATING & CAPITAL BUDGETS
PERSONNEL
Summary of Organization Personnel by Status
Operating Contract Personnel
FY07Authorize
FY08Authorize
FY09Authorize
FY06Authorize
Organization Description FY10Adopted
---- Marketing & Sales ---- 11 1
1Customer Services 1 ---- ---- ----
1Department of Communications & External Affairs 1 11 11Division of the General Manager/CEO 1 11 1
---- Rail Services 3 3---- 3
---- Department of Rail Operations 3 3---- 3---- AGM of Police Services 1 ---- ---- ----
---- Department of Police Services 1 ---- ---- ---- ---- Division of Operations 4 3---- 3
---- AGM of Finance 1 1---- 1
---- Revenue Operations 12 12---- 12
---- Department of Finance 13 13---- 132Administrative Services 3 3---- 3
2Department of Contracts & Procurement 3 3---- 35Human Resources 6 21 2
7Training 7 79 7
---- Diversity & Equal Opportunity ---- ---- 1 ----
12Department of Human Resources 13 911 9---- Technology Infrastructure & Operations 5 5---- 5
---- Technology Programs Management ---- 5---- 5
---- Department of Technology 5 10---- 1014Division of Business Support Services 34 3511 35
Authority Operating Contract Personnel 15 39 3912 39
69
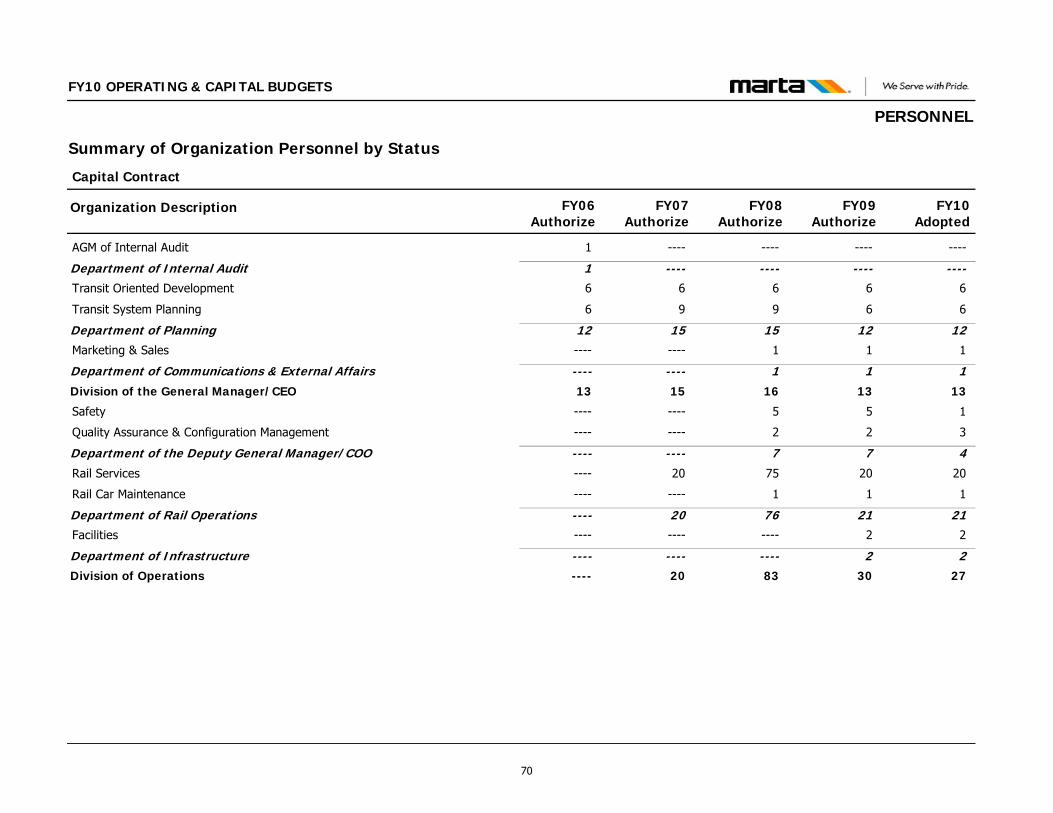
FY10 OPERATING & CAPITAL BUDGETS
PERSONNEL
Summary of Organization Personnel by Status
Capital Contract
FY07Authorize
FY08Authorize
FY09Authorize
FY06Authorize
Organization Description FY10Adopted
---- AGM of Internal Audit ---- ---- 1 ----
---- Department of Internal Audit ---- ---- 1 ---- 6Transit Oriented Development 6 66 6
9Transit System Planning 9 66 6
15Department of Planning 15 1212 12---- Marketing & Sales 1 1---- 1
---- Department of Communications & External Affairs 1 1---- 115Division of the General Manager/CEO 16 1313 13
---- Safety 5 5---- 1
---- Quality Assurance & Configuration Management 2 2---- 3
---- Department of the Deputy General Manager/COO 7 7---- 420Rail Services 75 20---- 20
---- Rail Car Maintenance 1 1---- 1
20Department of Rail Operations 76 21---- 21---- Facilities ---- 2---- 2
---- Department of Infrastructure ---- 2---- 220Division of Operations 83 30---- 27
70
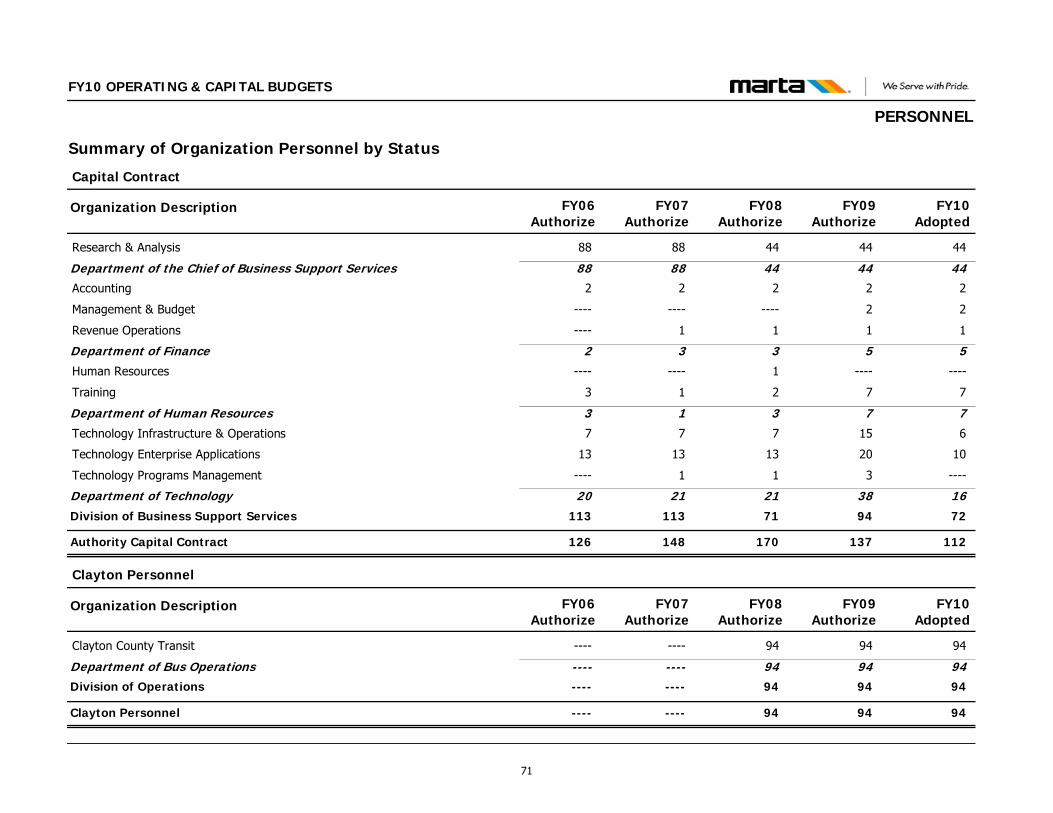
FY10 OPERATING & CAPITAL BUDGETS
PERSONNEL
Summary of Organization Personnel by Status
Capital Contract
FY07Authorize
FY08Authorize
FY09Authorize
FY06Authorize
Organization Description FY10Adopted
88Research & Analysis 44 4488 44
88Department of the Chief of Business Support Services 44 4488 442Accounting 2 22 2
---- Management & Budget ---- 2---- 2
1Revenue Operations 1 1---- 1
3Department of Finance 3 52 5---- Human Resources 1 ---- ---- ----
1Training 2 73 7
1Department of Human Resources 3 73 77Technology Infrastructure & Operations 7 157 6
13Technology Enterprise Applications 13 2013 10
1Technology Programs Management 1 3---- ----
21Department of Technology 21 3820 16113Division of Business Support Services 71 94113 72
Authority Capital Contract 148 170 137126 112
Clayton Personnel
FY07Authorize
FY08Authorize
FY09Authorize
FY06Authorize
Organization Description FY10Adopted
---- Clayton County Transit 94 94---- 94
---- Department of Bus Operations 94 94---- 94---- Division of Operations 94 94---- 94
Clayton Personnel ---- 94 94---- 94
71
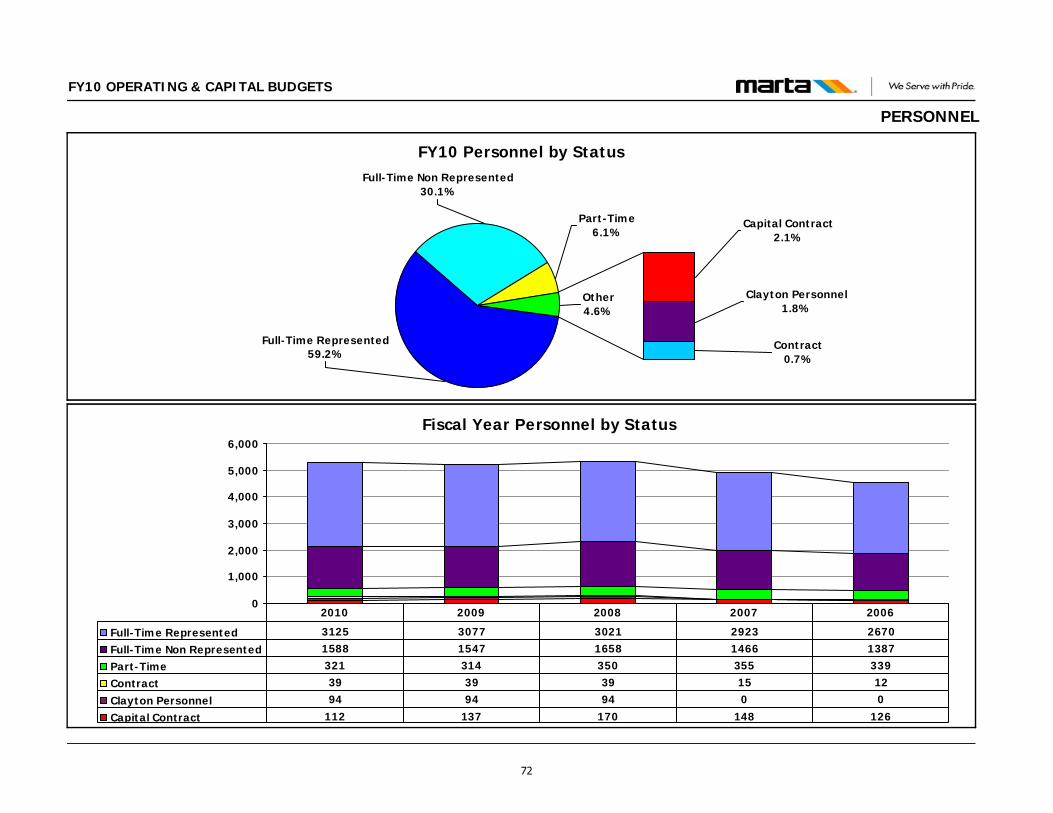
FY10 OPERATING & CAPITAL BUDGETS
PERSONNEL
Fiscal Year Personnel by Status
0
1,000
2,000
3,000
4,000
5,000
6,000
Full-Time Represented 3125 3077 3021 2923 2670
Full-Time Non Represented 1588 1547 1658 1466 1387
Part-Time 321 314 350 355 339
Contract 39 39 39 15 12
Clayton Personnel 94 94 94 0 0
Capital Contract 112 137 170 148 126
2010 2009 2008 2007 2006
FY10 Personnel by StatusFull-Time Non Represented
30.1%
Full-Time Represented59.2%
Part-Time6.1%
Contract0.7%
Capital Contract2.1%
Clayton Personnel1.8%
Other4.6%
72
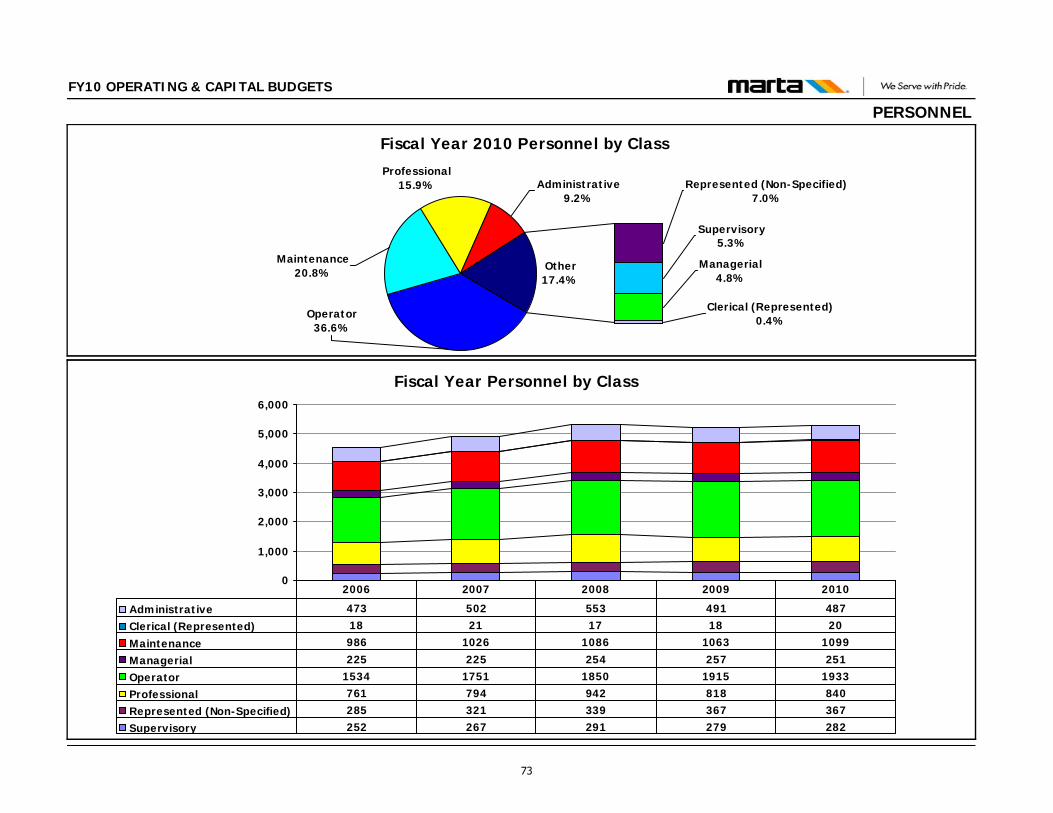
FY10 OPERATING & CAPITAL BUDGETS
PERSONNEL
Fiscal Year Personnel by Class
0
1,000
2,000
3,000
4,000
5,000
6,000
Administrative 473 502 553 491 487
Clerical (Represented) 18 21 17 18 20
Maintenance 986 1026 1086 1063 1099
Managerial 225 225 254 257 251
Operator 1534 1751 1850 1915 1933
Professional 761 794 942 818 840
Represented (Non-Specified) 285 321 339 367 367
Supervisory 252 267 291 279 282
2006 2007 2008 2009 2010
Fiscal Year 2010 Personnel by Class
Other17.4%
Clerical (Represented)0.4%
Managerial4.8%
Represented (Non-Specified)7.0%
Administrative9.2%
Supervisory5.3%
Professional15.9%
Operator36.6%
Maintenance20.8%
73
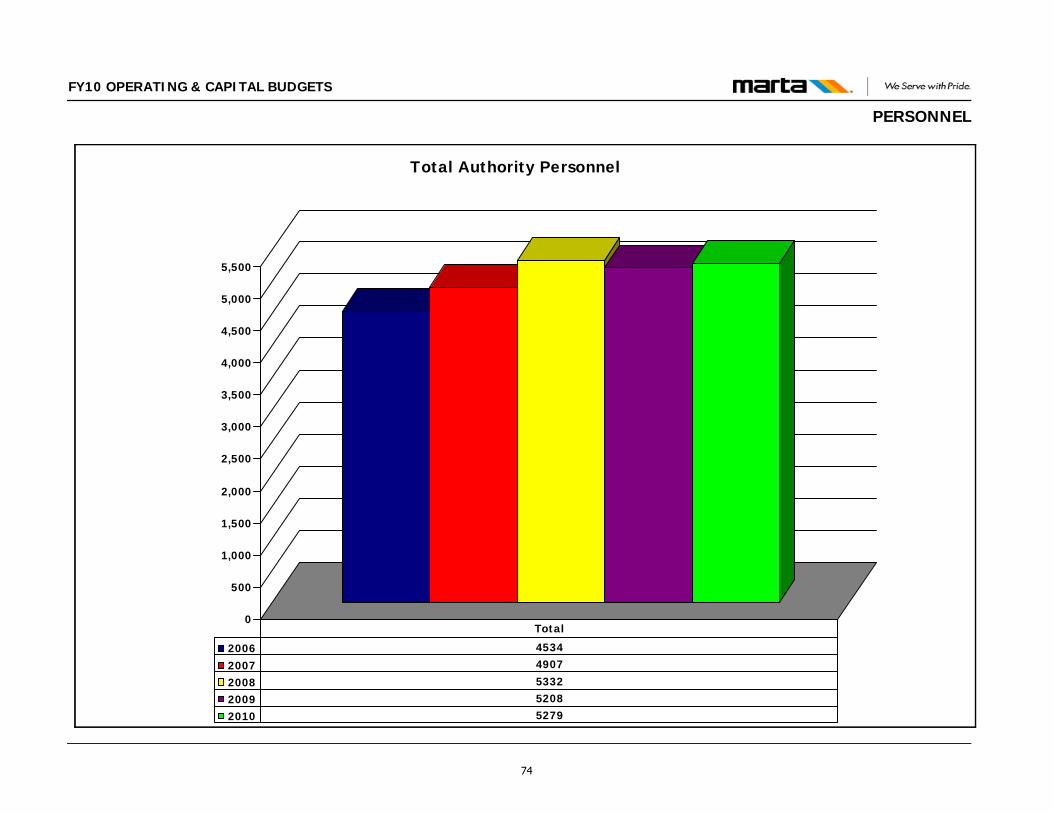
FY10 OPERATING & CAPITAL BUDGETS
PERSONNEL
0
500
1,000
1,500
2,000
2,500
3,000
3,500
4,000
4,500
5,000
5,500
Total Authority Personnel
2006 4534
2007 4907
2008 5332
2009 5208
2010 5279
Total
74
DIVISION OF THE GENERAL MANAGER/CEO This Division includes the following Departments: Department of the General Manager/CEO Department of Internal Audit Department of Legal Services Department of Planning Department of Communications & External Affairs
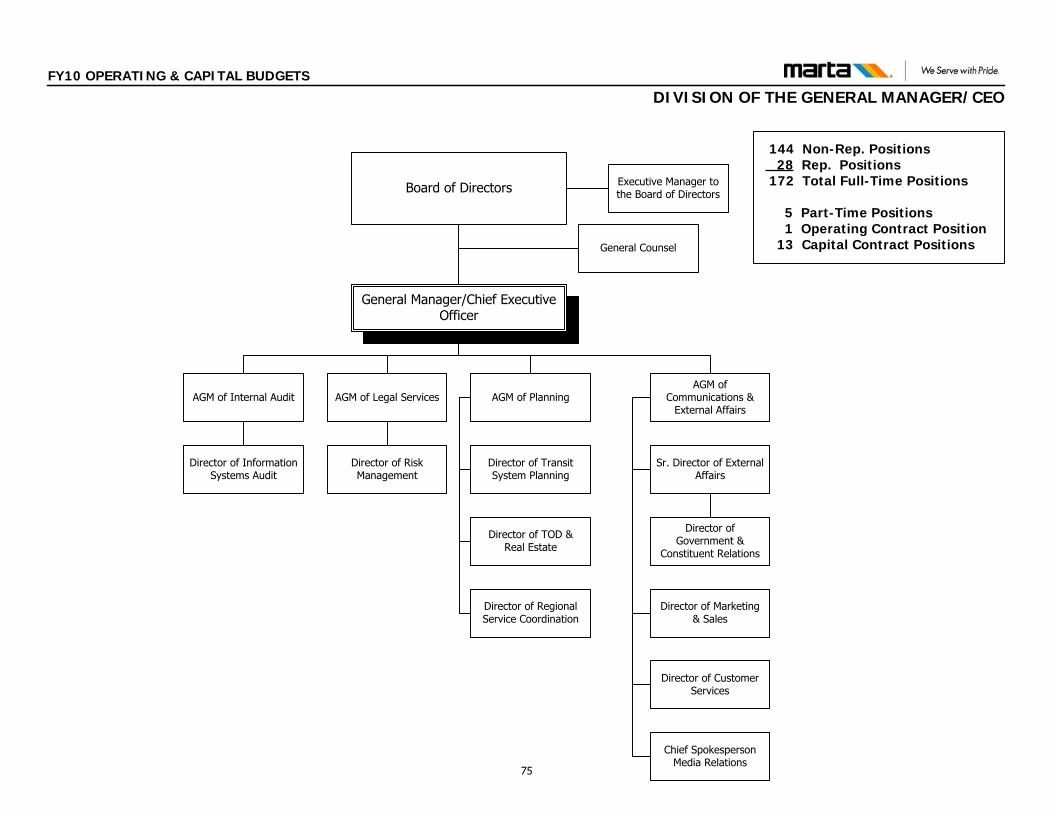
AGM of Internal Audit
General Manager/Chief Executive Officer
AGM of Communications &
External AffairsAGM of Legal Services AGM of Planning
Director of Information Systems Audit
Director of Risk Management
Director of Transit System Planning
Director of TOD & Real Estate
Sr. Director of External Affairs
Director of Marketing & Sales
Director of Customer Services
Chief Spokesperson Media Relations
Board of Directors
General Counsel
Executive Manager to the Board of Directors
Director of Government &
Constituent Relations
Director of Regional Service Coordination
144 Non-Rep. Positions 28 Rep. Positions
172 Total Full-Time Positions
5 Part-Time Positions 1 Operating Contract Position 13 Capital Contract Positions
FY10 OPERATING & CAPITAL BUDGETS
DIVISION OF THE GENERAL MANAGER/CEO
75
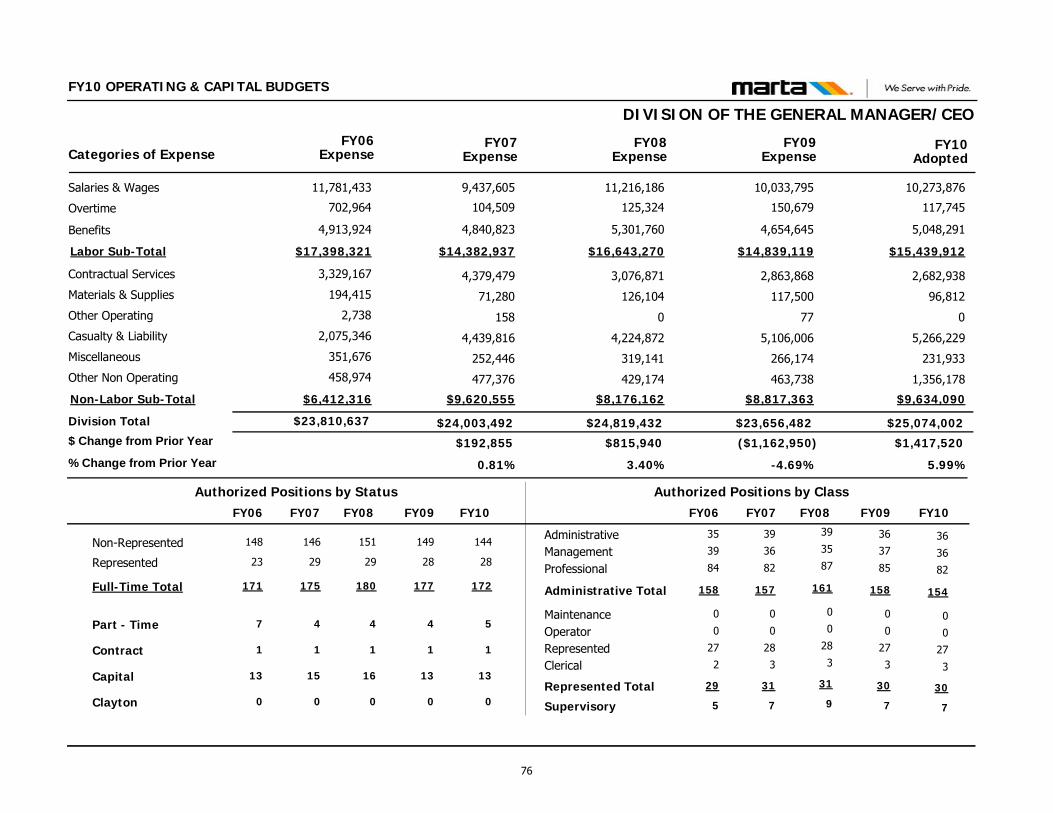
FY10 OPERATING & CAPITAL BUDGETS
DIVISION OF THE GENERAL MANAGER/CEO
$25,074,002$23,656,482
2,682,938
96,812
0
5,266,229
231,933
1,356,178
2,863,868
117,500
77
5,106,006
266,174
463,738
Contractual Services
Materials & Supplies
Other Operating
Casualty & Liability
Miscellaneous
Other Non Operating
Division Total
10,273,87610,033,795Salaries & Wages
117,745150,679Overtime
$15,439,912$14,839,119Labor Sub-Total
FY09 FY10Categories of Expense
$23,810,637
3,329,167
194,415
2,738
2,075,346
351,676
458,974
11,781,433
702,964
$17,398,321
FY06
$24,003,492
4,379,479
71,280
158
4,439,816
252,446
477,376
9,437,605
104,509
$14,382,937
FY07Expense Expense Expense Adopted
$1,417,520($1,162,950)$192,855
5.99%-4.69%0.81%
$ Change from Prior Year
% Change from Prior Year
$24,819,432
3,076,871
126,104
0
4,224,872
319,141
429,174
11,216,186
125,324
$16,643,270
FY08Expense
$815,940
3.40%
5,048,2914,654,645Benefits 4,913,924 4,840,823 5,301,760
$9,634,090$8,817,363Non-Labor Sub-Total $6,412,316 $9,620,555 $8,176,162
Administrative
Clerical
Management
MaintenanceOperator
Professional
Represented
Supervisory
39 36
3 3
35 37
0 00 0
87 85
28 27
9 7
36
3
36
0
0
82
27
7
Non-Represented 151 149 144
Part - Time 4 4 5
Represented 29 28 28
Full-Time Total 180 177 172
Contract 1 1 1
Capital 16 13 13
Authorized Positions by Class
Administrative Total 161 158 154
Authorized Positions by Status
Represented Total 31 30 30
39
3
36
0
0
82
28
7
146
4
29
175
1
15
157
31
35
2
39
0
0
84
27
5
148
7
23
171
1
13
158
29
FY09FY08 FY10FY07FY06 FY09FY08 FY10FY07FY06
Clayton 0 0 000
76
DEPARTMENT OF THE GENERAL MANAGER/CEO This Department includes the following Offices: Department of the General Manager/CEO Office of the General Manager/CEO Office of the Board of Directors
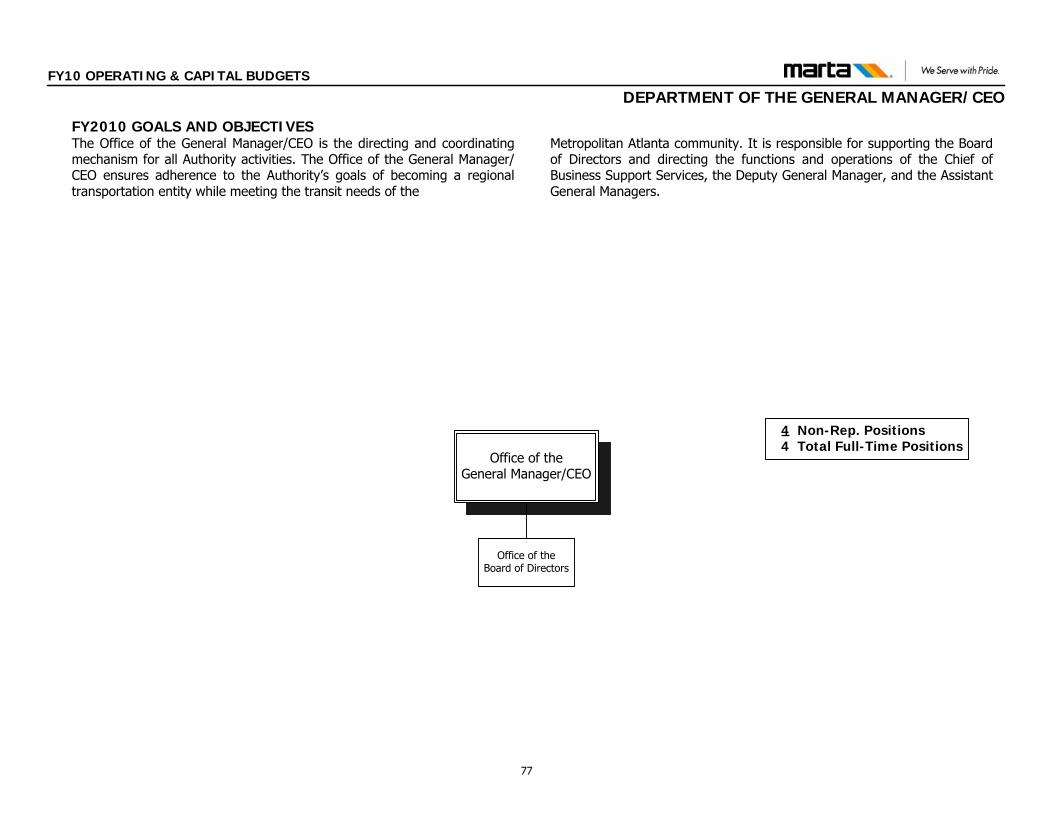
4 Non-Rep. Positions 4 Total Full-Time Positions
Office of the General Manager/CEO
Office of the Board of Directors
FY10 OPERATING & CAPITAL BUDGETS
DEPARTMENT OF THE GENERAL MANAGER/CEO
FY2010 GOALS AND OBJECTIVESThe Office of the General Manager/CEO is the directing and coordinating mechanism for all Authority activities. The Office of the General Manager/CEO ensures adherence to the Authority’s goals of becoming a regional transportation entity while meeting the transit needs of the
Metropolitan Atlanta community. It is responsible for supporting the Board of Directors and directing the functions and operations of the Chief of Business Support Services, the Deputy General Manager, and the Assistant General Managers.
77
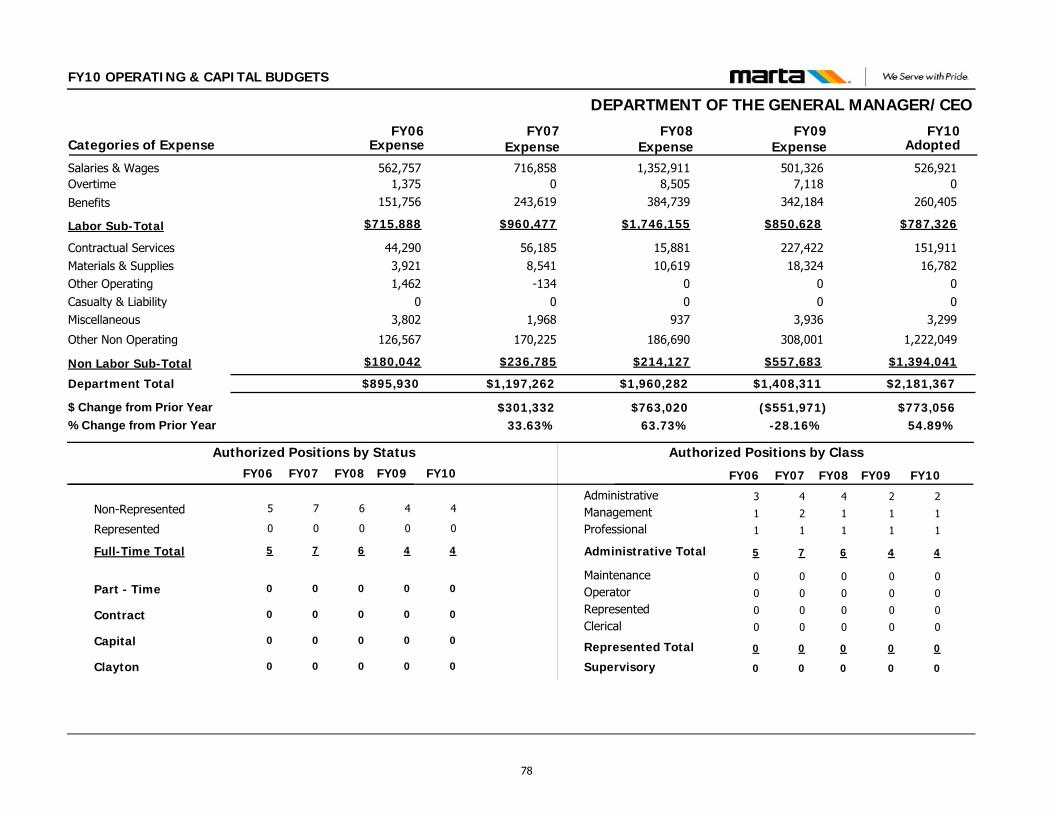
FY10 OPERATING & CAPITAL BUDGETS
DEPARTMENT OF THE GENERAL MANAGER/CEO
$2,181,367$1,408,311
151,91116,782
00
3,299
1,222,049
227,42218,324
00
3,936
308,001
Contractual ServicesMaterials & SuppliesOther OperatingCasualty & LiabilityMiscellaneous
Other Non Operating
Department Total
526,921501,326Salaries & Wages07,118Overtime
$787,326$850,628Labor Sub-Total
FY09 FY10Categories of Expense
$895,930
44,2903,9211,462
03,802
126,567
562,7571,375
$715,888
FY06
$1,197,262
56,1858,541-134
01,968
170,225
716,8580
$960,477
FY07Expense Expense Expense Adopted
$773,056($551,971)$301,33254.89%-28.16%33.63%
$ Change from Prior Year% Change from Prior Year
$1,960,282
15,88110,619
00
937
186,690
1,352,9118,505
$1,746,155
FY08Expense
$763,02063.73%
$1,394,041$557,683Non Labor Sub-Total $180,042 $236,785 $214,127
260,405342,184Benefits 151,756 243,619 384,739
Administrative
Clerical
Management
MaintenanceOperator
Professional
Represented
Supervisory
2
0
1
0
0
1
0
0
2
0
1
0
0
1
0
0
Non-Represented 4 4
Part - Time 0 0
Represented 0 0
Full-Time Total 4 4
Contract 0 0
Capital 0 0
Authorized Positions by Class
Administrative Total 4 4
Authorized Positions by Status
Represented Total 0 0
4
0
2
0
0
1
0
0
7
0
0
7
0
0
7
0
3
0
1
0
0
1
0
0
5
0
0
5
0
0
5
0
FY10FY09 FY07FY06 FY10FY09 FY07FY06
Clayton 0 000
6
0
0
6
0
0
FY08
0
4
0
1
0
0
1
0
0
6
0
FY08
78
FY10 OPERATING & CAPITAL BUDGETS
OFFICE OF THE GENERAL MANAGER/CEO FUNCTIONS & RESPONSBILITIES The Office of the General Manager/CEO is the directing and coordinating mechanism for all Authority activities. It is responsible for supporting the Board of Directors and directing the functions and operations of the Assistant General Managers. The Office of the General Manager/CEO ensures adherence to the Authority’s goals of becoming a regional transportation entity while meeting the transit needs of the Metropolitan Atlanta community. This office oversees the following departments: The Department of Internal Audit is an independent appraisal function responsible for assisting the Board of Directors, Authority management, and related governmental entities by furnishing them with objective analyses, appraisals, recommendations, and pertinent comments concerning the activities under audit. The goal of the department is to assist the Board of Directors and MARTA’s senior management team in the effective management of responsibilities.
The Department of Legal provides legal advice and support to the Authority’s Board of Directors and staff units. It also encompasses the area of Risk Management. The Department of Planning is responsible for developing and implementing the Authority’s external stakeholder relations. It encompasses the offices of Transit System Planning, Regional Service Coordination & Special Projects and Transit Oriented Development. The Department of Communications is responsible for the development and dissemination of timely and consistent messages and information to both internal and external audiences. In addition, the department oversees the training and deployment of customer service staff throughout the system and is responsible for increasing ridership through strategic marketing initiatives. It encompasses the offices of External Affairs, Government & Community Relations, Marketing & Sales, Media Relations and Customer & Station Services.
79

FY10 OPERATING & CAPITAL BUDGETS
OFFICE OF THE GENERAL MANAGER/CEO
$1,705,884$1,023,637
149,39012,053
00
83
1,082,755
225,57214,253
00
32
155,269
Contractual ServicesMaterials & SuppliesOther OperatingCasualty & LiabilityMiscellaneous
Other Non Operating
Office Total
308,942345,817Salaries & Wages07,118Overtime
$461,603$628,511Labor Sub-Total
FY09 FY10Categories of Expense
$628,902
23,7631,3821,462
00
16,298
468,0581,375
$585,997
FY06
$848,915
36,1852,208-134
00
10,588
607,8630
$800,068
FY07Expense Expense Expense Adopted
$682,247($596,377)$220,01366.65%-36.81%34.98%
$ Change from Prior Year% Change from Prior Year
$1,620,014
15,8817,786
00
12
45,005
1,218,5098,505
$1,551,330
FY08Expense
$771,09990.83%
$1,244,281$395,126Non Labor Sub-Total $42,905 $48,847 $68,684
152,660275,576Benefits 116,564 192,205 324,316
Administrative
Clerical
Management
MaintenanceOperator
Professional
Represented
Supervisory
0
0
1
0
0
0
0
0
0
0
1
0
0
0
0
0
Non-Represented 1 1
Part - Time 0 0
Represented 0 0
Full-Time Total 1 1
Contract 0 0
Capital 0 0
Authorized Positions by Class
Administrative Total 1 1
Authorized Positions by Status
Represented Total 0 0
2
0
2
0
0
1
0
0
5
0
0
5
0
0
5
0
1
0
1
0
0
1
0
0
3
0
0
3
0
0
3
0
FY10FY09 FY07FY06 FY10FY09 FY07FY06
Clayton 0 000
4
0
0
4
0
0
FY08
0
2
0
1
0
0
1
0
0
4
0
FY08
80
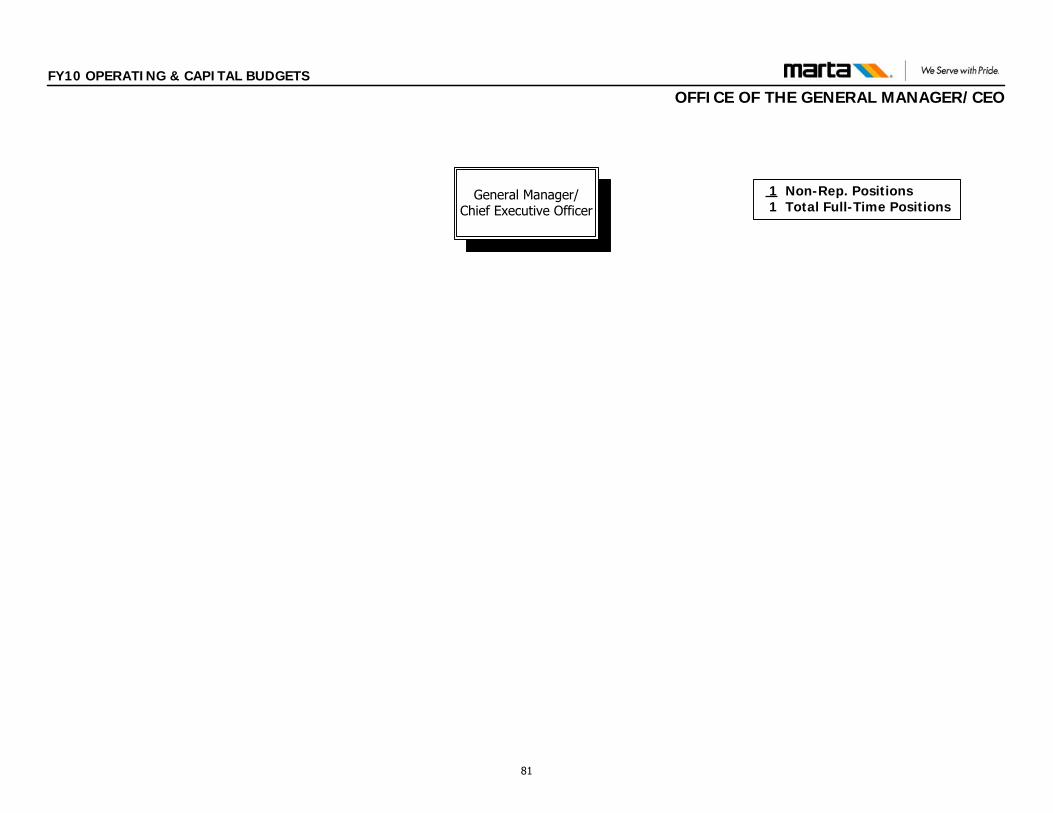
General Manager/Chief Executive Officer
1 Non-Rep. Positions 1 Total Full-Time Positions
FY10 OPERATING & CAPITAL BUDGETS
OFFICE OF THE GENERAL MANAGER/CEO
81
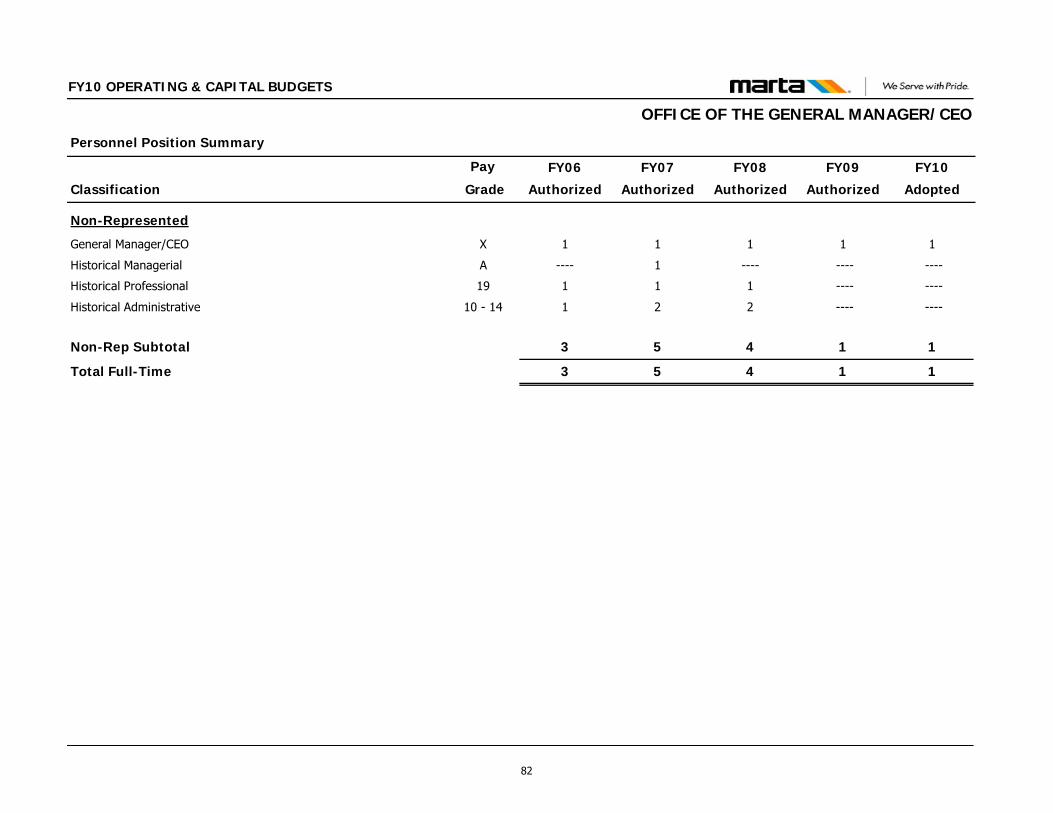
Classification
Personnel Position Summary
Pay FY09
Authorized
FY10
Adopted
FY10 OPERATING & CAPITAL BUDGETS
FY08
Authorized
FY07
Authorized
FY06
Authorized Grade
OFFICE OF THE GENERAL MANAGER/CEO
Non-Represented
General Manager/CEO X 1 1111
Historical Managerial A ---- --------1----
Historical Professional 19 ---- ----111
Historical Administrative 10 - 14 ---- ----221
Non-Rep Subtotal 1 1453
Total Full-Time 1 1453
82
FY10 OPERATING & CAPITAL BUDGETS
OFFICE OF THE BOARD OF DIRECTORS FUNCTIONS AND RESPONSIBILITIES The Office of the Board of Directors serves as the primary liaison between MARTA staff and MARTA Board of Directors. This Office coordinates the various Board related meetings, travel, events and activities. The dissemination of information for and from the Board of Directors is
primarily channeled through this office. Minutes, resolutions and statistics associated with the various Board Committee sessions and the General Board meetings are managed through this office. The office provides oversight and facilitation to every office within MARTA that submits a Board Resolution request.
83

FY10 OPERATING & CAPITAL BUDGETS
OFFICE OF THE BOARD OF DIRECTORS
$475,483$384,674
2,5214,729
00
3,216
139,294
1,8504,071
00
3,904
152,732
Contractual ServicesMaterials & SuppliesOther OperatingCasualty & LiabilityMiscellaneous
Other Non Operating
Office Total
217,979155,509Salaries & Wages00Overtime
$325,723$222,117Labor Sub-Total
FY09 FY10Categories of Expense
$267,028
20,5272,539
00
3,802
110,269
94,6990
$129,891
FY06
$348,347
20,0006,333
00
1,968
159,637
108,9950
$160,409
FY07Expense Expense Expense Adopted
$90,809$44,406$81,31923.61%13.05%30.45%
$ Change from Prior Year% Change from Prior Year
$340,268
02,833
00
925
141,685
134,4020
$194,825
FY08Expense
($8,079)-2.32%
$149,760$162,557Non Labor Sub-Total $137,137 $187,938 $145,443
107,74466,608Benefits 35,192 51,414 60,423
Administrative
Clerical
Management
MaintenanceOperator
Professional
Represented
Supervisory
2
0
0
0
0
1
0
0
2
0
0
0
0
1
0
0
Non-Represented 3 3
Part - Time 0 0
Represented 0 0
Full-Time Total 3 3
Contract 0 0
Capital 0 0
Authorized Positions by Class
Administrative Total 3 3
Authorized Positions by Status
Represented Total 0 0
2
0
0
0
0
0
0
0
2
0
0
2
0
0
2
0
2
0
0
0
0
0
0
0
2
0
0
2
0
0
2
0
FY10FY09 FY07FY06 FY10FY09 FY07FY06
Clayton 0 000
2
0
0
2
0
0
FY08
0
2
0
0
0
0
0
0
0
2
0
FY08
84
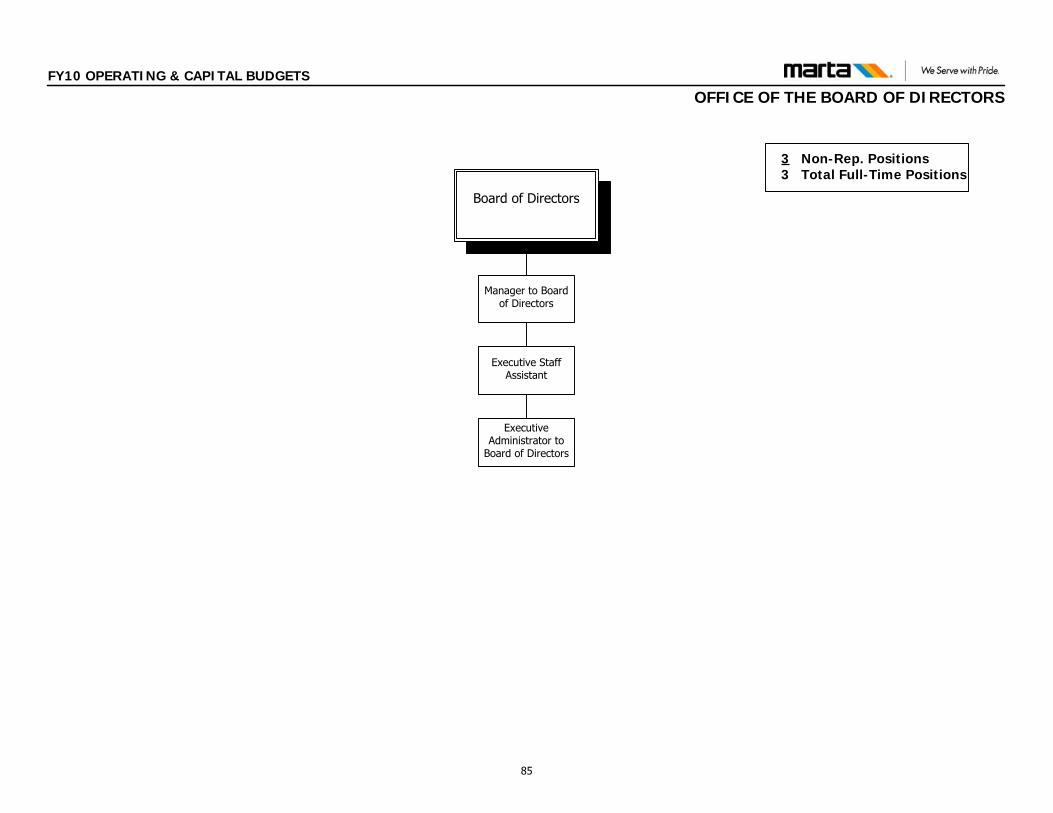
Executive Staff Assistant
Board of Directors
Executive Administrator to
Board of Directors
Manager to Board of Directors
3 Non-Rep. Positions 3 Total Full-Time Positions
FY10 OPERATING & CAPITAL BUDGETS
OFFICE OF THE BOARD OF DIRECTORS
85
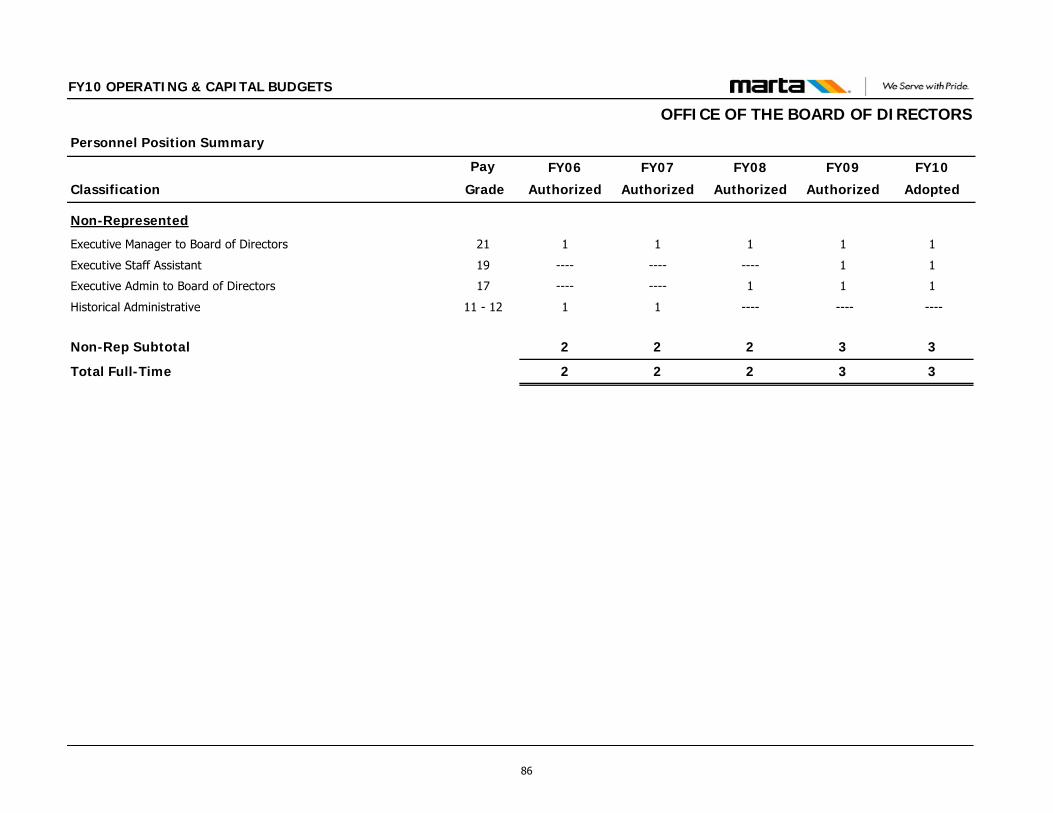
Classification
Personnel Position Summary
Pay FY09
Authorized
FY10
Adopted
FY10 OPERATING & CAPITAL BUDGETS
FY08
Authorized
FY07
Authorized
FY06
Authorized Grade
OFFICE OF THE BOARD OF DIRECTORS
Non-Represented
Executive Manager to Board of Directors 21 1 1111
Executive Staff Assistant 19 1 1------------
Executive Admin to Board of Directors 17 1 11--------
Historical Administrative 11 - 12 ---- --------11
Non-Rep Subtotal 3 3222
Total Full-Time 3 3222
86
DEPARTMENT OF INTERNAL AUDIT This Department includes the following Office: Department of Internal Audit Office of the AGM of Internal Audit Office of Information Systems Audit
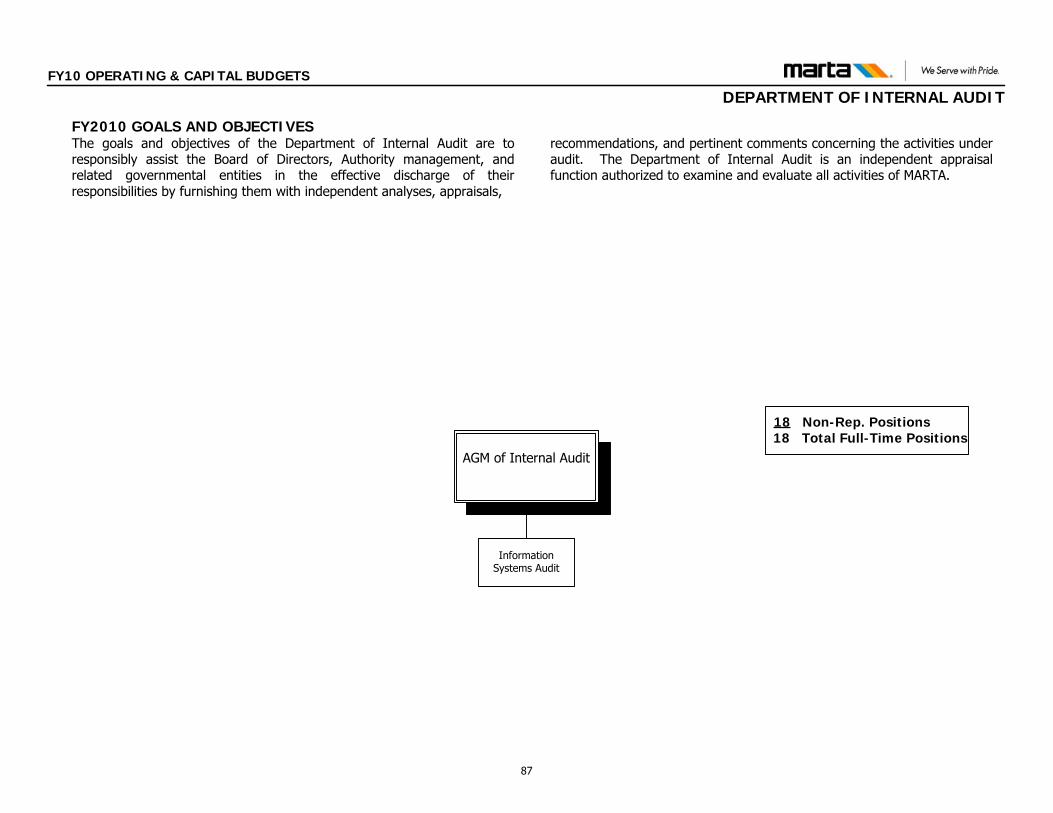
AGM of Internal Audit
18 Non-Rep. Positions 18 Total Full-Time Positions
Information Systems Audit
FY10 OPERATING & CAPITAL BUDGETS
DEPARTMENT OF INTERNAL AUDIT
FY2010 GOALS AND OBJECTIVESThe goals and objectives of the Department of Internal Audit are to responsibly assist the Board of Directors, Authority management, and related governmental entities in the effective discharge of their responsibilities by furnishing them with independent analyses, appraisals,
recommendations, and pertinent comments concerning the activities under audit. The Department of Internal Audit is an independent appraisal function authorized to examine and evaluate all activities of MARTA.
87
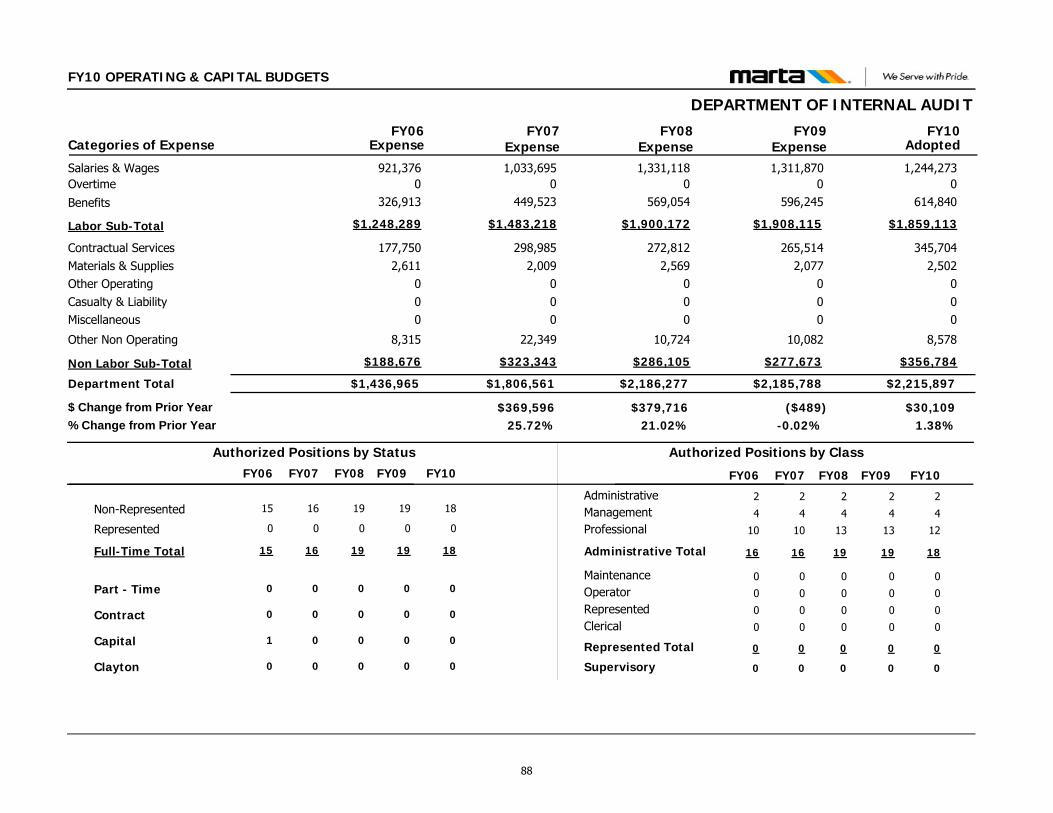
FY10 OPERATING & CAPITAL BUDGETS
DEPARTMENT OF INTERNAL AUDIT
$2,215,897$2,185,788
345,7042,502
000
8,578
265,5142,077
000
10,082
Contractual ServicesMaterials & SuppliesOther OperatingCasualty & LiabilityMiscellaneous
Other Non Operating
Department Total
1,244,2731,311,870Salaries & Wages00Overtime
$1,859,113$1,908,115Labor Sub-Total
FY09 FY10Categories of Expense
$1,436,965
177,7502,611
000
8,315
921,3760
$1,248,289
FY06
$1,806,561
298,9852,009
000
22,349
1,033,6950
$1,483,218
FY07Expense Expense Expense Adopted
$30,109($489)$369,5961.38%-0.02%25.72%
$ Change from Prior Year% Change from Prior Year
$2,186,277
272,8122,569
000
10,724
1,331,1180
$1,900,172
FY08Expense
$379,71621.02%
$356,784$277,673Non Labor Sub-Total $188,676 $323,343 $286,105
614,840596,245Benefits 326,913 449,523 569,054
Administrative
Clerical
Management
MaintenanceOperator
Professional
Represented
Supervisory
2
0
4
0
0
13
0
0
2
0
4
0
0
12
0
0
Non-Represented 19 18
Part - Time 0 0
Represented 0 0
Full-Time Total 19 18
Contract 0 0
Capital 0 0
Authorized Positions by Class
Administrative Total 19 18
Authorized Positions by Status
Represented Total 0 0
2
0
4
0
0
10
0
0
16
0
0
16
0
0
16
0
2
0
4
0
0
10
0
0
15
0
0
15
0
1
16
0
FY10FY09 FY07FY06 FY10FY09 FY07FY06
Clayton 0 000
19
0
0
19
0
0
FY08
0
2
0
4
0
0
13
0
0
19
0
FY08
88
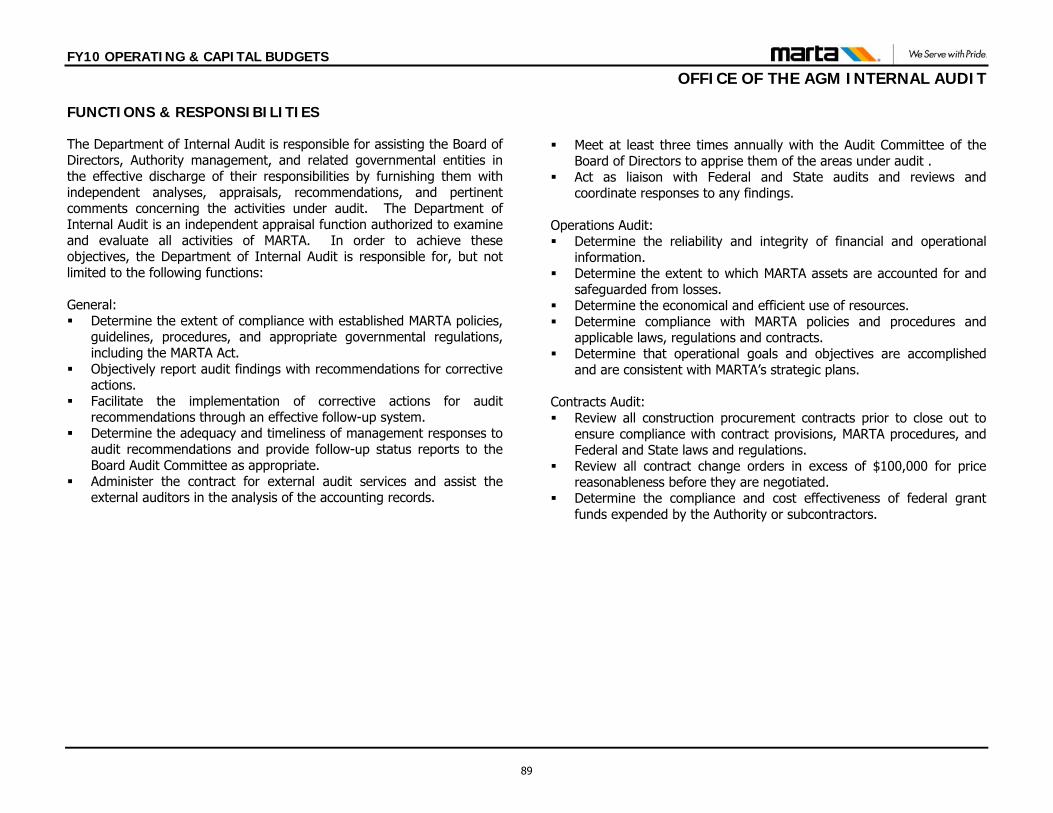
FY10 OPERATING & CAPITAL BUDGETS
OFFICE OF THE AGM INTERNAL AUDIT FUNCTIONS & RESPONSIBILITIES The Department of Internal Audit is responsible for assisting the Board of Directors, Authority management, and related governmental entities in the effective discharge of their responsibilities by furnishing them with independent analyses, appraisals, recommendations, and pertinent comments concerning the activities under audit. The Department of Internal Audit is an independent appraisal function authorized to examine and evaluate all activities of MARTA. In order to achieve these objectives, the Department of Internal Audit is responsible for, but not limited to the following functions: General: Determine the extent of compliance with established MARTA policies,
guidelines, procedures, and appropriate governmental regulations, including the MARTA Act.
Objectively report audit findings with recommendations for corrective actions.
Facilitate the implementation of corrective actions for audit recommendations through an effective follow-up system.
Determine the adequacy and timeliness of management responses to audit recommendations and provide follow-up status reports to the Board Audit Committee as appropriate.
Administer the contract for external audit services and assist the external auditors in the analysis of the accounting records.
Meet at least three times annually with the Audit Committee of the Board of Directors to apprise them of the areas under audit .
Act as liaison with Federal and State audits and reviews and coordinate responses to any findings.
Operations Audit: Determine the reliability and integrity of financial and operational
information. Determine the extent to which MARTA assets are accounted for and
safeguarded from losses. Determine the economical and efficient use of resources. Determine compliance with MARTA policies and procedures and
applicable laws, regulations and contracts. Determine that operational goals and objectives are accomplished
and are consistent with MARTA’s strategic plans. Contracts Audit: Review all construction procurement contracts prior to close out to
ensure compliance with contract provisions, MARTA procedures, and Federal and State laws and regulations.
Review all contract change orders in excess of $100,000 for price reasonableness before they are negotiated.
Determine the compliance and cost effectiveness of federal grant funds expended by the Authority or subcontractors.
89

FY10 OPERATING & CAPITAL BUDGETS
OFFICE OF THE AGM OF INTERNAL AUDIT
$1,736,403$1,661,992
345,7042,502
000
5,978
265,5142,077
000
7,867
Contractual ServicesMaterials & SuppliesOther OperatingCasualty & LiabilityMiscellaneous
Other Non Operating
Office Total
925,096959,607Salaries & Wages00Overtime
$1,382,219$1,386,534Labor Sub-Total
FY09 FY10Categories of Expense
$1,436,965
177,7502,611
000
8,315
921,3760
$1,248,289
FY06
$1,407,255
298,9852,009
000
22,040
747,4050
$1,084,221
FY07Expense Expense Expense Adopted
$74,411($77,546)($29,710)4.48%-4.46%-2.07%
$ Change from Prior Year% Change from Prior Year
$1,739,538
272,8122,569
000
9,488
1,022,5210
$1,454,669
FY08Expense
$332,28323.61%
$354,184$275,458Non Labor Sub-Total $188,676 $323,034 $284,869
457,123426,927Benefits 326,913 336,816 432,148
Administrative
Clerical
Management
MaintenanceOperator
Professional
Represented
Supervisory
2
0
3
0
0
10
0
0
2
0
3
0
0
9
0
0
Non-Represented 15 14
Part - Time 0 0
Represented 0 0
Full-Time Total 15 14
Contract 0 0
Capital 0 0
Authorized Positions by Class
Administrative Total 15 14
Authorized Positions by Status
Represented Total 0 0
2
0
3
0
0
8
0
0
13
0
0
13
0
0
13
0
2
0
4
0
0
8
0
0
13
0
0
13
0
1
14
0
FY10FY09 FY07FY06 FY10FY09 FY07FY06
Clayton 0 000
15
0
0
15
0
0
FY08
0
2
0
3
0
0
10
0
0
15
0
FY08
90
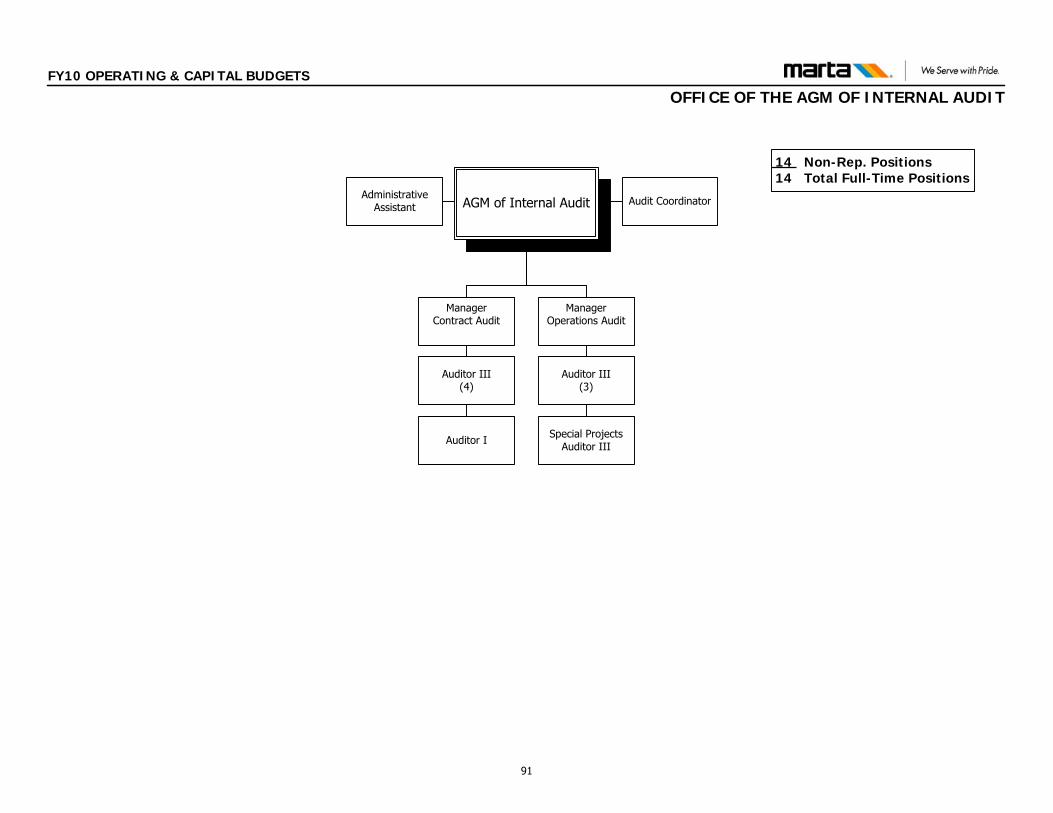
14 Non-Rep. Positions 14 Total Full-Time Positions
AGM of Internal Audit Audit Coordinator
Manager Contract Audit
ManagerOperations Audit
Auditor III(4)
Auditor III(3)
Administrative Assistant
Auditor I Special Projects Auditor III
FY10 OPERATING & CAPITAL BUDGETS
OFFICE OF THE AGM OF INTERNAL AUDIT
91
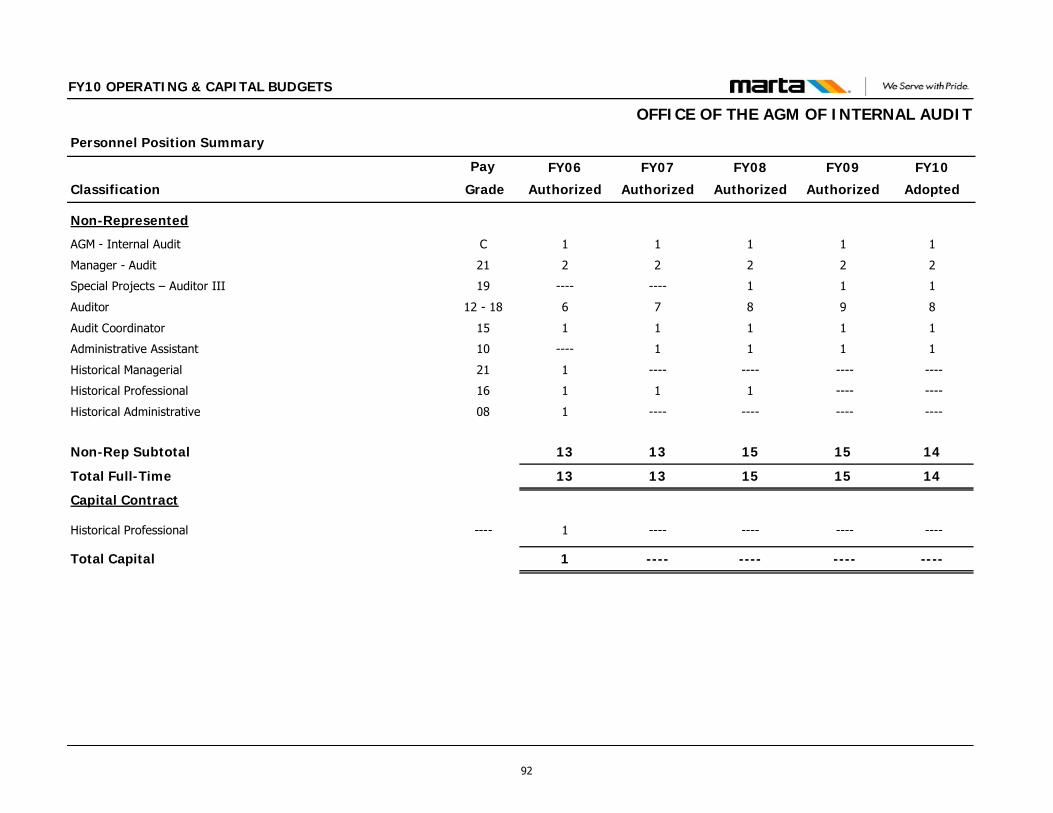
Classification
Personnel Position Summary
Pay FY09
Authorized
FY10
Adopted
FY10 OPERATING & CAPITAL BUDGETS
FY08
Authorized
FY07
Authorized
FY06
Authorized Grade
OFFICE OF THE AGM OF INTERNAL AUDIT
Non-Represented
AGM - Internal Audit C 1 1111
Manager - Audit 21 2 2222
Special Projects – Auditor III 19 1 11--------
Auditor 12 - 18 9 8876
Audit Coordinator 15 1 1111
Administrative Assistant 10 1 111----
Historical Managerial 21 ---- ------------1
Historical Professional 16 ---- ----111
Historical Administrative 08 ---- ------------1
Non-Rep Subtotal 15 14151313
Total Full-Time 15 14151313
Capital Contract
Historical Professional ---- ---- ------------1
Total Capital ---- ------------1
92
FY10 OPERATING & CAPITAL BUDGETS
OFFICE OF INFORMATION SYSTEMS AUDIT FUNCTIONS & RESPONSIBILITIES Information Systems Audit: Review the management and use of computer resources for
effectiveness and efficiency. Review and evaluate the adequacy of controls within the
computerized systems and operations.
Appraise the controls, economic values, and practicality of
applications systems under development. Determine the compliance to and effectiveness of data processing and security standards and procedures.
93
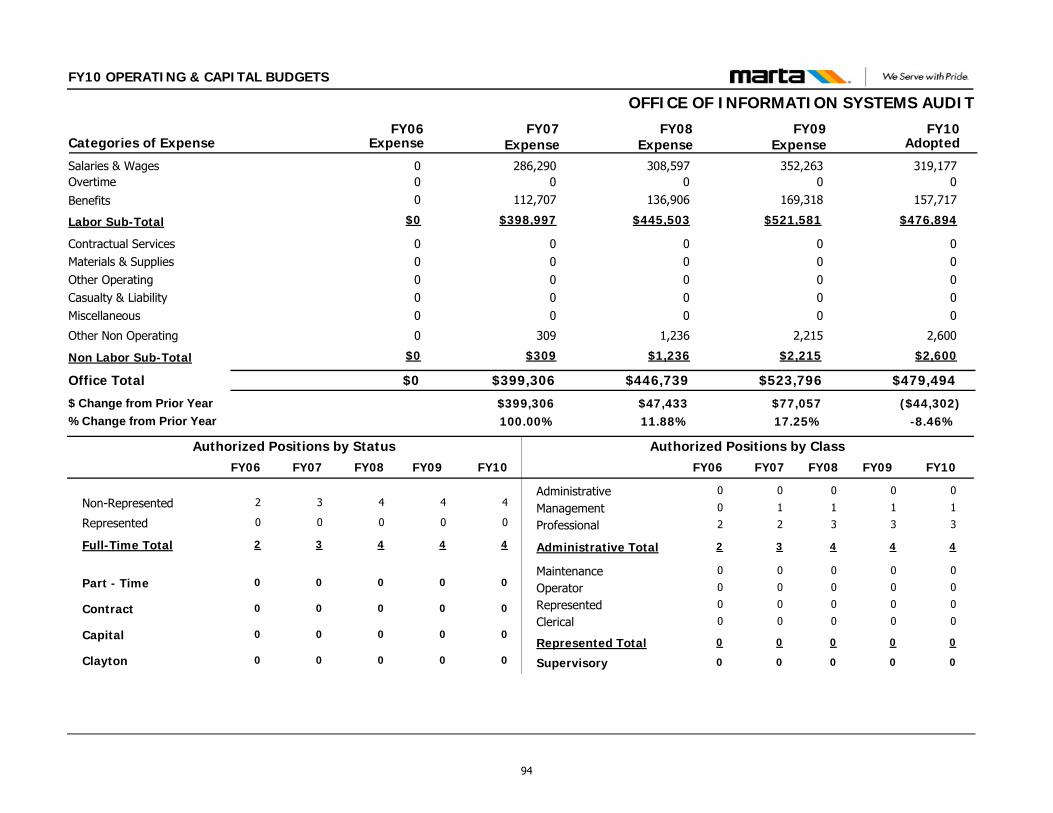
FY10 OPERATING & CAPITAL BUDGETS
OFFICE OF INFORMATION SYSTEMS AUDIT
$479,494$523,796
00000
2,600
00000
2,215
Contractual ServicesMaterials & SuppliesOther OperatingCasualty & LiabilityMiscellaneous
Other Non Operating
Office Total
319,177352,263Salaries & Wages00Overtime
$476,894$521,581Labor Sub-Total
FY09 FY10Categories of Expense
$0
00000
0
00
$0
FY06
$399,306
00000
309
286,2900
$398,997
FY07Expense Expense Expense Adopted
($44,302)$77,057$399,306-8.46%17.25%100.00%
$ Change from Prior Year% Change from Prior Year
$446,739
00000
1,236
308,5970
$445,503
FY08Expense
$47,43311.88%
$2,600$2,215Non Labor Sub-Total $0 $309 $1,236
157,717169,318Benefits 0 112,707 136,906
Administrative
Clerical
Management
MaintenanceOperator
Professional
Represented
Supervisory
0
0
1
0
0
3
0
0
0
0
1
0
0
3
0
0
Non-Represented 4 4
Part - Time 0 0
Represented 0 0
Full-Time Total 4 4
Contract 0 0
Capital 0 0
Authorized Positions by Class
Administrative Total 4 4
Authorized Positions by Status
Represented Total 0 0
0
0
1
0
0
2
0
0
3
0
0
3
0
0
3
0
0
0
0
0
0
2
0
0
2
0
0
2
0
0
2
0
FY10FY09 FY07FY06 FY10FY09 FY07FY06
Clayton 0 000
4
0
0
4
0
0
FY08
0
0
0
1
0
0
3
0
0
4
0
FY08
94
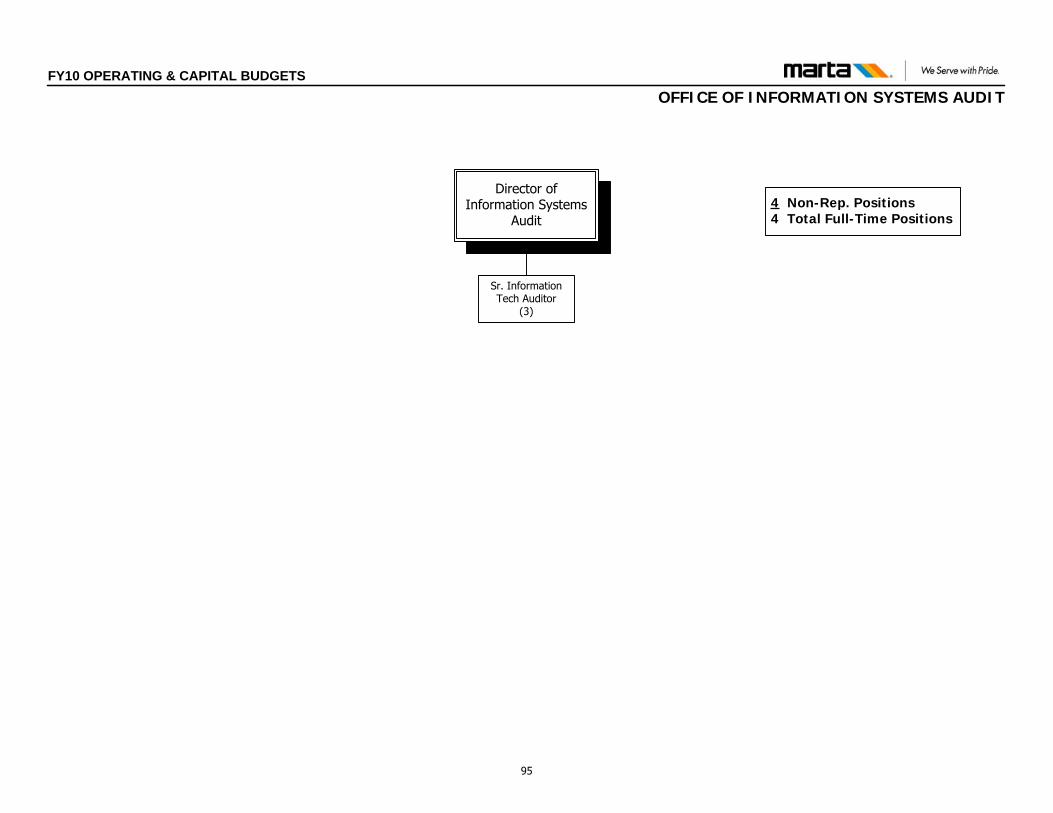
Director of Information Systems
Audit
Sr. Information Tech Auditor
(3)
4 Non-Rep. Positions4 Total Full-Time Positions
FY10 OPERATING & CAPITAL BUDGETSOFFICE OF INFORMATION SYSTEMS AUDIT
95
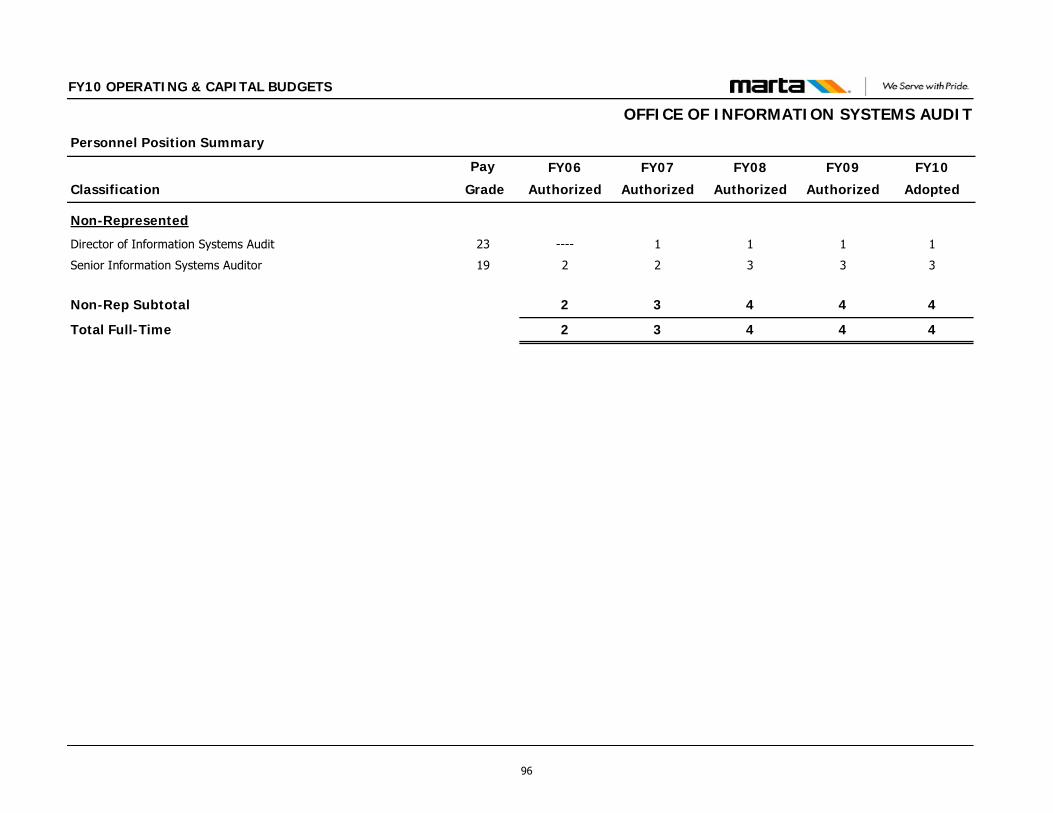
Classification
Personnel Position Summary
Pay FY09
Authorized
FY10
Adopted
FY10 OPERATING & CAPITAL BUDGETS
FY08
Authorized
FY07
Authorized
FY06
Authorized Grade
OFFICE OF INFORMATION SYSTEMS AUDIT
Non-Represented
Director of Information Systems Audit 23 1 111----
Senior Information Systems Auditor 19 3 3322
Non-Rep Subtotal 4 4432
Total Full-Time 4 4432
96
DEPARTMENT OF LEGAL SERVICES This Department includes the following Offices: Department of Legal Services Office of the AGM of Legal Services Office of Risk Management
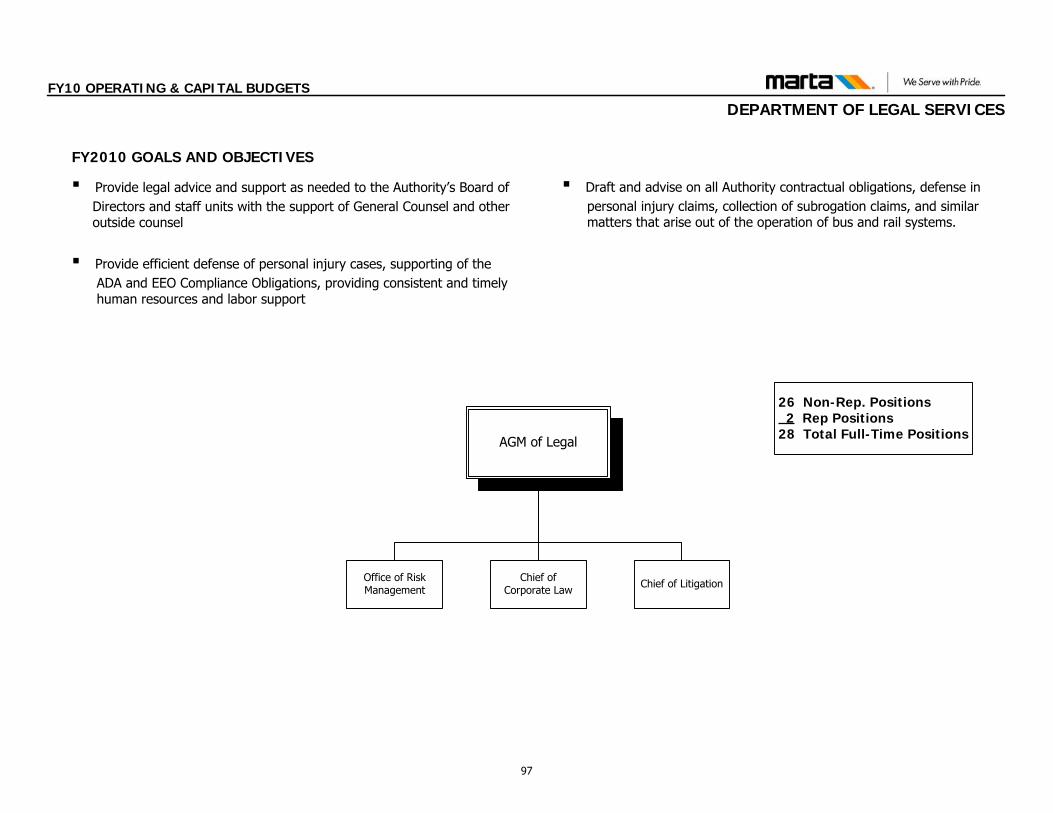
FY10 OPERATING & CAPITAL BUDGETS
DEPARTMENT OF LEGAL SERVICES
FY2010 GOALS AND OBJECTIVES
▪ Provide legal advice and support as needed to the Authority’s Board ofDirectors and staff units with the support of General Counsel and otheroutside counsel
▪ Provide efficient defense of personal injury cases, supporting of theADA and EEO Compliance Obligations, providing consistent and timelyhuman resources and labor support
▪ Draft and advise on all Authority contractual obligations, defense inpersonal injury claims, collection of subrogation claims, and similarmatters that arise out of the operation of bus and rail systems.
26 Non-Rep. Positions2 Rep Positions
28 Total Full-Time PositionsAGM of Legal
Chief of Corporate Law
Office of Risk Management Chief of Litigation
97
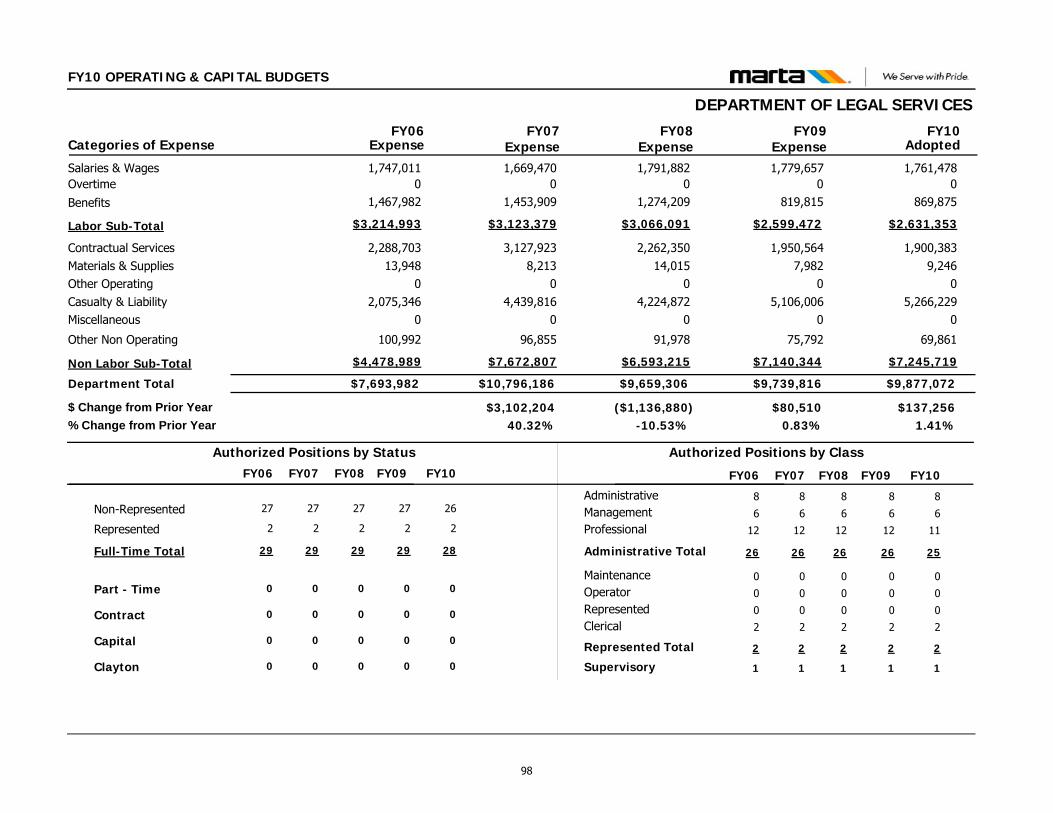
FY10 OPERATING & CAPITAL BUDGETS
DEPARTMENT OF LEGAL SERVICES
$9,877,072$9,739,816
1,900,3839,246
05,266,229
0
69,861
1,950,5647,982
05,106,006
0
75,792
Contractual ServicesMaterials & SuppliesOther OperatingCasualty & LiabilityMiscellaneous
Other Non Operating
Department Total
1,761,4781,779,657Salaries & Wages00Overtime
$2,631,353$2,599,472Labor Sub-Total
FY09 FY10Categories of Expense
$7,693,982
2,288,70313,948
02,075,346
0
100,992
1,747,0110
$3,214,993
FY06
$10,796,186
3,127,9238,213
04,439,816
0
96,855
1,669,4700
$3,123,379
FY07Expense Expense Expense Adopted
$137,256$80,510$3,102,2041.41%0.83%40.32%
$ Change from Prior Year% Change from Prior Year
$9,659,306
2,262,35014,015
04,224,872
0
91,978
1,791,8820
$3,066,091
FY08Expense
($1,136,880)-10.53%
$7,245,719$7,140,344Non Labor Sub-Total $4,478,989 $7,672,807 $6,593,215
869,875819,815Benefits 1,467,982 1,453,909 1,274,209
Administrative
Clerical
Management
MaintenanceOperator
Professional
Represented
Supervisory
8
2
6
0
0
12
0
1
8
2
6
0
0
11
0
1
Non-Represented 27 26
Part - Time 0 0
Represented 2 2
Full-Time Total 29 28
Contract 0 0
Capital 0 0
Authorized Positions by Class
Administrative Total 26 25
Authorized Positions by Status
Represented Total 2 2
8
2
6
0
0
12
0
1
27
0
2
29
0
0
26
2
8
2
6
0
0
12
0
1
27
0
2
29
0
0
26
2
FY10FY09 FY07FY06 FY10FY09 FY07FY06
Clayton 0 000
27
0
2
29
0
0
FY08
0
8
2
6
0
0
12
0
1
26
2
FY08
98
FY10 OPERATING & CAPITAL BUDGETS
OFFICE OF THE AGM OF LEGAL SERVICES FUNCTIONS & RESPONSIBILITIES The Office of Legal provides legal advice and support as needed to the Authority’s Board of Directors and staff units with the support of General Counsel and other outside counsel. The office provides general support for the Rail Program, including real estate acquisition and disposition, review and drafting of contract documents, advice and counsel with respect to contract award and administration, and legal representation of the Authority in the defense, negotiation, mediation, arbitration, and litigation of contract claims. Legal services is an integral part of the Authority’s Transit Oriented Development (TOD) negotiating team providing legal analysis of developer’s proposals and coordination efforts in reaching acceptable agreements.
The Office Legal Services along with outside counsel, provides representation of the Authority in defense of personal injury claims, collection of subrogation claims, employment issues, labor issues, contract negotiations, arbitration, litigation and similar matters arising out of the operation of the bus and rail systems. In addition, the Office provides legal services within the scope of contractual matters, Federal and State regulations and other legal matters.
99

FY10 OPERATING & CAPITAL BUDGETS
OFFICE OF THE AGM OF LEGAL SERVICES
$2,811,765$2,883,213
1,414,8363,985
000
59,013
1,516,2443,398
000
64,760
Contractual ServicesMaterials & SuppliesOther OperatingCasualty & LiabilityMiscellaneous
Other Non Operating
Office Total
892,777908,792Salaries & Wages00Overtime
$1,333,931$1,298,811Labor Sub-Total
FY09 FY10Categories of Expense
$3,340,150
2,027,5344,716
000
89,033
918,1760
$1,218,867
FY06
$3,928,208
2,669,1562,893
000
73,616
841,5490
$1,182,543
FY07Expense Expense Expense Adopted
($71,448)($177,891)$588,058-2.48%-5.81%17.61%
$ Change from Prior Year% Change from Prior Year
$3,061,104
1,711,7882,584
000
78,208
906,3220
$1,268,524
FY08Expense
($867,104)-22.07%
$1,477,834$1,584,402Non Labor Sub-Total $2,121,283 $2,745,665 $1,792,580
441,154390,019Benefits 300,691 340,994 362,202
Administrative
Clerical
Management
MaintenanceOperator
Professional
Represented
Supervisory
5
0
3
0
0
5
0
0
5
0
3
0
0
4
0
0
Non-Represented 13 12
Part - Time 0 0
Represented 0 0
Full-Time Total 13 12
Contract 0 0
Capital 0 0
Authorized Positions by Class
Administrative Total 13 12
Authorized Positions by Status
Represented Total 0 0
5
0
3
0
0
5
0
0
13
0
0
13
0
0
13
0
5
0
3
0
0
5
0
0
13
0
0
13
0
0
13
0
FY10FY09 FY07FY06 FY10FY09 FY07FY06
Clayton 0 000
13
0
0
13
0
0
FY08
0
5
0
3
0
0
5
0
0
13
0
FY08
100
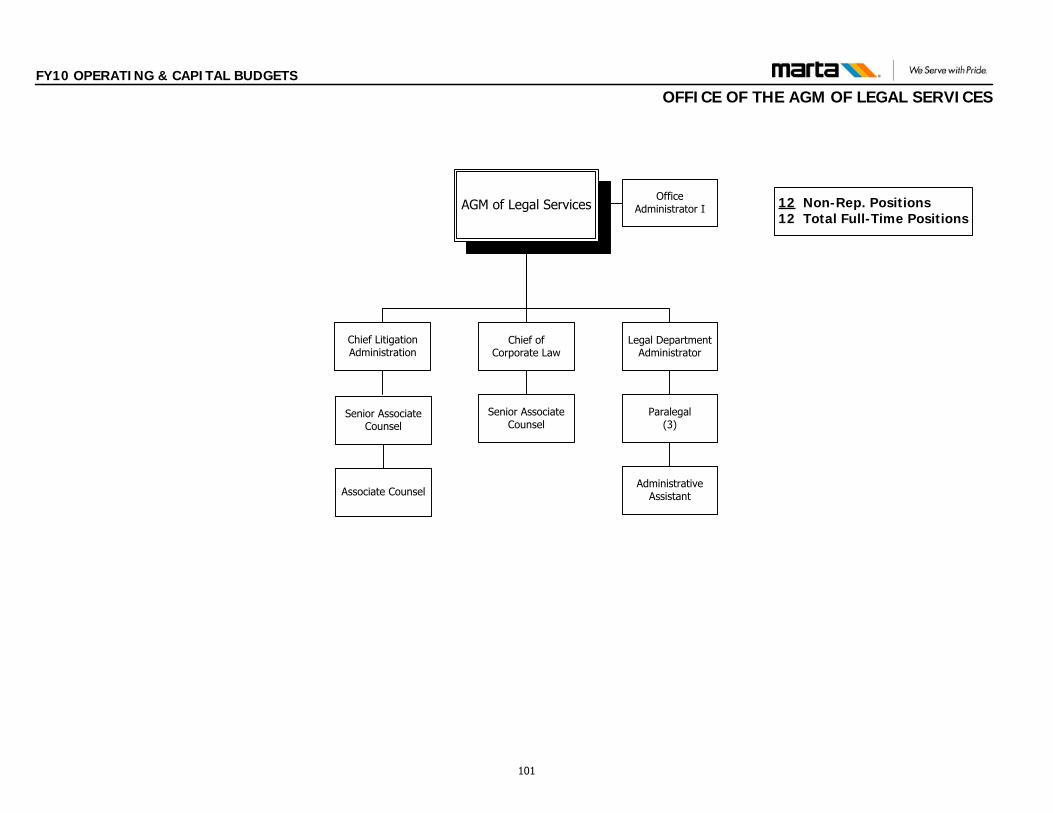
FY10 OPERATING & CAPITAL BUDGETS
OFFICE OF THE AGM OF LEGAL SERVICES
12 Non-Rep. Positions12 Total Full-Time Positions
AGM of Legal Services
Chief Litigation Administration
Legal Department Administrator
Senior Associate Counsel
Paralegal(3)
Administrative Assistant
Office Administrator I
Chief of Corporate Law
Senior Associate Counsel
Associate Counsel
101
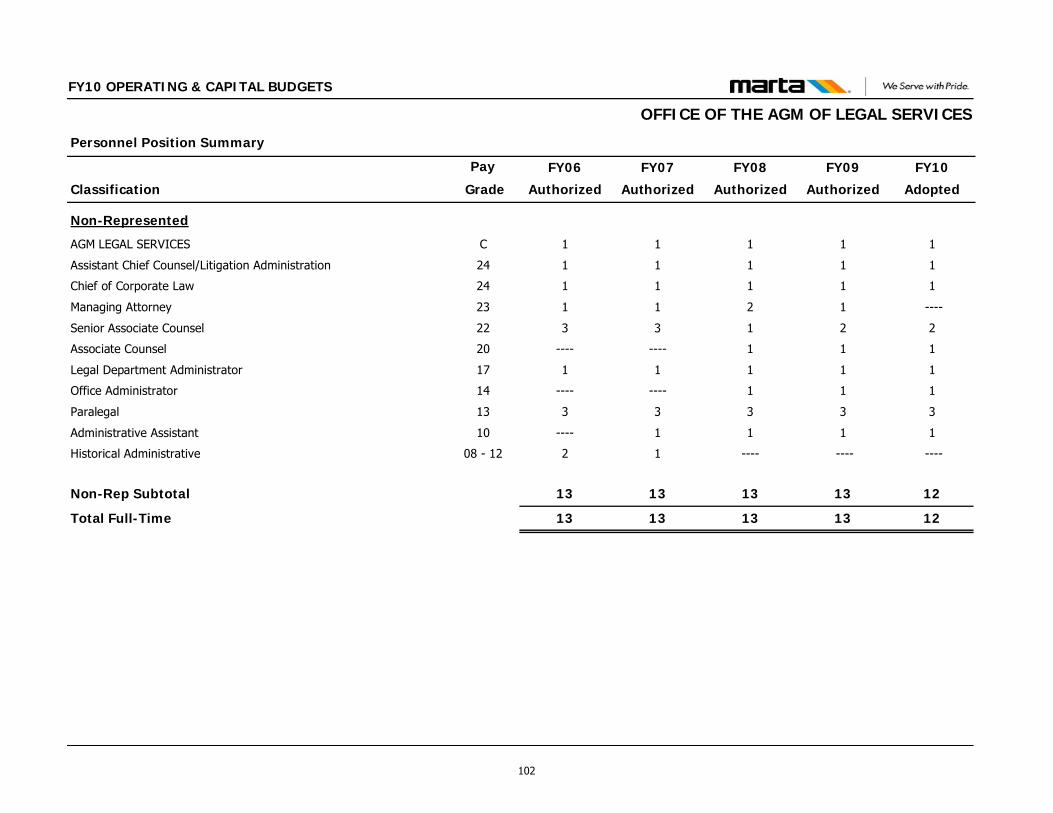
Classification
Personnel Position Summary
Pay FY09
Authorized
FY10
Adopted
FY10 OPERATING & CAPITAL BUDGETS
FY08
Authorized
FY07
Authorized
FY06
Authorized Grade
OFFICE OF THE AGM OF LEGAL SERVICES
Non-Represented
AGM LEGAL SERVICES C 1 1111
Assistant Chief Counsel/Litigation Administration 24 1 1111
Chief of Corporate Law 24 1 1111
Managing Attorney 23 1 ----211
Senior Associate Counsel 22 2 2133
Associate Counsel 20 1 11--------
Legal Department Administrator 17 1 1111
Office Administrator 14 1 11--------
Paralegal 13 3 3333
Administrative Assistant 10 1 111----
Historical Administrative 08 - 12 ---- --------12
Non-Rep Subtotal 13 12131313
Total Full-Time 13 12131313
102
FY10 OPERATING & CAPITAL BUDGETS
OFFICE OF RISK MANAGEMENT
FUNCTIONS & RESPONSIBILITIES The Office of Risk Management is responsible for protecting the Authority’s assets by the identification, analysis, elimination, reduction, assumption and funding of actual or potential losses. The Office of Risk Management also administers several claims functions under a self-administered plan of self-funded and insured programs. The Office processes, investigates, and adjusts property damage and personal injury claims incidental to MARTA’s bus and rail operations, as well as administers workers’ compensation claims. The Office of Risk Management is responsible for the Coordinated (Wrap-Up) Construction Insurance Program for all contractors and subcontractors working on capital construction projects. This Program also provides major safety programs for construction projects.
FY09 ACCOMPLISHMENTS Negotiated the renewal of the Excess Operations and Excess
Property insurance coverage for the Authority at extremely competitive costs. Realized premium savings of $ 181,664 for the 2009 policy year.
Received $ 125,000 return premium on the prior OCIP program
The Claims unit adjusted a total of 2,268 new claims filed against
the Authority. The Liability unit investigated and adjusted 1512 claims and closed 1469 Liability claims. The Workers’ Compensation claims unit investigated and adjusted 756 claims and closed 864 Workers’ Compensation claims.
Through aggressive pursuit of subrogation rights, recovered $
282,448 from adverse parties responsible for damage Authority property
103

FY10 OPERATING & CAPITAL BUDGETS
OFFICE OF RISK MANAGEMENT
$7,065,307$6,856,603
485,5475,261
05,266,229
0
10,848
434,3204,584
05,106,006
0
11,032
Contractual ServicesMaterials & SuppliesOther OperatingCasualty & LiabilityMiscellaneous
Other Non Operating
Office Total
868,701870,865Salaries & Wages00Overtime
$1,297,422$1,300,661Labor Sub-Total
FY09 FY10Categories of Expense
$4,353,832
261,1699,232
02,075,346
0
11,959
828,8350
$1,996,126
FY06
$6,867,978
458,7675,320
04,439,816
0
23,239
827,9210
$1,940,836
FY07Expense Expense Expense Adopted
$208,704$258,401$2,514,1463.04%3.92%57.75%
$ Change from Prior Year% Change from Prior Year
$6,598,202
550,56211,431
04,224,872
0
13,770
885,5600
$1,797,567
FY08Expense
($269,776)-3.93%
$5,767,885$5,555,942Non Labor Sub-Total $2,357,706 $4,927,142 $4,800,635
428,721429,796Benefits 1,167,291 1,112,915 912,007
Administrative
Clerical
Management
MaintenanceOperator
Professional
Represented
Supervisory
3
2
3
0
0
7
0
1
3
2
3
0
0
7
0
1
Non-Represented 14 14
Part - Time 0 0
Represented 2 2
Full-Time Total 16 16
Contract 0 0
Capital 0 0
Authorized Positions by Class
Administrative Total 13 13
Authorized Positions by Status
Represented Total 2 2
3
2
3
0
0
7
0
1
14
0
2
16
0
0
13
2
3
2
3
0
0
7
0
1
14
0
2
16
0
0
13
2
FY10FY09 FY07FY06 FY10FY09 FY07FY06
Clayton 0 000
14
0
2
16
0
0
FY08
0
3
2
3
0
0
7
0
1
13
2
FY08
104
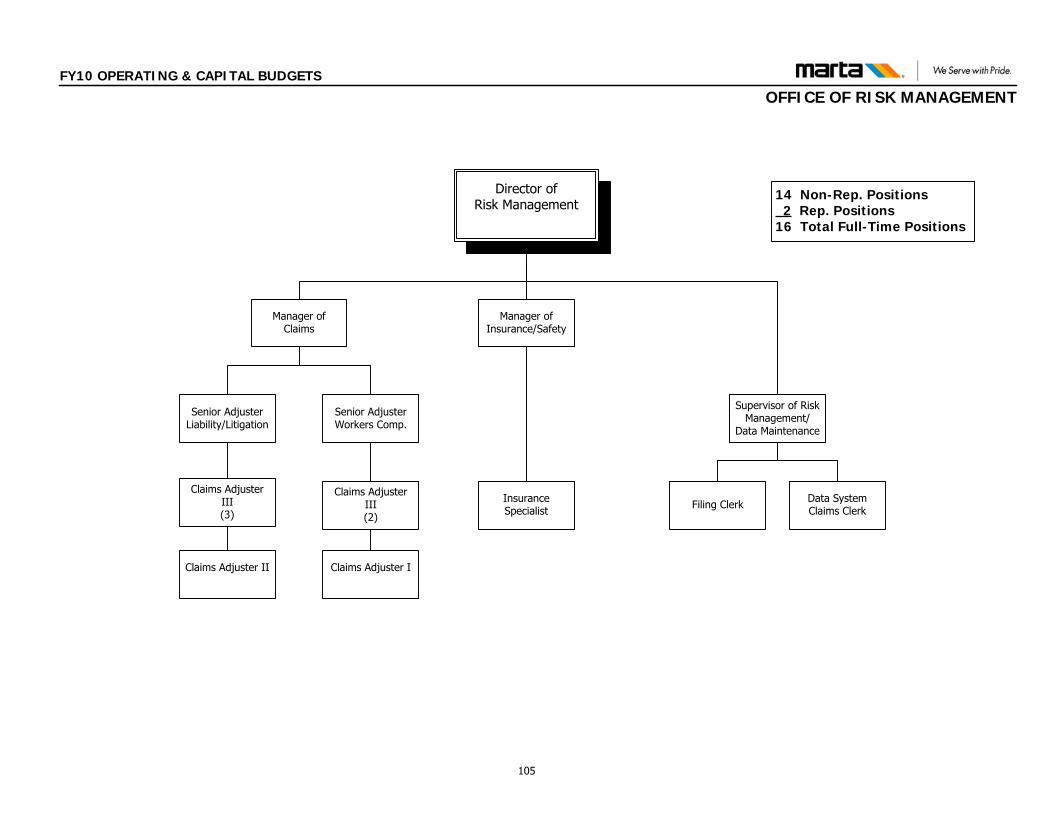
FY10 OPERATING & CAPITAL BUDGETS
OFFICE OF RISK MANAGEMENT
14 Non-Rep. Positions2 Rep. Positions
16 Total Full-Time Positions
Director of Risk Management
Supervisor of Risk Management/
Data Maintenance
Data System Claims ClerkFiling Clerk
Manager of Insurance/Safety
Insurance Specialist
Manager of Claims
Senior Adjuster Workers Comp.
Senior Adjuster Liability/Litigation
Claims Adjuster III(3)
Claims Adjuster III (2)
Claims Adjuster II Claims Adjuster I
105
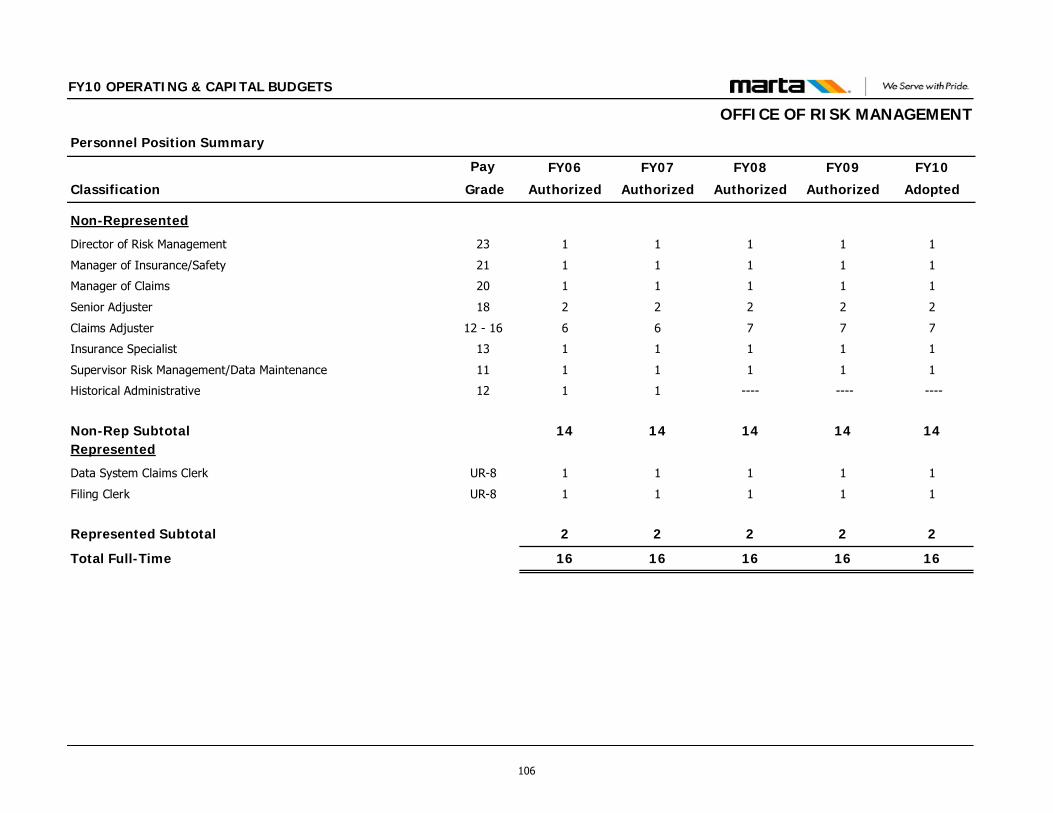
Classification
Personnel Position Summary
Pay FY09
Authorized
FY10
Adopted
FY10 OPERATING & CAPITAL BUDGETS
FY08
Authorized
FY07
Authorized
FY06
Authorized Grade
OFFICE OF RISK MANAGEMENT
Non-Represented
Director of Risk Management 23 1 1111
Manager of Insurance/Safety 21 1 1111
Manager of Claims 20 1 1111
Senior Adjuster 18 2 2222
Claims Adjuster 12 - 16 7 7766
Insurance Specialist 13 1 1111
Supervisor Risk Management/Data Maintenance 11 1 1111
Historical Administrative 12 ---- --------11
Non-Rep Subtotal 14 14141414Represented
Data System Claims Clerk UR-8 1 1111
Filing Clerk UR-8 1 1111
Represented Subtotal 2 2222
Total Full-Time 16 16161616
106
DEPARTMENT OF PLANNING This Department includes the following Offices: Department of Planning Office of the AGM of Planning Office of Transit Oriented Development Office of Transit System Planning Office of Regional Service Coordination & Special Projects
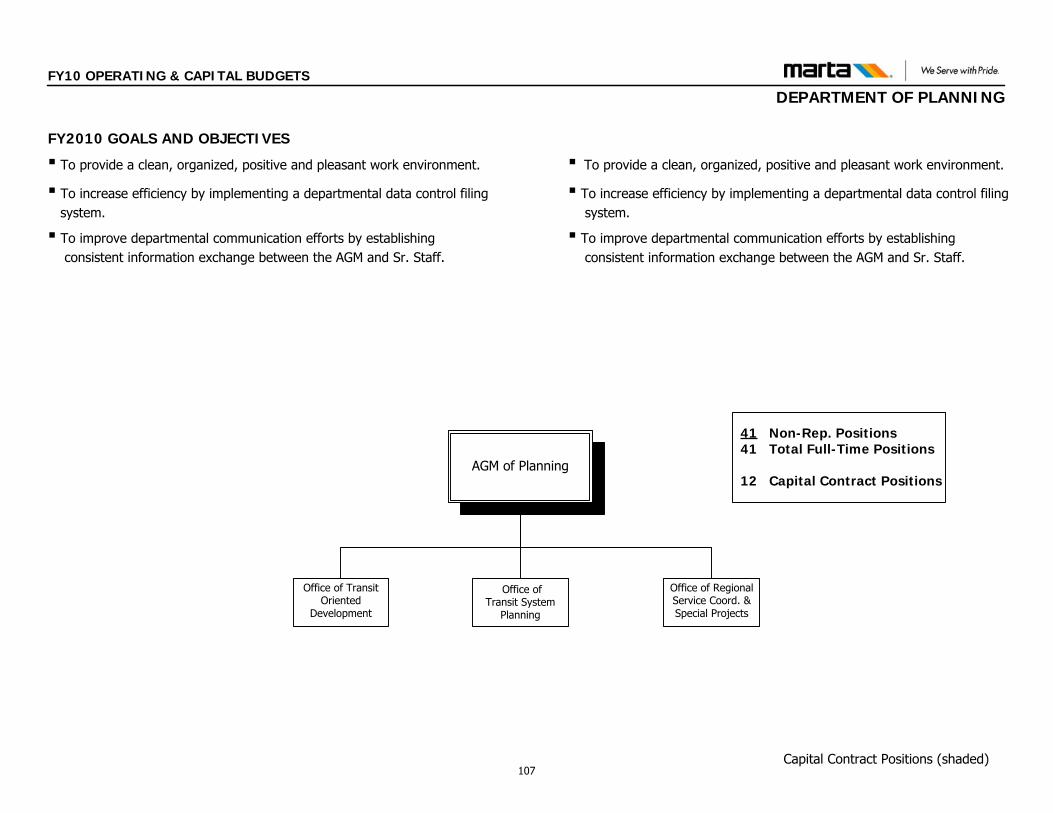
Capital Contract Positions (shaded)
41 Non-Rep. Positions 41 Total Full-Time Positions
12 Capital Contract PositionsAGM of Planning
Office of Transit Oriented
Development
Office of Transit System
Planning
Office of Regional Service Coord. & Special Projects
FY2010 GOALS AND OBJECTIVES
▪ To provide a clean, organized, positive and pleasant work environment.
▪ To increase efficiency by implementing a departmental data control filing system.
▪ To improve departmental communication efforts by establishing consistent information exchange between the AGM and Sr. Staff.
▪ To provide a clean, organized, positive and pleasant work environment.
▪ To increase efficiency by implementing a departmental data control filing system.
▪ To improve departmental communication efforts by establishing consistent information exchange between the AGM and Sr. Staff.
FY10 OPERATING & CAPITAL BUDGETS
DEPARTMENT OF PLANNING
107
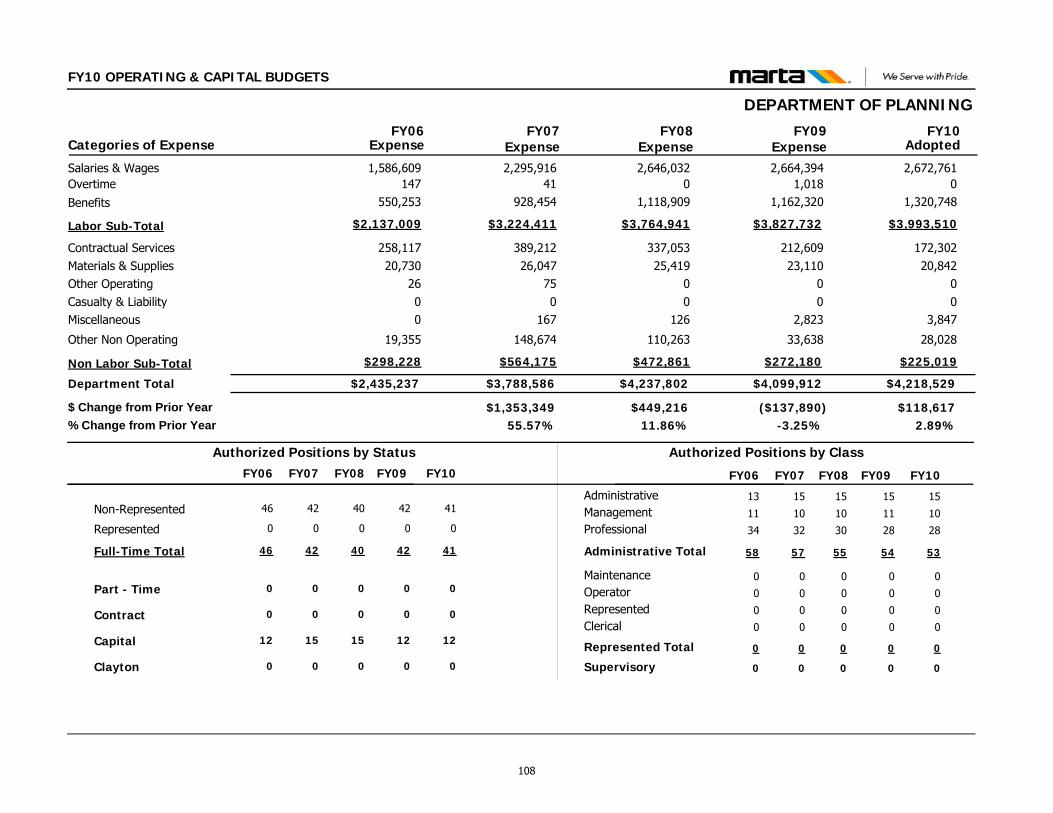
FY10 OPERATING & CAPITAL BUDGETS
DEPARTMENT OF PLANNING
$4,218,529$4,099,912
172,30220,842
00
3,847
28,028
212,60923,110
00
2,823
33,638
Contractual ServicesMaterials & SuppliesOther OperatingCasualty & LiabilityMiscellaneous
Other Non Operating
Department Total
2,672,7612,664,394Salaries & Wages01,018Overtime
$3,993,510$3,827,732Labor Sub-Total
FY09 FY10Categories of Expense
$2,435,237
258,11720,730
2600
19,355
1,586,609147
$2,137,009
FY06
$3,788,586
389,21226,047
750
167
148,674
2,295,91641
$3,224,411
FY07Expense Expense Expense Adopted
$118,617($137,890)$1,353,3492.89%-3.25%55.57%
$ Change from Prior Year% Change from Prior Year
$4,237,802
337,05325,419
00
126
110,263
2,646,0320
$3,764,941
FY08Expense
$449,21611.86%
$225,019$272,180Non Labor Sub-Total $298,228 $564,175 $472,861
1,320,7481,162,320Benefits 550,253 928,454 1,118,909
Administrative
Clerical
Management
MaintenanceOperator
Professional
Represented
Supervisory
15
0
11
0
0
28
0
0
15
0
10
0
0
28
0
0
Non-Represented 42 41
Part - Time 0 0
Represented 0 0
Full-Time Total 42 41
Contract 0 0
Capital 12 12
Authorized Positions by Class
Administrative Total 54 53
Authorized Positions by Status
Represented Total 0 0
15
0
10
0
0
32
0
0
42
0
0
42
0
15
57
0
13
0
11
0
0
34
0
0
46
0
0
46
0
12
58
0
FY10FY09 FY07FY06 FY10FY09 FY07FY06
Clayton 0 000
40
0
0
40
0
15
FY08
0
15
0
10
0
0
30
0
0
55
0
FY08
108
FY10 OPERATING & CAPITAL BUDGETS
OFFICE OF THE AGM OF PLANNING
FUNCTIONS & RESPONSIBILITIES The Office of the Assistant General Manager of Planning oversees a wide variety of programs and activities that involve diverse constituencies, planning for the corridor, service planning and scheduling, environmental analysis, transit oriented development, real estate acquisition and management and regional service coordination. Other offices in the department of Planning are the following: Transit System Planning Transit Oriented Development Regional Service Coordination
The Office of Transit System Planning directs the Authority’s Transit Planning initiatives, which is responsible for immediate, short-range and long-range planning of bus and rail services, developing various system strategies that lead to policy and creating a pro-transit environment within the community. This office overseas MARTA long range system planning; expansion plans for key service corridors; coordinates all Authority regional and planning initiatives which include identifying and structuring new and revised service to growing markets; and identifies new bus and rail technologies while overseeing the Unified Planning Work Program (UPWP) that is reported to the ARC and FTA. The Office of Transit Oriented Development is responsible for directing the Authority’s joint development activities, managing all real estate holdings, and promoting economic development activities in the MARTA service area. TOD staff is also involved in developing transit oriented development policies and guidelines. The office directs the joint development initiative by assessing the potential of property for
development and directing the eventual development of this property in order to increase transit ridership and generate new revenue. This office manages the Authority’s real estate holdings; including acquisition, evaluation, relocation, and disposition of properties. It also promotes the development of private property around MARTA rail stations and manages the Authority’s lease portfolio. The Office of Regional Service Coordination & Special Projects directs the Authority’s service coordination activities with partner transit operators and planning agencies as well as providing advice and consultation on special projects that arise from time to time within the region. This office works with the Office of Transit Systems Planning to oversee and coordinate all regional and planning initiatives for the Authority which includes identifying and structuring new and revised service to growing markets, and identifying new bus and rail technologies while overseeing the Unified Planning Work Program (UPWP) that is reported to the ARC and FTA. FY09 ACCOMPLISHMENTS Implemented the Planning Pride Newsletter to serve as an
internal funnel to inform, encourage and commend staff.
Refocused the TOD Staff to have more of a “land use”
perspective.
Established TOD Guidelines in an effort to “Promote Joint
Development.”
109
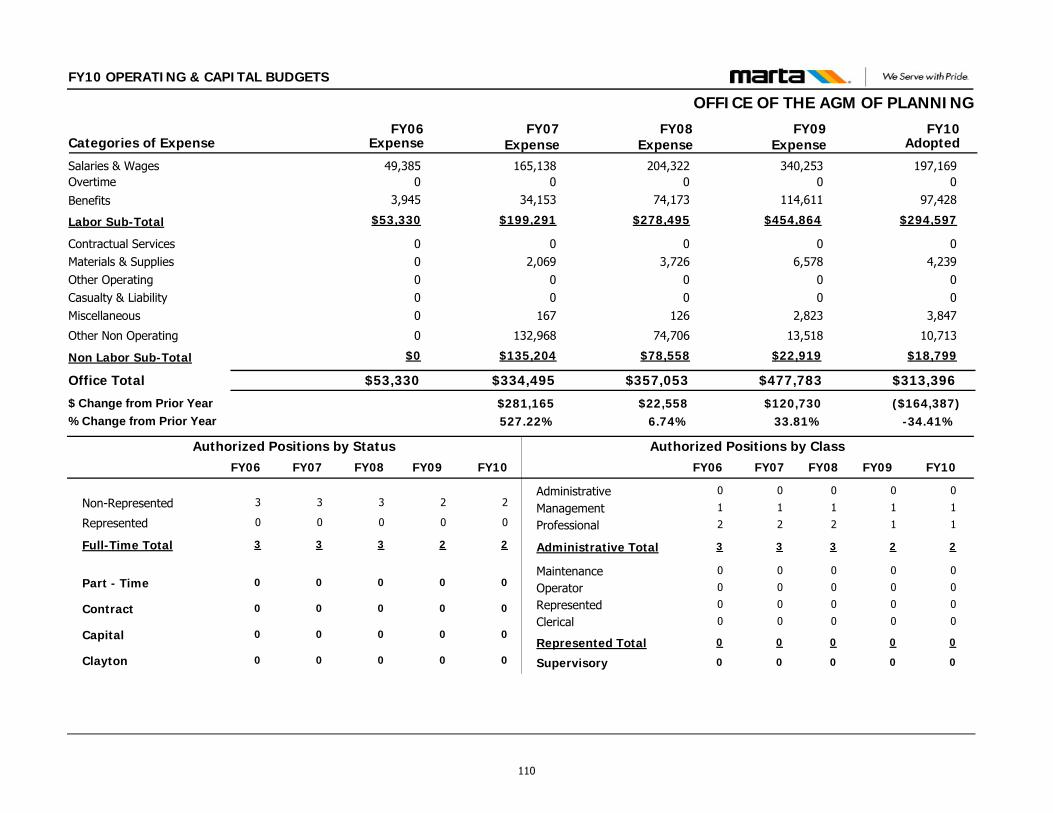
FY10 OPERATING & CAPITAL BUDGETS
OFFICE OF THE AGM OF PLANNING
$313,396$477,783
04,239
00
3,847
10,713
06,578
00
2,823
13,518
Contractual ServicesMaterials & SuppliesOther OperatingCasualty & LiabilityMiscellaneous
Other Non Operating
Office Total
197,169340,253Salaries & Wages00Overtime
$294,597$454,864Labor Sub-Total
FY09 FY10Categories of Expense
$53,330
00000
0
49,3850
$53,330
FY06
$334,495
02,069
00
167
132,968
165,1380
$199,291
FY07Expense Expense Expense Adopted
($164,387)$120,730$281,165-34.41%33.81%527.22%
$ Change from Prior Year% Change from Prior Year
$357,053
03,726
00
126
74,706
204,3220
$278,495
FY08Expense
$22,5586.74%
$18,799$22,919Non Labor Sub-Total $0 $135,204 $78,558
97,428114,611Benefits 3,945 34,153 74,173
Administrative
Clerical
Management
MaintenanceOperator
Professional
Represented
Supervisory
0
0
1
0
0
1
0
0
0
0
1
0
0
1
0
0
Non-Represented 2 2
Part - Time 0 0
Represented 0 0
Full-Time Total 2 2
Contract 0 0
Capital 0 0
Authorized Positions by Class
Administrative Total 2 2
Authorized Positions by Status
Represented Total 0 0
0
0
1
0
0
2
0
0
3
0
0
3
0
0
3
0
0
0
1
0
0
2
0
0
3
0
0
3
0
0
3
0
FY10FY09 FY07FY06 FY10FY09 FY07FY06
Clayton 0 000
3
0
0
3
0
0
FY08
0
0
0
1
0
0
2
0
0
3
0
FY08
110

FY10 OPERATING & CAPITAL BUDGETS
OFFICE OF THE AGM OF PLANNING
2 Non-Rep. Positions 2 Total Full-Time Positions
Department Administrator
AGM of Planning
111
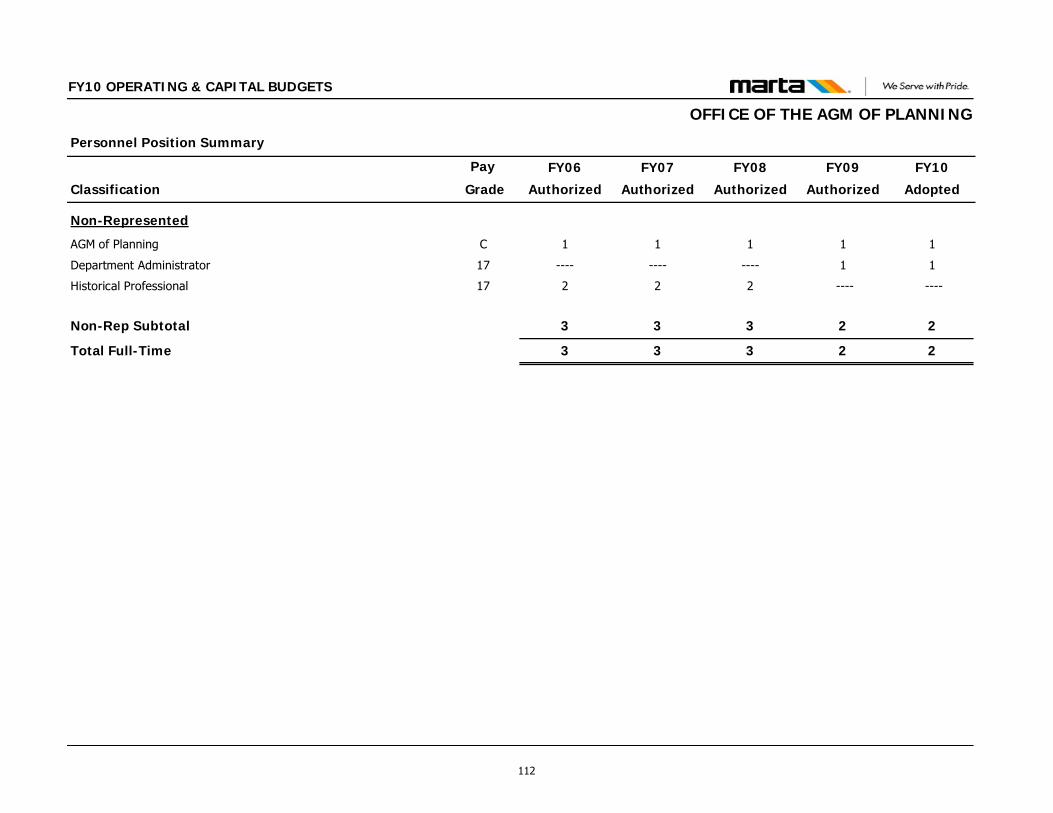
Classification
Personnel Position Summary
Pay FY09
Authorized
FY10
Adopted
FY10 OPERATING & CAPITAL BUDGETS
FY08
Authorized
FY07
Authorized
FY06
Authorized Grade
OFFICE OF THE AGM OF PLANNING
Non-Represented
AGM of Planning C 1 1111
Department Administrator 17 1 1------------
Historical Professional 17 ---- ----222
Non-Rep Subtotal 2 2333
Total Full-Time 2 2333
112
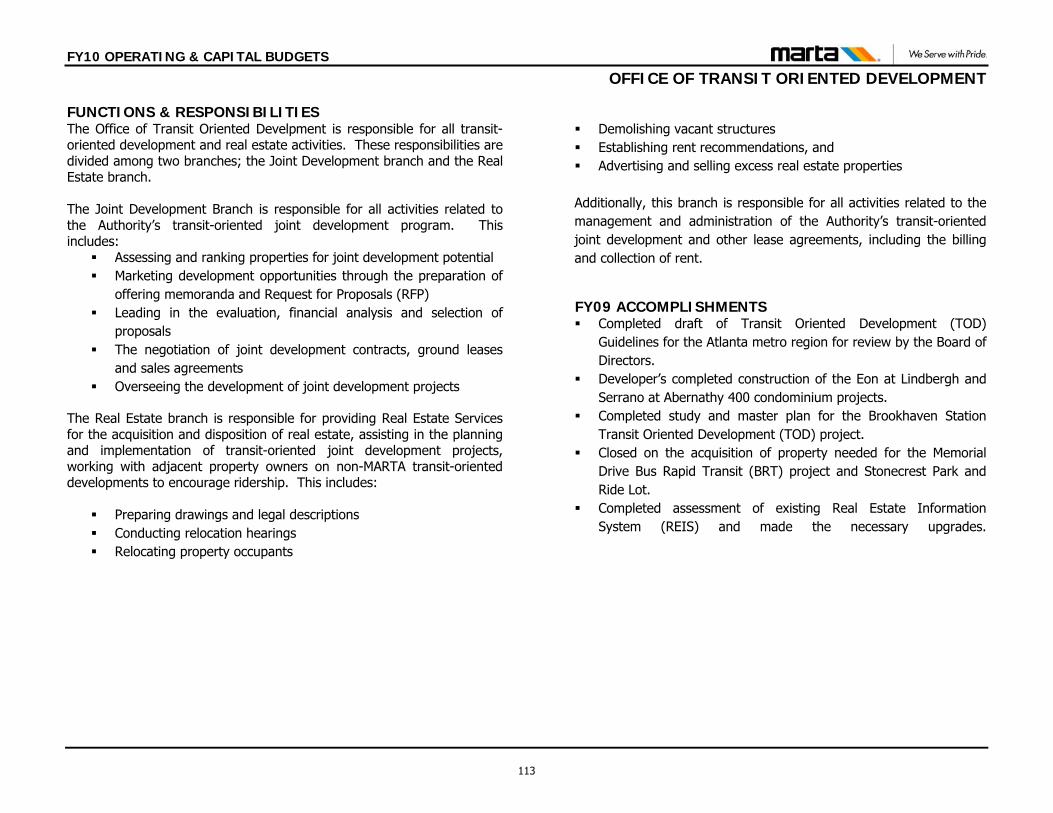
FY10 OPERATING & CAPITAL BUDGETS
D DEVELOPMENT
OFFICE OF TRANSIT ORIENTE
FUNCTIONS & RESPONSIBILITIES The Office of Transit Oriented Develpment is responsible for all transit-oriented development and real estate activities. These responsibilities are divided among two branches; the Joint Development branch and the Real Estate branch. The Joint Development Branch is responsible for all activities related to the Authority’s transit-oriented joint development program. This includes: Assessing and ranking properties for joint development potential Marketing development opportunities through the preparation of
offering memoranda and Request for Proposals (RFP) Leading in the evaluation, financial analysis and selection of
proposals The negotiation of joint development contracts, ground leases
and sales agreements Overseeing the development of joint development projects
The Real Estate branch is responsible for providing Real Estate Services for the acquisition and disposition of real estate, assisting in the planning and implementation of transit-oriented joint development projects, working with adjacent property owners on non-MARTA transit-oriented developments to encourage ridership. This includes: Preparing drawings and legal descriptions Conducting relocation hearings Relocating property occupants
Demolishing vacant structures Establishing rent recommendations, and Advertising and selling excess real estate properties Additionally, this branch is responsible for all activities related to the management and administration of the Authority’s transit-oriented joint development and other lease agreements, including the billing and collection of rent.
FY09 ACCOMPLISHMENTS Completed draft of Transit Oriented Development (TOD)
Guidelines for the Atlanta metro region for review by the Board of Directors.
Developer’s completed construction of the Eon at Lindbergh and Serrano at Abernathy 400 condominium projects.
Completed study and master plan for the Brookhaven Station Transit Oriented Development (TOD) project.
Closed on the acquisition of property needed for the Memorial Drive Bus Rapid Transit (BRT) project and Stonecrest Park and Ride Lot.
Completed assessment of existing Real Estate Information System (REIS) and made the necessary upgrades.
113
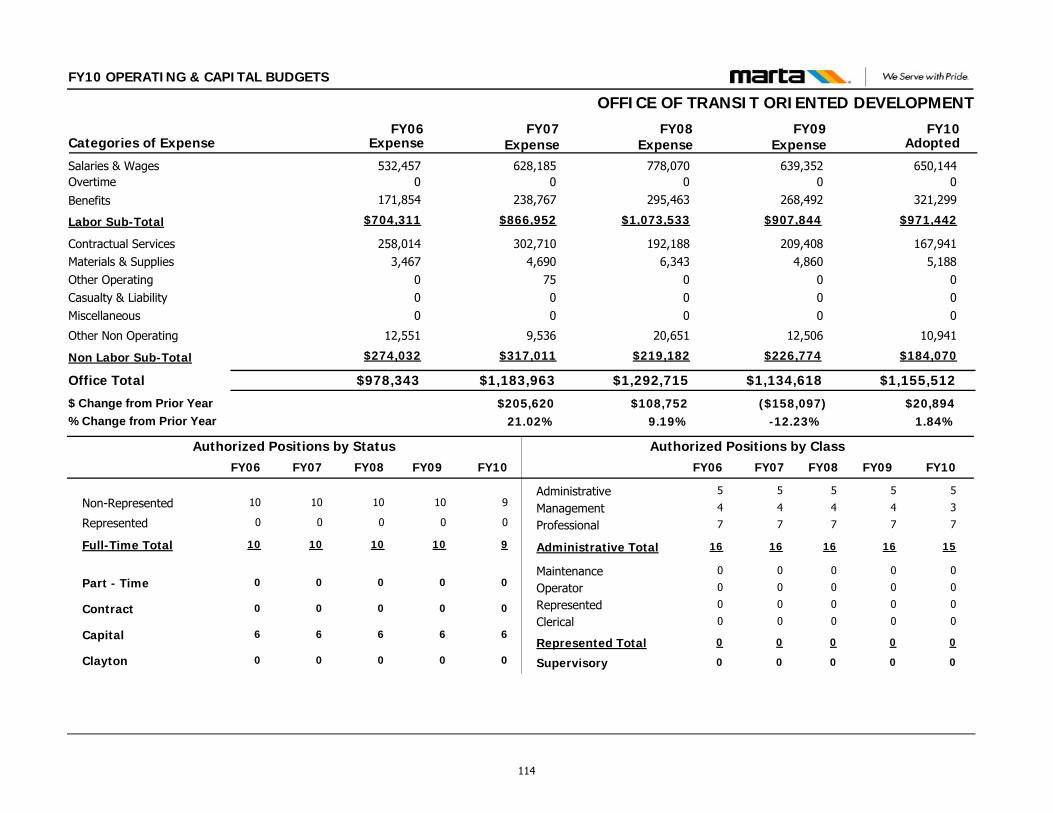
FY10 OPERATING & CAPITAL BUDGETS
OFFICE OF TRANSIT ORIENTED DEVELOPMENT
$1,155,512$1,134,618
167,9415,188
000
10,941
209,4084,860
000
12,506
Contractual ServicesMaterials & SuppliesOther OperatingCasualty & LiabilityMiscellaneous
Other Non Operating
Office Total
650,144639,352Salaries & Wages00Overtime
$971,442$907,844Labor Sub-Total
FY09 FY10Categories of Expense
$978,343
258,0143,467
000
12,551
532,4570
$704,311
FY06
$1,183,963
302,7104,690
7500
9,536
628,1850
$866,952
FY07Expense Expense Expense Adopted
$20,894($158,097)$205,6201.84%-12.23%21.02%
$ Change from Prior Year% Change from Prior Year
$1,292,715
192,1886,343
000
20,651
778,0700
$1,073,533
FY08Expense
$108,7529.19%
$184,070$226,774Non Labor Sub-Total $274,032 $317,011 $219,182
321,299268,492Benefits 171,854 238,767 295,463
Administrative
Clerical
Management
MaintenanceOperator
Professional
Represented
Supervisory
5
0
4
0
0
7
0
0
5
0
3
0
0
7
0
0
Non-Represented 10 9
Part - Time 0 0
Represented 0 0
Full-Time Total 10 9
Contract 0 0
Capital 6 6
Authorized Positions by Class
Administrative Total 16 15
Authorized Positions by Status
Represented Total 0 0
5
0
4
0
0
7
0
0
10
0
0
10
0
6
16
0
5
0
4
0
0
7
0
0
10
0
0
10
0
6
16
0
FY10FY09 FY07FY06 FY10FY09 FY07FY06
Clayton 0 000
10
0
0
10
0
6
FY08
0
5
0
4
0
0
7
0
0
16
0
FY08
114
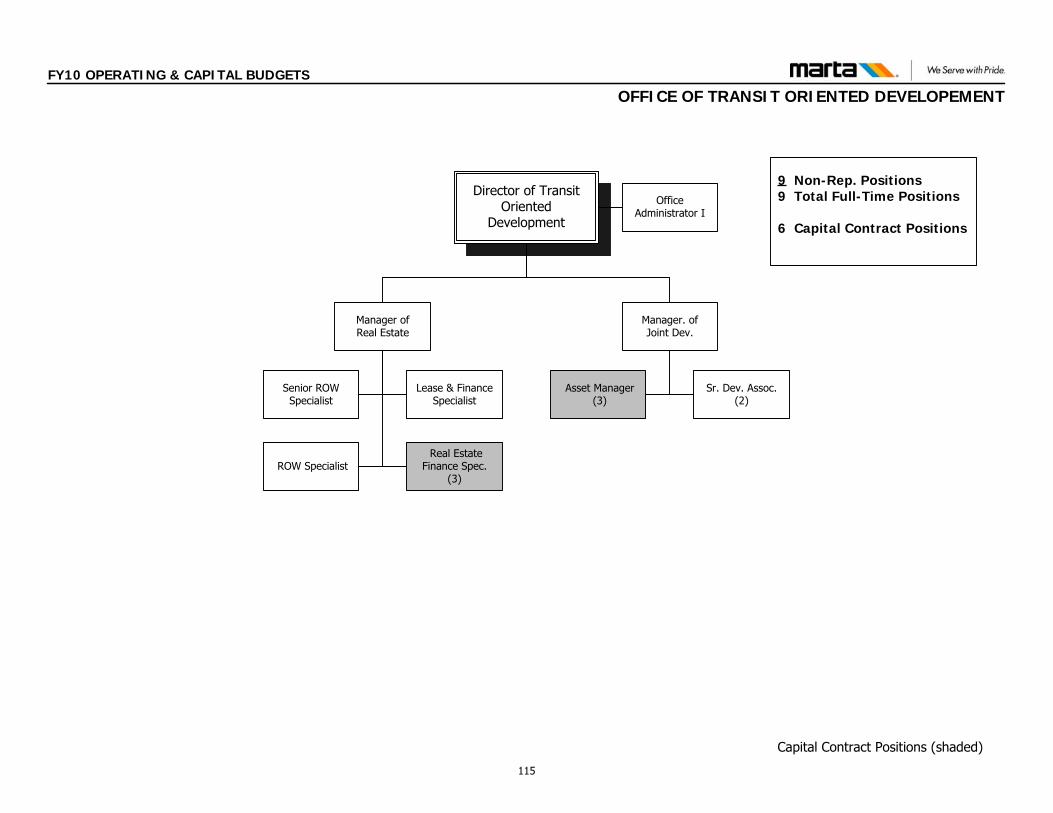
Real Estate Finance Spec.
(3)
Asset Manager (3)
Capital Contract Positions (shaded)
Director of Transit Oriented
Development
Manager. of Joint Dev.
Manager ofReal Estate
ROW Specialist
Sr. Dev. Assoc.(2)
Office Administrator I
Lease & Finance Specialist
Senior ROW Specialist
9 Non-Rep. Positions 9 Total Full-Time Positions
6 Capital Contract Positions
FY10 OPERATING & CAPITAL BUDGETS
OFFICE OF TRANSIT ORIENTED DEVELOPEMENT
115
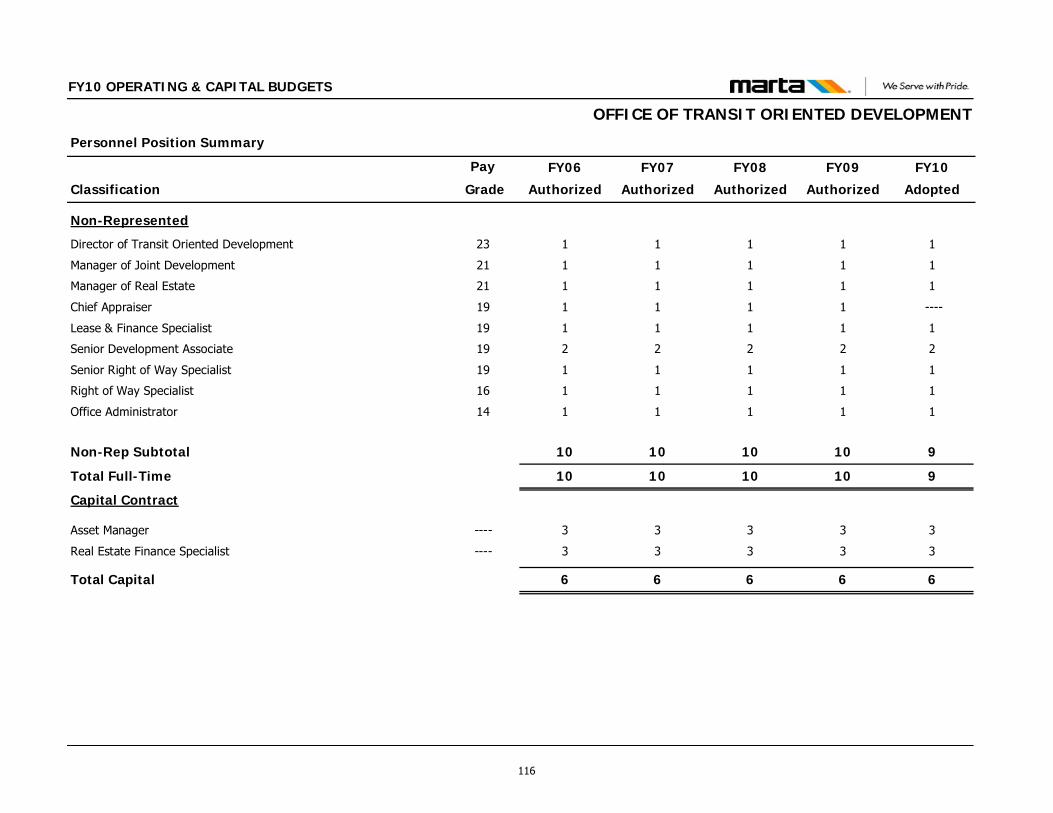
Classification
Personnel Position Summary
Pay FY09
Authorized
FY10
Adopted
FY10 OPERATING & CAPITAL BUDGETS
FY08
Authorized
FY07
Authorized
FY06
Authorized Grade
OFFICE OF TRANSIT ORIENTED DEVELOPMENT
Non-Represented
Director of Transit Oriented Development 23 1 1111
Manager of Joint Development 21 1 1111
Manager of Real Estate 21 1 1111
Chief Appraiser 19 1 ----111
Lease & Finance Specialist 19 1 1111
Senior Development Associate 19 2 2222
Senior Right of Way Specialist 19 1 1111
Right of Way Specialist 16 1 1111
Office Administrator 14 1 1111
Non-Rep Subtotal 10 9101010
Total Full-Time 10 9101010
Capital Contract
Asset Manager ---- 3 3333
Real Estate Finance Specialist ---- 3 3333
Total Capital 6 6666
116
FY10 OPERATING & CAPITAL BUDGETS
OFFICE OF TRANSIT SYSTEM PLANNING FUNCTIONS AND RESPONSIBILITIES The Office of Transit System Planning (TSP) is responsible for the planning, design, and scheduling of all bus and rail service. This includes development of service plans as required for the Authority’s operating budget, intermediate service initiatives, and long range expansion projects. TSP is responsible for the planning due diligence for the Authority’s expansion program and participating in other projects sponsored by the regional planning partners. TSP is the primary touch point for the Authority’s engagement in the regional transportation planning process to develop the Regional Transportation Plan (RTP) and Transportation Improvement Program (TIP) and for facilitating the Authority’s submittal of activities and accomplishments for the development of regional Unified Planning Work Program (UPWP). Regional Planning & Analysis represents the Authority with Regional, State, Federal and Local Agencies and participates in studies and projects throughout the region to increase support of and expansion of transit initiatives and priorities. This branch also conducts Long-range Planning to include guiding system expansion projects through the Federal Funding process, ridership modeling and identifying future locations for capital expansion projects (fixed-guideway, bus-rapid transit). This branch also reviews environmental impact, historical and archaeological studies as required by State and Federal laws. Service Planning & Scheduling includes evaluating the efficiency and effectiveness of existing services, proactively develops service plans with community input, maintains MARTA’s Service Standards that are approved annually by the MARTA Board of Directors and coordinates with local public/private agencies with bus and shuttle services (Transportation Management Associates and Community Improvement Districts). This branch also oversees the scheduling of all bus and rail service in coordination with Operations and Maintenance to ensure safe, efficient and cost effective transportation for our riders.
Planning Initiatives is responsible for internal and external coordination of project implementation and delivery, from planning through engineering and construction to service initiation. It directs the development of project environmental documentation in compliance with the National Environmental Policy Act and coordinates such documents for appropriate federal and state agency approvals. It supports the director in local and regional planning initiatives and provides technical review oversight in the planning, design, and implementation of expansion projects and new service initiatives. This branch also conducts the Authority's reviews of all Development of Regional Impact (DRI) applications. Special Projects & Analysis (SPA) provides support for the Office of Transit System Planning, providing the Office’s core GIS capabilities, service analysis and ridership management, mapping, and the capability to conduct other special projects. Additionally, SPA is the branch responsible for coordinating the Authority’s bus stop management efforts. SPA’s responsibilities include numerous ongoing projects as well as one-time major projects. FY09 ACCOMPLISHMENTS Commenced Tier 1 Beltline EIS Completed update of Categorical Exclusion application for
Hamilton Road Bus Facility and obtained FTA approval Completed documentation of Categorical Exclusion application for
Brady Bus Facility and obtained FTA approval Successful implementation of (3) Bus & Rail General Mark-up Developed service plan scenarios and final plan for FY2010
Budget Reduction Created Lifeline Service Designation Initiated South Fulton Transit Alternatives Study Completed a joint Cobb County-MARTA Regional Paratransit
Study Completed Memorial Drive BRT Assessment
117

FY10 OPERATING & CAPITAL BUDGETS
OFFICE OF TRANSIT SYSTEM PLANNING
$2,483,120$2,487,511
4,36111,415
000
6,374
3,20111,672
000
7,614
Contractual ServicesMaterials & SuppliesOther OperatingCasualty & LiabilityMiscellaneous
Other Non Operating
Office Total
1,647,0851,684,789Salaries & Wages01,018Overtime
$2,460,970$2,465,024Labor Sub-Total
FY09 FY10Categories of Expense
$1,403,564
10317,263
2600
6,804
1,004,767147
$1,379,368
FY06
$2,270,128
86,50219,288
000
6,170
1,502,59341
$2,158,168
FY07Expense Expense Expense Adopted
($4,391)($100,523)$866,564-0.18%-3.88%61.74%
$ Change from Prior Year% Change from Prior Year
$2,588,034
144,86515,350
000
14,906
1,663,6400
$2,412,913
FY08Expense
$317,90614.00%
$22,150$22,487Non Labor Sub-Total $24,196 $111,960 $175,121
813,885779,217Benefits 374,454 655,534 749,273
Administrative
Clerical
Management
MaintenanceOperator
Professional
Represented
Supervisory
10
0
5
0
0
19
0
0
10
0
5
0
0
19
0
0
Non-Represented 28 28
Part - Time 0 0
Represented 0 0
Full-Time Total 28 28
Contract 0 0
Capital 6 6
Authorized Positions by Class
Administrative Total 34 34
Authorized Positions by Status
Represented Total 0 0
10
0
5
0
0
23
0
0
29
0
0
29
0
9
38
0
8
0
6
0
0
25
0
0
33
0
0
33
0
6
39
0
FY10FY09 FY07FY06 FY10FY09 FY07FY06
Clayton 0 000
27
0
0
27
0
9
FY08
0
10
0
5
0
0
21
0
0
36
0
FY08
118
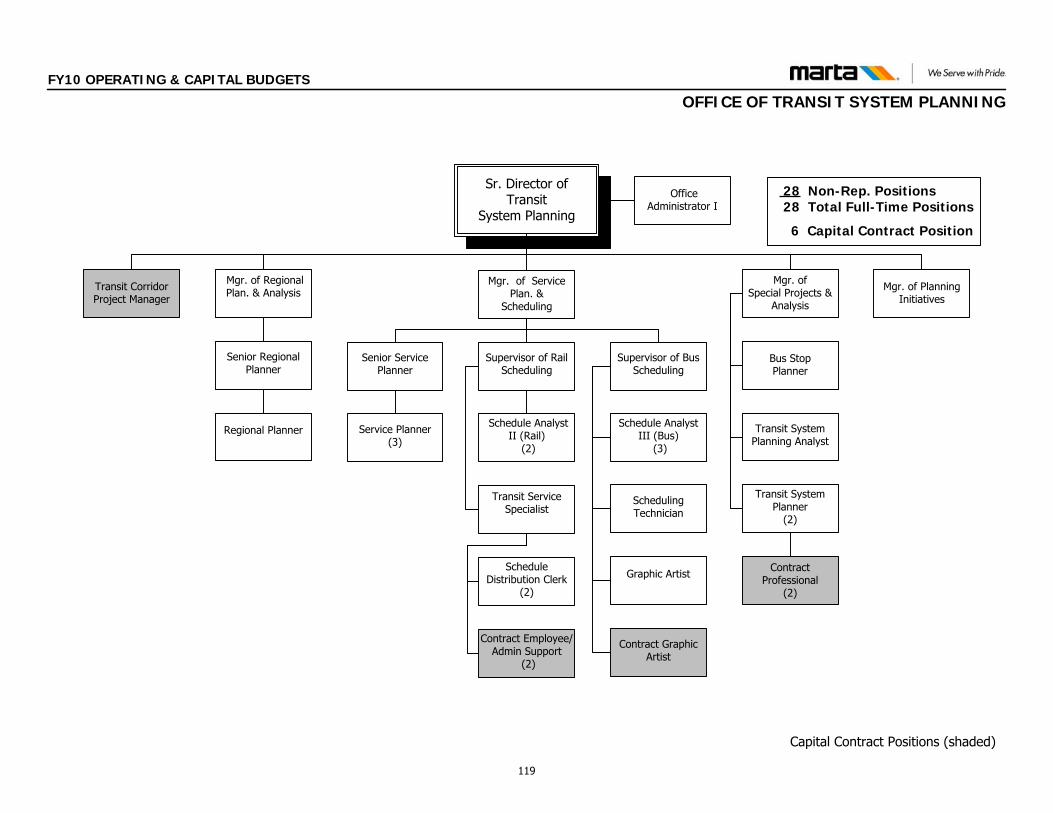
FY10 OPERATING & CAPITAL BUDGETS
OFFICE OF TRANSIT SYSTEM PLANNING
Sr. Director of Transit
System Planning
Senior Regional Planner
Mgr. of Special Projects &
Analysis
Office Administrator I
Regional Planner Service Planner (3)
Mgr. of Service Plan. &
Scheduling
Mgr. of Regional Plan. & Analysis Transit Corridor
Project Manager
Scheduling Technician
Senior Service Planner
Supervisor of Rail Scheduling
Supervisor of Bus Scheduling
Schedule Analyst II (Rail)
(2)
Schedule Analyst III (Bus)
(3)
Transit System Planner
(2)
Transit System Planning Analyst
Mgr. of Planning Initiatives
Contract Professional
(2)
Bus Stop Planner
Graphic ArtistSchedule
Distribution Clerk (2)
Transit Service Specialist
Contract Employee/Admin Support
(2)
Contract Graphic Artist
Capital Contract Positions (shaded)
28 Non-Rep. Positions 28 Total Full-Time Positions
6 Capital Contract Position
119
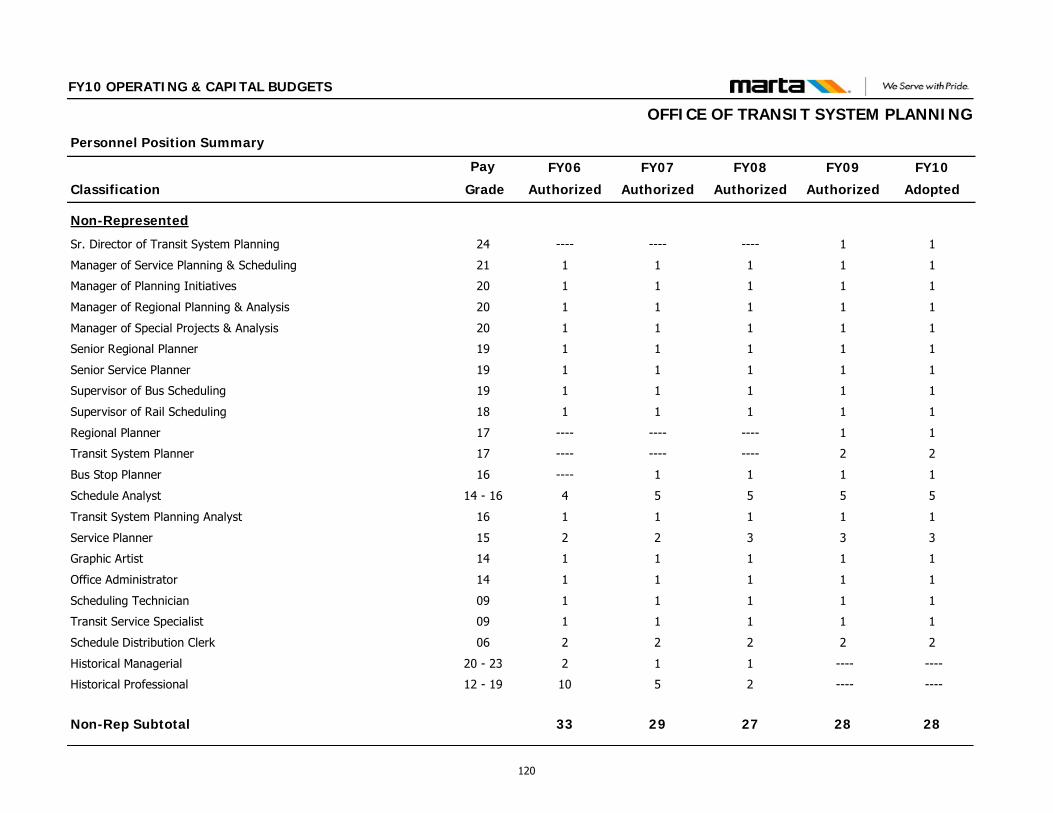
Classification
Personnel Position Summary
Pay FY09
Authorized
FY10
Adopted
FY10 OPERATING & CAPITAL BUDGETS
FY08
Authorized
FY07
Authorized
FY06
Authorized Grade
OFFICE OF TRANSIT SYSTEM PLANNING
Non-Represented
Sr. Director of Transit System Planning 24 1 1------------
Manager of Service Planning & Scheduling 21 1 1111
Manager of Planning Initiatives 20 1 1111
Manager of Regional Planning & Analysis 20 1 1111
Manager of Special Projects & Analysis 20 1 1111
Senior Regional Planner 19 1 1111
Senior Service Planner 19 1 1111
Supervisor of Bus Scheduling 19 1 1111
Supervisor of Rail Scheduling 18 1 1111
Regional Planner 17 1 1------------
Transit System Planner 17 2 2------------
Bus Stop Planner 16 1 111----
Schedule Analyst 14 - 16 5 5554
Transit System Planning Analyst 16 1 1111
Service Planner 15 3 3322
Graphic Artist 14 1 1111
Office Administrator 14 1 1111
Scheduling Technician 09 1 1111
Transit Service Specialist 09 1 1111
Schedule Distribution Clerk 06 2 2222
Historical Managerial 20 - 23 ---- ----112
Historical Professional 12 - 19 ---- ----2510
Non-Rep Subtotal 28 28272933
120
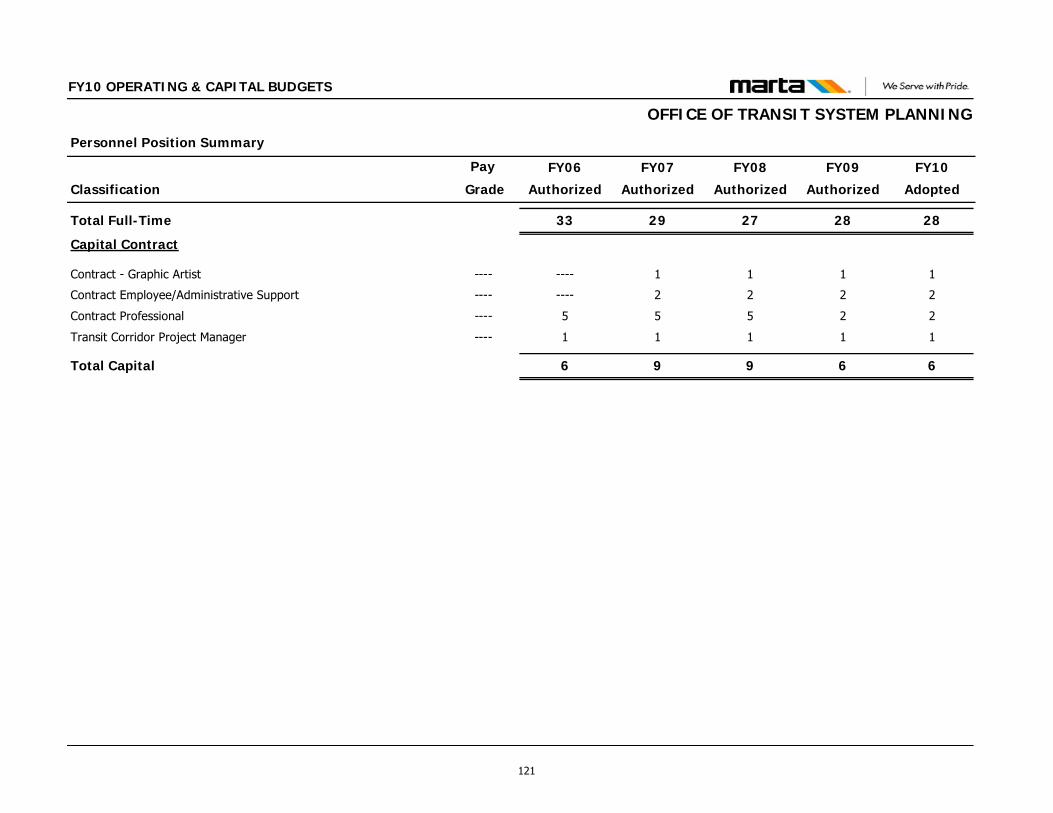
Classification
Personnel Position Summary
Pay FY09
Authorized
FY10
Adopted
FY10 OPERATING & CAPITAL BUDGETS
FY08
Authorized
FY07
Authorized
FY06
Authorized Grade
OFFICE OF TRANSIT SYSTEM PLANNING
Total Full-Time 28 28272933
Capital Contract
Contract - Graphic Artist ---- 1 111----
Contract Employee/Administrative Support ---- 2 222----
Contract Professional ---- 2 2555
Transit Corridor Project Manager ---- 1 1111
Total Capital 6 6996
121
FY10 OPERATING & CAPITAL BUDGETS
OFFI E OF REG N
C IO AL SERVICE COORDINATION & SPECIAL PROJECTS
FUNCTIONS & RESPONSIBILITIES The Office of Regional Service Coordination & Special Projects directs the Authority’s service coordination activities with partner transit operators and planning agencies as well as providing advice and consultation on special projects that arise from time to time within the region. This office works with the Office of Transit Systems Planning to oversee and coordinate all regional and planning initiatives for the Authority which includes identifying and structuring new and revised service to growing markets, and identifying new bus and rail technologies while overseeing the Unified Planning Work Program (UPWP) that is reported to the ARC and FTA. Regional Service Coordination & Special Projects (RSC&SP) staff focuses on coordinating MARTA internal responses and communicating MARTA responses to queries and initiatives of regional partners. Additionally, RSC&SP helps MARTA fulfill its responsibilities under the Quad Party Agreement governing transportation planning in Atlanta for supporting the efforts of the MPO in regional transit planning. Major Initiatives: RSC&SP will focus on the following major initiatives for FY 2010: 1. Staff support for the Transit Planning/Implementation Board Efforts
a. Regional Fare Product Implementation b. Support for the 2010 Georgia Legislative Session c. Regional Service Coordination Efforts d. Transit Programming for the 2040 RTP Development e. Other Regional Initiatives as Needed
2. Leading the Regional Service Coordination Council including monthly roundtables and quarterly bus maintenance forums
3. Special Initiatives such as FY 2009 Projects a. Streetcar / TIGER Initiative b. GRTA/MARTA/City of Atlanta MOU regarding Congestion
Reduction Demonstration c. David Gunn/Eugene Sporkowski Rail Symposium
4. Regional Data and Benchmarking Development for both regional use and internal support for External Affairs
5. Customer Service / Wayfinding Enhancements for Regional Operators a. Informing / Coordinating Regional Operators Service changes
with station personnel b. Identifying improvements in station information for customers
using regional partners’ services 6. Support of Transit System Planning Efforts as needed
a. Integration of MARTA projects into Regional System (i.e. I-20 East initiative)
b. Integration of External projects into MARTA system (i.e. I-85 NE initiative)
FY09 ACCOMPLISHMENTS Provided Director and Managerial Support to the Transit
Implementation Board – a joint venture of MARTA, GRTA and ARC charged with streamlining transit program implementation
Initiated Implementation of Joint MARTA/Cobb County joint Paratransit service in support of joint MARTA 12/CCT 10 service to Cumberland
Began development of Joint Regional Fare Product through the Regional Breeze Partners Task Force
Negotiated MARTA’s position on bus circulation in Downtown Atlanta through the Congestion Reduction Demonstration Project
Coordinated and Programmed the visit of David Gunn and Eugene Sporokowski for a joint rail summit in April, 2009
Provides support for the Decatur Belt Abandonment Resolution and subsequent development of Statewide Rail Planning Scope
Initiated introduction of the Atlantic Station Shuttle into the Arts Center Bus Bay
Provided Planning Support for the FY 2010 ARRA ARC/MARTA offset funding
122

FY10 OPERATING & CAPITAL BUDGETS
OFFICE OF REGIONAL SERVICE COORDINATION & SPECIAL PROJECTS
$266,500$0
00000
0
00000
0
Contractual ServicesMaterials & SuppliesOther OperatingCasualty & LiabilityMiscellaneous
Other Non Operating
Office Total
178,3640Salaries & Wages00Overtime
$266,500$0Labor Sub-Total
FY09 FY10Categories of Expense
$0
00000
0
00
$0
FY06
$0
00000
0
00
$0
FY07Expense Expense Expense Adopted
$266,500$0$0100.00%0.00%0.00%
$ Change from Prior Year% Change from Prior Year
$0
00000
0
00
$0
FY08Expense
$00.00%
$0$0Non Labor Sub-Total $0 $0 $0
88,1360Benefits 0 0 0
Administrative
Clerical
Management
MaintenanceOperator
Professional
Represented
Supervisory
0
0
1
0
0
1
0
0
0
0
1
0
0
1
0
0
Non-Represented 2 2
Part - Time 0 0
Represented 0 0
Full-Time Total 2 2
Contract 0 0
Capital 0 0
Authorized Positions by Class
Administrative Total 2 2
Authorized Positions by Status
Represented Total 0 0
0
0
0
0
0
0
0
0
0
0
0
0
0
0
0
0
0
0
0
0
0
0
0
0
0
0
0
0
0
0
0
0
FY10FY09 FY07FY06 FY10FY09 FY07FY06
Clayton 0 000
0
0
0
0
0
0
FY08
0
0
0
0
0
0
0
0
0
0
0
FY08
123
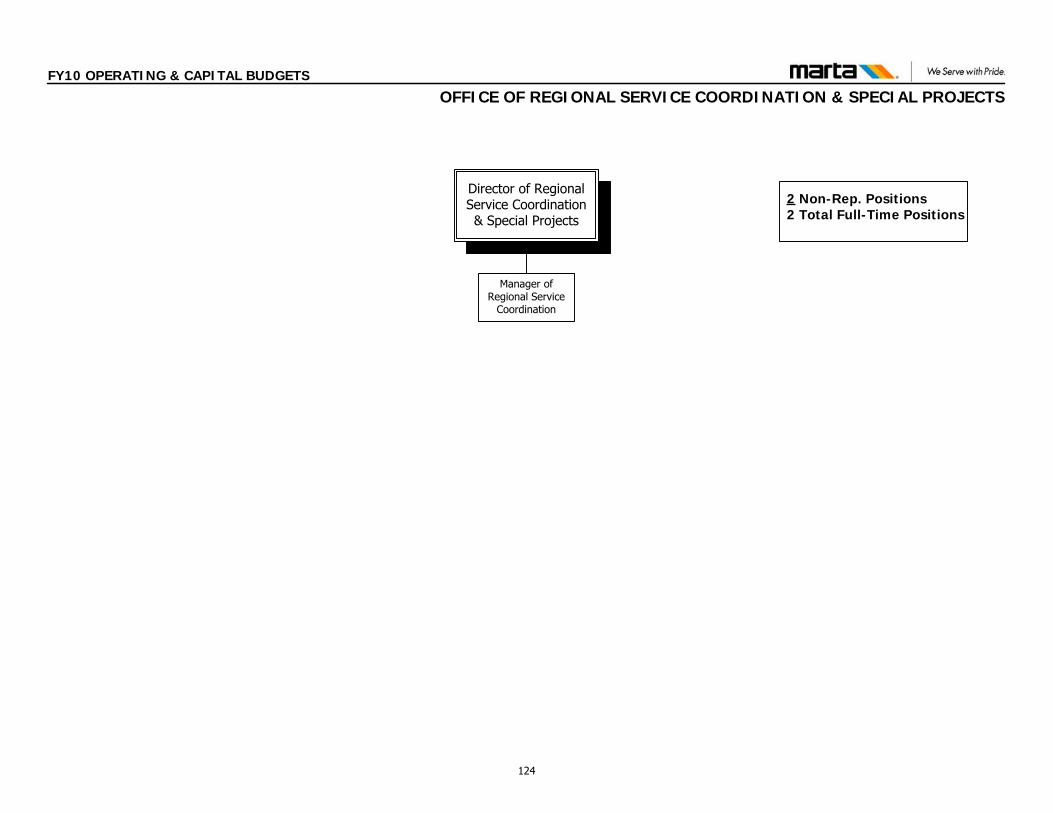
FY10 OPERATING & CAPITAL BUDGETS
OFFICE OF REGIONAL SERVICE COORDINATION & SPECIAL PROJECTS
2 Non-Rep. Positions 2 Total Full-Time Positions
Manager of Regional Service
Coordination
Director of Regional Service Coordination & Special Projects
124
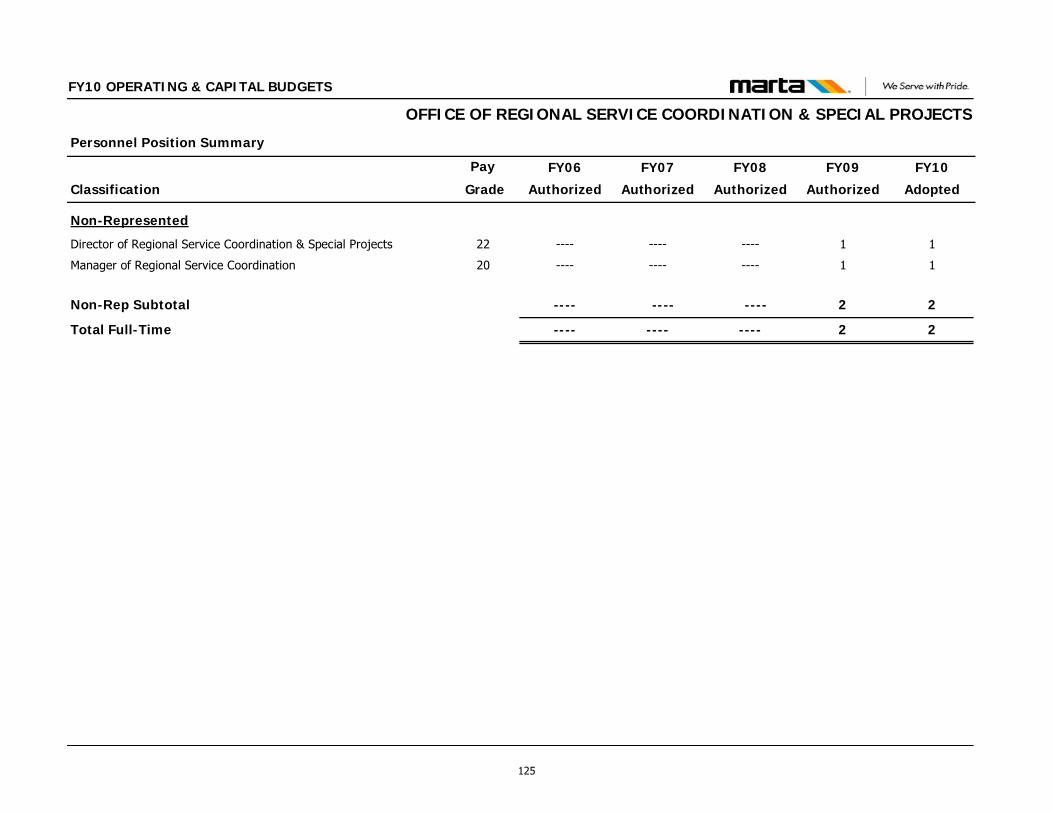
Classification
Personnel Position Summary
Pay FY09
Authorized
FY10
Adopted
FY10 OPERATING & CAPITAL BUDGETS
FY08
Authorized
FY07
Authorized
FY06
Authorized Grade
OFFICE OF REGIONAL SERVICE COORDINATION & SPECIAL PROJECTS
Non-Represented
Director of Regional Service Coordination & Special Projects 22 1 1------------
Manager of Regional Service Coordination 20 1 1------------
Non-Rep Subtotal 2 2 ---- --------
Total Full-Time 2 2------------
125

This page intentionally left blank
126
DEPARTMENT OF COMMUNICATIONS & EXTERNAL AFFAIRS This Department includes the following Offices: Department of Communications & External Affairs Office of the AGM of Communications & External Affairs Office of External Affairs Office of Marketing & Sales Office of Government & Constituent Relations Office of Customer Services Office of Media Relations
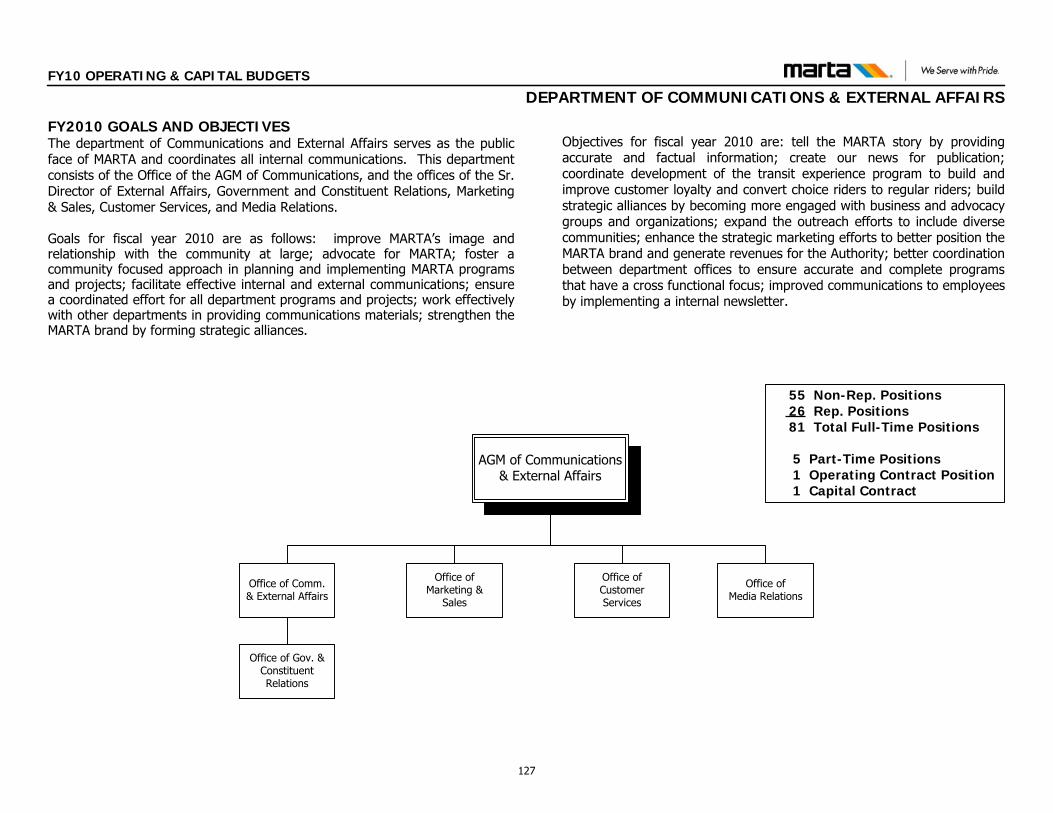
AGM of Communications & External Affairs
Office of Customer Services
Office of Comm. & External Affairs
Office of Media Relations
Office of Gov. & Constituent Relations
Office of Marketing &
Sales
FY10 OPERATING & CAPITAL BUDGETS
DEPARTMENT OF COMMUNICATIONS & EXTERNAL AFFAIRS
55 Non-Rep. Positions 26 Rep. Positions
81 Total Full-Time Positions
5 Part-Time Positions 1 Operating Contract Position 1 Capital Contract
FY2010 GOALS AND OBJECTIVESThe department of Communications and External Affairs serves as the public face of MARTA and coordinates all internal communications. This department consists of the Office of the AGM of Communications, and the offices of the Sr. Director of External Affairs, Government and Constituent Relations, Marketing & Sales, Customer Services, and Media Relations.
Goals for fiscal year 2010 are as follows: improve MARTA’s image and relationship with the community at large; advocate for MARTA; foster a community focused approach in planning and implementing MARTA programs and projects; facilitate effective internal and external communications; ensure a coordinated effort for all department programs and projects; work effectively with other departments in providing communications materials; strengthen the MARTA brand by forming strategic alliances.
Objectives for fiscal year 2010 are: tell the MARTA story by providing accurate and factual information; create our news for publication; coordinate development of the transit experience program to build and improve customer loyalty and convert choice riders to regular riders; build strategic alliances by becoming more engaged with business and advocacy groups and organizations; expand the outreach efforts to include diverse communities; enhance the strategic marketing efforts to better position the MARTA brand and generate revenues for the Authority; better coordination between department offices to ensure accurate and complete programs that have a cross functional focus; improved communications to employees by implementing a internal newsletter.
127
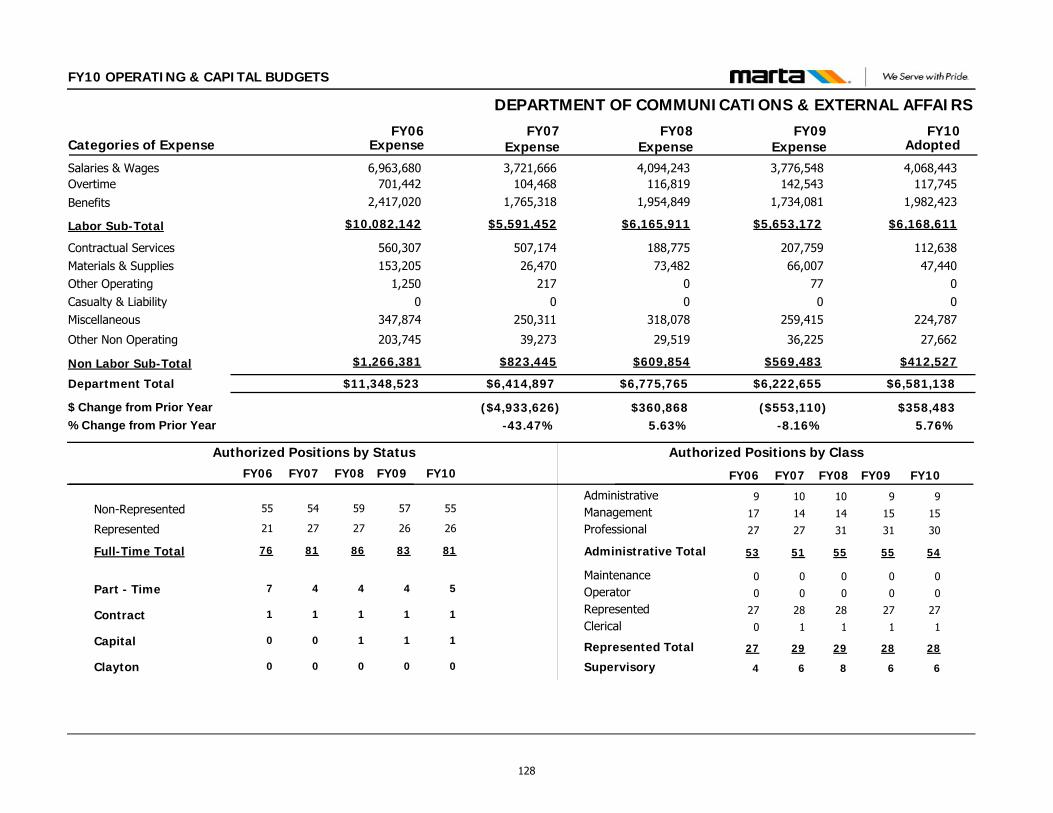
FY10 OPERATING & CAPITAL BUDGETS
DEPARTMENT OF COMMUNICATIONS & EXTERNAL AFFAIRS
$6,581,138$6,222,655
112,63847,440
00
224,787
27,662
207,75966,007
770
259,415
36,225
Contractual ServicesMaterials & SuppliesOther OperatingCasualty & LiabilityMiscellaneous
Other Non Operating
Department Total
4,068,4433,776,548Salaries & Wages117,745142,543Overtime
$6,168,611$5,653,172Labor Sub-Total
FY09 FY10Categories of Expense
$11,348,523
560,307153,205
1,2500
347,874
203,745
6,963,680701,442
$10,082,142
FY06
$6,414,897
507,17426,470
2170
250,311
39,273
3,721,666104,468
$5,591,452
FY07Expense Expense Expense Adopted
$358,483($553,110)($4,933,626)5.76%-8.16%-43.47%
$ Change from Prior Year% Change from Prior Year
$6,775,765
188,77573,482
00
318,078
29,519
4,094,243116,819
$6,165,911
FY08Expense
$360,8685.63%
$412,527$569,483Non Labor Sub-Total $1,266,381 $823,445 $609,854
1,982,4231,734,081Benefits 2,417,020 1,765,318 1,954,849
Administrative
Clerical
Management
MaintenanceOperator
Professional
Represented
Supervisory
9
1
15
0
0
31
27
6
9
1
15
0
0
30
27
6
Non-Represented 57 55
Part - Time 4 5
Represented 26 26
Full-Time Total 83 81
Contract 1 1
Capital 1 1
Authorized Positions by Class
Administrative Total 55 54
Authorized Positions by Status
Represented Total 28 28
10
1
14
0
0
27
28
6
54
4
27
81
1
0
51
29
9
0
17
0
0
27
27
4
55
7
21
76
1
0
53
27
FY10FY09 FY07FY06 FY10FY09 FY07FY06
Clayton 0 000
59
4
27
86
1
1
FY08
0
10
1
14
0
0
31
28
8
55
29
FY08
128
FY10 OPERATING & CAPITAL BUDGETS
OFFICE OF THE AGM OF COMMUNICATIONS & EXTERNAL AFFAIRS FUNCTIONS & RESPONSIBILITIES The office of Communications and External Affairs is responsible for the public face of MARTA and serves as another facet of front line representation of the Authority in the public domain. The AGM’s Office is responsible for coordinating and managing the four offices that comprise the department to ensure that MARTA’s vision and mission are achieved. To meet those objectives, the office oversees the development and dissemination of timely and consistent messages to internal and external audiences including customers, all levels of government, stakeholders, employees, community, advocacy groups and the media. The office serves to enhance the image of the Authority by building customer loyalty, forming strategic alliances and positioning MARTA as the subject matter expert for public transit. The office is the direct link to the General Manager/CEO for facilitating the internal and external communications and publications, strategic marketing, customer service initiatives and community and government organization that will strengthen the MARTA brand and public perception.
FY09 ACCOMPLISHMENTS Developed and implemented a Strategic Communications plan Produced and published Authority-wide brochures Coordinated overall Community outreach efforts for the FY10
budget Staged all Authority public hearings Planned and executed the MARTA Legislative Luncheon Staffed the Board Customer Development Committee and met
with committee chair to review agenda Facilitated quarterly briefings for the local jurisdictions Assisted with the passage of SB 89 Facilitated meetings and materials for the Board Ad Hoc
Committee on Governance and Funding Improved Media Relations by becoming more proactive in the
approach Improved communications to employees through video
presentations
129
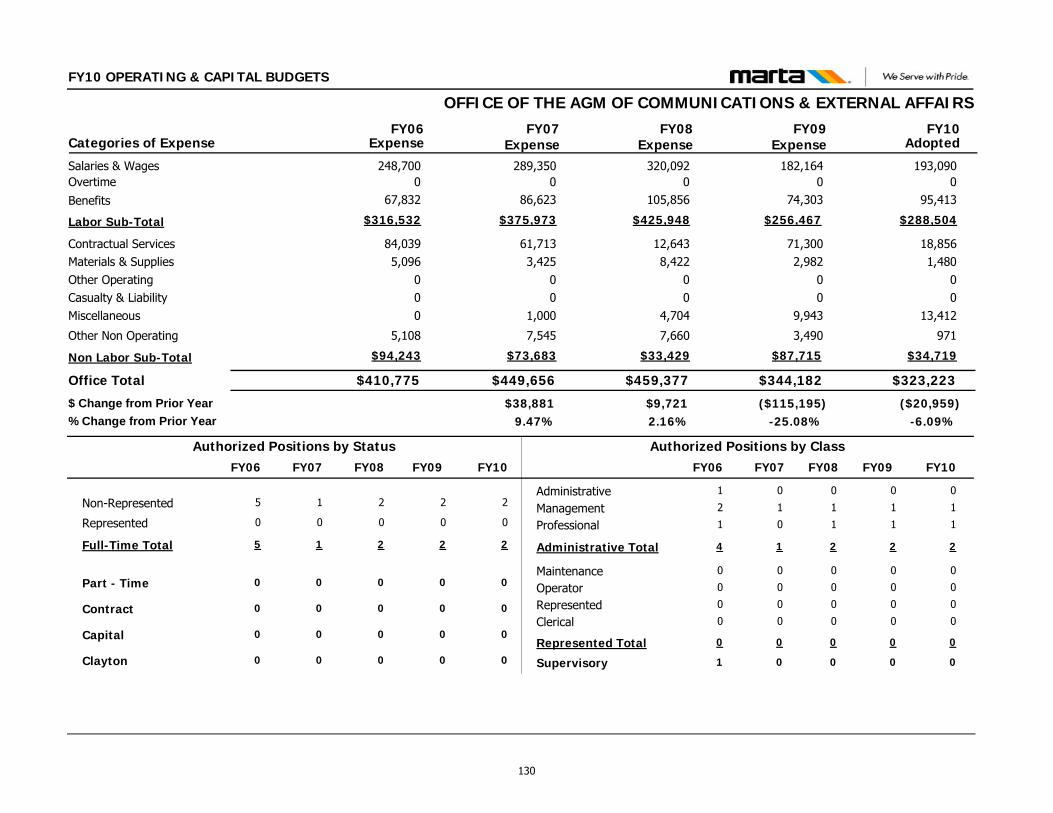
FY10 OPERATING & CAPITAL BUDGETS
OFFICE OF THE AGM OF COMMUNICATIONS & EXTERNAL AFFAIRS
$323,223$344,182
18,8561,480
00
13,412
971
71,3002,982
00
9,943
3,490
Contractual ServicesMaterials & SuppliesOther OperatingCasualty & LiabilityMiscellaneous
Other Non Operating
Office Total
193,090182,164Salaries & Wages00Overtime
$288,504$256,467Labor Sub-Total
FY09 FY10Categories of Expense
$410,775
84,0395,096
000
5,108
248,7000
$316,532
FY06
$449,656
61,7133,425
00
1,000
7,545
289,3500
$375,973
FY07Expense Expense Expense Adopted
($20,959)($115,195)$38,881-6.09%-25.08%9.47%
$ Change from Prior Year% Change from Prior Year
$459,377
12,6438,422
00
4,704
7,660
320,0920
$425,948
FY08Expense
$9,7212.16%
$34,719$87,715Non Labor Sub-Total $94,243 $73,683 $33,429
95,41374,303Benefits 67,832 86,623 105,856
Administrative
Clerical
Management
MaintenanceOperator
Professional
Represented
Supervisory
0
0
1
0
0
1
0
0
0
0
1
0
0
1
0
0
Non-Represented 2 2
Part - Time 0 0
Represented 0 0
Full-Time Total 2 2
Contract 0 0
Capital 0 0
Authorized Positions by Class
Administrative Total 2 2
Authorized Positions by Status
Represented Total 0 0
0
0
1
0
0
0
0
0
1
0
0
1
0
0
1
0
1
0
2
0
0
1
0
1
5
0
0
5
0
0
4
0
FY10FY09 FY07FY06 FY10FY09 FY07FY06
Clayton 0 000
2
0
0
2
0
0
FY08
0
0
0
1
0
0
1
0
0
2
0
FY08
130
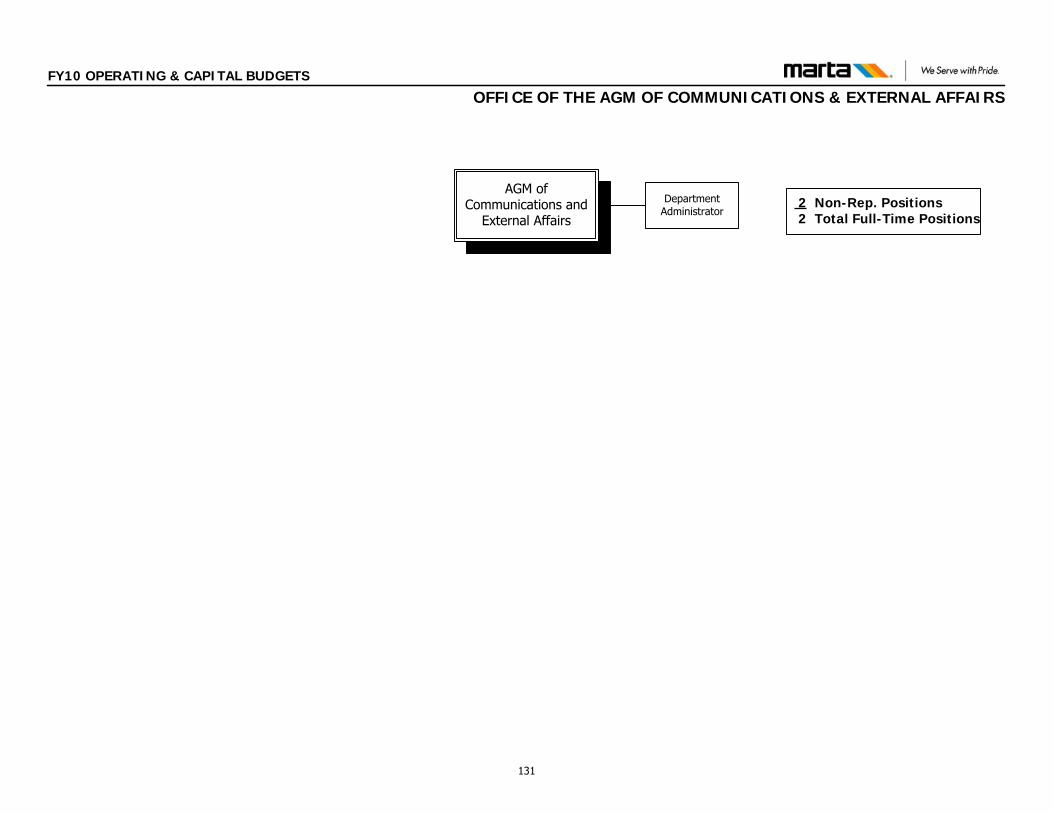
2 Non-Rep. Positions 2 Total Full-Time Positions
AGM of Communications and
External Affairs
Department Administrator
FY10 OPERATING & CAPITAL BUDGETS
OFFICE OF THE AGM OF COMMUNICATIONS & EXTERNAL AFFAIRS
131
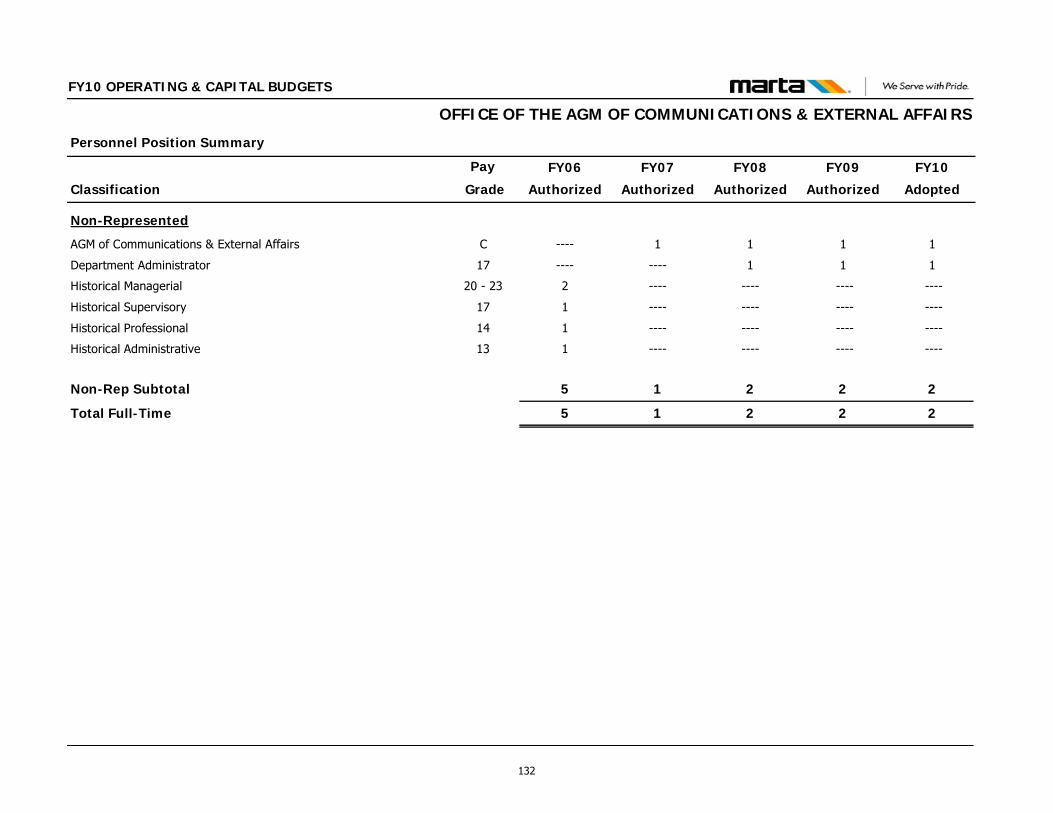
Classification
Personnel Position Summary
Pay FY09
Authorized
FY10
Adopted
FY10 OPERATING & CAPITAL BUDGETS
FY08
Authorized
FY07
Authorized
FY06
Authorized Grade
OFFICE OF THE AGM OF COMMUNICATIONS & EXTERNAL AFFAIRS
Non-Represented
AGM of Communications & External Affairs C 1 111----
Department Administrator 17 1 11--------
Historical Managerial 20 - 23 ---- ------------2
Historical Supervisory 17 ---- ------------1
Historical Professional 14 ---- ------------1
Historical Administrative 13 ---- ------------1
Non-Rep Subtotal 2 2215
Total Full-Time 2 2215
132
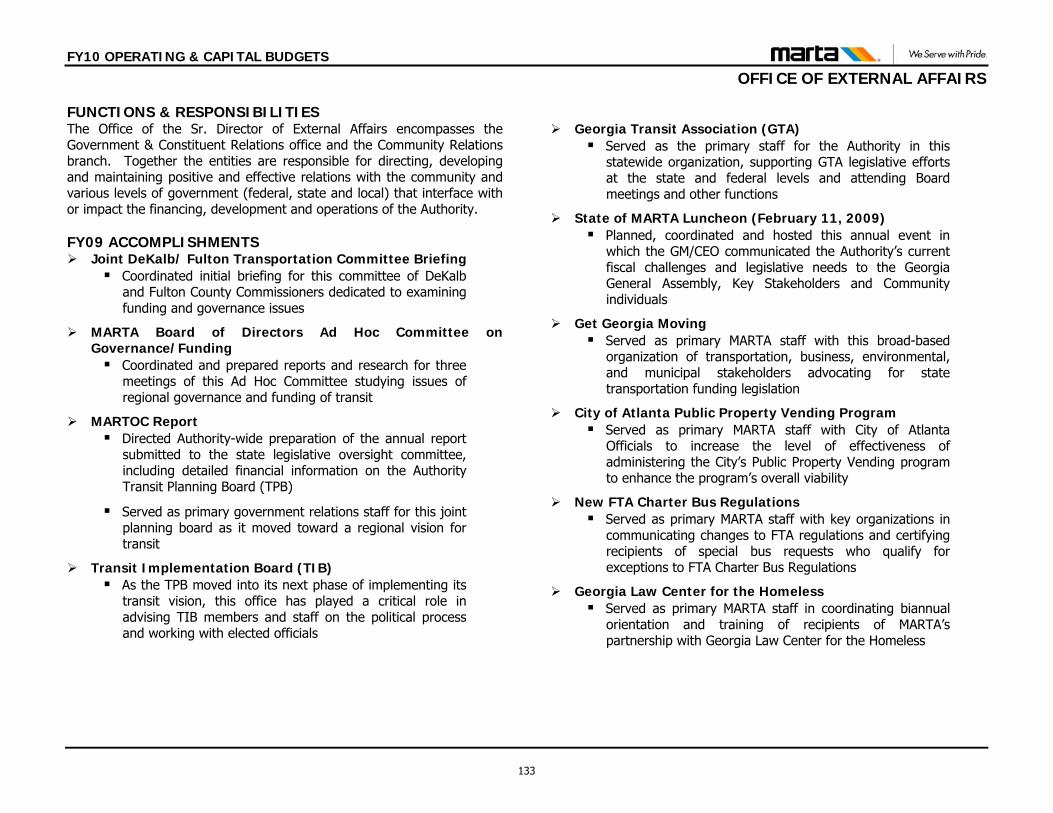
FY10 OPERATING & CAPITAL BUDGETS
OFFICE OF EXTERNAL AFFAIRS
FUNCTIONS & RESPONSIBILITIES The Office of the Sr. Director of External Affairs encompasses the Government & Constituent Relations office and the Community Relations branch. Together the entities are responsible for directing, developing and maintaining positive and effective relations with the community and various levels of government (federal, state and local) that interface with or impact the financing, development and operations of the Authority. FY09 ACCOMPLISHMENTS Joint DeKalb/ Fulton Transportation Committee Briefing
Coordinated initial briefing for this committee of DeKalb and Fulton County Commissioners dedicated to examining funding and governance issues
MARTA Board of Directors Ad Hoc Committee on Governance/Funding Coordinated and prepared reports and research for three
meetings of this Ad Hoc Committee studying issues of regional governance and funding of transit
MARTOC Report Directed Authority-wide preparation of the annual report
submitted to the state legislative oversight committee, including detailed financial information on the Authority Transit Planning Board (TPB)
Served as primary government relations staff for this joint planning board as it moved toward a regional vision for transit
Transit Implementation Board (TIB) As the TPB moved into its next phase of implementing its
transit vision, this office has played a critical role in advising TIB members and staff on the political process and working with elected officials
Georgia Transit Association (GTA)
Served as the primary staff for the Authority in this statewide organization, supporting GTA legislative efforts at the state and federal levels and attending Board meetings and other functions
State of MARTA Luncheon (February 11, 2009) Planned, coordinated and hosted this annual event in
which the GM/CEO communicated the Authority’s current fiscal challenges and legislative needs to the Georgia General Assembly, Key Stakeholders and Community individuals
Get Georgia Moving Served as primary MARTA staff with this broad-based
organization of transportation, business, environmental, and municipal stakeholders advocating for state transportation funding legislation
City of Atlanta Public Property Vending Program Served as primary MARTA staff with City of Atlanta
Officials to increase the level of effectiveness of administering the City’s Public Property Vending program to enhance the program’s overall viability
New FTA Charter Bus Regulations Served as primary MARTA staff with key organizations in
communicating changes to FTA regulations and certifying recipients of special bus requests who qualify for exceptions to FTA Charter Bus Regulations
Georgia Law Center for the Homeless Served as primary MARTA staff in coordinating biannual
orientation and training of recipients of MARTA’s partnership with Georgia Law Center for the Homeless
133

FY10 OPERATING & CAPITAL BUDGETS
OFFICE OF EXTERNAL AFFAIRS
$629,286$893,816
4,9985,924
00
102
8,269
8,7216,193
770
274
12,069
Contractual ServicesMaterials & SuppliesOther OperatingCasualty & LiabilityMiscellaneous
Other Non Operating
Office Total
408,258589,518Salaries & Wages00Overtime
$609,993$866,482Labor Sub-Total
FY09 FY10Categories of Expense
$439,266
15,1817,168
56100
18,040
305,9320
$398,316
FY06
$951,358
9,3721,483
2170
1,371
16,921
669,172962
$921,994
FY07Expense Expense Expense Adopted
($264,530)$19,648$512,092-29.60%2.25%116.58%
$ Change from Prior Year% Change from Prior Year
$874,168
9,7683,211
00
1,776
13,972
585,1510
$845,441
FY08Expense
($77,190)-8.11%
$19,293$27,334Non Labor Sub-Total $40,950 $29,364 $28,727
201,735276,964Benefits 92,384 251,860 260,290
Administrative
Clerical
Management
MaintenanceOperator
Professional
Represented
Supervisory
1
0
2
0
0
3
0
0
1
0
2
0
0
3
0
0
Non-Represented 6 6
Part - Time 0 0
Represented 0 0
Full-Time Total 6 6
Contract 0 0
Capital 0 0
Authorized Positions by Class
Administrative Total 6 6
Authorized Positions by Status
Represented Total 0 0
1
0
3
0
0
3
0
0
7
0
0
7
0
0
7
0
0
0
3
0
0
1
0
0
4
0
0
4
0
0
4
0
FY10FY09 FY07FY06 FY10FY09 FY07FY06
Clayton 0 000
8
0
0
8
0
0
FY08
0
1
0
3
0
0
4
0
0
8
0
FY08
134
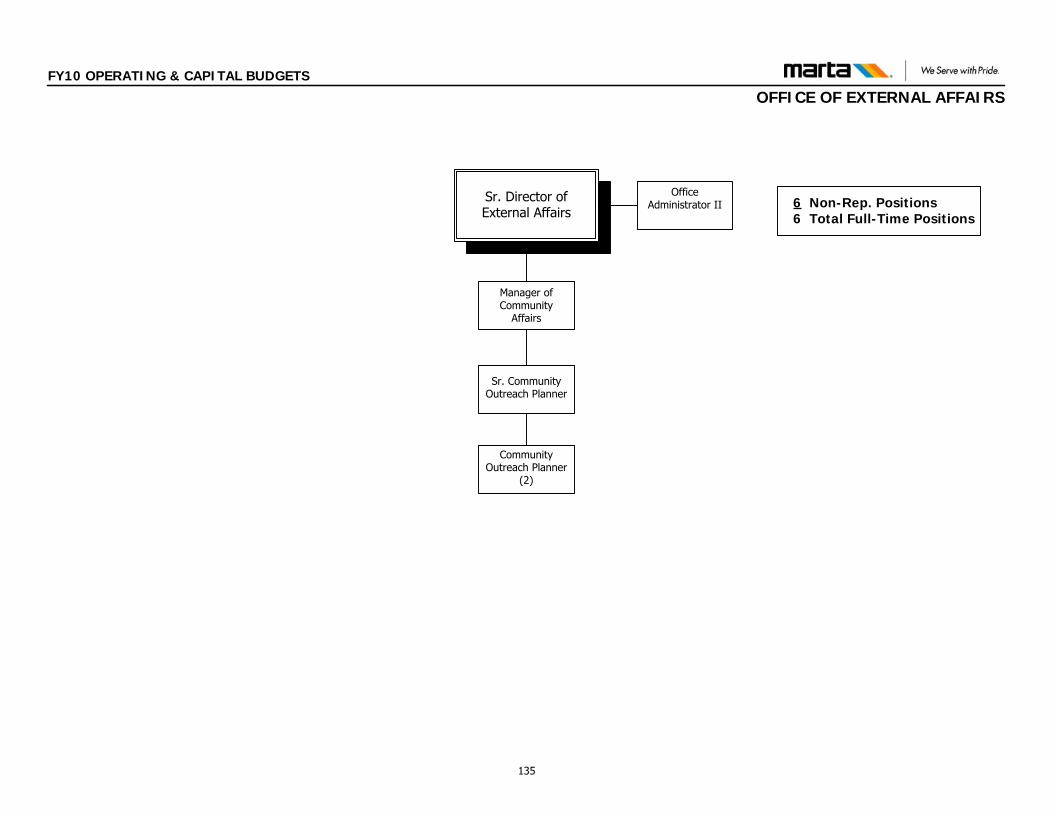
6 Non-Rep. Positions 6 Total Full-Time Positions
Manager of Community
Affairs
Sr. Director of External Affairs
Office Administrator II
Sr. Community Outreach Planner
Community Outreach Planner
(2)
FY10 OPERATING & CAPITAL BUDGETS
OFFICE OF EXTERNAL AFFAIRS
135
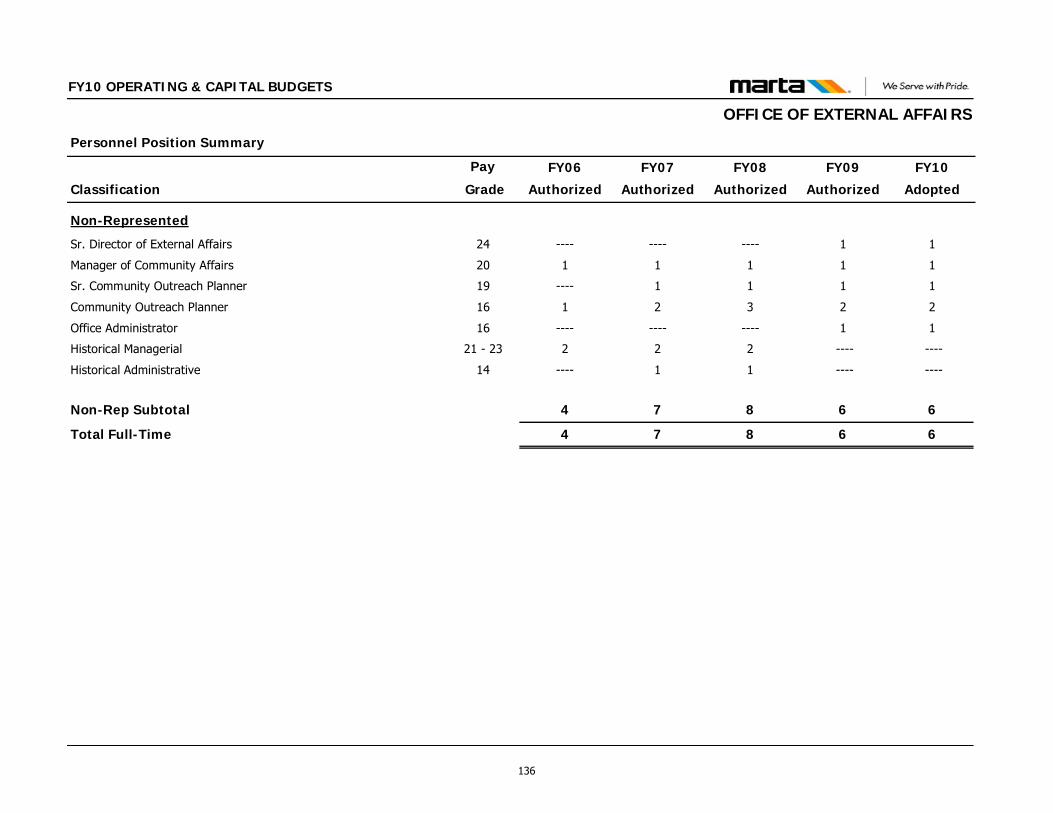
Classification
Personnel Position Summary
Pay FY09
Authorized
FY10
Adopted
FY10 OPERATING & CAPITAL BUDGETS
FY08
Authorized
FY07
Authorized
FY06
Authorized Grade
OFFICE OF EXTERNAL AFFAIRS
Non-Represented
Sr. Director of External Affairs 24 1 1------------
Manager of Community Affairs 20 1 1111
Sr. Community Outreach Planner 19 1 111----
Community Outreach Planner 16 2 2321
Office Administrator 16 1 1------------
Historical Managerial 21 - 23 ---- ----222
Historical Administrative 14 ---- ----11----
Non-Rep Subtotal 6 6874
Total Full-Time 6 6874
136
FY10 OPERATING & CAPITAL BUDGETS
OFFICE OF MARKETING & SALES FUNCTIONS & RESPONSIBILITIES The Office of Marketing & Communications is responsible for creating employee communications as well as all communication directed towards MARTA’s daily riders, devising and implementing strategic marketing initiatives, developing strategic sales plans, as well as identifying opportunities for the Authority to earn non-traditional revenue streams while increasing market share, building customer loyalty and brand awareness. Our mission is to devise reasonable and effective marketing initiatives and plans that are measured by consumer awareness, a potential increase in ridership within the targeted market or an increase in customer loyalty and brand awareness. All of MARTA’s daily customer communication (content, layout/design), which includes: system maps, rail maps, TRN, TTN and SignPost messaging, service changes, itsmarta.com, and breezcard.com are the responsibility of this group. Additionally, the group coordinates the Authority’s advertising initiatives, monitors the advertising vendors, forms strategic alliances and supervises special projects as they relate to the end user, the customer. The Strategic Sales team, which is part of the Business Development group, primarily focuses on increasing group sales revenue and market share within the designated sales channels; Corporations, Government Agencies, Nonprofits (Employer Pass Program), University (Upass Program), School Systems K-12 (Student Pass Program), Conventions and Hospitality (Visitor Pass Program). These programs generate approximately $22 million in annual revenue for the Authority and assist in building business relationships by providing mutually beneficial incentives to the members while contributing to the overall perception and viability of public transit. The Business Development group takes the lead on identifying, conducting due diligence and developing a business case for all non-traditional revenue generating initiatives that will enhance the customers’ experience while riding MARTA.
FY09 ACCOMPLISHMENTS In partnership with Creating Pride developed and implemented the
MARTA Arts Education Program, which engaged schools (primary, secondary and high), Media and the general public to have a vested interest in MARTA, allowed us to give back to the communities we serve and to integrate a positive image.
Devised and executed APTA’s National Dump the Pump Day to employ daily riders, non-riders and MARTA employees to take transit and help save the environment and reduce traffic congestion.
Developed and implemented Customer Holiday Appreciation event.
System Advertising generated the following revenue during FY09: Transit - $5.65 million, Shelter - $850,000, CBS Rail TV Screens - $275,000, SignPost - $155,000. In addition, 10 stations were upgrade with new LCD screens.
Sales Programs generated the following revenue during FY09: Partnership - $16,231,436, UPASS - 4,318,649, K-12 - $836,527, Visitors Pass - $91,282.25.
Achieved successful approval of new bus shelter contract. New contract provides the Authority with the following benefits: Approximately 380 bus shelters (ten years old or
older) will be replaced with the new design over the next 12-18 months.
All other shelters (advertising and non-advertising) will be replaced as they reach the ten year threshold.
CBS will build (new design) ten (10) non-advertising shelters in MARTA designated locations per year over the fifteen year term of the agreement.
Commission percentage improves from 15% to 35% over previous contract.
137
FY10 OPERATING & CAPITAL BUDGETS
OFFICE OF MARKETING & SALES CBS (effective with new agreement), assumed the maintenance
(cleaning and repair) of all shelters (advertising and non-advertising) over the term of the agreement saving the Authority $300,000 per year or over $4.5 million for the contract term.
CBS will pay $35.5 million as a minimum guarantee (50% to MARTA and 50% to the local jurisdictions) or $17.75 million to MARTA over the contract term. This represents an increase of over 260% from the previous contract.
Successfully partnered with the following organizations to extend the MARTA reach and brand: Taste of Atlanta, WNBA Atlanta Dream, Peachtree Road Race, Atlanta Hawks and Thrashers,
Fiesta Atlanta (Hispanic Partners), Underground Atlanta, Brand Atlanta, Civic Center, Woodruff Arts Center, Future Cities Program, GDOT and Clean Air Campaign.
Developed and implemented internal and external communications plans for the following initiatives: Gun Bill, H1N1 Swine Flu, Service Changes, Town Hall meetings, Community Forums, Public Hearings, Holiday Service Communications (New Years, July 4th, Halloween, Thanksgiving and Christmas), Cost Containment, C-Tran updates, Charity Golf Tournaments and Breeze information.
Worked in partnership with Rail Ops for the successful completion of the 2009 Rail Rodeo.
138

FY10 OPERATING & CAPITAL BUDGETS
OFFICE OF MARKETING & SALES
$1,578,887$1,506,827
84,12721,783
00
211,273
6,299
88,32040,201
00
249,198
5,306
Contractual ServicesMaterials & SuppliesOther OperatingCasualty & LiabilityMiscellaneous
Other Non Operating
Office Total
854,057760,327Salaries & Wages0485Overtime
$1,255,405$1,123,802Labor Sub-Total
FY09 FY10Categories of Expense
$2,242,949
213,57228,023
4720
347,874
172,102
1,116,9814,375
$1,480,906
FY06
$1,427,976
238,8462,616
00
247,940
6,113
636,9530
$932,461
FY07Expense Expense Expense Adopted
$72,060($80,541)($814,973)4.78%-5.07%-36.33%
$ Change from Prior Year% Change from Prior Year
$1,587,368
140,60443,656
00
311,598
5,203
762,8110
$1,086,307
FY08Expense
$159,39211.16%
$323,482$383,025Non Labor Sub-Total $762,043 $495,515 $501,061
401,347362,990Benefits 359,550 295,508 323,496
Administrative
Clerical
Management
MaintenanceOperator
Professional
Represented
Supervisory
3
0
4
0
0
8
0
1
3
0
4
0
0
7
0
1
Non-Represented 14 13
Part - Time 0 0
Represented 0 0
Full-Time Total 14 13
Contract 1 1
Capital 1 1
Authorized Positions by Class
Administrative Total 15 14
Authorized Positions by Status
Represented Total 0 0
3
0
4
0
0
6
0
1
14
0
0
14
0
0
13
0
6
0
6
0
0
7
0
1
18
1
0
18
1
0
19
0
FY10FY09 FY07FY06 FY10FY09 FY07FY06
Clayton 0 000
14
0
0
14
0
1
FY08
0
3
0
4
0
0
7
0
1
14
0
FY08
139
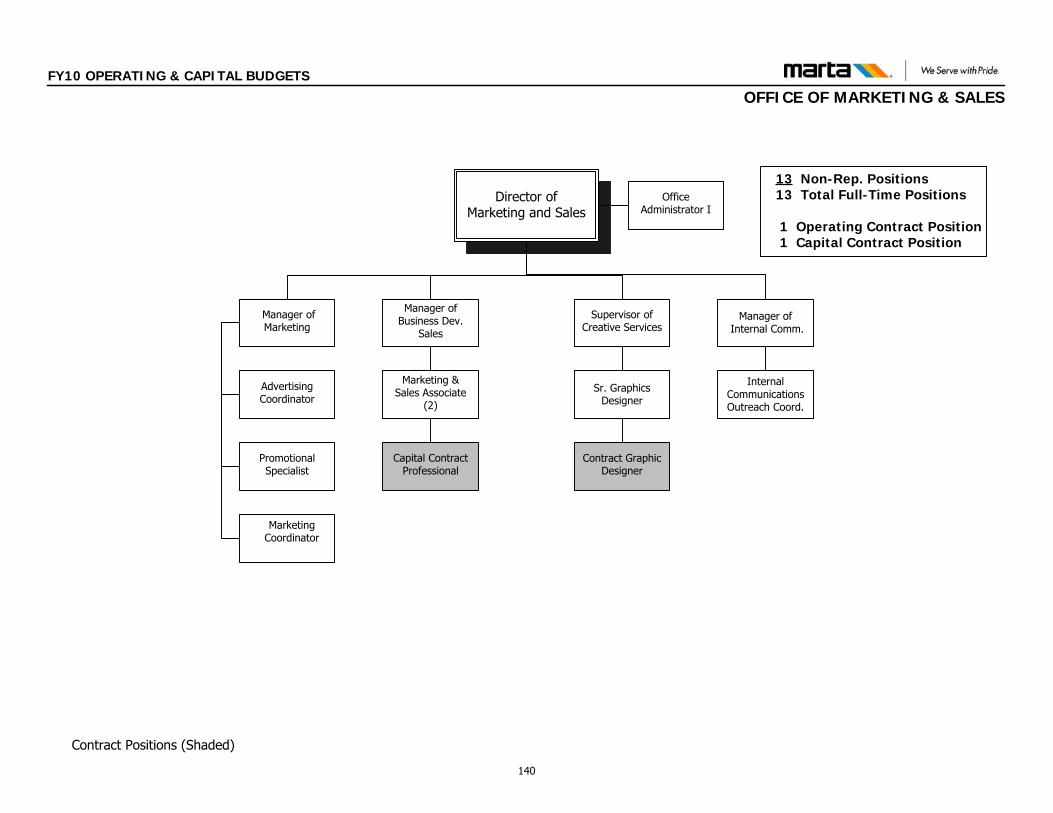
13 Non-Rep. Positions 13 Total Full-Time Positions
1 Operating Contract Position 1 Capital Contract Position
Director of Marketing and Sales
Office Administrator I
Manager of Business Dev.
Sales
Marketing & Sales Associate
(2)
Manager of Marketing
Marketing Coordinator
Advertising Coordinator
Promotional Specialist
Supervisor of Creative Services
Contract Graphic Designer
Contract Positions (Shaded)
Sr. GraphicsDesigner
Manager of Internal Comm.
Internal Communications Outreach Coord.
Capital Contract Professional
FY10 OPERATING & CAPITAL BUDGETS
OFFICE OF MARKETING & SALES
140
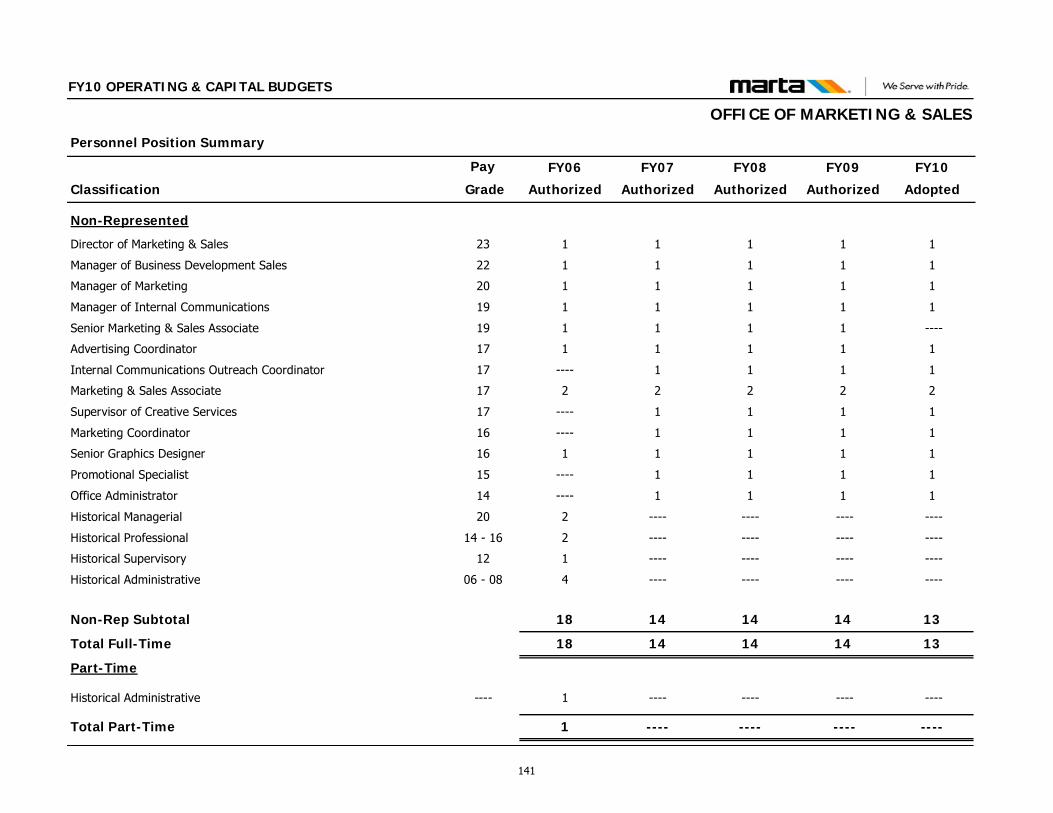
Classification
Personnel Position Summary
Pay FY09
Authorized
FY10
Adopted
FY10 OPERATING & CAPITAL BUDGETS
FY08
Authorized
FY07
Authorized
FY06
Authorized Grade
OFFICE OF MARKETING & SALES
Non-Represented
Director of Marketing & Sales 23 1 1111
Manager of Business Development Sales 22 1 1111
Manager of Marketing 20 1 1111
Manager of Internal Communications 19 1 1111
Senior Marketing & Sales Associate 19 1 ----111
Advertising Coordinator 17 1 1111
Internal Communications Outreach Coordinator 17 1 111----
Marketing & Sales Associate 17 2 2222
Supervisor of Creative Services 17 1 111----
Marketing Coordinator 16 1 111----
Senior Graphics Designer 16 1 1111
Promotional Specialist 15 1 111----
Office Administrator 14 1 111----
Historical Managerial 20 ---- ------------2
Historical Professional 14 - 16 ---- ------------2
Historical Supervisory 12 ---- ------------1
Historical Administrative 06 - 08 ---- ------------4
Non-Rep Subtotal 14 13141418
Total Full-Time 14 13141418
Part-Time
Historical Administrative ---- ---- ------------1
Total Part-Time ---- ------------1
141
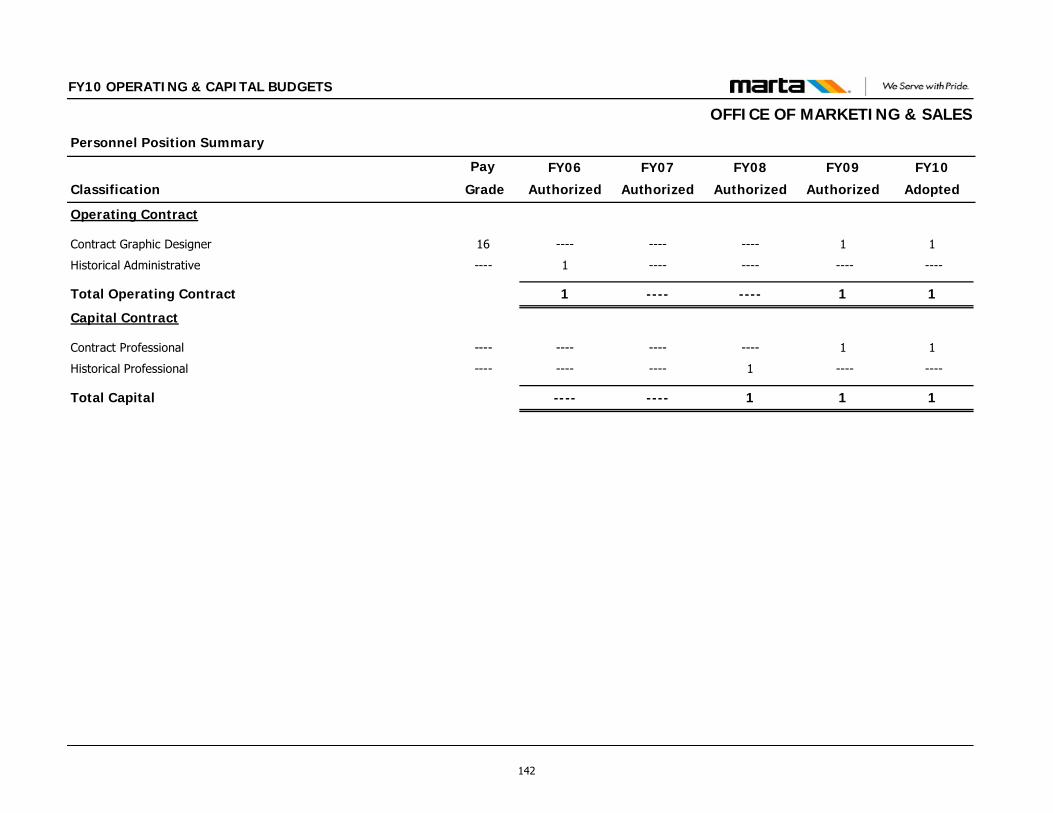
Classification
Personnel Position Summary
Pay FY09
Authorized
FY10
Adopted
FY10 OPERATING & CAPITAL BUDGETS
FY08
Authorized
FY07
Authorized
FY06
Authorized Grade
OFFICE OF MARKETING & SALES
Operating Contract
Contract Graphic Designer 16 1 1------------
Historical Administrative ---- ---- ------------1
Total Operating Contract 1 1--------1
Capital Contract
Contract Professional ---- 1 1------------
Historical Professional ---- ---- ----1--------
Total Capital 1 11--------
142
FY10 OPERATING & CAPITAL BUDGETS
OFFIC
E OF GOVERNMENT & CONSTITUENT RELATIONS
FUNCTIONS & RESPONSIBILITIES The Office of Government & Constituent Relations is responsible for directing, developing and maintaining positive and effective relations with the community and various levels of government (federal, state and local) that interface with or impact the financing, development and operations of the authority. FY09 ACCOMPLISHMENTS 2009 State Legislative Session
Passage of SB 89 – Allowing the consumption of food/beverages in a rapid rail station/intermodal bus station, with the goal of enhancing potential revenue opportunities through public/private partnerships
Congressional/Federal Involvement
Facilitated receipt of more than $60 million in American Recovery and Reinvestment Act (ARRA) economic stimulus funds for the Authority
Supported efforts to pass a provision allowing 10% of ARRA funds to be used for Operating Assistance
Dialogue with Senator Richard Durbin advocating for MARTA inclusion in the “State of Good Repair” category
Advocated for Senator Robert Menendez’s legislation addressing the SILO/LILO issue in a favorable way for the Authority
Jurisdictional Briefings
Coordinated First Quarter Briefings for DeKalb and Fulton County Commissioners and City of Atlanta Council Members.
Coordinated Second Quarter Briefings for DeKalb and Fulton County Commissioners and City of Atlanta Council Members
Community Outreach Adopt A-Bus-Stop System
Keep DeKalb Beautiful and MARTA are implementing an Adopt A MARTA Bus Stop Initiative. Within DeKalb County eleven (11) bus stop locations have been adopted and the program has great potential to be expanded into other parts of the MARTA service area.
Keep Atlanta Beautiful (KAB) and MARTA are in the initial
phases of implementing an Adopt A MARTA Bus Stop Initiative to include the participation of the West End Academy, which has proposed to adopt the Westend, Oakland City and Ashby transit Stations for the purpose of planting flowers and vegetation to enhance the image of the stations. Additionally, the West End Academy has already adopted the Beltline (Gordon White) Park at Ralph David Abernathy Boulevard at Langhorn & White Streets.
Community Forums – Phase I (December 15, 2008-January
13, 2009) – The Authority sought input on how MARTA can effectively deal with the current turbulent financial climate through “deficit reduction strategies” so that the Authority can continue and improve providing the best service for you and your community. DeKalb County Public Library-January 7, 2009 – Attendees 85/
Comment Forms 26 College Park Public Safety Complex – January 8, 2009 –
Attendees 32/Comment Forms 3 MARTA HQ – January 10, 2009 – Attendees 134/Comment
Cards 45 Senior/Disabled Community Forum and EDAAC (Wachovia
Annex) – January 13, 2009 – Attendees 200/ Comment Forms 0 Employee Forums – (December 15, 2008-January 13, 2009)
Coordinated by External Affairs Staff and were held to educate employees on the Authority’s Financial Challenges and to seek their help in Deficit Reduction Strategies. Additionally, input from these meetings served as input to the MARTA Board of Directors. Tuesday, January 6, 2009 – Locations were: Avondale
Maintenance of Way, Laredo Garage, Hamilton Garage and C-Tran
Friday, January 9, 2009 – Locations were: Headquarters Annex, Perry Garage and Headquarters Atrium
143
FY10 OPERATING & CAPITAL BUDGETS
OFFI
CE OF GOVERNMENT & CONSTITUENT RELATIONS
Community Outreach Meetings – Phase II (January 13, 2009 – March 2, 2009) – FY2010 budget discussed. External Affairs Community Outreach Staff attended 70 community outreach meetings within the Metro Atlanta area with a total of 2,990 individuals in attendance. City of Atlanta – 40 meetings were held in this jurisdiction with
1, 737 people in attendance. Fulton County – 8 meetings were held within this jurisdiction
with 303 people in attendance. DeKalb County – 18 meetings were held within this jurisdiction
with 850 people in attendance. Cobb County – 1 meeting was held within this jurisdiction with
520 people in attendance. Rockdale County – 1 meeting was held within this jurisdiction
with 50 people in attendance. Community Outreach Meeting – Phase III (March 30, 2009) –
Clicker Technology was utilized at this meeting to capture immediate response from the community. Additionally this meeting was held immediately after the Business Management Committee Meeting with a viewing screen set up in the Atrium for individuals to view proceedings of meeting. MARTA HQ – 220 attended this meeting.
FY2010 Budget Public Hearings – Held June 16 & 17, 2009 – The public’s response to a fare increase and specific service changes were heard. June 16, 2009 (Atlanta City Hall) - Attended by 106 people with
56 speakers, 6 people from the Media and 24 Board Members and Staff.
June 16, 2009 (North Fulton Service Center - Attended by 19 people with 8 speakers, 2 people from the Media and 21 Board Members and Staff .
June 17, 2009 (South Fulton Service Center) - Attended by 34 people with 12 speakers, 2 people from the Media and 27 Board members and Staff.
June 17, 2009 (DeKalb Maloof Auditorium) - Attended by 91 people with 41 speakers, 2 people from the Media and 15 Board members and Staff.
External Meetings – The External Affairs office coordinates
all external meetings for the General Manager/ CEO. External Affairs staff has researched and provided the GM/CEO
with all background information for all external meetings the GM/CEO attends. The staff has prepared briefing packets containing issues and history related to each of these meetings.
The Staff of external Affairs works as liaisons between the GM/CEO and any person, group or organization requesting a meeting with the General Meeting.
Tours of the Authority by Requesting Delegations – The
External Affairs office coordinates all tours of the Authority by Domestic and International visiting Delegations. February 13, 2009, Odakyu Group, a privately operated
transportation company which operates a railway system, department stores, hotels, taxis, real estate, and a charter bus company in Tokyo, Japan received an overview of MARTA’s TOD projects, MARTA’s history, planning initiatives, sustainability initiatives, a walking TOD tour, and a comprehensive tour of Armour Yard Maintenance facility.
July 1, 2009, First Lego League toured MARTA’s Armour Yard Rail facility. First Lego League is a global robotics program that ignites an enthusiasm for discovery, science and technology in kids ages 9-14. Eight students and 5 adults toured Armour Yard to learn how MARTA is currently moving masses of people through Atlanta and to see what steps MARTA is taking to continue to improve the efficiency of transit in the future.
Statewide Bus Rodeo – Coordinated the Statewide Bus
Rodeo Coordinated all aspects of the Statewide Bus Rodeo Banquet
including ensuring welcome packets, invitations, event programs, registration material, gift bags, and volunteers were in place for the event and for the bus rodeo event.
144
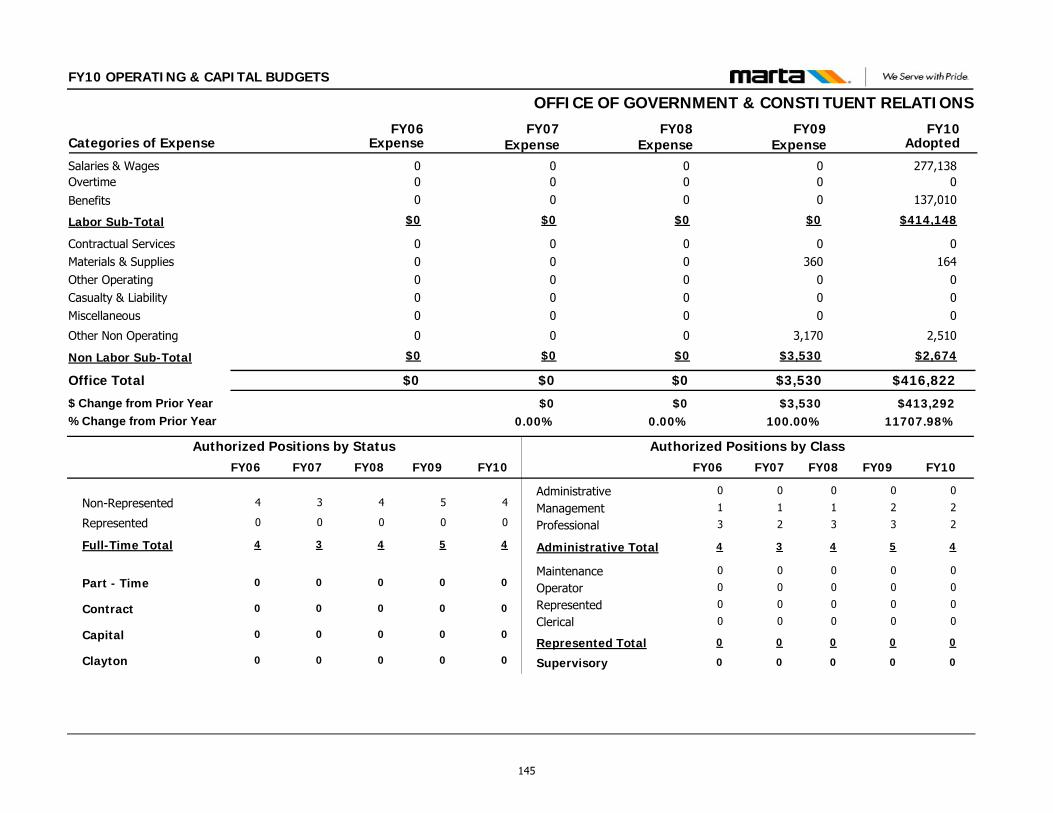
FY10 OPERATING & CAPITAL BUDGETS
OFFICE OF GOVERNMENT & CONSTITUENT RELATIONS
$416,822$3,530
0164
000
2,510
0360
000
3,170
Contractual ServicesMaterials & SuppliesOther OperatingCasualty & LiabilityMiscellaneous
Other Non Operating
Office Total
277,1380Salaries & Wages00Overtime
$414,148$0Labor Sub-Total
FY09 FY10Categories of Expense
$0
00000
0
00
$0
FY06
$0
00000
0
00
$0
FY07Expense Expense Expense Adopted
$413,292$3,530$011707.98%100.00%0.00%
$ Change from Prior Year% Change from Prior Year
$0
00000
0
00
$0
FY08Expense
$00.00%
$2,674$3,530Non Labor Sub-Total $0 $0 $0
137,0100Benefits 0 0 0
Administrative
Clerical
Management
MaintenanceOperator
Professional
Represented
Supervisory
0
0
2
0
0
3
0
0
0
0
2
0
0
2
0
0
Non-Represented 5 4
Part - Time 0 0
Represented 0 0
Full-Time Total 5 4
Contract 0 0
Capital 0 0
Authorized Positions by Class
Administrative Total 5 4
Authorized Positions by Status
Represented Total 0 0
0
0
1
0
0
2
0
0
3
0
0
3
0
0
3
0
0
0
1
0
0
3
0
0
4
0
0
4
0
0
4
0
FY10FY09 FY07FY06 FY10FY09 FY07FY06
Clayton 0 000
4
0
0
4
0
0
FY08
0
0
0
1
0
0
3
0
0
4
0
FY08
145
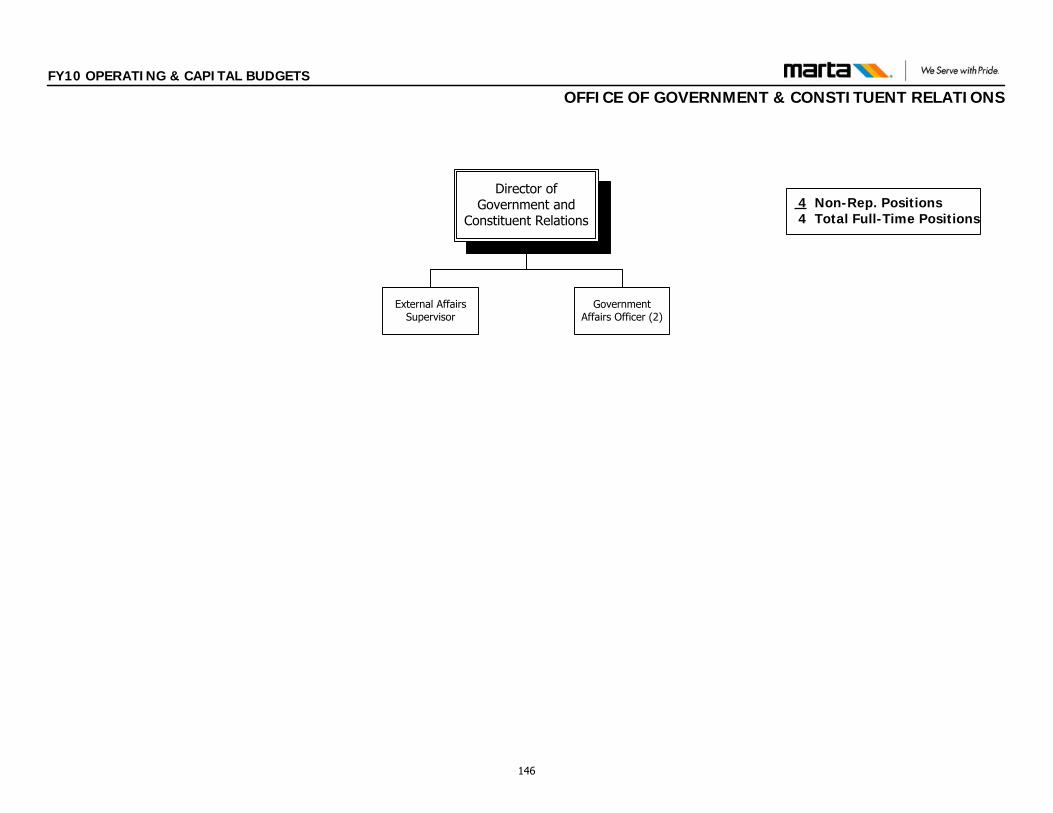
4 Non-Rep. Positions 4 Total Full-Time Positions
Director of Government and
Constituent Relations
External Affairs Supervisor
Government Affairs Officer (2)
FY10 OPERATING & CAPITAL BUDGETS
OFFICE OF GOVERNMENT & CONSTITUENT RELATIONS
146
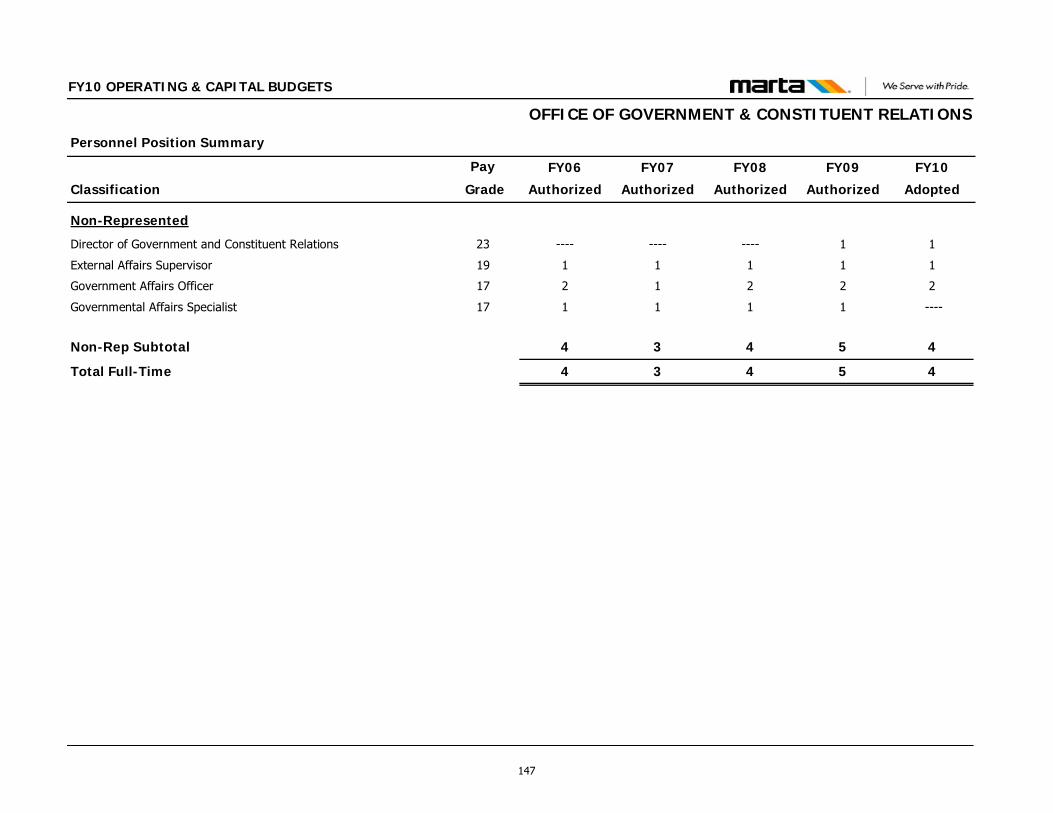
Classification
Personnel Position Summary
Pay FY09
Authorized
FY10
Adopted
FY10 OPERATING & CAPITAL BUDGETS
FY08
Authorized
FY07
Authorized
FY06
Authorized Grade
OFFICE OF GOVERNMENT & CONSTITUENT RELATIONS
Non-Represented
Director of Government and Constituent Relations 23 1 1------------
External Affairs Supervisor 19 1 1111
Government Affairs Officer 17 2 2212
Governmental Affairs Specialist 17 1 ----111
Non-Rep Subtotal 5 4434
Total Full-Time 5 4434
147
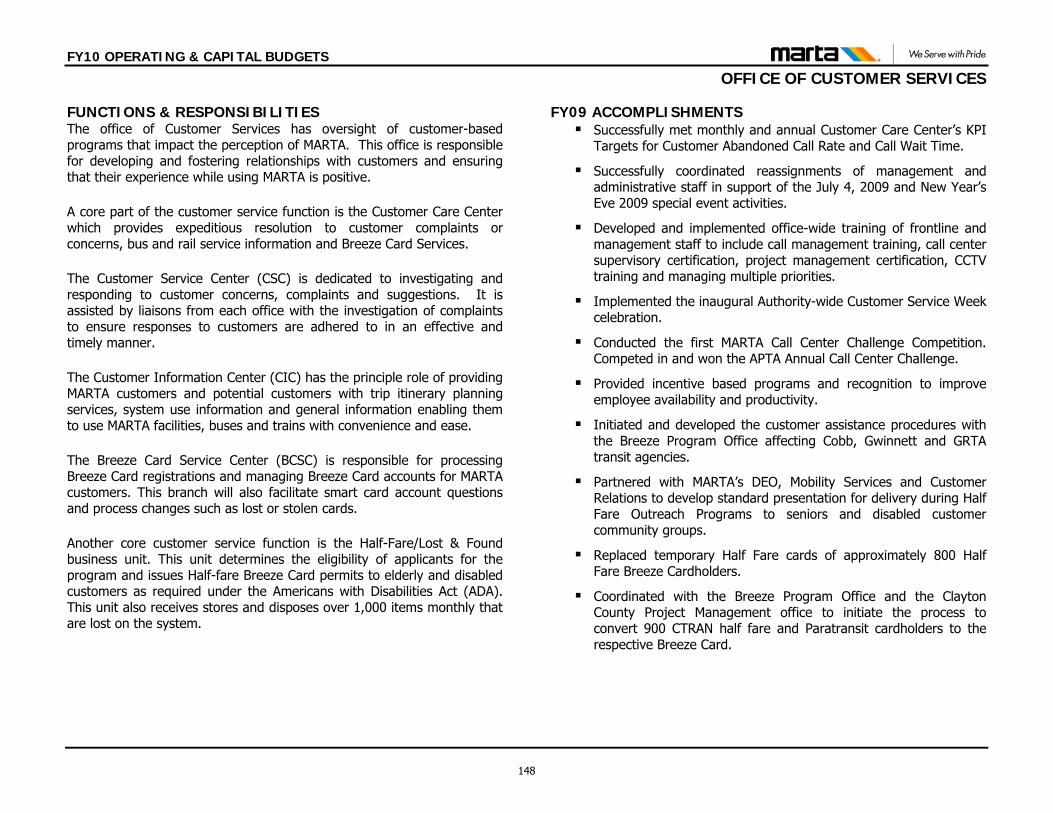
FY10 OPERATING & CAPITAL BUDGETS
O F
F ICE OF CUSTOMER SERVICES
FUNCTIONS & RESPONSIBILITIES The office of Customer Services has oversight of customer-based programs that impact the perception of MARTA. This office is responsible for developing and fostering relationships with customers and ensuring that their experience while using MARTA is positive.
A core part of the customer service function is the Customer Care Center which provides expeditious resolution to customer complaints or concerns, bus and rail service information and Breeze Card Services.
The Customer Service Center (CSC) is dedicated to investigating and responding to customer concerns, complaints and suggestions. It is assisted by liaisons from each office with the investigation of complaints to ensure responses to customers are adhered to in an effective and timely manner.
The Customer Information Center (CIC) has the principle role of providing MARTA customers and potential customers with trip itinerary planning services, system use information and general information enabling them to use MARTA facilities, buses and trains with convenience and ease.
The Breeze Card Service Center (BCSC) is responsible for processing Breeze Card registrations and managing Breeze Card accounts for MARTA customers. This branch will also facilitate smart card account questions and process changes such as lost or stolen cards.
Another core customer service function is the Half-Fare/Lost & Found business unit. This unit determines the eligibility of applicants for the program and issues Half-fare Breeze Card permits to elderly and disabled customers as required under the Americans with Disabilities Act (ADA). This unit also receives stores and disposes over 1,000 items monthly that are lost on the system.
FY09 ACCOMPLISHMENTS Successfully met monthly and annual Customer Care Center’s KPI
Targets for Customer Abandoned Call Rate and Call Wait Time.
Successfully coordinated reassignments of management and administrative staff in support of the July 4, 2009 and New Year’s Eve 2009 special event activities.
Developed and implemented office-wide training of frontline and management staff to include call management training, call center supervisory certification, project management certification, CCTV training and managing multiple priorities.
Implemented the inaugural Authority-wide Customer Service Week celebration.
Conducted the first MARTA Call Center Challenge Competition. Competed in and won the APTA Annual Call Center Challenge.
Provided incentive based programs and recognition to improve employee availability and productivity.
Initiated and developed the customer assistance procedures with the Breeze Program Office affecting Cobb, Gwinnett and GRTA transit agencies.
Partnered with MARTA’s DEO, Mobility Services and Customer Relations to develop standard presentation for delivery during Half Fare Outreach Programs to seniors and disabled customer community groups.
Replaced temporary Half Fare cards of approximately 800 Half Fare Breeze Cardholders.
Coordinated with the Breeze Program Office and the Clayton County Project Management office to initiate the process to convert 900 CTRAN half fare and Paratransit cardholders to the respective Breeze Card.
148
FY1
0 OPERATING & CAPITAL BUDGETS
OFFICE OF CUSTOMER SERVICES
Developed Half Fare/Lost & Found employee handbooks which communicate standard operating procedures, codes of conduct and general operating instructions to frontline employees.
Updated the Authority’s Lost & Found operational procedures to include coordination with various departments within MARTA, the lost & found office of Hartsfield-Jackson Airport and various other entities.
Coordinated technology projects and upgrades to improve the reliability of the travel-related and general information disseminated to callers.
Conducted monthly meetings with the Department of Technology to facilitate improved call center performance.
Improved MARTA’s disabled customer’s access to the Customer Care Center by installing new TTY equipment.
Reduced response time to customer inquiries related to bus locations by installing Transit Master mapping software that provides real-time bus locations by AVL and GPS tracking.
Revised the Bus Operator Complaint Resolution process.
Improved the presence of bi-lingual staff in the Customer Care Center by attending bi-lingual job fairs throughout the metropolitan area.
149

FY10 OPERATING & CAPITAL BUDGETS
OFFICE OF CUSTOMER SERVICES
$3,261,970$3,288,557
4,65718,012
000
7,532
39,41815,929
000
9,126
Contractual ServicesMaterials & SuppliesOther OperatingCasualty & LiabilityMiscellaneous
Other Non Operating
Office Total
2,089,0932,099,434Salaries & Wages117,745142,058Overtime
$3,231,769$3,224,084Labor Sub-Total
FY09 FY10Categories of Expense
$8,255,533
247,515112,918
21700
8,495
5,292,067697,067
$7,886,388
FY06
$3,585,907
197,24318,946
000
8,694
2,126,191103,506
$3,361,024
FY07Expense Expense Expense Adopted
($26,587)($566,295)($4,669,626)-0.81%-14.69%-56.56%
$ Change from Prior Year% Change from Prior Year
$3,854,852
25,76018,193
000
2,684
2,426,189116,819
$3,808,215
FY08Expense
$268,9457.50%
$30,201$64,473Non Labor Sub-Total $369,145 $224,883 $46,637
1,024,931982,592Benefits 1,897,254 1,131,327 1,265,207
Administrative
Clerical
Management
MaintenanceOperator
Professional
Represented
Supervisory
5
1
4
0
0
15
27
5
5
1
4
0
0
15
27
5
Non-Represented 27 27
Part - Time 4 4
Represented 26 26
Full-Time Total 53 53
Contract 0 0
Capital 0 0
Authorized Positions by Class
Administrative Total 24 24
Authorized Positions by Status
Represented Total 28 28
6
1
4
0
0
16
28
5
28
4
27
55
1
0
26
29
2
0
5
0
0
15
27
2
24
6
21
45
0
0
22
27
FY10FY09 FY07FY06 FY10FY09 FY07FY06
Clayton 0 000
30
4
27
57
1
0
FY08
0
6
1
4
0
0
16
28
7
26
29
FY08
150
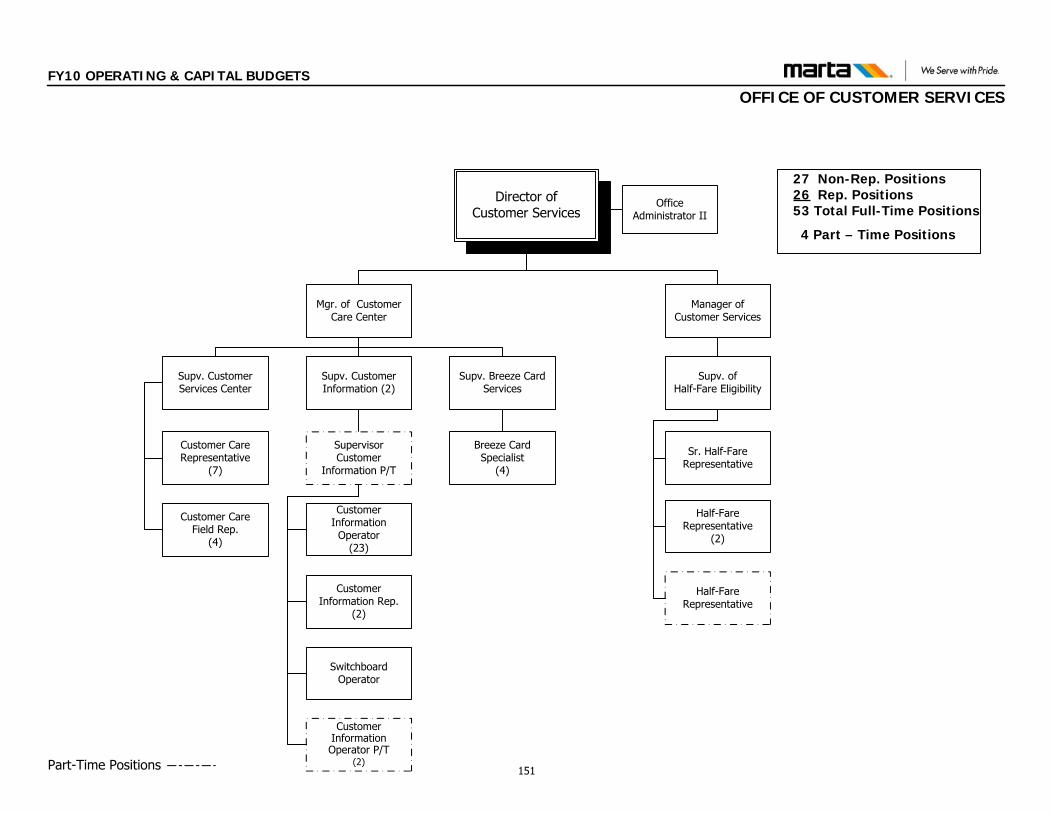
Director of Customer Services
Supv. CustomerInformation (2)
Part-Time Positions
Office Administrator II
Supv. Customer Services Center
Manager of Customer Services
Mgr. of Customer Care Center
Supv. Breeze Card Services
Supv. ofHalf-Fare Eligibility
Sr. Half-Fare Representative
Half-Fare Representative
(2)
Half-Fare Representative
Breeze Card Specialist
(4)
Customer Information
Operator(23)
Customer Information Rep.
(2)
Customer Care Field Rep.
(4)
Customer Care Representative
(7)
Switchboard Operator
Supervisor Customer
Information P/T
Customer Information Operator P/T
(2)
27 Non-Rep. Positions26 Rep. Positions
53 Total Full-Time Positions
4 Part – Time Positions
FY10 OPERATING & CAPITAL BUDGETS
OFFICE OF CUSTOMER SERVICES
151
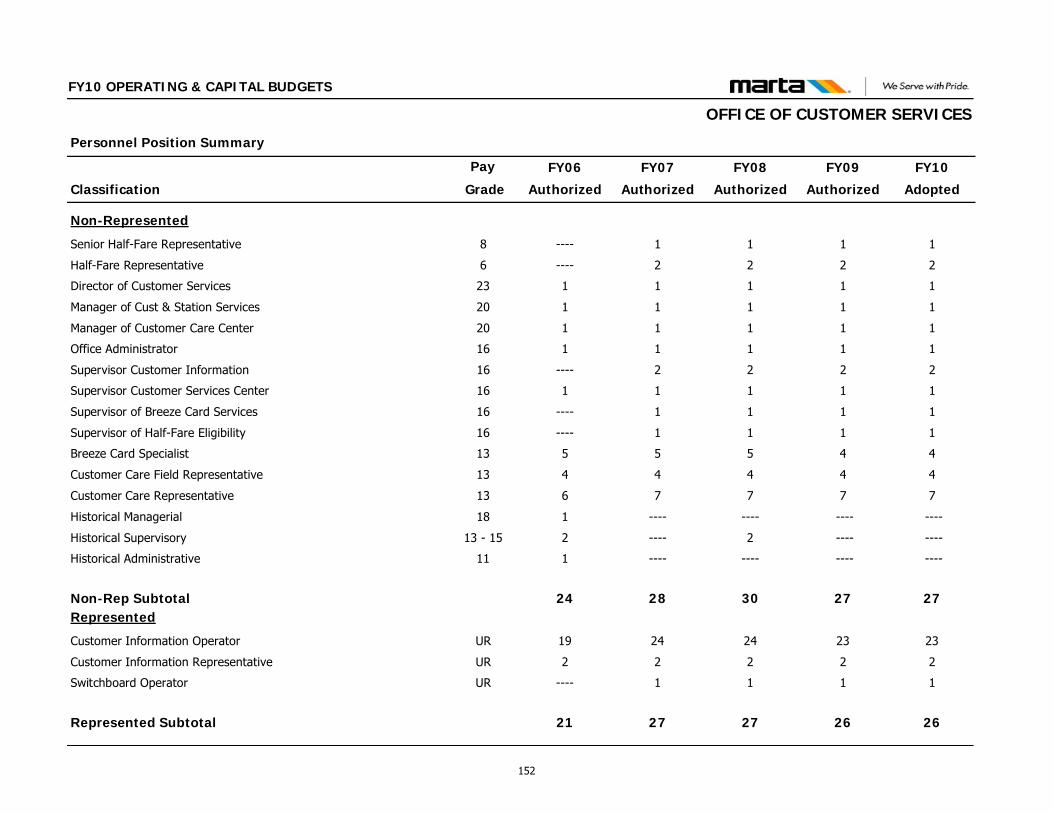
Classification
Personnel Position Summary
Pay FY09
Authorized
FY10
Adopted
FY10 OPERATING & CAPITAL BUDGETS
FY08
Authorized
FY07
Authorized
FY06
Authorized Grade
OFFICE OF CUSTOMER SERVICES
Non-Represented
Senior Half-Fare Representative 8 1 111----
Half-Fare Representative 6 2 222----
Director of Customer Services 23 1 1111
Manager of Cust & Station Services 20 1 1111
Manager of Customer Care Center 20 1 1111
Office Administrator 16 1 1111
Supervisor Customer Information 16 2 222----
Supervisor Customer Services Center 16 1 1111
Supervisor of Breeze Card Services 16 1 111----
Supervisor of Half-Fare Eligibility 16 1 111----
Breeze Card Specialist 13 4 4555
Customer Care Field Representative 13 4 4444
Customer Care Representative 13 7 7776
Historical Managerial 18 ---- ------------1
Historical Supervisory 13 - 15 ---- ----2----2
Historical Administrative 11 ---- ------------1
Non-Rep Subtotal 27 27302824Represented
Customer Information Operator UR 23 23242419
Customer Information Representative UR 2 2222
Switchboard Operator UR 1 111----
Represented Subtotal 26 26272721
152
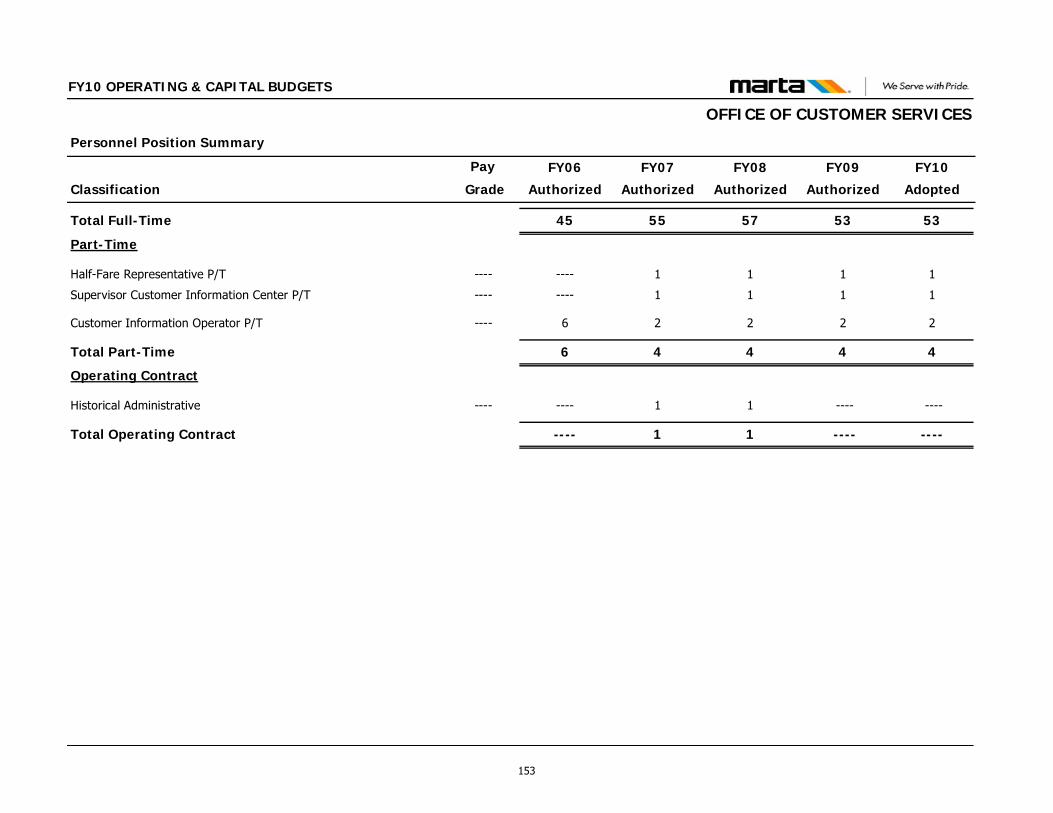
Classification
Personnel Position Summary
Pay FY09
Authorized
FY10
Adopted
FY10 OPERATING & CAPITAL BUDGETS
FY08
Authorized
FY07
Authorized
FY06
Authorized Grade
OFFICE OF CUSTOMER SERVICES
Total Full-Time 53 53575545
Part-Time
Half-Fare Representative P/T ---- 1 111----
Supervisor Customer Information Center P/T ---- 1 111----
Customer Information Operator P/T ---- 2 2226
Total Part-Time 4 4446
Operating Contract
Historical Administrative ---- ---- ----11----
Total Operating Contract ---- ----11----
153
FY10 OPERATING & CAPITAL BUDGETS
OFFICE OF MEDIA RELATIONS FUNCTIONS & RESPONSIBILITIES The Office of Media Relations establishes and maintains active working relationships with all relevant local, national and industry-wide media in order to communicate pertinent information to MARTA’s constituencies, including service changes and enhancements; emergency situations posing an immediate threat to the safety and security of MARTA customers or its service area; and policy changes. Additionally, the Media Relations Office advises senior and executive staff on all matters related to the media, and disseminates timely, credible and accurate information related to the authority’s strategies, goals, objectives, operations, and image. FY09 ACCOMPLISHMENTS Strategic Media Plans - 2009 State Legislative Session Effectively secured media support of “MARTA needs help
message” Continuously distributed press releases Planned and managed press conference Secured 4 op-ed pieces in the AJC and 1 in the Atlanta Business
Chronicle
State of MARTA Luncheon (February 11, 2009) Secured article in the AJC regarding this annual event in which the
GM/CEO communicated the Authority’s current fiscal challenges and legislative needs to the Georgia General Assembly, key stakeholders and community individuals
LILO/SILO Inquiries Effectively managed the flow of information to the media to allow
MARTA personnel to investigate and develop plan of action to address MARTA’s concerns regarding the potential unraveling of its LILO/SILO deals.
FY 2010 Budget Development/Adoption Process (January
2009 – July 2009) Effectively communicated potential impact that fiscal challenges
would have for Fiscal Year 2010 budget. Received enormous
media coverage throughout the process of potential internal and external budget recommendations. Some events for which press releases were distributed include:
Impact the lack of legislative and financial support from the Georgia General Assembly would have on FY 2010 Budget proposal
Introduction of the ARC re-allocation idea; its development as a proposal to be voted on for acceptance; its final acceptance
MARTA staff’s presentation of the FY 2010 proposed budget recommendations/Acceptance of the proposal by the board of directors
FY2010 Budget Public Hearings – Held June 16 & 17, 2009 – The public’s response to a fare increase and specific service changes were heard
The MARTA Board of Director’s adoption of the FY 2010 budget
Implementation of adopted internal and external measures
Media Response Management Met response deadline for every open records request received
during Fiscal Year 2009 Responded within 24 hours to all media inquiries during Fiscal
Year 2009 Received no media complaints regarding response time during
Fiscal Year 2009 Responded to and managed media communications at major
incidents where media was on the scene Routinely informed members of MARTA’s board of directors,
executive management team and other key personnel of potential major news stories
154
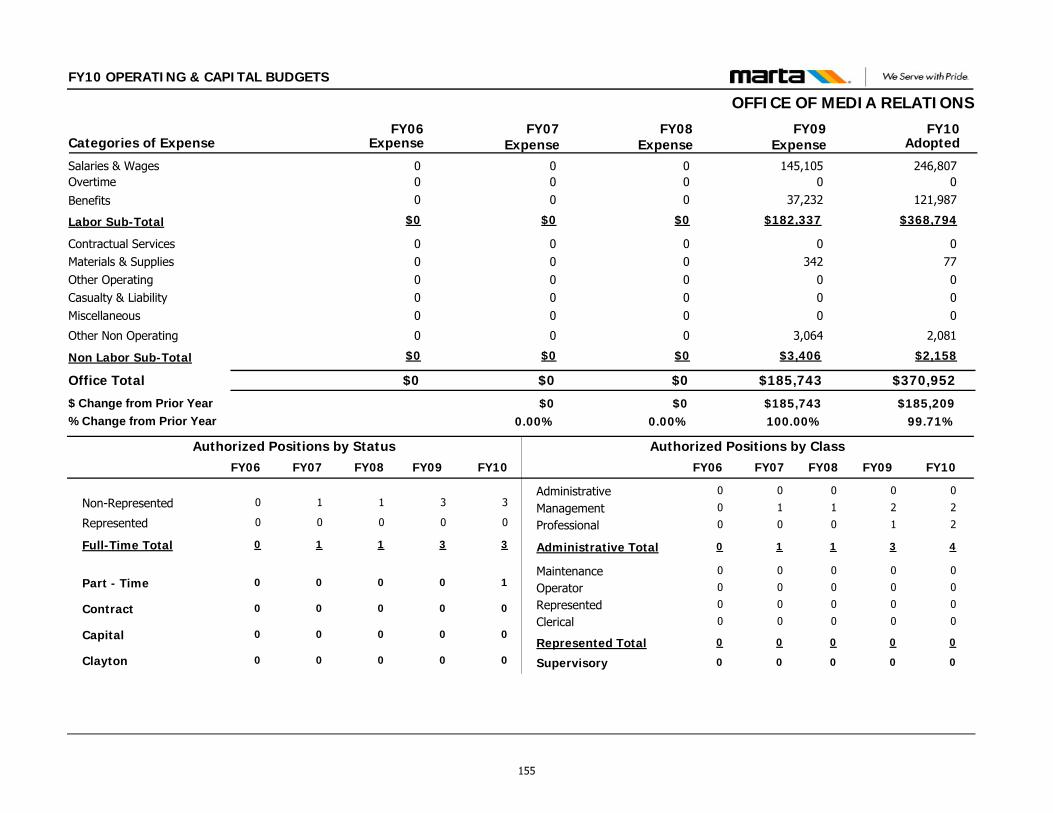
FY10 OPERATING & CAPITAL BUDGETS
OFFICE OF MEDIA RELATIONS
$370,952$185,743
077000
2,081
0342
000
3,064
Contractual ServicesMaterials & SuppliesOther OperatingCasualty & LiabilityMiscellaneous
Other Non Operating
Office Total
246,807145,105Salaries & Wages00Overtime
$368,794$182,337Labor Sub-Total
FY09 FY10Categories of Expense
$0
00000
0
00
$0
FY06
$0
00000
0
00
$0
FY07Expense Expense Expense Adopted
$185,209$185,743$099.71%100.00%0.00%
$ Change from Prior Year% Change from Prior Year
$0
00000
0
00
$0
FY08Expense
$00.00%
$2,158$3,406Non Labor Sub-Total $0 $0 $0
121,98737,232Benefits 0 0 0
Administrative
Clerical
Management
MaintenanceOperator
Professional
Represented
Supervisory
0
0
2
0
0
1
0
0
0
0
2
0
0
2
0
0
Non-Represented 3 3
Part - Time 0 1
Represented 0 0
Full-Time Total 3 3
Contract 0 0
Capital 0 0
Authorized Positions by Class
Administrative Total 3 4
Authorized Positions by Status
Represented Total 0 0
0
0
1
0
0
0
0
0
1
0
0
1
0
0
1
0
0
0
0
0
0
0
0
0
0
0
0
0
0
0
0
0
FY10FY09 FY07FY06 FY10FY09 FY07FY06
Clayton 0 000
1
0
0
1
0
0
FY08
0
0
0
1
0
0
0
0
0
1
0
FY08
155
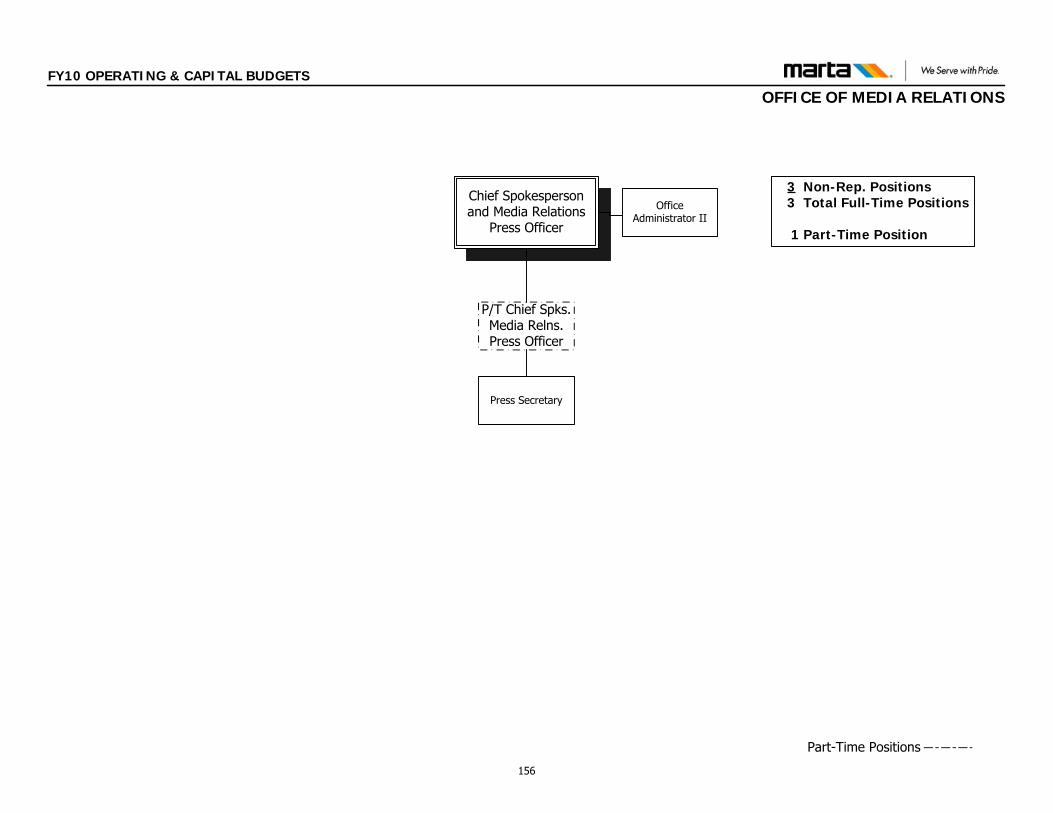
3 Non-Rep. Positions 3 Total Full-Time Positions
1 Part-Time Position
Chief Spokesperson and Media Relations
Press Officer
Press Secretary
Office Administrator II
FY10 OPERATING & CAPITAL BUDGETS
OFFICE OF MEDIA RELATIONS
P/T Chief Spks. Media Relns. Press Officer
Part-Time Positions
156
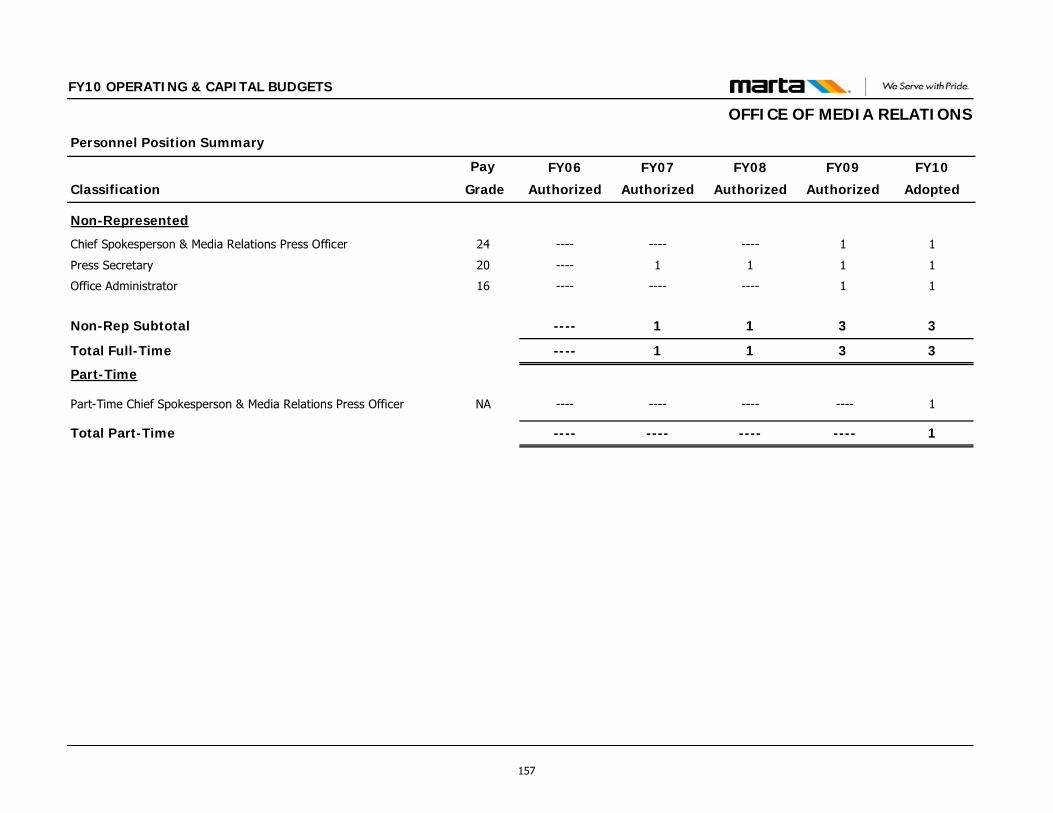
Classification
Personnel Position Summary
Pay FY09
Authorized
FY10
Adopted
FY10 OPERATING & CAPITAL BUDGETS
FY08
Authorized
FY07
Authorized
FY06
Authorized Grade
OFFICE OF MEDIA RELATIONS
Non-Represented
Chief Spokesperson & Media Relations Press Officer 24 1 1------------
Press Secretary 20 1 111----
Office Administrator 16 1 1------------
Non-Rep Subtotal 3 311----
Total Full-Time 3 311----
Part-Time
Part-Time Chief Spokesperson & Media Relations Press Officer NA ---- 1------------
Total Part-Time ---- 1------------
157

This page intentionally left blank
158
DIVISION OF OPERATIONS This Division includes the following Departments: Department of the Deputy General Manager/COO
Department of Bus Operations
Department of Rail Operations
Department of Infrastructure
Department of Police Services
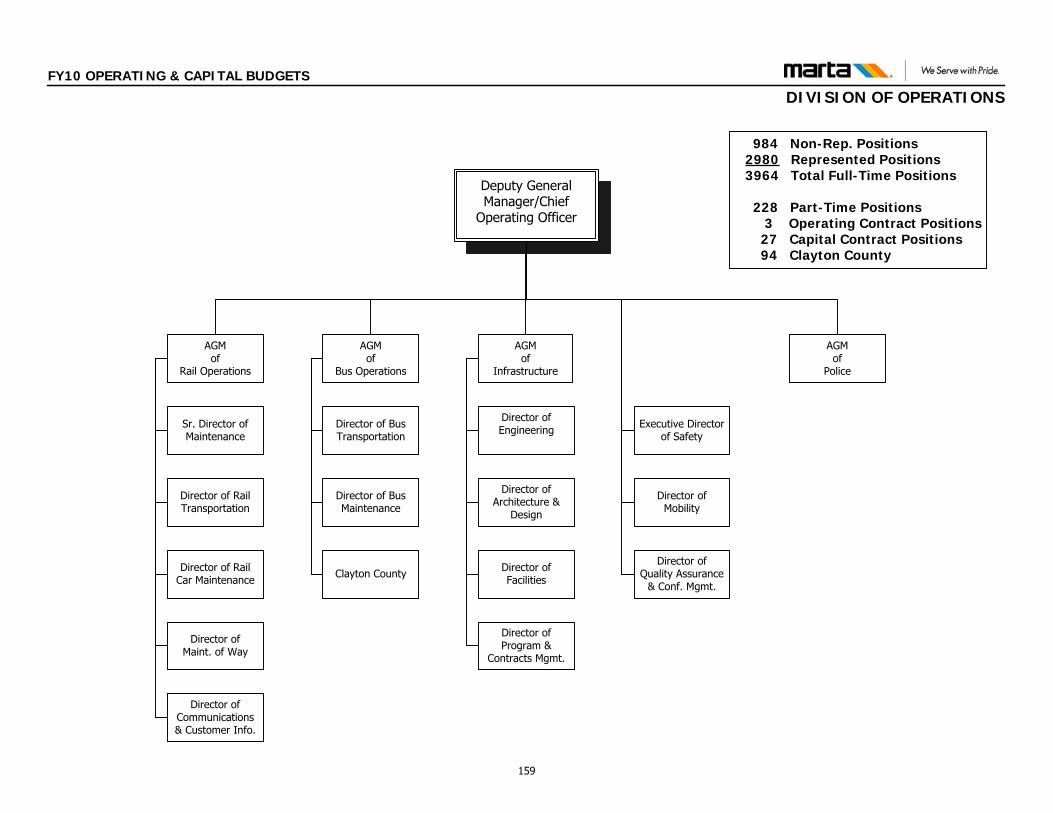
Deputy General Manager/Chief
Operating Officer
Director of Rail Car Maintenance
Director of Rail Transportation
Director of Maint. of Way
Sr. Director of Maintenance
Director of Communications & Customer Info.
AGM of
Rail Operations
Director of Bus Transportation
Director of Bus Maintenance
AGM of
Bus Operations
Director of Engineering
Director of Program &
Contracts Mgmt.
AGM of
Infrastructure
Director of Facilities
Director of Mobility
AGM of
Police
Clayton County
Executive Director of Safety
Director of Quality Assurance
& Conf. Mgmt.
Director of Architecture &
Design
FY10 OPERATING & CAPITAL BUDGETS
DIVISION OF OPERATIONS
984 Non-Rep. Positions2980 Represented Positions
3964 Total Full-Time Positions
228 Part-Time Positions 3 Operating Contract Positions 27 Capital Contract Positions 94 Clayton County
159
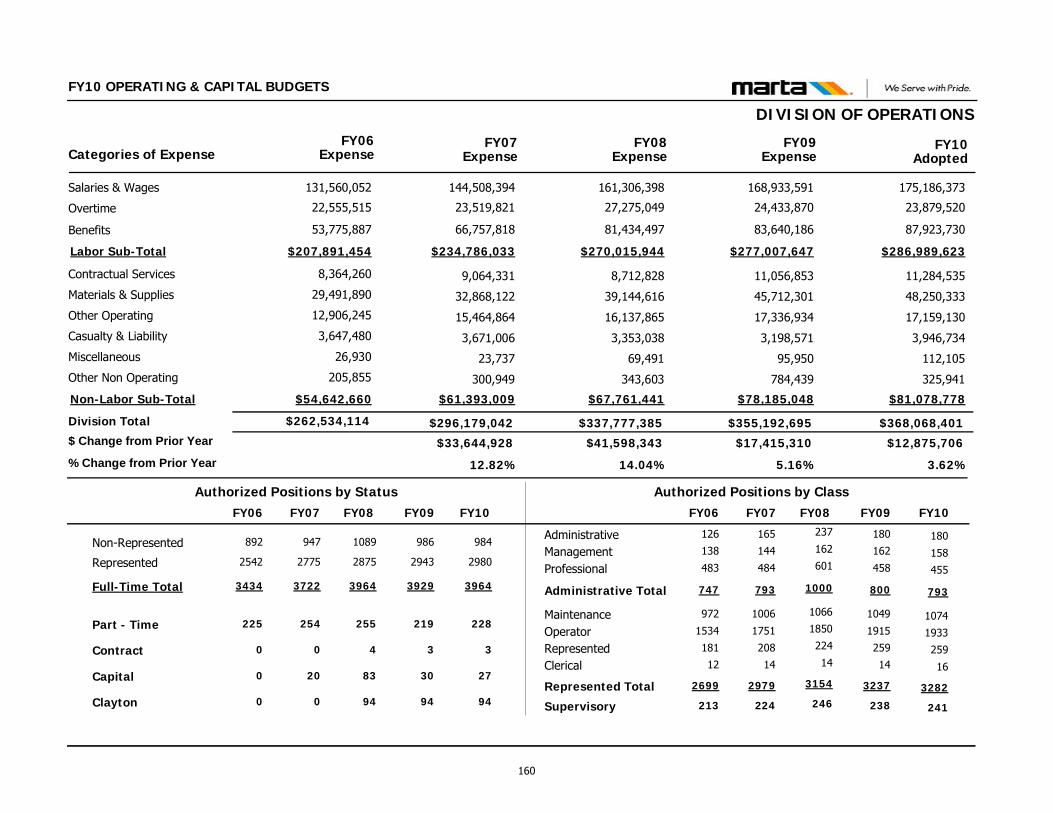
FY10 OPERATING & CAPITAL BUDGETS
DIVISION OF OPERATIONS
$368,068,401$355,192,695
11,284,535
48,250,333
17,159,130
3,946,734
112,105
325,941
11,056,853
45,712,301
17,336,934
3,198,571
95,950
784,439
Contractual Services
Materials & Supplies
Other Operating
Casualty & Liability
Miscellaneous
Other Non Operating
Division Total
175,186,373168,933,591Salaries & Wages
23,879,52024,433,870Overtime
$286,989,623$277,007,647Labor Sub-Total
FY09 FY10Categories of Expense
$262,534,114
8,364,260
29,491,890
12,906,245
3,647,480
26,930
205,855
131,560,052
22,555,515
$207,891,454
FY06
$296,179,042
9,064,331
32,868,122
15,464,864
3,671,006
23,737
300,949
144,508,394
23,519,821
$234,786,033
FY07Expense Expense Expense Adopted
$12,875,706$17,415,310$33,644,928
3.62%5.16%12.82%
$ Change from Prior Year
% Change from Prior Year
$337,777,385
8,712,828
39,144,616
16,137,865
3,353,038
69,491
343,603
161,306,398
27,275,049
$270,015,944
FY08Expense
$41,598,343
14.04%
87,923,73083,640,186Benefits 53,775,887 66,757,818 81,434,497
$81,078,778$78,185,048Non-Labor Sub-Total $54,642,660 $61,393,009 $67,761,441
Administrative
Clerical
Management
MaintenanceOperator
Professional
Represented
Supervisory
237 180
14 14
162 162
1066 10491850 1915
601 458
224 259
246 238
180
16
158
1074
1933
455
259
241
Non-Represented 1089 986 984
Part - Time 255 219 228
Represented 2875 2943 2980
Full-Time Total 3964 3929 3964
Contract 4 3 3
Capital 83 30 27
Authorized Positions by Class
Administrative Total 1000 800 793
Authorized Positions by Status
Represented Total 3154 3237 3282
165
14
144
1006
1751
484
208
224
947
254
2775
3722
0
20
793
2979
126
12
138
972
1534
483
181
213
892
225
2542
3434
0
0
747
2699
FY09FY08 FY10FY07FY06 FY09FY08 FY10FY07FY06
Clayton 94 94 9400
160
DEPARTMENT OF THE DEPUTY GENERAL MANAGER/COO This Department includes the following Offices: Department of the Deputy General Manager/COO Office of the Deputy General Manager/COO Office of Mobility Services Office of Safety Office of Quality Assurance & Configuration Management
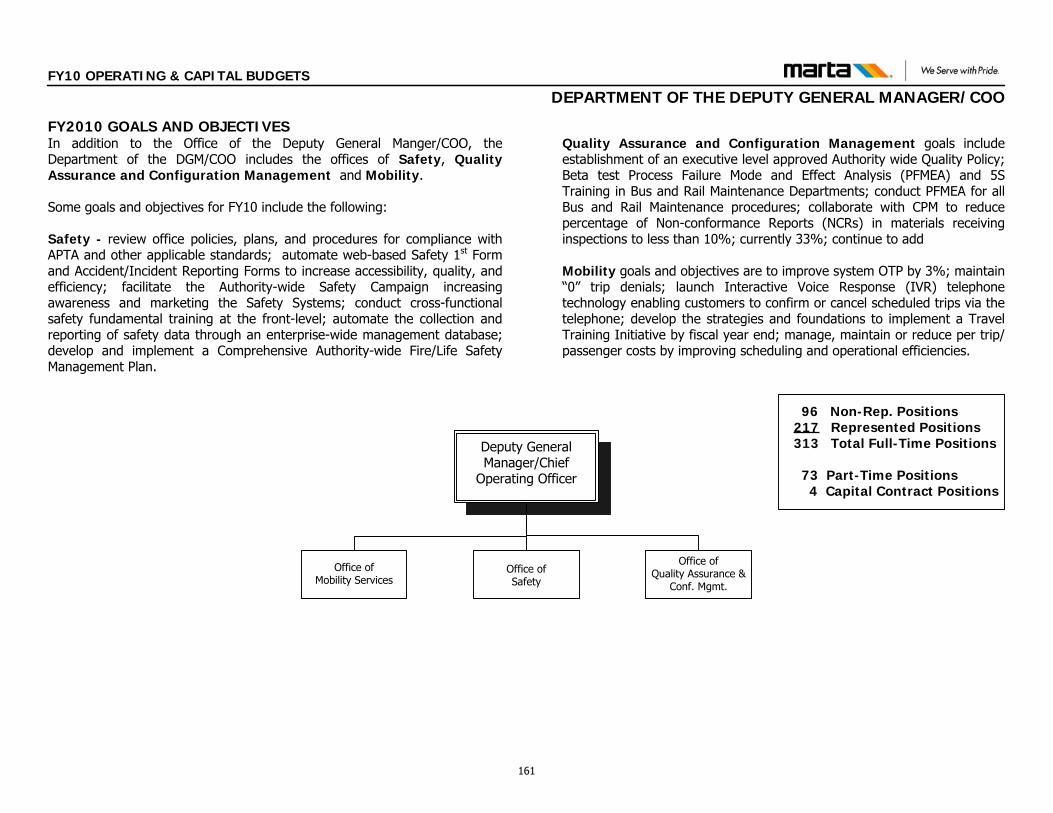
Deputy General Manager/Chief
Operating Officer
Office of Safety
Office of Mobility Services
FY10 OPERATING & CAPITAL BUDGETS
DEPARTMENT OF THE DEPUTY GENERAL MANAGER/COO
96 Non-Rep. Positions217 Represented Positions
313 Total Full-Time Positions
73 Part-Time Positions 4 Capital Contract Positions
FY2010 GOALS AND OBJECTIVESIn addition to the Office of the Deputy General Manger/COO, the Department of the DGM/COO includes the offices of Safety, Quality Assurance and Configuration Management and Mobility.
Some goals and objectives for FY10 include the following:
Safety - review office policies, plans, and procedures for compliance with APTA and other applicable standards; automate web-based Safety 1st Form and Accident/Incident Reporting Forms to increase accessibility, quality, and efficiency; facilitate the Authority-wide Safety Campaign increasing awareness and marketing the Safety Systems; conduct cross-functional safety fundamental training at the front-level; automate the collection and reporting of safety data through an enterprise-wide management database; develop and implement a Comprehensive Authority-wide Fire/Life Safety Management Plan.
Quality Assurance and Configuration Management goals include establishment of an executive level approved Authority wide Quality Policy; Beta test Process Failure Mode and Effect Analysis (PFMEA) and 5S Training in Bus and Rail Maintenance Departments; conduct PFMEA for all Bus and Rail Maintenance procedures; collaborate with CPM to reduce percentage of Non-conformance Reports (NCRs) in materials receiving inspections to less than 10%; currently 33%; continue to add
Mobility goals and objectives are to improve system OTP by 3%; maintain “0” trip denials; launch Interactive Voice Response (IVR) telephone technology enabling customers to confirm or cancel scheduled trips via the telephone; develop the strategies and foundations to implement a Travel Training Initiative by fiscal year end; manage, maintain or reduce per trip/passenger costs by improving scheduling and operational efficiencies.
Office of Quality Assurance &
Conf. Mgmt.
161
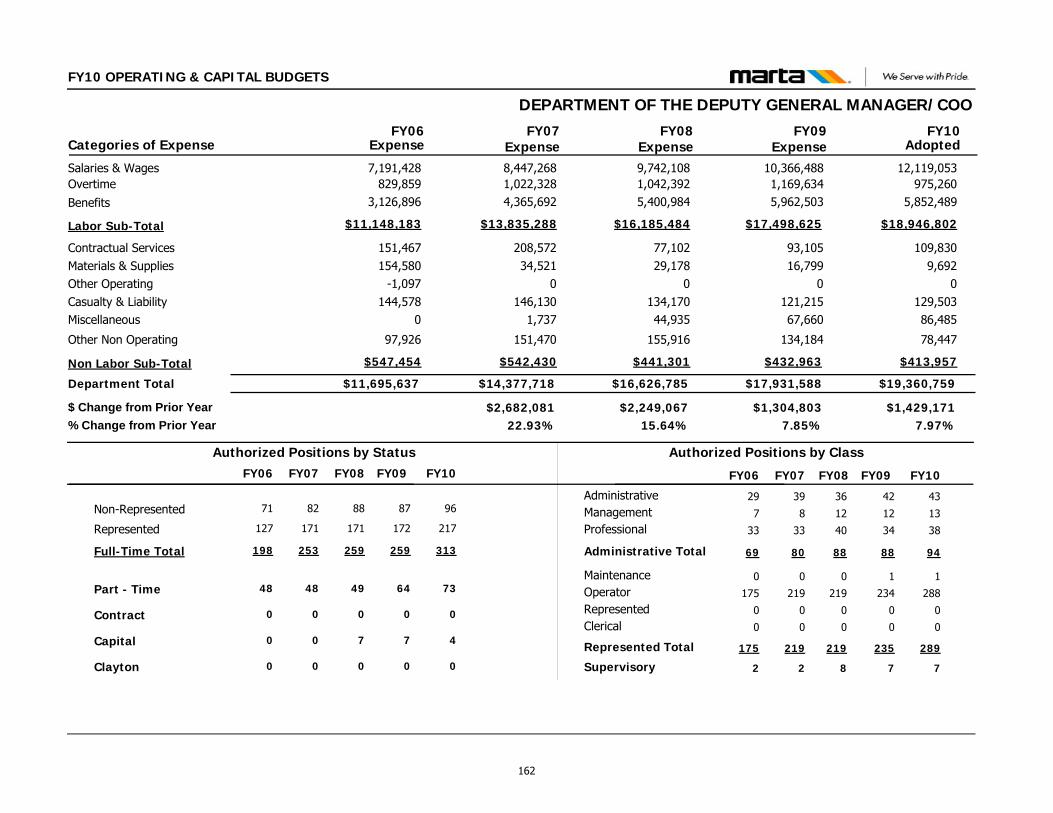
FY10 OPERATING & CAPITAL BUDGETS
DEPARTMENT OF THE DEPUTY GENERAL MANAGER/COO
$19,360,759$17,931,588
109,8309,692
0129,50386,485
78,447
93,10516,799
0121,21567,660
134,184
Contractual ServicesMaterials & SuppliesOther OperatingCasualty & LiabilityMiscellaneous
Other Non Operating
Department Total
12,119,05310,366,488Salaries & Wages975,2601,169,634Overtime
$18,946,802$17,498,625Labor Sub-Total
FY09 FY10Categories of Expense
$11,695,637
151,467154,580
-1,097144,578
0
97,926
7,191,428829,859
$11,148,183
FY06
$14,377,718
208,57234,521
0146,130
1,737
151,470
8,447,2681,022,328
$13,835,288
FY07Expense Expense Expense Adopted
$1,429,171$1,304,803$2,682,0817.97%7.85%22.93%
$ Change from Prior Year% Change from Prior Year
$16,626,785
77,10229,178
0134,17044,935
155,916
9,742,1081,042,392
$16,185,484
FY08Expense
$2,249,06715.64%
$413,957$432,963Non Labor Sub-Total $547,454 $542,430 $441,301
5,852,4895,962,503Benefits 3,126,896 4,365,692 5,400,984
Administrative
Clerical
Management
MaintenanceOperator
Professional
Represented
Supervisory
42
0
12
1
234
34
0
7
43
0
13
1
288
38
0
7
Non-Represented 87 96
Part - Time 64 73
Represented 172 217
Full-Time Total 259 313
Contract 0 0
Capital 7 4
Authorized Positions by Class
Administrative Total 88 94
Authorized Positions by Status
Represented Total 235 289
39
0
8
0
219
33
0
2
82
48
171
253
0
0
80
219
29
0
7
0
175
33
0
2
71
48
127
198
0
0
69
175
FY10FY09 FY07FY06 FY10FY09 FY07FY06
Clayton 0 000
88
49
171
259
0
7
FY08
0
36
0
12
0
219
40
0
8
88
219
FY08
162
FY10 OPERATING & CAPITAL BUDGETS
OFFICE OF THE DEPUTY GENERAL MANAGER FUNCTIONS AND RESPONSIBILITIES The Office of the Deputy General Manger/Chief Operating Officer (COO) is responsible for the direction and management of the operation and maintenance of the Authority’s transit system. This includes the maintenance, repair, and rehabilitation of the Authority's operating, support, and administrative facilities on the bus and rail systems. Functions include the following: The overall management and coordination of the Bus, Mobility, and
Rail fleets, ensuring safe, efficient, and cost-effective transportation for MARTA riders. This includes the scheduling of vehicles, preparation for service, communication with all operators, control of rail vehicles, and supervision of daily transit operations.
Maintenance of all transit and non-revenue vehicles to ensure safe,
reliable transportation. This includes daily service, scheduled repairs, on-demand maintenance, and vehicle overhaul and rebuilds. It also includes rebuilds and/or replacement of major vehicle components.
Management of the Authority’s Bus & Rail Capital Programs. This includes development, programming, designing, and execution of all major capital investments. The Office of the Deputy General Manager manages, coordinates, and directs activities to ensure that new Rail, Bus, and Mobility service projects are successfully completed within scope, budget, and schedule.
Long and short range scheduling for bus and rail services for
providing and improving service delivery and reliability. Oversight of MARTA’s Bus and Rail Roadeo Events. The Office of the Deputy General Manger/Chief Operating Officer also identifies and implements initiatives which reduce operating costs, enhance service quality, and increase revenues and ridership, and ensures that initiatives are aligned with the Authority’s strategic objectives.
163

FY10 OPERATING & CAPITAL BUDGETS
OFFICE OF THE DEPUTY GENERAL MANAGER
$734,981$745,784
71,535189
00
86,285
40,718
65,000139
00
67,353
87,988
Contractual ServicesMaterials & SuppliesOther OperatingCasualty & LiabilityMiscellaneous
Other Non Operating
Office Total
358,906380,456Salaries & Wages0271Overtime
$536,254$525,304Labor Sub-Total
FY09 FY10Categories of Expense
$425,549
18,0301,899
000
62,437
258,18732
$343,183
FY06
$710,125
46,08713,278
00
1,605
90,443
428,5210
$558,712
FY07Expense Expense Expense Adopted
($10,803)$146,268$284,576-1.45%24.40%66.87%
$ Change from Prior Year% Change from Prior Year
$599,516
9,8258,978
00
44,891
108,983
299,328273
$426,839
FY08Expense
($110,609)-15.58%
$198,727$220,480Non Labor Sub-Total $82,366 $151,413 $172,677
177,348144,577Benefits 84,964 130,191 127,238
Administrative
Clerical
Management
MaintenanceOperator
Professional
Represented
Supervisory
2
0
1
0
0
1
0
0
1
0
1
0
0
1
0
0
Non-Represented 4 3
Part - Time 0 0
Represented 0 0
Full-Time Total 4 3
Contract 0 0
Capital 0 0
Authorized Positions by Class
Administrative Total 4 3
Authorized Positions by Status
Represented Total 0 0
3
0
0
0
0
1
0
0
4
0
0
4
0
0
4
0
3
0
1
0
0
2
0
0
6
0
0
6
0
0
6
0
FY10FY09 FY07FY06 FY10FY09 FY07FY06
Clayton 0 000
4
0
0
4
0
0
FY08
0
1
0
1
0
0
2
0
0
4
0
FY08
164
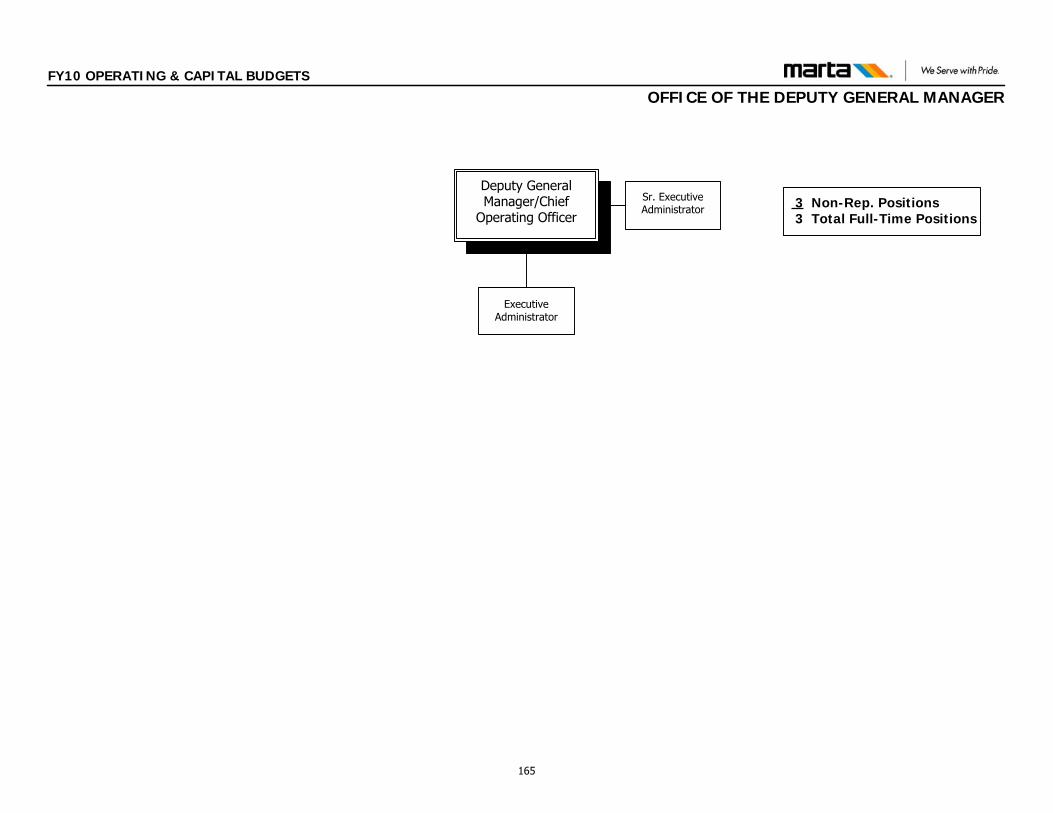
3 Non-Rep. Positions 3 Total Full-Time Positions
Deputy General Manager/Chief
Operating Officer
Sr. Executive Administrator
Executive Administrator
FY10 OPERATING & CAPITAL BUDGETS
OFFICE OF THE DEPUTY GENERAL MANAGER
165
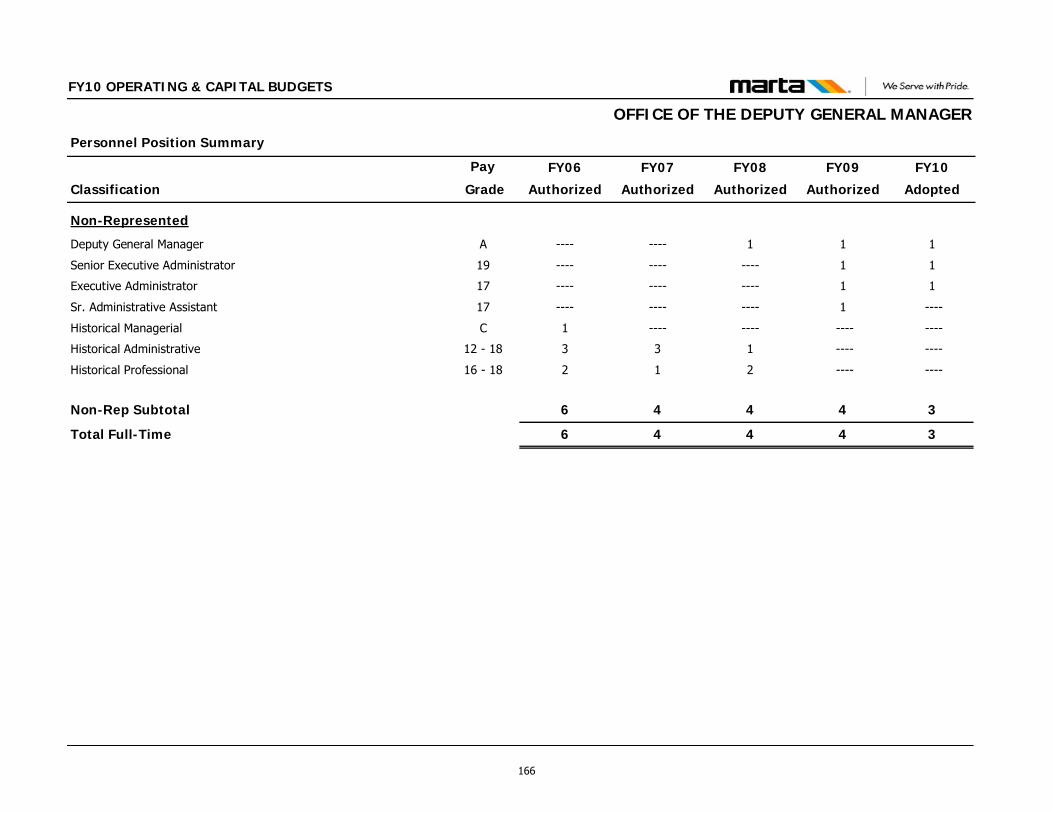
Classification
Personnel Position Summary
Pay FY09
Authorized
FY10
Adopted
FY10 OPERATING & CAPITAL BUDGETS
FY08
Authorized
FY07
Authorized
FY06
Authorized Grade
OFFICE OF THE DEPUTY GENERAL MANAGER
Non-Represented
Deputy General Manager A 1 11--------
Senior Executive Administrator 19 1 1------------
Executive Administrator 17 1 1------------
Sr. Administrative Assistant 17 1 ----------------
Historical Managerial C ---- ------------1
Historical Administrative 12 - 18 ---- ----133
Historical Professional 16 - 18 ---- ----212
Non-Rep Subtotal 4 3446
Total Full-Time 4 3446
166
FY10 OPERATING & CAPITAL BUDGETS
OFFICE OF MOBILITY SERVICES FUNCTIONS & RESPONSIBILITIES The office of Mobility Services is responsible for directing and coordinating operations and administrative functions of Paratransit and Special Services. This office effectively meets the service demands of certified customers in compliance with the Americans with Disabilities Act (ADA) of 1990. Providing complementary paratransit service or equivalent public transportation to individuals with disabilities who cannot board, ride or get to an accessible fixed route bus or train because of their disabilities is the mission of MARTA Mobility. The operation offers transportation on demand to customers who reserve trips up to seven days in advance to customers traveling anywhere for any purpose within ¾ of a mile of MARTA’s fixed route service area. Disabilities that prevent customers from using the regular bus or rail services, including but not limited to visual, cognitive and/or physical disabilities may be eligible to ride paratransit on a conditional basis. All customers are recertified to continue eligibility every two years. MARTA Mobility coordinates and partners with its community affairs department to communicate Mobility’s goal and objectives to provide quality, reliable transportation for certified customers with disabilies. MARTA Mobility Service is operates in Fulton and DeKalb counties. The service operates to and from any point of origin or destination that is within a ¾ mile corridor on each side of each bus route or within a ¾ mile radius of each rail station within the MARTA service area. Specially equipped lift vehicles are capable of transporting up to three wheelchairs and/or nine (9) ambulatory customers. The service operates to and from locations on a curb-to-curb basis, as a feeder service to the fixed route system, or upon request,origin-to-destination.
MARTA Mobility service is a shared ride and advanced reservation form of public transportation that complements MARTA’s fixed route services. This office employs 343 employees who provide administrative support such as determining customer eligibility, scheduling service, managing day to day service or reconciling the data necessary to measure its efficiency and performance. The operation utilizes a fleet of 174 revenue L-Vans. The office of Mobility services is also responsible for accomplishing its mission through the development, implementation, and management of comprehensive quality programs, procedures, and practices which pursues ADA compliance, improved on-time performance, reliability, customer satisfaction, and safe operations. In addition, the office is responsible for the MARTA Mobility Radio Communications Center that serves as a 24-hour communication link between Mobility operations, Bus,Rail and Police Communications. . FY09 ACCOMPLISHMENTS Improved Mobility On Time Performance from 84.5% in FY08 to
87.3% YTD in FY09 Reduced Customer Complaints per 1K to 4.9 beating goal of 5.5. Reduced customer abandonment rate from 18% in FY 2008 to 5%
in FY 2009. Reduced the number of customers on “hold” more than three
minutes by 53%.
167

FY10 OPERATING & CAPITAL BUDGETS
OFFICE OF MOBILITY SERVICES
$14,734,162$13,821,174
07,922
0129,503
200
18,555
013,745
0121,215
307
23,165
Contractual ServicesMaterials & SuppliesOther OperatingCasualty & LiabilityMiscellaneous
Other Non Operating
Office Total
9,191,5287,695,186Salaries & Wages975,2601,162,344Overtime
$14,577,982$13,662,742Labor Sub-Total
FY09 FY10Categories of Expense
$9,002,732
9,688129,725
-1,241144,578
0
2,329
5,398,611828,369
$8,717,653
FY06
$10,631,975
14,01312,920
0146,130
132
6,870
6,044,6811,021,364
$10,451,910
FY07Expense Expense Expense Adopted
$912,988$1,503,069$1,629,2436.61%12.20%18.10%
$ Change from Prior Year% Change from Prior Year
$12,318,105
4,17812,761
0135,932
41
15,112
6,879,6261,033,624
$12,150,081
FY08Expense
$1,686,13015.86%
$156,180$158,432Non Labor Sub-Total $285,079 $180,065 $168,024
4,411,1954,805,212Benefits 2,490,673 3,385,865 4,236,831
Administrative
Clerical
Management
MaintenanceOperator
Professional
Represented
Supervisory
39
0
4
1
234
2
0
7
41
0
4
1
288
2
0
7
Non-Represented 52 54
Part - Time 63 72
Represented 172 217
Full-Time Total 224 271
Contract 0 0
Capital 0 0
Authorized Positions by Class
Administrative Total 45 47
Authorized Positions by Status
Represented Total 235 289
33
0
4
0
219
2
0
2
41
48
171
212
0
0
39
219
24
0
3
0
175
2
0
2
31
48
127
158
0
0
29
175
FY10FY09 FY07FY06 FY10FY09 FY07FY06
Clayton 0 000
47
48
171
218
0
0
FY08
0
33
0
4
0
219
2
0
8
39
219
FY08
168
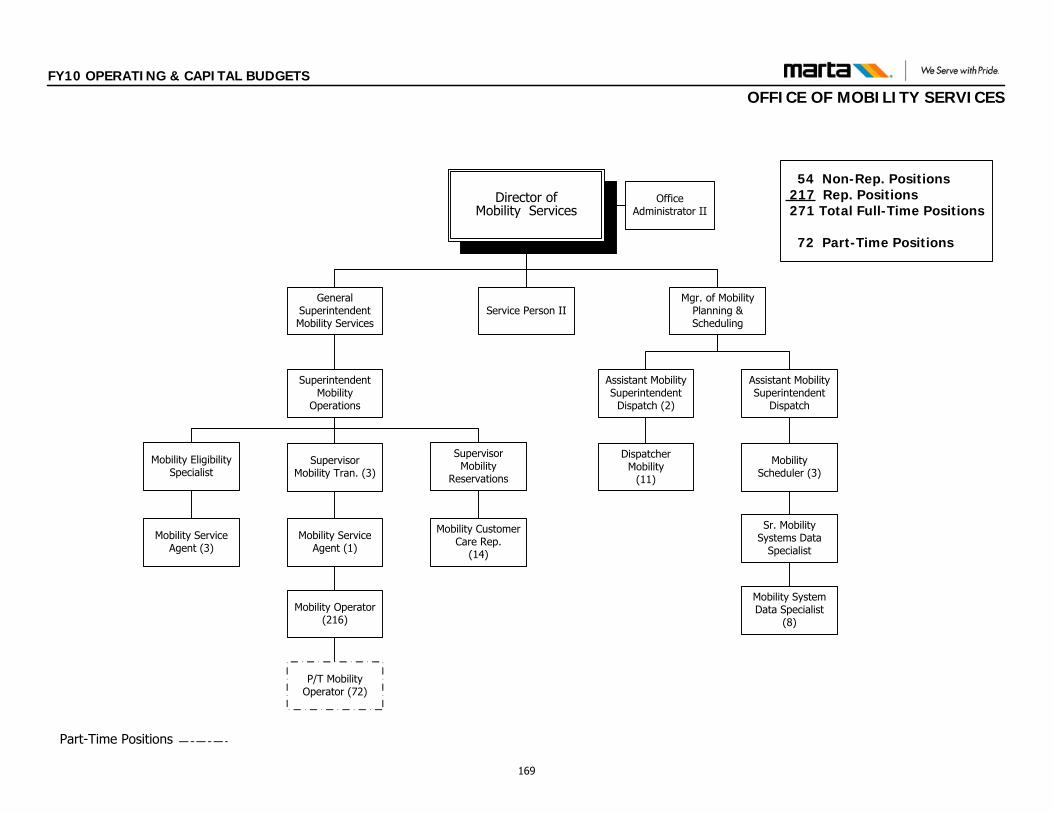
General Superintendent Mobility Services
Supervisor Mobility Tran. (3)
Part-Time Positions
Director of Mobility Services
54 Non-Rep. Positions 217 Rep. Positions 271 Total Full-Time Positions
72 Part-Time Positions
Office Administrator II
Supervisor Mobility
Reservations
Mobility Scheduler (3)
Assistant Mobility Superintendent
Dispatch
Mobility System Data Specialist
(8)
Mobility Customer Care Rep.
(14)
P/T MobilityOperator (72)
Mobility Eligibility Specialist
Mobility Service Agent (1)
Mgr. of Mobility Planning & Scheduling
Mobility Operator (216)
SuperintendentMobility
Operations
Assistant Mobility Superintendent
Dispatch (2)
Dispatcher Mobility
(11)
Mobility Service Agent (3)
Sr. Mobility Systems Data
Specialist
Service Person II
FY10 OPERATING & CAPITAL BUDGETS
OFFICE OF MOBILITY SERVICES
169
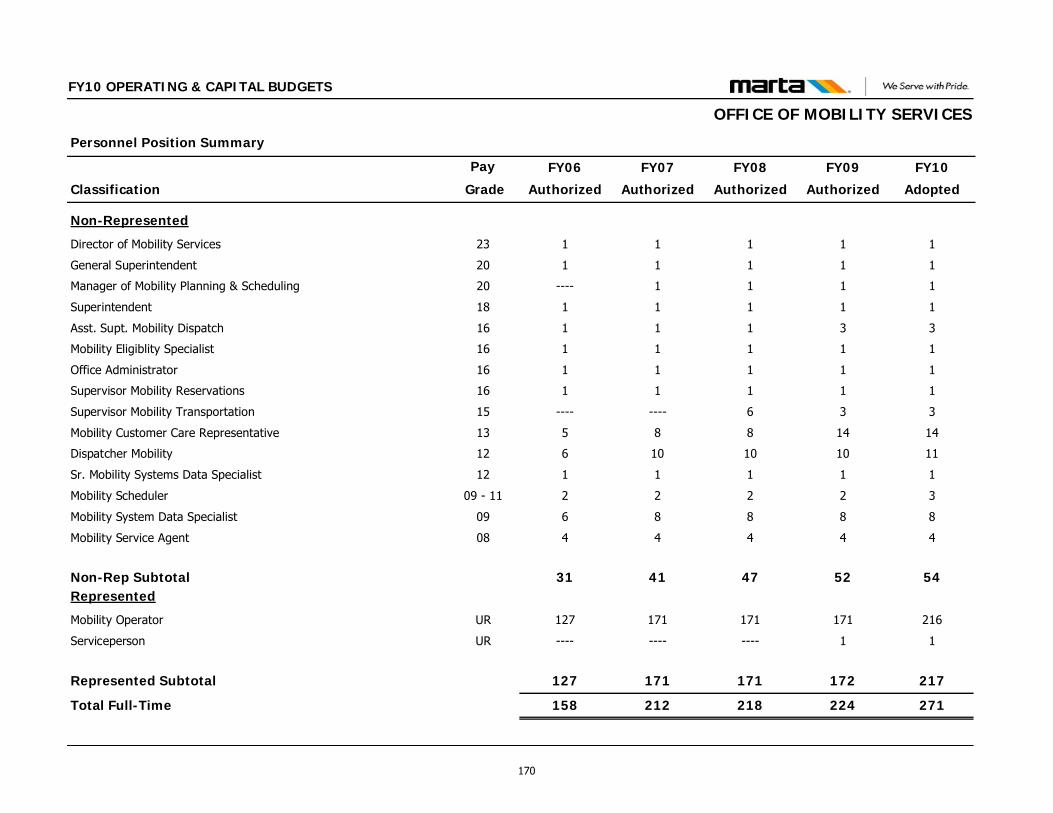
Classification
Personnel Position Summary
Pay FY09
Authorized
FY10
Adopted
FY10 OPERATING & CAPITAL BUDGETS
FY08
Authorized
FY07
Authorized
FY06
Authorized Grade
OFFICE OF MOBILITY SERVICES
Non-Represented
Director of Mobility Services 23 1 1111
General Superintendent 20 1 1111
Manager of Mobility Planning & Scheduling 20 1 111----
Superintendent 18 1 1111
Asst. Supt. Mobility Dispatch 16 3 3111
Mobility Eligiblity Specialist 16 1 1111
Office Administrator 16 1 1111
Supervisor Mobility Reservations 16 1 1111
Supervisor Mobility Transportation 15 3 36--------
Mobility Customer Care Representative 13 14 14885
Dispatcher Mobility 12 10 1110106
Sr. Mobility Systems Data Specialist 12 1 1111
Mobility Scheduler 09 - 11 2 3222
Mobility System Data Specialist 09 8 8886
Mobility Service Agent 08 4 4444
Non-Rep Subtotal 52 54474131Represented
Mobility Operator UR 171 216171171127
Serviceperson UR 1 1------------
Represented Subtotal 172 217171171127
Total Full-Time 224 271218212158
170
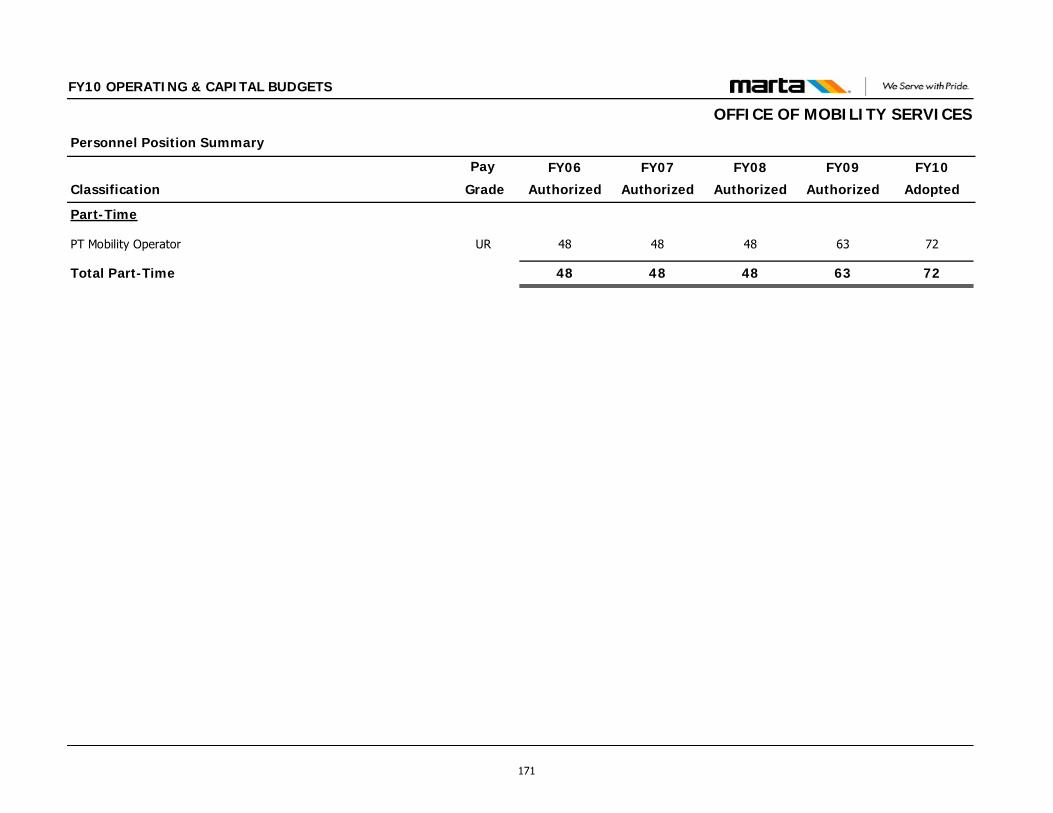
Classification
Personnel Position Summary
Pay FY09
Authorized
FY10
Adopted
FY10 OPERATING & CAPITAL BUDGETS
FY08
Authorized
FY07
Authorized
FY06
Authorized Grade
OFFICE OF MOBILITY SERVICES
Part-Time
PT Mobility Operator UR 63 72484848
Total Part-Time 63 72484848
171
FY10 OPERATING & CAPITAL BUDGETS
OFFICE OF SAFETY
FUNCTIONS & RESPONSIBILITIES The Office of Safety strives to promote safety, efficiency, effectiveness, and accountability in the Authority. This is accomplished through audits, assessments, inspections, investigations, observations, and evaluations to determine whether activities and programs comply with applicable codes, standards, specifications, guidelines, etc. and reporting same. The Office of Safety provides data collection, objective analysis and recommendations through the performance of: audits, assessments, inspections, investigations, observations, and
evaluations;
preliminary, interim, and final reporting;
stakeholders meetings
FY09 ACCOMPLISHMENTS
Implemented Environmental and Industrial Safety Inspections Programs.
Performed safety and quality assurance functions on the CQ310/311 Railcar Rehabilitation Project and Block 2 Modifications and the Collector Shoe Investigation.
Received 3393 reported incidents: 108 (major) and 3285 (minor); investigated 28 Rail and 13 Bus incidents.
Tracked KPIs for Employee Accidents (EAs) and Employee Lost
Time Accidents (ELTAs), and began tracking Workers’ Compensation (WC) Claim Repeaters.
8 (eight) Internal Safety audits.
Provided Safety support on 71 Authority-wide contracts.
Reviewed and revised the Safety Policies, MARTA Inspection Program Plan (MTPP), System Safety Program Plan (SSPP), Office procedures for capital projects.
Conducted Safety Marshal, Hazardous Waste Awareness, and Respirator Fit Trainings.
Conducted Emergency Evacuation Training at all MARTA facilities and facilitated semiannual Evacuation Drills at each of the 12 major MARTA Facilities; as well as conducted Fire Safety Inspections on 182 buses, 47 L-Vans and 46 rail cars.
Provided project management, process improvements, and corrective action development and tracking of findings for the RFP 13994, Comprehensive Safety Critical Systems Assessment, conducted by Transportation Resource Associates, Inc. (TRA).
Participated on the Collector Shoe Study Committee Task Force.
172

FY10 OPERATING & CAPITAL BUDGETS
OFFICE OF SAFETY
$1,813,446$1,522,558
38,2951,018
000
13,968
28,1051,902
000
16,228
Contractual ServicesMaterials & SuppliesOther OperatingCasualty & LiabilityMiscellaneous
Other Non Operating
Office Total
1,182,0261,059,156Salaries & Wages07,019Overtime
$1,760,165$1,476,323Labor Sub-Total
FY09 FY10Categories of Expense
$1,012,822
123,74913,147
000
18,714
630,2921,458
$857,212
FY06
$1,258,698
148,4723,652
000
34,215
760,074964
$1,072,359
FY07Expense Expense Expense Adopted
$290,888($264,996)$245,87619.11%-14.82%24.28%
$ Change from Prior Year% Change from Prior Year
$1,787,554
62,6325,719
0-1,762
3
24,650
1,258,2277,733
$1,696,312
FY08Expense
$528,85642.02%
$53,281$46,235Non Labor Sub-Total $155,610 $186,339 $91,242
578,139410,148Benefits 225,462 311,321 430,352
Administrative
Clerical
Management
MaintenanceOperator
Professional
Represented
Supervisory
1
0
4
0
0
13
0
0
1
0
4
0
0
15
0
0
Non-Represented 12 18
Part - Time 1 1
Represented 0 0
Full-Time Total 12 18
Contract 0 0
Capital 5 1
Authorized Positions by Class
Administrative Total 18 20
Authorized Positions by Status
Represented Total 0 0
3
0
4
0
0
16
0
0
23
0
0
23
0
0
23
0
2
0
3
0
0
14
0
0
19
0
0
19
0
0
19
0
FY10FY09 FY07FY06 FY10FY09 FY07FY06
Clayton 0 000
16
1
0
16
0
5
FY08
0
1
0
4
0
0
17
0
0
22
0
FY08
173
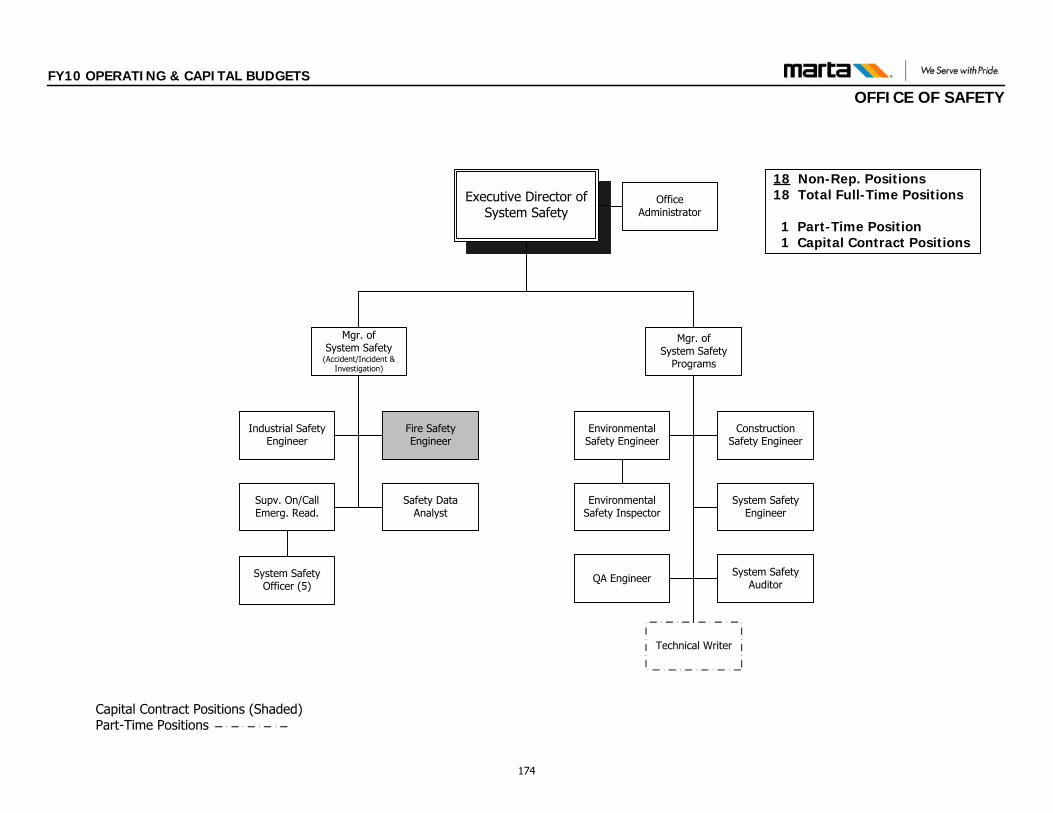
18 Non-Rep. Positions 18 Total Full-Time Positions
1 Part-Time Position 1 Capital Contract Positions
Mgr. ofSystem Safety
Programs
Safety Data Analyst
Environmental Safety Engineer
Construction Safety Engineer
Mgr. of System Safety
(Accident/Incident & Investigation)
Office Administrator
Supv. On/Call Emerg. Read.
Industrial Safety Engineer
Fire Safety Engineer
Capital Contract Positions (Shaded) Part-Time Positions
System Safety Engineer
QA Engineer
Executive Director of System Safety
Environmental Safety Inspector
System Safety Auditor
System Safety Officer (5)
Technical Writer
FY10 OPERATING & CAPITAL BUDGETS
OFFICE OF SAFETY
174
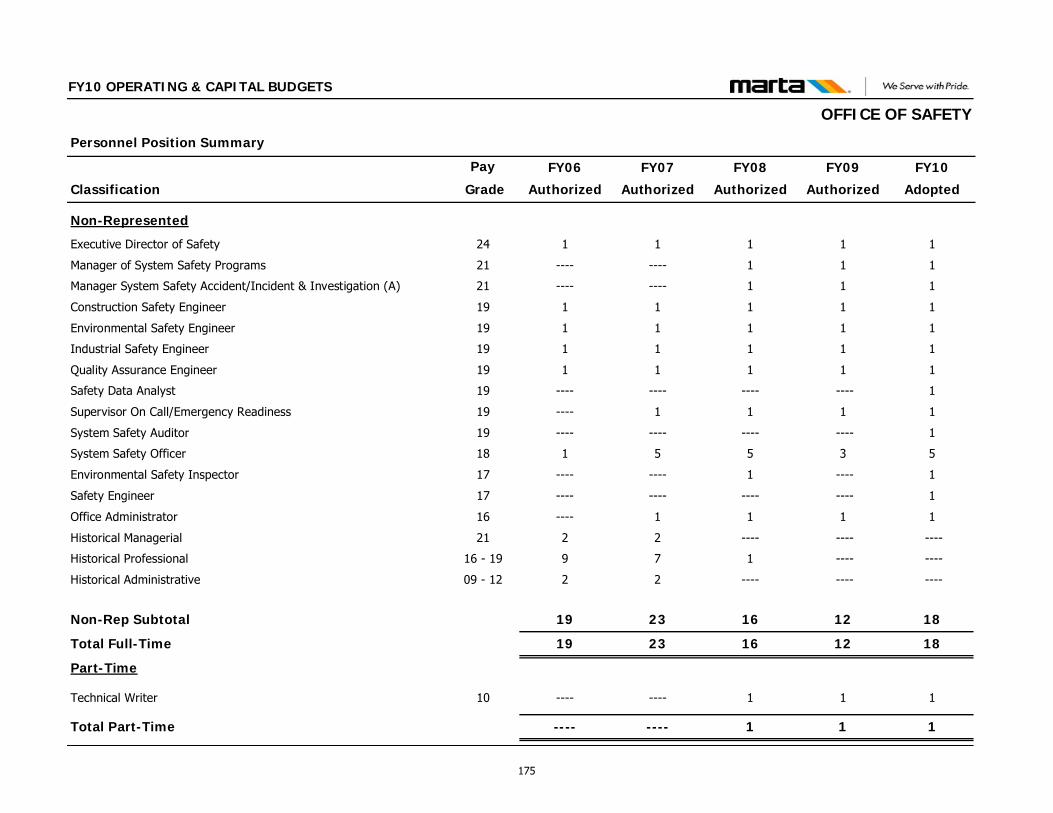
Classification
Personnel Position Summary
Pay FY09
Authorized
FY10
Adopted
FY10 OPERATING & CAPITAL BUDGETS
FY08
Authorized
FY07
Authorized
FY06
Authorized Grade
OFFICE OF SAFETY
Non-Represented
Executive Director of Safety 24 1 1111
Manager of System Safety Programs 21 1 11--------
Manager System Safety Accident/Incident & Investigation (A) 21 1 11--------
Construction Safety Engineer 19 1 1111
Environmental Safety Engineer 19 1 1111
Industrial Safety Engineer 19 1 1111
Quality Assurance Engineer 19 1 1111
Safety Data Analyst 19 ---- 1------------
Supervisor On Call/Emergency Readiness 19 1 111----
System Safety Auditor 19 ---- 1------------
System Safety Officer 18 3 5551
Environmental Safety Inspector 17 ---- 11--------
Safety Engineer 17 ---- 1------------
Office Administrator 16 1 111----
Historical Managerial 21 ---- --------22
Historical Professional 16 - 19 ---- ----179
Historical Administrative 09 - 12 ---- --------22
Non-Rep Subtotal 12 18162319
Total Full-Time 12 18162319
Part-Time
Technical Writer 10 1 11--------
Total Part-Time 1 11--------
175
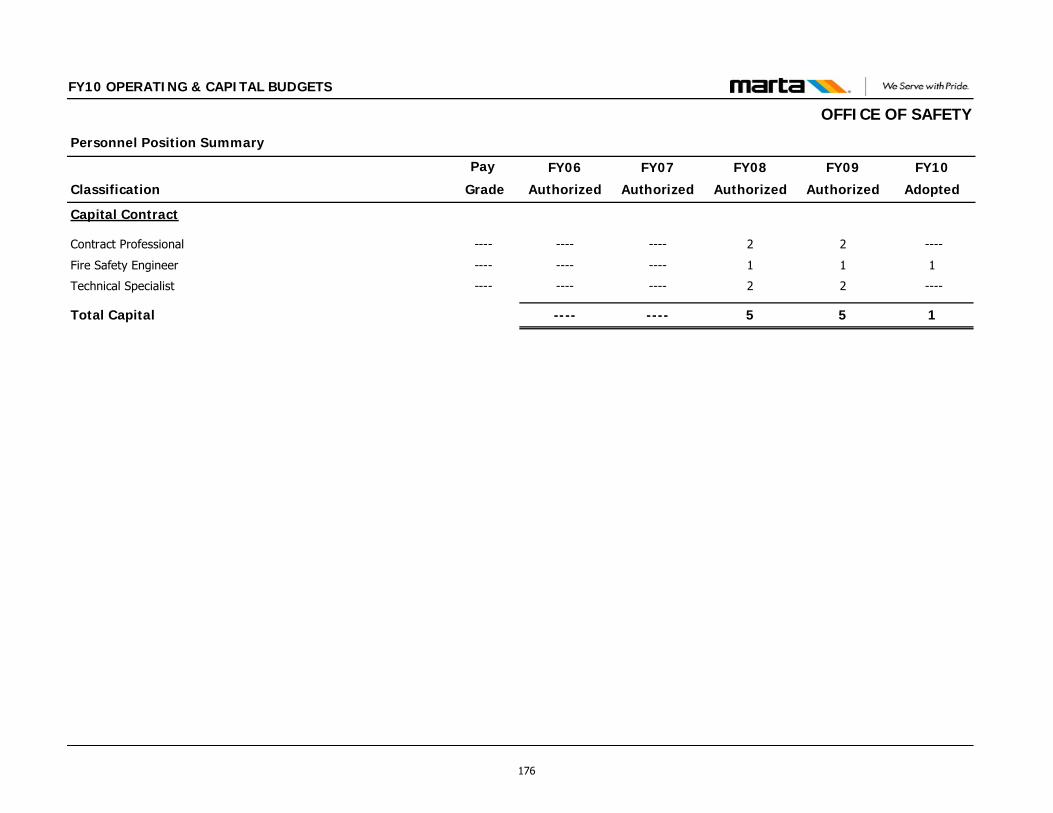
Classification
Personnel Position Summary
Pay FY09
Authorized
FY10
Adopted
FY10 OPERATING & CAPITAL BUDGETS
FY08
Authorized
FY07
Authorized
FY06
Authorized Grade
OFFICE OF SAFETY
Capital Contract
Contract Professional ---- 2 ----2--------
Fire Safety Engineer ---- 1 11--------
Technical Specialist ---- 2 ----2--------
Total Capital 5 15--------
176
FY10 OPERATING & CAPITAL BUDGETS
OFFICE OF QUALITY ASSURANCE & CONFIGURATION MANAGEMENT FUNCTIONS & RESPONSIBILITIES The Office of Quality Assurance & Configuration Management is responsible for the overall direction, development, implementation, monitoring and sustainability of a comprehensive Quality Assurance program in accordance with federal, state and local oversight guidelines and requirements. Quality Assurance & Configuration Management will ensure that the quality-related goals and objectives of the Authority are met and properly administered by all. Quality Assurance & Configuration Management may suspend unsafe and unreliable operations and activities at any time in order to protect passengers, employees, property, facilities and the general public at-large. The Office represents the Authority to federal, state and industry agencies and organizations such as FTA, NTSB, GDOT and APTA. The Office, through the Quality Assurance branch is responsible for developing, implementing, maintaining and managing an inclusive Quality Assurance Program (QAP). The QAP ensures that assemblies, structures, systems of vehicles, equipment and facilities are designed, engineered, manufactured and installed in accordance with specified contractual, industry and government requirements. This is accomplished through contract monitoring, assessments, audits, evaluation, statistical analysis, cross-functional education, process establishment, key performance indicators/measures and best practice implementation. The Office, through the Test and Inspection branch is responsible for developing, implementing, maintaining and managing a comprehensive Testing and Inspection Program. The branch’s primary focus is to verify and ensure through quality control, system evaluations, critical performance measures, testing and cross-functional facilitation/education all new and rehabilitated facilities and systems are in compliance with MARTA standards and are compatible with the existing system; and to improve bus and rail maintenance processes through TQM application. The Office operates a Computer Aided Design and Drafting System (CADD).
The Office is responsible for providing oversight guidance of support to the creation/upgrades to the Authority’s Standard Operating Procedures. The Office provides administrative services in the printing, distribution, and sale of all contract documents issued by the Authority for public view and bid; manages the Authority-wide Configuration Management Program and handles all change to the engineering baseline documents. Provides direction and leadership in transforming the Authority’s paper legacy into electronic format for the Authority’s old contract documents and provides direction in establishing a Configuration Management standard as it relates to new contract documents. FY09 ACCOMPLISHMENTS
Performed quality assurance functions on the CQ310/311 Railcar Rehabilitation Project and Block 2 Modifications and the Collector Shoe Investigation.
Completed 11 QA audits.
Provided QA, and Acceptance Testing support on 71 Authority-wide contracts.
Reviewed and revised the Quality Policies, MARTA Inspection Program Plan (MTPP), System, Quality Assurance Program Plan (QAPP), Office procedures, and the Test Specification Section for capital projects.
Developed 5P Program for Operational Improvements training, work instructions, and templates (a systematic approach to process improvement for incorporating into our corrective action process).
Provided project management, process improvements, and corrective action development and tracking of findings for the RFP 13994 Comprehensive Safety Critical Systems Assessment conducted by Transportation Resource Associates, Inc. (TRA).
177
FY10 OPERATING & CAPITAL BUDGETS
FICE OF QUALIT
OF Y ASSURANCE & CONFIGURATION MANAGEMENT
Coordinated with vendor and MARTA stakeholders to bring the Authority’s Calibration Program into compliance with APTA standards.
Conducted approximately 400 materials receiving inspections; worked with vendors, Contracts, Procurement and Materials, and Bus and Rail Maintenance to resolve discrepancies found during 135 of these inspections.
Participated on the Collector Shoe Study Committee Task Force and coordinated and managed the collector shoes and assemblies testing.
Performed quality assurance functions on the CQ310/311 Railcar Rehabilitation Project and Block 2 Modifications and the Collector Shoe Investigation.
Completed 11 QA audits.
Provided QA, and Acceptance Testing support on 71 Authority-wide contracts.
Reviewed and revised the Quality Policies, MARTA Inspection Program Plan (MTPP), System, Quality Assurance Program Plan (QAPP), Office procedures, and the Test Specification Section for capital projects.
Developed 5P Program for Operational Improvements training, work instructions, and templates (a systematic approach to process improvement for incorporating into our corrective action process).
Provided project management, process improvements, and corrective action development and tracking of findings for the RFP 13994 Comprehensive Safety Critical Systems Assessment conducted by Transportation Resource Associates, Inc. (TRA).
Coordinated with vendor and MARTA stakeholders to bring the Authority’s Calibration Program into compliance with APTA standards.
Conducted approximately 400 materials receiving inspections; worked with vendors, Contracts, Procurement and Materials, and Bus and Rail Maintenance to resolve discrepancies found during 135 of these inspections.
Participated on the Collector Shoe Study Committee Task Force and coordinated and managed the collector shoes and assemblies testing.
Updated approx. 6000 documents and downloaded to Electronic
Data Management System (EDMS).—completed on schedule Documented & distributed Engineering Contract packages--
completed on schedule.
178
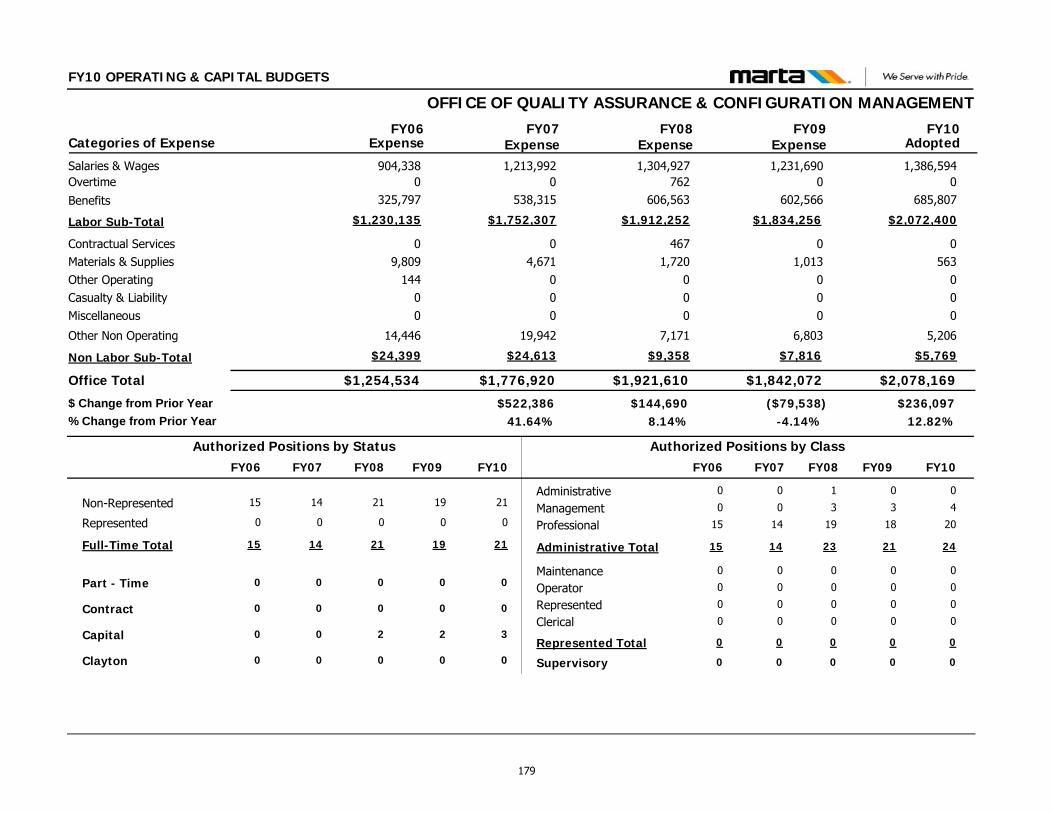
FY10 OPERATING & CAPITAL BUDGETS
OFFICE OF QUALITY ASSURANCE & CONFIGURATION MANAGEMENT
$2,078,169$1,842,072
0563
000
5,206
01,013
000
6,803
Contractual ServicesMaterials & SuppliesOther OperatingCasualty & LiabilityMiscellaneous
Other Non Operating
Office Total
1,386,5941,231,690Salaries & Wages00Overtime
$2,072,400$1,834,256Labor Sub-Total
FY09 FY10Categories of Expense
$1,254,534
09,809
14400
14,446
904,3380
$1,230,135
FY06
$1,776,920
04,671
000
19,942
1,213,9920
$1,752,307
FY07Expense Expense Expense Adopted
$236,097($79,538)$522,38612.82%-4.14%41.64%
$ Change from Prior Year% Change from Prior Year
$1,921,610
4671,720
000
7,171
1,304,927762
$1,912,252
FY08Expense
$144,6908.14%
$5,769$7,816Non Labor Sub-Total $24,399 $24,613 $9,358
685,807602,566Benefits 325,797 538,315 606,563
Administrative
Clerical
Management
MaintenanceOperator
Professional
Represented
Supervisory
0
0
3
0
0
18
0
0
0
0
4
0
0
20
0
0
Non-Represented 19 21
Part - Time 0 0
Represented 0 0
Full-Time Total 19 21
Contract 0 0
Capital 2 3
Authorized Positions by Class
Administrative Total 21 24
Authorized Positions by Status
Represented Total 0 0
0
0
0
0
0
14
0
0
14
0
0
14
0
0
14
0
0
0
0
0
0
15
0
0
15
0
0
15
0
0
15
0
FY10FY09 FY07FY06 FY10FY09 FY07FY06
Clayton 0 000
21
0
0
21
0
2
FY08
0
1
0
3
0
0
19
0
0
23
0
FY08
179
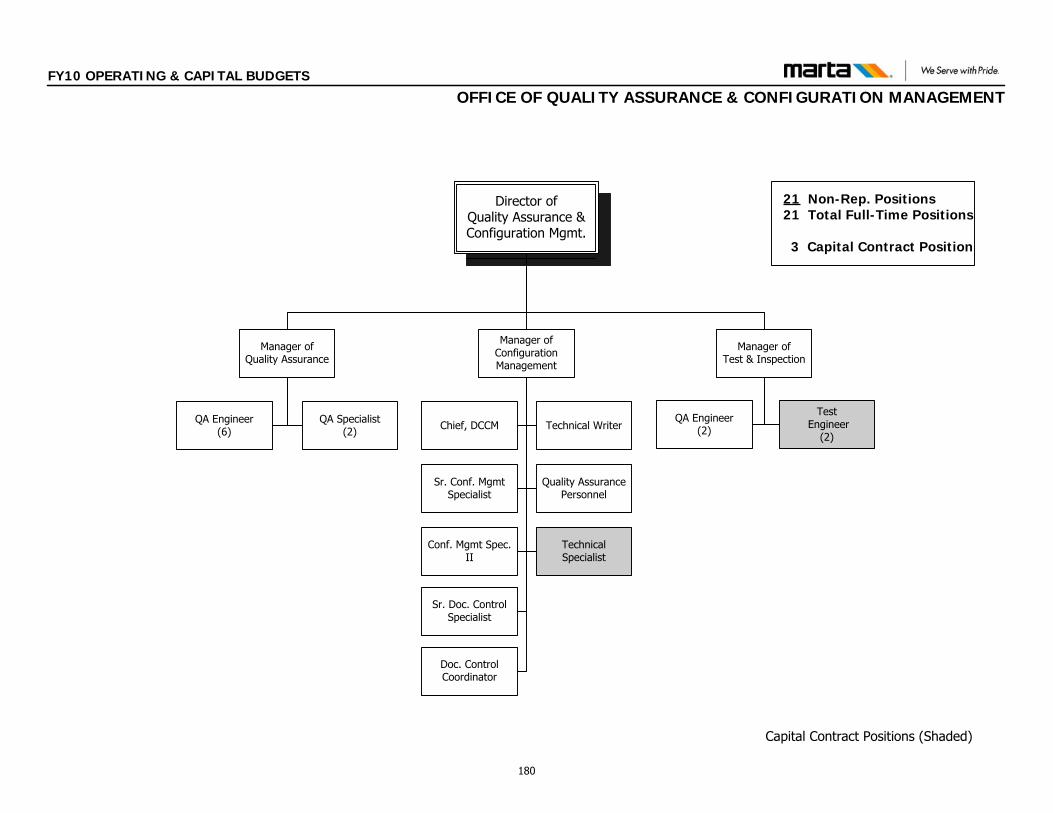
21 Non-Rep. Positions 21 Total Full-Time Positions
3 Capital Contract Position
QA Engineer (6)
Manager ofQuality Assurance
QA Specialist (2)
QA Engineer (2)
Manager ofTest & Inspection
Test Engineer
(2)
Capital Contract Positions (Shaded)
Director of Quality Assurance & Configuration Mgmt.
Quality Assurance Personnel
Manager ofConfiguration Management
Technical Specialist
Chief, DCCM
Conf. Mgmt Spec. II
Sr. Conf. Mgmt Specialist
Sr. Doc. Control Specialist
Doc. Control Coordinator
Technical Writer
FY10 OPERATING & CAPITAL BUDGETS
OFFICE OF QUALITY ASSURANCE & CONFIGURATION MANAGEMENT
180
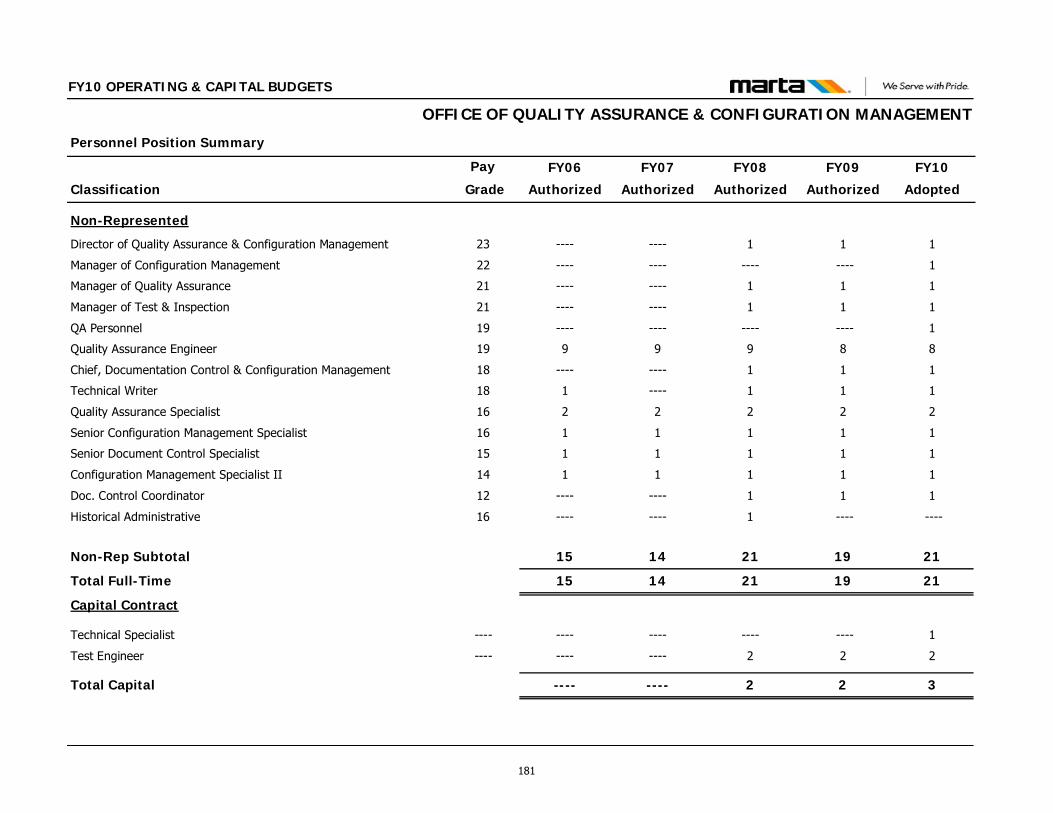
Classification
Personnel Position Summary
Pay FY09
Authorized
FY10
Adopted
FY10 OPERATING & CAPITAL BUDGETS
FY08
Authorized
FY07
Authorized
FY06
Authorized Grade
OFFICE OF QUALITY ASSURANCE & CONFIGURATION MANAGEMENT
Non-Represented
Director of Quality Assurance & Configuration Management 23 1 11--------
Manager of Configuration Management 22 ---- 1------------
Manager of Quality Assurance 21 1 11--------
Manager of Test & Inspection 21 1 11--------
QA Personnel 19 ---- 1------------
Quality Assurance Engineer 19 8 8999
Chief, Documentation Control & Configuration Management 18 1 11--------
Technical Writer 18 1 11----1
Quality Assurance Specialist 16 2 2222
Senior Configuration Management Specialist 16 1 1111
Senior Document Control Specialist 15 1 1111
Configuration Management Specialist II 14 1 1111
Doc. Control Coordinator 12 1 11--------
Historical Administrative 16 ---- ----1--------
Non-Rep Subtotal 19 21211415
Total Full-Time 19 21211415
Capital Contract
Technical Specialist ---- ---- 1------------
Test Engineer ---- 2 22--------
Total Capital 2 32--------
181

This page intentionally left blank
182
DEPARTMENT OF BUS OPERATIONS This Department includes the following Offices: Department of Bus Operations Office of AGM of Bus Operations Office of Bus Transportation Office of Bus Maintenance Office of Clayton County Transit
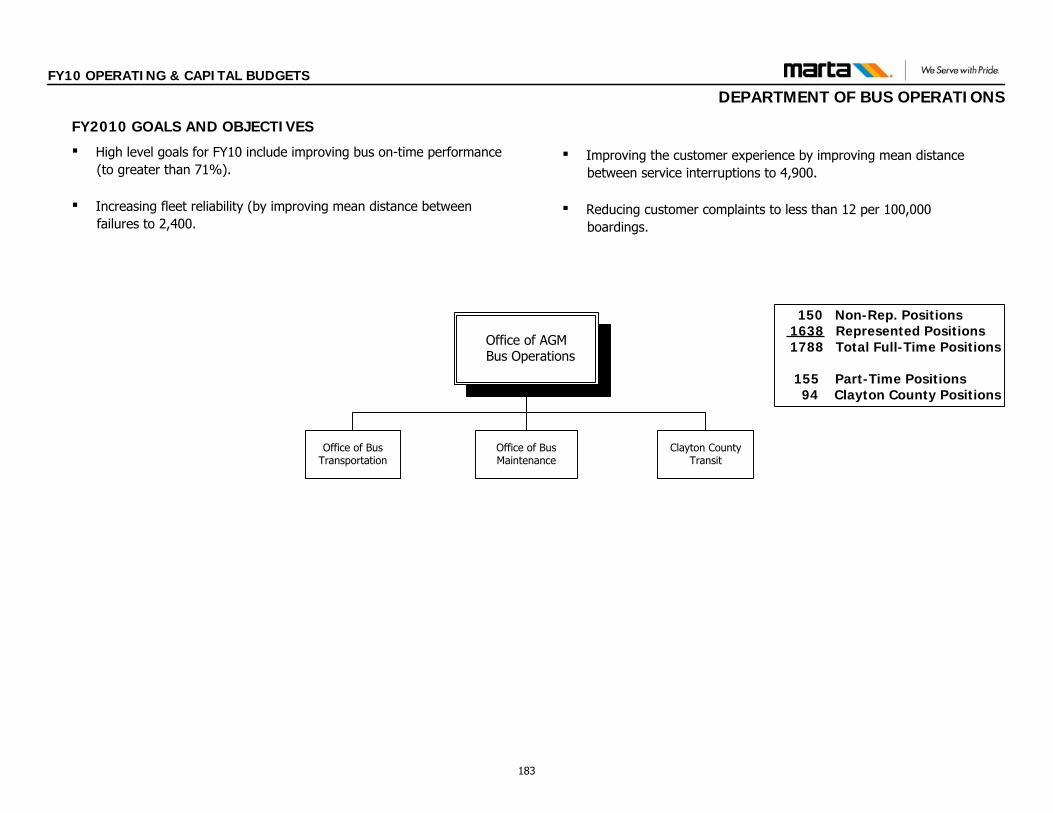
FY10 OPERATING & CAPITAL BUDGETS
DEPARTMENT OF BUS OPERATIONS
Office of AGMBus Operations
Office of Bus Transportation
150 Non-Rep. Positions1638 Represented Positions1788 Total Full-Time Positions
155 Part-Time Positions 94 Clayton County Positions
Office of Bus Maintenance
Clayton County Transit
FY2010 GOALS AND OBJECTIVES
▪ High level goals for FY10 include improving bus on-time performance(to greater than 71%).
▪ Increasing fleet reliability (by improving mean distance betweenfailures to 2,400.
▪ Improving the customer experience by improving mean distancebetween service interruptions to 4,900.
▪ Reducing customer complaints to less than 12 per 100,000 boardings.
183
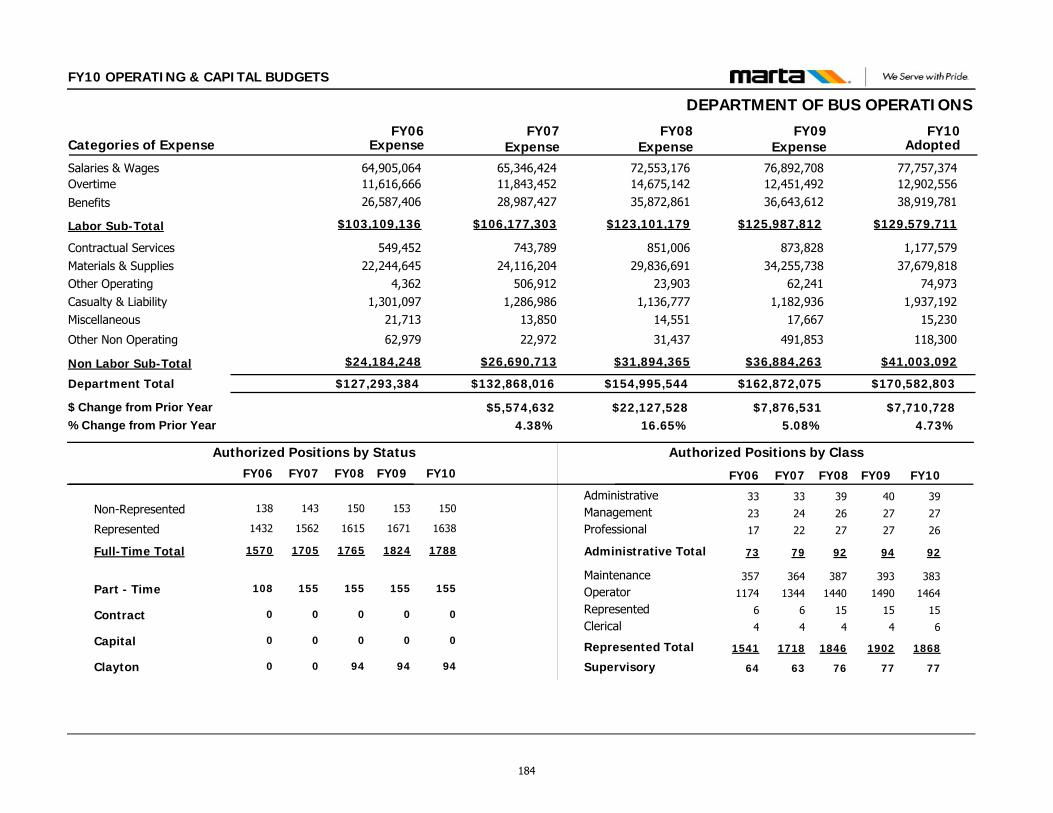
FY10 OPERATING & CAPITAL BUDGETS
DEPARTMENT OF BUS OPERATIONS
$170,582,803$162,872,075
1,177,57937,679,818
74,9731,937,192
15,230
118,300
873,82834,255,738
62,2411,182,936
17,667
491,853
Contractual ServicesMaterials & SuppliesOther OperatingCasualty & LiabilityMiscellaneous
Other Non Operating
Department Total
77,757,37476,892,708Salaries & Wages12,902,55612,451,492Overtime
$129,579,711$125,987,812Labor Sub-Total
FY09 FY10Categories of Expense
$127,293,384
549,45222,244,645
4,3621,301,097
21,713
62,979
64,905,06411,616,666
$103,109,136
FY06
$132,868,016
743,78924,116,204
506,9121,286,986
13,850
22,972
65,346,42411,843,452
$106,177,303
FY07Expense Expense Expense Adopted
$7,710,728$7,876,531$5,574,6324.73%5.08%4.38%
$ Change from Prior Year% Change from Prior Year
$154,995,544
851,00629,836,691
23,9031,136,777
14,551
31,437
72,553,17614,675,142
$123,101,179
FY08Expense
$22,127,52816.65%
$41,003,092$36,884,263Non Labor Sub-Total $24,184,248 $26,690,713 $31,894,365
38,919,78136,643,612Benefits 26,587,406 28,987,427 35,872,861
Administrative
Clerical
Management
MaintenanceOperator
Professional
Represented
Supervisory
40
4
27
393
1490
27
15
77
39
6
27
383
1464
26
15
77
Non-Represented 153 150
Part - Time 155 155
Represented 1671 1638
Full-Time Total 1824 1788
Contract 0 0
Capital 0 0
Authorized Positions by Class
Administrative Total 94 92
Authorized Positions by Status
Represented Total 1902 1868
33
4
24
364
1344
22
6
63
143
155
1562
1705
0
0
79
1718
33
4
23
357
1174
17
6
64
138
108
1432
1570
0
0
73
1541
FY10FY09 FY07FY06 FY10FY09 FY07FY06
Clayton 94 9400
150
155
1615
1765
0
0
FY08
94
39
4
26
387
1440
27
15
76
92
1846
FY08
184
FY10 OPERATING & CAPITAL BUDGETS
OFFICE OF THE AGM OF BUS OPERATIONS
FUNCTIONS & RESPONSIBILITIES
The Office of the AGM of Bus Operations is responsible for the overall
operation and safety of the Authority’s Bus system to include contracted
bus services.
Other offices in the Department of Bus Operations are the following:
Bus Transportation
Bus Maintenance
Bus Transportation, with over 1,500 employees, covers three (3)
primary areas of operations: Perry Blvd, Hamilton Blvd and Laredo. This
office is responsible for the daily transport of passengers on the fixed
route bus system. It operates 600 buses. The combined fleet travels
over 30.1 million miles annually on 130 bus routes, small bus services and
special events. Also, this office is responsible for the Bus Radio
Communication Center that serves as the critical 24-hour communication
link between all buses and Operations. The Communication Center
serves includes the MARTA Intelligent Transportation System (ITS)
component that provides the Automatic Vehicle locator (AVL) System, the
Automatic Passenger Counter (APC) System, and a link to the Georgia
Department of Transportation (GDOT).
Bus Maintenance, with over 450 employees has four (4) vehicle maintenance facilities, one heavy maintenance facility utilized to maintain the bus fleet and Fleet Management Services for non revenue vehicles: The Office of Bus Maintenance is responsible for the comprehensive maintenance of the Authority’s buses, paratransit vans, light duty and non revenue vehicles. Comprehensive maintenance includes routine repairs, preventive maintenance, body work, painting of vehicles, rebuild of various components, daily cleaning and fueling of revenue vehicles. There are: Laredo Garage in the east, Perry Garage in the west, Hamilton Garage and Browns Mill Heavy Maintenance in the south. Brady Garage is centrally located near the center of the metro area, in Fulton County.
FY09 ACCOMPLISHMENTS
Met Bus On-Time Performance 70% goal Met and Exceeded Bus Off the Lot Performance 99% goal Received “Clean Air Award” for 15 years of contribution to clean
cities Reinstituted 2 Year Apprenticeship Program Awarded New Bus Replacement Contract for $50M Warranty Recovery for FY09 at $1.1M in cash, parts, and vendor
repairs Completed 75 Mid-Life Overhauls
185

FY10 OPERATING & CAPITAL BUDGETS
OFFICE OF THE AGM OF BUS OPERATIONS
$546,879$500,412
03,700
000
2,891
03,124
000
2,656
Contractual ServicesMaterials & SuppliesOther OperatingCasualty & LiabilityMiscellaneous
Other Non Operating
Office Total
361,606330,193Salaries & Wages00Overtime
$540,288$494,632Labor Sub-Total
FY09 FY10Categories of Expense
$213,921
01,653
000
5,187
138,1510
$207,081
FY06
$744,456
04,374
8100
2,372
542,0070
$737,629
FY07Expense Expense Expense Adopted
$46,467($177,706)$530,5359.29%-26.21%248.01%
$ Change from Prior Year% Change from Prior Year
$678,118
02,863
000
7,026
472,5500
$668,229
FY08Expense
($66,338)-8.91%
$6,591$5,780Non Labor Sub-Total $6,840 $6,827 $9,889
178,683164,439Benefits 68,930 195,622 195,679
Administrative
Clerical
Management
MaintenanceOperator
Professional
Represented
Supervisory
1
0
1
0
0
2
0
0
1
0
2
0
0
1
0
0
Non-Represented 4 4
Part - Time 0 0
Represented 0 0
Full-Time Total 4 4
Contract 0 0
Capital 0 0
Authorized Positions by Class
Administrative Total 4 4
Authorized Positions by Status
Represented Total 0 0
0
0
1
0
0
1
0
0
2
0
0
2
0
0
2
0
0
0
1
0
0
1
0
0
2
0
0
2
0
0
2
0
FY10FY09 FY07FY06 FY10FY09 FY07FY06
Clayton 0 000
3
0
0
3
0
0
FY08
0
0
0
1
0
0
2
0
0
3
0
FY08
186
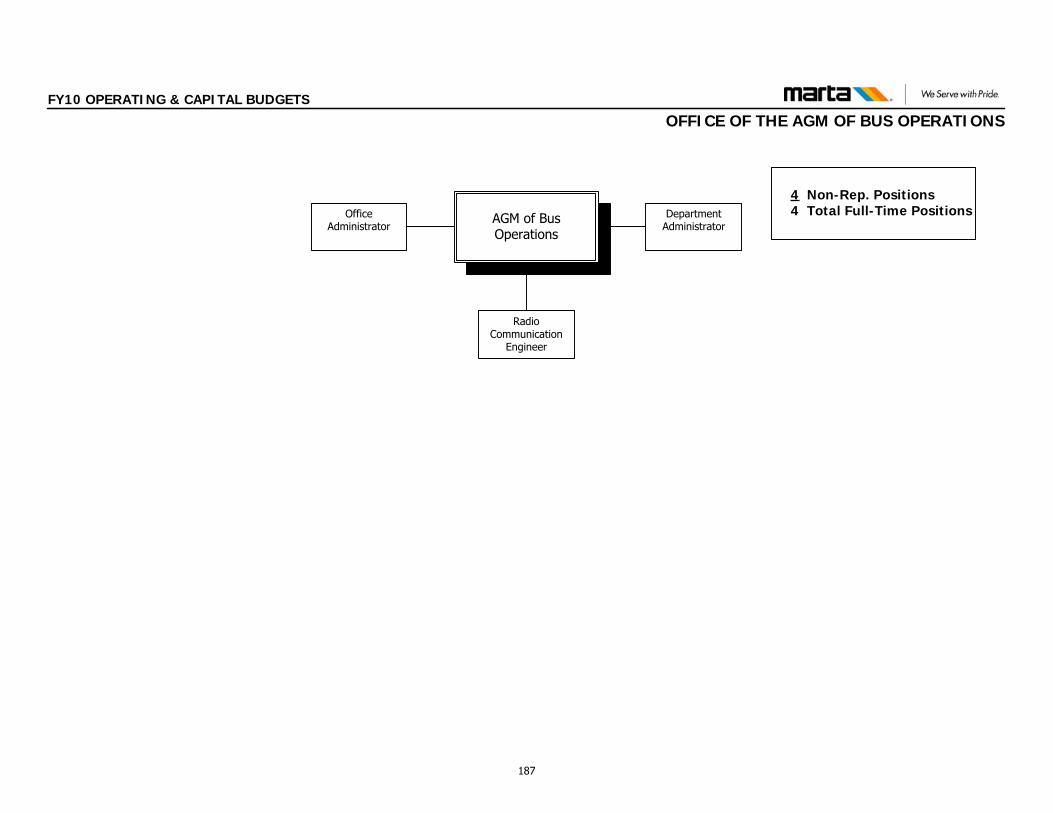
FY10 OPERATING & CAPITAL BUDGETS
OFFICE OF THE AGM OF BUS OPERATIONS
AGM of Bus Operations
4 Non-Rep. Positions4 Total Full-Time PositionsDepartment
AdministratorOffice
Administrator
Radio Communication
Engineer
187
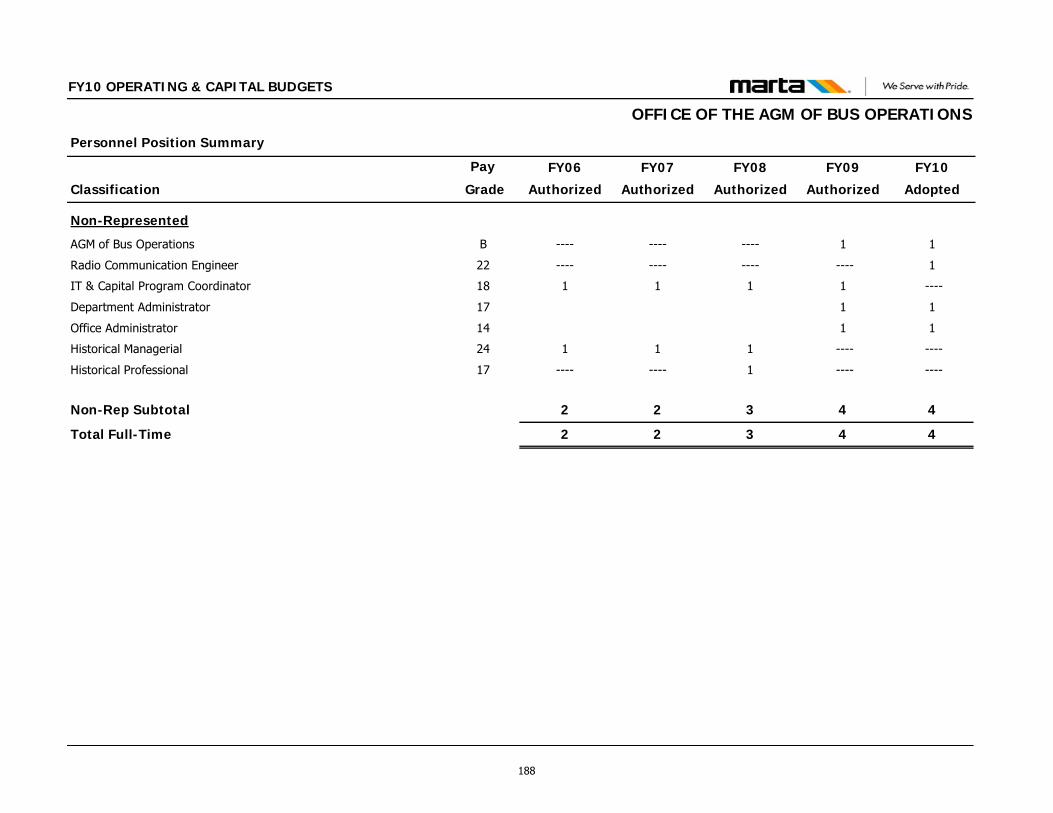
Classification
Personnel Position Summary
Pay FY09
Authorized
FY10
Adopted
FY10 OPERATING & CAPITAL BUDGETS
FY08
Authorized
FY07
Authorized
FY06
Authorized Grade
OFFICE OF THE AGM OF BUS OPERATIONS
Non-Represented
AGM of Bus Operations B 1 1------------
Radio Communication Engineer 22 ---- 1------------
IT & Capital Program Coordinator 18 1 ----111
Department Administrator 17 1 1
Office Administrator 14 1 1
Historical Managerial 24 ---- ----111
Historical Professional 17 ---- ----1--------
Non-Rep Subtotal 4 4322
Total Full-Time 4 4322
188
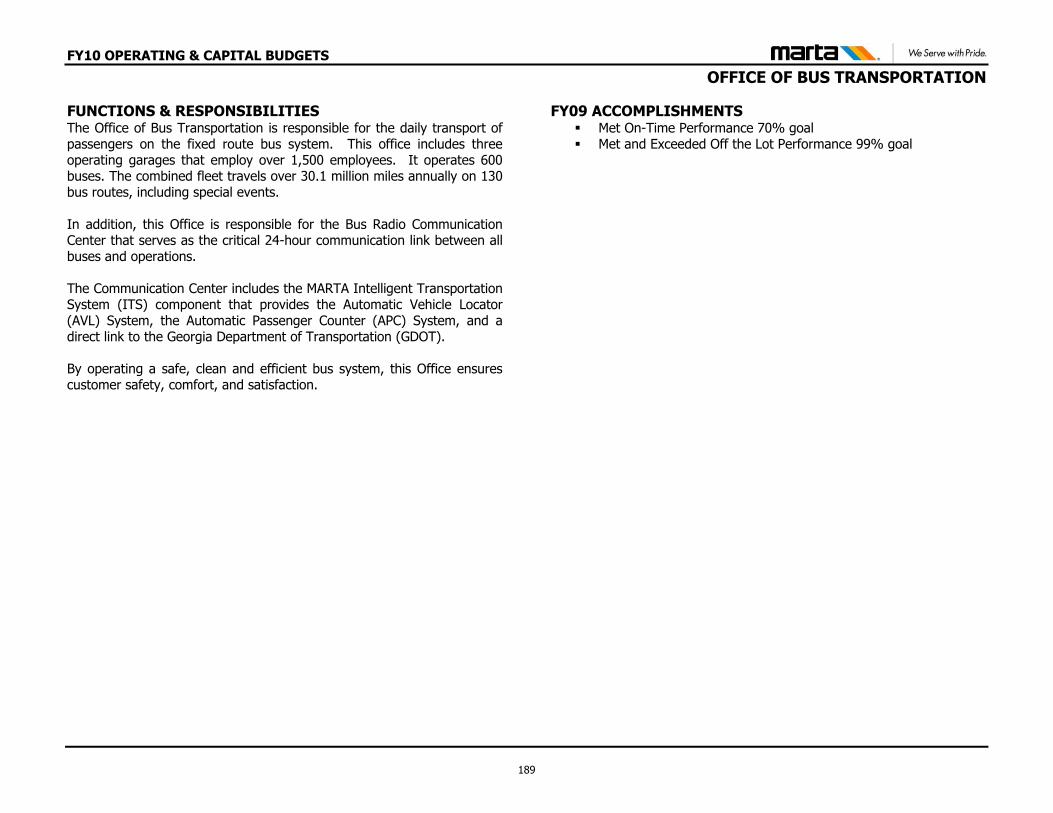
FY10 OPERATING & CAPITAL BUDGETS
OFFICE OF BUS TRANSPORTATION
FUNCTIONS & RESPONSIBILITIES The Office of Bus Transportation is responsible for the daily transport of passengers on the fixed route bus system. This office includes three operating garages that employ over 1,500 employees. It operates 600 buses. The combined fleet travels over 30.1 million miles annually on 130 bus routes, including special events. In addition, this Office is responsible for the Bus Radio Communication Center that serves as the critical 24-hour communication link between all buses and operations. The Communication Center includes the MARTA Intelligent Transportation System (ITS) component that provides the Automatic Vehicle Locator (AVL) System, the Automatic Passenger Counter (APC) System, and a direct link to the Georgia Department of Transportation (GDOT). By operating a safe, clean and efficient bus system, this Office ensures customer safety, comfort, and satisfaction.
FY09 ACCOMPLISHMENTS Met On-Time Performance 70% goal Met and Exceeded Off the Lot Performance 99% goal
189
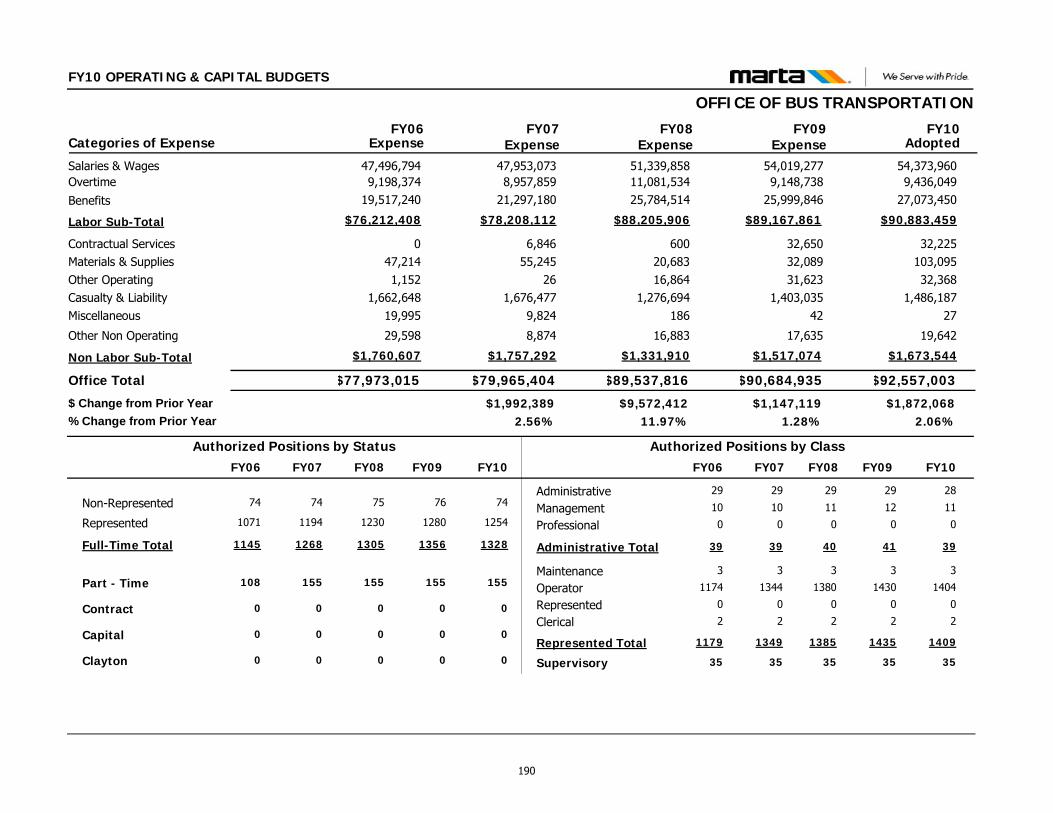
FY10 OPERATING & CAPITAL BUDGETS
OFFICE OF BUS TRANSPORTATION
$92,557,003$90,684,935
32,225103,09532,368
1,486,18727
19,642
32,65032,08931,623
1,403,03542
17,635
Contractual ServicesMaterials & SuppliesOther OperatingCasualty & LiabilityMiscellaneous
Other Non Operating
Office Total
54,373,96054,019,277Salaries & Wages9,436,0499,148,738Overtime
$90,883,459$89,167,861Labor Sub-Total
FY09 FY10Categories of Expense
$77,973,015
047,2141,152
1,662,64819,995
29,598
47,496,7949,198,374
$76,212,408
FY06
$79,965,404
6,84655,245
261,676,477
9,824
8,874
47,953,0738,957,859
$78,208,112
FY07Expense Expense Expense Adopted
$1,872,068$1,147,119$1,992,3892.06%1.28%2.56%
$ Change from Prior Year% Change from Prior Year
$89,537,816
60020,68316,864
1,276,694186
16,883
51,339,85811,081,534
$88,205,906
FY08Expense
$9,572,41211.97%
$1,673,544$1,517,074Non Labor Sub-Total $1,760,607 $1,757,292 $1,331,910
27,073,45025,999,846Benefits 19,517,240 21,297,180 25,784,514
Administrative
Clerical
Management
MaintenanceOperator
Professional
Represented
Supervisory
29
2
12
3
1430
0
0
35
28
2
11
3
1404
0
0
35
Non-Represented 76 74
Part - Time 155 155
Represented 1280 1254
Full-Time Total 1356 1328
Contract 0 0
Capital 0 0
Authorized Positions by Class
Administrative Total 41 39
Authorized Positions by Status
Represented Total 1435 1409
29
2
10
3
1344
0
0
35
74
155
1194
1268
0
0
39
1349
29
2
10
3
1174
0
0
35
74
108
1071
1145
0
0
39
1179
FY10FY09 FY07FY06 FY10FY09 FY07FY06
Clayton 0 000
75
155
1230
1305
0
0
FY08
0
29
2
11
3
1380
0
0
35
40
1385
FY08
190
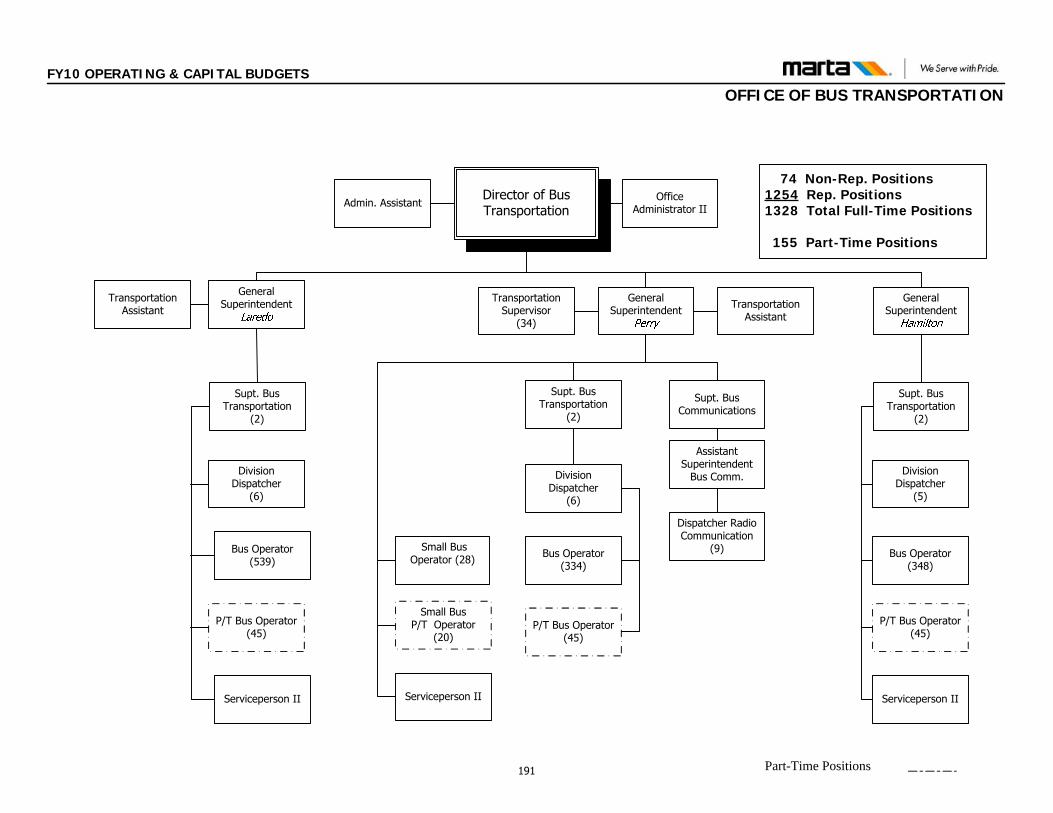
FY10 OPERATING & CAPITAL BUDGETS
OFFICE OF BUS TRANSPORTATION
74 Non-Rep. Positions1254 Rep. Positions1328 Total Full-Time Positions
155 Part-Time Positions
Director of Bus Transportation
General Superintendent General
Superintendent
Supt. Bus Communications
Transportation Assistant
Supt. Bus Transportation
(2)
Division Dispatcher
(6)
Transportation Assistant
Supt. Bus Transportation
(2)
Division Dispatcher
(6)
Bus Operator(334)
Supt. Bus Transportation
(2)
Division Dispatcher
(5)
Bus Operator(348)
Assistant Superintendent
Bus Comm.
Dispatcher Radio Communication
(9)
Transportation Supervisor
(34)
Serviceperson II Serviceperson II
Office Administrator IIAdmin. Assistant
Serviceperson II
General Superintendent
Bus Operator(539)
Part-Time Positions
Small Bus Operator (28)
P/T Bus Operator(45)
P/T Bus Operator(45)
P/T Bus Operator(45)
Small BusP/T Operator
(20)
191
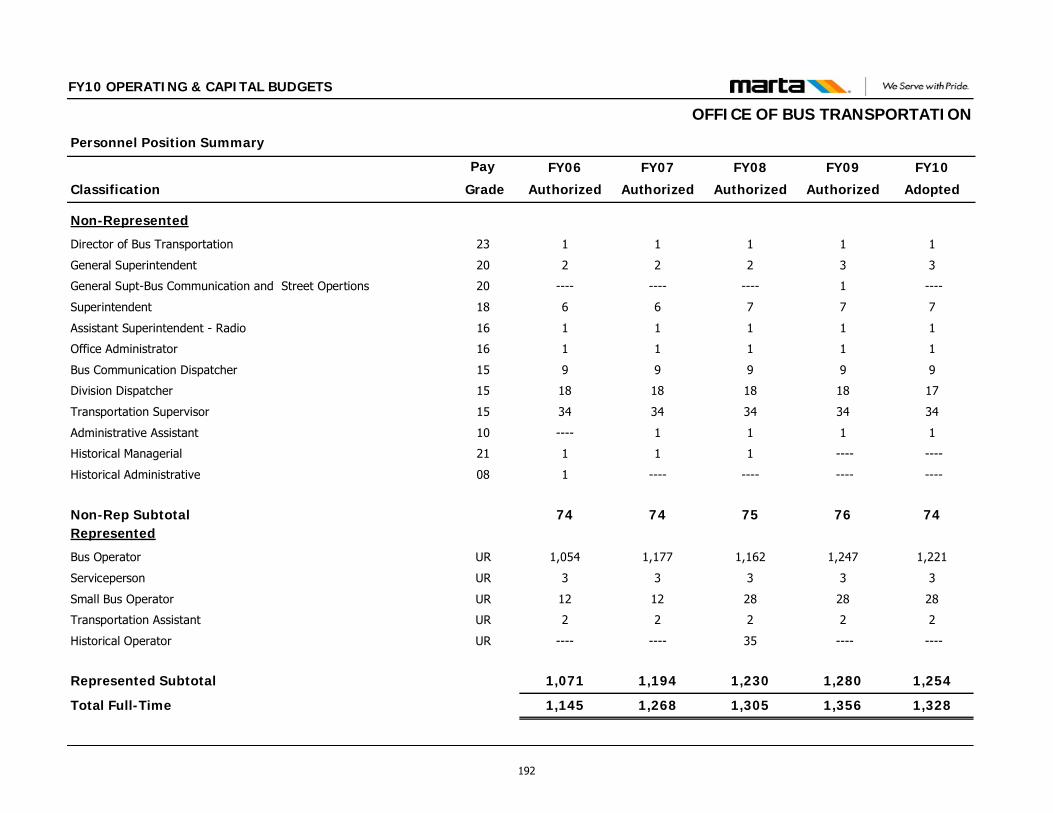
Classification
Personnel Position Summary
Pay FY09
Authorized
FY10
Adopted
FY10 OPERATING & CAPITAL BUDGETS
FY08
Authorized
FY07
Authorized
FY06
Authorized Grade
OFFICE OF BUS TRANSPORTATION
Non-Represented
Director of Bus Transportation 23 1 1111
General Superintendent 20 3 3222
General Supt-Bus Communication and Street Opertions 20 1 ----------------
Superintendent 18 7 7766
Assistant Superintendent - Radio 16 1 1111
Office Administrator 16 1 1111
Bus Communication Dispatcher 15 9 9999
Division Dispatcher 15 18 17181818
Transportation Supervisor 15 34 34343434
Administrative Assistant 10 1 111----
Historical Managerial 21 ---- ----111
Historical Administrative 08 ---- ------------1
Non-Rep Subtotal 76 74757474Represented
Bus Operator UR 1,247 1,2211,1621,1771,054
Serviceperson UR 3 3333
Small Bus Operator UR 28 28281212
Transportation Assistant UR 2 2222
Historical Operator UR ---- ----35--------
Represented Subtotal 1,280 1,2541,2301,1941,071
Total Full-Time 1,356 1,3281,3051,2681,145
192
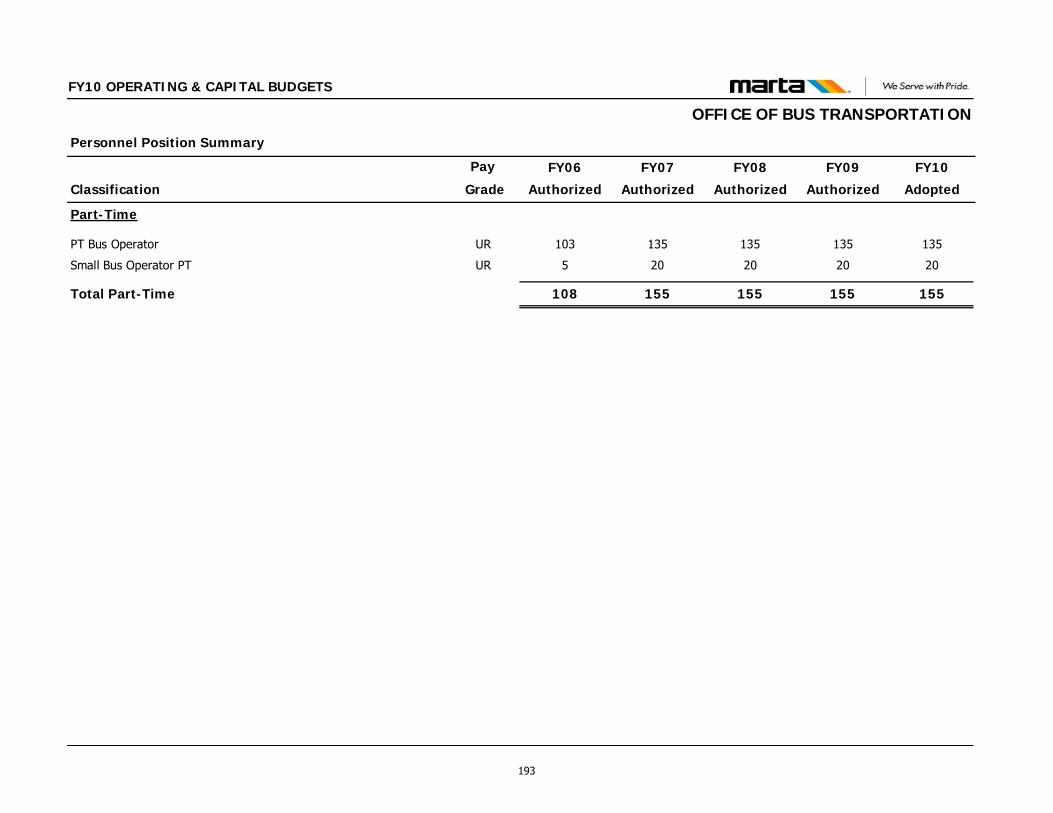
Classification
Personnel Position Summary
Pay FY09
Authorized
FY10
Adopted
FY10 OPERATING & CAPITAL BUDGETS
FY08
Authorized
FY07
Authorized
FY06
Authorized Grade
OFFICE OF BUS TRANSPORTATION
Part-Time
PT Bus Operator UR 135 135135135103
Small Bus Operator PT UR 20 2020205
Total Part-Time 155 155155155108
193
FY10 OPERATING & CAPITAL BUDGETS
OFFICE OF BUS MAINTENANCE
FUNCTIONS & RESPONSIBILITIES The office is responsible for the comprehensive maintenance of the Authority’s buses, paratransit vans, and light duty vehicles. The office employs 456 employees and maintains 576 buses, 174 paratransit vans, and over 446 light duty non-revenue vehicles. The Office of Bus Maintenance operates four bus maintenance garages and one heavy maintenance facility. Within each maintenance garage at Brady, Hamilton, Laredo, or Perry, personnel perform preventive maintenance, routine repairs, and servicing of buses operating out of their respective facilities. The Browns Mill Heavy Maintenance Facility performs major repairs, body and frame maintenance, repainting, non-revenue vehicle maintenance, and major component overhaul. There are two specialty groups within the Office of Bus Maintenance; Engineering and Planning. The Bus Engineering group maintains a current parts inventory, writes technical specifications, provides new technology information, oversees technical inspections of new vehicles during build, and provides technical assistance to the operating facilities. Planning schedules all maintenance work, conducts trend analysis, and provides trend feedback to Engineering. They are also responsible for maintaining all equipment maintenance records and key performance indicators.
FY09 ACCOMPLISHMENTS
Received “Clean Air Award” for 15 years of contribution to clean cities
Reinstituted 2 Year Apprenticeship Program Awarded New Bus Replacement Contract for $50M Warranty Recovery for FY09 at $1.1M in cash, parts, and
vendor repairs Completed 75 Mid-Life Overhauls
194
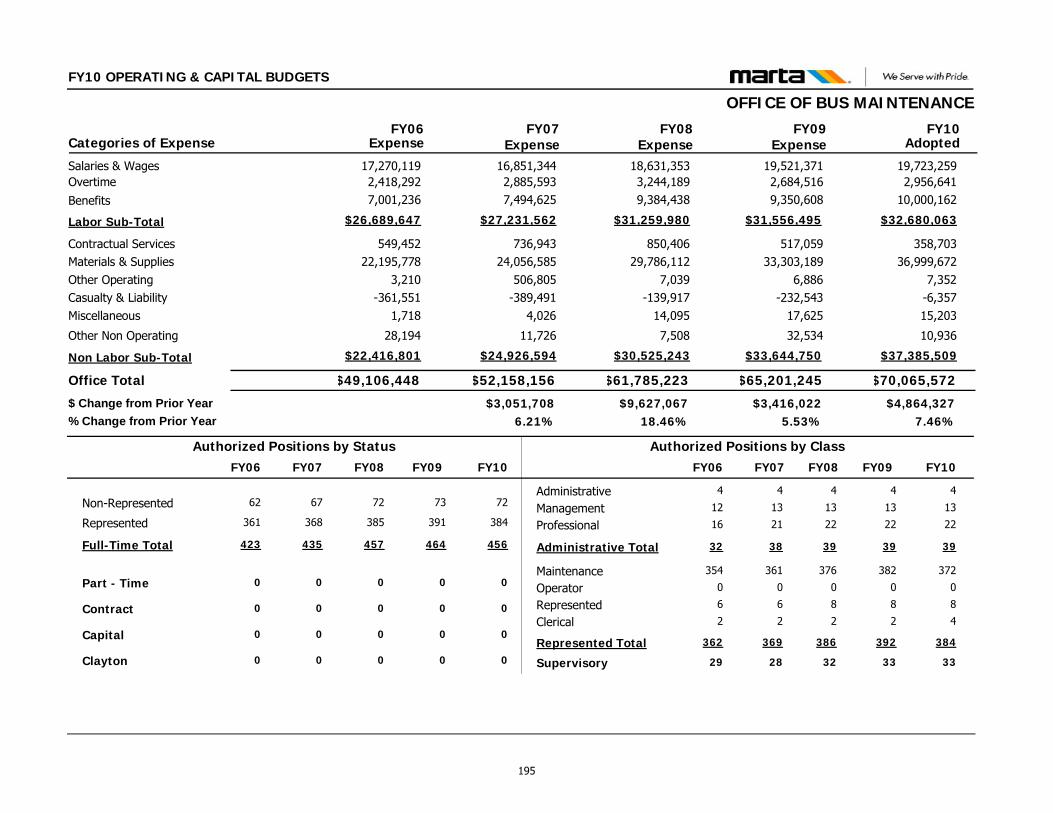
FY10 OPERATING & CAPITAL BUDGETS
OFFICE OF BUS MAINTENANCE
$70,065,572$65,201,245
358,70336,999,672
7,352-6,35715,203
10,936
517,05933,303,189
6,886-232,543
17,625
32,534
Contractual ServicesMaterials & SuppliesOther OperatingCasualty & LiabilityMiscellaneous
Other Non Operating
Office Total
19,723,25919,521,371Salaries & Wages2,956,6412,684,516Overtime
$32,680,063$31,556,495Labor Sub-Total
FY09 FY10Categories of Expense
$49,106,448
549,45222,195,778
3,210-361,551
1,718
28,194
17,270,1192,418,292
$26,689,647
FY06
$52,158,156
736,94324,056,585
506,805-389,491
4,026
11,726
16,851,3442,885,593
$27,231,562
FY07Expense Expense Expense Adopted
$4,864,327$3,416,022$3,051,7087.46%5.53%6.21%
$ Change from Prior Year% Change from Prior Year
$61,785,223
850,40629,786,112
7,039-139,917
14,095
7,508
18,631,3533,244,189
$31,259,980
FY08Expense
$9,627,06718.46%
$37,385,509$33,644,750Non Labor Sub-Total $22,416,801 $24,926,594 $30,525,243
10,000,1629,350,608Benefits 7,001,236 7,494,625 9,384,438
Administrative
Clerical
Management
MaintenanceOperator
Professional
Represented
Supervisory
4
2
13
382
0
22
8
33
4
4
13
372
0
22
8
33
Non-Represented 73 72
Part - Time 0 0
Represented 391 384
Full-Time Total 464 456
Contract 0 0
Capital 0 0
Authorized Positions by Class
Administrative Total 39 39
Authorized Positions by Status
Represented Total 392 384
4
2
13
361
0
21
6
28
67
0
368
435
0
0
38
369
4
2
12
354
0
16
6
29
62
0
361
423
0
0
32
362
FY10FY09 FY07FY06 FY10FY09 FY07FY06
Clayton 0 000
72
0
385
457
0
0
FY08
0
4
2
13
376
0
22
8
32
39
386
FY08
195
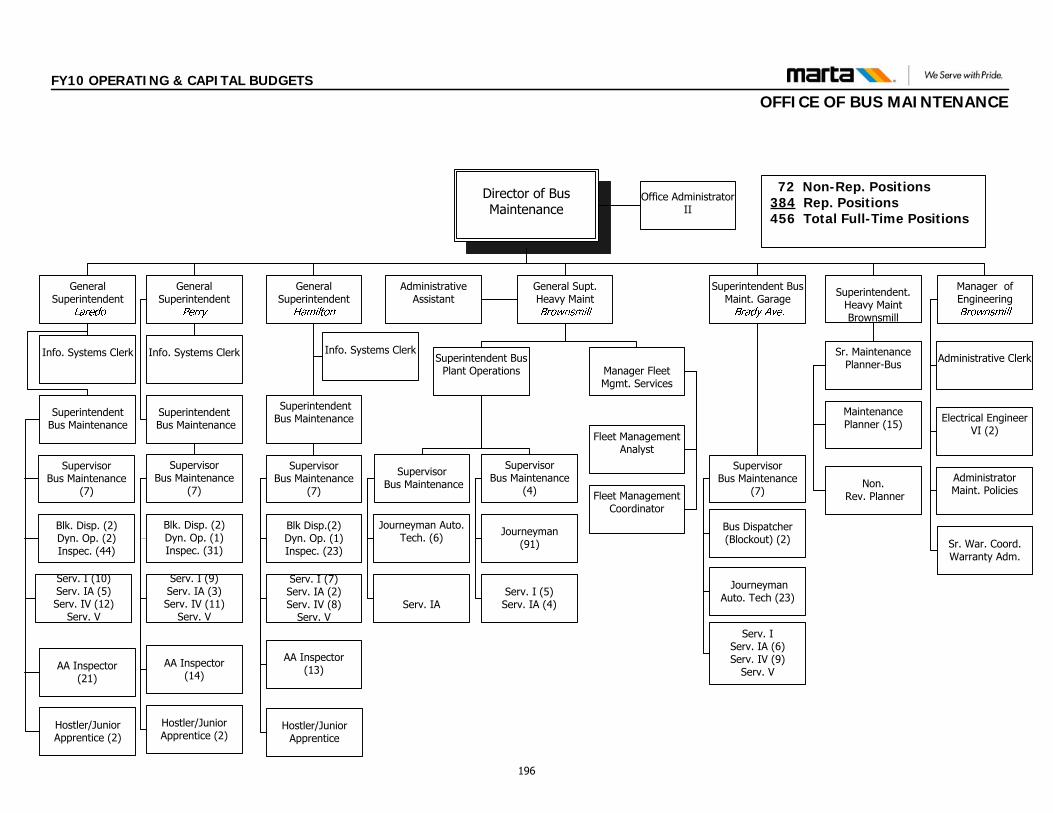
FY10 OPERATING & CAPITAL BUDGETS
OFFICE OF BUS MAINTENANCE
Director of Bus Maintenance
Office Administrator II
Administrative Assistant
General Superintendent
General Superintendent
General Superintendent
General Supt. Heavy Maint
Sr. Maintenance Planner-Bus
Maintenance Planner (15)
Superintendent Bus Plant Operations
Supervisor Bus Maintenance
SupervisorBus Maintenance
(7)
Superintendent Bus Maintenance
Supervisor Bus Maintenance
(7)
Blk. Disp. (2)Dyn. Op. (2)Inspec. (44)
Serv. I (10)Serv. IA (5)Serv. IV (12)
Serv. V
SuperintendentBus Maintenance
Supervisor Bus Maintenance
(7)
Blk. Disp. (2)Dyn. Op. (1)Inspec. (31)
Serv. I (9)Serv. IA (3)Serv. IV (11)
Serv. V
Manager of Engineering
Supervisor Bus Maintenance
(4)
Journeyman(91)
Electrical Engineer VI (2)
Sr. War. Coord. Warranty Adm.
Administrative Clerk
Serv. I (7)Serv. IA (2)Serv. IV (8)
Serv. V
72 Non-Rep. Positions384 Rep. Positions456 Total Full-Time Positions
AA Inspector(21)
AA Inspector(14)
Hostler/JuniorApprentice
Hostler/JuniorApprentice (2)
Hostler/JuniorApprentice (2)
Serv. IA
AA Inspector(13)
Blk Disp.(2)Dyn. Op. (1)Inspec. (23)
Superintendent. Heavy MaintBrownsmill
Superintendent Bus Maint. Garage
Supervisor Bus Maintenance
(7)
Bus Dispatcher (Blockout) (2)
JourneymanAuto. Tech (23)
Journeyman Auto. Tech. (6)
Administrator Maint. Policies
Info. Systems Clerk
Superintendent Bus Maintenance
Manager Fleet Mgmt. Services
Fleet Management Analyst
Fleet Management Coordinator
Serv. I Serv. IA (6)Serv. IV (9)
Serv. V
Non.Rev. Planner
Serv. I (5)Serv. IA (4)
Info. Systems ClerkInfo. Systems Clerk
196
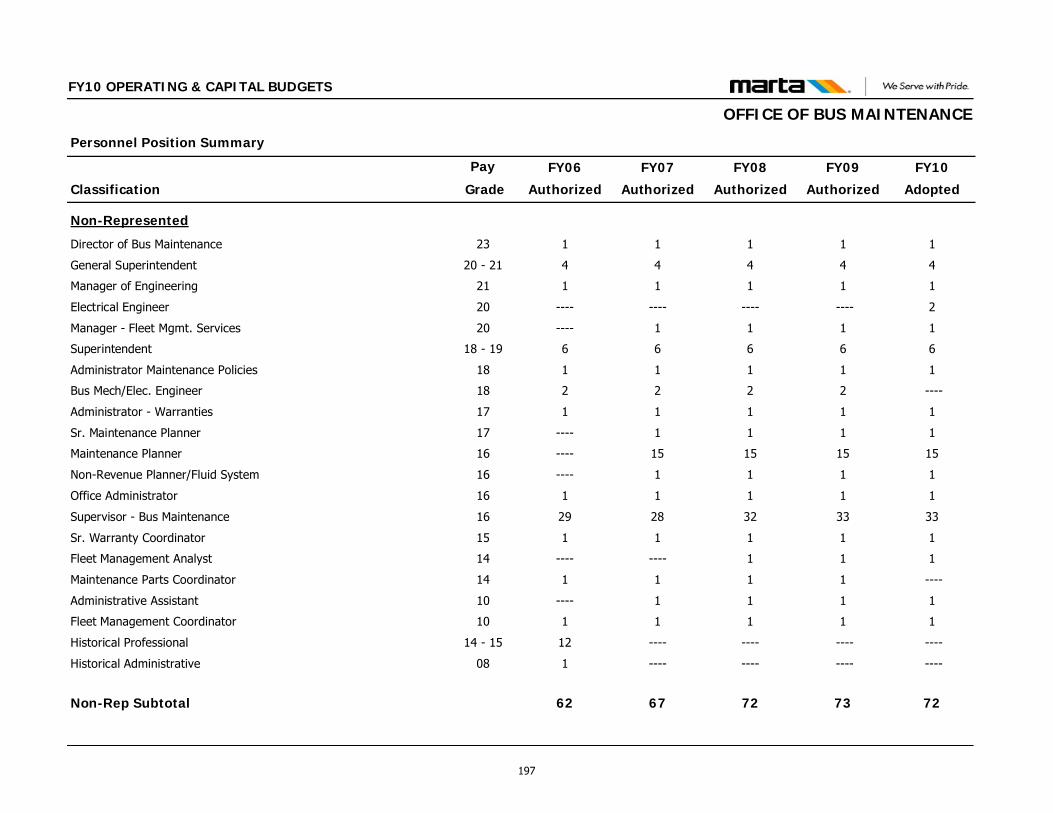
Classification
Personnel Position Summary
Pay FY09
Authorized
FY10
Adopted
FY10 OPERATING & CAPITAL BUDGETS
FY08
Authorized
FY07
Authorized
FY06
Authorized Grade
OFFICE OF BUS MAINTENANCE
Non-Represented
Director of Bus Maintenance 23 1 1111
General Superintendent 20 - 21 4 4444
Manager of Engineering 21 1 1111
Electrical Engineer 20 ---- 2------------
Manager - Fleet Mgmt. Services 20 1 111----
Superintendent 18 - 19 6 6666
Administrator Maintenance Policies 18 1 1111
Bus Mech/Elec. Engineer 18 2 ----222
Administrator - Warranties 17 1 1111
Sr. Maintenance Planner 17 1 111----
Maintenance Planner 16 15 151515----
Non-Revenue Planner/Fluid System 16 1 111----
Office Administrator 16 1 1111
Supervisor - Bus Maintenance 16 33 33322829
Sr. Warranty Coordinator 15 1 1111
Fleet Management Analyst 14 1 11--------
Maintenance Parts Coordinator 14 1 ----111
Administrative Assistant 10 1 111----
Fleet Management Coordinator 10 1 1111
Historical Professional 14 - 15 ---- ------------12
Historical Administrative 08 ---- ------------1
Non-Rep Subtotal 73 72726762
197
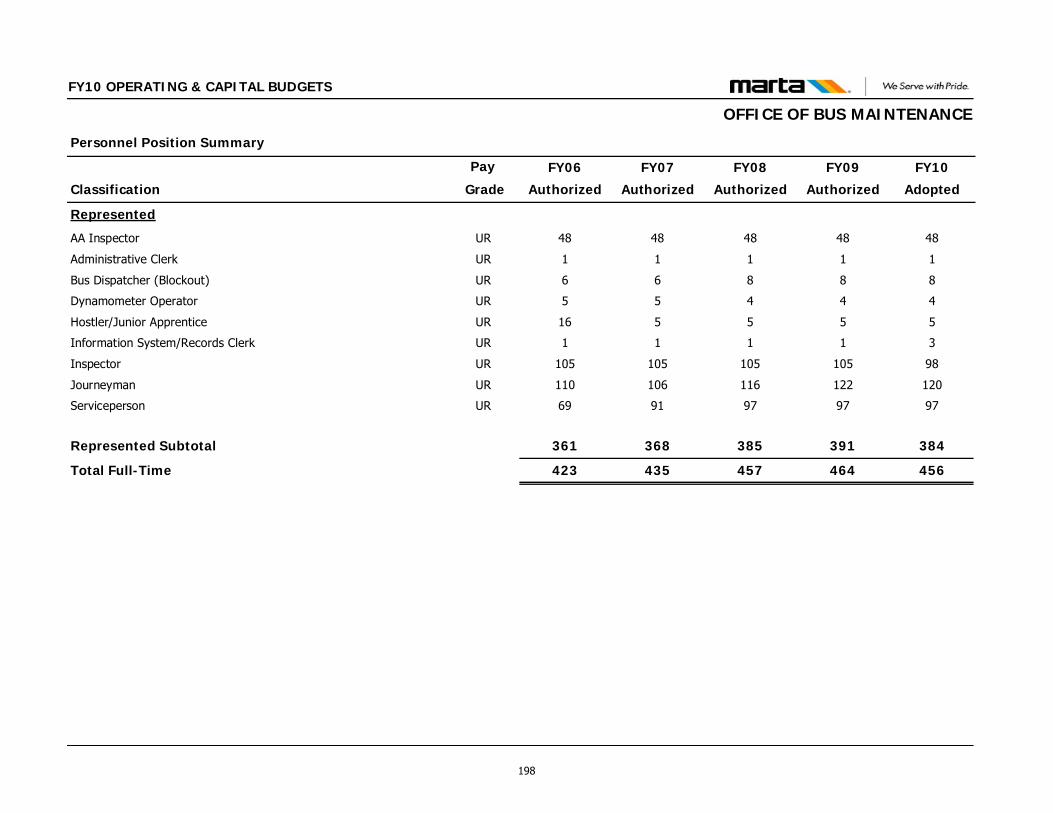
Classification
Personnel Position Summary
Pay FY09
Authorized
FY10
Adopted
FY10 OPERATING & CAPITAL BUDGETS
FY08
Authorized
FY07
Authorized
FY06
Authorized Grade
OFFICE OF BUS MAINTENANCE
Represented
AA Inspector UR 48 48484848
Administrative Clerk UR 1 1111
Bus Dispatcher (Blockout) UR 8 8866
Dynamometer Operator UR 4 4455
Hostler/Junior Apprentice UR 5 55516
Information System/Records Clerk UR 1 3111
Inspector UR 105 98105105105
Journeyman UR 122 120116106110
Serviceperson UR 97 97979169
Represented Subtotal 391 384385368361
Total Full-Time 464 456457435423
198
FY10 OPERATING & CAPITAL BUDGETS
OFFICE OF CLAYTON COUNTY TRANSIT FUNCTIONS & RESPONSIBILITIES The Office of Clayton County Transit is responsible for compliance with the contractual agreement for the daily transport of passengers on the fixed route bus system in Clayton County. The Office is responsible for providing all related services in connection with the operation of C- Tran. The functions and responsibilities include the day-to-day operations of C-TRAN fixed routes schedules. This effort includes employing and supervising all personnel including supervisors, vehicle operators, dispatchers and other personnel. Additional functions and responsibilities include providing paratransit certification and related paratransit services; collecting fare box revenue; providing preventive maintenance and repair of vehicles and the processing of related warranty vehicle claims; and the procurement of fuels, oils, parts and other tangible items for use in the operation and maintenance of vehicles.
Furthermore, The Office of Clayton County Transit provides property leasing and improvements, utilities fees, and related items thereon for C- Tran Operations; customer service; reporting of accidents and related occurrences; assistance in marketing; prepares and maintains safety and security plans as required by state and federal law or regulation; procures polices of insurance; and reporting of NTD (National Transit Database) data as required on behalf of Clayton County. By complying with the contractual agreement and performance of all related functions and responsibilities and by operating a safe, clean and efficient bus system, this Office ensures to provide as a service to Clayton County, customer safety, comfort, and satisfaction. FY09 ACCOMPLISHMENTS Completed 100% of performance within scope of contract.
199
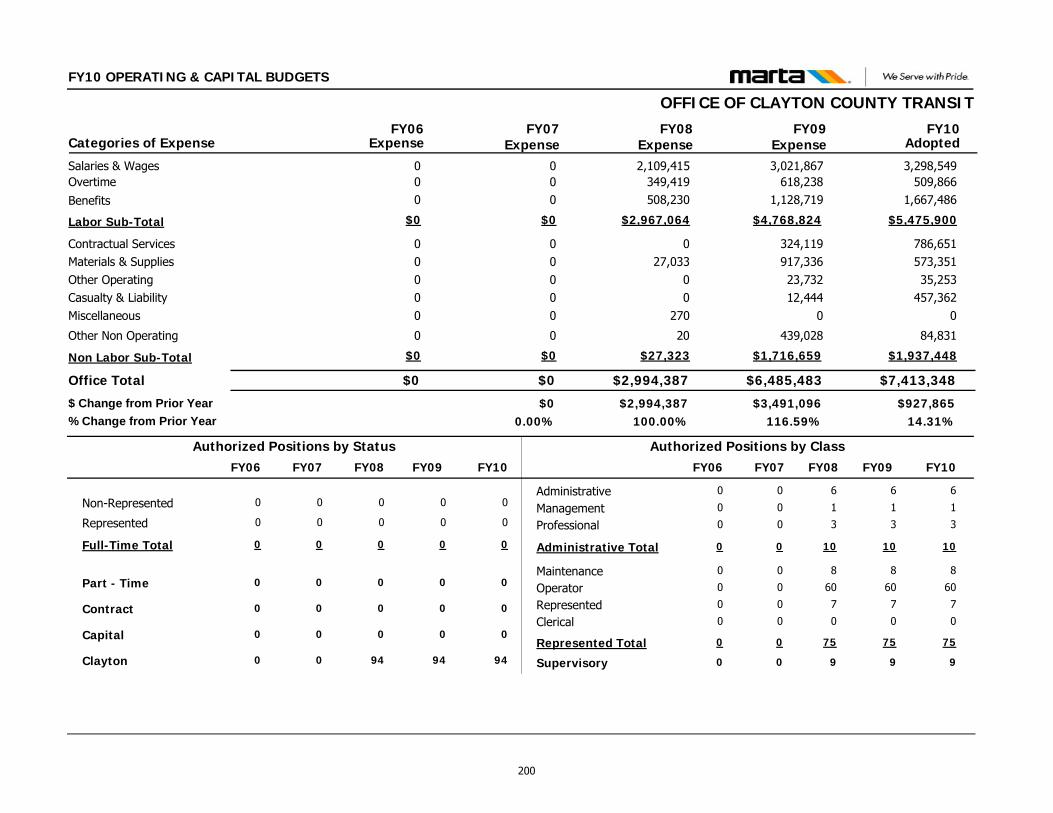
FY10 OPERATING & CAPITAL BUDGETS
OFFICE OF CLAYTON COUNTY TRANSIT
$7,413,348$6,485,483
786,651573,35135,253
457,3620
84,831
324,119917,33623,73212,444
0
439,028
Contractual ServicesMaterials & SuppliesOther OperatingCasualty & LiabilityMiscellaneous
Other Non Operating
Office Total
3,298,5493,021,867Salaries & Wages509,866618,238Overtime
$5,475,900$4,768,824Labor Sub-Total
FY09 FY10Categories of Expense
$0
00000
0
00
$0
FY06
$0
00000
0
00
$0
FY07Expense Expense Expense Adopted
$927,865$3,491,096$014.31%116.59%0.00%
$ Change from Prior Year% Change from Prior Year
$2,994,387
027,033
00
270
20
2,109,415349,419
$2,967,064
FY08Expense
$2,994,387100.00%
$1,937,448$1,716,659Non Labor Sub-Total $0 $0 $27,323
1,667,4861,128,719Benefits 0 0 508,230
Administrative
Clerical
Management
MaintenanceOperator
Professional
Represented
Supervisory
6
0
1
8
60
3
7
9
6
0
1
8
60
3
7
9
Non-Represented 0 0
Part - Time 0 0
Represented 0 0
Full-Time Total 0 0
Contract 0 0
Capital 0 0
Authorized Positions by Class
Administrative Total 10 10
Authorized Positions by Status
Represented Total 75 75
0
0
0
0
0
0
0
0
0
0
0
0
0
0
0
0
0
0
0
0
0
0
0
0
0
0
0
0
0
0
0
0
FY10FY09 FY07FY06 FY10FY09 FY07FY06
Clayton 94 9400
0
0
0
0
0
0
FY08
94
6
0
1
8
60
3
7
9
10
75
FY08
200
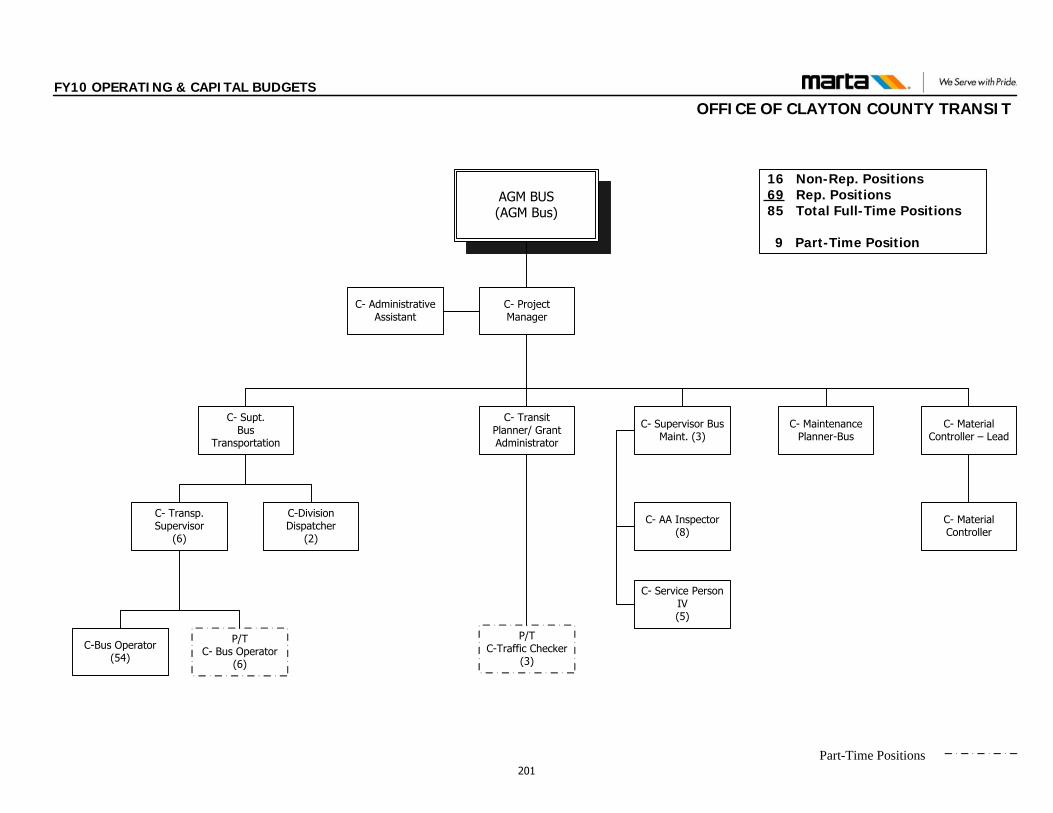
FY10 OPERATING & CAPITAL BUDGETS
OFFICE OF CLAYTON COUNTY TRANSIT
16 Non-Rep. Positions 69 Rep. Positions
85 Total Full-Time Positions
9 Part-Time Position
C- Transit Planner/ Grant Administrator
C- Supt. Bus
Transportation
C- Administrative Assistant
C- AA Inspector(8)
C- Service Person IV(5)
C- Transp. Supervisor
(6)
C-Bus Operator(54)
P/TC- Bus Operator
(6)
C- Material Controller
P/T C-Traffic Checker
(3)
C- Supervisor Bus Maint. (3)
C- Material Controller – Lead
C- Maintenance Planner-Bus
C-Division Dispatcher
(2)
AGM BUS (AGM Bus)
C- Project Manager
Part-Time Positions 201
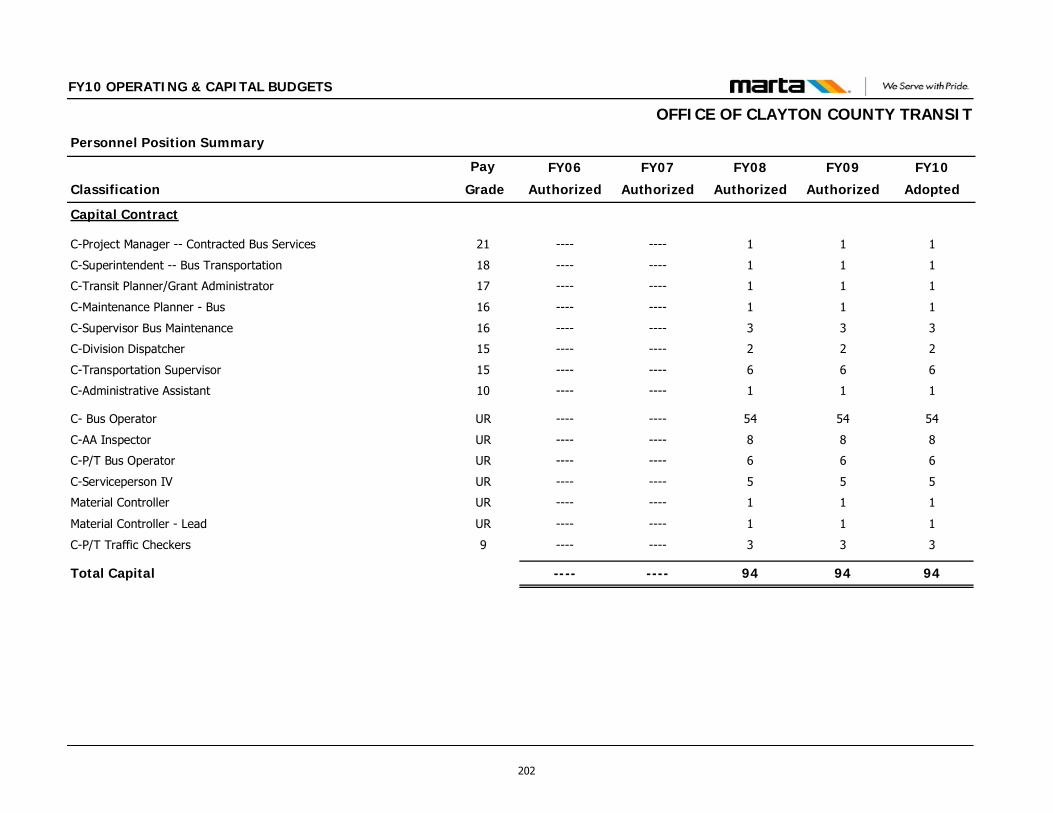
Classification
Personnel Position Summary
Pay FY09
Authorized
FY10
Adopted
FY10 OPERATING & CAPITAL BUDGETS
FY08
Authorized
FY07
Authorized
FY06
Authorized Grade
OFFICE OF CLAYTON COUNTY TRANSIT
Capital Contract
C-Project Manager -- Contracted Bus Services 21 1 11--------
C-Superintendent -- Bus Transportation 18 1 11--------
C-Transit Planner/Grant Administrator 17 1 11--------
C-Maintenance Planner - Bus 16 1 11--------
C-Supervisor Bus Maintenance 16 3 33--------
C-Division Dispatcher 15 2 22--------
C-Transportation Supervisor 15 6 66--------
C-Administrative Assistant 10 1 11--------
C- Bus Operator UR 54 5454--------
C-AA Inspector UR 8 88--------
C-P/T Bus Operator UR 6 66--------
C-Serviceperson IV UR 5 55--------
Material Controller UR 1 11--------
Material Controller - Lead UR 1 11--------
C-P/T Traffic Checkers 9 3 33--------
Total Capital 94 9494--------
202
DEPARTMENT OF RAIL OPERATIONS This Department includes the following Offices: Department of Rail Operations Office of AGM of Rail Operations Office of Rail Systems Engineering Office of Rail Services Office of Rail Car Maintenance Office of Maintenance of Way Office of Communications & Customer Information
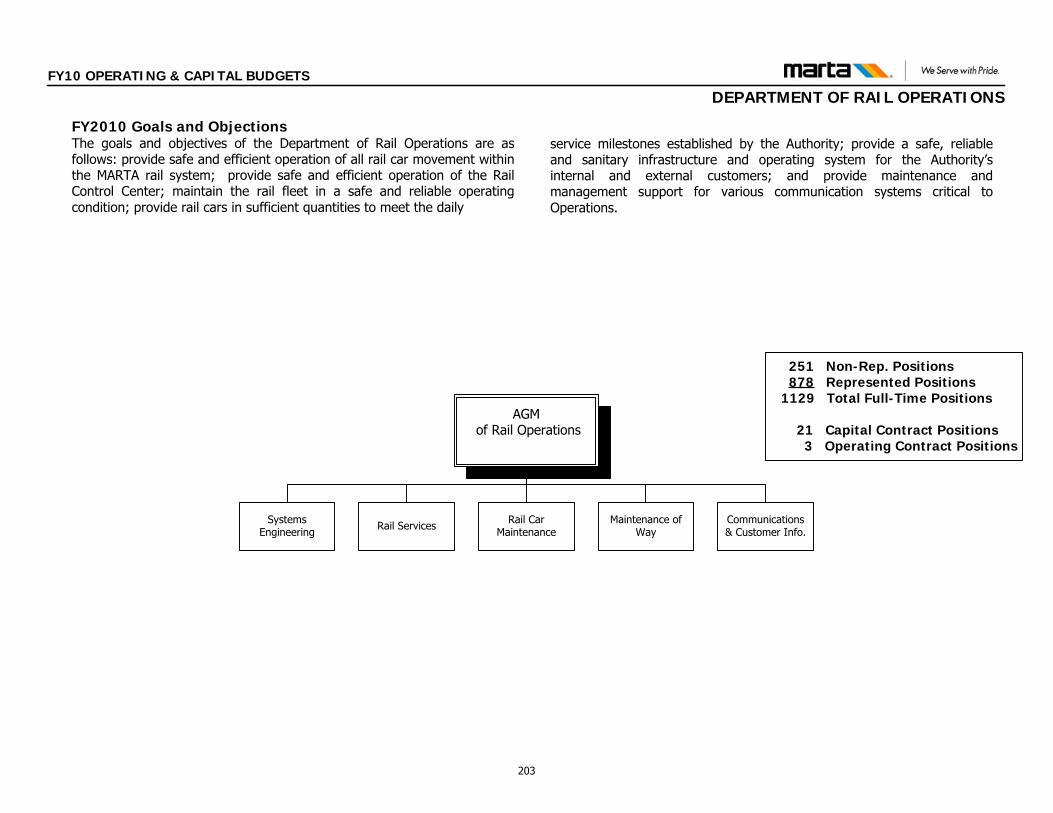
AGM of Rail Operations
Rail Services Rail Car Maintenance
Maintenance of Way
251 Non-Rep. Positions878 Represented Positions
1129 Total Full-Time Positions
21 Capital Contract Positions 3 Operating Contract Positions
Communications & Customer Info.
Systems Engineering
FY10 OPERATING & CAPITAL BUDGETS
DEPARTMENT OF RAIL OPERATIONS
FY2010 Goals and ObjectionsThe goals and objectives of the Department of Rail Operations are as follows: provide safe and efficient operation of all rail car movement within the MARTA rail system; provide safe and efficient operation of the Rail Control Center; maintain the rail fleet in a safe and reliable operating condition; provide rail cars in sufficient quantities to meet the daily
service milestones established by the Authority; provide a safe, reliable and sanitary infrastructure and operating system for the Authority’s internal and external customers; and provide maintenance and management support for various communication systems critical to Operations.
203

FY10 OPERATING & CAPITAL BUDGETS
DEPARTMENT OF RAIL OPERATIONS
$109,799,164$103,954,222
3,823,8358,658,280
14,422,4511,880,039
5,390
79,861
3,077,7679,505,555
14,505,8241,905,786
6,031
93,757
Contractual ServicesMaterials & SuppliesOther OperatingCasualty & LiabilityMiscellaneous
Other Non Operating
Department Total
49,972,90146,779,476Salaries & Wages5,889,9635,993,647Overtime
$80,929,308$74,859,502Labor Sub-Total
FY09 FY10Categories of Expense
$73,675,669
1,637,2915,670,323
10,905,5802,201,805
880
46,322
33,667,7096,718,547
$53,213,468
FY06
$93,722,367
1,842,9657,344,134
12,602,9652,256,678
2,922
62,695
42,746,9517,795,437
$69,610,008
FY07Expense Expense Expense Adopted
$5,844,942$4,633,380$20,046,6985.62%4.67%27.21%
$ Change from Prior Year% Change from Prior Year
$99,320,842
1,176,1357,175,545
13,781,4642,098,484
5,548
78,159
46,007,5076,929,147
$75,005,507
FY08Expense
$5,598,4755.97%
$28,869,856$29,094,720Non Labor Sub-Total $20,462,201 $24,112,359 $24,315,335
25,066,44422,086,379Benefits 12,827,212 19,067,620 22,068,853
Administrative
Clerical
Management
MaintenanceOperator
Professional
Represented
Supervisory
42
8
39
519
191
68
135
122
43
8
37
554
181
69
135
126
Non-Represented 247 251
Part - Time 0 0
Represented 853 878
Full-Time Total 1100 1129
Contract 3 3
Capital 21 21
Authorized Positions by Class
Administrative Total 149 149
Authorized Positions by Status
Represented Total 853 878
39
10
35
506
188
163
93
127
293
51
797
1090
0
20
237
797
18
8
33
500
185
174
90
120
276
69
783
1059
0
0
225
783
FY10FY09 FY07FY06 FY10FY09 FY07FY06
Clayton 0 000
333
51
844
1177
3
76
FY08
0
99
10
39
543
191
196
100
129
334
844
FY08
204
FY10 OPERATING & CAPITAL BUDGETS
OFFICE OF THE AGM OF RAIL OPERATIONS FUNCTIONS & RESPONSIBILITIES The Office of the Assistant General Manger of Rail Operations is responsible for the overall operation and maintenance of the Authority’s rail transit system. The responsibilities of the respective areas housed within Rail Operations include the following: The primary responsibilities of the general management function are to manage and direct all activities related to rail transit system development and the maintenance, repair, and rehabilitation of the Authority's operating, support, and administrative facilities on the and rail system.
The overall management and coordination of the rail fleets, ensuring safe, efficient, and cost-effective transportation for our riders. This includes the scheduling of vehicles, preparation for service, communication with all operators, control of rail vehicles, and supervision of daily transit operations.
Maintenance of all rail transit vehicles to ensure safe, reliable transportation. This includes daily service, scheduled repairs, on-demand
maintenance, and vehicle overhaul and rebuilds. It also includes rebuilds and/or replacement of major vehicle components.
Management of the Authority’s Rail Capital Programs. This includes development, programming, designing, and execution of all major capital investments. The Office of AGM of Rail Operations manages, coordinates, and directs activities to ensure that new rail, projects are successfully completed within scope, budget, and schedule.
Long and short range scheduling for rail services for providing and improving service delivery and reliability. The Office of the Assistant General Manager of Rail Operations also identifies and implements initiatives, which reduce operating costs, enhance service quality, and increase revenues and ridership. The Office is also responsible for ensuring that the overall operations and administrative activities for the department are aligned with the Authority’s strategic objectives.
205
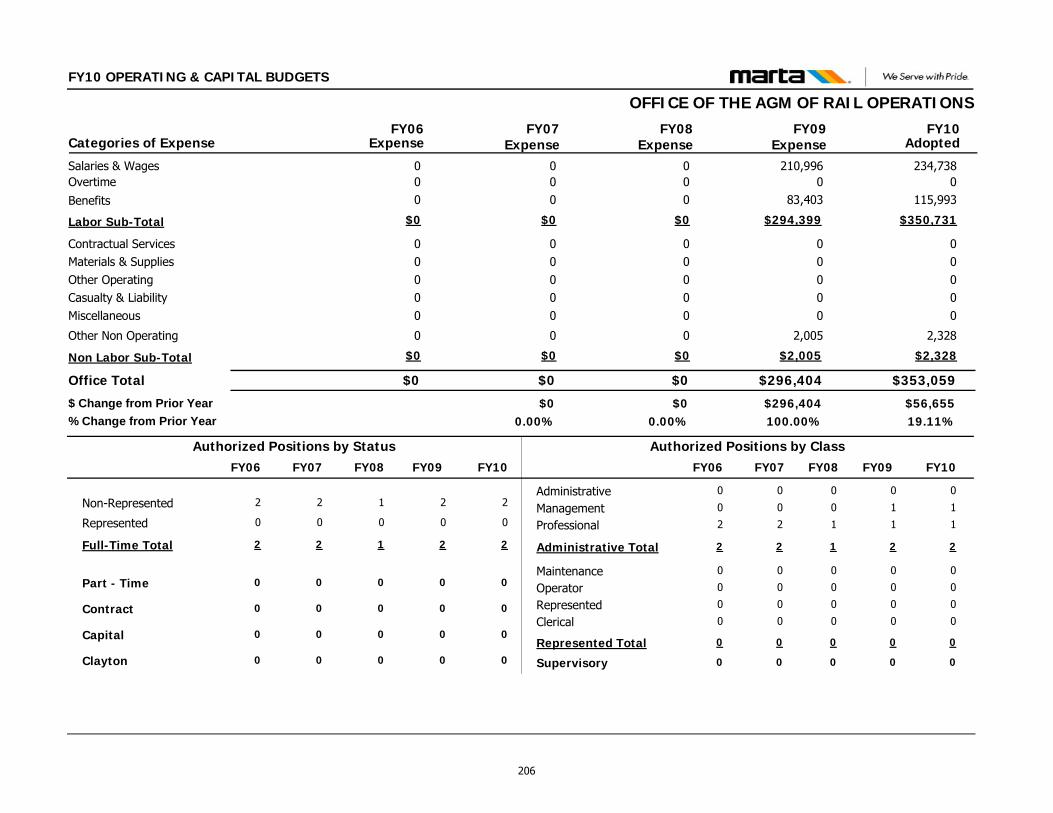
FY10 OPERATING & CAPITAL BUDGETS
OFFICE OF THE AGM OF RAIL OPERATIONS
$353,059$296,404
00000
2,328
00000
2,005
Contractual ServicesMaterials & SuppliesOther OperatingCasualty & LiabilityMiscellaneous
Other Non Operating
Office Total
234,738210,996Salaries & Wages00Overtime
$350,731$294,399Labor Sub-Total
FY09 FY10Categories of Expense
$0
00000
0
00
$0
FY06
$0
00000
0
00
$0
FY07Expense Expense Expense Adopted
$56,655$296,404$019.11%100.00%0.00%
$ Change from Prior Year% Change from Prior Year
$0
00000
0
00
$0
FY08Expense
$00.00%
$2,328$2,005Non Labor Sub-Total $0 $0 $0
115,99383,403Benefits 0 0 0
Administrative
Clerical
Management
MaintenanceOperator
Professional
Represented
Supervisory
0
0
1
0
0
1
0
0
0
0
1
0
0
1
0
0
Non-Represented 2 2
Part - Time 0 0
Represented 0 0
Full-Time Total 2 2
Contract 0 0
Capital 0 0
Authorized Positions by Class
Administrative Total 2 2
Authorized Positions by Status
Represented Total 0 0
0
0
0
0
0
2
0
0
2
0
0
2
0
0
2
0
0
0
0
0
0
2
0
0
2
0
0
2
0
0
2
0
FY10FY09 FY07FY06 FY10FY09 FY07FY06
Clayton 0 000
1
0
0
1
0
0
FY08
0
0
0
0
0
0
1
0
0
1
0
FY08
206
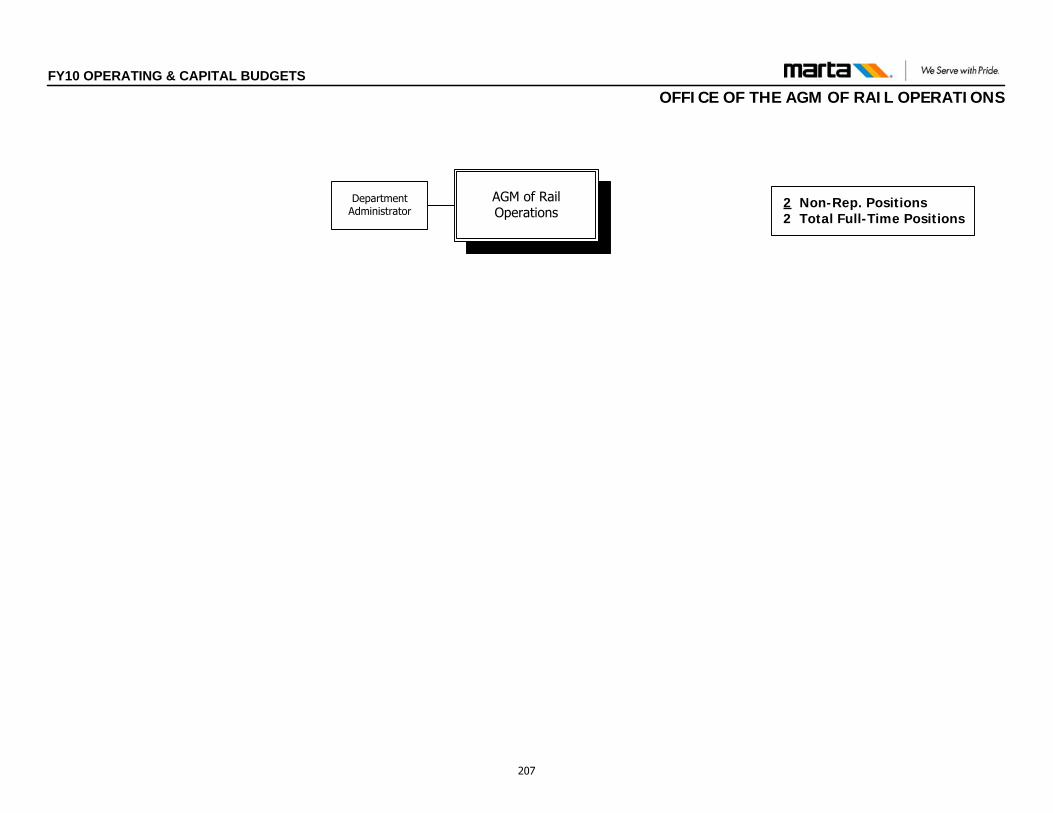
FY10 OPERATING & CAPITAL BUDGETSOFFICE OF THE AGM OF RAIL OPERATIONS
AGM of Rail Operations
2 Non-Rep. Positions2 Total Full-Time Positions
Department Administrator
207
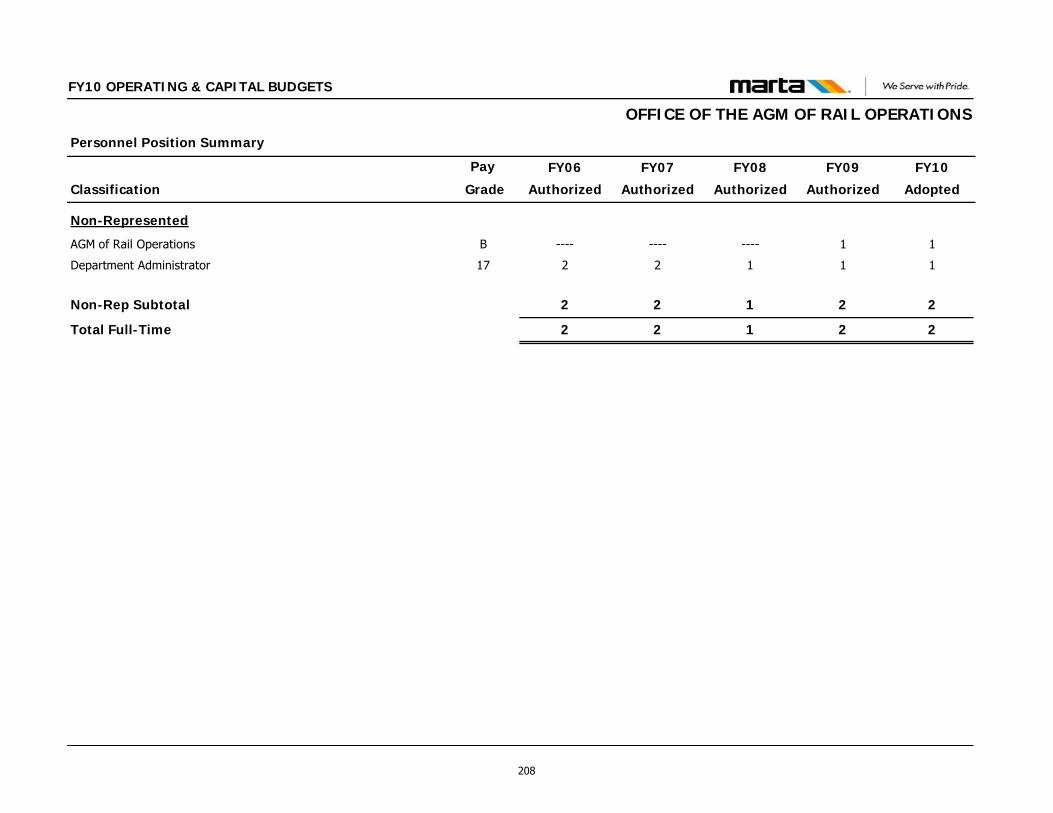
Classification
Personnel Position Summary
Pay FY09
Authorized
FY10
Adopted
FY10 OPERATING & CAPITAL BUDGETS
FY08
Authorized
FY07
Authorized
FY06
Authorized Grade
OFFICE OF THE AGM OF RAIL OPERATIONS
Non-Represented
AGM of Rail Operations B 1 1------------
Department Administrator 17 1 1122
Non-Rep Subtotal 2 2122
Total Full-Time 2 2122
208
FY10 OPERATING & CAPITAL BUDGETS
OFFICE OF RAIL SYSTEMS ENGINEERING FUNCTIONS & RESPONSIBILITIES
This Office of Rail Systems Engineering is responsible for managing and directing the design activities, implementation processes and sustainability plans of critical rail related assets and systems (such as rail vehicles, train control, traction power, track and communications) which are critical to the safe and reliable operation of MARTA’s rail system.
The office of Rail Systems Engineering directs the activities of the General Engineering Consultant- Metropolitan Atlanta Transit Consultants (MATC), who supports the Track & Systems portion of MARTA’s Ten-Year Capital Program, as well as the activities of the Rail Vehicle Consultant (RVC). The RVC supports Rail Operations on operating and capital programs and projects associated with rail vehicle systems, sub-systems, components and supporting wayside equipment and rail yard infrastructure.
209
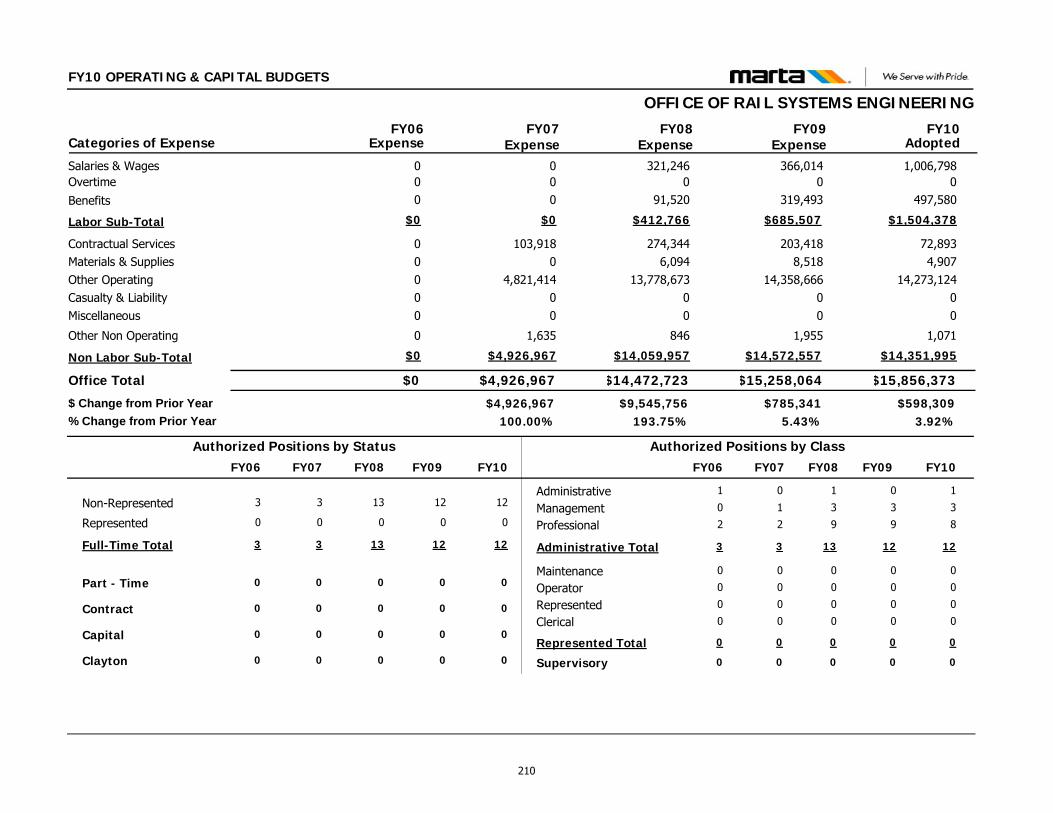
FY10 OPERATING & CAPITAL BUDGETS
OFFICE OF RAIL SYSTEMS ENGINEERING
$15,856,373$15,258,064
72,8934,907
14,273,12400
1,071
203,4188,518
14,358,66600
1,955
Contractual ServicesMaterials & SuppliesOther OperatingCasualty & LiabilityMiscellaneous
Other Non Operating
Office Total
1,006,798366,014Salaries & Wages00Overtime
$1,504,378$685,507Labor Sub-Total
FY09 FY10Categories of Expense
$0
00000
0
00
$0
FY06
$4,926,967
103,9180
4,821,41400
1,635
00
$0
FY07Expense Expense Expense Adopted
$598,309$785,341$4,926,9673.92%5.43%100.00%
$ Change from Prior Year% Change from Prior Year
$14,472,723
274,3446,094
13,778,67300
846
321,2460
$412,766
FY08Expense
$9,545,756193.75%
$14,351,995$14,572,557Non Labor Sub-Total $0 $4,926,967 $14,059,957
497,580319,493Benefits 0 0 91,520
Administrative
Clerical
Management
MaintenanceOperator
Professional
Represented
Supervisory
0
0
3
0
0
9
0
0
1
0
3
0
0
8
0
0
Non-Represented 12 12
Part - Time 0 0
Represented 0 0
Full-Time Total 12 12
Contract 0 0
Capital 0 0
Authorized Positions by Class
Administrative Total 12 12
Authorized Positions by Status
Represented Total 0 0
0
0
1
0
0
2
0
0
3
0
0
3
0
0
3
0
1
0
0
0
0
2
0
0
3
0
0
3
0
0
3
0
FY10FY09 FY07FY06 FY10FY09 FY07FY06
Clayton 0 000
13
0
0
13
0
0
FY08
0
1
0
3
0
0
9
0
0
13
0
FY08
210
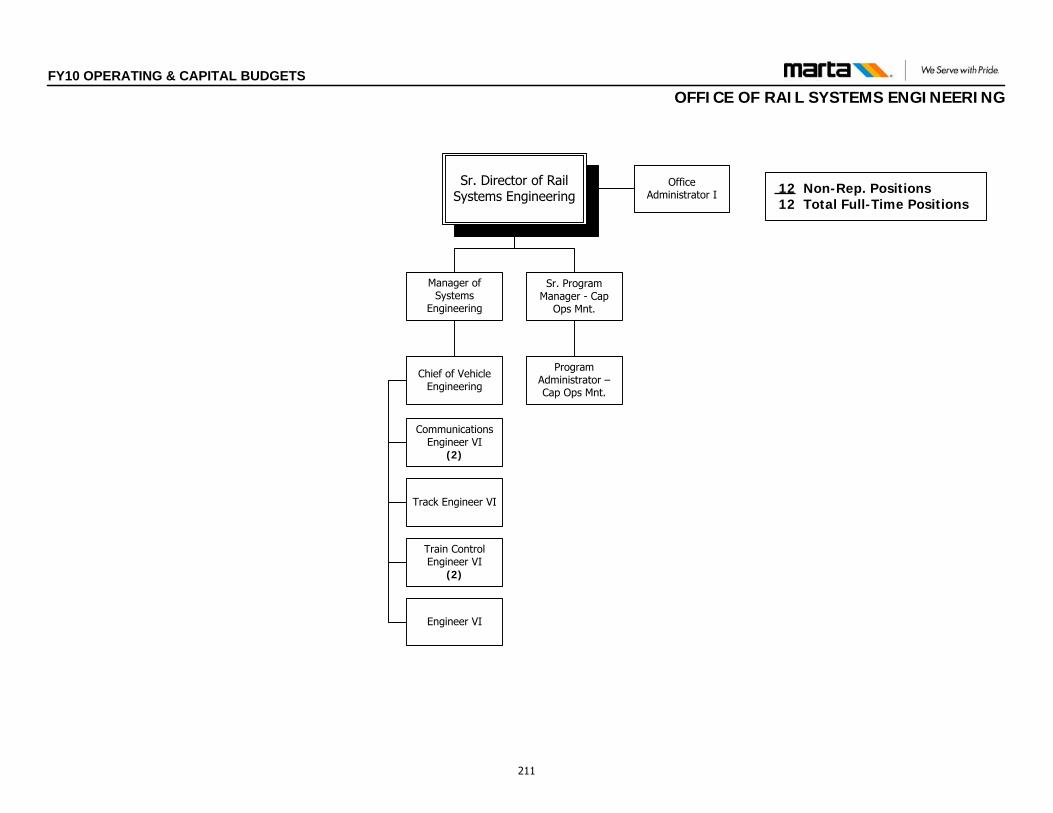
Sr. Director of Rail Systems Engineering
Sr. Program Manager - Cap
Ops Mnt.
12 Non-Rep. Positions 12 Total Full-Time Positions
Program Administrator –Cap Ops Mnt.
Office Administrator I
Chief of Vehicle Engineering
Communications Engineer VI
(2)
Track Engineer VI
Train Control Engineer VI
(2)
Manager of Systems
Engineering
Engineer VI
FY10 OPERATING & CAPITAL BUDGETSOFFICE OF RAIL SYSTEMS ENGINEERING
211
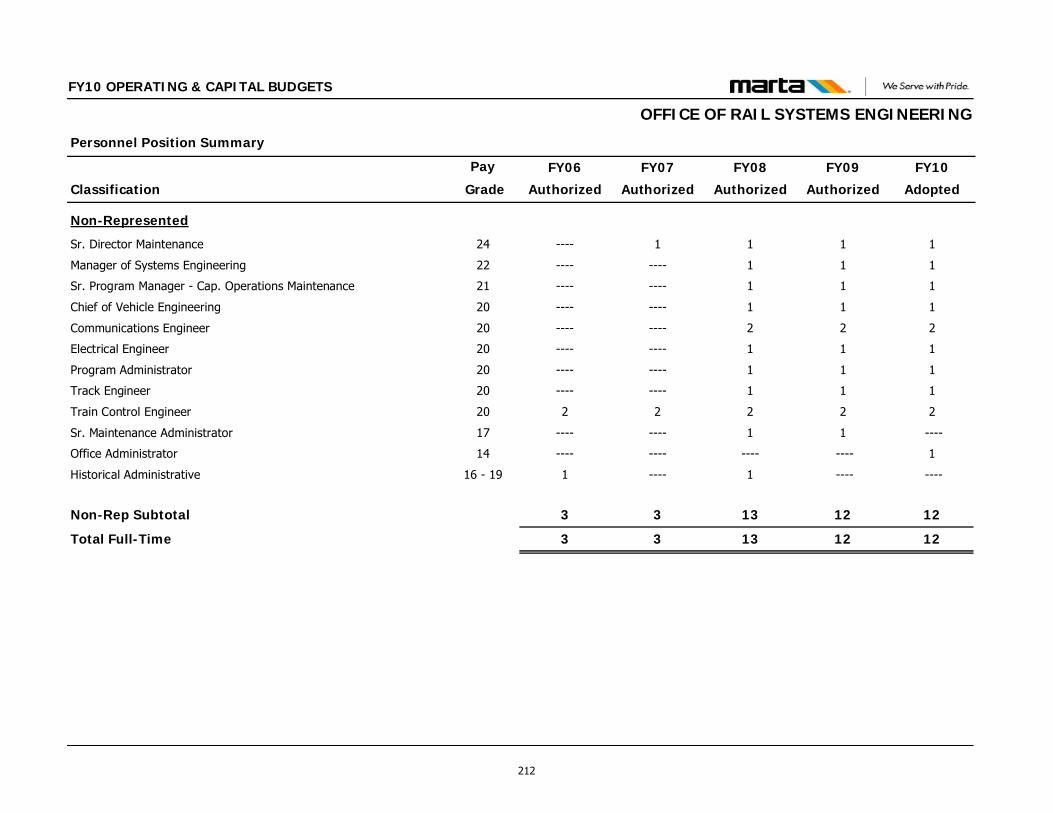
Classification
Personnel Position Summary
Pay FY09
Authorized
FY10
Adopted
FY10 OPERATING & CAPITAL BUDGETS
FY08
Authorized
FY07
Authorized
FY06
Authorized Grade
OFFICE OF RAIL SYSTEMS ENGINEERING
Non-Represented
Sr. Director Maintenance 24 1 111----
Manager of Systems Engineering 22 1 11--------
Sr. Program Manager - Cap. Operations Maintenance 21 1 11--------
Chief of Vehicle Engineering 20 1 11--------
Communications Engineer 20 2 22--------
Electrical Engineer 20 1 11--------
Program Administrator 20 1 11--------
Track Engineer 20 1 11--------
Train Control Engineer 20 2 2222
Sr. Maintenance Administrator 17 1 ----1--------
Office Administrator 14 ---- 1------------
Historical Administrative 16 - 19 ---- ----1----1
Non-Rep Subtotal 12 121333
Total Full-Time 12 121333
212
FY10 OPERATING & CAPITAL BUDGETS OFFICE OF RAIL SERVICES
FUNCTIONS & RESPONSIBILITIES The Office of Rail Services is responsible for the Rail Services Control Center, Mainline Rail Operations, Yard Operations (Avondale, South Yard, and Armour Yard), Dispatch, and Station Services. Rail Services is responsible for the safe and efficient operation of all rail car movement within the MARTA rail system. Rail Services supports 104 miles of mainline track, 3 rail yards, dispatch, 38 stations, and 135 station agents. Rail is also responsible for the Rail Services Control Center in Decatur which is the command center for all of rail operations. Included in Rail Services is the Yard Operations staff which wash, store, and inspect rail vehicles and coordinate with Office of
Rail Maintenance to ensure the required number of cars is available for revenue service. The Yard Operations staff also controls all yard movement, including movement in and out of shops, and provides vehicle-testing support for operations and capital projects. Other responsibilities in Rail Services include: Dispatching scheduled work assignments to represented and non-
represented personnel to ensure that all work is filled in accordance with the labor agreements
Providing reports of vehicle performance to assist with failure diagnosis and repairs
Monitoring and troubleshooting problems within rail cars Monitoring, directing, and evaluating the performance of all rail
transportation personnel
213
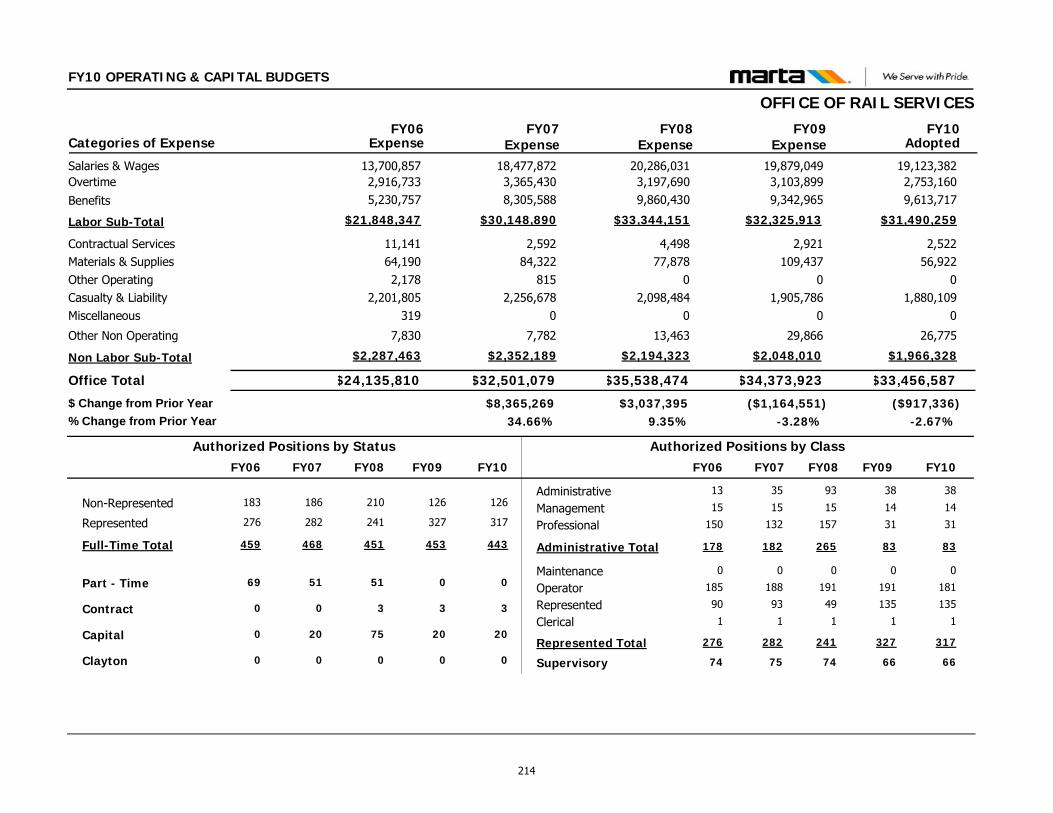
FY10 OPERATING & CAPITAL BUDGETS
OFFICE OF RAIL SERVICES
$33,456,587$34,373,923
2,52256,922
01,880,109
0
26,775
2,921109,437
01,905,786
0
29,866
Contractual ServicesMaterials & SuppliesOther OperatingCasualty & LiabilityMiscellaneous
Other Non Operating
Office Total
19,123,38219,879,049Salaries & Wages2,753,1603,103,899Overtime
$31,490,259$32,325,913Labor Sub-Total
FY09 FY10Categories of Expense
$24,135,810
11,14164,1902,178
2,201,805319
7,830
13,700,8572,916,733
$21,848,347
FY06
$32,501,079
2,59284,322
8152,256,678
0
7,782
18,477,8723,365,430
$30,148,890
FY07Expense Expense Expense Adopted
($917,336)($1,164,551)$8,365,269-2.67%-3.28%34.66%
$ Change from Prior Year% Change from Prior Year
$35,538,474
4,49877,878
02,098,484
0
13,463
20,286,0313,197,690
$33,344,151
FY08Expense
$3,037,3959.35%
$1,966,328$2,048,010Non Labor Sub-Total $2,287,463 $2,352,189 $2,194,323
9,613,7179,342,965Benefits 5,230,757 8,305,588 9,860,430
Administrative
Clerical
Management
MaintenanceOperator
Professional
Represented
Supervisory
38
1
14
0
191
31
135
66
38
1
14
0
181
31
135
66
Non-Represented 126 126
Part - Time 0 0
Represented 327 317
Full-Time Total 453 443
Contract 3 3
Capital 20 20
Authorized Positions by Class
Administrative Total 83 83
Authorized Positions by Status
Represented Total 327 317
35
1
15
0
188
132
93
75
186
51
282
468
0
20
182
282
13
1
15
0
185
150
90
74
183
69
276
459
0
0
178
276
FY10FY09 FY07FY06 FY10FY09 FY07FY06
Clayton 0 000
210
51
241
451
3
75
FY08
0
93
1
15
0
191
157
49
74
265
241
FY08
214
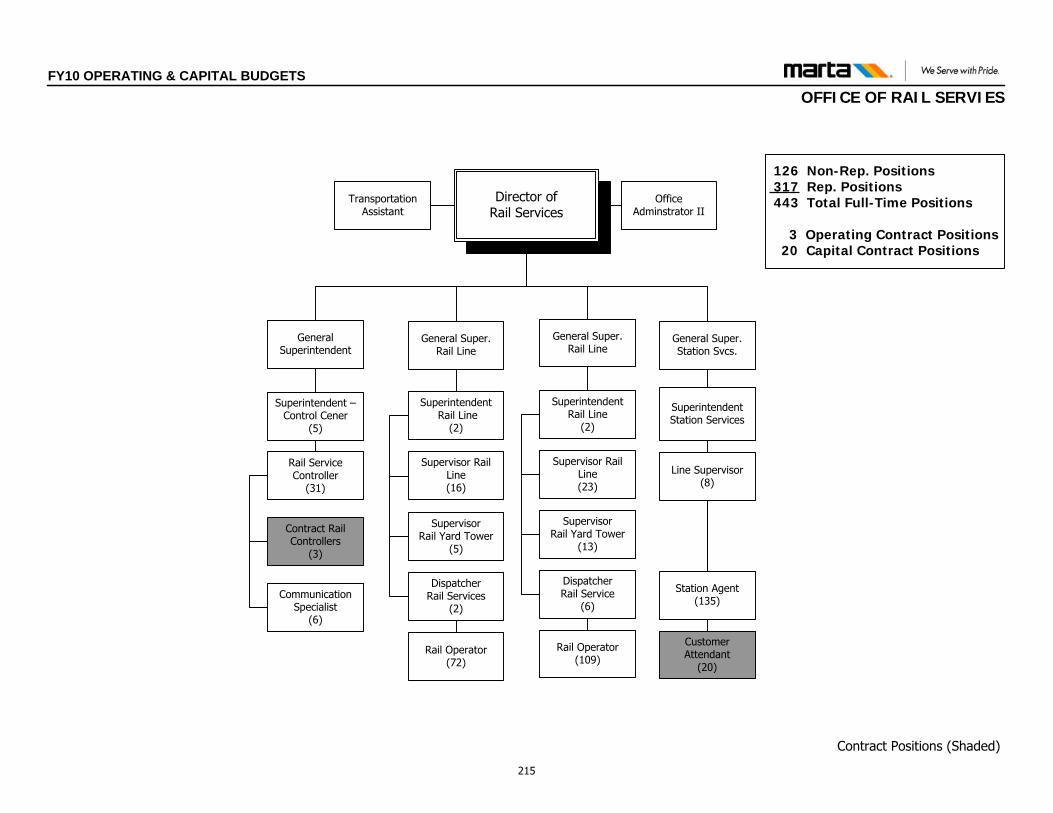
Director of Rail Services
Office Adminstrator II
General Super.Rail Line
General Super.Rail Line
DispatcherRail Services
(2)
Supervisor Rail Line(16)
Rail Operator(72)
Transportation Assistant
Supervisor Rail Line(23)
126 Non-Rep. Positions 317 Rep. Positions 443 Total Full-Time Positions
3 Operating Contract Positions 20 Capital Contract Positions
Superintendent Rail Line
(2)
SupervisorRail Yard Tower
(5)
SupervisorRail Yard Tower
(13)
Superintendent Rail Line
(2)
Contract Positions (Shaded)
Rail Operator(109)
DispatcherRail Service
(6)
General Super.Station Svcs.
Line Supervisor (8)
Station Agent (135)
SuperintendentStation Services
Customer Attendant
(20)
General Superintendent
Superintendent –Control Cener
(5)
Rail Service Controller
(31)
Communication Specialist
(6)
Contract Rail Controllers
(3)
FY10 OPERATING & CAPITAL BUDGETSOFFICE OF RAIL SERVIES
215
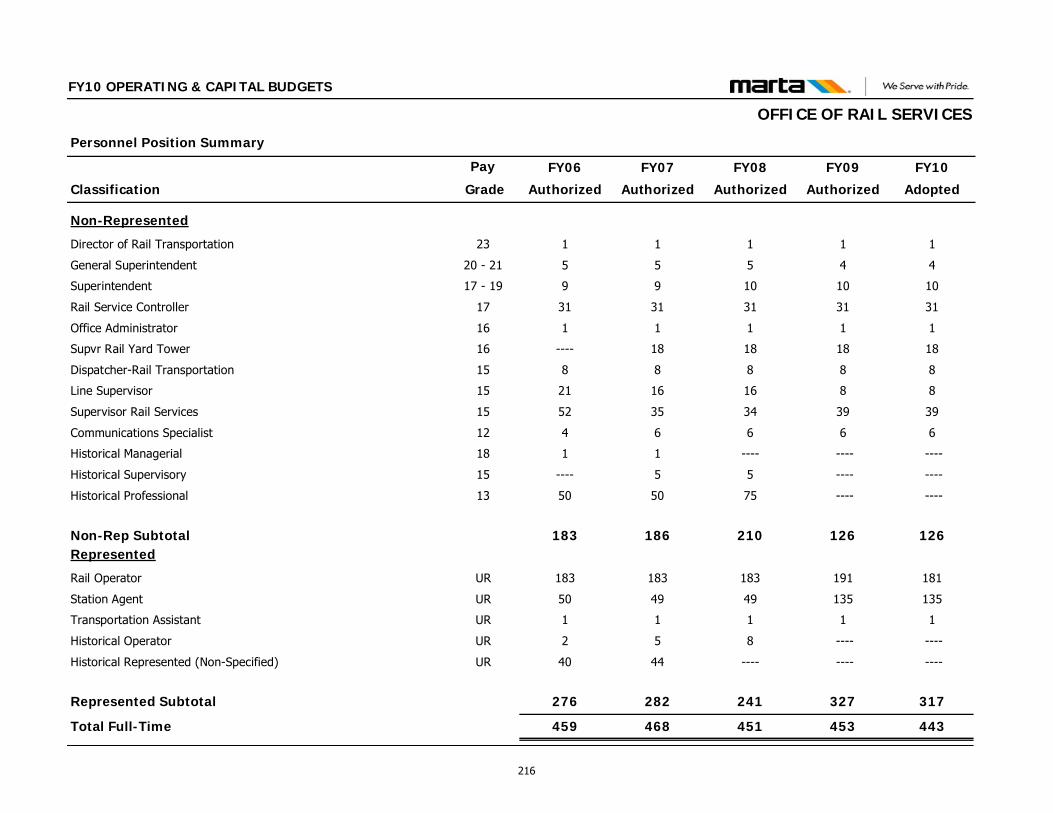
Classification
Personnel Position Summary
Pay FY09
Authorized
FY10
Adopted
FY10 OPERATING & CAPITAL BUDGETS
FY08
Authorized
FY07
Authorized
FY06
Authorized Grade
OFFICE OF RAIL SERVICES
Non-Represented
Director of Rail Transportation 23 1 1111
General Superintendent 20 - 21 4 4555
Superintendent 17 - 19 10 101099
Rail Service Controller 17 31 31313131
Office Administrator 16 1 1111
Supvr Rail Yard Tower 16 18 181818----
Dispatcher-Rail Transportation 15 8 8888
Line Supervisor 15 8 8161621
Supervisor Rail Services 15 39 39343552
Communications Specialist 12 6 6664
Historical Managerial 18 ---- --------11
Historical Supervisory 15 ---- ----55----
Historical Professional 13 ---- ----755050
Non-Rep Subtotal 126 126210186183Represented
Rail Operator UR 191 181183183183
Station Agent UR 135 135494950
Transportation Assistant UR 1 1111
Historical Operator UR ---- ----852
Historical Represented (Non-Specified) UR ---- --------4440
Represented Subtotal 327 317241282276
Total Full-Time 453 443451468459
216
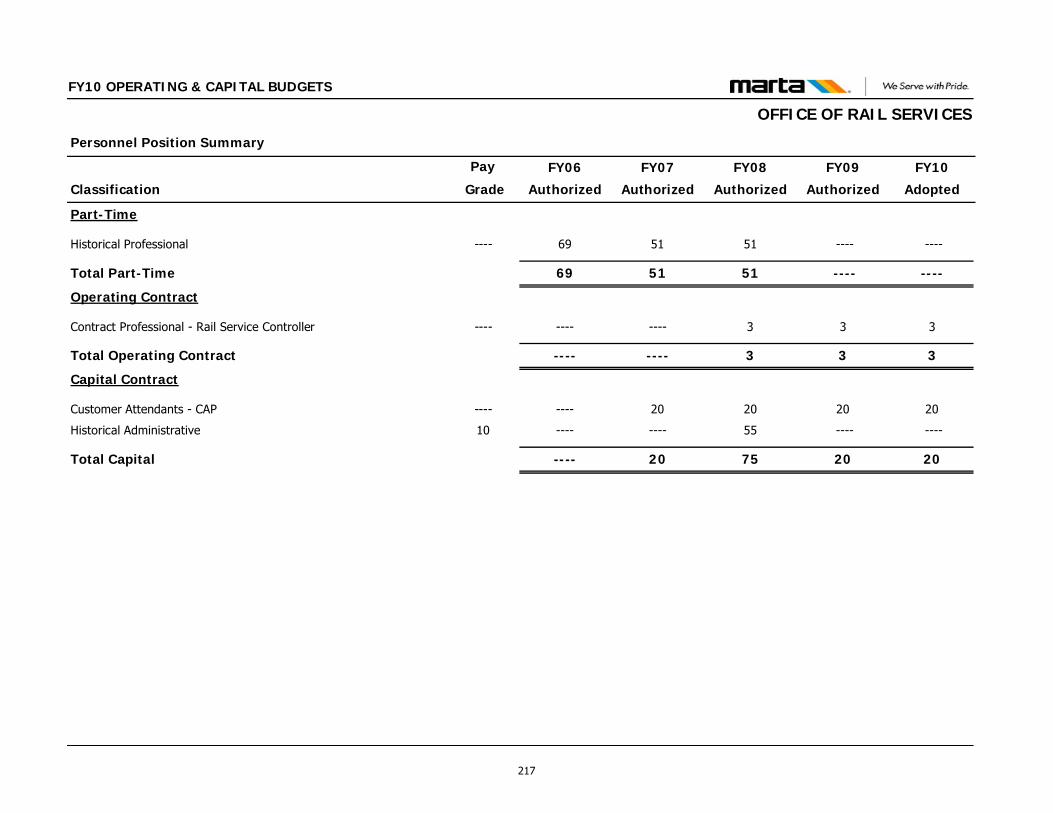
Classification
Personnel Position Summary
Pay FY09
Authorized
FY10
Adopted
FY10 OPERATING & CAPITAL BUDGETS
FY08
Authorized
FY07
Authorized
FY06
Authorized Grade
OFFICE OF RAIL SERVICES
Part-Time
Historical Professional ---- ---- ----515169
Total Part-Time ---- ----515169
Operating Contract
Contract Professional - Rail Service Controller ---- 3 33--------
Total Operating Contract 3 33--------
Capital Contract
Customer Attendants - CAP ---- 20 202020----
Historical Administrative 10 ---- ----55--------
Total Capital 20 207520----
217
FY10 OPERATING & CAPITAL BUDGETS OFFICE OF RAIL CAR MAINTENANCE
FUNCTIONS & RESPONSIBILITIES The Office of Rail Car Maintenance consists of 356 employees in five primary functional areas: Administration, Light Maintenance, Heavy Maintenance, Reliability Engineering and Rail Car Appearance. Light Maintenance is comprised of running repair and scheduled preventive maintenance inspections. Heavy Maintenance is comprised of component repair/overhaul (Backshops), comprehensive scheduled inspections and The Life Cycle Asses Reliability Enhancement (LCARE) program. Reliability Engineering provides mechanical and electrical engineering support and analysis activities to improve vehicle reliability and maintenance processes. Rail Car Appearance provides minor and major interior and exterior cleaning of the Authority’s rail car fleet. Rail Car Maintenance activities are performed at Armour Yard, Avondale and South Yard maintenance shops.
The major function of Rail Car Maintenance is to ensure rail car equipment is safe to operate, reliable in manner that satisfies the Authority’s milestones for service delivery and maintenance costs and clean to a level where appearance is visually pleasing. Maintenance programs are directly focused and intended to provide our customers with clean, efficient, reliable vehicles with fully functional operating systems and equipment. Rail Car Maintenance is responsible for all maintenance and repair of the rail transit fleet through periodic and proactive maintenance plans designed and implemented to improve the operational reliability for the best possible customer experience.
218
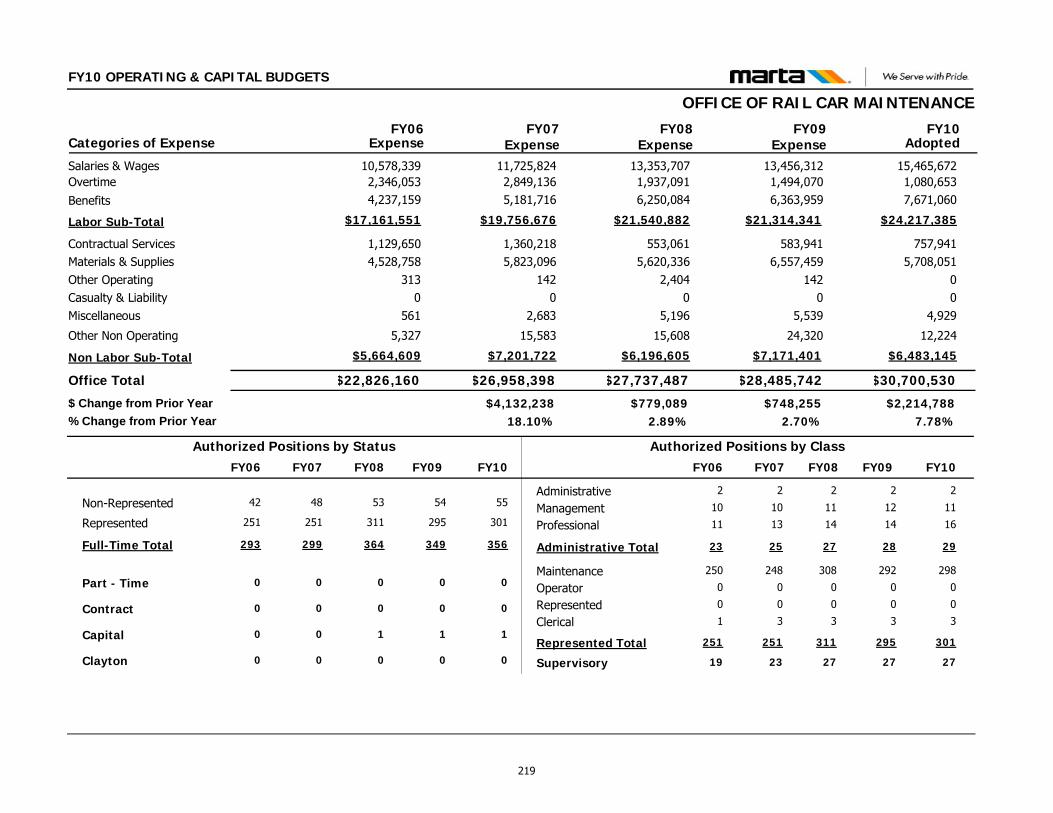
FY10 OPERATING & CAPITAL BUDGETS
OFFICE OF RAIL CAR MAINTENANCE
$30,700,530$28,485,742
757,9415,708,051
00
4,929
12,224
583,9416,557,459
1420
5,539
24,320
Contractual ServicesMaterials & SuppliesOther OperatingCasualty & LiabilityMiscellaneous
Other Non Operating
Office Total
15,465,67213,456,312Salaries & Wages1,080,6531,494,070Overtime
$24,217,385$21,314,341Labor Sub-Total
FY09 FY10Categories of Expense
$22,826,160
1,129,6504,528,758
3130
561
5,327
10,578,3392,346,053
$17,161,551
FY06
$26,958,398
1,360,2185,823,096
1420
2,683
15,583
11,725,8242,849,136
$19,756,676
FY07Expense Expense Expense Adopted
$2,214,788$748,255$4,132,2387.78%2.70%18.10%
$ Change from Prior Year% Change from Prior Year
$27,737,487
553,0615,620,336
2,4040
5,196
15,608
13,353,7071,937,091
$21,540,882
FY08Expense
$779,0892.89%
$6,483,145$7,171,401Non Labor Sub-Total $5,664,609 $7,201,722 $6,196,605
7,671,0606,363,959Benefits 4,237,159 5,181,716 6,250,084
Administrative
Clerical
Management
MaintenanceOperator
Professional
Represented
Supervisory
2
3
12
292
0
14
0
27
2
3
11
298
0
16
0
27
Non-Represented 54 55
Part - Time 0 0
Represented 295 301
Full-Time Total 349 356
Contract 0 0
Capital 1 1
Authorized Positions by Class
Administrative Total 28 29
Authorized Positions by Status
Represented Total 295 301
2
3
10
248
0
13
0
23
48
0
251
299
0
0
25
251
2
1
10
250
0
11
0
19
42
0
251
293
0
0
23
251
FY10FY09 FY07FY06 FY10FY09 FY07FY06
Clayton 0 000
53
0
311
364
0
1
FY08
0
2
3
11
308
0
14
0
27
27
311
FY08
219
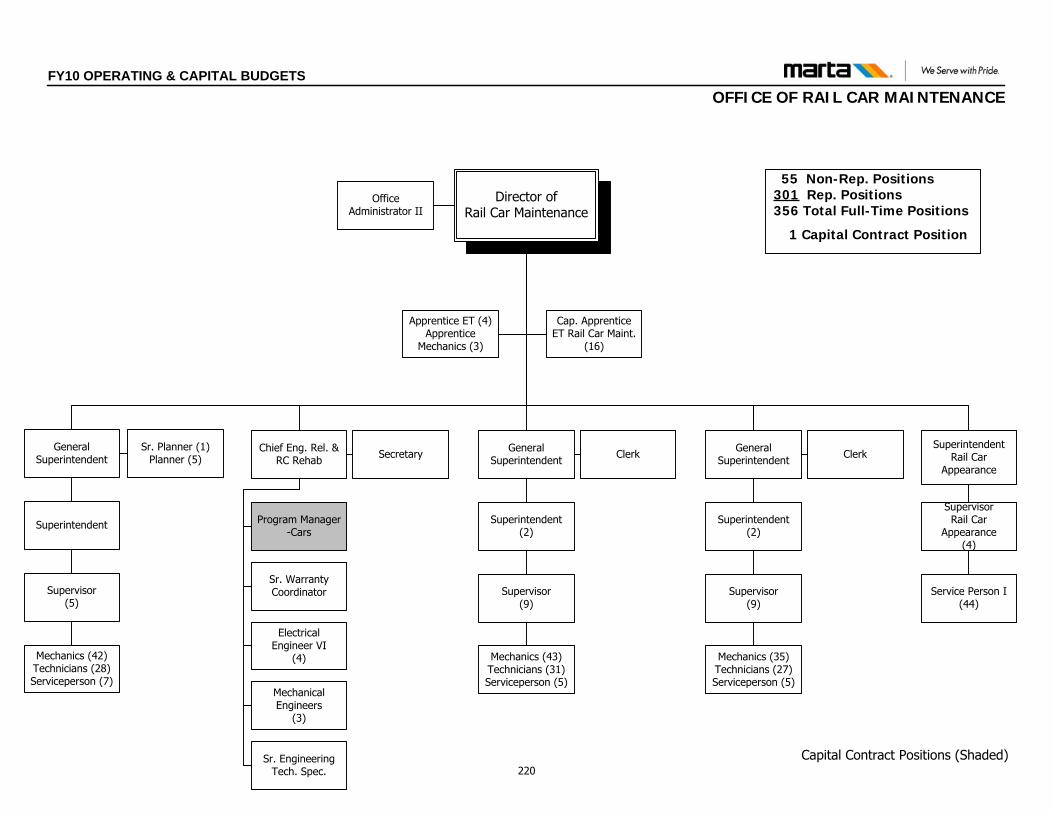
Director of Rail Car Maintenance
Apprentice ET (4)Apprentice
Mechanics (3)
General Superintendent
Office Administrator II
Sr. Planner (1)Planner (5)
Superintendent
Supervisor(5)
Mechanics (42) Technicians (28)Serviceperson (7)
Superintendent (2)
Supervisor(9)
Mechanics (43) Technicians (31)Serviceperson (5)
General Superintendent
Sr. Warranty Coordinator
Superintendent (2)
55 Non-Rep. Positions301 Rep. Positions
356 Total Full-Time Positions
1 Capital Contract Position
Supervisor(9)
Mechanics (35) Technicians (27)Serviceperson (5)
Cap. Apprentice ET Rail Car Maint.
(16)
Chief Eng. Rel. & RC Rehab
Program Manager -Cars
Capital Contract Positions (Shaded)
General Superintendent
Electrical Engineer VI
(4)
Supervisor Rail Car
Appearance(4)
SuperintendentRail Car
Appearance
Service Person I (44)
Mechanical Engineers
(3)
Sr. Engineering Tech. Spec.
Secretary Clerk Clerk
FY10 OPERATING & CAPITAL BUDGETSOFFICE OF RAIL CAR MAINTENANCE
220
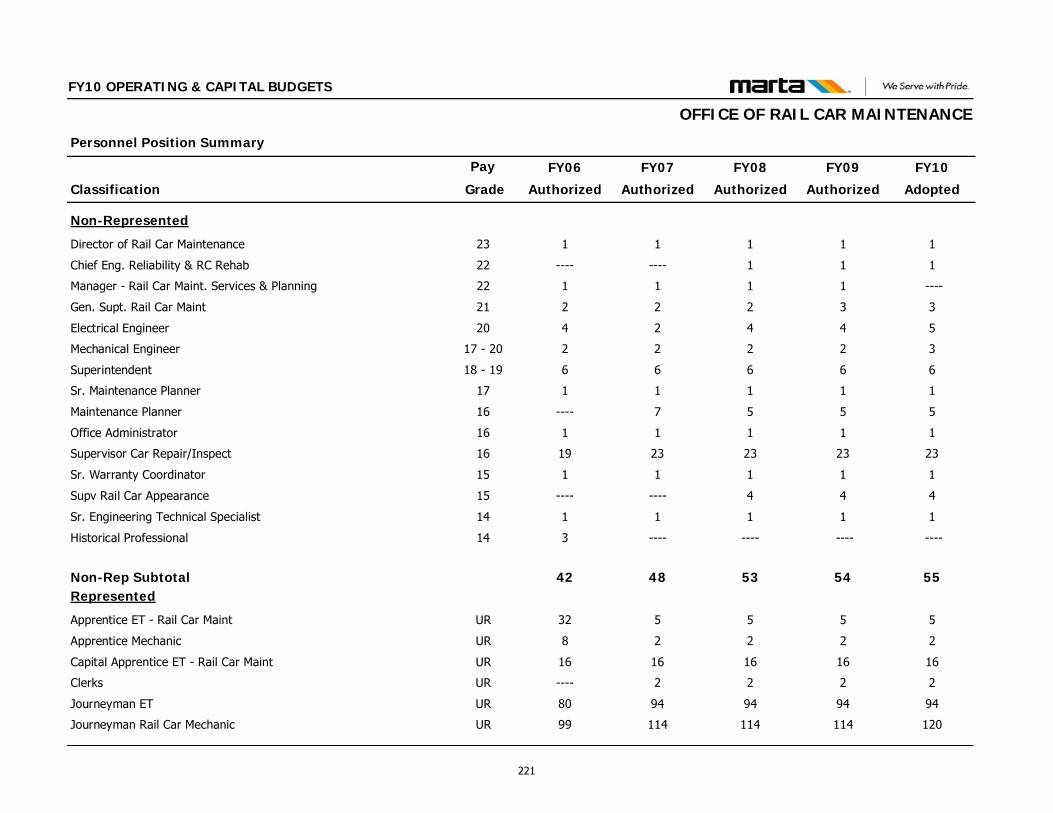
Classification
Personnel Position Summary
Pay FY09
Authorized
FY10
Adopted
FY10 OPERATING & CAPITAL BUDGETS
FY08
Authorized
FY07
Authorized
FY06
Authorized Grade
OFFICE OF RAIL CAR MAINTENANCE
Non-Represented
Director of Rail Car Maintenance 23 1 1111
Chief Eng. Reliability & RC Rehab 22 1 11--------
Manager - Rail Car Maint. Services & Planning 22 1 ----111
Gen. Supt. Rail Car Maint 21 3 3222
Electrical Engineer 20 4 5424
Mechanical Engineer 17 - 20 2 3222
Superintendent 18 - 19 6 6666
Sr. Maintenance Planner 17 1 1111
Maintenance Planner 16 5 557----
Office Administrator 16 1 1111
Supervisor Car Repair/Inspect 16 23 23232319
Sr. Warranty Coordinator 15 1 1111
Supv Rail Car Appearance 15 4 44--------
Sr. Engineering Technical Specialist 14 1 1111
Historical Professional 14 ---- ------------3
Non-Rep Subtotal 54 55534842Represented
Apprentice ET - Rail Car Maint UR 5 55532
Apprentice Mechanic UR 2 2228
Capital Apprentice ET - Rail Car Maint UR 16 16161616
Clerks UR 2 222----
Journeyman ET UR 94 94949480
Journeyman Rail Car Mechanic UR 114 12011411499
221
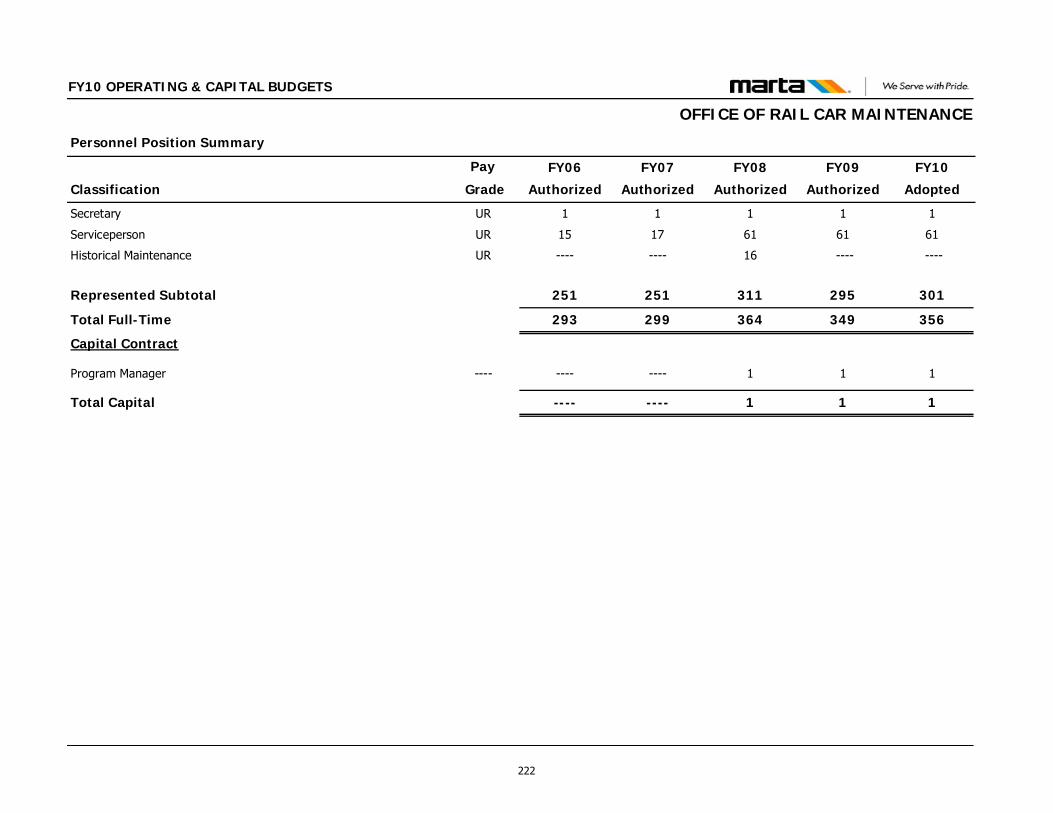
Classification
Personnel Position Summary
Pay FY09
Authorized
FY10
Adopted
FY10 OPERATING & CAPITAL BUDGETS
FY08
Authorized
FY07
Authorized
FY06
Authorized Grade
OFFICE OF RAIL CAR MAINTENANCE
Secretary UR 1 1111
Serviceperson UR 61 61611715
Historical Maintenance UR ---- ----16--------
Represented Subtotal 295 301311251251
Total Full-Time 349 356364299293
Capital Contract
Program Manager ---- 1 11--------
Total Capital 1 11--------
222
FY10 OPERATING & CAPITAL BUDGETS OFFICE OF MAINTENANCE OF WAY
FUNCTIONS & RESPONSIBILITIES The Office of Maintenance of Way is responsible for managing the maintenance programs for the Authority's automatic train control and signaling system; traction, auxiliary and emergency power systems; track, structures, and right of way; for all Authority owned buildings, rail stations, rail yards, parking facilities, bus garages and real estate. The primary focus of this Office is to provide a safe, reliable and sanitary infrastructure and operating system for the Authority’s internal and external customers. The Office of Maintenance of Way is committed to MARTA's strategic priorities and will meet those objectives and standards through the combined efforts of the Director and the following branches. The Automatic Train Control branch is responsible for maintenance and repairs of the signaling and train control systems that guide rail vehicle movement. The function of this branch is to ensure the safe operation of trains by maintaining track circuits, impedance bonds, switch machines, vital control relays, encroachment detection systems, traffic signals, routing circuits, and automatic speed command systems. The Electrical Power and Equipment branch is responsible for preventive maintenance and repair of the Authority's traction and auxiliary power systems. The traction power function of this branch is to deliver safe and reliable third rail power (750 dc) to propel the Authority's rail cars and to maintain the wayside emergency trip stations. The auxiliary power function of this branch is to deliver safe and reliable auxiliary power to the Authority's electrical loads, (lighting, elevators, escalators, heating and ventilation) for all rails, bus and support facilities. This branch also performs general building electrical maintenance, and repair and minor installation in bus and rail facilities. The primary focus of this branch is to
provide uninterrupted traction power, well-lighted passenger stations and parking lots, and electrical system integrity. The Track & Structures branch is comprised of three major units: Track Inspection & Support, Track Maintenance and Structural Engineering, Maintenance & Inspection. The Track Inspection & Support unit provides track inspection services, scheduling services, personnel administration services, contract administration services, material management services, predictive maintenance and track vehicle and equipment repair and maintenance services. The Track Maintenance unit performs the majority of the track maintenance and repair programs, including ballasted track maintenance, direct fixation track maintenance, contact rail maintenance, running rail maintenance and turnout maintenance. The Structural Engineering, Maintenance and Inspection unit provides structural inspection services, including the inspection of aerial structures, tunnels, right-of-way structures and passenger station structures on a biennial basis to ensure safety, strength and serviceability. Maintenance services include structural component cleaning, structural concrete repair and inspection, expansion joint repair and replacement, drain maintenance, structural bolt maintenance and bearing pad replacement and maintenance. This unit also furnishes conceptual engineering support for special projects and planning studies as requested by various MARTA departments and offices.
223
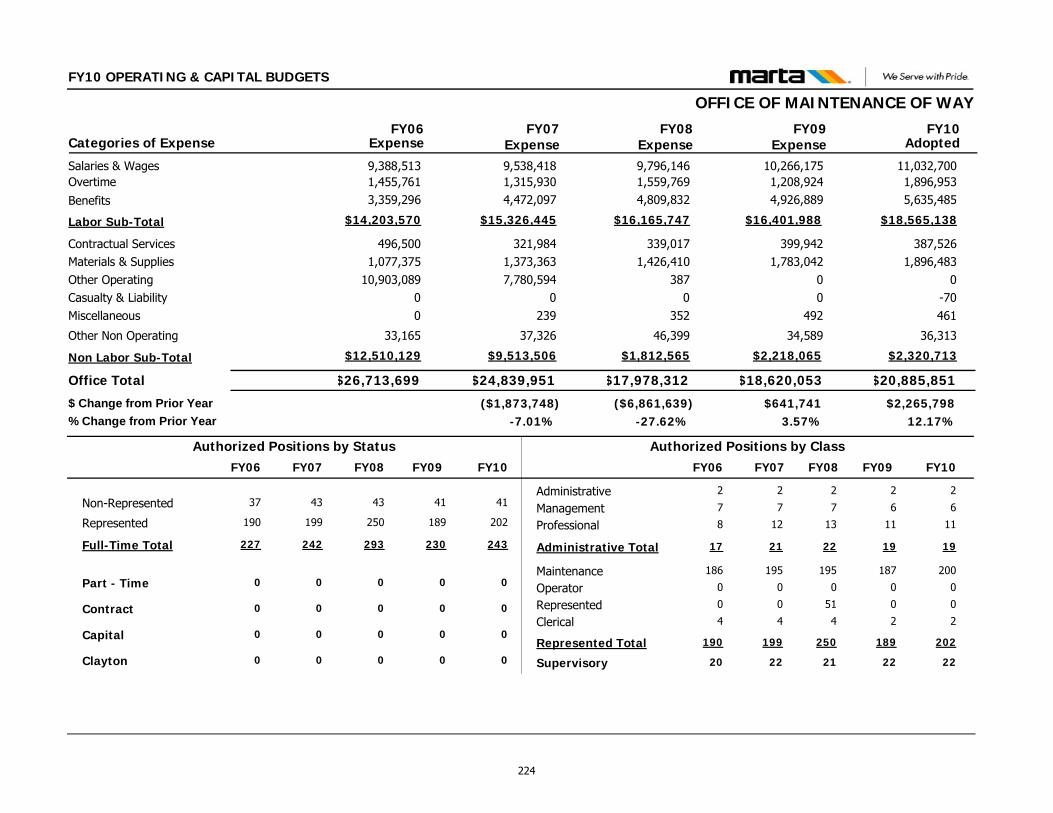
FY10 OPERATING & CAPITAL BUDGETS
OFFICE OF MAINTENANCE OF WAY
$20,885,851$18,620,053
387,5261,896,483
0-70461
36,313
399,9421,783,042
00
492
34,589
Contractual ServicesMaterials & SuppliesOther OperatingCasualty & LiabilityMiscellaneous
Other Non Operating
Office Total
11,032,70010,266,175Salaries & Wages1,896,9531,208,924Overtime
$18,565,138$16,401,988Labor Sub-Total
FY09 FY10Categories of Expense
$26,713,699
496,5001,077,375
10,903,08900
33,165
9,388,5131,455,761
$14,203,570
FY06
$24,839,951
321,9841,373,3637,780,594
0239
37,326
9,538,4181,315,930
$15,326,445
FY07Expense Expense Expense Adopted
$2,265,798$641,741($1,873,748)12.17%3.57%-7.01%
$ Change from Prior Year% Change from Prior Year
$17,978,312
339,0171,426,410
3870
352
46,399
9,796,1461,559,769
$16,165,747
FY08Expense
($6,861,639)-27.62%
$2,320,713$2,218,065Non Labor Sub-Total $12,510,129 $9,513,506 $1,812,565
5,635,4854,926,889Benefits 3,359,296 4,472,097 4,809,832
Administrative
Clerical
Management
MaintenanceOperator
Professional
Represented
Supervisory
2
2
6
187
0
11
0
22
2
2
6
200
0
11
0
22
Non-Represented 41 41
Part - Time 0 0
Represented 189 202
Full-Time Total 230 243
Contract 0 0
Capital 0 0
Authorized Positions by Class
Administrative Total 19 19
Authorized Positions by Status
Represented Total 189 202
2
4
7
195
0
12
0
22
43
0
199
242
0
0
21
199
2
4
7
186
0
8
0
20
37
0
190
227
0
0
17
190
FY10FY09 FY07FY06 FY10FY09 FY07FY06
Clayton 0 000
43
0
250
293
0
0
FY08
0
2
4
7
195
0
13
51
21
22
250
FY08
224
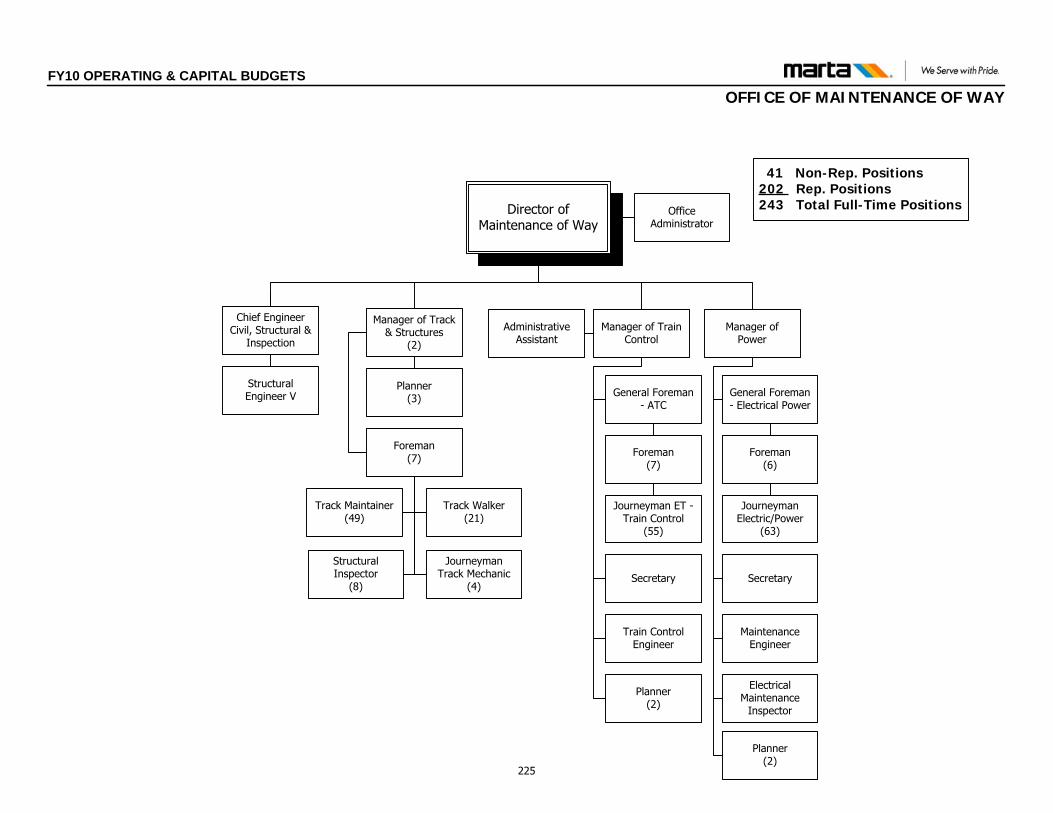
Manager of Train Control
General Foreman - ATC
Train Control Engineer
Foreman (7)
Journeyman ET -Train Control
(55)
Secretary
Manager of Power
Planner(2)
Secretary
Electrical Maintenance
Inspector
Maintenance Engineer
General Foreman - Electrical Power
Foreman (6)
Journeyman Electric/Power
(63)
Manager of Track & Structures
(2)
Administrative Assistant
Track Walker(21)
Structural Inspector
(8)
Track Maintainer(49)
Foreman(7)
Planner(3)
Journeyman Track Mechanic
(4)
Chief Engineer Civil, Structural &
Inspection
Structural Engineer V
Planner(2)
Director of Maintenance of Way
Office Administrator
41 Non-Rep. Positions202 Rep. Positions243 Total Full-Time Positions
FY10 OPERATING & CAPITAL BUDGETSOFFICE OF MAINTENANCE OF WAY
225
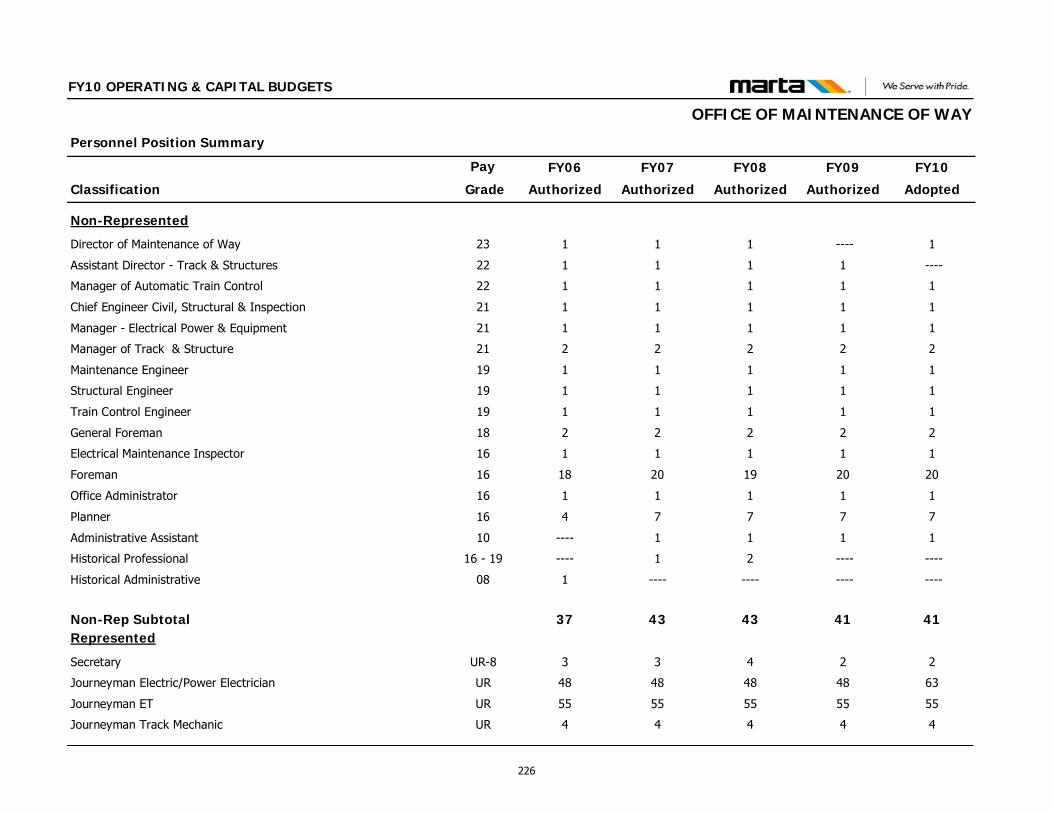
Classification
Personnel Position Summary
Pay FY09
Authorized
FY10
Adopted
FY10 OPERATING & CAPITAL BUDGETS
FY08
Authorized
FY07
Authorized
FY06
Authorized Grade
OFFICE OF MAINTENANCE OF WAY
Non-Represented
Director of Maintenance of Way 23 ---- 1111
Assistant Director - Track & Structures 22 1 ----111
Manager of Automatic Train Control 22 1 1111
Chief Engineer Civil, Structural & Inspection 21 1 1111
Manager - Electrical Power & Equipment 21 1 1111
Manager of Track & Structure 21 2 2222
Maintenance Engineer 19 1 1111
Structural Engineer 19 1 1111
Train Control Engineer 19 1 1111
General Foreman 18 2 2222
Electrical Maintenance Inspector 16 1 1111
Foreman 16 20 20192018
Office Administrator 16 1 1111
Planner 16 7 7774
Administrative Assistant 10 1 111----
Historical Professional 16 - 19 ---- ----21----
Historical Administrative 08 ---- ------------1
Non-Rep Subtotal 41 41434337Represented
Secretary UR-8 2 2433
Journeyman Electric/Power Electrician UR 48 63484848
Journeyman ET UR 55 55555555
Journeyman Track Mechanic UR 4 4444
226
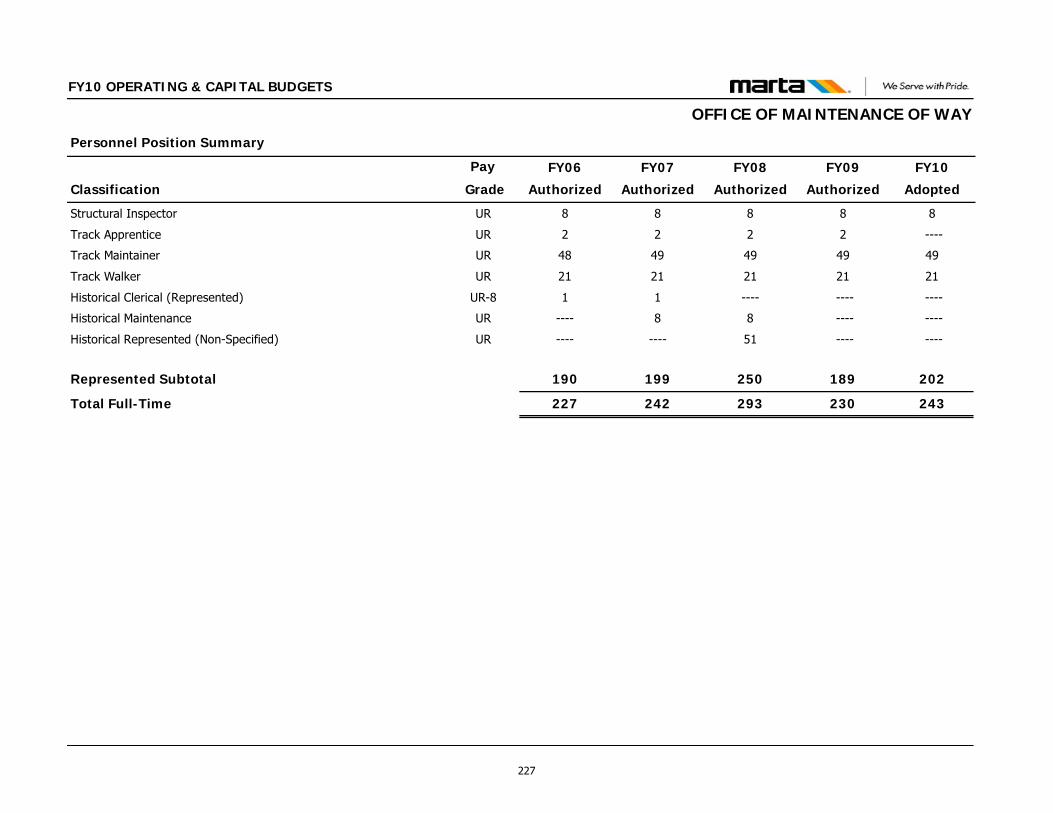
Classification
Personnel Position Summary
Pay FY09
Authorized
FY10
Adopted
FY10 OPERATING & CAPITAL BUDGETS
FY08
Authorized
FY07
Authorized
FY06
Authorized Grade
OFFICE OF MAINTENANCE OF WAY
Structural Inspector UR 8 8888
Track Apprentice UR 2 ----222
Track Maintainer UR 49 49494948
Track Walker UR 21 21212121
Historical Clerical (Represented) UR-8 ---- --------11
Historical Maintenance UR ---- ----88----
Historical Represented (Non-Specified) UR ---- ----51--------
Represented Subtotal 189 202250199190
Total Full-Time 230 243293242227
227
FY10 OPERATING & CAPITAL BUDGETS
OFFICE OF COMMUNICATIONS & CUSTOMER INFORMATION FUNCTIONS & RESPONSIBILITIES The Office of Communications and Customer Information consists of three branches: Radio Maintenance, Computer Maintenance and the Automated Fare Collection (AFC) Repair Shop. Responsibilities include maintenance and repairs of the following systems and associated components: local data transmission systems (LDTS), remote terminal units (RTU), bar code printers, network printers, personal computers, desktop and laptop, Visual Public Address System (VPAS), Train Control System, Supervisory Control and Data Acquisition (SCADA) System, Closed Circuit Television (CCTV) System, 800MHZ Radio System, Fire and Intrusion Systems and Mobile Two-way Radios for Police, Bus, Rail and Infrastructure.
The Radio Maintenance branch provides 24/7 maintenance support and is responsible for Police, Bus, Rail and Infrastructure two-way radios, mobile and handhelds, and the Bus Automatic Vehicel Locator (AVL) System. Their responsibilities also include maintaining the closed circuit television (CCTV) system, the Fire and intrusion Systems, Intelligent Transportation Systems (ITS) hardware and Automatic Train Announcement System (ATAS).
The Computer Maintenance branch provides 24/7 maintenance support to Rail Operations for train control, supervisory and control and associated equipment required to monitor train movement and field equipment.
The AFC Repair Shop is responsible for coordinating maintenance of the newly installed AFC systems, the supervision of the maintenance of the transcard encoders utilized at the revenue facilities and the entry gates at the Headquarters facility.
228
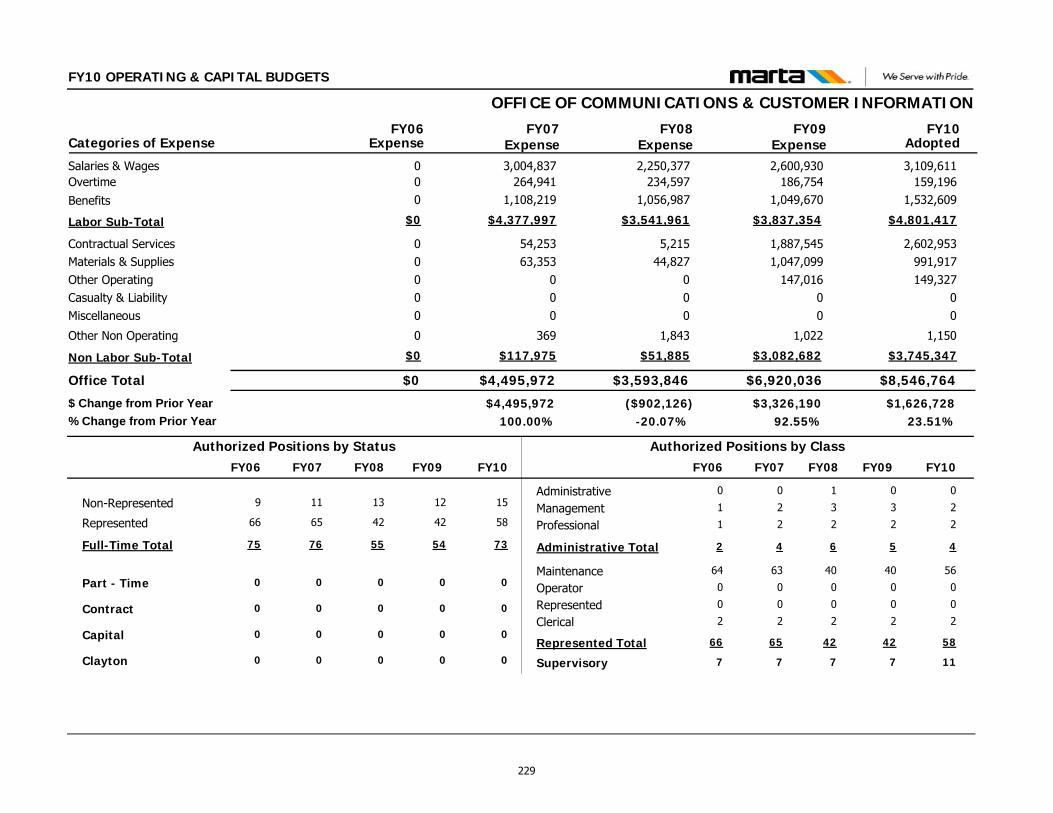
FY10 OPERATING & CAPITAL BUDGETS
OFFICE OF COMMUNICATIONS & CUSTOMER INFORMATION
$8,546,764$6,920,036
2,602,953991,917149,327
00
1,150
1,887,5451,047,099
147,01600
1,022
Contractual ServicesMaterials & SuppliesOther OperatingCasualty & LiabilityMiscellaneous
Other Non Operating
Office Total
3,109,6112,600,930Salaries & Wages159,196186,754Overtime
$4,801,417$3,837,354Labor Sub-Total
FY09 FY10Categories of Expense
$0
00000
0
00
$0
FY06
$4,495,972
54,25363,353
000
369
3,004,837264,941
$4,377,997
FY07Expense Expense Expense Adopted
$1,626,728$3,326,190$4,495,97223.51%92.55%100.00%
$ Change from Prior Year% Change from Prior Year
$3,593,846
5,21544,827
000
1,843
2,250,377234,597
$3,541,961
FY08Expense
($902,126)-20.07%
$3,745,347$3,082,682Non Labor Sub-Total $0 $117,975 $51,885
1,532,6091,049,670Benefits 0 1,108,219 1,056,987
Administrative
Clerical
Management
MaintenanceOperator
Professional
Represented
Supervisory
0
2
3
40
0
2
0
7
0
2
2
56
0
2
0
11
Non-Represented 12 15
Part - Time 0 0
Represented 42 58
Full-Time Total 54 73
Contract 0 0
Capital 0 0
Authorized Positions by Class
Administrative Total 5 4
Authorized Positions by Status
Represented Total 42 58
0
2
2
63
0
2
0
7
11
0
65
76
0
0
4
65
0
2
1
64
0
1
0
7
9
0
66
75
0
0
2
66
FY10FY09 FY07FY06 FY10FY09 FY07FY06
Clayton 0 000
13
0
42
55
0
0
FY08
0
1
2
3
40
0
2
0
7
6
42
FY08
229
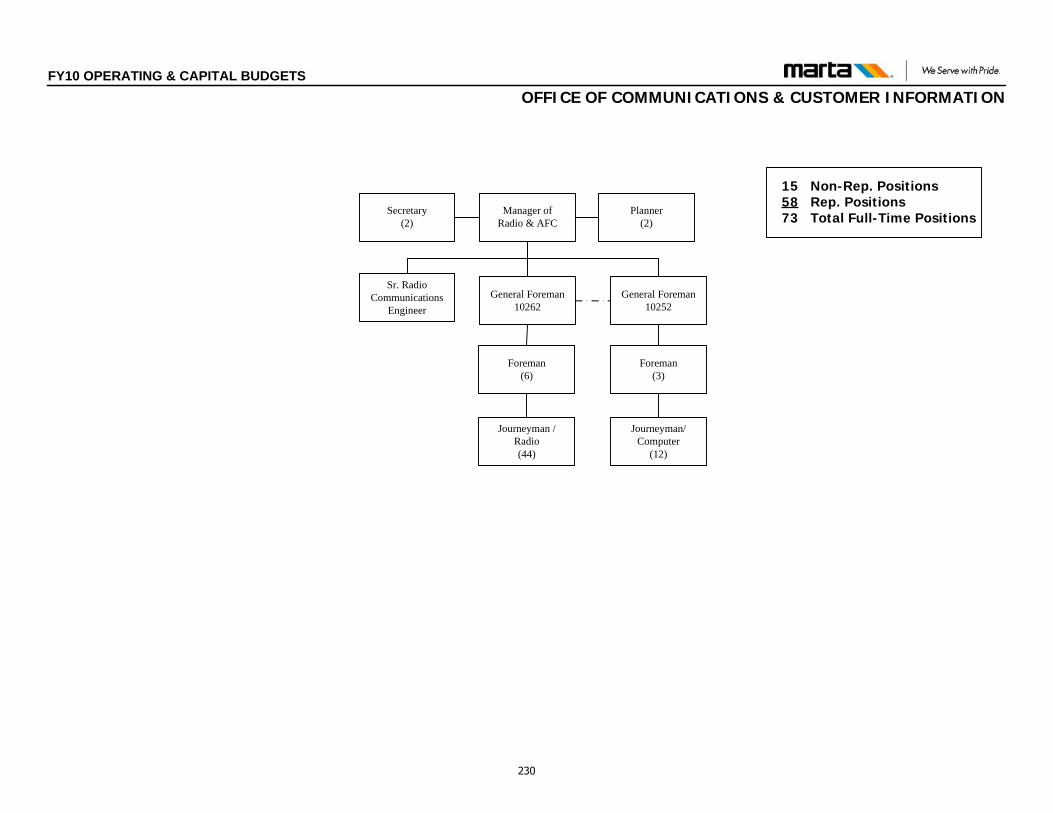
15 Non-Rep. Positions58 Rep. Positions
73 Total Full-Time Positions
Foreman(3)
Journeyman/Computer
(12)
Manager of Radio & AFC
Secretary(2)
Planner(2)
General Foreman10262
Foreman(6)
Journeyman /Radio (44)
General Foreman10252
Sr. Radio Communications
Engineer
FY10 OPERATING & CAPITAL BUDGETSOFFICE OF COMMUNICATIONS & CUSTOMER INFORMATION
230
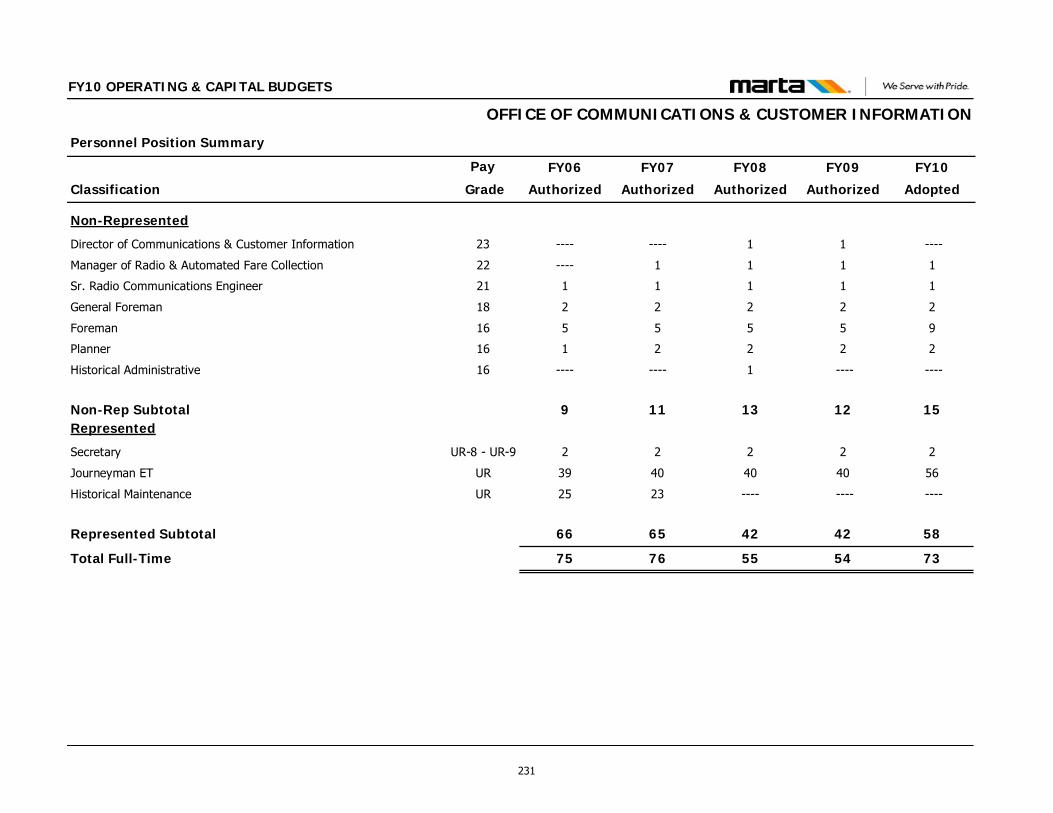
Classification
Personnel Position Summary
Pay FY09
Authorized
FY10
Adopted
FY10 OPERATING & CAPITAL BUDGETS
FY08
Authorized
FY07
Authorized
FY06
Authorized Grade
OFFICE OF COMMUNICATIONS & CUSTOMER INFORMATION
Non-Represented
Director of Communications & Customer Information 23 1 ----1--------
Manager of Radio & Automated Fare Collection 22 1 111----
Sr. Radio Communications Engineer 21 1 1111
General Foreman 18 2 2222
Foreman 16 5 9555
Planner 16 2 2221
Historical Administrative 16 ---- ----1--------
Non-Rep Subtotal 12 1513119Represented
Secretary UR-8 - UR-9 2 2222
Journeyman ET UR 40 56404039
Historical Maintenance UR ---- --------2325
Represented Subtotal 42 58426566
Total Full-Time 54 73557675
231

This page intentionally left blank
232
DEPARTMENT OF INFRASTRUCTURE This Department includes the following Offices: Department of Infrastructure Office of AGM of Infrastructure Office of Engineering Office of Architecture & Design Office of Facilities Office of Program & Contract Management
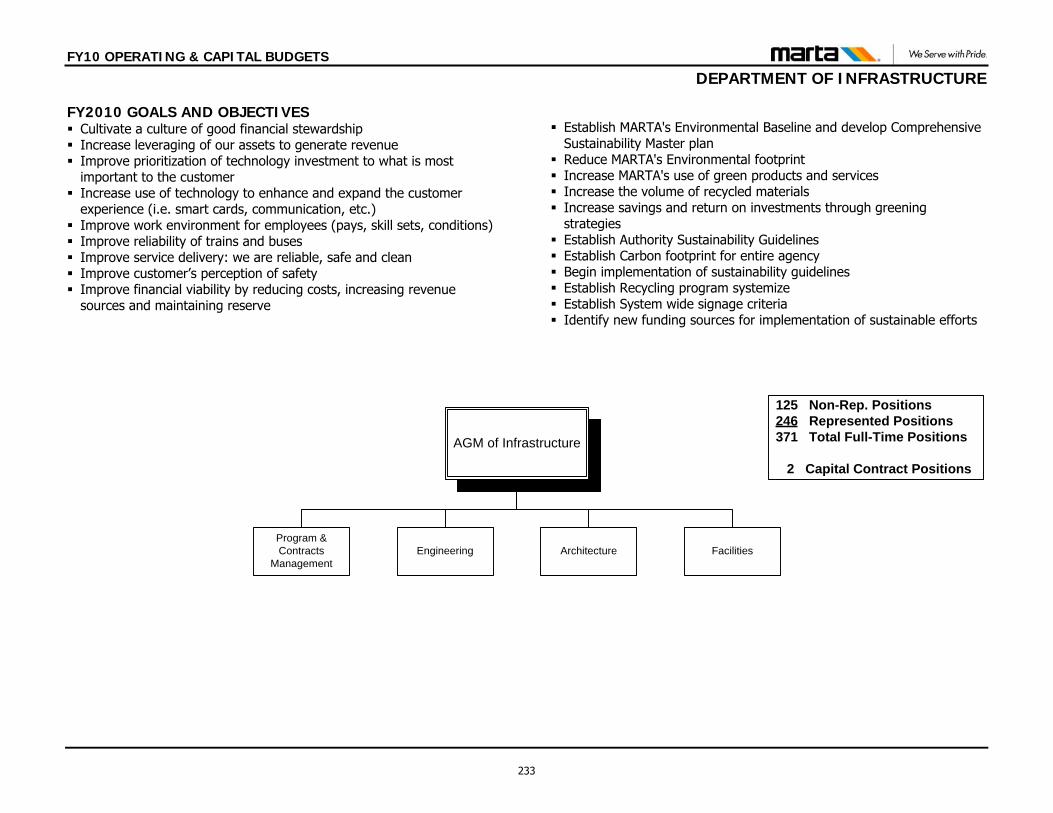
FY10 OPERATING & CAPITAL BUDGETS
DEPARTMENT OF INFRASTRUCTURE
FY2010 GOALS AND OBJECTIVES Cultivate a culture of good financial stewardship Increase leveraging of our assets to generate revenue Improve prioritization of technology investment to what is most
important to the customer Increase use of technology to enhance and expand the customer
experience (i.e. smart cards, communication, etc.) Improve work environment for employees (pays, skill sets, conditions) Improve reliability of trains and buses Improve service delivery: we are reliable, safe and clean Improve customer’s perception of safety Improve financial viability by reducing costs, increasing revenue
sources and maintaining reserve
Establish MARTA's Environmental Baseline and develop Comprehensive
Sustainability Master plan Reduce MARTA's Environmental footprint Increase MARTA's use of green products and services Increase the volume of recycled materials Increase savings and return on investments through greening
strategies Establish Authority Sustainability Guidelines Establish Carbon footprint for entire agency Begin implementation of sustainability guidelines Establish Recycling program systemize Establish System wide signage criteria Identify new funding sources for implementation of sustainable efforts
AGM of Infrastructure
Program & Contracts
ManagementEngineering Architecture
125 Non-Rep. Positions246 Represented Positions
371 Total Full-Time Positions
2 Capital Contract Positions
Facilities
233
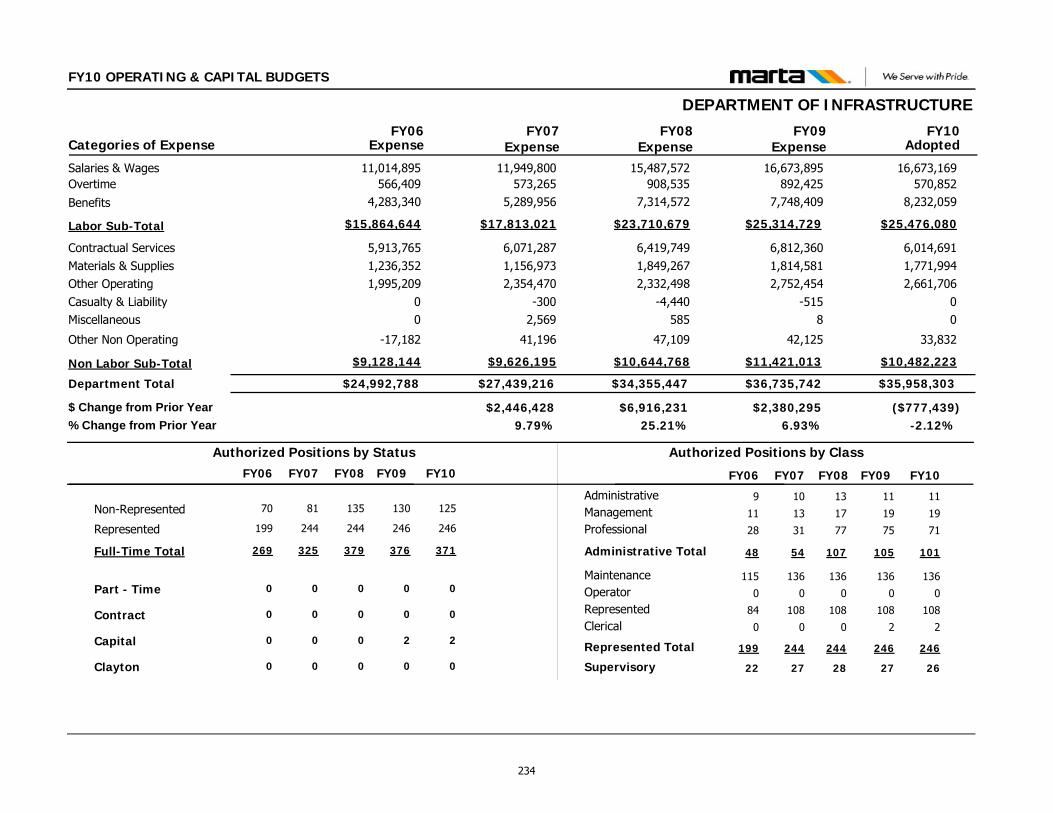
FY10 OPERATING & CAPITAL BUDGETS
DEPARTMENT OF INFRASTRUCTURE
$35,958,303$36,735,742
6,014,6911,771,9942,661,706
00
33,832
6,812,3601,814,5812,752,454
-5158
42,125
Contractual ServicesMaterials & SuppliesOther OperatingCasualty & LiabilityMiscellaneous
Other Non Operating
Department Total
16,673,16916,673,895Salaries & Wages570,852892,425Overtime
$25,476,080$25,314,729Labor Sub-Total
FY09 FY10Categories of Expense
$24,992,788
5,913,7651,236,3521,995,209
00
-17,182
11,014,895566,409
$15,864,644
FY06
$27,439,216
6,071,2871,156,9732,354,470
-3002,569
41,196
11,949,800573,265
$17,813,021
FY07Expense Expense Expense Adopted
($777,439)$2,380,295$2,446,428-2.12%6.93%9.79%
$ Change from Prior Year% Change from Prior Year
$34,355,447
6,419,7491,849,2672,332,498
-4,440585
47,109
15,487,572908,535
$23,710,679
FY08Expense
$6,916,23125.21%
$10,482,223$11,421,013Non Labor Sub-Total $9,128,144 $9,626,195 $10,644,768
8,232,0597,748,409Benefits 4,283,340 5,289,956 7,314,572
Administrative
Clerical
Management
MaintenanceOperator
Professional
Represented
Supervisory
11
2
19
136
0
75
108
27
11
2
19
136
0
71
108
26
Non-Represented 130 125
Part - Time 0 0
Represented 246 246
Full-Time Total 376 371
Contract 0 0
Capital 2 2
Authorized Positions by Class
Administrative Total 105 101
Authorized Positions by Status
Represented Total 246 246
10
0
13
136
0
31
108
27
81
0
244
325
0
0
54
244
9
0
11
115
0
28
84
22
70
0
199
269
0
0
48
199
FY10FY09 FY07FY06 FY10FY09 FY07FY06
Clayton 0 000
135
0
244
379
0
0
FY08
0
13
0
17
136
0
77
108
28
107
244
FY08
234
FY10 OPERATING & CAPITAL BUDGETS
OFFICE OF THE AGM OF INFRASTRUCTURE FUNCTIONS AND RESPONSIBILITIESThe Office of the Assistant General Manager of Infrastructure is responsible for the core business functions of general management and business management for the Department of Infrastructure. The primary responsibilities of the general management function are to manage and direct all activities related to rail transit system development and the maintenance, repair, and rehabilitation of the Authority’s operating,
support, and administrative facilities on the bus and rail systems. The Business Management function develops and implements departmental strategic business plans, goals and objectives, operating and capital budgets, performance measures and tracking mechanisms, organizational changes, training, employee development programs, and communications for the department.
235
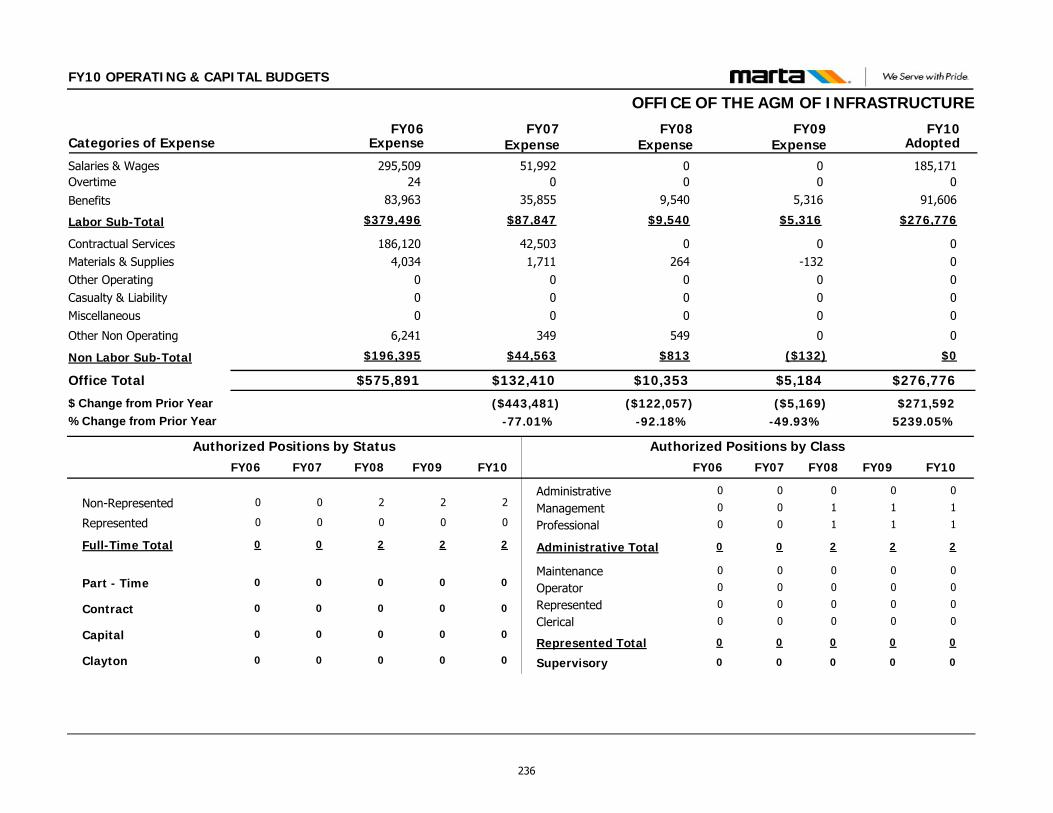
FY10 OPERATING & CAPITAL BUDGETS
OFFICE OF THE AGM OF INFRASTRUCTURE
$276,776$5,184
00000
0
0-132
000
0
Contractual ServicesMaterials & SuppliesOther OperatingCasualty & LiabilityMiscellaneous
Other Non Operating
Office Total
185,1710Salaries & Wages00Overtime
$276,776$5,316Labor Sub-Total
FY09 FY10Categories of Expense
$575,891
186,1204,034
000
6,241
295,50924
$379,496
FY06
$132,410
42,5031,711
000
349
51,9920
$87,847
FY07Expense Expense Expense Adopted
$271,592($5,169)($443,481)5239.05%-49.93%-77.01%
$ Change from Prior Year% Change from Prior Year
$10,353
0264
000
549
00
$9,540
FY08Expense
($122,057)-92.18%
$0($132)Non Labor Sub-Total $196,395 $44,563 $813
91,6065,316Benefits 83,963 35,855 9,540
Administrative
Clerical
Management
MaintenanceOperator
Professional
Represented
Supervisory
0
0
1
0
0
1
0
0
0
0
1
0
0
1
0
0
Non-Represented 2 2
Part - Time 0 0
Represented 0 0
Full-Time Total 2 2
Contract 0 0
Capital 0 0
Authorized Positions by Class
Administrative Total 2 2
Authorized Positions by Status
Represented Total 0 0
0
0
0
0
0
0
0
0
0
0
0
0
0
0
0
0
0
0
0
0
0
0
0
0
0
0
0
0
0
0
0
0
FY10FY09 FY07FY06 FY10FY09 FY07FY06
Clayton 0 000
2
0
0
2
0
0
FY08
0
0
0
1
0
0
1
0
0
2
0
FY08
236
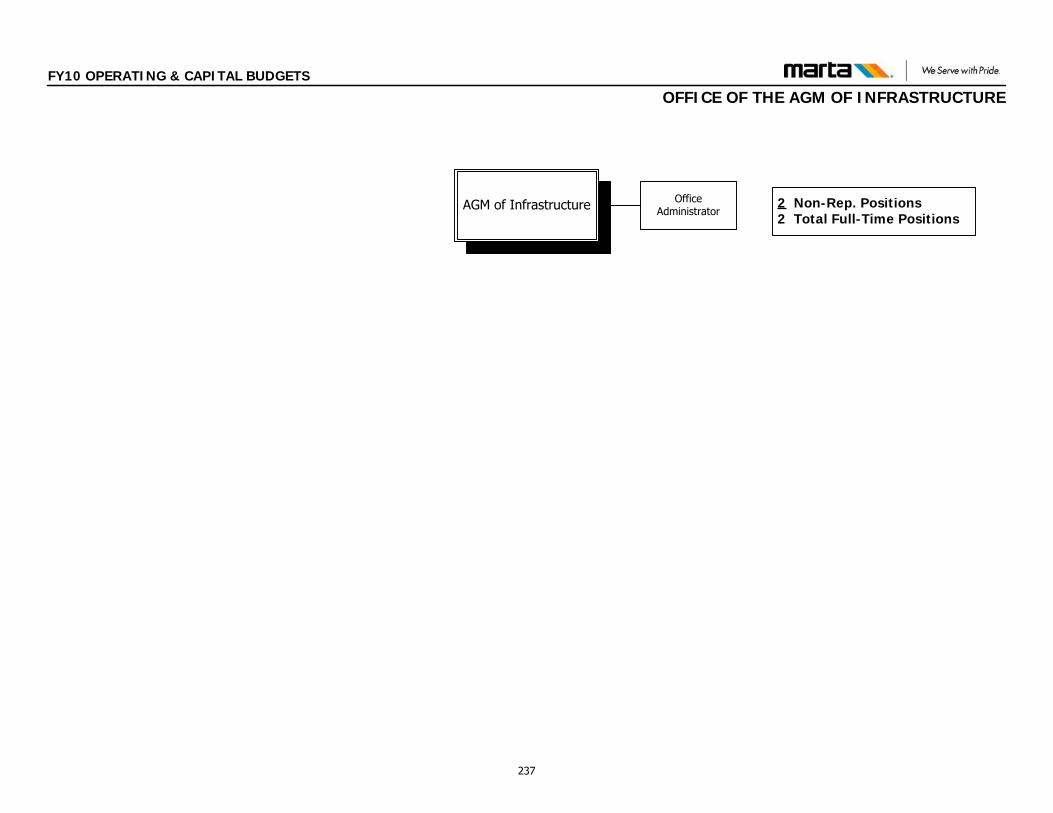
FY10 OPERATING & CAPITAL BUDGETS
OFFICE OF THE AGM OF INFRASTRUCTURE
AGM of Infrastructure Office Administrator
2 Non-Rep. Positions2 Total Full-Time Positions
237
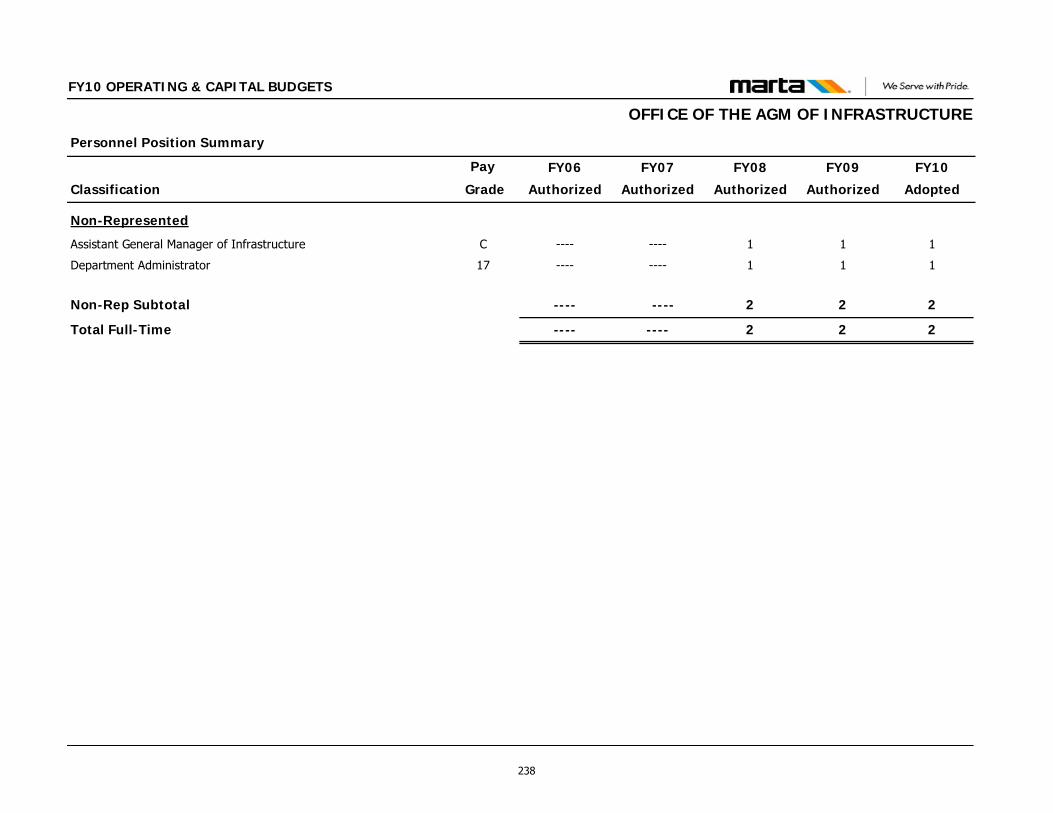
Classification
Personnel Position Summary
Pay FY09
Authorized
FY10
Adopted
FY10 OPERATING & CAPITAL BUDGETS
FY08
Authorized
FY07
Authorized
FY06
Authorized Grade
OFFICE OF THE AGM OF INFRASTRUCTURE
Non-Represented
Assistant General Manager of Infrastructure C 1 11--------
Department Administrator 17 1 11--------
Non-Rep Subtotal 2 22 --------
Total Full-Time 2 22--------
238
FY10 OPERATING & CAPITAL BUDGETS
OFFICE OF ENGINEERING FUNCTIONS AND RESPONSIBILITIESThe Office of Engineering ensures infrastructure safety to MARTA patrons by providing best cost effective, safe, constructible, technical solution to MARTA’s engineering design projects within established budgets, schedules and long range plan; provides engineering design services including contract documents, project specifications, and design services during construction; management of consultant design services and defines General Engineering Consultant annual work program and Specialty Engineering Consultant work scope in support of future expansion and rehabilitation of existing facilities. The Office establishes engineering design criteria and standards; Provide engineering support to other MARTA departments including engineering support to planning and system expansion studies and technical reviews of adjacent land development projects impacting and/or interfacing with the Authority. The Office participates in the selection and negotiation of engineering consultants and manages specialty engineering services for the Authority. The Office furnishes conceptual engineering support for special projects and planning studies for revenue service expansion projects as requested by various MARTA departments and offices. It also supports and provides all engineering and management services for revenue generating projects for TOD and Marketing. The Office provides technical management support to infrastructure maintenance programs including structural rehabilitation program, pavement rehabilitation program, station rehabilitation program, escalator/elevators rehabilitation and environmental remediation of MARTA facilities. The Office develops and maintains the update of engineering design criteria. Implement revisions and/or additions based on latest industry standards and guidelines and changes to building codes and federal, state, and local regulations. The Office prepares property mapping and certification for MARTA’s rights-of-way.
The Office provides Engineering coordination and cooperation with other MARTA departments and government agencies including Program and Contract Management, Safety, Quality Assurance, Operations, Planning, Marketing & Customer Relations, Technology, Financial Management & Treasury Services, and Facilities and Wayside Maintenance. The Office also coordinates, and monitors, design and construction activities performed by outside contractors or developers adjacent to MARTA property or facilities. This activity ensures the protection of MARTA patrons, employees, property, and operations, and enforces contractor compliance with Federal Labor Standards. FY09 ACCOMPLISHMENTS MARTA Expansion Plan - Participated with MARTA Office of Planning
and provide engineering review comments to MARTA expansion Plan Concept 3, Beltline, Clifton Corridor Buckhead Station Pedestrian Bridge - Completed conceptual design and
coordinated with all stakeholders including MARTA, adjoining developers, BCID, SRTA and City of Atlanta for design input and comments Ashby Station Water Infiltration - Provided engineering design guidance
and oversight to recommended fixes to rehabilitate the station for water leakage into the station CN915 and CE530 Girder Renovations - Completed CN915 and CE530
pilot program (Carbon Fiber Reinforcement Polymer Repair); complete design document for CN915 and CE530 Girder Renovations Other Projects include Grout Pockets and Construction Joint
Renovations, At Grade Transition Project, Bridge Coating Replacement at CS115 and CS310 Aerial Structures, Abutment and Drainage Renovations , HQ Data Center Rehabilitation, Specialty Consultant Oversight, System Wide Escalators Rehabilitation, Lighting Program, Tunnel Lighting Upgrades System Wide, Ashby Station Motor Control Center Replacement, Auxiliary Power Switchgear Replacement – Arts Center, Vine City TPSS Renovation, Replace UPS Systems, Fire Protection System Upgrade System Wide, Windward Park-n-Ride Erosion, Maintenance Facilities Assessment, Perry Boulevard Bus Facility Compressor Station Expansion, Evans Mill Temp Lot/ Lithonia City Hall Lot, K-9 Kennel Permitting (FTA Homeland Security)
239
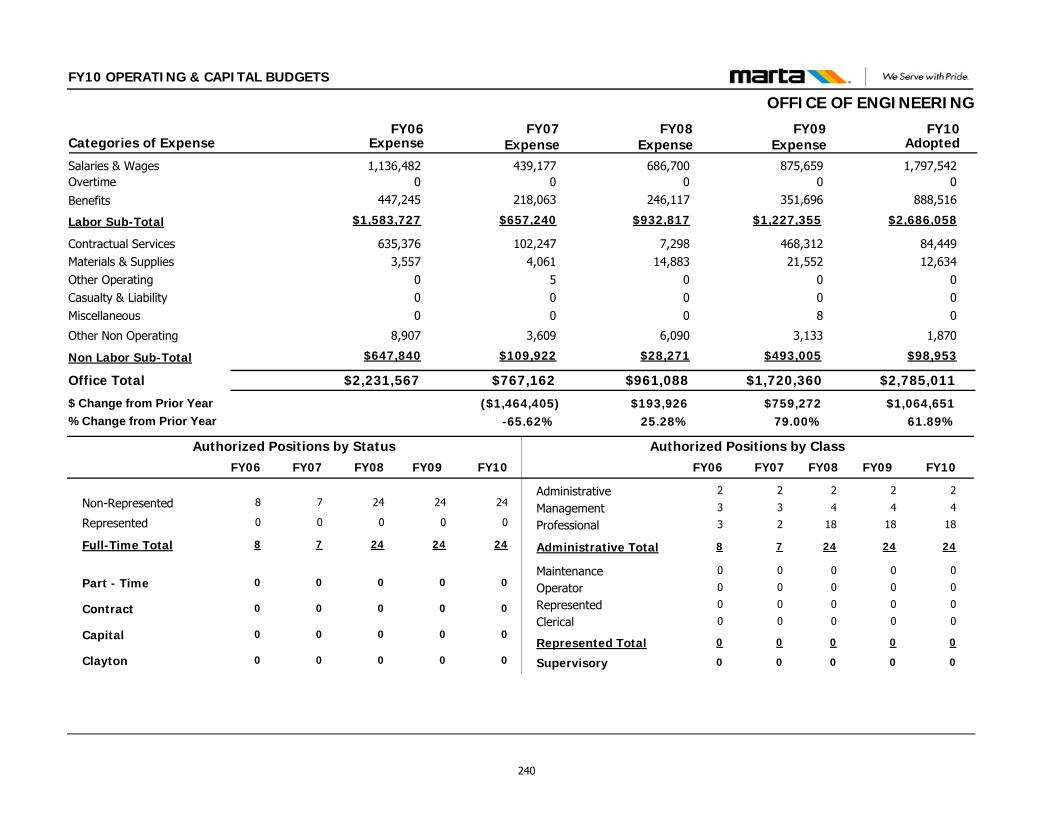
FY10 OPERATING & CAPITAL BUDGETS
OFFICE OF ENGINEERING
$2,785,011$1,720,360
84,44912,634
000
1,870
468,31221,552
008
3,133
Contractual ServicesMaterials & SuppliesOther OperatingCasualty & LiabilityMiscellaneous
Other Non Operating
Office Total
1,797,542875,659Salaries & Wages00Overtime
$2,686,058$1,227,355Labor Sub-Total
FY09 FY10Categories of Expense
$2,231,567
635,3763,557
000
8,907
1,136,4820
$1,583,727
FY06
$767,162
102,2474,061
500
3,609
439,1770
$657,240
FY07Expense Expense Expense Adopted
$1,064,651$759,272($1,464,405)61.89%79.00%-65.62%
$ Change from Prior Year% Change from Prior Year
$961,088
7,29814,883
000
6,090
686,7000
$932,817
FY08Expense
$193,92625.28%
$98,953$493,005Non Labor Sub-Total $647,840 $109,922 $28,271
888,516351,696Benefits 447,245 218,063 246,117
Administrative
Clerical
Management
MaintenanceOperator
Professional
Represented
Supervisory
2
0
4
0
0
18
0
0
2
0
4
0
0
18
0
0
Non-Represented 24 24
Part - Time 0 0
Represented 0 0
Full-Time Total 24 24
Contract 0 0
Capital 0 0
Authorized Positions by Class
Administrative Total 24 24
Authorized Positions by Status
Represented Total 0 0
2
0
3
0
0
2
0
0
7
0
0
7
0
0
7
0
2
0
3
0
0
3
0
0
8
0
0
8
0
0
8
0
FY10FY09 FY07FY06 FY10FY09 FY07FY06
Clayton 0 000
24
0
0
24
0
0
FY08
0
2
0
4
0
0
18
0
0
24
0
FY08
240
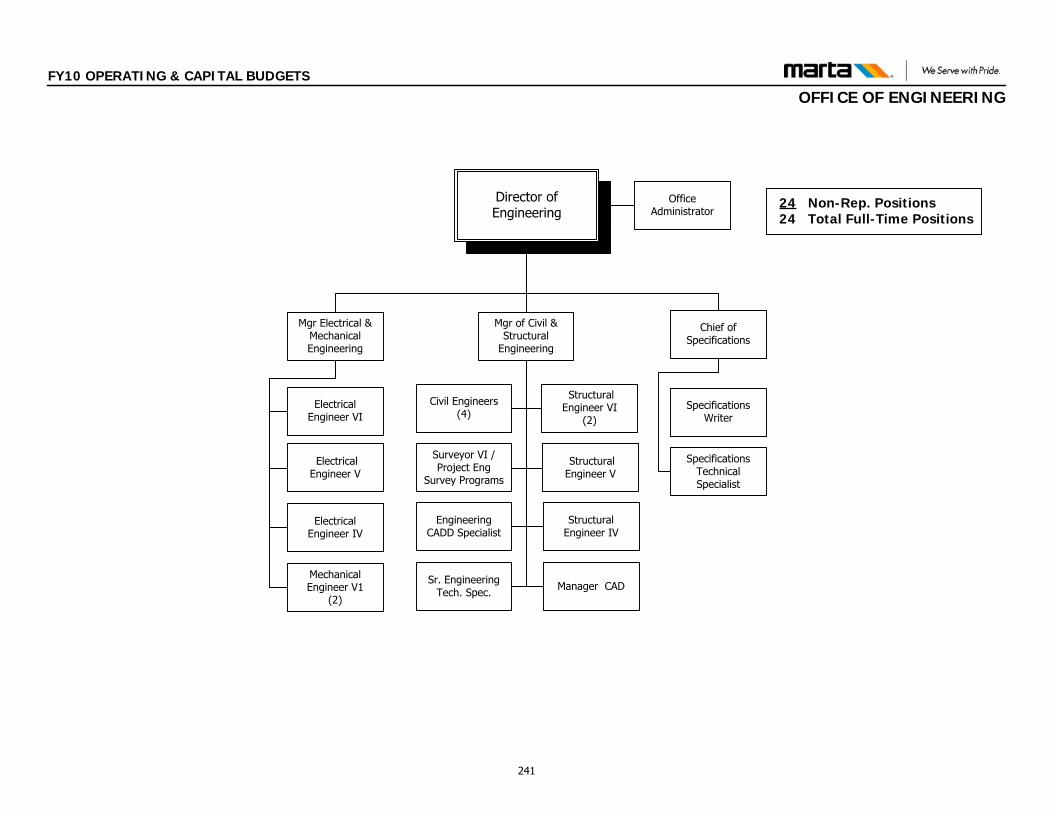
FY10 OPERATING & CAPITAL BUDGETS
OFFICE OF ENGINEERING
Office Administrator
Mgr Electrical & Mechanical Engineering
Electrical Engineer IV
24 Non-Rep. Positions 24 Total Full-Time Positions
Electrical Engineer VI
Electrical Engineer V
Mechanical Engineer V1
(2)
Mgr of Civil & Structural
Engineering
Civil Engineers(4)
Structural Engineer VI
(2)
Surveyor VI / Project Eng
Survey Programs
Sr. Engineering Tech. Spec.
Engineering CADD Specialist
Structural Engineer V
Structural Engineer IV
Chief of Specifications
Specifications Writer
Specifications Technical Specialist
Manager CAD
Director of Engineering
241
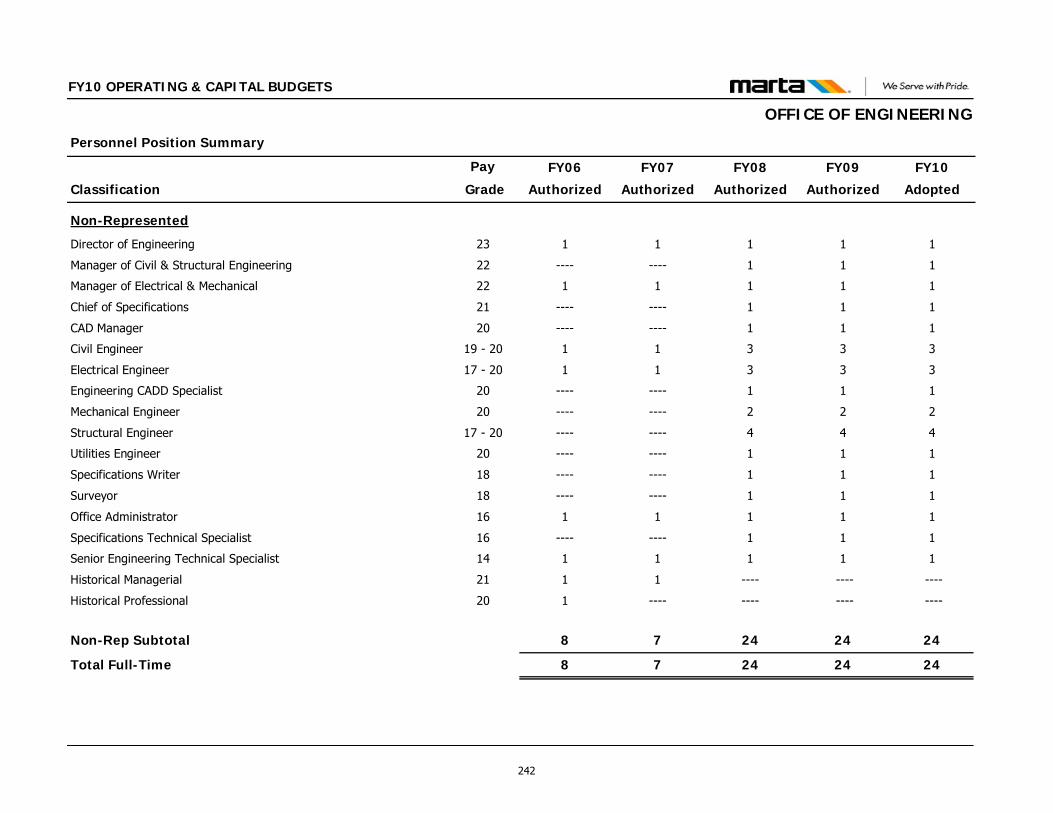
Classification
Personnel Position Summary
Pay FY09
Authorized
FY10
Adopted
FY10 OPERATING & CAPITAL BUDGETS
FY08
Authorized
FY07
Authorized
FY06
Authorized Grade
OFFICE OF ENGINEERING
Non-Represented
Director of Engineering 23 1 1111
Manager of Civil & Structural Engineering 22 1 11--------
Manager of Electrical & Mechanical 22 1 1111
Chief of Specifications 21 1 11--------
CAD Manager 20 1 11--------
Civil Engineer 19 - 20 3 3311
Electrical Engineer 17 - 20 3 3311
Engineering CADD Specialist 20 1 11--------
Mechanical Engineer 20 2 22--------
Structural Engineer 17 - 20 4 44--------
Utilities Engineer 20 1 11--------
Specifications Writer 18 1 11--------
Surveyor 18 1 11--------
Office Administrator 16 1 1111
Specifications Technical Specialist 16 1 11--------
Senior Engineering Technical Specialist 14 1 1111
Historical Managerial 21 ---- --------11
Historical Professional 20 ---- ------------1
Non-Rep Subtotal 24 242478
Total Full-Time 24 242478
242
FY10 OPERATING & CAPITAL BUDGETS
OFFICE
OF ARCHITECTURE & DESIGN
FUNCTIONS AND RESPONSIBILITIES The Office of Architecture and Design provides architectural design services including management of work programs provided by Authority consultants, in support of operating and capital programs for the rehabilitation of facilities and equipment and new capital projects. The Office establishes design criteria; provides technical services including designs, design reviews, design services during construction, inspections, technical support and reviews and troubleshooting to operations. The Office participates in the selection and negotiation of Architectural/Engineering contracts and manages architectural services for the Authority. The Office furnishes conceptual architectural support for special projects and planning studies for revenue service expansion projects as requested by various MARTA departments and offices. It also supports and provides all engineering and management services for revenue generating projects for TOD and Marketing. The Office developed and manages an environmental baseline and developed- a comprehensive Sustainability Master Plan for the Authority. The Office is also charged with managing the Sustainability Program, including reducing MARTA’s environmental footprint, and increasing MARTA’s use of green products and services. The Office is also charged with increasing the volume of recycled materials, and increasing savings and return on investment through greening strategies. The Office is also responsible for managing and preparing landscape designs as needed for the Authority-wide facilities; and acting as liaison with outside agencies, governments and adjoining property owners. The Office provides input and technical support to other MARTA offices and departments: Program and Contract Management, Safety, Quality Assurance, Operations, Planning, Marketing & Customer Relations, Technology, Financial Management & Treasury Services, and Facilities and Wayside Maintenance.
FY09 ACCOMPLISHMENTS Beltline - Provided technical review of alignment. Reviewed station
location and general architectural issues. TIGGER Grant - Developed and proposed grant possibilities. Gathered
all technical and appropriate data to be included as part of grant application. Reviewed all other applications to for technical review and ensured appropriateness of application as pertaining to sustainability CBS Bus Shelter - Selected and worked on design of new shelter that
would introduce a new high profile image for MARTA as well as establish long term durability for the high impact use of our established patronage. Reviewed all technical aspects of the structure in order to ensure long durability and maximize amenity provisions as per contract requirements. Provided comments to fabricator and provide acceptance up through first article inspection. Obtained COA Urban Design approval. Sustainability Program - Worked with all disciplines within MARTA to
reduce the environmental consequences of the Authority's activities and provide educational guidelines to reduce the overall carbon footprint. Implemented low hanging fruit initiatives that are cost saving efforts system wide. Implement the APTA pilot phase of the sustainability commitment program. Buckhead Station North Entrance - Provided Design of architectural
discipline including technical and aesthetic review, compliance with code requirements and establish LEED certification. General Architectural Issues - Provided day to day Architectural
aesthetic oversight of all architectural elements as they relate to all stations and facilities such as code compliance, issues dealing with ADA, aesthetics and other related issues. Other Projects include, but are not limited to Five Points technical and
aesthetic assistance, Airport design report, Buckhead Bridge architectural discipline and ensured LEED accreditation, LED lighting - stations and tunnels, PA System standards, Sustainability Program, Rail Supervisors Booth, Landscape architecture, Ashby Station Water Rehab, Brady Administration/ Maintenance Facility – assisted in architectural design and LEED accreditation of the facility
243
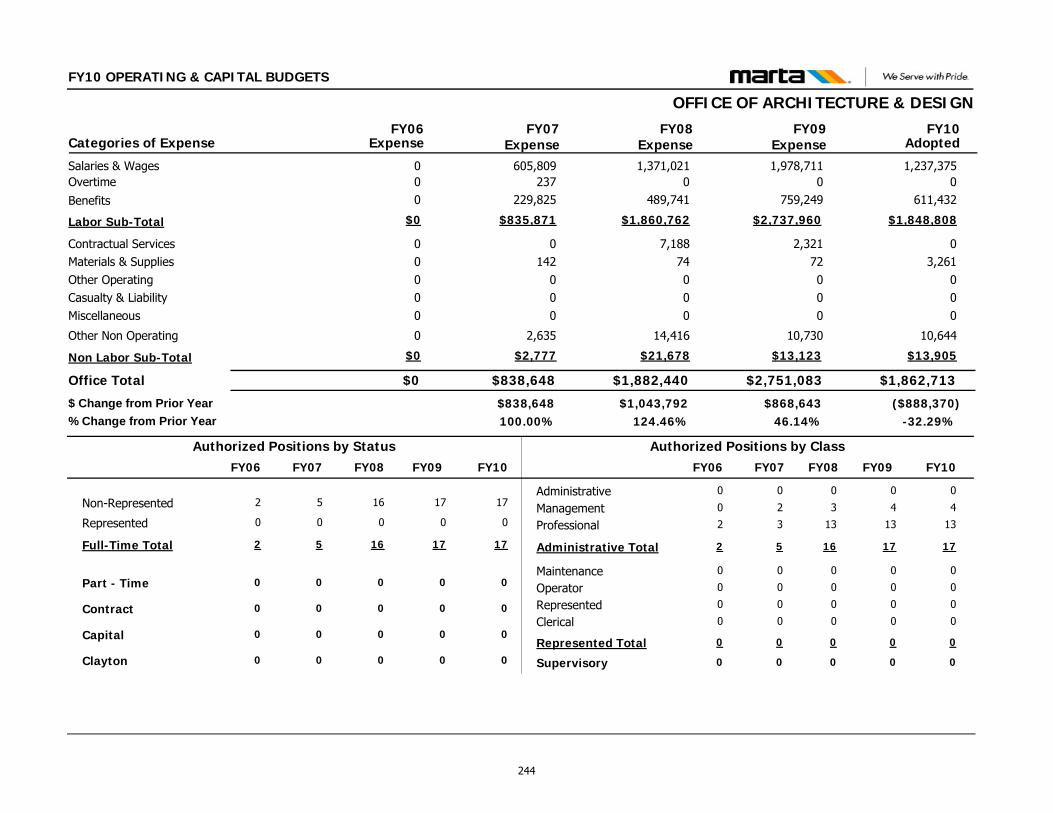
FY10 OPERATING & CAPITAL BUDGETS
OFFICE OF ARCHITECTURE & DESIGN
$1,862,713$2,751,083
03,261
000
10,644
2,32172000
10,730
Contractual ServicesMaterials & SuppliesOther OperatingCasualty & LiabilityMiscellaneous
Other Non Operating
Office Total
1,237,3751,978,711Salaries & Wages00Overtime
$1,848,808$2,737,960Labor Sub-Total
FY09 FY10Categories of Expense
$0
00000
0
00
$0
FY06
$838,648
0142
000
2,635
605,809237
$835,871
FY07Expense Expense Expense Adopted
($888,370)$868,643$838,648-32.29%46.14%100.00%
$ Change from Prior Year% Change from Prior Year
$1,882,440
7,18874000
14,416
1,371,0210
$1,860,762
FY08Expense
$1,043,792124.46%
$13,905$13,123Non Labor Sub-Total $0 $2,777 $21,678
611,432759,249Benefits 0 229,825 489,741
Administrative
Clerical
Management
MaintenanceOperator
Professional
Represented
Supervisory
0
0
4
0
0
13
0
0
0
0
4
0
0
13
0
0
Non-Represented 17 17
Part - Time 0 0
Represented 0 0
Full-Time Total 17 17
Contract 0 0
Capital 0 0
Authorized Positions by Class
Administrative Total 17 17
Authorized Positions by Status
Represented Total 0 0
0
0
2
0
0
3
0
0
5
0
0
5
0
0
5
0
0
0
0
0
0
2
0
0
2
0
0
2
0
0
2
0
FY10FY09 FY07FY06 FY10FY09 FY07FY06
Clayton 0 000
16
0
0
16
0
0
FY08
0
0
0
3
0
0
13
0
0
16
0
FY08
244
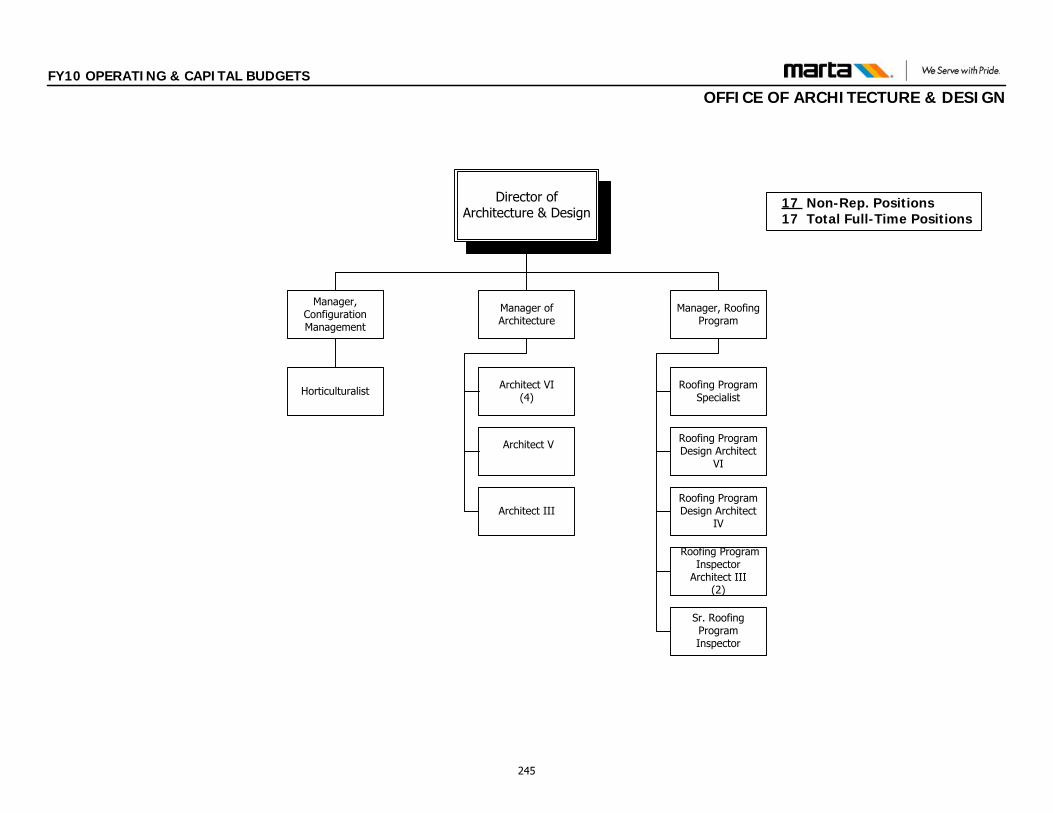
FY10 OPERATING & CAPITAL BUDGETS
OFFICE OF ARCHITECTURE & DESIGN
17 Non-Rep. Positions 17 Total Full-Time Positions
Director of Architecture & Design
Roofing Program Specialist
Roofing Program Design Architect
VI
Roofing Program Design Architect
IV
Roofing Program Inspector
Architect III(2)
Manager, Configuration Management
Manager, Roofing Program
Horticulturalist
Manager of Architecture
Architect VI(4)
Architect V
Architect III
Sr. Roofing Program Inspector
245
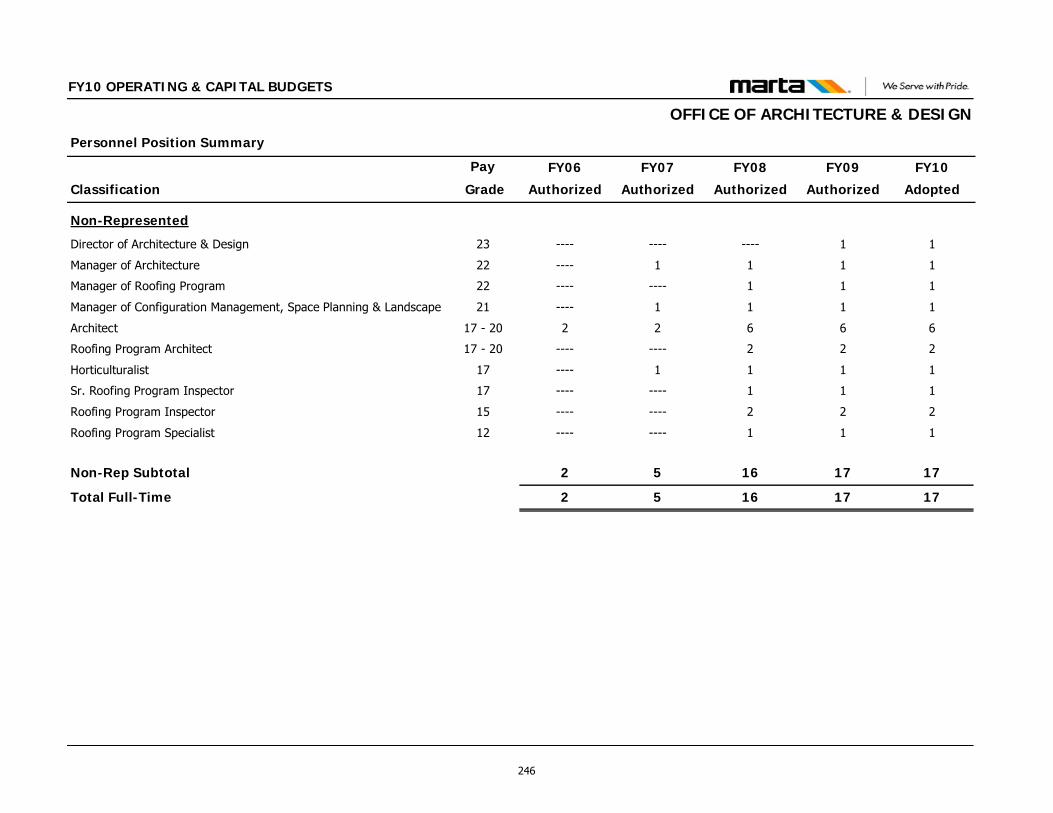
Classification
Personnel Position Summary
Pay FY09
Authorized
FY10
Adopted
FY10 OPERATING & CAPITAL BUDGETS
FY08
Authorized
FY07
Authorized
FY06
Authorized Grade
OFFICE OF ARCHITECTURE & DESIGN
Non-Represented
Director of Architecture & Design 23 1 1------------
Manager of Architecture 22 1 111----
Manager of Roofing Program 22 1 11--------
Manager of Configuration Management, Space Planning & Landscape 21 1 111----
Architect 17 - 20 6 6622
Roofing Program Architect 17 - 20 2 22--------
Horticulturalist 17 1 111----
Sr. Roofing Program Inspector 17 1 11--------
Roofing Program Inspector 15 2 22--------
Roofing Program Specialist 12 1 11--------
Non-Rep Subtotal 17 171652
Total Full-Time 17 171652
246
FY10 OPERATING & CAPITAL BUDGETS
OFFICE OF FACILITIES FUNCTIONS AND RESPONSIBILITIESThe Office of Facilities is responsible for managing the maintenance programs for the Authority's facilities management and maintenance, utilities (gas, water electricity), elevator/escalator, landscaping services and custodial services for all Authority owned buildings, rail stations, rail yards, parking facilities, bus garages, and real estate. The primary focus of this Office is to provide a safe, reliable and sanitary infrastructure and operating system for the Authority’s internal and external customers. The Office of Elevator/Escalator is responsible for the management of MARTA’s Elevator and Escalator program to include the administration of maintenance and capital rehabilitation contracts. Has major responsibility for completion of the appropriate activities necessary for the design, preparation, advertisement, and award of elevator and escalator contracts. Ensures contractors comply with contract technical specifications and requirements, as well as with any federal, state, city and local government requirements, ordinances, codes, and all applicable safety requirements. Oversees equipment inspections and troubleshooting process of MARTA’s elevator and escalator electrical and mechanical equipment problems and tracks installation of repaired or acquired equipment. Ensures other MARTA staff members such as Safety and Quality Assurance personnel, Project and Resident Engineers, Project and Construction Managers are informed of the status of the elevator/escalator facilities on a routine basis; ensures timely 24hr/7-day week emergency response to all elevator/escalator incidents or accidents. The Buildings and Support Equipment branch is responsible for the general maintenance, minor construction and repair for MARTA facilities including the bus garages, rail shops, rail stations, roads, parking lots and all associated mechanical, HVAC, water, sewer and fire protection systems, elevator and escalator systems. The Custodial and Landscape Services branch is responsible for the general custodial services, landscape maintenance, manufacture, repair and installation of signage for all Authority owned buildings, rail stations, parking facilities, rail yards, bus garages and real estate. The Headquarters Maintenance branch is responsible for the general custodial support, signage, landscape, painting and all associated mechanical, elevator, HVAC, water, sewer and fire protection systems in
the Headquarters and HQ Annex buildings. This maintenance group maintains a safe and efficient environment for MARTA’s business units. FY09 ACCOMPLISHMENTS Station Cleaning - Installed deodorizers to improve the smell of
elevators at several problem stations; Installed new shelving and Employee lockers at all station maintainer rooms Heavy Cleaning - C&L assisted with cleaning and refurbishing all Rail
Station Staff rooms. This was a coordinated effort between Custodial and Landscape, Building Support, EP&E, Station Services, and Contracted Services; Continued the track cleaning/de-littering initiative in partnership with the Track Department Manufactured 110 signs for Rail Transportation “Yard throat
demarcation” safety; Manufactured and installed 150 safety signs for end of the platform wayside entry gates; Fabricated 1272 Handicap-Priority seating decals for Rail Cars; Manufactured 65 (Push to trip) signs for ATC; Manufactured 24 A frame signs (lot closed) for MARTA Police Buildings & Support Equipment (not limited to) - Formed B&SE Project
Crew that has built/installed new offices and weight room at Armour Yard. Tiled numerous floors, built cabinets, shelving, reinstalled plumbing fixtures, doors and windows Authority Wide with an estimated cost savings of $75K; At C-Tran B&SE was instrumental in the start up of the Facility. Re-painted offices built deck, steps, installed a canopy over the deck and stairs, replaced HVAC equipment walls, windows, floors and fire extinguishers. Made several repairs to the parking lot and driveways; Rebuilt the South Yard locker rooms HQ Branch (not limited to) - Upgrade fire protection system at
Headquarters building; addition of push button controls to reset smoke doors without requiring contractor assistance to place doors back in normal service; Upgraded (3) older Variable Air Volume (HVAC system) units in Executive area with more modern version. Eliminating costly repairs and service visits to repair older, outdated systems; Extended life of Headquarters cooling towers 4-5 additional years by adding protective lining to prevent corrosion and rust from further damage. These cooling towers are already passed their useful life expectancy.
247
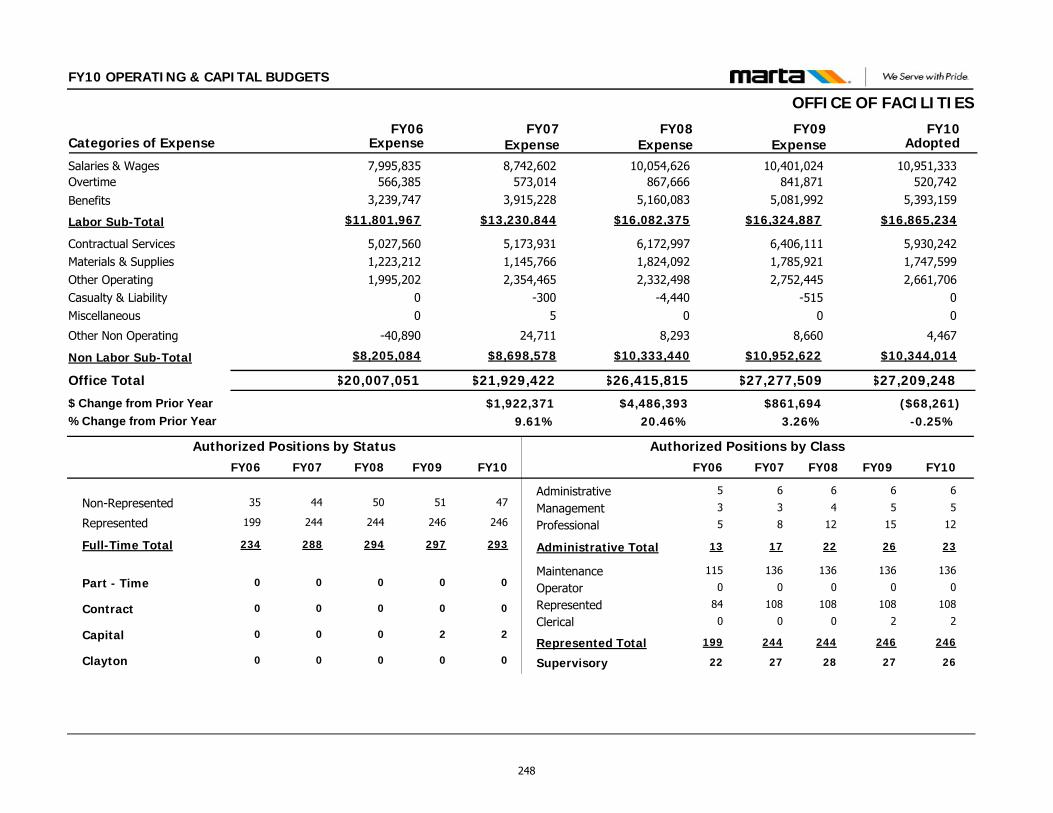
FY10 OPERATING & CAPITAL BUDGETS
OFFICE OF FACILITIES
$27,209,248$27,277,509
5,930,2421,747,5992,661,706
00
4,467
6,406,1111,785,9212,752,445
-5150
8,660
Contractual ServicesMaterials & SuppliesOther OperatingCasualty & LiabilityMiscellaneous
Other Non Operating
Office Total
10,951,33310,401,024Salaries & Wages520,742841,871Overtime
$16,865,234$16,324,887Labor Sub-Total
FY09 FY10Categories of Expense
$20,007,051
5,027,5601,223,2121,995,202
00
-40,890
7,995,835566,385
$11,801,967
FY06
$21,929,422
5,173,9311,145,7662,354,465
-3005
24,711
8,742,602573,014
$13,230,844
FY07Expense Expense Expense Adopted
($68,261)$861,694$1,922,371-0.25%3.26%9.61%
$ Change from Prior Year% Change from Prior Year
$26,415,815
6,172,9971,824,0922,332,498
-4,4400
8,293
10,054,626867,666
$16,082,375
FY08Expense
$4,486,39320.46%
$10,344,014$10,952,622Non Labor Sub-Total $8,205,084 $8,698,578 $10,333,440
5,393,1595,081,992Benefits 3,239,747 3,915,228 5,160,083
Administrative
Clerical
Management
MaintenanceOperator
Professional
Represented
Supervisory
6
2
5
136
0
15
108
27
6
2
5
136
0
12
108
26
Non-Represented 51 47
Part - Time 0 0
Represented 246 246
Full-Time Total 297 293
Contract 0 0
Capital 2 2
Authorized Positions by Class
Administrative Total 26 23
Authorized Positions by Status
Represented Total 246 246
6
0
3
136
0
8
108
27
44
0
244
288
0
0
17
244
5
0
3
115
0
5
84
22
35
0
199
234
0
0
13
199
FY10FY09 FY07FY06 FY10FY09 FY07FY06
Clayton 0 000
50
0
244
294
0
0
FY08
0
6
0
4
136
0
12
108
28
22
244
FY08
248
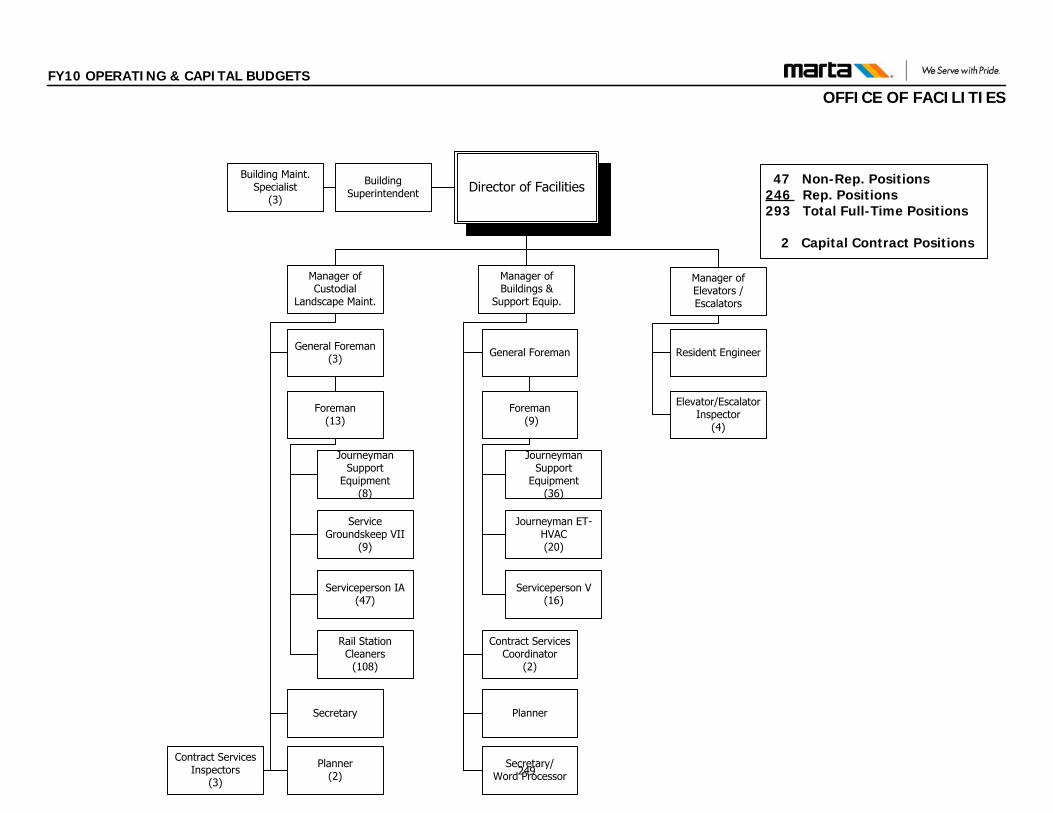
FY10 OPERATING & CAPITAL BUDGETS
OFFICE OF FACILITIES
Manager of Custodial
Landscape Maint.
Planner(2)
General Foreman(3)
Contract Services Inspectors
(3)
Journeyman Support
Equipment(8)
Service Groundskeep VII
(9)
Foreman(13)
Serviceperson IA(47)
Manager of Buildings &
Support Equip.
Planner
General Foreman
Contract Services Coordinator
(2)
Serviceperson V(16)
Foreman (9)
Journeyman Support
Equipment(36)
Journeyman ET-HVAC(20)
Secretary/Word Processor
Rail Station Cleaners
(108)
Director of FacilitiesBuilding Superintendent
Building Maint. Specialist
(3)
47 Non-Rep. Positions246 Rep. Positions293 Total Full-Time Positions
2 Capital Contract Positions
Manager of Elevators /Escalators
Resident Engineer
Elevator/Escalator Inspector
(4)
Secretary
249
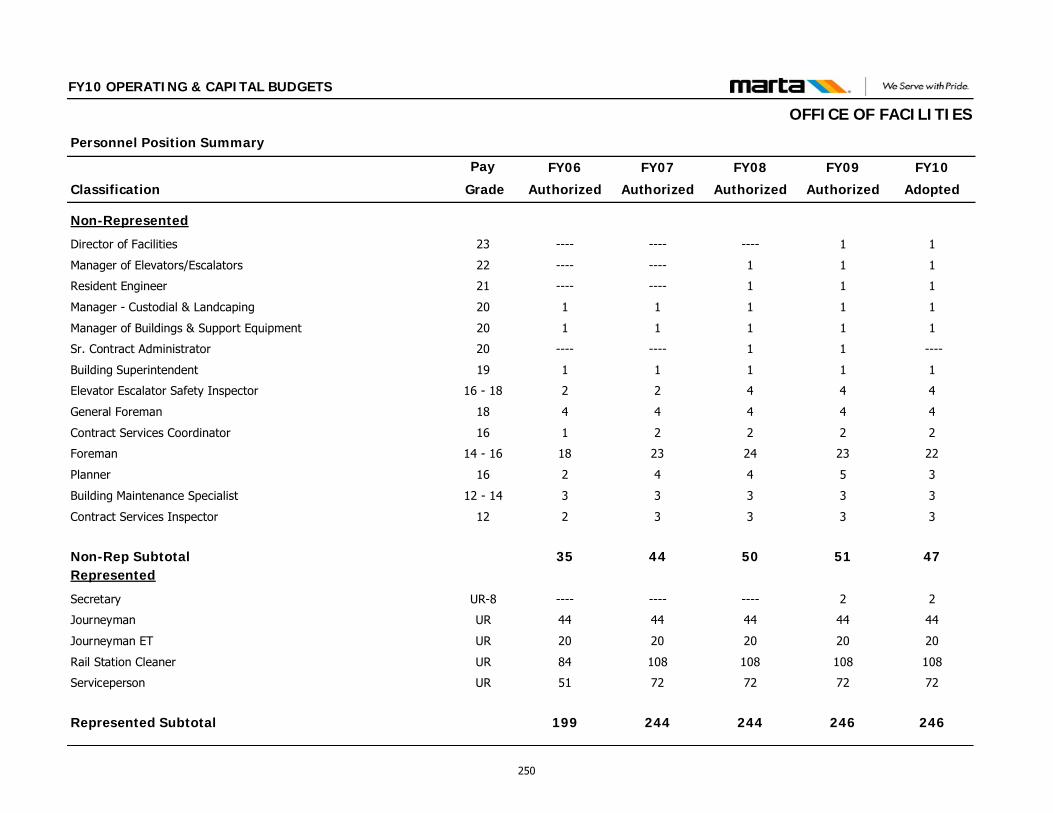
Classification
Personnel Position Summary
Pay FY09
Authorized
FY10
Adopted
FY10 OPERATING & CAPITAL BUDGETS
FY08
Authorized
FY07
Authorized
FY06
Authorized Grade
OFFICE OF FACILITIES
Non-Represented
Director of Facilities 23 1 1------------
Manager of Elevators/Escalators 22 1 11--------
Resident Engineer 21 1 11--------
Manager - Custodial & Landcaping 20 1 1111
Manager of Buildings & Support Equipment 20 1 1111
Sr. Contract Administrator 20 1 ----1--------
Building Superintendent 19 1 1111
Elevator Escalator Safety Inspector 16 - 18 4 4422
General Foreman 18 4 4444
Contract Services Coordinator 16 2 2221
Foreman 14 - 16 23 22242318
Planner 16 5 3442
Building Maintenance Specialist 12 - 14 3 3333
Contract Services Inspector 12 3 3332
Non-Rep Subtotal 51 47504435Represented
Secretary UR-8 2 2------------
Journeyman UR 44 44444444
Journeyman ET UR 20 20202020
Rail Station Cleaner UR 108 10810810884
Serviceperson UR 72 72727251
Represented Subtotal 246 246244244199
250
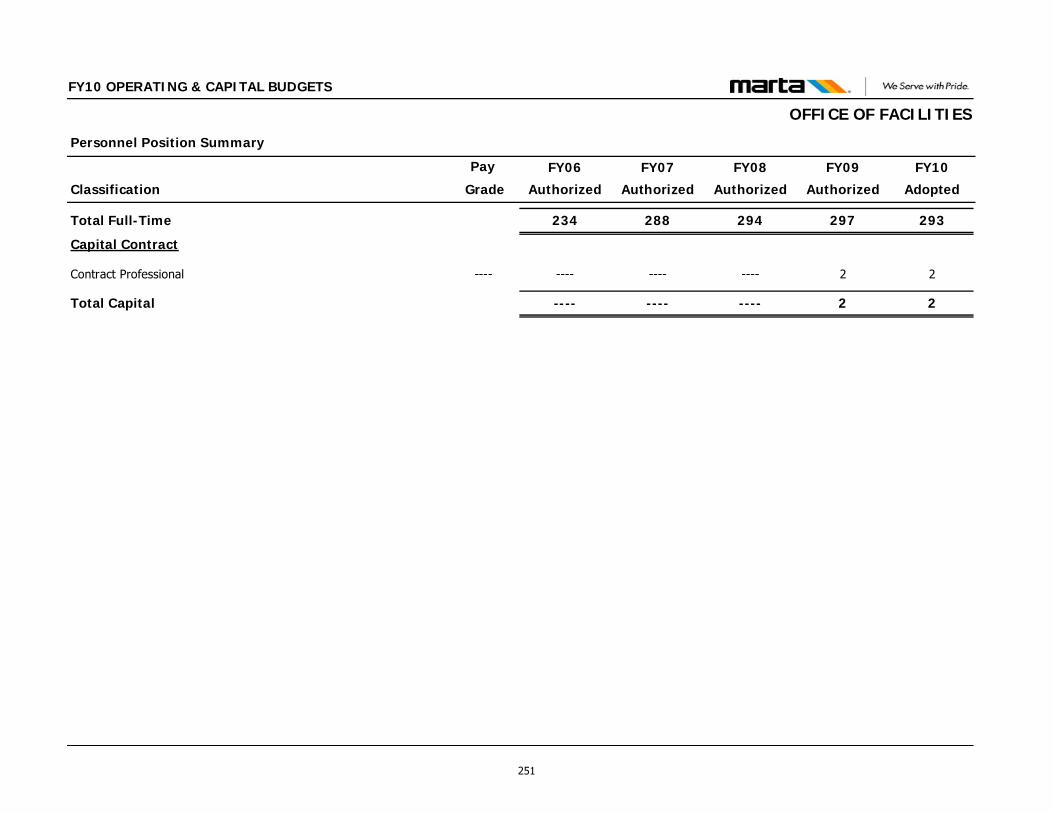
Classification
Personnel Position Summary
Pay FY09
Authorized
FY10
Adopted
FY10 OPERATING & CAPITAL BUDGETS
FY08
Authorized
FY07
Authorized
FY06
Authorized Grade
OFFICE OF FACILITIES
Total Full-Time 297 293294288234
Capital Contract
Contract Professional ---- 2 2------------
Total Capital 2 2------------
251
FY10 OPERATING & CAPITAL BUDGETS
OFFICE OF PROGRAM & CONTRACT MANAGEMENT FUNCTIONS AND RESPONSIBILITIESThe Office of Program & Contract Management consists of Project Management, Construction Management, and Capital Program Management & Oversight. The Project Management group provides project management services in support of MARTA’s Long-Range Capital Improvement Program. Project Managers are responsible for managing and directing resources and activities to ensure that project goals and objectives are successfully completed within scope, schedule and budget. Project Management responsibilities include development and initiation of capital projects, managing conceptual design through bid documents, oversight of construction activity, and coordinating agreements with outside agencies. Project Management presents and briefs projects with MARTA senior management and Board of Directors. Project Management participates in the development of annual work programs for the General Engineering Consultant and other Architectural/Engineering Consultants. Project Management monitors and manages the project functions and activities of the General Engineering Consultant and other Architectural/Engineering Consultants to ensure compliance with project scope, budget, and schedule. The Capital Improvement Program Management and Oversight group is responsible for developing and maintaining MARTA's Long-Range Capital Improvement Program, including the systems and processes associated with executing the program. The Long-Range Capital Improvement Program is used to plan and program the resources necessary to keep the transit system in a state of good repair, comply with regulatory requirements, enhance existing service, and expand the transit system. The responsibilities for the capital improvement program include capital project oversight and analyses, project and program performance analyses, maintenance of the master project schedule, and preparation of construction cost estimates and project budgets. The Construction Management group provides the services necessary to execute contracts in support of MARTA’s Long-Range Capital Improvement Program. Construction contracts include new buildings, structures and facilities for bus and rail operations, renovation and
rehabilitation of existing bus and rail facilities and equipment, and systems. Construction Management is responsible for contractor field activity, and federal, state, and city regulatory requirements; environmental and safety compliance. Construction Management is also responsible for coordinating, monitoring, and inspecting the construction activities performed by outside contractors or developers adjacent to MARTA property or facilities. To ensure the protection of MARTA patrons, employees, property, and operations. Construction Management is responsible for executing the Job Order Contract (JOC) that offers MARTA the opportunity to acquire construction or maintenance services in a very timely manner for small to medium sized projects necessary to solve short-term urgent needs. FY09 ACCOMPLISHMENTS A. UPS Phase III – Design/Implementation - 31651 Completed design documents Advertised and awarded contract Issued ANTP and began construction activities
B. Aux. Power MCC Replacement – Ashby St. – Design/Implementation - 31666 Completed design documents Advertised and awarded contract Issued ANTP and began construction activities
C. TRll Program The construction contract for the replacement of Special Trackwork
on North, South and East Lines, replace D. F. Fasteners on North, Northeast, South, East and West Lines, seal two block ties Northeast Line, and cable connection upgrades throughout the system and expansion joint work on North, South, East and West Lines (CP B2293) have continued to work toward the expected June 2009 completion of the implementation phase.
D. Participated in FTA Financial Audit and no audit findings were found E. Other Projects include, but are not limited to: Aux. Power Switchgear
Replacement – Arts Center – Design/Implementation – 31683, Stonecrest Parking Lot – Design – 31686, System-wide Tunnel Lighting Upgrades – 31707, AC Track Circuits and Train Alert Lights, Ph 2 – 31690, Emergency Trip Station, South Line – 31705
252

FY10 OPERATING & CAPITAL BUDGETS
OFFICE OF PROGRAM & CONTRACT MANAGEMENT
$3,824,555$4,981,606
08,500
000
16,851
-64,3847,168
900
19,602
Contractual ServicesMaterials & SuppliesOther OperatingCasualty & LiabilityMiscellaneous
Other Non Operating
Office Total
2,501,7483,418,501Salaries & Wages50,11050,554Overtime
$3,799,204$5,019,211Labor Sub-Total
FY09 FY10Categories of Expense
$2,178,279
64,7095,549
700
8,560
1,587,0690
$2,099,454
FY06
$3,771,574
752,6065,293
00
2,564
9,892
2,110,22014
$3,001,219
FY07Expense Expense Expense Adopted
($1,157,051)($104,145)$1,593,295-23.23%-2.05%73.14%
$ Change from Prior Year% Change from Prior Year
$5,085,751
232,2669,954
00
585
17,761
3,375,22540,869
$4,825,185
FY08Expense
$1,314,17734.84%
$25,351($37,605)Non Labor Sub-Total $78,825 $770,355 $260,566
1,247,3461,550,156Benefits 512,385 890,985 1,409,091
Administrative
Clerical
Management
MaintenanceOperator
Professional
Represented
Supervisory
3
0
5
0
0
28
0
0
3
0
5
0
0
27
0
0
Non-Represented 36 35
Part - Time 0 0
Represented 0 0
Full-Time Total 36 35
Contract 0 0
Capital 0 0
Authorized Positions by Class
Administrative Total 36 35
Authorized Positions by Status
Represented Total 0 0
2
0
5
0
0
18
0
0
25
0
0
25
0
0
25
0
2
0
5
0
0
18
0
0
25
0
0
25
0
0
25
0
FY10FY09 FY07FY06 FY10FY09 FY07FY06
Clayton 0 000
43
0
0
43
0
0
FY08
0
5
0
5
0
0
33
0
0
43
0
FY08
253
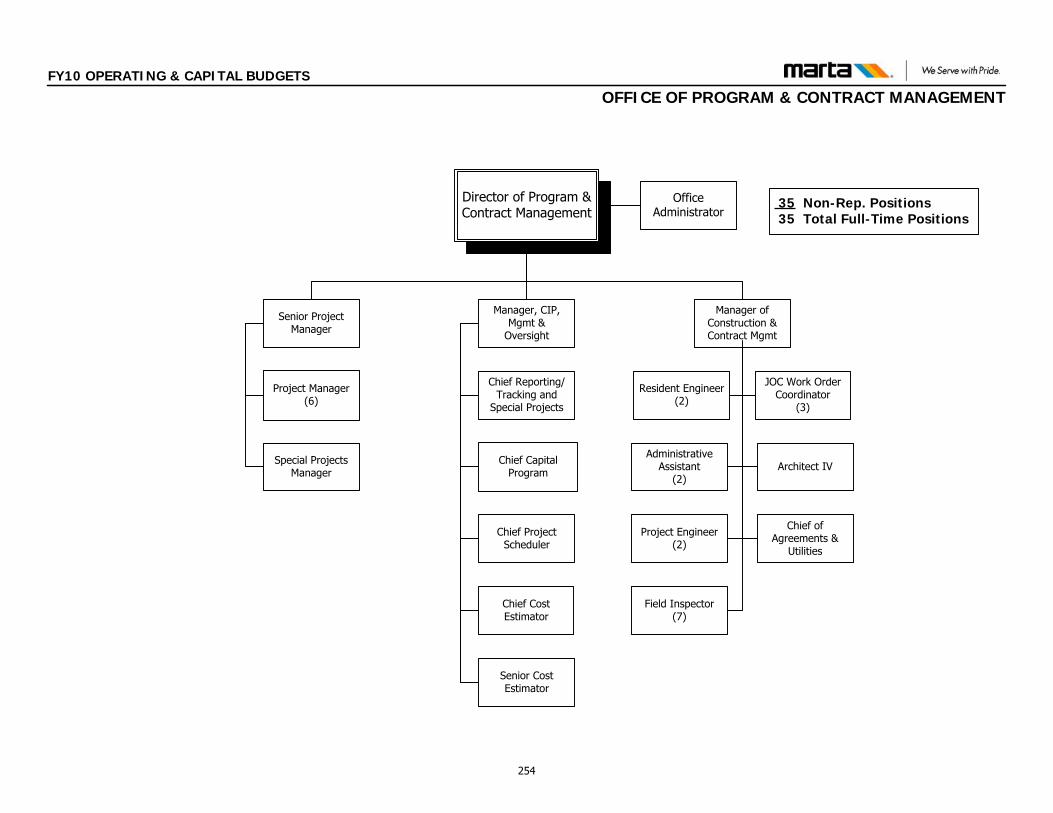
FY10 OPERATING & CAPITAL BUDGETS
OFFICE OF PROGRAM & CONTRACT MANAGEMENT
35 Non-Rep. Positions 35 Total Full-Time Positions
Office Administrator
JOC Work Order Coordinator
(3)
Resident Engineer(2)
Project Engineer(2)
Field Inspector (7)
Administrative Assistant
(2)
Chief of Agreements &
Utilities
Chief Cost Estimator
Senior Cost Estimator
Chief Project Scheduler
Chief Capital Program
Project Manager(6)
Manager of Construction & Contract Mgmt
Manager, CIP, Mgmt &
Oversight
Senior Project Manager
Architect IVSpecial Projects Manager
Chief Reporting/Tracking and
Special Projects
Director of Program & Contract Management
254
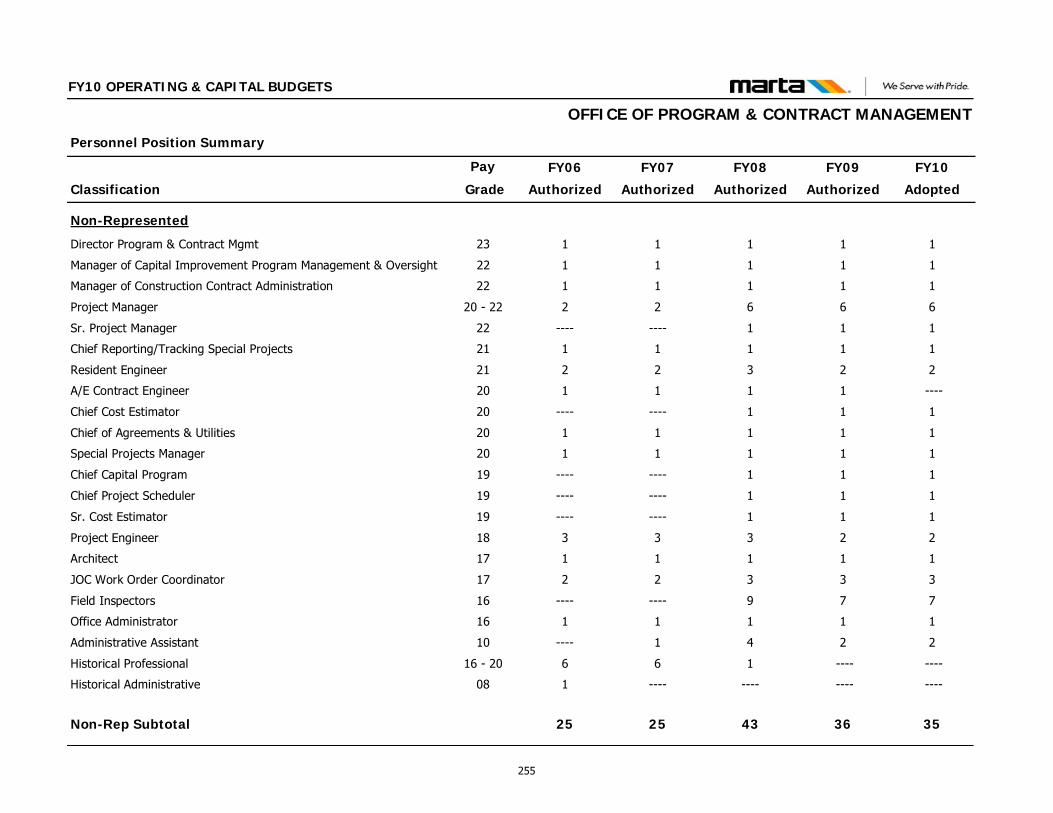
Classification
Personnel Position Summary
Pay FY09
Authorized
FY10
Adopted
FY10 OPERATING & CAPITAL BUDGETS
FY08
Authorized
FY07
Authorized
FY06
Authorized Grade
OFFICE OF PROGRAM & CONTRACT MANAGEMENT
Non-Represented
Director Program & Contract Mgmt 23 1 1111
Manager of Capital Improvement Program Management & Oversight 22 1 1111
Manager of Construction Contract Administration 22 1 1111
Project Manager 20 - 22 6 6622
Sr. Project Manager 22 1 11--------
Chief Reporting/Tracking Special Projects 21 1 1111
Resident Engineer 21 2 2322
A/E Contract Engineer 20 1 ----111
Chief Cost Estimator 20 1 11--------
Chief of Agreements & Utilities 20 1 1111
Special Projects Manager 20 1 1111
Chief Capital Program 19 1 11--------
Chief Project Scheduler 19 1 11--------
Sr. Cost Estimator 19 1 11--------
Project Engineer 18 2 2333
Architect 17 1 1111
JOC Work Order Coordinator 17 3 3322
Field Inspectors 16 7 79--------
Office Administrator 16 1 1111
Administrative Assistant 10 2 241----
Historical Professional 16 - 20 ---- ----166
Historical Administrative 08 ---- ------------1
Non-Rep Subtotal 36 35432525
255
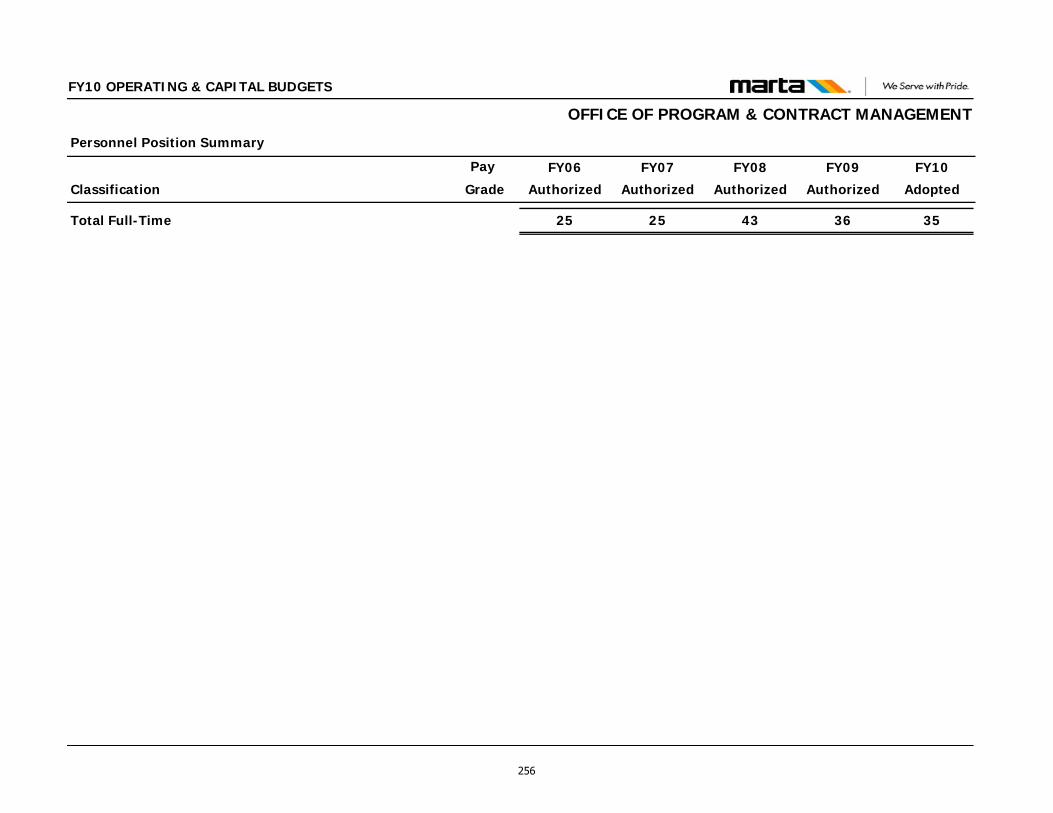
Classification
Personnel Position Summary
Pay FY09
Authorized
FY10
Adopted
FY10 OPERATING & CAPITAL BUDGETS
FY08
Authorized
FY07
Authorized
FY06
Authorized Grade
OFFICE OF PROGRAM & CONTRACT MANAGEMENT
Total Full-Time 36 35432525
256
DEPARTMENT OF POLICE SERVICES This Department includes the following Offices: Department of Police Services Office of the AGM of Police Services
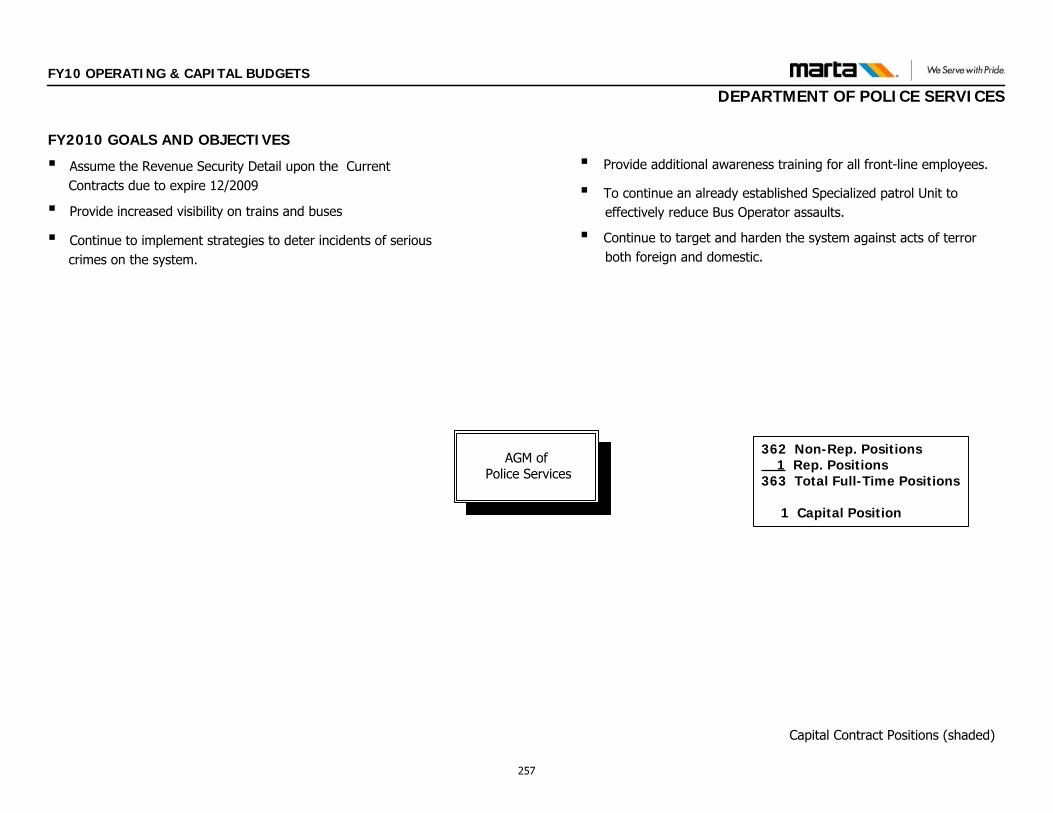
Capital Contract Positions (shaded)
362 Non-Rep. Positions 1 Rep. Positions
363 Total Full-Time Positions
1 Capital Position
AGM of Police Services
FY2010 GOALS AND OBJECTIVES
▪ Assume the Revenue Security Detail upon the Current Contracts due to expire 12/2009
▪ Provide increased visibility on trains and buses
▪ Continue to implement strategies to deter incidents of serious crimes on the system.
▪ Provide additional awareness training for all front-line employees.
▪ To continue an already established Specialized patrol Unit to effectively reduce Bus Operator assaults.
▪ Continue to target and harden the system against acts of terror both foreign and domestic.
FY10 OPERATING & CAPITAL BUDGETS
DEPARTMENT OF POLICE SERVICES
257
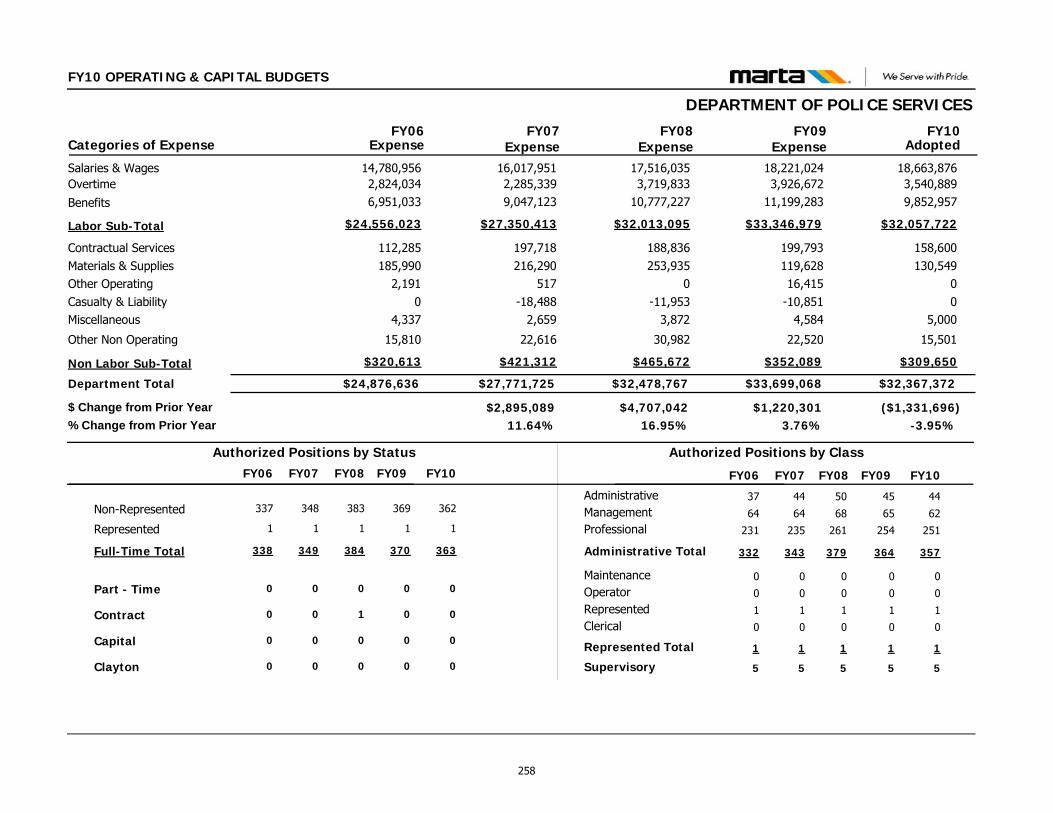
FY10 OPERATING & CAPITAL BUDGETS
DEPARTMENT OF POLICE SERVICES
$32,367,372$33,699,068
158,600130,549
00
5,000
15,501
199,793119,62816,415
-10,8514,584
22,520
Contractual ServicesMaterials & SuppliesOther OperatingCasualty & LiabilityMiscellaneous
Other Non Operating
Department Total
18,663,87618,221,024Salaries & Wages3,540,8893,926,672Overtime
$32,057,722$33,346,979Labor Sub-Total
FY09 FY10Categories of Expense
$24,876,636
112,285185,990
2,1910
4,337
15,810
14,780,9562,824,034
$24,556,023
FY06
$27,771,725
197,718216,290
517-18,488
2,659
22,616
16,017,9512,285,339
$27,350,413
FY07Expense Expense Expense Adopted
($1,331,696)$1,220,301$2,895,089-3.95%3.76%11.64%
$ Change from Prior Year% Change from Prior Year
$32,478,767
188,836253,935
0-11,953
3,872
30,982
17,516,0353,719,833
$32,013,095
FY08Expense
$4,707,04216.95%
$309,650$352,089Non Labor Sub-Total $320,613 $421,312 $465,672
9,852,95711,199,283Benefits 6,951,033 9,047,123 10,777,227
Administrative
Clerical
Management
MaintenanceOperator
Professional
Represented
Supervisory
45
0
65
0
0
254
1
5
44
0
62
0
0
251
1
5
Non-Represented 369 362
Part - Time 0 0
Represented 1 1
Full-Time Total 370 363
Contract 0 0
Capital 0 0
Authorized Positions by Class
Administrative Total 364 357
Authorized Positions by Status
Represented Total 1 1
44
0
64
0
0
235
1
5
348
0
1
349
0
0
343
1
37
0
64
0
0
231
1
5
337
0
1
338
0
0
332
1
FY10FY09 FY07FY06 FY10FY09 FY07FY06
Clayton 0 000
383
0
1
384
1
0
FY08
0
50
0
68
0
0
261
1
5
379
1
FY08
258
FY10 OPERATING & CAPITAL BUDGETS
OFFICE OF THE AGM OF POLICE SERVICES FUNCTIONS & RESPONSIBILITIES The Office of the AGM of Police Services is responsible for providing police services to MARTA patrons and all related facilities as well as providing protection and security for all Authority assets. The operation of the Office of the AGM of Police Services is based on accepted law enforcement standards. The Office applies these standards to the needs of the Authority, its patrons, and the community in general, while enforcing the rules of the Authority. This is consistent with the mission and purpose of MARTA. The office of the AGM of Police services is
committed to MARTA’s goal of being a customer focused organization that concentrates on the needs and expectations of existing and potential riders. Using both sworn and non-sworn personnel, the Office provides the Authority, its customers a, and its employees with a full-service police agency dedicated to reducing actual crime and improving the perception of crime on the system, thereby maintaining current riders and attracting new riders to the system.
259
FY10 OPERATING & CAPITAL BUDGETS
OFFICE OF THE AGM OF POLICE SERVICES
FY09 ACCOMPLISHMENTS
Provided training to the Federal, State, County and Municipal Police organizations on Wayside Access (approximately 49 sworn personnel).
Graduated 19 recruits from the MARTA Police Department Filed Training Officer (FTO) Program.
Initiated the MARTA Police Community Outreach Program
Maintained training files to C.A.L.E.A. standard.
Completed the Inaugural Youth Leadership Academy (24 Attendees).
Completed the inaugural Kids-in-Transit Youth Summer Program (30 attendees).
Completed and delivered training on Radiation Detection Pager Certification.
Held Tabletop and Full Scale Exercise at the Georgia Dome with local partners.
Held Homeland Security Exercise and Evaluation Program (HSEEP) training to initiate multi-year exercise program in MARTA with various stakeholders.
Held Tabletop Exercise at the GA Technical Research Institute (GTRI).
Initiated Weapons of Mass Destruction (WMD’S) Contract Award for multi-year exercise program.
Staff attended Transit Security Administration Grant Seminar in Washington D.C. to review National TSGP process.
Staff attended FEMA Grand and Preparedness Review of the last five years in Washington D.C.
Staff attended TSA/FTA Transpiration Security Roundtable in Dallas, TX.
Established Urban Area Security Initiative (UASI) Interoperability Assessment for Interoperable Communications to improve MARTA’s ability to communicate with regional partners.
System Emergency Preparedness Plan (SEPP/SSP Approval (1st Approved Revision since 2005) through GDOT.
Completed CCTV upgrades to Mobile Command Vehicle (MCV)
Initiated Automatic External Defibrillator (AED) Program through the Authority.
Submitted a Pandemic Influenza Preparedness Response Plan for approval
Submitted a Homeland Security Awareness Handbook for approval.
Bus Marshall Program which places plain clothes Officers on target buses has increased Police enforcement on Buses by 20%
There has been a 33% Decrease in Operator physical assaults on the MARTA system.
Completed Police In-Service training without creating additional sessions
Hosted and conducted National Incident Management System (NIMS) required training fro all front-line employees.
Graduated 100% of recruits attending Mandated
Completed Class number 14 of the Citizens Police Academy and graduated 18 citizens.
Graduated Approxamantly 14 Officers for the Fulton County Public Safety Training Center with 440 hours of Law Enforcement Instructions.
Graduated 8 Supervisors for the Peace Officers Standards and Training (POST) Council’s Supervisory Management and Executive courses.
260
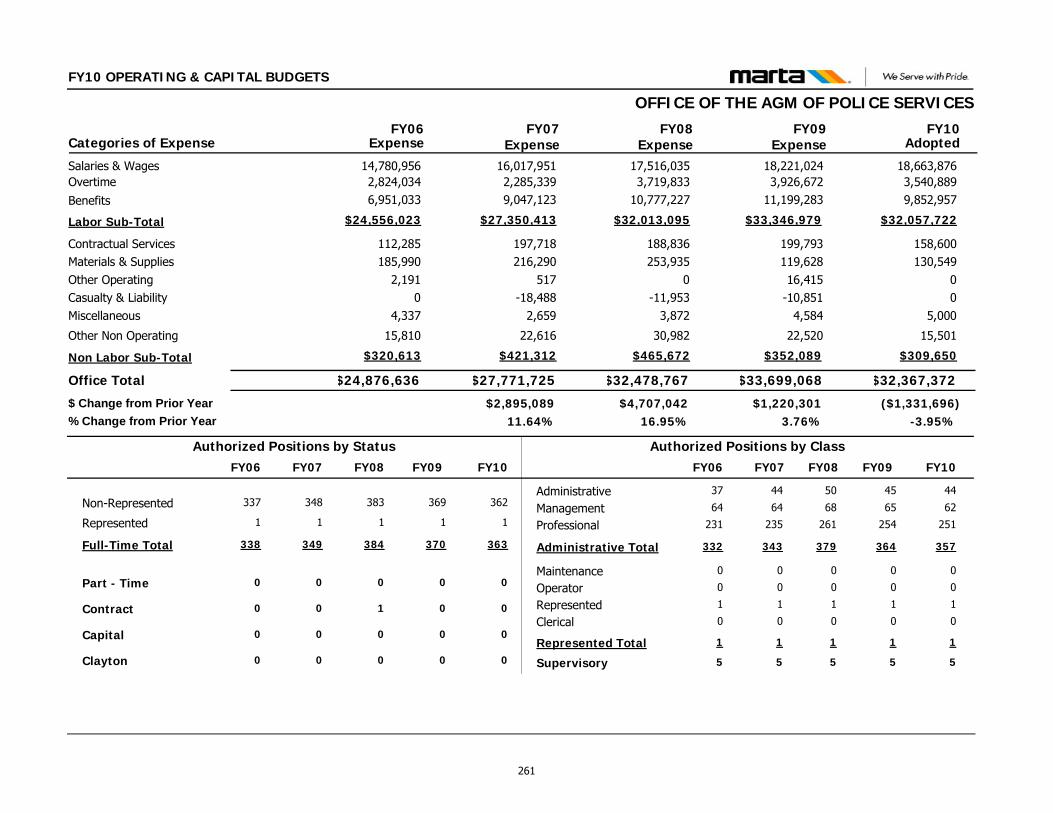
FY10 OPERATING & CAPITAL BUDGETS
OFFICE OF THE AGM OF POLICE SERVICES
$32,367,372$33,699,068
158,600130,549
00
5,000
15,501
199,793119,62816,415
-10,8514,584
22,520
Contractual ServicesMaterials & SuppliesOther OperatingCasualty & LiabilityMiscellaneous
Other Non Operating
Office Total
18,663,87618,221,024Salaries & Wages3,540,8893,926,672Overtime
$32,057,722$33,346,979Labor Sub-Total
FY09 FY10Categories of Expense
$24,876,636
112,285185,990
2,1910
4,337
15,810
14,780,9562,824,034
$24,556,023
FY06
$27,771,725
197,718216,290
517-18,488
2,659
22,616
16,017,9512,285,339
$27,350,413
FY07Expense Expense Expense Adopted
($1,331,696)$1,220,301$2,895,089-3.95%3.76%11.64%
$ Change from Prior Year% Change from Prior Year
$32,478,767
188,836253,935
0-11,953
3,872
30,982
17,516,0353,719,833
$32,013,095
FY08Expense
$4,707,04216.95%
$309,650$352,089Non Labor Sub-Total $320,613 $421,312 $465,672
9,852,95711,199,283Benefits 6,951,033 9,047,123 10,777,227
Administrative
Clerical
Management
MaintenanceOperator
Professional
Represented
Supervisory
45
0
65
0
0
254
1
5
44
0
62
0
0
251
1
5
Non-Represented 369 362
Part - Time 0 0
Represented 1 1
Full-Time Total 370 363
Contract 0 0
Capital 0 0
Authorized Positions by Class
Administrative Total 364 357
Authorized Positions by Status
Represented Total 1 1
44
0
64
0
0
235
1
5
348
0
1
349
0
0
343
1
37
0
64
0
0
231
1
5
337
0
1
338
0
0
332
1
FY10FY09 FY07FY06 FY10FY09 FY07FY06
Clayton 0 000
383
0
1
384
1
0
FY08
0
50
0
68
0
0
261
1
5
379
1
FY08
261
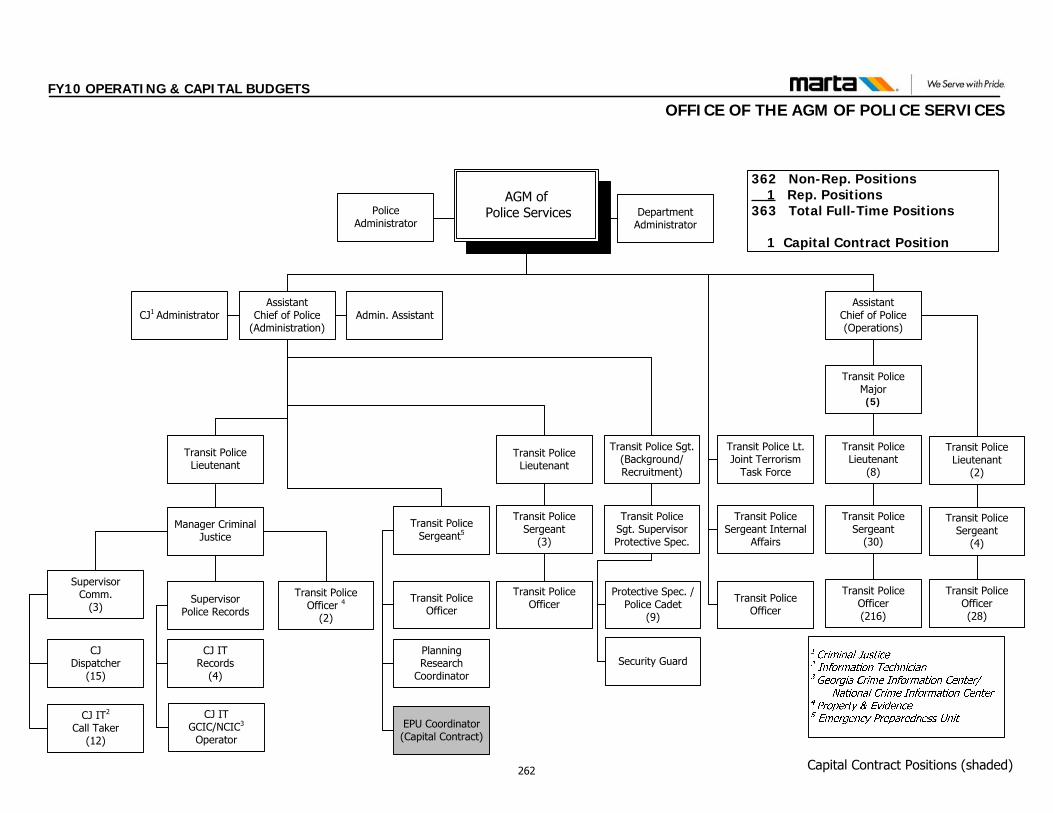
FY10 OPERATING & CAPITAL BUDGETS
OFFICE OF THE AGM OF POLICE SERVICES
362 Non-Rep. Positions 1 Rep. Positions
363 Total Full-Time Positions
1 Capital Contract Position
AGM of Police Services
Transit Police Sergeant Internal
Affairs
Planning Research
Coordinator
Assistant Chief of Police(Operations)
Assistant Chief of Police
(Administration)
Transit Police Major(5)
Transit Police Lieutenant
(8)
Transit Police Sergeant
(30)
Transit Police Officer(216)
CJ1 Administrator Admin. Assistant
Transit Police Sergeant5
Manager Criminal Justice
Supervisor Comm.
(3)Supervisor
Police Records
Transit Police Officer 4
(2)
CJDispatcher
(15)
CJ IT2
Call Taker(12)
CJ ITRecords
(4)
Transit Police Sgt. SupervisorProtective Spec.
Protective Spec. /Police Cadet
(9)
Security Guard
Transit Police Lt. Joint Terrorism
Task Force
Transit Police Officer
CJ IT GCIC/NCIC3
Operator
Department Administrator
Transit Police Lieutenant
Transit Police Sergeant
(3)
Transit Police Sgt. (Background/ Recruitment)
Police Administrator
Transit Police Officer
Transit Police Lieutenant
Transit Police Lieutenant
(2)
Transit PoliceOfficer
Transit Police Sergeant
(4)
Transit Police Officer(28)
EPU Coordinator (Capital Contract)
Capital Contract Positions (shaded)262
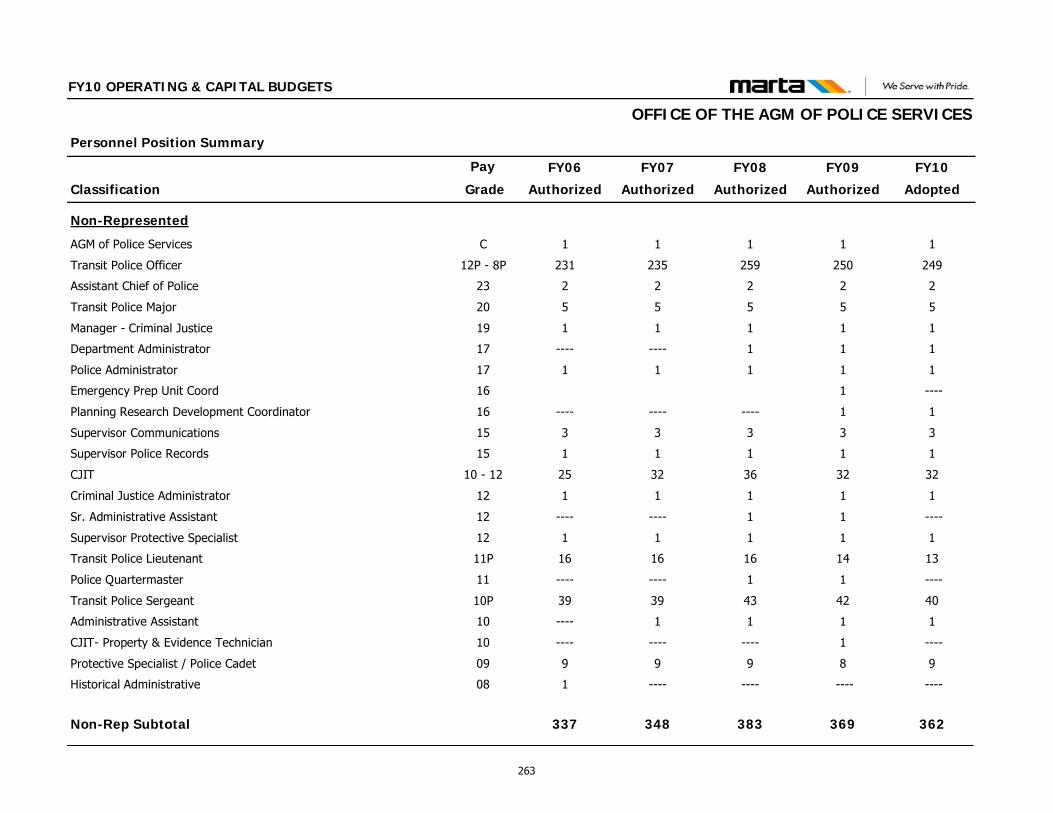
Classification
Personnel Position Summary
Pay FY09
Authorized
FY10
Adopted
FY10 OPERATING & CAPITAL BUDGETS
FY08
Authorized
FY07
Authorized
FY06
Authorized Grade
OFFICE OF THE AGM OF POLICE SERVICES
Non-Represented
AGM of Police Services C 1 1111
Transit Police Officer 12P - 8P 250 249259235231
Assistant Chief of Police 23 2 2222
Transit Police Major 20 5 5555
Manager - Criminal Justice 19 1 1111
Department Administrator 17 1 11--------
Police Administrator 17 1 1111
Emergency Prep Unit Coord 16 1 ----
Planning Research Development Coordinator 16 1 1------------
Supervisor Communications 15 3 3333
Supervisor Police Records 15 1 1111
CJIT 10 - 12 32 32363225
Criminal Justice Administrator 12 1 1111
Sr. Administrative Assistant 12 1 ----1--------
Supervisor Protective Specialist 12 1 1111
Transit Police Lieutenant 11P 14 13161616
Police Quartermaster 11 1 ----1--------
Transit Police Sergeant 10P 42 40433939
Administrative Assistant 10 1 111----
CJIT- Property & Evidence Technician 10 1 ----------------
Protective Specialist / Police Cadet 09 8 9999
Historical Administrative 08 ---- ------------1
Non-Rep Subtotal 369 362383348337
263
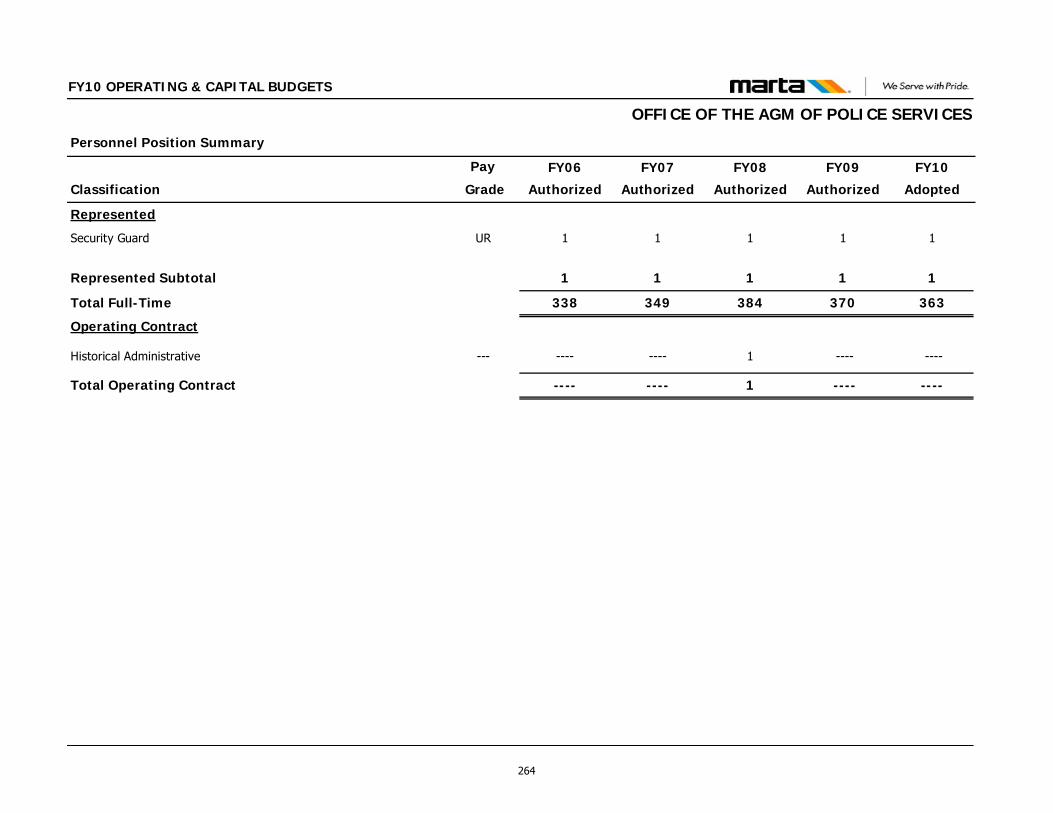
Classification
Personnel Position Summary
Pay FY09
Authorized
FY10
Adopted
FY10 OPERATING & CAPITAL BUDGETS
FY08
Authorized
FY07
Authorized
FY06
Authorized Grade
OFFICE OF THE AGM OF POLICE SERVICES
Represented
Security Guard UR 1 1111
Represented Subtotal 1 1111
Total Full-Time 370 363384349338
Operating Contract
Historical Administrative --- ---- ----1--------
Total Operating Contract ---- ----1--------
264
DIVISION OF BUSINESS SUPPORT SERVICES This Division includes the following Departments: Department of the Chief of Business Support Services
Department of Finance
Department of Contracts & Procurement
Department of Human Resources
Department of Technology
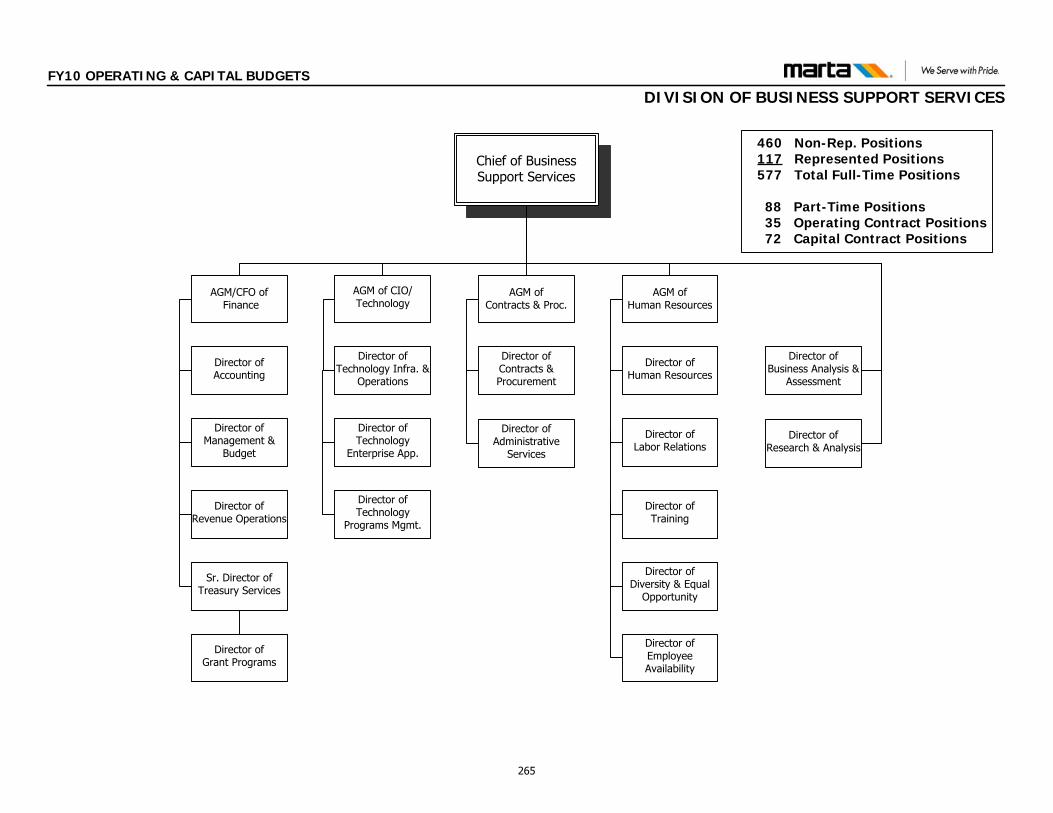
Director of Accounting
Director of Management &
Budget
Director of Revenue Operations
Sr. Director of Treasury Services
Director of Technology Infra. &
Operations
Director of Technology
Enterprise App.
Director of Technology
Programs Mgmt.
Director of Contracts & Procurement
Director of Human Resources
Director of Business Analysis &
Assessment
Director of Administrative
Services
AGM/CFO of Finance
AGM of CIO/ Technology
AGM of Contracts & Proc.
AGM of Human Resources
Director of Research & Analysis
Chief of Business Support Services
Director of Labor Relations
Director of Training
Director of Diversity & Equal
Opportunity
Director of Employee Availability
Director of Grant Programs
FY10 OPERATING & CAPITAL BUDGETS
DIVISION OF BUSINESS SUPPORT SERVICES
460 Non-Rep. Positions117 Represented Positions
577 Total Full-Time Positions
88 Part-Time Positions 35 Operating Contract Positions 72 Capital Contract Positions
265
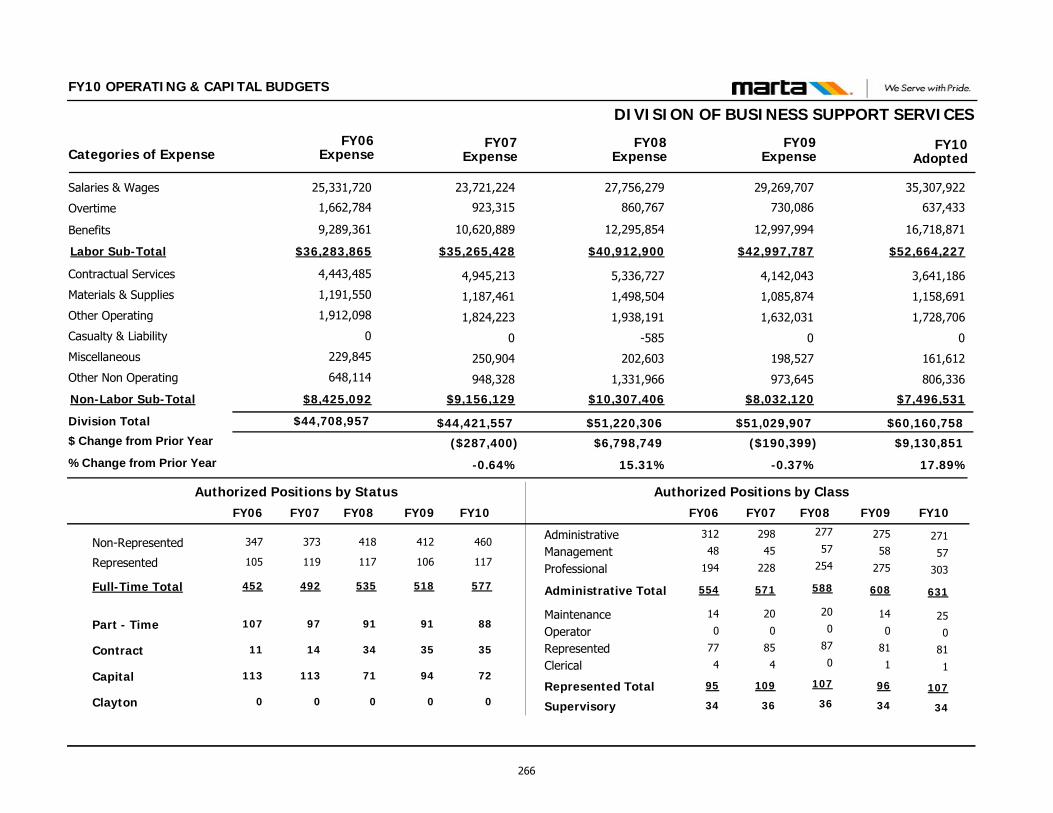
FY10 OPERATING & CAPITAL BUDGETS
DIVISION OF BUSINESS SUPPORT SERVICES
$60,160,758$51,029,907
3,641,186
1,158,691
1,728,706
0
161,612
806,336
4,142,043
1,085,874
1,632,031
0
198,527
973,645
Contractual Services
Materials & Supplies
Other Operating
Casualty & Liability
Miscellaneous
Other Non Operating
Division Total
35,307,92229,269,707Salaries & Wages
637,433730,086Overtime
$52,664,227$42,997,787Labor Sub-Total
FY09 FY10Categories of Expense
$44,708,957
4,443,485
1,191,550
1,912,098
0
229,845
648,114
25,331,720
1,662,784
$36,283,865
FY06
$44,421,557
4,945,213
1,187,461
1,824,223
0
250,904
948,328
23,721,224
923,315
$35,265,428
FY07Expense Expense Expense Adopted
$9,130,851($190,399)($287,400)
17.89%-0.37%-0.64%
$ Change from Prior Year
% Change from Prior Year
$51,220,306
5,336,727
1,498,504
1,938,191
-585
202,603
1,331,966
27,756,279
860,767
$40,912,900
FY08Expense
$6,798,749
15.31%
16,718,87112,997,994Benefits 9,289,361 10,620,889 12,295,854
$7,496,531$8,032,120Non-Labor Sub-Total $8,425,092 $9,156,129 $10,307,406
Administrative
Clerical
Management
MaintenanceOperator
Professional
Represented
Supervisory
277 275
0 1
57 58
20 140 0
254 275
87 81
36 34
271
1
57
25
0
303
81
34
Non-Represented 418 412 460
Part - Time 91 91 88
Represented 117 106 117
Full-Time Total 535 518 577
Contract 34 35 35
Capital 71 94 72
Authorized Positions by Class
Administrative Total 588 608 631
Authorized Positions by Status
Represented Total 107 96 107
298
4
45
20
0
228
85
36
373
97
119
492
14
113
571
109
312
4
48
14
0
194
77
34
347
107
105
452
11
113
554
95
FY09FY08 FY10FY07FY06 FY09FY08 FY10FY07FY06
Clayton 0 0 000
266
DEPARTMENT OF CHIEF OF BUSINESS SUPPORT SERVICES This Department includes the following Offices: Department of Chief of Business Support Services Office of the Chief of Business Support Services Office of Business Analysis & Assessment Office of Research & Analysis
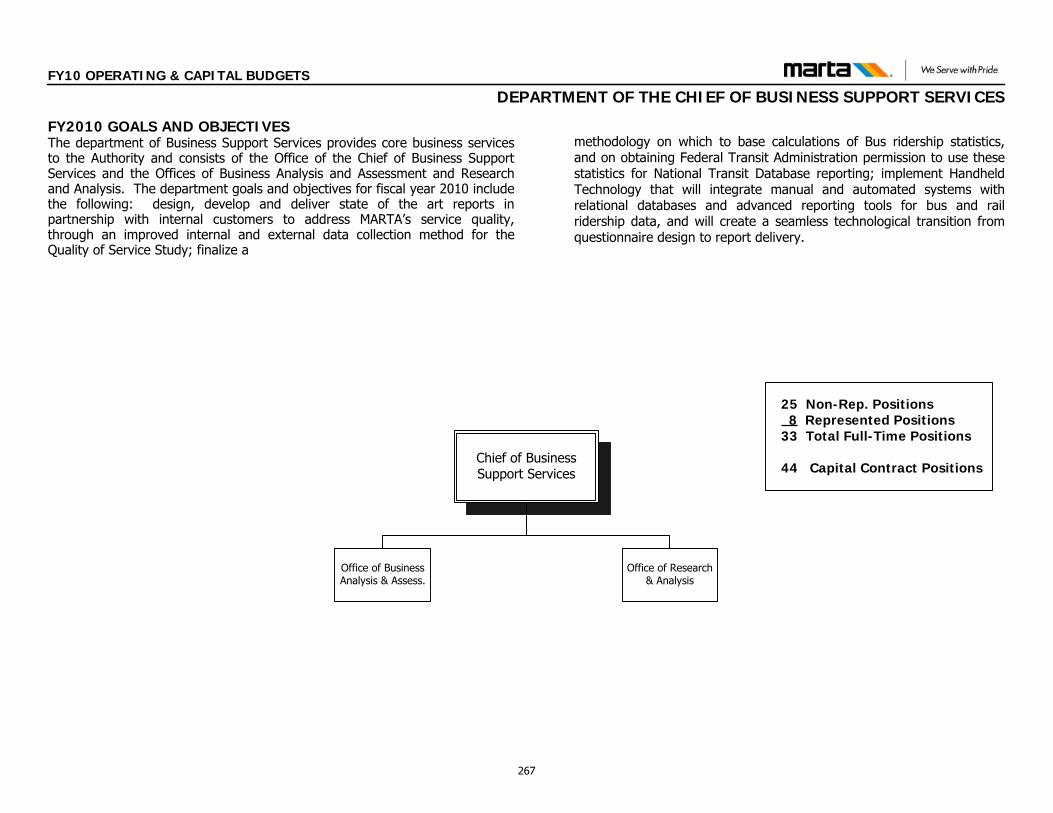
Chief of Business Support Services
Office of Research & Analysis
Office of Business Analysis & Assess.
FY10 OPERATING & CAPITAL BUDGETS
DEPARTMENT OF THE CHIEF OF BUSINESS SUPPORT SERVICES
25 Non-Rep. Positions 8 Represented Positions
33 Total Full-Time Positions
44 Capital Contract Positions
FY2010 GOALS AND OBJECTIVESThe department of Business Support Services provides core business services to the Authority and consists of the Office of the Chief of Business Support Services and the Offices of Business Analysis and Assessment and Research and Analysis. The department goals and objectives for fiscal year 2010 include the following: design, develop and deliver state of the art reports in partnership with internal customers to address MARTA’s service quality, through an improved internal and external data collection method for the Quality of Service Study; finalize a
methodology on which to base calculations of Bus ridership statistics, and on obtaining Federal Transit Administration permission to use these statistics for National Transit Database reporting; implement Handheld Technology that will integrate manual and automated systems with relational databases and advanced reporting tools for bus and rail ridership data, and will create a seamless technological transition from questionnaire design to report delivery.
267

FY10 OPERATING & CAPITAL BUDGETS
DEPARTMENT OF THE CHIEF OF BUSINESS SUPPORT SERVICES
$3,194,680$2,798,457
03,840
000
19,710
3584,042
000
33,121
Contractual ServicesMaterials & SuppliesOther OperatingCasualty & LiabilityMiscellaneous
Other Non Operating
Department Total
2,018,3561,941,842Salaries & Wages136,92696,777Overtime
$3,171,130$2,760,936Labor Sub-Total
FY09 FY10Categories of Expense
$1,908,675
39,26910,041
000
73,051
1,240,67196,716
$1,786,314
FY06
$1,654,876
04,043
000
32,552
1,055,02496,732
$1,618,281
FY07Expense Expense Expense Adopted
$396,223$741,846($253,799)14.16%36.07%-13.30%
$ Change from Prior Year% Change from Prior Year
$2,056,611
03,800
000
29,416
1,324,021113,537
$2,023,395
FY08Expense
$401,73524.28%
$23,550$37,521Non Labor Sub-Total $122,361 $36,595 $33,216
1,015,848722,317Benefits 448,927 466,525 585,837
Administrative
Clerical
Management
MaintenanceOperator
Professional
Represented
Supervisory
47
0
8
0
0
12
8
1
47
0
7
0
0
14
8
1
Non-Represented 24 25
Part - Time 0 0
Represented 8 8
Full-Time Total 32 33
Contract 0 0
Capital 44 44
Authorized Positions by Class
Administrative Total 67 68
Authorized Positions by Status
Represented Total 8 8
91
0
4
0
0
11
8
1
19
0
8
27
0
88
106
8
90
0
3
0
0
12
8
0
17
0
8
25
0
88
105
8
FY10FY09 FY07FY06 FY10FY09 FY07FY06
Clayton 0 000
22
0
8
30
0
44
FY08
0
48
0
7
0
0
10
8
1
65
8
FY08
268
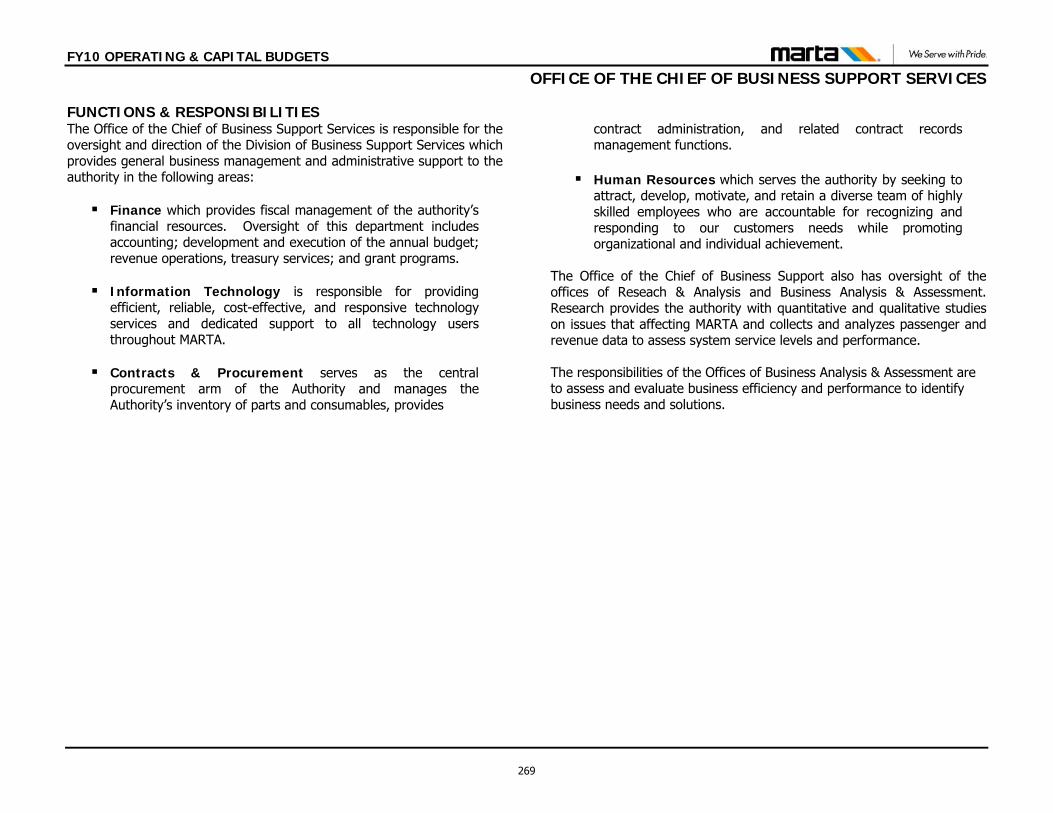
FY10 OPERATING & CAPITAL BUDGETS
OFFICE OF THE CHIEF OF BUSINESS SUPPORT SERVICES FUNCTIONS & RESPONSIBILITIES The Office of the Chief of Business Support Services is responsible for the oversight and direction of the Division of Business Support Services which provides general business management and administrative support to the authority in the following areas: Finance which provides fiscal management of the authority’s
financial resources. Oversight of this department includes accounting; development and execution of the annual budget; revenue operations, treasury services; and grant programs.
Information Technology is responsible for providing
efficient, reliable, cost-effective, and responsive technology services and dedicated support to all technology users throughout MARTA.
Contracts & Procurement serves as the central
procurement arm of the Authority and manages the Authority’s inventory of parts and consumables, provides
contract administration, and related contract records management functions.
Human Resources which serves the authority by seeking to
attract, develop, motivate, and retain a diverse team of highly skilled employees who are accountable for recognizing and responding to our customers needs while promoting organizational and individual achievement.
The Office of the Chief of Business Support also has oversight of the offices of Reseach & Analysis and Business Analysis & Assessment. Research provides the authority with quantitative and qualitative studies on issues that affecting MARTA and collects and analyzes passenger and revenue data to assess system service levels and performance. The responsibilities of the Offices of Business Analysis & Assessment are to assess and evaluate business efficiency and performance to identify business needs and solutions.
269
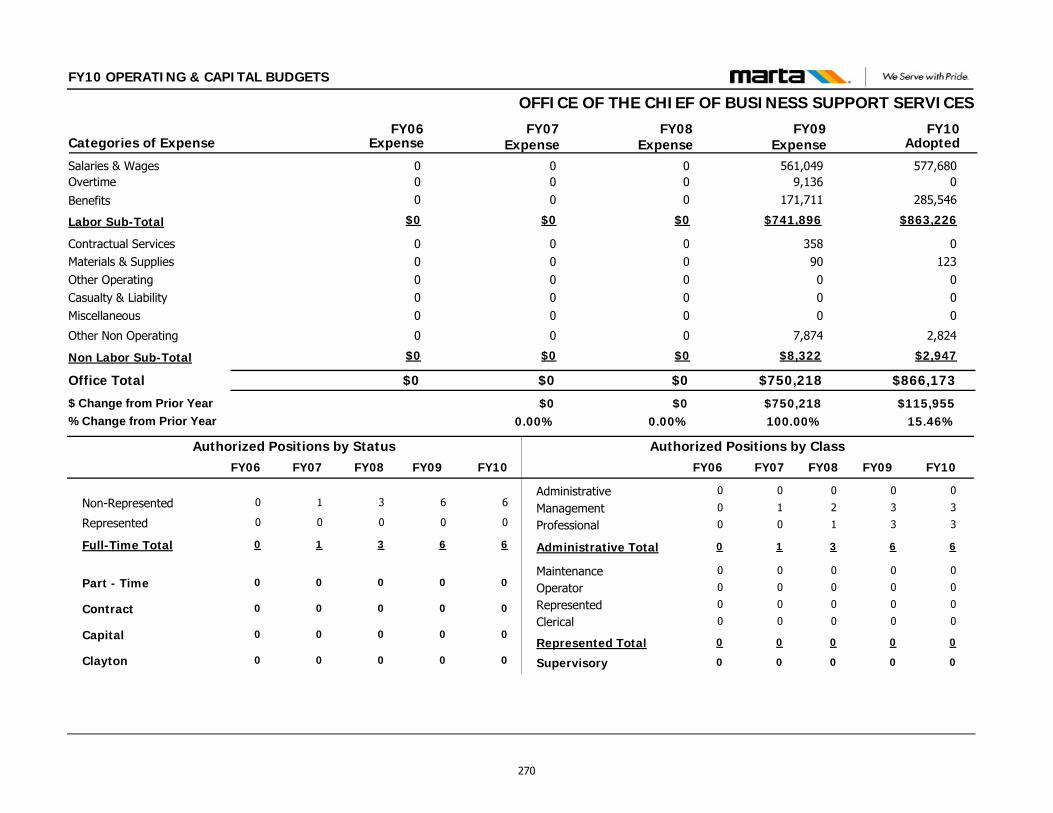
FY10 OPERATING & CAPITAL BUDGETS
OFFICE OF THE CHIEF OF BUSINESS SUPPORT SERVICES
$866,173$750,218
0123
000
2,824
35890000
7,874
Contractual ServicesMaterials & SuppliesOther OperatingCasualty & LiabilityMiscellaneous
Other Non Operating
Office Total
577,680561,049Salaries & Wages09,136Overtime
$863,226$741,896Labor Sub-Total
FY09 FY10Categories of Expense
$0
00000
0
00
$0
FY06
$0
00000
0
00
$0
FY07Expense Expense Expense Adopted
$115,955$750,218$015.46%100.00%0.00%
$ Change from Prior Year% Change from Prior Year
$0
00000
0
00
$0
FY08Expense
$00.00%
$2,947$8,322Non Labor Sub-Total $0 $0 $0
285,546171,711Benefits 0 0 0
Administrative
Clerical
Management
MaintenanceOperator
Professional
Represented
Supervisory
0
0
3
0
0
3
0
0
0
0
3
0
0
3
0
0
Non-Represented 6 6
Part - Time 0 0
Represented 0 0
Full-Time Total 6 6
Contract 0 0
Capital 0 0
Authorized Positions by Class
Administrative Total 6 6
Authorized Positions by Status
Represented Total 0 0
0
0
1
0
0
0
0
0
1
0
0
1
0
0
1
0
0
0
0
0
0
0
0
0
0
0
0
0
0
0
0
0
FY10FY09 FY07FY06 FY10FY09 FY07FY06
Clayton 0 000
3
0
0
3
0
0
FY08
0
0
0
2
0
0
1
0
0
3
0
FY08
270
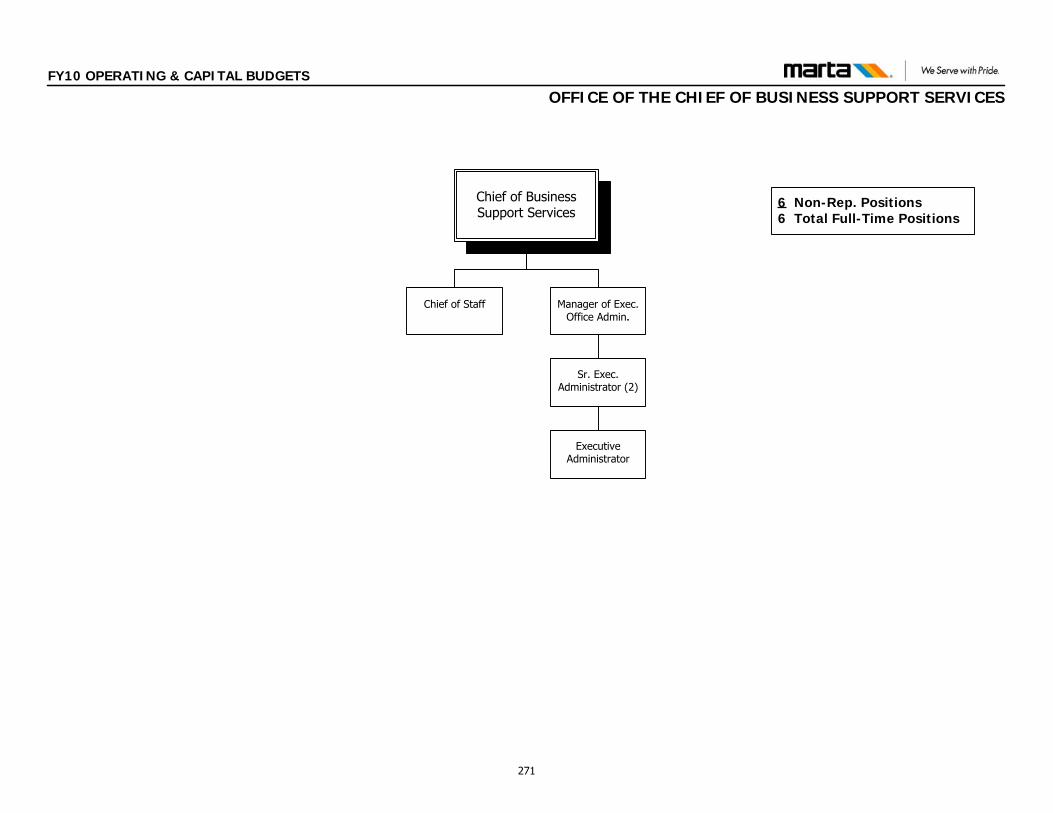
Chief of Business Support Services
6 Non-Rep. Positions6 Total Full-Time Positions
Chief of Staff Manager of Exec. Office Admin.
Sr. Exec. Administrator (2)
Executive Administrator
FY10 OPERATING & CAPITAL BUDGETS
OFFICE OF THE CHIEF OF BUSINESS SUPPORT SERVICES
271
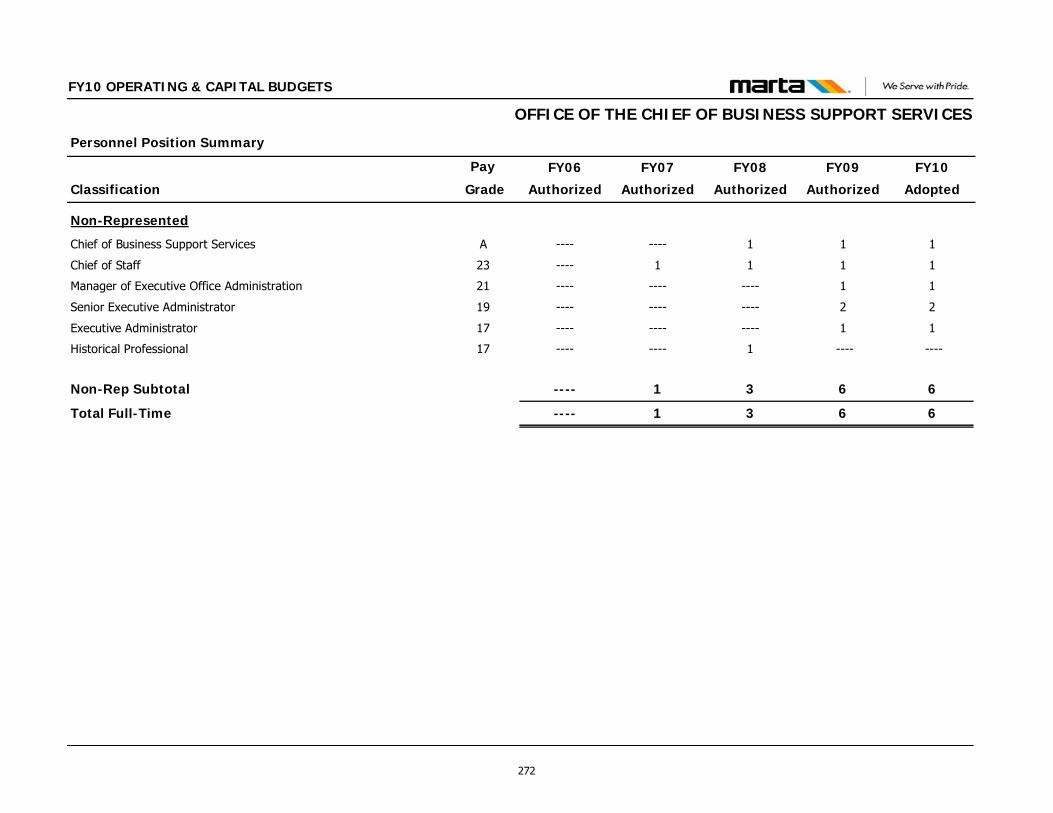
Classification
Personnel Position Summary
Pay FY09
Authorized
FY10
Adopted
FY10 OPERATING & CAPITAL BUDGETS
FY08
Authorized
FY07
Authorized
FY06
Authorized Grade
OFFICE OF THE CHIEF OF BUSINESS SUPPORT SERVICES
Non-Represented
Chief of Business Support Services A 1 11--------
Chief of Staff 23 1 111----
Manager of Executive Office Administration 21 1 1------------
Senior Executive Administrator 19 2 2------------
Executive Administrator 17 1 1------------
Historical Professional 17 ---- ----1--------
Non-Rep Subtotal 6 631----
Total Full-Time 6 631----
272
FY10 OPERATING & CAPITAL BUDGETS
OFFICE OF BUSINESS ANALYSIS & ASSESSMENT FUNCTIONS & RESPONSIBILITIES The functions and responsibilities of the Office of Business Analysis and Assessment are to assess and evaluate business efficiency and performance and identify business needs and determine solutions to business problems. This office will focus on the following authority-wide objectives: reducing waste; creating solutions; completing projects on time; improving efficiency; and documenting requirements.
Functions and responsibilities also include usage of the following methodologies: process mapping and reengineering best practices benchmarking metric driver identification and improvement continuous process improvement cycles SWOT analysis
273

FY10 OPERATING & CAPITAL BUDGETS
OFFICE OF BUSINESS ANALYSIS & ASSESSMENT
$140,539$0
00000
0
00000
0
Contractual ServicesMaterials & SuppliesOther OperatingCasualty & LiabilityMiscellaneous
Other Non Operating
Office Total
94,0240Salaries & Wages00Overtime
$140,539$0Labor Sub-Total
FY09 FY10Categories of Expense
$0
00000
0
00
$0
FY06
$0
00000
0
00
$0
FY07Expense Expense Expense Adopted
$140,539$0$0100.00%0.00%0.00%
$ Change from Prior Year% Change from Prior Year
$0
00000
0
00
$0
FY08Expense
$00.00%
$0$0Non Labor Sub-Total $0 $0 $0
46,5140Benefits 0 0 0
Administrative
Clerical
Management
MaintenanceOperator
Professional
Represented
Supervisory
0
0
1
0
0
0
0
0
0
0
1
0
0
0
0
0
Non-Represented 1 1
Part - Time 0 0
Represented 0 0
Full-Time Total 1 1
Contract 0 0
Capital 0 0
Authorized Positions by Class
Administrative Total 1 1
Authorized Positions by Status
Represented Total 0 0
0
0
0
0
0
0
0
0
0
0
0
0
0
0
0
0
0
0
0
0
0
0
0
0
0
0
0
0
0
0
0
0
FY10FY09 FY07FY06 FY10FY09 FY07FY06
Clayton 0 000
1
0
0
1
0
0
FY08
0
0
0
1
0
0
0
0
0
1
0
FY08
274
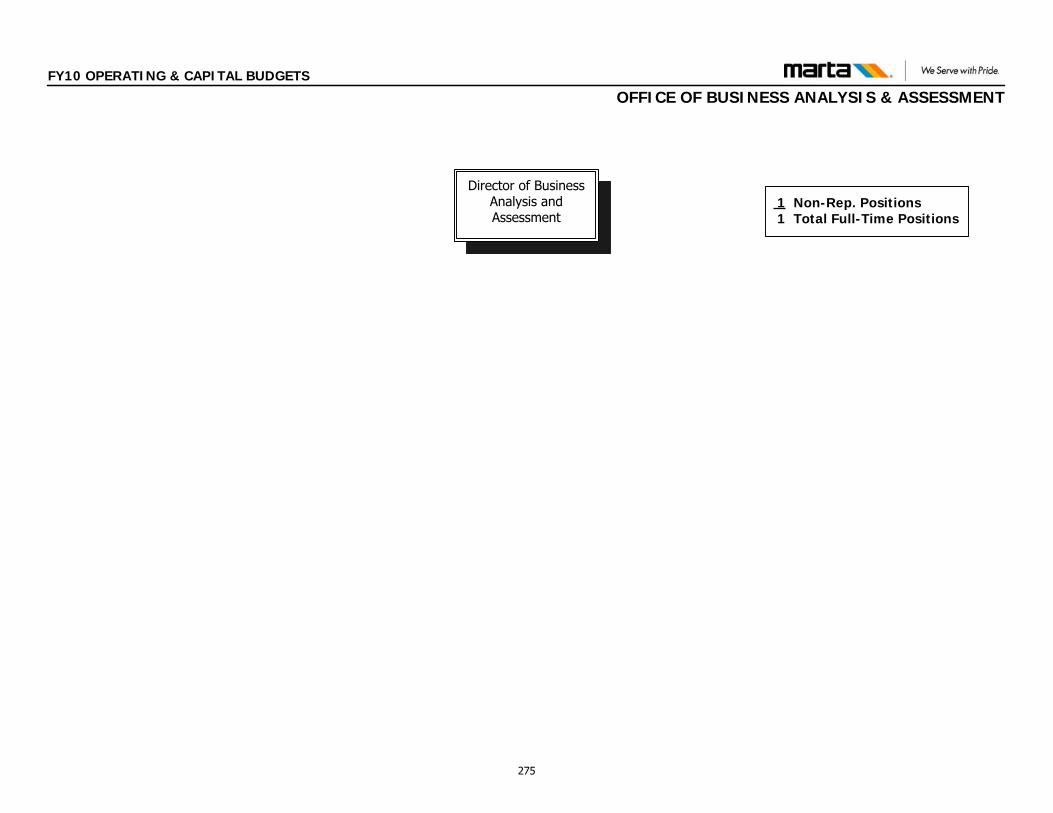
Director of Business Analysis and Assessment
1 Non-Rep. Positions 1 Total Full-Time Positions
FY10 OPERATING & CAPITAL BUDGETS
OFFICE OF BUSINESS ANALYSIS & ASSESSMENT
275

Classification
Personnel Position Summary
Pay FY09
Authorized
FY10
Adopted
FY10 OPERATING & CAPITAL BUDGETS
FY08
Authorized
FY07
Authorized
FY06
Authorized Grade
OFFICE OF BUSINESS ANALYSIS & ASSESSMENT
Non-Represented
Director of Business Analysis & Assessment 23 1 11--------
Non-Rep Subtotal 1 11 --------
Total Full-Time 1 11--------
276
FY10 OPERATING & CAPITAL BUDGETS
OFFICE OF RESEARCH & ANALYSIS
FUNCTIONS & RESPONSIBILITIES The Office of Research & Analysis (R&A) is comprised of the units of Transit Research, Transit Analysis and Service Monitoring. The Office is responsible for conducting quantitative and qualitative studies on issues that affect all aspects of the transit experience. R&A also collects and analyzes passenger and revenue data to assess system service levels and performance. Since 1985, the Transit Research Unit has captured system usage, customer demographics and feedback, while tracking industry standards data for the evaluation of service delivery. Transit Research provides actionable information to assist in decision-making and effective stewardship of resources. The Quality of Service, System wide Factors, and Breeze Fare Collection System studios provide continuous assessment of internal performance and external environmental factors, including customer feedback and service delivery levels. The unit also conducts a number of ad hoc studies to assess the impact of dynamic agents such as car ownership, high gas prices, and sensitivity to environmental concerns. Transit Research assists other MARTA departments in discerning best practices in the transit industry by conducting peer studies on various timely subjects. The primary function of the Transit Analysis Unit is to collect data and perform calculations on a monthly basis in support of mandated reporting to the Federal Transit Administration’s National Transit Database. This includes the production of statistics on the quantity of service that MARTA provides to its customers based on miles and hours. The quantity of service MARTA’s customers consume, measured by passenger trips and revenue, is also produced by Transit Analysis. These statistics help determine MARTA’s federal funding, and support various performance measures required by the strategic plan. Transit Analysis is tasked with analyzing historical data in order to forecast future MARTA passenger revenue and ridership for budget purposes. These analyses may include the evaluation of proposed changes in the fare structure and service levels. Transit Analysis also tracks trends in the data produced by the Automatic Vehicle Locators/ Automatic Passenger Counters and Breeze Automated Fare Collection automated reporting systems, for the purpose of System Health Monitoring.
The unit also performs standard and ad hoc analyses of these systems’ data for the purpose of responding to internal and external data requests. The Service Monitoring Unit collects, analyzes and reports system wide MARTA bus/ rail ridership data and Clayton County bus ridership data. Service Monitoring utilizes output from Intelligent Transportation System technology. Technology includes Continental and UTA AVL and the APC systems to evaluate and track route performance, service level ridership and on-time performance. In addition, the unit evaluates ridership and fare payment methods along with data parameters associated with the new AFC. Additionally, Service Monitoring analyzes and reports MARTA & Clayton County NTD-Bus Mode reports, Title VI Assessments, special events activity, reciprocal ridership, rail line-load and load factor analysis, automated systems validation and system wide parking by tag registration. Special projects conducted by this branch include validation/diagnostic studies that confirm the accuracy of new APC and AVL technology. FY09 ACCOMPLISHMENTS National Transit Database Reporting: Successfully completed
external audit of processes and entry of all required ridership and service level data ahead of schedule, as well as addressed all resulting “issues” for RY 2008 annual reporting. Also reported monthly ridership and service level statistics, as required.
Automatic Vehicle Location / Automatic Passenger Counter System: Partnered with Bryan Nace and Rob Bradford to produce a methodology for calculating Bus ridership statistics based on AVL/APC data (replacing current Passenger-Revenue Model procedures), to be submitted to FTA for approval for use in FY 2010 National Transit Database reporting. Partnered with Bryan Nace, Rob Bradford, MARTA Operations, and other interested parties, to institute an AVL/APC System Health Monitoring Team that will routinely examine system Key Performance Indicators with the purpose of maximizing system sustainability (to be fully implemented in FY 2010).
277
FY10 OPERATING & CAPITAL BUDGETS
OFFICE OF RESEARCH & ANALYSIS
Briefing Papers in Support of Proposed FY 2010 Fare and Parking Fee Changes: Assisted with preparation of these briefing papers, contributing especially to sections on Fare Change Scenarios and Title VI Assessment.
Breeze Queuing Study: Provided information regarding how
MARTA riders use their fare payments on the bus as well as the duration of each fare payment transaction. Scheduling can make use of this information to design more realistic schedules for the bus.
Handheld Device Software: Procurement of Handheld software technology is in progress. RFP process is in place and review and scoring of vendor’s quotes are being submitted.
Proof of Performance Continental System Validation: Completed Continental System PoP validation for routes from each garage thru manual data collection, Continental APC data and UTA APC
data. Conducted audit of data with Vendor, and forwarded validation results to management, vendor and stakeholders.
Clayton County System Ridership Analysis: Conducted full-service manual data collection for Clayton County routes – weekday, Saturday and Sunday for AECOM Consultants. Performed detailed ridership, maximum load by time-period and on-time performance analysis with special emphasis on overcrowding conditions.
Monthly Tracking – Station Entries: Average station entries tracking are complete and reported thru June for fiscal and calendar year 2009 weekday, Saturday and Sunday. Additionally, graphics by station are provided thru June 2009.
AVA Bus Announcement Validation: Created, associated, and validated all 2230+ designated ADA bus announcements in compliance with ADA and FTA guidelines, as well as, developed standard operating procedures for maintaining and sustaining the AVA of the bus announcements.
278
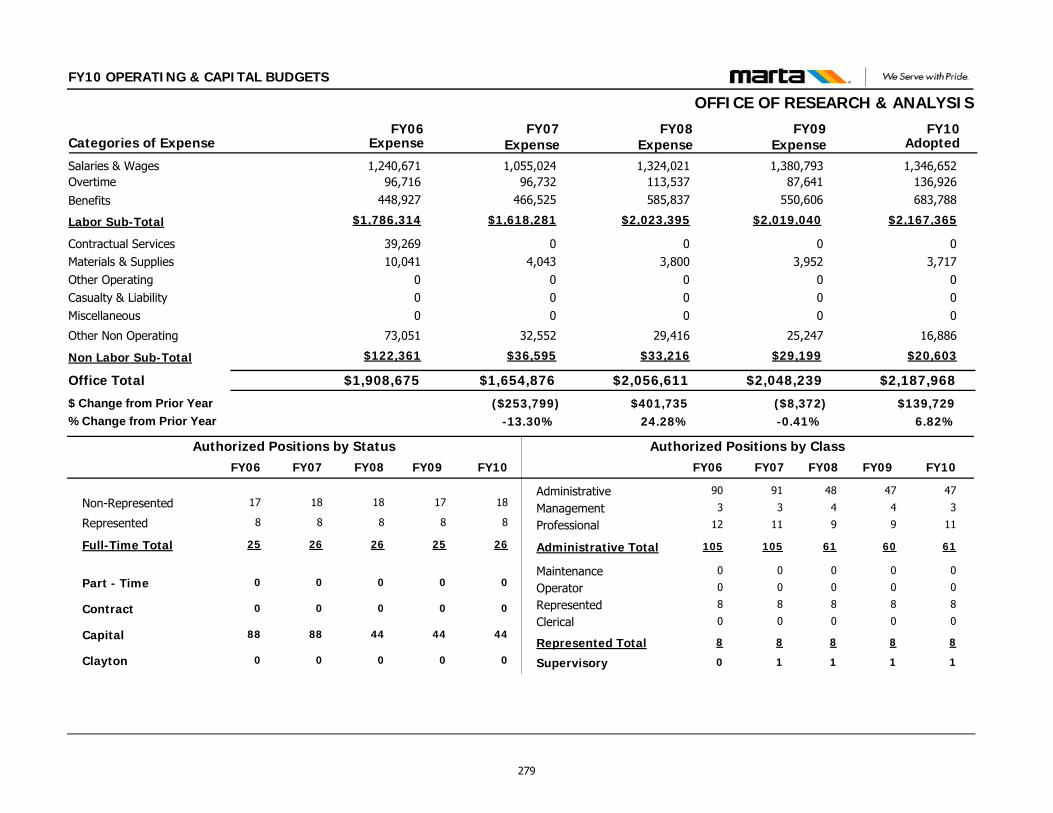
FY10 OPERATING & CAPITAL BUDGETS
OFFICE OF RESEARCH & ANALYSIS
$2,187,968$2,048,239
03,717
000
16,886
03,952
000
25,247
Contractual ServicesMaterials & SuppliesOther OperatingCasualty & LiabilityMiscellaneous
Other Non Operating
Office Total
1,346,6521,380,793Salaries & Wages136,92687,641Overtime
$2,167,365$2,019,040Labor Sub-Total
FY09 FY10Categories of Expense
$1,908,675
39,26910,041
000
73,051
1,240,67196,716
$1,786,314
FY06
$1,654,876
04,043
000
32,552
1,055,02496,732
$1,618,281
FY07Expense Expense Expense Adopted
$139,729($8,372)($253,799)6.82%-0.41%-13.30%
$ Change from Prior Year% Change from Prior Year
$2,056,611
03,800
000
29,416
1,324,021113,537
$2,023,395
FY08Expense
$401,73524.28%
$20,603$29,199Non Labor Sub-Total $122,361 $36,595 $33,216
683,788550,606Benefits 448,927 466,525 585,837
Administrative
Clerical
Management
MaintenanceOperator
Professional
Represented
Supervisory
47
0
4
0
0
9
8
1
47
0
3
0
0
11
8
1
Non-Represented 17 18
Part - Time 0 0
Represented 8 8
Full-Time Total 25 26
Contract 0 0
Capital 44 44
Authorized Positions by Class
Administrative Total 60 61
Authorized Positions by Status
Represented Total 8 8
91
0
3
0
0
11
8
1
18
0
8
26
0
88
105
8
90
0
3
0
0
12
8
0
17
0
8
25
0
88
105
8
FY10FY09 FY07FY06 FY10FY09 FY07FY06
Clayton 0 000
18
0
8
26
0
44
FY08
0
48
0
4
0
0
9
8
1
61
8
FY08
279
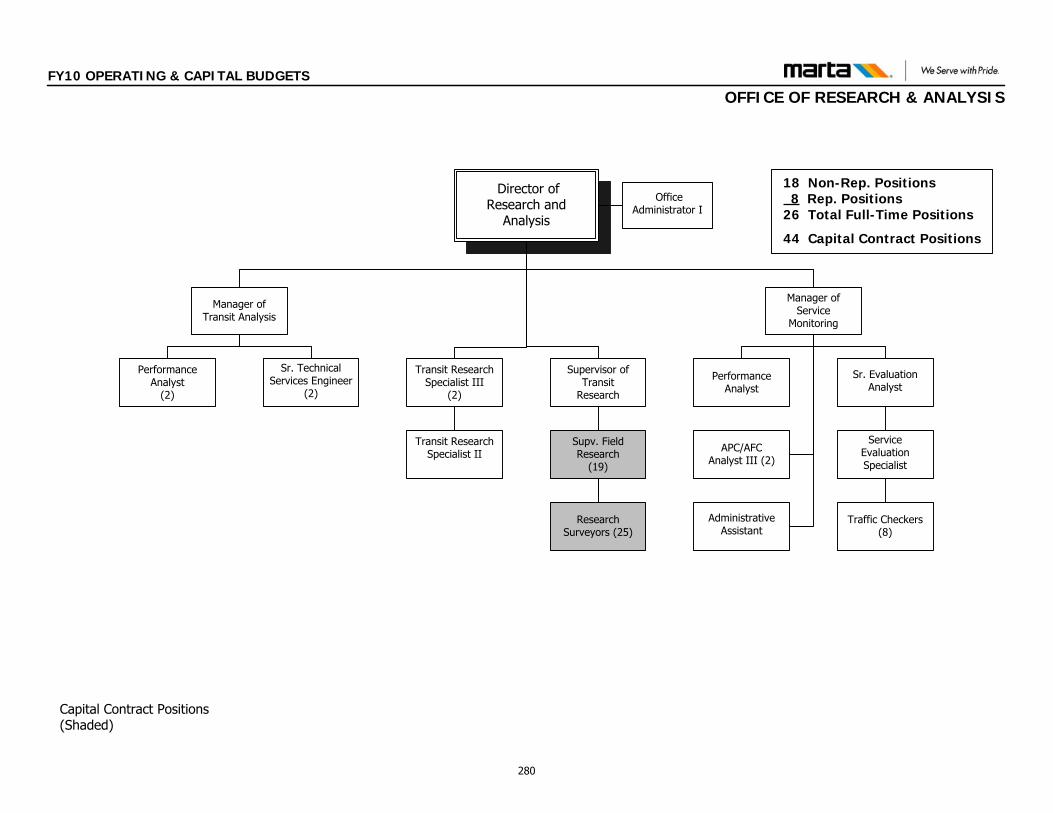
18 Non-Rep. Positions 8 Rep. Positions
26 Total Full-Time Positions
44 Capital Contract Positions
Capital Contract Positions (Shaded)
Director of Research and
Analysis
Manager of Service
Monitoring
Transit Research Specialist III
(2)
Transit Research Specialist II
Sr. Evaluation Analyst
Traffic Checkers(8)
APC/AFC Analyst III (2)
Service Evaluation Specialist
PerformanceAnalyst
(2)
Office Administrator I
Supervisor of Transit
Research
Supv. Field Research
(19)
ResearchSurveyors (25)
Manager of Transit Analysis
Administrative Assistant
PerformanceAnalyst
Sr. Technical Services Engineer
(2)
FY10 OPERATING & CAPITAL BUDGETS
OFFICE OF RESEARCH & ANALYSIS
280
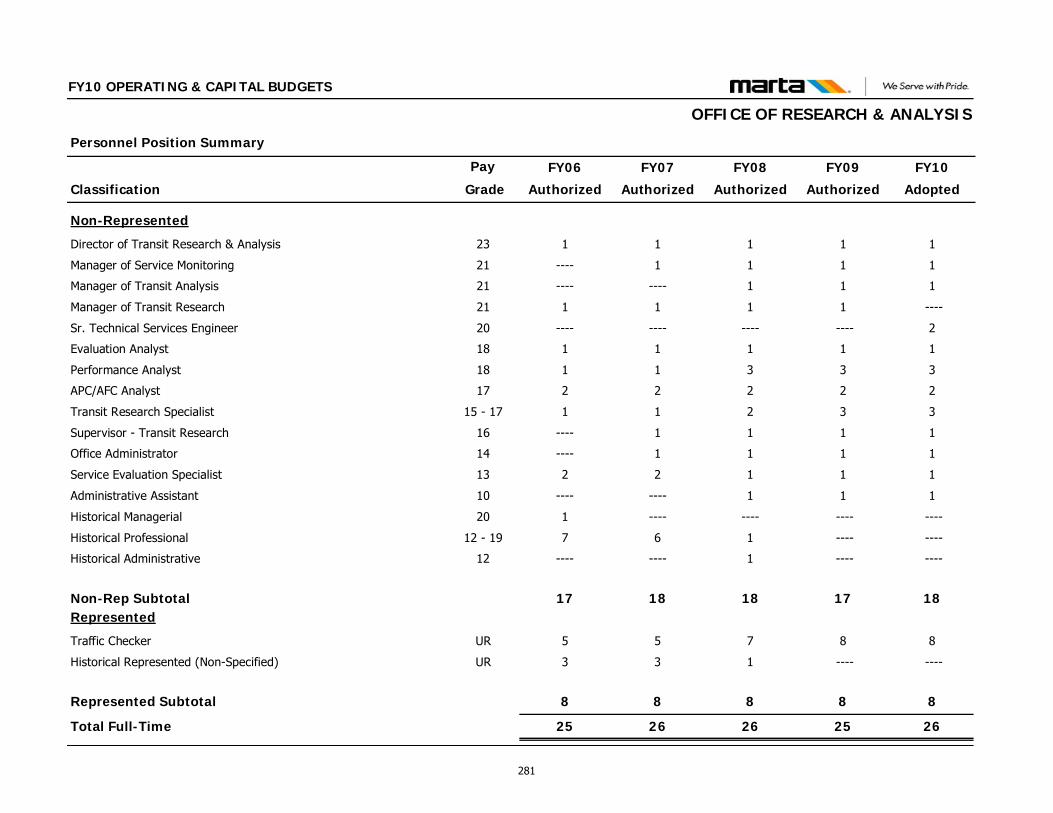
Classification
Personnel Position Summary
Pay FY09
Authorized
FY10
Adopted
FY10 OPERATING & CAPITAL BUDGETS
FY08
Authorized
FY07
Authorized
FY06
Authorized Grade
OFFICE OF RESEARCH & ANALYSIS
Non-Represented
Director of Transit Research & Analysis 23 1 1111
Manager of Service Monitoring 21 1 111----
Manager of Transit Analysis 21 1 11--------
Manager of Transit Research 21 1 ----111
Sr. Technical Services Engineer 20 ---- 2------------
Evaluation Analyst 18 1 1111
Performance Analyst 18 3 3311
APC/AFC Analyst 17 2 2222
Transit Research Specialist 15 - 17 3 3211
Supervisor - Transit Research 16 1 111----
Office Administrator 14 1 111----
Service Evaluation Specialist 13 1 1122
Administrative Assistant 10 1 11--------
Historical Managerial 20 ---- ------------1
Historical Professional 12 - 19 ---- ----167
Historical Administrative 12 ---- ----1--------
Non-Rep Subtotal 17 18181817Represented
Traffic Checker UR 8 8755
Historical Represented (Non-Specified) UR ---- ----133
Represented Subtotal 8 8888
Total Full-Time 25 26262625
281
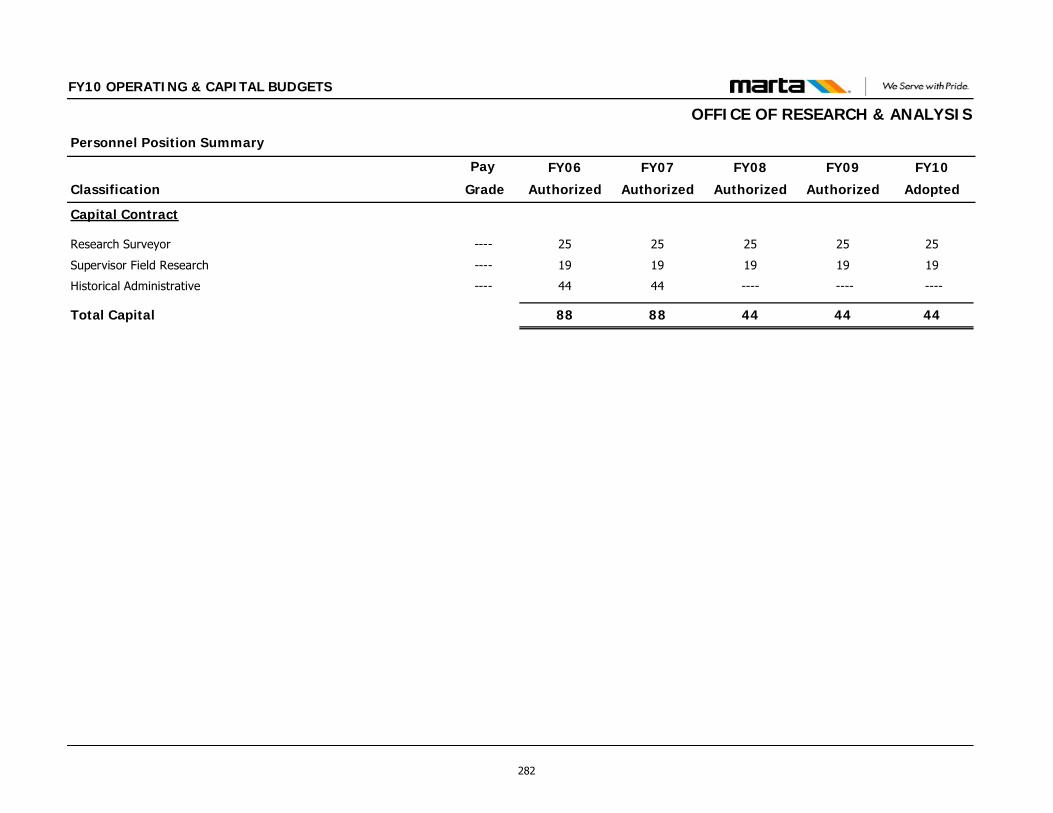
Classification
Personnel Position Summary
Pay FY09
Authorized
FY10
Adopted
FY10 OPERATING & CAPITAL BUDGETS
FY08
Authorized
FY07
Authorized
FY06
Authorized Grade
OFFICE OF RESEARCH & ANALYSIS
Capital Contract
Research Surveyor ---- 25 25252525
Supervisor Field Research ---- 19 19191919
Historical Administrative ---- ---- --------4444
Total Capital 44 44448888
282
DEPARTMENT OF FINANCE This Department includes the following Offices: Department of Finance Office of the AGM of Finance Office of Accounting Office of Management & Budget Office of Revenue Operations Office of Treasury Services Office of Federal & State Programs
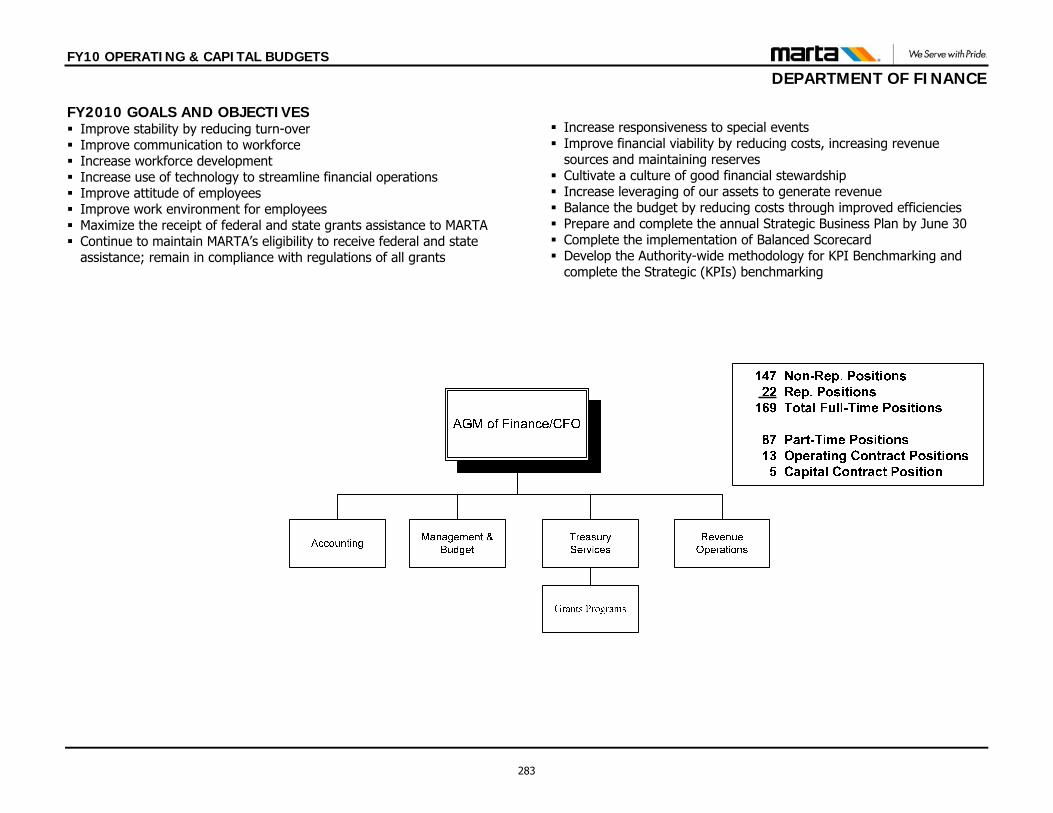
FY10 OPERATING & CAPITAL BUDGETS
DEPARTMENT OF FINANCE
FY2010 GOALS AND OBJECTIVES Improve stability by reducing turn-over Improve communication to workforce Increase workforce development Increase use of technology to streamline financial operations Improve attitude of employees Improve work environment for employees Maximize the receipt of federal and state grants assistance to MARTA Continue to maintain MARTA’s eligibility to receive federal and state
assistance; remain in compliance with regulations of all grants
Increase responsiveness to special events Improve financial viability by reducing costs, increasing revenue
sources and maintaining reserves Cultivate a culture of good financial stewardship Increase leveraging of our assets to generate revenue Balance the budget by reducing costs through improved efficiencies Prepare and complete the annual Strategic Business Plan by June 30 Complete the implementation of Balanced Scorecard Develop the Authority-wide methodology for KPI Benchmarking and
complete the Strategic (KPIs) benchmarking
283
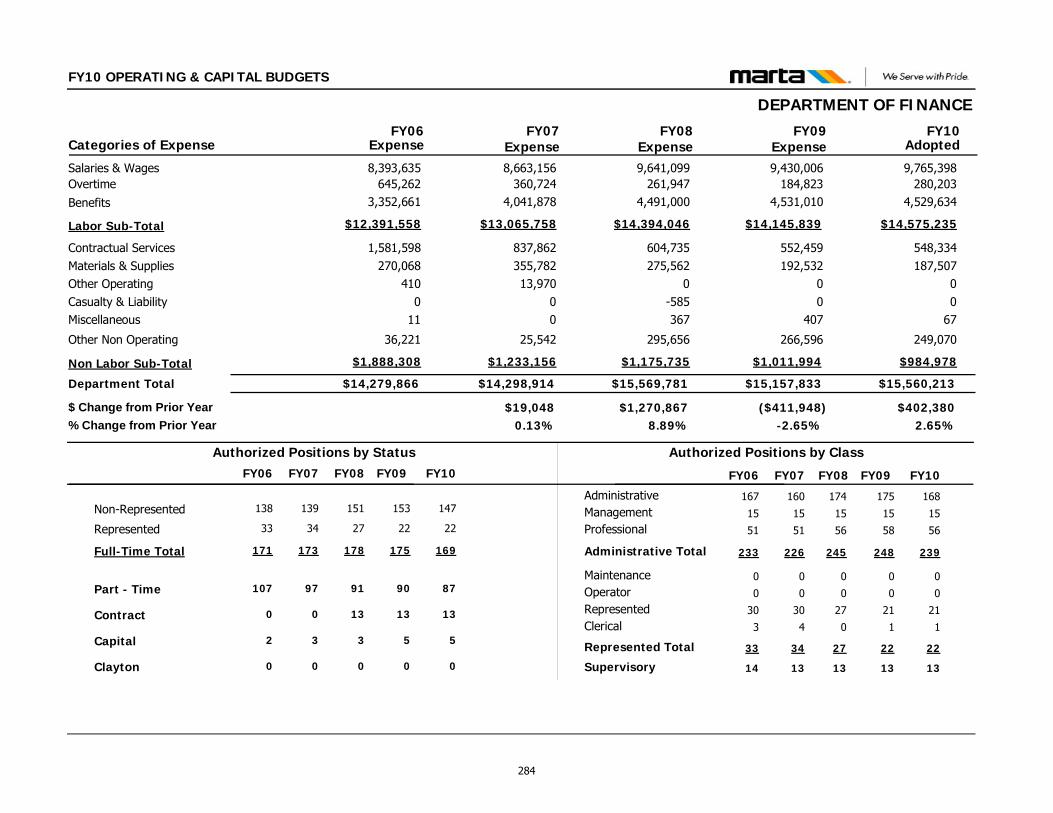
FY10 OPERATING & CAPITAL BUDGETS
DEPARTMENT OF FINANCE
$15,560,213$15,157,833
548,334187,507
00
67
249,070
552,459192,532
00
407
266,596
Contractual ServicesMaterials & SuppliesOther OperatingCasualty & LiabilityMiscellaneous
Other Non Operating
Department Total
9,765,3989,430,006Salaries & Wages280,203184,823Overtime
$14,575,235$14,145,839Labor Sub-Total
FY09 FY10Categories of Expense
$14,279,866
1,581,598270,068
4100
11
36,221
8,393,635645,262
$12,391,558
FY06
$14,298,914
837,862355,78213,970
00
25,542
8,663,156360,724
$13,065,758
FY07Expense Expense Expense Adopted
$402,380($411,948)$19,0482.65%-2.65%0.13%
$ Change from Prior Year% Change from Prior Year
$15,569,781
604,735275,562
0-585367
295,656
9,641,099261,947
$14,394,046
FY08Expense
$1,270,8678.89%
$984,978$1,011,994Non Labor Sub-Total $1,888,308 $1,233,156 $1,175,735
4,529,6344,531,010Benefits 3,352,661 4,041,878 4,491,000
Administrative
Clerical
Management
MaintenanceOperator
Professional
Represented
Supervisory
175
1
15
0
0
58
21
13
168
1
15
0
0
56
21
13
Non-Represented 153 147
Part - Time 90 87
Represented 22 22
Full-Time Total 175 169
Contract 13 13
Capital 5 5
Authorized Positions by Class
Administrative Total 248 239
Authorized Positions by Status
Represented Total 22 22
160
4
15
0
0
51
30
13
139
97
34
173
0
3
226
34
167
3
15
0
0
51
30
14
138
107
33
171
0
2
233
33
FY10FY09 FY07FY06 FY10FY09 FY07FY06
Clayton 0 000
151
91
27
178
13
3
FY08
0
174
0
15
0
0
56
27
13
245
27
FY08
284
FY10 OPERATING & CAPITAL BUDGETS
OFFICE OF THE AGM OF FINANCE FUNCTIONS AND RESPONSIBILITIESThe Office of the Assistant General Manager of Finance supervises the Authority’s financial activities, and is responsible for the strategic direction, financial viability and daily management of the Department of Finance. The Department of Finance encompasses the offices of Accounting, Management & Budget, Treasury Services, Revenue Operations, and Grant Programs. The Office of Accounting serves as the primary source of financial and management information for the Authority. The office prepares the monthly financial results and variance to budget for presentation to the Board of Directors and MARTA Senior Management. The office processes bi-weekly payroll, disbursements, cash receipts and appropriate accounting allocation between operating, capital and grants. The office maintains historical accounting records and oversees the annual external financial audit. The Office of Management & Budget administers and develops the Authority’s Annual Operating and Capital Budgets; monitors the Authority’s expenditures on an ongoing basis; develops the Authority’s Five-Year Financial Plan; manages strategic plan & Key Performance Indicators (KPI); provides support to the Authority in the areas of business and financial analysis and manages the Authority’s Efficiency Improvement Program mandated by the Board of Directors. This office also assists management in developing and monitoring strategies and performance measures to align operational, tactical and strategic processes with MARTA's strategic direction. The objective of this office is to provide managerial & financial advising services that enables the Authority the optimize performance and productivity, while simultaneously containing or reducing cost.
The primary responsibilities of the Office of Treasury & Capital Programs are to provide support to the Authority in the areas of business and financial analysis; ensure maximum investment yield; capital budget development. The Financial Planning & Analysis branch provides programming, management, management of the Authority’s Capital Improvement Planning program. The Cash Management branch provides services to ensure maximum investment yield on the Authority's idle cash. This includes the receipt, investment, and disbursement of funds; preparation of short and long-range cash-flow plans; and development and maintenance of business relationships with banking and investment institutions that support Authority programs The primary responsibilities of the Office of Revenue Operations are to centrally manage the Authority’s revenue collected and processed from all ticket vending machines, bus fareboxes, parking lots, ridestores, media encoding, and media sales. Also, the office is responsible for all revenue settlement and clearinghouse duties to ensure that all transactions and revenue are accurately reported and apportioned according to regional agreements. The Office consists of eight branches: Revenue Administration, Maintenance oversight of ticket-vending machines/bus processing equipment, Revenue Collection, Revenue Processing, Media Encoding, Media Sales, Parking Services, Revenue Settlement and Clearinghouse. The Office of Grant Programs coordinates the Authority’s Federal and State funding programs, seeking to create, maintains and build relationships with federal and state funding agencies to have a positive impact on the financing, development and operations of MARTA.
285

FY10 OPERATING & CAPITAL BUDGETS
OFFICE OF THE AGM OF FINANCE
$568,123$578,875
8512,194
000
193,810
6254,440
000
178,577
Contractual ServicesMaterials & SuppliesOther OperatingCasualty & LiabilityMiscellaneous
Other Non Operating
Office Total
264,083294,608Salaries & Wages00Overtime
$371,268$395,233Labor Sub-Total
FY09 FY10Categories of Expense
$416,645
03,315
000
13,133
303,7290
$400,197
FY06
$214,162
01,450
000
1,645
152,9170
$211,067
FY07Expense Expense Expense Adopted
($10,752)$125,864($202,483)-1.86%27.78%-48.60%
$ Change from Prior Year% Change from Prior Year
$453,011
1,0003,605
000
127,596
247,0770
$320,810
FY08Expense
$238,849111.53%
$196,855$183,642Non Labor Sub-Total $16,448 $3,095 $132,201
107,186100,625Benefits 96,468 58,150 73,733
Administrative
Clerical
Management
MaintenanceOperator
Professional
Represented
Supervisory
0
0
1
0
0
2
0
0
0
0
1
0
0
2
0
0
Non-Represented 2 2
Part - Time 0 0
Represented 0 0
Full-Time Total 2 2
Contract 1 1
Capital 0 0
Authorized Positions by Class
Administrative Total 3 3
Authorized Positions by Status
Represented Total 0 0
0
0
1
0
0
1
0
0
2
0
0
2
0
0
2
0
1
0
1
0
0
1
0
0
2
1
0
2
0
0
3
0
FY10FY09 FY07FY06 FY10FY09 FY07FY06
Clayton 0 000
2
0
0
2
1
0
FY08
0
0
0
1
0
0
2
0
0
3
0
FY08
286
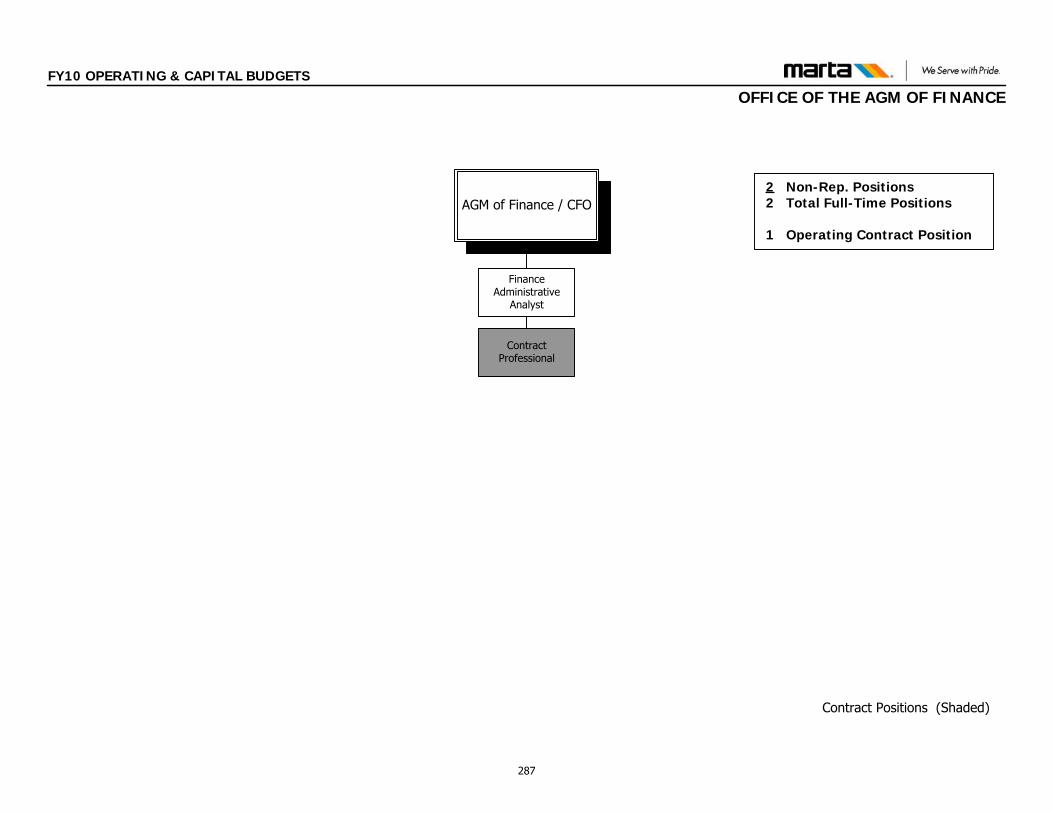
FY10 OPERATING & CAPITAL BUDGETS
OFFICE OF THE AGM OF FINANCE
Finance Administrative
Analyst
Contract Professional
Contract Positions (Shaded)
2 Non-Rep. Positions 2 Total Full-Time Positions
1 Operating Contract Position
AGM of Finance / CFO
287
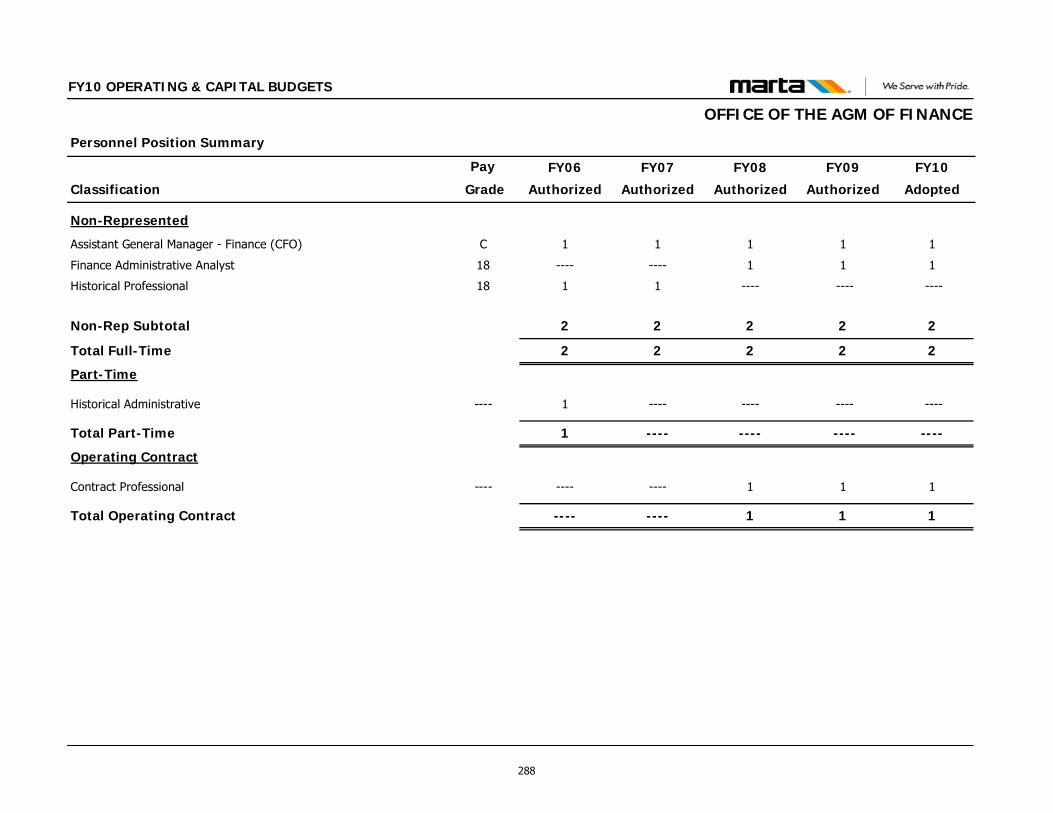
Classification
Personnel Position Summary
Pay FY09
Authorized
FY10
Adopted
FY10 OPERATING & CAPITAL BUDGETS
FY08
Authorized
FY07
Authorized
FY06
Authorized Grade
OFFICE OF THE AGM OF FINANCE
Non-Represented
Assistant General Manager - Finance (CFO) C 1 1111
Finance Administrative Analyst 18 1 11--------
Historical Professional 18 ---- --------11
Non-Rep Subtotal 2 2222
Total Full-Time 2 2222
Part-Time
Historical Administrative ---- ---- ------------1
Total Part-Time ---- ------------1
Operating Contract
Contract Professional ---- 1 11--------
Total Operating Contract 1 11--------
288
FY10 OPERATING & CAPITAL BUDGETS
OFFICE OF ACCOUNTING FUNCTIONS AND RESPONSIBILITIESThe Office of Accounting serves as the primary source of financial and management information for the Authority. This office develops and implements accounting system policies and procedures; directs the Authority’s accounting functions including union and non-union payroll, general disbursements, revenues, cash, receivables, construction, real estate, contracts, federal grants, fixed assets and property control, inventories, cost allocations, insurance program, special projects, etc.; develops and implements policies and procedures to support these functions; and anticipates future needs from an accounting and reporting standpoint for the Authority. The Office of Accounting maintains historical accounting records and data; tracks disbursements and receipts
of funds; and prepares reports, analyses, and trends. The Office oversees the annual external financial audit; prepares yearend audited financial statements and prepares the comprehensive annual financial report (CAFR). Specific responsibilities include: preparation of the monthly financial results and variance to budget for presentation to the Board of Directors and MARTA Senior Management; processing of biweekly payroll; processing of disbursements and cash receipts; and appropriate accounting allocation between operating, capital, and grants.
289

FY10 OPERATING & CAPITAL BUDGETS
OFFICE OF ACCOUNTING
$3,466,907$3,421,782
2,9364,850
00
33
7,218
10,2415,938
00
382
10,677
Contractual ServicesMaterials & SuppliesOther OperatingCasualty & LiabilityMiscellaneous
Other Non Operating
Office Total
2,290,5922,346,771Salaries & Wages24,0799,693Overtime
$3,451,870$3,394,544Labor Sub-Total
FY09 FY10Categories of Expense
$2,774,308
8,2297,295
00
11
13,721
2,036,77314,963
$2,745,052
FY06
$3,192,310
8,5629,209
000
9,626
2,208,99113,296
$3,164,913
FY07Expense Expense Expense Adopted
$45,125($136,717)$418,0021.32%-3.84%15.07%
$ Change from Prior Year% Change from Prior Year
$3,558,499
9,8027,037
000
7,356
2,414,81418,450
$3,534,304
FY08Expense
$366,18911.47%
$15,037$27,238Non Labor Sub-Total $29,256 $27,397 $24,195
1,137,1981,038,080Benefits 693,316 942,626 1,101,040
Administrative
Clerical
Management
MaintenanceOperator
Professional
Represented
Supervisory
16
0
4
0
0
25
0
0
15
0
4
0
0
24
0
0
Non-Represented 43 41
Part - Time 0 0
Represented 0 0
Full-Time Total 43 41
Contract 0 0
Capital 2 2
Authorized Positions by Class
Administrative Total 45 43
Authorized Positions by Status
Represented Total 0 0
16
0
4
0
0
26
0
0
44
0
0
44
0
2
46
0
15
0
4
0
0
26
0
0
43
0
0
43
0
2
45
0
FY10FY09 FY07FY06 FY10FY09 FY07FY06
Clayton 0 000
44
0
0
44
0
2
FY08
0
16
0
4
0
0
26
0
0
46
0
FY08
290
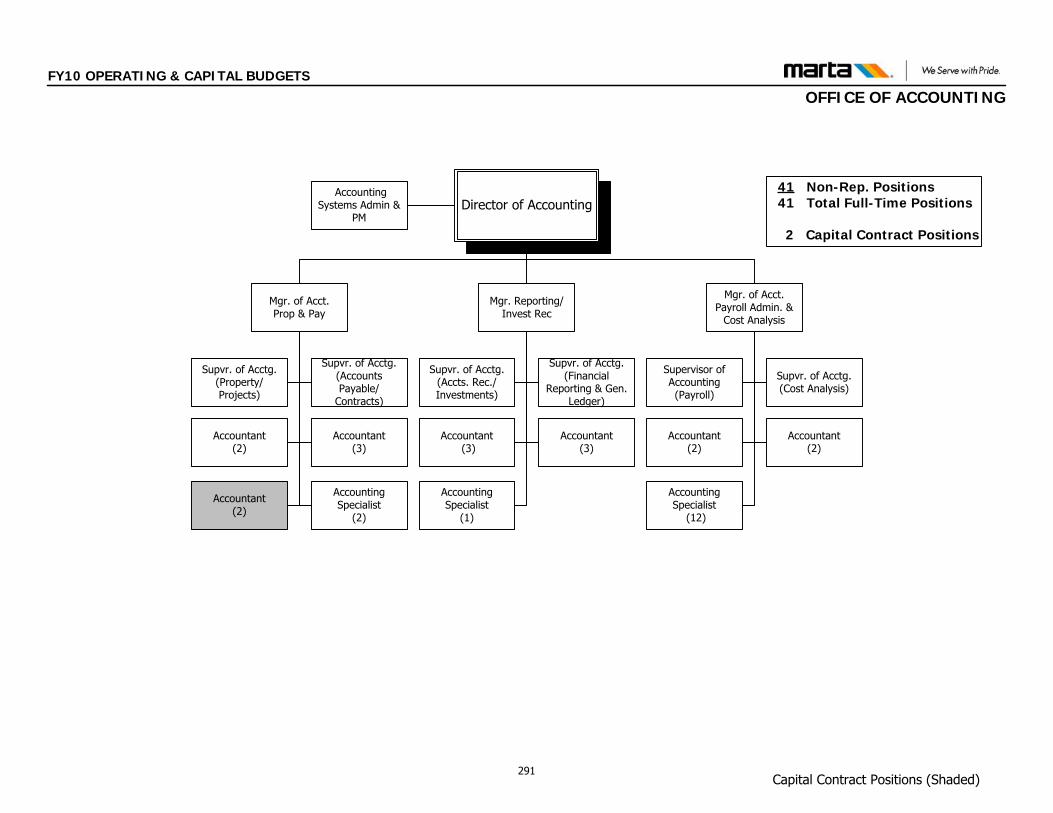
FY10 OPERATING & CAPITAL BUDGETS
OFFICE OF ACCOUNTING
Capital Contract Positions (Shaded)
Mgr. Reporting/Invest Rec
Mgr. of Acct. Payroll Admin. &
Cost Analysis
Mgr. of Acct.Prop & Pay
Supvr. of Acctg.(Accts. Rec./Investments)
Supervisor of Accounting(Payroll)
Supvr. of Acctg.(Cost Analysis)
Accountant(2)
Accountant(2)
Supvr. of Acctg.(Property/Projects)
Supvr. of Acctg.(Accounts Payable/
Contracts)
Accountant(2)
Accountant(3)
Accounting Specialist
(2)
Accountant (3)
Accounting Specialist
(1)
Supvr. of Acctg.(Financial
Reporting & Gen. Ledger)
Accountant(3)
Accountant(2)
Accounting Systems Admin &
PM
Accounting Specialist
(12)
41 Non-Rep. Positions 41 Total Full-Time Positions
2 Capital Contract Positions
Director of Accounting
291
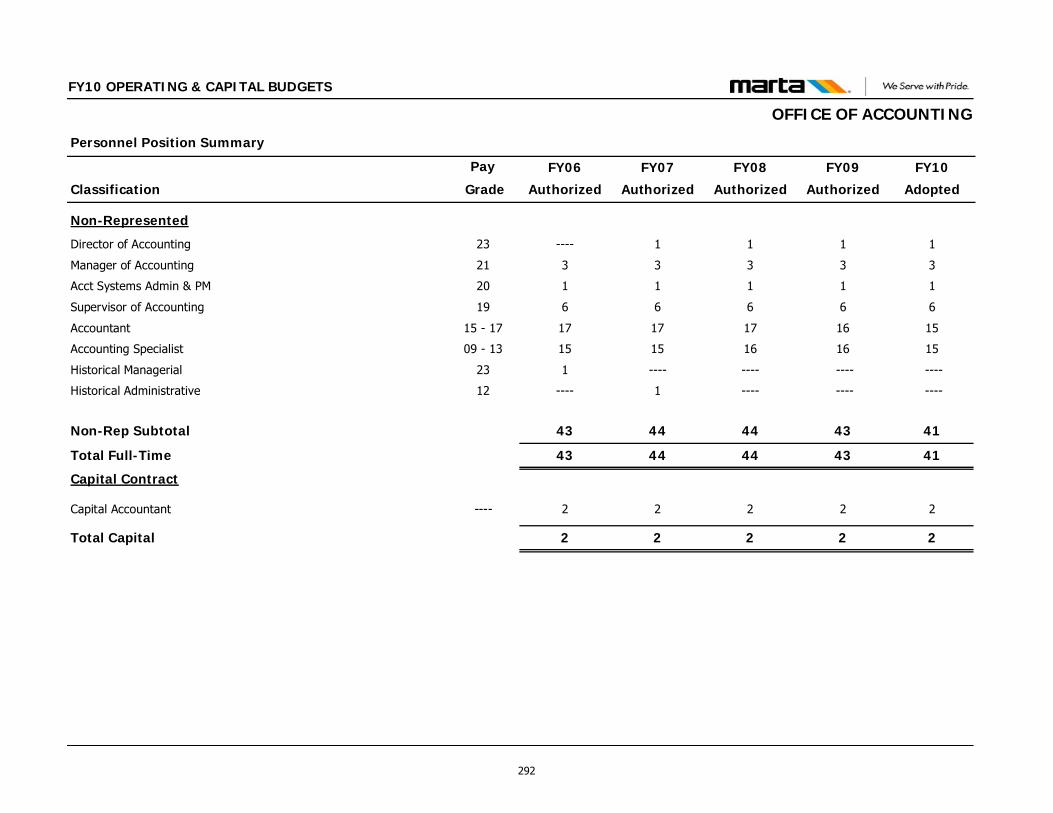
Classification
Personnel Position Summary
Pay FY09
Authorized
FY10
Adopted
FY10 OPERATING & CAPITAL BUDGETS
FY08
Authorized
FY07
Authorized
FY06
Authorized Grade
OFFICE OF ACCOUNTING
Non-Represented
Director of Accounting 23 1 111----
Manager of Accounting 21 3 3333
Acct Systems Admin & PM 20 1 1111
Supervisor of Accounting 19 6 6666
Accountant 15 - 17 16 15171717
Accounting Specialist 09 - 13 16 15161515
Historical Managerial 23 ---- ------------1
Historical Administrative 12 ---- --------1----
Non-Rep Subtotal 43 41444443
Total Full-Time 43 41444443
Capital Contract
Capital Accountant ---- 2 2222
Total Capital 2 2222
292
FY10 OPERATING & CAPITAL BUDGETS
OFFICE OF MANAGEMENT & BUDGET FUNCTIONS AND RESPONSIBILITIESThe primary responsibilities of the Office of Management & Budget are to administer and develop the Authority’s Annual Operating and Capital Budgets; monitor the Authority’s expenditures on an ongoing basis; develop the Authority’s Five-Year Financial Plan; monitor performance measurement activities; provide support to the Authority in the areas of business and financial analysis, and manage Authority’s Efficiency Improvement Program mandated by the Board of Directors. The objective of this office is to provide managerial and financial advising services, which enable the Authority to optimize performance and productivity, while simultaneously containing or reducing cost. Such efforts enable the attainment of the Authority’s strategic goals. The Office consists of two branches: the Budget branch and the TranStat branch. The Budget branch operates as “internal consultants” to the Authority. This branch develops the Authority’s Operating & Capital Budgets and publishes a Recommended and an Adopted budget book each year. This requires adhering to various milestones, analyzing significant budgetary increases/decreases per expense category per office, assessing resource reallocation necessities and providing recommendations. On a monthly basis position control is reconciled at the office level; variance analyses are performed; and office meetings are conducted for analyses and verification. The branch works to identify solutions for organizational concerns, manages personnel authorization and requisition control, provides financial analysis to assure the best use of MARTA’s financial resources, assesses the efficient use of our employees, monitors the functional components of the Authority, and determine how each function operates internally and cross-functionally. The services it provides are organizational assessment studies, industry comparative studies,
efficiency studies, efficiency-improvement strategies, evaluation of the implementation processes, managerial advisory services, and budgetary reallocation and facilitation of the budgetary process. The TranStat Branch, which is now the Strategic Performance Management Branch manages MARTA’s tactical performance management and accountability system (TRANSTAT). This branch focuses on developing accurate and timely operational intelligence, implementation of effective performance improvement tactics and strategies, rapid deployment of resources and relentless follow-up and assessment of improvement initiatives. This branch also assists management in developing and monitoring strategies and performance measures to align operational, tactical and strategic processes with MARTA's strategic direction. Specific contributions are clearly defined strategies consistent with the Authority’s goals in a defined time frame within the organization’s capacity for implementation; communication of those strategies to the organization’s constituents; development of a sense of ownership of the plan throughout the organization; ensures that the most effective use is made of the organization’s resources by focusing the resources on the key priorities; provides a base from which progress can be measured and development of a mechanism for informed change, as it becomes vital; brings together everyone’s best and most reasoned efforts in building a consensus about where the organization is going. This branch is championing the development of the Authority’s Benchmarking policy, as well as the insight of vision benchmarking assessments throughout the Authority. This branch provides managerial advisory services to the Transit Planning Board (TPB) for performance management metrics.
293

FY10 OPERATING & CAPITAL BUDGETS
OFFICE OF MANAGEMENT & BUDGET
$1,682,283$1,451,585
3,8419,691
000
3,905
41,73210,754
000
3,453
Contractual ServicesMaterials & SuppliesOther OperatingCasualty & LiabilityMiscellaneous
Other Non Operating
Office Total
1,114,253961,591Salaries & Wages0750Overtime
$1,664,846$1,395,646Labor Sub-Total
FY09 FY10Categories of Expense
$1,827,106
1,0157,257
3600
32,693
1,241,786129
$1,786,105
FY06
$1,414,503
2169,500
000
28,006
945,154434
$1,376,781
FY07Expense Expense Expense Adopted
$230,698$61,816($412,603)15.89%4.45%-22.58%
$ Change from Prior Year% Change from Prior Year
$1,389,769
013,240
00
71
3,408
989,574208
$1,373,050
FY08Expense
($24,734)-1.75%
$17,437$55,939Non Labor Sub-Total $41,001 $37,722 $16,719
550,593433,305Benefits 544,190 431,193 383,268
Administrative
Clerical
Management
MaintenanceOperator
Professional
Represented
Supervisory
0
0
4
0
0
14
0
0
0
0
4
0
0
13
0
0
Non-Represented 16 15
Part - Time 0 0
Represented 0 0
Full-Time Total 16 15
Contract 0 0
Capital 2 2
Authorized Positions by Class
Administrative Total 18 17
Authorized Positions by Status
Represented Total 0 0
0
0
4
0
0
12
0
0
16
0
0
16
0
0
16
0
0
0
4
0
0
13
0
0
17
0
0
17
0
0
17
0
FY10FY09 FY07FY06 FY10FY09 FY07FY06
Clayton 0 000
17
0
0
17
0
0
FY08
0
1
0
4
0
0
12
0
0
17
0
FY08
294
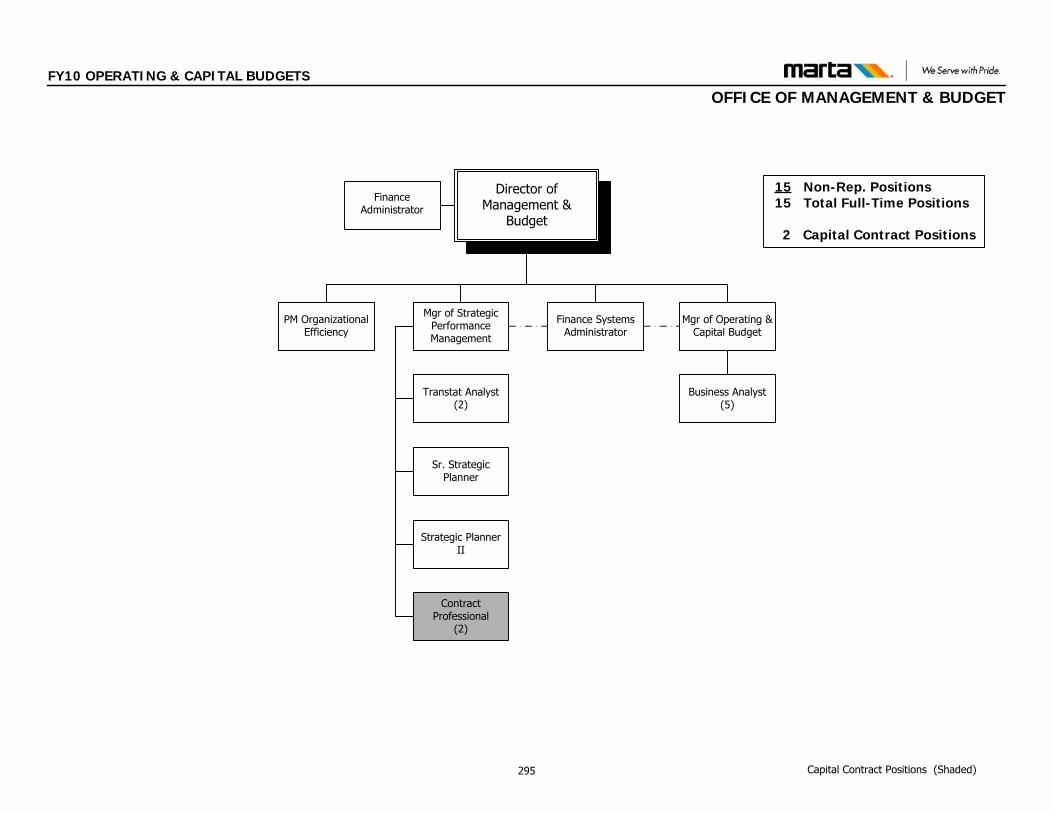
FY10 OPERATING & CAPITAL BUDGETS
OFFICE OF MANAGEMENT & BUDGET
Finance Administrator
Contract Professional
(2)
Capital Contract Positions (Shaded)
15 Non-Rep. Positions 15 Total Full-Time Positions
2 Capital Contract Positions
Mgr of Strategic Performance Management
Mgr of Operating & Capital Budget
Finance Systems Administrator
PM Organizational Efficiency
Director of Management &
Budget
Strategic PlannerII
Transtat Analyst(2)
Sr. Strategic Planner
Business Analyst (5)
295
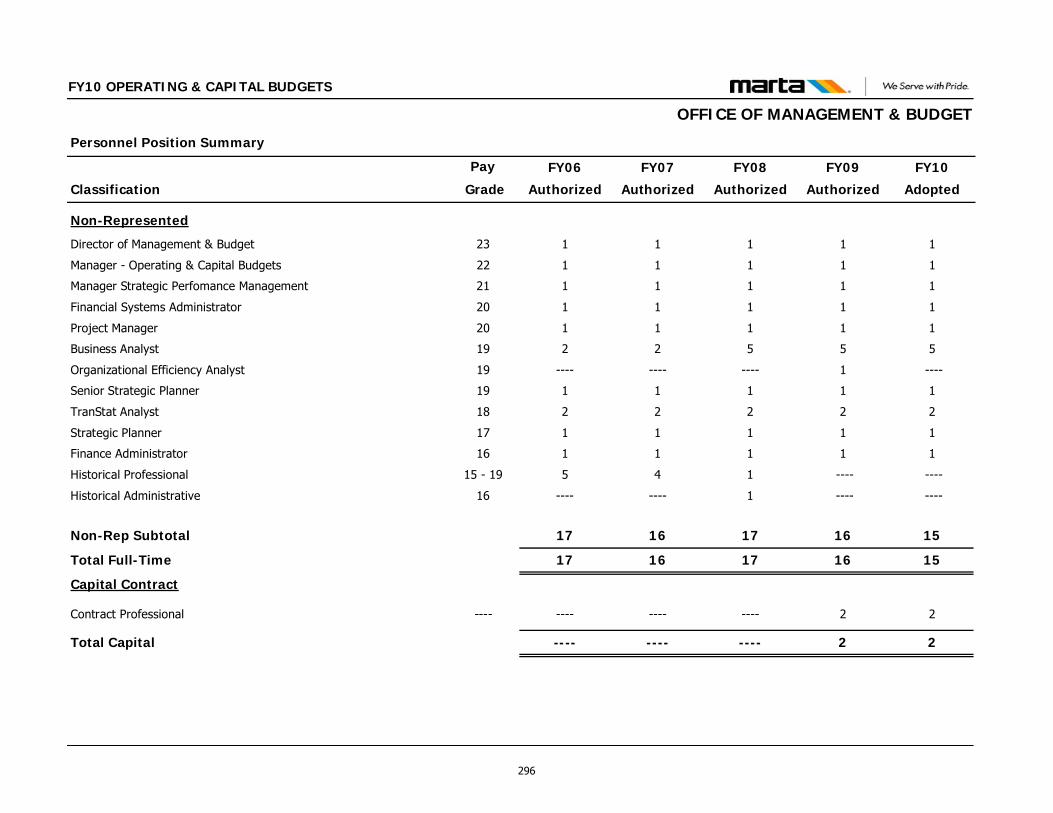
Classification
Personnel Position Summary
Pay FY09
Authorized
FY10
Adopted
FY10 OPERATING & CAPITAL BUDGETS
FY08
Authorized
FY07
Authorized
FY06
Authorized Grade
OFFICE OF MANAGEMENT & BUDGET
Non-Represented
Director of Management & Budget 23 1 1111
Manager - Operating & Capital Budgets 22 1 1111
Manager Strategic Perfomance Management 21 1 1111
Financial Systems Administrator 20 1 1111
Project Manager 20 1 1111
Business Analyst 19 5 5522
Organizational Efficiency Analyst 19 1 ----------------
Senior Strategic Planner 19 1 1111
TranStat Analyst 18 2 2222
Strategic Planner 17 1 1111
Finance Administrator 16 1 1111
Historical Professional 15 - 19 ---- ----145
Historical Administrative 16 ---- ----1--------
Non-Rep Subtotal 16 15171617
Total Full-Time 16 15171617
Capital Contract
Contract Professional ---- 2 2------------
Total Capital 2 2------------
296
FY10 OPERATING & CAPITAL BUDGETS
OFFICE OF REVENUE OPERATIONS FUNCTIONS AND RESPONSIBILITIESThe primary responsibilities of the Office of Revenue Operations are to centrally manage the Authority’s revenue collected and processed from all ticket vending machines, bus fareboxes, parking lots, ride Stores, media encoding, and media sales. Also the office is responsible for all revenue settlement and clearinghouse duties to ensure that all transactions and revenue are accurately reported and apportioned according to regional agreements. The Office consists of eight branches: Revenue Administration, Maintenance oversight of ticket-vending machines/bus processing equipment, Revenue Collection, Revenue Processing, Media Encoding, Media Sales, Parking Services, Revenue Settlement and clearinghouse. The Revenue Administration branch oversees the reconciliation of actual coin and currency counts processed by the Revenue Processing Unit and by monitoring, auditing, and controlling transactional fraud and system access rules. These activities include identifying, preventing, investigating, resolving, and reporting discrepancies, unusual occurrences and variances. Total revenue monitored is approximately $103.5 million annually. This branch is also responsible for the management of the design, implementation, and operation of the Authority’s fare collection system, encoding fare media and the administration of revenue contracts. The Ticket Vending/Bus processing equipment maintenance oversight branch oversees equipment reported as out of service to prevent abuse and fraudulent transactions. The mission of MARTA’s Revenue Settlement and Clearinghouse is to ensure that fare payment transactions and revenue are accurately reported and apportioned according to regional agreements. The office reconciles credit/debit settlement reports from the bank against the Breeze Vending Machine credit/debit sales reports and investigates transaction discrepancies. It is responsible for investigating and resolving credit/debit card charge backs. Responsibilities also include review and investigation of Breeze customer inquiries requesting credit restore and limited cash refunds. Failed auto loads are investigated and resolved. The Revenue collections branch is responsible for securing the collection of approximately $57 million from bus fareboxes and Ticket Vending machines. This branch also works with other departments to handle special events and to assist patrons throughout the system.
The Revenue Processing branch is responsible for securing the processing and banking of approximately $57 million from bus fareboxes, parking lots, and Ticket Vending machines. This branch is also responsible for supplying change of approximately $9 million for the Ticket Vending machines. The Media Encoding branch is the central point of distribution and control for all fare media, including regional partners. Responsibilities include managing the fare media inventory, receiving and processing all bulk fare media orders, including initializing, encoding, quality assurance, printing, packaging, delivering, and tracking the receipt of each order. FY09 ACCOMPLISHMENTS Successful completion of secure room upgrades Developed and implemented key procedures and policies to improve
customer service and enforce controls of fare media and revenues All wrap signs were replaced at Ride Stores (price changes with Breeze
Media). Old sign had the old prices and tokens Newsletter was created for the Department of Revenue Operations Successfully collected on Authorities past due invoices and significantly
reduced Aging Report balances Added radio communication between floaters and the cashier facilities Merged Parking Administration and Parking Operations as a team
concept Eliminate ACCPAC (an accounting sub-system) from tracking daily
orders. Now tracked through Oracle’s order management system Map out process for the Annual Pass Move POS Partners (internal credit card system) to server in IT, thus
eliminating disasters such as losing history of charges and not being able to complete a transaction by not charging the credit card Comprehensive study on Parking, costs to replace current location, cost
to implement collections at all MARTA parking locations (which are free now). Included are benchmarks with sister agencies, pricing at locations, daily collections, and business plans for parking
297
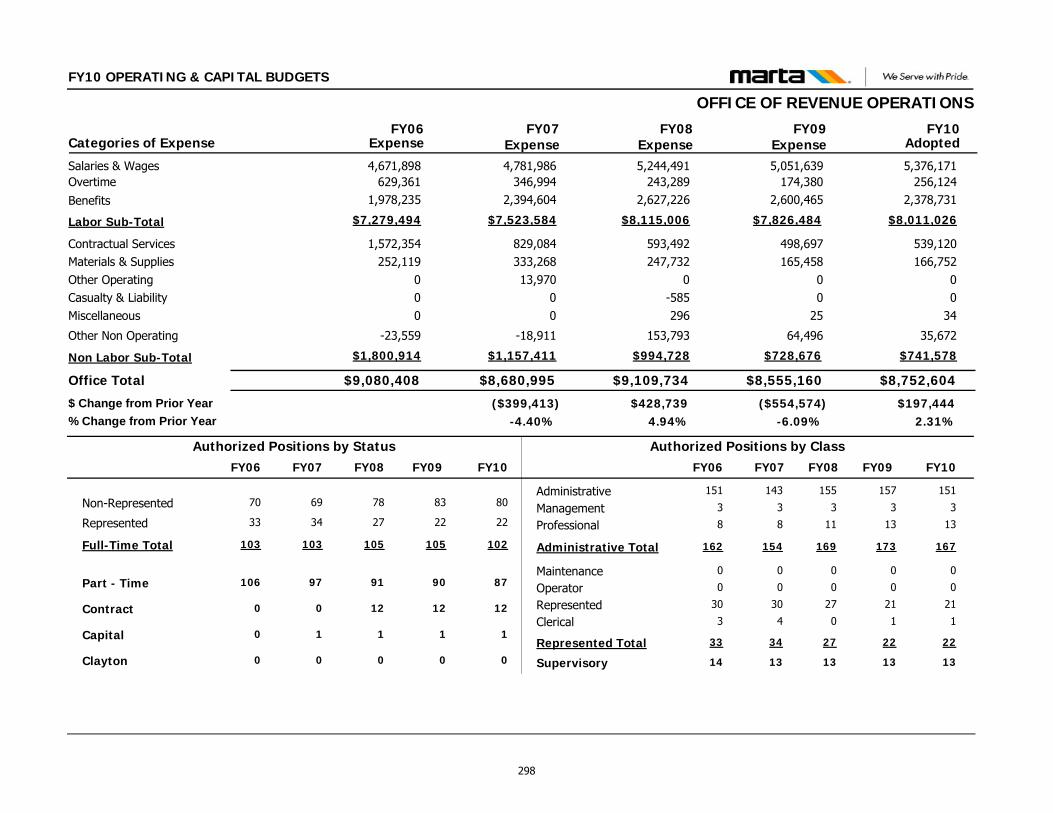
FY10 OPERATING & CAPITAL BUDGETS
OFFICE OF REVENUE OPERATIONS
$8,752,604$8,555,160
539,120166,752
00
34
35,672
498,697165,458
00
25
64,496
Contractual ServicesMaterials & SuppliesOther OperatingCasualty & LiabilityMiscellaneous
Other Non Operating
Office Total
5,376,1715,051,639Salaries & Wages256,124174,380Overtime
$8,011,026$7,826,484Labor Sub-Total
FY09 FY10Categories of Expense
$9,080,408
1,572,354252,119
000
-23,559
4,671,898629,361
$7,279,494
FY06
$8,680,995
829,084333,26813,970
00
-18,911
4,781,986346,994
$7,523,584
FY07Expense Expense Expense Adopted
$197,444($554,574)($399,413)2.31%-6.09%-4.40%
$ Change from Prior Year% Change from Prior Year
$9,109,734
593,492247,732
0-585296
153,793
5,244,491243,289
$8,115,006
FY08Expense
$428,7394.94%
$741,578$728,676Non Labor Sub-Total $1,800,914 $1,157,411 $994,728
2,378,7312,600,465Benefits 1,978,235 2,394,604 2,627,226
Administrative
Clerical
Management
MaintenanceOperator
Professional
Represented
Supervisory
157
1
3
0
0
13
21
13
151
1
3
0
0
13
21
13
Non-Represented 83 80
Part - Time 90 87
Represented 22 22
Full-Time Total 105 102
Contract 12 12
Capital 1 1
Authorized Positions by Class
Administrative Total 173 167
Authorized Positions by Status
Represented Total 22 22
143
4
3
0
0
8
30
13
69
97
34
103
0
1
154
34
151
3
3
0
0
8
30
14
70
106
33
103
0
0
162
33
FY10FY09 FY07FY06 FY10FY09 FY07FY06
Clayton 0 000
78
91
27
105
12
1
FY08
0
155
0
3
0
0
11
27
13
169
27
FY08
298
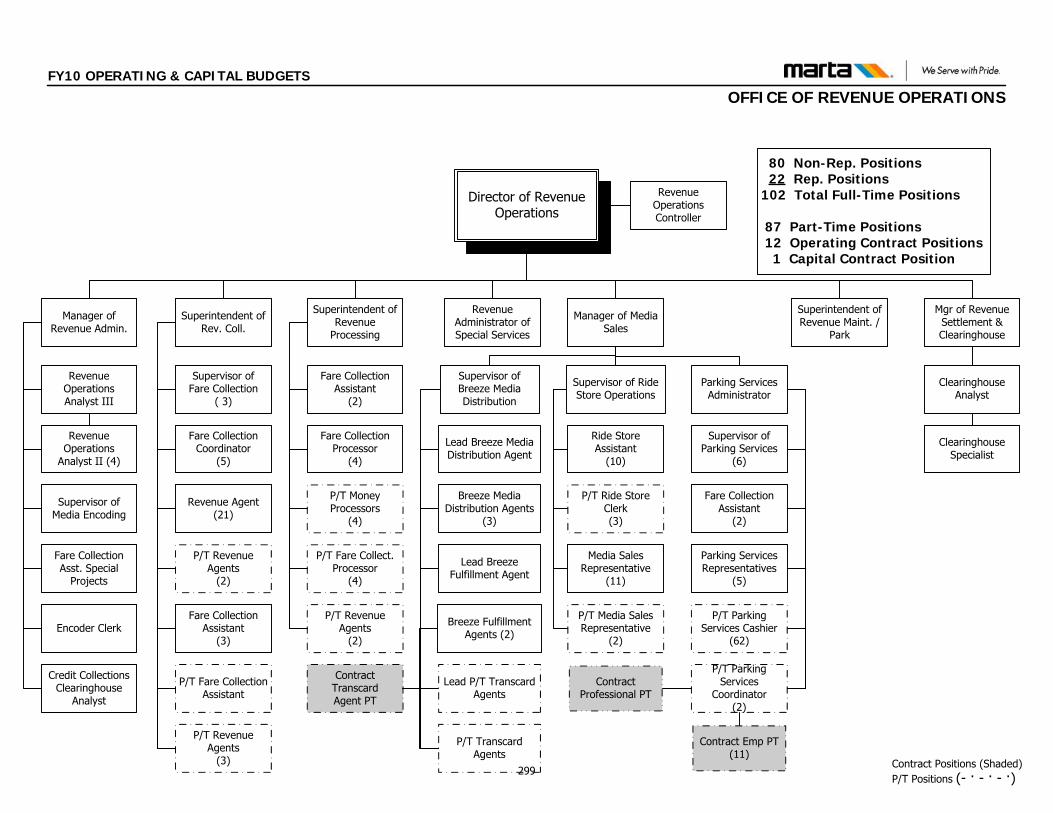
FY10 OPERATING & CAPITAL BUDGETS
OFFICE OF REVENUE OPERATIONS
80 Non-Rep. Positions22 Rep. Positions
102 Total Full-Time Positions
87 Part-Time Positions 12 Operating Contract Positions 1 Capital Contract Position
Director of Revenue Operations
Superintendent of Rev. Coll.
Manager of Media Sales
Supervisor of Fare Collection
( 3)
Fare Collection Coordinator
(5)
Ride Store Assistant
(10)
Revenue OperationsController
Superintendent of Revenue
Processing
Fare Collection Assistant
(2)
Manager of Revenue Admin.
Revenue Administrator of Special Services
Revenue Operations
Analyst II (4)
Supervisor of Media Encoding
Revenue Operations Analyst III
Fare Collection Asst. Special
Projects
P/T Revenue Agents
(2)
Fare Collection Processor
(4)
P/T Fare Collect. Processor
(4)
P/T Money Processors
(4)
P/T Revenue Agents
(2)
Revenue Agent(21)
Supervisor of Breeze Media Distribution
Media Sales Representative
(11)
P/T Media Sales Representative
(2)
P/T Ride Store Clerk(3)
Lead Breeze Media Distribution Agent
Lead Breeze Fulfillment Agent
Superintendent of Revenue Maint. /
Park
Parking Services Administrator
Parking Services Representatives
(5)
Fare Collection Assistant
(2)
Supervisor of Parking Services
(6)
P/T Parking Services
Coordinator(2)
P/T Parking Services Cashier
(62)
Breeze Fulfillment Agents (2)Encoder Clerk
P/T Revenue Agents
(3)
Fare Collection Assistant
(3)
Mgr of Revenue Settlement & Clearinghouse
Clearinghouse Analyst
Clearinghouse Specialist
Contract TranscardAgent PT
Lead P/T Transcard Agents
Breeze Media Distribution Agents
(3)
Contract Emp PT(11)
Contract Positions (Shaded)P/T Positions (- · - · - ·)
P/T Fare Collection Assistant
Supervisor of Ride Store Operations
Credit Collections Clearinghouse
Analyst
P/T Transcard Agents
Contract Professional PT
299
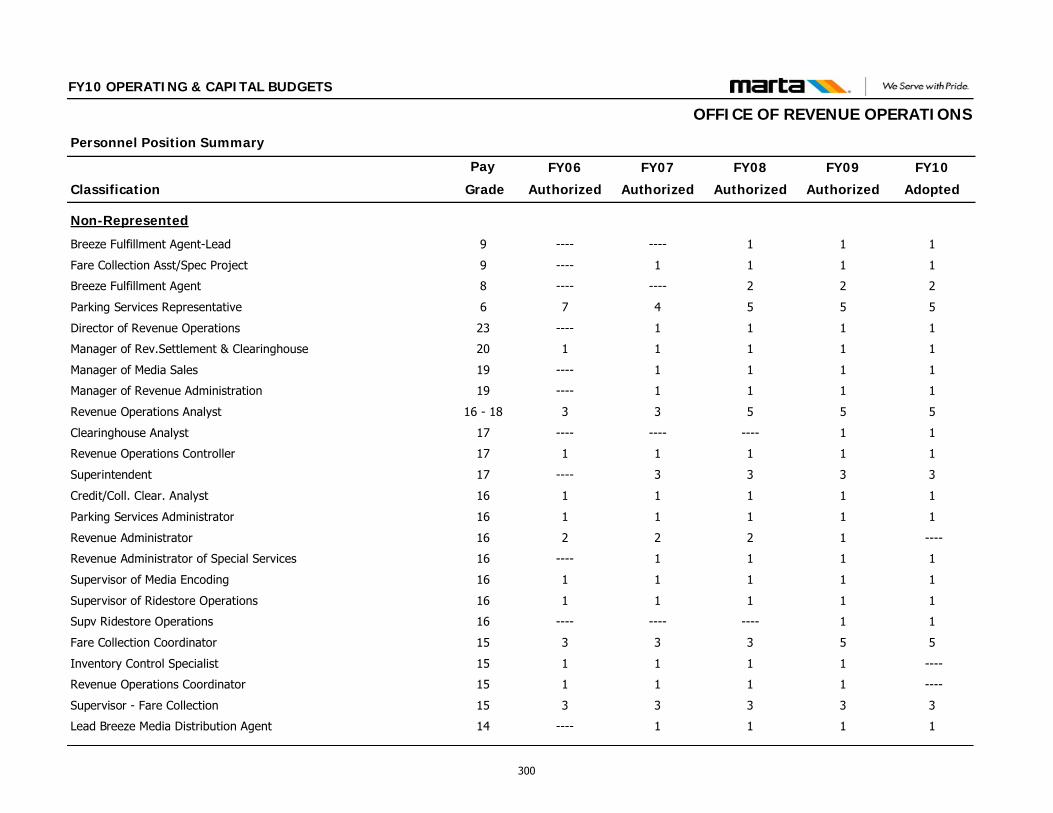
Classification
Personnel Position Summary
Pay FY09
Authorized
FY10
Adopted
FY10 OPERATING & CAPITAL BUDGETS
FY08
Authorized
FY07
Authorized
FY06
Authorized Grade
OFFICE OF REVENUE OPERATIONS
Non-Represented
Breeze Fulfillment Agent-Lead 9 1 11--------
Fare Collection Asst/Spec Project 9 1 111----
Breeze Fulfillment Agent 8 2 22--------
Parking Services Representative 6 5 5547
Director of Revenue Operations 23 1 111----
Manager of Rev.Settlement & Clearinghouse 20 1 1111
Manager of Media Sales 19 1 111----
Manager of Revenue Administration 19 1 111----
Revenue Operations Analyst 16 - 18 5 5533
Clearinghouse Analyst 17 1 1------------
Revenue Operations Controller 17 1 1111
Superintendent 17 3 333----
Credit/Coll. Clear. Analyst 16 1 1111
Parking Services Administrator 16 1 1111
Revenue Administrator 16 1 ----222
Revenue Administrator of Special Services 16 1 111----
Supervisor of Media Encoding 16 1 1111
Supervisor of Ridestore Operations 16 1 1111
Supv Ridestore Operations 16 1 1------------
Fare Collection Coordinator 15 5 5333
Inventory Control Specialist 15 1 ----111
Revenue Operations Coordinator 15 1 ----111
Supervisor - Fare Collection 15 3 3333
Lead Breeze Media Distribution Agent 14 1 111----
300
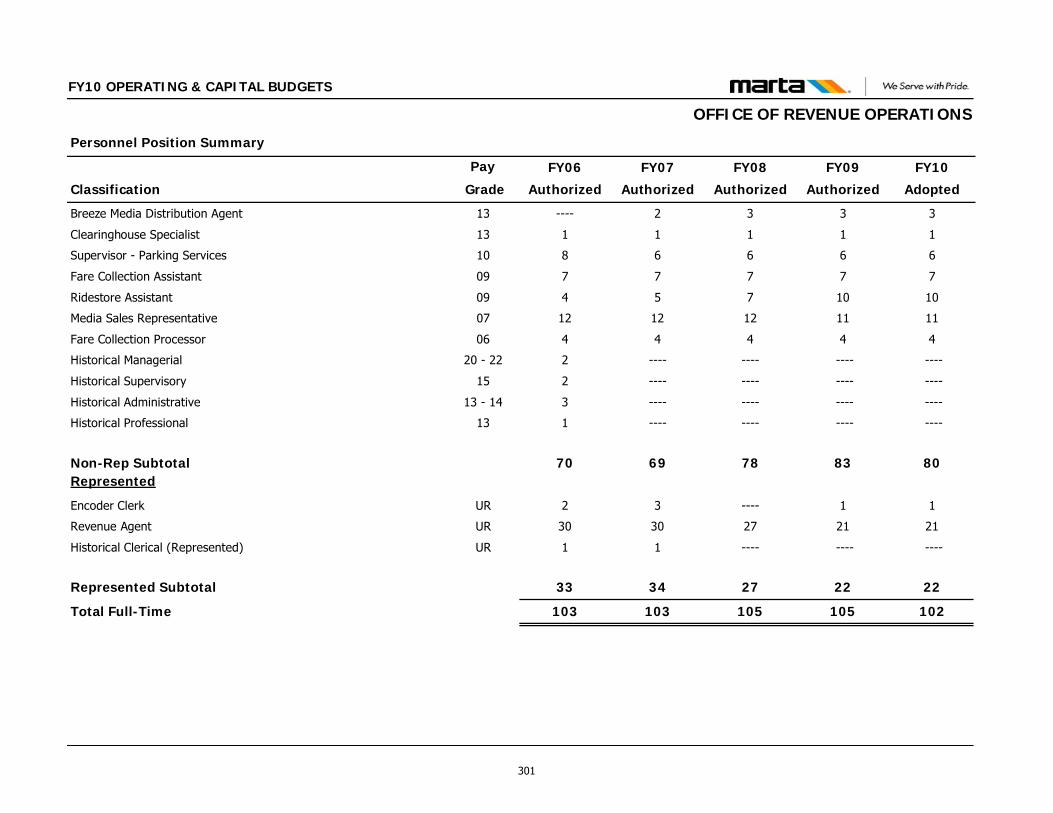
Classification
Personnel Position Summary
Pay FY09
Authorized
FY10
Adopted
FY10 OPERATING & CAPITAL BUDGETS
FY08
Authorized
FY07
Authorized
FY06
Authorized Grade
OFFICE OF REVENUE OPERATIONS
Breeze Media Distribution Agent 13 3 332----
Clearinghouse Specialist 13 1 1111
Supervisor - Parking Services 10 6 6668
Fare Collection Assistant 09 7 7777
Ridestore Assistant 09 10 10754
Media Sales Representative 07 11 11121212
Fare Collection Processor 06 4 4444
Historical Managerial 20 - 22 ---- ------------2
Historical Supervisory 15 ---- ------------2
Historical Administrative 13 - 14 ---- ------------3
Historical Professional 13 ---- ------------1
Non-Rep Subtotal 83 80786970Represented
Encoder Clerk UR 1 1----32
Revenue Agent UR 21 21273030
Historical Clerical (Represented) UR ---- --------11
Represented Subtotal 22 22273433
Total Full-Time 105 102105103103
301
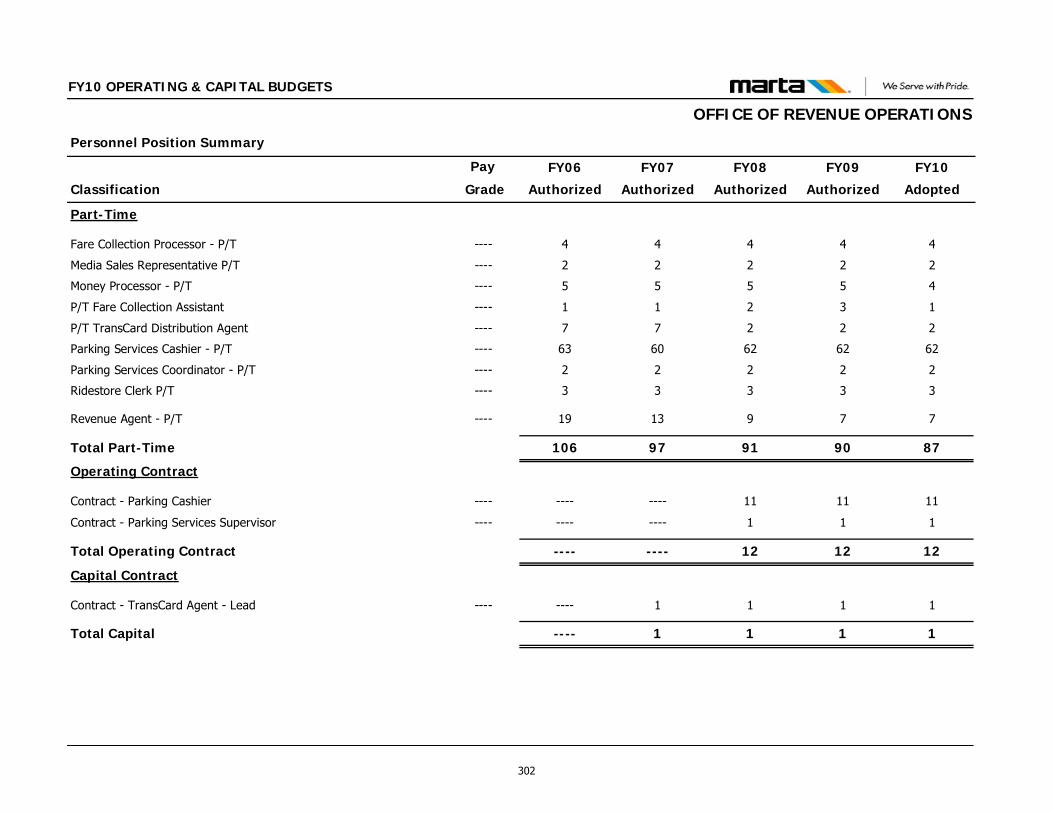
Classification
Personnel Position Summary
Pay FY09
Authorized
FY10
Adopted
FY10 OPERATING & CAPITAL BUDGETS
FY08
Authorized
FY07
Authorized
FY06
Authorized Grade
OFFICE OF REVENUE OPERATIONS
Part-Time
Fare Collection Processor - P/T ---- 4 4444
Media Sales Representative P/T ---- 2 2222
Money Processor - P/T ---- 5 4555
P/T Fare Collection Assistant ---- 3 1211
P/T TransCard Distribution Agent ---- 2 2277
Parking Services Cashier - P/T ---- 62 62626063
Parking Services Coordinator - P/T ---- 2 2222
Ridestore Clerk P/T ---- 3 3333
Revenue Agent - P/T ---- 7 791319
Total Part-Time 90 879197106
Operating Contract
Contract - Parking Cashier ---- 11 1111--------
Contract - Parking Services Supervisor ---- 1 11--------
Total Operating Contract 12 1212--------
Capital Contract
Contract - TransCard Agent - Lead ---- 1 111----
Total Capital 1 111----
302
FY10 OPERATING & CAPITAL BUDGETS
OFFICE OF TREASURY SERVICES FUNCTIONS AND RESPONSIBILITIES The primary responsibilities of the Office of Treasury & Capital Programs are to provide support to the Authority in the areas of cash management, business and financial analysis; ensure maximum investment yield; capital budget development and grant and debt program execution and management. The Office consists of one office: Office of Grant Programs; and two branches: the Financial Planning & Analysis branch and the Cash Management branch. The Financial Planning & Analysis branch provides programming, management, administration and oversight of federal and state grants to include regional solicitation and designated recipient efforts; and analysis and forecasting of revenue. Another core function contained within this branch is the financial management of the Authority’s Capital Improvement Planning Program. This branch also performs capital budget development and financial management, programming of funds, budgeting and tracking system development, planning, and preservation programs. In addition, the branch maintains and utilizes financial computer models to: develop and support short, intermediate and long-range planning; perform variance and financial analysis; and produce ad hoc and periodic management reports. The branch also develops, recommends and executes capital and operating debt and funding strategies. These strategies include the Authority’s bond and commercial paper programs, structured program or any other financial instruments to optimize the Authority’s financial position. The Cash Management branch provides services to ensure maximum investment yield on the Authority's idle cash. This includes the receipt, investment, and disbursement of funds; preparation of short and long-range cash-flow plans; and development and maintenance of business relationships with banking and investment institutions that support Authority programs. This branch controls all disbursements, executes wire transfers, and ECHO-draws; develops and monitors cash management policies and procedures to ensure that cash is available when needed, and tracks short-term investments of available cash as compared to Authority benchmarks.
FY09 ACCOMPLISHMENTS I. Achieved the following: Terminated the Avondale Lease to Service transaction with a
net benefit to MARTA exceeding $10,700,000 Terminated the East Line Lease to Service Transactions with a
minimal out of pocket expenses Negotiated a restructuring of the South Line Lease to Service
Transaction to eliminate the need for a backup credit facility Negotiated and reduced Lease to Service risk exposure by
67% Extended MARTA fuel hedge for 16 months to lock in fuel
prices through FY10 Received high scores in the Financial Management Oversight
Audit with no major findings II. Supported implementation of the following major initiatives: Provided financial and grant support to Atlanta Beltline and
the TPB Concept 3 Studies Supported Clayton operations with finance Supplied the Georgia Department of Transportation with grant
assistance As designated recipient for regional 5307 funds, supported the
regions in the allocation and distribution of ARRA funding III. Maintained MARTA’s cash assets with the following results (FY07
goal was to equal or better the Georgia 1 Fund): MARTA’s Return FY09 – 1.88% S&P Government – 1.213% (out performed by 0.67%) Georgia 1 Fund – 1.364% (outperformed by .52%)
303
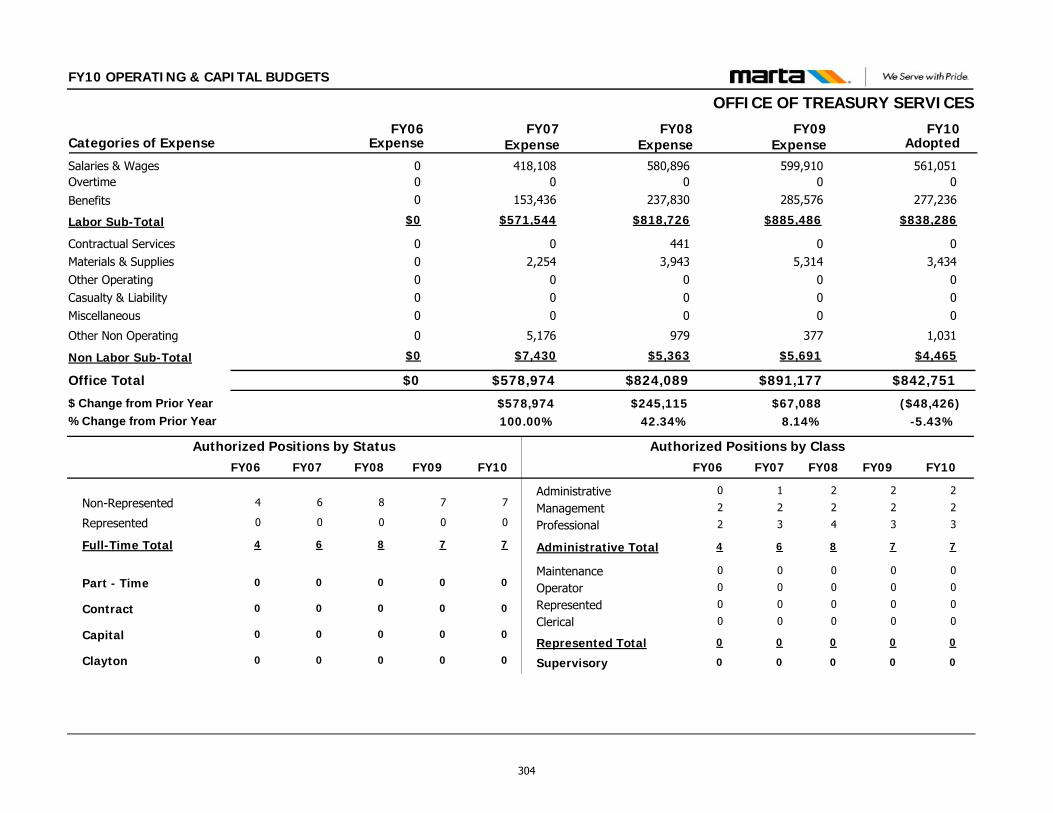
FY10 OPERATING & CAPITAL BUDGETS
OFFICE OF TREASURY SERVICES
$842,751$891,177
03,434
000
1,031
05,314
000
377
Contractual ServicesMaterials & SuppliesOther OperatingCasualty & LiabilityMiscellaneous
Other Non Operating
Office Total
561,051599,910Salaries & Wages00Overtime
$838,286$885,486Labor Sub-Total
FY09 FY10Categories of Expense
$0
00000
0
00
$0
FY06
$578,974
02,254
000
5,176
418,1080
$571,544
FY07Expense Expense Expense Adopted
($48,426)$67,088$578,974-5.43%8.14%100.00%
$ Change from Prior Year% Change from Prior Year
$824,089
4413,943
000
979
580,8960
$818,726
FY08Expense
$245,11542.34%
$4,465$5,691Non Labor Sub-Total $0 $7,430 $5,363
277,236285,576Benefits 0 153,436 237,830
Administrative
Clerical
Management
MaintenanceOperator
Professional
Represented
Supervisory
2
0
2
0
0
3
0
0
2
0
2
0
0
3
0
0
Non-Represented 7 7
Part - Time 0 0
Represented 0 0
Full-Time Total 7 7
Contract 0 0
Capital 0 0
Authorized Positions by Class
Administrative Total 7 7
Authorized Positions by Status
Represented Total 0 0
1
0
2
0
0
3
0
0
6
0
0
6
0
0
6
0
0
0
2
0
0
2
0
0
4
0
0
4
0
0
4
0
FY10FY09 FY07FY06 FY10FY09 FY07FY06
Clayton 0 000
8
0
0
8
0
0
FY08
0
2
0
2
0
0
4
0
0
8
0
FY08
304
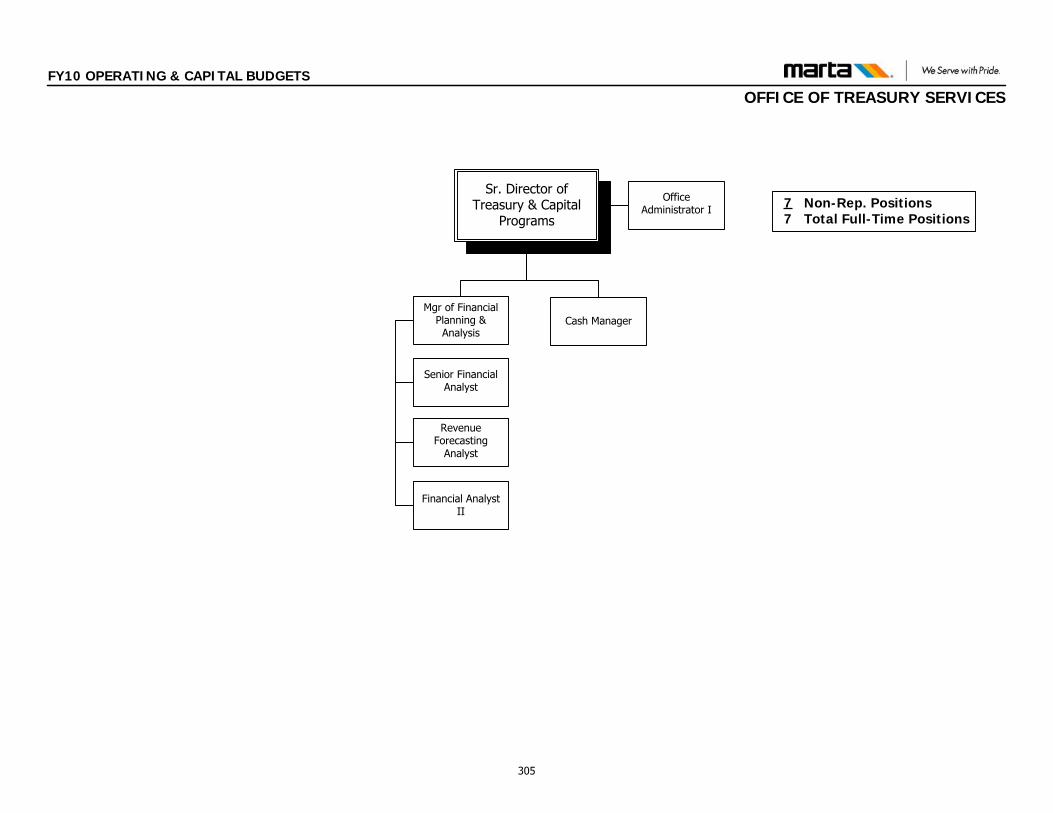
FY10 OPERATING & CAPITAL BUDGETS
OFFICE OF TREASURY SERVICES
Senior Financial Analyst
Revenue Forecasting
Analyst
Office Administrator I 7 Non-Rep. Positions
7 Total Full-Time Positions
Sr. Director of Treasury & Capital
Programs
Mgr of Financial Planning & Analysis
Cash Manager
Financial Analyst II
305
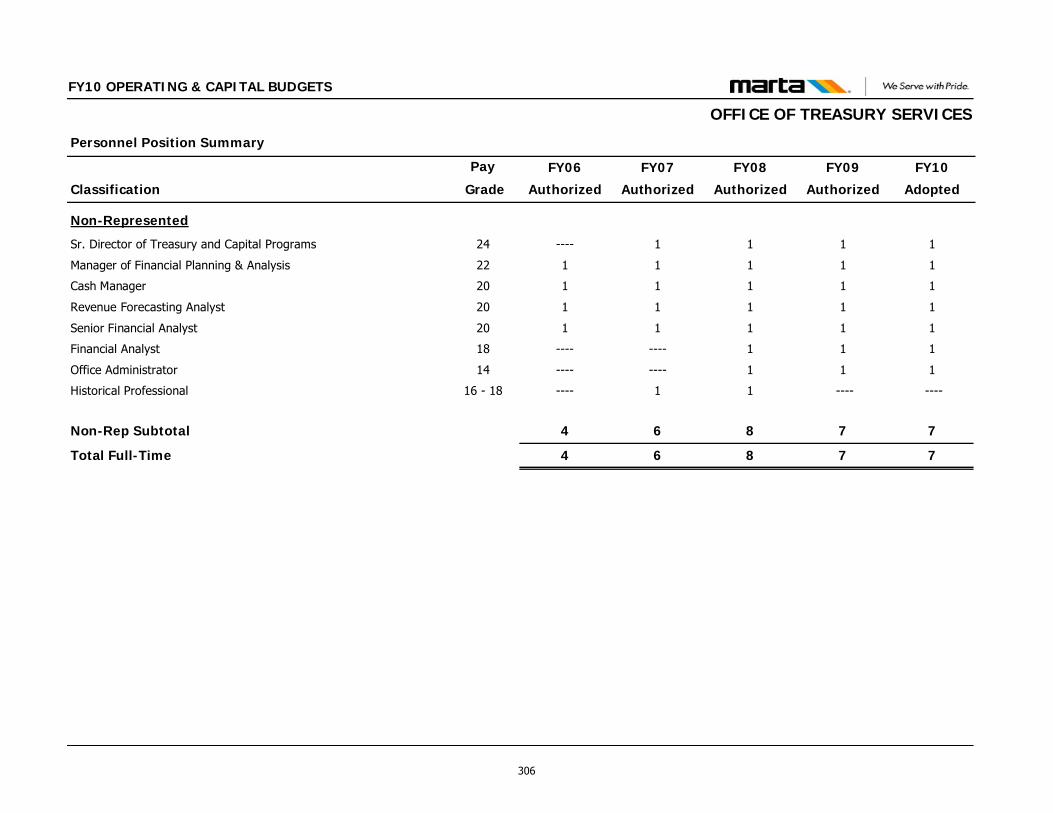
Classification
Personnel Position Summary
Pay FY09
Authorized
FY10
Adopted
FY10 OPERATING & CAPITAL BUDGETS
FY08
Authorized
FY07
Authorized
FY06
Authorized Grade
OFFICE OF TREASURY SERVICES
Non-Represented
Sr. Director of Treasury and Capital Programs 24 1 111----
Manager of Financial Planning & Analysis 22 1 1111
Cash Manager 20 1 1111
Revenue Forecasting Analyst 20 1 1111
Senior Financial Analyst 20 1 1111
Financial Analyst 18 1 11--------
Office Administrator 14 1 11--------
Historical Professional 16 - 18 ---- ----11----
Non-Rep Subtotal 7 7864
Total Full-Time 7 7864
306
FY10 OPERATING & CAPITAL BUDGETS
OFFICE OF FEDERAL & STATE PROGRAMS FUNCTIONS AND RESPONSIBILITIESThe Office of Federal & State Programs coordinates the Authority’s Federal and State funding programs, seeking to create, maintains and build relationships with federal and state funding agencies to have a positive impact on the financing, development and operations of MARTA. The Office, in conjunction with the Office of Government and Constituent Relations, monitors and lobbies to impact the six-year Federal Transportation Reauthorization bill to advance MARTA’s interests. This office also participates in the funding process for MARTA by seeking out, facilitating, and tracking federal, state and non-traditional grant opportunities as well as being the lead in development and submittal of annual congressional appropriations requests. The Office of Federal & State Programs, in conjunction with the Financial Planning and Analysis branch coordinates and executes the development/submittal of grant applications and grant amendments to U.S. and state government funding agencies, primarily the Federal Transit Administration (FTA) and Georgia DOT. The Office serves as the primary
point of contact between MARTA and FTA. In support of MARTA’s role as Designated Recipient, the Office also jointly administers sub-grant agreements, which pass-through federal funds to sub-recipient entities. FY09 ACCOMPLISHMENTS Provided financial support to Clayton County grants management MARTA has been successful in acquiring Department of Homeland
Security funds with the majority of MARTA projects submitted being approved. This has directly resulted in security improvements to the MARTA system. Results from inception to date have been $8 million in federal revenue. Secured the award of over $65 million in FTA grant assistance to
MARTA during FY 2009 Secured $2,755,000 in Federal FY 2009 discretionary Congressional
appropriations for MARTA
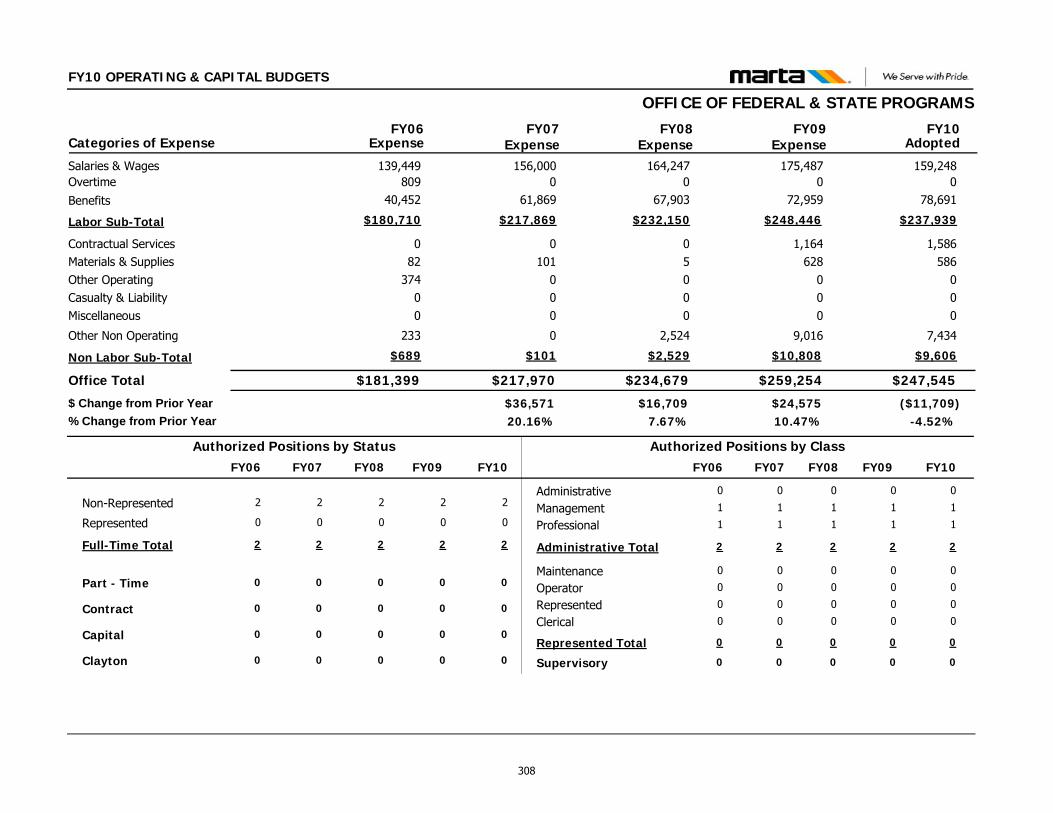
FY10 OPERATING & CAPITAL BUDGETS
OFFICE OF FEDERAL & STATE PROGRAMS
$247,545$259,254
1,586586
000
7,434
1,164628
000
9,016
Contractual ServicesMaterials & SuppliesOther OperatingCasualty & LiabilityMiscellaneous
Other Non Operating
Office Total
159,248175,487Salaries & Wages00Overtime
$237,939$248,446Labor Sub-Total
FY09 FY10Categories of Expense
$181,399
082
37400
233
139,449809
$180,710
FY06
$217,970
0101
000
0
156,0000
$217,869
FY07Expense Expense Expense Adopted
($11,709)$24,575$36,571-4.52%10.47%20.16%
$ Change from Prior Year% Change from Prior Year
$234,679
05000
2,524
164,2470
$232,150
FY08Expense
$16,7097.67%
$9,606$10,808Non Labor Sub-Total $689 $101 $2,529
78,69172,959Benefits 40,452 61,869 67,903
Administrative
Clerical
Management
MaintenanceOperator
Professional
Represented
Supervisory
0
0
1
0
0
1
0
0
0
0
1
0
0
1
0
0
Non-Represented 2 2
Part - Time 0 0
Represented 0 0
Full-Time Total 2 2
Contract 0 0
Capital 0 0
Authorized Positions by Class
Administrative Total 2 2
Authorized Positions by Status
Represented Total 0 0
0
0
1
0
0
1
0
0
2
0
0
2
0
0
2
0
0
0
1
0
0
1
0
0
2
0
0
2
0
0
2
0
FY10FY09 FY07FY06 FY10FY09 FY07FY06
Clayton 0 000
2
0
0
2
0
0
FY08
0
0
0
1
0
0
1
0
0
2
0
FY08
308

FY10 OPERATING & CAPITAL BUDGETS
OFFICE OF FEDERAL & STATE PROGRAMS
Grant Writer
Director of Grants Management
2 Non-Rep. Positions 2 Total Full-Time Positions
309

Classification
Personnel Position Summary
Pay FY09
Authorized
FY10
Adopted
FY10 OPERATING & CAPITAL BUDGETS
FY08
Authorized
FY07
Authorized
FY06
Authorized Grade
OFFICE OF FEDERAL & STATE PROGRAMS
Non-Represented
Director of Grants Management 23 1 1------------
Grant Writer 16 1 1111
Historical Managerial 22 ---- ----111
Non-Rep Subtotal 2 2222
Total Full-Time 2 2222
310
DEPARTMENT OF CONTRACTS & PROCUREMENT This Department includes the following Office: Department of Contracts & Procurement Office of the AGM of Contracts & Procurement Office of Contracts & Procurement and Materials Office of Administrative Services
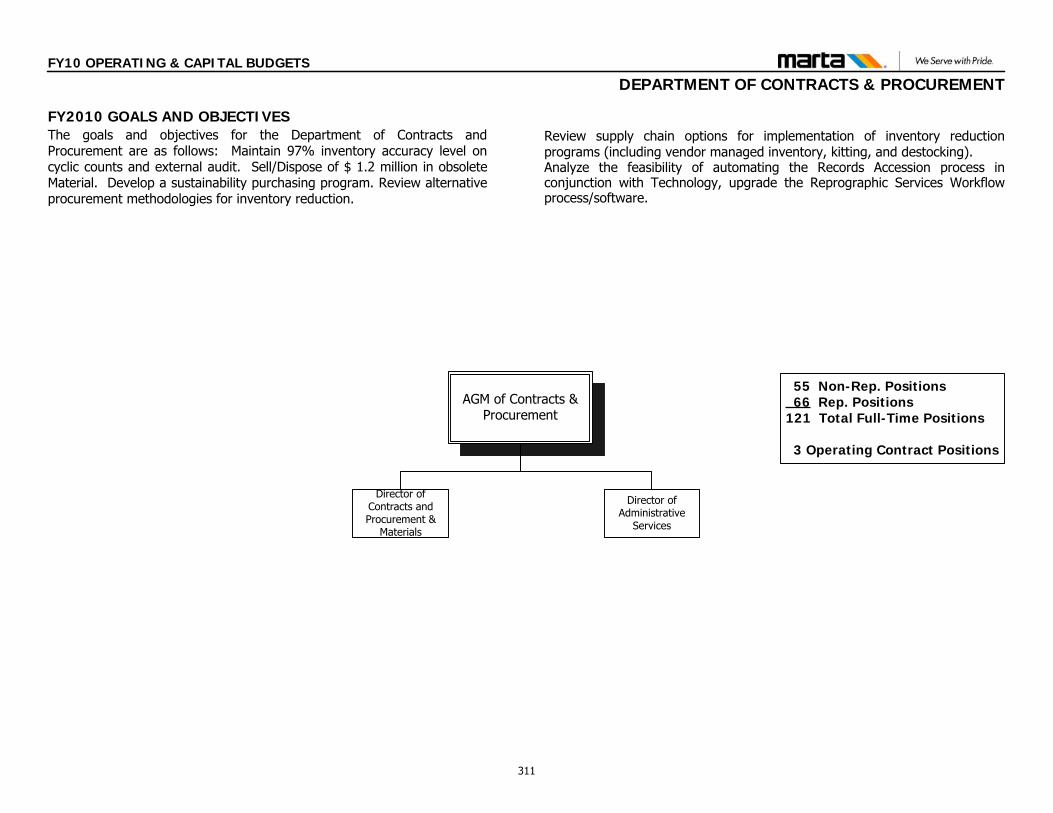
FY10 OPERATING & CAPITAL BUDGETS
DEPARTMENT OF CONTRACTS & PROCUREMENT
AGM of Contracts & Procurement
Director of Contracts and Procurement &
Materials
55 Non-Rep. Positions66 Rep. Positions
121 Total Full-Time Positions
3 Operating Contract Positions
Director of Administrative
Services
FY2010 GOALS AND OBJECTIVESThe goals and objectives for the Department of Contracts and Procurement are as follows: Maintain 97% inventory accuracy level on cyclic counts and external audit. Sell/Dispose of $ 1.2 million in obsolete Material. Develop a sustainability purchasing program. Review alternative procurement methodologies for inventory reduction.
Review supply chain options for implementation of inventory reduction programs (including vendor managed inventory, kitting, and destocking).Analyze the feasibility of automating the Records Accession process in conjunction with Technology, upgrade the Reprographic Services Workflow process/software.
311
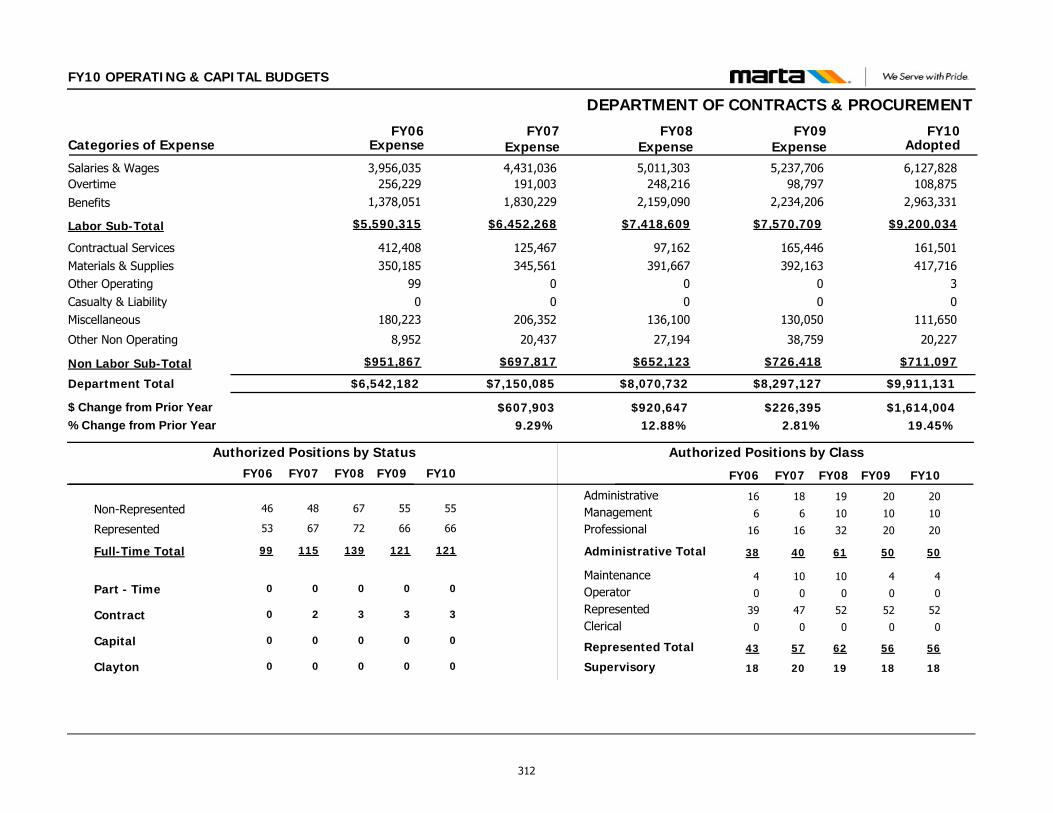
FY10 OPERATING & CAPITAL BUDGETS
DEPARTMENT OF CONTRACTS & PROCUREMENT
$9,911,131$8,297,127
161,501417,716
30
111,650
20,227
165,446392,163
00
130,050
38,759
Contractual ServicesMaterials & SuppliesOther OperatingCasualty & LiabilityMiscellaneous
Other Non Operating
Department Total
6,127,8285,237,706Salaries & Wages108,87598,797Overtime
$9,200,034$7,570,709Labor Sub-Total
FY09 FY10Categories of Expense
$6,542,182
412,408350,185
990
180,223
8,952
3,956,035256,229
$5,590,315
FY06
$7,150,085
125,467345,561
00
206,352
20,437
4,431,036191,003
$6,452,268
FY07Expense Expense Expense Adopted
$1,614,004$226,395$607,90319.45%2.81%9.29%
$ Change from Prior Year% Change from Prior Year
$8,070,732
97,162391,667
00
136,100
27,194
5,011,303248,216
$7,418,609
FY08Expense
$920,64712.88%
$711,097$726,418Non Labor Sub-Total $951,867 $697,817 $652,123
2,963,3312,234,206Benefits 1,378,051 1,830,229 2,159,090
Administrative
Clerical
Management
MaintenanceOperator
Professional
Represented
Supervisory
20
0
10
4
0
20
52
18
20
0
10
4
0
20
52
18
Non-Represented 55 55
Part - Time 0 0
Represented 66 66
Full-Time Total 121 121
Contract 3 3
Capital 0 0
Authorized Positions by Class
Administrative Total 50 50
Authorized Positions by Status
Represented Total 56 56
18
0
6
10
0
16
47
20
48
0
67
115
2
0
40
57
16
0
6
4
0
16
39
18
46
0
53
99
0
0
38
43
FY10FY09 FY07FY06 FY10FY09 FY07FY06
Clayton 0 000
67
0
72
139
3
0
FY08
0
19
0
10
10
0
32
52
19
61
62
FY08
312
FY10 OPERATING & CAPITAL BUDGETS
OFFICE OF THE AGM OF CONTRACTS & PROCUREMENT
FUNCTIONS & RESPONSIBILITIES The Office of the AGM of Contracts and Procurement takes responsibility for identifying and implementing advanced procurement and contract administrative technologies and methodologies to increase processing efficiencies and reduce costs, while improving the timely availability and quality of goods and services procured.
Other offices in the Department of Contracts and Procurement are the following:
Office of Contracts and Procurement & Materials Office of Administrative Services
The Office of Contracts & Procurement and Materials serves as the central procurement arm of the Authority, provides contract administration, contract records management, and manages the Authority's inventory of parts and consumables. Additionally, the office provides cellular communications. It is responsible for maximizing the effectiveness of the Authority's inventory required to support Operations, while minimizing inventory investment. The office of Administrative Services is responsible for the coordination of Authority-wide Policies and Procedures, Records Management, Reprographic Services, Furniture, Mail and Postal Services, Executive Meeting Services, and Cellular Communications.
313

FY10 OPERATING & CAPITAL BUDGETS
OFFICE OF THE AGM OF CONTRACTS & PROCUREMENT
$258,461$131,016
56,3570000
0
41,3610000
0
Contractual ServicesMaterials & SuppliesOther OperatingCasualty & LiabilityMiscellaneous
Other Non Operating
Office Total
135,26563,079Salaries & Wages00Overtime
$202,104$89,655Labor Sub-Total
FY09 FY10Categories of Expense
$0
00000
0
00
$0
FY06
$0
00000
0
00
$0
FY07Expense Expense Expense Adopted
$127,445$131,016$097.27%100.00%0.00%
$ Change from Prior Year% Change from Prior Year
$0
00000
0
00
$0
FY08Expense
$00.00%
$56,357$41,361Non Labor Sub-Total $0 $0 $0
66,84026,576Benefits 0 0 0
Administrative
Clerical
Management
MaintenanceOperator
Professional
Represented
Supervisory
0
0
1
0
0
0
0
0
0
0
1
0
0
0
0
0
Non-Represented 1 1
Part - Time 0 0
Represented 0 0
Full-Time Total 1 1
Contract 0 0
Capital 0 0
Authorized Positions by Class
Administrative Total 1 1
Authorized Positions by Status
Represented Total 0 0
0
0
0
0
0
0
0
0
0
0
0
0
0
0
0
0
0
0
0
0
0
0
0
0
0
0
0
0
0
0
0
0
FY10FY09 FY07FY06 FY10FY09 FY07FY06
Clayton 0 000
1
0
0
1
0
0
FY08
0
0
0
1
0
0
0
0
0
1
0
FY08
314
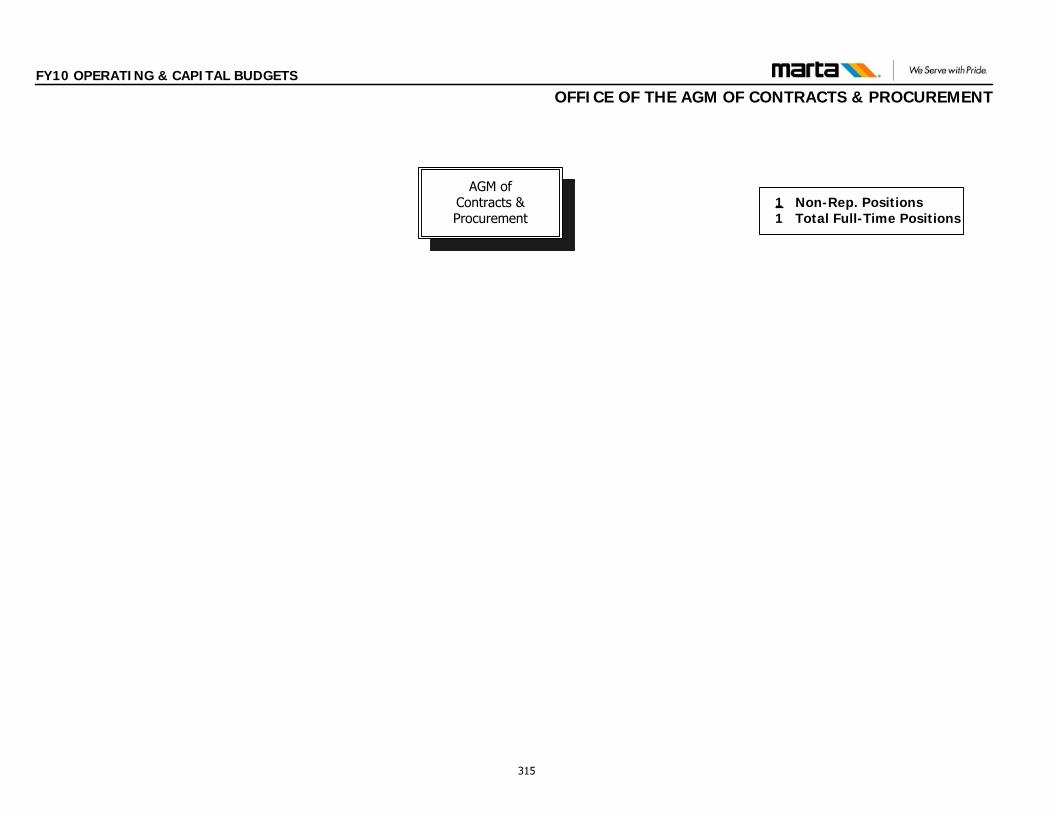
FY10 OPERATING & CAPITAL BUDGETS
OFFICE OF THE AGM OF CONTRACTS & PROCUREMENT
1 Non-Rep. Positions1 Total Full-Time Positions
AGM of Contracts & Procurement
315
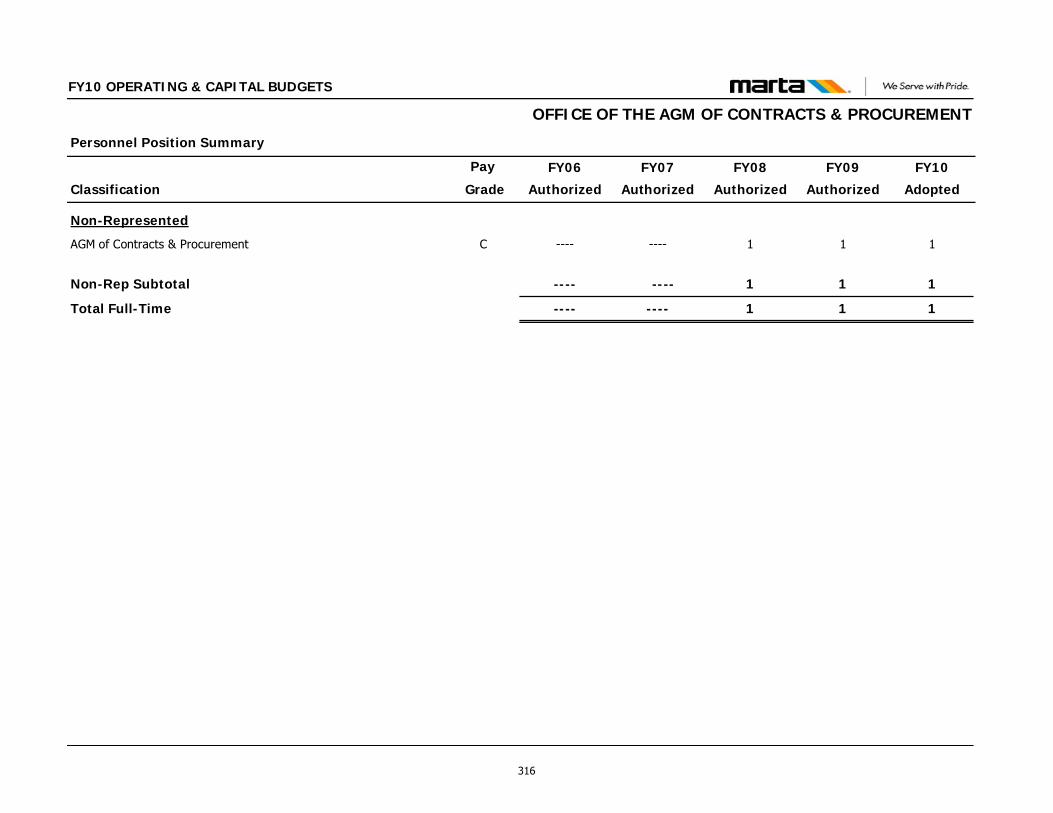
Classification
Personnel Position Summary
Pay FY09
Authorized
FY10
Adopted
FY10 OPERATING & CAPITAL BUDGETS
FY08
Authorized
FY07
Authorized
FY06
Authorized Grade
OFFICE OF THE AGM OF CONTRACTS & PROCUREMENT
Non-Represented
AGM of Contracts & Procurement C 1 11--------
Non-Rep Subtotal 1 11 --------
Total Full-Time 1 11--------
316
FY10 OPERATING & CAPITAL BUDGETS
OFFICE OF CONTRACTS & PROCUREMENT AND MATERIALS
FUNCTIONS & RESPONSIBILITIES The Office of Contracts & Procurement and Materials serves as the central procurement arm of the Authority, provides contract administration, contract records management, and manages the Authority's inventory of parts and consumables. Additionally, the office provides cellular communications. The Office has the responsibility for contract development, procurement and related administrative functions, all in accordance with applicable federal and state requirements.
The Office has responsibility for storeroom operations and inventory provisioning and replenishment of parts and consumables. It is responsible for both traditional-type requirements for goods, supplies, and services, as well as for the most advanced contract types, such as those for transit-oriented development, fast track, architectural and engineering, turnkey-design, and design/build.
317
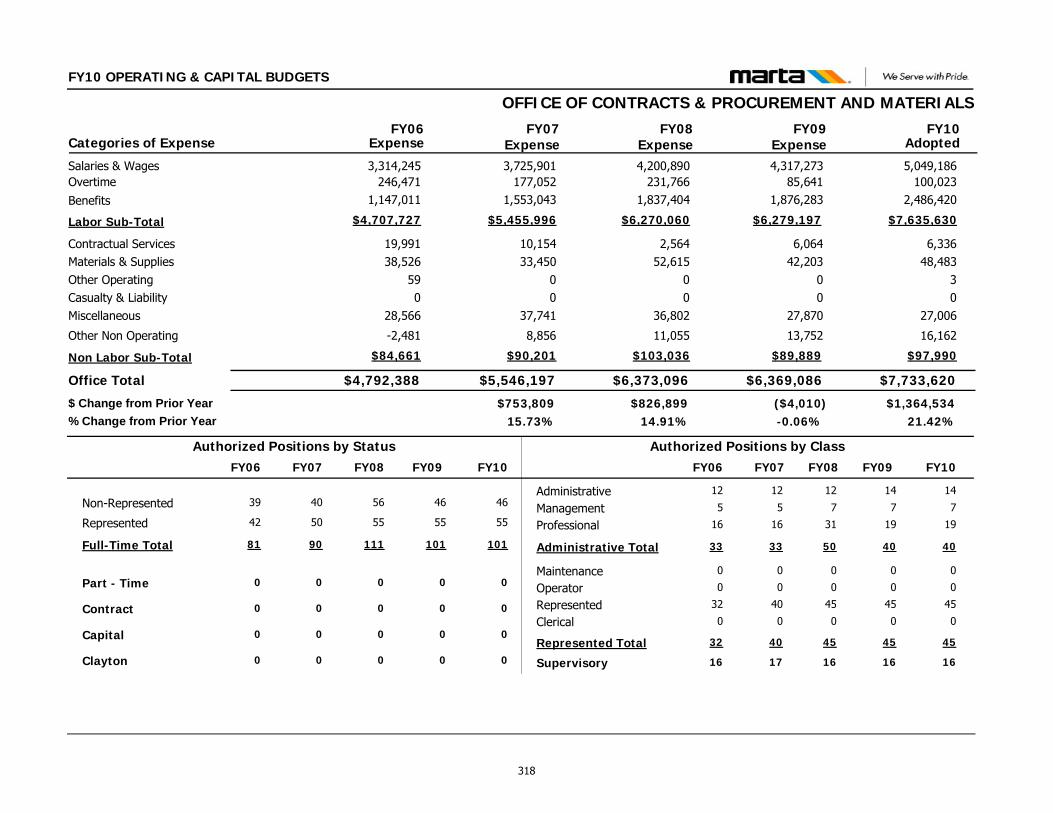
FY10 OPERATING & CAPITAL BUDGETS
OFFICE OF CONTRACTS & PROCUREMENT AND MATERIALS
$7,733,620$6,369,086
6,33648,483
30
27,006
16,162
6,06442,203
00
27,870
13,752
Contractual ServicesMaterials & SuppliesOther OperatingCasualty & LiabilityMiscellaneous
Other Non Operating
Office Total
5,049,1864,317,273Salaries & Wages100,02385,641Overtime
$7,635,630$6,279,197Labor Sub-Total
FY09 FY10Categories of Expense
$4,792,388
19,99138,526
590
28,566
-2,481
3,314,245246,471
$4,707,727
FY06
$5,546,197
10,15433,450
00
37,741
8,856
3,725,901177,052
$5,455,996
FY07Expense Expense Expense Adopted
$1,364,534($4,010)$753,80921.42%-0.06%15.73%
$ Change from Prior Year% Change from Prior Year
$6,373,096
2,56452,615
00
36,802
11,055
4,200,890231,766
$6,270,060
FY08Expense
$826,89914.91%
$97,990$89,889Non Labor Sub-Total $84,661 $90,201 $103,036
2,486,4201,876,283Benefits 1,147,011 1,553,043 1,837,404
Administrative
Clerical
Management
MaintenanceOperator
Professional
Represented
Supervisory
14
0
7
0
0
19
45
16
14
0
7
0
0
19
45
16
Non-Represented 46 46
Part - Time 0 0
Represented 55 55
Full-Time Total 101 101
Contract 0 0
Capital 0 0
Authorized Positions by Class
Administrative Total 40 40
Authorized Positions by Status
Represented Total 45 45
12
0
5
0
0
16
40
17
40
0
50
90
0
0
33
40
12
0
5
0
0
16
32
16
39
0
42
81
0
0
33
32
FY10FY09 FY07FY06 FY10FY09 FY07FY06
Clayton 0 000
56
0
55
111
0
0
FY08
0
12
0
7
0
0
31
45
16
50
45
FY08
318
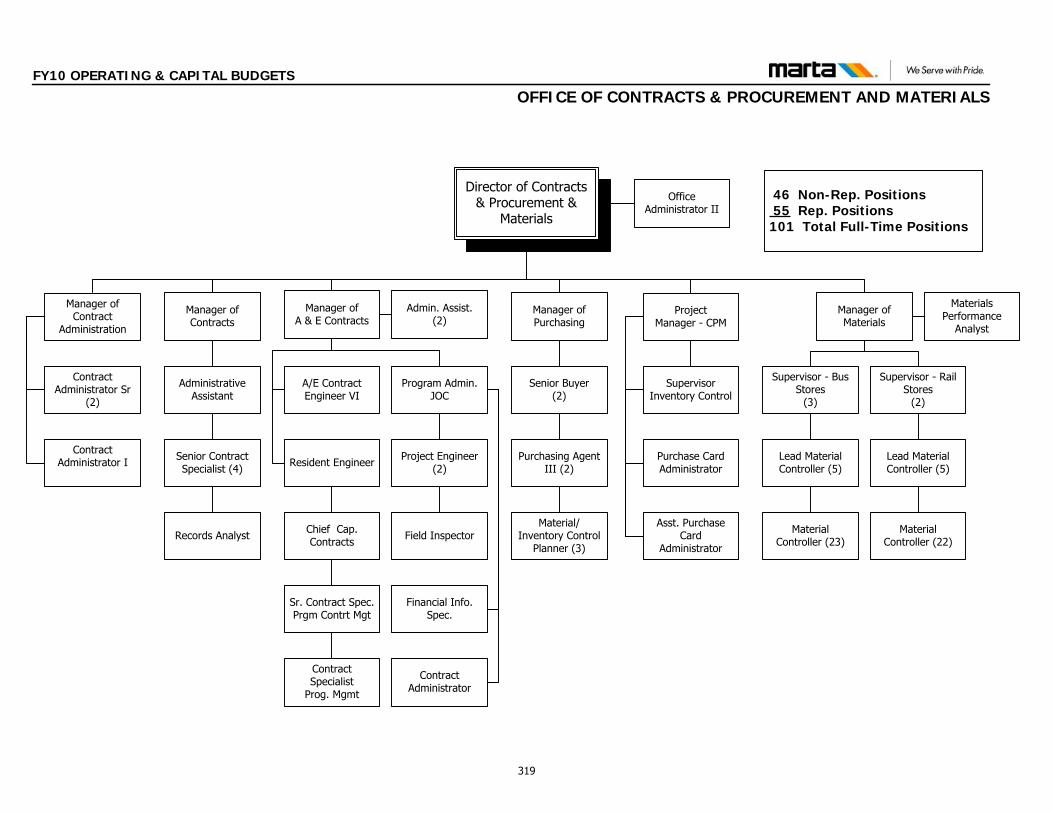
FY10 OPERATING & CAPITAL BUDGETS
OFFICE OF CONTRACTS & PROCUREMENT AND MATERIALS
Director of Contracts & Procurement &
Materials
Manager of Purchasing
Office Administrator II
Administrative Assistant
Purchasing Agent III (2)
Records Analyst Material/
Inventory Control Planner (3)
Purchase Card Administrator
46 Non-Rep. Positions55 Rep. Positions
101 Total Full-Time Positions
Manager of Materials
ProjectManager - CPM
Supervisor - Bus Stores
(3)
Supervisor - Rail Stores
(2)
Materials Performance
Analyst
Lead Material Controller (5)
Material Controller (23)
Lead Material Controller (5)
Material Controller (22)
Manager of Contracts
Senior Buyer(2)
Supervisor Inventory Control
Senior Contract Specialist (4)
Manager of Contract
Administration
Contract Administrator Sr
(2)
Contract Administrator I
Asst. Purchase Card
Administrator
Resident Engineer
Manager of A & E Contracts
Chief Cap. Contracts
Project Engineer (2)
Program Admin. JOC
Admin. Assist.(2)
Sr. Contract Spec. Prgm Contrt Mgt
Field Inspector
Financial Info. Spec.
Contract Administrator
Contract Specialist
Prog. Mgmt
A/E Contract Engineer VI
319
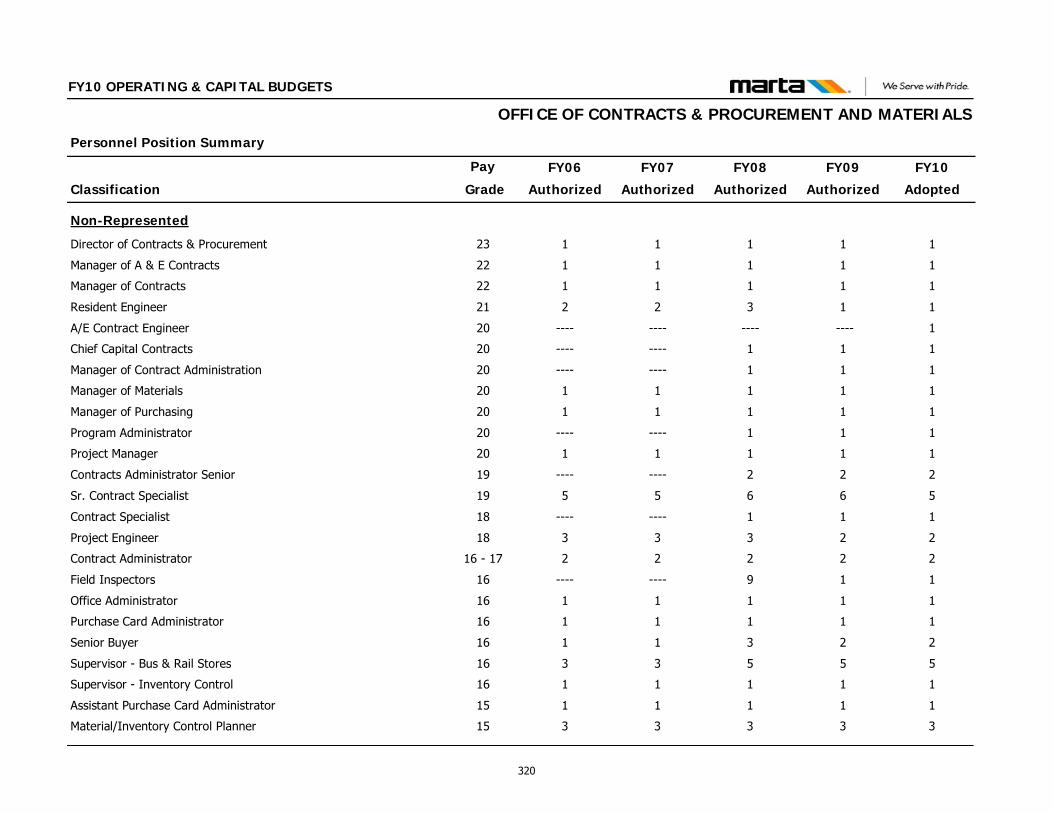
Classification
Personnel Position Summary
Pay FY09
Authorized
FY10
Adopted
FY10 OPERATING & CAPITAL BUDGETS
FY08
Authorized
FY07
Authorized
FY06
Authorized Grade
OFFICE OF CONTRACTS & PROCUREMENT AND MATERIALS
Non-Represented
Director of Contracts & Procurement 23 1 1111
Manager of A & E Contracts 22 1 1111
Manager of Contracts 22 1 1111
Resident Engineer 21 1 1322
A/E Contract Engineer 20 ---- 1------------
Chief Capital Contracts 20 1 11--------
Manager of Contract Administration 20 1 11--------
Manager of Materials 20 1 1111
Manager of Purchasing 20 1 1111
Program Administrator 20 1 11--------
Project Manager 20 1 1111
Contracts Administrator Senior 19 2 22--------
Sr. Contract Specialist 19 6 5655
Contract Specialist 18 1 11--------
Project Engineer 18 2 2333
Contract Administrator 16 - 17 2 2222
Field Inspectors 16 1 19--------
Office Administrator 16 1 1111
Purchase Card Administrator 16 1 1111
Senior Buyer 16 2 2311
Supervisor - Bus & Rail Stores 16 5 5533
Supervisor - Inventory Control 16 1 1111
Assistant Purchase Card Administrator 15 1 1111
Material/Inventory Control Planner 15 3 3333
320
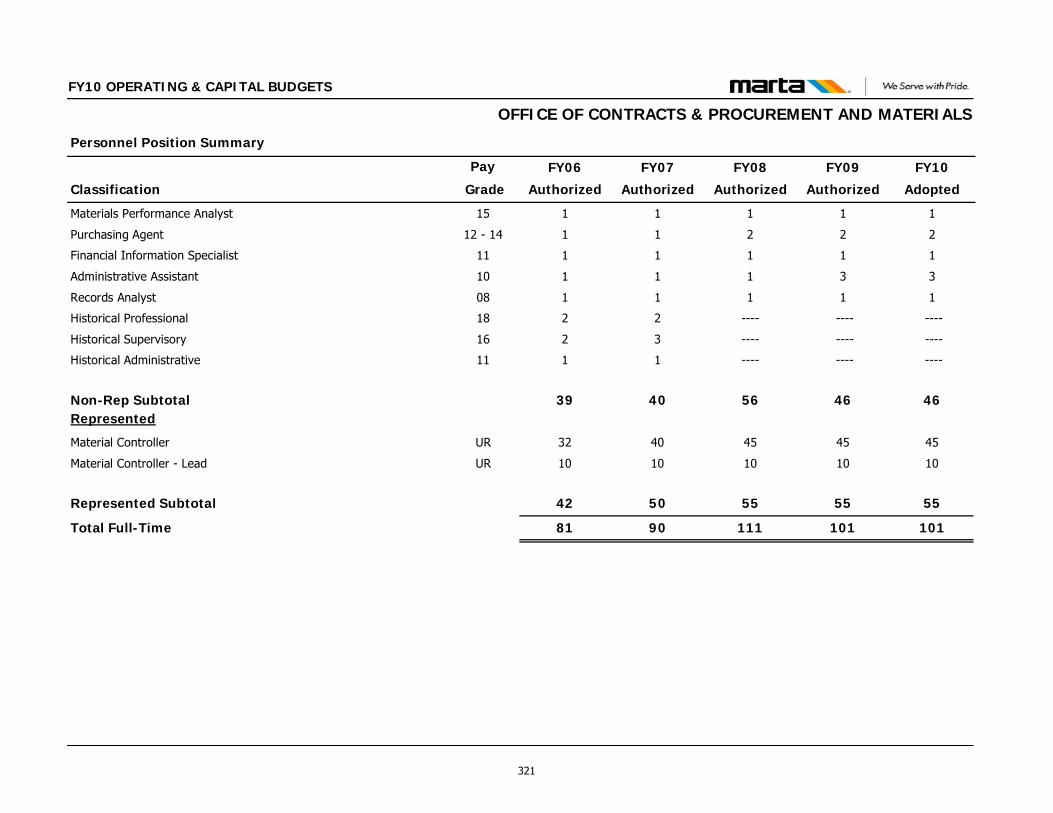
Classification
Personnel Position Summary
Pay FY09
Authorized
FY10
Adopted
FY10 OPERATING & CAPITAL BUDGETS
FY08
Authorized
FY07
Authorized
FY06
Authorized Grade
OFFICE OF CONTRACTS & PROCUREMENT AND MATERIALS
Materials Performance Analyst 15 1 1111
Purchasing Agent 12 - 14 2 2211
Financial Information Specialist 11 1 1111
Administrative Assistant 10 3 3111
Records Analyst 08 1 1111
Historical Professional 18 ---- --------22
Historical Supervisory 16 ---- --------32
Historical Administrative 11 ---- --------11
Non-Rep Subtotal 46 46564039Represented
Material Controller UR 45 45454032
Material Controller - Lead UR 10 10101010
Represented Subtotal 55 55555042
Total Full-Time 101 1011119081
321
FY10 OPERATING & CAPITAL BUDGETS
OFFICE OF ADMINISTRATIVE SERVICES
FUNCTIONS & RESPONSIBILITIES The Office of Administrative Services’ primary responsibility is to provide the Authority with specialized support services to assist MARTA staff in the execution of their duties. Services provided include coordination of Authority-wide Policies and Procedures and Records Management in accordance with the State of Georgia Records and Open Records Acts, Reprographic Services, Furniture and Facilities Administration, Mail and Postal Services, Executive Meeting Services, and Cellular Communications. The programs provided by the Office of Administrative Services support the Authority’s missions and goals. The Office of Administrative Services seeks constantly to provide quality, cost-effective service to our internal customers.
FY09 ACCOMPLISHMENTS Upgraded all printing equipment and accessories for the High
Volume Print Shop. Specified, requisitioned and installed furniture and accessories for
all (40) Authority Rail Station Staff and Ready Rooms.
322
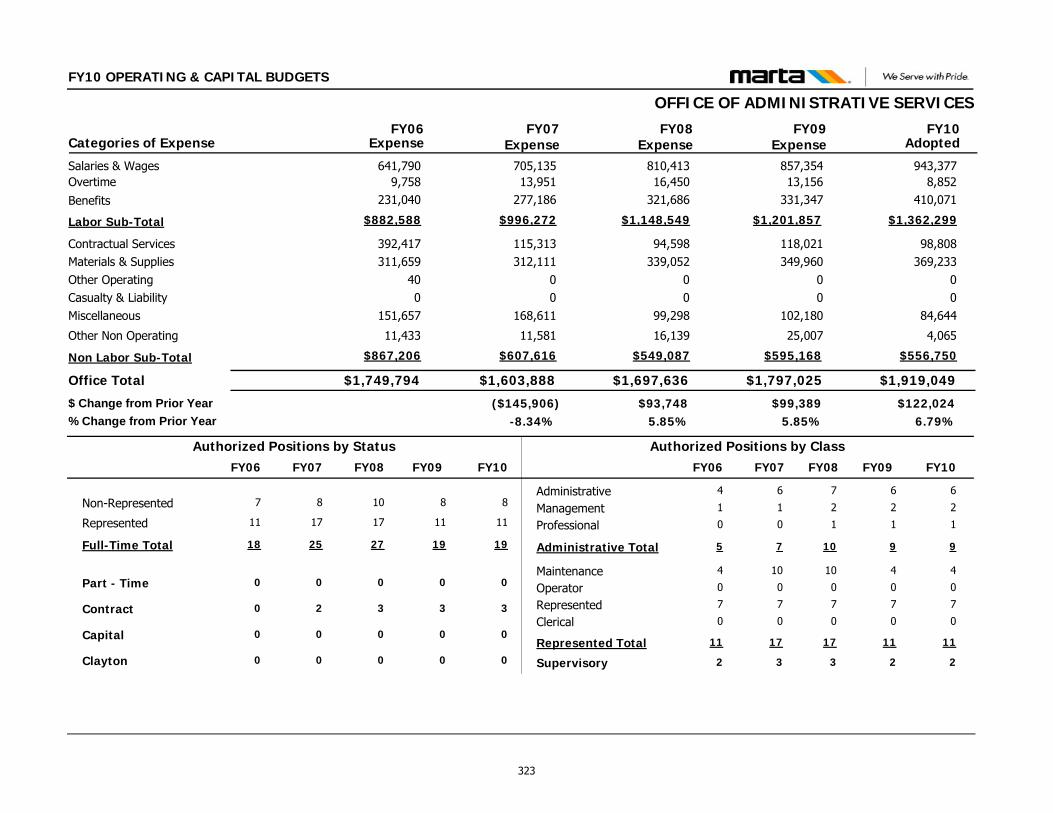
FY10 OPERATING & CAPITAL BUDGETS
OFFICE OF ADMINISTRATIVE SERVICES
$1,919,049$1,797,025
98,808369,233
00
84,644
4,065
118,021349,960
00
102,180
25,007
Contractual ServicesMaterials & SuppliesOther OperatingCasualty & LiabilityMiscellaneous
Other Non Operating
Office Total
943,377857,354Salaries & Wages8,85213,156Overtime
$1,362,299$1,201,857Labor Sub-Total
FY09 FY10Categories of Expense
$1,749,794
392,417311,659
400
151,657
11,433
641,7909,758
$882,588
FY06
$1,603,888
115,313312,111
00
168,611
11,581
705,13513,951
$996,272
FY07Expense Expense Expense Adopted
$122,024$99,389($145,906)6.79%5.85%-8.34%
$ Change from Prior Year% Change from Prior Year
$1,697,636
94,598339,052
00
99,298
16,139
810,41316,450
$1,148,549
FY08Expense
$93,7485.85%
$556,750$595,168Non Labor Sub-Total $867,206 $607,616 $549,087
410,071331,347Benefits 231,040 277,186 321,686
Administrative
Clerical
Management
MaintenanceOperator
Professional
Represented
Supervisory
6
0
2
4
0
1
7
2
6
0
2
4
0
1
7
2
Non-Represented 8 8
Part - Time 0 0
Represented 11 11
Full-Time Total 19 19
Contract 3 3
Capital 0 0
Authorized Positions by Class
Administrative Total 9 9
Authorized Positions by Status
Represented Total 11 11
6
0
1
10
0
0
7
3
8
0
17
25
2
0
7
17
4
0
1
4
0
0
7
2
7
0
11
18
0
0
5
11
FY10FY09 FY07FY06 FY10FY09 FY07FY06
Clayton 0 000
10
0
17
27
3
0
FY08
0
7
0
2
10
0
1
7
3
10
17
FY08
323
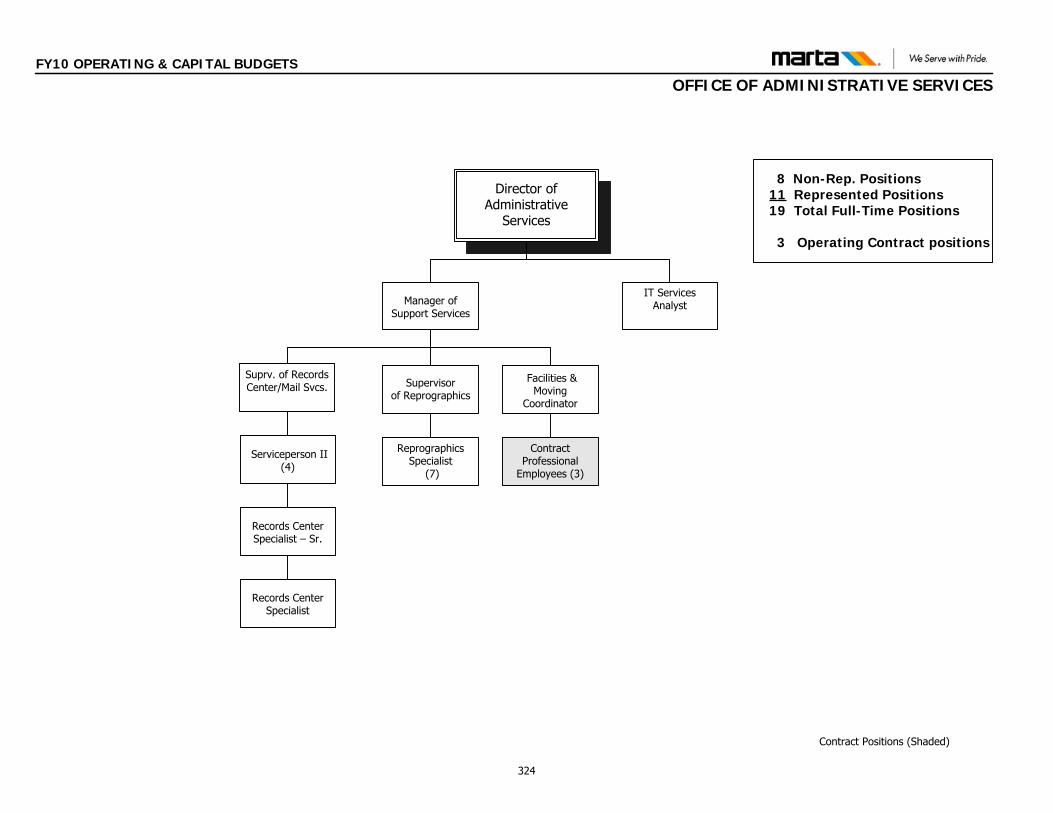
FY10 OPERATING & CAPITAL BUDGETS
OFFICE OF ADMINISTRATIVE SERVICES
Director of Administrative
Services
Supervisor of Reprographics
Reprographics Specialist
(7)
Records Center Specialist – Sr.
Serviceperson II (4)
Facilities & Moving
Coordinator
Manager of Support Services
Contract Professional
Employees (3)
Records Center Specialist
Contract Positions (Shaded)
Suprv. of Records Center/Mail Svcs.
8 Non-Rep. Positions11 Represented Positions19 Total Full-Time Positions
3 Operating Contract positions
IT Services Analyst
Contract Positions (Shaded)
324
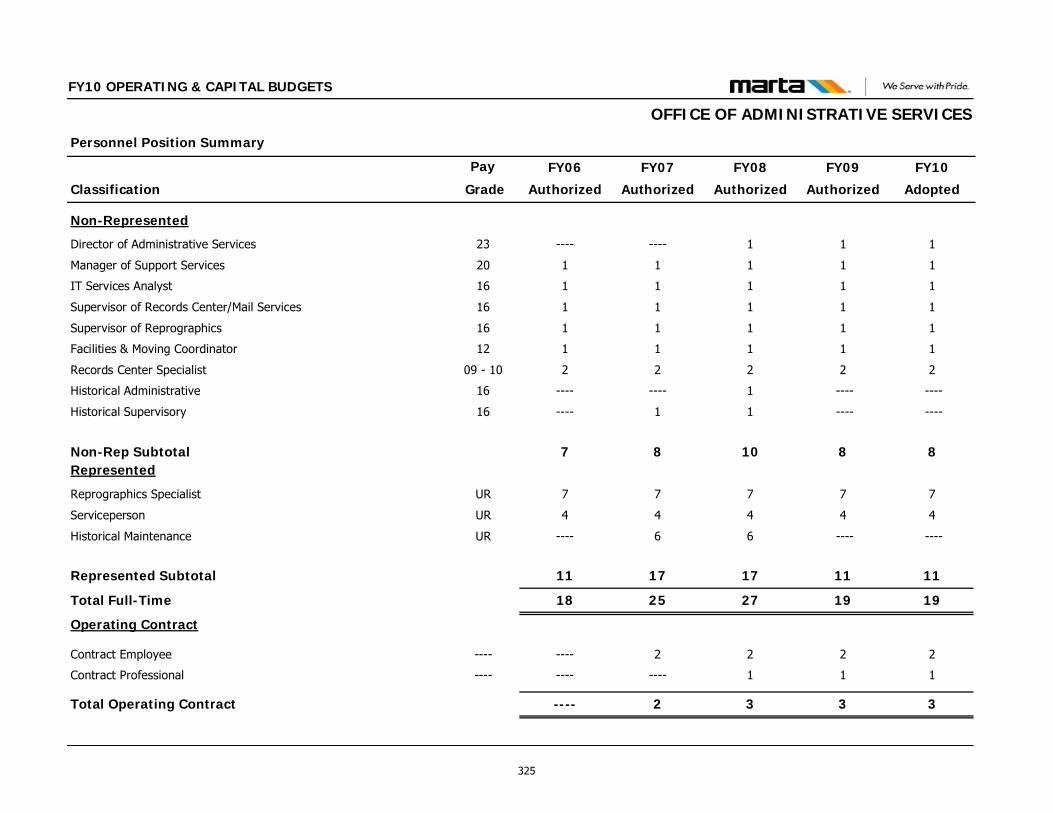
Classification
Personnel Position Summary
Pay FY09
Authorized
FY10
Adopted
FY10 OPERATING & CAPITAL BUDGETS
FY08
Authorized
FY07
Authorized
FY06
Authorized Grade
OFFICE OF ADMINISTRATIVE SERVICES
Non-Represented
Director of Administrative Services 23 1 11--------
Manager of Support Services 20 1 1111
IT Services Analyst 16 1 1111
Supervisor of Records Center/Mail Services 16 1 1111
Supervisor of Reprographics 16 1 1111
Facilities & Moving Coordinator 12 1 1111
Records Center Specialist 09 - 10 2 2222
Historical Administrative 16 ---- ----1--------
Historical Supervisory 16 ---- ----11----
Non-Rep Subtotal 8 81087Represented
Reprographics Specialist UR 7 7777
Serviceperson UR 4 4444
Historical Maintenance UR ---- ----66----
Represented Subtotal 11 11171711
Total Full-Time 19 19272518
Operating Contract
Contract Employee ---- 2 222----
Contract Professional ---- 1 11--------
Total Operating Contract 3 332----
325

This page intentionally left blank
326
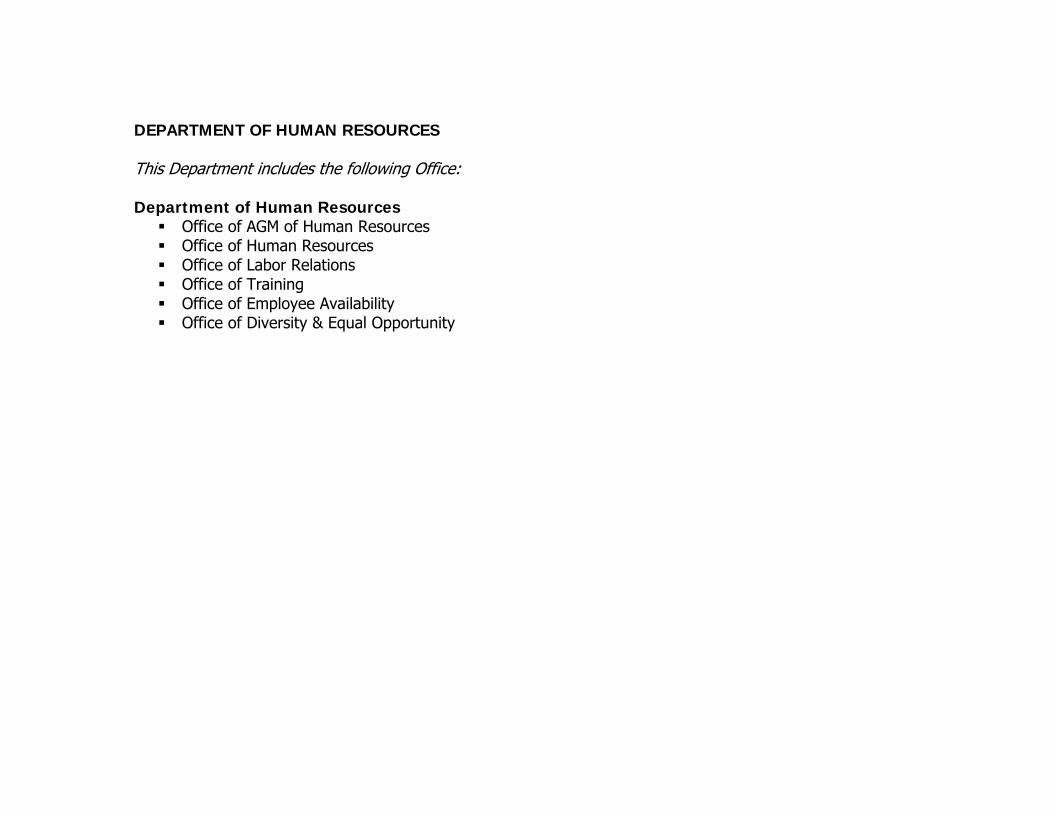
DEPARTMENT OF HUMAN RESOURCES This Department includes the following Office: Department of Human Resources Office of AGM of Human Resources Office of Human Resources Office of Labor Relations Office of Training Office of Employee Availability Office of Diversity & Equal Opportunity
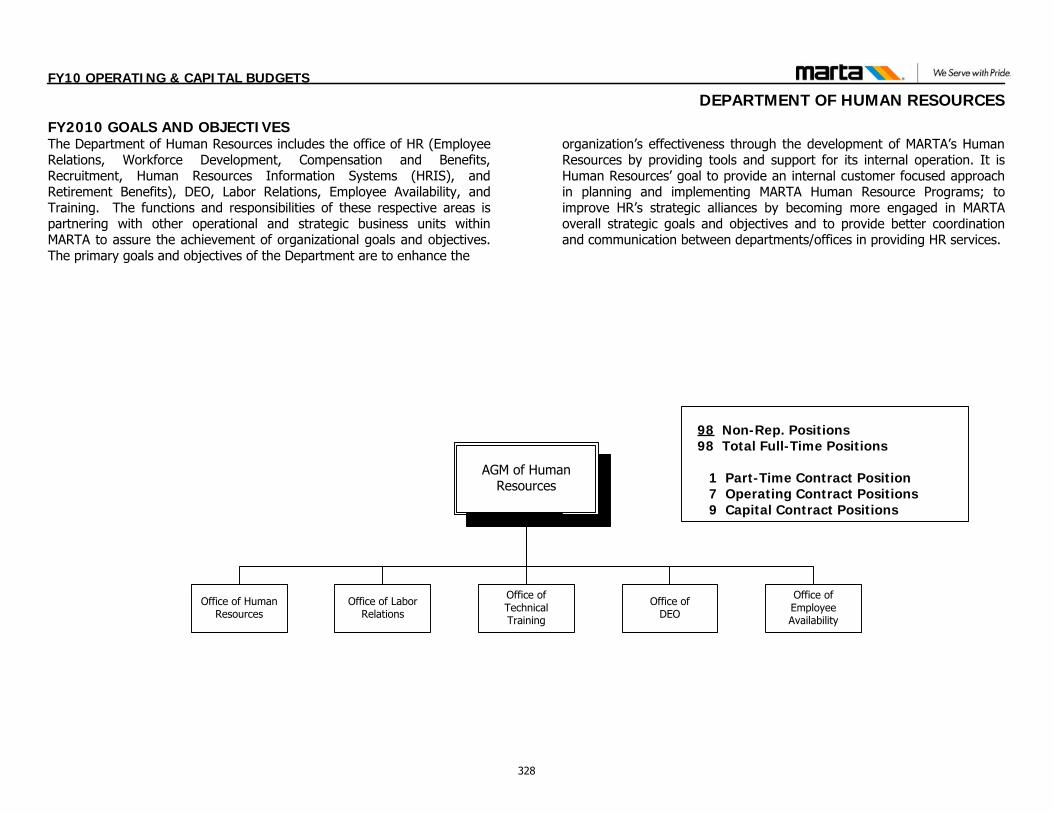
FY10 OPERATING & CAPITAL BUDGETS
DEPARTMENT OF HUMAN RESOURCES
AGM of Human Resources
Office of Human Resources
98 Non-Rep. Positions 98 Total Full-Time Positions
1 Part-Time Contract Position 7 Operating Contract Positions 9 Capital Contract Positions
Office of Labor Relations
Office of Technical Training
Office of DEO
Office of Employee Availability
FY2010 GOALS AND OBJECTIVESThe Department of Human Resources includes the office of HR (Employee Relations, Workforce Development, Compensation and Benefits, Recruitment, Human Resources Information Systems (HRIS), and Retirement Benefits), DEO, Labor Relations, Employee Availability, and Training. The functions and responsibilities of these respective areas is partnering with other operational and strategic business units within MARTA to assure the achievement of organizational goals and objectives. The primary goals and objectives of the Department are to enhance the
organization’s effectiveness through the development of MARTA’s Human Resources by providing tools and support for its internal operation. It is Human Resources’ goal to provide an internal customer focused approach in planning and implementing MARTA Human Resource Programs; to improve HR’s strategic alliances by becoming more engaged in MARTA overall strategic goals and objectives and to provide better coordination and communication between departments/offices in providing HR services.
328
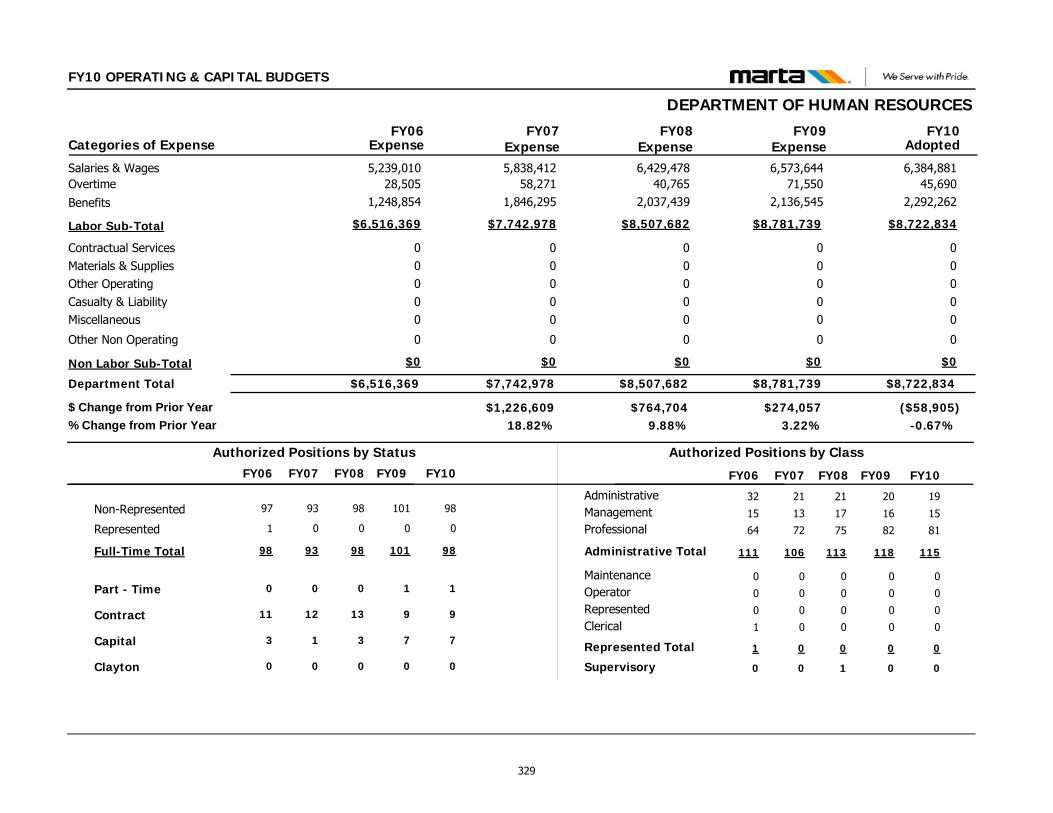
FY10 OPERATING & CAPITAL BUDGETS
DEPARTMENT OF HUMAN RESOURCES
$8,722,834$8,781,739
00000
0
00000
0
Contractual ServicesMaterials & SuppliesOther OperatingCasualty & LiabilityMiscellaneous
Other Non Operating
Department Total
6,384,8816,573,644Salaries & Wages45,69071,550Overtime
$8,722,834$8,781,739Labor Sub-Total
FY09 FY10Categories of Expense
$6,516,369
00000
0
5,239,01028,505
$6,516,369
FY06
$7,742,978
00000
0
5,838,41258,271
$7,742,978
FY07Expense Expense Expense Adopted
($58,905)$274,057$1,226,609-0.67%3.22%18.82%
$ Change from Prior Year% Change from Prior Year
$8,507,682
00000
0
6,429,47840,765
$8,507,682
FY08Expense
$764,7049.88%
$0$0Non Labor Sub-Total $0 $0 $0
2,292,2622,136,545Benefits 1,248,854 1,846,295 2,037,439
Administrative
Clerical
Management
MaintenanceOperator
Professional
Represented
Supervisory
20
0
16
0
0
82
0
0
19
0
15
0
0
81
0
0
Non-Represented 101 98
Part - Time 1 1
Represented 0 0
Full-Time Total 101 98
Contract 9 9
Capital 7 7
Authorized Positions by Class
Administrative Total 118 115
Authorized Positions by Status
Represented Total 0 0
21
0
13
0
0
72
0
0
93
0
0
93
12
1
106
0
32
1
15
0
0
64
0
0
97
0
1
98
11
3
111
1
FY10FY09 FY07FY06 FY10FY09 FY07FY06
Clayton 0 000
98
0
0
98
13
3
FY08
0
21
0
17
0
0
75
0
1
113
0
FY08
329
FY10 OPERATING & CAPITAL BUDGETS
OFFICE OF THE AGM OF HUMAN RESOURCES
FUNCTIONS & RESPONSIBILITES The Office of the Assistant General Manager of Human Resources (HR) partners with other operational and strategic business units within MARTA to assure the achievement of organizational goals and objectives. A primary responsibility of this office is to enhance the organization's effectiveness through the development of MARTA's human resources. We provide oversight that ensures the department's vision is actualized - "Providing tools and support to inspire MARTA employees toward excellence". The HR Department is comprised of the Offices of HR (Employee Relations, Workforce Development, Compensation and Benefits, Recruitment, Human Resources Information Systems (HRIS), and Retirement Benefits), DEO, Labor Relations, Employee Availability, and Training. The myriad of comprehensive employee-focused services the department provides is appropriately aligned with its mission. Human Resources is the primary source to attract, develop, motivate, and retain a diverse team of highly skilled employees who are accountable for recognizing and responding to our customers needs while promoting organizational and individual achievement.
The critical role that the HR Department plays in the organization is demonstrated by its ability to effectively balance the needs of both employees and the organization. The HR Department provides the following comprehensive services: Recruitment, Tuition Reimbursement, Employee Assistance Program, Health Benefits, HRIS and Employee Records, Labor Contract Administration, Occupational Medical Services, Alternative Dispute Resolution, Pension Administration, Employee Recognition, Transitional Employment, Employee Wellness, Salary Administration, Training and Employee and Organizational Development.
FY09 ACCOMPLISHMENTS Initiated a study of Human Resources practices and policies
which will be performed by the Hay Group. The study officially began in February 2009, and is expected to be completed by November 2009. The primary focus of the study is compensation and benefits, but it will also include, training, succession planning and leadership development. In preparation for the study, HR led an effort to update all of the Authority’s job descriptions and participated in 25 salary surveys to provide up-to-date market
data. Meetings have been held with MARTA management, union leadership and HR management, as well as site visits to various
MARTA locations. Focus groups will be held with employees and communications will be developed to describe the project and its results.
Served as an advocate of the Authority's commitment to the promotion of a work environment that recognizes and values the diverse social profile of the MARTA service area. As such, the office ensures the equitable representation and advancement of protected group members at all levels of employment, the utilization of small, socially and economically disadvantaged businesses in contracts and procurements, the equitable distribution of transit service and benefits, as well as the non-discriminatory impact of Authority decisions and activities.
These objectives are accomplished through a multiplicity of means. First, all Authority employment decisions, practices, and procedures are reviewed to ensure that they are fair and equitable. Second, the maximization of small, socially and economically disadvantaged business enterprises is done through goal setting, monitoring of participation commitments, outreach efforts, and DBE certifications. Third, Title VI and Environmental Justice programs are designed and implemented to review, monitor, and ensure that there is a consistently equitable distribution of transit services and benefits. Finally, strategically targeted outreach efforts are designed to solicit and gauge community input to facilitate the examination of all facts and ensure the non-discriminatory impact of the Authority's decisions and activities.
Analyzed daily, monthly and quarterly mystery shopper reports to ensure agency compliance with ADA (Americans with Disabilities Act) requirements and to track key customer service performance.
Delivered over 34,269 hours of employee training – Employees
attending one or more training event resulted in 4,694 individual employee training activities completed during FY09.
330
FY10 OPERATING & CAPITAL BUDGETS
OFFICE OF THE AGM OF HUMAN RESOURCES
Effectively managed the implementation of a successful Joint ATU/MARTA Training Partnership designed to address skill development needs in various represented crafts. This program is ongoing and is providing key information needed to define the
training required to improve operational quality and efficiency. Resolved the long standing issue between MARTA and ATU
involving the subcontracting of maintenance work on MARTA’s Rail Car fleet. MARTA has paid approximately $2M in arbitration decisions and revised settlements during this time. This final settlement reached on April 20, 2009, encompasses many other
elements of contention between the parties, such as backlogged grievances, AM/PM Extra board, Faregate Technicians work, PTO program, baseline of maintenance jobs, a new grievance process, and maintenance overtime boards. This is a major accomplishment for MARTA and ATU to resolve these issues.
Assessed and identified absence patterns and outcomes of how absences are administered and managed to drive attendance strategies in designing absence management best practices and making sure that process and policy are aligned.
331
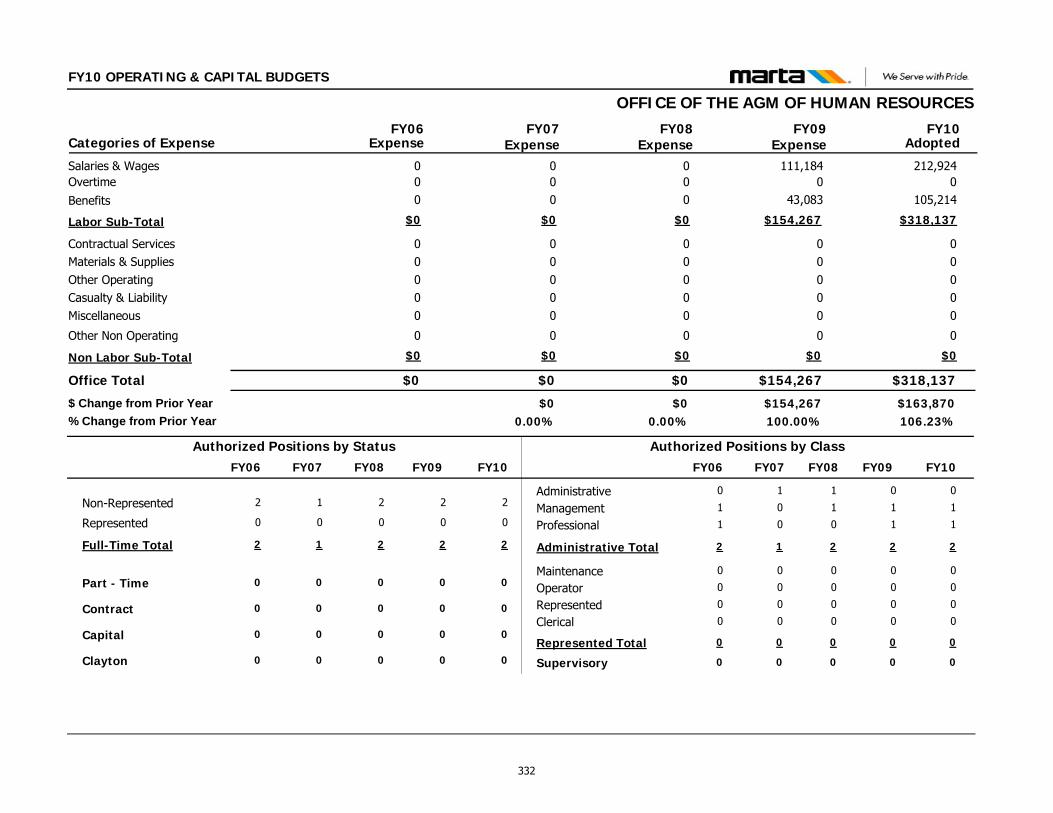
FY10 OPERATING & CAPITAL BUDGETS
OFFICE OF THE AGM OF HUMAN RESOURCES
$318,137$154,267
00000
0
00000
0
Contractual ServicesMaterials & SuppliesOther OperatingCasualty & LiabilityMiscellaneous
Other Non Operating
Office Total
212,924111,184Salaries & Wages00Overtime
$318,137$154,267Labor Sub-Total
FY09 FY10Categories of Expense
$0
00000
0
00
$0
FY06
$0
00000
0
00
$0
FY07Expense Expense Expense Adopted
$163,870$154,267$0106.23%100.00%0.00%
$ Change from Prior Year% Change from Prior Year
$0
00000
0
00
$0
FY08Expense
$00.00%
$0$0Non Labor Sub-Total $0 $0 $0
105,21443,083Benefits 0 0 0
Administrative
Clerical
Management
MaintenanceOperator
Professional
Represented
Supervisory
0
0
1
0
0
1
0
0
0
0
1
0
0
1
0
0
Non-Represented 2 2
Part - Time 0 0
Represented 0 0
Full-Time Total 2 2
Contract 0 0
Capital 0 0
Authorized Positions by Class
Administrative Total 2 2
Authorized Positions by Status
Represented Total 0 0
1
0
0
0
0
0
0
0
1
0
0
1
0
0
1
0
0
0
1
0
0
1
0
0
2
0
0
2
0
0
2
0
FY10FY09 FY07FY06 FY10FY09 FY07FY06
Clayton 0 000
2
0
0
2
0
0
FY08
0
1
0
1
0
0
0
0
0
2
0
FY08
332
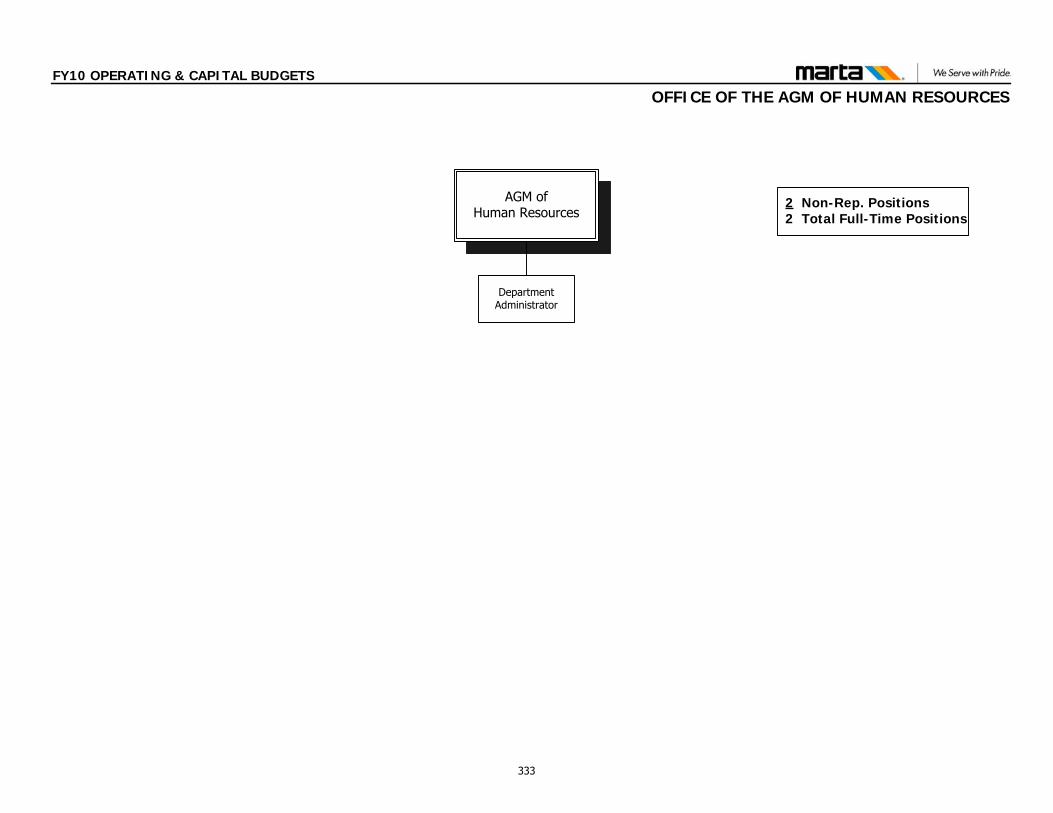
FY10 OPERATING & CAPITAL BUDGETS
OFFICE OF THE AGM OF HUMAN RESOURCES
AGM of Human Resources
2 Non-Rep. Positions 2 Total Full-Time Positions
Department Administrator
333
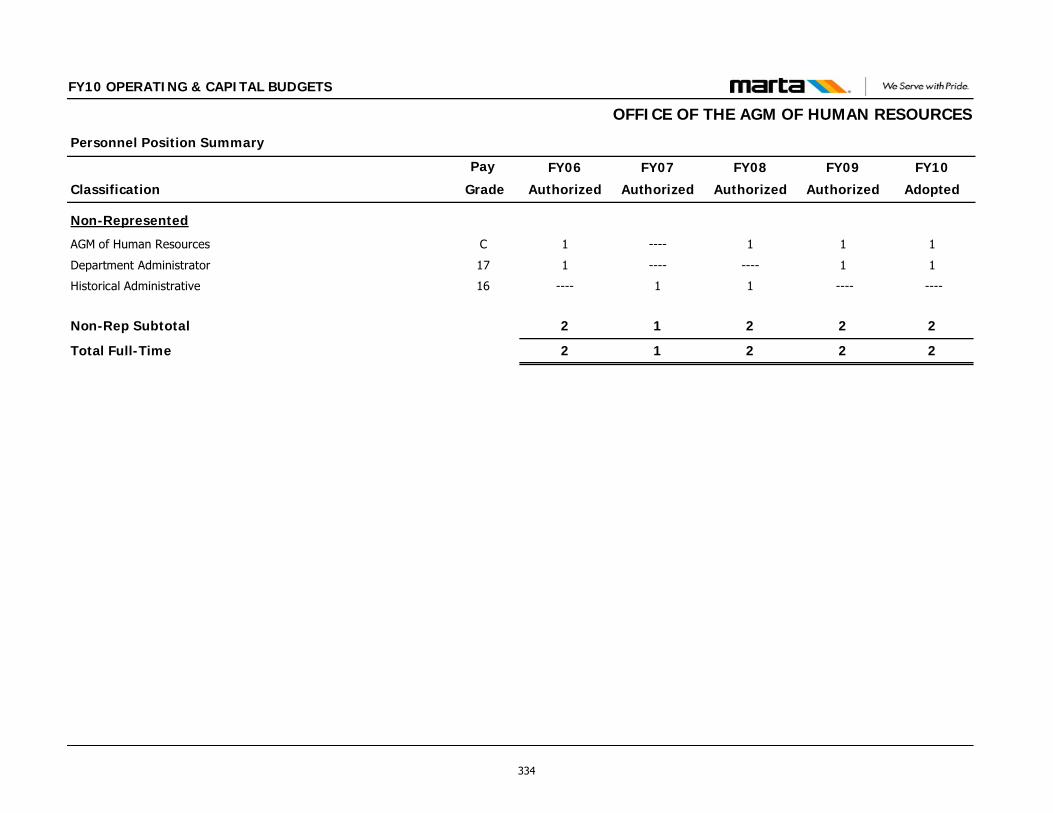
Classification
Personnel Position Summary
Pay FY09
Authorized
FY10
Adopted
FY10 OPERATING & CAPITAL BUDGETS
FY08
Authorized
FY07
Authorized
FY06
Authorized Grade
OFFICE OF THE AGM OF HUMAN RESOURCES
Non-Represented
AGM of Human Resources C 1 11----1
Department Administrator 17 1 1--------1
Historical Administrative 16 ---- ----11----
Non-Rep Subtotal 2 2212
Total Full-Time 2 2212
334
FY10 OPERATING & CAPITAL BUDGETS
OFFICE OF HUMAN RESOURCES FUNCTIONS & RESPONSIBILITES The Office of Human Resource partners with other operational and strategic business units within MARTA to assure the achievement of organizational goals and objectives. A primary responsibility of this office is to enhance the organization's effectiveness through the development of MARTA's human resources. We provide oversight that ensures the office's vision is actualized - "Providing tools and support to inspire MARTA employees toward excellence". The HR Office is comprised of the Branches of Employee Relations & Workforce Development, Compensation & Benefits, Recruiting, Human Resources Information (HRIS) and Retirement Benefits. The myriad of comprehensive employee-focused services the office provides is appropriately aligned with its mission. Human Resources is the primary source to attract, develop, motivate, and retain a diverse team of highly skilled employees who are accountable for recognizing and responding to our customers needs while promoting organizational and individual achievement. The critical role that the HR Office plays in the organization is demonstrated by its ability to effectively balance the needs of both employees and the organization. The HR Office provides the following comprehensive services: Recruitment, Salary Administration, HRIS and Employee Records, Employee and Organizational Development, Tuition Reimbursement, Employee Recognition, Employee Wellness, Employee Assistance Program, Occupational Medical Services, Transitional Employment, Alternative Dispute Resolution, and Pension Administration. The Office is responsible for designing and administering flexible, cost-effective benefit programs that can be individually tailored and are instrumental in attracting and retaining a talented and diverse workforce. ACHIEVEMENTS BTP/Oracle In support of Phase I and II of the BTP Program, HRIS continues to play a key role with the Oracle HR and Finance/Payroll Systems. The support includes and is not limited to creation of organizations, jobs, positions, locations, grades, grade structures, employees, assignments and reports. Cleanup and validation of data continue as the need arises for ongoing processes to support Oracle. Security levels within the Oracle system are being updated to enable each employee with the required fields to perform their daily tasks. Re-evaluation of the current processes is
ongoing and updated accordingly. HRIS continues to determine the needs and requirements necessary to support the Oracle system as required by the Authority.
Reporting Enhancements In conjunction with IT, Budget, Compensation, and Recruiting, HRIS played an integral role in producing a Position Control Vacancy Report that will be utilized by the Authority. The report will enable the Authority to validate current staffing levels and vacancies. This project also incorporated a new requirement to include identifying contract employees assigned to current vacancies. Therefore, HRIS further developed the architectural design structure for position and sub position categories and primary and secondary leave categories for this process. In conjunction with Employee Relations, Risk Management and Employee Availability, HRIS played a major role in producing and Employee Availability Report to capture those employees out on leave programs as well as those who have met the requirements of various attendance related policies. The architectural design structure developed for the vacancy report is also being utilized with the availability report. To ensure that these reports were successful, HRIS developed, tested and implemented a variety of reports and edits. Work Flow Enhancements Due to the lack of automated work flows within the Oracle system, HRIS, in conjunction with other HR branches, developed a variety of forms to aid in the transition to Oracle HR from GEAC. In addition to developing forms, HRIS also assisted with the development of new procedures for the workflows that were incorporated with the design of these forms. HRIS also assisted in the development of the new automated grade step progression process that reduced the bi-weekly manual input for the Compensation Staff. HRIS, along with IT and Recruiting, developed and internal and external internet application process. In addition, assisted Recruiting with merging multiple applications and deleting duplicate applicants from the system in an effort to reduce redundancy. HRIS established a process for Benefits that enabled timely posting of element entries to meet the bi-weekly processing schedule. HRIS developed a process to notify Compensation of an employee on leave status returning to work in order to initiate payments for wages not received while on
335
FY10 OPERATING & CAPITAL BUDGETS
OFFICE OF HUMAN RESOURCES leave. HRIS developed an Oracle to C-Cure (Badging System) interface to better assist Police Services with accurate information about an employee’s current status.
EMPLOYEE RELATIONS AND ORGANIZATIONAL DEVELOPMENT Drug and Alcohol: successfully completed FTA mandated random drug testing rate of 29% (25% required) and 11% (10% required) alcohol testing for calendar year 2008 with reporting being submitted on time. Positive Random testing rates for drugs and alcohol were <1% and <1%, respectively. Coordinated 32 Fitness for Duty evaluations to ensure employees are fit to perform the essential function of their job in a safe manner. MARTA’s Short and Long term Disability Program – Managed 122 claims. Long Term Disability (LTD) offsets continue to provide a cost savings of $8,577 on a bi-weekly basis. Identified and collected $15,288 overpayment recovery.
Employee Assistance Program – Coordinated 2 Critical Incident Stress Debriefing sessions and 14 mental wellness seminars
Expanded Staff – held 3 sessions, with 169 employees recognized and awarded for 20 or more years of service.
Suggestion Program: 41 suggestions submitted and 15 approved and awarded. The suggestions produced savings to the Authority in amount of $659,097.70. Total amount awarded to employees for their suggestions is $28,814.92.
Health Fairs were held at HQ, Brownsmill, Laredo, and Perry in July 2008 and In January-February 2009 timeframe at Hamilton, Five Points, Armour Yard and HQ, totaling 8 locations.
Lunch n learn sessions organized at Headquarters in October 2008, February 2009, and March 2009 focused on topics such as Managing Change, Money and Stress, Colon Cancer, etc.
Annual KP Corporate Challenge with increased participation by 30% compared to 2007, totaling 337 participants.
Race to Fitness kicked off in January and ending in April conducted at 11 locations.
Other wellness-work/life balance programs held during FY09: breast cancer awareness, flu shots (October 2008 – HQ, Perry, Brady, C-Tran, Laredo, Hamilton, Annex building, with a total of 387 shots), health 101 events throughout MARTA for blood pressure testing, cholesterol testing, health education, etc.
Holiday Bazaar – held at HQ in November 2008 – 40 employees participated as vendors.
MARTA Wellness Guide - MARTA Wellness Guide is an employee self-help guide designed to provide answers to employees most frequently asked questions, in addition to contact information for resources and services provided by Aetna, EAP and Occupational Medical Services educational sessions. The guide is scheduled to be rolled out during the open enrollment period. As part of the Authority-wide cost containment measures that will be implemented by MARTA in response to the budget short-fall, the Office of Human Resources developed a comprehensive Reduction in Force (RIF) Plan based on MARTA’s RIF Policy and in compliance with the current Employment and Labor Laws. The Plan includes the RIF Program Outline; proposed implementation timeline, detailed action steps, as well as information related to medical benefits for the employees affected, furlough program, and current MARTA vacancies.
Manager of EROD was selected to present at APTA’s Bus and Paratransit Conference to be held in Seattle, Washington in May 2009. The focus of the APTA session is “Revolutionizing Employee and Management Relations through Understanding Thought’s Influence on Human Behaviors”.
Tuition Reimbursement Program - As of April 2009 a total of $123,322.79 was expensed by processing 149 employee applications. As of April 2009, 105 employees received tuition reimbursement from the FY09 allocated budget. The majority of employees are enrolled in degree programs at Undergraduate level, majoring in fields such as Criminal Justice, Business Administration, Computer Science, Accounting, etc. Twenty-two (22) employees that receive reimbursement through this program are in the process of obtaining their Master’s degree.
GM/CEO Town Hall Meetings: development of the 2008 THM Report, process flow and proposed policy. Final Version of the 2008 report, to
336
FY10 OPERATING & CAPITAL BUDGETS
OFFICE OF HUMAN RESOURCES include employee comments (questions, suggestions, etc) with the respective responses updated with status as of February 2009 was submitted to the AGM of HR for review.
IT Change Management Initiative: HR plays a key role in ensuring a smooth transition to a new organizational structure within the Department of Technology, as part of the overall transformation and re-alignment process undertaken. The focus of this initiative is to develop a plan to ensure that activities that support IT’s Strategic Priorities will not be discontinued by the restructuring of the department. Employee Relations/Conflict Resolution The Employee Relations business unit achieved the successful closure of more than 60 employee issues, therefore avoiding possible escalation of the respective issue within the workplace. By conducting consultations, conciliations, facilitations, interventions and round tables at employee, management, or organization (department) level, Employee Relations managed to build the communication lines between employees or employees and management necessary to carry out daily activities in a professional environment. Among the various types of issues handled are: employee individual development, performance improvement, progressive disciplinary issues, unfair suspension, removal of discipline, hostile work environment, unfair treatment by management, management unprofessional conduct, etc.
COMPENSATION AND BENEFITS Initiated a study of Human Resource practices and policies which will be performed by the Hay Group. The study officially began in February 2009, and is expected to be completed by November 2009. The primary focus of the study is compensation and benefits, but it will also include, training, succession planning and leadership development. In preparation for the study, HR led an effort to update all of the Authority’s job descriptions and participated in 25 salary surveys to provide up-to-date market data. Meetings have been held with MARTA management, union leadership and HR management, as well as site visits to various MARTA locations. Focus groups will be held with employees and communications will be developed to describe the project and its results.
The 2009 State of Georgia legislative session included several bills presented at MARTA’s request. As a result of the heightened interest in
the transportation needs of the state and the metropolitan Atlanta area.
As a result of MARTA’s budget shortfalls, HR has been asked to make recommendations and provide data regarding potential cost saving measures. Included in the information was data on a number of potential changes to the costs and coverage in the existing medical plans, as well as information on a number of furlough options.
MARTA’s life and health insurance contracts have been renewed with minimal increases in administrative fees (3% increase in medical fees, no increase in dental fees, 40% share ($82,570) of pharmacy rebate), a less than anticipated increase in insurance rates (although plan’s loss ratio was 133% warranting a renewal rate of $0.44/$1,000, negotiated a rate of $0.33/$1,000) and a rebate of Medicare Part D drug costs ($19,596). Benefits planned and conducted a campaign to encourage employees and their dependents to complete health risk assessments and take a more active role in managing their health and lifestyle. An additional 230 employees completed the assessment.
New federal regulations have resulted in increased requirement in the benefits area. The Family and Medical Leave Act (FMLA) policy has been updated to comply with the new regulations, as well as making the necessary changes to comply with the new COBRA provisions in the Economic Stimulus Act (ARRA).
Audit conducted an internal audit of Benefits’ internal processes and medical claims with no findings in either area. RECRUITING Re-established the Authory’s Internship Program in May 2008. We were able to offer meaningful and practical work experience to students from GA State University, Georgia Tech, Clark Atlanta University, and Spelman College. Because the students were such an asset to the Department of Planning and Engineering, they were hired on contractually after the Summer Program ended. This spoke volumes to the program’s goals and objectives which is to provide students with a rewarding work experience that fosters character and development for the professional arena. Our hope is that through these experiences, we will be able to get back our ROI and make them employable with MARTA. The Summer and Fall Internship Programs were both a huge success in 2008.
337
FY10 OPERATING & CAPITAL BUDGETS
OFFICE OF HUMAN RESOURCES
Met the increased staffing need for the Office of Bus Transportation. Bus Transportation needed to increase their staffing level of Bus Operators by 85 Operators. We established an accelerated hiring process that changed the time to hire an operator from 60 days to 30 days to meet Transportation’s needs. At the time, the number of budgeted operators was 1162. Between the months of July and September we were able to meet the goal of having 1247 operators on staff and ultimately overstaffed the Bus Operator total by 40 operators. During the months of July- September 2008, we screened over 700 resumes, tested over 500 applicants, interviewed over 300 candidates and hired 127 operators to achieve this goal.
Conducted the RIF for employees that were impacted by the reorganization within Customer & Station Services. The process included transitioning 64 non-represented CSR’s and CA’s into the represented Station Agents’ positions, giving notifications and severance packages to 30 employees and providing each of them with outplacement services. Because of the communication process during the RIF, HR received high praise from senior management and affected employees. Formulated strategies to change the process for EEO data collection requirements to
ensure that the authority is in compliance federal EEO laws. These strategies included modifying the EEO data collection form and collaborating with IT to redesign the external website to ensure that the data was being tracked by positions.
Changed the interview and selection process based on feedback from focus groups. The new process includes a guideline for Panel members, a structure briefing by the recruiter before the interview session commences and limiting the number of panel members from the hiring authority’s area. The new process has minimized the number of complaints, given employees a better sense of fairness in the process and has improved the quality of hires.
PENSION Retirement Benefits in conjunction with The Hartford and Nationwide Retirement Solutions offer quarterly investment seminars to employees participating in the Defined Benefit Plan, Defined Contribution Plan and the Deferred Compensation Plans. These seminars are designed to inform employees of the welfare of the plans as well as providing education on the market trends and investment options available.
338
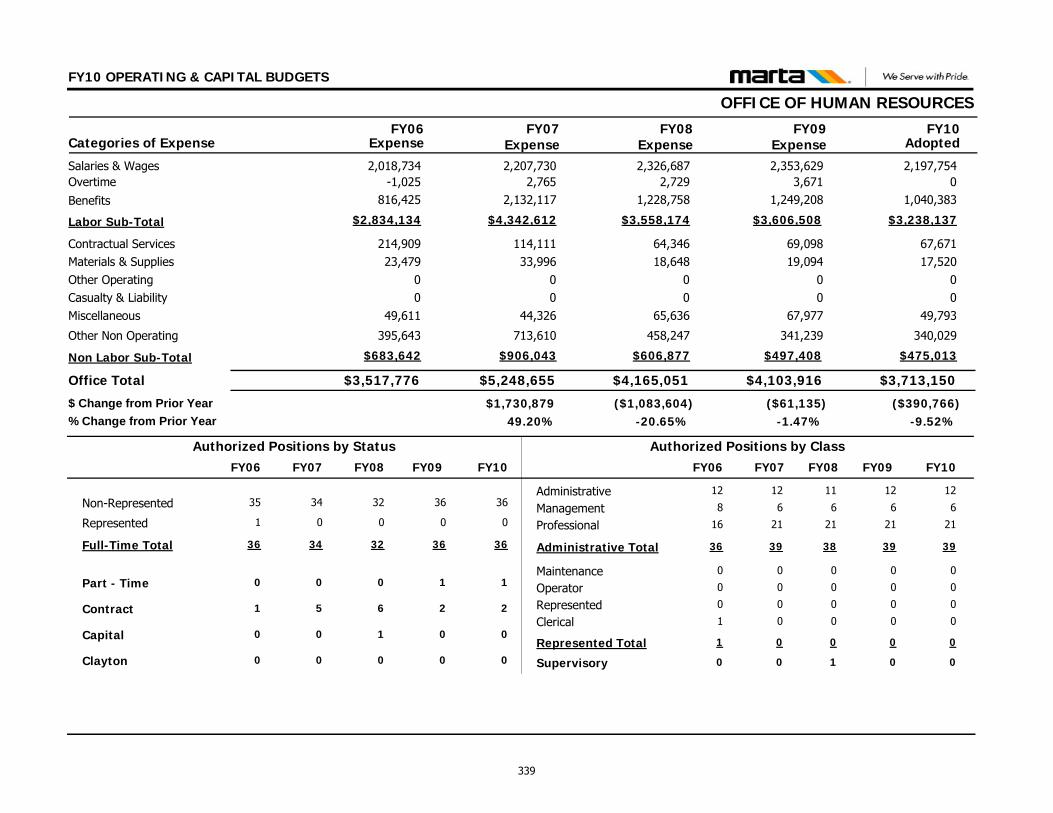
FY10 OPERATING & CAPITAL BUDGETS
OFFICE OF HUMAN RESOURCES
$3,713,150$4,103,916
67,67117,520
00
49,793
340,029
69,09819,094
00
67,977
341,239
Contractual ServicesMaterials & SuppliesOther OperatingCasualty & LiabilityMiscellaneous
Other Non Operating
Office Total
2,197,7542,353,629Salaries & Wages03,671Overtime
$3,238,137$3,606,508Labor Sub-Total
FY09 FY10Categories of Expense
$3,517,776
214,90923,479
00
49,611
395,643
2,018,734-1,025
$2,834,134
FY06
$5,248,655
114,11133,996
00
44,326
713,610
2,207,7302,765
$4,342,612
FY07Expense Expense Expense Adopted
($390,766)($61,135)$1,730,879-9.52%-1.47%49.20%
$ Change from Prior Year% Change from Prior Year
$4,165,051
64,34618,648
00
65,636
458,247
2,326,6872,729
$3,558,174
FY08Expense
($1,083,604)-20.65%
$475,013$497,408Non Labor Sub-Total $683,642 $906,043 $606,877
1,040,3831,249,208Benefits 816,425 2,132,117 1,228,758
Administrative
Clerical
Management
MaintenanceOperator
Professional
Represented
Supervisory
12
0
6
0
0
21
0
0
12
0
6
0
0
21
0
0
Non-Represented 36 36
Part - Time 1 1
Represented 0 0
Full-Time Total 36 36
Contract 2 2
Capital 0 0
Authorized Positions by Class
Administrative Total 39 39
Authorized Positions by Status
Represented Total 0 0
12
0
6
0
0
21
0
0
34
0
0
34
5
0
39
0
12
1
8
0
0
16
0
0
35
0
1
36
1
0
36
1
FY10FY09 FY07FY06 FY10FY09 FY07FY06
Clayton 0 000
32
0
0
32
6
1
FY08
0
11
0
6
0
0
21
0
1
38
0
FY08
339
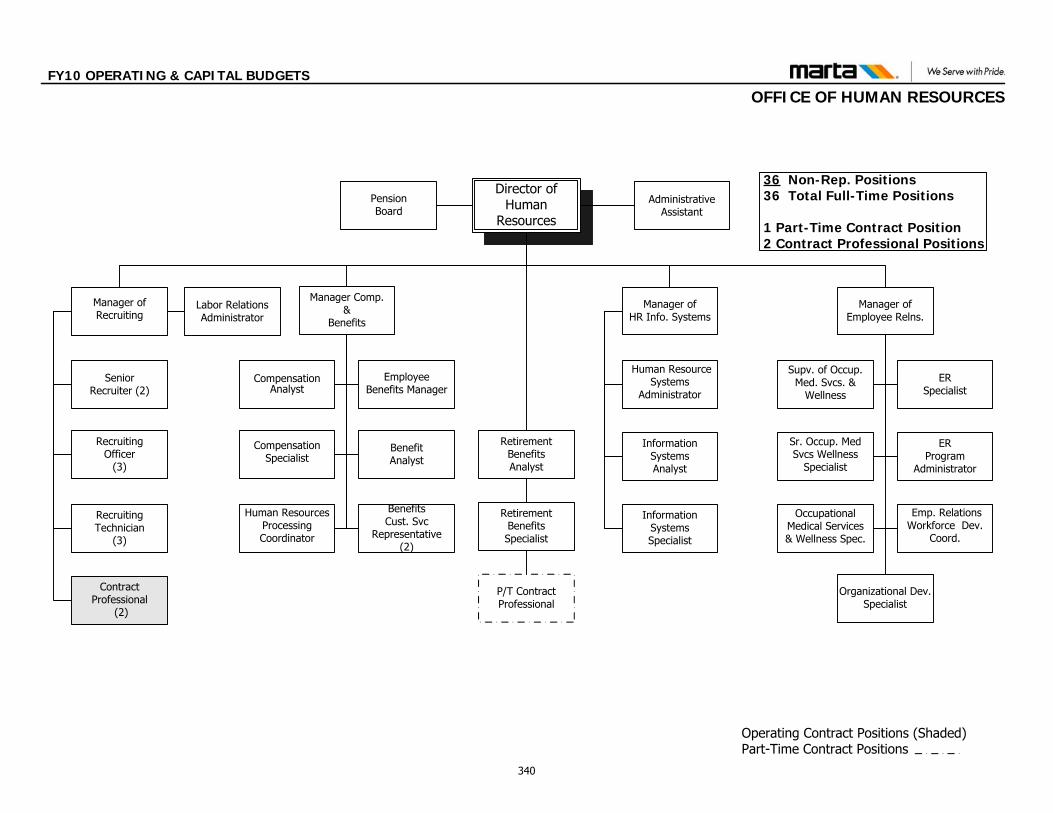
FY10 OPERATING & CAPITAL BUDGETS
OFFICE OF HUMAN RESOURCES
Operating Contract Positions (Shaded)Part-Time Contract Positions
Director of Human
Resources
Manager Comp. &
Benefits
Manager of HR Info. Systems
Compensation Analyst
Retirement Benefits Specialist
Human Resource Systems
Administrator
Information Systems Analyst
Compensation Specialist
Manager of Recruiting
Senior Recruiter (2)
Recruiting Officer
(3)
Recruiting Technician
(3)
Retirement BenefitsAnalyst
Information SystemsSpecialist
Employee Benefits Manager
Benefits Cust. Svc
Representative (2)
Benefit Analyst
Human Resources Processing Coordinator
PensionBoard
Supv. of Occup. Med. Svcs. &
Wellness
Sr. Occup. Med Svcs Wellness
Specialist
Occupational Medical Services & Wellness Spec.
ER Specialist
ER Program
Administrator
Emp. Relations Workforce Dev.
Coord.
Organizational Dev. Specialist
P/T Contract Professional
Manager of Employee Relns.
Labor Relations Administrator
36 Non-Rep. Positions 36 Total Full-Time Positions
1 Part-Time Contract Position 2 Contract Professional Positions
Administrative Assistant
Contract Professional
(2)
340
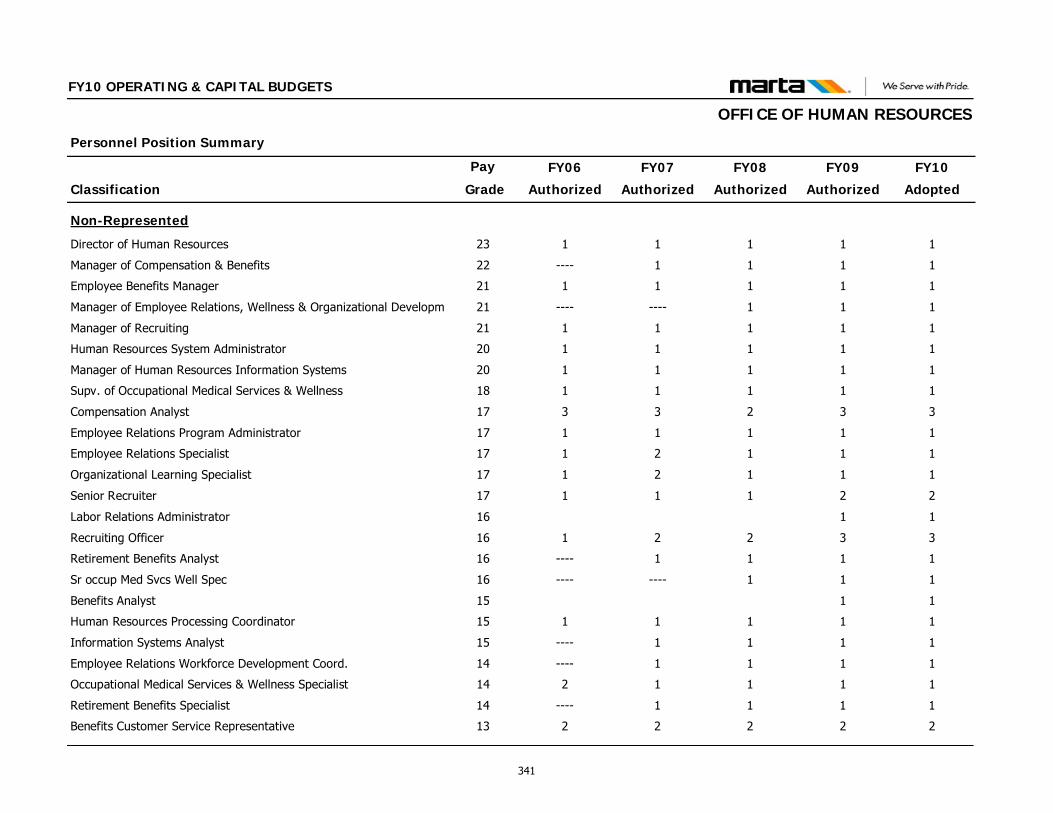
Classification
Personnel Position Summary
Pay FY09
Authorized
FY10
Adopted
FY10 OPERATING & CAPITAL BUDGETS
FY08
Authorized
FY07
Authorized
FY06
Authorized Grade
OFFICE OF HUMAN RESOURCES
Non-Represented
Director of Human Resources 23 1 1111
Manager of Compensation & Benefits 22 1 111----
Employee Benefits Manager 21 1 1111
Manager of Employee Relations, Wellness & Organizational Developm 21 1 11--------
Manager of Recruiting 21 1 1111
Human Resources System Administrator 20 1 1111
Manager of Human Resources Information Systems 20 1 1111
Supv. of Occupational Medical Services & Wellness 18 1 1111
Compensation Analyst 17 3 3233
Employee Relations Program Administrator 17 1 1111
Employee Relations Specialist 17 1 1121
Organizational Learning Specialist 17 1 1121
Senior Recruiter 17 2 2111
Labor Relations Administrator 16 1 1
Recruiting Officer 16 3 3221
Retirement Benefits Analyst 16 1 111----
Sr occup Med Svcs Well Spec 16 1 11--------
Benefits Analyst 15 1 1
Human Resources Processing Coordinator 15 1 1111
Information Systems Analyst 15 1 111----
Employee Relations Workforce Development Coord. 14 1 111----
Occupational Medical Services & Wellness Specialist 14 1 1112
Retirement Benefits Specialist 14 1 111----
Benefits Customer Service Representative 13 2 2222
341
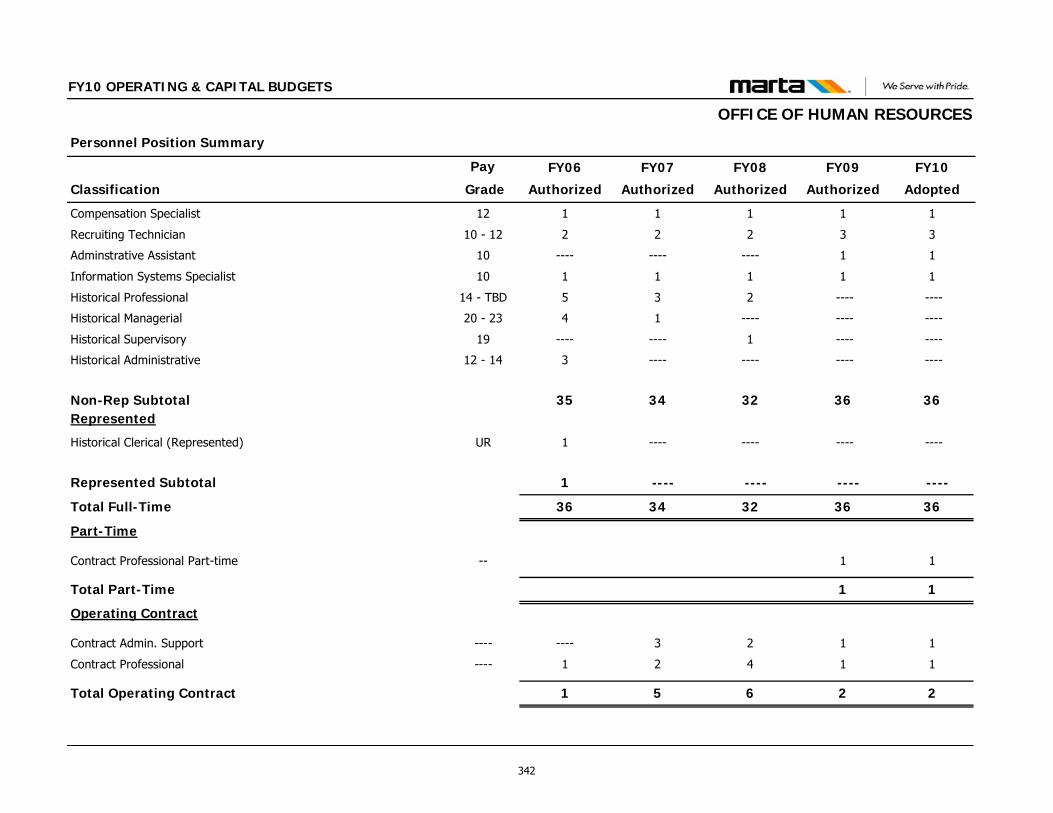
Classification
Personnel Position Summary
Pay FY09
Authorized
FY10
Adopted
FY10 OPERATING & CAPITAL BUDGETS
FY08
Authorized
FY07
Authorized
FY06
Authorized Grade
OFFICE OF HUMAN RESOURCES
Compensation Specialist 12 1 1111
Recruiting Technician 10 - 12 3 3222
Adminstrative Assistant 10 1 1------------
Information Systems Specialist 10 1 1111
Historical Professional 14 - TBD ---- ----235
Historical Managerial 20 - 23 ---- --------14
Historical Supervisory 19 ---- ----1--------
Historical Administrative 12 - 14 ---- ------------3
Non-Rep Subtotal 36 36323435Represented
Historical Clerical (Represented) UR ---- ------------1
Represented Subtotal ---- ---- ---- ----1
Total Full-Time 36 36323436
Part-Time
Contract Professional Part-time -- 1 1
Total Part-Time 1 1
Operating Contract
Contract Admin. Support ---- 1 123----
Contract Professional ---- 1 1421
Total Operating Contract 2 2651
342
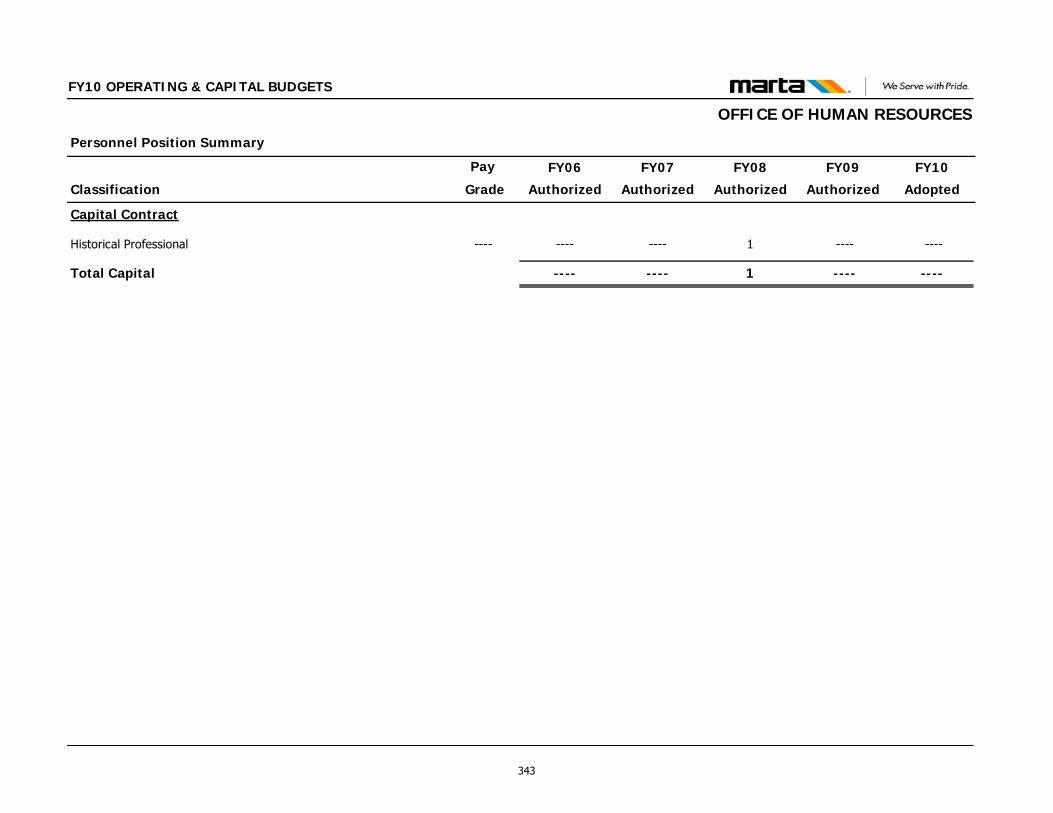
Classification
Personnel Position Summary
Pay FY09
Authorized
FY10
Adopted
FY10 OPERATING & CAPITAL BUDGETS
FY08
Authorized
FY07
Authorized
FY06
Authorized Grade
OFFICE OF HUMAN RESOURCES
Capital Contract
Historical Professional ---- ---- ----1--------
Total Capital ---- ----1--------
343
FY10 OPERATING & CAPITAL BUDGETS
OFFICE OF LABOR RELATIONS
FUNCTIONS AND RESPONSIBILITES The office of Labor Relations administers the labor agreements with the Amalgamated Transit Union, Local 732, for the Authority. Specific responsibilities are to plan, develop, and oversee the implantation of long and short-range strategies to support the Authority’s and Department’s goals, objectives, and strategic plans; plan, conduct and advise MARTA Management on all union contract negotiations; assist Authority management on matters relative to labor activities; monitor the administration of discipline codes and work rules; coordinated the handling of grievances; represent the Authority in arbitration; and work for the continued improvement of labor relations throughout the Authority. FY09 ACCOMPLISHMENTS 1. Labor Relations negotiated new joint apprenticeship
agreements in Bus and Rail Maintenance. These programs had been dormant since the RIF in 2004, and allows MARTA and ATU to move forward in preparing employees with the necessary skills for key maintenance positions.
2. Reduction in arbitration expense. For this first time in at least 12 years, MARTA and ATU had no (0) arbitrations hearings, saving the Authority $40,000 in budgeted expense, plus the cost of any negative awards. This was accomplished through the trial use of mediation, creative settlements, and the support of operations management.
3. Development of a new 4-step grievance process. Identified as
a problem area in the April 2008 MARTA/ATU retreat, Labor Relations worked with key Operations Directors and ATU to design a simpler, clearer process, which features a mechanized tracking system. This new process is scheduled for implementation on August 1, 2009.
4. Resolution of operators part-time to full-time issue. This had
been a major issue for 6-8 years, due to MARTA’s pay practices differing from contract language, with a resulting huge liability. Reached settlement with ATU by re-writing the contract language, and by moving selected operators to a higher step on the progression schedule, with no back pay liability.
5. Resolution of Station Agents staffing issue. Identified as a
problem area in the April 2008 MARTA/ATU retreat, we successfully negotiated a MOU with ATU to consolidate two non-represented titles into the represented Station Agent position. The wage rates were adjusted, and a lump sum payment was made to the incumbents in the title, resolving all individual and collective grievances on this subject.
6. Resolution of Alertness Assurance Policy. After challenges by
ATU on MARTA’s rights to impose limits on hours worked, we researched historical files and related arbitration decisions to document the development of the current policy and clear Arbitrator’s language supporting MARTA’s rights. ATU has accepted these findings.
7. Resolution of the Mid-Life Overhaul Agreement. This has been
a significant issue between MARTA and ATU since 1993, involving the subcontracting of maintenance work on MARTA’s Rail Car fleet. MARTA has paid approximately $2M in arbitration decisions and revised settlements during this time. This final settlement reached on April 20, 2009, encompasses many other elements of contention between the parties, such as backlogged grievances, AM/PM Extra board, Faregate Technicians work, PTO program, baseline of maintenance jobs, a new grievance process, and maintenance overtime boards. This is a major accomplishment for MARTA and ATU to resolve these issues.
344

FY10 OPERATING & CAPITAL BUDGETS
OFFICE OF LABOR RELATIONS
$352,109$399,118
8,404451
000
293
7,5681,299
000
2,338
Contractual ServicesMaterials & SuppliesOther OperatingCasualty & LiabilityMiscellaneous
Other Non Operating
Office Total
229,538256,959Salaries & Wages00Overtime
$342,961$387,913Labor Sub-Total
FY09 FY10Categories of Expense
$450,133
18,4461,018
14900
2,202
322,5070
$428,318
FY06
$610,665
189,0284738600
4,439
286,220236
$416,639
FY07Expense Expense Expense Adopted
($47,009)($76,003)$160,532-11.78%-16.00%35.66%
$ Change from Prior Year% Change from Prior Year
$475,121
22,545590
000
4,226
307,1500
$447,760
FY08Expense
($135,544)-22.20%
$9,148$11,205Non Labor Sub-Total $21,815 $194,026 $27,361
113,423130,954Benefits 105,811 130,183 140,610
Administrative
Clerical
Management
MaintenanceOperator
Professional
Represented
Supervisory
1
0
2
0
0
0
0
0
1
0
2
0
0
0
0
0
Non-Represented 3 3
Part - Time 0 0
Represented 0 0
Full-Time Total 3 3
Contract 0 0
Capital 0 0
Authorized Positions by Class
Administrative Total 3 3
Authorized Positions by Status
Represented Total 0 0
2
0
2
0
0
0
0
0
4
0
0
4
0
0
4
0
2
0
2
0
0
0
0
0
4
0
0
4
0
0
4
0
FY10FY09 FY07FY06 FY10FY09 FY07FY06
Clayton 0 000
4
0
0
4
0
0
FY08
0
2
0
2
0
0
0
0
0
4
0
FY08
345
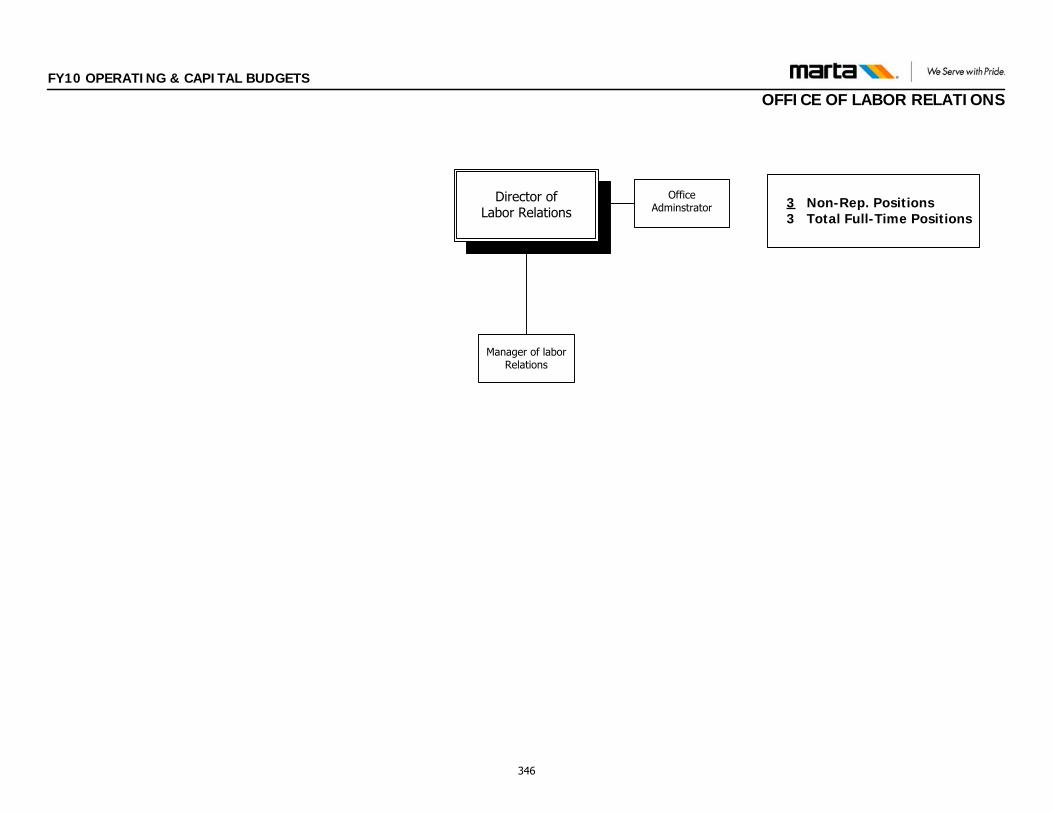
FY10 OPERATING & CAPITAL BUDGETS
OFFICE OF LABOR RELATIONS
3 Non-Rep. Positions 3 Total Full-Time Positions
Director of Labor Relations
Manager of labor Relations
Office Adminstrator
346
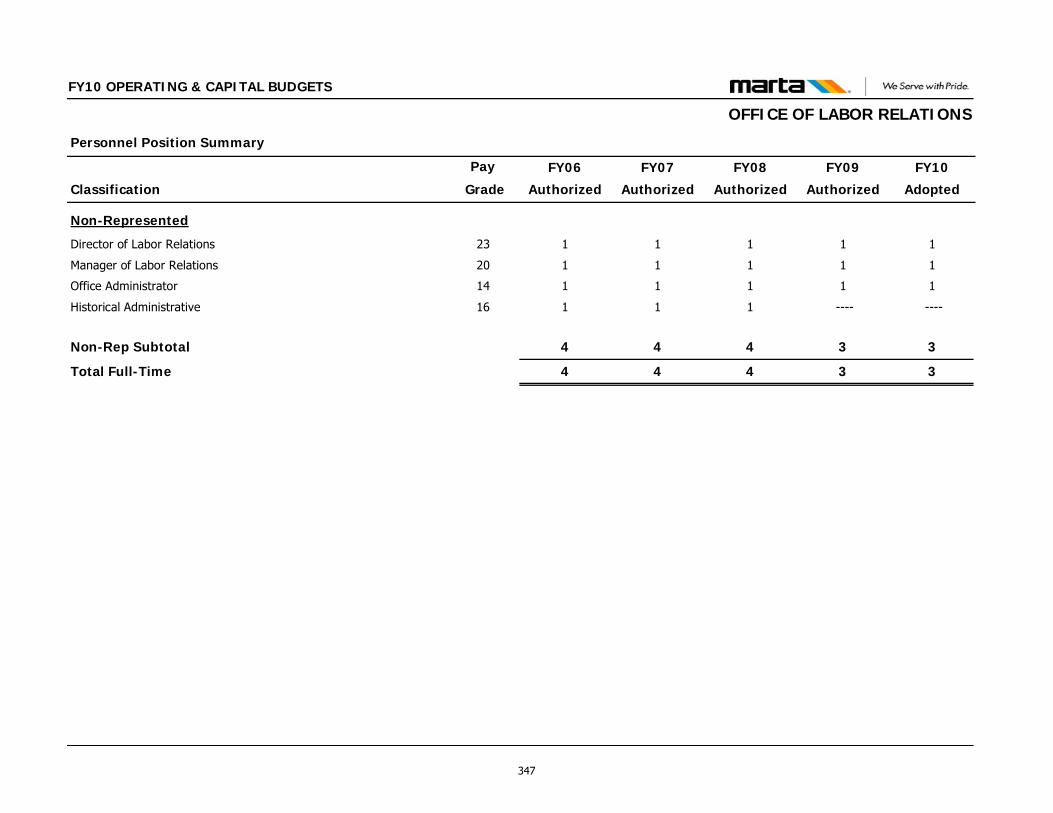
Classification
Personnel Position Summary
Pay FY09
Authorized
FY10
Adopted
FY10 OPERATING & CAPITAL BUDGETS
FY08
Authorized
FY07
Authorized
FY06
Authorized Grade
OFFICE OF LABOR RELATIONS
Non-Represented
Director of Labor Relations 23 1 1111
Manager of Labor Relations 20 1 1111
Office Administrator 14 1 1111
Historical Administrative 16 ---- ----111
Non-Rep Subtotal 3 3444
Total Full-Time 3 3444
347
FY10 OPERATING & CAPITAL BUDGETS
OFFICE OF TRAINING
FUNCTIONS & RESPONSIBILITES The Office of Training partners with other operational and strategic business units within MARTA to assure the achievement of organizational goals and objectives. A primary responsibility of this office is to enhance the organization's effectiveness through the development of MARTA's personnel via effective training programs.
To maximize the training with minimal dollars, various training programs will be utilized. Some will incorporate current personnel through "train the trainer" programs. Others will involve computer aided programs to be completed as time permits or requires. FY09 ACCOMPLISHMENTS Rail Maintenance Training Conducted Modular Systems Training (MST) for mechanics and
technicians as required refresher training that included classroom and hands-on training. Training delivered was equivalent to 973 employees attending training sessions (individual employees attended more than one training session).
Trained and certified three Rail Car Maintenance Apprentice
Mechanics and four Rail Care Electronic Technicians.
Bus Maintenance Training Completed training classes for and graduated three groups of
Inspectors (21 students) from the MARTA six month Inspector trainee program. (This P.O.I. is for the training of new employees to the Authority. These employees are experienced mechanics; however their experience is not transit bus specific).
Started and conducted training classes for one group of
Apprentice Inspectors (11 students) in the MARTA Two year Apprentice Mechanic program. (in progress) (This P.O.I. is for the training of internal employees who desire to become Bus mechanics and have no previous mechanical training or experience).
Conducted training for MARTA’s Bus Maintenance Inspectors in
Journeyman Inspector Upgrade and Sustainment Training (JUST), and shop Performance based Training (PBT) for a total of 1116 individual employee training events for a training total of 15,928 hours. (The JUST POI consists of 4 to 8 hour refresher classes covering some perishable technical skills and addresses changes in technology. The shop PBT consists of one on one, Instructor and technician troubleshooting of problematic buses. This format assists in both the repair of fleet vehicles as well as knowledge transfer from Instructor to Technician.
Six Bus Maintenance Instructors successfully gained certification
in one or more ASE Certifications. One Bus Maintenance Instructor advises and is currently a member of the national ASE test writing panel for Transit Coach ASE Certification Exams.
Maintained the Bus Maintenance Training resource website, CBT
training portal and Bus Maintenance Instructional Newsletter.
Infrastructure Training Developed Escalator Start-up training and delivered that training
to 194 employees. These trained personnel can now safely take a dangerous escalator out of service and return one to service after a basic examination of the unit.
Delivered training updates to 164 transportation and maintenance
employees on new procedures for placing hi-rail equipment on the tracks generated in General Order 08-15.
Conducted On-Track Equipment Operator Certification designed
to ensure safe operation of maintenance vehicles on Authority track for approximately 175 maintenance employees.
Facilitated the delivery of Wayside Access Procedures Certification
for 2188 employees and contractors with job duties that require them to work or access MARTA's rail wayside.
348
FY1 O
0 PERATING & CAPITAL BUDGETS
OFFICE OF TRAINING
Facilitated certification of 20 Track Inspectors to perform FRA mandated daily visual track inspections.
During the past year, trained 20 newly hired or transferred
employees (6 month training programs) in four mission critical crafts: Automatic Train Control—5 apprentices were trained to maintain and repair the automatic control systems that determine safe speed and routing for all rail vehicles both revenue and non-revenue; Electrical Power & Equipment—11 apprentices were trained to maintain and repair all the electrical systems in the authority. This includes power and lighting to all facilities and power to operate revenue vehicles; Computer Maintenance—2 apprentices were trained to maintain and repair components of the Authority’s computer systems. This includes communication units used to deliver information between Rail Services Control Center and the rail stations; Track—2 apprentices completed a two year apprentice program in track maintenance and inspection to be able to maintain the rails used for revenue service.
Bus Transportation Training Certified 219 Part-Time Bus Operators and 47 Part Time Mobility
Operators. Each certification course consisted of 54 Days (432 Hours) of training on the safe and professional operation of MARTA buses in revenue service.
Conducted post accident or return to work training for 69 Fixed
Route and 39 Mobility Operators. This training is specifically designed for operators who are returning to work after extended absence or who have been involved in two or more preventable accidents,
Conducted ADA recertification training for 26 Bus Operators on
ADA final warning. This training is specifically designed to address Operator skill deficiencies related to ADA customer service.
CDL Examiners trained and licensed 122 Marta Employees during
33 CDL training classes.
Rail Transportation Training Conducted a variety of certification and recertification classes
required to ensure safe rail operation. Training included: Rail Operators certified or in training- 32, Rail Operator Post Mark-Up Certification - 4, Rail Controller Certification - 1, Rail Controller Post Mark-Up Certification - 1, Rail Line Supervisor Certification - 11, Rail Line Supervisor Post Mark-Up Certification - 2, Yard Tower Certification - 3, Locomotive Operator Certification - 48, Rail Car Cleaner Certification - 8, Operator Recertification - 9,
Revised and delivered refresher training to 104 Operators,
Supervisors, and Rail Controllers. Conducted post incident or skill deficiency retraining for 32
Operators, Supervisors and Rail Controllers. Rail Transportation Training conducted first responder Fire
Department training, (Rail Car Orientation, Station Walk-Thru, Tunnel Walk-Thru and Fire Simulations) for 1945 local Firefighters who respond to MARTA rail incidents.
Strategic Training Conducted numerous performance consultations with various
employees and MARTA workgroups during the last 12 months. Specific engagements were conducted in Customer and Station Services, Revenue Services, Research and Analysis, MARTA Police and for a variety of individual employees. Additionally, ongoing performance support is provided to the Bus Operator Safety Steering Committee
Conducted 637 employee days of training in the following subject
areas; Customer Service Basics, CPR & AED, Building Effective Relationships, Personal Style Inventory (PSI), Effective Communication, Customer Service Impact (CSI), Business Writing Strategies, Business Communication, Effective Teams, Communicating with Presence, Group Dynamics, Active Listening, Managing Effective Teams, Resume Writing, Interview Skills, Communication Styles, Email Writing Skills, Employee Satisfaction Survey Forums
349
FY10 OPERATING & CAPITAL BUDGETS
OFFICE OF TRAINING Conducted 1489 employee days of management training in the
following subject areas; Communications, Team Management, Organizational Leadership, Time Management, Managing and Leading, Diversity, Workplace Roles and Responsibility, Incident Report Writing, Conference Records, and Emotional Intelligence
Conducted Microsoft 07 transition training by facilitating 171
classes with 569 employee training days. Additionally, technology end user training was provided for the Web Timesheet and Disciplinary Tracking System (DTS).
Conducted Web Timesheet Class
Delivered 115 employee days of training to address Clayton
County Bus Operator customer service skills and business unit specific training for Rail Operations Supervisors that addressed management techniques and tools as well as training in infection control measures.
Delivered comprehensive New Employee Orientation for all newly
hired MARTA employees. During the last 12 months 409 new employees attended orientation.
Provided organizational development support through the
following efforts during the last 12 months; Customer Call Center Quarterly Team Development Sessions, Customer and Station Services Customer Service Support Program, CPT and AED Course Training, Police Terrorist Training Support, Ektron Content Management Training Support and Development of Audit presentation for New Employee Orientation.
Instructional development activities during the last 12 months
included the creation and delivery of numerous courses and tools; on-line course calendar and registration forms, critical thinking class, anger management class, spill kit awareness course support, FEMA/NIMS course updates, active listening course, business writing strategies class and weekly e-newsletter, firearms in the system video, rail system fire evacuation video, workers compensation video and MS Office 2007 rollout video.
In the last twelve months Strategic Training has provided additional training support in the following areas; Office of DEO - anger management, communications, conflict resolution and teambuilding training, Marketing Department and the Breeze Employee Partnership Program - MARTA Direct Companies, Governmental Agencies and TMA (Transportation Management Association), rollout of new HR systems and responded to 2600 software assistance calls for the Authority. Instructional Design The purpose of the Instructional Design Team is to create interesting and compelling training packages for use throughout the authority. Since this unit did not previously exist at MARTA, we were tasked with creating our own technology infrastructure, policies and procedures, while producing product. To date, we have built an impressive network which when fully deployed will allow all MARTA employees to access training 24 hours a day, 7 days a week from any MARTA PC, and from home. Internal projects are activities that support the conceptualization, development and building of an eLearning infrastructure. It requires the seamless collaboration between the Office of Technology and the Office of Training with accomplishments that include; Development of Training standards that address specifications for documentation, multimedia and presentation, creation of Training Portal , build out (and maintenance) of SharePoint portal for Training, SharePoint Training, introduction to eLearning video, online student registration and reporting, built and configured servers for development environment, stood up SQL database, installed and configured Moodle, develop marketing plan for Moodle, tested several eLearning/LMS/CMS platforms. External projects are activities that, in collaboration with individual business units within the Authority, create customized, interactive training packages for distribution. Accomplishments include; mouse tutorial, Bus Radio AVL CBT development, work rules CBT development, Survival Spanish course development, Absolute Blocking simulation delivery, Fire Video production, Several Videos of Dr. Scott addressing MARTA staff, Train Control Systems Upgrade RFP technical training review team, Live Video Streaming of MARTA Board of Directors Meeting, video recording of Technology Focus Groups.
350
FY10 OPERATING & CAPITAL BUDGETS
OFFICE OF TRAINING
General • During FY09 Infrastructure, Rail Maintenance and Rail
Transportation Training delivered over 34,269 hours of employee training – Employees attending one or more training event resulted in 4,694 individual employee training activities completed during FY09.
• The Office of Technical Training has effectively managed the
implementation of a successful Joint ATU/MARTA Training Partnership designed to address skill development needs in various represented crafts. This program is ongoing and is providing key information needed to define the training required to improve operational quality and efficiency.
351
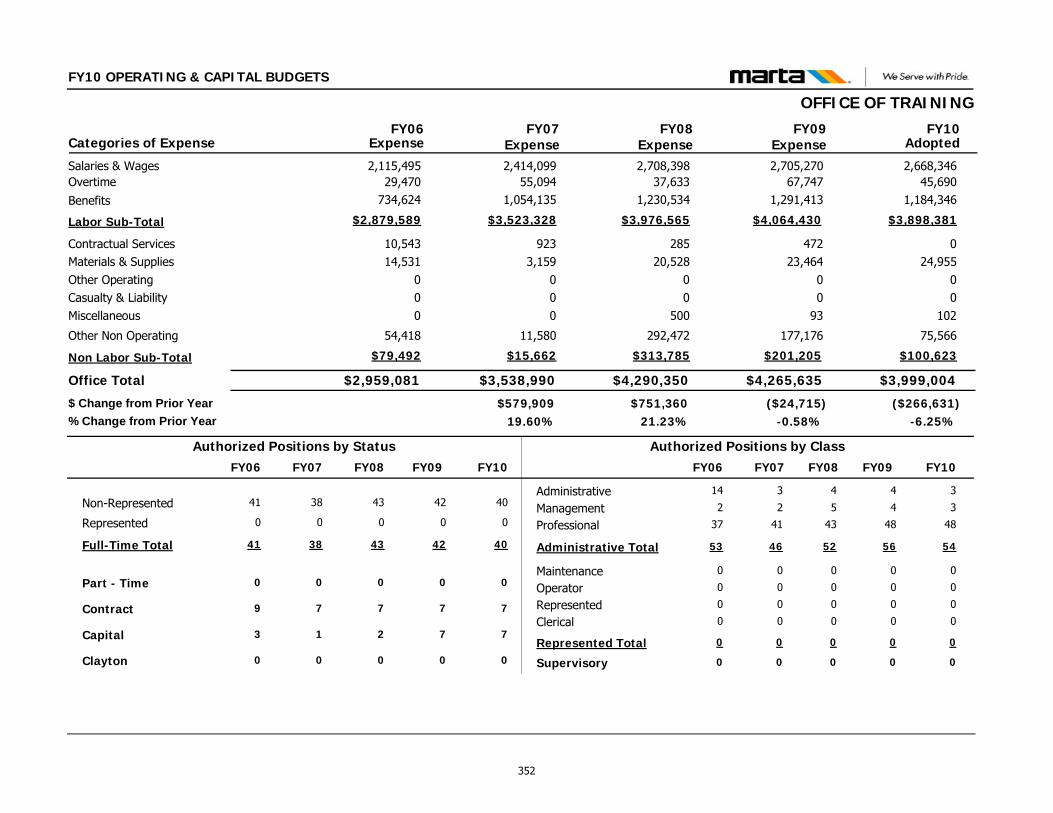
FY10 OPERATING & CAPITAL BUDGETS
OFFICE OF TRAINING
$3,999,004$4,265,635
024,955
00
102
75,566
47223,464
00
93
177,176
Contractual ServicesMaterials & SuppliesOther OperatingCasualty & LiabilityMiscellaneous
Other Non Operating
Office Total
2,668,3462,705,270Salaries & Wages45,69067,747Overtime
$3,898,381$4,064,430Labor Sub-Total
FY09 FY10Categories of Expense
$2,959,081
10,54314,531
000
54,418
2,115,49529,470
$2,879,589
FY06
$3,538,990
9233,159
000
11,580
2,414,09955,094
$3,523,328
FY07Expense Expense Expense Adopted
($266,631)($24,715)$579,909-6.25%-0.58%19.60%
$ Change from Prior Year% Change from Prior Year
$4,290,350
28520,528
00
500
292,472
2,708,39837,633
$3,976,565
FY08Expense
$751,36021.23%
$100,623$201,205Non Labor Sub-Total $79,492 $15,662 $313,785
1,184,3461,291,413Benefits 734,624 1,054,135 1,230,534
Administrative
Clerical
Management
MaintenanceOperator
Professional
Represented
Supervisory
4
0
4
0
0
48
0
0
3
0
3
0
0
48
0
0
Non-Represented 42 40
Part - Time 0 0
Represented 0 0
Full-Time Total 42 40
Contract 7 7
Capital 7 7
Authorized Positions by Class
Administrative Total 56 54
Authorized Positions by Status
Represented Total 0 0
3
0
2
0
0
41
0
0
38
0
0
38
7
1
46
0
14
0
2
0
0
37
0
0
41
0
0
41
9
3
53
0
FY10FY09 FY07FY06 FY10FY09 FY07FY06
Clayton 0 000
43
0
0
43
7
2
FY08
0
4
0
5
0
0
43
0
0
52
0
FY08
352
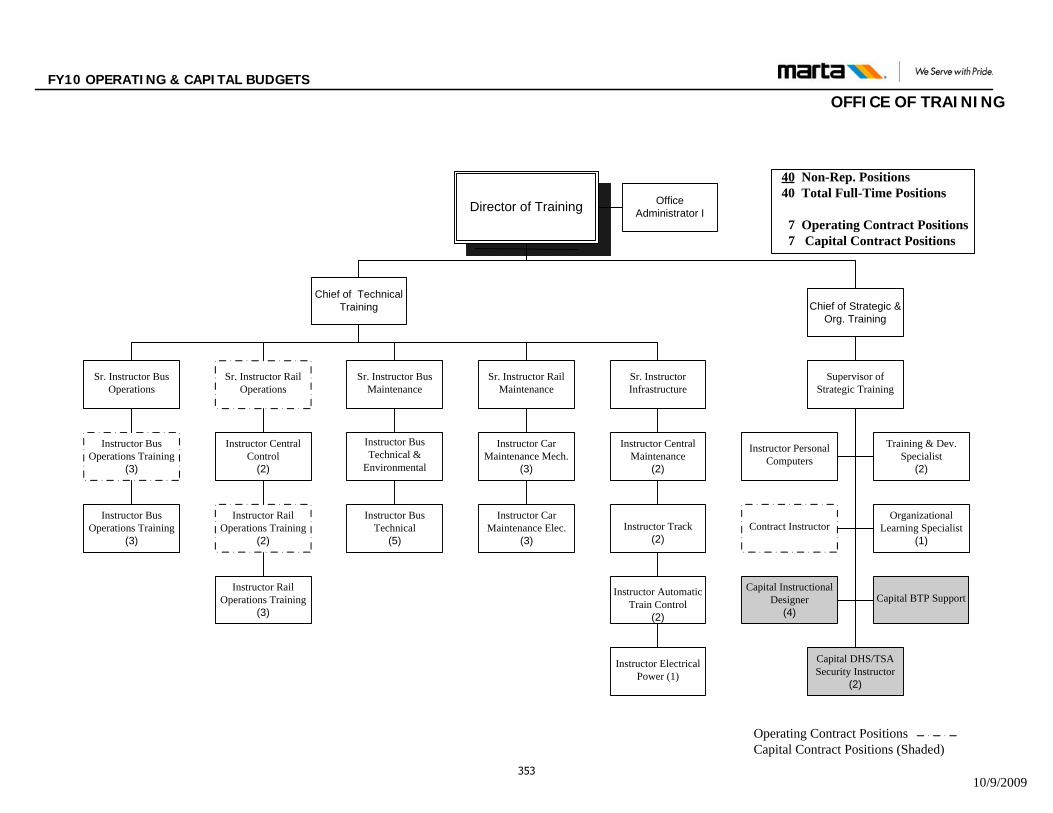
FY10 OPERATING & CAPITAL BUDGETS
OFFICE OF TRAINING
Operating Contract PositionsCapital Contract Positions (Shaded)
Director of Training Office Administrator I
40 Non-Rep. Positions 40 Total Full-Time Positions
7 Operating Contract Positions 7 Capital Contract Positions
Chief of Technical Training Chief of Strategic &
Org. Training
Sr. Instructor Rail Maintenance
Sr. Instructor Infrastructure
Sr. Instructor Bus Maintenance
Sr. Instructor Rail Operations
Sr. Instructor Bus Operations
Supervisor of Strategic Training
Instructor Bus Technical
(5)
Instructor Bus Technical &
Environmental
Instructor Car Maintenance Elec.
(3)
Instructor Car Maintenance Mech.
(3)
Instructor Electrical Power (1)
Instructor Automatic Train Control
(2)
Instructor Track(2)
Instructor Central Maintenance
(2)
Instructor Bus Operations Training
(3)
Instructor Bus Operations Training
(3)
Instructor Rail Operations Training
(3)
Instructor Rail Operations Training
(2)
Instructor Central Control
(2)
Instructor Personal Computers
Training & Dev. Specialist
(2)
Capital Instructional Designer
(4)
Organizational Learning Specialist
(1)
Capital BTP Support
Contract Instructor
Capital DHS/TSA Security Instructor
(2)
10/9/2009353
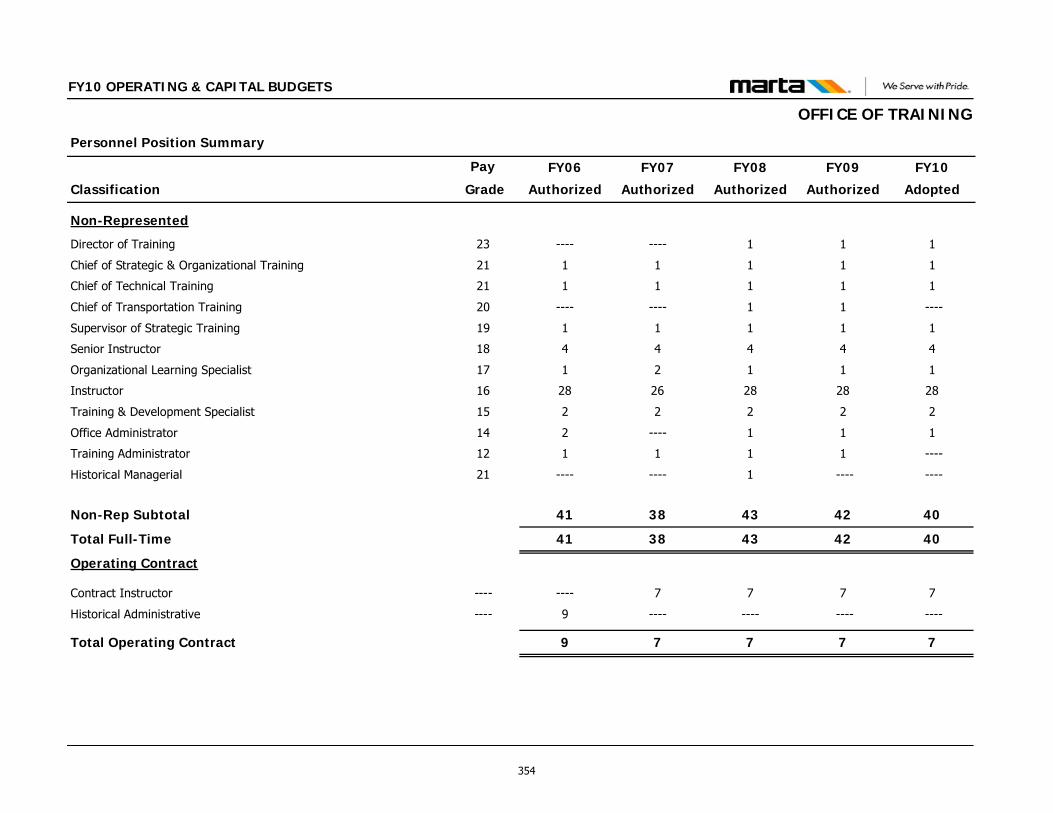
Classification
Personnel Position Summary
Pay FY09
Authorized
FY10
Adopted
FY10 OPERATING & CAPITAL BUDGETS
FY08
Authorized
FY07
Authorized
FY06
Authorized Grade
OFFICE OF TRAINING
Non-Represented
Director of Training 23 1 11--------
Chief of Strategic & Organizational Training 21 1 1111
Chief of Technical Training 21 1 1111
Chief of Transportation Training 20 1 ----1--------
Supervisor of Strategic Training 19 1 1111
Senior Instructor 18 4 4444
Organizational Learning Specialist 17 1 1121
Instructor 16 28 28282628
Training & Development Specialist 15 2 2222
Office Administrator 14 1 11----2
Training Administrator 12 1 ----111
Historical Managerial 21 ---- ----1--------
Non-Rep Subtotal 42 40433841
Total Full-Time 42 40433841
Operating Contract
Contract Instructor ---- 7 777----
Historical Administrative ---- ---- ------------9
Total Operating Contract 7 7779
354
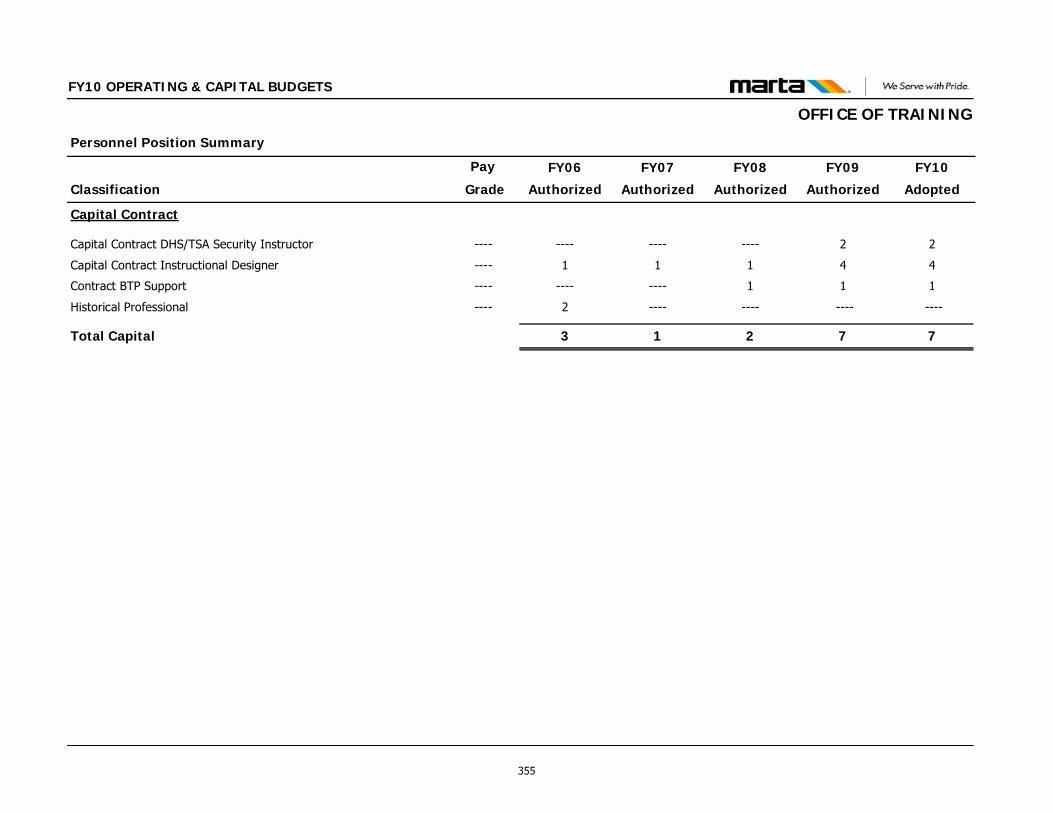
Classification
Personnel Position Summary
Pay FY09
Authorized
FY10
Adopted
FY10 OPERATING & CAPITAL BUDGETS
FY08
Authorized
FY07
Authorized
FY06
Authorized Grade
OFFICE OF TRAINING
Capital Contract
Capital Contract DHS/TSA Security Instructor ---- 2 2------------
Capital Contract Instructional Designer ---- 4 4111
Contract BTP Support ---- 1 11--------
Historical Professional ---- ---- ------------2
Total Capital 7 7213
355
FY10 OPERATING & CAPITAL BUDGETS
OFFICE OF EMPLOYEE AVAILABILITY FUNCTIONS & RESPONSIBILITES The Office of Employee Availability creates an environment extending to our employees the proper knowledge, programs, and support available, to adequately manage absence effectively, ensure the availability of quality employees and improve attendance performance. The function assesses, identifies and addresses absence issues, based on a comprehensive employee availability program with sensitive, but firm management policies and joint action to provide adequate staffing and improve employee availability. We assess and identify absenteeism, using absence management metrics and other data points. We lead and sponsor the creation of standardized processes, improvement initiatives, organizational development, change management and implement solutions to make better, faster more relevant business decisions, related to employee attendance. ACCOMPLISHMENTS Currently there are four, disparate timekeeping systems which
have been streamlined directly into a single platform (Data Warehouse) to consolidate the data not just to create numerous excel spreadsheets and reports; rather, the strategic objective is to utilize this data for analysis in “what-if scenarios” to improve tracking of leave time and bring key elements into focus for improvement. This functionality enables managers of MARTA to access to review and analyze data that impact operations, employee’s attendance rates and trending over time.
Pinpointed absence patterns and outcomes of how absences are
administered and managed to implement attendance strategies in
designing absence management best practices and making sure that process and policy are aligned. It allows for efficiencies and taking advantage of windows of opportunities for ensuring that that policies and procedures are being followed by management and employees alike.
Conducted process mapping to understand the current state of
leave programs and return to work programs to design the future state along with updating policy as we review related policy for opportunities to improve consistency of processes, understand leave laws and tighten administrative and management controls of leave programs, particularly with the complexity of FMLA regulations and compliance.
Standardized and improved the workflow processes by
implementing a standardized access system for which Transitional Employment Program (TEP) Administrators and Bus/Rail Transportation management could obtain accurate attendance information about how many people are on TEP are at work, late, out on another leave and for how long. These processes are of particular importance in response to improve management of employee attendance information (their records, histories, their movement, etc.) and ready access to accurate employee attendance information to ensure efficient operation, accurately tracking leave time within an automated system, eliminating the usage of paper timesheets and addressing attendance performance.
356

FY10 OPERATING & CAPITAL BUDGETS
OFFICE OF EMPLOYEE AVAILABILITY
$121,282$136,455
00000
0
00000
0
Contractual ServicesMaterials & SuppliesOther OperatingCasualty & LiabilityMiscellaneous
Other Non Operating
Office Total
81,172100,621Salaries & Wages00Overtime
$121,282$136,455Labor Sub-Total
FY09 FY10Categories of Expense
$0
00000
0
00
$0
FY06
$0
00000
0
00
$0
FY07Expense Expense Expense Adopted
($15,173)$136,455$0-11.12%100.00%0.00%
$ Change from Prior Year% Change from Prior Year
$0
00000
0
00
$0
FY08Expense
$00.00%
$0$0Non Labor Sub-Total $0 $0 $0
40,11035,834Benefits 0 0 0
Administrative
Clerical
Management
MaintenanceOperator
Professional
Represented
Supervisory
0
0
0
0
0
1
0
0
0
0
0
0
0
1
0
0
Non-Represented 1 1
Part - Time 0 0
Represented 0 0
Full-Time Total 1 1
Contract 0 0
Capital 0 0
Authorized Positions by Class
Administrative Total 1 1
Authorized Positions by Status
Represented Total 0 0
0
0
0
0
0
0
0
0
0
0
0
0
0
0
0
0
0
0
0
0
0
0
0
0
0
0
0
0
0
0
0
0
FY10FY09 FY07FY06 FY10FY09 FY07FY06
Clayton 0 000
0
0
0
0
0
0
FY08
0
0
0
0
0
0
0
0
0
0
0
FY08
357

FY10 OPERATING & CAPITAL BUDGETS
OFFICE OF EMPLOYEE AVAILABILITY
Director of Employee Availability
1 Non-Rep. Position 1 Total Full-Time Position
358
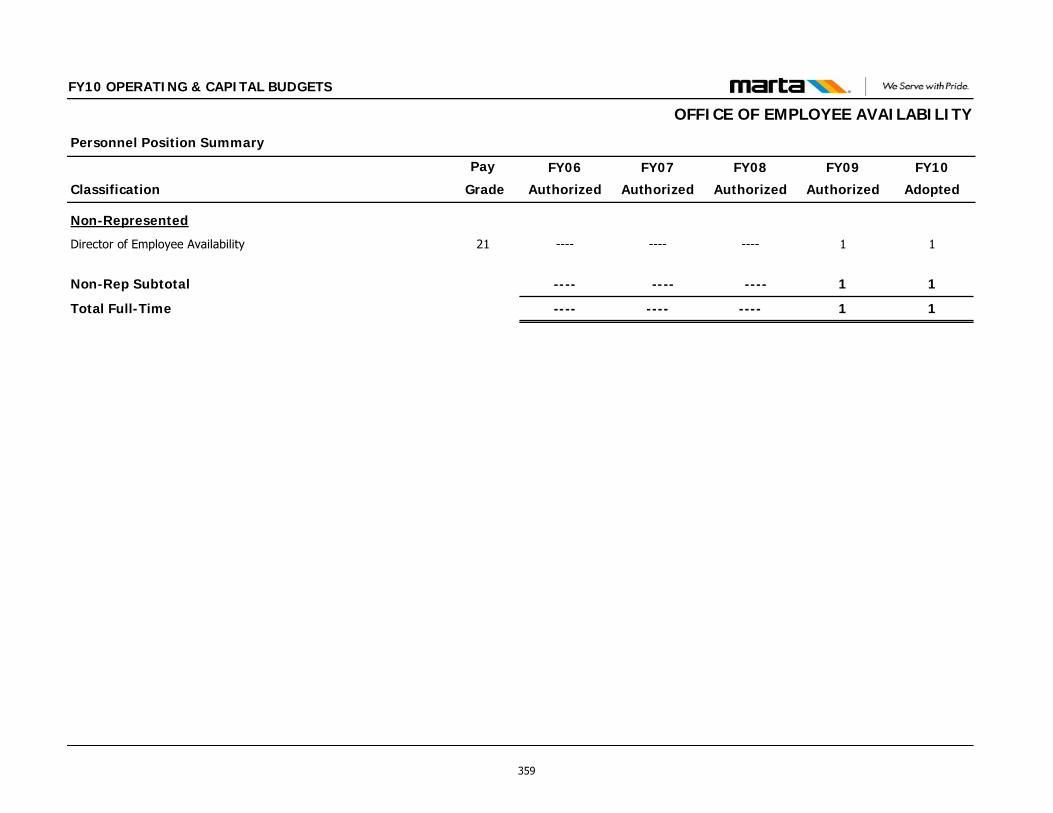
Classification
Personnel Position Summary
Pay FY09
Authorized
FY10
Adopted
FY10 OPERATING & CAPITAL BUDGETS
FY08
Authorized
FY07
Authorized
FY06
Authorized Grade
OFFICE OF EMPLOYEE AVAILABILITY
Non-Represented
Director of Employee Availability 21 1 1------------
Non-Rep Subtotal 1 1 ---- --------
Total Full-Time 1 1------------
359
FY10 OPERATING & CAPITAL BUDGETS
OFFICE OF DIVERSITY & EQUAL OPPORTUNITY FUNCTIONS & RESPONSIBILITIES The Office of Diversity & Equal Opportunity is charged with the development, implementation, coordination, and monitoring of all equal opportunity, affirmative action, conflict resolution and civil rights programs required by Board policies and Federal regulations. This includes, but is not limited to, the following:
• Equal Employment Opportunity • Affirmative Action • Americans With Disabilities Act (ADA) • Title VI of the Civil Rights Act of 1964 • Title VII of the Civil Rights Act of 1964 • Environmental Justice • Small and Socio-Economically Disadvantaged Business
Program • Cultural Diversity • Alternative Dispute Resolution
The Office of Diversity & Equal Opportunity serves as an advocate of the Authority's commitment to the promotion of a work environment that recognizes and values the diverse social profile of the MARTA service area. As such, the office ensures the equitable representation and advancement of protected group members at all levels of employment, the utilization of smalt, socially and
economically disadvantaged businesses in contracts and procurements, the equitable distribution of transit service and benefits, as well as the non-discriminatory impact of Authority decisions and activities.
These objectives are accomplished through a multiplicity of means. First, all Authority employment decisions, practices, and procedures are reviewed to ensure that they are fair and equitable. Second, the maximization of small, socially and economically disadvantaged business enterprises is done through goal setting, monitoring of participation commitments, outreach efforts, and DBE certifications. Third, Title VI and Environmental Justice programs are designed and implemented to review, monitor, and ensure that there is a consistently equitable distribution of transit services and benefits. Finally, strategically targeted outreach efforts are designed to solicit and gauge community input to facilitate the examination of all facts
and ensure the non-discriminatory impact of the Authority's decisions and activities.
The Mystery Customer Program Unit (MCPU) analyzes daily, monthly and quarterly mystery shopper reports to ensure agency compliance with ADA (Americans with Disabilities Act) requirements and to track key customer service performance. FY09 ACCOMPLISHMENTS DEO Georgia Unified Certification Program
One hundred twenty-seven (127) new DBE Pre-certifications reviewed, processed and determined
Twenty-one percent (21%) Out-of-State Five percent (5%) outside of Metro Atlanta Thirty-four (34) DBE Annual Notices of No Change reviewed, processed and determined Contracts Monitored for EEO requirements and DBE Participation
Fifty (50) new contracts awarded that require monitoring until contract closeout
Fifteen percent (15%) of contracts with contract goal
Total of 134 contracts multi-year contracts now being monitored foe EEO and DBE participation until contract closeout
DBE Program Management and Technical Assistance Efforts:
Conducted Twenty-two (22) one-on-one contracts and procurement technical assistance meetings with small, minority, women and disadvantaged businesses.
360
FY10 OPERATING & CAPITAL BUDGETS
O TUNITY
FFICE OF DIVERSITY & EQUAL OPPOR
Developed, published and distributed the MARTA Connector for 12 months. Each MARTA Connector reflected information on different organizational, managerial and cutting edge topics that are germane to the development and maintenance of small, minority, women and disadvantaged businesses. Distributed e-mail blasts that covered the visit of the SBA’s Small Business Ombudsman to Atlanta; information on federal regulation changes and new requirements; and information on the requirements that all firms will have to meet to participate on a contract funded by economic stimulus money. Published and disseminated a hard copy DBE Directory. In addition, posted the DBE Directory on the MARTA website and ensured monthly updates. EEO, Title VI, Title VII and Limited English Proficiency
A. Compliance Training /Workshops
1. Monthly New Employee orientation training on EEO, ADA and
Sexual Harassment prevention 2. Clayton County C-Tran informational meetings and training on
rights and responsibilities 3. ADA training class conducted for Supervisors at Laredo Garage 4. EEO training class for supervisors from bus, rail and headquarters 5. Coordinated with the Technical Training Department on the
development of an Anger Management training class. 6. Compliance training conducted for MARTA Line Staff 7. EEO, Affirmative Action and Sexual Harassment Prevention
training classes conducted for the MARTA Police Department
B. Compliance and Enforcement Activities 1. Designed, developed and implemented a DEO facilities’
Compliance Review Program and forms. Have carried out four to five facility compliance reviews
2. Developed an electronic complaint determination and tracking system
3. Conducted workplace assessments and climate surveys at Brady Avenue, Laredo Garage, Perry Garage, and Armour Yard
4. Conducted environmental climate surveys in the Program Management Division in Headquarters
5. Designed, developed, distributed and retrieved VETs 100 form and information on the Veteran’s status of 9% of the MARTA employee populous
6. Reviewed 70-75 hiring packages from HR for compliance with the established Affirmative Action requirements
C. Effectuated Cultural Diversity Initiatives 1. Developed and distributed a Cultural Diversity Calendar for five
months. This will be an on-going activity 2. Developed and displayed posters for special emphasis/diversity
celebrations. Thus far, the displays have addressed:
A. Hispanic/Latino Heritage Month B. Native American Heritage Month C. Black History Month D. Asian/Pacific Islander Heritage Month E. Women’s History Month
3. Held a Veteran’s Day Program honoring MARTA’s Veterans.
Provide Veterans with a copy of the Proclamation signed by President Bush, a certificate of Special Recognition with their name on it, and a flag lapel pin.
361
FY10 OPERATING & CAPITAL BUDGETS
OFFICE OF DIVERSITY & EQUAL OPPORTUNITY
4. Initiated liaison and discussions with the Consulate Generals from
Guatemala, Mexico, Colombia and Argentina. 5. Established partnership with the East Indian Chamber of
Commerce 6. Attended cultural and employment recruitment affairs sponsored
by the Latin American Association 7. Attended the reception for the Indonesian Ambassador 8. Participated in the Annual Asian Rice Festival
D. Title VI, Title VII, Workplace Violence and ADA
Complaints DEO has received and processed over 60 complaints. Twenty eight Title VI/Title VII complaints have been resolved through informal processes. Sixteen additional Title VI/Title VII complaints have required full-fledged investigations. Sixteen conflict resolution/ADR complaints have required full-fledged investigations. This is the total thus far with several weeks left in MARTA’s FY09 fiscal year.
362

FY10 OPERATING & CAPITAL BUDGETS
OFFICE OF DIVERSITY & EQUAL OPPORTUNITY
$1,561,333$1,558,850
26,1217,361
000
40,931
26,10510,163
000
44,457
Contractual ServicesMaterials & SuppliesOther OperatingCasualty & LiabilityMiscellaneous
Other Non Operating
Office Total
995,1481,045,981Salaries & Wages0132Overtime
$1,486,920$1,478,125Labor Sub-Total
FY09 FY10Categories of Expense
$1,109,232
19,64610,783
000
45,038
782,27460
$1,033,765
FY06
$1,431,929
39,22212,631
000
77,630
930,363176
$1,302,446
FY07Expense Expense Expense Adopted
$2,483($115,182)$322,6970.16%-6.88%29.09%
$ Change from Prior Year% Change from Prior Year
$1,674,032
32,61816,310
000
70,492
1,087,243403
$1,554,612
FY08Expense
$242,10316.91%
$74,413$80,725Non Labor Sub-Total $75,467 $129,483 $119,420
491,772432,012Benefits 251,431 371,907 466,966
Administrative
Clerical
Management
MaintenanceOperator
Professional
Represented
Supervisory
3
0
3
0
0
11
0
0
3
0
3
0
0
10
0
0
Non-Represented 17 16
Part - Time 0 0
Represented 0 0
Full-Time Total 17 16
Contract 0 0
Capital 0 0
Authorized Positions by Class
Administrative Total 17 16
Authorized Positions by Status
Represented Total 0 0
3
0
3
0
0
10
0
0
16
0
0
16
0
0
16
0
4
0
2
0
0
10
0
0
15
0
0
15
1
0
16
0
FY10FY09 FY07FY06 FY10FY09 FY07FY06
Clayton 0 000
17
0
0
17
0
0
FY08
0
3
0
3
0
0
11
0
0
17
0
FY08
363
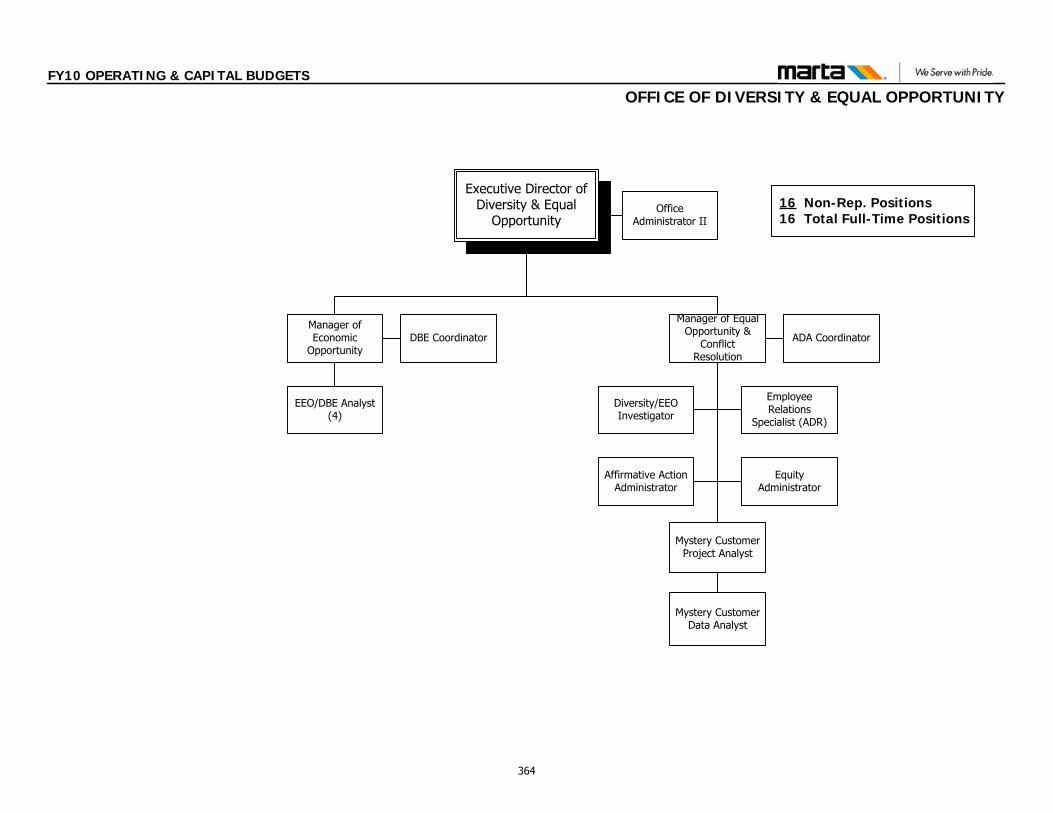
FY10 OPERATING & CAPITAL BUDGETS
OFFICE OF DIVERSITY & EQUAL OPPORTUNITY
Executive Director of Diversity & Equal
Opportunity
Manager of Economic
Opportunity
Affirmative Action Administrator
EEO/DBE Analyst (4)
16 Non-Rep. Positions 16 Total Full-Time Positions
Office Administrator II
Diversity/EEO Investigator
Mystery Customer Project Analyst
Manager of Equal Opportunity &
Conflict Resolution
Equity Administrator
Employee Relations
Specialist (ADR)
DBE Coordinator ADA Coordinator
Mystery Customer Data Analyst
364
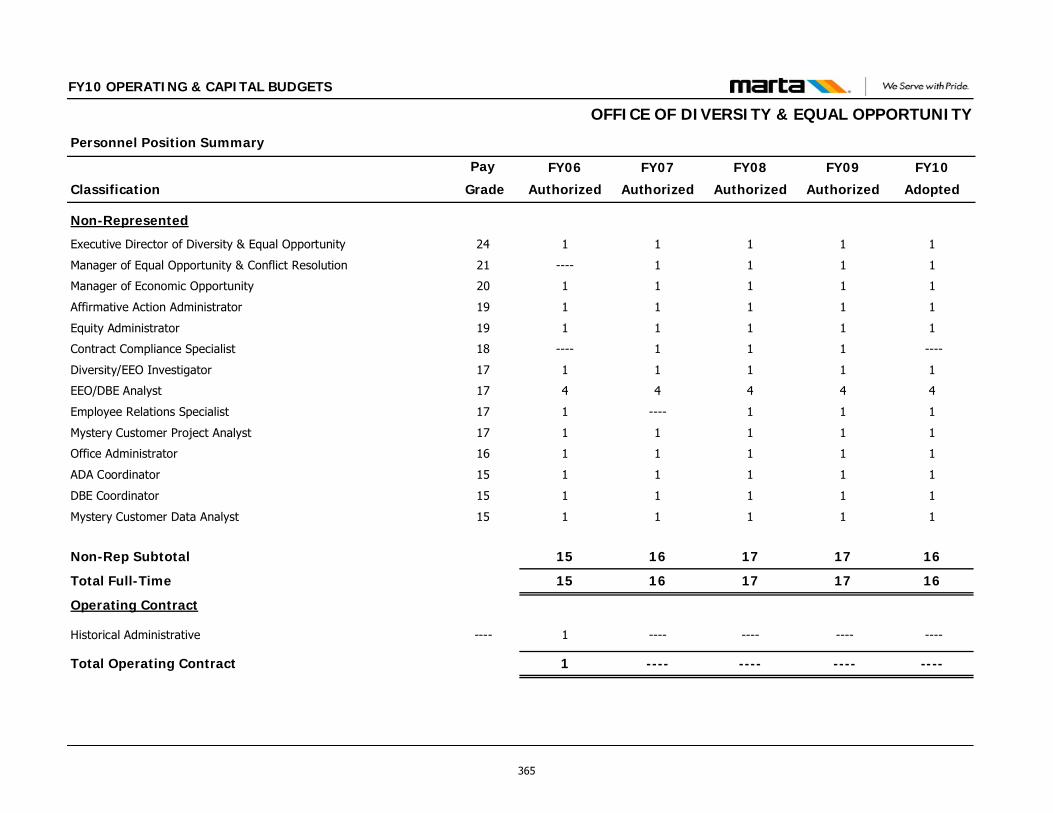
Classification
Personnel Position Summary
Pay FY09
Authorized
FY10
Adopted
FY10 OPERATING & CAPITAL BUDGETS
FY08
Authorized
FY07
Authorized
FY06
Authorized Grade
OFFICE OF DIVERSITY & EQUAL OPPORTUNITY
Non-Represented
Executive Director of Diversity & Equal Opportunity 24 1 1111
Manager of Equal Opportunity & Conflict Resolution 21 1 111----
Manager of Economic Opportunity 20 1 1111
Affirmative Action Administrator 19 1 1111
Equity Administrator 19 1 1111
Contract Compliance Specialist 18 1 ----11----
Diversity/EEO Investigator 17 1 1111
EEO/DBE Analyst 17 4 4444
Employee Relations Specialist 17 1 11----1
Mystery Customer Project Analyst 17 1 1111
Office Administrator 16 1 1111
ADA Coordinator 15 1 1111
DBE Coordinator 15 1 1111
Mystery Customer Data Analyst 15 1 1111
Non-Rep Subtotal 17 16171615
Total Full-Time 17 16171615
Operating Contract
Historical Administrative ---- ---- ------------1
Total Operating Contract ---- ------------1
365

This page intentionally left blank
366
DEPARTMENT OF TECHNOLOGY This Department includes the following Offices: Department of Technology Office of the AGM of Technology Office of Technology Infrastructure & Operations Office of Technology Enterprise Applications Office of Technology Programs Management
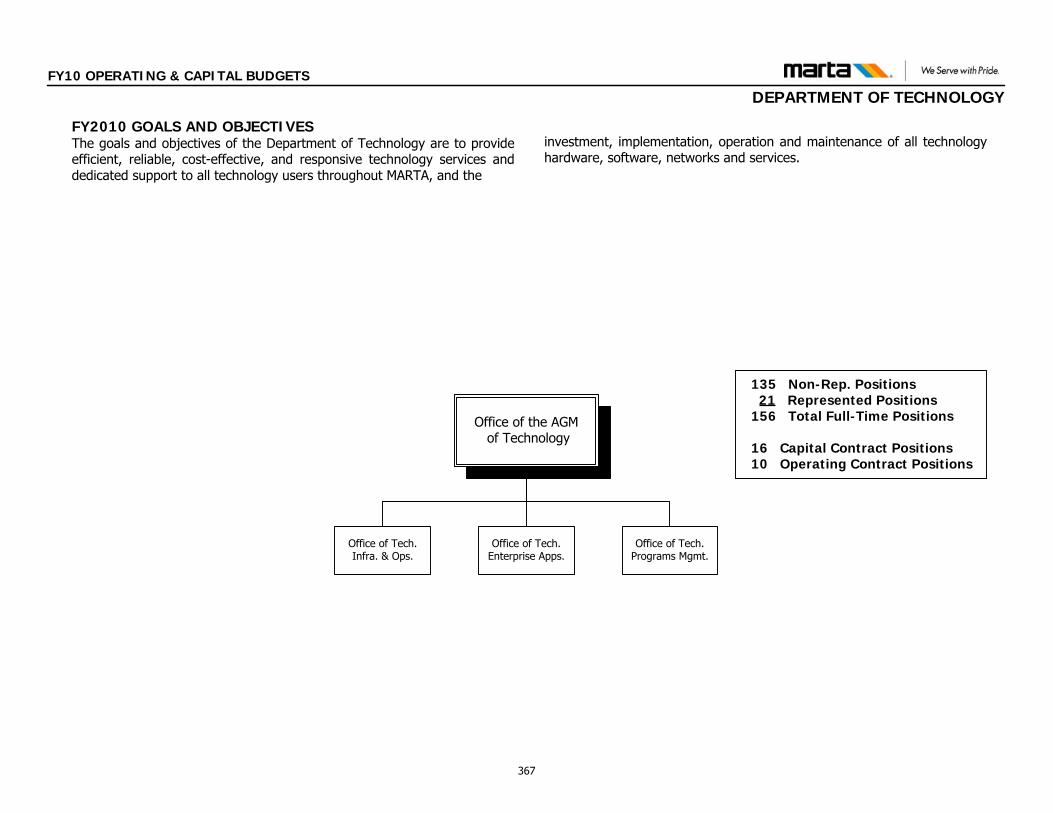
Office of the AGM of Technology
Office of Tech. Infra. & Ops.
Office of Tech. Enterprise Apps.
Office of Tech. Programs Mgmt.
135 Non-Rep. Positions21 Represented Positions
156 Total Full-Time Positions
16 Capital Contract Positions 10 Operating Contract Positions
FY2010 GOALS AND OBJECTIVESThe goals and objectives of the Department of Technology are to provide efficient, reliable, cost-effective, and responsive technology services and dedicated support to all technology users throughout MARTA, and the
investment, implementation, operation and maintenance of all technology hardware, software, networks and services.
FY10 OPERATING & CAPITAL BUDGETS
DEPARTMENT OF TECHNOLOGY
367

FY10 OPERATING & CAPITAL BUDGETS
DEPARTMENT OF TECHNOLOGY
$21,429,718$14,158,249
2,829,155499,341
1,728,70300
60,510
3,320,537443,117
1,632,03100
69,959
Contractual ServicesMaterials & SuppliesOther OperatingCasualty & LiabilityMiscellaneous
Other Non Operating
Department Total
11,011,4586,086,509Salaries & Wages65,740278,139Overtime
$16,312,009$8,692,605Labor Sub-Total
FY09 FY10Categories of Expense
$13,942,012
2,146,666511,445
1,911,44000
32,589
6,502,369636,072
$9,339,872
FY06
$11,528,534
3,638,600431,816
1,810,1670
226
62,538
3,733,596216,585
$5,585,187
FY07Expense Expense Expense Adopted
$7,271,469($760,379)($2,413,478)51.36%-5.10%-17.31%
$ Change from Prior Year% Change from Prior Year
$14,918,628
4,515,036771,399
1,938,19100
154,263
5,350,378196,302
$7,539,739
FY08Expense
$3,390,09429.41%
$5,117,709$5,465,644Non Labor Sub-Total $4,602,140 $5,943,347 $7,378,889
5,234,8112,327,957Benefits 2,201,431 1,635,006 1,993,059
Administrative
Clerical
Management
MaintenanceOperator
Professional
Represented
Supervisory
13
0
9
10
0
103
0
2
17
0
10
21
0
132
0
2
Non-Represented 79 135
Part - Time 0 0
Represented 10 21
Full-Time Total 89 156
Contract 10 10
Capital 38 16
Authorized Positions by Class
Administrative Total 125 159
Authorized Positions by Status
Represented Total 10 21
8
0
7
10
0
78
0
2
74
0
10
84
0
21
93
10
7
0
9
10
0
51
0
2
49
0
10
59
0
20
67
10
FY10FY09 FY07FY06 FY10FY09 FY07FY06
Clayton 0 000
80
0
10
90
5
21
FY08
0
15
0
8
10
0
81
0
2
104
10
FY08
368
FY10 OPERATING & CAPITAL BUDGETS
OFFICE OF THE AGM OF TECHNOLOGY FUNCTIONS AND RESPONSIBILITIES The Assistant General Manager/CIO leads the Department of Technology, which is responsible for providing efficient, reliable, cost-effective, and responsive technology services and dedicated support to all technology users throughout MARTA. The Assistant General Manager/CIO is responsible for the investment, implementation, operation and maintenance of all technology hardware, software, networks and services. The Assistant General Manager/CIO of Technology manages four offices: Office of the AGM of Technology/CIO Office of Technology Infrastructure & Operations Office of Technology Enterprise Applications Office of Technology Programs Management
In addition to managing these offices and branches, the Assistant General Manager/CIO’s responsibilities also include setting strategies, policies and procedures for Technology and overall management and direction of the Authority’s technology investments which contribute to MARTA’s success through:
Ensuring proper management control over the technology, fiscal
and human resources of MARTA. Providing cost-effective, efficient, manageable, and maintainable
support for MARTA critical enterprise operations. Upgrading and/or replacing MARTA’s business and technology
architecture, including hardware, software, and applications infrastructures.
Directing and leadership of technology associated management groups including Technology Working Group (TWG), Source Evaluation Committee (SEC), and Technology Steering Committees (TSC).
Ensuring sound and responsible business, financial and project practices for telecommunications, technology assets, fiscal and operating budgets and development of projects for technology and its customers.
Successful implementation of new technology programs currently underway at MARTA including the Automated Fare Collection System (Breeze), Automatic Vehicle Locator system, Business Transformation Program, etc.
369

FY10 OPERATING & CAPITAL BUDGETS
OFFICE OF THE AGM OF TECHNOLOGY
$690,636$447,231
16,90870,502
67400
30,259
12,40963,445
49500
39,946
Contractual ServicesMaterials & SuppliesOther OperatingCasualty & LiabilityMiscellaneous
Other Non Operating
Office Total
382,993244,243Salaries & Wages00Overtime
$572,293$330,936Labor Sub-Total
FY09 FY10Categories of Expense
$1,075,604
16,64529,157
000
11,003
792,567110
$1,018,799
FY06
$388,571
015,112
000
12,825
284,287334
$360,634
FY07Expense Expense Expense Adopted
$243,405($56,799)($687,033)54.42%-11.27%-63.87%
$ Change from Prior Year% Change from Prior Year
$504,030
8,67021,976
000
69,199
319,7001,728
$404,185
FY08Expense
$115,45929.71%
$118,343$116,295Non Labor Sub-Total $56,805 $27,937 $99,845
189,30086,693Benefits 226,122 76,013 82,757
Administrative
Clerical
Management
MaintenanceOperator
Professional
Represented
Supervisory
0
0
2
0
0
2
0
0
0
0
2
0
0
2
0
0
Non-Represented 4 4
Part - Time 0 0
Represented 0 0
Full-Time Total 4 4
Contract 0 0
Capital 0 0
Authorized Positions by Class
Administrative Total 4 4
Authorized Positions by Status
Represented Total 0 0
0
0
0
0
0
2
0
0
2
0
0
2
0
0
2
0
1
0
1
0
0
0
0
0
2
0
0
2
0
0
2
0
FY10FY09 FY07FY06 FY10FY09 FY07FY06
Clayton 0 000
3
0
0
3
0
0
FY08
0
0
0
1
0
0
2
0
0
3
0
FY08
370
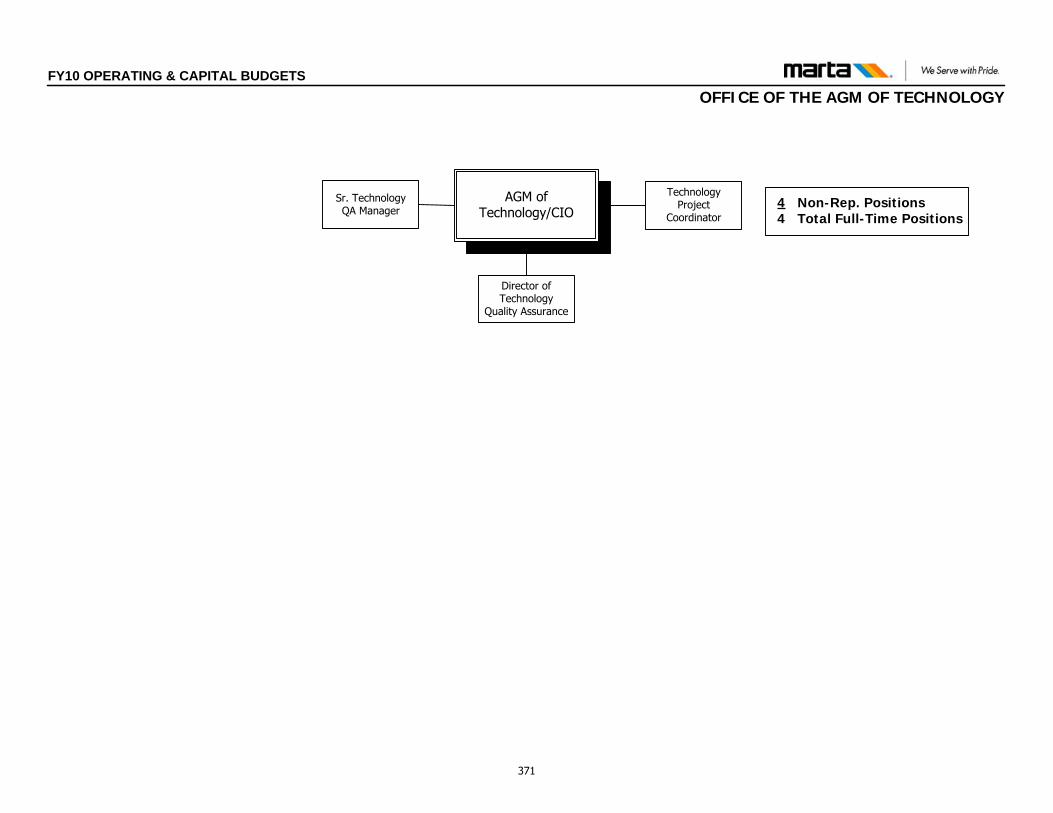
AGM of Technology/CIO
4 Non-Rep. Positions4 Total Full-Time Positions
Technology Project
Coordinator
Director of Technology
Quality Assurance
Sr. Technology QA Manager
FY10 OPERATING & CAPITAL BUDGETSOFFICE OF THE AGM OF TECHNOLOGY
371
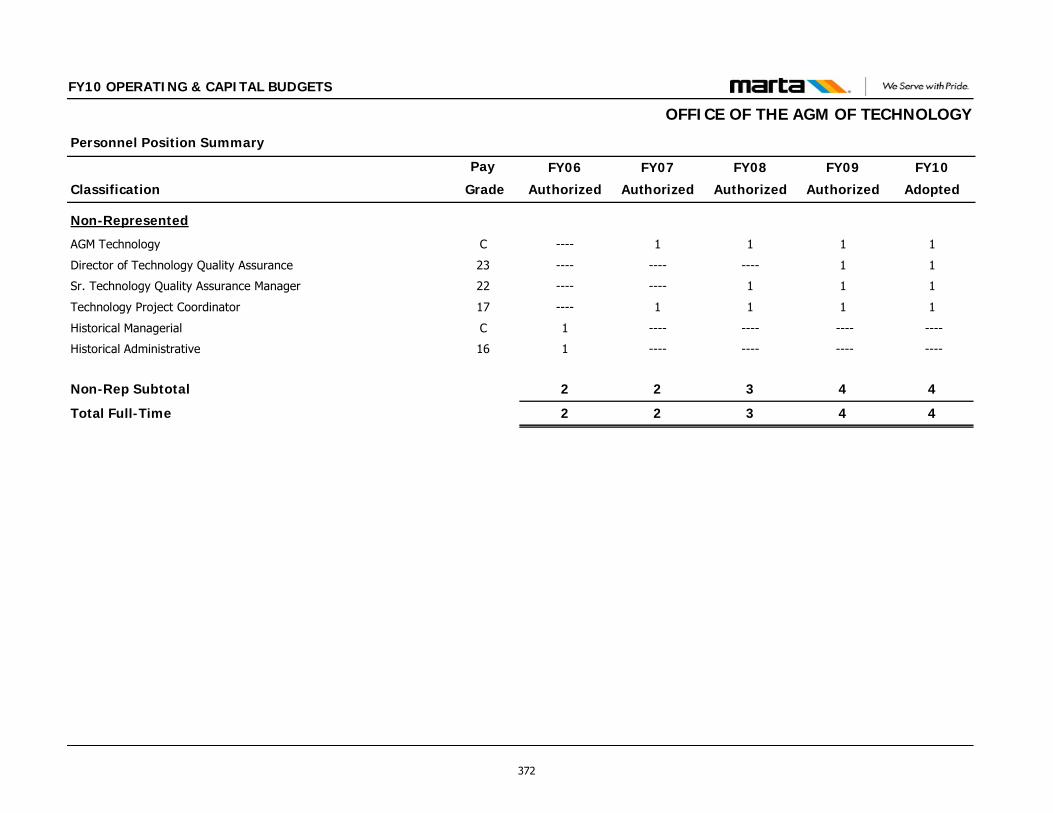
Classification
Personnel Position Summary
Pay FY09
Authorized
FY10
Adopted
FY10 OPERATING & CAPITAL BUDGETS
FY08
Authorized
FY07
Authorized
FY06
Authorized Grade
OFFICE OF THE AGM OF TECHNOLOGY
Non-Represented
AGM Technology C 1 111----
Director of Technology Quality Assurance 23 1 1------------
Sr. Technology Quality Assurance Manager 22 1 11--------
Technology Project Coordinator 17 1 111----
Historical Managerial C ---- ------------1
Historical Administrative 16 ---- ------------1
Non-Rep Subtotal 4 4322
Total Full-Time 4 4322
372
FY10 OPERATING & CAPITAL BUDGETS
OFFICE OF TECHNOLOGY INFRASTRUCTURE & OPERATIONS FUNCTIONS AND RESPONSIBILITIES The Office of Technology Infrastructure & Operations is responsible for providing computing support for mainframe and enterprise client/server environments, technology data center processing services and maintenance and support of all technology systems. This office supports Authority-Wide business units in providing distributed desktop support, data network connectivity support, telephony services support and radio communications support. This office operates and maintains an integrated Technology infrastructure that enables MARTA to operate effectively and efficiently in current and emerging business environments. Infrastructure plans, deploys and supports the rollout of new desktops, printers and associated software and controls the overall usage of technology tools throughout the Authority. This department accomplishes these functions through the Technology Systems Support, Enterprise Network Operations and Communications branches. The Technology Systems Support branch responsibilities include: Providing mainframe payroll and human resources Tier I support. Tier I support of enterprise systems to include system monitoring
for both the server farm environments and the enterprise network environment. This section of the branch is currently in the process of transitioning to an enterprise network operations center.
Technology Help Desk services for distributed desk top support and fielding/escalation of all technology related production support areas.
Tier I support of train control system, to include wayside components.
Planning, updating and maintaining Disaster Recovery and Business Continuity plans working in coordination with Tier II support teams for disaster recovery implementation.
Data Center and Disaster Recovery Center Operations. The Enterprise Network Operations branch responsibilities include: Providing Authority-wide Tier II support (diagnosing and
resolving production support issues) for enterprise server, data network and telephony systems.
Managing and maintaining MARTA’s core technology infrastructure, which includes Windows server systems, UNIX server systems, distributed printing components, and enterprise LAN/WAN components.
Providing Authority-Wide telephony services, to include the rail station public telephone system.
Support and maintenance of Authority-Wide rail station public address system.
Management of Authority-Wide data transport system (SONET). Deployment and management of enterprise disaster recovery and
storage area networking systems. Deployment and management of enterprise anti-virus systems. Facilitating Authority-wide network access, to include the
deployment and management of networking components.
373

FY10 OPERATING & CAPITAL BUDGETS
OFFICE OF TECHNOLOGY INFRASTRUCTURE & OPERATIONS
$9,875,608$8,103,537
1,584,836410,944
1,416,94300
12,059
2,174,845368,334
1,276,26100
10,824
Contractual ServicesMaterials & SuppliesOther OperatingCasualty & LiabilityMiscellaneous
Other Non Operating
Office Total
4,411,9152,911,990Salaries & Wages65,740261,214Overtime
$6,450,826$4,273,273Labor Sub-Total
FY09 FY10Categories of Expense
$10,276,555
1,152,328470,086
1,911,44000
15,383
4,503,425635,962
$6,727,318
FY06
$7,018,058
2,268,209404,161
1,810,16700
22,962
1,468,673215,785
$2,512,559
FY07Expense Expense Expense Adopted
$1,772,071($700,834)($3,258,497)21.87%-7.96%-31.71%
$ Change from Prior Year% Change from Prior Year
$8,804,371
2,625,485709,767
1,886,25000
51,149
2,366,544181,534
$3,531,720
FY08Expense
$1,786,31325.45%
$3,424,782$3,830,264Non Labor Sub-Total $3,549,237 $4,505,499 $5,272,651
1,973,1711,100,069Benefits 1,587,931 828,101 983,642
Administrative
Clerical
Management
MaintenanceOperator
Professional
Represented
Supervisory
12
0
3
10
0
35
0
2
14
0
3
21
0
44
0
2
Non-Represented 32 52
Part - Time 0 0
Represented 10 21
Full-Time Total 42 73
Contract 5 5
Capital 15 6
Authorized Positions by Class
Administrative Total 50 61
Authorized Positions by Status
Represented Total 10 21
7
0
3
10
0
24
0
2
29
0
10
39
0
7
34
10
5
0
4
10
0
23
0
2
27
0
10
37
0
7
32
10
FY10FY09 FY07FY06 FY10FY09 FY07FY06
Clayton 0 000
34
0
10
44
5
7
FY08
0
14
0
3
10
0
27
0
2
44
10
FY08
374
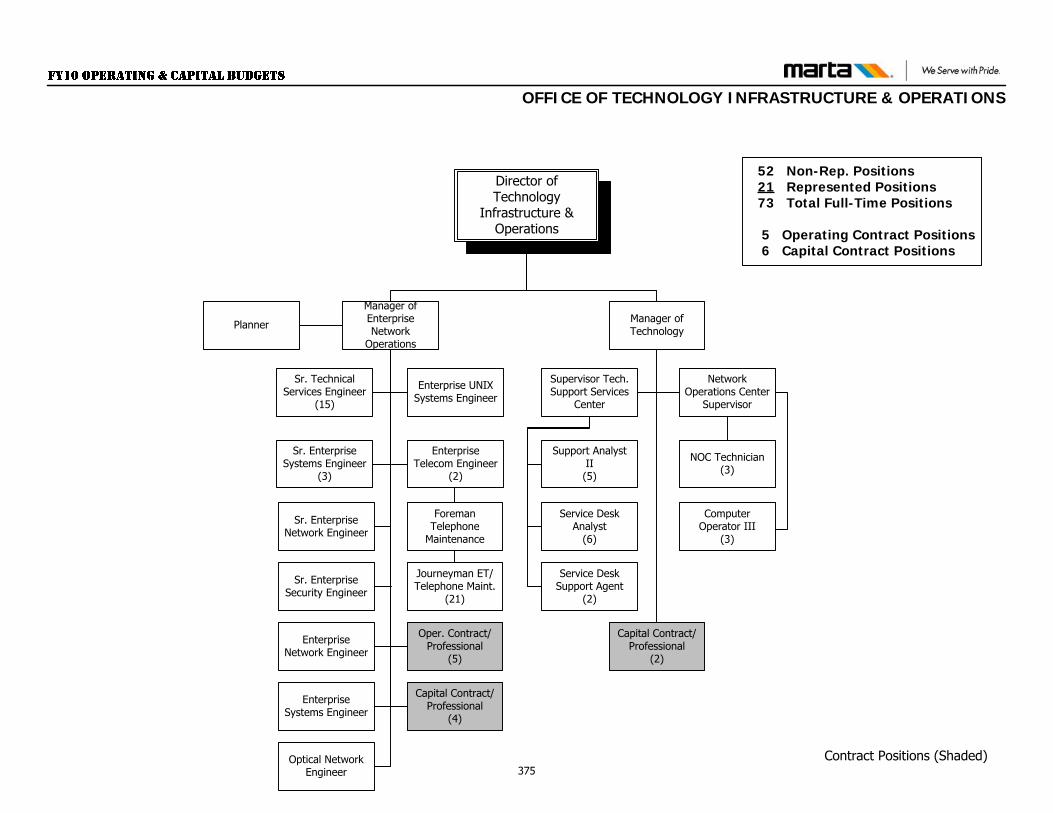
Director of Technology
Infrastructure & Operations
52 Non-Rep. Positions21 Represented Positions
73 Total Full-Time Positions
5 Operating Contract Positions 6 Capital Contract Positions
Manager of Enterprise Network
Operations
Manager of Technology
Sr. Enterprise Systems Engineer
(3)
Enterprise Network Engineer
Contract Positions (Shaded)
Capital Contract/Professional
(2)
Supervisor Tech. Support Services
Center
Support Analyst II(5)
Service Desk Analyst
(6)
Sr. Technical Services Engineer
(15)
Capital Contract/Professional
(4)
Oper. Contract/Professional
(5)
Enterprise UNIX Systems Engineer
Network Operations Center
Supervisor
NOC Technician(3)
Enterprise Telecom Engineer
(2)
Computer Operator III
(3)
ForemanTelephone
Maintenance
Journeyman ET/ Telephone Maint.
(21)
Planner
Enterprise Systems Engineer
Optical Network Engineer
Service Desk Support Agent
(2)
Sr. Enterprise Network Engineer
Sr. Enterprise Security Engineer
OFFICE OF TECHNOLOGY INFRASTRUCTURE & OPERATIONS
375
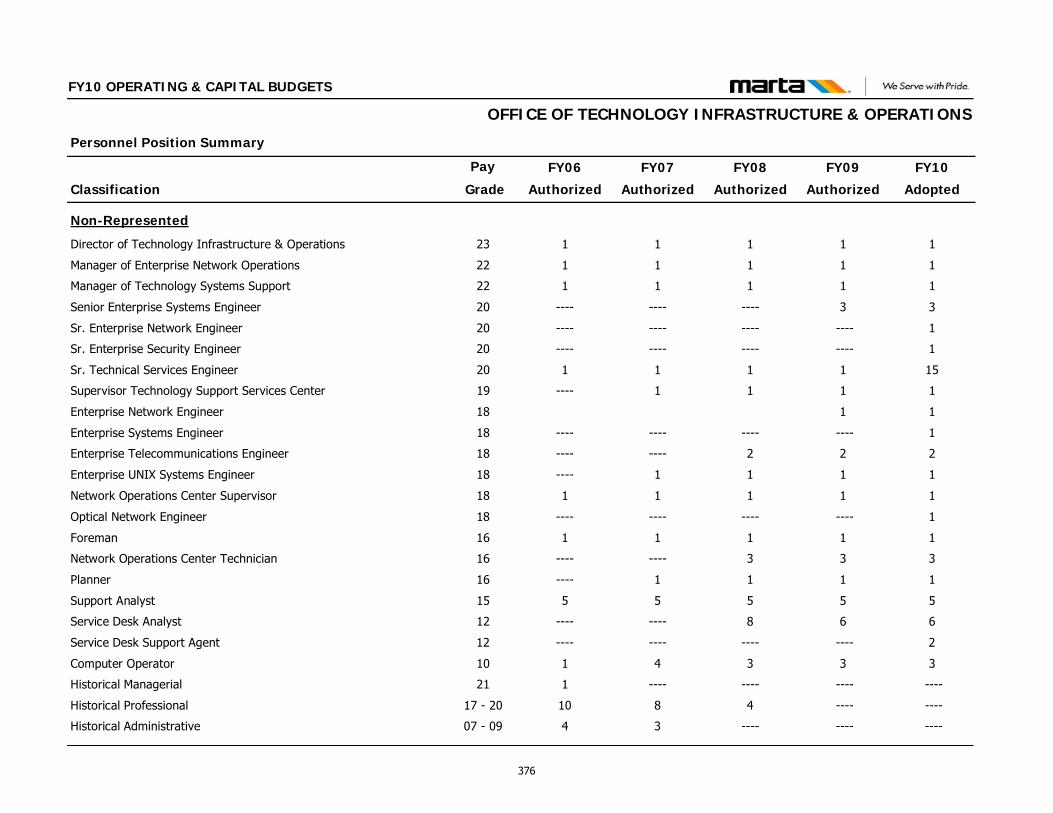
Classification
Personnel Position Summary
Pay FY09
Authorized
FY10
Adopted
FY10 OPERATING & CAPITAL BUDGETS
FY08
Authorized
FY07
Authorized
FY06
Authorized Grade
OFFICE OF TECHNOLOGY INFRASTRUCTURE & OPERATIONS
Non-Represented
Director of Technology Infrastructure & Operations 23 1 1111
Manager of Enterprise Network Operations 22 1 1111
Manager of Technology Systems Support 22 1 1111
Senior Enterprise Systems Engineer 20 3 3------------
Sr. Enterprise Network Engineer 20 ---- 1------------
Sr. Enterprise Security Engineer 20 ---- 1------------
Sr. Technical Services Engineer 20 1 15111
Supervisor Technology Support Services Center 19 1 111----
Enterprise Network Engineer 18 1 1
Enterprise Systems Engineer 18 ---- 1------------
Enterprise Telecommunications Engineer 18 2 22--------
Enterprise UNIX Systems Engineer 18 1 111----
Network Operations Center Supervisor 18 1 1111
Optical Network Engineer 18 ---- 1------------
Foreman 16 1 1111
Network Operations Center Technician 16 3 33--------
Planner 16 1 111----
Support Analyst 15 5 5555
Service Desk Analyst 12 6 68--------
Service Desk Support Agent 12 ---- 2------------
Computer Operator 10 3 3341
Historical Managerial 21 ---- ------------1
Historical Professional 17 - 20 ---- ----4810
Historical Administrative 07 - 09 ---- --------34
376
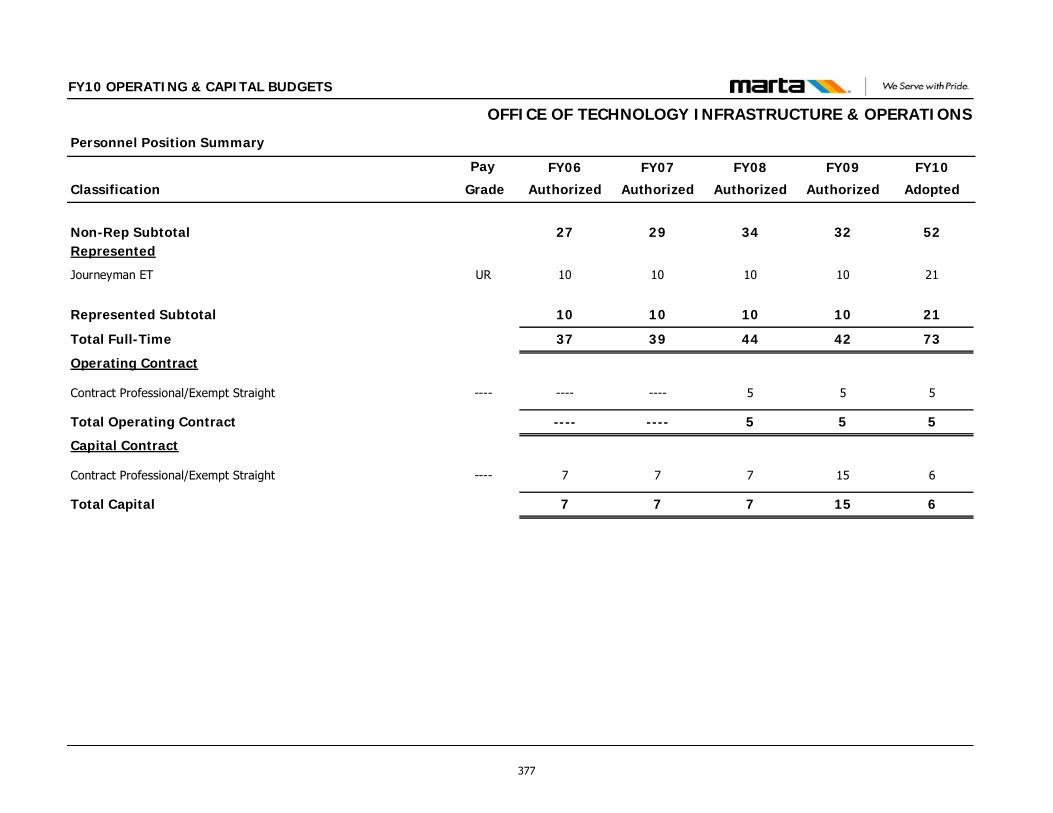
Classification
Personnel Position Summary
Pay FY09
Authorized
FY10
Adopted
FY10 OPERATING & CAPITAL BUDGETS
FY08
Authorized
FY07
Authorized
FY06
Authorized Grade
OFFICE OF TECHNOLOGY INFRASTRUCTURE & OPERATIONS
Non-Rep Subtotal 32 52342927Represented
Journeyman ET UR 10 21101010
Represented Subtotal 10 21101010
Total Full-Time 42 73443937
Operating Contract
Contract Professional/Exempt Straight ---- 5 55--------
Total Operating Contract 5 55--------
Capital Contract
Contract Professional/Exempt Straight ---- 15 6777
Total Capital 15 6777
377
FY10 OPERATING & CAPITAL BUDGETS
OFFICE OF TECHNOLOGY ENTERPRISE APPLICATIONS FUNCTIONS AND RESPONSIBILITIES The Office of Technology Enterprise Applications is responsible for development and implementation of new applications and the maintenance and modifications of existing applications for all of the Authority. This office is also responsible for providing both general and technology management for MARTA wide technology projects. This office accomplishes these functions and responsibilities through the Business Applications and the ITS Applications branches. The ITS Applications branch is responsible for providing applications development, maintenance, and centralized data management as a corporate resource across the MARTA enterprise. Office responsibilities include: Database development, administration, and management of all
data repositories. Internet, Intranet and Universal Web Portal development and
maintenance. Data Warehouse/Balanced Scorecard Development and Support. Application support for the implementation and support of the
Automated Fare Collection and the Bus Automated Vehicle Locator systems.
Application support for the Regional Trip Planning and Scheduling
systems. Geographical Information Systems development and support.
The Business Applications branch is responsible for planning, designing, developing or acquiring, implementing and supporting new and advanced business applications in MARTA’s technology environment. Office responsibilities include: Coordinating systems requirements with executives and clients. Implementing and supporting the Business Transformation
Program which includes Enterprise Resource Planning (Oracle E-Business Suite- Financials and Human resources) and an Enterprise Asset Management (Maximus – Maintenance Management) system.
Supporting major systems in production, including Train Control system, Police Management Information system, document management & Automated Dispatch systems.
378
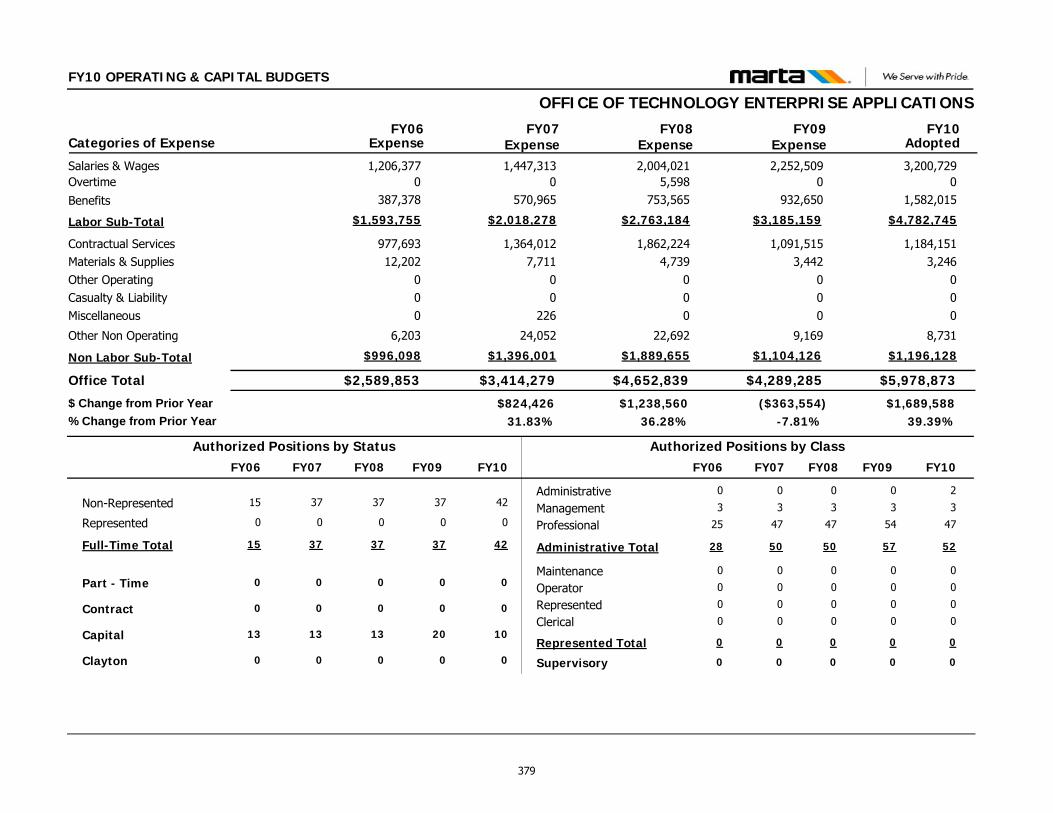
FY10 OPERATING & CAPITAL BUDGETS
OFFICE OF TECHNOLOGY ENTERPRISE APPLICATIONS
$5,978,873$4,289,285
1,184,1513,246
000
8,731
1,091,5153,442
000
9,169
Contractual ServicesMaterials & SuppliesOther OperatingCasualty & LiabilityMiscellaneous
Other Non Operating
Office Total
3,200,7292,252,509Salaries & Wages00Overtime
$4,782,745$3,185,159Labor Sub-Total
FY09 FY10Categories of Expense
$2,589,853
977,69312,202
000
6,203
1,206,3770
$1,593,755
FY06
$3,414,279
1,364,0127,711
00
226
24,052
1,447,3130
$2,018,278
FY07Expense Expense Expense Adopted
$1,689,588($363,554)$824,42639.39%-7.81%31.83%
$ Change from Prior Year% Change from Prior Year
$4,652,839
1,862,2244,739
000
22,692
2,004,0215,598
$2,763,184
FY08Expense
$1,238,56036.28%
$1,196,128$1,104,126Non Labor Sub-Total $996,098 $1,396,001 $1,889,655
1,582,015932,650Benefits 387,378 570,965 753,565
Administrative
Clerical
Management
MaintenanceOperator
Professional
Represented
Supervisory
0
0
3
0
0
54
0
0
2
0
3
0
0
47
0
0
Non-Represented 37 42
Part - Time 0 0
Represented 0 0
Full-Time Total 37 42
Contract 0 0
Capital 20 10
Authorized Positions by Class
Administrative Total 57 52
Authorized Positions by Status
Represented Total 0 0
0
0
3
0
0
47
0
0
37
0
0
37
0
13
50
0
0
0
3
0
0
25
0
0
15
0
0
15
0
13
28
0
FY10FY09 FY07FY06 FY10FY09 FY07FY06
Clayton 0 000
37
0
0
37
0
13
FY08
0
0
0
3
0
0
47
0
0
50
0
FY08
379
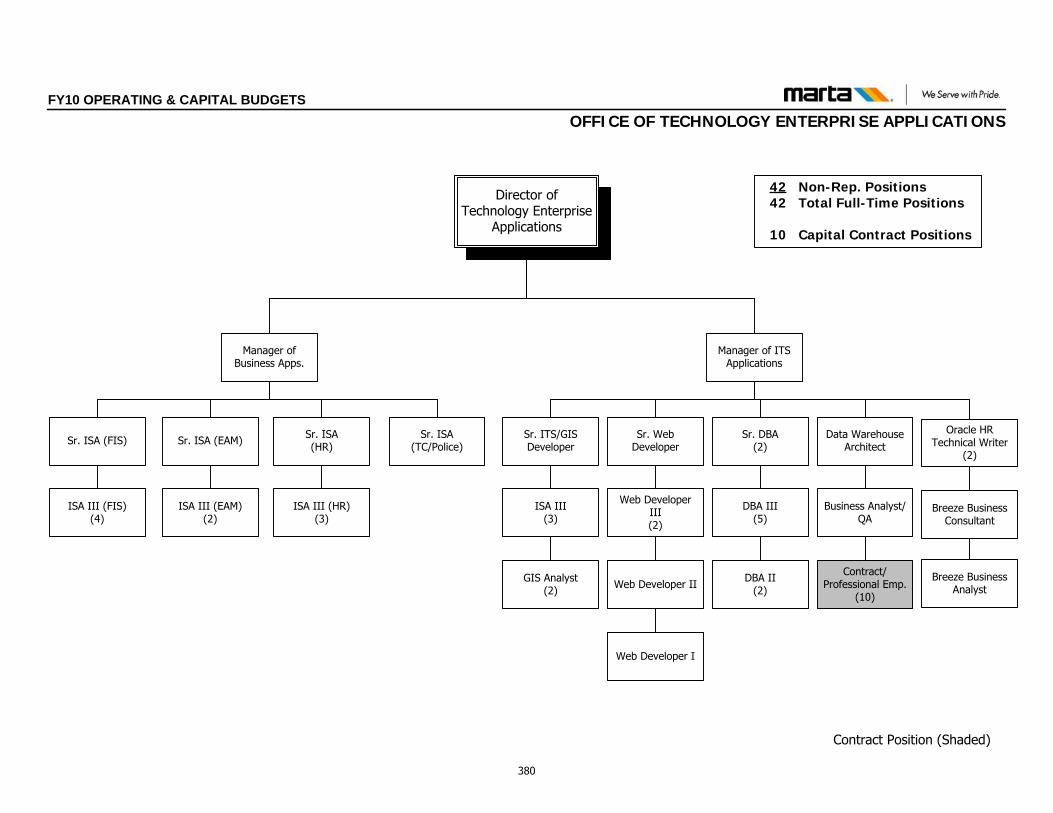
Director of Technology Enterprise
Applications
42 Non-Rep. Positions 42 Total Full-Time Positions
10 Capital Contract Positions
Manager of ITS Applications
Sr. Web Developer
Web Developer III(2)
Contract Position (Shaded)
Business Analyst/QA
Sr. DBA(2)
DBA III(5)
DBA II(2)
Manager of Business Apps.
Sr. ISA (FIS) Sr. ISA (EAM)
ISA III (EAM)(2)
ISA III (FIS)(4)
Sr. ITS/GIS Developer
ISA III(3)
GIS Analyst(2)
Web Developer I
ISA III (HR)(3)
Web Developer II
Data Warehouse Architect
Sr. ISA(HR)
Sr. ISA(TC/Police)
Contract/Professional Emp.
(10)
Breeze Business Consultant
Oracle HR Technical Writer
(2)
Breeze Business Analyst
FY10 OPERATING & CAPITAL BUDGETSOFFICE OF TECHNOLOGY ENTERPRISE APPLICATIONS
380
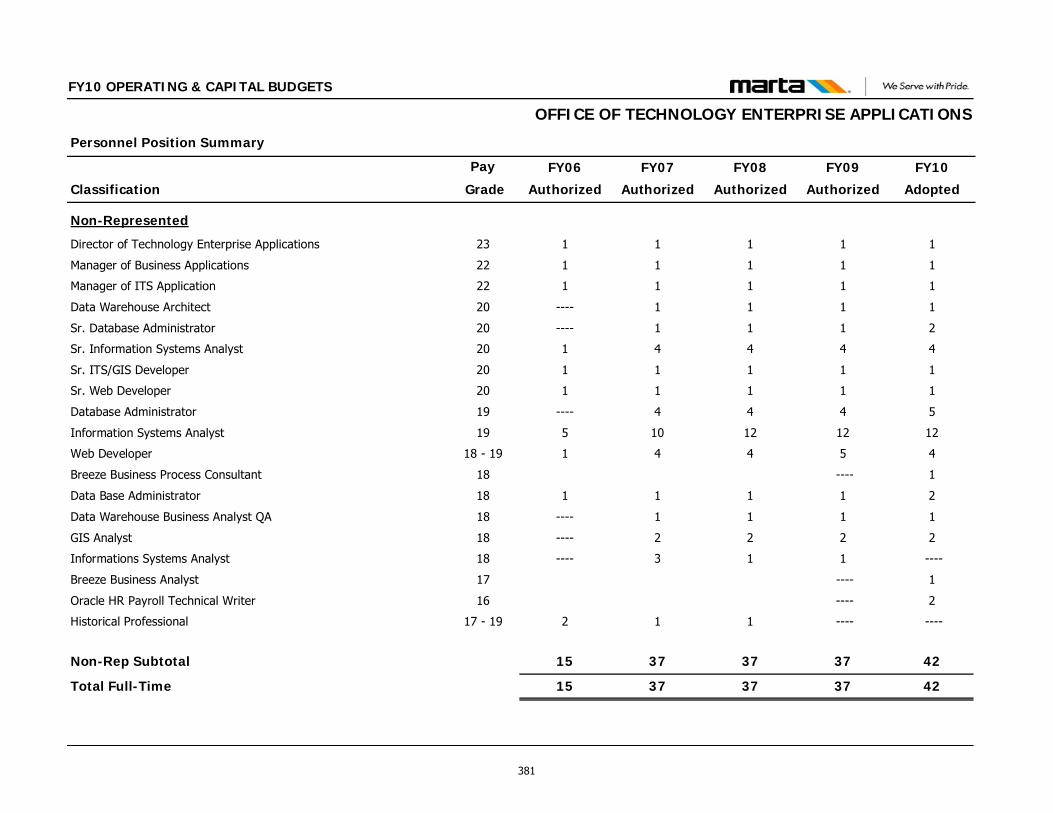
Classification
Personnel Position Summary
Pay FY09
Authorized
FY10
Adopted
FY10 OPERATING & CAPITAL BUDGETS
FY08
Authorized
FY07
Authorized
FY06
Authorized Grade
OFFICE OF TECHNOLOGY ENTERPRISE APPLICATIONS
Non-Represented
Director of Technology Enterprise Applications 23 1 1111
Manager of Business Applications 22 1 1111
Manager of ITS Application 22 1 1111
Data Warehouse Architect 20 1 111----
Sr. Database Administrator 20 1 211----
Sr. Information Systems Analyst 20 4 4441
Sr. ITS/GIS Developer 20 1 1111
Sr. Web Developer 20 1 1111
Database Administrator 19 4 544----
Information Systems Analyst 19 12 1212105
Web Developer 18 - 19 5 4441
Breeze Business Process Consultant 18 ---- 1
Data Base Administrator 18 1 2111
Data Warehouse Business Analyst QA 18 1 111----
GIS Analyst 18 2 222----
Informations Systems Analyst 18 1 ----13----
Breeze Business Analyst 17 ---- 1
Oracle HR Payroll Technical Writer 16 ---- 2
Historical Professional 17 - 19 ---- ----112
Non-Rep Subtotal 37 42373715
Total Full-Time 37 42373715
381
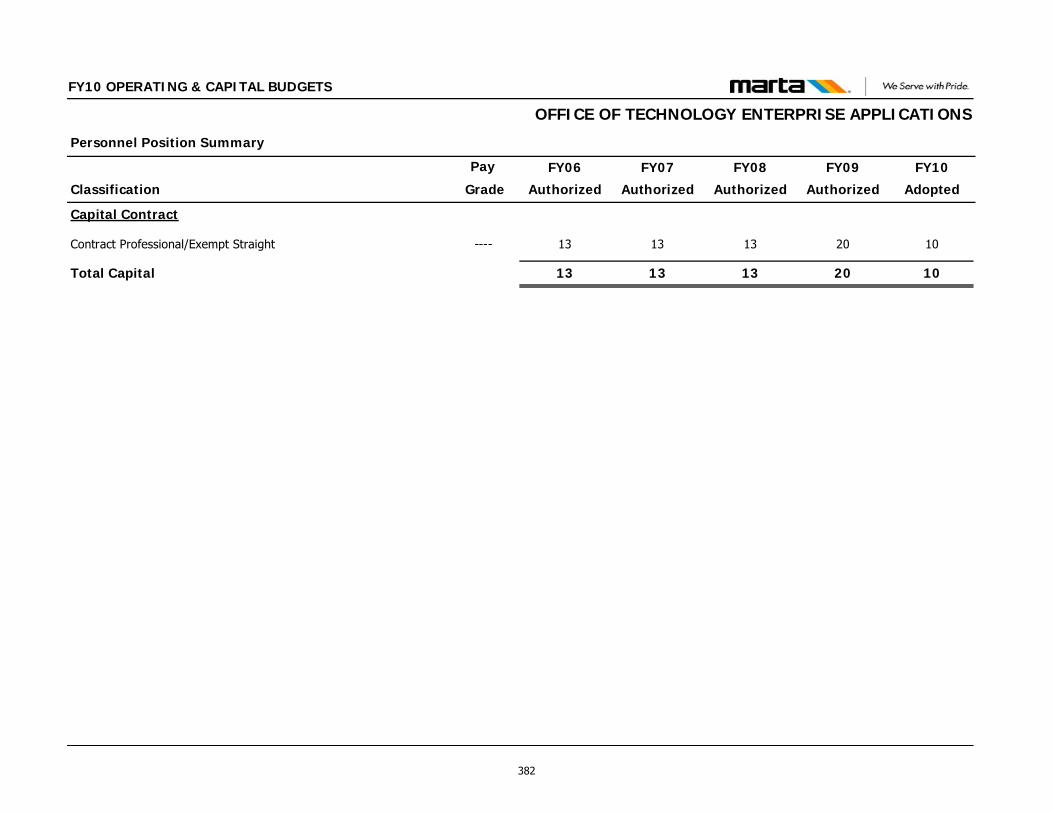
Classification
Personnel Position Summary
Pay FY09
Authorized
FY10
Adopted
FY10 OPERATING & CAPITAL BUDGETS
FY08
Authorized
FY07
Authorized
FY06
Authorized Grade
OFFICE OF TECHNOLOGY ENTERPRISE APPLICATIONS
Capital Contract
Contract Professional/Exempt Straight ---- 20 10131313
Total Capital 20 10131313
382
FY10 OPERATING & CAPITAL BUDGETS O F
F ICE OF TECHNOLOGY PROGRAMS MANAGEMENT
FUNCTIONS AND RESPONSIBILITIES The Technology Programs Management office is responsible for program, project, budget and contractual oversight for the Department and for analyzing and researching new transit technologies and programs. The Program Management branch develops business requirements, justifications and senior management approval for new business initiatives and tracks the schedule and budgets of existing projects. Project management including responsibility for matrix
management of the implementation teams for technology projects, serving as the contracting representative for all technology contracts support and coordination of Authority needs, resolving conflicts that impact project schedule and cost.
Implementing a project tracking tool which provides a common methodology across technology projects.
Maintain a Technology Scorecard for monitoring project and technology performance.
This branch assigns, prioritizes, and monitors technology projects. In addition, the branch tracks achievement of goals and objectives for divisional reporting.
Manages customer liaison activities between Technology and the business units of the Authority.
The Transit System Enhancement (TSE) branch surveys MARTA staff, management and the transit industry regarding system improvements and upgrades, and makes recommendations to the CEO team. The TSE branch also initiates Intelligent Transportation Systems (ITS) projects and acts as project champion until they become fully operational. During FY08, the branch will manage the remaining tasks of the Breeze Card Fare Collection Program and other initiatives including: Close out of Rail Station Modifications for Breeze Card Program. Close out of the Cash Handling Facility Renovation. Leadership of Breeze Card Marketing, Operations, Finance,
Planning, Technology, Engineering and Customer Service Teams. Implementation of Regional Trip Itinerary Planning System.
Management of Fare Collection Equipment Contractor. Upgrade of the Parking System to Smart Card Technology. On-Going Participation with Regional Partners Regarding Technology
and ITS Projects including Regional 511. Processes and monitors the primary functions related to preparing,
processing and successful execution of purchasing hardware, software and services for Technology.
The Technology Business Management (TBM) branch is responsible for managing contract and financial administration, maintenance of technology related policies and procedures and administration of Technology professional services. This branch is accountable for performance reporting, contract administration, resource administration (staffing, training, labor relations) and budget administration including the analysis of financial condition and communication to Authority Executive staff. The Technology Business Management branch responsibilities include the following: Manages Technology Programs responsible for providing,
financial administration, telecommunications and technology assets management.
Oversees & helps department managers manage their capital and operating budgets.
Assists department management in analyzing all vendor contracts for Technology and advises on best practices.
Assists departmental management in preparing and completing business cases.
Monitors cell phone and pager use in the Authority. Administers contracts with all vendors. Prepares and updates policies and procedures. Monitors,
authenticates and prepares responses for all internal and external audit activities.
Develops various business presentations and reviews procedures and guidelines for financial planning.
Analyzes the financial condition of Technology and communicates the results to executive decision makers.
383
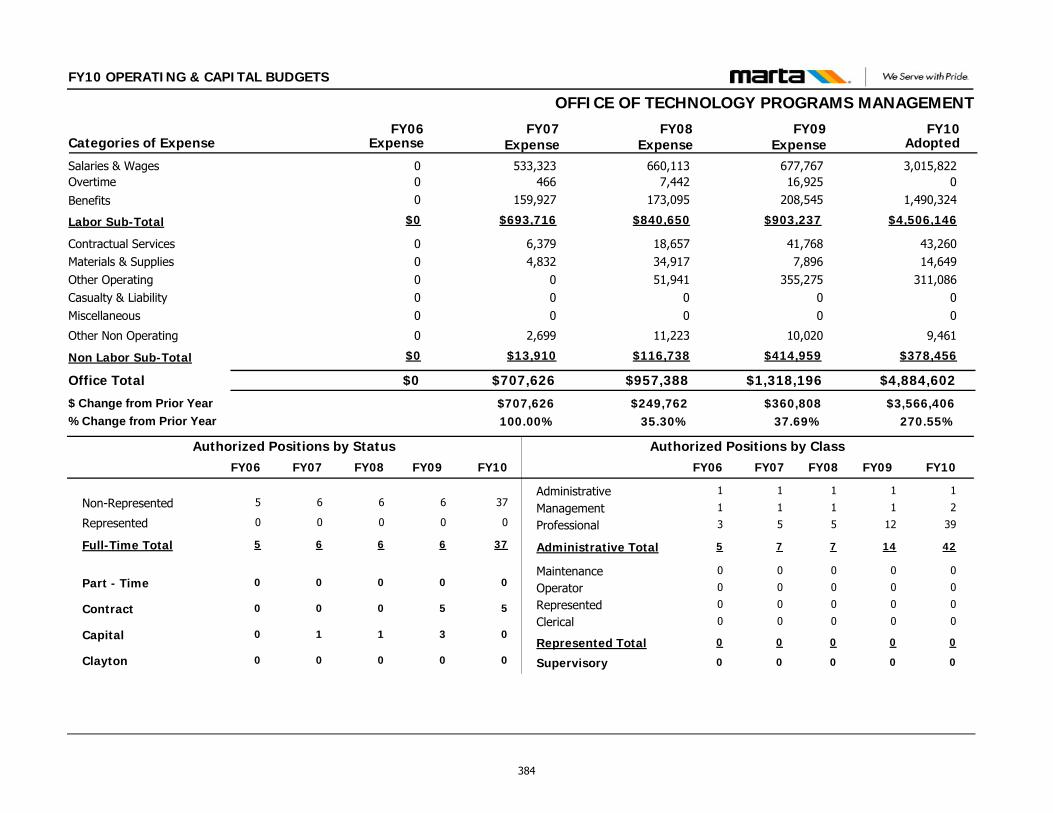
FY10 OPERATING & CAPITAL BUDGETS
OFFICE OF TECHNOLOGY PROGRAMS MANAGEMENT
$4,884,602$1,318,196
43,26014,649
311,08600
9,461
41,7687,896
355,27500
10,020
Contractual ServicesMaterials & SuppliesOther OperatingCasualty & LiabilityMiscellaneous
Other Non Operating
Office Total
3,015,822677,767Salaries & Wages016,925Overtime
$4,506,146$903,237Labor Sub-Total
FY09 FY10Categories of Expense
$0
00000
0
00
$0
FY06
$707,626
6,3794,832
000
2,699
533,323466
$693,716
FY07Expense Expense Expense Adopted
$3,566,406$360,808$707,626270.55%37.69%100.00%
$ Change from Prior Year% Change from Prior Year
$957,388
18,65734,91751,941
00
11,223
660,1137,442
$840,650
FY08Expense
$249,76235.30%
$378,456$414,959Non Labor Sub-Total $0 $13,910 $116,738
1,490,324208,545Benefits 0 159,927 173,095
Administrative
Clerical
Management
MaintenanceOperator
Professional
Represented
Supervisory
1
0
1
0
0
12
0
0
1
0
2
0
0
39
0
0
Non-Represented 6 37
Part - Time 0 0
Represented 0 0
Full-Time Total 6 37
Contract 5 5
Capital 3 0
Authorized Positions by Class
Administrative Total 14 42
Authorized Positions by Status
Represented Total 0 0
1
0
1
0
0
5
0
0
6
0
0
6
0
1
7
0
1
0
1
0
0
3
0
0
5
0
0
5
0
0
5
0
FY10FY09 FY07FY06 FY10FY09 FY07FY06
Clayton 0 000
6
0
0
6
0
1
FY08
0
1
0
1
0
0
5
0
0
7
0
FY08
384
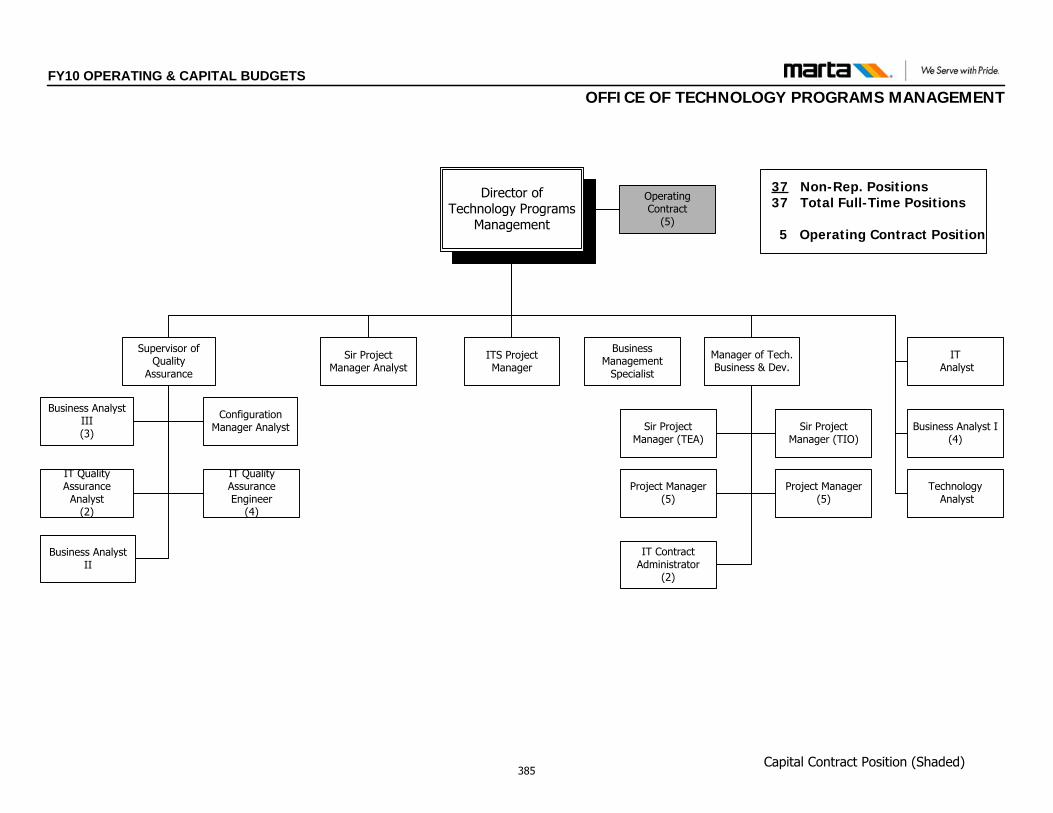
Director of Technology Programs
Management
37 Non-Rep. Positions37 Total Full-Time Positions
5 Operating Contract Position
Sir Project Manager Analyst
Manager of Tech. Business & Dev.
Sir Project Manager (TEA)
ITS Project Manager
Capital Contract Position (Shaded)
Operating Contract
(5)
FY10 OPERATING & CAPITAL BUDGETSOFFICE OF TECHNOLOGY PROGRAMS MANAGEMENT
ITAnalyst
Project Manager(5)
Sir Project Manager (TIO)
Project Manager(5)
Supervisor of Quality
Assurance
Business Analyst III(3)
Configuration Manager Analyst
IT Quality Assurance Engineer
(4)
IT Quality Assurance
Analyst(2)
Business Analyst II
Business Analyst I(4)
IT Contract Administrator
(2)
Business Management
Specialist
TechnologyAnalyst
385
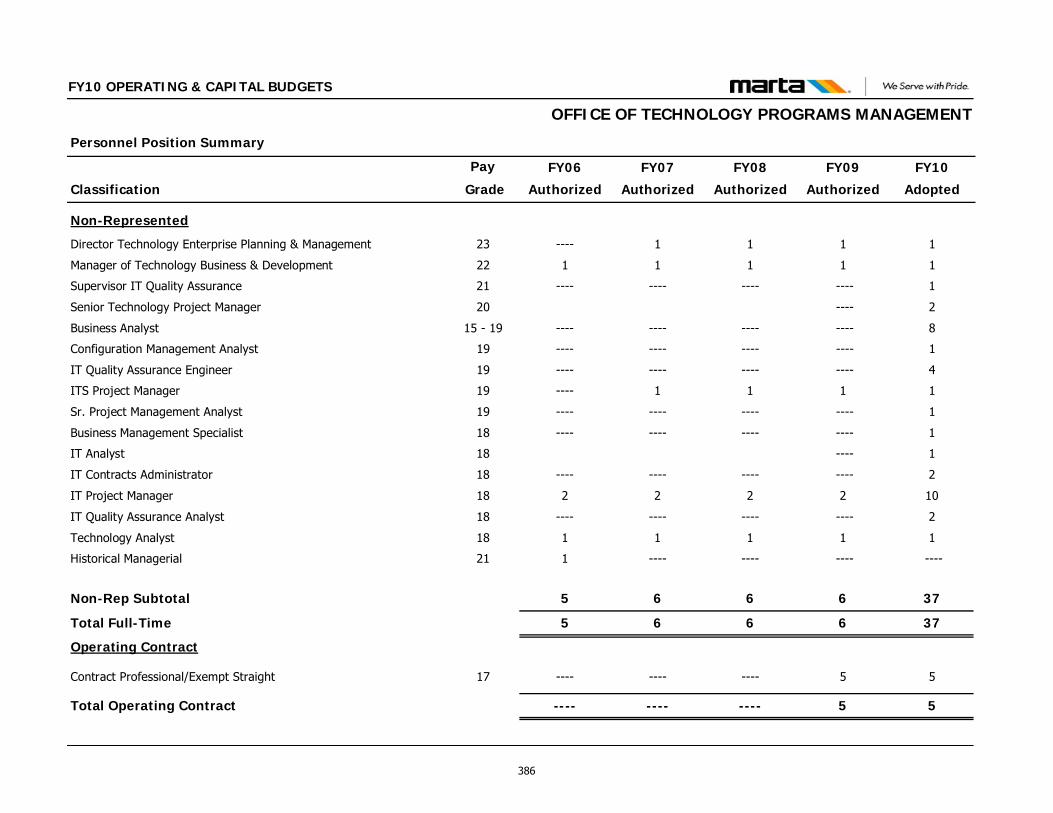
Classification
Personnel Position Summary
Pay FY09
Authorized
FY10
Adopted
FY10 OPERATING & CAPITAL BUDGETS
FY08
Authorized
FY07
Authorized
FY06
Authorized Grade
OFFICE OF TECHNOLOGY PROGRAMS MANAGEMENT
Non-Represented
Director Technology Enterprise Planning & Management 23 1 111----
Manager of Technology Business & Development 22 1 1111
Supervisor IT Quality Assurance 21 ---- 1------------
Senior Technology Project Manager 20 ---- 2
Business Analyst 15 - 19 ---- 8------------
Configuration Management Analyst 19 ---- 1------------
IT Quality Assurance Engineer 19 ---- 4------------
ITS Project Manager 19 1 111----
Sr. Project Management Analyst 19 ---- 1------------
Business Management Specialist 18 ---- 1------------
IT Analyst 18 ---- 1
IT Contracts Administrator 18 ---- 2------------
IT Project Manager 18 2 10222
IT Quality Assurance Analyst 18 ---- 2------------
Technology Analyst 18 1 1111
Historical Managerial 21 ---- ------------1
Non-Rep Subtotal 6 37665
Total Full-Time 6 37665
Operating Contract
Contract Professional/Exempt Straight 17 5 5------------
Total Operating Contract 5 5------------
386
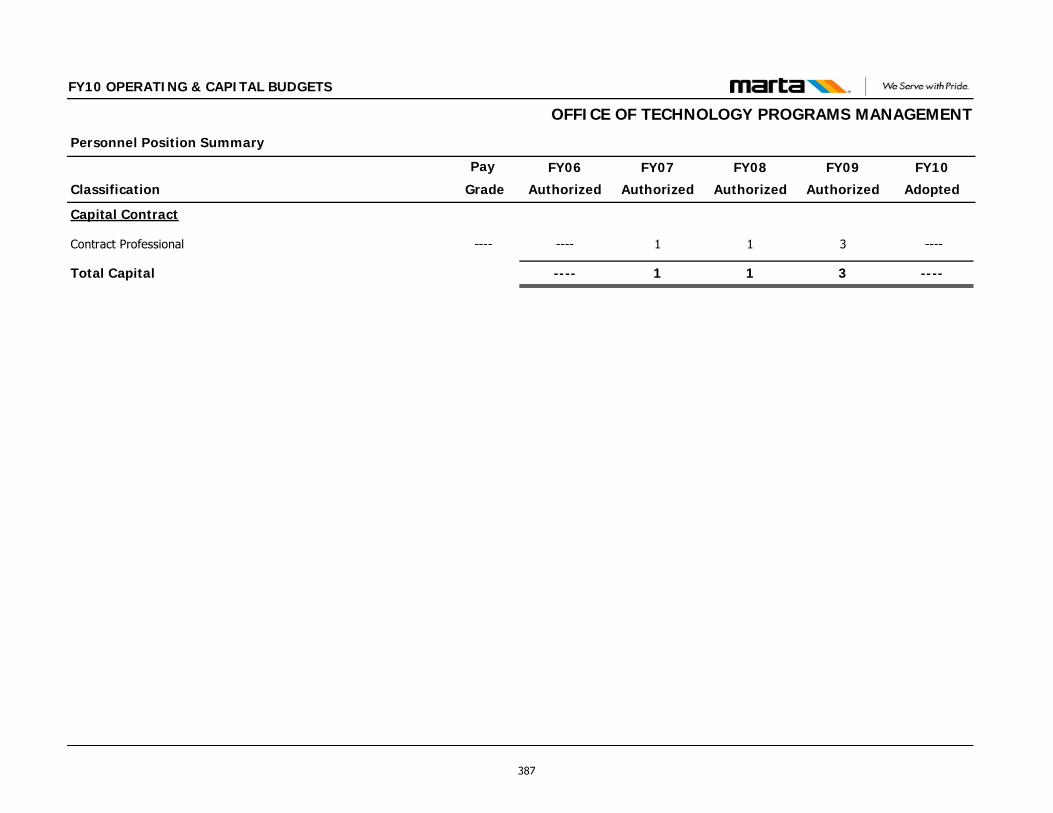
Classification
Personnel Position Summary
Pay FY09
Authorized
FY10
Adopted
FY10 OPERATING & CAPITAL BUDGETS
FY08
Authorized
FY07
Authorized
FY06
Authorized Grade
OFFICE OF TECHNOLOGY PROGRAMS MANAGEMENT
Capital Contract
Contract Professional ---- 3 ----11----
Total Capital 3 ----11----
387

This page intentionally left blank
388
CAPITAL BUDGET This section summarizes FY10 capital expenditures and funding, and defines the Authority’s capital policies and procedures. The section further defines MARTA’s Ten-Year Capital Program and the infrastructure and planning efforts that it supports. In the end, it details the Federal Grants that support the funding of the FY10 CIP and beyond. This section includes the following: Capital Budget Overview
Capital Infrastructure
Planning Program Overview
Capital Sources & Applications of Funds
Approved Capital Budget Summary
Approved Projects Ten-year Forecast
Approved Project Detail
Federal Grant Detail
FY10 OPERATING & CAPITAL BUDGETS
CAPITAL BUDGET OVERVIEW
OVERVIEW MARTA’s Capital Budget provides for the rehabilitation, replacement, enhancement and expansion of the Authority’s infrastructure, facilities, equipment and rolling stock. Additionally, funding is included for the Authority’s planning needs and the retirement of bond debt. Capital Policy MARTA is required to adhere to a system of financial accounting that complies with Generally Accepted Accounting Principles (GAAP). Consistent with this requirement, MARTA developed and adopted Procedure 10.3.21, “Fixed Asset Management and Capital Policy.” This procedure sets forth definitions of fixed asset and capital policies, the applicability of these policies, and the responsibilities in carrying out these stated policies (included in this section). As defined, the major categories of fixed assets include the following: Land
System and Facility Improvements
Vehicles (Revenue and Service)
Operating Equipment
Office Furnishings and Equipment Definition of Fixed Assets MARTA defines fixed assets as property, plant and equipment items that benefit future periods and have a useful life of greater than one year, a minimum cost per unit of $300, and that have the characteristics of property. They are classified as real or personal, tangible or intangible, and can be new or used. The major characteristics of tangible fixed assets are that they have physical substance, are relatively long-lived, provide measurable future economic benefits, can be inventoried, are actively used in MARTA’s operations, and are not held as an investment for resale. Authority Capital Policy In addition to adhering to the definition of fixed assets, MARTA’s capital policy for property, plant and equipment divides expenditures for fixed assets into two categories: costs at acquisition or construction and costs
incurred during the useful life of an existing asset that increase its efficiency, capacity, useful life or economy.
1. Costs at acquisition or construction include the initial costs of the property, plant and equipment and any additional charges incurred to prepare them for their intended use.
Expenditures to add omitted construction work within a reasonable time (12 months) after an asset has been placed into service may be capitalized and added to the existing asset base unit; however,
Expenditures for corrective work resulting from latent defects and inferior construction are not eligible for capitalization but are considered non-operating expenses (according to MARTA Act).
2. Costs incurred during the useful life of an existing asset are those that increase its efficiency, capacity, useful life or economy. Expenditures of this kind are capital and classified as follows:
Additions to Asset Base Unit - Examples are extensions, enlargements or expansions made to existing assets.
Extraordinary Repairs or Major Overhauls to Asset Base Units - Expenditures of this kind normally involve very large amounts, are not recurring in nature, and tend to increase the utility or extend the service life of the asset’s existing life. Examples of this kind of repair include the midlife overhaul of the rail cars and station rehabilitation projects.
Replacement of Asset Base Unit Components - The removal of a major part or component of an existing asset and the substitution of a new component having essentially the same type and performance capacities.
Improvements to Asset Base Units - This includes the removal of an existing asset and the substitution of a different asset having improved or increased overall efficiency and tends to extend useful life of the unit.
389
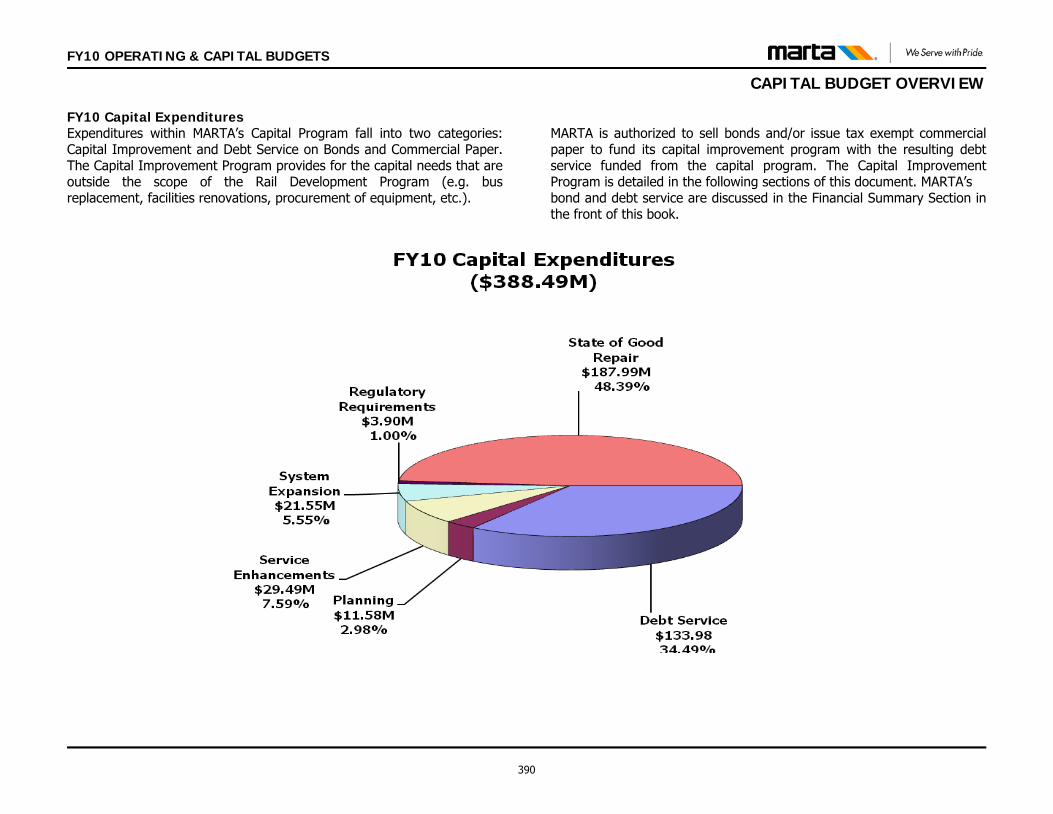
FY10 OPERATING & CAPITAL BUDGETS
CAPITAL BUDGET OVERVIEW
FY10 Capital Expenditures Expenditures within MARTA’s Capital Program fall into two categories: Capital Improvement and Debt Service on Bonds and Commercial Paper. The Capital Improvement Program provides for the capital needs that are outside the scope of the Rail Development Program (e.g. bus replacement, facilities renovations, procurement of equipment, etc.).
MARTA is authorized to sell bonds and/or issue tax exempt commercial paper to fund its capital improvement program with the resulting debt service funded from the capital program. The Capital Improvement Program is detailed in the following sections of this document. MARTA’s bond and debt service are discussed in the Financial Summary Section in the front of this book.
390
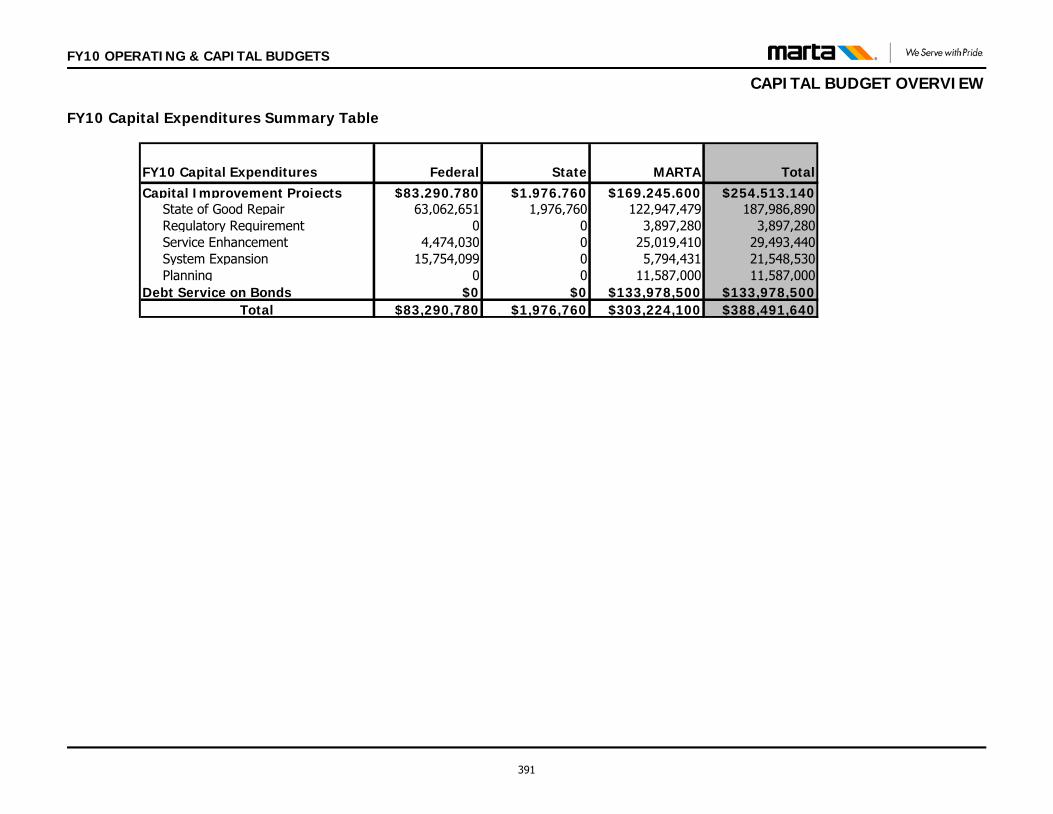
FY10 OPERATING & CAPITAL BUDGETS
CAPITAL BUDGET OVERVIEW
FY10 Capital Expenditures Summary Table
FY10 Capital Expenditures Federal State MARTA TotalCapital Improvement Projects $83,290,780 $1,976,760 $169,245,600 $254,513,140 State of Good Repair 63,062,651 1,976,760 122,947,479 187,986,890 Regulatory Requirement 0 0 3,897,280 3,897,280 Service Enhancement 4,474,030 0 25,019,410 29,493,440 System Expansion 15,754,099 0 5,794,431 21,548,530 Planning 0 0 11,587,000 11,587,000Debt Service on Bonds $0 $0 $133,978,500 $133,978,500
Total $83,290,780 $1,976,760 $303,224,100 $388,491,640
391
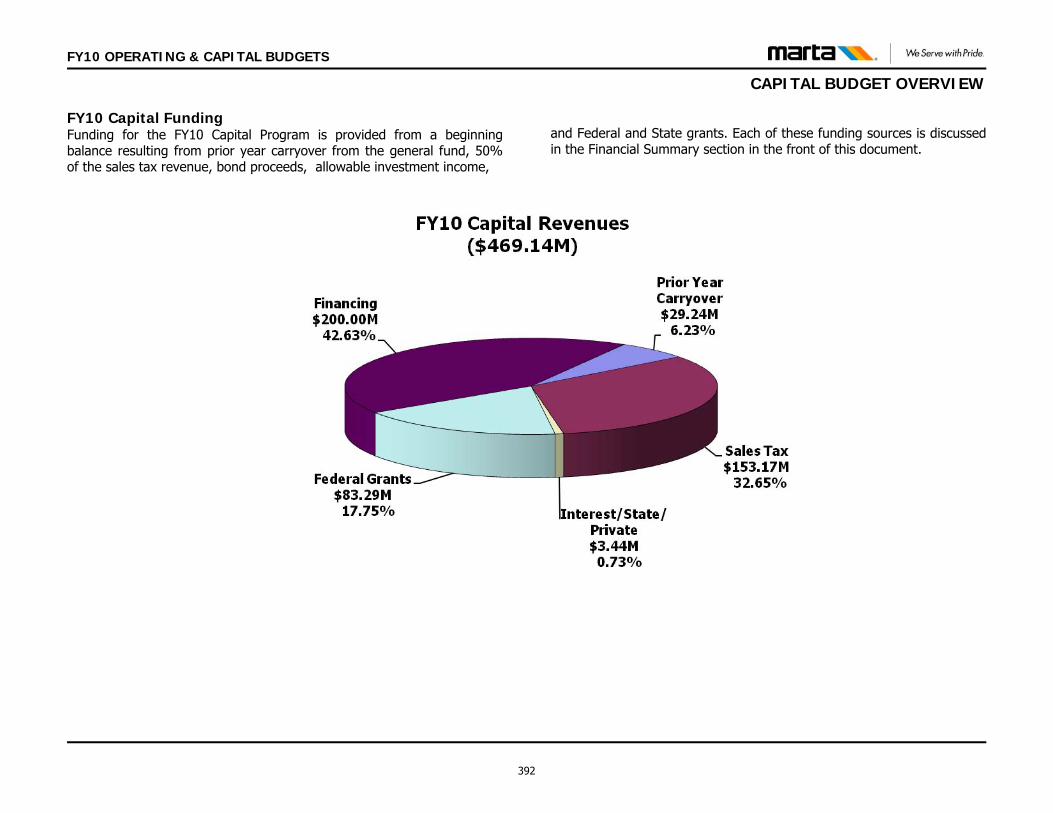
FY10 OPERATING & CAPITAL BUDGETS
CAPITAL BUDGET OVERVIEW
FY10 Capital Funding Funding for the FY10 Capital Program is provided from a beginning balance resulting from prior year carryover from the general fund, 50% of the sales tax revenue, bond proceeds, allowable investment income,
and Federal and State grants. Each of these funding sources is discussed in the Financial Summary section in the front of this document.
392
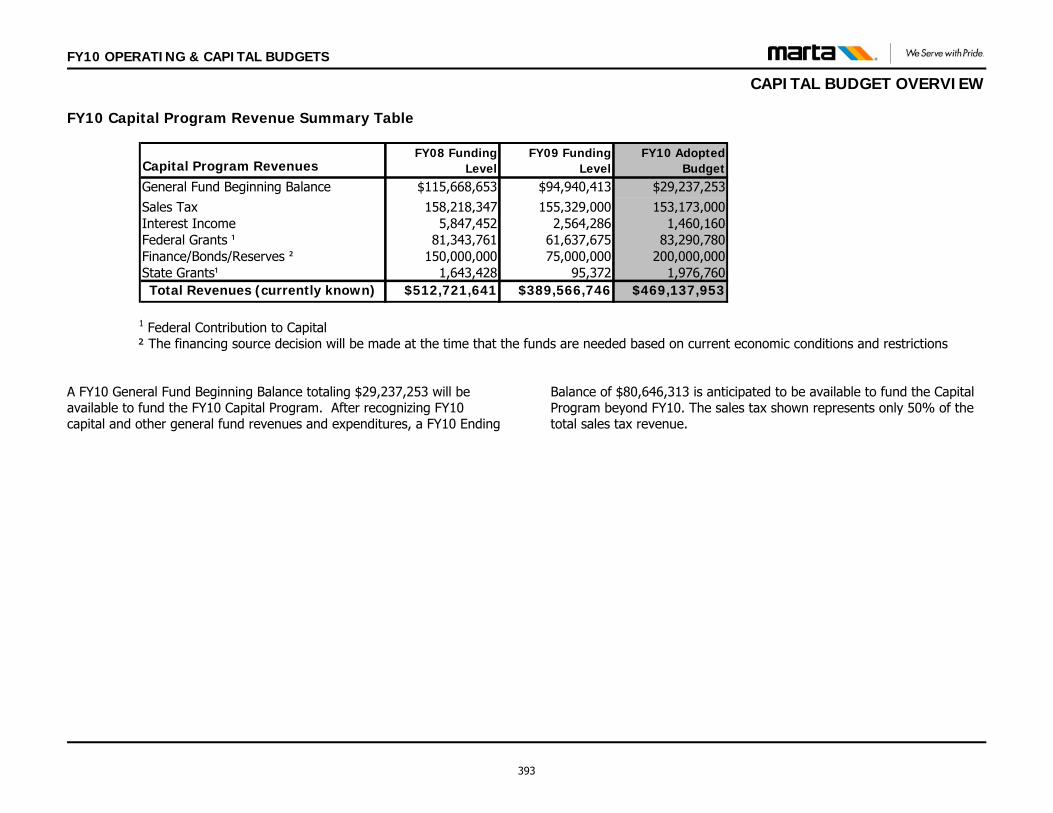
FY10 OPERATING & CAPITAL BUDGETS
CAPITAL BUDGET OVERVIEW
FY10 Capital Program Revenue Summary Table
Capital Program RevenuesFY08 Funding
LevelFY09 Funding
LevelFY10 Adopted
BudgetGeneral Fund Beginning Balance $115,668,653 $94,940,413 $29,237,253 Sales Tax 158,218,347 155,329,000 153,173,000Interest Income 5,847,452 2,564,286 1,460,160Federal Grants ¹ 81,343,761 61,637,675 83,290,780Finance/Bonds/Reserves ² 150,000,000 75,000,000 200,000,000State Grants¹ 1,643,428 95,372 1,976,760Total Revenues (currently known) $512,721,641 $389,566,746 $469,137,953
1 Federal Contribution to Capital ² The financing source decision will be made at the time that the funds are needed based on current economic conditions and restrictions A FY10 General Fund Beginning Balance totaling $29,237,253 will be available to fund the FY10 Capital Program. After recognizing FY10 capital and other general fund revenues and expenditures, a FY10 Ending
Balance of $80,646,313 is anticipated to be available to fund the Capital Program beyond FY10. The sales tax shown represents only 50% of the total sales tax revenue.
393
FY10 OPERATING & CAPITAL BUDGETS
CAPITAL BUDGET OVERVIEW
Capital Improvement Program MARTA launched capital improvement projects that will help preserve its capability for high-quality service delivery over a ten-year range. These essential programs are divided into the following four categories: Category 1 – State of Good Repair MARTA maintains an extensive infrastructure system which has to be maintained to ensure safety, reliability, service quality and efficiency. The state of good repair category contains numerous projects, a few examples follow: CNG Bus Procurement MARTA’s commitment to improving the region's air quality is demonstrated by its active fleet of 441 CNG vehicles out of a total of 615 buses. This is an ongoing program to replace buses per the guidelines established by FTA to support the efficient operation of the Authority’s bus fleet and the Atlanta region’s air quality improvement efforts.
MARTA Mobility/Lift-Van Replacements MARTA Mobility has added new service, vehicles and implemented program changes to improve on-time performance and service delivery. MARTA’s paratransit fleet consists of 175 vehicles that are programmed for replacement on a four-year cycle.
Breeze - Automated Fare Collection System On July 1, 2007 MARTA’s new fare collection system became fully operational. MARTA is the first transit system in North America and among the first in the world to convert to a 100% smart card fare collection system. This state-of-the-art technology offers customers the convenience of using one card for numerous trips with a variety of payment options and eliminate the need for tokens and paper bus transfers.
Breeze allows MARTA to:
• Focus on Customer Service: The new equipment allows MARTA's frontline staff to better serve customers.
• Improve Reliability: New vending machines, plastic Breeze Cards, entry gates and "tap-and-go" card readers create a more reliable system.
• Learn More About Customer Needs: More accurate, real-time trip and ridership information is available for route planning and service schedules that better meet customer needs.
• Capture Lost Revenue: Broken fare gates and turnstile jumpers previously cost MARTA millions of dollars a year in lost revenue. Breeze’s six-foot entry gates greatly reduce fare evasion and allow MARTA to better maintain the system.
• Offer Credit/Debit Functionality: Customers are able to load value to their Breeze Cards using credit and debit cards at all vending machines in all stations.
• Protect the Customer’s Investment: Customers may protect the value of their credit cards by registering free for balance protection.
MARTA continues its role as an industry leader in technology advancements with the Breeze conversion.
Life Cycle Asset Reliability Enhancement Program (L-CARE) MARTA’s dedication to provide reliable train service is demonstrated with the creation of its L-CARE Program. The program directs preventive and predictive actions to be performed before failures occur by rehabilitating and enhancing the various major and subset components of the railcar fleet as programmed by car type.
The Business Transformation Program (BTP) BTP calls for a substantial replacement of the information technology systems supporting the Authority's administrative business with an integrated suite of enterprise applications. BTP is a fully integrated solution which will provide modern, integrated support for MARTA’s Finance, Maintenance, and Human Resources business areas. The initiative will not only meet MARTA’s current business and technical requirements but is flexible and scaleable to meet MARTA’s future needs.
In October, 2006, Phase I, Oracle Financials, Maximus, and Optram were implemented. The Phase II of the Business Transformation Project was completed in May 2008. During this phase Human Resource, Payroll, and
394
FY10 OPERATING & CAPITAL BUDGETS
CAPITAL BUDGET OVERVIEW
Labor Distribution processes were deployed and integrated with the Finance and Accounting systems. Phase III of the project will be implemented starting in FY10. The Employee and Manager Self Service HR applications will be implemented in FY10 to speed up the processing time and to reduce operational costs.
System Wide Escalator Rehabilitation Escalators will be replaced or refurbished through a phased approach to further reduce maintenance costs and improve service reliability and safety for MARTA’s customers.
Brady Mobility Facility Improvement This new facility will be phased in to replace the old facility on the same site. The facility uses include a Maintenance and Mobility Operations Building, a new fueling facility, and a new revenue and non-revenue vehicle wash facility. The existing fare retrieval building will be renovated. When completed, the facility will allow for the efficient and effective operation of MARTA’s Mobility Service.
Bus Facility Conversion The land procurement and facility design for the Compressed Natural Gas upgrade planned for Hamilton Garage are scheduled to be completed in FY10. A new compressor station will be installed that will allow simultaneous and independent refueling operations for 260 natural gas powered buses. In addition, there will be numerous future facility upgrades to include a new fare retrieval facility, mechanical equipment; bay upgrades, bus parking, and a vehicle wash facility.
Category 2 – Regulatory Requirements MARTA’s regulatory requirement category focuses on compliance to environmental, safety and security standards mandated by the State of Georgia, FTA, EPA and TSA. The major programs included under this category are:
• Pollution Prevention Program which allows MARTA to be in compliance with Clean Water Act regulations.
• Underground Storage Tank Program which brings MARTA into compliance with environmental regulations.
• Safety Program which allows MARTA to undergo proactive programs and mandated safety projects for compliance issues.
• Configuration Management Program which ensures compliance with federal and state, system safety standards regarding configuration management, system modification, and documentation control.
• Life Safety Program which ensures that fire detection, alarm, and suppression systems are in compliance with state and local regulations.
• Security Program which keeps MARTA in compliance with Transportation Security Administration national security standards as administered by U.S Department of Homeland Security.
Category 3 – System Expansion and Planning System expansion strives to attract new customers by providing new transit facilities, additional bus routes and rail extensions linking major activity centers. The System Expansion Category refers to any series of activities related to the planning, environmental clearance, conceptual development and design of corridors and specific projects that are included in the 12th and 13th amendments of the MARTA Rapid Transit Contract and Assistance Agreement (RTCAA) and or the regional transit vision plan -Concept 3. These activities are needed in order to prepare these projects for funding or to facilitate project implementation. In early 2009, the MARTA Board and the MARTA member jurisdictions adopted the 13th Amendment to the Rapid Transit Contract and Assistance Agreement (RTCAA) which defines the projects that make up MARTA’s capital program. The 13th amendment, adopted in 2008 along with the 12th amendment, adopted in 2007 includes the critical first expansion elements of the regional Concept 3 plan. Thus, the needed planning, environmental and design work supporting the “readiness” of these projects have been included in the FY10 capital budget.
395
FY10 OPERATING & CAPITAL BUDGETS CAPITAL BUDGET OVERVIEW
Memorial Drive BRT Service - In addition to the efforts listed above, the Memorial Drive BRT is under construction along with the acquisition of land, securing of Temporary Construction Easements (TCEs) and final environmental clearance. Memorial Drive is one of several major, regional arterials that were identified in Concept 3 as prime candidates for improvements that will increase the travel time and reliability of bus travel in these corridors. The project involves bus service enhancements (signal priority for buses, queue jumpers, far side stops, skip stop service), improvements to the passenger/pedestrian environment (improved bus stops, specialized vehicles and service branding) and the purchase of 12 buses. The service will run from the Kensington Station East along Memorial Drive to a park and ride lot at Goldsmith Road and also along the North Hairston corridor to Mountain Industrial Boulevard at East Ponce de Leon. The project is receiving federal Surface Transportation Program (STP) and Congestion Mitigation Air Quality grant funding. I-20 East Corridor – This effort involves planning necessary to support FTA concurrence with the Alternatives Analysis (AA) and approval of the baseline alternative, travel demand modeling, the securing of NEPA environmental clearance (Draft EIS and Record of Decision), preparation of a potential New Starts funding application to acquire permission from FTA to enter preliminary engineering (PE) and complete the Final Environmental Impact Statement (FEIS). The project involves a high capacity transit improvement for the I-20 East corridor from the Stonecrest Mall area east into downtown Atlanta. The estimated 2030 ridership for this corridor ranges from 19,000 to 53,000 daily boarding’s. Capital budget funding FY10 through FY12 is $4.3 million. Depend-ing upon FTA concurrence and permission to enter PE, the PE/FEIS and Final design could start in 2013 and be completed by 2016 (funds programmed for FY13 through FY16–$10.3 million. The future advancement schedule of this effort could be affected by the completion of the regional origin and destination study and the updates to the regional travel demand model. I-20 West Corridor – This effort involves completion of planning, environmental clearance, preliminary and final design and engineering
for the 1.8 mile extension of the existing MARTA rail line west from the HE Holmes Station to I-285 in new right-of-way. The previous work in the corridor advanced a bus rapid transit project as a part of HOV lane development by GDOT in the corridor. That effort has been put on hold pending GDOT funding issues. This extension of the MARTA rail west has been a part of the initial MARTA Rail plans and would represent the completion of earlier expansion plans. Approximately $1.5 million has been budgeted through FY 2012 to complete the planning, preliminary design and environmental work. The forward progress of this project is contingent upon approval of our FY10 federal appropriations request. This work could start in 2010 and be completed in 2011. This is a complicated project for which we do not have the right of way and there could potentially be numerous property acquisitions and displacements and possible Title IV/Environmental Justice (EJ) issues. Peachtree Streetcar – This effort would involve the further planning, environmental clearance and preliminary design/engineering for the proposed Peachtree Streetcar project. The project involves an 8.1 mile, in street running LRT/Streetcar system from the intersection of Peachtree Street east and east along Edgewood and Auburn Avenues; then north and south along Peachtree Street to the MARTA Arts Center Station; then back south along Peachtree to connect to Centennial Olympic Park. It would connect with the Beltline at Edgewood and 10th Street and become a part of the regional high capacity transit network envisioned in Concept 3. Estimated year 2030 daily boarding’s for this corridor range from 9,400 to 17,900. This effort is envisioned to be a 6 to 8 month fast tracked effort designed to get this project ready to apply for discretionary funds that should be available as a part of a next phase of ARRA funding. The initial high level conceptual work was done by the City of Atlanta (COA) under the direction of the Peachtree Streetcar Task Force and paid for by private dollars. The next steps work scope and budget will include the environmental clearance and the conceptual design. The effort is estimated to cost $600,000. It is anticipated that the City of Atlanta intends to submit the project for discretionary ARRA funds and to ask the corridor CIDs to participate in the funding of the $600,000 study cost with MARTA’s participation being in kind staff services. The future advancement schedule of this effort
396
FY10 OPERATING & CAPITAL BUDGETS CAPITAL BUDGET OVERVIEW
could be affected by the completion of the regional origin and destination study and the updates to the regional travel demand model. Beltline – The effort consists of planning, environmental clearance and preliminary design/engineering. The project involves a 22 mile loop around the central core of the Atlanta region and includes transit, trials and parks. It has the potential to interface with the existing MARTA rail system at the Inman Park, West End, Ashby, Bankhead and Lindbergh (Armour Yard area) stations. It is anticipated that a light rail/streetcar may be the preferred transit technology. The Tier 1 EIS and securing of the Georgia Environmental Protection Act (GERPA) clearance and conceptual design are scheduled for completion by the end of 2010. Approximately $5.0 Million has been expended to date with another $1.7 budgeted through FY10. This will allow for the going forward of some corridor activities such as the securing of Right of Ways and local decisions. The start of Tier 2 Environmental, Preliminary Engineering and final environmental clearance for various initial segments is very dependent upon gaining FTA concurrence on the baseline alternative, the updating of the regional travel demand model and thus may have an impact on the schedule. This effort is scheduled for the end of FY10 through FY12 and $7.0 million is budgeted. This amount includes previous earmarks for the Beltline AA. The Beltline would be a part of the regional high capacity transit network potentially connecting DeKalb, Fulton, COA and Cobb Counties and the proposed Peachtree Streetcar. It would also serve as the first and last mile distribution network for the regional transit system. The City of Atlanta in partnership with ABI, Inc. and MARTA has identified the BeltLine as a High Priority Project for the next federal authorization; and requested full funding for the Northeast segment (Phase 1). Clifton Corridor – This effort includes planning and travel demand modeling to support an FTA accepted Alternatives Analysis (AA) and eventual New Starts funding application. This effort was kicked off in March of 2009 with the start of a corridor wide origin and destination survey that will support a sub-area travel demand model and the analysis needed for the Alternatives Analysis. The project includes a 6.5 mile corridor running from the MARTA Lindbergh station to the MARTA
Decatur Station. The sub-area modeling technique has been agreed upon by ARC and is being discussed with FTA. The AA is scheduled for completion in early 2011. The budgeted amount includes $679K (2010) to be supplemented by another approximately $1.5 million in grant funds to be flexed to MARTA by the CCTMA. These funds have been obligated through a grant to MARTA and we have a Memorandum of Understanding (MOU) with CCTMA on the roles and responsibilities for this effort. This effort will also build upon the previous work in the corridor and is supported by Emory University and the Center for Disease Control (CDC). Estimated year 2030 daily boarding’s for this corridor range from 25,000 to 46,700. The future advancement schedule of this effort could be affected by the completion of the regional origin and destination study and the updates to the regional travel demand model. South Fulton Transit Feasibility Study - Fulton County- This effort is being undertaken to conduct a feasibility study for the south Fulton area. The study was requested by members of the Fulton County Commission and is designed to determine the best plan of action for transit improvements and infrastructure investments in the growing south Fulton area. The study will be coordinated with the effort of GDOT in this same area and will be directed through a multi-jurisdictional steering committee of affected stakeholders. The study is estimated to take 6 months and will include a study area from College Park to Chattahoochee Hill Country/Coopers Ferry Road. The study was kicked off in March and is scheduled to be completed by MARTA staff and consultants (GPC) by September 2009. A total of $250K has been requested to be added to the FY10 capital budget. Regional Coordination and Integration – This effort involves any number of planning activities in support of progress towards the advancement of the regional, integrated transit network. This would include but not be I limited to assistance on: Downtown Transit Operations Analysis (COA/region) – This effort involves a comprehensive planning and operational analysis of all
397
FY10 OPERATING & CAPITAL BUDGETS CAPITAL BUDGET OVERVIEW
of the proposed transit lines and improvements as these converge in the downtown area. There has been a lot of planning done and a lot of concepts that bring numerous lines and transit services to a convergence in downtown Atlanta. Currently today there is tremendous bus congestion with all of the regional operators and the express bus system bringing all of their riders into the downtown. To date there has been no comprehensive look at how all of these lines and services would effectively operate in the area and we are not sure if this multimodal convergence is even possible and how it might be accomplished. This effort is envisioned to be started in FY 2010 and completed in 2011. An estimated $750,000 has been requested to be added to the FY 2010 and 2011 budgets. Multi-modal (MMPT) Facilities Planning /Regional Integration Plan (Project 31742) - This provides for MARTA’s share of the cost to determine the location, design and operations and modal interface as well as operational compatibility with existing MARTA bus and rail services of the downtown multi modal and other potential transfer facilities. This effort continues to start and stop and involves some significant planning and technical analysis to support regional decision making on service coordination with the existing MARTA transit network. This is envisioned to include a detailed operations analysis, traffic and planning analysis and potential environmental work to be done in association with GDOT, GRTA, and COA and the regional operators as well as potentially freight rail operators. Approximately $1.65 million has been allocated in the FY10 budget for this activity. Georgia 400 Corridor - In addition to the efforts listed above, the Georgia 400 corridor is one of the most congested corridors in the region. This corridor has strong existing bus ridership and has been extensively studied. The Concept 3 Plan recommended a Light Rail line in this corridor from the Perimeter business center north to the Windward area. This line could be interlined with the I-285 line near Perimeter. Total ridership in the TPB Concept 3 analysis suggested a range of between 11,000 – 26,000 average daily boarding’s.
Northeast Line Extension - As part of MARTA comments to the initial TPB Concept 3, engineering suggested a one station extension of the Northeast Line to an area around Northeast DeKalb/Southern Gwinnett. This extension would utilize the existing MARTA rail bridge across I-285 and allow for a potential regional multi-modal center used by MARTA heavy rail, I-285 transit, potential commuter rail, intercity and local bus, and potential intercity/high speed rail services. The TPB estimated that average daily boarding’s of this approximately 4-5 mile extension would range between 9,600 and 20,400. Southeast /Hapeville Branch - Part of the original referendum system, the Southeast branch has recently had renewed interest for several reasons. First, construction of the new Airport terminal on the east side of the airport along with a proposed Southern Crescent Intermodal Center serving Commuter rail, Intercity rail and high speed rail indicate that a significant regional multi-modal center could be constructed just east of the airport. Additionally, with the closure of the Hapeville Ford Plant and Hapeville Livable Centers Initiative studies, the area along the proposed line has had renewed interest for redevelopment. Finally, some minor provisions for this line were provided during the construction of the South Line south of East Point station. This line was included in the TPB Concept 3 and indicated a range of average daily boarding’s from 6,300–20,500 for this approximately 4-5 mile extension. General Planning/System Sustainability - This item involves the salaries of the service planning and scheduling staff as well as the regional planning staff and consultant assistance (General Planning Consultant–GPC to supplement staff resources) to respond to requests for MARTA involvement in member jurisdictions and regional concerns (Transit Implementation Board). This effort involves any planning activities not identified above as well as service planning and scheduling for service changes and modifications, run cutting for mark ups, the extensive effort to identify the service changes needed to balance the FY10 through FY13 budget given the budget crisis, regional planning efforts (TIB/TPB, ARC, TCC, TAQC, TOS etc), monitoring the HOV to HOT-Congestion Reduction Demonstration project, MARTA participation
398
FY10 OPERATING & CAPITAL BUDGETS CAPITAL BUDGET OVERVIEW
in the GDOT development of their Commuter Rail projects, analysis of the regional Decatur Belt abandonment issue, technical support for the regional/distanced based fare study, transit project prioritization, New Starts strategy, regional travel demand modeling and O&D study, GIS mapping, data and analysis to support Title IV reporting, bus stop and sign placement, regional service coordination and other planning and support services as requested and directed. This line item includes approximately $15.7 million in the capital budget from 2010 to 2012. This amount includes dollars for bus stop signs and related materials. Category 4 – Service Enhancements Service enhancements are designed to provide customers with increased and more efficient service. MARTA commits its resources to the issues that matter the most to its customers: cleanness, security, convenience and on time performance. Distance Based/Variable Fare Distance Based Variable Fare is a program the Authority will implement in FY 2012. The proposed plan for FY10 provides $5M to complete the comprehensive impact analysis and implementation plan for variable fares, including Regional Partners applications for both rail and bus by December 2009. This will include an assessment of station modifications to address redistribution of current entry and exits to bring the Breeze System into a completely closed system, and the requisitioning process for hardware and software. An additional $10M is programmed as a place holder to fund implementation upon approval of plans from the study to be completed in FY 2010.
Memorial Drive Bus Rapid Transit (BRT) MARTA is building a BRT line in DeKalb County with a limited number of stops that is scheduled to be operational in 2010. The line will feature several innovations to move buses faster, such as onboard sensors to control traffic lights and reconfigured intersections to enable buses to move to the front of the line. Buses with wider aisles and lower floors will run from East DeKalb County park-and-ride lot to the Kensington
rail station. A spur from Memorial Drive will go north to Mountain Industrial at East Ponce.
Stonecrest Parking Facility This project will provide a permanent parking solution for the I-20 East/Mall at Stonecrest area and replace the temporary park and ride facility now provided by City of Lithonia. The new facility will provide MARTA bus patrons with a dedicated parking facility.
Security MARTA’s overall homeland security funding initiatives consists of a combination of capital investments and grants designed specifically to address target hardening projects, strategic counter-measures, and programs to augment security plans and objectives. MARTA has been designated by federal authorities as a Tier I Transit Agency because it is a vital and critical infrastructure for federal, state, and local interests within the Metro-Atlanta Area. Consistent with established capital program priorities for safety and security, MARTA has time-sensitive federal grant funding available to support security related equipment, facility security, canine teams, CCTV expansion, access control, training and public awareness campaigns. In addition, it has been determined by a Department of Homeland Security (DHS) Threat and Vulnerability Assessment that such endeavors must remain a high priority for MARTA to responsibly mitigate identified threats to our system. Summarily, MARTA’s homeland Security related capital projects are instrumental to increasing MARTA’s resiliency and ability to protect, prevent, respond, and recover from all 21st century hazards, natural or man made in origin.
Transit Oriented Development (TOD) This effort involves continued planning to support existing and potential TOD proposals, agreements and other grants in and around our station areas for development; assessment of potential concessions in station and transfer areas and development of regional impacts. Currently, there are active detail proposals for Brookhaven and Avondale Stations. A total of $1.8 million is programmed in both FY10 and FY11 to match funds for an ARC LCI grant to build replacement parking for a proposed TOD at the Brookhaven station. This program also includes the
399
FY10 OPERATING & CAPITAL BUDGETS CAPITAL BUDGET OVERVIEW
continued support and management of leases at the Lindbergh TOD as well as the assessment of continued requests and proposals for development at other stations such as Five Points (the Greenline); Arts Center (Woodruff); Medical Center (St. Joseph Hospital); Chamblee (DeKalb Senior Center); Sandy Springs transfer to development rights and others. TOD staff is developing a comprehensive set of TOD guidelines, policies and procedures, comprehensive station profiles to post on the website, and preparing to host a potential developer informational forum. Most recently, planning has been asked to lead the agency wide effort to assess stations and develop an approach to accommodate potential concessions in the event of the passage of the MARTA legislation to allow food and drink at stations and transfer areas.
The Mystery Shopper Customer Program The Mystery Shopper Customer program is a regulatory requirement set forth by the Consent Decree of 2001. An Independent vendor conducts “mystery” shops that evaluate the Authority’s compliance with American Disabilities Act (ADA) on all modes of transit.
MARTA Contracted Management and Operations Clayton County Transit (C-Tran) Operations In accordance with the Strategic Vision to become a key partner in the regional transportation environment, MARTA has contracted with Clayton County to execute the maintenance and operations of the C-TRAN bus service. The service includes five (5) fixed routes as well as Paratransit services. MARTA began operating the C-TRAN service on October 1, 2007.
400
FY10 OPERATING & CAPITAL BUDGETS
CAPITAL INFRASTRUCTURE
CAPITAL IMPROVEMENT PROGRAM INFRASTRUCTURE This section identifies the infrastructure supported by the FY10 Capital Improvement Program Budget.
401
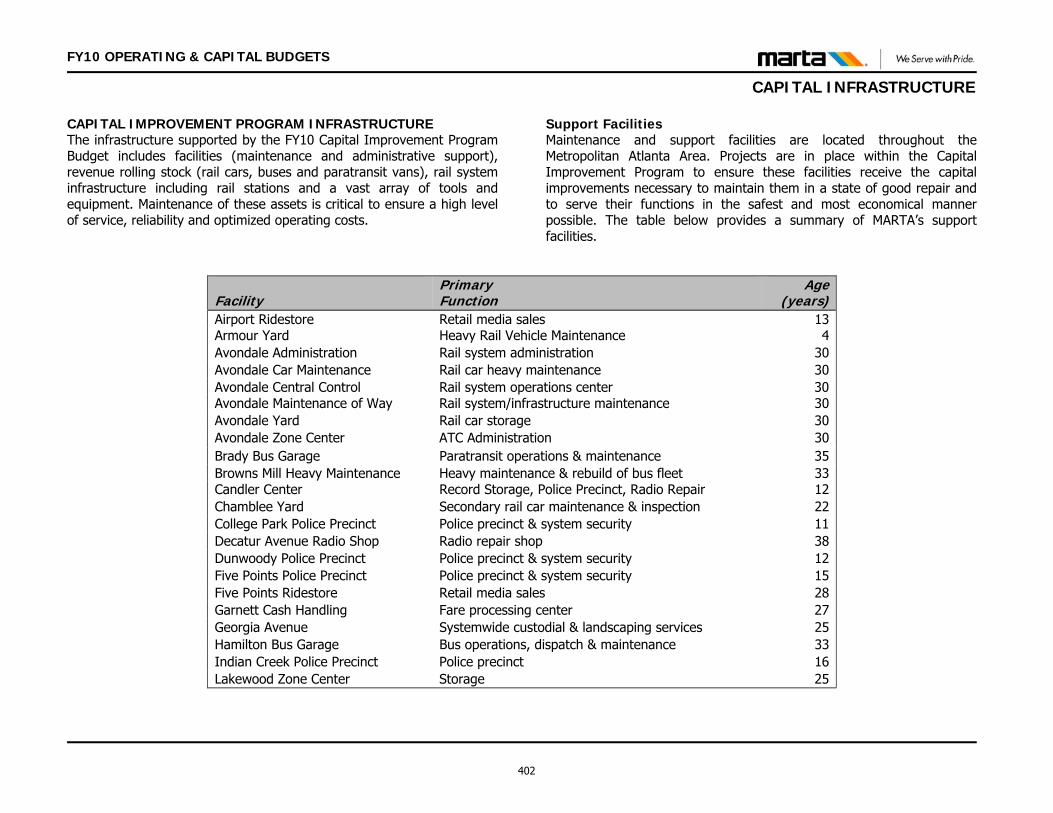
FY10 OPERATING & CAPITAL BUDGETS
CAPITAL INFRASTRUCTURE
CAPITAL IMPROVEMENT PROGRAM INFRASTRUCTURE The infrastructure supported by the FY10 Capital Improvement Program Budget includes facilities (maintenance and administrative support), revenue rolling stock (rail cars, buses and paratransit vans), rail system infrastructure including rail stations and a vast array of tools and equipment. Maintenance of these assets is critical to ensure a high level of service, reliability and optimized operating costs.
Support Facilities Maintenance and support facilities are located throughout the Metropolitan Atlanta Area. Projects are in place within the Capital Improvement Program to ensure these facilities receive the capital improvements necessary to maintain them in a state of good repair and to serve their functions in the safest and most economical manner possible. The table below provides a summary of MARTA’s support facilities.
Facility
Primary Function
Age(years)
Airport Ridestore Retail media sales 13Armour Yard Heavy Rail Vehicle Maintenance 4Avondale Administration Rail system administration 30Avondale Car Maintenance Rail car heavy maintenance 30Avondale Central Control Rail system operations center 30Avondale Maintenance of Way Rail system/infrastructure maintenance 30Avondale Yard Rail car storage 30Avondale Zone Center ATC Administration 30Brady Bus Garage Paratransit operations & maintenance 35Browns Mill Heavy Maintenance Heavy maintenance & rebuild of bus fleet 33Candler Center Record Storage, Police Precinct, Radio Repair 12Chamblee Yard Secondary rail car maintenance & inspection 22College Park Police Precinct Police precinct & system security 11Decatur Avenue Radio Shop Radio repair shop 38Dunwoody Police Precinct Police precinct & system security 12Five Points Police Precinct Police precinct & system security 15Five Points Ridestore Retail media sales 28Garnett Cash Handling Fare processing center 27Georgia Avenue Systemwide custodial & landscaping services 25Hamilton Bus Garage Bus operations, dispatch & maintenance 33Indian Creek Police Precinct Police precinct 16Lakewood Zone Center Storage 25
402
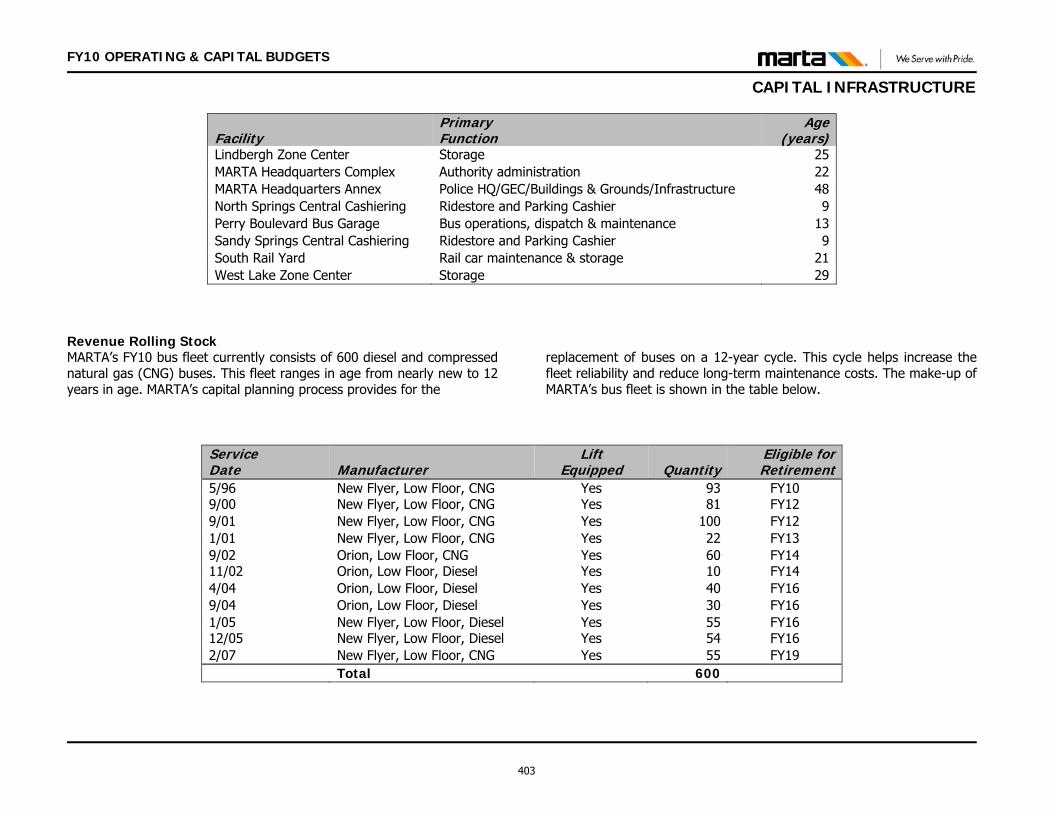
FY10 OPERATING & CAPITAL BUDGETS
CAPITAL INFRASTRUCTURE
Facility
Primary Function
Age(years)
Lindbergh Zone Center Storage 25MARTA Headquarters Complex Authority administration 22MARTA Headquarters Annex Police HQ/GEC/Buildings & Grounds/Infrastructure 48North Springs Central Cashiering Ridestore and Parking Cashier 9Perry Boulevard Bus Garage Bus operations, dispatch & maintenance 13Sandy Springs Central Cashiering Ridestore and Parking Cashier 9South Rail Yard Rail car maintenance & storage 21West Lake Zone Center Storage 29
Revenue Rolling Stock MARTA’s FY10 bus fleet currently consists of 600 diesel and compressed natural gas (CNG) buses. This fleet ranges in age from nearly new to 12 years in age. MARTA’s capital planning process provides for the
replacement of buses on a 12-year cycle. This cycle helps increase the fleet reliability and reduce long-term maintenance costs. The make-up of MARTA’s bus fleet is shown in the table below.
Service Date
Manufacturer
Lift Equipped Quantity
Eligible forRetirement
5/96 New Flyer, Low Floor, CNG Yes 93 FY10 9/00 New Flyer, Low Floor, CNG Yes 81 FY12 9/01 New Flyer, Low Floor, CNG Yes 100 FY12 1/01 New Flyer, Low Floor, CNG Yes 22 FY13 9/02 Orion, Low Floor, CNG Yes 60 FY14 11/02 Orion, Low Floor, Diesel Yes 10 FY14 4/04 Orion, Low Floor, Diesel Yes 40 FY16 9/04 Orion, Low Floor, Diesel Yes 30 FY16 1/05 New Flyer, Low Floor, Diesel Yes 55 FY16 12/05 New Flyer, Low Floor, Diesel Yes 54 FY16 2/07 New Flyer, Low Floor, CNG Yes 55 FY19 Total 600
403
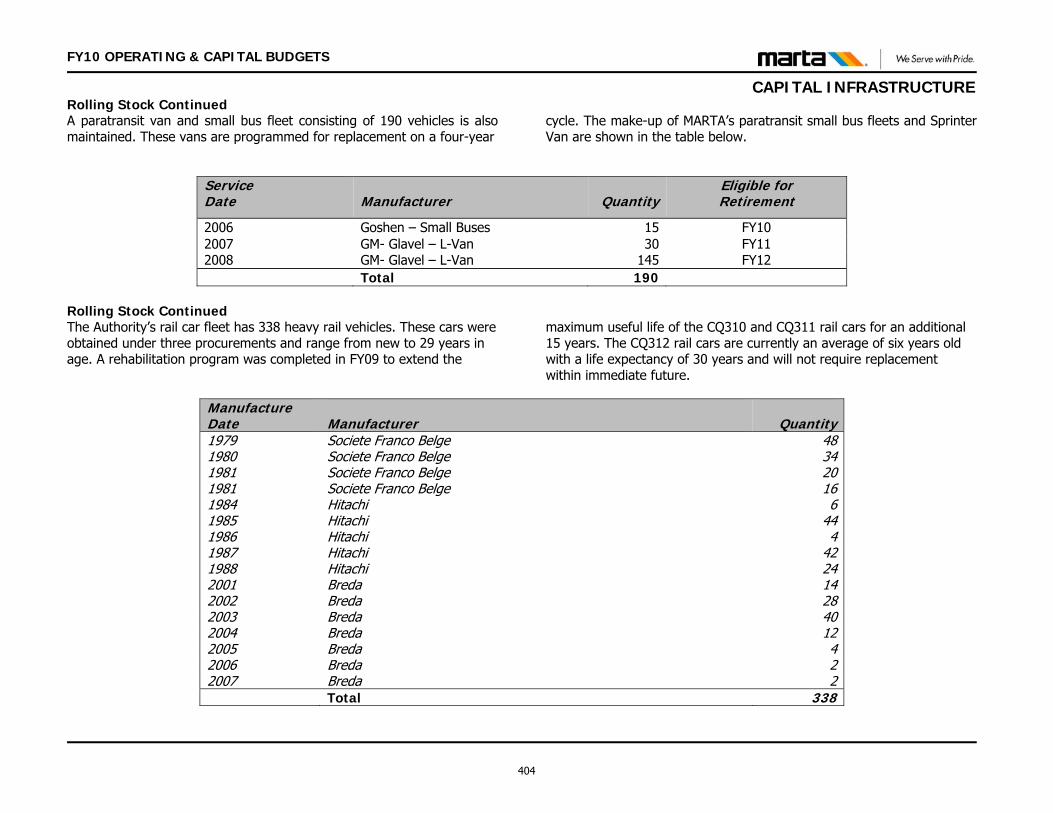
FY10 OPERATING & CAPITAL BUDGETS
CAPITAL INFRASTRUCTURE
Rolling Stock Continued A paratransit van and small bus fleet consisting of 190 vehicles is also maintained. These vans are programmed for replacement on a four-year
cycle. The make-up of MARTA’s paratransit small bus fleets and Sprinter Van are shown in the table below.
Service Date
Manufacturer Quantity
Eligible for Retirement
2006 Goshen – Small Buses 15 FY10 2007 GM- Glavel – L-Van 30 FY11 2008 GM- Glavel – L-Van 145 FY12
Total 190 Rolling Stock Continued The Authority’s rail car fleet has 338 heavy rail vehicles. These cars were obtained under three procurements and range from new to 29 years in age. A rehabilitation program was completed in FY09 to extend the
maximum useful life of the CQ310 and CQ311 rail cars for an additional 15 years. The CQ312 rail cars are currently an average of six years old with a life expectancy of 30 years and will not require replacement within immediate future.
Manufacture Date
Manufacturer Quantity
1979 Societe Franco Belge 481980 Societe Franco Belge 341981 Societe Franco Belge 201981 Societe Franco Belge 161984 Hitachi 61985 Hitachi 441986 Hitachi 41987 Hitachi 421988 Hitachi 242001 Breda 142002 Breda 282003 Breda 402004 Breda 122005 Breda 42006 Breda 22007 Breda 2
Total 338
404
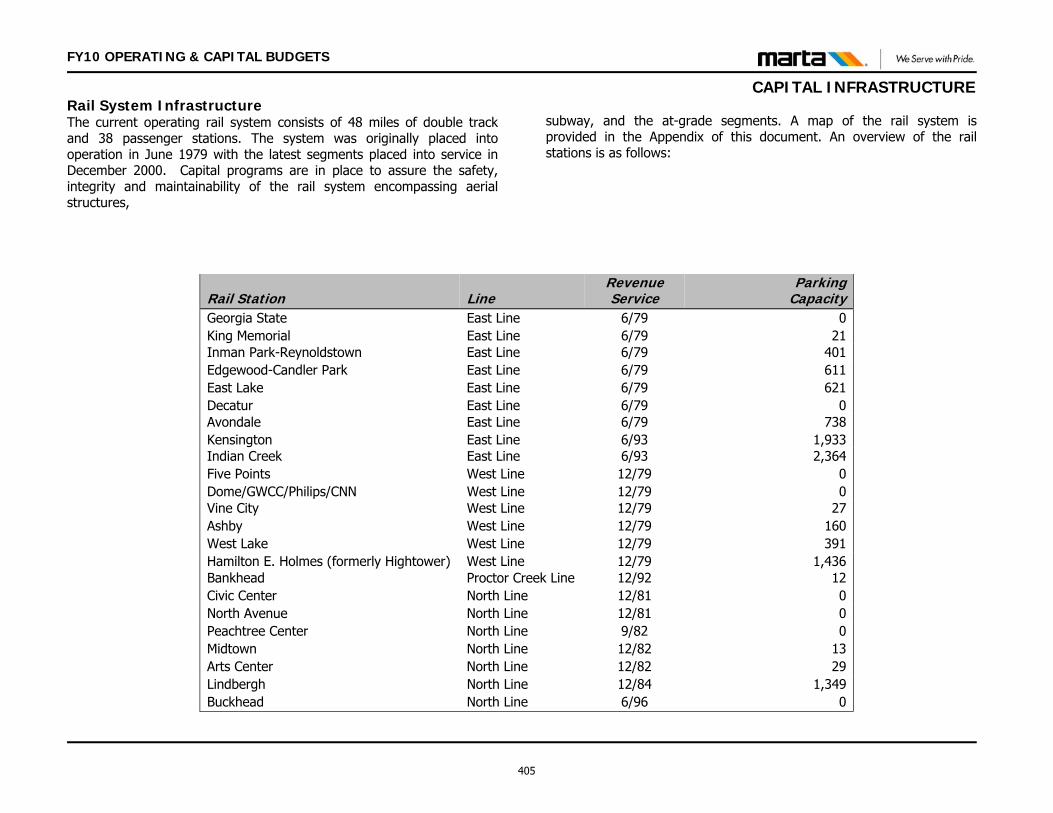
FY10 OPERATING & CAPITAL BUDGETS
CAPITAL INFRASTRUCTURE
Rail System Infrastructure The current operating rail system consists of 48 miles of double track and 38 passenger stations. The system was originally placed into operation in June 1979 with the latest segments placed into service in December 2000. Capital programs are in place to assure the safety, integrity and maintainability of the rail system encompassing aerial structures,
subway, and the at-grade segments. A map of the rail system is provided in the Appendix of this document. An overview of the rail stations is as follows:
Rail Station
Line
Revenue Service
ParkingCapacity
Georgia State East Line 6/79 0King Memorial East Line 6/79 21Inman Park-Reynoldstown East Line 6/79 401Edgewood-Candler Park East Line 6/79 611East Lake East Line 6/79 621Decatur East Line 6/79 0Avondale East Line 6/79 738Kensington East Line 6/93 1,933Indian Creek East Line 6/93 2,364Five Points West Line 12/79 0Dome/GWCC/Philips/CNN West Line 12/79 0Vine City West Line 12/79 27Ashby West Line 12/79 160West Lake West Line 12/79 391Hamilton E. Holmes (formerly Hightower) West Line 12/79 1,436Bankhead Proctor Creek Line 12/92 12Civic Center North Line 12/81 0North Avenue North Line 12/81 0Peachtree Center North Line 9/82 0Midtown North Line 12/82 13Arts Center North Line 12/82 29Lindbergh North Line 12/84 1,349Buckhead North Line 6/96 0
405
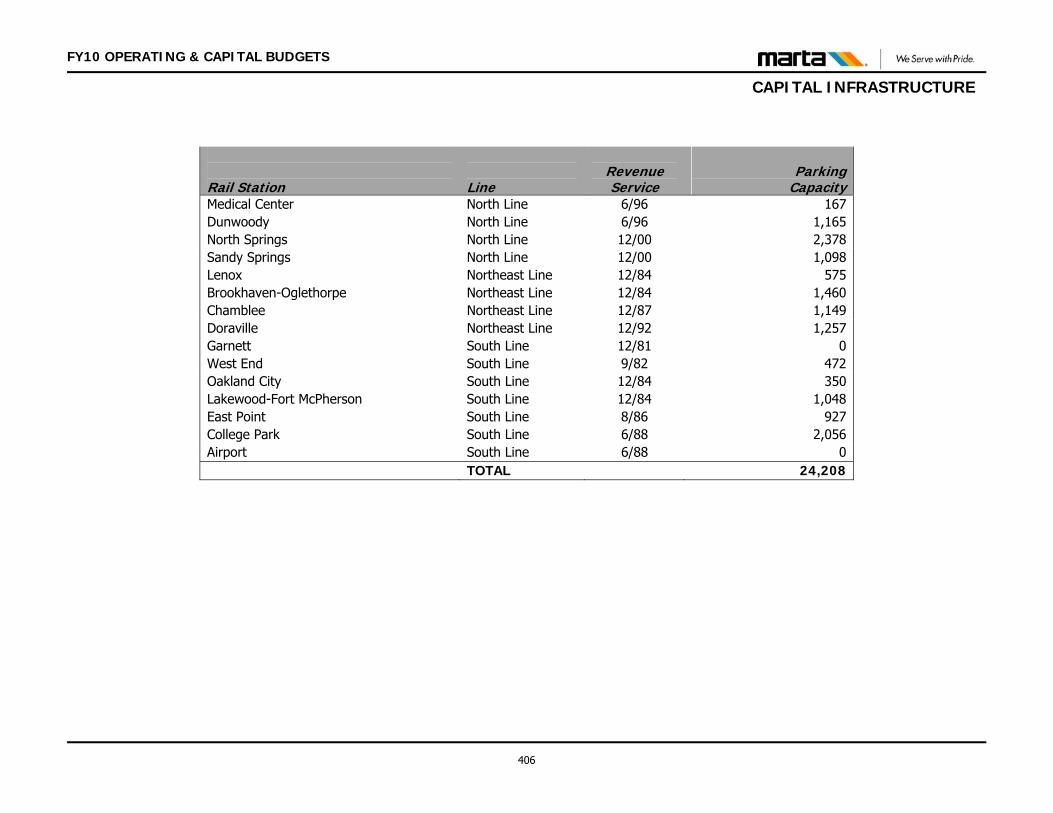
FY10 OPERATING & CAPITAL BUDGETS
CAPITAL INFRASTRUCTURE
Rail Station
Line
Revenue Service
ParkingCapacity
Medical Center North Line 6/96 167Dunwoody North Line 6/96 1,165North Springs North Line 12/00 2,378Sandy Springs North Line 12/00 1,098Lenox Northeast Line 12/84 575Brookhaven-Oglethorpe Northeast Line 12/84 1,460Chamblee Northeast Line 12/87 1,149Doraville Northeast Line 12/92 1,257Garnett South Line 12/81 0West End South Line 9/82 472Oakland City South Line 12/84 350Lakewood-Fort McPherson South Line 12/84 1,048East Point South Line 8/86 927College Park South Line 6/88 2,056Airport South Line 6/88 0 TOTAL 24,208
406
FY10 OPERATING & CAPITAL BUDGETS
PLANNING PROGRAM OVERVIEW
PLANNING PROGRAM This section identifies the Planning Program of the Capital Improvement Program.
407
FY10 OPERATING & CAPITAL BUDGETS
PLANNING PROGRAM OVERVIEW Planning Program MARTA’s Planning Program is contained within the Capital Improvement Program and consists of three primary components. The components are Regional Transit Planning, Transit Financial Planning and Short-Range Transit Planning. Regional Transit Planning This component includes all work done in support of the Atlanta Regional Transportation Planning Program of the Atlanta Regional Commission (ARC). Recent developments include active participation in the recently formed Transit Planning Board that works in coordination with the ARC process. Examples of regional activities include participation in the Transportation Coordination Committee (TCC), clearinghouse reviews and coordination of specific projects within the transit program, and support for the following ARC activities: Updating the regional development and regional transportation plan Maintaining the transportation planning process Assisting in transportation air quality planning Participating in suburban transportation and inter-modal studies Analyzing sensitive sub-regional issues Planning for Transportation System Management Projects Developing a congestion management system Evaluating MARTA’s bicycle access policies and facilities Refining transportation demand forecast models Preparing transit networks Providing technical assistance on transit issues in activities that
expand the role of public transit in non-MARTA counties
Long-range planning projects may include: Updating data on referendum corridors Identifying new corridors for rail and bus system expansion Collecting, processing, analyzing and documenting MARTA’s National
Transit Database (NTD) non-financial operating data Activities related to implementing the Clean Air Act Amendments Coordinating land use and transportation policies Transportation strategic planning and special studies
Transit Financial Planning This planning component includes the development of long-range financial and business plans for MARTA’s expense and revenue management. In support of these plans there will be an ongoing effort which analyzes the impact of reduced federal funds, alternative fare policies and structures, operational alternatives, and alternative funding sources. Also included will be activities related to obtaining Safe, Accountable, Flexible, Efficient Transportation Equity Act: A Legacy for Users (SAFETEA-LU) flexible funding for transit projects, planning and coordination required to refine and enhance MARTA’s strategic planning process.
Short-Range Transit Planning This planning component provides for work by MARTA staff to refine and continue to apply the transit planning process to define transit services and operating formats and policies required to meet the public transportation needs of the MARTA service area. As part of this component, information about transit riders and non-riders will be captured and applied to system and service development activities. Major activities will include the identification and development of service plans and strategies for transit markets with growth potential, refinement of existing service plans based on corridor level service needs and route level alignment studies, and special projects including MARTA’s strategic planning activities. Also included are studies to improve the efficiency and effectiveness of MARTA’s operation, to coordinate with ARC and Georgia DOT in fulfilling planning requirements of SAFETEA-LU, and provide technical information and support to regional transit planning. Modifications of service levels and analysis of operating policies and programs are also included. MARTA also maintains an ongoing monitoring program to determine the impact of the rail transit construction and operational demand. Activities will include evaluating the effectiveness of marketing strategies, developing strategies for changing factors which impact ridership, and evaluating demographic changes and their impact on ridership. Research
408
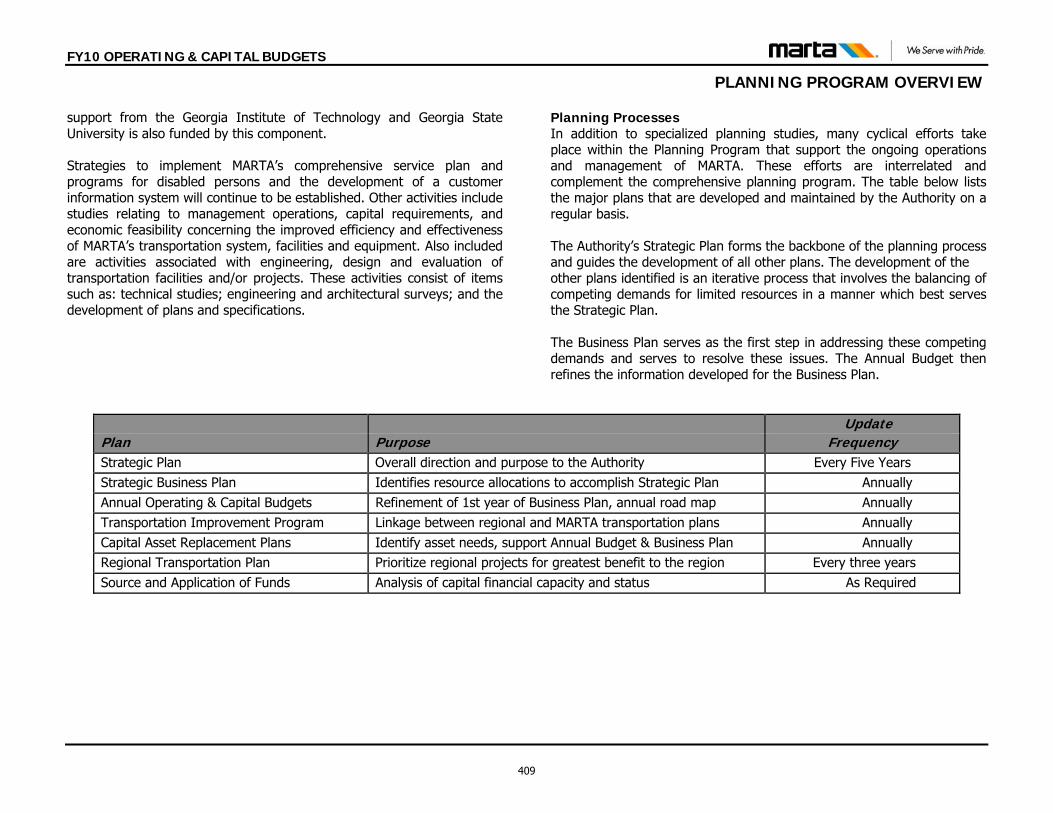
FY10 OPERATING & CAPITAL BUDGETS
PLANNING PROGRAM OVERVIEW support from the Georgia Institute of Technology and Georgia State University is also funded by this component. Strategies to implement MARTA’s comprehensive service plan and programs for disabled persons and the development of a customer information system will continue to be established. Other activities include studies relating to management operations, capital requirements, and economic feasibility concerning the improved efficiency and effectiveness of MARTA’s transportation system, facilities and equipment. Also included are activities associated with engineering, design and evaluation of transportation facilities and/or projects. These activities consist of items such as: technical studies; engineering and architectural surveys; and the development of plans and specifications.
Planning Processes In addition to specialized planning studies, many cyclical efforts take place within the Planning Program that support the ongoing operations and management of MARTA. These efforts are interrelated and complement the comprehensive planning program. The table below lists the major plans that are developed and maintained by the Authority on a regular basis. The Authority’s Strategic Plan forms the backbone of the planning process and guides the development of all other plans. The development of the other plans identified is an iterative process that involves the balancing of competing demands for limited resources in a manner which best serves the Strategic Plan. The Business Plan serves as the first step in addressing these competing demands and serves to resolve these issues. The Annual Budget then refines the information developed for the Business Plan.
Update Plan Purpose Frequency Strategic Plan Overall direction and purpose to the Authority Every Five Years Strategic Business Plan Identifies resource allocations to accomplish Strategic Plan Annually Annual Operating & Capital Budgets Refinement of 1st year of Business Plan, annual road map Annually Transportation Improvement Program Linkage between regional and MARTA transportation plans Annually Capital Asset Replacement Plans Identify asset needs, support Annual Budget & Business Plan Annually Regional Transportation Plan Prioritize regional projects for greatest benefit to the region Every three years Source and Application of Funds Analysis of capital financial capacity and status As Required
409
FY10 OPERATING & CAPITAL BUDGETS
CAPITAL SOURCES AND APPLICATIONS OF FUNDS
Sources and Applications of Funds The following section describes the capital program sources and applications of funds in the format of a ten-year plan.
410
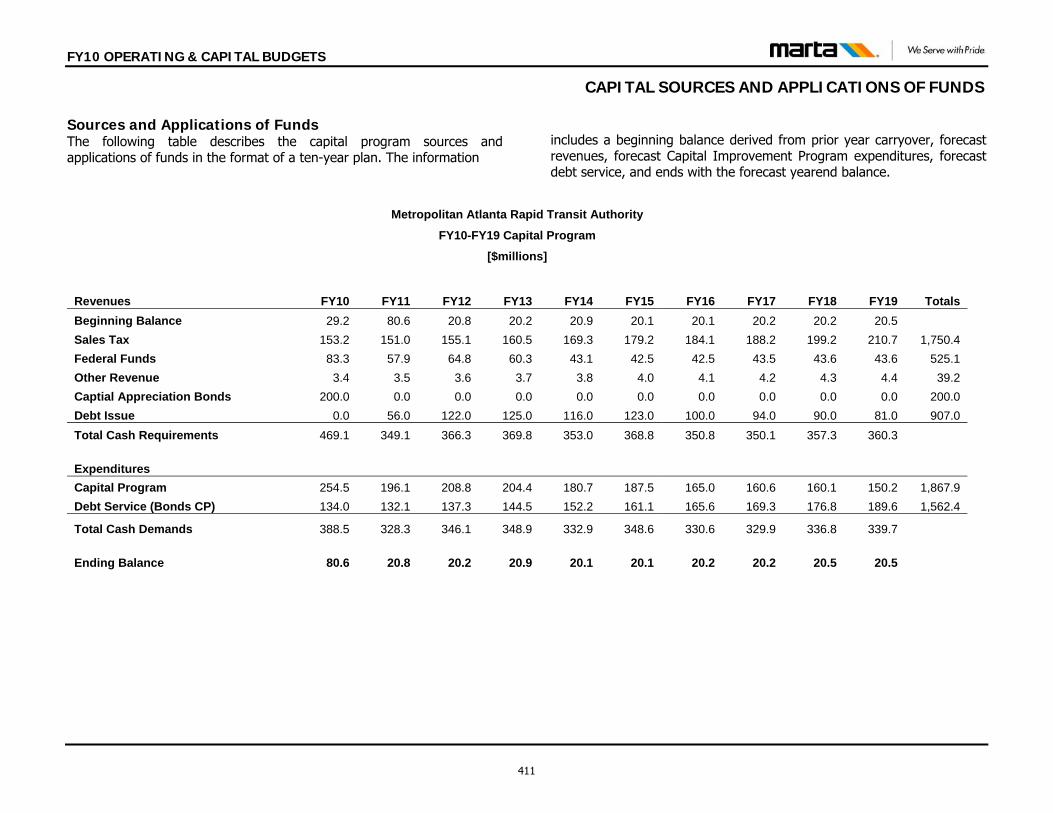
FY10 OPERATING & CAPITAL BUDGETS
CAPITAL SOURCES AND APPLICATIONS OF FUNDS Sources and Applications of Funds The following table describes the capital program sources and applications of funds in the format of a ten-year plan. The information
includes a beginning balance derived from prior year carryover, forecast revenues, forecast Capital Improvement Program expenditures, forecast debt service, and ends with the forecast yearend balance.
Metropolitan Atlanta Rapid Transit Authority
FY10-FY19 Capital Program
[$millions]
Revenues FY10 FY11 FY12 FY13 FY14 FY15 FY16 FY17 FY18 FY19 Totals Beginning Balance 29.2 80.6 20.8 20.2 20.9 20.1 20.1 20.2 20.2 20.5 Sales Tax 153.2 151.0 155.1 160.5 169.3 179.2 184.1 188.2 199.2 210.7 1,750.4 Federal Funds 83.3 57.9 64.8 60.3 43.1 42.5 42.5 43.5 43.6 43.6 525.1 Other Revenue 3.4 3.5 3.6 3.7 3.8 4.0 4.1 4.2 4.3 4.4 39.2 Captial Appreciation Bonds 200.0 0.0 0.0 0.0 0.0 0.0 0.0 0.0 0.0 0.0 200.0 Debt Issue 0.0 56.0 122.0 125.0 116.0 123.0 100.0 94.0 90.0 81.0 907.0 Total Cash Requirements 469.1 349.1 366.3 369.8 353.0 368.8 350.8 350.1 357.3 360.3
Expenditures Capital Program 254.5 196.1 208.8 204.4 180.7 187.5 165.0 160.6 160.1 150.2 1,867.9 Debt Service (Bonds CP) 134.0 132.1 137.3 144.5 152.2 161.1 165.6 169.3 176.8 189.6 1,562.4
Total Cash Demands 388.5 328.3 346.1 348.9 332.9 348.6 330.6 329.9 336.8 339.7
Ending Balance 80.6 20.8 20.2 20.9 20.1 20.1 20.2 20.2 20.5 20.5
411
FY10 OPERATING & CAPITAL BUDGETS
APPROVED PROJECTS SUMMARY
Capital Projects Summary The following report depicts a summary of the proposed projects by program, with final approval of funds for FY10. The total funds budgeted for capital improvement is $254,513,140.
412
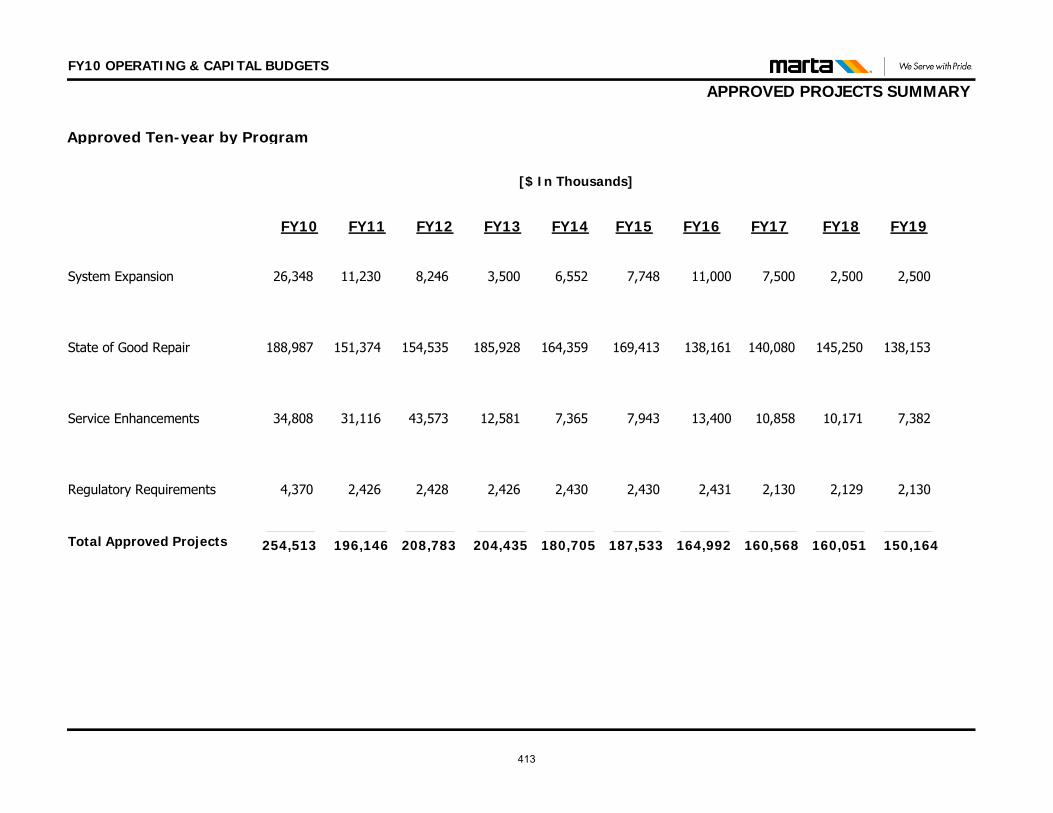
FY18 FY19FY10 FY11 FY12
APPROVED PROJECTS SUMMARY
FY13 FY14 FY15 FY16 FY17
[$ In Thousands]
FY10 OPERATING & CAPITAL BUDGETS
Approved Ten-year by Program
26,348 11,230 8,246 3,500 6,552System Expansion 7,748 11,000 7,500 2,500 2,500
188,987 151,374 154,535 185,928 164,359State of Good Repair 169,413 138,161 140,080 145,250 138,153
34,808 31,116 43,573 12,581 7,365Service Enhancements 7,943 13,400 10,858 10,171 7,382
4,370 2,426 2,428 2,426 2,430Regulatory Requirements 2,430 2,431 2,130 2,129 2,130
254,513 196,146 208,783 204,435 180,705 187,533 164,992 160,568 160,051 150,164Total Approved Projects
413
FY10 OPERATING & CAPITAL BUDGETS
APPROVED PROJECTS TEN-YEAR FORECAST Approved Capital Project Ten-year Plan The report on the following pages depicts the approved capital projects ten year forecast for years FY10 to FY19.
414
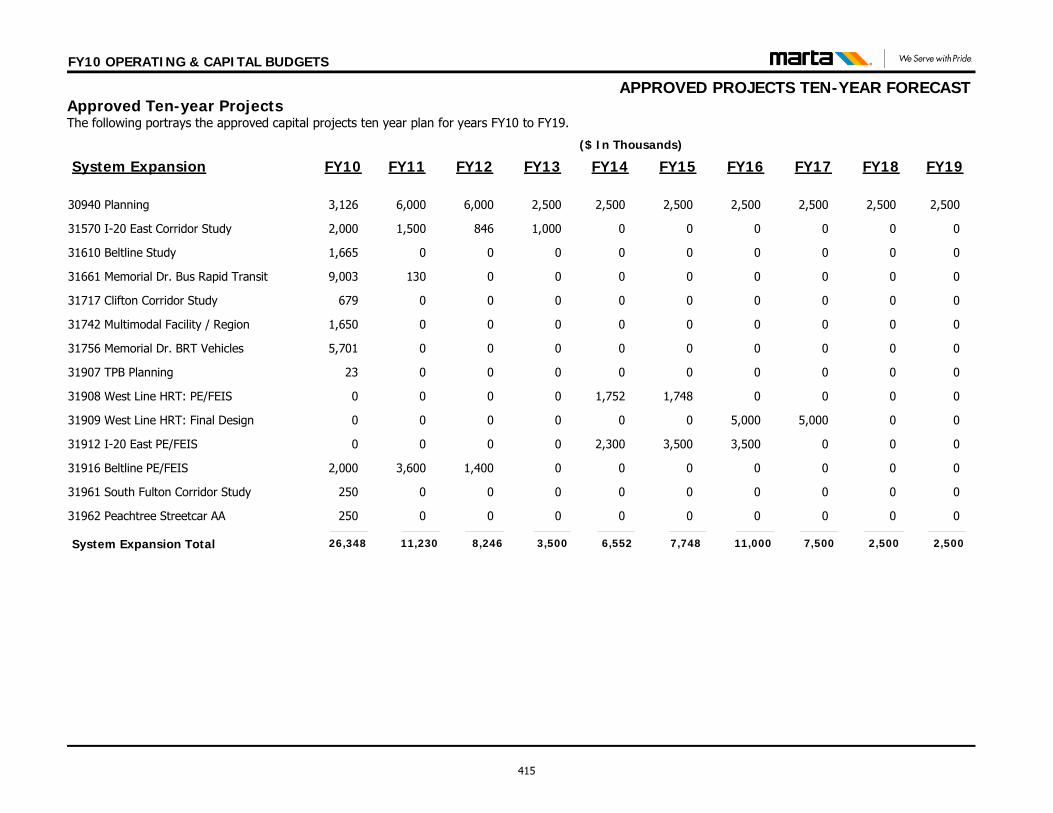
APPROVED PROJECTS TEN-YEAR FORECAST
($ In Thousands)
FY10 OPERATING & CAPITAL BUDGETS
Approved Ten-year Projects The following portrays the approved capital projects ten year plan for years FY10 to FY19.
FY10 FY11 FY12 FY13 FY14 FY15 FY16 FY17 FY18 FY19System Expansion
3,126 6,000 6,000 2,500 2,500 2,500 2,500 2,500 2,500 2,50030940 Planning
2,000 1,500 846 1,000 0 0 0 0 0 031570 I-20 East Corridor Study
1,665 0 0 0 0 0 0 0 0 031610 Beltline Study
9,003 130 0 0 0 0 0 0 0 031661 Memorial Dr. Bus Rapid Transit
679 0 0 0 0 0 0 0 0 031717 Clifton Corridor Study
1,650 0 0 0 0 0 0 0 0 031742 Multimodal Facility / Region
5,701 0 0 0 0 0 0 0 0 031756 Memorial Dr. BRT Vehicles
23 0 0 0 0 0 0 0 0 031907 TPB Planning
0 0 0 0 1,752 1,748 0 0 0 031908 West Line HRT: PE/FEIS
0 0 0 0 0 0 5,000 5,000 0 031909 West Line HRT: Final Design
0 0 0 0 2,300 3,500 3,500 0 0 031912 I-20 East PE/FEIS
2,000 3,600 1,400 0 0 0 0 0 0 031916 Beltline PE/FEIS
250 0 0 0 0 0 0 0 0 031961 South Fulton Corridor Study
250 0 0 0 0 0 0 0 0 031962 Peachtree Streetcar AA
11,230 8,246 3,500 6,552System Expansion Total 26,348 11,000 7,500 2,500 2,5007,748
415
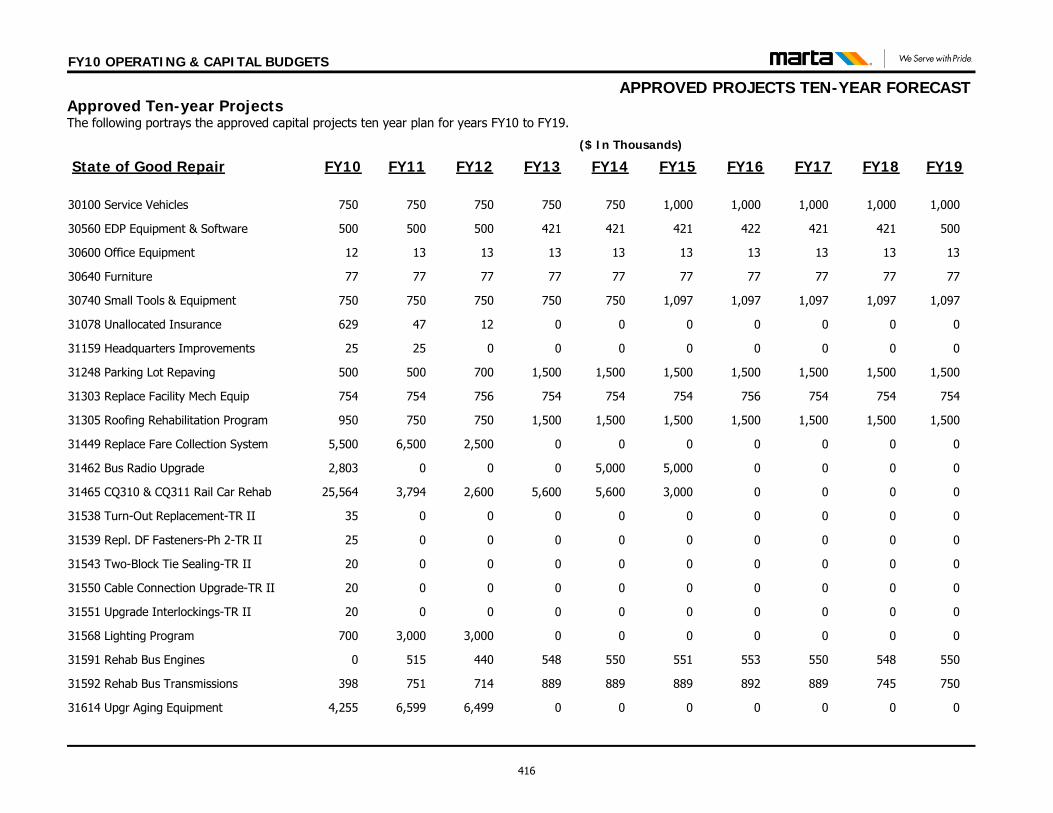
APPROVED PROJECTS TEN-YEAR FORECAST
($ In Thousands)
FY10 OPERATING & CAPITAL BUDGETS
Approved Ten-year Projects The following portrays the approved capital projects ten year plan for years FY10 to FY19.
FY10 FY11 FY12 FY13 FY14 FY15 FY16 FY17 FY18 FY19State of Good Repair
750 750 750 750 750 1,000 1,000 1,000 1,000 1,00030100 Service Vehicles
500 500 500 421 421 421 422 421 421 50030560 EDP Equipment & Software
12 13 13 13 13 13 13 13 13 1330600 Office Equipment
77 77 77 77 77 77 77 77 77 7730640 Furniture
750 750 750 750 750 1,097 1,097 1,097 1,097 1,09730740 Small Tools & Equipment
629 47 12 0 0 0 0 0 0 031078 Unallocated Insurance
25 25 0 0 0 0 0 0 0 031159 Headquarters Improvements
500 500 700 1,500 1,500 1,500 1,500 1,500 1,500 1,50031248 Parking Lot Repaving
754 754 756 754 754 754 756 754 754 75431303 Replace Facility Mech Equip
950 750 750 1,500 1,500 1,500 1,500 1,500 1,500 1,50031305 Roofing Rehabilitation Program
5,500 6,500 2,500 0 0 0 0 0 0 031449 Replace Fare Collection System
2,803 0 0 0 5,000 5,000 0 0 0 031462 Bus Radio Upgrade
25,564 3,794 2,600 5,600 5,600 3,000 0 0 0 031465 CQ310 & CQ311 Rail Car Rehab
35 0 0 0 0 0 0 0 0 031538 Turn-Out Replacement-TR II
25 0 0 0 0 0 0 0 0 031539 Repl. DF Fasteners-Ph 2-TR II
20 0 0 0 0 0 0 0 0 031543 Two-Block Tie Sealing-TR II
20 0 0 0 0 0 0 0 0 031550 Cable Connection Upgrade-TR II
20 0 0 0 0 0 0 0 0 031551 Upgrade Interlockings-TR II
700 3,000 3,000 0 0 0 0 0 0 031568 Lighting Program
0 515 440 548 550 551 553 550 548 55031591 Rehab Bus Engines
398 751 714 889 889 889 892 889 745 75031592 Rehab Bus Transmissions
4,255 6,599 6,499 0 0 0 0 0 0 031614 Upgr Aging Equipment
416
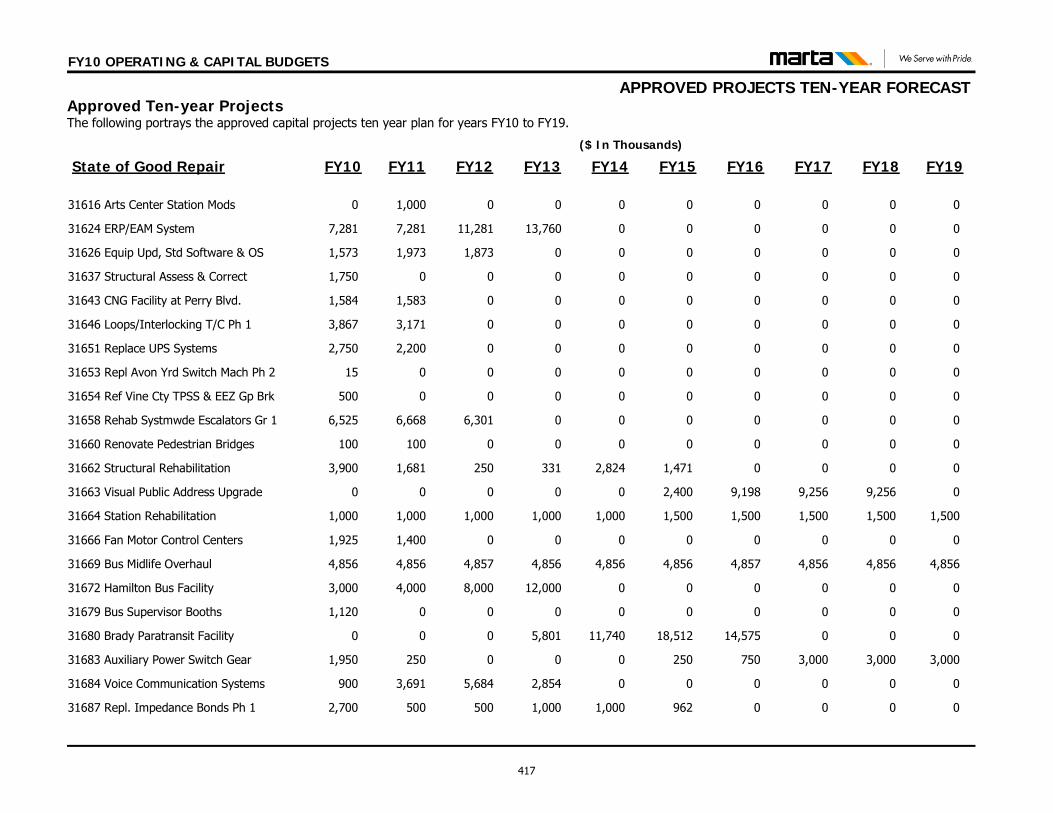
APPROVED PROJECTS TEN-YEAR FORECAST
($ In Thousands)
FY10 OPERATING & CAPITAL BUDGETS
Approved Ten-year Projects The following portrays the approved capital projects ten year plan for years FY10 to FY19.
FY10 FY11 FY12 FY13 FY14 FY15 FY16 FY17 FY18 FY19State of Good Repair
0 1,000 0 0 0 0 0 0 0 031616 Arts Center Station Mods
7,281 7,281 11,281 13,760 0 0 0 0 0 031624 ERP/EAM System
1,573 1,973 1,873 0 0 0 0 0 0 031626 Equip Upd, Std Software & OS
1,750 0 0 0 0 0 0 0 0 031637 Structural Assess & Correct
1,584 1,583 0 0 0 0 0 0 0 031643 CNG Facility at Perry Blvd.
3,867 3,171 0 0 0 0 0 0 0 031646 Loops/Interlocking T/C Ph 1
2,750 2,200 0 0 0 0 0 0 0 031651 Replace UPS Systems
15 0 0 0 0 0 0 0 0 031653 Repl Avon Yrd Switch Mach Ph 2
500 0 0 0 0 0 0 0 0 031654 Ref Vine Cty TPSS & EEZ Gp Brk
6,525 6,668 6,301 0 0 0 0 0 0 031658 Rehab Systmwde Escalators Gr 1
100 100 0 0 0 0 0 0 0 031660 Renovate Pedestrian Bridges
3,900 1,681 250 331 2,824 1,471 0 0 0 031662 Structural Rehabilitation
0 0 0 0 0 2,400 9,198 9,256 9,256 031663 Visual Public Address Upgrade
1,000 1,000 1,000 1,000 1,000 1,500 1,500 1,500 1,500 1,50031664 Station Rehabilitation
1,925 1,400 0 0 0 0 0 0 0 031666 Fan Motor Control Centers
4,856 4,856 4,857 4,856 4,856 4,856 4,857 4,856 4,856 4,85631669 Bus Midlife Overhaul
3,000 4,000 8,000 12,000 0 0 0 0 0 031672 Hamilton Bus Facility
1,120 0 0 0 0 0 0 0 0 031679 Bus Supervisor Booths
0 0 0 5,801 11,740 18,512 14,575 0 0 031680 Brady Paratransit Facility
1,950 250 0 0 0 250 750 3,000 3,000 3,00031683 Auxiliary Power Switch Gear
900 3,691 5,684 2,854 0 0 0 0 0 031684 Voice Communication Systems
2,700 500 500 1,000 1,000 962 0 0 0 031687 Repl. Impedance Bonds Ph 1
417
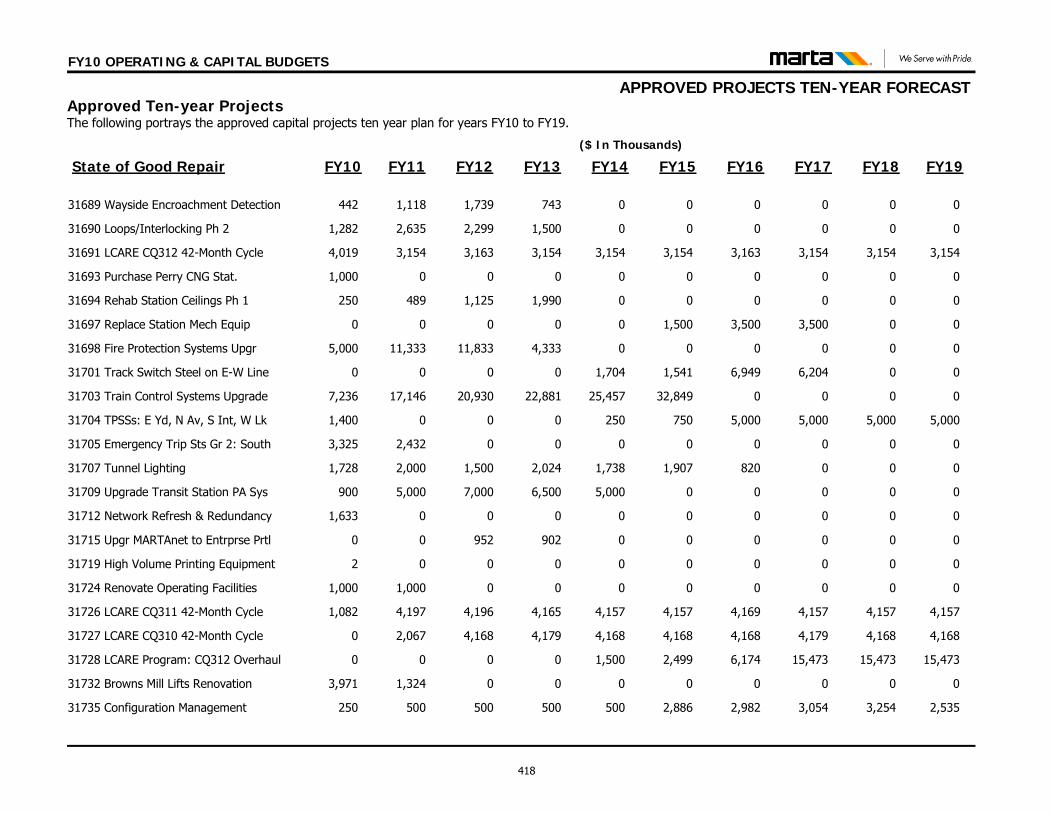
APPROVED PROJECTS TEN-YEAR FORECAST
($ In Thousands)
FY10 OPERATING & CAPITAL BUDGETS
Approved Ten-year Projects The following portrays the approved capital projects ten year plan for years FY10 to FY19.
FY10 FY11 FY12 FY13 FY14 FY15 FY16 FY17 FY18 FY19State of Good Repair
442 1,118 1,739 743 0 0 0 0 0 031689 Wayside Encroachment Detection
1,282 2,635 2,299 1,500 0 0 0 0 0 031690 Loops/Interlocking Ph 2
4,019 3,154 3,163 3,154 3,154 3,154 3,163 3,154 3,154 3,15431691 LCARE CQ312 42-Month Cycle
1,000 0 0 0 0 0 0 0 0 031693 Purchase Perry CNG Stat.
250 489 1,125 1,990 0 0 0 0 0 031694 Rehab Station Ceilings Ph 1
0 0 0 0 0 1,500 3,500 3,500 0 031697 Replace Station Mech Equip
5,000 11,333 11,833 4,333 0 0 0 0 0 031698 Fire Protection Systems Upgr
0 0 0 0 1,704 1,541 6,949 6,204 0 031701 Track Switch Steel on E-W Line
7,236 17,146 20,930 22,881 25,457 32,849 0 0 0 031703 Train Control Systems Upgrade
1,400 0 0 0 250 750 5,000 5,000 5,000 5,00031704 TPSSs: E Yd, N Av, S Int, W Lk
3,325 2,432 0 0 0 0 0 0 0 031705 Emergency Trip Sts Gr 2: South
1,728 2,000 1,500 2,024 1,738 1,907 820 0 0 031707 Tunnel Lighting
900 5,000 7,000 6,500 5,000 0 0 0 0 031709 Upgrade Transit Station PA Sys
1,633 0 0 0 0 0 0 0 0 031712 Network Refresh & Redundancy
0 0 952 902 0 0 0 0 0 031715 Upgr MARTAnet to Entrprse Prtl
2 0 0 0 0 0 0 0 0 031719 High Volume Printing Equipment
1,000 1,000 0 0 0 0 0 0 0 031724 Renovate Operating Facilities
1,082 4,197 4,196 4,165 4,157 4,157 4,169 4,157 4,157 4,15731726 LCARE CQ311 42-Month Cycle
0 2,067 4,168 4,179 4,168 4,168 4,168 4,179 4,168 4,16831727 LCARE CQ310 42-Month Cycle
0 0 0 0 1,500 2,499 6,174 15,473 15,473 15,47331728 LCARE Program: CQ312 Overhaul
3,971 1,324 0 0 0 0 0 0 0 031732 Browns Mill Lifts Renovation
250 500 500 500 500 2,886 2,982 3,054 3,254 2,53531735 Configuration Management
418
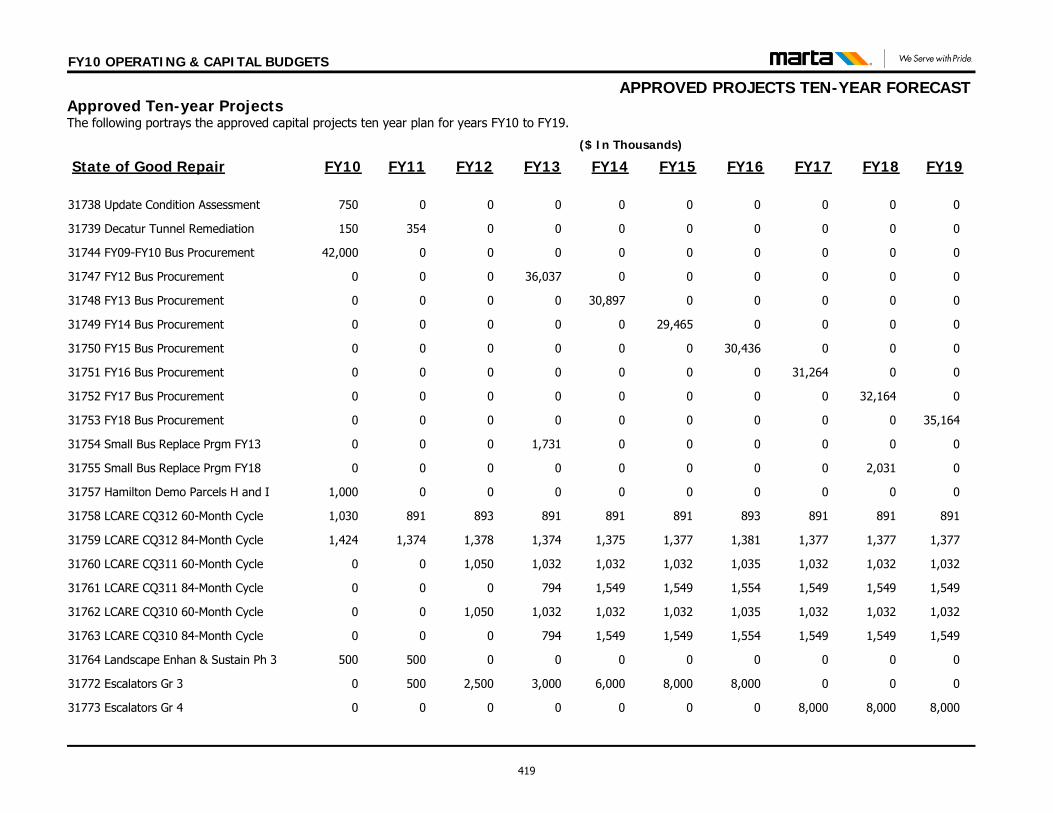
APPROVED PROJECTS TEN-YEAR FORECAST
($ In Thousands)
FY10 OPERATING & CAPITAL BUDGETS
Approved Ten-year Projects The following portrays the approved capital projects ten year plan for years FY10 to FY19.
FY10 FY11 FY12 FY13 FY14 FY15 FY16 FY17 FY18 FY19State of Good Repair
750 0 0 0 0 0 0 0 0 031738 Update Condition Assessment
150 354 0 0 0 0 0 0 0 031739 Decatur Tunnel Remediation
42,000 0 0 0 0 0 0 0 0 031744 FY09-FY10 Bus Procurement
0 0 0 36,037 0 0 0 0 0 031747 FY12 Bus Procurement
0 0 0 0 30,897 0 0 0 0 031748 FY13 Bus Procurement
0 0 0 0 0 29,465 0 0 0 031749 FY14 Bus Procurement
0 0 0 0 0 0 30,436 0 0 031750 FY15 Bus Procurement
0 0 0 0 0 0 0 31,264 0 031751 FY16 Bus Procurement
0 0 0 0 0 0 0 0 32,164 031752 FY17 Bus Procurement
0 0 0 0 0 0 0 0 0 35,16431753 FY18 Bus Procurement
0 0 0 1,731 0 0 0 0 0 031754 Small Bus Replace Prgm FY13
0 0 0 0 0 0 0 0 2,031 031755 Small Bus Replace Prgm FY18
1,000 0 0 0 0 0 0 0 0 031757 Hamilton Demo Parcels H and I
1,030 891 893 891 891 891 893 891 891 89131758 LCARE CQ312 60-Month Cycle
1,424 1,374 1,378 1,374 1,375 1,377 1,381 1,377 1,377 1,37731759 LCARE CQ312 84-Month Cycle
0 0 1,050 1,032 1,032 1,032 1,035 1,032 1,032 1,03231760 LCARE CQ311 60-Month Cycle
0 0 0 794 1,549 1,549 1,554 1,549 1,549 1,54931761 LCARE CQ311 84-Month Cycle
0 0 1,050 1,032 1,032 1,032 1,035 1,032 1,032 1,03231762 LCARE CQ310 60-Month Cycle
0 0 0 794 1,549 1,549 1,554 1,549 1,549 1,54931763 LCARE CQ310 84-Month Cycle
500 500 0 0 0 0 0 0 0 031764 Landscape Enhan & Sustain Ph 3
0 500 2,500 3,000 6,000 8,000 8,000 0 0 031772 Escalators Gr 3
0 0 0 0 0 0 0 8,000 8,000 8,00031773 Escalators Gr 4
419
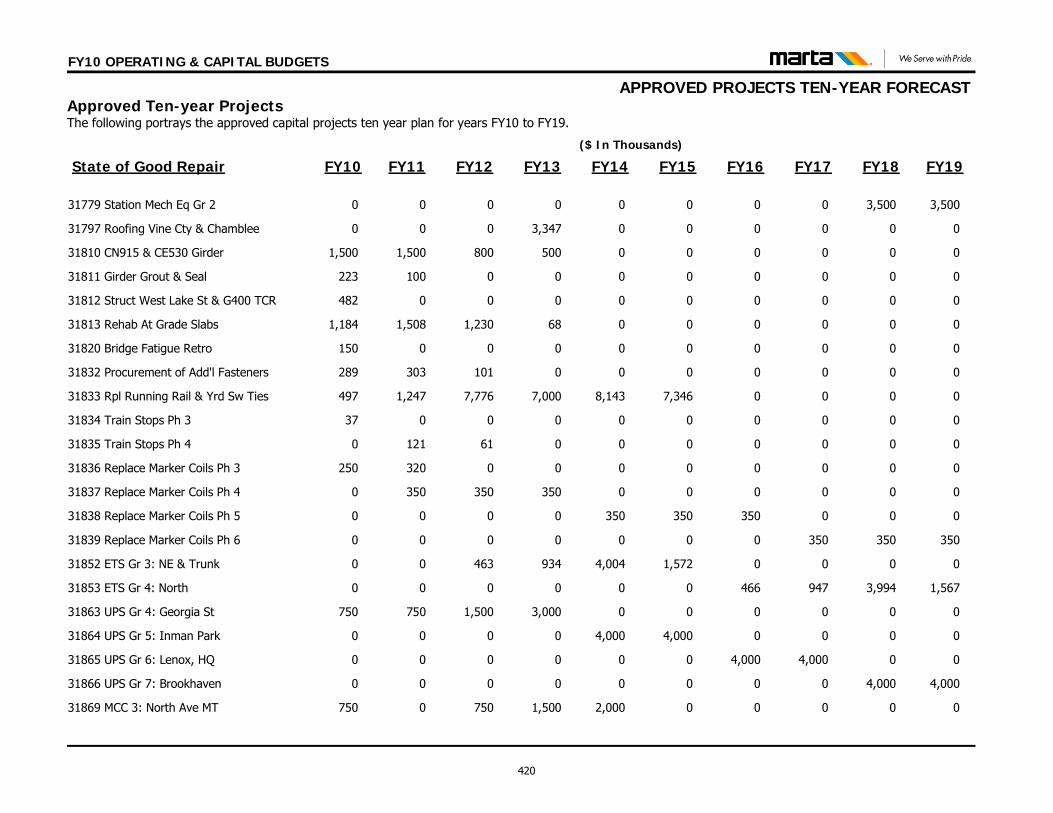
APPROVED PROJECTS TEN-YEAR FORECAST
($ In Thousands)
FY10 OPERATING & CAPITAL BUDGETS
Approved Ten-year Projects The following portrays the approved capital projects ten year plan for years FY10 to FY19.
FY10 FY11 FY12 FY13 FY14 FY15 FY16 FY17 FY18 FY19State of Good Repair
0 0 0 0 0 0 0 0 3,500 3,50031779 Station Mech Eq Gr 2
0 0 0 3,347 0 0 0 0 0 031797 Roofing Vine Cty & Chamblee
1,500 1,500 800 500 0 0 0 0 0 031810 CN915 & CE530 Girder
223 100 0 0 0 0 0 0 0 031811 Girder Grout & Seal
482 0 0 0 0 0 0 0 0 031812 Struct West Lake St & G400 TCR
1,184 1,508 1,230 68 0 0 0 0 0 031813 Rehab At Grade Slabs
150 0 0 0 0 0 0 0 0 031820 Bridge Fatigue Retro
289 303 101 0 0 0 0 0 0 031832 Procurement of Add'l Fasteners
497 1,247 7,776 7,000 8,143 7,346 0 0 0 031833 Rpl Running Rail & Yrd Sw Ties
37 0 0 0 0 0 0 0 0 031834 Train Stops Ph 3
0 121 61 0 0 0 0 0 0 031835 Train Stops Ph 4
250 320 0 0 0 0 0 0 0 031836 Replace Marker Coils Ph 3
0 350 350 350 0 0 0 0 0 031837 Replace Marker Coils Ph 4
0 0 0 0 350 350 350 0 0 031838 Replace Marker Coils Ph 5
0 0 0 0 0 0 0 350 350 35031839 Replace Marker Coils Ph 6
0 0 463 934 4,004 1,572 0 0 0 031852 ETS Gr 3: NE & Trunk
0 0 0 0 0 0 466 947 3,994 1,56731853 ETS Gr 4: North
750 750 1,500 3,000 0 0 0 0 0 031863 UPS Gr 4: Georgia St
0 0 0 0 4,000 4,000 0 0 0 031864 UPS Gr 5: Inman Park
0 0 0 0 0 0 4,000 4,000 0 031865 UPS Gr 6: Lenox, HQ
0 0 0 0 0 0 0 0 4,000 4,00031866 UPS Gr 7: Brookhaven
750 0 750 1,500 2,000 0 0 0 0 031869 MCC 3: North Ave MT
420
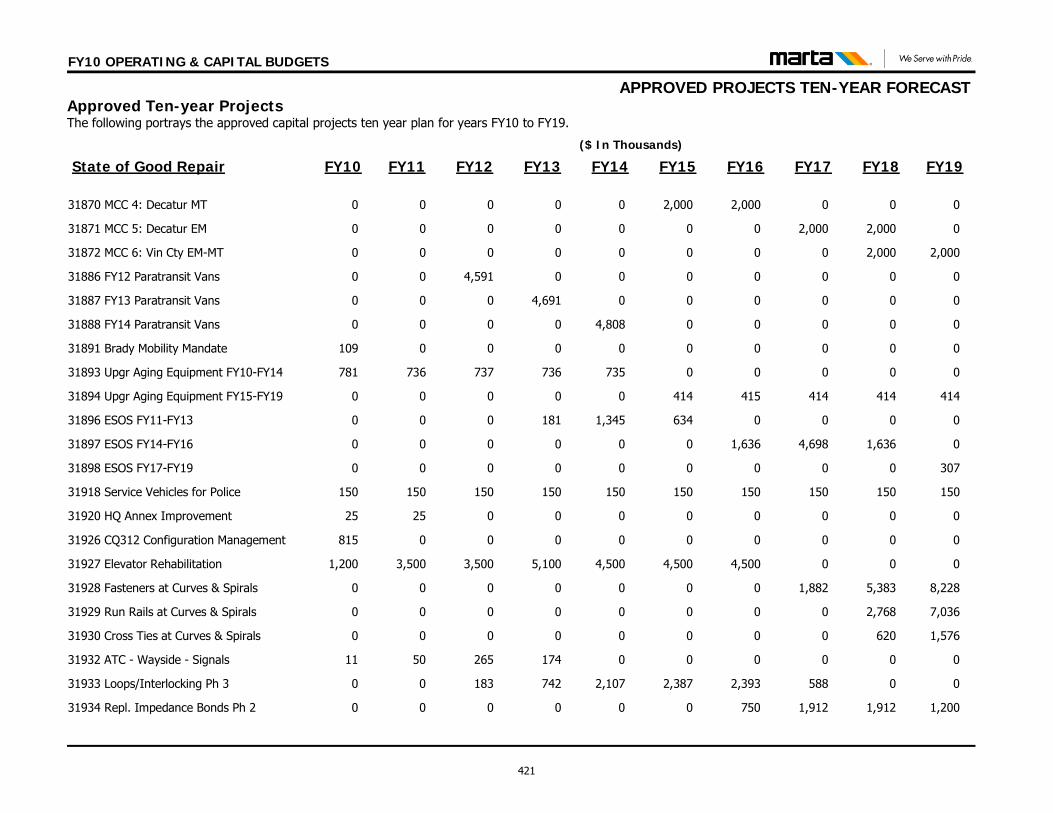
APPROVED PROJECTS TEN-YEAR FORECAST
($ In Thousands)
FY10 OPERATING & CAPITAL BUDGETS
Approved Ten-year Projects The following portrays the approved capital projects ten year plan for years FY10 to FY19.
FY10 FY11 FY12 FY13 FY14 FY15 FY16 FY17 FY18 FY19State of Good Repair
0 0 0 0 0 2,000 2,000 0 0 031870 MCC 4: Decatur MT
0 0 0 0 0 0 0 2,000 2,000 031871 MCC 5: Decatur EM
0 0 0 0 0 0 0 0 2,000 2,00031872 MCC 6: Vin Cty EM-MT
0 0 4,591 0 0 0 0 0 0 031886 FY12 Paratransit Vans
0 0 0 4,691 0 0 0 0 0 031887 FY13 Paratransit Vans
0 0 0 0 4,808 0 0 0 0 031888 FY14 Paratransit Vans
109 0 0 0 0 0 0 0 0 031891 Brady Mobility Mandate
781 736 737 736 735 0 0 0 0 031893 Upgr Aging Equipment FY10-FY14
0 0 0 0 0 414 415 414 414 41431894 Upgr Aging Equipment FY15-FY19
0 0 0 181 1,345 634 0 0 0 031896 ESOS FY11-FY13
0 0 0 0 0 0 1,636 4,698 1,636 031897 ESOS FY14-FY16
0 0 0 0 0 0 0 0 0 30731898 ESOS FY17-FY19
150 150 150 150 150 150 150 150 150 15031918 Service Vehicles for Police
25 25 0 0 0 0 0 0 0 031920 HQ Annex Improvement
815 0 0 0 0 0 0 0 0 031926 CQ312 Configuration Management
1,200 3,500 3,500 5,100 4,500 4,500 4,500 0 0 031927 Elevator Rehabilitation
0 0 0 0 0 0 0 1,882 5,383 8,22831928 Fasteners at Curves & Spirals
0 0 0 0 0 0 0 0 2,768 7,03631929 Run Rails at Curves & Spirals
0 0 0 0 0 0 0 0 620 1,57631930 Cross Ties at Curves & Spirals
11 50 265 174 0 0 0 0 0 031932 ATC - Wayside - Signals
0 0 183 742 2,107 2,387 2,393 588 0 031933 Loops/Interlocking Ph 3
0 0 0 0 0 0 750 1,912 1,912 1,20031934 Repl. Impedance Bonds Ph 2
421
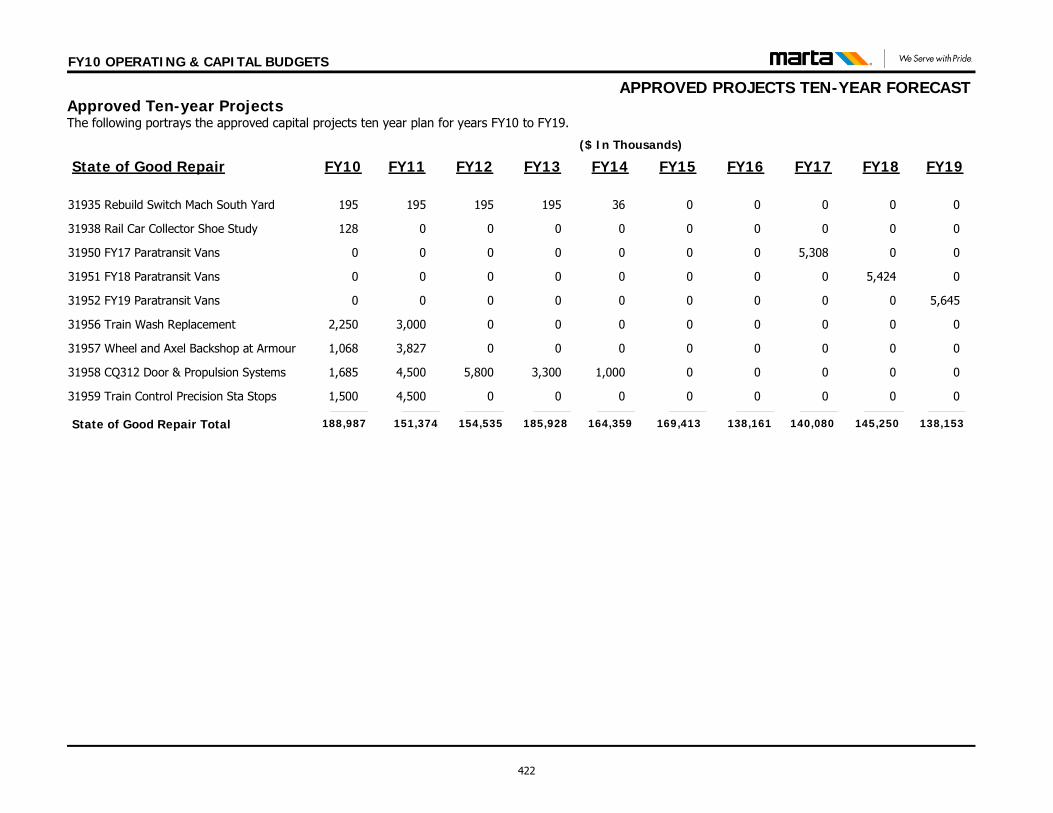
APPROVED PROJECTS TEN-YEAR FORECAST
($ In Thousands)
FY10 OPERATING & CAPITAL BUDGETS
Approved Ten-year Projects The following portrays the approved capital projects ten year plan for years FY10 to FY19.
FY10 FY11 FY12 FY13 FY14 FY15 FY16 FY17 FY18 FY19State of Good Repair
195 195 195 195 36 0 0 0 0 031935 Rebuild Switch Mach South Yard
128 0 0 0 0 0 0 0 0 031938 Rail Car Collector Shoe Study
0 0 0 0 0 0 0 5,308 0 031950 FY17 Paratransit Vans
0 0 0 0 0 0 0 0 5,424 031951 FY18 Paratransit Vans
0 0 0 0 0 0 0 0 0 5,64531952 FY19 Paratransit Vans
2,250 3,000 0 0 0 0 0 0 0 031956 Train Wash Replacement
1,068 3,827 0 0 0 0 0 0 0 031957 Wheel and Axel Backshop at Armour
1,685 4,500 5,800 3,300 1,000 0 0 0 0 031958 CQ312 Door & Propulsion Systems
1,500 4,500 0 0 0 0 0 0 0 031959 Train Control Precision Sta Stops
151,374 154,535 185,928 164,359State of Good Repair Total 188,987 138,161 140,080 145,250 138,153169,413
422
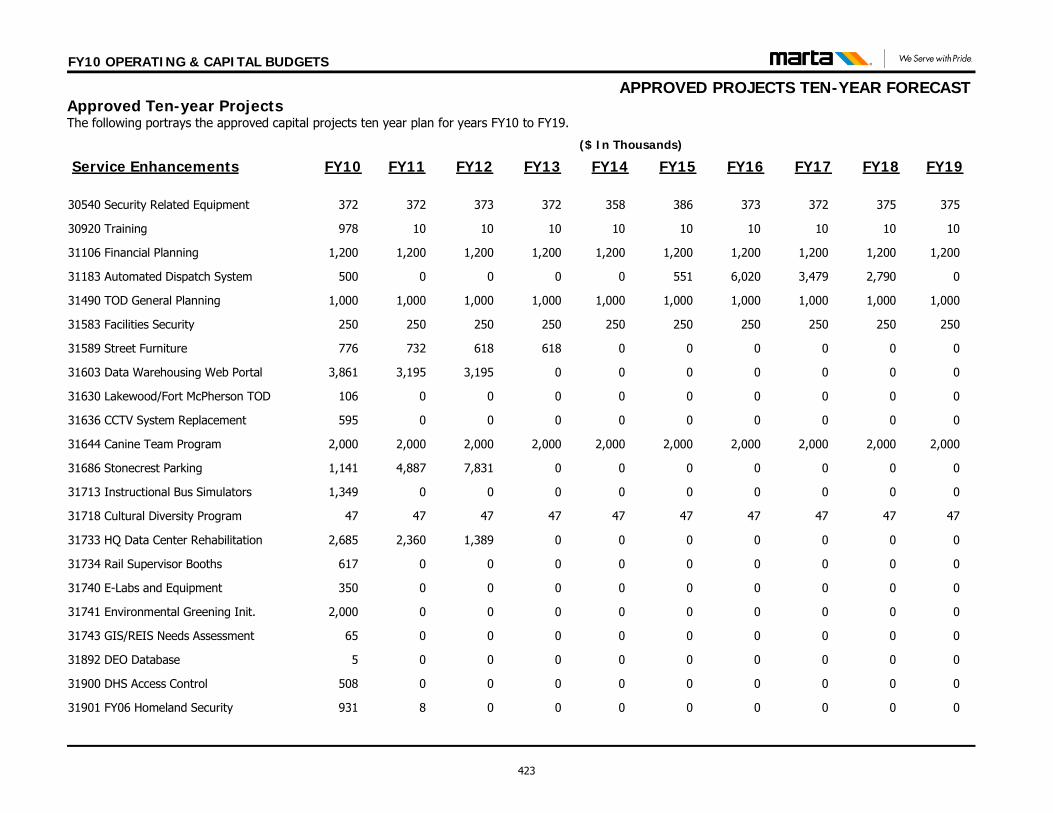
APPROVED PROJECTS TEN-YEAR FORECAST
($ In Thousands)
FY10 OPERATING & CAPITAL BUDGETS
Approved Ten-year Projects The following portrays the approved capital projects ten year plan for years FY10 to FY19.
FY10 FY11 FY12 FY13 FY14 FY15 FY16 FY17 FY18 FY19Service Enhancements
372 372 373 372 358 386 373 372 375 37530540 Security Related Equipment
978 10 10 10 10 10 10 10 10 1030920 Training
1,200 1,200 1,200 1,200 1,200 1,200 1,200 1,200 1,200 1,20031106 Financial Planning
500 0 0 0 0 551 6,020 3,479 2,790 031183 Automated Dispatch System
1,000 1,000 1,000 1,000 1,000 1,000 1,000 1,000 1,000 1,00031490 TOD General Planning
250 250 250 250 250 250 250 250 250 25031583 Facilities Security
776 732 618 618 0 0 0 0 0 031589 Street Furniture
3,861 3,195 3,195 0 0 0 0 0 0 031603 Data Warehousing Web Portal
106 0 0 0 0 0 0 0 0 031630 Lakewood/Fort McPherson TOD
595 0 0 0 0 0 0 0 0 031636 CCTV System Replacement
2,000 2,000 2,000 2,000 2,000 2,000 2,000 2,000 2,000 2,00031644 Canine Team Program
1,141 4,887 7,831 0 0 0 0 0 0 031686 Stonecrest Parking
1,349 0 0 0 0 0 0 0 0 031713 Instructional Bus Simulators
47 47 47 47 47 47 47 47 47 4731718 Cultural Diversity Program
2,685 2,360 1,389 0 0 0 0 0 0 031733 HQ Data Center Rehabilitation
617 0 0 0 0 0 0 0 0 031734 Rail Supervisor Booths
350 0 0 0 0 0 0 0 0 031740 E-Labs and Equipment
2,000 0 0 0 0 0 0 0 0 031741 Environmental Greening Init.
65 0 0 0 0 0 0 0 0 031743 GIS/REIS Needs Assessment
5 0 0 0 0 0 0 0 0 031892 DEO Database
508 0 0 0 0 0 0 0 0 031900 DHS Access Control
931 8 0 0 0 0 0 0 0 031901 FY06 Homeland Security
423
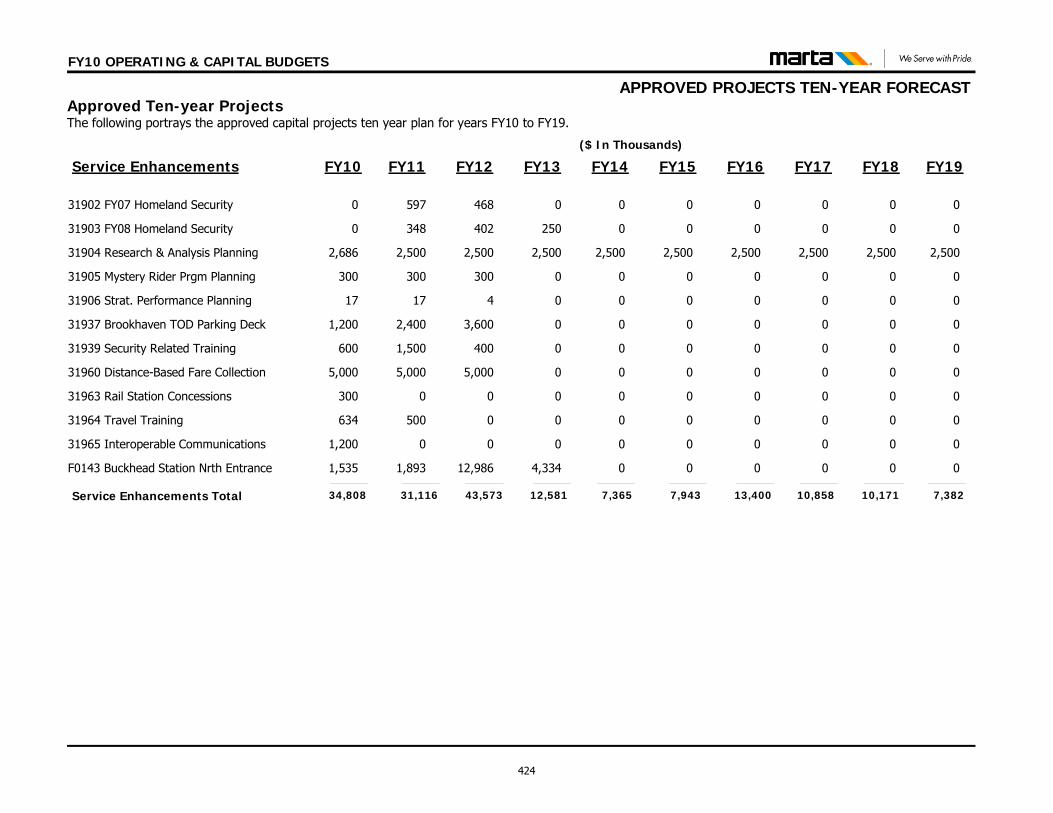
APPROVED PROJECTS TEN-YEAR FORECAST
($ In Thousands)
FY10 OPERATING & CAPITAL BUDGETS
Approved Ten-year Projects The following portrays the approved capital projects ten year plan for years FY10 to FY19.
FY10 FY11 FY12 FY13 FY14 FY15 FY16 FY17 FY18 FY19Service Enhancements
0 597 468 0 0 0 0 0 0 031902 FY07 Homeland Security
0 348 402 250 0 0 0 0 0 031903 FY08 Homeland Security
2,686 2,500 2,500 2,500 2,500 2,500 2,500 2,500 2,500 2,50031904 Research & Analysis Planning
300 300 300 0 0 0 0 0 0 031905 Mystery Rider Prgm Planning
17 17 4 0 0 0 0 0 0 031906 Strat. Performance Planning
1,200 2,400 3,600 0 0 0 0 0 0 031937 Brookhaven TOD Parking Deck
600 1,500 400 0 0 0 0 0 0 031939 Security Related Training
5,000 5,000 5,000 0 0 0 0 0 0 031960 Distance-Based Fare Collection
300 0 0 0 0 0 0 0 0 031963 Rail Station Concessions
634 500 0 0 0 0 0 0 0 031964 Travel Training
1,200 0 0 0 0 0 0 0 0 031965 Interoperable Communications
1,535 1,893 12,986 4,334 0 0 0 0 0 0F0143 Buckhead Station Nrth Entrance
31,116 43,573 12,581 7,365Service Enhancements Total 34,808 13,400 10,858 10,171 7,3827,943
424
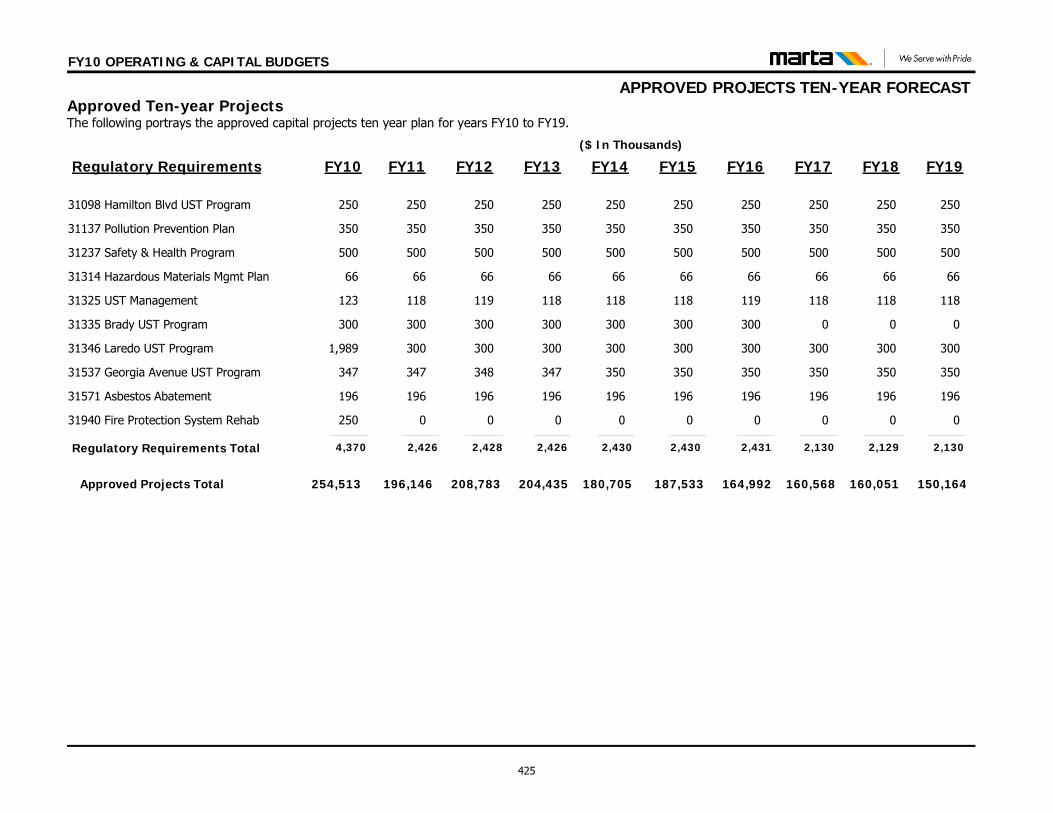
APPROVED PROJECTS TEN-YEAR FORECAST
($ In Thousands)
FY10 OPERATING & CAPITAL BUDGETS
Approved Ten-year Projects The following portrays the approved capital projects ten year plan for years FY10 to FY19.
FY10 FY11 FY12 FY13 FY14 FY15 FY16 FY17 FY18 FY19Regulatory Requirements
250 250 250 250 250 250 250 250 250 25031098 Hamilton Blvd UST Program
350 350 350 350 350 350 350 350 350 35031137 Pollution Prevention Plan
500 500 500 500 500 500 500 500 500 50031237 Safety & Health Program
66 66 66 66 66 66 66 66 66 6631314 Hazardous Materials Mgmt Plan
123 118 119 118 118 118 119 118 118 11831325 UST Management
300 300 300 300 300 300 300 0 0 031335 Brady UST Program
1,989 300 300 300 300 300 300 300 300 30031346 Laredo UST Program
347 347 348 347 350 350 350 350 350 35031537 Georgia Avenue UST Program
196 196 196 196 196 196 196 196 196 19631571 Asbestos Abatement
250 0 0 0 0 0 0 0 0 031940 Fire Protection System Rehab
2,426 2,428 2,426 2,430Regulatory Requirements Total 4,370 2,431 2,130 2,129 2,1302,430
Approved Projects Total 254,513 196,146 208,783 204,435 180,705 187,533 164,992 160,568 160,051 150,164
425
FY10 OPERATING & CAPITAL BUDGETS
APPROVED PROJECT DETAIL Approved Project Detail The following report provides details for FY10 approved projects. The data displays cost, scope, and the operating impacts of the projects.
426
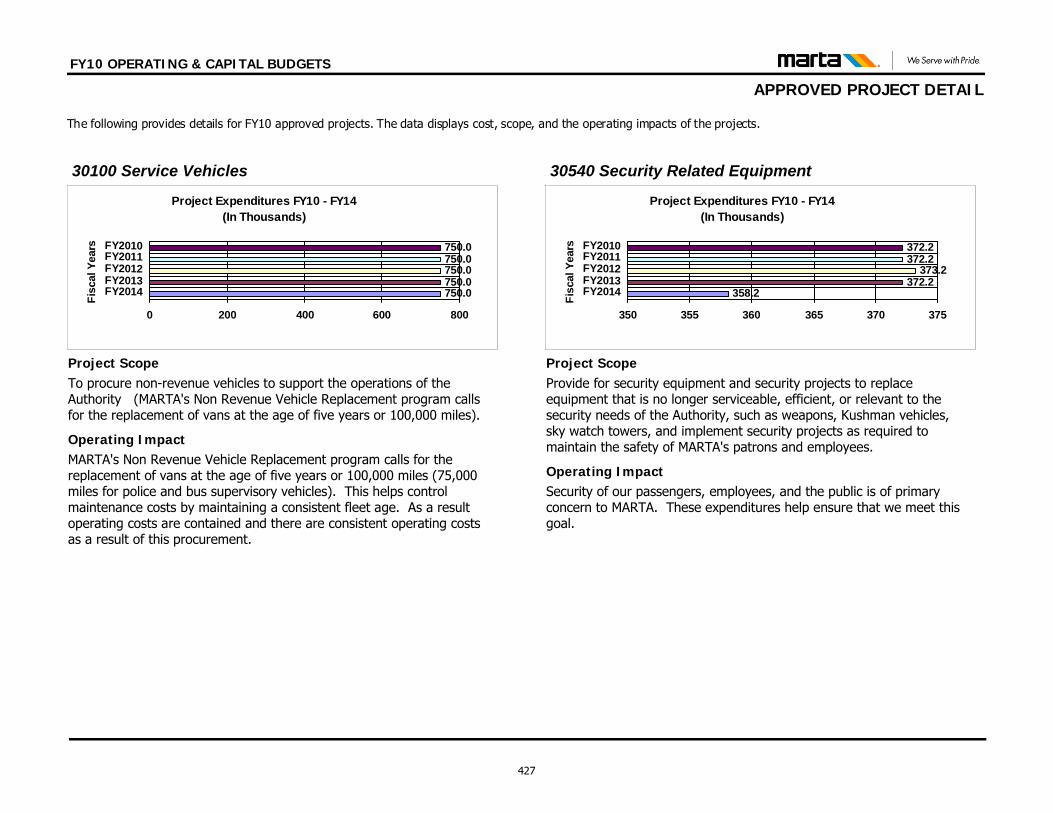
FY10 OPERATING & CAPITAL BUDGETS
APPROVED PROJECT DETAIL The following provides details for FY10 approved projects. The data displays cost, scope, and the operating impacts of the projects.
MARTA's Non Revenue Vehicle Replacement program calls for the replacement of vans at the age of five years or 100,000 miles (75,000 miles for police and bus supervisory vehicles). This helps control maintenance costs by maintaining a consistent fleet age. As a result operating costs are contained and there are consistent operating costs as a result of this procurement.
Operating Impact
Project ScopeTo procure non-revenue vehicles to support the operations of the Authority (MARTA's Non Revenue Vehicle Replacement program calls for the replacement of vans at the age of five years or 100,000 miles).
Project Expenditures FY10 - FY14(In Thousands)
750.0750.0750.0750.0750.0
0 200 400 600 800
FY2014FY2013FY2012FY2011FY2010
Fisc
al Y
ears
30100 Service Vehicles
Security of our passengers, employees, and the public is of primary concern to MARTA. These expenditures help ensure that we meet this goal.
Operating Impact
Project ScopeProvide for security equipment and security projects to replace equipment that is no longer serviceable, efficient, or relevant to the security needs of the Authority, such as weapons, Kushman vehicles, sky watch towers, and implement security projects as required to maintain the safety of MARTA's patrons and employees.
Project Expenditures FY10 - FY14(In Thousands)
358.2372.2
373.2372.2372.2
350 355 360 365 370 375
FY2014FY2013FY2012FY2011FY2010
Fisc
al Y
ears
30540 Security Related Equipment
427
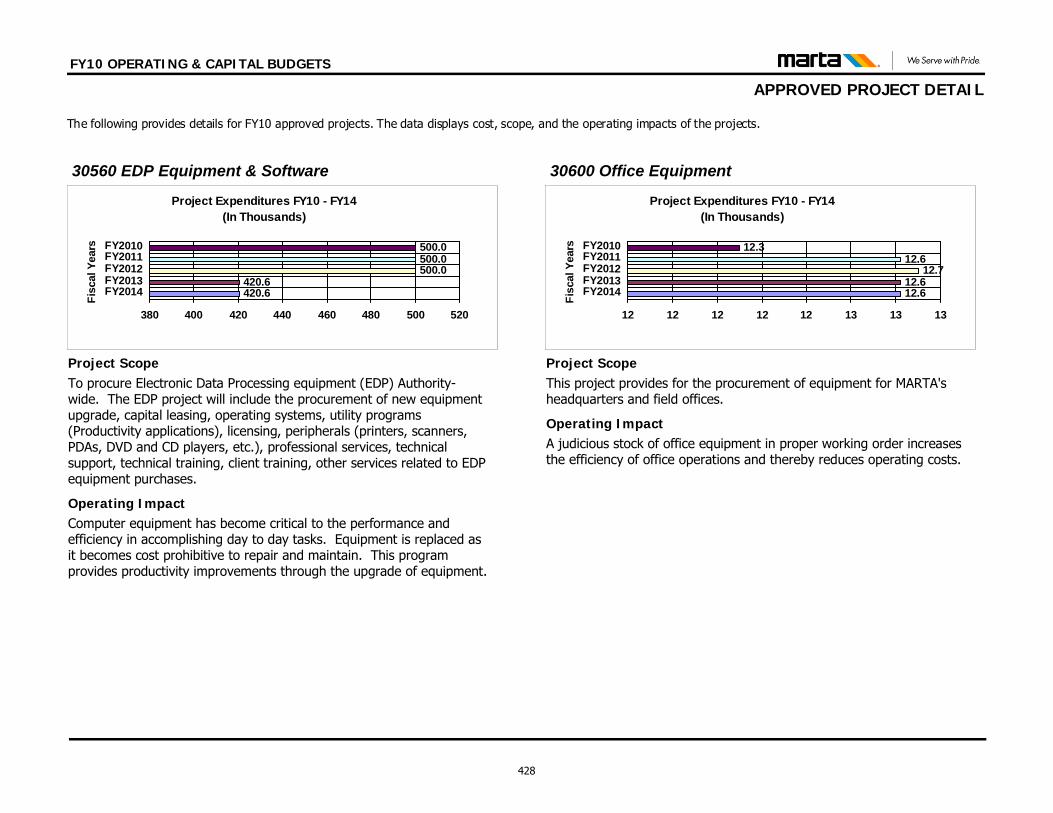
FY10 OPERATING & CAPITAL BUDGETS
APPROVED PROJECT DETAIL The following provides details for FY10 approved projects. The data displays cost, scope, and the operating impacts of the projects.
Computer equipment has become critical to the performance and efficiency in accomplishing day to day tasks. Equipment is replaced as it becomes cost prohibitive to repair and maintain. This program provides productivity improvements through the upgrade of equipment.
Operating Impact
Project ScopeTo procure Electronic Data Processing equipment (EDP) Authority-wide. The EDP project will include the procurement of new equipment upgrade, capital leasing, operating systems, utility programs (Productivity applications), licensing, peripherals (printers, scanners, PDAs, DVD and CD players, etc.), professional services, technical support, technical training, client training, other services related to EDP equipment purchases.
Project Expenditures FY10 - FY14(In Thousands)
420.6420.6
500.0500.0500.0
380 400 420 440 460 480 500 520
FY2014FY2013FY2012FY2011FY2010
Fisc
al Y
ears
30560 EDP Equipment & Software
A judicious stock of office equipment in proper working order increases the efficiency of office operations and thereby reduces operating costs.
Operating Impact
Project ScopeThis project provides for the procurement of equipment for MARTA's headquarters and field offices.
Project Expenditures FY10 - FY14(In Thousands)
12.612.6
12.712.6
12.3
12 12 12 12 12 13 13 13
FY2014FY2013FY2012FY2011FY2010
Fisc
al Y
ears
30600 Office Equipment
428
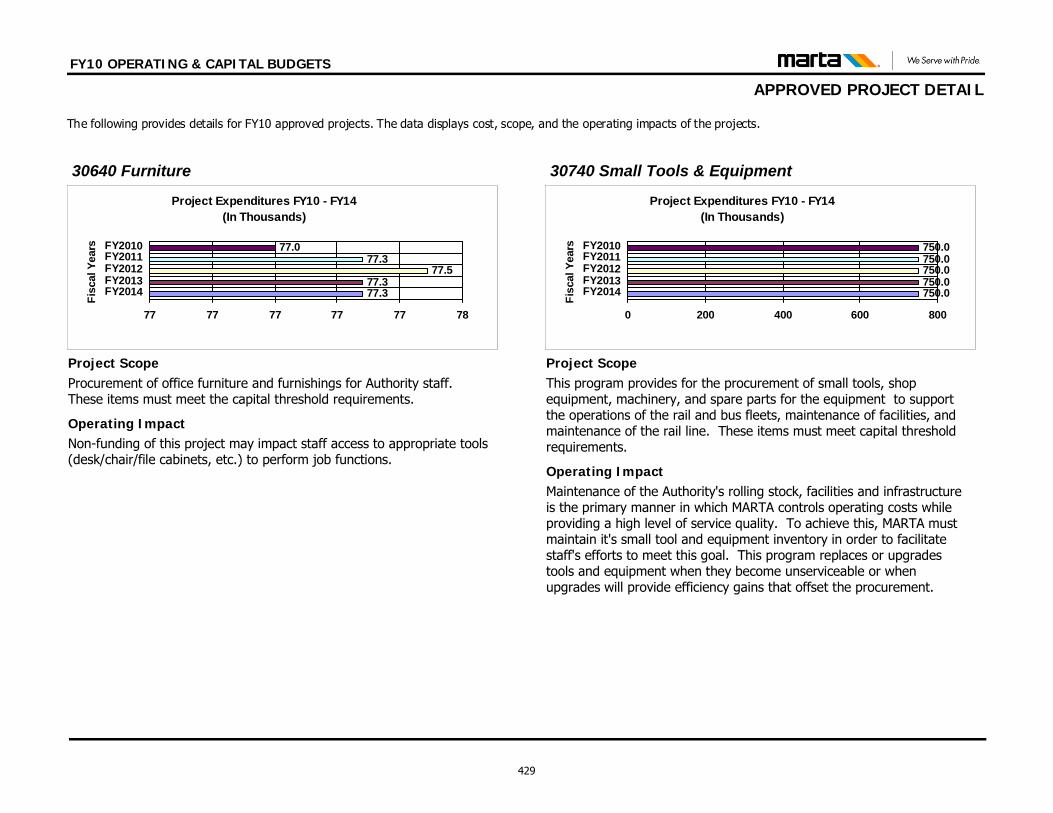
FY10 OPERATING & CAPITAL BUDGETS
APPROVED PROJECT DETAIL The following provides details for FY10 approved projects. The data displays cost, scope, and the operating impacts of the projects.
Non-funding of this project may impact staff access to appropriate tools (desk/chair/file cabinets, etc.) to perform job functions.
Operating Impact
Project ScopeProcurement of office furniture and furnishings for Authority staff. These items must meet the capital threshold requirements.
Project Expenditures FY10 - FY14(In Thousands)
77.377.3
77.577.3
77.0
77 77 77 77 77 78
FY2014FY2013FY2012FY2011FY2010
Fisc
al Y
ears
30640 Furniture
Maintenance of the Authority's rolling stock, facilities and infrastructure is the primary manner in which MARTA controls operating costs while providing a high level of service quality. To achieve this, MARTA must maintain it's small tool and equipment inventory in order to facilitate staff's efforts to meet this goal. This program replaces or upgrades tools and equipment when they become unserviceable or when upgrades will provide efficiency gains that offset the procurement.
Operating Impact
Project ScopeThis program provides for the procurement of small tools, shop equipment, machinery, and spare parts for the equipment to support the operations of the rail and bus fleets, maintenance of facilities, and maintenance of the rail line. These items must meet capital threshold requirements.
Project Expenditures FY10 - FY14(In Thousands)
750.0750.0750.0750.0750.0
0 200 400 600 800
FY2014FY2013FY2012FY2011FY2010
Fisc
al Y
ears
30740 Small Tools & Equipment
429
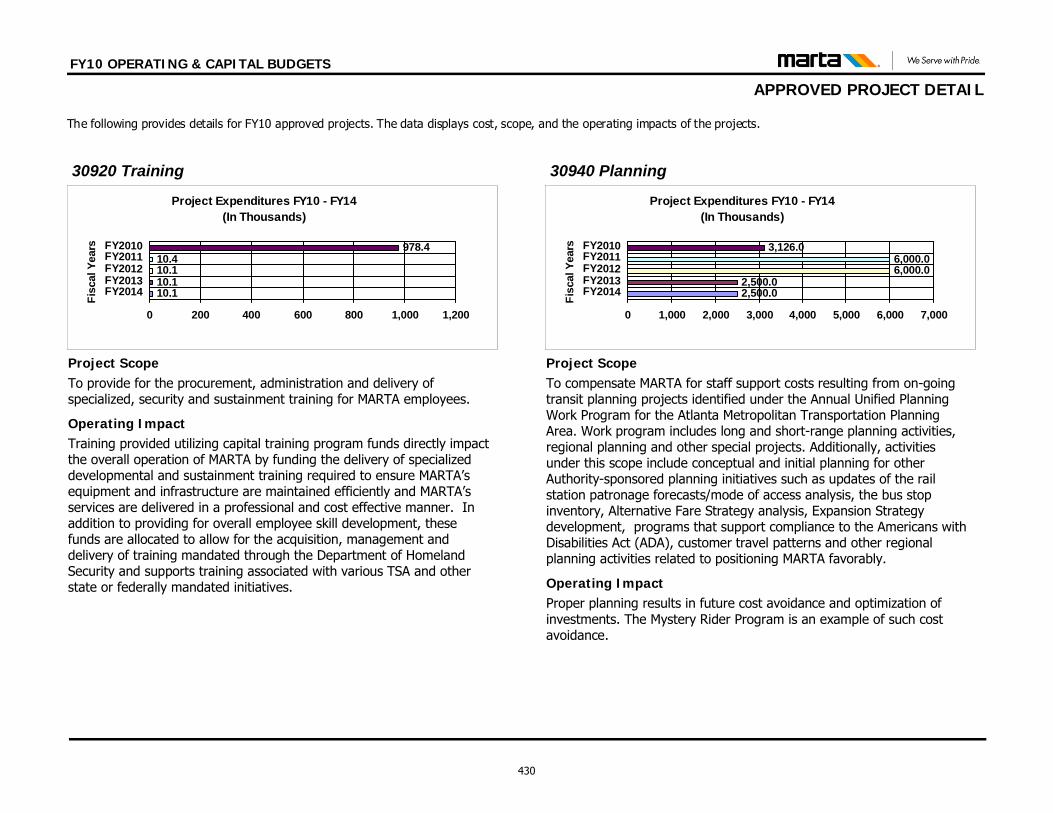
FY10 OPERATING & CAPITAL BUDGETS
APPROVED PROJECT DETAIL The following provides details for FY10 approved projects. The data displays cost, scope, and the operating impacts of the projects.
Training provided utilizing capital training program funds directly impact the overall operation of MARTA by funding the delivery of specialized developmental and sustainment training required to ensure MARTA’s equipment and infrastructure are maintained efficiently and MARTA’s services are delivered in a professional and cost effective manner. In addition to providing for overall employee skill development, these funds are allocated to allow for the acquisition, management and delivery of training mandated through the Department of Homeland Security and supports training associated with various TSA and other state or federally mandated initiatives.
Operating Impact
Project ScopeTo provide for the procurement, administration and delivery of specialized, security and sustainment training for MARTA employees.
Project Expenditures FY10 - FY14(In Thousands)
10.110.110.110.4
978.4
0 200 400 600 800 1,000 1,200
FY2014FY2013FY2012FY2011FY2010
Fisc
al Y
ears
30920 Training
Proper planning results in future cost avoidance and optimization of investments. The Mystery Rider Program is an example of such cost avoidance.
Operating Impact
Project ScopeTo compensate MARTA for staff support costs resulting from on-going transit planning projects identified under the Annual Unified Planning Work Program for the Atlanta Metropolitan Transportation Planning Area. Work program includes long and short-range planning activities, regional planning and other special projects. Additionally, activities under this scope include conceptual and initial planning for other Authority-sponsored planning initiatives such as updates of the rail station patronage forecasts/mode of access analysis, the bus stop inventory, Alternative Fare Strategy analysis, Expansion Strategy development, programs that support compliance to the Americans with Disabilities Act (ADA), customer travel patterns and other regional planning activities related to positioning MARTA favorably.
Project Expenditures FY10 - FY14(In Thousands)
2,500.02,500.0
6,000.06,000.0
3,126.0
0 1,000 2,000 3,000 4,000 5,000 6,000 7,000
FY2014FY2013FY2012FY2011FY2010
Fisc
al Y
ears
30940 Planning
430
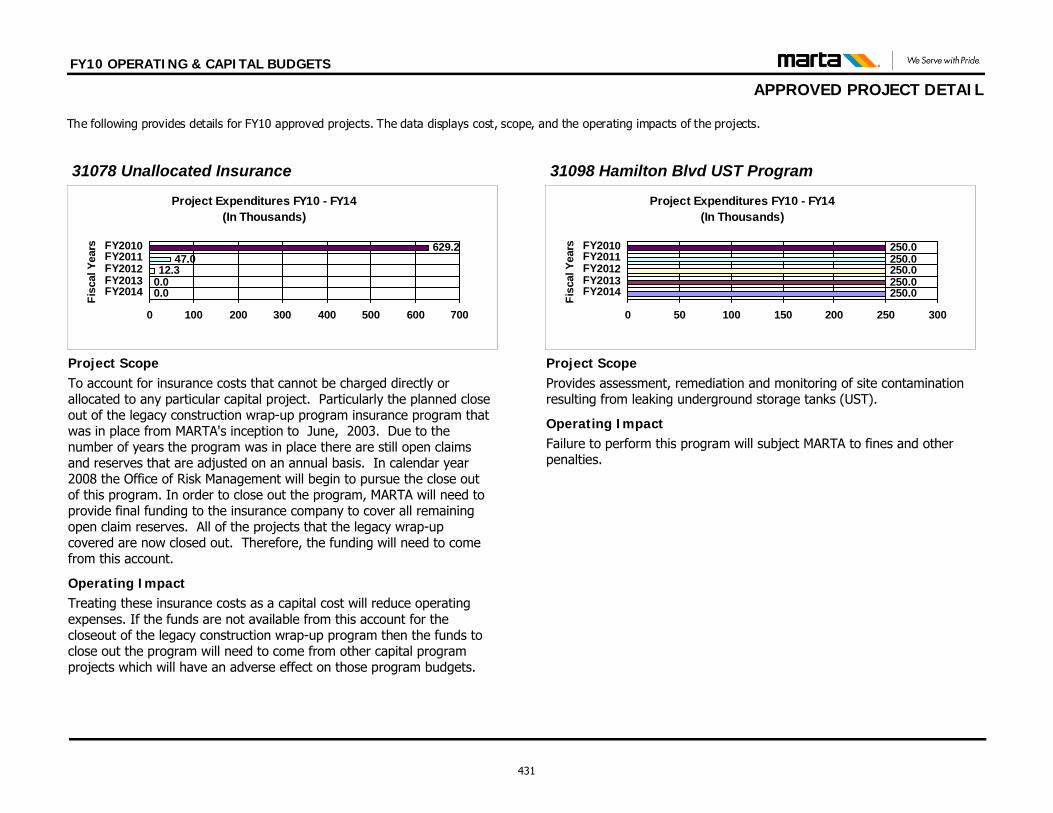
FY10 OPERATING & CAPITAL BUDGETS
APPROVED PROJECT DETAIL The following provides details for FY10 approved projects. The data displays cost, scope, and the operating impacts of the projects.
Treating these insurance costs as a capital cost will reduce operating expenses. If the funds are not available from this account for the closeout of the legacy construction wrap-up program then the funds to close out the program will need to come from other capital program projects which will have an adverse effect on those program budgets.
Operating Impact
Project ScopeTo account for insurance costs that cannot be charged directly or allocated to any particular capital project. Particularly the planned close out of the legacy construction wrap-up program insurance program that was in place from MARTA's inception to June, 2003. Due to the number of years the program was in place there are still open claims and reserves that are adjusted on an annual basis. In calendar year 2008 the Office of Risk Management will begin to pursue the close out of this program. In order to close out the program, MARTA will need to provide final funding to the insurance company to cover all remaining open claim reserves. All of the projects that the legacy wrap-up covered are now closed out. Therefore, the funding will need to come from this account.
Project Expenditures FY10 - FY14(In Thousands)
0.00.012.3
47.0629.2
0 100 200 300 400 500 600 700
FY2014FY2013FY2012FY2011FY2010
Fisc
al Y
ears
31078 Unallocated Insurance
Failure to perform this program will subject MARTA to fines and other penalties.
Operating Impact
Project ScopeProvides assessment, remediation and monitoring of site contamination resulting from leaking underground storage tanks (UST).
Project Expenditures FY10 - FY14(In Thousands)
250.0250.0250.0250.0250.0
0 50 100 150 200 250 300
FY2014FY2013FY2012FY2011FY2010
Fisc
al Y
ears
31098 Hamilton Blvd UST Program
431
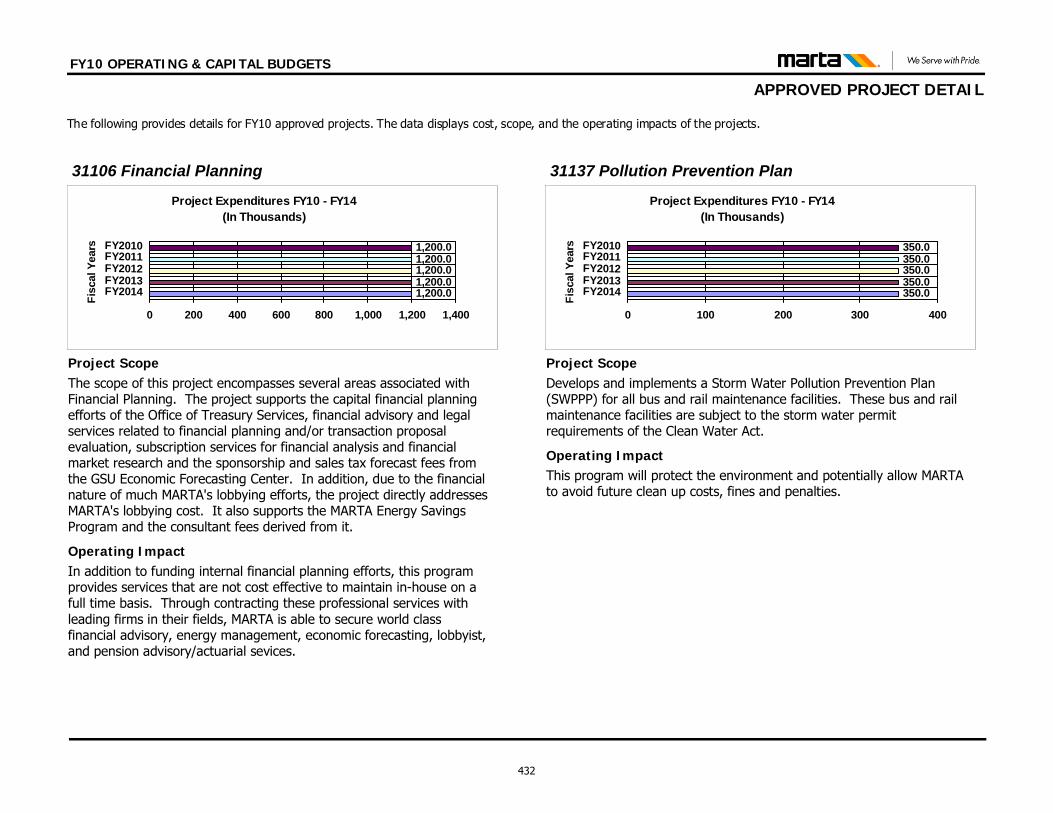
FY10 OPERATING & CAPITAL BUDGETS
APPROVED PROJECT DETAIL The following provides details for FY10 approved projects. The data displays cost, scope, and the operating impacts of the projects.
In addition to funding internal financial planning efforts, this program provides services that are not cost effective to maintain in-house on a full time basis. Through contracting these professional services with leading firms in their fields, MARTA is able to secure world class financial advisory, energy management, economic forecasting, lobbyist, and pension advisory/actuarial sevices.
Operating Impact
Project ScopeThe scope of this project encompasses several areas associated with Financial Planning. The project supports the capital financial planning efforts of the Office of Treasury Services, financial advisory and legal services related to financial planning and/or transaction proposal evaluation, subscription services for financial analysis and financial market research and the sponsorship and sales tax forecast fees from the GSU Economic Forecasting Center. In addition, due to the financial nature of much MARTA's lobbying efforts, the project directly addresses MARTA's lobbying cost. It also supports the MARTA Energy Savings Program and the consultant fees derived from it.
Project Expenditures FY10 - FY14(In Thousands)
1,200.01,200.01,200.01,200.01,200.0
0 200 400 600 800 1,000 1,200 1,400
FY2014FY2013FY2012FY2011FY2010
Fisc
al Y
ears
31106 Financial Planning
This program will protect the environment and potentially allow MARTA to avoid future clean up costs, fines and penalties.
Operating Impact
Project ScopeDevelops and implements a Storm Water Pollution Prevention Plan (SWPPP) for all bus and rail maintenance facilities. These bus and rail maintenance facilities are subject to the storm water permit requirements of the Clean Water Act.
Project Expenditures FY10 - FY14(In Thousands)
350.0350.0350.0350.0350.0
0 100 200 300 400
FY2014FY2013FY2012FY2011FY2010
Fisc
al Y
ears
31137 Pollution Prevention Plan
432
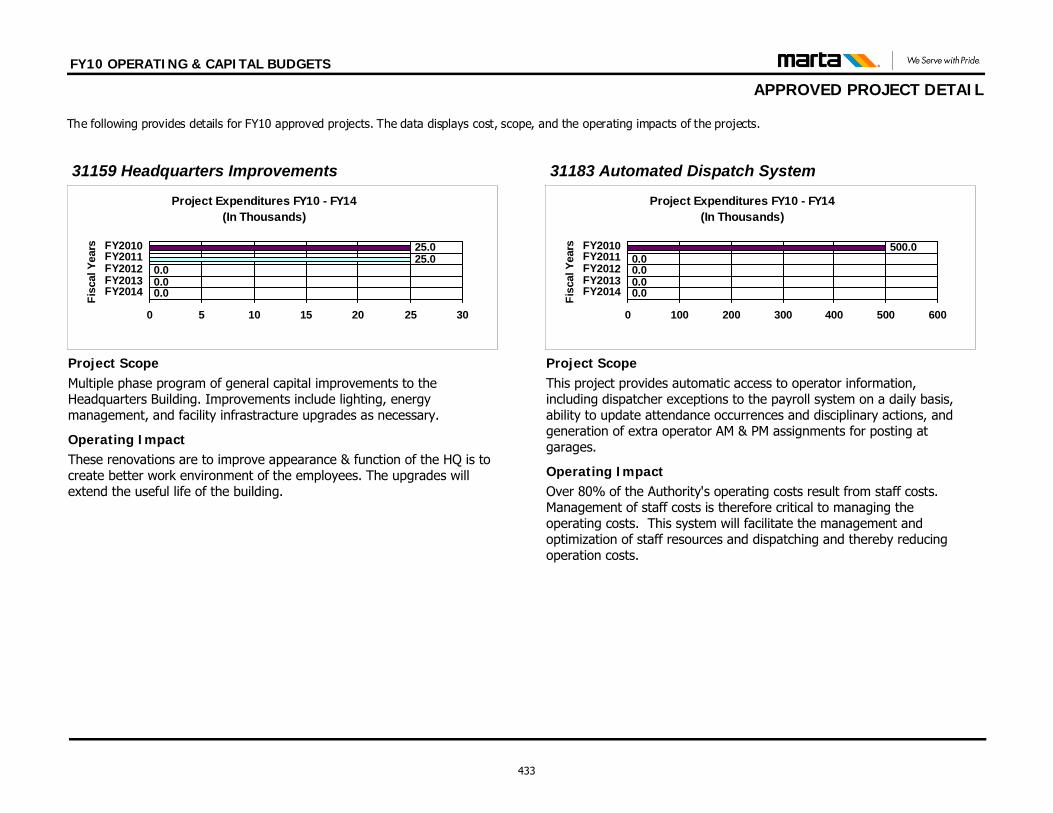
FY10 OPERATING & CAPITAL BUDGETS
APPROVED PROJECT DETAIL The following provides details for FY10 approved projects. The data displays cost, scope, and the operating impacts of the projects.
These renovations are to improve appearance & function of the HQ is to create better work environment of the employees. The upgrades will extend the useful life of the building.
Operating Impact
Project ScopeMultiple phase program of general capital improvements to the Headquarters Building. Improvements include lighting, energy management, and facility infrastracture upgrades as necessary.
Project Expenditures FY10 - FY14(In Thousands)
0.00.00.0
25.025.0
0 5 10 15 20 25 30
FY2014FY2013FY2012FY2011FY2010
Fisc
al Y
ears
31159 Headquarters Improvements
Over 80% of the Authority's operating costs result from staff costs. Management of staff costs is therefore critical to managing the operating costs. This system will facilitate the management and optimization of staff resources and dispatching and thereby reducing operation costs.
Operating Impact
Project ScopeThis project provides automatic access to operator information, including dispatcher exceptions to the payroll system on a daily basis, ability to update attendance occurrences and disciplinary actions, and generation of extra operator AM & PM assignments for posting at garages.
Project Expenditures FY10 - FY14(In Thousands)
0.00.00.00.0
500.0
0 100 200 300 400 500 600
FY2014FY2013FY2012FY2011FY2010
Fisc
al Y
ears
31183 Automated Dispatch System
433
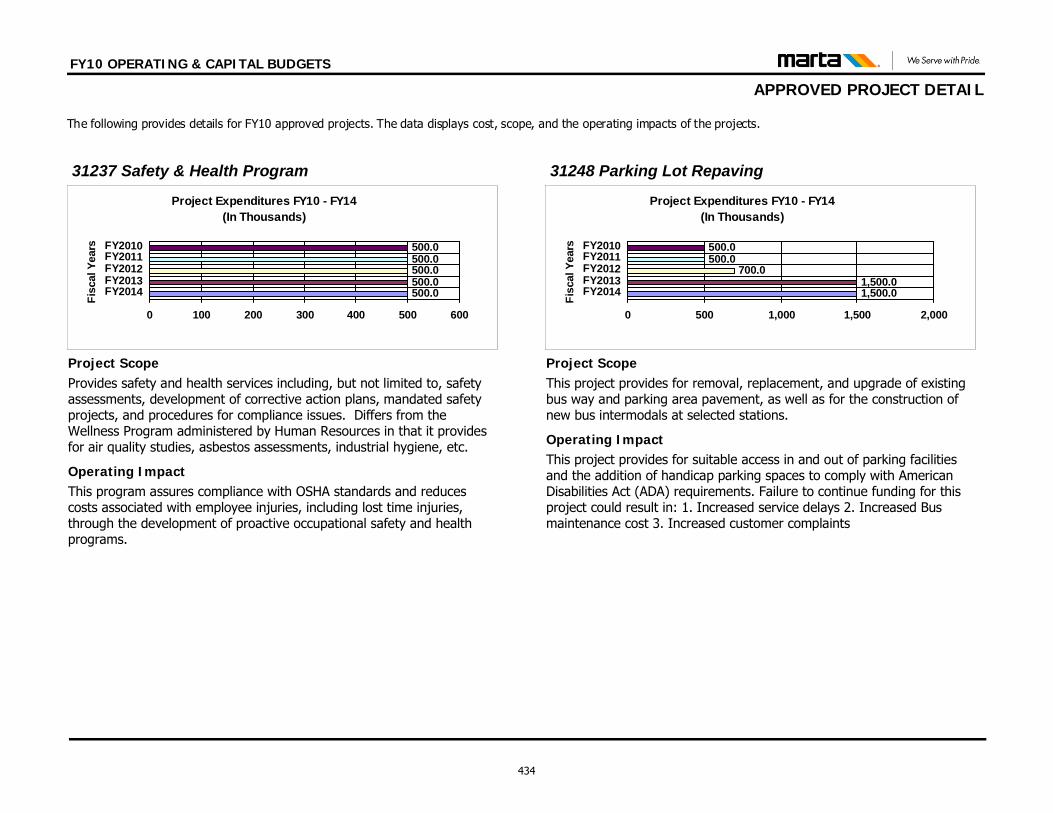
FY10 OPERATING & CAPITAL BUDGETS
APPROVED PROJECT DETAIL The following provides details for FY10 approved projects. The data displays cost, scope, and the operating impacts of the projects.
This program assures compliance with OSHA standards and reduces costs associated with employee injuries, including lost time injuries, through the development of proactive occupational safety and health programs.
Operating Impact
Project ScopeProvides safety and health services including, but not limited to, safety assessments, development of corrective action plans, mandated safety projects, and procedures for compliance issues. Differs from the Wellness Program administered by Human Resources in that it provides for air quality studies, asbestos assessments, industrial hygiene, etc.
Project Expenditures FY10 - FY14(In Thousands)
500.0500.0500.0500.0500.0
0 100 200 300 400 500 600
FY2014FY2013FY2012FY2011FY2010
Fisc
al Y
ears
31237 Safety & Health Program
This project provides for suitable access in and out of parking facilities and the addition of handicap parking spaces to comply with American Disabilities Act (ADA) requirements. Failure to continue funding for this project could result in: 1. Increased service delays 2. Increased Bus maintenance cost 3. Increased customer complaints
Operating Impact
Project ScopeThis project provides for removal, replacement, and upgrade of existing bus way and parking area pavement, as well as for the construction of new bus intermodals at selected stations.
Project Expenditures FY10 - FY14(In Thousands)
1,500.01,500.0
700.0500.0500.0
0 500 1,000 1,500 2,000
FY2014FY2013FY2012FY2011FY2010
Fisc
al Y
ears
31248 Parking Lot Repaving
434
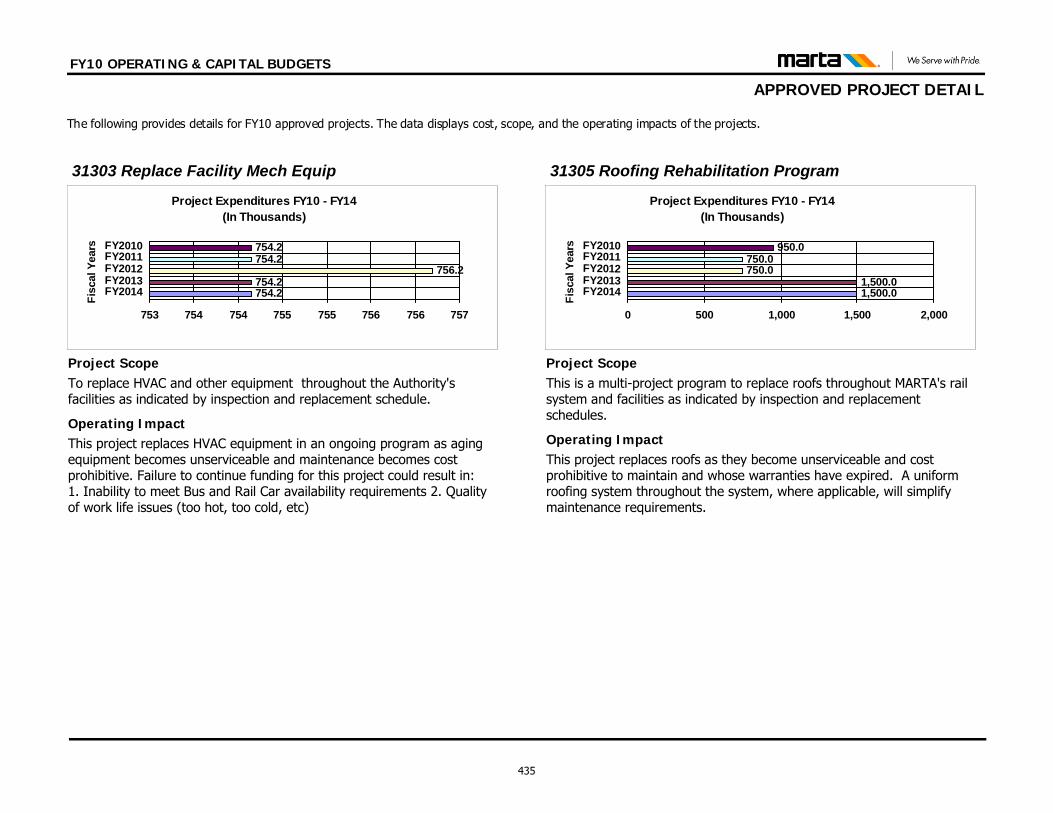
FY10 OPERATING & CAPITAL BUDGETS
APPROVED PROJECT DETAIL The following provides details for FY10 approved projects. The data displays cost, scope, and the operating impacts of the projects.
This project replaces HVAC equipment in an ongoing program as aging equipment becomes unserviceable and maintenance becomes cost prohibitive. Failure to continue funding for this project could result in: 1. Inability to meet Bus and Rail Car availability requirements 2. Quality of work life issues (too hot, too cold, etc)
Operating Impact
Project ScopeTo replace HVAC and other equipment throughout the Authority's facilities as indicated by inspection and replacement schedule.
Project Expenditures FY10 - FY14(In Thousands)
754.2754.2
756.2754.2754.2
753 754 754 755 755 756 756 757
FY2014FY2013FY2012FY2011FY2010
Fisc
al Y
ears
31303 Replace Facility Mech Equip
This project replaces roofs as they become unserviceable and cost prohibitive to maintain and whose warranties have expired. A uniform roofing system throughout the system, where applicable, will simplify maintenance requirements.
Operating Impact
Project ScopeThis is a multi-project program to replace roofs throughout MARTA's rail system and facilities as indicated by inspection and replacement schedules.
Project Expenditures FY10 - FY14(In Thousands)
1,500.01,500.0
750.0750.0
950.0
0 500 1,000 1,500 2,000
FY2014FY2013FY2012FY2011FY2010
Fisc
al Y
ears
31305 Roofing Rehabilitation Program
435
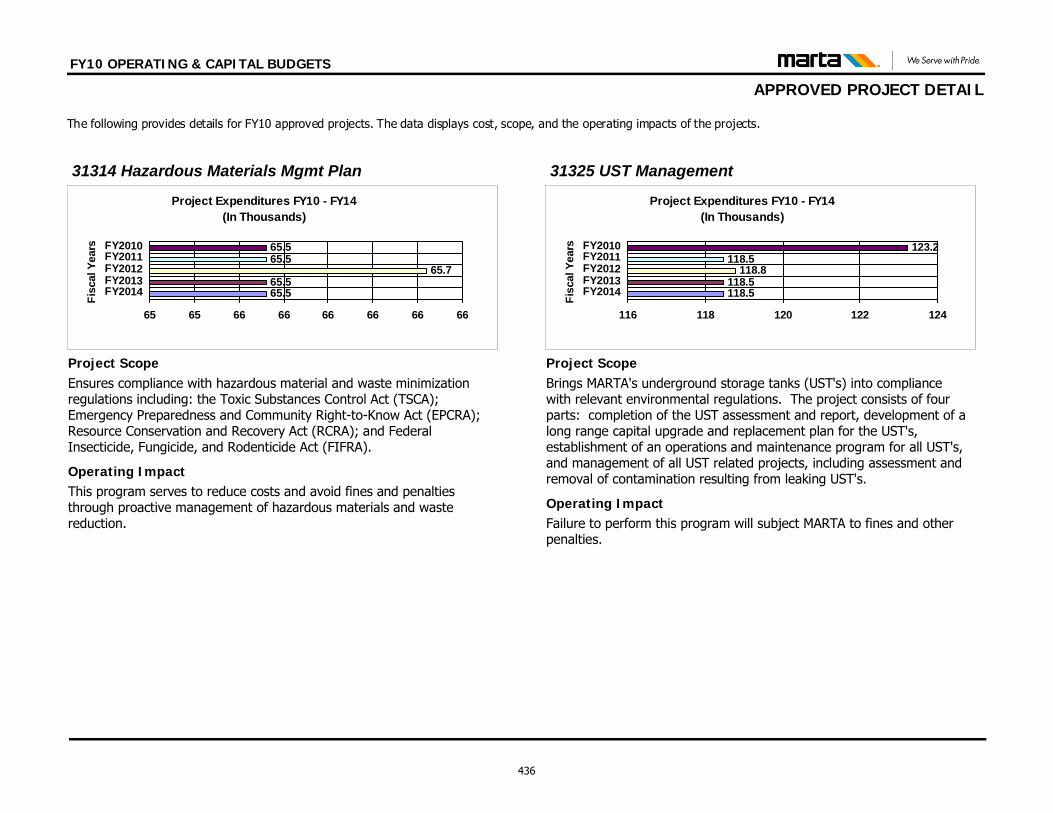
FY10 OPERATING & CAPITAL BUDGETS
APPROVED PROJECT DETAIL The following provides details for FY10 approved projects. The data displays cost, scope, and the operating impacts of the projects.
This program serves to reduce costs and avoid fines and penalties through proactive management of hazardous materials and waste reduction.
Operating Impact
Project ScopeEnsures compliance with hazardous material and waste minimization regulations including: the Toxic Substances Control Act (TSCA); Emergency Preparedness and Community Right-to-Know Act (EPCRA); Resource Conservation and Recovery Act (RCRA); and Federal Insecticide, Fungicide, and Rodenticide Act (FIFRA).
Project Expenditures FY10 - FY14(In Thousands)
65.565.5
65.765.565.5
65 65 66 66 66 66 66 66
FY2014FY2013FY2012FY2011FY2010
Fisc
al Y
ears
31314 Hazardous Materials Mgmt Plan
Failure to perform this program will subject MARTA to fines and other penalties.
Operating Impact
Project ScopeBrings MARTA's underground storage tanks (UST's) into compliance with relevant environmental regulations. The project consists of four parts: completion of the UST assessment and report, development of a long range capital upgrade and replacement plan for the UST's, establishment of an operations and maintenance program for all UST's, and management of all UST related projects, including assessment and removal of contamination resulting from leaking UST's.
Project Expenditures FY10 - FY14(In Thousands)
118.5118.5
118.8118.5
123.2
116 118 120 122 124
FY2014FY2013FY2012FY2011FY2010
Fisc
al Y
ears
31325 UST Management
436
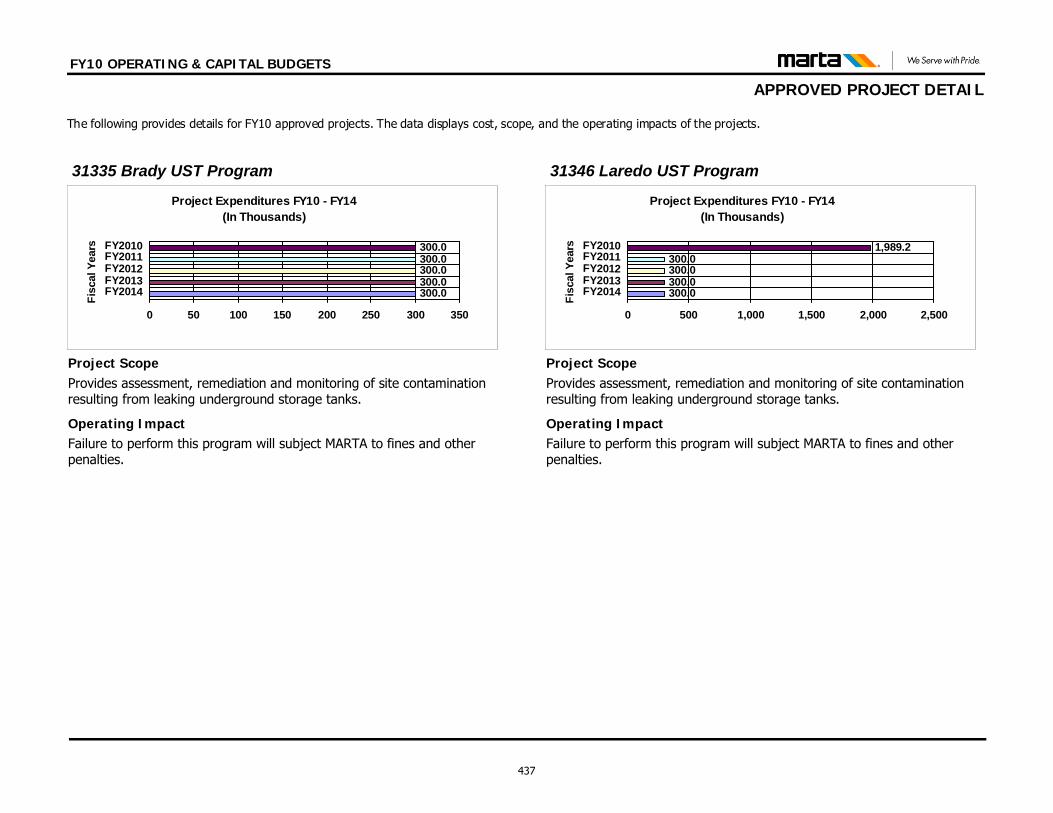
FY10 OPERATING & CAPITAL BUDGETS
APPROVED PROJECT DETAIL The following provides details for FY10 approved projects. The data displays cost, scope, and the operating impacts of the projects.
Failure to perform this program will subject MARTA to fines and other penalties.
Operating Impact
Project ScopeProvides assessment, remediation and monitoring of site contamination resulting from leaking underground storage tanks.
Project Expenditures FY10 - FY14(In Thousands)
300.0300.0300.0300.0300.0
0 50 100 150 200 250 300 350
FY2014FY2013FY2012FY2011FY2010
Fisc
al Y
ears
31335 Brady UST Program
Failure to perform this program will subject MARTA to fines and other penalties.
Operating Impact
Project ScopeProvides assessment, remediation and monitoring of site contamination resulting from leaking underground storage tanks.
Project Expenditures FY10 - FY14(In Thousands)
300.0300.0300.0300.0
1,989.2
0 500 1,000 1,500 2,000 2,500
FY2014FY2013FY2012FY2011FY2010
Fisc
al Y
ears
31346 Laredo UST Program
437
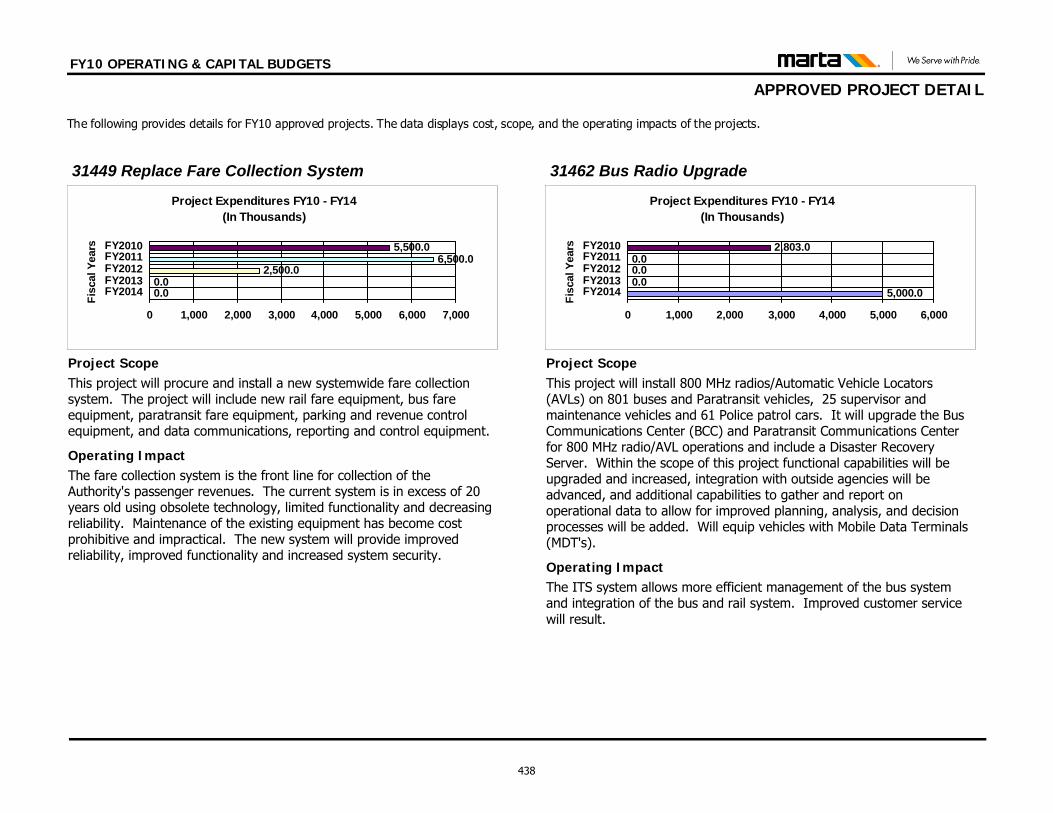
FY10 OPERATING & CAPITAL BUDGETS
APPROVED PROJECT DETAIL The following provides details for FY10 approved projects. The data displays cost, scope, and the operating impacts of the projects.
The fare collection system is the front line for collection of the Authority's passenger revenues. The current system is in excess of 20 years old using obsolete technology, limited functionality and decreasing reliability. Maintenance of the existing equipment has become cost prohibitive and impractical. The new system will provide improved reliability, improved functionality and increased system security.
Operating Impact
Project ScopeThis project will procure and install a new systemwide fare collection system. The project will include new rail fare equipment, bus fare equipment, paratransit fare equipment, parking and revenue control equipment, and data communications, reporting and control equipment.
Project Expenditures FY10 - FY14(In Thousands)
0.00.0
2,500.06,500.0
5,500.0
0 1,000 2,000 3,000 4,000 5,000 6,000 7,000
FY2014FY2013FY2012FY2011FY2010
Fisc
al Y
ears
31449 Replace Fare Collection System
The ITS system allows more efficient management of the bus system and integration of the bus and rail system. Improved customer service will result.
Operating Impact
Project ScopeThis project will install 800 MHz radios/Automatic Vehicle Locators (AVLs) on 801 buses and Paratransit vehicles, 25 supervisor and maintenance vehicles and 61 Police patrol cars. It will upgrade the Bus Communications Center (BCC) and Paratransit Communications Center for 800 MHz radio/AVL operations and include a Disaster Recovery Server. Within the scope of this project functional capabilities will be upgraded and increased, integration with outside agencies will be advanced, and additional capabilities to gather and report on operational data to allow for improved planning, analysis, and decision processes will be added. Will equip vehicles with Mobile Data Terminals (MDT's).
Project Expenditures FY10 - FY14(In Thousands)
5,000.00.00.00.0
2,803.0
0 1,000 2,000 3,000 4,000 5,000 6,000
FY2014FY2013FY2012FY2011FY2010
Fisc
al Y
ears
31462 Bus Radio Upgrade
438
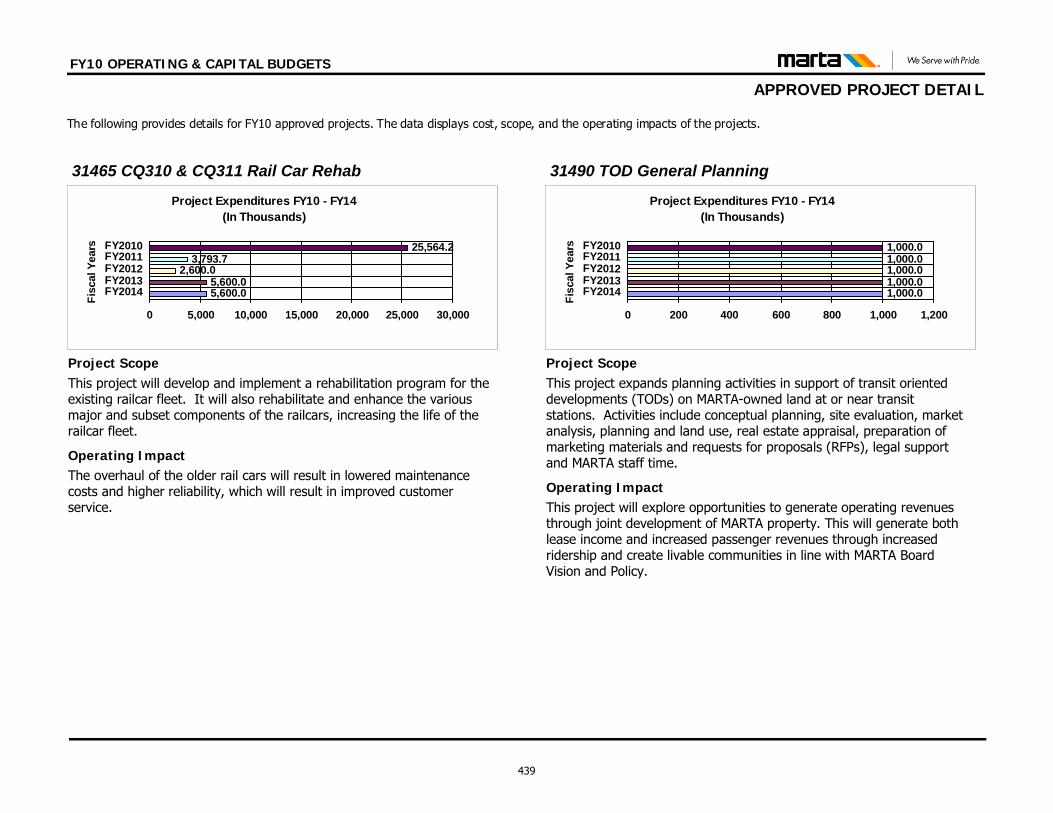
FY10 OPERATING & CAPITAL BUDGETS
APPROVED PROJECT DETAIL The following provides details for FY10 approved projects. The data displays cost, scope, and the operating impacts of the projects.
The overhaul of the older rail cars will result in lowered maintenance costs and higher reliability, which will result in improved customer service.
Operating Impact
Project ScopeThis project will develop and implement a rehabilitation program for the existing railcar fleet. It will also rehabilitate and enhance the various major and subset components of the railcars, increasing the life of the railcar fleet.
Project Expenditures FY10 - FY14(In Thousands)
5,600.05,600.0
2,600.03,793.7
25,564.2
0 5,000 10,000 15,000 20,000 25,000 30,000
FY2014FY2013FY2012FY2011FY2010
Fisc
al Y
ears
31465 CQ310 & CQ311 Rail Car Rehab
This project will explore opportunities to generate operating revenues through joint development of MARTA property. This will generate both lease income and increased passenger revenues through increased ridership and create livable communities in line with MARTA Board Vision and Policy.
Operating Impact
Project ScopeThis project expands planning activities in support of transit oriented developments (TODs) on MARTA-owned land at or near transit stations. Activities include conceptual planning, site evaluation, market analysis, planning and land use, real estate appraisal, preparation of marketing materials and requests for proposals (RFPs), legal support and MARTA staff time.
Project Expenditures FY10 - FY14(In Thousands)
1,000.01,000.01,000.01,000.01,000.0
0 200 400 600 800 1,000 1,200
FY2014FY2013FY2012FY2011FY2010
Fisc
al Y
ears
31490 TOD General Planning
439
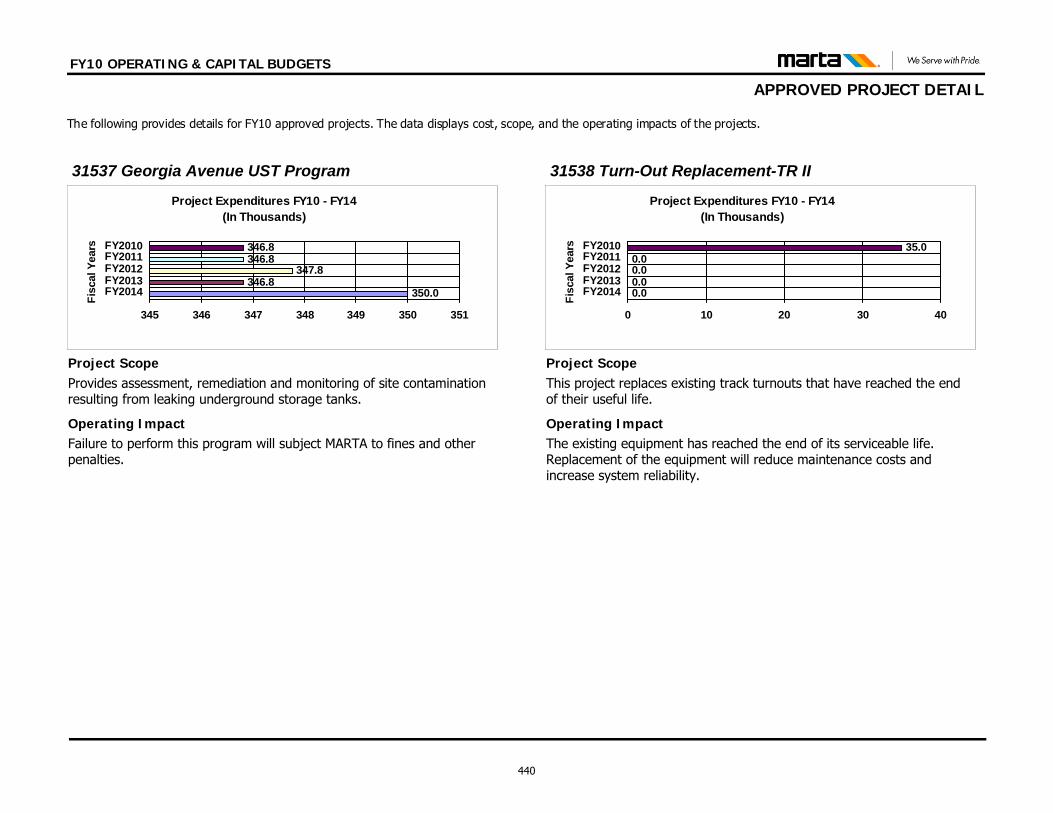
FY10 OPERATING & CAPITAL BUDGETS
APPROVED PROJECT DETAIL The following provides details for FY10 approved projects. The data displays cost, scope, and the operating impacts of the projects.
Failure to perform this program will subject MARTA to fines and other penalties.
Operating Impact
Project ScopeProvides assessment, remediation and monitoring of site contamination resulting from leaking underground storage tanks.
Project Expenditures FY10 - FY14(In Thousands)
350.0346.8
347.8346.8346.8
345 346 347 348 349 350 351
FY2014FY2013FY2012FY2011FY2010
Fisc
al Y
ears
31537 Georgia Avenue UST Program
The existing equipment has reached the end of its serviceable life. Replacement of the equipment will reduce maintenance costs and increase system reliability.
Operating Impact
Project ScopeThis project replaces existing track turnouts that have reached the end of their useful life.
Project Expenditures FY10 - FY14(In Thousands)
0.00.00.00.0
35.0
0 10 20 30 40
FY2014FY2013FY2012FY2011FY2010
Fisc
al Y
ears
31538 Turn-Out Replacement-TR II
440
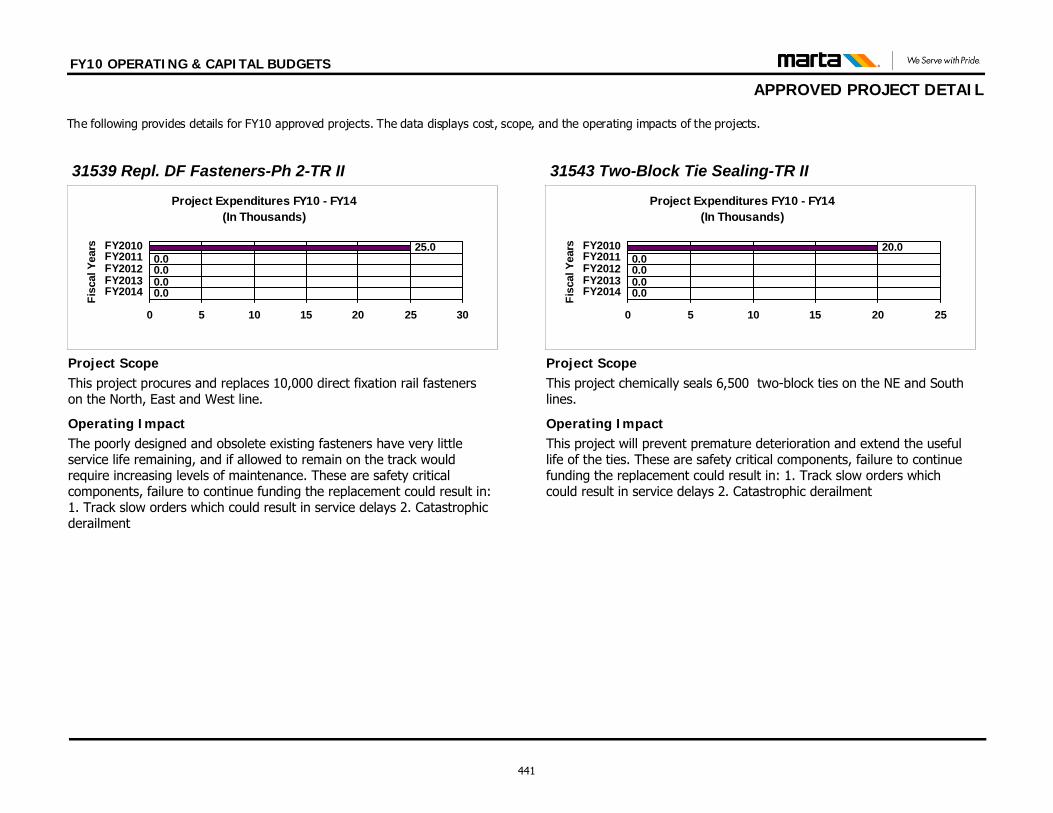
FY10 OPERATING & CAPITAL BUDGETS
APPROVED PROJECT DETAIL The following provides details for FY10 approved projects. The data displays cost, scope, and the operating impacts of the projects.
The poorly designed and obsolete existing fasteners have very little service life remaining, and if allowed to remain on the track would require increasing levels of maintenance. These are safety critical components, failure to continue funding the replacement could result in: 1. Track slow orders which could result in service delays 2. Catastrophic derailment
Operating Impact
Project ScopeThis project procures and replaces 10,000 direct fixation rail fasteners on the North, East and West line.
Project Expenditures FY10 - FY14(In Thousands)
0.00.00.00.0
25.0
0 5 10 15 20 25 30
FY2014FY2013FY2012FY2011FY2010
Fisc
al Y
ears
31539 Repl. DF Fasteners-Ph 2-TR II
This project will prevent premature deterioration and extend the useful life of the ties. These are safety critical components, failure to continue funding the replacement could result in: 1. Track slow orders which could result in service delays 2. Catastrophic derailment
Operating Impact
Project ScopeThis project chemically seals 6,500 two-block ties on the NE and South lines.
Project Expenditures FY10 - FY14(In Thousands)
0.00.00.00.0
20.0
0 5 10 15 20 25
FY2014FY2013FY2012FY2011FY2010
Fisc
al Y
ears
31543 Two-Block Tie Sealing-TR II
441
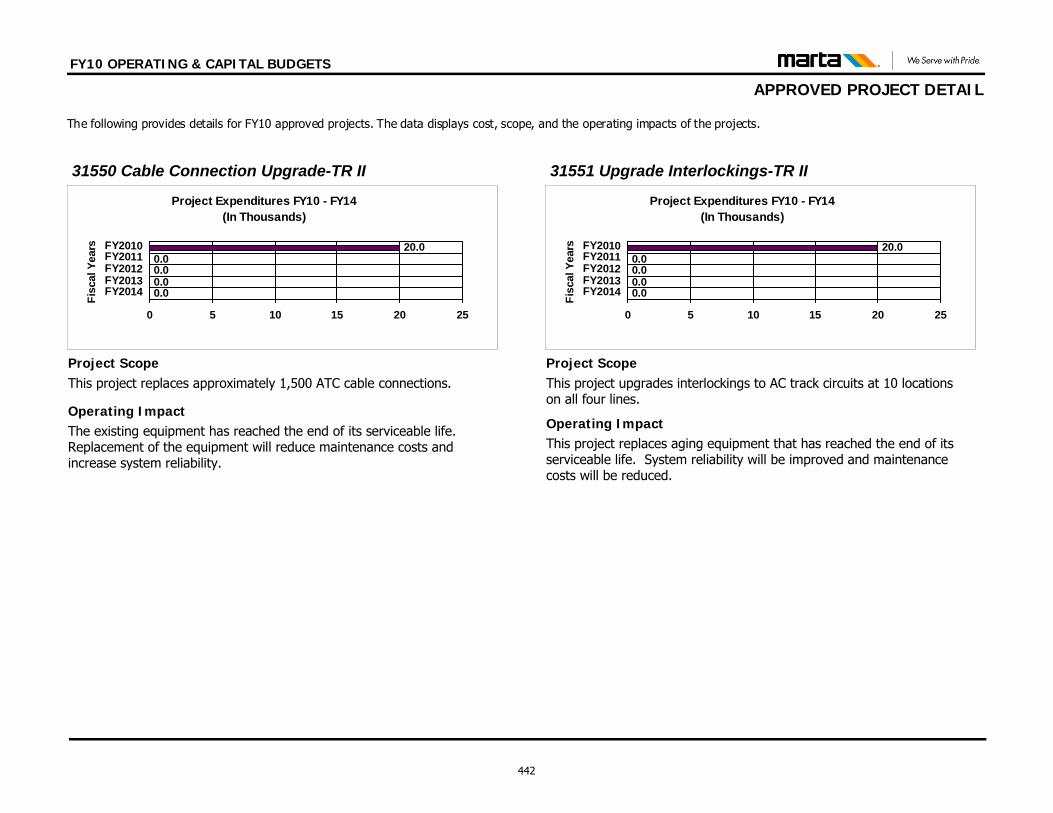
FY10 OPERATING & CAPITAL BUDGETS
APPROVED PROJECT DETAIL The following provides details for FY10 approved projects. The data displays cost, scope, and the operating impacts of the projects.
The existing equipment has reached the end of its serviceable life. Replacement of the equipment will reduce maintenance costs and increase system reliability.
Operating Impact
Project ScopeThis project replaces approximately 1,500 ATC cable connections.
Project Expenditures FY10 - FY14(In Thousands)
0.00.00.00.0
20.0
0 5 10 15 20 25
FY2014FY2013FY2012FY2011FY2010
Fisc
al Y
ears
31550 Cable Connection Upgrade-TR II
This project replaces aging equipment that has reached the end of its serviceable life. System reliability will be improved and maintenance costs will be reduced.
Operating Impact
Project ScopeThis project upgrades interlockings to AC track circuits at 10 locations on all four lines.
Project Expenditures FY10 - FY14(In Thousands)
0.00.00.00.0
20.0
0 5 10 15 20 25
FY2014FY2013FY2012FY2011FY2010
Fisc
al Y
ears
31551 Upgrade Interlockings-TR II
442
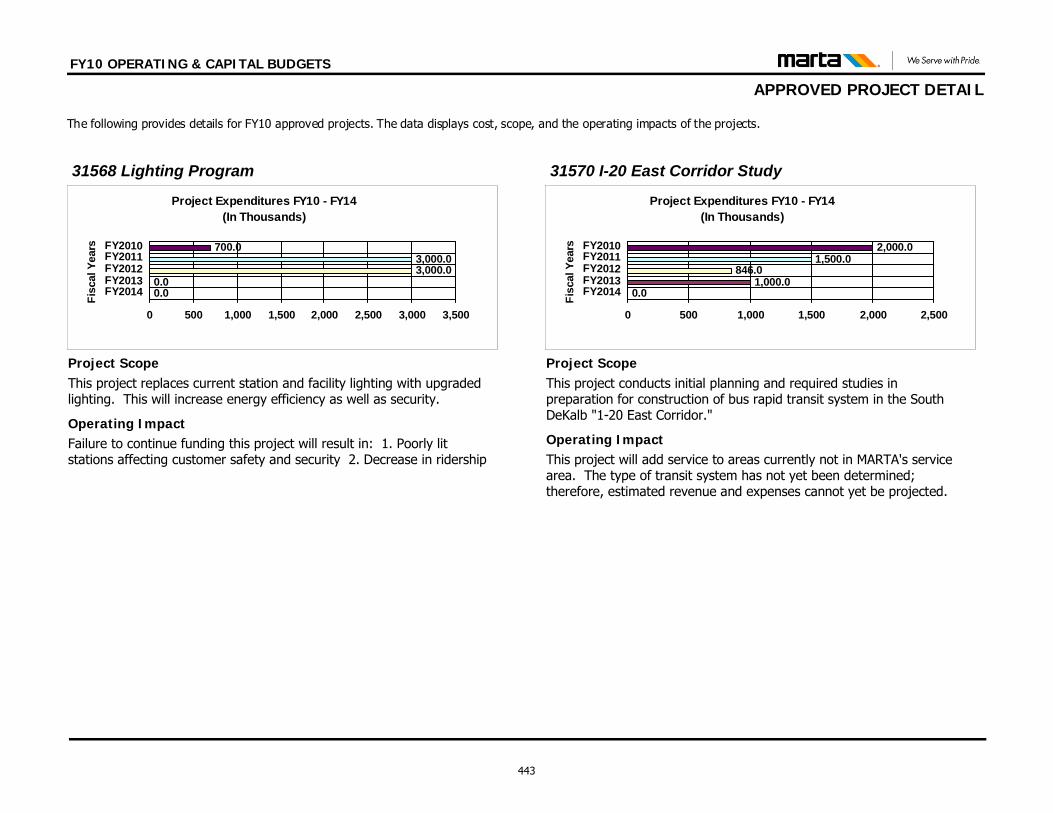
FY10 OPERATING & CAPITAL BUDGETS
APPROVED PROJECT DETAIL The following provides details for FY10 approved projects. The data displays cost, scope, and the operating impacts of the projects.
Failure to continue funding this project will result in: 1. Poorly lit stations affecting customer safety and security 2. Decrease in ridership
Operating Impact
Project ScopeThis project replaces current station and facility lighting with upgraded lighting. This will increase energy efficiency as well as security.
Project Expenditures FY10 - FY14(In Thousands)
0.00.0
3,000.03,000.0
700.0
0 500 1,000 1,500 2,000 2,500 3,000 3,500
FY2014FY2013FY2012FY2011FY2010
Fisc
al Y
ears
31568 Lighting Program
This project will add service to areas currently not in MARTA's service area. The type of transit system has not yet been determined; therefore, estimated revenue and expenses cannot yet be projected.
Operating Impact
Project ScopeThis project conducts initial planning and required studies in preparation for construction of bus rapid transit system in the South DeKalb "1-20 East Corridor."
Project Expenditures FY10 - FY14(In Thousands)
0.01,000.0
846.01,500.0
2,000.0
0 500 1,000 1,500 2,000 2,500
FY2014FY2013FY2012FY2011FY2010
Fisc
al Y
ears
31570 I-20 East Corridor Study
443
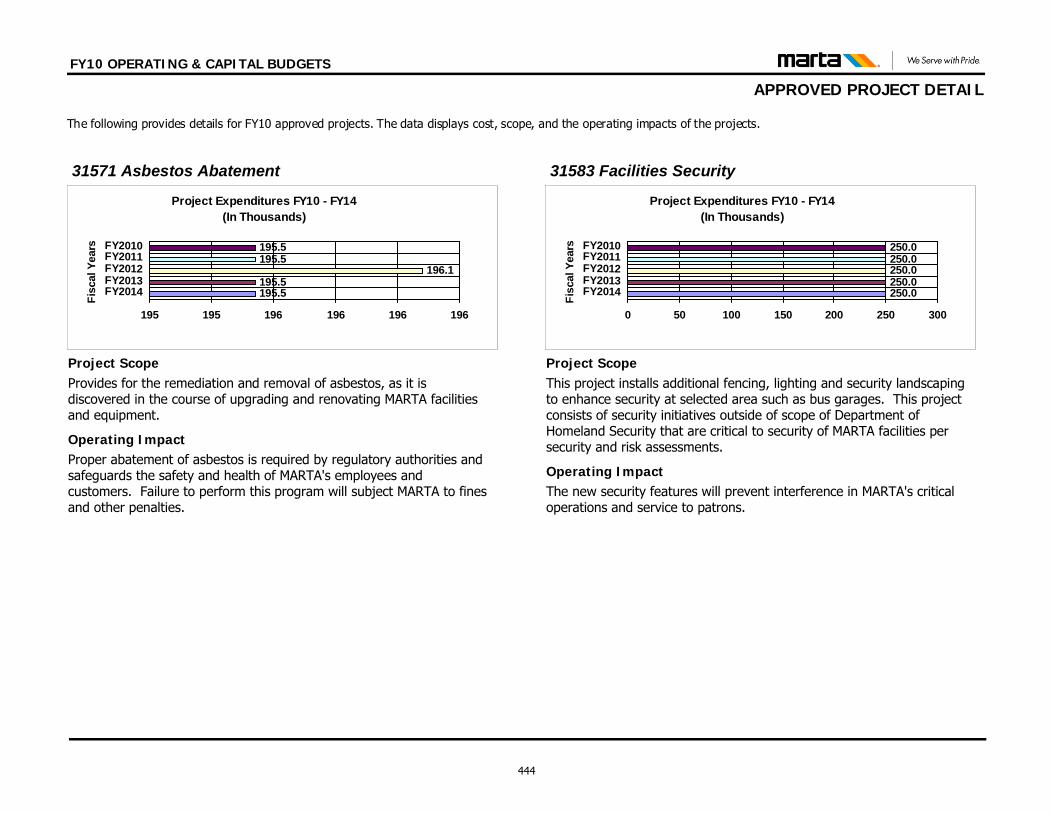
FY10 OPERATING & CAPITAL BUDGETS
APPROVED PROJECT DETAIL The following provides details for FY10 approved projects. The data displays cost, scope, and the operating impacts of the projects.
Proper abatement of asbestos is required by regulatory authorities and safeguards the safety and health of MARTA's employees and customers. Failure to perform this program will subject MARTA to fines and other penalties.
Operating Impact
Project ScopeProvides for the remediation and removal of asbestos, as it is discovered in the course of upgrading and renovating MARTA facilities and equipment.
Project Expenditures FY10 - FY14(In Thousands)
195.5195.5
196.1195.5195.5
195 195 196 196 196 196
FY2014FY2013FY2012FY2011FY2010
Fisc
al Y
ears
31571 Asbestos Abatement
The new security features will prevent interference in MARTA's critical operations and service to patrons.
Operating Impact
Project ScopeThis project installs additional fencing, lighting and security landscaping to enhance security at selected area such as bus garages. This project consists of security initiatives outside of scope of Department of Homeland Security that are critical to security of MARTA facilities per security and risk assessments.
Project Expenditures FY10 - FY14(In Thousands)
250.0250.0250.0250.0250.0
0 50 100 150 200 250 300
FY2014FY2013FY2012FY2011FY2010
Fisc
al Y
ears
31583 Facilities Security
444
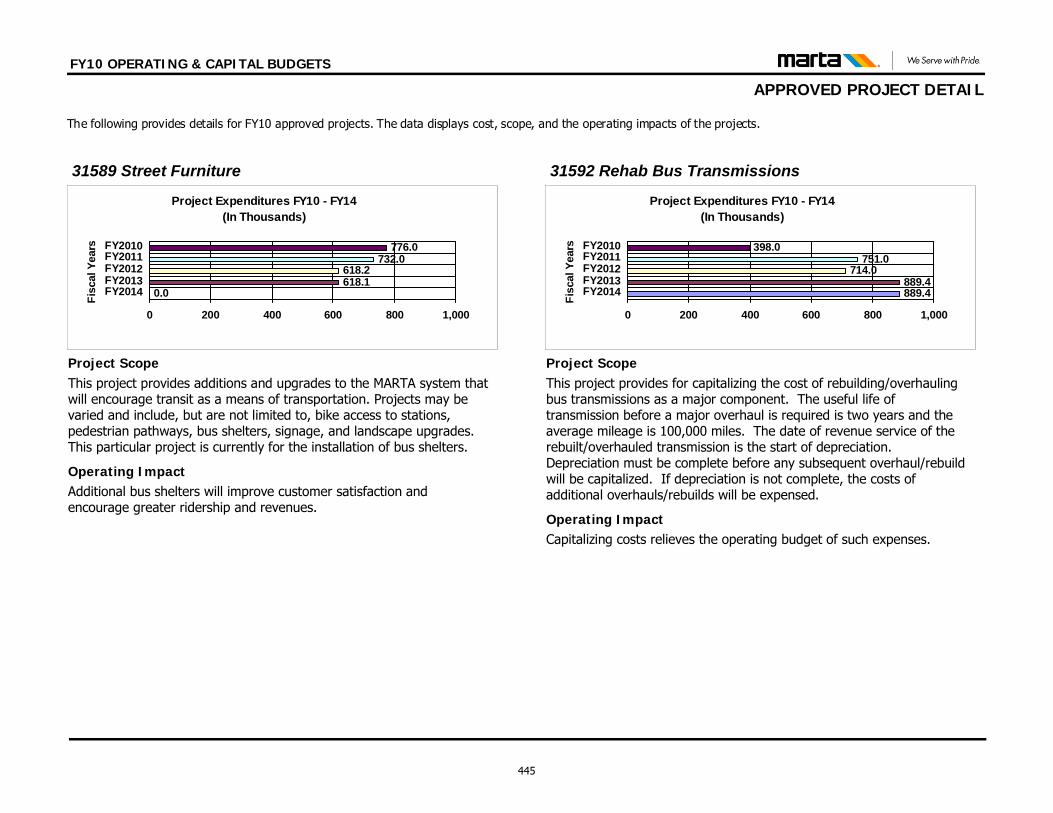
FY10 OPERATING & CAPITAL BUDGETS
APPROVED PROJECT DETAIL The following provides details for FY10 approved projects. The data displays cost, scope, and the operating impacts of the projects.
Additional bus shelters will improve customer satisfaction and encourage greater ridership and revenues.
Operating Impact
Project ScopeThis project provides additions and upgrades to the MARTA system that will encourage transit as a means of transportation. Projects may be varied and include, but are not limited to, bike access to stations, pedestrian pathways, bus shelters, signage, and landscape upgrades. This particular project is currently for the installation of bus shelters.
Project Expenditures FY10 - FY14(In Thousands)
0.0618.1618.2
732.0776.0
0 200 400 600 800 1,000
FY2014FY2013FY2012FY2011FY2010
Fisc
al Y
ears
31589 Street Furniture
Capitalizing costs relieves the operating budget of such expenses.Operating Impact
Project ScopeThis project provides for capitalizing the cost of rebuilding/overhauling bus transmissions as a major component. The useful life of transmission before a major overhaul is required is two years and the average mileage is 100,000 miles. The date of revenue service of the rebuilt/overhauled transmission is the start of depreciation. Depreciation must be complete before any subsequent overhaul/rebuild will be capitalized. If depreciation is not complete, the costs of additional overhauls/rebuilds will be expensed.
Project Expenditures FY10 - FY14(In Thousands)
889.4889.4
714.0751.0
398.0
0 200 400 600 800 1,000
FY2014FY2013FY2012FY2011FY2010
Fisc
al Y
ears
31592 Rehab Bus Transmissions
445
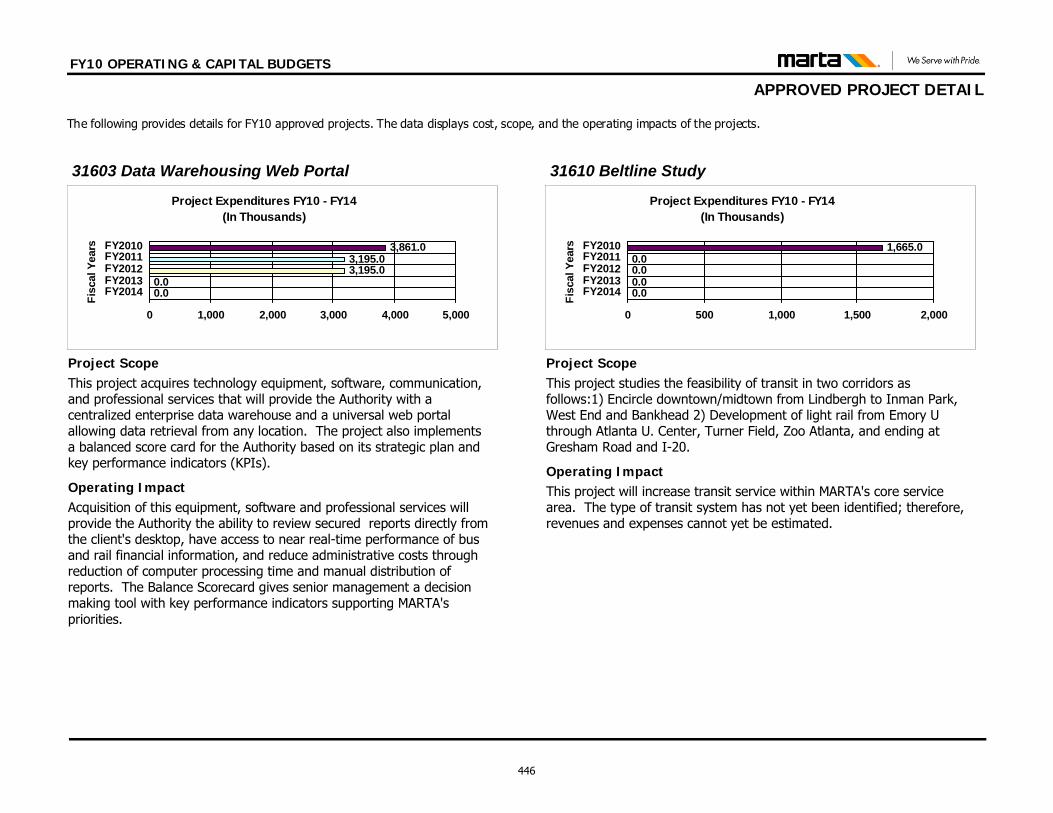
FY10 OPERATING & CAPITAL BUDGETS
APPROVED PROJECT DETAIL The following provides details for FY10 approved projects. The data displays cost, scope, and the operating impacts of the projects.
Acquisition of this equipment, software and professional services will provide the Authority the ability to review secured reports directly from the client's desktop, have access to near real-time performance of bus and rail financial information, and reduce administrative costs through reduction of computer processing time and manual distribution of reports. The Balance Scorecard gives senior management a decision making tool with key performance indicators supporting MARTA's priorities.
Operating Impact
Project ScopeThis project acquires technology equipment, software, communication, and professional services that will provide the Authority with a centralized enterprise data warehouse and a universal web portal allowing data retrieval from any location. The project also implements a balanced score card for the Authority based on its strategic plan and key performance indicators (KPIs).
Project Expenditures FY10 - FY14(In Thousands)
0.00.0
3,195.03,195.0
3,861.0
0 1,000 2,000 3,000 4,000 5,000
FY2014FY2013FY2012FY2011FY2010
Fisc
al Y
ears
31603 Data Warehousing Web Portal
This project will increase transit service within MARTA's core service area. The type of transit system has not yet been identified; therefore, revenues and expenses cannot yet be estimated.
Operating Impact
Project ScopeThis project studies the feasibility of transit in two corridors as follows:1) Encircle downtown/midtown from Lindbergh to Inman Park, West End and Bankhead 2) Development of light rail from Emory U through Atlanta U. Center, Turner Field, Zoo Atlanta, and ending at Gresham Road and I-20.
Project Expenditures FY10 - FY14(In Thousands)
0.00.00.00.0
1,665.0
0 500 1,000 1,500 2,000
FY2014FY2013FY2012FY2011FY2010
Fisc
al Y
ears
31610 Beltline Study
446
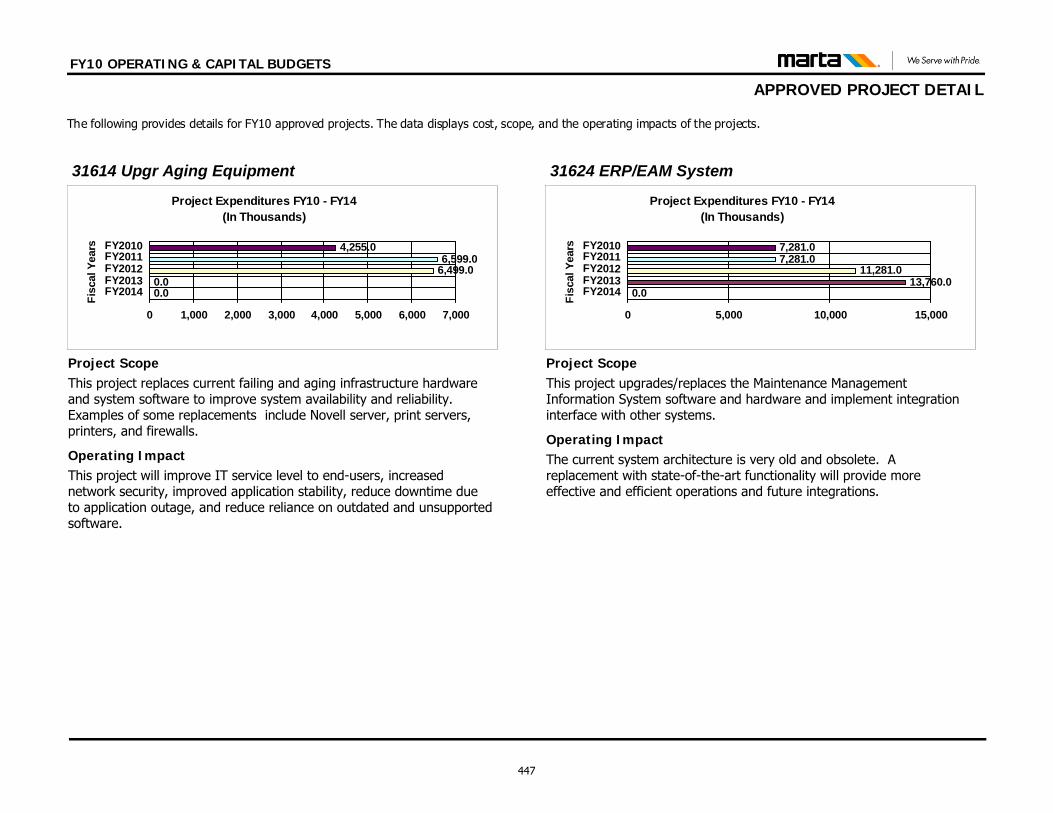
FY10 OPERATING & CAPITAL BUDGETS
APPROVED PROJECT DETAIL The following provides details for FY10 approved projects. The data displays cost, scope, and the operating impacts of the projects.
This project will improve IT service level to end-users, increased network security, improved application stability, reduce downtime due to application outage, and reduce reliance on outdated and unsupported software.
Operating Impact
Project ScopeThis project replaces current failing and aging infrastructure hardware and system software to improve system availability and reliability. Examples of some replacements include Novell server, print servers, printers, and firewalls.
Project Expenditures FY10 - FY14(In Thousands)
0.00.0
6,499.06,599.0
4,255.0
0 1,000 2,000 3,000 4,000 5,000 6,000 7,000
FY2014FY2013FY2012FY2011FY2010
Fisc
al Y
ears
31614 Upgr Aging Equipment
The current system architecture is very old and obsolete. A replacement with state-of-the-art functionality will provide more effective and efficient operations and future integrations.
Operating Impact
Project ScopeThis project upgrades/replaces the Maintenance Management Information System software and hardware and implement integration interface with other systems.
Project Expenditures FY10 - FY14(In Thousands)
0.013,760.0
11,281.07,281.07,281.0
0 5,000 10,000 15,000
FY2014FY2013FY2012FY2011FY2010
Fisc
al Y
ears
31624 ERP/EAM System
447
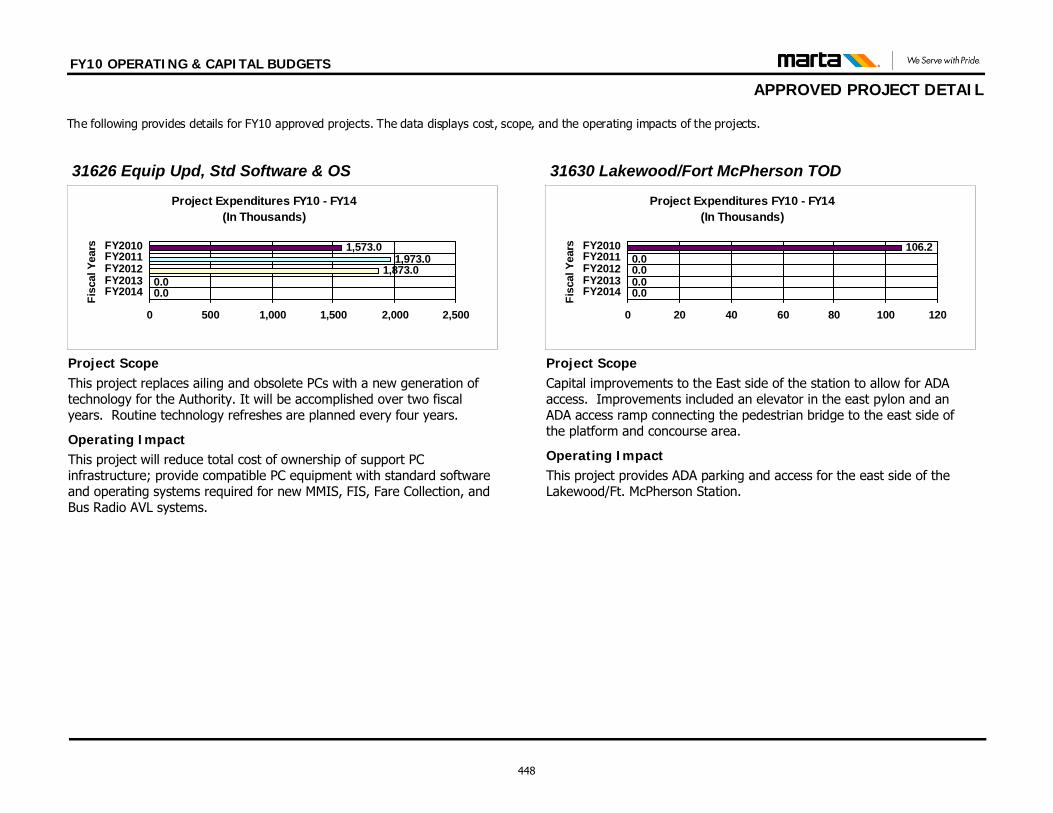
FY10 OPERATING & CAPITAL BUDGETS
APPROVED PROJECT DETAIL The following provides details for FY10 approved projects. The data displays cost, scope, and the operating impacts of the projects.
This project will reduce total cost of ownership of support PC infrastructure; provide compatible PC equipment with standard software and operating systems required for new MMIS, FIS, Fare Collection, and Bus Radio AVL systems.
Operating Impact
Project ScopeThis project replaces ailing and obsolete PCs with a new generation of technology for the Authority. It will be accomplished over two fiscal years. Routine technology refreshes are planned every four years.
Project Expenditures FY10 - FY14(In Thousands)
0.00.0
1,873.01,973.0
1,573.0
0 500 1,000 1,500 2,000 2,500
FY2014FY2013FY2012FY2011FY2010
Fisc
al Y
ears
31626 Equip Upd, Std Software & OS
This project provides ADA parking and access for the east side of the Lakewood/Ft. McPherson Station.
Operating Impact
Project ScopeCapital improvements to the East side of the station to allow for ADA access. Improvements included an elevator in the east pylon and an ADA access ramp connecting the pedestrian bridge to the east side of the platform and concourse area.
Project Expenditures FY10 - FY14(In Thousands)
0.00.00.00.0
106.2
0 20 40 60 80 100 120
FY2014FY2013FY2012FY2011FY2010
Fisc
al Y
ears
31630 Lakewood/Fort McPherson TOD
448
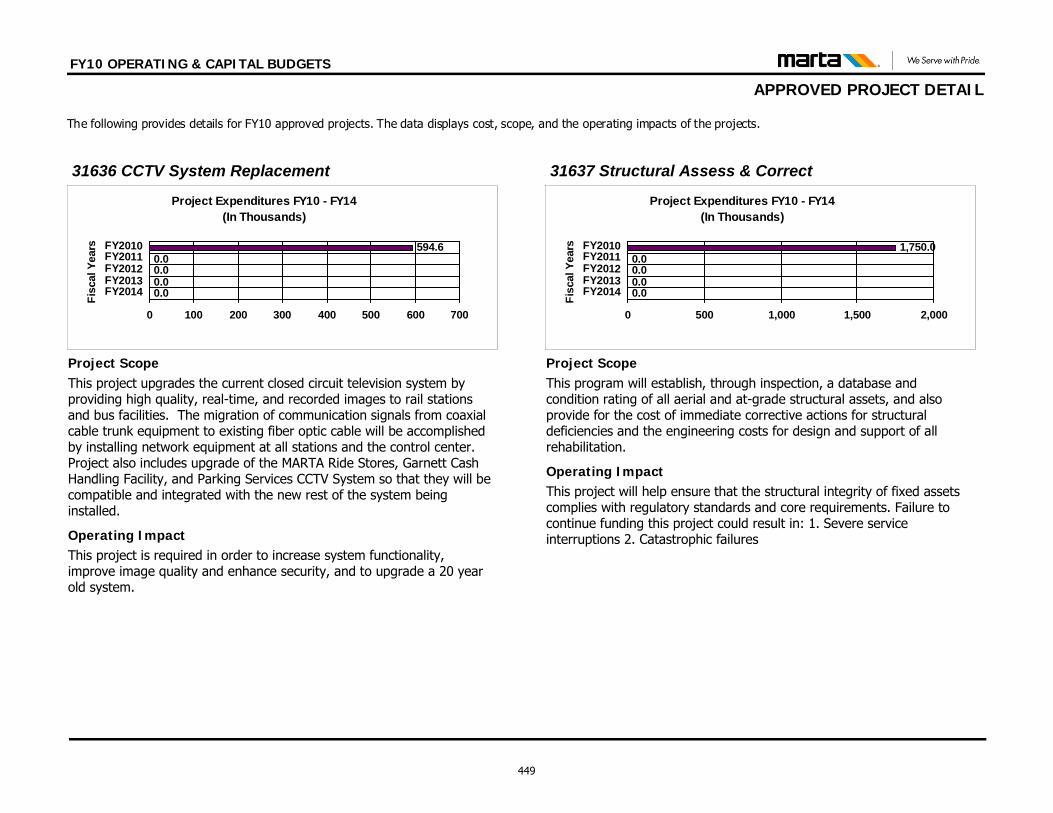
FY10 OPERATING & CAPITAL BUDGETS
APPROVED PROJECT DETAIL The following provides details for FY10 approved projects. The data displays cost, scope, and the operating impacts of the projects.
This project is required in order to increase system functionality, improve image quality and enhance security, and to upgrade a 20 year old system.
Operating Impact
Project ScopeThis project upgrades the current closed circuit television system by providing high quality, real-time, and recorded images to rail stations and bus facilities. The migration of communication signals from coaxial cable trunk equipment to existing fiber optic cable will be accomplished by installing network equipment at all stations and the control center. Project also includes upgrade of the MARTA Ride Stores, Garnett Cash Handling Facility, and Parking Services CCTV System so that they will be compatible and integrated with the new rest of the system being installed.
Project Expenditures FY10 - FY14(In Thousands)
0.00.00.00.0
594.6
0 100 200 300 400 500 600 700
FY2014FY2013FY2012FY2011FY2010
Fisc
al Y
ears
31636 CCTV System Replacement
This project will help ensure that the structural integrity of fixed assets complies with regulatory standards and core requirements. Failure to continue funding this project could result in: 1. Severe service interruptions 2. Catastrophic failures
Operating Impact
Project ScopeThis program will establish, through inspection, a database and condition rating of all aerial and at-grade structural assets, and also provide for the cost of immediate corrective actions for structural deficiencies and the engineering costs for design and support of all rehabilitation.
Project Expenditures FY10 - FY14(In Thousands)
0.00.00.00.0
1,750.0
0 500 1,000 1,500 2,000
FY2014FY2013FY2012FY2011FY2010
Fisc
al Y
ears
31637 Structural Assess & Correct
449
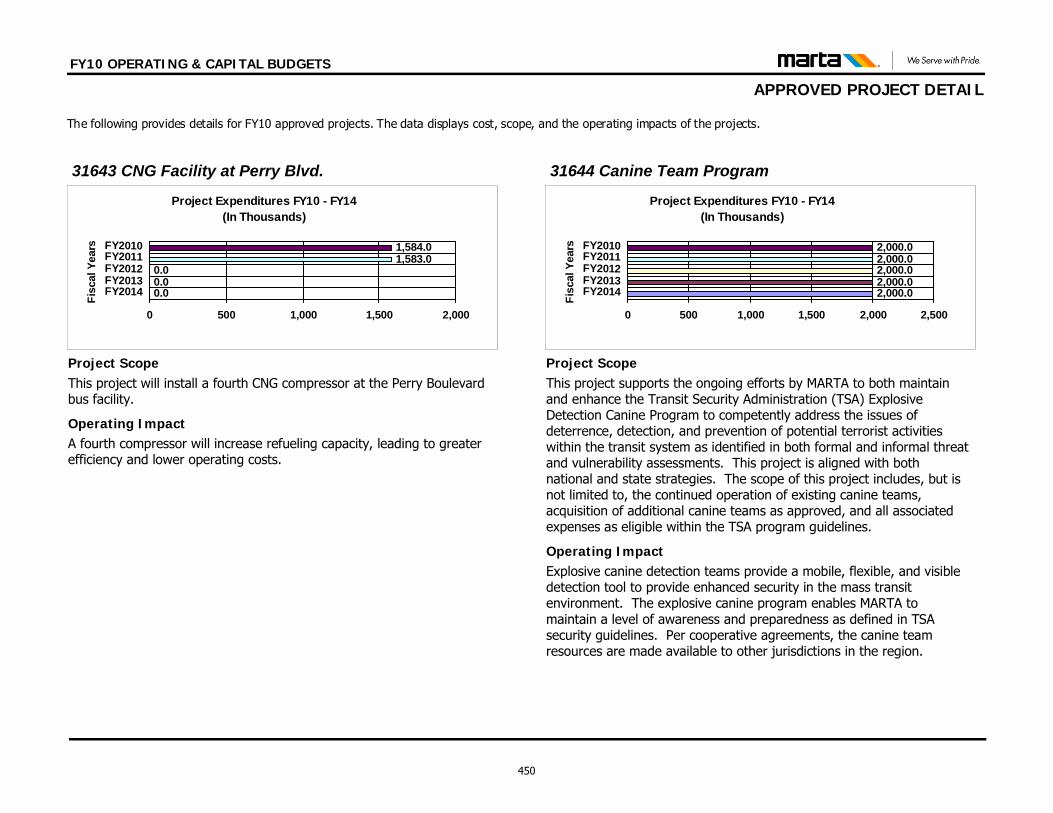
FY10 OPERATING & CAPITAL BUDGETS
APPROVED PROJECT DETAIL The following provides details for FY10 approved projects. The data displays cost, scope, and the operating impacts of the projects.
A fourth compressor will increase refueling capacity, leading to greater efficiency and lower operating costs.
Operating Impact
Project ScopeThis project will install a fourth CNG compressor at the Perry Boulevard bus facility.
Project Expenditures FY10 - FY14(In Thousands)
0.00.00.0
1,583.01,584.0
0 500 1,000 1,500 2,000
FY2014FY2013FY2012FY2011FY2010
Fisc
al Y
ears
31643 CNG Facility at Perry Blvd.
Explosive canine detection teams provide a mobile, flexible, and visible detection tool to provide enhanced security in the mass transit environment. The explosive canine program enables MARTA to maintain a level of awareness and preparedness as defined in TSA security guidelines. Per cooperative agreements, the canine team resources are made available to other jurisdictions in the region.
Operating Impact
Project ScopeThis project supports the ongoing efforts by MARTA to both maintain and enhance the Transit Security Administration (TSA) Explosive Detection Canine Program to competently address the issues of deterrence, detection, and prevention of potential terrorist activities within the transit system as identified in both formal and informal threat and vulnerability assessments. This project is aligned with both national and state strategies. The scope of this project includes, but is not limited to, the continued operation of existing canine teams, acquisition of additional canine teams as approved, and all associated expenses as eligible within the TSA program guidelines.
Project Expenditures FY10 - FY14(In Thousands)
2,000.02,000.02,000.02,000.02,000.0
0 500 1,000 1,500 2,000 2,500
FY2014FY2013FY2012FY2011FY2010
Fisc
al Y
ears
31644 Canine Team Program
450
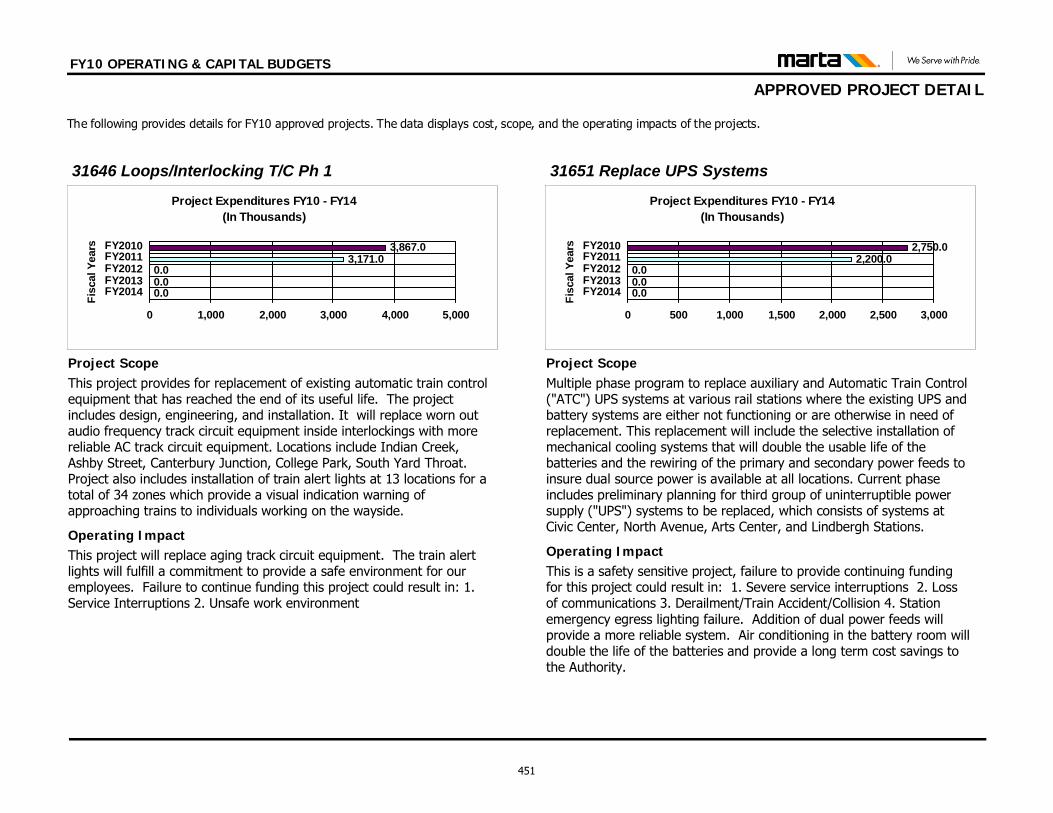
FY10 OPERATING & CAPITAL BUDGETS
APPROVED PROJECT DETAIL The following provides details for FY10 approved projects. The data displays cost, scope, and the operating impacts of the projects.
This project will replace aging track circuit equipment. The train alert lights will fulfill a commitment to provide a safe environment for our employees. Failure to continue funding this project could result in: 1. Service Interruptions 2. Unsafe work environment
Operating Impact
Project ScopeThis project provides for replacement of existing automatic train control equipment that has reached the end of its useful life. The project includes design, engineering, and installation. It will replace worn out audio frequency track circuit equipment inside interlockings with more reliable AC track circuit equipment. Locations include Indian Creek, Ashby Street, Canterbury Junction, College Park, South Yard Throat. Project also includes installation of train alert lights at 13 locations for a total of 34 zones which provide a visual indication warning of approaching trains to individuals working on the wayside.
Project Expenditures FY10 - FY14(In Thousands)
0.00.00.0
3,171.03,867.0
0 1,000 2,000 3,000 4,000 5,000
FY2014FY2013FY2012FY2011FY2010
Fisc
al Y
ears
31646 Loops/Interlocking T/C Ph 1
This is a safety sensitive project, failure to provide continuing funding for this project could result in: 1. Severe service interruptions 2. Loss of communications 3. Derailment/Train Accident/Collision 4. Station emergency egress lighting failure. Addition of dual power feeds will provide a more reliable system. Air conditioning in the battery room will double the life of the batteries and provide a long term cost savings to the Authority.
Operating Impact
Project ScopeMultiple phase program to replace auxiliary and Automatic Train Control ("ATC") UPS systems at various rail stations where the existing UPS and battery systems are either not functioning or are otherwise in need of replacement. This replacement will include the selective installation of mechanical cooling systems that will double the usable life of the batteries and the rewiring of the primary and secondary power feeds to insure dual source power is available at all locations. Current phase includes preliminary planning for third group of uninterruptible power supply ("UPS") systems to be replaced, which consists of systems at Civic Center, North Avenue, Arts Center, and Lindbergh Stations.
Project Expenditures FY10 - FY14(In Thousands)
0.00.00.0
2,200.02,750.0
0 500 1,000 1,500 2,000 2,500 3,000
FY2014FY2013FY2012FY2011FY2010
Fisc
al Y
ears
31651 Replace UPS Systems
451
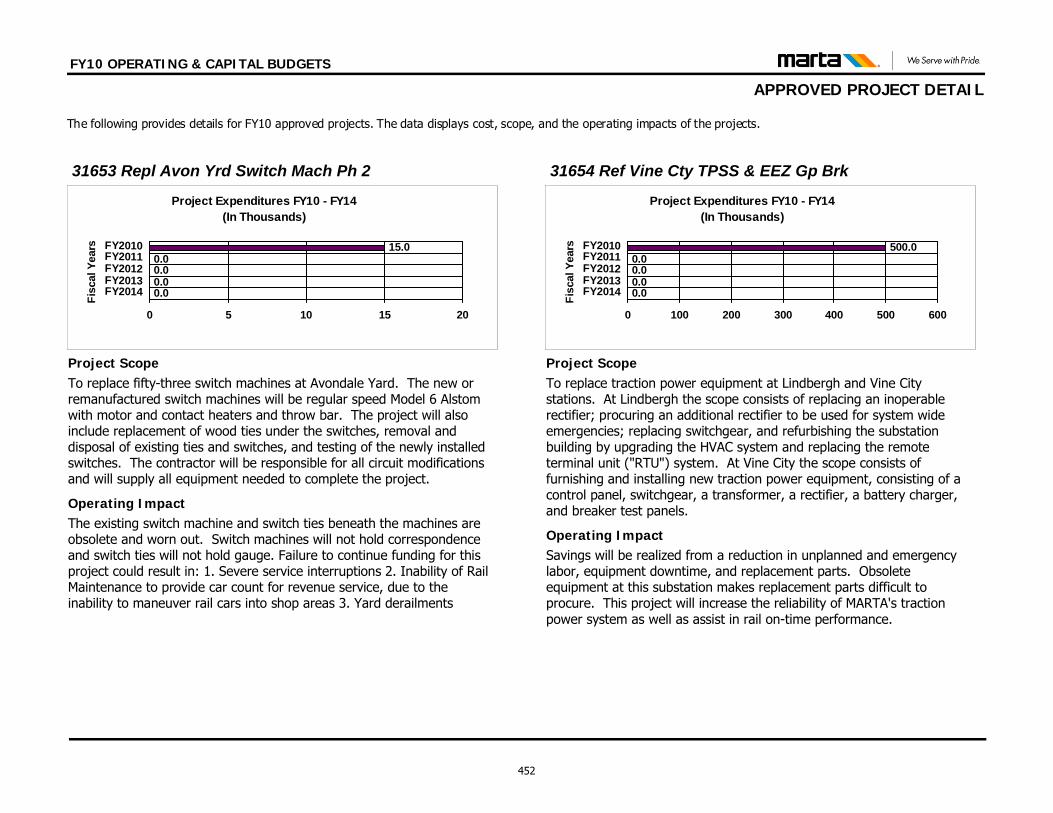
FY10 OPERATING & CAPITAL BUDGETS
APPROVED PROJECT DETAIL The following provides details for FY10 approved projects. The data displays cost, scope, and the operating impacts of the projects.
The existing switch machine and switch ties beneath the machines are obsolete and worn out. Switch machines will not hold correspondence and switch ties will not hold gauge. Failure to continue funding for this project could result in: 1. Severe service interruptions 2. Inability of Rail Maintenance to provide car count for revenue service, due to the inability to maneuver rail cars into shop areas 3. Yard derailments
Operating Impact
Project ScopeTo replace fifty-three switch machines at Avondale Yard. The new or remanufactured switch machines will be regular speed Model 6 Alstom with motor and contact heaters and throw bar. The project will also include replacement of wood ties under the switches, removal and disposal of existing ties and switches, and testing of the newly installed switches. The contractor will be responsible for all circuit modifications and will supply all equipment needed to complete the project.
Project Expenditures FY10 - FY14(In Thousands)
0.00.00.00.0
15.0
0 5 10 15 20
FY2014FY2013FY2012FY2011FY2010
Fisc
al Y
ears
31653 Repl Avon Yrd Switch Mach Ph 2
Savings will be realized from a reduction in unplanned and emergency labor, equipment downtime, and replacement parts. Obsolete equipment at this substation makes replacement parts difficult to procure. This project will increase the reliability of MARTA's traction power system as well as assist in rail on-time performance.
Operating Impact
Project ScopeTo replace traction power equipment at Lindbergh and Vine City stations. At Lindbergh the scope consists of replacing an inoperable rectifier; procuring an additional rectifier to be used for system wide emergencies; replacing switchgear, and refurbishing the substation building by upgrading the HVAC system and replacing the remote terminal unit ("RTU") system. At Vine City the scope consists of furnishing and installing new traction power equipment, consisting of a control panel, switchgear, a transformer, a rectifier, a battery charger, and breaker test panels.
Project Expenditures FY10 - FY14(In Thousands)
0.00.00.00.0
500.0
0 100 200 300 400 500 600
FY2014FY2013FY2012FY2011FY2010
Fisc
al Y
ears
31654 Ref Vine Cty TPSS & EEZ Gp Brk
452
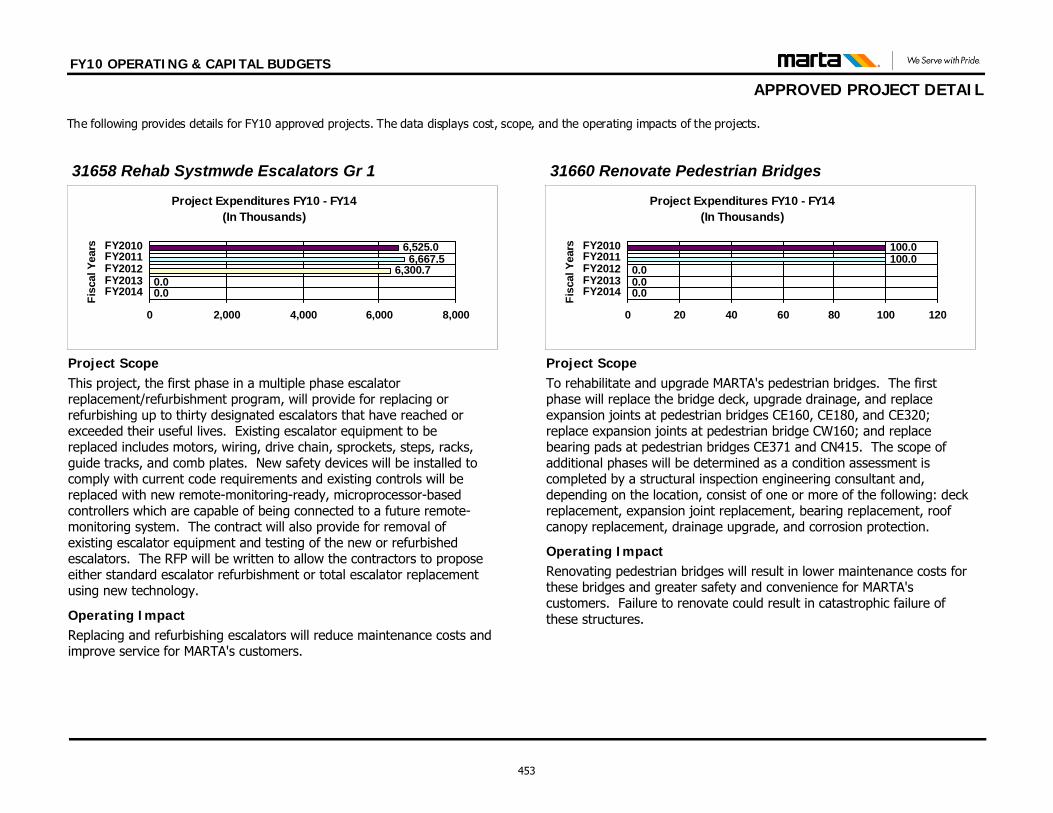
FY10 OPERATING & CAPITAL BUDGETS
APPROVED PROJECT DETAIL The following provides details for FY10 approved projects. The data displays cost, scope, and the operating impacts of the projects.
Replacing and refurbishing escalators will reduce maintenance costs and improve service for MARTA's customers.
Operating Impact
Project ScopeThis project, the first phase in a multiple phase escalator replacement/refurbishment program, will provide for replacing or refurbishing up to thirty designated escalators that have reached or exceeded their useful lives. Existing escalator equipment to be replaced includes motors, wiring, drive chain, sprockets, steps, racks, guide tracks, and comb plates. New safety devices will be installed to comply with current code requirements and existing controls will be replaced with new remote-monitoring-ready, microprocessor-based controllers which are capable of being connected to a future remote-monitoring system. The contract will also provide for removal of existing escalator equipment and testing of the new or refurbished escalators. The RFP will be written to allow the contractors to propose either standard escalator refurbishment or total escalator replacement using new technology.
Project Expenditures FY10 - FY14(In Thousands)
0.00.0
6,300.76,667.5
6,525.0
0 2,000 4,000 6,000 8,000
FY2014FY2013FY2012FY2011FY2010
Fisc
al Y
ears
31658 Rehab Systmwde Escalators Gr 1
Renovating pedestrian bridges will result in lower maintenance costs for these bridges and greater safety and convenience for MARTA's customers. Failure to renovate could result in catastrophic failure of these structures.
Operating Impact
Project ScopeTo rehabilitate and upgrade MARTA's pedestrian bridges. The first phase will replace the bridge deck, upgrade drainage, and replace expansion joints at pedestrian bridges CE160, CE180, and CE320; replace expansion joints at pedestrian bridge CW160; and replace bearing pads at pedestrian bridges CE371 and CN415. The scope of additional phases will be determined as a condition assessment is completed by a structural inspection engineering consultant and, depending on the location, consist of one or more of the following: deck replacement, expansion joint replacement, bearing replacement, roof canopy replacement, drainage upgrade, and corrosion protection.
Project Expenditures FY10 - FY14(In Thousands)
0.00.00.0
100.0100.0
0 20 40 60 80 100 120
FY2014FY2013FY2012FY2011FY2010
Fisc
al Y
ears
31660 Renovate Pedestrian Bridges
453
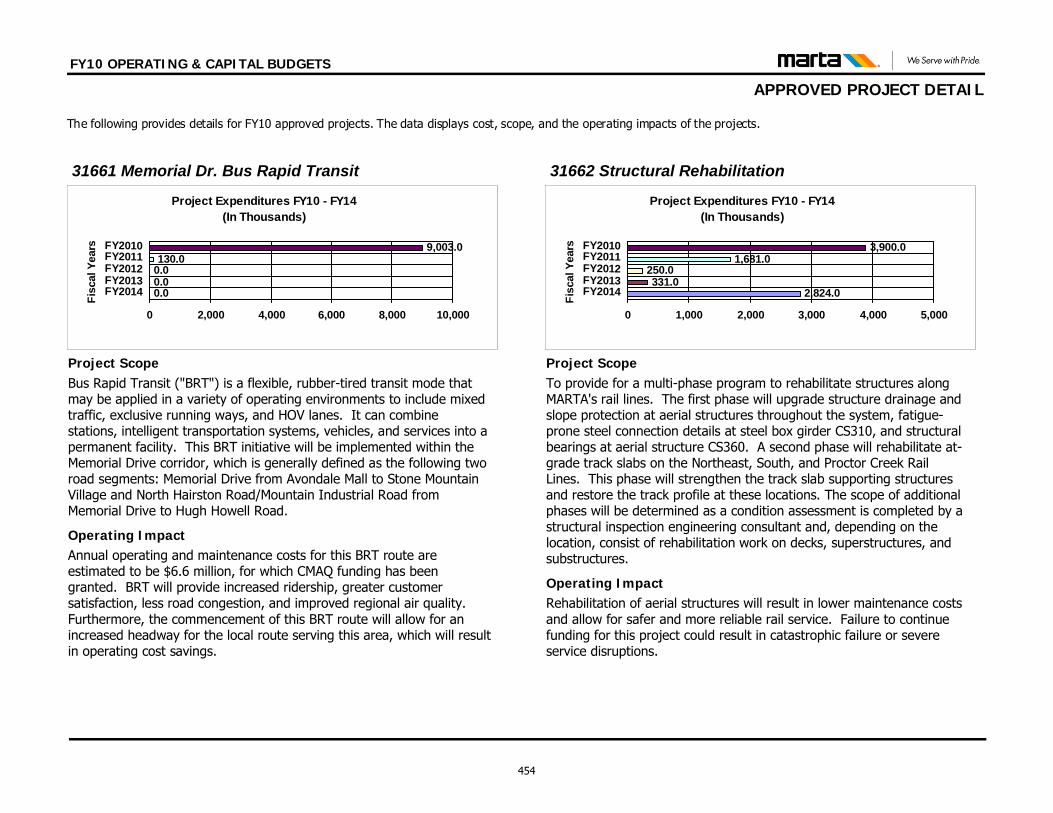
FY10 OPERATING & CAPITAL BUDGETS
APPROVED PROJECT DETAIL The following provides details for FY10 approved projects. The data displays cost, scope, and the operating impacts of the projects.
Annual operating and maintenance costs for this BRT route are estimated to be $6.6 million, for which CMAQ funding has been granted. BRT will provide increased ridership, greater customer satisfaction, less road congestion, and improved regional air quality. Furthermore, the commencement of this BRT route will allow for an increased headway for the local route serving this area, which will result in operating cost savings.
Operating Impact
Project ScopeBus Rapid Transit ("BRT") is a flexible, rubber-tired transit mode that may be applied in a variety of operating environments to include mixed traffic, exclusive running ways, and HOV lanes. It can combine stations, intelligent transportation systems, vehicles, and services into a permanent facility. This BRT initiative will be implemented within the Memorial Drive corridor, which is generally defined as the following two road segments: Memorial Drive from Avondale Mall to Stone Mountain Village and North Hairston Road/Mountain Industrial Road from Memorial Drive to Hugh Howell Road.
Project Expenditures FY10 - FY14(In Thousands)
0.00.00.0130.0
9,003.0
0 2,000 4,000 6,000 8,000 10,000
FY2014FY2013FY2012FY2011FY2010
Fisc
al Y
ears
31661 Memorial Dr. Bus Rapid Transit
Rehabilitation of aerial structures will result in lower maintenance costs and allow for safer and more reliable rail service. Failure to continue funding for this project could result in catastrophic failure or severe service disruptions.
Operating Impact
Project ScopeTo provide for a multi-phase program to rehabilitate structures along MARTA's rail lines. The first phase will upgrade structure drainage and slope protection at aerial structures throughout the system, fatigue-prone steel connection details at steel box girder CS310, and structural bearings at aerial structure CS360. A second phase will rehabilitate at-grade track slabs on the Northeast, South, and Proctor Creek Rail Lines. This phase will strengthen the track slab supporting structures and restore the track profile at these locations. The scope of additional phases will be determined as a condition assessment is completed by a structural inspection engineering consultant and, depending on the location, consist of rehabilitation work on decks, superstructures, and substructures.
Project Expenditures FY10 - FY14(In Thousands)
2,824.0331.0
250.01,681.0
3,900.0
0 1,000 2,000 3,000 4,000 5,000
FY2014FY2013FY2012FY2011FY2010
Fisc
al Y
ears
31662 Structural Rehabilitation
454
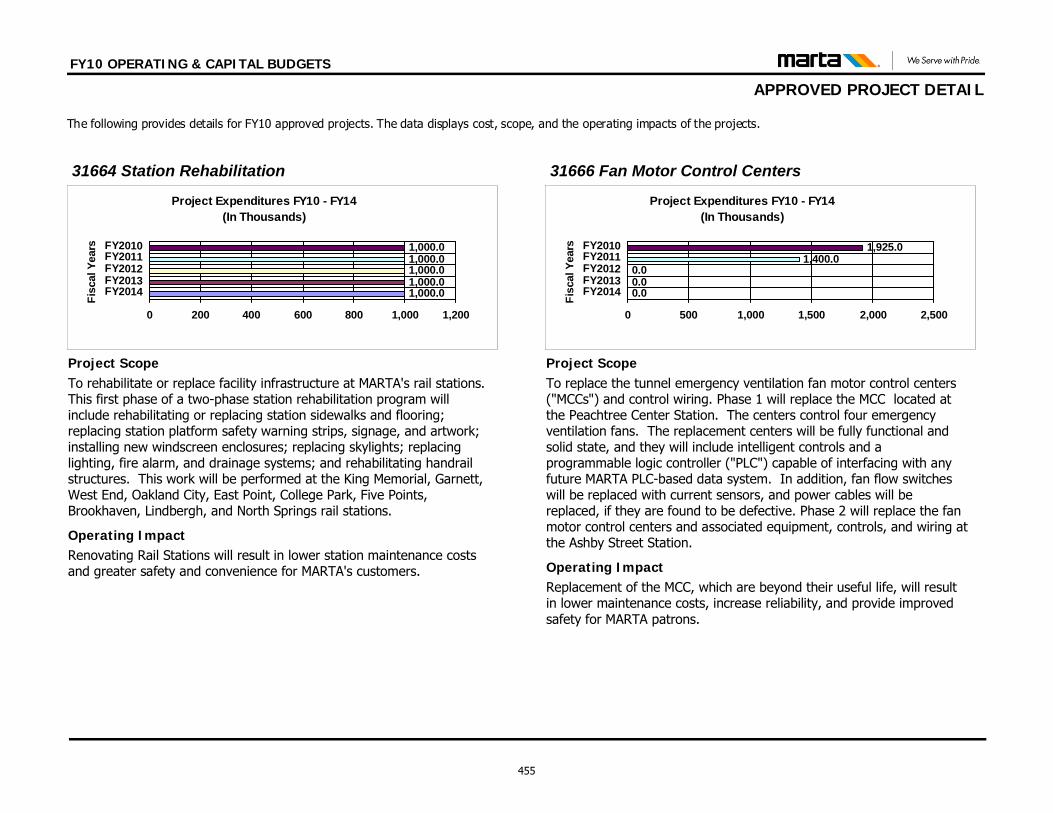
FY10 OPERATING & CAPITAL BUDGETS
APPROVED PROJECT DETAIL The following provides details for FY10 approved projects. The data displays cost, scope, and the operating impacts of the projects.
Renovating Rail Stations will result in lower station maintenance costs and greater safety and convenience for MARTA's customers.
Operating Impact
Project ScopeTo rehabilitate or replace facility infrastructure at MARTA's rail stations. This first phase of a two-phase station rehabilitation program will include rehabilitating or replacing station sidewalks and flooring; replacing station platform safety warning strips, signage, and artwork; installing new windscreen enclosures; replacing skylights; replacing lighting, fire alarm, and drainage systems; and rehabilitating handrail structures. This work will be performed at the King Memorial, Garnett, West End, Oakland City, East Point, College Park, Five Points, Brookhaven, Lindbergh, and North Springs rail stations.
Project Expenditures FY10 - FY14(In Thousands)
1,000.01,000.01,000.01,000.01,000.0
0 200 400 600 800 1,000 1,200
FY2014FY2013FY2012FY2011FY2010
Fisc
al Y
ears
31664 Station Rehabilitation
Replacement of the MCC, which are beyond their useful life, will result in lower maintenance costs, increase reliability, and provide improved safety for MARTA patrons.
Operating Impact
Project ScopeTo replace the tunnel emergency ventilation fan motor control centers ("MCCs") and control wiring. Phase 1 will replace the MCC located at the Peachtree Center Station. The centers control four emergency ventilation fans. The replacement centers will be fully functional and solid state, and they will include intelligent controls and a programmable logic controller ("PLC") capable of interfacing with any future MARTA PLC-based data system. In addition, fan flow switches will be replaced with current sensors, and power cables will be replaced, if they are found to be defective. Phase 2 will replace the fan motor control centers and associated equipment, controls, and wiring at the Ashby Street Station.
Project Expenditures FY10 - FY14(In Thousands)
0.00.00.0
1,400.01,925.0
0 500 1,000 1,500 2,000 2,500
FY2014FY2013FY2012FY2011FY2010
Fisc
al Y
ears
31666 Fan Motor Control Centers
455
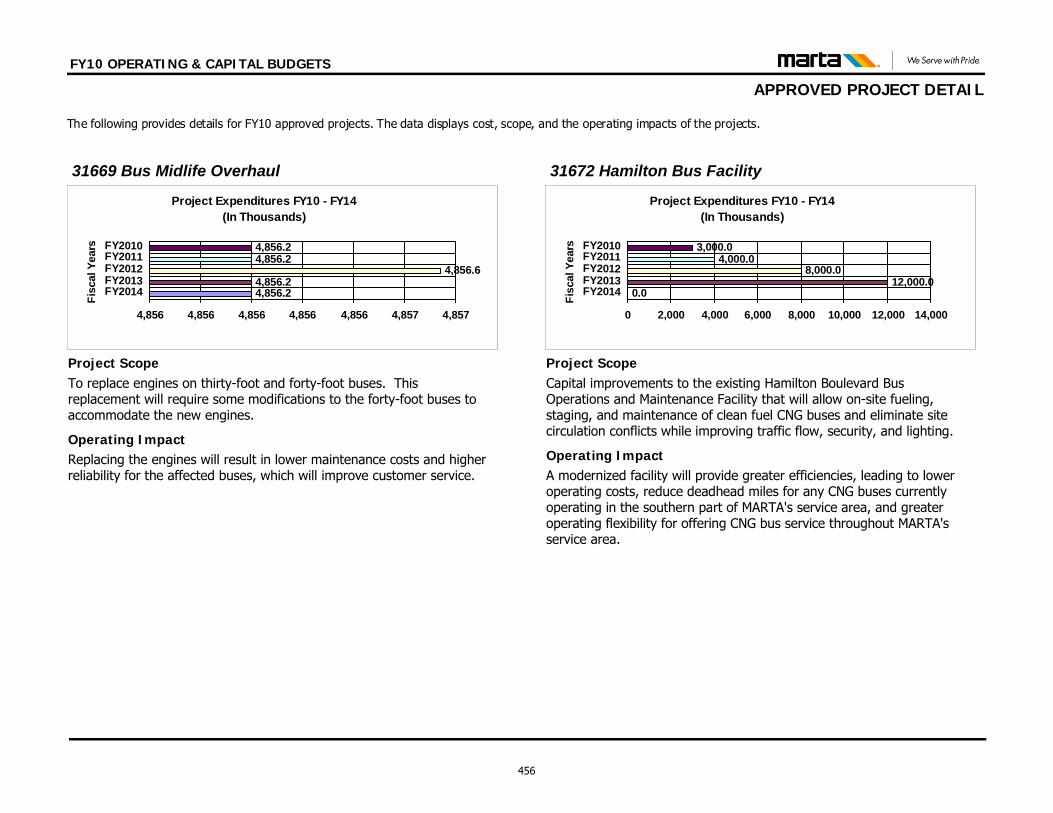
FY10 OPERATING & CAPITAL BUDGETS
APPROVED PROJECT DETAIL The following provides details for FY10 approved projects. The data displays cost, scope, and the operating impacts of the projects.
Replacing the engines will result in lower maintenance costs and higher reliability for the affected buses, which will improve customer service.
Operating Impact
Project ScopeTo replace engines on thirty-foot and forty-foot buses. This replacement will require some modifications to the forty-foot buses to accommodate the new engines.
Project Expenditures FY10 - FY14(In Thousands)
4,856.24,856.2
4,856.64,856.24,856.2
4,856 4,856 4,856 4,856 4,856 4,857 4,857
FY2014FY2013FY2012FY2011FY2010
Fisc
al Y
ears
31669 Bus Midlife Overhaul
A modernized facility will provide greater efficiencies, leading to lower operating costs, reduce deadhead miles for any CNG buses currently operating in the southern part of MARTA's service area, and greater operating flexibility for offering CNG bus service throughout MARTA's service area.
Operating Impact
Project ScopeCapital improvements to the existing Hamilton Boulevard Bus Operations and Maintenance Facility that will allow on-site fueling, staging, and maintenance of clean fuel CNG buses and eliminate site circulation conflicts while improving traffic flow, security, and lighting.
Project Expenditures FY10 - FY14(In Thousands)
0.012,000.0
8,000.04,000.0
3,000.0
0 2,000 4,000 6,000 8,000 10,000 12,000 14,000
FY2014FY2013FY2012FY2011FY2010
Fisc
al Y
ears
31672 Hamilton Bus Facility
456
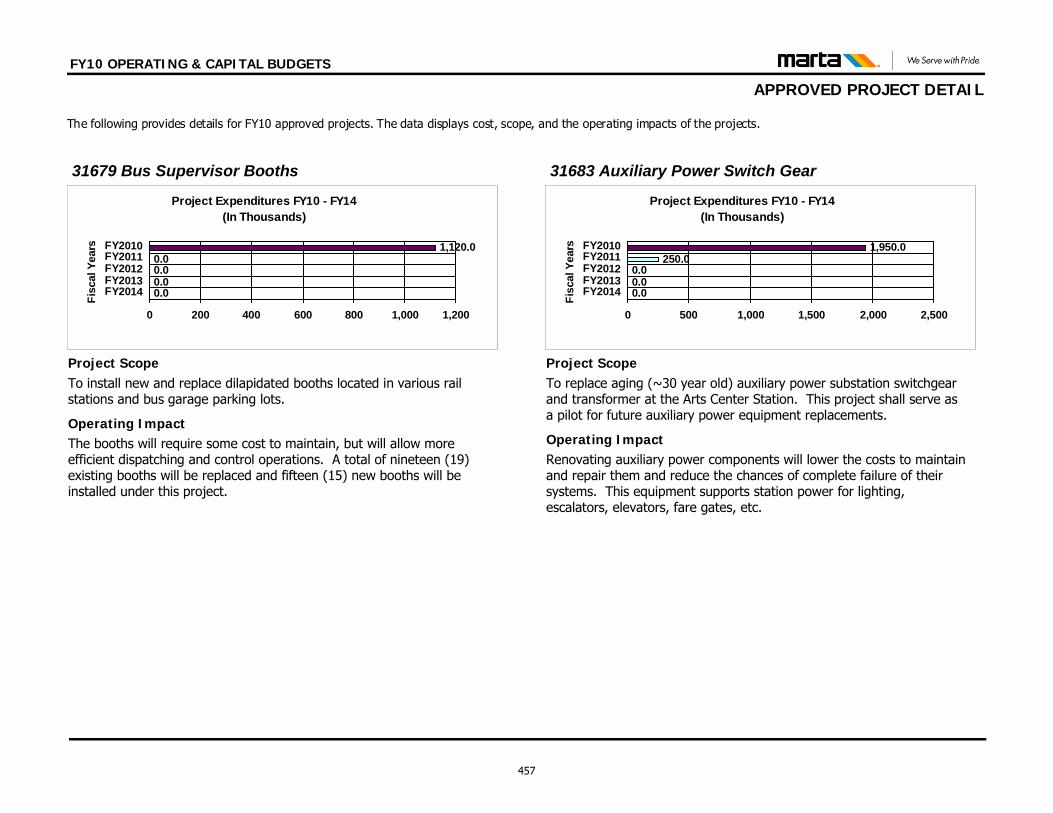
FY10 OPERATING & CAPITAL BUDGETS
APPROVED PROJECT DETAIL The following provides details for FY10 approved projects. The data displays cost, scope, and the operating impacts of the projects.
The booths will require some cost to maintain, but will allow more efficient dispatching and control operations. A total of nineteen (19) existing booths will be replaced and fifteen (15) new booths will be installed under this project.
Operating Impact
Project ScopeTo install new and replace dilapidated booths located in various rail stations and bus garage parking lots.
Project Expenditures FY10 - FY14(In Thousands)
0.00.00.00.0
1,120.0
0 200 400 600 800 1,000 1,200
FY2014FY2013FY2012FY2011FY2010
Fisc
al Y
ears
31679 Bus Supervisor Booths
Renovating auxiliary power components will lower the costs to maintain and repair them and reduce the chances of complete failure of their systems. This equipment supports station power for lighting, escalators, elevators, fare gates, etc.
Operating Impact
Project ScopeTo replace aging (~30 year old) auxiliary power substation switchgear and transformer at the Arts Center Station. This project shall serve as a pilot for future auxiliary power equipment replacements.
Project Expenditures FY10 - FY14(In Thousands)
0.00.00.0
250.01,950.0
0 500 1,000 1,500 2,000 2,500
FY2014FY2013FY2012FY2011FY2010
Fisc
al Y
ears
31683 Auxiliary Power Switch Gear
457
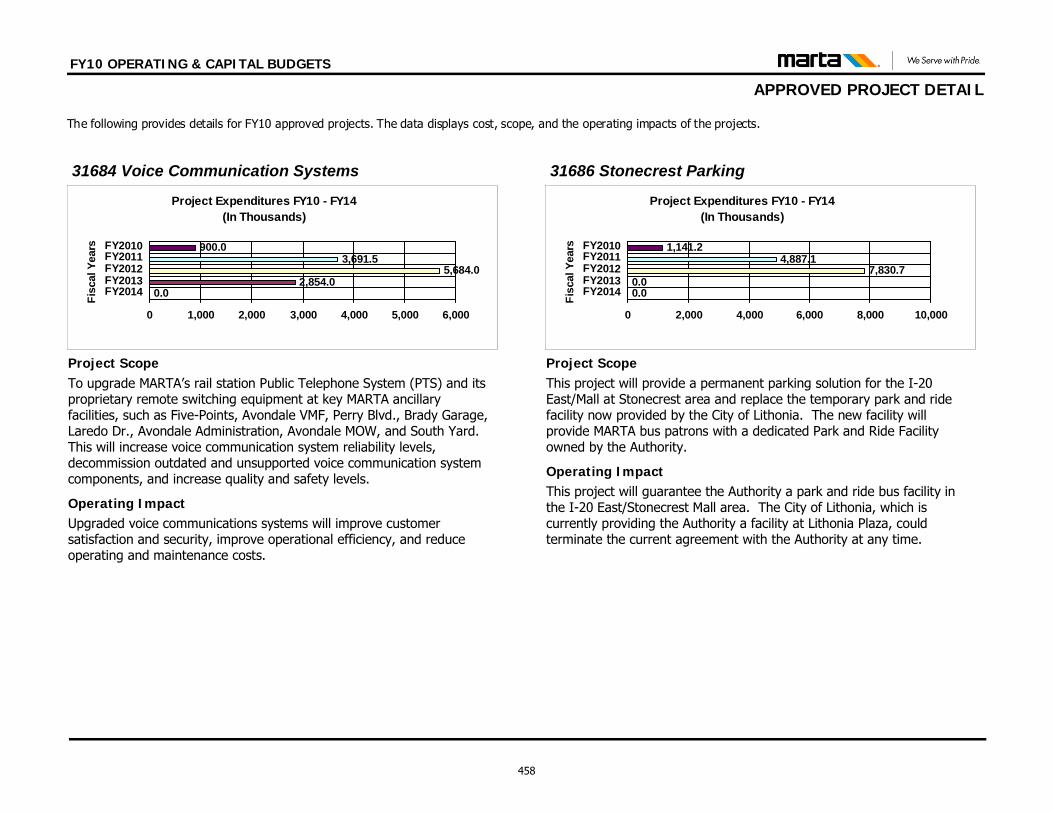
FY10 OPERATING & CAPITAL BUDGETS
APPROVED PROJECT DETAIL The following provides details for FY10 approved projects. The data displays cost, scope, and the operating impacts of the projects.
Upgraded voice communications systems will improve customer satisfaction and security, improve operational efficiency, and reduce operating and maintenance costs.
Operating Impact
Project ScopeTo upgrade MARTA’s rail station Public Telephone System (PTS) and its proprietary remote switching equipment at key MARTA ancillary facilities, such as Five-Points, Avondale VMF, Perry Blvd., Brady Garage, Laredo Dr., Avondale Administration, Avondale MOW, and South Yard. This will increase voice communication system reliability levels, decommission outdated and unsupported voice communication system components, and increase quality and safety levels.
Project Expenditures FY10 - FY14(In Thousands)
0.02,854.0
5,684.03,691.5
900.0
0 1,000 2,000 3,000 4,000 5,000 6,000
FY2014FY2013FY2012FY2011FY2010
Fisc
al Y
ears
31684 Voice Communication Systems
This project will guarantee the Authority a park and ride bus facility in the I-20 East/Stonecrest Mall area. The City of Lithonia, which is currently providing the Authority a facility at Lithonia Plaza, could terminate the current agreement with the Authority at any time.
Operating Impact
Project ScopeThis project will provide a permanent parking solution for the I-20 East/Mall at Stonecrest area and replace the temporary park and ride facility now provided by the City of Lithonia. The new facility will provide MARTA bus patrons with a dedicated Park and Ride Facility owned by the Authority.
Project Expenditures FY10 - FY14(In Thousands)
0.00.0
7,830.74,887.1
1,141.2
0 2,000 4,000 6,000 8,000 10,000
FY2014FY2013FY2012FY2011FY2010
Fisc
al Y
ears
31686 Stonecrest Parking
458
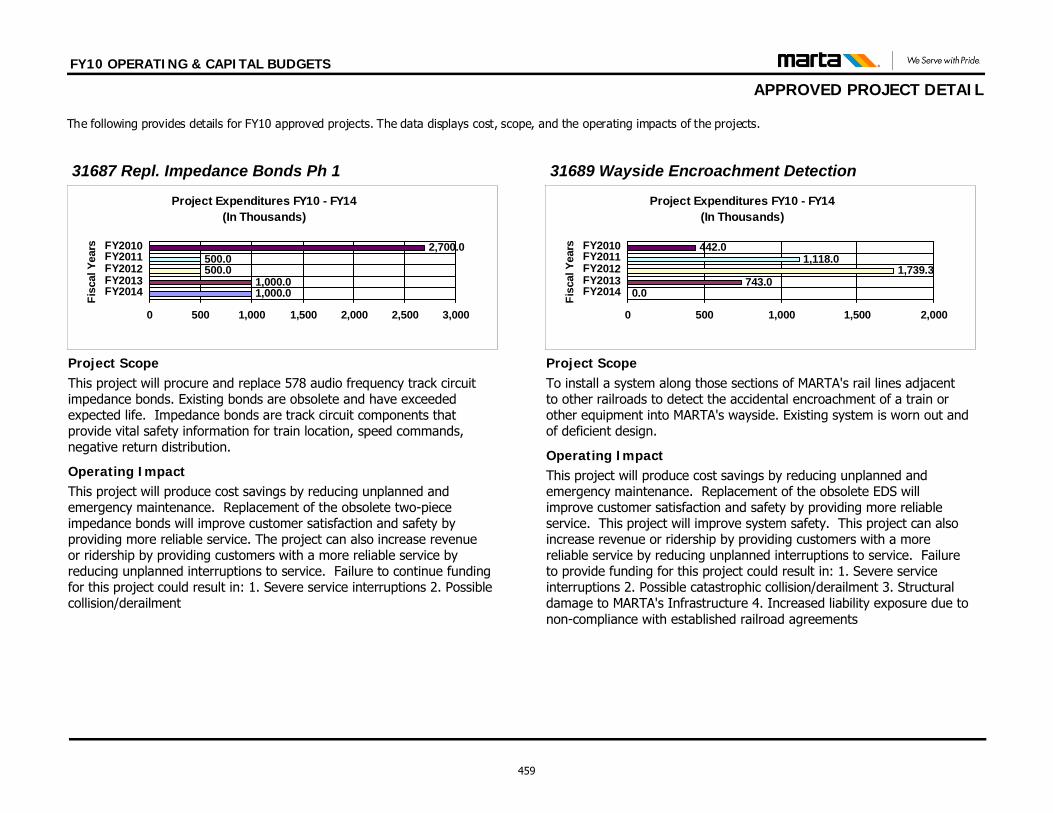
FY10 OPERATING & CAPITAL BUDGETS
APPROVED PROJECT DETAIL The following provides details for FY10 approved projects. The data displays cost, scope, and the operating impacts of the projects.
This project will produce cost savings by reducing unplanned and emergency maintenance. Replacement of the obsolete two-piece impedance bonds will improve customer satisfaction and safety by providing more reliable service. The project can also increase revenue or ridership by providing customers with a more reliable service by reducing unplanned interruptions to service. Failure to continue funding for this project could result in: 1. Severe service interruptions 2. Possible collision/derailment
Operating Impact
Project ScopeThis project will procure and replace 578 audio frequency track circuit impedance bonds. Existing bonds are obsolete and have exceeded expected life. Impedance bonds are track circuit components that provide vital safety information for train location, speed commands, negative return distribution.
Project Expenditures FY10 - FY14(In Thousands)
1,000.01,000.0
500.0500.0
2,700.0
0 500 1,000 1,500 2,000 2,500 3,000
FY2014FY2013FY2012FY2011FY2010
Fisc
al Y
ears
31687 Repl. Impedance Bonds Ph 1
This project will produce cost savings by reducing unplanned and emergency maintenance. Replacement of the obsolete EDS will improve customer satisfaction and safety by providing more reliable service. This project will improve system safety. This project can also increase revenue or ridership by providing customers with a more reliable service by reducing unplanned interruptions to service. Failure to provide funding for this project could result in: 1. Severe service interruptions 2. Possible catastrophic collision/derailment 3. Structural damage to MARTA's Infrastructure 4. Increased liability exposure due to non-compliance with established railroad agreements
Operating Impact
Project ScopeTo install a system along those sections of MARTA's rail lines adjacent to other railroads to detect the accidental encroachment of a train or other equipment into MARTA's wayside. Existing system is worn out and of deficient design.
Project Expenditures FY10 - FY14(In Thousands)
0.0743.0
1,739.31,118.0
442.0
0 500 1,000 1,500 2,000
FY2014FY2013FY2012FY2011FY2010
Fisc
al Y
ears
31689 Wayside Encroachment Detection
459
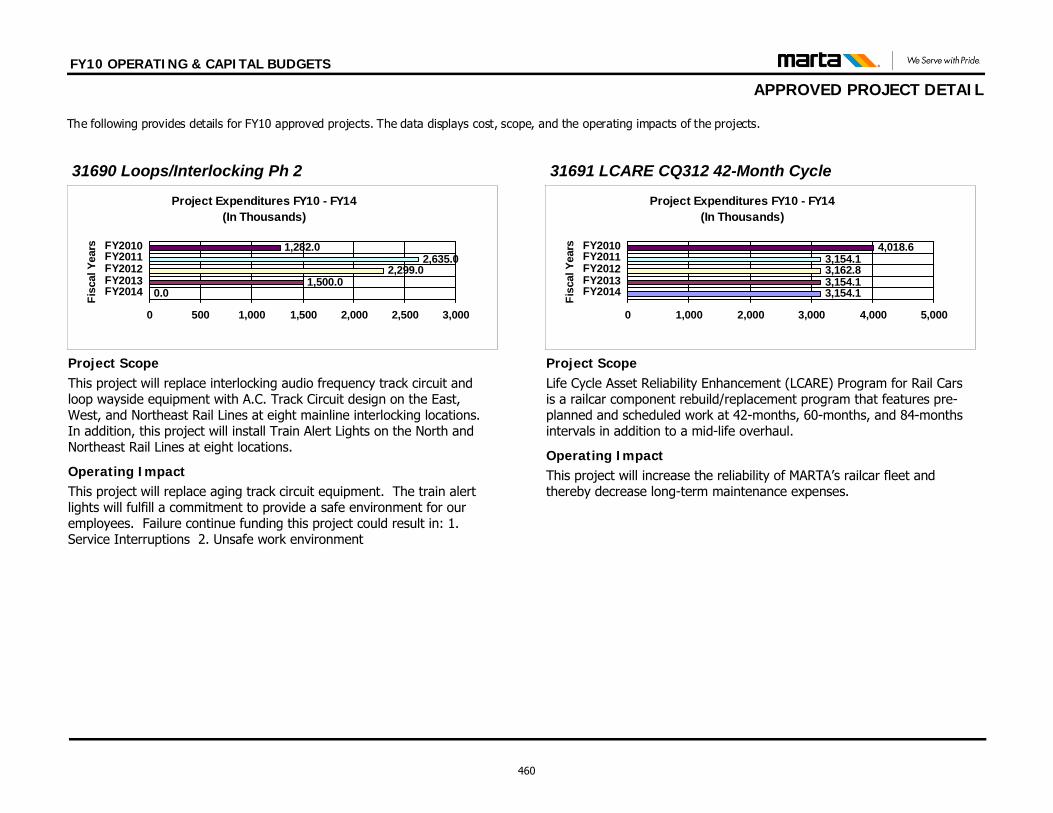
FY10 OPERATING & CAPITAL BUDGETS
APPROVED PROJECT DETAIL The following provides details for FY10 approved projects. The data displays cost, scope, and the operating impacts of the projects.
This project will replace aging track circuit equipment. The train alert lights will fulfill a commitment to provide a safe environment for our employees. Failure continue funding this project could result in: 1. Service Interruptions 2. Unsafe work environment
Operating Impact
Project ScopeThis project will replace interlocking audio frequency track circuit and loop wayside equipment with A.C. Track Circuit design on the East, West, and Northeast Rail Lines at eight mainline interlocking locations. In addition, this project will install Train Alert Lights on the North and Northeast Rail Lines at eight locations.
Project Expenditures FY10 - FY14(In Thousands)
0.01,500.0
2,299.02,635.0
1,282.0
0 500 1,000 1,500 2,000 2,500 3,000
FY2014FY2013FY2012FY2011FY2010
Fisc
al Y
ears
31690 Loops/Interlocking Ph 2
This project will increase the reliability of MARTA’s railcar fleet and thereby decrease long-term maintenance expenses.
Operating Impact
Project ScopeLife Cycle Asset Reliability Enhancement (LCARE) Program for Rail Cars is a railcar component rebuild/replacement program that features pre-planned and scheduled work at 42-months, 60-months, and 84-months intervals in addition to a mid-life overhaul.
Project Expenditures FY10 - FY14(In Thousands)
3,154.13,154.13,162.83,154.1
4,018.6
0 1,000 2,000 3,000 4,000 5,000
FY2014FY2013FY2012FY2011FY2010
Fisc
al Y
ears
31691 LCARE CQ312 42-Month Cycle
460
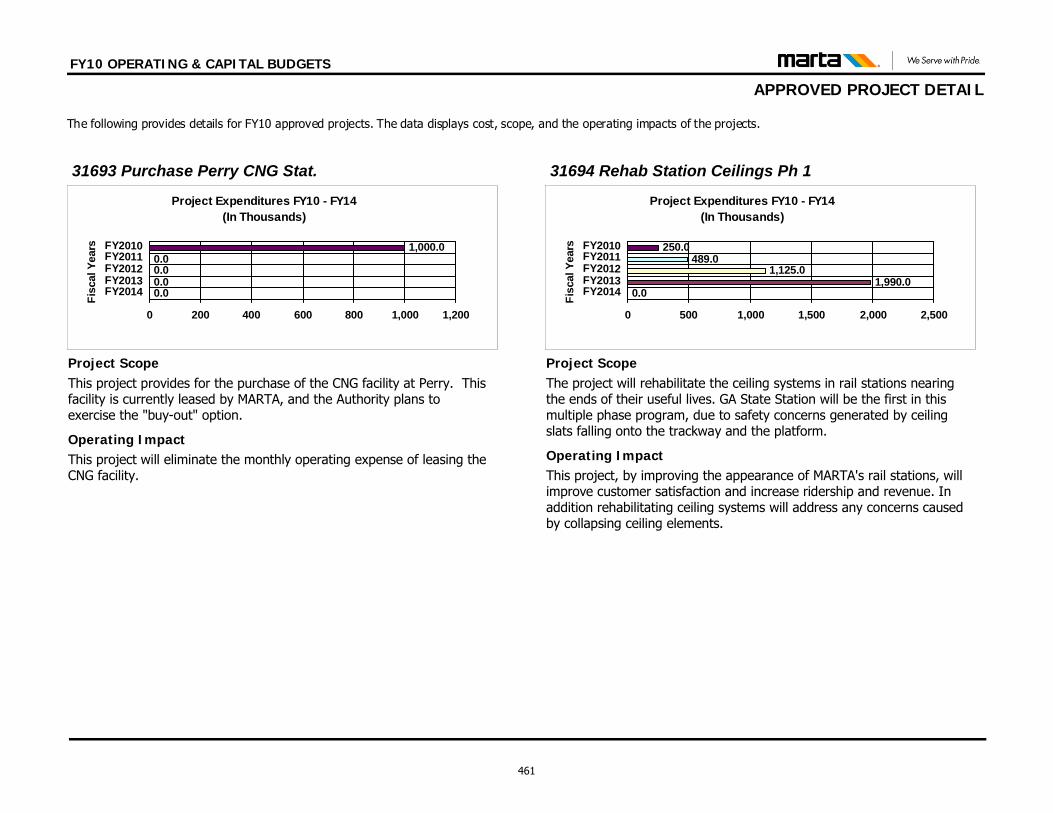
FY10 OPERATING & CAPITAL BUDGETS
APPROVED PROJECT DETAIL The following provides details for FY10 approved projects. The data displays cost, scope, and the operating impacts of the projects.
This project will eliminate the monthly operating expense of leasing the CNG facility.
Operating Impact
Project ScopeThis project provides for the purchase of the CNG facility at Perry. This facility is currently leased by MARTA, and the Authority plans to exercise the "buy-out" option.
Project Expenditures FY10 - FY14(In Thousands)
0.00.00.00.0
1,000.0
0 200 400 600 800 1,000 1,200
FY2014FY2013FY2012FY2011FY2010
Fisc
al Y
ears
31693 Purchase Perry CNG Stat.
This project, by improving the appearance of MARTA's rail stations, will improve customer satisfaction and increase ridership and revenue. In addition rehabilitating ceiling systems will address any concerns caused by collapsing ceiling elements.
Operating Impact
Project ScopeThe project will rehabilitate the ceiling systems in rail stations nearing the ends of their useful lives. GA State Station will be the first in this multiple phase program, due to safety concerns generated by ceiling slats falling onto the trackway and the platform.
Project Expenditures FY10 - FY14(In Thousands)
0.01,990.0
1,125.0489.0
250.0
0 500 1,000 1,500 2,000 2,500
FY2014FY2013FY2012FY2011FY2010
Fisc
al Y
ears
31694 Rehab Station Ceilings Ph 1
461
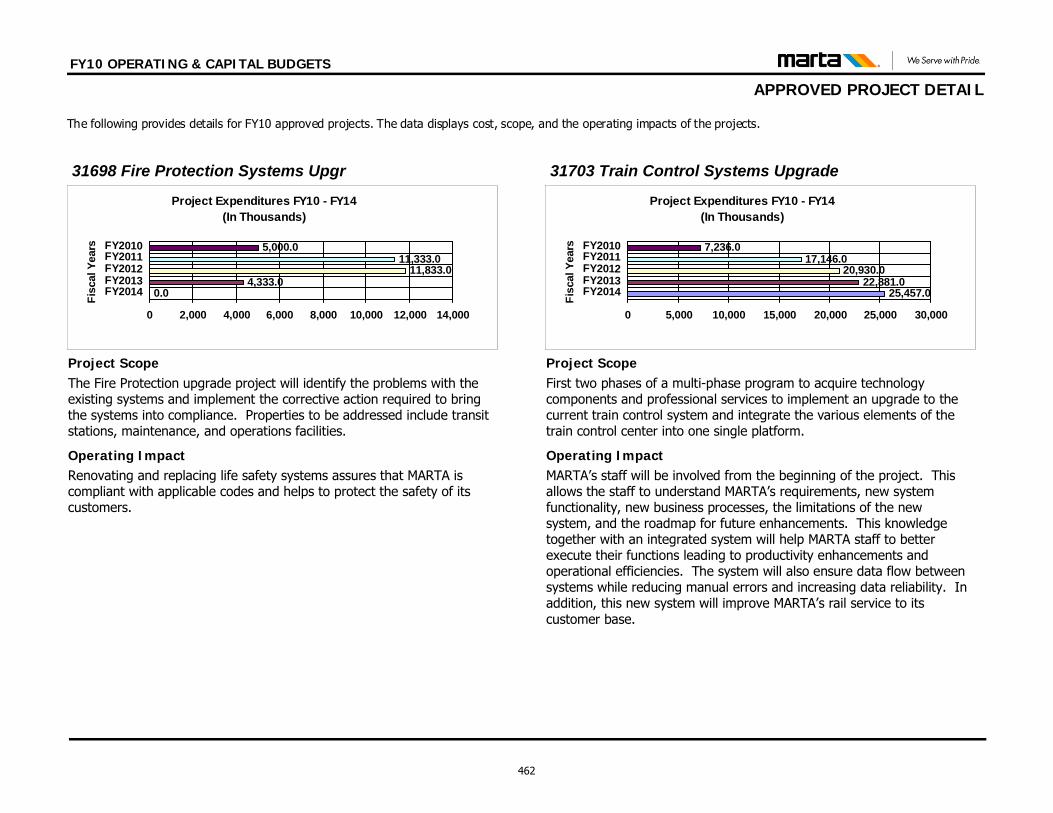
FY10 OPERATING & CAPITAL BUDGETS
APPROVED PROJECT DETAIL The following provides details for FY10 approved projects. The data displays cost, scope, and the operating impacts of the projects.
Renovating and replacing life safety systems assures that MARTA is compliant with applicable codes and helps to protect the safety of its customers.
Operating Impact
Project ScopeThe Fire Protection upgrade project will identify the problems with the existing systems and implement the corrective action required to bring the systems into compliance. Properties to be addressed include transit stations, maintenance, and operations facilities.
Project Expenditures FY10 - FY14(In Thousands)
0.04,333.0
11,833.011,333.0
5,000.0
0 2,000 4,000 6,000 8,000 10,000 12,000 14,000
FY2014FY2013FY2012FY2011FY2010
Fisc
al Y
ears
31698 Fire Protection Systems Upgr
MARTA’s staff will be involved from the beginning of the project. This allows the staff to understand MARTA’s requirements, new system functionality, new business processes, the limitations of the new system, and the roadmap for future enhancements. This knowledge together with an integrated system will help MARTA staff to better execute their functions leading to productivity enhancements and operational efficiencies. The system will also ensure data flow between systems while reducing manual errors and increasing data reliability. In addition, this new system will improve MARTA’s rail service to its customer base.
Operating Impact
Project ScopeFirst two phases of a multi-phase program to acquire technology components and professional services to implement an upgrade to the current train control system and integrate the various elements of the train control center into one single platform.
Project Expenditures FY10 - FY14(In Thousands)
25,457.022,881.0
20,930.017,146.0
7,236.0
0 5,000 10,000 15,000 20,000 25,000 30,000
FY2014FY2013FY2012FY2011FY2010
Fisc
al Y
ears
31703 Train Control Systems Upgrade
462
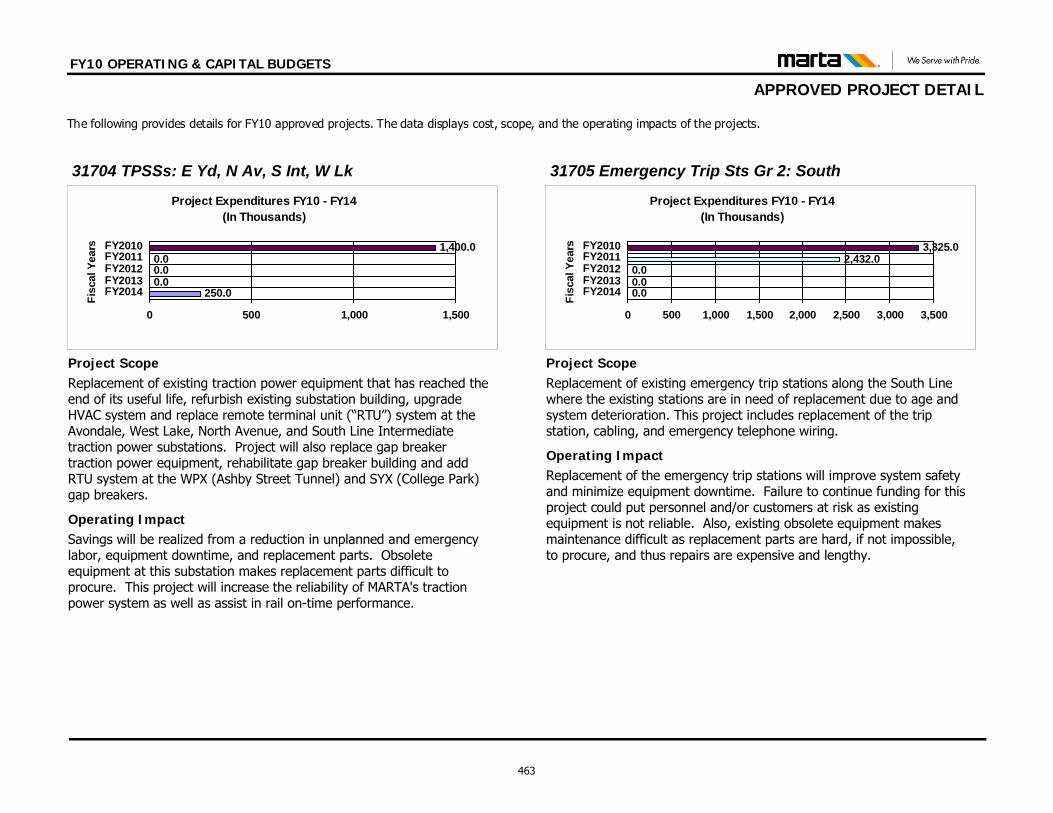
FY10 OPERATING & CAPITAL BUDGETS
APPROVED PROJECT DETAIL The following provides details for FY10 approved projects. The data displays cost, scope, and the operating impacts of the projects.
Savings will be realized from a reduction in unplanned and emergency labor, equipment downtime, and replacement parts. Obsolete equipment at this substation makes replacement parts difficult to procure. This project will increase the reliability of MARTA's traction power system as well as assist in rail on-time performance.
Operating Impact
Project ScopeReplacement of existing traction power equipment that has reached the end of its useful life, refurbish existing substation building, upgrade HVAC system and replace remote terminal unit (“RTU”) system at the Avondale, West Lake, North Avenue, and South Line Intermediate traction power substations. Project will also replace gap breaker traction power equipment, rehabilitate gap breaker building and add RTU system at the WPX (Ashby Street Tunnel) and SYX (College Park) gap breakers.
Project Expenditures FY10 - FY14(In Thousands)
250.00.00.00.0
1,400.0
0 500 1,000 1,500
FY2014FY2013FY2012FY2011FY2010
Fisc
al Y
ears
31704 TPSSs: E Yd, N Av, S Int, W Lk
Replacement of the emergency trip stations will improve system safety and minimize equipment downtime. Failure to continue funding for this project could put personnel and/or customers at risk as existing equipment is not reliable. Also, existing obsolete equipment makes maintenance difficult as replacement parts are hard, if not impossible, to procure, and thus repairs are expensive and lengthy.
Operating Impact
Project ScopeReplacement of existing emergency trip stations along the South Line where the existing stations are in need of replacement due to age and system deterioration. This project includes replacement of the trip station, cabling, and emergency telephone wiring.
Project Expenditures FY10 - FY14(In Thousands)
0.00.00.0
2,432.03,325.0
0 500 1,000 1,500 2,000 2,500 3,000 3,500
FY2014FY2013FY2012FY2011FY2010
Fisc
al Y
ears
31705 Emergency Trip Sts Gr 2: South
463
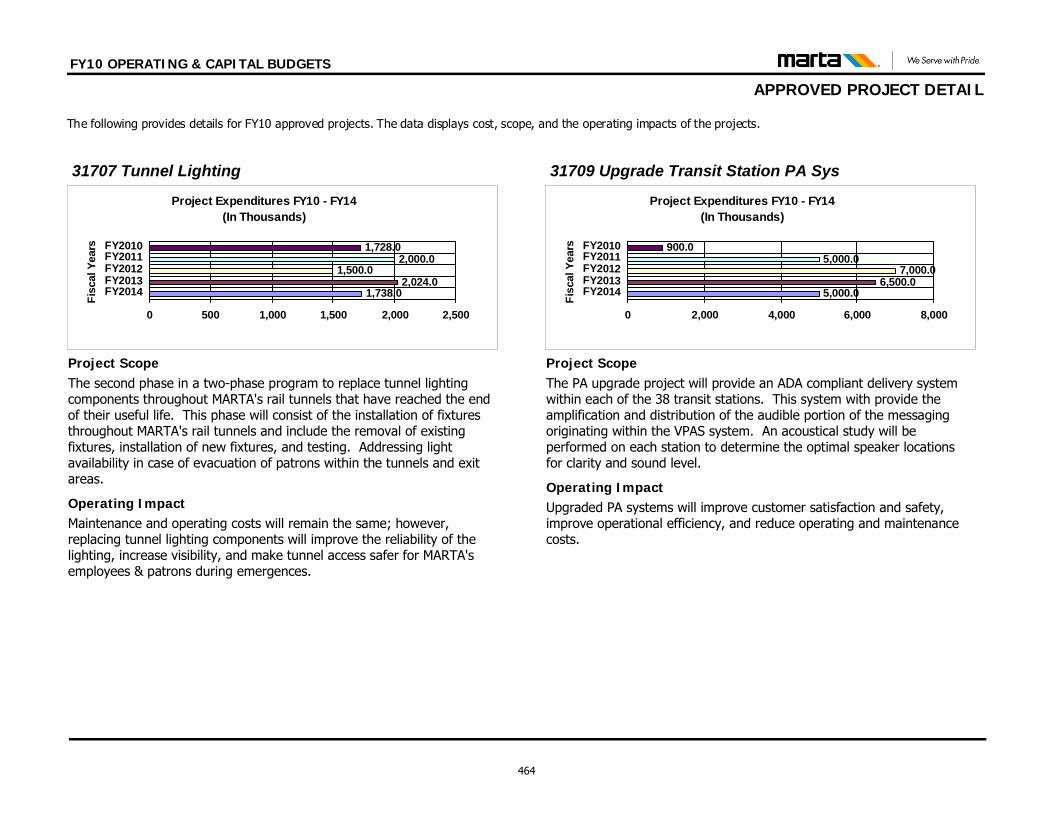
FY10 OPERATING & CAPITAL BUDGETS
APPROVED PROJECT DETAIL The following provides details for FY10 approved projects. The data displays cost, scope, and the operating impacts of the projects.
Maintenance and operating costs will remain the same; however, replacing tunnel lighting components will improve the reliability of the lighting, increase visibility, and make tunnel access safer for MARTA's employees & patrons during emergences.
Operating Impact
Project ScopeThe second phase in a two-phase program to replace tunnel lighting components throughout MARTA's rail tunnels that have reached the end of their useful life. This phase will consist of the installation of fixtures throughout MARTA's rail tunnels and include the removal of existing fixtures, installation of new fixtures, and testing. Addressing light availability in case of evacuation of patrons within the tunnels and exit areas.
Project Expenditures FY10 - FY14(In Thousands)
1,738.02,024.0
1,500.02,000.0
1,728.0
0 500 1,000 1,500 2,000 2,500
FY2014FY2013FY2012FY2011FY2010
Fisc
al Y
ears
31707 Tunnel Lighting
Upgraded PA systems will improve customer satisfaction and safety, improve operational efficiency, and reduce operating and maintenance costs.
Operating Impact
Project ScopeThe PA upgrade project will provide an ADA compliant delivery system within each of the 38 transit stations. This system with provide the amplification and distribution of the audible portion of the messaging originating within the VPAS system. An acoustical study will be performed on each station to determine the optimal speaker locations for clarity and sound level.
Project Expenditures FY10 - FY14(In Thousands)
5,000.06,500.0
7,000.05,000.0
900.0
0 2,000 4,000 6,000 8,000
FY2014FY2013FY2012FY2011FY2010
Fisc
al Y
ears
31709 Upgrade Transit Station PA Sys
464
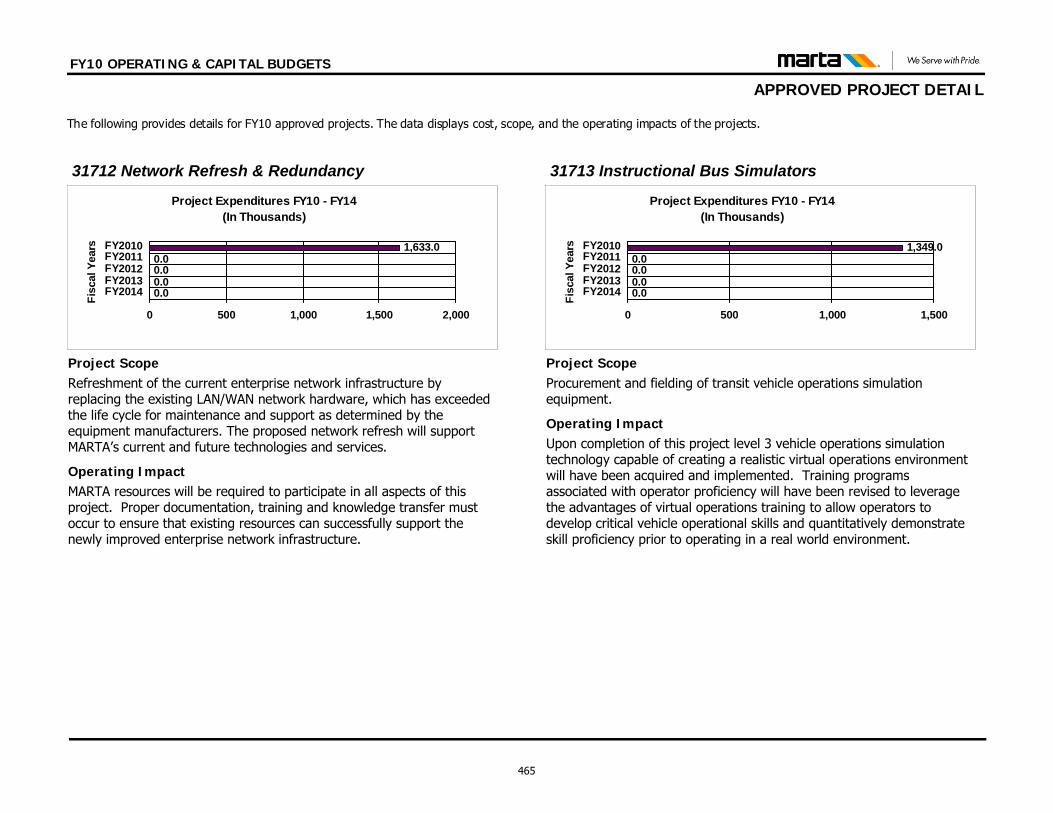
FY10 OPERATING & CAPITAL BUDGETS
APPROVED PROJECT DETAIL The following provides details for FY10 approved projects. The data displays cost, scope, and the operating impacts of the projects.
MARTA resources will be required to participate in all aspects of this project. Proper documentation, training and knowledge transfer must occur to ensure that existing resources can successfully support the newly improved enterprise network infrastructure.
Operating Impact
Project ScopeRefreshment of the current enterprise network infrastructure by replacing the existing LAN/WAN network hardware, which has exceeded the life cycle for maintenance and support as determined by the equipment manufacturers. The proposed network refresh will support MARTA’s current and future technologies and services.
Project Expenditures FY10 - FY14(In Thousands)
0.00.00.00.0
1,633.0
0 500 1,000 1,500 2,000
FY2014FY2013FY2012FY2011FY2010
Fisc
al Y
ears
31712 Network Refresh & Redundancy
Upon completion of this project level 3 vehicle operations simulation technology capable of creating a realistic virtual operations environment will have been acquired and implemented. Training programs associated with operator proficiency will have been revised to leverage the advantages of virtual operations training to allow operators to develop critical vehicle operational skills and quantitatively demonstrate skill proficiency prior to operating in a real world environment.
Operating Impact
Project ScopeProcurement and fielding of transit vehicle operations simulation equipment.
Project Expenditures FY10 - FY14(In Thousands)
0.00.00.00.0
1,349.0
0 500 1,000 1,500
FY2014FY2013FY2012FY2011FY2010
Fisc
al Y
ears
31713 Instructional Bus Simulators
465
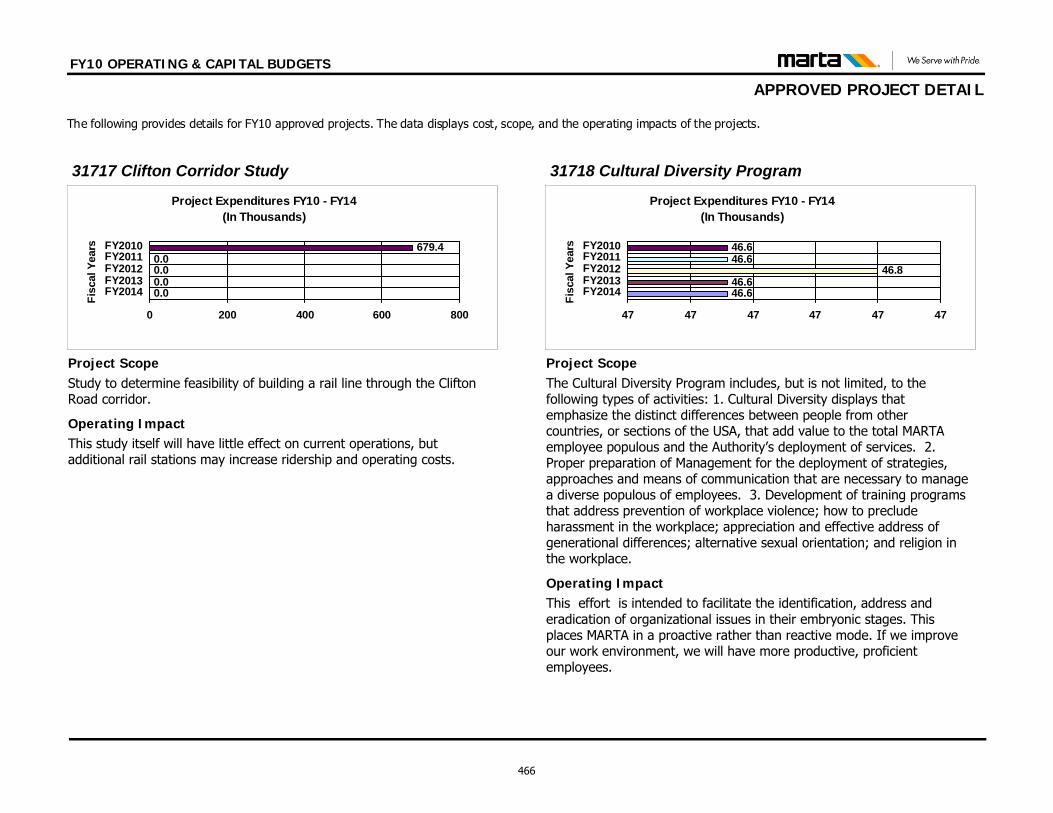
FY10 OPERATING & CAPITAL BUDGETS
APPROVED PROJECT DETAIL The following provides details for FY10 approved projects. The data displays cost, scope, and the operating impacts of the projects.
This study itself will have little effect on current operations, but additional rail stations may increase ridership and operating costs.
Operating Impact
Project ScopeStudy to determine feasibility of building a rail line through the Clifton Road corridor.
Project Expenditures FY10 - FY14(In Thousands)
0.00.00.00.0
679.4
0 200 400 600 800
FY2014FY2013FY2012FY2011FY2010
Fisc
al Y
ears
31717 Clifton Corridor Study
This effort is intended to facilitate the identification, address and eradication of organizational issues in their embryonic stages. This places MARTA in a proactive rather than reactive mode. If we improve our work environment, we will have more productive, proficient employees.
Operating Impact
Project ScopeThe Cultural Diversity Program includes, but is not limited, to the following types of activities: 1. Cultural Diversity displays that emphasize the distinct differences between people from other countries, or sections of the USA, that add value to the total MARTA employee populous and the Authority’s deployment of services. 2. Proper preparation of Management for the deployment of strategies, approaches and means of communication that are necessary to manage a diverse populous of employees. 3. Development of training programs that address prevention of workplace violence; how to preclude harassment in the workplace; appreciation and effective address of generational differences; alternative sexual orientation; and religion in the workplace.
Project Expenditures FY10 - FY14(In Thousands)
46.646.6
46.846.646.6
47 47 47 47 47 47
FY2014FY2013FY2012FY2011FY2010
Fisc
al Y
ears
31718 Cultural Diversity Program
466
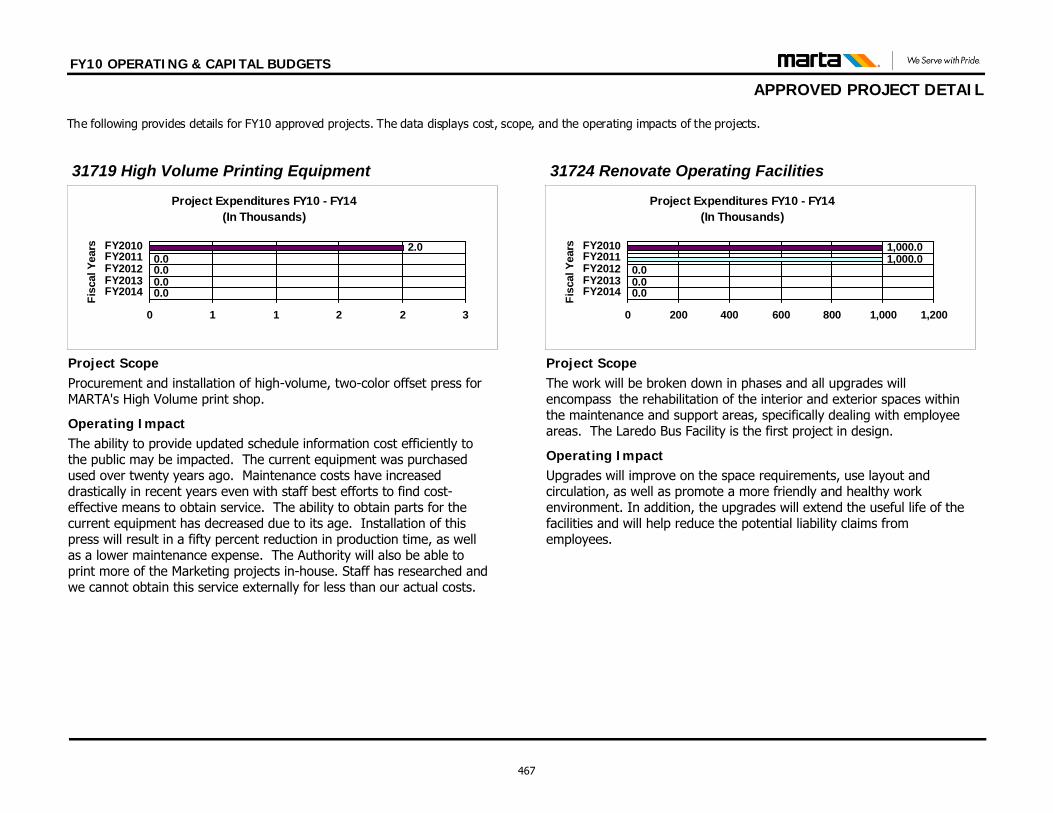
FY10 OPERATING & CAPITAL BUDGETS
APPROVED PROJECT DETAIL The following provides details for FY10 approved projects. The data displays cost, scope, and the operating impacts of the projects.
The ability to provide updated schedule information cost efficiently to the public may be impacted. The current equipment was purchased used over twenty years ago. Maintenance costs have increased drastically in recent years even with staff best efforts to find cost-effective means to obtain service. The ability to obtain parts for the current equipment has decreased due to its age. Installation of this press will result in a fifty percent reduction in production time, as well as a lower maintenance expense. The Authority will also be able to print more of the Marketing projects in-house. Staff has researched and we cannot obtain this service externally for less than our actual costs.
Operating Impact
Project ScopeProcurement and installation of high-volume, two-color offset press for MARTA's High Volume print shop.
Project Expenditures FY10 - FY14(In Thousands)
0.00.00.00.0
2.0
0 1 1 2 2 3
FY2014FY2013FY2012FY2011FY2010
Fisc
al Y
ears
31719 High Volume Printing Equipment
Upgrades will improve on the space requirements, use layout and circulation, as well as promote a more friendly and healthy work environment. In addition, the upgrades will extend the useful life of the facilities and will help reduce the potential liability claims from employees.
Operating Impact
Project ScopeThe work will be broken down in phases and all upgrades will encompass the rehabilitation of the interior and exterior spaces within the maintenance and support areas, specifically dealing with employee areas. The Laredo Bus Facility is the first project in design.
Project Expenditures FY10 - FY14(In Thousands)
0.00.00.0
1,000.01,000.0
0 200 400 600 800 1,000 1,200
FY2014FY2013FY2012FY2011FY2010
Fisc
al Y
ears
31724 Renovate Operating Facilities
467
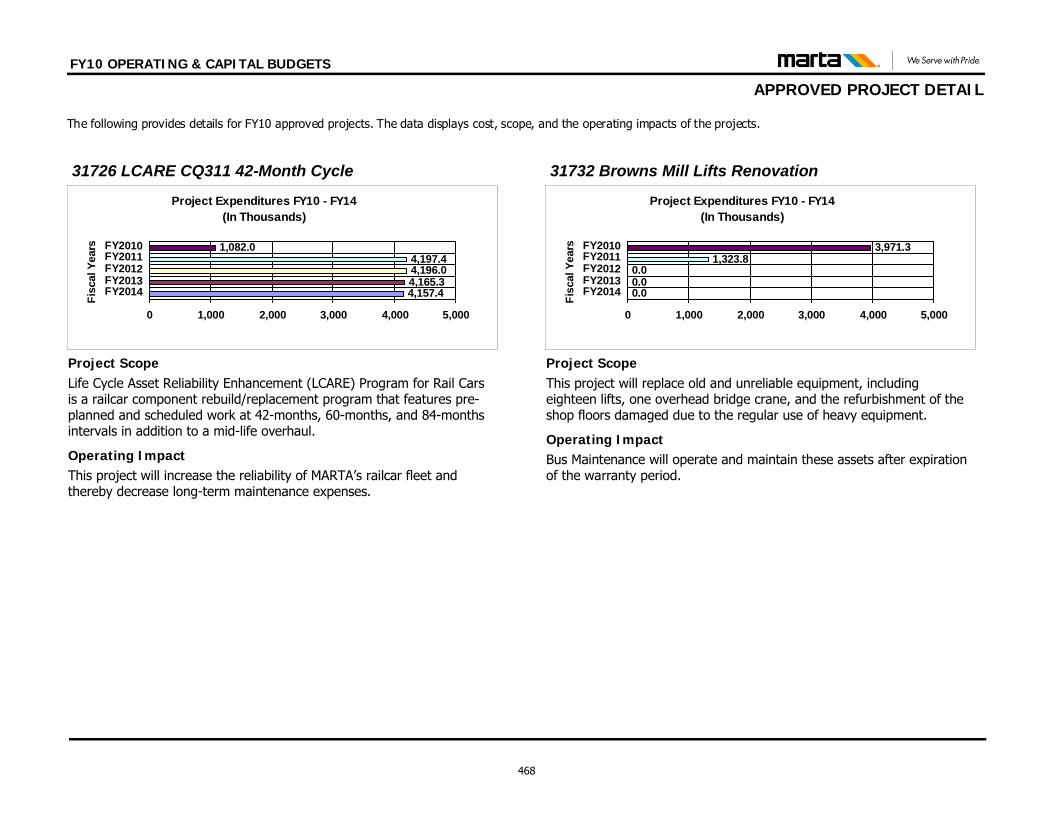
FY10 OPERATING & CAPITAL BUDGETS
APPROVED PROJECT DETAIL The following provides details for FY10 approved projects. The data displays cost, scope, and the operating impacts of the projects.
This project will increase the reliability of MARTA’s railcar fleet and thereby decrease long-term maintenance expenses.
Operating Impact
Project ScopeLife Cycle Asset Reliability Enhancement (LCARE) Program for Rail Cars is a railcar component rebuild/replacement program that features pre-planned and scheduled work at 42-months, 60-months, and 84-months intervals in addition to a mid-life overhaul.
Project Expenditures FY10 - FY14(In Thousands)
4,157.44,165.34,196.04,197.4
1,082.0
0 1,000 2,000 3,000 4,000 5,000
FY2014FY2013FY2012FY2011FY2010
Fisc
al Y
ears
31726 LCARE CQ311 42-Month Cycle
Bus Maintenance will operate and maintain these assets after expiration of the warranty period.
Operating Impact
Project ScopeThis project will replace old and unreliable equipment, including eighteen lifts, one overhead bridge crane, and the refurbishment of the shop floors damaged due to the regular use of heavy equipment.
Project Expenditures FY10 - FY14(In Thousands)
0.00.00.0
1,323.83,971.3
0 1,000 2,000 3,000 4,000 5,000
FY2014FY2013FY2012FY2011FY2010
Fisc
al Y
ears
31732 Browns Mill Lifts Renovation
468
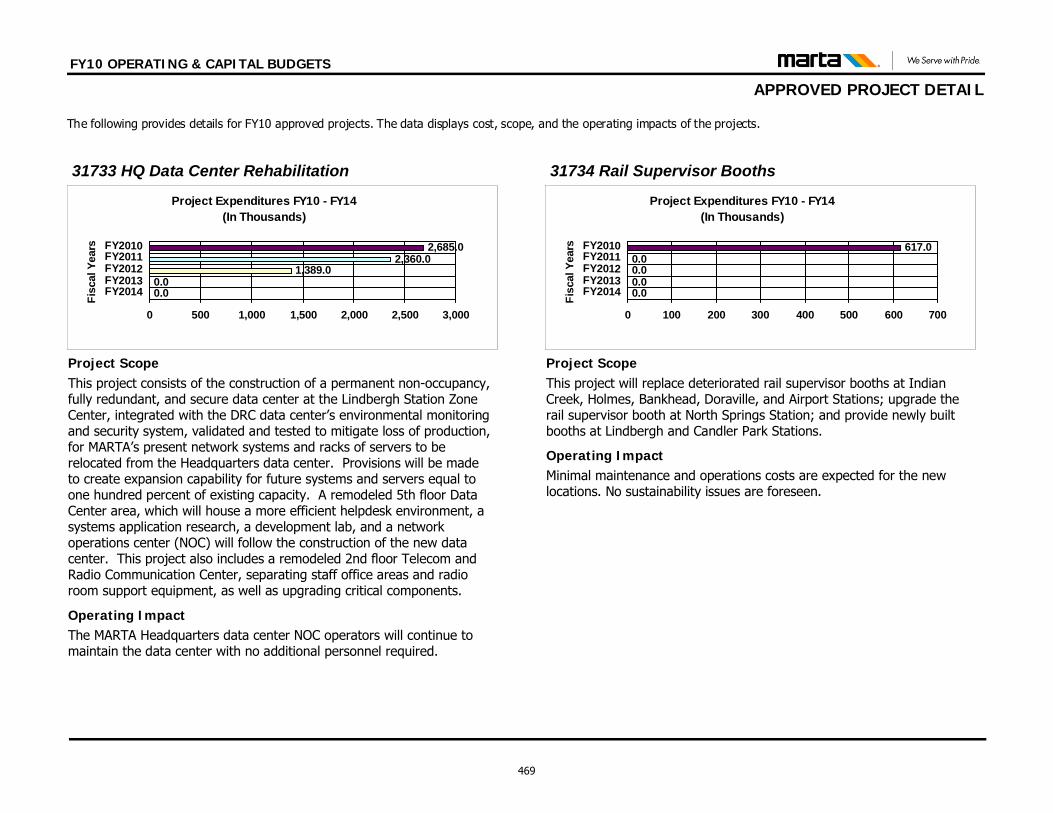
FY10 OPERATING & CAPITAL BUDGETS
APPROVED PROJECT DETAIL The following provides details for FY10 approved projects. The data displays cost, scope, and the operating impacts of the projects.
The MARTA Headquarters data center NOC operators will continue to maintain the data center with no additional personnel required.
Operating Impact
Project ScopeThis project consists of the construction of a permanent non-occupancy, fully redundant, and secure data center at the Lindbergh Station Zone Center, integrated with the DRC data center’s environmental monitoring and security system, validated and tested to mitigate loss of production, for MARTA’s present network systems and racks of servers to be relocated from the Headquarters data center. Provisions will be made to create expansion capability for future systems and servers equal to one hundred percent of existing capacity. A remodeled 5th floor Data Center area, which will house a more efficient helpdesk environment, a systems application research, a development lab, and a network operations center (NOC) will follow the construction of the new data center. This project also includes a remodeled 2nd floor Telecom and Radio Communication Center, separating staff office areas and radio room support equipment, as well as upgrading critical components.
Project Expenditures FY10 - FY14(In Thousands)
0.00.0
1,389.02,360.0
2,685.0
0 500 1,000 1,500 2,000 2,500 3,000
FY2014FY2013FY2012FY2011FY2010
Fisc
al Y
ears
31733 HQ Data Center Rehabilitation
Minimal maintenance and operations costs are expected for the new locations. No sustainability issues are foreseen.
Operating Impact
Project ScopeThis project will replace deteriorated rail supervisor booths at Indian Creek, Holmes, Bankhead, Doraville, and Airport Stations; upgrade the rail supervisor booth at North Springs Station; and provide newly built booths at Lindbergh and Candler Park Stations.
Project Expenditures FY10 - FY14(In Thousands)
0.00.00.00.0
617.0
0 100 200 300 400 500 600 700
FY2014FY2013FY2012FY2011FY2010
Fisc
al Y
ears
31734 Rail Supervisor Booths
469
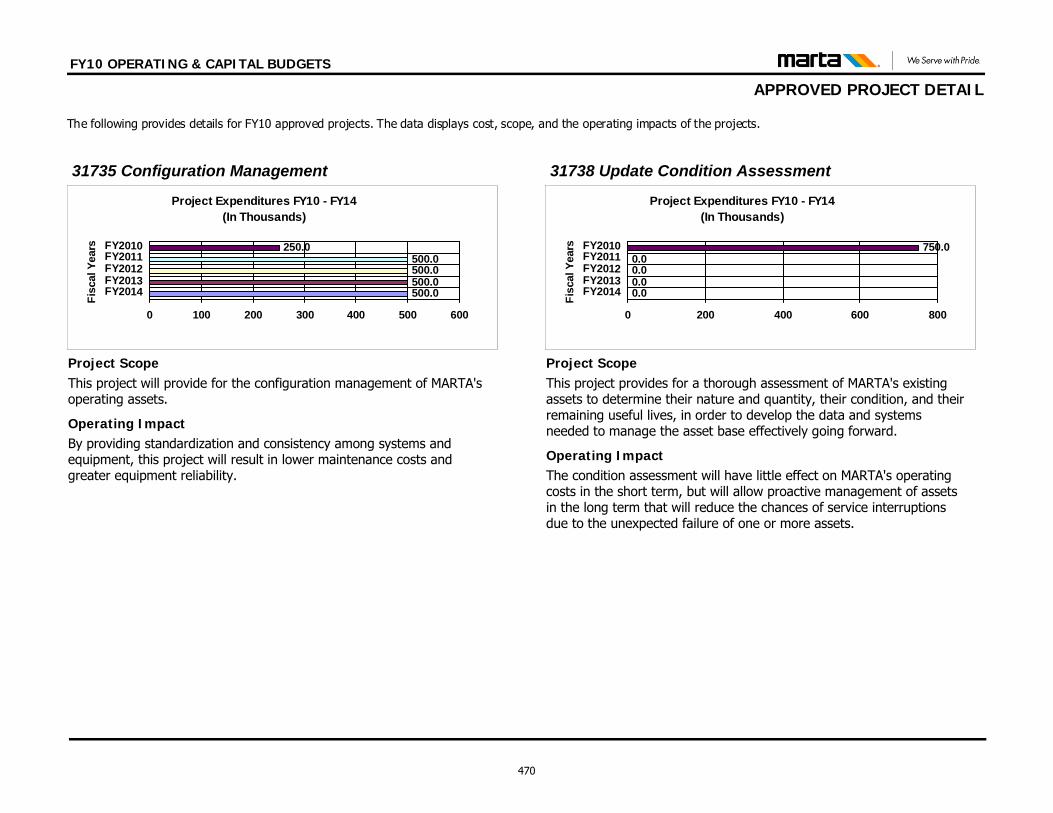
FY10 OPERATING & CAPITAL BUDGETS
APPROVED PROJECT DETAIL The following provides details for FY10 approved projects. The data displays cost, scope, and the operating impacts of the projects.
By providing standardization and consistency among systems and equipment, this project will result in lower maintenance costs and greater equipment reliability.
Operating Impact
Project ScopeThis project will provide for the configuration management of MARTA's operating assets.
Project Expenditures FY10 - FY14(In Thousands)
500.0500.0500.0500.0
250.0
0 100 200 300 400 500 600
FY2014FY2013FY2012FY2011FY2010
Fisc
al Y
ears
31735 Configuration Management
The condition assessment will have little effect on MARTA's operating costs in the short term, but will allow proactive management of assets in the long term that will reduce the chances of service interruptions due to the unexpected failure of one or more assets.
Operating Impact
Project ScopeThis project provides for a thorough assessment of MARTA's existing assets to determine their nature and quantity, their condition, and their remaining useful lives, in order to develop the data and systems needed to manage the asset base effectively going forward.
Project Expenditures FY10 - FY14(In Thousands)
0.00.00.00.0
750.0
0 200 400 600 800
FY2014FY2013FY2012FY2011FY2010
Fisc
al Y
ears
31738 Update Condition Assessment
470
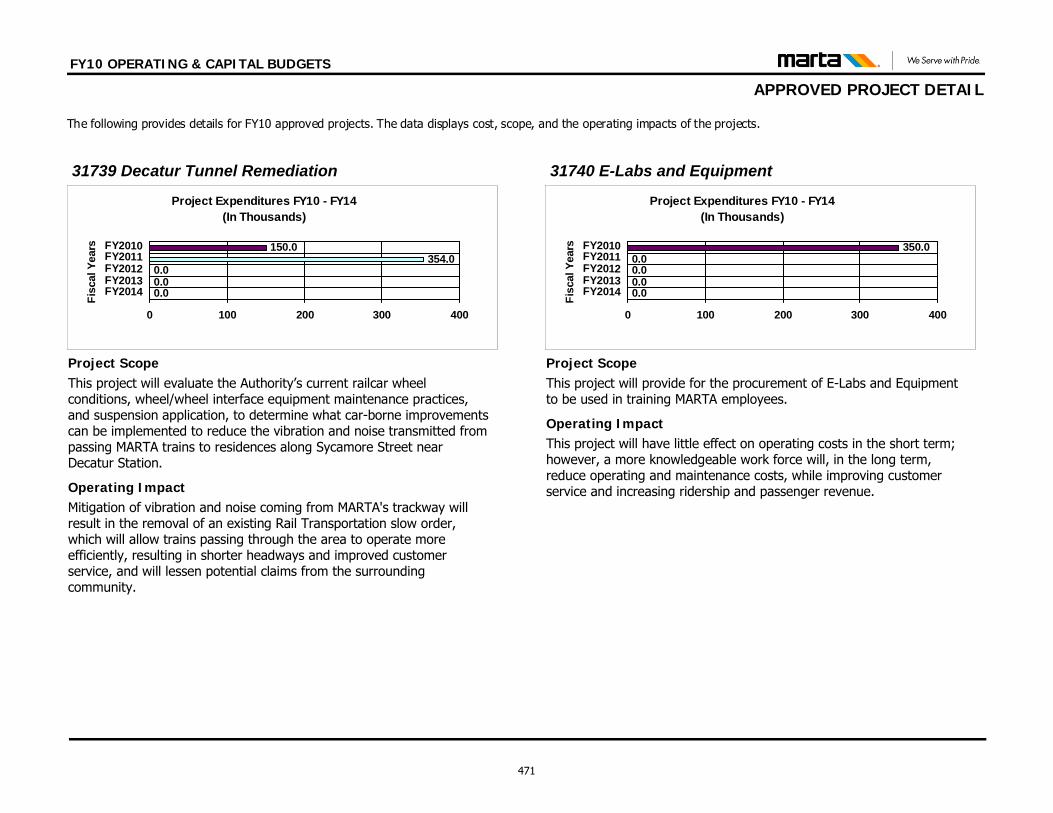
FY10 OPERATING & CAPITAL BUDGETS
APPROVED PROJECT DETAIL The following provides details for FY10 approved projects. The data displays cost, scope, and the operating impacts of the projects.
Mitigation of vibration and noise coming from MARTA's trackway will result in the removal of an existing Rail Transportation slow order, which will allow trains passing through the area to operate more efficiently, resulting in shorter headways and improved customer service, and will lessen potential claims from the surrounding community.
Operating Impact
Project ScopeThis project will evaluate the Authority’s current railcar wheel conditions, wheel/wheel interface equipment maintenance practices, and suspension application, to determine what car-borne improvements can be implemented to reduce the vibration and noise transmitted from passing MARTA trains to residences along Sycamore Street near Decatur Station.
Project Expenditures FY10 - FY14(In Thousands)
0.00.00.0
354.0150.0
0 100 200 300 400
FY2014FY2013FY2012FY2011FY2010
Fisc
al Y
ears
31739 Decatur Tunnel Remediation
This project will have little effect on operating costs in the short term; however, a more knowledgeable work force will, in the long term, reduce operating and maintenance costs, while improving customer service and increasing ridership and passenger revenue.
Operating Impact
Project ScopeThis project will provide for the procurement of E-Labs and Equipment to be used in training MARTA employees.
Project Expenditures FY10 - FY14(In Thousands)
0.00.00.00.0
350.0
0 100 200 300 400
FY2014FY2013FY2012FY2011FY2010
Fisc
al Y
ears
31740 E-Labs and Equipment
471
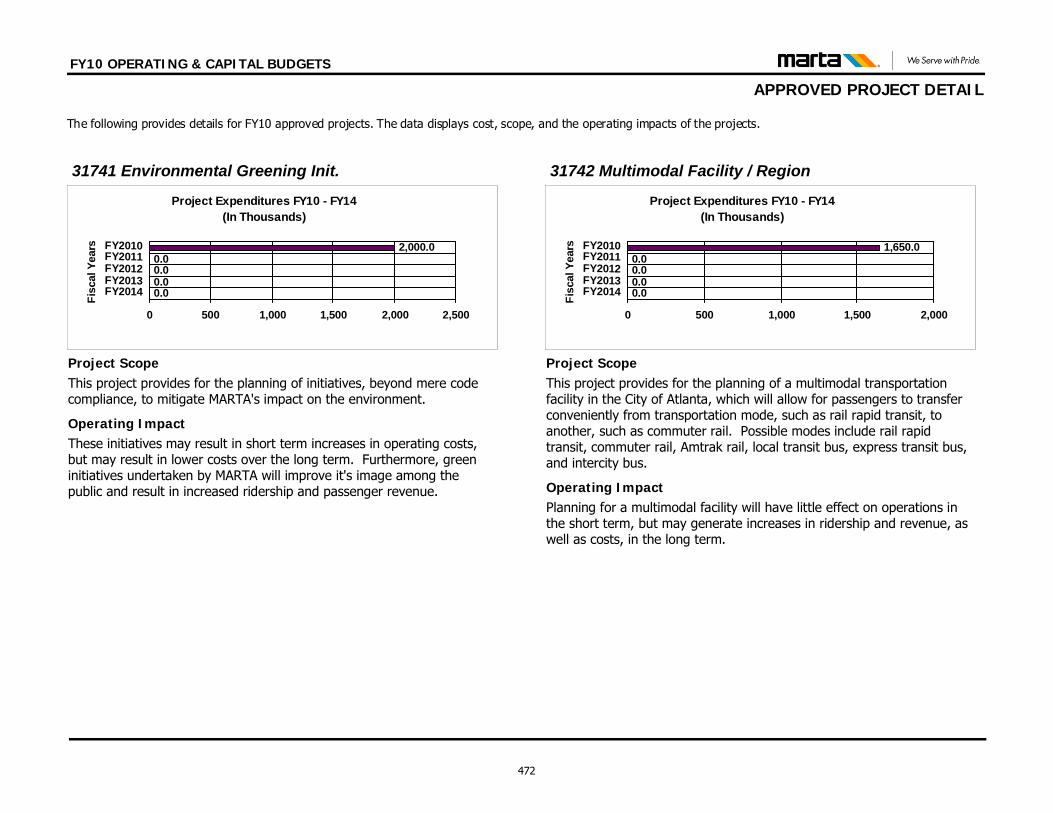
FY10 OPERATING & CAPITAL BUDGETS
APPROVED PROJECT DETAIL The following provides details for FY10 approved projects. The data displays cost, scope, and the operating impacts of the projects.
These initiatives may result in short term increases in operating costs, but may result in lower costs over the long term. Furthermore, green initiatives undertaken by MARTA will improve it's image among the public and result in increased ridership and passenger revenue.
Operating Impact
Project ScopeThis project provides for the planning of initiatives, beyond mere code compliance, to mitigate MARTA's impact on the environment.
Project Expenditures FY10 - FY14(In Thousands)
0.00.00.00.0
2,000.0
0 500 1,000 1,500 2,000 2,500
FY2014FY2013FY2012FY2011FY2010
Fisc
al Y
ears
31741 Environmental Greening Init.
Planning for a multimodal facility will have little effect on operations in the short term, but may generate increases in ridership and revenue, as well as costs, in the long term.
Operating Impact
Project ScopeThis project provides for the planning of a multimodal transportation facility in the City of Atlanta, which will allow for passengers to transfer conveniently from transportation mode, such as rail rapid transit, to another, such as commuter rail. Possible modes include rail rapid transit, commuter rail, Amtrak rail, local transit bus, express transit bus, and intercity bus.
Project Expenditures FY10 - FY14(In Thousands)
0.00.00.00.0
1,650.0
0 500 1,000 1,500 2,000
FY2014FY2013FY2012FY2011FY2010
Fisc
al Y
ears
31742 Multimodal Facility / Region
472
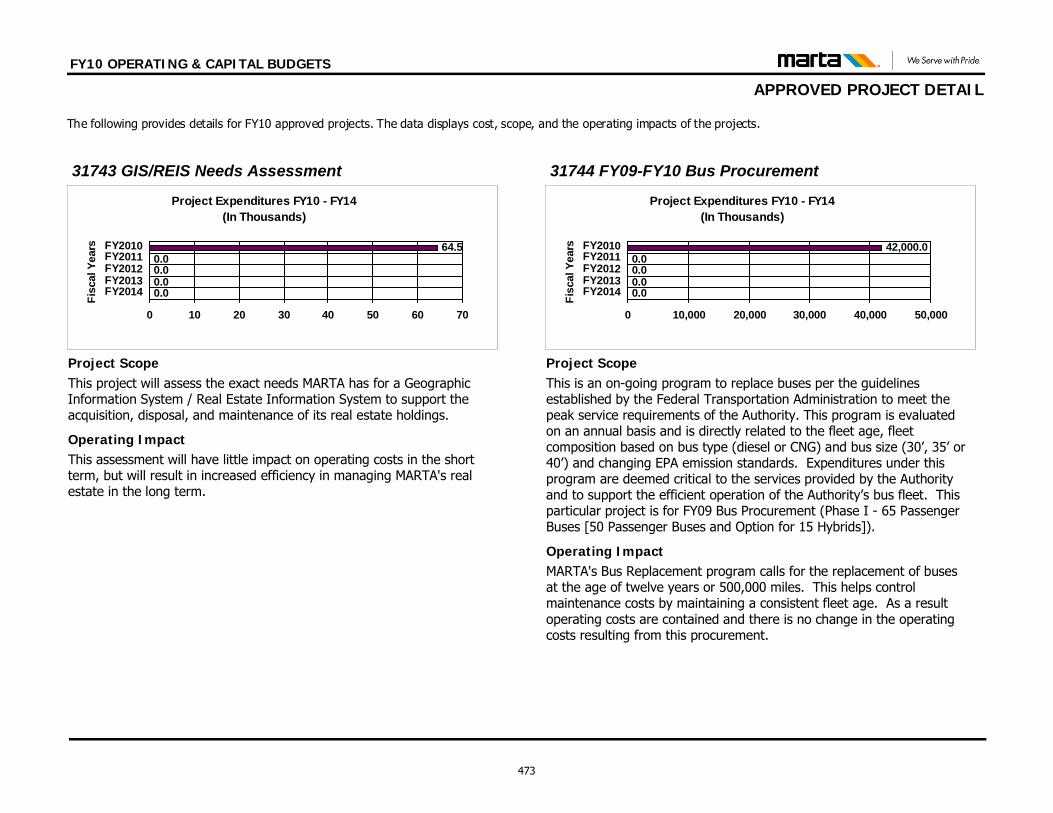
FY10 OPERATING & CAPITAL BUDGETS
APPROVED PROJECT DETAIL The following provides details for FY10 approved projects. The data displays cost, scope, and the operating impacts of the projects.
This assessment will have little impact on operating costs in the short term, but will result in increased efficiency in managing MARTA's real estate in the long term.
Operating Impact
Project ScopeThis project will assess the exact needs MARTA has for a Geographic Information System / Real Estate Information System to support the acquisition, disposal, and maintenance of its real estate holdings.
Project Expenditures FY10 - FY14(In Thousands)
0.00.00.00.0
64.5
0 10 20 30 40 50 60 70
FY2014FY2013FY2012FY2011FY2010
Fisc
al Y
ears
31743 GIS/REIS Needs Assessment
MARTA's Bus Replacement program calls for the replacement of buses at the age of twelve years or 500,000 miles. This helps control maintenance costs by maintaining a consistent fleet age. As a result operating costs are contained and there is no change in the operating costs resulting from this procurement.
Operating Impact
Project ScopeThis is an on-going program to replace buses per the guidelines established by the Federal Transportation Administration to meet the peak service requirements of the Authority. This program is evaluated on an annual basis and is directly related to the fleet age, fleet composition based on bus type (diesel or CNG) and bus size (30’, 35’ or 40’) and changing EPA emission standards. Expenditures under this program are deemed critical to the services provided by the Authority and to support the efficient operation of the Authority’s bus fleet. This particular project is for FY09 Bus Procurement (Phase I - 65 Passenger Buses [50 Passenger Buses and Option for 15 Hybrids]).
Project Expenditures FY10 - FY14(In Thousands)
0.00.00.00.0
42,000.0
0 10,000 20,000 30,000 40,000 50,000
FY2014FY2013FY2012FY2011FY2010
Fisc
al Y
ears
31744 FY09-FY10 Bus Procurement
473
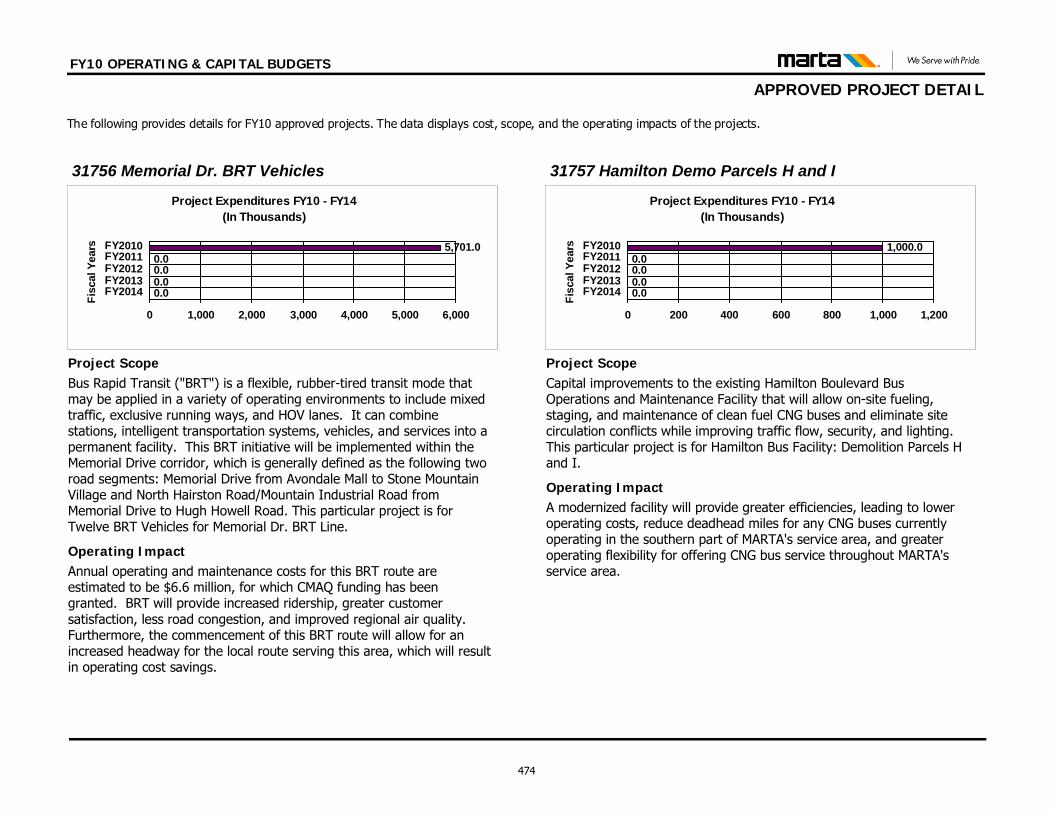
FY10 OPERATING & CAPITAL BUDGETS
APPROVED PROJECT DETAIL The following provides details for FY10 approved projects. The data displays cost, scope, and the operating impacts of the projects.
Annual operating and maintenance costs for this BRT route are estimated to be $6.6 million, for which CMAQ funding has been granted. BRT will provide increased ridership, greater customer satisfaction, less road congestion, and improved regional air quality. Furthermore, the commencement of this BRT route will allow for an increased headway for the local route serving this area, which will result in operating cost savings.
Operating Impact
Project ScopeBus Rapid Transit ("BRT") is a flexible, rubber-tired transit mode that may be applied in a variety of operating environments to include mixed traffic, exclusive running ways, and HOV lanes. It can combine stations, intelligent transportation systems, vehicles, and services into a permanent facility. This BRT initiative will be implemented within the Memorial Drive corridor, which is generally defined as the following two road segments: Memorial Drive from Avondale Mall to Stone Mountain Village and North Hairston Road/Mountain Industrial Road from Memorial Drive to Hugh Howell Road. This particular project is for Twelve BRT Vehicles for Memorial Dr. BRT Line.
Project Expenditures FY10 - FY14(In Thousands)
0.00.00.00.0
5,701.0
0 1,000 2,000 3,000 4,000 5,000 6,000
FY2014FY2013FY2012FY2011FY2010
Fisc
al Y
ears
31756 Memorial Dr. BRT Vehicles
A modernized facility will provide greater efficiencies, leading to lower operating costs, reduce deadhead miles for any CNG buses currently operating in the southern part of MARTA's service area, and greater operating flexibility for offering CNG bus service throughout MARTA's service area.
Operating Impact
Project ScopeCapital improvements to the existing Hamilton Boulevard Bus Operations and Maintenance Facility that will allow on-site fueling, staging, and maintenance of clean fuel CNG buses and eliminate site circulation conflicts while improving traffic flow, security, and lighting. This particular project is for Hamilton Bus Facility: Demolition Parcels H and I.
Project Expenditures FY10 - FY14(In Thousands)
0.00.00.00.0
1,000.0
0 200 400 600 800 1,000 1,200
FY2014FY2013FY2012FY2011FY2010
Fisc
al Y
ears
31757 Hamilton Demo Parcels H and I
474
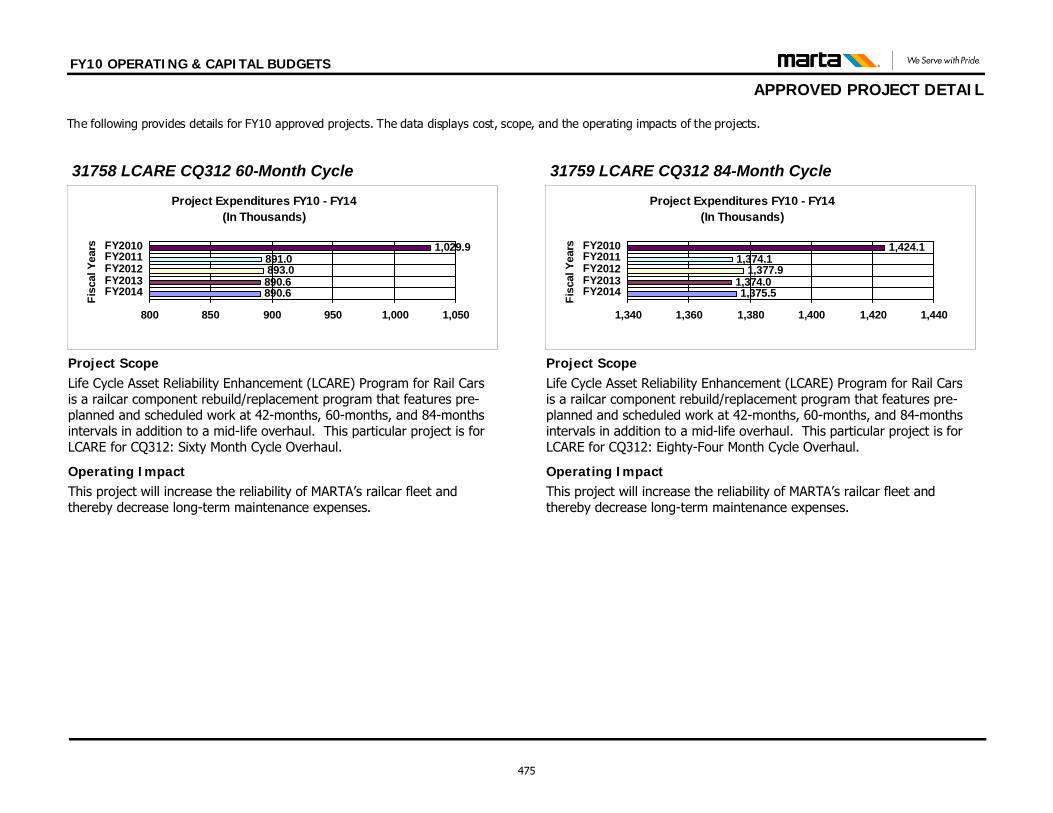
FY10 OPERATING & CAPITAL BUDGETS
APPROVED PROJECT DETAIL The following provides details for FY10 approved projects. The data displays cost, scope, and the operating impacts of the projects.
This project will increase the reliability of MARTA’s railcar fleet and thereby decrease long-term maintenance expenses.
Operating Impact
Project ScopeLife Cycle Asset Reliability Enhancement (LCARE) Program for Rail Cars is a railcar component rebuild/replacement program that features pre-planned and scheduled work at 42-months, 60-months, and 84-months intervals in addition to a mid-life overhaul. This particular project is for LCARE for CQ312: Sixty Month Cycle Overhaul.
Project Expenditures FY10 - FY14(In Thousands)
890.6890.6893.0891.0
1,029.9
800 850 900 950 1,000 1,050
FY2014FY2013FY2012FY2011FY2010
Fisc
al Y
ears
31758 LCARE CQ312 60-Month Cycle
This project will increase the reliability of MARTA’s railcar fleet and thereby decrease long-term maintenance expenses.
Operating Impact
Project ScopeLife Cycle Asset Reliability Enhancement (LCARE) Program for Rail Cars is a railcar component rebuild/replacement program that features pre-planned and scheduled work at 42-months, 60-months, and 84-months intervals in addition to a mid-life overhaul. This particular project is for LCARE for CQ312: Eighty-Four Month Cycle Overhaul.
Project Expenditures FY10 - FY14(In Thousands)
1,375.51,374.0
1,377.91,374.1
1,424.1
1,340 1,360 1,380 1,400 1,420 1,440
FY2014FY2013FY2012FY2011FY2010
Fisc
al Y
ears
31759 LCARE CQ312 84-Month Cycle
475
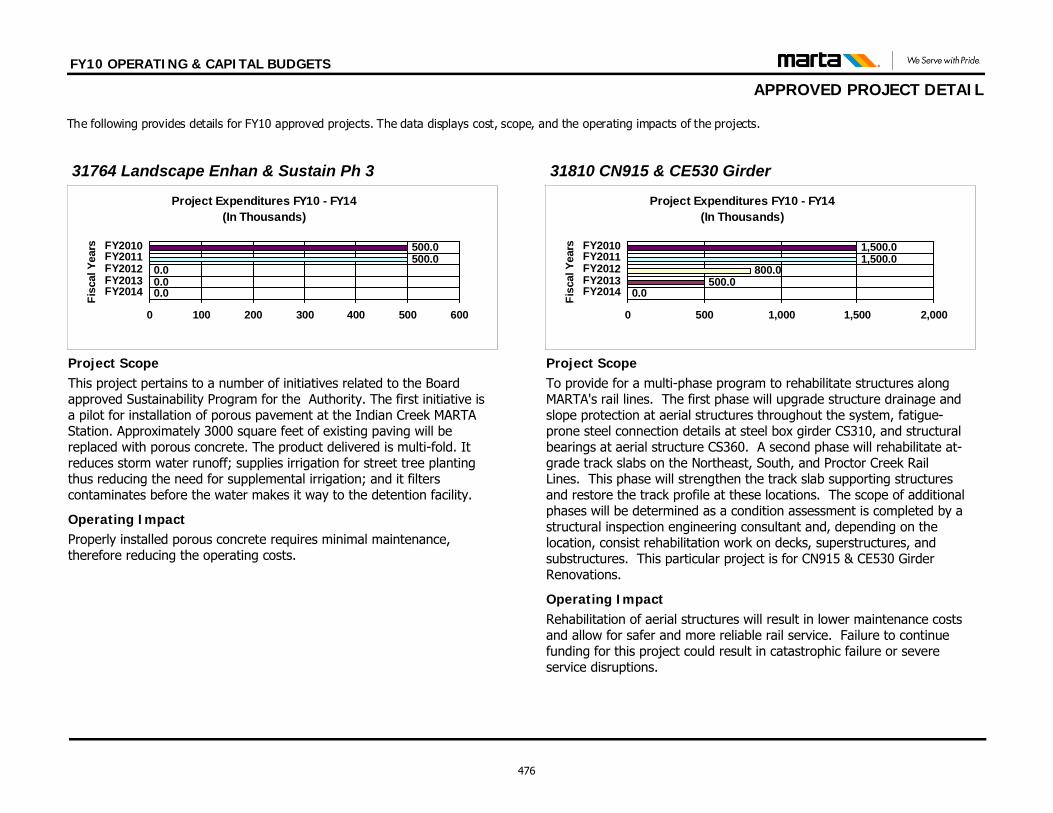
FY10 OPERATING & CAPITAL BUDGETS
APPROVED PROJECT DETAIL The following provides details for FY10 approved projects. The data displays cost, scope, and the operating impacts of the projects.
Properly installed porous concrete requires minimal maintenance, therefore reducing the operating costs.
Operating Impact
Project ScopeThis project pertains to a number of initiatives related to the Board approved Sustainability Program for the Authority. The first initiative is a pilot for installation of porous pavement at the Indian Creek MARTA Station. Approximately 3000 square feet of existing paving will be replaced with porous concrete. The product delivered is multi-fold. It reduces storm water runoff; supplies irrigation for street tree planting thus reducing the need for supplemental irrigation; and it filters contaminates before the water makes it way to the detention facility.
Project Expenditures FY10 - FY14(In Thousands)
0.00.00.0
500.0500.0
0 100 200 300 400 500 600
FY2014FY2013FY2012FY2011FY2010
Fisc
al Y
ears
31764 Landscape Enhan & Sustain Ph 3
Rehabilitation of aerial structures will result in lower maintenance costs and allow for safer and more reliable rail service. Failure to continue funding for this project could result in catastrophic failure or severe service disruptions.
Operating Impact
Project ScopeTo provide for a multi-phase program to rehabilitate structures along MARTA's rail lines. The first phase will upgrade structure drainage and slope protection at aerial structures throughout the system, fatigue-prone steel connection details at steel box girder CS310, and structural bearings at aerial structure CS360. A second phase will rehabilitate at-grade track slabs on the Northeast, South, and Proctor Creek Rail Lines. This phase will strengthen the track slab supporting structures and restore the track profile at these locations. The scope of additional phases will be determined as a condition assessment is completed by a structural inspection engineering consultant and, depending on the location, consist rehabilitation work on decks, superstructures, and substructures. This particular project is for CN915 & CE530 Girder Renovations.
Project Expenditures FY10 - FY14(In Thousands)
0.0500.0
800.01,500.01,500.0
0 500 1,000 1,500 2,000
FY2014FY2013FY2012FY2011FY2010
Fisc
al Y
ears
31810 CN915 & CE530 Girder
476
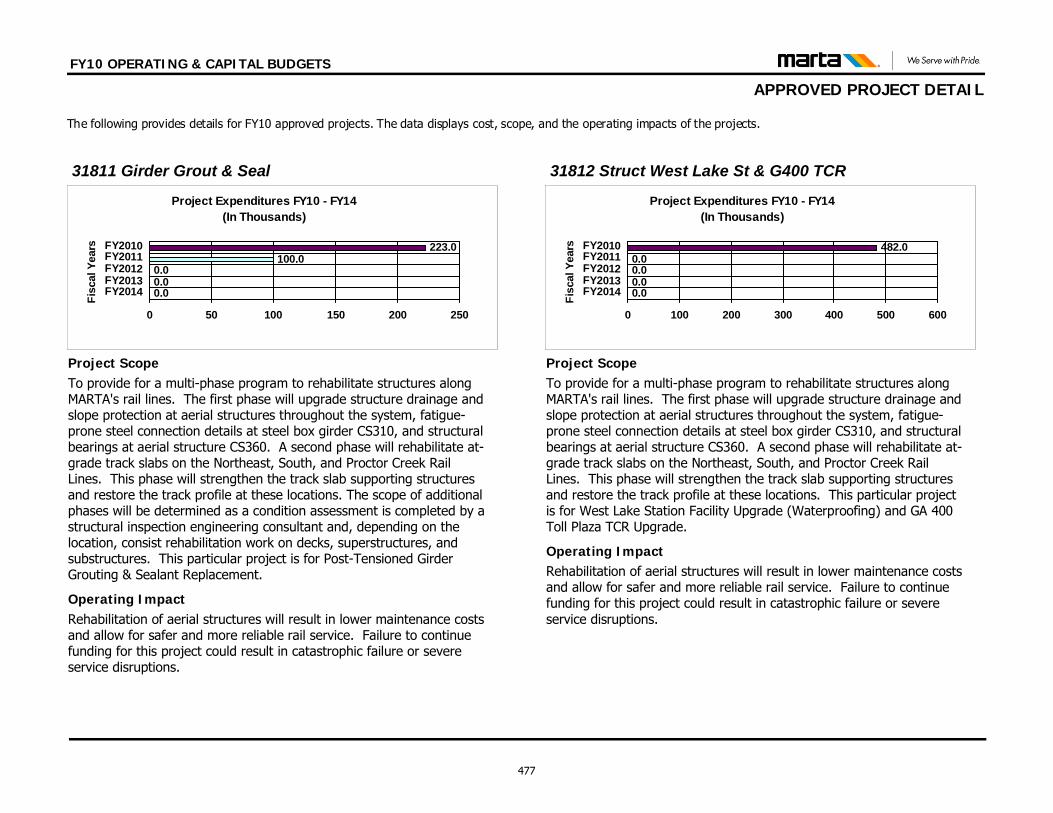
FY10 OPERATING & CAPITAL BUDGETS
APPROVED PROJECT DETAIL The following provides details for FY10 approved projects. The data displays cost, scope, and the operating impacts of the projects.
Rehabilitation of aerial structures will result in lower maintenance costs and allow for safer and more reliable rail service. Failure to continue funding for this project could result in catastrophic failure or severe service disruptions.
Operating Impact
Project ScopeTo provide for a multi-phase program to rehabilitate structures along MARTA's rail lines. The first phase will upgrade structure drainage and slope protection at aerial structures throughout the system, fatigue-prone steel connection details at steel box girder CS310, and structural bearings at aerial structure CS360. A second phase will rehabilitate at-grade track slabs on the Northeast, South, and Proctor Creek Rail Lines. This phase will strengthen the track slab supporting structures and restore the track profile at these locations. The scope of additional phases will be determined as a condition assessment is completed by a structural inspection engineering consultant and, depending on the location, consist rehabilitation work on decks, superstructures, and substructures. This particular project is for Post-Tensioned Girder Grouting & Sealant Replacement.
Project Expenditures FY10 - FY14(In Thousands)
0.00.00.0
100.0223.0
0 50 100 150 200 250
FY2014FY2013FY2012FY2011FY2010
Fisc
al Y
ears
31811 Girder Grout & Seal
Rehabilitation of aerial structures will result in lower maintenance costs and allow for safer and more reliable rail service. Failure to continue funding for this project could result in catastrophic failure or severe service disruptions.
Operating Impact
Project ScopeTo provide for a multi-phase program to rehabilitate structures along MARTA's rail lines. The first phase will upgrade structure drainage and slope protection at aerial structures throughout the system, fatigue-prone steel connection details at steel box girder CS310, and structural bearings at aerial structure CS360. A second phase will rehabilitate at-grade track slabs on the Northeast, South, and Proctor Creek Rail Lines. This phase will strengthen the track slab supporting structures and restore the track profile at these locations. This particular project is for West Lake Station Facility Upgrade (Waterproofing) and GA 400 Toll Plaza TCR Upgrade.
Project Expenditures FY10 - FY14(In Thousands)
0.00.00.00.0
482.0
0 100 200 300 400 500 600
FY2014FY2013FY2012FY2011FY2010
Fisc
al Y
ears
31812 Struct West Lake St & G400 TCR
477
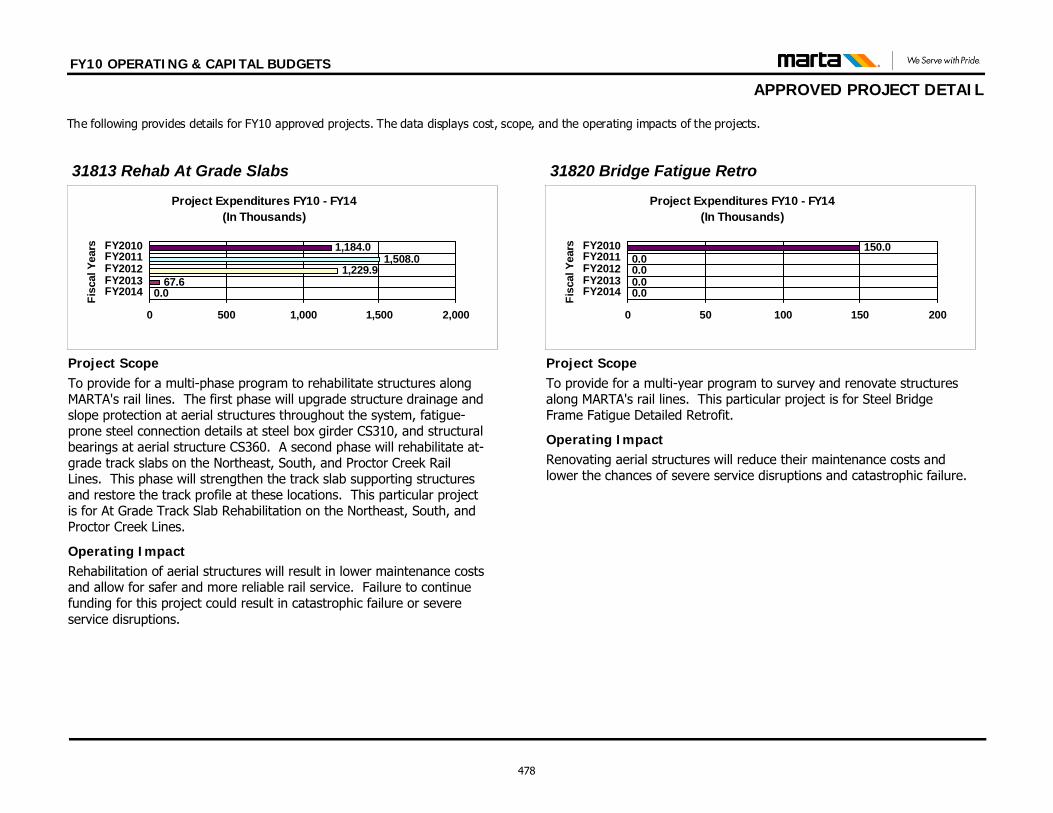
FY10 OPERATING & CAPITAL BUDGETS
APPROVED PROJECT DETAIL The following provides details for FY10 approved projects. The data displays cost, scope, and the operating impacts of the projects.
Rehabilitation of aerial structures will result in lower maintenance costs and allow for safer and more reliable rail service. Failure to continue funding for this project could result in catastrophic failure or severe service disruptions.
Operating Impact
Project ScopeTo provide for a multi-phase program to rehabilitate structures along MARTA's rail lines. The first phase will upgrade structure drainage and slope protection at aerial structures throughout the system, fatigue-prone steel connection details at steel box girder CS310, and structural bearings at aerial structure CS360. A second phase will rehabilitate at-grade track slabs on the Northeast, South, and Proctor Creek Rail Lines. This phase will strengthen the track slab supporting structures and restore the track profile at these locations. This particular project is for At Grade Track Slab Rehabilitation on the Northeast, South, and Proctor Creek Lines.
Project Expenditures FY10 - FY14(In Thousands)
0.067.6
1,229.91,508.0
1,184.0
0 500 1,000 1,500 2,000
FY2014FY2013FY2012FY2011FY2010
Fisc
al Y
ears
31813 Rehab At Grade Slabs
Renovating aerial structures will reduce their maintenance costs and lower the chances of severe service disruptions and catastrophic failure.
Operating Impact
Project ScopeTo provide for a multi-year program to survey and renovate structures along MARTA's rail lines. This particular project is for Steel Bridge Frame Fatigue Detailed Retrofit.
Project Expenditures FY10 - FY14(In Thousands)
0.00.00.00.0
150.0
0 50 100 150 200
FY2014FY2013FY2012FY2011FY2010
Fisc
al Y
ears
31820 Bridge Fatigue Retro
478
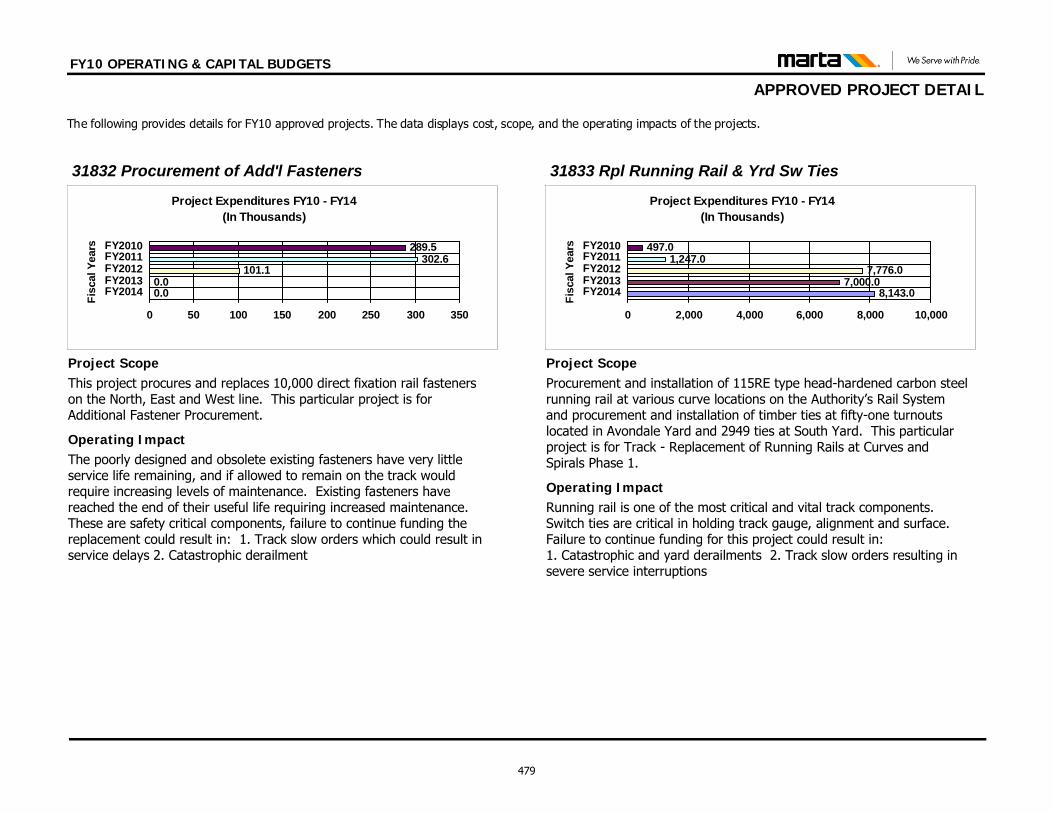
FY10 OPERATING & CAPITAL BUDGETS
APPROVED PROJECT DETAIL The following provides details for FY10 approved projects. The data displays cost, scope, and the operating impacts of the projects.
The poorly designed and obsolete existing fasteners have very little service life remaining, and if allowed to remain on the track would require increasing levels of maintenance. Existing fasteners have reached the end of their useful life requiring increased maintenance. These are safety critical components, failure to continue funding the replacement could result in: 1. Track slow orders which could result in service delays 2. Catastrophic derailment
Operating Impact
Project ScopeThis project procures and replaces 10,000 direct fixation rail fasteners on the North, East and West line. This particular project is for Additional Fastener Procurement.
Project Expenditures FY10 - FY14(In Thousands)
0.00.0
101.1302.6
289.5
0 50 100 150 200 250 300 350
FY2014FY2013FY2012FY2011FY2010
Fisc
al Y
ears
31832 Procurement of Add'l Fasteners
Running rail is one of the most critical and vital track components. Switch ties are critical in holding track gauge, alignment and surface. Failure to continue funding for this project could result in: 1. Catastrophic and yard derailments 2. Track slow orders resulting in severe service interruptions
Operating Impact
Project ScopeProcurement and installation of 115RE type head-hardened carbon steel running rail at various curve locations on the Authority’s Rail System and procurement and installation of timber ties at fifty-one turnouts located in Avondale Yard and 2949 ties at South Yard. This particular project is for Track - Replacement of Running Rails at Curves and Spirals Phase 1.
Project Expenditures FY10 - FY14(In Thousands)
8,143.07,000.0
7,776.01,247.0
497.0
0 2,000 4,000 6,000 8,000 10,000
FY2014FY2013FY2012FY2011FY2010
Fisc
al Y
ears
31833 Rpl Running Rail & Yrd Sw Ties
479
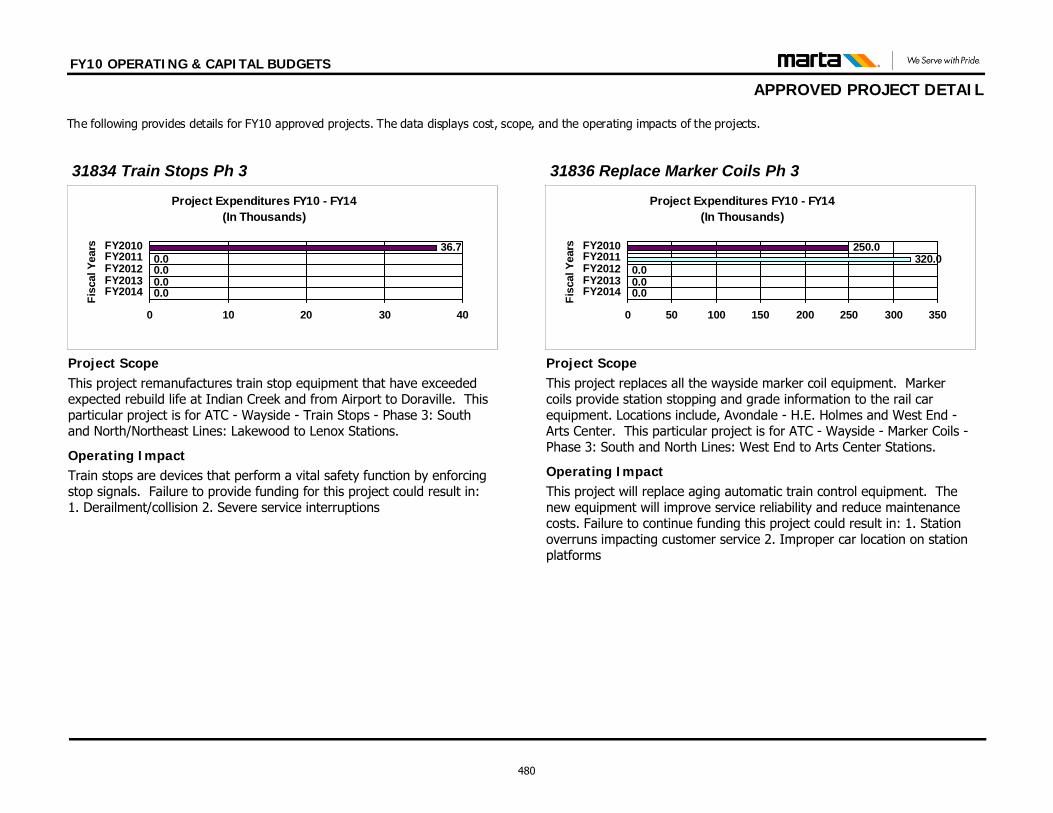
FY10 OPERATING & CAPITAL BUDGETS
APPROVED PROJECT DETAIL The following provides details for FY10 approved projects. The data displays cost, scope, and the operating impacts of the projects.
Train stops are devices that perform a vital safety function by enforcing stop signals. Failure to provide funding for this project could result in: 1. Derailment/collision 2. Severe service interruptions
Operating Impact
Project ScopeThis project remanufactures train stop equipment that have exceeded expected rebuild life at Indian Creek and from Airport to Doraville. This particular project is for ATC - Wayside - Train Stops - Phase 3: South and North/Northeast Lines: Lakewood to Lenox Stations.
Project Expenditures FY10 - FY14(In Thousands)
0.00.00.00.0
36.7
0 10 20 30 40
FY2014FY2013FY2012FY2011FY2010
Fisc
al Y
ears
31834 Train Stops Ph 3
This project will replace aging automatic train control equipment. The new equipment will improve service reliability and reduce maintenance costs. Failure to continue funding this project could result in: 1. Station overruns impacting customer service 2. Improper car location on station platforms
Operating Impact
Project ScopeThis project replaces all the wayside marker coil equipment. Marker coils provide station stopping and grade information to the rail car equipment. Locations include, Avondale - H.E. Holmes and West End - Arts Center. This particular project is for ATC - Wayside - Marker Coils - Phase 3: South and North Lines: West End to Arts Center Stations.
Project Expenditures FY10 - FY14(In Thousands)
0.00.00.0
320.0250.0
0 50 100 150 200 250 300 350
FY2014FY2013FY2012FY2011FY2010
Fisc
al Y
ears
31836 Replace Marker Coils Ph 3
480
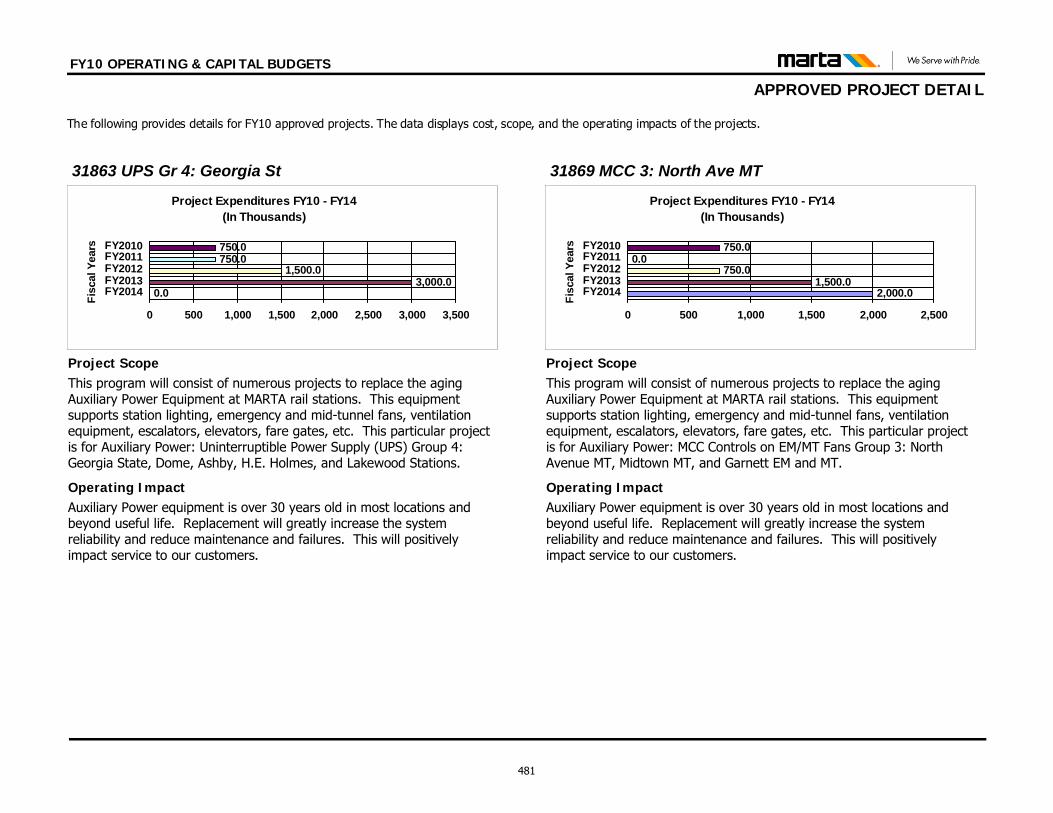
FY10 OPERATING & CAPITAL BUDGETS
APPROVED PROJECT DETAIL The following provides details for FY10 approved projects. The data displays cost, scope, and the operating impacts of the projects.
Auxiliary Power equipment is over 30 years old in most locations and beyond useful life. Replacement will greatly increase the system reliability and reduce maintenance and failures. This will positively impact service to our customers.
Operating Impact
Project ScopeThis program will consist of numerous projects to replace the aging Auxiliary Power Equipment at MARTA rail stations. This equipment supports station lighting, emergency and mid-tunnel fans, ventilation equipment, escalators, elevators, fare gates, etc. This particular project is for Auxiliary Power: Uninterruptible Power Supply (UPS) Group 4: Georgia State, Dome, Ashby, H.E. Holmes, and Lakewood Stations.
Project Expenditures FY10 - FY14(In Thousands)
0.03,000.0
1,500.0750.0750.0
0 500 1,000 1,500 2,000 2,500 3,000 3,500
FY2014FY2013FY2012FY2011FY2010
Fisc
al Y
ears
31863 UPS Gr 4: Georgia St
Auxiliary Power equipment is over 30 years old in most locations and beyond useful life. Replacement will greatly increase the system reliability and reduce maintenance and failures. This will positively impact service to our customers.
Operating Impact
Project ScopeThis program will consist of numerous projects to replace the aging Auxiliary Power Equipment at MARTA rail stations. This equipment supports station lighting, emergency and mid-tunnel fans, ventilation equipment, escalators, elevators, fare gates, etc. This particular project is for Auxiliary Power: MCC Controls on EM/MT Fans Group 3: North Avenue MT, Midtown MT, and Garnett EM and MT.
Project Expenditures FY10 - FY14(In Thousands)
2,000.01,500.0
750.00.0
750.0
0 500 1,000 1,500 2,000 2,500
FY2014FY2013FY2012FY2011FY2010
Fisc
al Y
ears
31869 MCC 3: North Ave MT
481
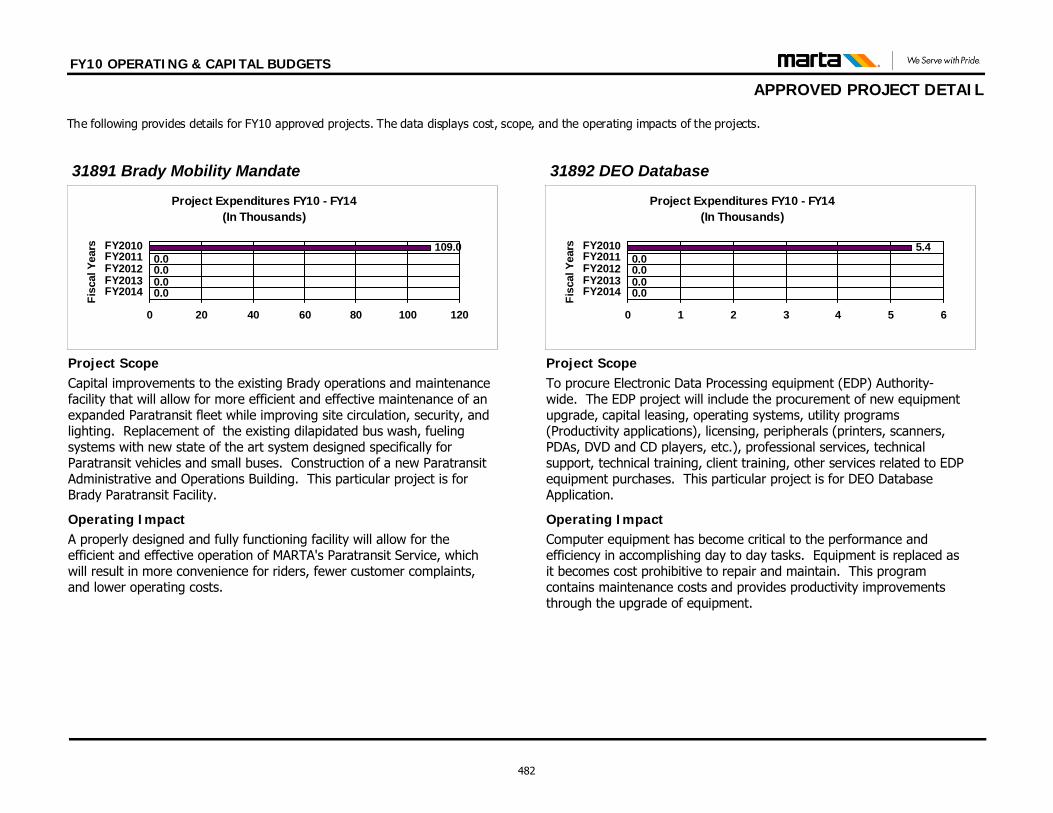
FY10 OPERATING & CAPITAL BUDGETS
APPROVED PROJECT DETAIL The following provides details for FY10 approved projects. The data displays cost, scope, and the operating impacts of the projects.
A properly designed and fully functioning facility will allow for the efficient and effective operation of MARTA's Paratransit Service, which will result in more convenience for riders, fewer customer complaints, and lower operating costs.
Operating Impact
Project ScopeCapital improvements to the existing Brady operations and maintenance facility that will allow for more efficient and effective maintenance of an expanded Paratransit fleet while improving site circulation, security, and lighting. Replacement of the existing dilapidated bus wash, fueling systems with new state of the art system designed specifically for Paratransit vehicles and small buses. Construction of a new Paratransit Administrative and Operations Building. This particular project is for Brady Paratransit Facility.
Project Expenditures FY10 - FY14(In Thousands)
0.00.00.00.0
109.0
0 20 40 60 80 100 120
FY2014FY2013FY2012FY2011FY2010
Fisc
al Y
ears
31891 Brady Mobility Mandate
Computer equipment has become critical to the performance and efficiency in accomplishing day to day tasks. Equipment is replaced as it becomes cost prohibitive to repair and maintain. This program contains maintenance costs and provides productivity improvements through the upgrade of equipment.
Operating Impact
Project ScopeTo procure Electronic Data Processing equipment (EDP) Authority-wide. The EDP project will include the procurement of new equipment upgrade, capital leasing, operating systems, utility programs (Productivity applications), licensing, peripherals (printers, scanners, PDAs, DVD and CD players, etc.), professional services, technical support, technical training, client training, other services related to EDP equipment purchases. This particular project is for DEO Database Application.
Project Expenditures FY10 - FY14(In Thousands)
0.00.00.00.0
5.4
0 1 2 3 4 5 6
FY2014FY2013FY2012FY2011FY2010
Fisc
al Y
ears
31892 DEO Database
482
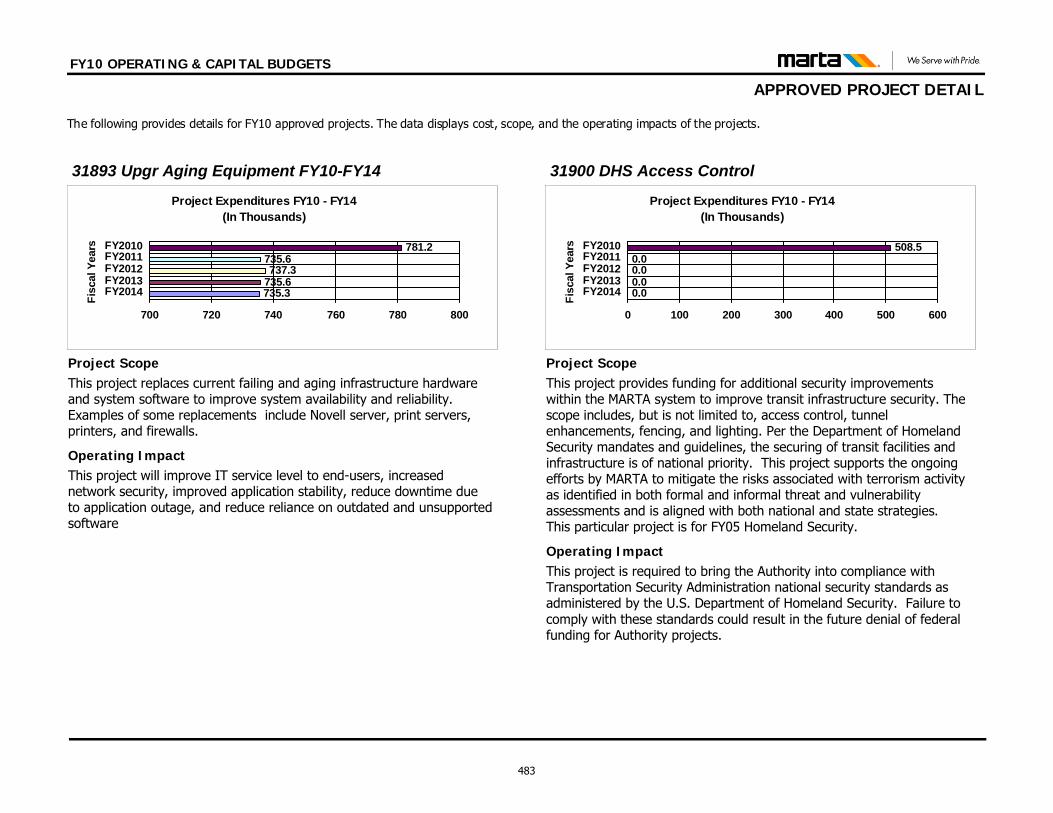
FY10 OPERATING & CAPITAL BUDGETS
APPROVED PROJECT DETAIL The following provides details for FY10 approved projects. The data displays cost, scope, and the operating impacts of the projects.
This project will improve IT service level to end-users, increased network security, improved application stability, reduce downtime due to application outage, and reduce reliance on outdated and unsupported software
Operating Impact
Project ScopeThis project replaces current failing and aging infrastructure hardware and system software to improve system availability and reliability. Examples of some replacements include Novell server, print servers, printers, and firewalls.
Project Expenditures FY10 - FY14(In Thousands)
735.3735.6737.3
735.6781.2
700 720 740 760 780 800
FY2014FY2013FY2012FY2011FY2010
Fisc
al Y
ears
31893 Upgr Aging Equipment FY10-FY14
This project is required to bring the Authority into compliance with Transportation Security Administration national security standards as administered by the U.S. Department of Homeland Security. Failure to comply with these standards could result in the future denial of federal funding for Authority projects.
Operating Impact
Project ScopeThis project provides funding for additional security improvements within the MARTA system to improve transit infrastructure security. The scope includes, but is not limited to, access control, tunnel enhancements, fencing, and lighting. Per the Department of Homeland Security mandates and guidelines, the securing of transit facilities and infrastructure is of national priority. This project supports the ongoing efforts by MARTA to mitigate the risks associated with terrorism activity as identified in both formal and informal threat and vulnerability assessments and is aligned with both national and state strategies. This particular project is for FY05 Homeland Security.
Project Expenditures FY10 - FY14(In Thousands)
0.00.00.00.0
508.5
0 100 200 300 400 500 600
FY2014FY2013FY2012FY2011FY2010
Fisc
al Y
ears
31900 DHS Access Control
483
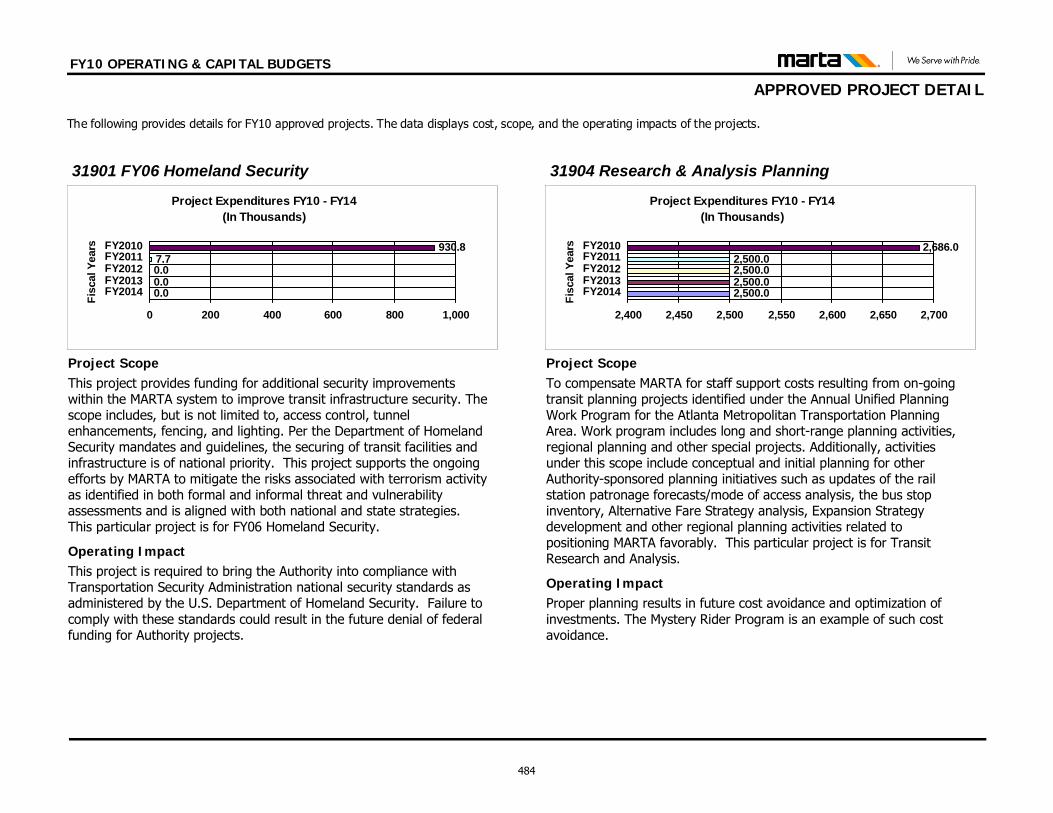
FY10 OPERATING & CAPITAL BUDGETS
APPROVED PROJECT DETAIL The following provides details for FY10 approved projects. The data displays cost, scope, and the operating impacts of the projects.
This project is required to bring the Authority into compliance with Transportation Security Administration national security standards as administered by the U.S. Department of Homeland Security. Failure to comply with these standards could result in the future denial of federal funding for Authority projects.
Operating Impact
Project ScopeThis project provides funding for additional security improvements within the MARTA system to improve transit infrastructure security. The scope includes, but is not limited to, access control, tunnel enhancements, fencing, and lighting. Per the Department of Homeland Security mandates and guidelines, the securing of transit facilities and infrastructure is of national priority. This project supports the ongoing efforts by MARTA to mitigate the risks associated with terrorism activity as identified in both formal and informal threat and vulnerability assessments and is aligned with both national and state strategies. This particular project is for FY06 Homeland Security.
Project Expenditures FY10 - FY14(In Thousands)
0.00.00.07.7
930.8
0 200 400 600 800 1,000
FY2014FY2013FY2012FY2011FY2010
Fisc
al Y
ears
31901 FY06 Homeland Security
Proper planning results in future cost avoidance and optimization of investments. The Mystery Rider Program is an example of such cost avoidance.
Operating Impact
Project ScopeTo compensate MARTA for staff support costs resulting from on-going transit planning projects identified under the Annual Unified Planning Work Program for the Atlanta Metropolitan Transportation Planning Area. Work program includes long and short-range planning activities, regional planning and other special projects. Additionally, activities under this scope include conceptual and initial planning for other Authority-sponsored planning initiatives such as updates of the rail station patronage forecasts/mode of access analysis, the bus stop inventory, Alternative Fare Strategy analysis, Expansion Strategy development and other regional planning activities related to positioning MARTA favorably. This particular project is for Transit Research and Analysis.
Project Expenditures FY10 - FY14(In Thousands)
2,500.02,500.02,500.02,500.0
2,686.0
2,400 2,450 2,500 2,550 2,600 2,650 2,700
FY2014FY2013FY2012FY2011FY2010
Fisc
al Y
ears
31904 Research & Analysis Planning
484
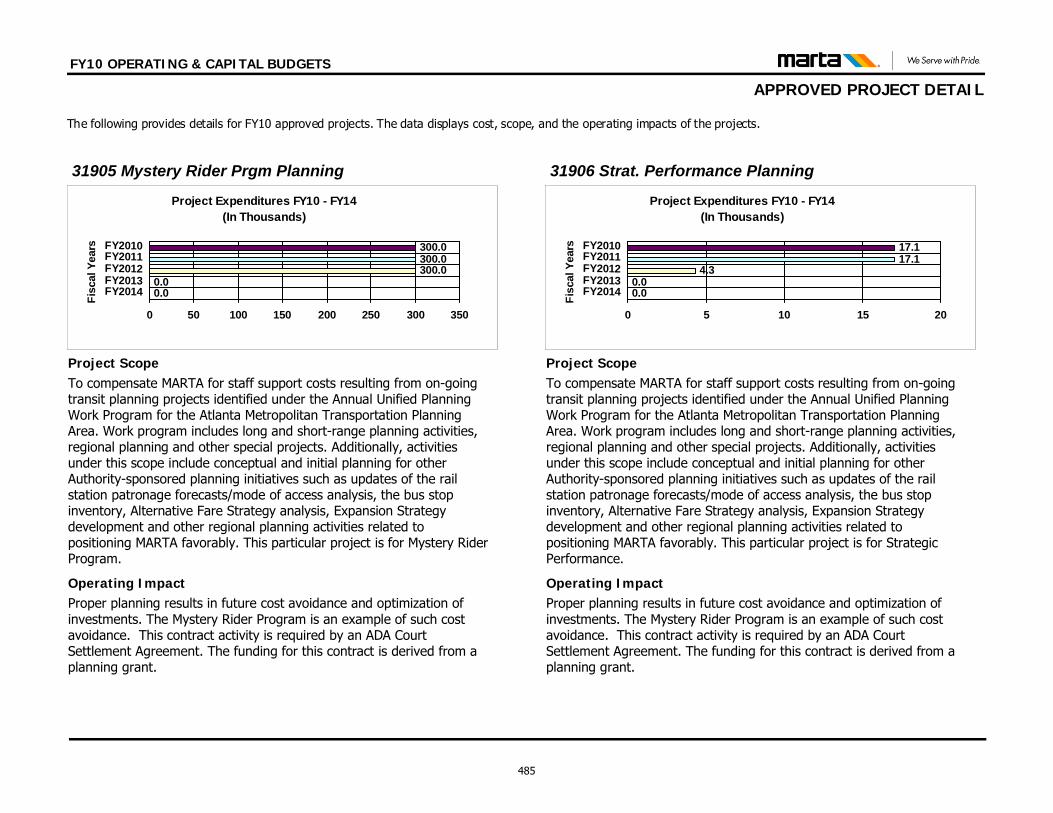
FY10 OPERATING & CAPITAL BUDGETS
APPROVED PROJECT DETAIL The following provides details for FY10 approved projects. The data displays cost, scope, and the operating impacts of the projects.
Proper planning results in future cost avoidance and optimization of investments. The Mystery Rider Program is an example of such cost avoidance. This contract activity is required by an ADA Court Settlement Agreement. The funding for this contract is derived from a planning grant.
Operating Impact
Project ScopeTo compensate MARTA for staff support costs resulting from on-going transit planning projects identified under the Annual Unified Planning Work Program for the Atlanta Metropolitan Transportation Planning Area. Work program includes long and short-range planning activities, regional planning and other special projects. Additionally, activities under this scope include conceptual and initial planning for other Authority-sponsored planning initiatives such as updates of the rail station patronage forecasts/mode of access analysis, the bus stop inventory, Alternative Fare Strategy analysis, Expansion Strategy development and other regional planning activities related to positioning MARTA favorably. This particular project is for Mystery Rider Program.
Project Expenditures FY10 - FY14(In Thousands)
0.00.0
300.0300.0300.0
0 50 100 150 200 250 300 350
FY2014FY2013FY2012FY2011FY2010
Fisc
al Y
ears
31905 Mystery Rider Prgm Planning
Proper planning results in future cost avoidance and optimization of investments. The Mystery Rider Program is an example of such cost avoidance. This contract activity is required by an ADA Court Settlement Agreement. The funding for this contract is derived from a planning grant.
Operating Impact
Project ScopeTo compensate MARTA for staff support costs resulting from on-going transit planning projects identified under the Annual Unified Planning Work Program for the Atlanta Metropolitan Transportation Planning Area. Work program includes long and short-range planning activities, regional planning and other special projects. Additionally, activities under this scope include conceptual and initial planning for other Authority-sponsored planning initiatives such as updates of the rail station patronage forecasts/mode of access analysis, the bus stop inventory, Alternative Fare Strategy analysis, Expansion Strategy development and other regional planning activities related to positioning MARTA favorably. This particular project is for Strategic Performance.
Project Expenditures FY10 - FY14(In Thousands)
0.00.0
4.317.117.1
0 5 10 15 20
FY2014FY2013FY2012FY2011FY2010
Fisc
al Y
ears
31906 Strat. Performance Planning
485
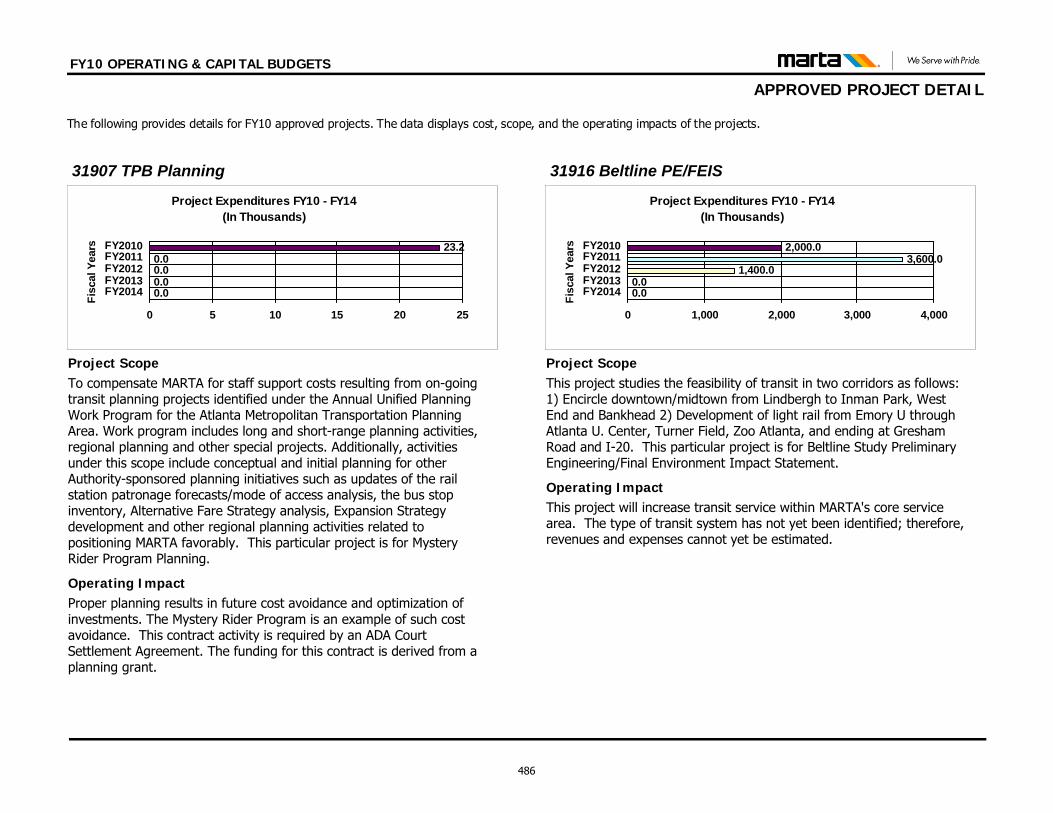
FY10 OPERATING & CAPITAL BUDGETS
APPROVED PROJECT DETAIL The following provides details for FY10 approved projects. The data displays cost, scope, and the operating impacts of the projects.
Proper planning results in future cost avoidance and optimization of investments. The Mystery Rider Program is an example of such cost avoidance. This contract activity is required by an ADA Court Settlement Agreement. The funding for this contract is derived from a planning grant.
Operating Impact
Project ScopeTo compensate MARTA for staff support costs resulting from on-going transit planning projects identified under the Annual Unified Planning Work Program for the Atlanta Metropolitan Transportation Planning Area. Work program includes long and short-range planning activities, regional planning and other special projects. Additionally, activities under this scope include conceptual and initial planning for other Authority-sponsored planning initiatives such as updates of the rail station patronage forecasts/mode of access analysis, the bus stop inventory, Alternative Fare Strategy analysis, Expansion Strategy development and other regional planning activities related to positioning MARTA favorably. This particular project is for Mystery Rider Program Planning.
Project Expenditures FY10 - FY14(In Thousands)
0.00.00.00.0
23.2
0 5 10 15 20 25
FY2014FY2013FY2012FY2011FY2010
Fisc
al Y
ears
31907 TPB Planning
This project will increase transit service within MARTA's core service area. The type of transit system has not yet been identified; therefore, revenues and expenses cannot yet be estimated.
Operating Impact
Project ScopeThis project studies the feasibility of transit in two corridors as follows: 1) Encircle downtown/midtown from Lindbergh to Inman Park, West End and Bankhead 2) Development of light rail from Emory U through Atlanta U. Center, Turner Field, Zoo Atlanta, and ending at Gresham Road and I-20. This particular project is for Beltline Study Preliminary Engineering/Final Environment Impact Statement.
Project Expenditures FY10 - FY14(In Thousands)
0.00.0
1,400.03,600.0
2,000.0
0 1,000 2,000 3,000 4,000
FY2014FY2013FY2012FY2011FY2010
Fisc
al Y
ears
31916 Beltline PE/FEIS
486
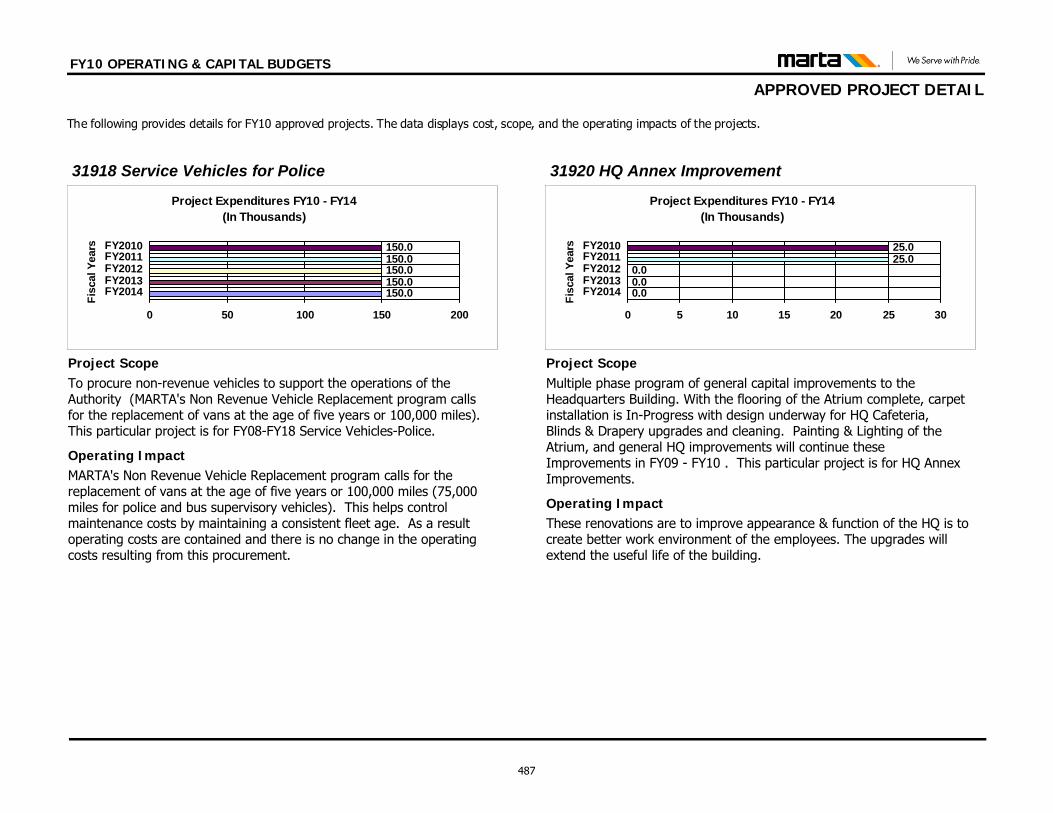
FY10 OPERATING & CAPITAL BUDGETS
APPROVED PROJECT DETAIL The following provides details for FY10 approved projects. The data displays cost, scope, and the operating impacts of the projects.
MARTA's Non Revenue Vehicle Replacement program calls for the replacement of vans at the age of five years or 100,000 miles (75,000 miles for police and bus supervisory vehicles). This helps control maintenance costs by maintaining a consistent fleet age. As a result operating costs are contained and there is no change in the operating costs resulting from this procurement.
Operating Impact
Project ScopeTo procure non-revenue vehicles to support the operations of the Authority (MARTA's Non Revenue Vehicle Replacement program calls for the replacement of vans at the age of five years or 100,000 miles). This particular project is for FY08-FY18 Service Vehicles-Police.
Project Expenditures FY10 - FY14(In Thousands)
150.0150.0150.0150.0150.0
0 50 100 150 200
FY2014FY2013FY2012FY2011FY2010
Fisc
al Y
ears
31918 Service Vehicles for Police
These renovations are to improve appearance & function of the HQ is to create better work environment of the employees. The upgrades will extend the useful life of the building.
Operating Impact
Project ScopeMultiple phase program of general capital improvements to the Headquarters Building. With the flooring of the Atrium complete, carpet installation is In-Progress with design underway for HQ Cafeteria, Blinds & Drapery upgrades and cleaning. Painting & Lighting of the Atrium, and general HQ improvements will continue these Improvements in FY09 - FY10 . This particular project is for HQ Annex Improvements.
Project Expenditures FY10 - FY14(In Thousands)
0.00.00.0
25.025.0
0 5 10 15 20 25 30
FY2014FY2013FY2012FY2011FY2010
Fisc
al Y
ears
31920 HQ Annex Improvement
487
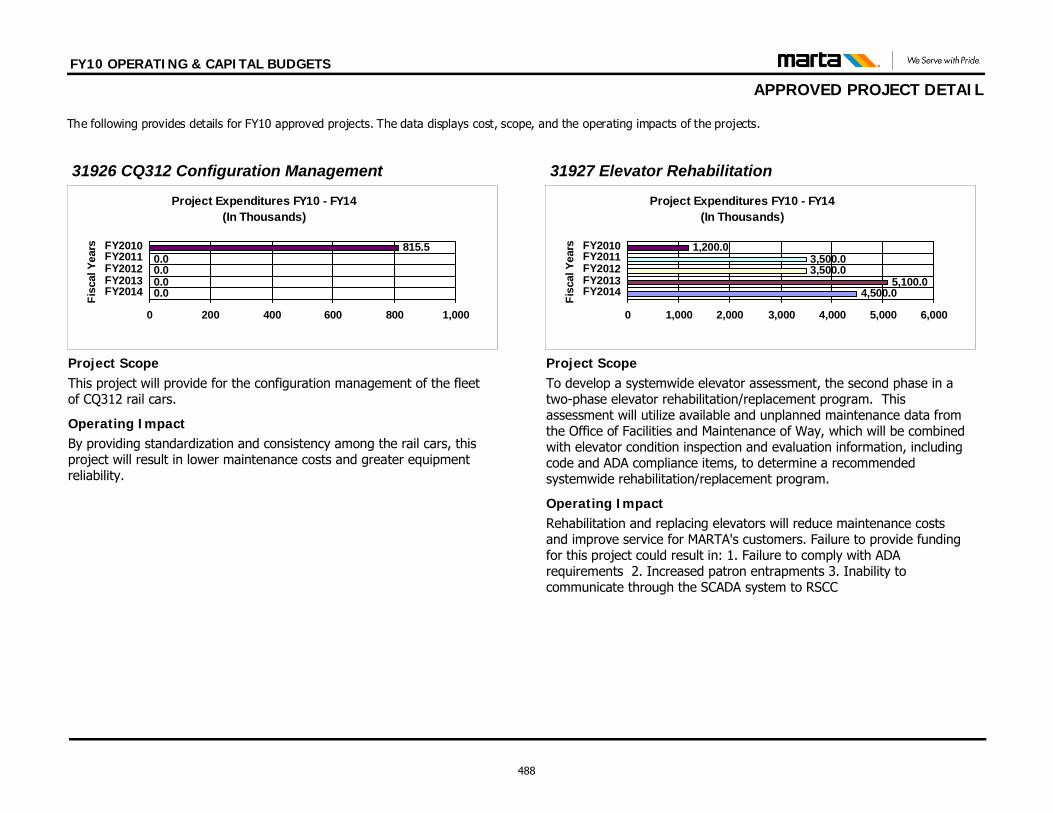
FY10 OPERATING & CAPITAL BUDGETS
APPROVED PROJECT DETAIL The following provides details for FY10 approved projects. The data displays cost, scope, and the operating impacts of the projects.
By providing standardization and consistency among the rail cars, this project will result in lower maintenance costs and greater equipment reliability.
Operating Impact
Project ScopeThis project will provide for the configuration management of the fleet of CQ312 rail cars.
Project Expenditures FY10 - FY14(In Thousands)
0.00.00.00.0
815.5
0 200 400 600 800 1,000
FY2014FY2013FY2012FY2011FY2010
Fisc
al Y
ears
31926 CQ312 Configuration Management
Rehabilitation and replacing elevators will reduce maintenance costs and improve service for MARTA's customers. Failure to provide funding for this project could result in: 1. Failure to comply with ADA requirements 2. Increased patron entrapments 3. Inability to communicate through the SCADA system to RSCC
Operating Impact
Project ScopeTo develop a systemwide elevator assessment, the second phase in a two-phase elevator rehabilitation/replacement program. This assessment will utilize available and unplanned maintenance data from the Office of Facilities and Maintenance of Way, which will be combined with elevator condition inspection and evaluation information, including code and ADA compliance items, to determine a recommended systemwide rehabilitation/replacement program.
Project Expenditures FY10 - FY14(In Thousands)
4,500.05,100.0
3,500.03,500.0
1,200.0
0 1,000 2,000 3,000 4,000 5,000 6,000
FY2014FY2013FY2012FY2011FY2010
Fisc
al Y
ears
31927 Elevator Rehabilitation
488
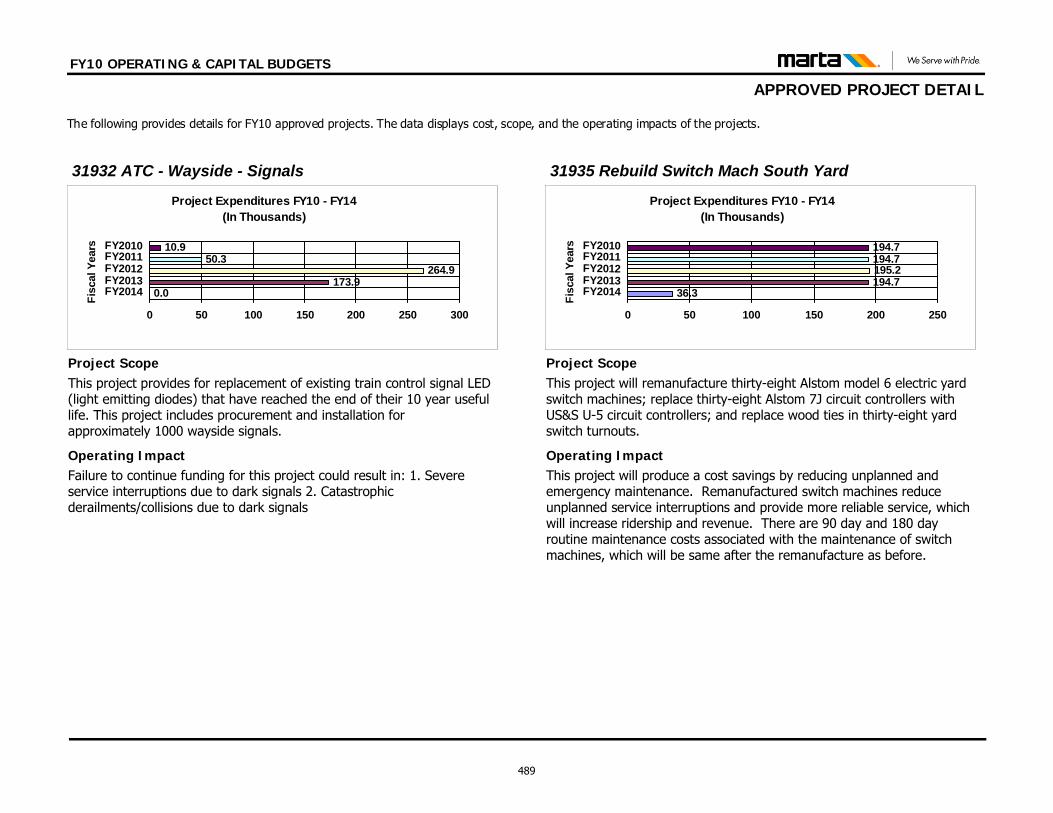
FY10 OPERATING & CAPITAL BUDGETS
APPROVED PROJECT DETAIL The following provides details for FY10 approved projects. The data displays cost, scope, and the operating impacts of the projects.
Failure to continue funding for this project could result in: 1. Severe service interruptions due to dark signals 2. Catastrophic derailments/collisions due to dark signals
Operating Impact
Project ScopeThis project provides for replacement of existing train control signal LED (light emitting diodes) that have reached the end of their 10 year useful life. This project includes procurement and installation for approximately 1000 wayside signals.
Project Expenditures FY10 - FY14(In Thousands)
0.0173.9
264.950.3
10.9
0 50 100 150 200 250 300
FY2014FY2013FY2012FY2011FY2010
Fisc
al Y
ears
31932 ATC - Wayside - Signals
This project will produce a cost savings by reducing unplanned and emergency maintenance. Remanufactured switch machines reduce unplanned service interruptions and provide more reliable service, which will increase ridership and revenue. There are 90 day and 180 day routine maintenance costs associated with the maintenance of switch machines, which will be same after the remanufacture as before.
Operating Impact
Project ScopeThis project will remanufacture thirty-eight Alstom model 6 electric yard switch machines; replace thirty-eight Alstom 7J circuit controllers with US&S U-5 circuit controllers; and replace wood ties in thirty-eight yard switch turnouts.
Project Expenditures FY10 - FY14(In Thousands)
36.3194.7195.2194.7194.7
0 50 100 150 200 250
FY2014FY2013FY2012FY2011FY2010
Fisc
al Y
ears
31935 Rebuild Switch Mach South Yard
489
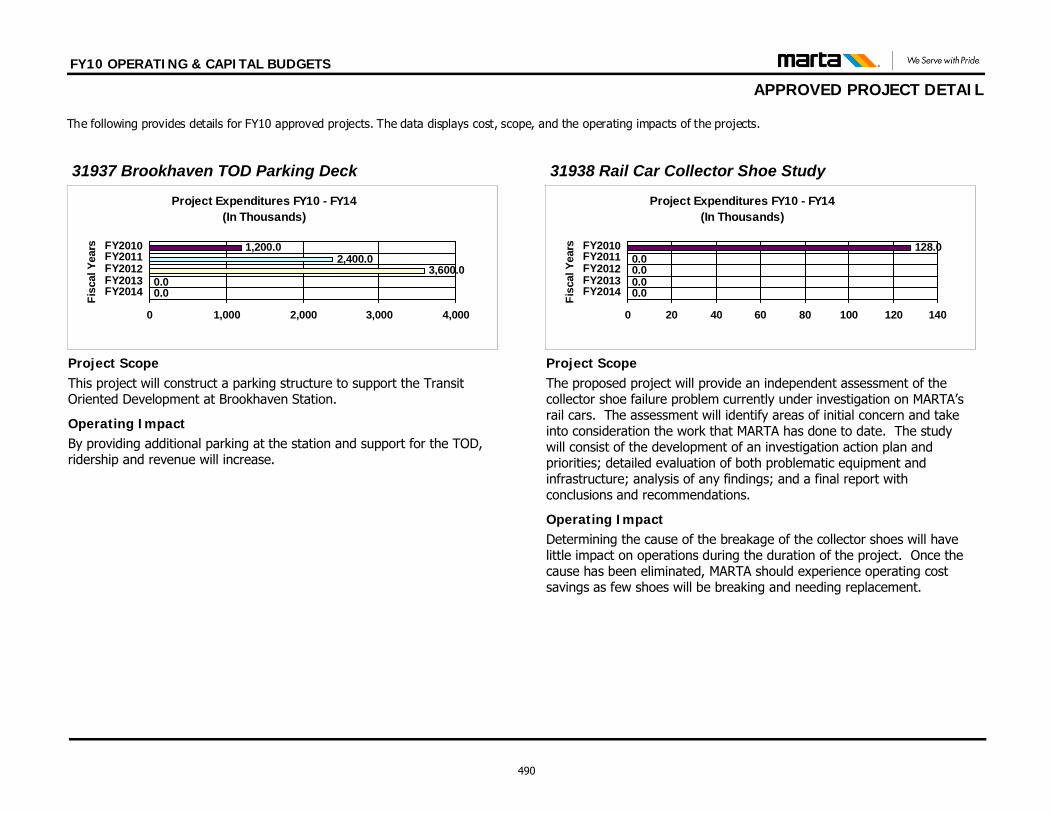
FY10 OPERATING & CAPITAL BUDGETS
APPROVED PROJECT DETAIL The following provides details for FY10 approved projects. The data displays cost, scope, and the operating impacts of the projects.
By providing additional parking at the station and support for the TOD, ridership and revenue will increase.
Operating Impact
Project ScopeThis project will construct a parking structure to support the Transit Oriented Development at Brookhaven Station.
Project Expenditures FY10 - FY14(In Thousands)
0.00.0
3,600.02,400.0
1,200.0
0 1,000 2,000 3,000 4,000
FY2014FY2013FY2012FY2011FY2010
Fisc
al Y
ears
31937 Brookhaven TOD Parking Deck
Determining the cause of the breakage of the collector shoes will have little impact on operations during the duration of the project. Once the cause has been eliminated, MARTA should experience operating cost savings as few shoes will be breaking and needing replacement.
Operating Impact
Project ScopeThe proposed project will provide an independent assessment of the collector shoe failure problem currently under investigation on MARTA’s rail cars. The assessment will identify areas of initial concern and take into consideration the work that MARTA has done to date. The study will consist of the development of an investigation action plan and priorities; detailed evaluation of both problematic equipment and infrastructure; analysis of any findings; and a final report with conclusions and recommendations.
Project Expenditures FY10 - FY14(In Thousands)
0.00.00.00.0
128.0
0 20 40 60 80 100 120 140
FY2014FY2013FY2012FY2011FY2010
Fisc
al Y
ears
31938 Rail Car Collector Shoe Study
490
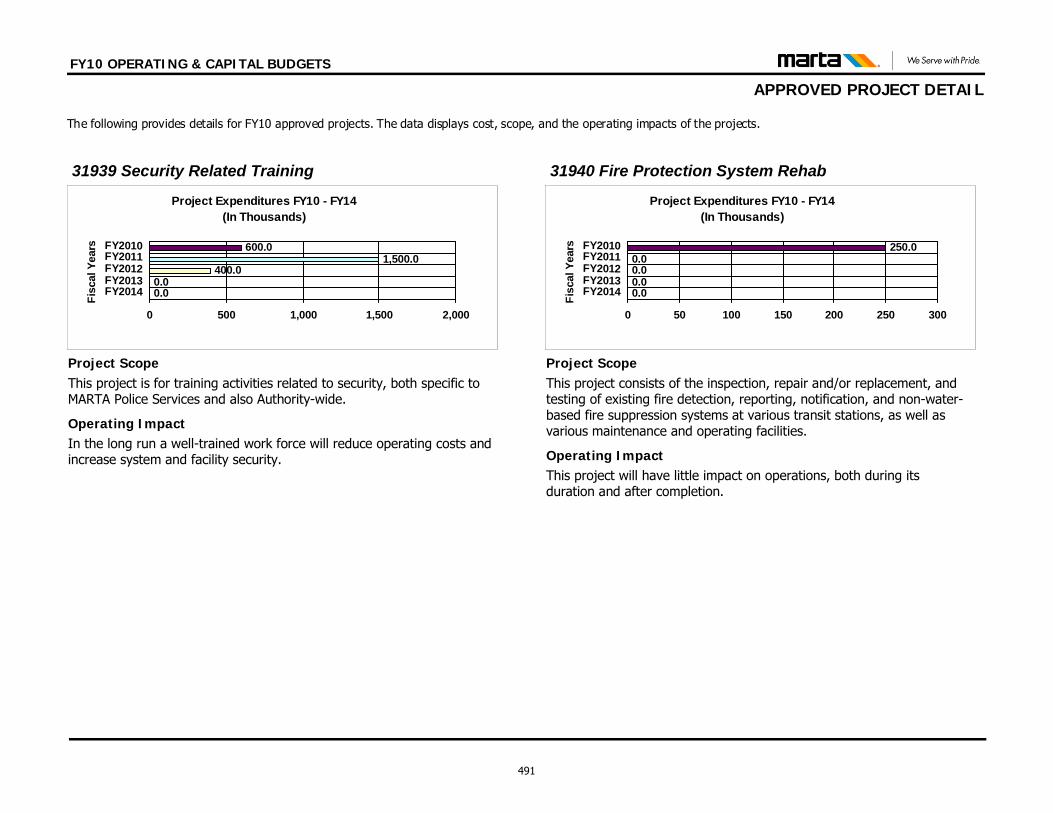
FY10 OPERATING & CAPITAL BUDGETS
APPROVED PROJECT DETAIL The following provides details for FY10 approved projects. The data displays cost, scope, and the operating impacts of the projects.
In the long run a well-trained work force will reduce operating costs and increase system and facility security.
Operating Impact
Project ScopeThis project is for training activities related to security, both specific to MARTA Police Services and also Authority-wide.
Project Expenditures FY10 - FY14(In Thousands)
0.00.0
400.01,500.0
600.0
0 500 1,000 1,500 2,000
FY2014FY2013FY2012FY2011FY2010
Fisc
al Y
ears
31939 Security Related Training
This project will have little impact on operations, both during its duration and after completion.
Operating Impact
Project ScopeThis project consists of the inspection, repair and/or replacement, and testing of existing fire detection, reporting, notification, and non-water-based fire suppression systems at various transit stations, as well as various maintenance and operating facilities.
Project Expenditures FY10 - FY14(In Thousands)
0.00.00.00.0
250.0
0 50 100 150 200 250 300
FY2014FY2013FY2012FY2011FY2010
Fisc
al Y
ears
31940 Fire Protection System Rehab
491
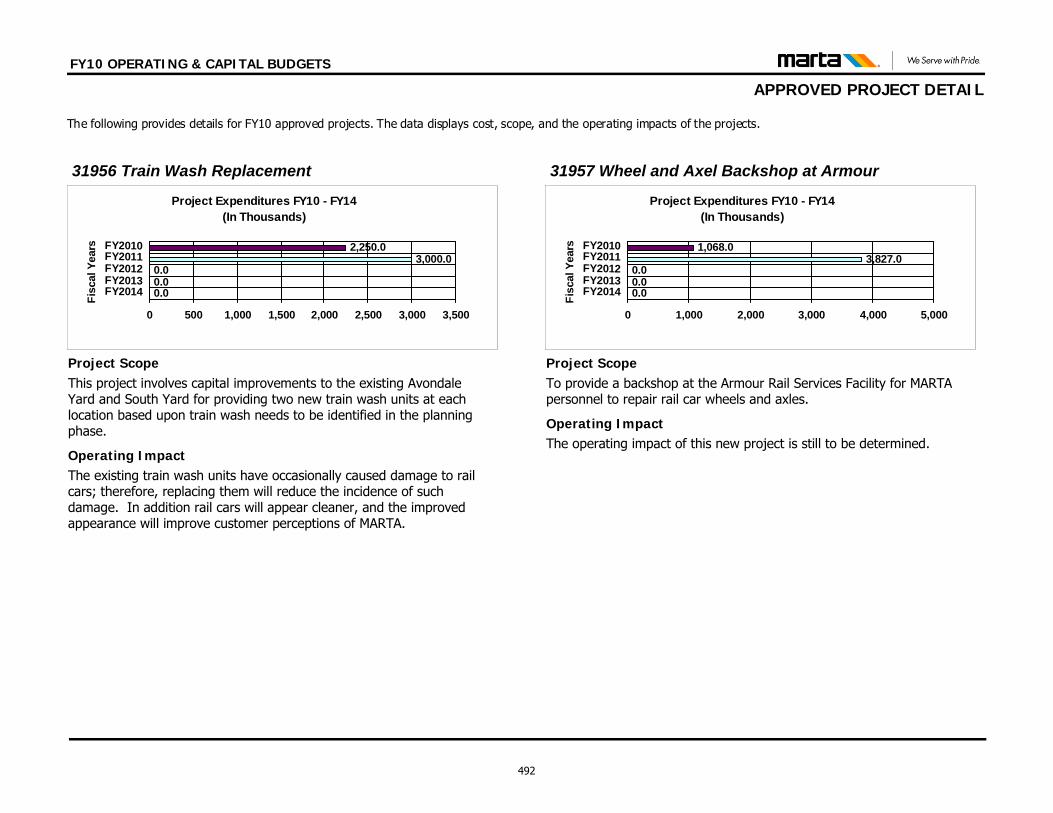
FY10 OPERATING & CAPITAL BUDGETS
APPROVED PROJECT DETAIL The following provides details for FY10 approved projects. The data displays cost, scope, and the operating impacts of the projects.
The existing train wash units have occasionally caused damage to rail cars; therefore, replacing them will reduce the incidence of such damage. In addition rail cars will appear cleaner, and the improved appearance will improve customer perceptions of MARTA.
Operating Impact
Project ScopeThis project involves capital improvements to the existing Avondale Yard and South Yard for providing two new train wash units at each location based upon train wash needs to be identified in the planning phase.
Project Expenditures FY10 - FY14(In Thousands)
0.00.00.0
3,000.02,250.0
0 500 1,000 1,500 2,000 2,500 3,000 3,500
FY2014FY2013FY2012FY2011FY2010
Fisc
al Y
ears
31956 Train Wash Replacement
The operating impact of this new project is still to be determined.Operating Impact
Project ScopeTo provide a backshop at the Armour Rail Services Facility for MARTA personnel to repair rail car wheels and axles.
Project Expenditures FY10 - FY14(In Thousands)
0.00.00.0
3,827.01,068.0
0 1,000 2,000 3,000 4,000 5,000
FY2014FY2013FY2012FY2011FY2010
Fisc
al Y
ears
31957 Wheel and Axel Backshop at Armour
492
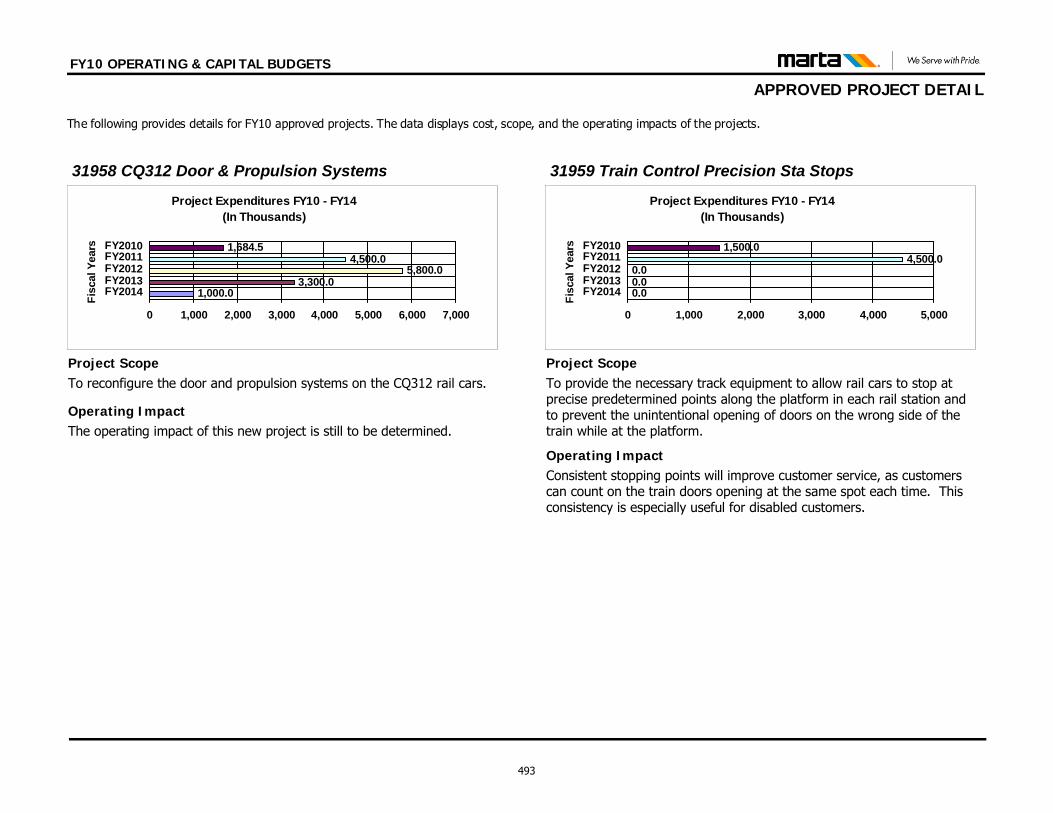
FY10 OPERATING & CAPITAL BUDGETS
APPROVED PROJECT DETAIL The following provides details for FY10 approved projects. The data displays cost, scope, and the operating impacts of the projects.
The operating impact of this new project is still to be determined.Operating Impact
Project ScopeTo reconfigure the door and propulsion systems on the CQ312 rail cars.
Project Expenditures FY10 - FY14(In Thousands)
1,000.03,300.0
5,800.04,500.0
1,684.5
0 1,000 2,000 3,000 4,000 5,000 6,000 7,000
FY2014FY2013FY2012FY2011FY2010
Fisc
al Y
ears
31958 CQ312 Door & Propulsion Systems
Consistent stopping points will improve customer service, as customers can count on the train doors opening at the same spot each time. This consistency is especially useful for disabled customers.
Operating Impact
Project ScopeTo provide the necessary track equipment to allow rail cars to stop at precise predetermined points along the platform in each rail station and to prevent the unintentional opening of doors on the wrong side of the train while at the platform.
Project Expenditures FY10 - FY14(In Thousands)
0.00.00.0
4,500.01,500.0
0 1,000 2,000 3,000 4,000 5,000
FY2014FY2013FY2012FY2011FY2010
Fisc
al Y
ears
31959 Train Control Precision Sta Stops
493
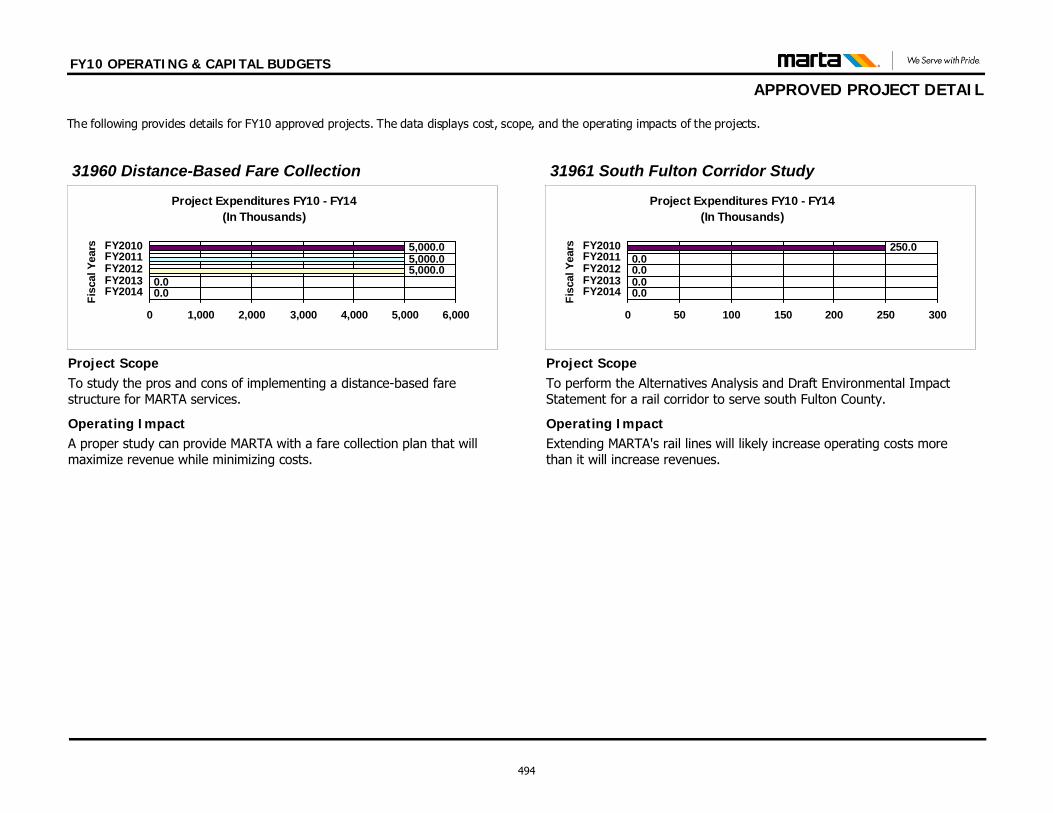
FY10 OPERATING & CAPITAL BUDGETS
APPROVED PROJECT DETAIL The following provides details for FY10 approved projects. The data displays cost, scope, and the operating impacts of the projects.
A proper study can provide MARTA with a fare collection plan that will maximize revenue while minimizing costs.
Operating Impact
Project ScopeTo study the pros and cons of implementing a distance-based fare structure for MARTA services.
Project Expenditures FY10 - FY14(In Thousands)
0.00.0
5,000.05,000.05,000.0
0 1,000 2,000 3,000 4,000 5,000 6,000
FY2014FY2013FY2012FY2011FY2010
Fisc
al Y
ears
31960 Distance-Based Fare Collection
Extending MARTA's rail lines will likely increase operating costs more than it will increase revenues.
Operating Impact
Project ScopeTo perform the Alternatives Analysis and Draft Environmental Impact Statement for a rail corridor to serve south Fulton County.
Project Expenditures FY10 - FY14(In Thousands)
0.00.00.00.0
250.0
0 50 100 150 200 250 300
FY2014FY2013FY2012FY2011FY2010
Fisc
al Y
ears
31961 South Fulton Corridor Study
494
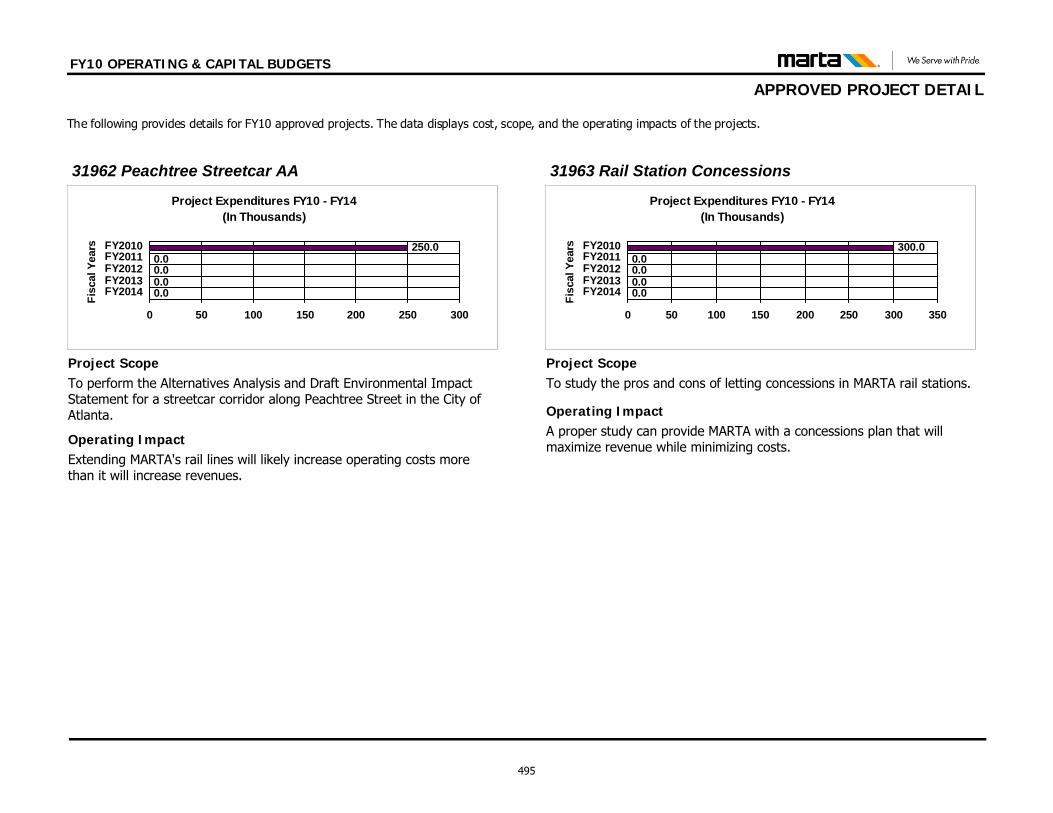
FY10 OPERATING & CAPITAL BUDGETS
APPROVED PROJECT DETAIL The following provides details for FY10 approved projects. The data displays cost, scope, and the operating impacts of the projects.
Extending MARTA's rail lines will likely increase operating costs more than it will increase revenues.
Operating Impact
Project ScopeTo perform the Alternatives Analysis and Draft Environmental Impact Statement for a streetcar corridor along Peachtree Street in the City of Atlanta.
Project Expenditures FY10 - FY14(In Thousands)
0.00.00.00.0
250.0
0 50 100 150 200 250 300
FY2014FY2013FY2012FY2011FY2010
Fisc
al Y
ears
31962 Peachtree Streetcar AA
A proper study can provide MARTA with a concessions plan that will maximize revenue while minimizing costs.
Operating Impact
Project ScopeTo study the pros and cons of letting concessions in MARTA rail stations.
Project Expenditures FY10 - FY14(In Thousands)
0.00.00.00.0
300.0
0 50 100 150 200 250 300 350
FY2014FY2013FY2012FY2011FY2010
Fisc
al Y
ears
31963 Rail Station Concessions
495
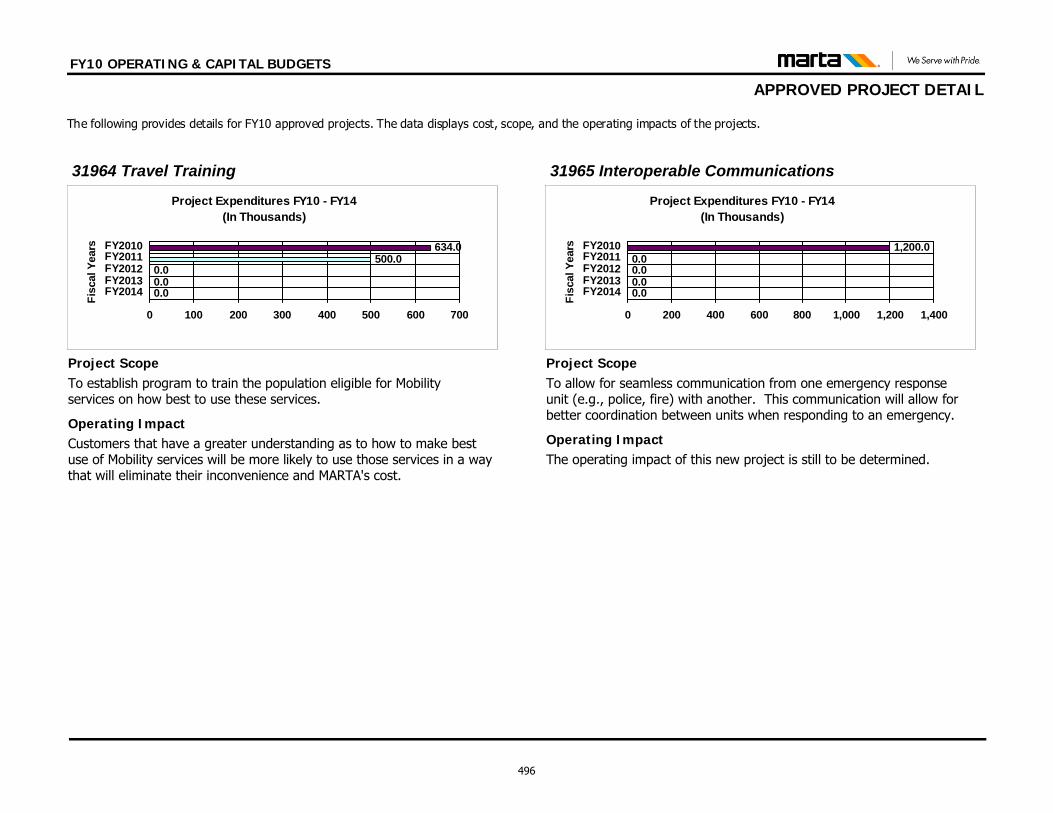
FY10 OPERATING & CAPITAL BUDGETS
APPROVED PROJECT DETAIL The following provides details for FY10 approved projects. The data displays cost, scope, and the operating impacts of the projects.
Customers that have a greater understanding as to how to make best use of Mobility services will be more likely to use those services in a way that will eliminate their inconvenience and MARTA's cost.
Operating Impact
Project ScopeTo establish program to train the population eligible for Mobility services on how best to use these services.
Project Expenditures FY10 - FY14(In Thousands)
0.00.00.0
500.0634.0
0 100 200 300 400 500 600 700
FY2014FY2013FY2012FY2011FY2010
Fisc
al Y
ears
31964 Travel Training
The operating impact of this new project is still to be determined.Operating Impact
Project ScopeTo allow for seamless communication from one emergency response unit (e.g., police, fire) with another. This communication will allow for better coordination between units when responding to an emergency.
Project Expenditures FY10 - FY14(In Thousands)
0.00.00.00.0
1,200.0
0 200 400 600 800 1,000 1,200 1,400
FY2014FY2013FY2012FY2011FY2010
Fisc
al Y
ears
31965 Interoperable Communications
496
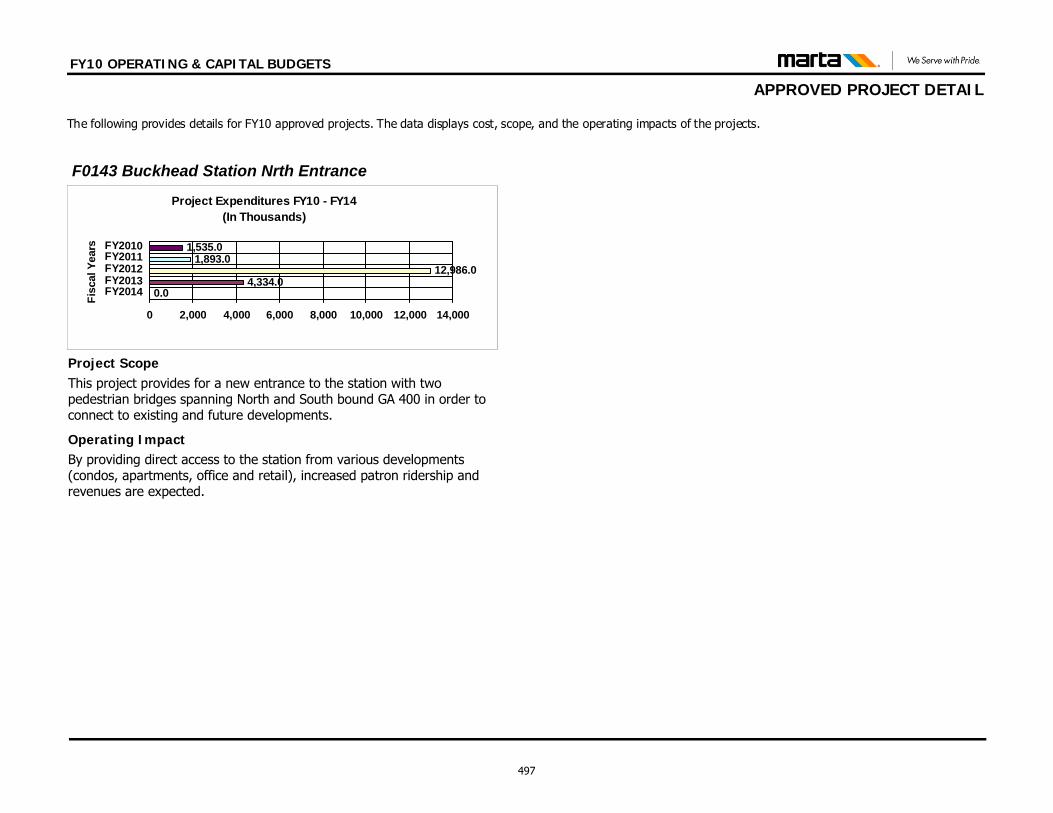
FY10 OPERATING & CAPITAL BUDGETS
APPROVED PROJECT DETAIL The following provides details for FY10 approved projects. The data displays cost, scope, and the operating impacts of the projects.
By providing direct access to the station from various developments (condos, apartments, office and retail), increased patron ridership and revenues are expected.
Operating Impact
Project ScopeThis project provides for a new entrance to the station with two pedestrian bridges spanning North and South bound GA 400 in order to connect to existing and future developments.
Project Expenditures FY10 - FY14(In Thousands)
0.04,334.0
12,986.01,893.0
1,535.0
0 2,000 4,000 6,000 8,000 10,000 12,000 14,000
FY2014FY2013FY2012FY2011FY2010
Fisc
al Y
ears
F0143 Buckhead Station Nrth Entrance
497
FY10 OPERATING & CAPITAL BUDGETS
FEDERAL GRANT DETAIL Federal Grants This section details the federal grants that support the funding of the FY10 Capital Improvement Program and beyond.
498
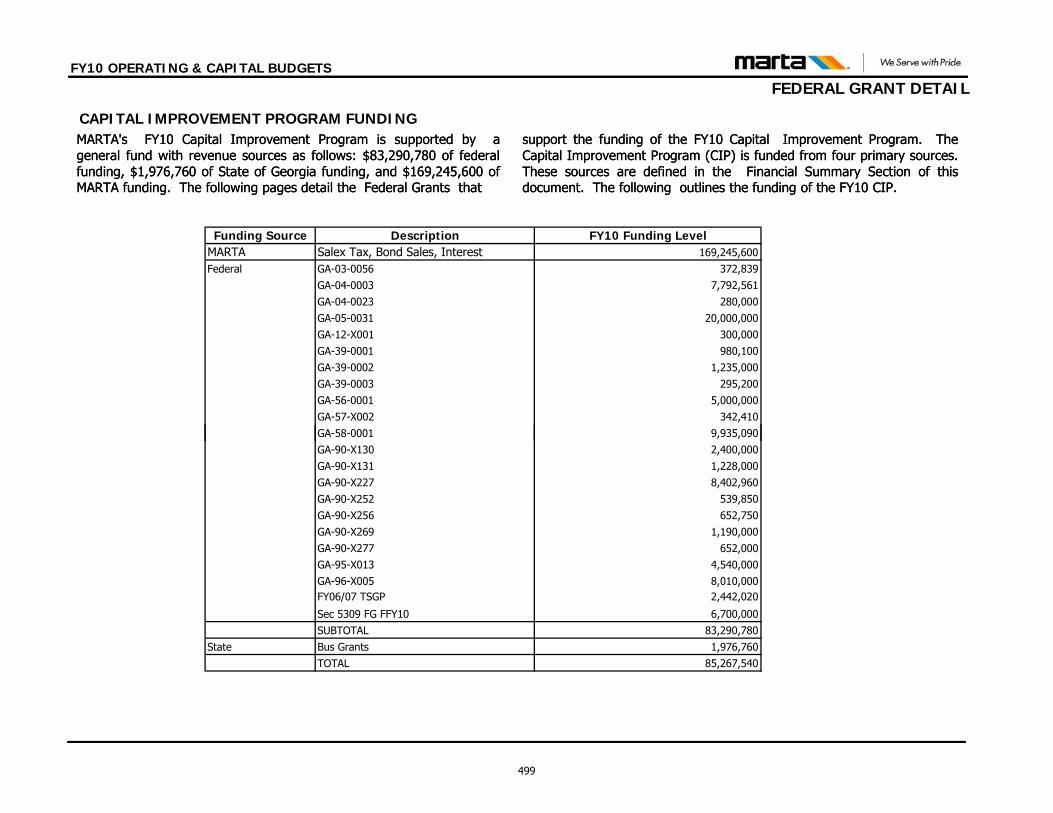
FY10 OPERATING & CAPITAL BUDGETS
FEDERAL GRANT DETAIL
CAPITAL IMPROVEMENT PROGRAM FUNDING
Funding Source DescriptionMARTA Salex Tax, Bond Sales, InterestFederal GA-03-0056
GA-04-0003GA-04-0023GA-05-0031GA-12-X001 300,000GA-39-0001 980,100GA-39-0002 1,235,000GA-39-0003GA-56-0001 5,000,000GA-57-X002 342,410GA 58 0001
FY10 Funding Level169,245,600
372,8397,792,561
9 935 090
280,00020,000,000
295,200
MARTA's FY10 Capital Improvement Program is supported by ageneral fund with revenue sources as follows: $83,290,780 of federalfunding, $1,976,760 of State of Georgia funding, and $169,245,600 ofMARTA funding. The following pages detail the Federal Grants that
support the funding of the FY10 Capital Improvement Program. TheCapital Improvement Program (CIP) is funded from four primary sources.These sources are defined in the Financial Summary Section of thisdocument. The following outlines the funding of the FY10 CIP.
GA-58-0001GA-90-X130GA-90-X131GA-90-X227GA-90-X252GA-90-X256GA-90-X269 1,190,000GA-90-X277 652,000GA-95-X013 4,540,000GA-96-X005FY06/07 TSGP
Sec 5309 FG FFY10SUBTOTAL
State Bus GrantsTOTAL
652,750
8,402,960
9,935,0902,400,0001,228,000
539,850
83,290,7801,976,760
85,267,540
8,010,0002,442,020
6,700,000
MARTA's FY10 Capital Improvement Program is supported by ageneral fund with revenue sources as follows: $83,290,780 of federalfunding, $1,976,760 of State of Georgia funding, and $169,245,600 ofMARTA funding. The following pages detail the Federal Grants that
support the funding of the FY10 Capital Improvement Program. TheCapital Improvement Program (CIP) is funded from four primary sources.These sources are defined in the Financial Summary Section of thisdocument. The following outlines the funding of the FY10 CIP.
499
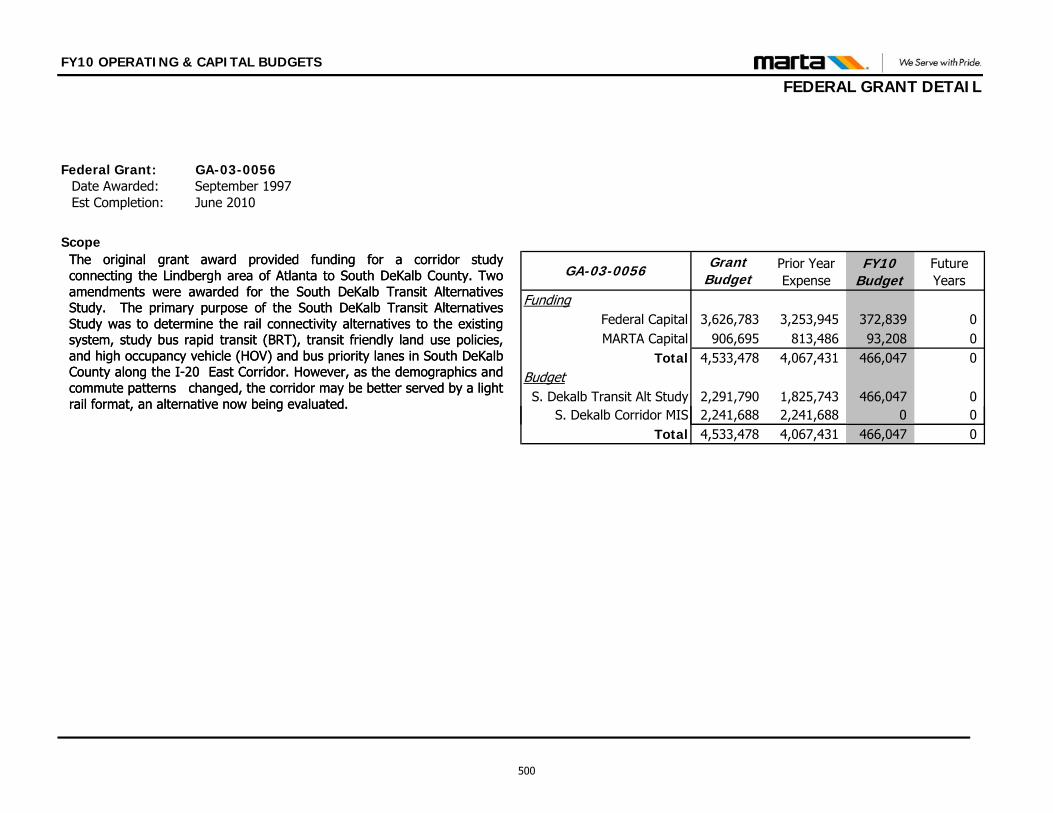
FY10 OPERATING & CAPITAL BUDGETS
FEDERAL GRANT DETAIL
Federal Grant: GA-03-0056Date Awarded: September 1997Est Completion: June 2010
Scope
FundingFederal Capital 3,626,783 3,253,945 372,839 0MARTA Capital 906,695 813,486 93,208 0
Total 4,533,478 4,067,431 466,047 0Budget
S. Dekalb Transit Alt Study 2,291,790 1,825,743 466,047 0S. Dekalb Corridor MIS 2,241,688 2,241,688 0 0
Future Years
GA-03-0056 Grant Budget
Prior Year Expense
FY10 Budget
The original grant award provided funding for a corridor studyconnecting the Lindbergh area of Atlanta to South DeKalb County. Twoamendments were awarded for the South DeKalb Transit AlternativesStudy. The primary purpose of the South DeKalb Transit AlternativesStudy was to determine the rail connectivity alternatives to the existingsystem, study bus rapid transit (BRT), transit friendly land use policies,and high occupancy vehicle (HOV) and bus priority lanes in South DeKalbCounty along the I-20 East Corridor. However, as the demographics andcommute patterns changed, the corridor may be better served by a lightrail format, an alternative now being evaluated.
Total 4,533,478 4,067,431 466,047 0
The original grant award provided funding for a corridor studyconnecting the Lindbergh area of Atlanta to South DeKalb County. Twoamendments were awarded for the South DeKalb Transit AlternativesStudy. The primary purpose of the South DeKalb Transit AlternativesStudy was to determine the rail connectivity alternatives to the existingsystem, study bus rapid transit (BRT), transit friendly land use policies,and high occupancy vehicle (HOV) and bus priority lanes in South DeKalbCounty along the I-20 East Corridor. However, as the demographics andcommute patterns changed, the corridor may be better served by a lightrail format, an alternative now being evaluated.
500
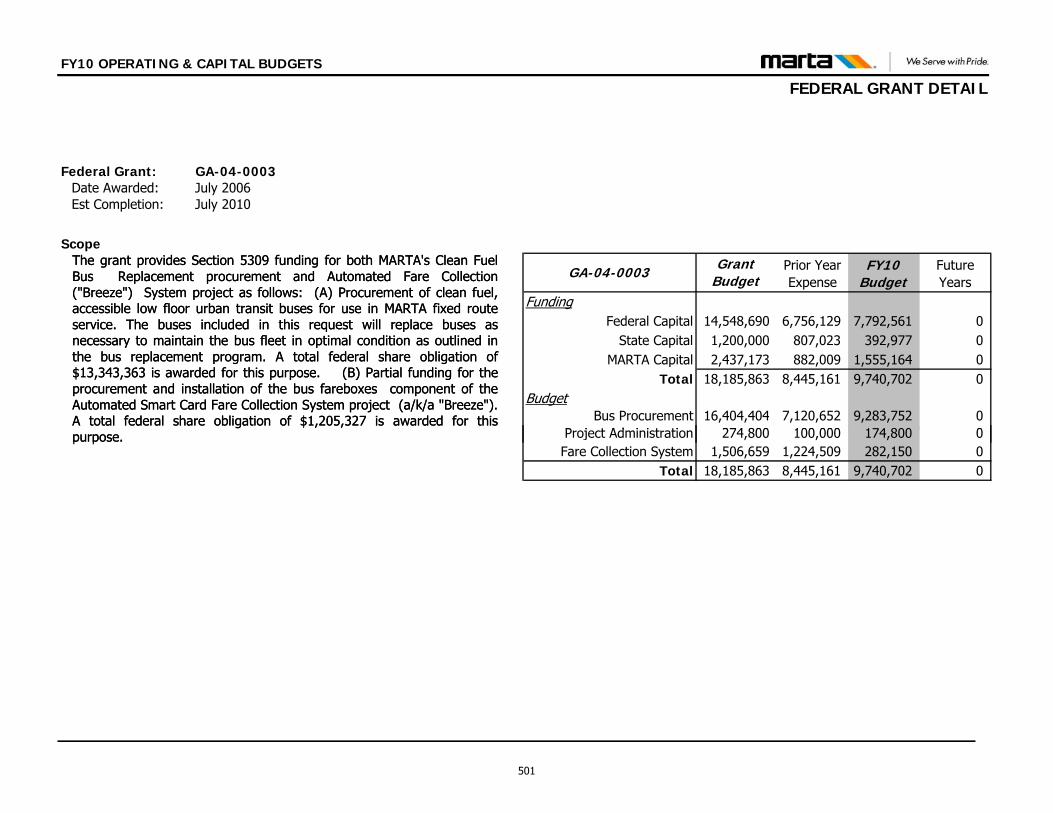
FY10 OPERATING & CAPITAL BUDGETS
FEDERAL GRANT DETAIL
Federal Grant: GA-04-0003Date Awarded: July 2006Est Completion: July 2010
Scope
FundingFederal Capital 14,548,690 6,756,129 7,792,561 0
State Capital 1,200,000 807,023 392,977 0MARTA Capital 2,437,173 882,009 1,555,164 0
Total 18,185,863 8,445,161 9,740,702 0Budget
Bus Procurement 16,404,404 7,120,652 9,283,752 0P j t Ad i i t ti 274 800 100 000 174 800 0
Future Years
GA-04-0003 Grant Budget
Prior Year Expense
FY10 Budget
The grant provides Section 5309 funding for both MARTA's Clean FuelBus Replacement procurement and Automated Fare Collection("Breeze") System project as follows: (A) Procurement of clean fuel,accessible low floor urban transit buses for use in MARTA fixed routeservice. The buses included in this request will replace buses asnecessary to maintain the bus fleet in optimal condition as outlined inthe bus replacement program. A total federal share obligation of$13,343,363 is awarded for this purpose. (B) Partial funding for theprocurement and installation of the bus fareboxes component of theAutomated Smart Card Fare Collection System project (a/k/a "Breeze").A total federal share obligation of $1,205,327 is awarded for thispurpose. Project Administration 274,800 100,000 174,800 0
Fare Collection System 1,506,659 1,224,509 282,150 0Total 18,185,863 8,445,161 9,740,702 0
The grant provides Section 5309 funding for both MARTA's Clean FuelBus Replacement procurement and Automated Fare Collection("Breeze") System project as follows: (A) Procurement of clean fuel,accessible low floor urban transit buses for use in MARTA fixed routeservice. The buses included in this request will replace buses asnecessary to maintain the bus fleet in optimal condition as outlined inthe bus replacement program. A total federal share obligation of$13,343,363 is awarded for this purpose. (B) Partial funding for theprocurement and installation of the bus fareboxes component of theAutomated Smart Card Fare Collection System project (a/k/a "Breeze").A total federal share obligation of $1,205,327 is awarded for thispurpose.
501
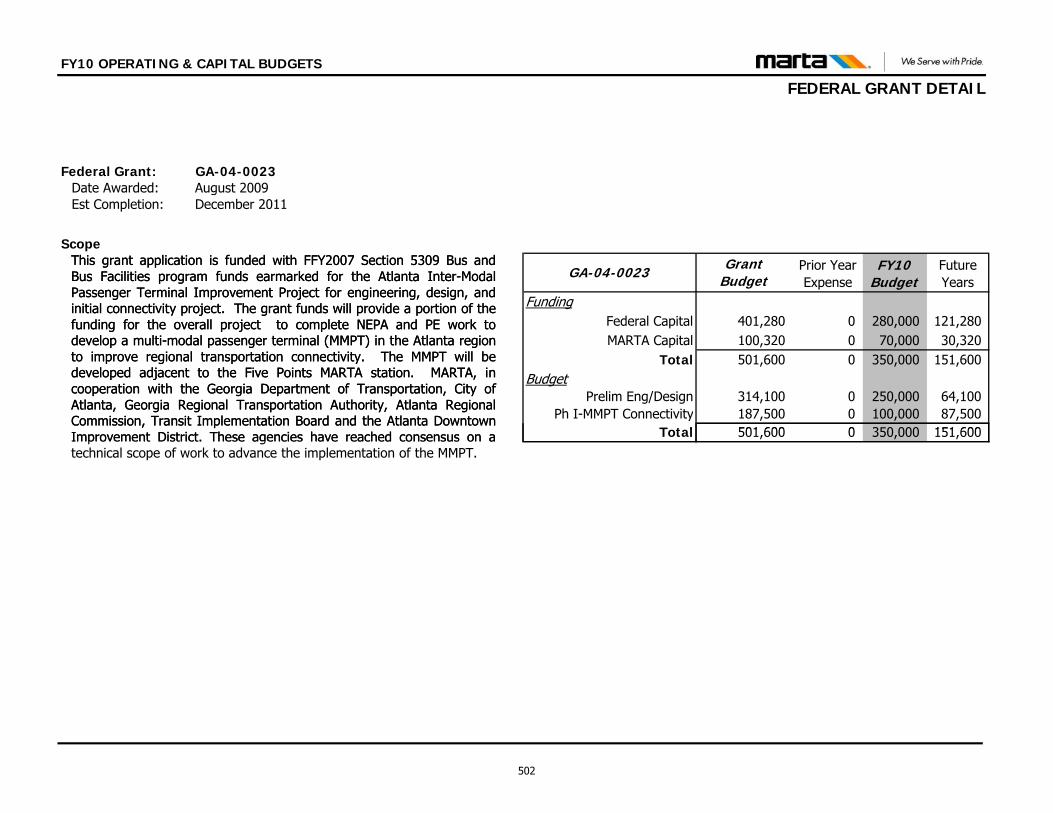
FY10 OPERATING & CAPITAL BUDGETS
FEDERAL GRANT DETAIL
Federal Grant: GA-04-0023Date Awarded: August 2009Est Completion: December 2011
Scope
FundingFederal Capital 401,280 0 280,000 121,280MARTA Capital 100,320 0 70,000 30,320
Total 501,600 0 350,000 151,600Budget
Prelim Eng/Design 314,100 0 250,000 64,100Ph I-MMPT Connectivity 187,500 0 100,000 87,500
Total 501 600 0 350 000 151 600
Future Years
GA-04-0023 Grant Budget
Prior Year Expense
FY10 Budget
This grant application is funded with FFY2007 Section 5309 Bus andBus Facilities program funds earmarked for the Atlanta Inter-ModalPassenger Terminal Improvement Project for engineering, design, andinitial connectivity project. The grant funds will provide a portion of thefunding for the overall project to complete NEPA and PE work todevelop a multi-modal passenger terminal (MMPT) in the Atlanta regionto improve regional transportation connectivity. The MMPT will bedeveloped adjacent to the Five Points MARTA station. MARTA, incooperation with the Georgia Department of Transportation, City ofAtlanta, Georgia Regional Transportation Authority, Atlanta RegionalCommission, Transit Implementation Board and the Atlanta DowntownImprovement District. These agencies have reached consensus on a Total 501,600 0 350,000 151,600
This grant application is funded with FFY2007 Section 5309 Bus andBus Facilities program funds earmarked for the Atlanta Inter-ModalPassenger Terminal Improvement Project for engineering, design, andinitial connectivity project. The grant funds will provide a portion of thefunding for the overall project to complete NEPA and PE work todevelop a multi-modal passenger terminal (MMPT) in the Atlanta regionto improve regional transportation connectivity. The MMPT will bedeveloped adjacent to the Five Points MARTA station. MARTA, incooperation with the Georgia Department of Transportation, City ofAtlanta, Georgia Regional Transportation Authority, Atlanta RegionalCommission, Transit Implementation Board and the Atlanta DowntownImprovement District. These agencies have reached consensus on atechnical scope of work to advance the implementation of the MMPT.
502
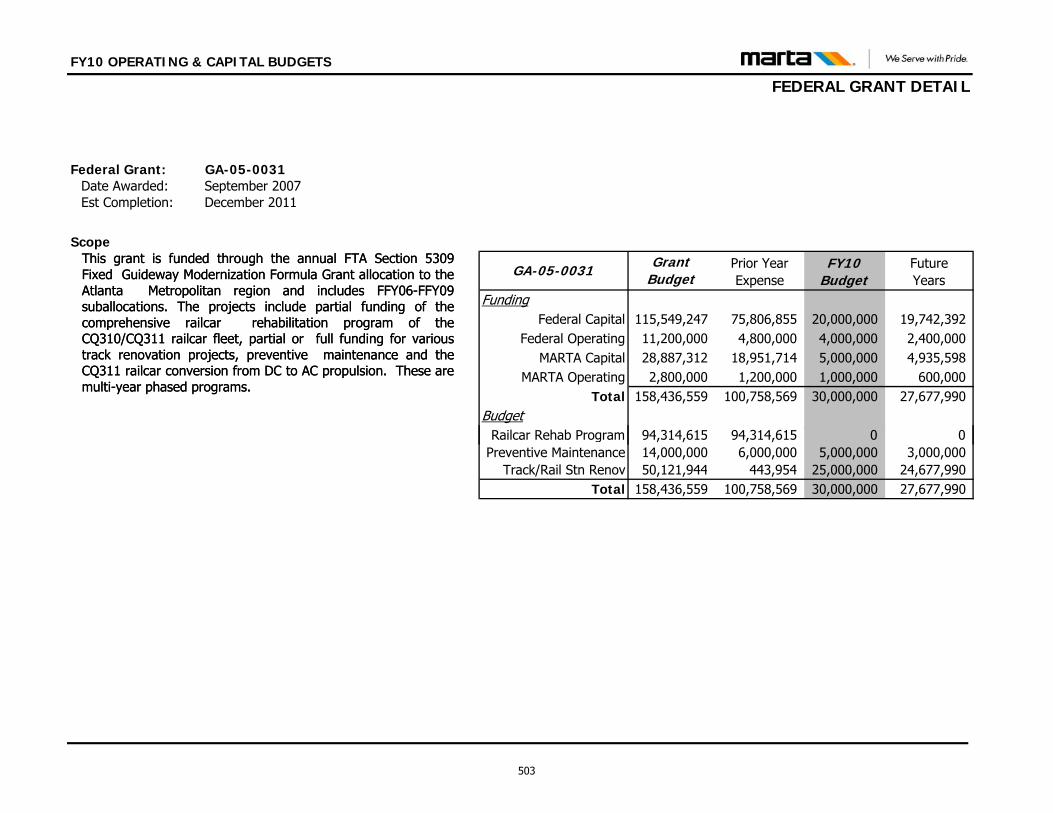
Future Years
FY10 Budget
This grant is funded through the annual FTAFixed Guideway Modernization Formula Grant alloAtlanta Metropolitan region and includessuballocations. The projects include partial fundi
FY10 OPERATING & CAPITAL BUDGETS
FEDERAL GRANT DETAIL
Federal Grant: GA-05-0031Date Awarded: September 2007Est Completion: December 2011
ScopeSection 5309cation to the GA-05-0031 Grant
Budge t
Prior Year Expense
FundingFFY06-FFY09
ng of thecomprehensive railcar rehabilitation program of the Federal Capital 115,549,247 75,806,855 20,000,000 19,742,392CQ310/CQ311 railcar fleet, partial or full funding for various Federal Operating 11,200,000 4,800,000 4,000,000 2,400,000track renovation projects, preventive maintenance and the MARTA Capital 28,887,312 18,951,714 5,000,000 4,935,598CQ311 railcar conversion from DC to AC propulsion. These are MARTA Operating 2,800,000 1,200,000 1,000,000 600,000multi-year phased programs.
Total 158,436,559 100,758,569 30,000,000 27,677,990Budget
Railcar Rehab Program 94,314,615 94,314,615 0 0Preventive Maintenance 14,000,000 6,000,000 5,000,000 3,000,000
Track/Rail Stn Renov 50,121,944 443,954 25,000,000 24,677,990Total 158,436,559 100,758,569 30,000,000 27,677,990
This grant is funded through the annual FTA Section 5309Fixed Guideway Modernization Formula Grant allocation to theAtlanta Metropolitan region and includes FFY06-FFY09suballocations. The projects include partial funding of thecomprehensive railcar rehabilitation program of theCQ310/CQ311 railcar fleet, partial or full funding for varioustrack renovation projects, preventive maintenance and theCQ311 railcar conversion from DC to AC propulsion. These aremulti-year phased programs.
503
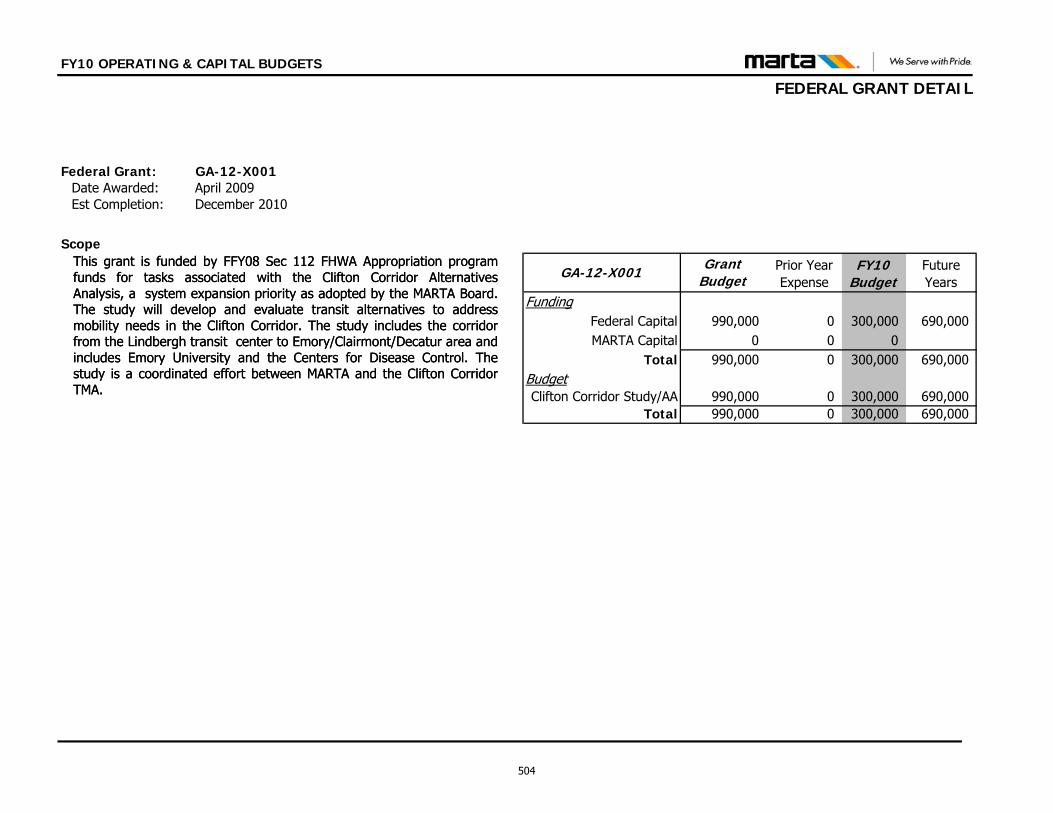
FY10 OPERATING & CAPITAL BUDGETS
FEDERAL GRANT DETAIL
Federal Grant: GA-12-X001Date Awarded: April 2009Est Completion: December 2010
Scope
FundingFederal Capital 990,000 0 300,000 690,000MARTA Capital 0 0 0
Total 990,000 0 300,000 690,000BudgetClifton Corridor Study/AA 990,000 0 300,000 690,000
Total 990,000 0 300,000 690,000
Future Years
GA-12-X001 Grant Budget
Prior Year Expense
FY10 Budget
This grant is funded by FFY08 Sec 112 FHWA Appropriation programfunds for tasks associated with the Clifton Corridor AlternativesAnalysis, a system expansion priority as adopted by the MARTA Board.The study will develop and evaluate transit alternatives to addressmobility needs in the Clifton Corridor. The study includes the corridorfrom the Lindbergh transit center to Emory/Clairmont/Decatur area andincludes Emory University and the Centers for Disease Control. Thestudy is a coordinated effort between MARTA and the Clifton CorridorTMA.
This grant is funded by FFY08 Sec 112 FHWA Appropriation programfunds for tasks associated with the Clifton Corridor AlternativesAnalysis, a system expansion priority as adopted by the MARTA Board.The study will develop and evaluate transit alternatives to addressmobility needs in the Clifton Corridor. The study includes the corridorfrom the Lindbergh transit center to Emory/Clairmont/Decatur area andincludes Emory University and the Centers for Disease Control. Thestudy is a coordinated effort between MARTA and the Clifton CorridorTMA.
504
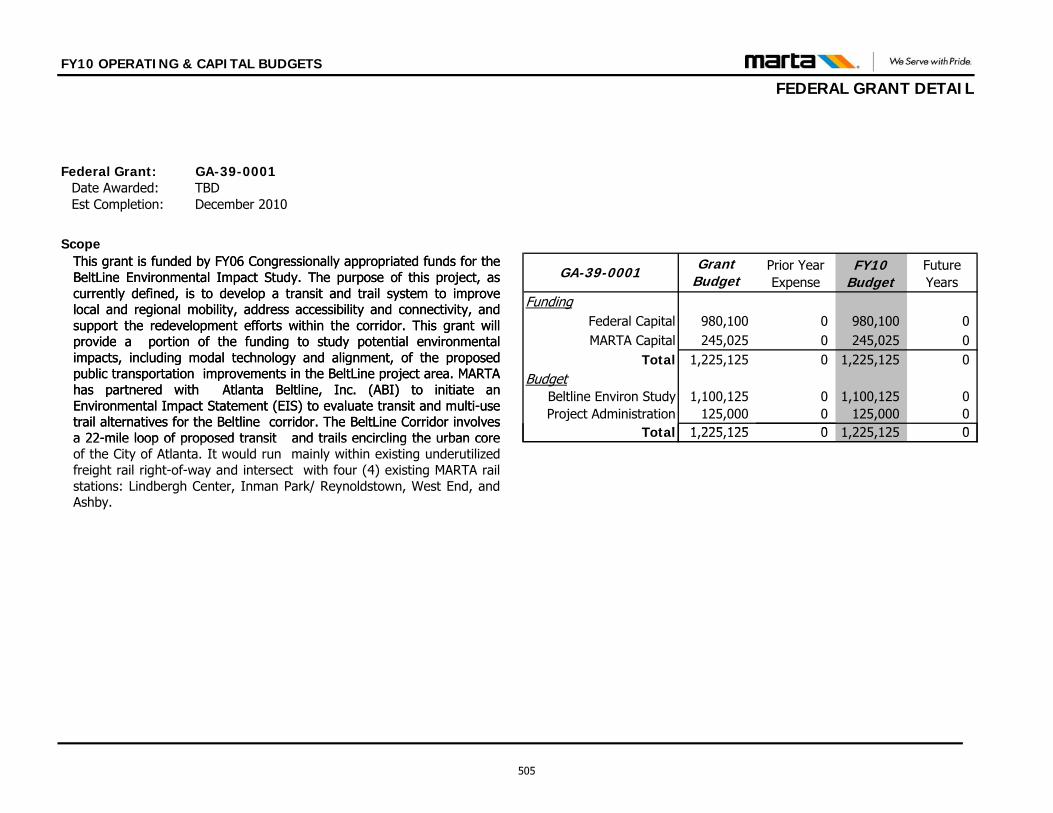
FY10 OPERATING & CAPITAL BUDGETS
FEDERAL GRANT DETAIL
Federal Grant: GA-39-0001Date Awarded: TBDEst Completion: December 2010
Scope
FundingFederal Capital 980,100 0 980,100 0MARTA Capital 245,025 0 245,025 0
Total 1,225,125 0 1,225,125 0Budget
Beltline Environ Study 1,100,125 0 1,100,125 0Project Administration 125,000 0 125,000 0
Total 1 225 125 0 1 225 125 0
Future Years
GA-39-0001 Grant Budget
Prior Year Expense
FY10 Budget
This grant is funded by FY06 Congressionally appropriated funds for theBeltLine Environmental Impact Study. The purpose of this project, ascurrently defined, is to develop a transit and trail system to improvelocal and regional mobility, address accessibility and connectivity, andsupport the redevelopment efforts within the corridor. This grant willprovide a portion of the funding to study potential environmentalimpacts, including modal technology and alignment, of the proposedpublic transportation improvements in the BeltLine project area. MARTAhas partnered with Atlanta Beltline, Inc. (ABI) to initiate anEnvironmental Impact Statement (EIS) to evaluate transit and multi-usetrail alternatives for the Beltline corridor. The BeltLine Corridor involvesa 22-mile loop of proposed transit and trails encircling the urban core Total 1,225,125 0 1,225,125 0
This grant is funded by FY06 Congressionally appropriated funds for theBeltLine Environmental Impact Study. The purpose of this project, ascurrently defined, is to develop a transit and trail system to improvelocal and regional mobility, address accessibility and connectivity, andsupport the redevelopment efforts within the corridor. This grant willprovide a portion of the funding to study potential environmentalimpacts, including modal technology and alignment, of the proposedpublic transportation improvements in the BeltLine project area. MARTAhas partnered with Atlanta Beltline, Inc. (ABI) to initiate anEnvironmental Impact Statement (EIS) to evaluate transit and multi-usetrail alternatives for the Beltline corridor. The BeltLine Corridor involvesa 22-mile loop of proposed transit and trails encircling the urban coreof the City of Atlanta. It would run mainly within existing underutilizedfreight rail right-of-way and intersect with four (4) existing MARTA railstations: Lindbergh Center, Inman Park/ Reynoldstown, West End, andAshby.
505
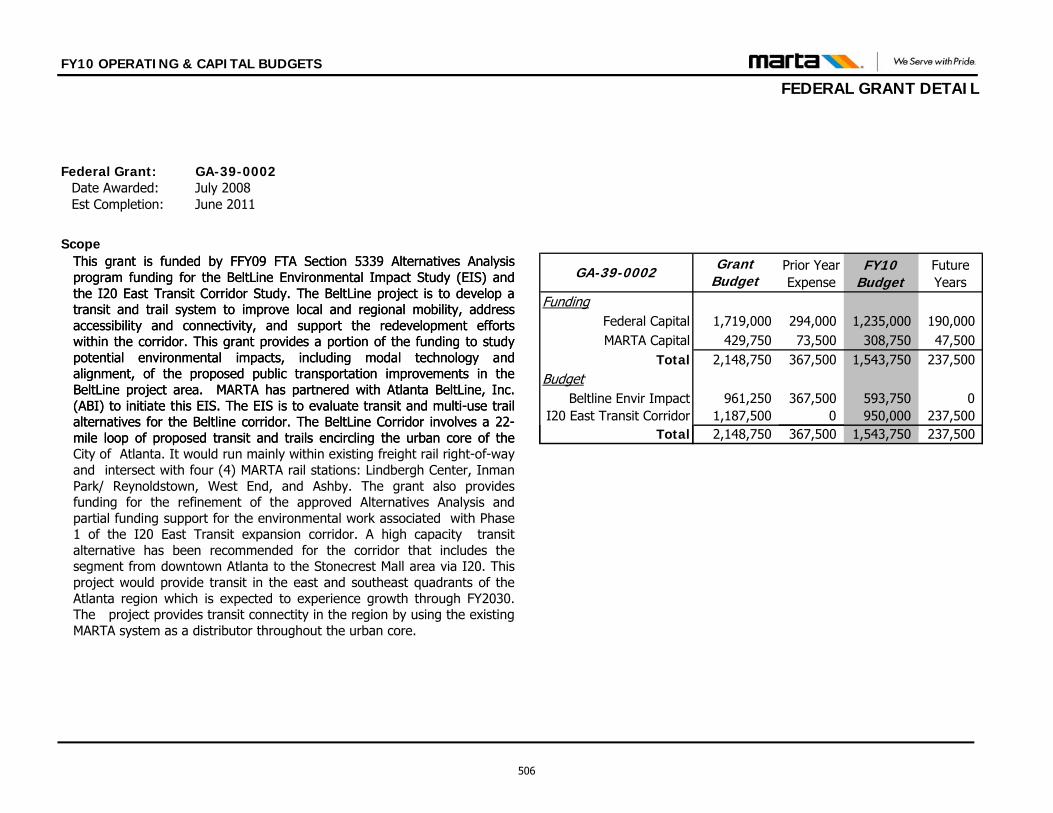
FY10 OPERATING & CAPITAL BUDGETS
FEDERAL GRANT DETAIL
Federal Grant: GA-39-0002Date Awarded: July 2008Est Completion: June 2011
Scope
FundingFederal Capital 1,719,000 294,000 1,235,000 190,000MARTA Capital 429,750 73,500 308,750 47,500
Total 2,148,750 367,500 1,543,750 237,500Budget
Beltline Envir Impact 961,250 367,500 593,750 0I20 East Transit Corridor 1,187,500 0 950,000 237,500
T t l 2 148 750 367 500 1 543 750 237 500
Future Years
GA-39-0002 Grant Budget
Prior Year Expense
FY10 Budget
This grant is funded by FFY09 FTA Section 5339 Alternatives Analysisprogram funding for the BeltLine Environmental Impact Study (EIS) andthe I20 East Transit Corridor Study. The BeltLine project is to develop atransit and trail system to improve local and regional mobility, addressaccessibility and connectivity, and support the redevelopment effortswithin the corridor. This grant provides a portion of the funding to studypotential environmental impacts, including modal technology andalignment, of the proposed public transportation improvements in theBeltLine project area. MARTA has partnered with Atlanta BeltLine, Inc.(ABI) to initiate this EIS. The EIS is to evaluate transit and multi-use trailalternatives for the Beltline corridor. The BeltLine Corridor involves a 22-mile loop of proposed transit and trails encircling the urban core of the Total 2,148,750 367,500 1,543,750 237,500
This grant is funded by FFY09 FTA Section 5339 Alternatives Analysisprogram funding for the BeltLine Environmental Impact Study (EIS) andthe I20 East Transit Corridor Study. The BeltLine project is to develop atransit and trail system to improve local and regional mobility, addressaccessibility and connectivity, and support the redevelopment effortswithin the corridor. This grant provides a portion of the funding to studypotential environmental impacts, including modal technology andalignment, of the proposed public transportation improvements in theBeltLine project area. MARTA has partnered with Atlanta BeltLine, Inc.(ABI) to initiate this EIS. The EIS is to evaluate transit and multi-use trailalternatives for the Beltline corridor. The BeltLine Corridor involves a 22-mile loop of proposed transit and trails encircling the urban core of theCity of Atlanta. It would run mainly within existing freight rail right-of-wayand intersect with four (4) MARTA rail stations: Lindbergh Center, InmanPark/ Reynoldstown, West End, and Ashby. The grant also providesfunding for the refinement of the approved Alternatives Analysis andpartial funding support for the environmental work associated with Phase1 of the I20 East Transit expansion corridor. A high capacity transitalternative has been recommended for the corridor that includes thesegment from downtown Atlanta to the Stonecrest Mall area via I20. Thisproject would provide transit in the east and southeast quadrants of theAtlanta region which is expected to experience growth through FY2030.The project provides transit connectity in the region by using the existingMARTA system as a distributor throughout the urban core.
506
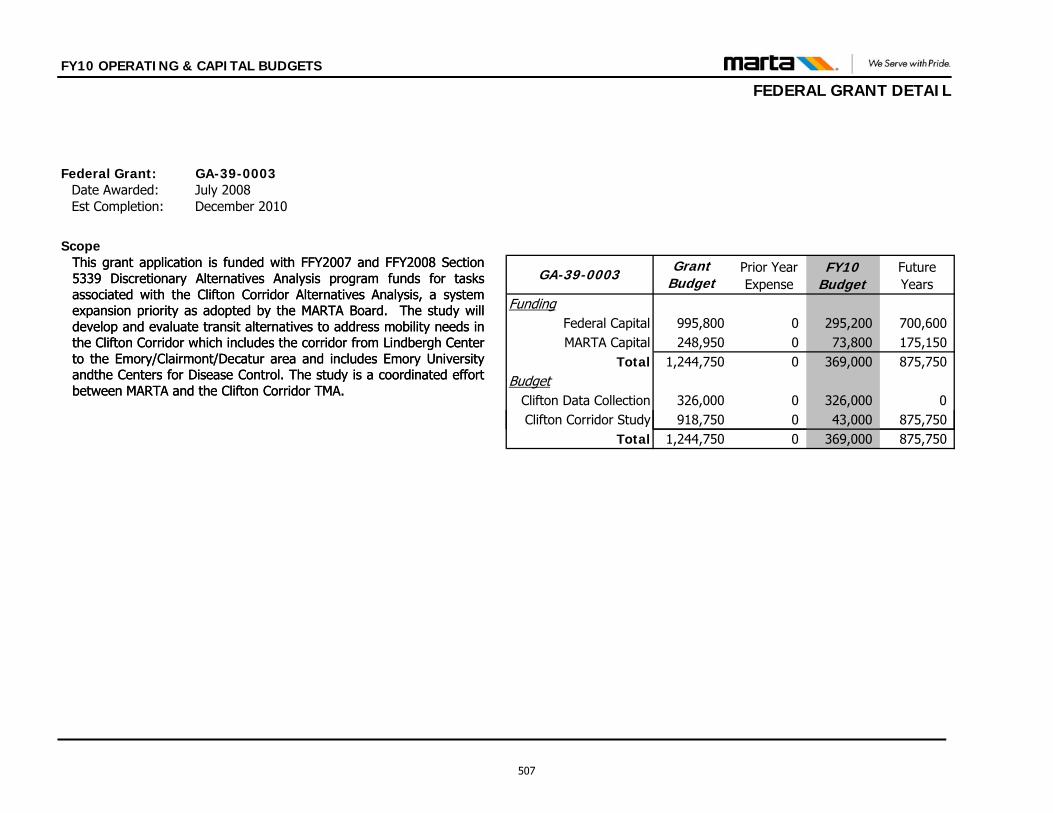
FY10 OPERATING & CAPITAL BUDGETS
FEDERAL GRANT DETAIL
Federal Grant: GA-39-0003Date Awarded: July 2008Est Completion: December 2010
Scope
FundingFederal Capital 995,800 0 295,200 700,600MARTA Capital 248,950 0 73,800 175,150
Total 1,244,750 0 369,000 875,750Budget
Clifton Data Collection 326,000 0 326,000 0Clifton Corridor Study 918,750 0 43,000 875,750
Future Years
GA-39-0003 Grant Budget
Prior Year Expense
FY10 Budget
This grant application is funded with FFY2007 and FFY2008 Section5339 Discretionary Alternatives Analysis program funds for tasksassociated with the Clifton Corridor Alternatives Analysis, a systemexpansion priority as adopted by the MARTA Board. The study willdevelop and evaluate transit alternatives to address mobility needs inthe Clifton Corridor which includes the corridor from Lindbergh Centerto the Emory/Clairmont/Decatur area and includes Emory Universityandthe Centers for Disease Control. The study is a coordinated effortbetween MARTA and the Clifton Corridor TMA.
yTotal 1,244,750 0 369,000 875,750
This grant application is funded with FFY2007 and FFY2008 Section5339 Discretionary Alternatives Analysis program funds for tasksassociated with the Clifton Corridor Alternatives Analysis, a systemexpansion priority as adopted by the MARTA Board. The study willdevelop and evaluate transit alternatives to address mobility needs inthe Clifton Corridor which includes the corridor from Lindbergh Centerto the Emory/Clairmont/Decatur area and includes Emory Universityandthe Centers for Disease Control. The study is a coordinated effortbetween MARTA and the Clifton Corridor TMA.
507
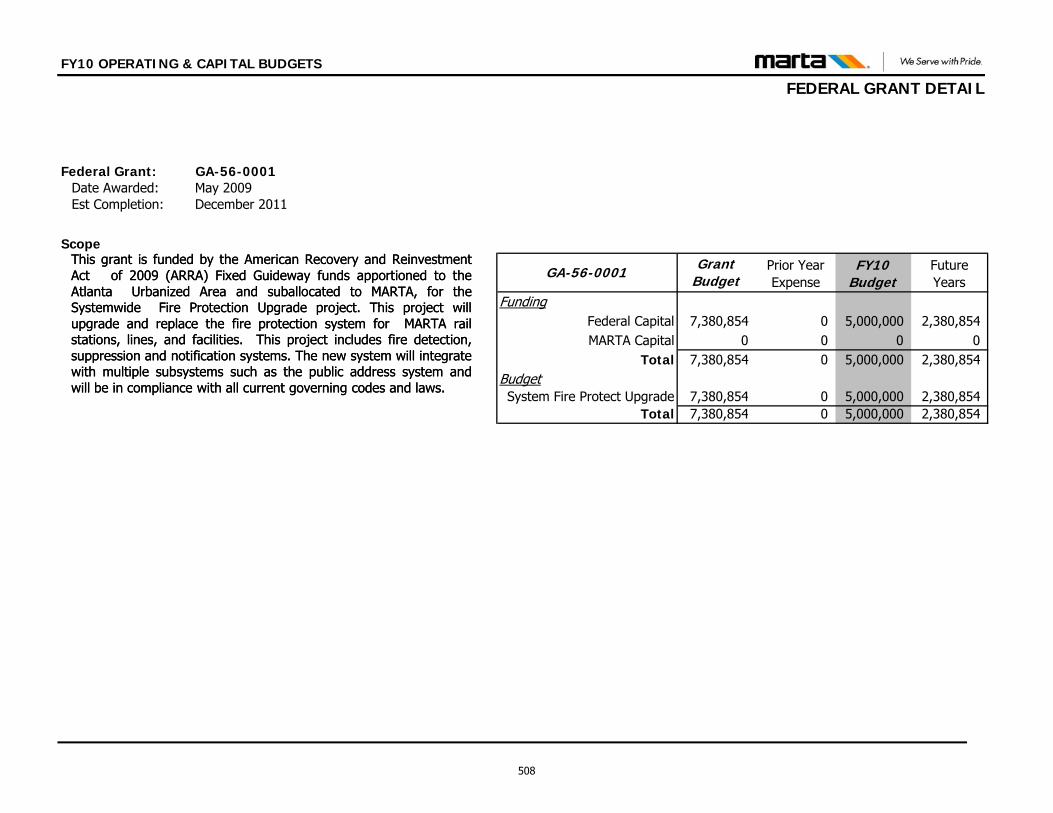
FY10 OPERATING & CAPITAL BUDGETS
FEDERAL GRANT DETAIL
Federal Grant: GA-56-0001Date Awarded: May 2009Est Completion: December 2011
Scope
FundingFederal Capital 7,380,854 0 5,000,000 2,380,854MARTA Capital 0 0 0 0
Total 7,380,854 0 5,000,000 2,380,854BudgetSystem Fire Protect Upgrade 7,380,854 0 5,000,000 2,380,854
Total 7,380,854 0 5,000,000 2,380,854
Future Years
GA-56-0001 Grant Budget
Prior Year Expense
FY10 Budget
This grant is funded by the American Recovery and ReinvestmentAct of 2009 (ARRA) Fixed Guideway funds apportioned to theAtlanta Urbanized Area and suballocated to MARTA, for theSystemwide Fire Protection Upgrade project. This project willupgrade and replace the fire protection system for MARTA railstations, lines, and facilities. This project includes fire detection,suppression and notification systems. The new system will integratewith multiple subsystems such as the public address system andwill be in compliance with all current governing codes and laws.
This grant is funded by the American Recovery and ReinvestmentAct of 2009 (ARRA) Fixed Guideway funds apportioned to theAtlanta Urbanized Area and suballocated to MARTA, for theSystemwide Fire Protection Upgrade project. This project willupgrade and replace the fire protection system for MARTA railstations, lines, and facilities. This project includes fire detection,suppression and notification systems. The new system will integratewith multiple subsystems such as the public address system andwill be in compliance with all current governing codes and laws.
508
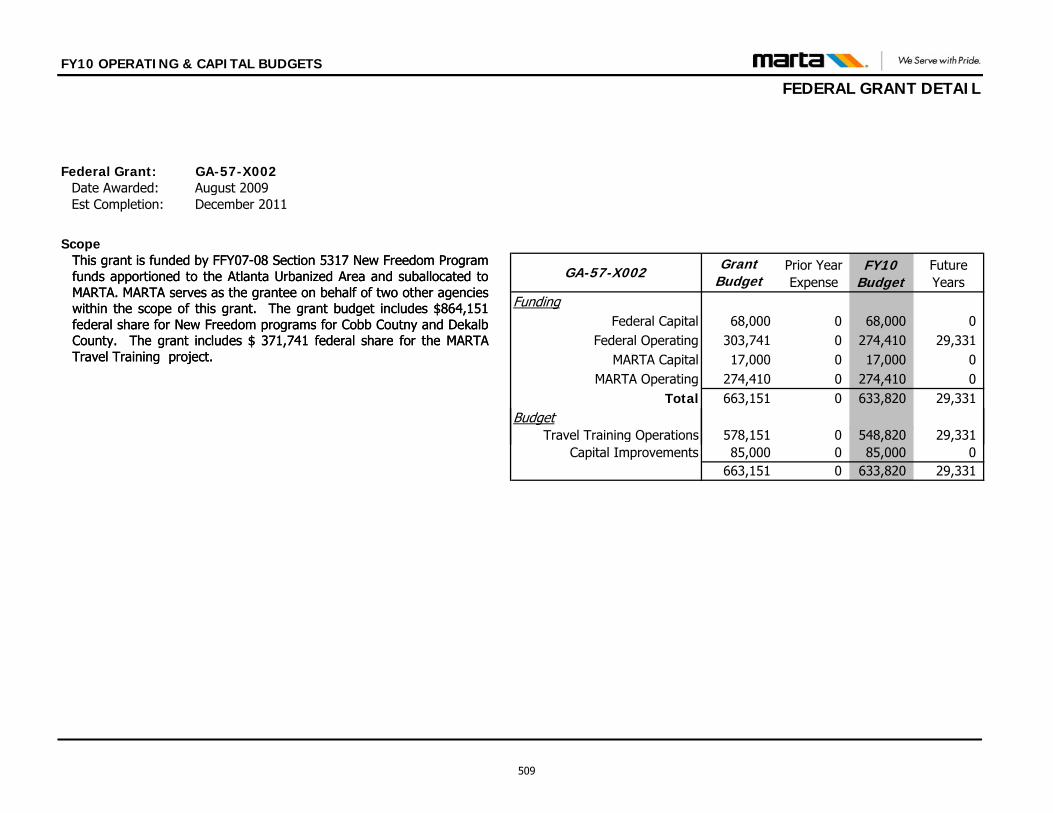
FY10 OPERATING & CAPITAL BUDGETS
FEDERAL GRANT DETAIL
Federal Grant: GA-57-X002Date Awarded: August 2009Est Completion: December 2011
Scope
FundingFederal Capital 68,000 0 68,000 0
Federal Operating 303,741 0 274,410 29,331MARTA Capital 17,000 0 17,000 0
MARTA Operating 274,410 0 274,410 0Total 663,151 0 633,820 29,331
Budget
Future Years
GA-57-X002 Grant Budget
Prior Year Expense
FY10 Budget
This grant is funded by FFY07-08 Section 5317 New Freedom Programfunds apportioned to the Atlanta Urbanized Area and suballocated toMARTA. MARTA serves as the grantee on behalf of two other agencieswithin the scope of this grant. The grant budget includes $864,151federal share for New Freedom programs for Cobb Coutny and DekalbCounty. The grant includes $ 371,741 federal share for the MARTATravel Training project.
Travel Training Operations 578,151 0 548,820 29,331Capital Improvements 85,000 0 85,000 0
663,151 0 633,820 29,331
This grant is funded by FFY07-08 Section 5317 New Freedom Programfunds apportioned to the Atlanta Urbanized Area and suballocated toMARTA. MARTA serves as the grantee on behalf of two other agencieswithin the scope of this grant. The grant budget includes $864,151federal share for New Freedom programs for Cobb Coutny and DekalbCounty. The grant includes $ 371,741 federal share for the MARTATravel Training project.
509
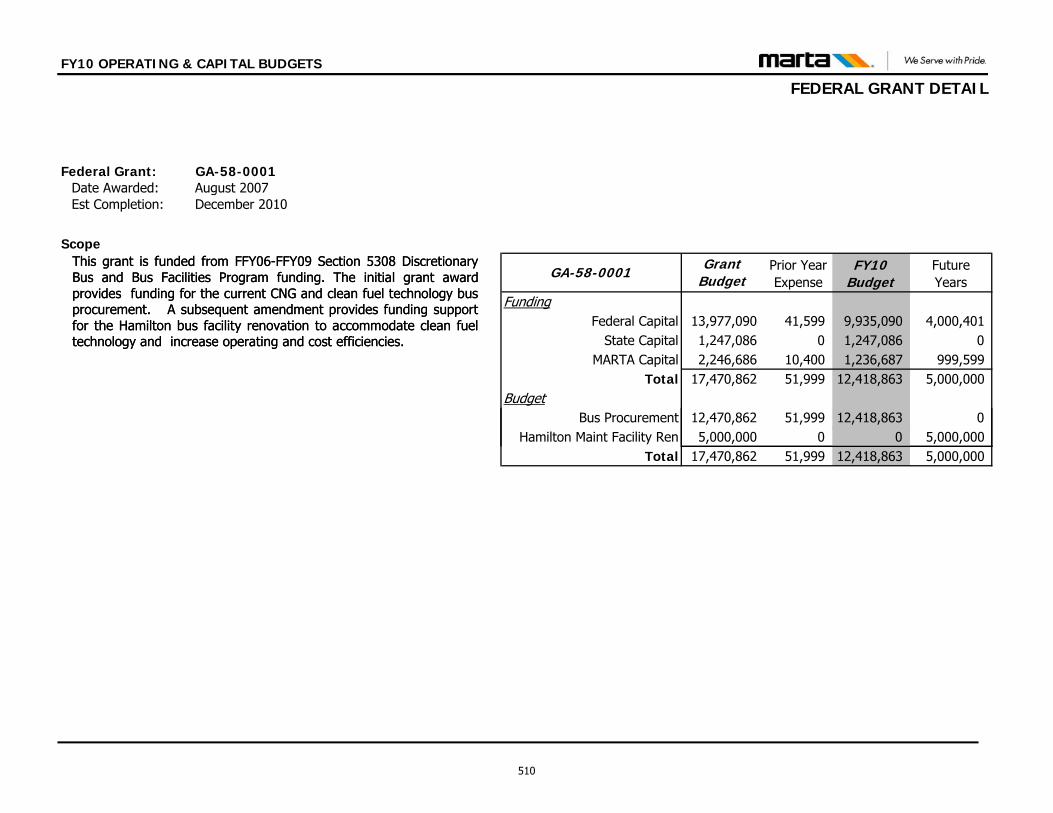
FY10 OPERATING & CAPITAL BUDGETS
FEDERAL GRANT DETAIL
Federal Grant: GA-58-0001Date Awarded: August 2007Est Completion: December 2010
Scope
FundingFederal Capital 13,977,090 41,599 9,935,090 4,000,401
State Capital 1,247,086 0 1,247,086 0MARTA Capital 2,246,686 10,400 1,236,687 999,599
Total 17,470,862 51,999 12,418,863 5,000,000Budget
Bus Procurement 12,470,862 51,999 12,418,863 0
Future Years
GA-58-0001 Grant Budget
Prior Year Expense
FY10 Budget
This grant is funded from FFY06-FFY09 Section 5308 DiscretionaryBus and Bus Facilities Program funding. The initial grant awardprovides funding for the current CNG and clean fuel technology busprocurement. A subsequent amendment provides funding supportfor the Hamilton bus facility renovation to accommodate clean fueltechnology and increase operating and cost efficiencies.
Hamilton Maint Facility Ren 5,000,000 0 0 5,000,000Total 17,470,862 51,999 12,418,863 5,000,000
This grant is funded from FFY06-FFY09 Section 5308 DiscretionaryBus and Bus Facilities Program funding. The initial grant awardprovides funding for the current CNG and clean fuel technology busprocurement. A subsequent amendment provides funding supportfor the Hamilton bus facility renovation to accommodate clean fueltechnology and increase operating and cost efficiencies.
510
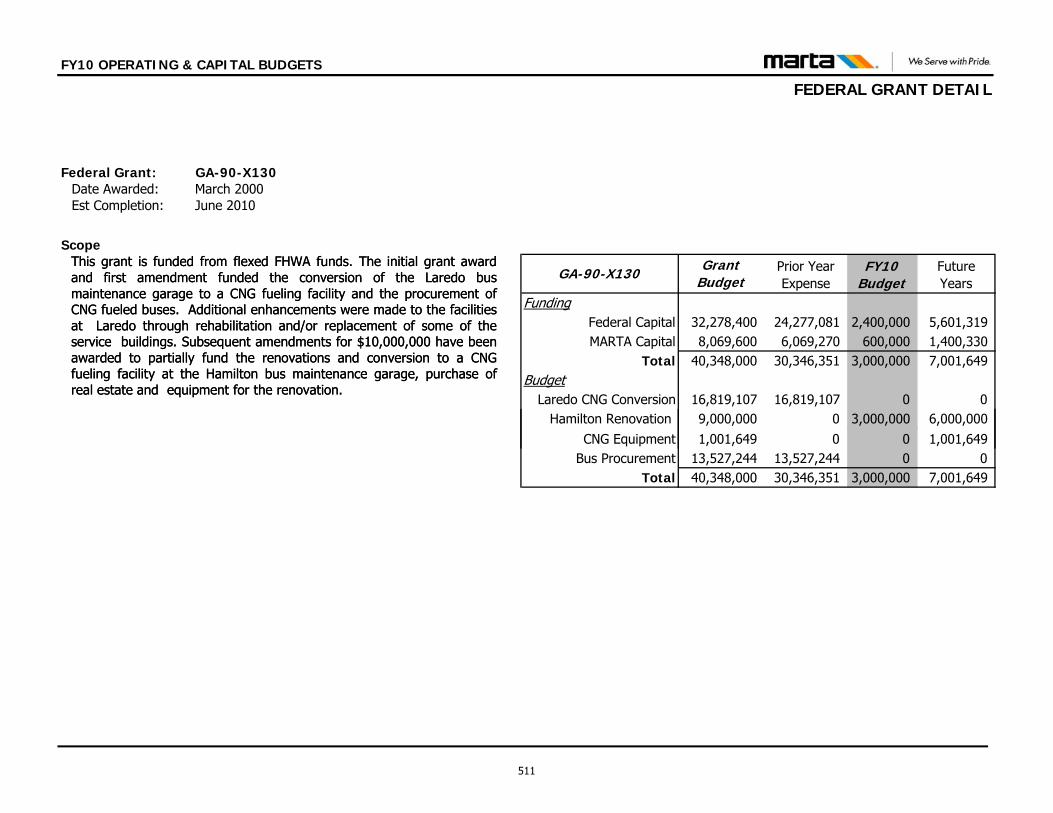
FY10 OPERATING & CAPITAL BUDGETS
FEDERAL GRANT DETAIL
Federal Grant: GA-90-X130Date Awarded: March 2000Est Completion: June 2010
Scope
FundingFederal Capital 32,278,400 24,277,081 2,400,000 5,601,319MARTA Capital 8,069,600 6,069,270 600,000 1,400,330
Total 40,348,000 30,346,351 3,000,000 7,001,649Budget
Laredo CNG Conversion 16,819,107 16,819,107 0 0Hamilton Renovation 9,000,000 0 3,000,000 6,000,000
Future Years
GA-90-X130 Grant Budget
Prior Year Expense
FY10 Budget
This grant is funded from flexed FHWA funds. The initial grant awardand first amendment funded the conversion of the Laredo busmaintenance garage to a CNG fueling facility and the procurement ofCNG fueled buses. Additional enhancements were made to the facilitiesat Laredo through rehabilitation and/or replacement of some of theservice buildings. Subsequent amendments for $10,000,000 have beenawarded to partially fund the renovations and conversion to a CNGfueling facility at the Hamilton bus maintenance garage, purchase ofreal estate and equipment for the renovation.
CNG Equipment 1,001,649 0 0 1,001,649Bus Procurement 13,527,244 13,527,244 0 0
Total 40,348,000 30,346,351 3,000,000 7,001,649
This grant is funded from flexed FHWA funds. The initial grant awardand first amendment funded the conversion of the Laredo busmaintenance garage to a CNG fueling facility and the procurement ofCNG fueled buses. Additional enhancements were made to the facilitiesat Laredo through rehabilitation and/or replacement of some of theservice buildings. Subsequent amendments for $10,000,000 have beenawarded to partially fund the renovations and conversion to a CNGfueling facility at the Hamilton bus maintenance garage, purchase ofreal estate and equipment for the renovation.
511
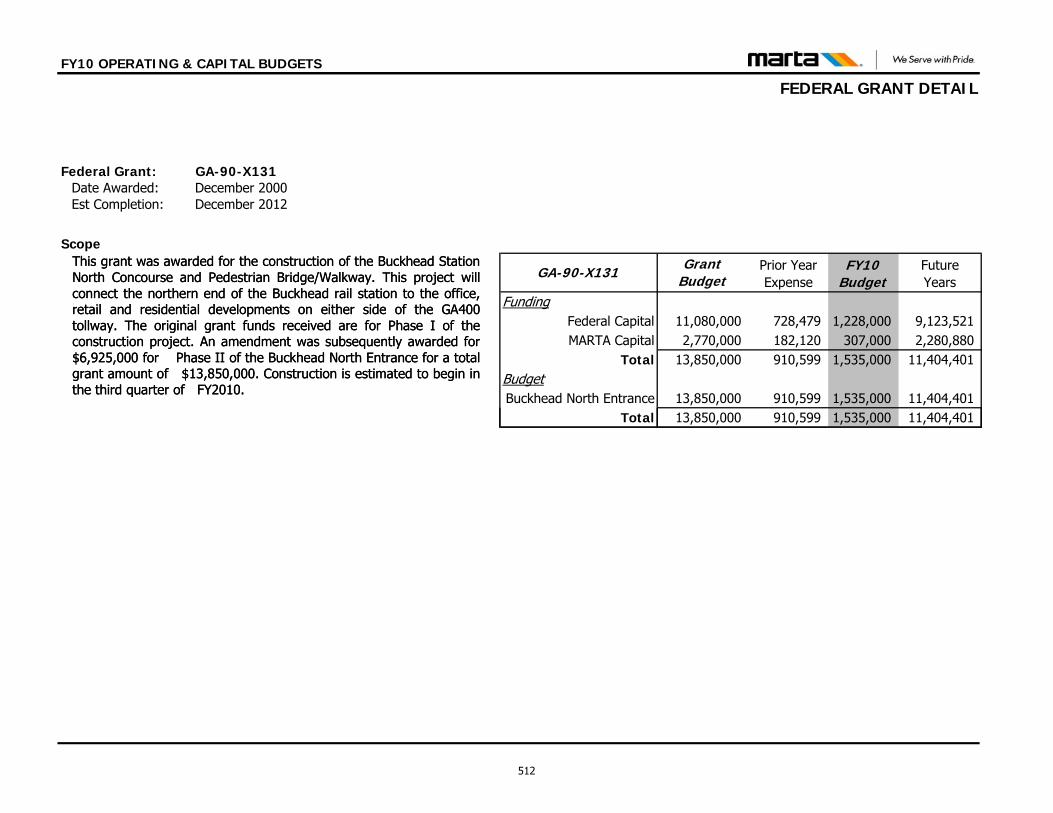
FY10 OPERATING & CAPITAL BUDGETS
FEDERAL GRANT DETAIL
Federal Grant: GA-90-X131Date Awarded: December 2000Est Completion: December 2012
Scope
FundingFederal Capital 11,080,000 728,479 1,228,000 9,123,521MARTA Capital 2,770,000 182,120 307,000 2,280,880
Total 13,850,000 910,599 1,535,000 11,404,401BudgetBuckhead North Entrance 13,850,000 910,599 1,535,000 11,404,401
Total 13,850,000 910,599 1,535,000 11,404,401
Future Years
GA-90-X131 Grant Budget
Prior Year Expense
FY10 Budget
This grant was awarded for the construction of the Buckhead StationNorth Concourse and Pedestrian Bridge/Walkway. This project willconnect the northern end of the Buckhead rail station to the office,retail and residential developments on either side of the GA400tollway. The original grant funds received are for Phase I of theconstruction project. An amendment was subsequently awarded for$6,925,000 for Phase II of the Buckhead North Entrance for a totalgrant amount of $13,850,000. Construction is estimated to begin inthe third quarter of FY2010.
This grant was awarded for the construction of the Buckhead StationNorth Concourse and Pedestrian Bridge/Walkway. This project willconnect the northern end of the Buckhead rail station to the office,retail and residential developments on either side of the GA400tollway. The original grant funds received are for Phase I of theconstruction project. An amendment was subsequently awarded for$6,925,000 for Phase II of the Buckhead North Entrance for a totalgrant amount of $13,850,000. Construction is estimated to begin inthe third quarter of FY2010.
512
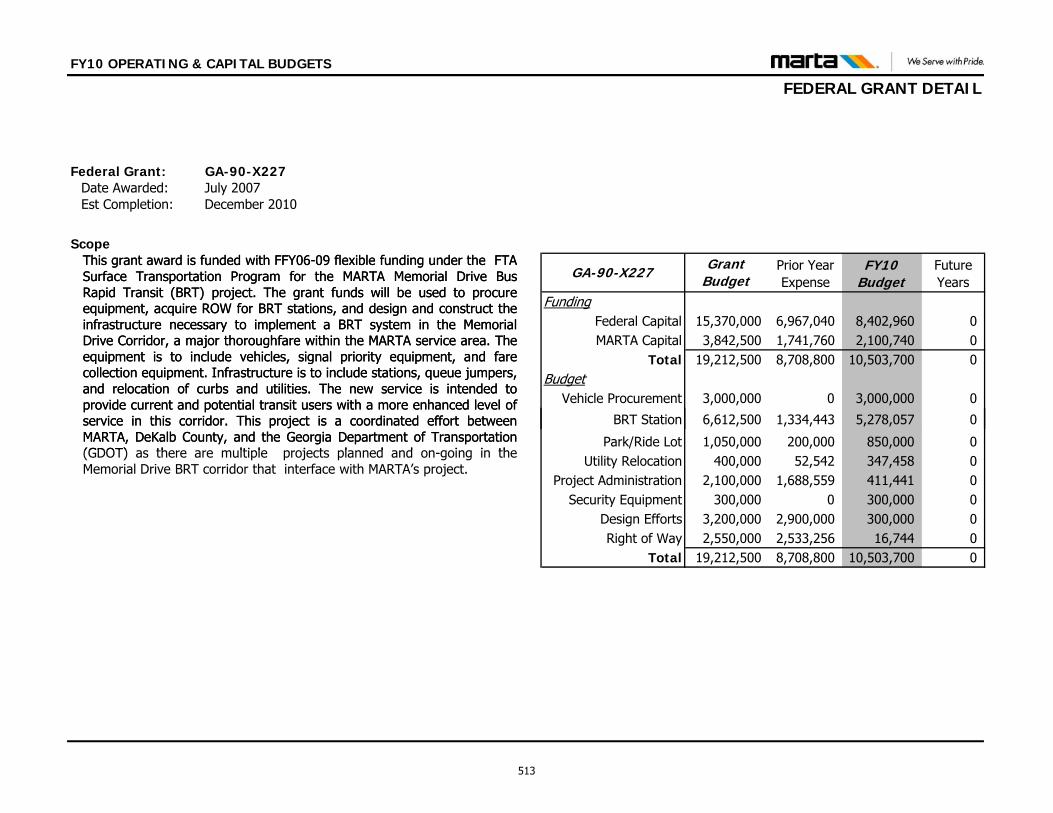
FY10 OPERATING & CAPITAL BUDGETS
FEDERAL GRANT DETAIL
Federal Grant: GA-90-X227Date Awarded: July 2007Est Completion: December 2010
Scope
FundingFederal Capital 15,370,000 6,967,040 8,402,960 0MARTA Capital 3,842,500 1,741,760 2,100,740 0
Total 19,212,500 8,708,800 10,503,700 0Budget
Vehicle Procurement 3,000,000 0 3,000,000 0
BRT Station 6,612,500 1,334,443 5,278,057 0
Future Years
GA-90-X227 Grant Budget
Prior Year Expense
FY10 Budget
This grant award is funded with FFY06-09 flexible funding under the FTASurface Transportation Program for the MARTA Memorial Drive BusRapid Transit (BRT) project. The grant funds will be used to procureequipment, acquire ROW for BRT stations, and design and construct theinfrastructure necessary to implement a BRT system in the MemorialDrive Corridor, a major thoroughfare within the MARTA service area. Theequipment is to include vehicles, signal priority equipment, and farecollection equipment. Infrastructure is to include stations, queue jumpers,and relocation of curbs and utilities. The new service is intended toprovide current and potential transit users with a more enhanced level ofservice in this corridor. This project is a coordinated effort betweenMARTA, DeKalb County, and the Georgia Department of Transportation(GDOT) as there are multiple projects planned and on going in the
Park/Ride Lot 1,050,000 200,000 850,000 0Utility Relocation 400,000 52,542 347,458 0
Project Administration 2,100,000 1,688,559 411,441 0Security Equipment 300,000 0 300,000 0
Design Efforts 3,200,000 2,900,000 300,000 0Right of Way 2,550,000 2,533,256 16,744 0
Total 19,212,500 8,708,800 10,503,700 0
This grant award is funded with FFY06-09 flexible funding under the FTASurface Transportation Program for the MARTA Memorial Drive BusRapid Transit (BRT) project. The grant funds will be used to procureequipment, acquire ROW for BRT stations, and design and construct theinfrastructure necessary to implement a BRT system in the MemorialDrive Corridor, a major thoroughfare within the MARTA service area. Theequipment is to include vehicles, signal priority equipment, and farecollection equipment. Infrastructure is to include stations, queue jumpers,and relocation of curbs and utilities. The new service is intended toprovide current and potential transit users with a more enhanced level ofservice in this corridor. This project is a coordinated effort betweenMARTA, DeKalb County, and the Georgia Department of Transportation(GDOT) as there are multiple projects planned and on-going in theMemorial Drive BRT corridor that interface with MARTA’s project.
513
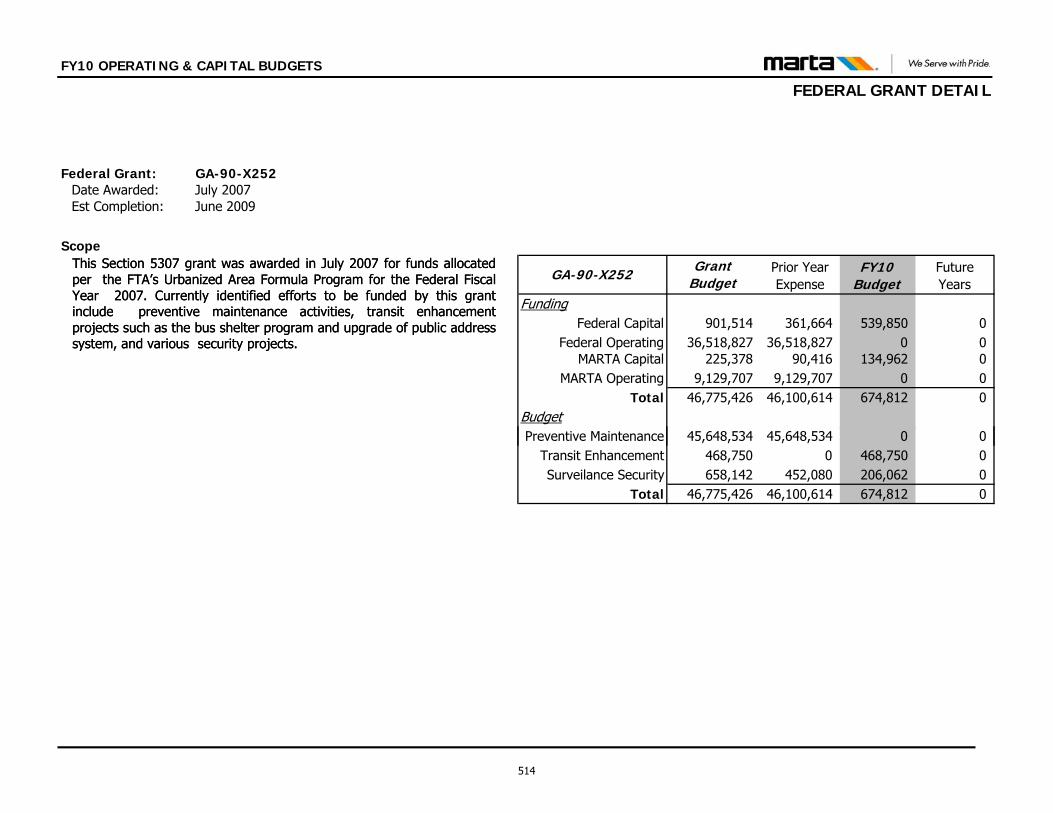
FY10 OPERATING & CAPITAL BUDGETS
FEDERAL GRANT DETAIL
Federal Grant: GA-90-X252Date Awarded: July 2007Est Completion: June 2009
Scope
FundingFederal Capital 901,514 361,664 539,850 0
Federal Operating 36,518,827 36,518,827 0 0MARTA Capital 225,378 90,416 134,962 0
MARTA Operating 9,129,707 9,129,707 0 0Total 46,775,426 46,100,614 674,812 0
Budget
Future Years
GA-90-X252 Grant Budget
Prior Year Expense
FY10 Budget
This Section 5307 grant was awarded in July 2007 for funds allocatedper the FTA’s Urbanized Area Formula Program for the Federal FiscalYear 2007. Currently identified efforts to be funded by this grantinclude preventive maintenance activities, transit enhancementprojects such as the bus shelter program and upgrade of public addresssystem, and various security projects.
Preventive Maintenance 45,648,534 45,648,534 0 0Transit Enhancement 468,750 0 468,750 0Surveilance Security 658,142 452,080 206,062 0
Total 46,775,426 46,100,614 674,812 0
This Section 5307 grant was awarded in July 2007 for funds allocatedper the FTA’s Urbanized Area Formula Program for the Federal FiscalYear 2007. Currently identified efforts to be funded by this grantinclude preventive maintenance activities, transit enhancementprojects such as the bus shelter program and upgrade of public addresssystem, and various security projects.
514
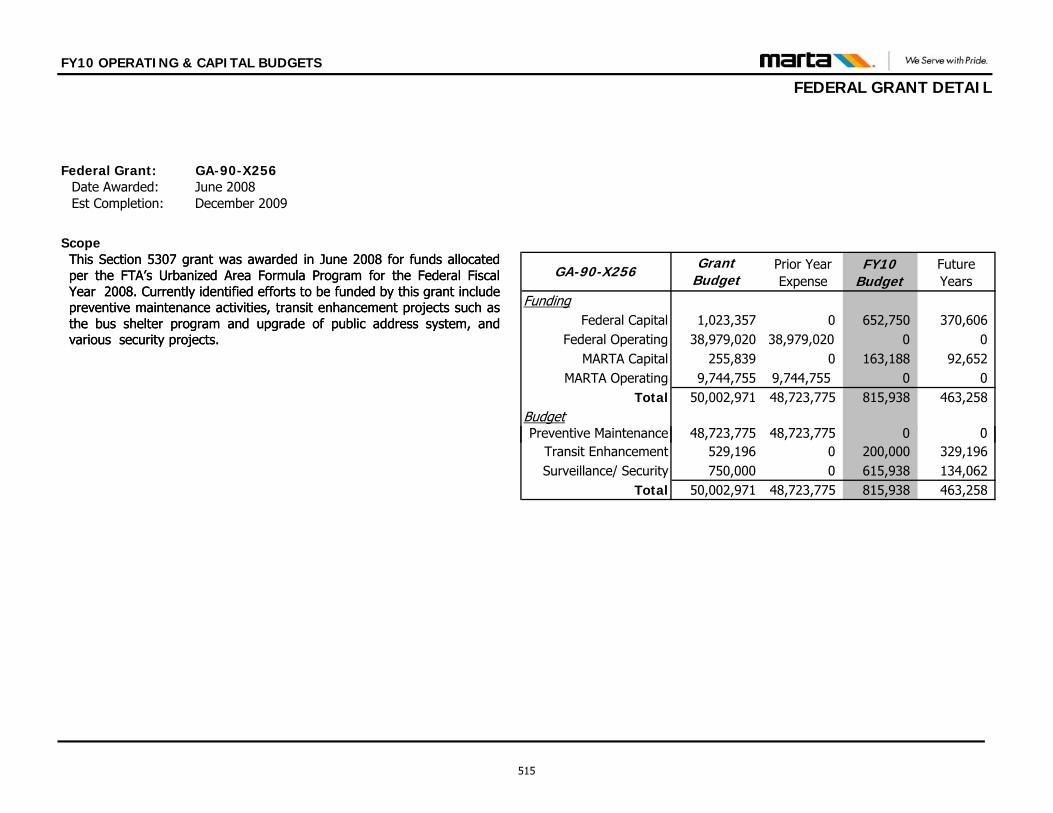
FY10 OPERATING & CAPITAL BUDGETS
FEDERAL GRANT DETAIL
Federal Grant: GA-90-X256Date Awarded: June 2008Est Completion: December 2009
Scope
FundingFederal Capital 1,023,357 0 652,750 370,606
Federal Operating 38,979,020 38,979,020 0 0MARTA Capital 255,839 0 163,188 92,652
MARTA Operating 9,744,755 9,744,755 0 0Total 50,002,971 48,723,775 815,938 463,258
BudgetP ti M i t 48 723 775 48 723 775 0 0
Future Years
GA-90-X256 Grant Budget
Prior Year Expense
FY10 Budget
This Section 5307 grant was awarded in June 2008 for funds allocatedper the FTA’s Urbanized Area Formula Program for the Federal FiscalYear 2008. Currently identified efforts to be funded by this grant includepreventive maintenance activities, transit enhancement projects such asthe bus shelter program and upgrade of public address system, andvarious security projects.
Preventive Maintenance 48,723,775 48,723,775 0 0Transit Enhancement 529,196 0 200,000 329,196Surveillance/ Security 750,000 0 615,938 134,062
Total 50,002,971 48,723,775 815,938 463,258
This Section 5307 grant was awarded in June 2008 for funds allocatedper the FTA’s Urbanized Area Formula Program for the Federal FiscalYear 2008. Currently identified efforts to be funded by this grant includepreventive maintenance activities, transit enhancement projects such asthe bus shelter program and upgrade of public address system, andvarious security projects.
515
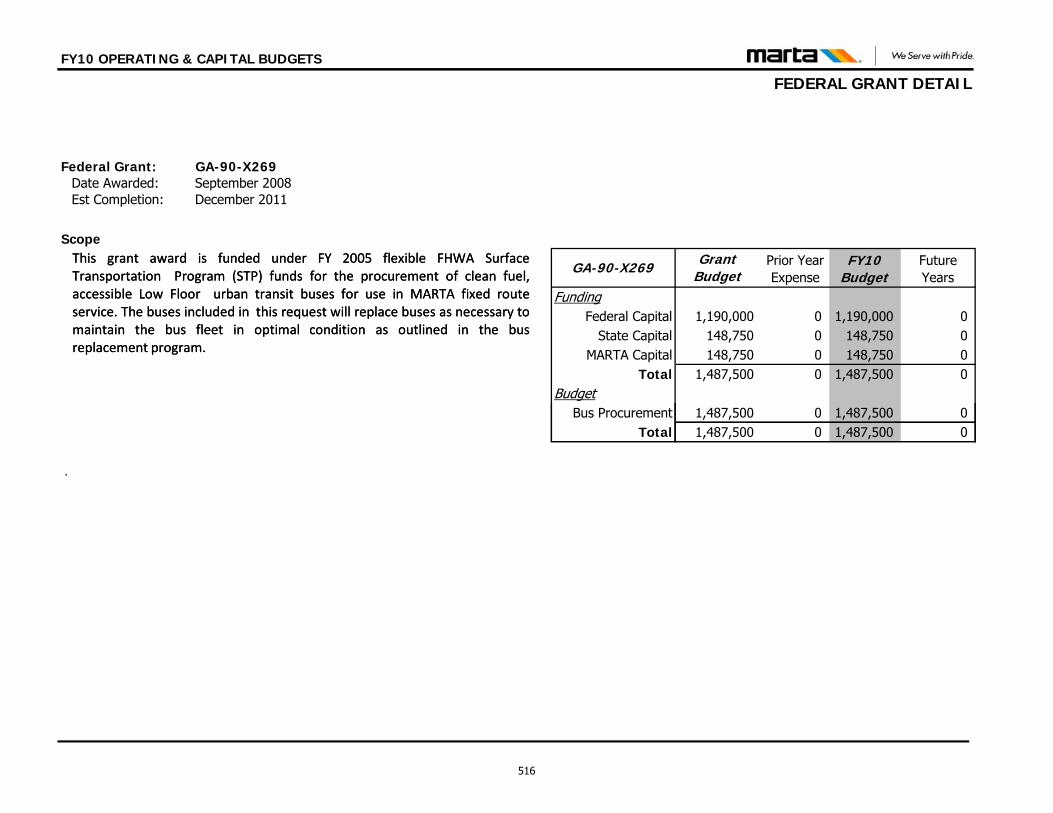
FY10 OPERATING & CAPITAL BUDGETS
FEDERAL GRANT DETAIL
Federal Grant: GA-90-X269Date Awarded: September 2008Est Completion: December 2011
Scope
FundingFederal Capital 1,190,000 0 1,190,000 0
State Capital 148,750 0 148,750 0MARTA Capital 148,750 0 148,750 0
Total 1,487,500 0 1,487,500 0Budget
Bus Procurement 1,487,500 0 1,487,500 0
Future Years
GA-90-X269 Grant Budget
Prior Year Expense
FY10 Budget
This grant award is funded under FY 2005 flexible FHWA SurfaceTransportation Program (STP) funds for the procurement of clean fuel,accessible Low Floor urban transit buses for use in MARTA fixed routeservice. The buses included in this request will replace buses as necessary tomaintain the bus fleet in optimal condition as outlined in the busreplacement program.
Total 1,487,500 0 1,487,500 0
.
This grant award is funded under FY 2005 flexible FHWA SurfaceTransportation Program (STP) funds for the procurement of clean fuel,accessible Low Floor urban transit buses for use in MARTA fixed routeservice. The buses included in this request will replace buses as necessary tomaintain the bus fleet in optimal condition as outlined in the busreplacement program.
516
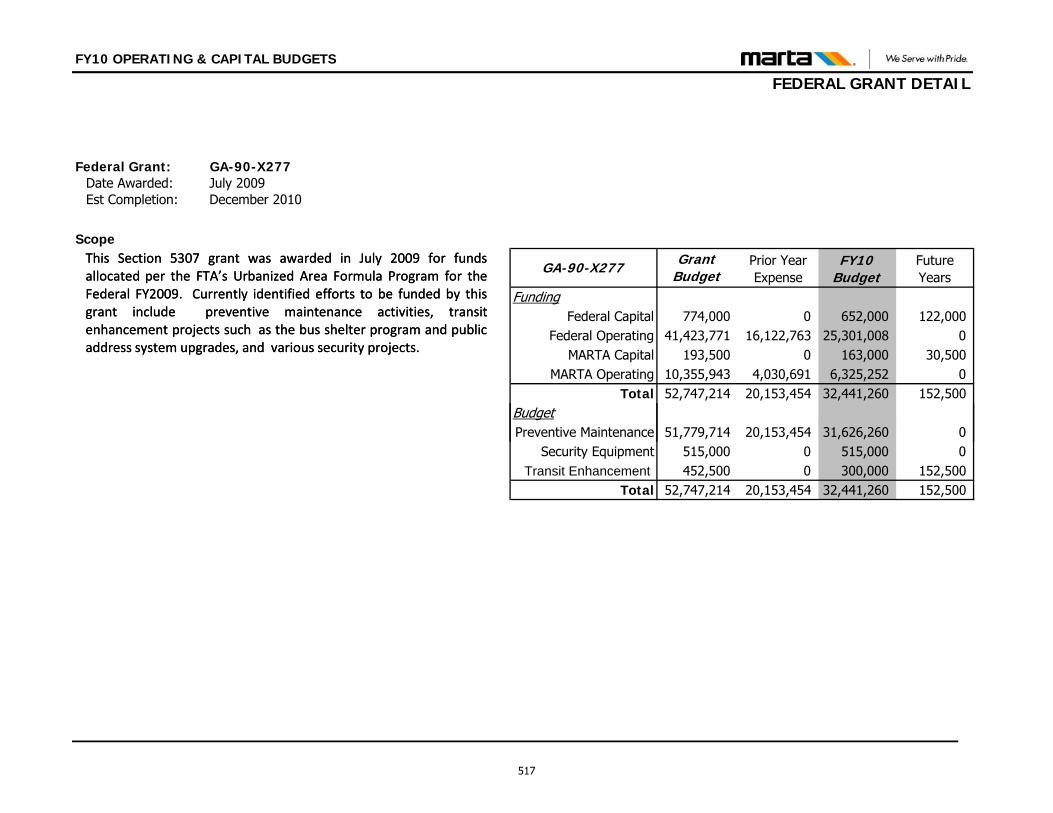
FY10 OPERATING & CAPITAL BUDGETS
FEDERAL GRANT DETAIL
Federal Grant: GA-90-X277Date Awarded: July 2009Est Completion: December 2010
Scope
FundingFederal Capital 774,000 0 652,000 122,000
Federal Operating 41,423,771 16,122,763 25,301,008 0MARTA Capital 193,500 0 163,000 30,500
MARTA Operating 10,355,943 4,030,691 6,325,252 0Total 52,747,214 20,153,454 32,441,260 152,500
Budget
Future Years
GA-90-X277 Grant Budget
Prior Year Expense
FY10 Budget
This Section 5307 grant was awarded in July 2009 for fundsallocated per the FTA’s Urbanized Area Formula Program for theFederal FY2009. Currently identified efforts to be funded by thisgrant include preventive maintenance activities, transitenhancement projects such as the bus shelter program and publicaddress system upgrades, and various security projects.
Preventive Maintenance 51,779,714 20,153,454 31,626,260 0Security Equipment 515,000 0 515,000 0
Transit Enhancement 452,500 0 300,000 152,500Total 52,747,214 20,153,454 32,441,260 152,500
This Section 5307 grant was awarded in July 2009 for fundsallocated per the FTA’s Urbanized Area Formula Program for theFederal FY2009. Currently identified efforts to be funded by thisgrant include preventive maintenance activities, transitenhancement projects such as the bus shelter program and publicaddress system upgrades, and various security projects.
517
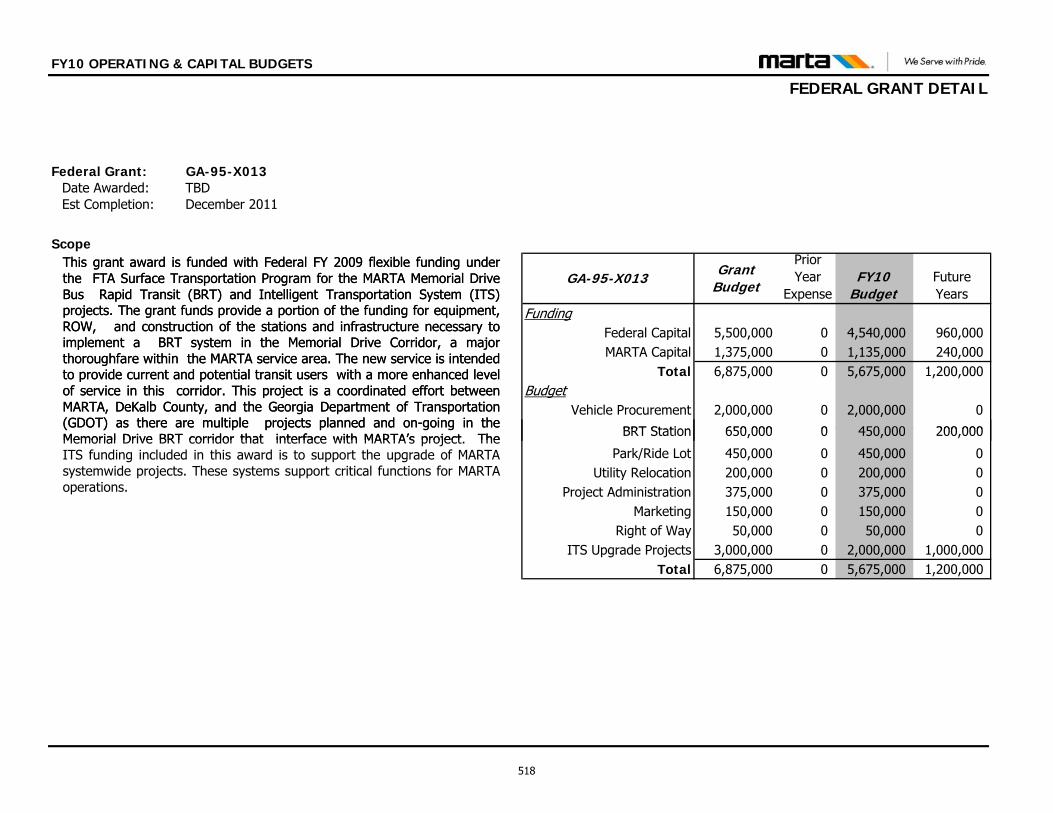
FY10 OPERATING & CAPITAL BUDGETS
FEDERAL GRANT DETAIL
Federal Grant: GA-95-X013Date Awarded: TBDEst Completion: December 2011
Scope
FundingFederal Capital 5,500,000 0 4,540,000 960,000MARTA Capital 1,375,000 0 1,135,000 240,000
Total 6,875,000 0 5,675,000 1,200,000Budget
Vehicle Procurement 2,000,000 0 2,000,000 0
BRT Station 650 000 0 450 000 200 000
Future Years
GA-95-X013 Grant Budget
Prior Year
ExpenseFY10
Budget
This grant award is funded with Federal FY 2009 flexible funding underthe FTA Surface Transportation Program for the MARTA Memorial DriveBus Rapid Transit (BRT) and Intelligent Transportation System (ITS)projects. The grant funds provide a portion of the funding for equipment,ROW, and construction of the stations and infrastructure necessary toimplement a BRT system in the Memorial Drive Corridor, a majorthoroughfare within the MARTA service area. The new service is intendedto provide current and potential transit users with a more enhanced levelof service in this corridor. This project is a coordinated effort betweenMARTA, DeKalb County, and the Georgia Department of Transportation(GDOT) as there are multiple projects planned and on-going in theMemorial Drive BRT corridor that interface with MARTA’s project The BRT Station 650,000 0 450,000 200,000
Park/Ride Lot 450,000 0 450,000 0Utility Relocation 200,000 0 200,000 0
Project Administration 375,000 0 375,000 0Marketing 150,000 0 150,000 0
Right of Way 50,000 0 50,000 0ITS Upgrade Projects 3,000,000 0 2,000,000 1,000,000
Total 6,875,000 0 5,675,000 1,200,000
This grant award is funded with Federal FY 2009 flexible funding underthe FTA Surface Transportation Program for the MARTA Memorial DriveBus Rapid Transit (BRT) and Intelligent Transportation System (ITS)projects. The grant funds provide a portion of the funding for equipment,ROW, and construction of the stations and infrastructure necessary toimplement a BRT system in the Memorial Drive Corridor, a majorthoroughfare within the MARTA service area. The new service is intendedto provide current and potential transit users with a more enhanced levelof service in this corridor. This project is a coordinated effort betweenMARTA, DeKalb County, and the Georgia Department of Transportation(GDOT) as there are multiple projects planned and on-going in theMemorial Drive BRT corridor that interface with MARTA’s project. TheITS funding included in this award is to support the upgrade of MARTAsystemwide projects. These systems support critical functions for MARTAoperations.
518
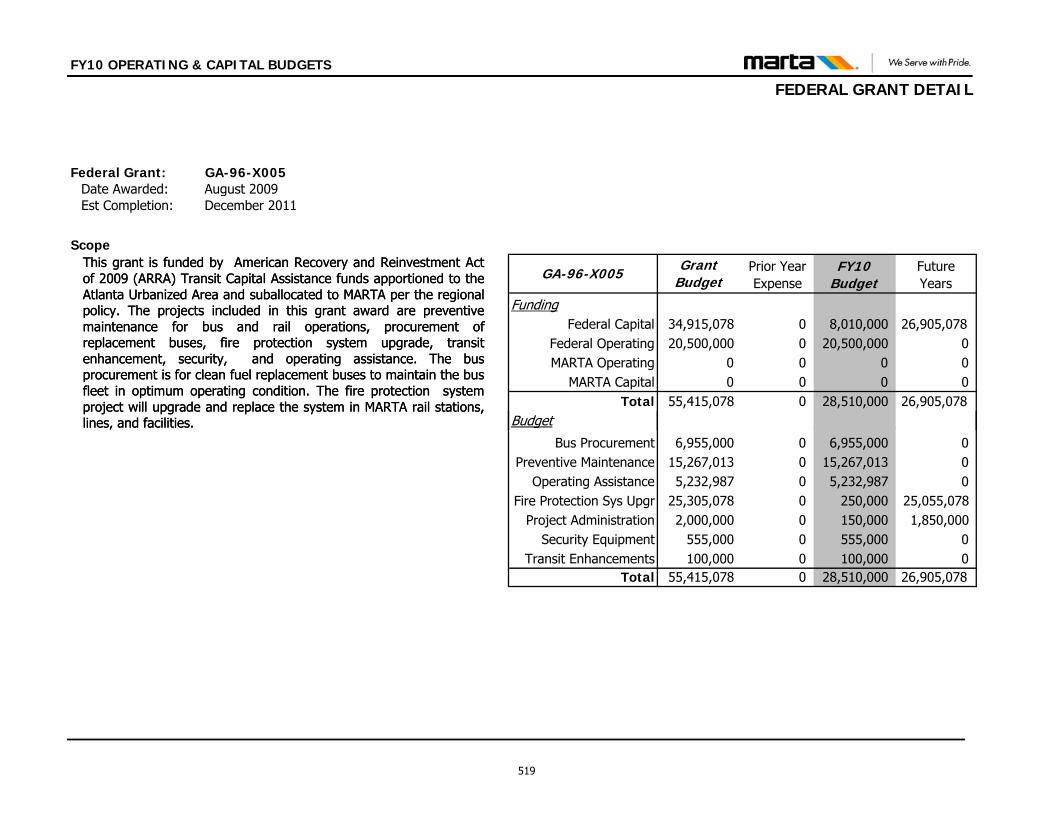
FY10 OPERATING & CAPITAL BUDGETS
FEDERAL GRANT DETAIL
Federal Grant: GA-96-X005Date Awarded: August 2009Est Completion: December 2011
Scope
FundingFederal Capital 34,915,078 0 8,010,000 26,905,078
Federal Operating 20,500,000 0 20,500,000 0MARTA Operating 0 0 0 0
MARTA Capital 0 0 0 0Total 55,415,078 0 28,510,000 26,905,078
Budget
Future Years
GA-96-X005 Grant Budget
Prior Year Expense
FY10 Budget
This grant is funded by American Recovery and Reinvestment Actof 2009 (ARRA) Transit Capital Assistance funds apportioned to theAtlanta Urbanized Area and suballocated to MARTA per the regionalpolicy. The projects included in this grant award are preventivemaintenance for bus and rail operations, procurement ofreplacement buses, fire protection system upgrade, transitenhancement, security, and operating assistance. The busprocurement is for clean fuel replacement buses to maintain the busfleet in optimum operating condition. The fire protection systemproject will upgrade and replace the system in MARTA rail stations,lines, and facilities. g
Bus Procurement 6,955,000 0 6,955,000 0Preventive Maintenance 15,267,013 0 15,267,013 0
Operating Assistance 5,232,987 0 5,232,987 0Fire Protection Sys Upgr 25,305,078 0 250,000 25,055,078
Project Administration 2,000,000 0 150,000 1,850,000Security Equipment 555,000 0 555,000 0
Transit Enhancements 100,000 0 100,000 0Total 55,415,078 0 28,510,000 26,905,078
This grant is funded by American Recovery and Reinvestment Actof 2009 (ARRA) Transit Capital Assistance funds apportioned to theAtlanta Urbanized Area and suballocated to MARTA per the regionalpolicy. The projects included in this grant award are preventivemaintenance for bus and rail operations, procurement ofreplacement buses, fire protection system upgrade, transitenhancement, security, and operating assistance. The busprocurement is for clean fuel replacement buses to maintain the busfleet in optimum operating condition. The fire protection systemproject will upgrade and replace the system in MARTA rail stations,lines, and facilities.
519
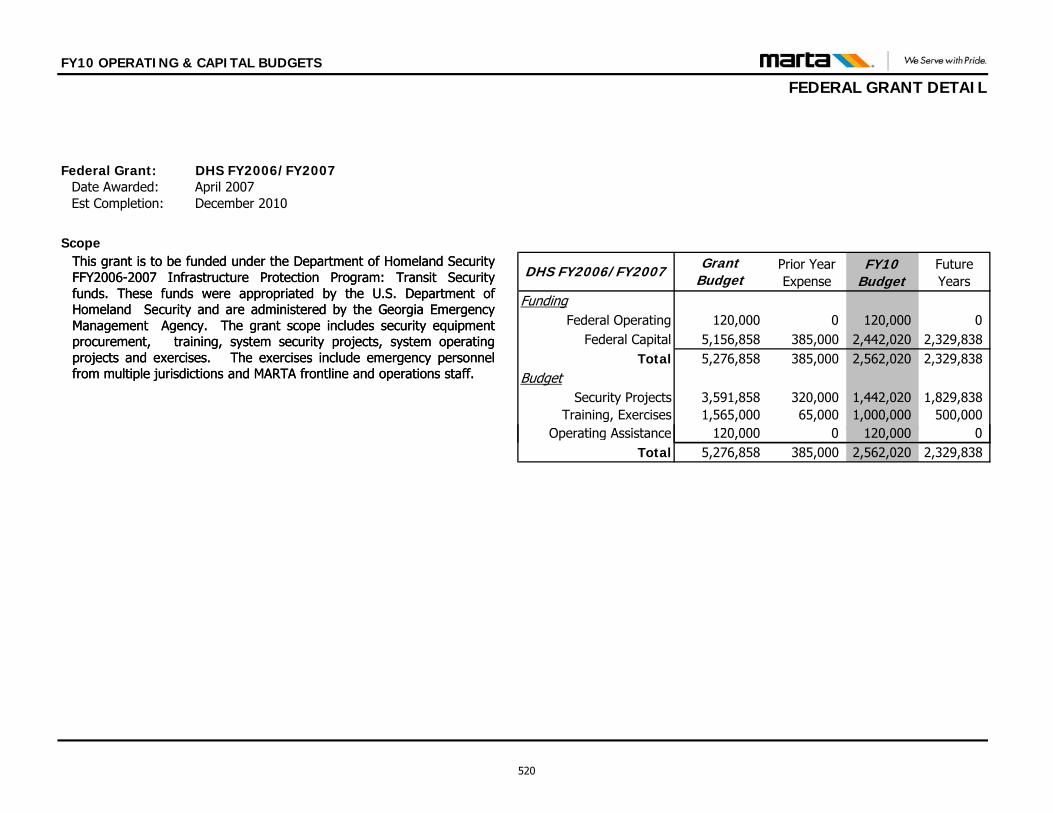
FY10 OPERATING & CAPITAL BUDGETS
FEDERAL GRANT DETAIL
Federal Grant: DHS FY2006/FY2007Date Awarded: April 2007Est Completion: December 2010
Scope
FundingFederal Operating 120,000 0 120,000 0
Federal Capital 5,156,858 385,000 2,442,020 2,329,838Total 5,276,858 385,000 2,562,020 2,329,838
BudgetSecurity Projects 3,591,858 320,000 1,442,020 1,829,838
Training, Exercises 1,565,000 65,000 1,000,000 500,000O ti A i t 120 000 0 120 000 0
Future Years
DHS FY2006/FY2007 Grant Budget
Prior Year Expense
FY10 Budget
This grant is to be funded under the Department of Homeland SecurityFFY2006-2007 Infrastructure Protection Program: Transit Securityfunds. These funds were appropriated by the U.S. Department ofHomeland Security and are administered by the Georgia EmergencyManagement Agency. The grant scope includes security equipmentprocurement, training, system security projects, system operatingprojects and exercises. The exercises include emergency personnelfrom multiple jurisdictions and MARTA frontline and operations staff.
Operating Assistance 120,000 0 120,000 0Total 5,276,858 385,000 2,562,020 2,329,838
This grant is to be funded under the Department of Homeland SecurityFFY2006-2007 Infrastructure Protection Program: Transit Securityfunds. These funds were appropriated by the U.S. Department ofHomeland Security and are administered by the Georgia EmergencyManagement Agency. The grant scope includes security equipmentprocurement, training, system security projects, system operatingprojects and exercises. The exercises include emergency personnelfrom multiple jurisdictions and MARTA frontline and operations staff.
520
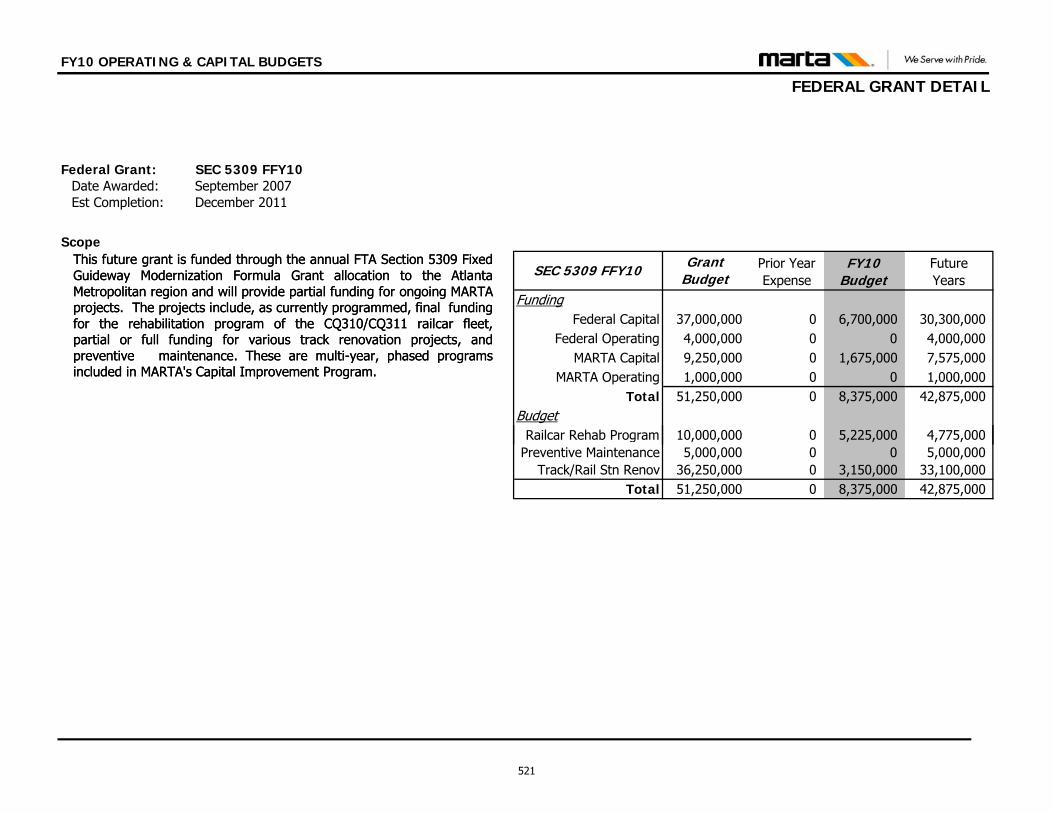
FY10 OPERATING & CAPITAL BUDGETS
FEDERAL GRANT DETAIL
Federal Grant: SEC 5309 FFY10Date Awarded: September 2007Est Completion: December 2011
Scope
FundingFederal Capital 37,000,000 0 6,700,000 30,300,000
Federal Operating 4,000,000 0 0 4,000,000MARTA Capital 9,250,000 0 1,675,000 7,575,000
MARTA Operating 1,000,000 0 0 1,000,000Total 51,250,000 0 8,375,000 42,875,000
Budget
Future Years
SEC 5309 FFY10 Grant Budget
Prior Year Expense
FY10 Budget
This future grant is funded through the annual FTA Section 5309 FixedGuideway Modernization Formula Grant allocation to the AtlantaMetropolitan region and will provide partial funding for ongoing MARTAprojects. The projects include, as currently programmed, final fundingfor the rehabilitation program of the CQ310/CQ311 railcar fleet,partial or full funding for various track renovation projects, andpreventive maintenance. These are multi-year, phased programsincluded in MARTA's Capital Improvement Program.
Railcar Rehab Program 10,000,000 0 5,225,000 4,775,000Preventive Maintenance 5,000,000 0 0 5,000,000
Track/Rail Stn Renov 36,250,000 0 3,150,000 33,100,000Total 51,250,000 0 8,375,000 42,875,000
This future grant is funded through the annual FTA Section 5309 FixedGuideway Modernization Formula Grant allocation to the AtlantaMetropolitan region and will provide partial funding for ongoing MARTAprojects. The projects include, as currently programmed, final fundingfor the rehabilitation program of the CQ310/CQ311 railcar fleet,partial or full funding for various track renovation projects, andpreventive maintenance. These are multi-year, phased programsincluded in MARTA's Capital Improvement Program.
521

This page intentionally left blank
522
APPENDIX This section consists of compensation and benefits information, miscellaneous operations data, awards, and terminology. It includes: Salary Structures for all Employees
Fare History
Fare Structure
Financial Performance Measures
Category and Subcategory Expense Listing
FY10 Benefits Calculation
MARTA Facts
Glossary of Terms
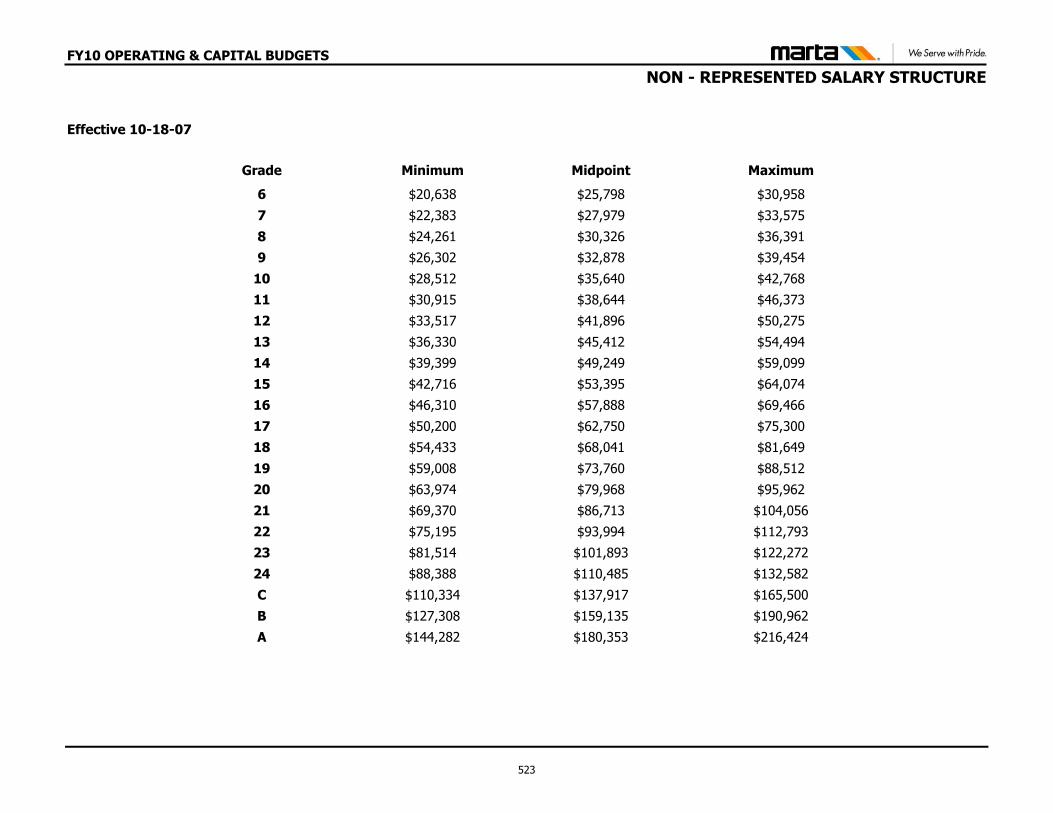
FY10 OPERATING & CAPITAL BUDGETS
NON - REPRESENTED SALARY STRUCTURE
Effective 10-18-07
Grade Minimum Midpoint Maximum
6 $20,638 $25,798 $30,958
7 $22,383 $27,979 $33,575
8 $24,261 $30,326 $36,391
9 $26,302 $32,878 $39,454
10 $28,512 $35,640 $42,768
11 $30,915 $38,644 $46,373
12 $33,517 $41,896 $50,275
13 $36,330 $45,412 $54,494
14 $39,399 $49,249 $59,099
15 $42,716 $53,395 $64,074
16 $46,310 $57,888 $69,466
17 $50,200 $62,750 $75,300
18 $54,433 $68,041 $81,649
19 $59,008 $73,760 $88,512
20 $63,974 $79,968 $95,962
21 $69,370 $86,713 $104,056
22 $75,195 $93,994 $112,793
23 $81,514 $101,893 $122,272
24 $88,388 $110,485 $132,582
C $110,334 $137,917 $165,500
B $127,308 $159,135 $190,962
A $144,282 $180,353 $216,424
523
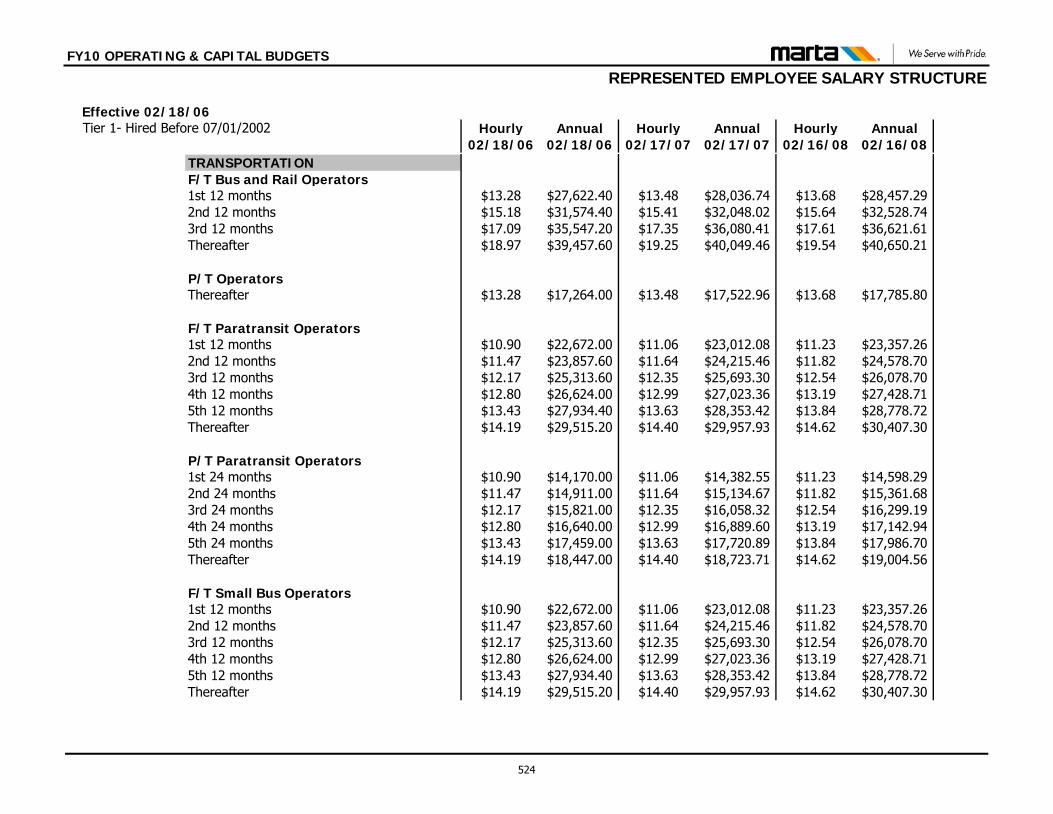
FY10 OPERATING & CAPITAL BUDGETS
REPRESENTED EMPLOYEE SALARY STRUCTURE
Effective 02/18/06 Tier 1- Hired Before 07/01/2002 Hourly Annual Hourly Annual Hourly Annual
02/18/06 02/18/06 02/17/07 02/17/07 02/16/08 02/16/08 TRANSPORTATIONF/T Bus and Rail Operators1st 12 months $13.28 $27,622.40 $13.48 $28,036.74 $13.68 $28,457.292nd 12 months $15.18 $31,574.40 $15.41 $32,048.02 $15.64 $32,528.743rd 12 months $17.09 $35,547.20 $17.35 $36,080.41 $17.61 $36,621.61Thereafter $18.97 $39,457.60 $19.25 $40,049.46 $19.54 $40,650.21
P/T OperatorsThereafter $13.28 $17,264.00 $13.48 $17,522.96 $13.68 $17,785.80
F/T Paratransit Operators1st 12 months $10.90 $22,672.00 $11.06 $23,012.08 $11.23 $23,357.262nd 12 months $11.47 $23,857.60 $11.64 $24,215.46 $11.82 $24,578.703rd 12 months $12.17 $25,313.60 $12.35 $25,693.30 $12.54 $26,078.704th 12 months $12.80 $26,624.00 $12.99 $27,023.36 $13.19 $27,428.715th 12 months $13.43 $27,934.40 $13.63 $28,353.42 $13.84 $28,778.72Thereafter $14.19 $29,515.20 $14.40 $29,957.93 $14.62 $30,407.30
P/T Paratransit Operators1st 24 months $10.90 $14,170.00 $11.06 $14,382.55 $11.23 $14,598.292nd 24 months $11.47 $14,911.00 $11.64 $15,134.67 $11.82 $15,361.683rd 24 months $12.17 $15,821.00 $12.35 $16,058.32 $12.54 $16,299.194th 24 months $12.80 $16,640.00 $12.99 $16,889.60 $13.19 $17,142.945th 24 months $13.43 $17,459.00 $13.63 $17,720.89 $13.84 $17,986.70Thereafter $14.19 $18,447.00 $14.40 $18,723.71 $14.62 $19,004.56
F/T Small Bus Operators1st 12 months $10.90 $22,672.00 $11.06 $23,012.08 $11.23 $23,357.262nd 12 months $11.47 $23,857.60 $11.64 $24,215.46 $11.82 $24,578.703rd 12 months $12.17 $25,313.60 $12.35 $25,693.30 $12.54 $26,078.704th 12 months $12.80 $26,624.00 $12.99 $27,023.36 $13.19 $27,428.715th 12 months $13.43 $27,934.40 $13.63 $28,353.42 $13.84 $28,778.72Thereafter $14.19 $29,515.20 $14.40 $29,957.93 $14.62 $30,407.30
524
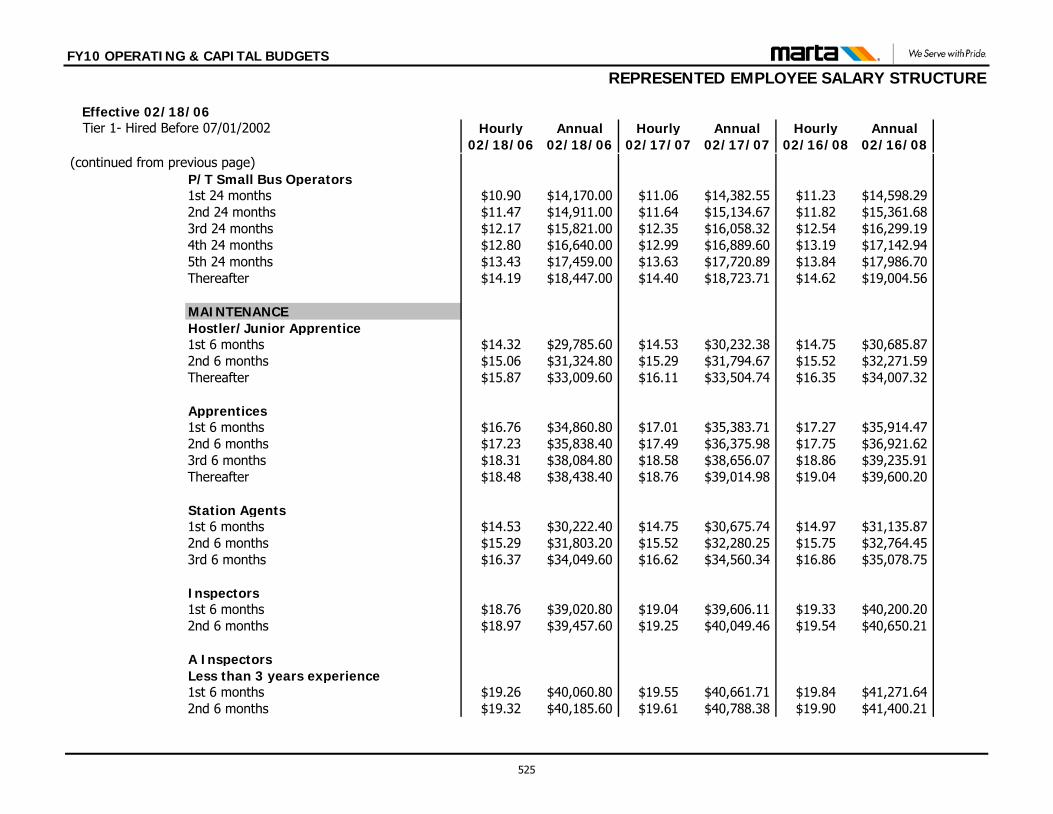
FY10 OPERATING & CAPITAL BUDGETS
REPRESENTED EMPLOYEE SALARY STRUCTURE
Effective 02/18/06 Tier 1- Hired Before 07/01/2002 Hourly Annual Hourly Annual Hourly Annual
02/18/06 02/18/06 02/17/07 02/17/07 02/16/08 02/16/08 (continued from previous page)
P/T Small Bus Operators1st 24 months $10.90 $14,170.00 $11.06 $14,382.55 $11.23 $14,598.292nd 24 months $11.47 $14,911.00 $11.64 $15,134.67 $11.82 $15,361.683rd 24 months $12.17 $15,821.00 $12.35 $16,058.32 $12.54 $16,299.194th 24 months $12.80 $16,640.00 $12.99 $16,889.60 $13.19 $17,142.945th 24 months $13.43 $17,459.00 $13.63 $17,720.89 $13.84 $17,986.70Thereafter $14.19 $18,447.00 $14.40 $18,723.71 $14.62 $19,004.56
MAINTENANCEHostler/Junior Apprentice1st 6 months $14.32 $29,785.60 $14.53 $30,232.38 $14.75 $30,685.872nd 6 months $15.06 $31,324.80 $15.29 $31,794.67 $15.52 $32,271.59Thereafter $15.87 $33,009.60 $16.11 $33,504.74 $16.35 $34,007.32
Apprentices1st 6 months $16.76 $34,860.80 $17.01 $35,383.71 $17.27 $35,914.472nd 6 months $17.23 $35,838.40 $17.49 $36,375.98 $17.75 $36,921.623rd 6 months $18.31 $38,084.80 $18.58 $38,656.07 $18.86 $39,235.91Thereafter $18.48 $38,438.40 $18.76 $39,014.98 $19.04 $39,600.20
Station Agents1st 6 months $14.53 $30,222.40 $14.75 $30,675.74 $14.97 $31,135.872nd 6 months $15.29 $31,803.20 $15.52 $32,280.25 $15.75 $32,764.453rd 6 months $16.37 $34,049.60 $16.62 $34,560.34 $16.86 $35,078.75
Inspectors1st 6 months $18.76 $39,020.80 $19.04 $39,606.11 $19.33 $40,200.202nd 6 months $18.97 $39,457.60 $19.25 $40,049.46 $19.54 $40,650.21
A InspectorsLess than 3 years experience1st 6 months $19.26 $40,060.80 $19.55 $40,661.71 $19.84 $41,271.642nd 6 months $19.32 $40,185.60 $19.61 $40,788.38 $19.90 $41,400.21
525
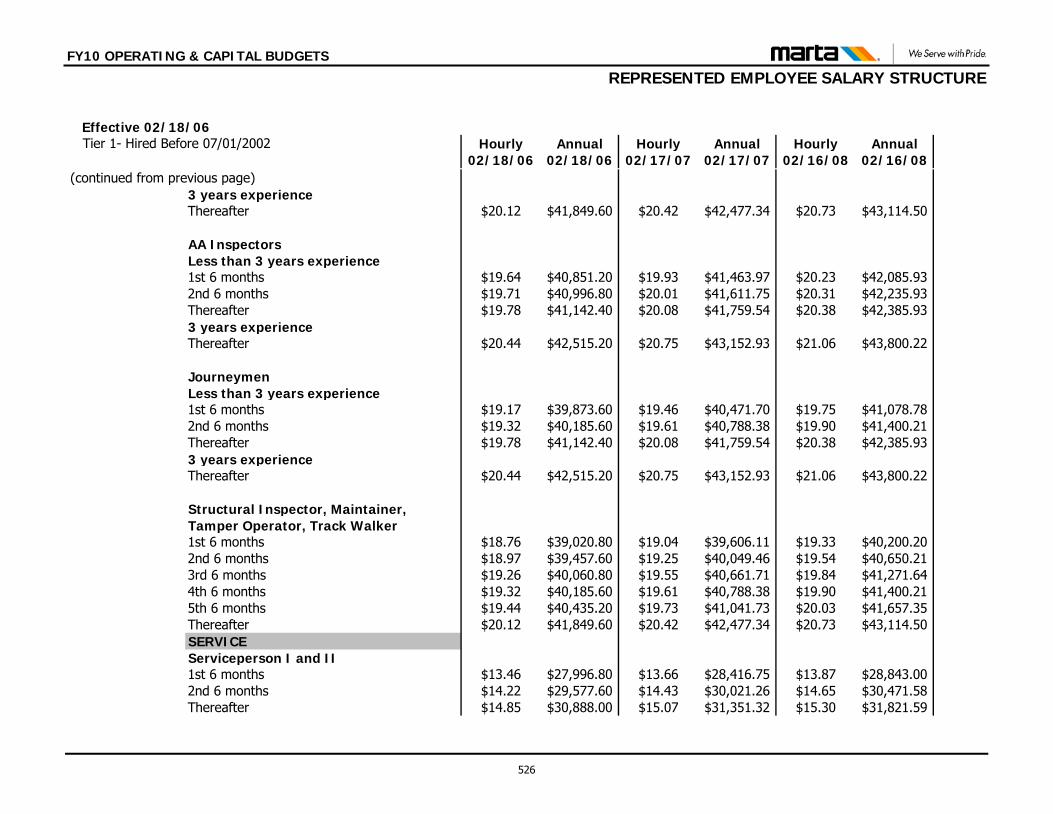
FY10 OPERATING & CAPITAL BUDGETS
REPRESENTED EMPLOYEE SALARY STRUCTURE
Effective 02/18/06 Tier 1- Hired Before 07/01/2002 Hourly Annual Hourly Annual Hourly Annual
02/18/06 02/18/06 02/17/07 02/17/07 02/16/08 02/16/08 (continued from previous page)
3 years experienceThereafter $20.12 $41,849.60 $20.42 $42,477.34 $20.73 $43,114.50
AA InspectorsLess than 3 years experience1st 6 months $19.64 $40,851.20 $19.93 $41,463.97 $20.23 $42,085.932nd 6 months $19.71 $40,996.80 $20.01 $41,611.75 $20.31 $42,235.93Thereafter $19.78 $41,142.40 $20.08 $41,759.54 $20.38 $42,385.933 years experienceThereafter $20.44 $42,515.20 $20.75 $43,152.93 $21.06 $43,800.22
Journeymen Less than 3 years experience1st 6 months $19.17 $39,873.60 $19.46 $40,471.70 $19.75 $41,078.782nd 6 months $19.32 $40,185.60 $19.61 $40,788.38 $19.90 $41,400.21Thereafter $19.78 $41,142.40 $20.08 $41,759.54 $20.38 $42,385.933 years experienceThereafter $20.44 $42,515.20 $20.75 $43,152.93 $21.06 $43,800.22
Structural Inspector, Maintainer, Tamper Operator, Track Walker1st 6 months $18.76 $39,020.80 $19.04 $39,606.11 $19.33 $40,200.202nd 6 months $18.97 $39,457.60 $19.25 $40,049.46 $19.54 $40,650.213rd 6 months $19.26 $40,060.80 $19.55 $40,661.71 $19.84 $41,271.644th 6 months $19.32 $40,185.60 $19.61 $40,788.38 $19.90 $41,400.215th 6 months $19.44 $40,435.20 $19.73 $41,041.73 $20.03 $41,657.35Thereafter $20.12 $41,849.60 $20.42 $42,477.34 $20.73 $43,114.50SERVICEServiceperson I and II1st 6 months $13.46 $27,996.80 $13.66 $28,416.75 $13.87 $28,843.002nd 6 months $14.22 $29,577.60 $14.43 $30,021.26 $14.65 $30,471.58Thereafter $14.85 $30,888.00 $15.07 $31,351.32 $15.30 $31,821.59
526
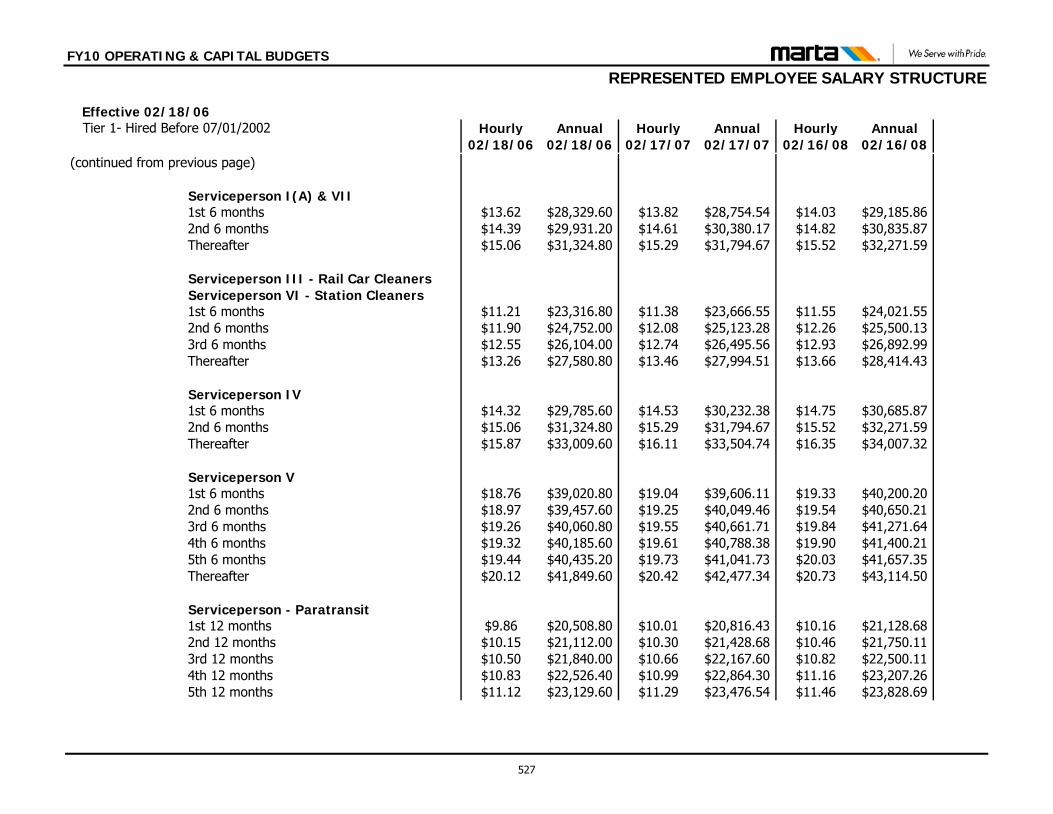
FY10 OPERATING & CAPITAL BUDGETS
REPRESENTED EMPLOYEE SALARY STRUCTURE
Effective 02/18/06 Tier 1- Hired Before 07/01/2002 Hourly Annual Hourly Annual Hourly Annual
02/18/06 02/18/06 02/17/07 02/17/07 02/16/08 02/16/08 (continued from previous page)
Serviceperson I(A) & VII 1st 6 months $13.62 $28,329.60 $13.82 $28,754.54 $14.03 $29,185.862nd 6 months $14.39 $29,931.20 $14.61 $30,380.17 $14.82 $30,835.87Thereafter $15.06 $31,324.80 $15.29 $31,794.67 $15.52 $32,271.59
Serviceperson III - Rail Car CleanersServiceperson VI - Station Cleaners1st 6 months $11.21 $23,316.80 $11.38 $23,666.55 $11.55 $24,021.552nd 6 months $11.90 $24,752.00 $12.08 $25,123.28 $12.26 $25,500.133rd 6 months $12.55 $26,104.00 $12.74 $26,495.56 $12.93 $26,892.99Thereafter $13.26 $27,580.80 $13.46 $27,994.51 $13.66 $28,414.43
Serviceperson IV 1st 6 months $14.32 $29,785.60 $14.53 $30,232.38 $14.75 $30,685.872nd 6 months $15.06 $31,324.80 $15.29 $31,794.67 $15.52 $32,271.59Thereafter $15.87 $33,009.60 $16.11 $33,504.74 $16.35 $34,007.32
Serviceperson V 1st 6 months $18.76 $39,020.80 $19.04 $39,606.11 $19.33 $40,200.202nd 6 months $18.97 $39,457.60 $19.25 $40,049.46 $19.54 $40,650.213rd 6 months $19.26 $40,060.80 $19.55 $40,661.71 $19.84 $41,271.644th 6 months $19.32 $40,185.60 $19.61 $40,788.38 $19.90 $41,400.215th 6 months $19.44 $40,435.20 $19.73 $41,041.73 $20.03 $41,657.35Thereafter $20.12 $41,849.60 $20.42 $42,477.34 $20.73 $43,114.50
Serviceperson - Paratransit1st 12 months $9.86 $20,508.80 $10.01 $20,816.43 $10.16 $21,128.682nd 12 months $10.15 $21,112.00 $10.30 $21,428.68 $10.46 $21,750.113rd 12 months $10.50 $21,840.00 $10.66 $22,167.60 $10.82 $22,500.114th 12 months $10.83 $22,526.40 $10.99 $22,864.30 $11.16 $23,207.265th 12 months $11.12 $23,129.60 $11.29 $23,476.54 $11.46 $23,828.69
527
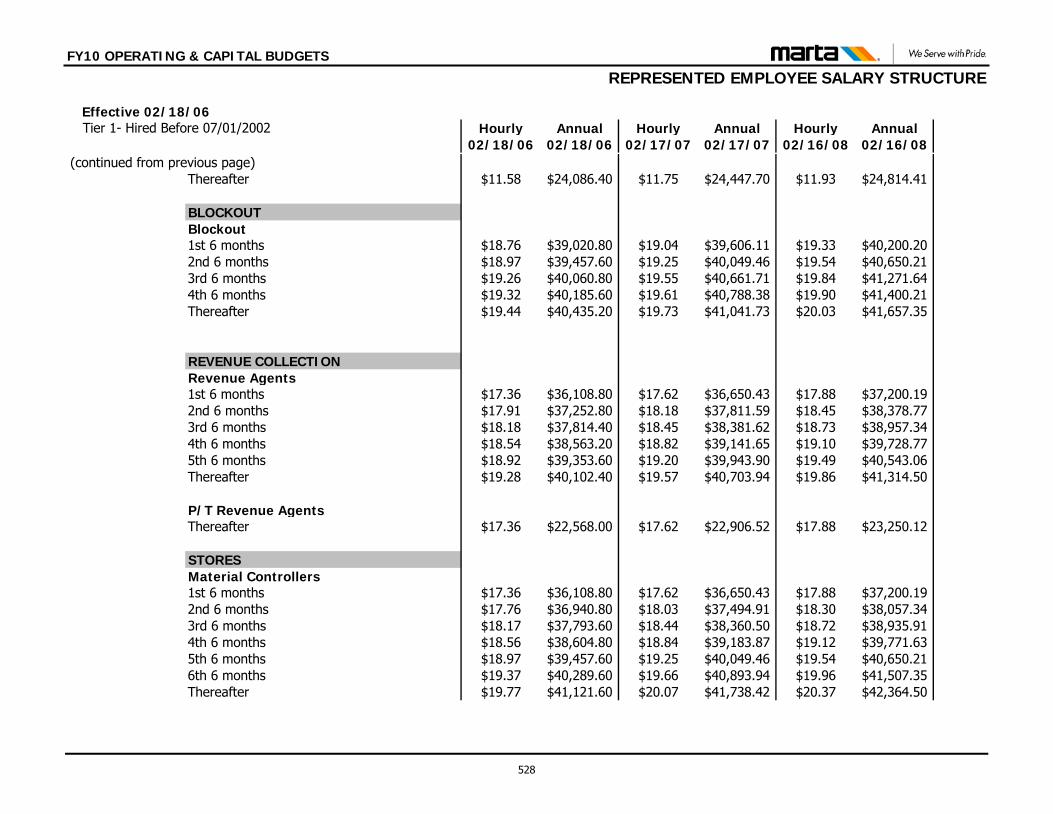
FY10 OPERATING & CAPITAL BUDGETS
REPRESENTED EMPLOYEE SALARY STRUCTURE
Effective 02/18/06 Tier 1- Hired Before 07/01/2002 Hourly Annual Hourly Annual Hourly Annual
02/18/06 02/18/06 02/17/07 02/17/07 02/16/08 02/16/08 (continued from previous page)
Thereafter $11.58 $24,086.40 $11.75 $24,447.70 $11.93 $24,814.41
BLOCKOUT Blockout 1st 6 months $18.76 $39,020.80 $19.04 $39,606.11 $19.33 $40,200.202nd 6 months $18.97 $39,457.60 $19.25 $40,049.46 $19.54 $40,650.213rd 6 months $19.26 $40,060.80 $19.55 $40,661.71 $19.84 $41,271.644th 6 months $19.32 $40,185.60 $19.61 $40,788.38 $19.90 $41,400.21Thereafter $19.44 $40,435.20 $19.73 $41,041.73 $20.03 $41,657.35
REVENUE COLLECTIONRevenue Agents1st 6 months $17.36 $36,108.80 $17.62 $36,650.43 $17.88 $37,200.192nd 6 months $17.91 $37,252.80 $18.18 $37,811.59 $18.45 $38,378.773rd 6 months $18.18 $37,814.40 $18.45 $38,381.62 $18.73 $38,957.344th 6 months $18.54 $38,563.20 $18.82 $39,141.65 $19.10 $39,728.775th 6 months $18.92 $39,353.60 $19.20 $39,943.90 $19.49 $40,543.06Thereafter $19.28 $40,102.40 $19.57 $40,703.94 $19.86 $41,314.50
P/T Revenue AgentsThereafter $17.36 $22,568.00 $17.62 $22,906.52 $17.88 $23,250.12
STORESMaterial Controllers1st 6 months $17.36 $36,108.80 $17.62 $36,650.43 $17.88 $37,200.192nd 6 months $17.76 $36,940.80 $18.03 $37,494.91 $18.30 $38,057.343rd 6 months $18.17 $37,793.60 $18.44 $38,360.50 $18.72 $38,935.914th 6 months $18.56 $38,604.80 $18.84 $39,183.87 $19.12 $39,771.635th 6 months $18.97 $39,457.60 $19.25 $40,049.46 $19.54 $40,650.216th 6 months $19.37 $40,289.60 $19.66 $40,893.94 $19.96 $41,507.35Thereafter $19.77 $41,121.60 $20.07 $41,738.42 $20.37 $42,364.50
528
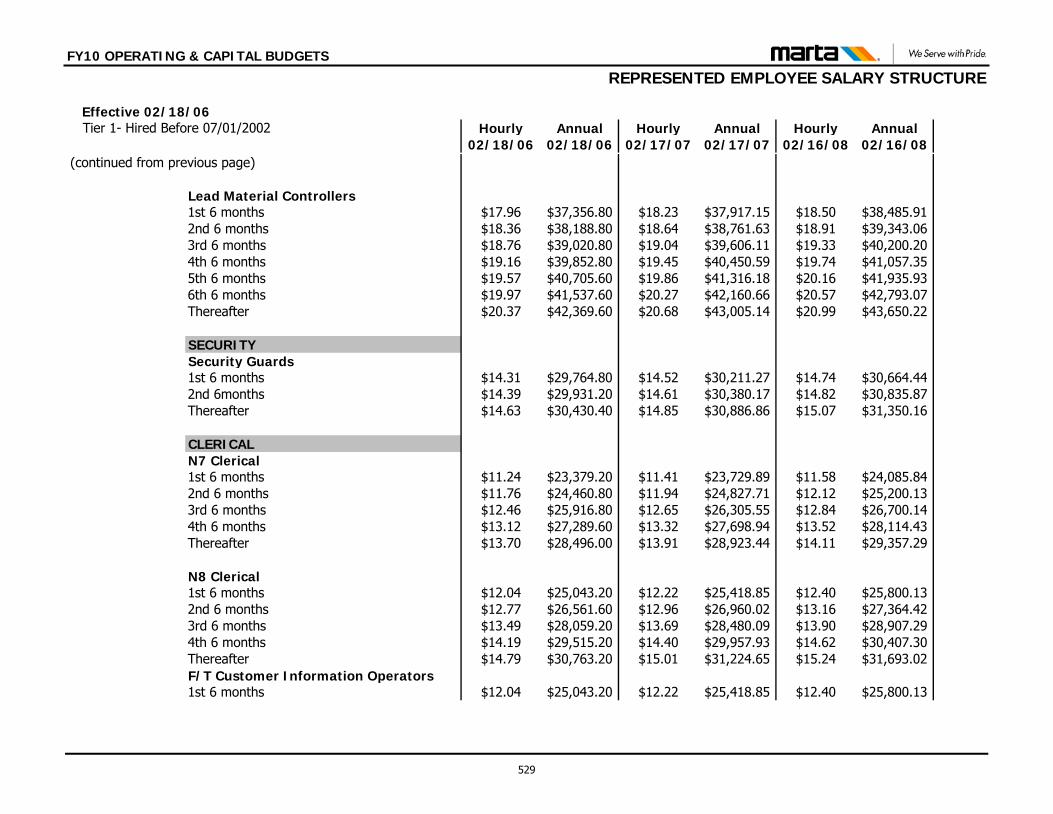
FY10 OPERATING & CAPITAL BUDGETS
REPRESENTED EMPLOYEE SALARY STRUCTURE
Effective 02/18/06 Tier 1- Hired Before 07/01/2002 Hourly Annual Hourly Annual Hourly Annual
02/18/06 02/18/06 02/17/07 02/17/07 02/16/08 02/16/08(continued from previous page)
Lead Material Controllers1st 6 months $17.96 $37,356.80 $18.23 $37,917.15 $18.50 $38,485.912nd 6 months $18.36 $38,188.80 $18.64 $38,761.63 $18.91 $39,343.063rd 6 months $18.76 $39,020.80 $19.04 $39,606.11 $19.33 $40,200.204th 6 months $19.16 $39,852.80 $19.45 $40,450.59 $19.74 $41,057.355th 6 months $19.57 $40,705.60 $19.86 $41,316.18 $20.16 $41,935.936th 6 months $19.97 $41,537.60 $20.27 $42,160.66 $20.57 $42,793.07Thereafter $20.37 $42,369.60 $20.68 $43,005.14 $20.99 $43,650.22
SECURITYSecurity Guards 1st 6 months $14.31 $29,764.80 $14.52 $30,211.27 $14.74 $30,664.442nd 6months $14.39 $29,931.20 $14.61 $30,380.17 $14.82 $30,835.87Thereafter $14.63 $30,430.40 $14.85 $30,886.86 $15.07 $31,350.16
CLERICALN7 Clerical 1st 6 months $11.24 $23,379.20 $11.41 $23,729.89 $11.58 $24,085.842nd 6 months $11.76 $24,460.80 $11.94 $24,827.71 $12.12 $25,200.133rd 6 months $12.46 $25,916.80 $12.65 $26,305.55 $12.84 $26,700.144th 6 months $13.12 $27,289.60 $13.32 $27,698.94 $13.52 $28,114.43Thereafter $13.70 $28,496.00 $13.91 $28,923.44 $14.11 $29,357.29
N8 Clerical 1st 6 months $12.04 $25,043.20 $12.22 $25,418.85 $12.40 $25,800.132nd 6 months $12.77 $26,561.60 $12.96 $26,960.02 $13.16 $27,364.423rd 6 months $13.49 $28,059.20 $13.69 $28,480.09 $13.90 $28,907.294th 6 months $14.19 $29,515.20 $14.40 $29,957.93 $14.62 $30,407.30Thereafter $14.79 $30,763.20 $15.01 $31,224.65 $15.24 $31,693.02F/T Customer Information Operators1st 6 months $12.04 $25,043.20 $12.22 $25,418.85 $12.40 $25,800.13
529
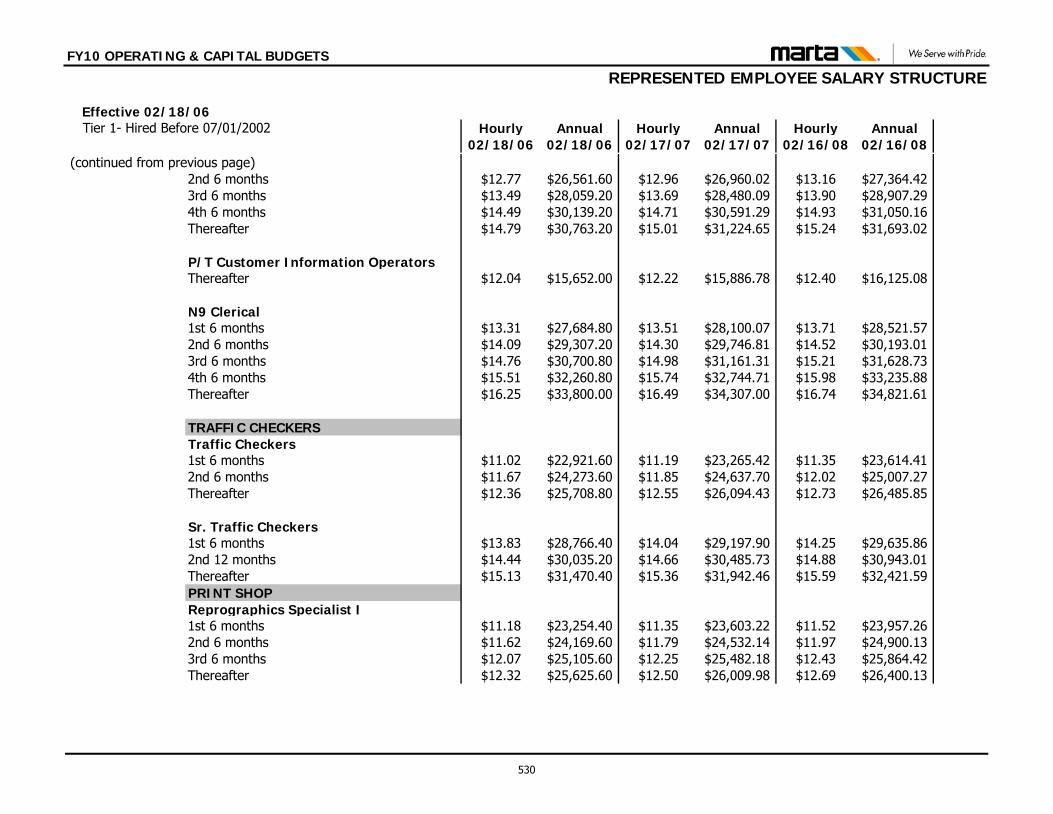
FY10 OPERATING & CAPITAL BUDGETS
REPRESENTED EMPLOYEE SALARY STRUCTURE
Effective 02/18/06 Tier 1- Hired Before 07/01/2002 Hourly Annual Hourly Annual Hourly Annual
02/18/06 02/18/06 02/17/07 02/17/07 02/16/08 02/16/08(continued from previous page)
2nd 6 months $12.77 $26,561.60 $12.96 $26,960.02 $13.16 $27,364.423rd 6 months $13.49 $28,059.20 $13.69 $28,480.09 $13.90 $28,907.294th 6 months $14.49 $30,139.20 $14.71 $30,591.29 $14.93 $31,050.16Thereafter $14.79 $30,763.20 $15.01 $31,224.65 $15.24 $31,693.02
P/T Customer Information OperatorsThereafter $12.04 $15,652.00 $12.22 $15,886.78 $12.40 $16,125.08
N9 Clerical 1st 6 months $13.31 $27,684.80 $13.51 $28,100.07 $13.71 $28,521.572nd 6 months $14.09 $29,307.20 $14.30 $29,746.81 $14.52 $30,193.013rd 6 months $14.76 $30,700.80 $14.98 $31,161.31 $15.21 $31,628.734th 6 months $15.51 $32,260.80 $15.74 $32,744.71 $15.98 $33,235.88Thereafter $16.25 $33,800.00 $16.49 $34,307.00 $16.74 $34,821.61
TRAFFIC CHECKERS Traffic Checkers 1st 6 months $11.02 $22,921.60 $11.19 $23,265.42 $11.35 $23,614.412nd 6 months $11.67 $24,273.60 $11.85 $24,637.70 $12.02 $25,007.27Thereafter $12.36 $25,708.80 $12.55 $26,094.43 $12.73 $26,485.85
Sr. Traffic Checkers1st 6 months $13.83 $28,766.40 $14.04 $29,197.90 $14.25 $29,635.862nd 12 months $14.44 $30,035.20 $14.66 $30,485.73 $14.88 $30,943.01Thereafter $15.13 $31,470.40 $15.36 $31,942.46 $15.59 $32,421.59PRINT SHOPReprographics Specialist I 1st 6 months $11.18 $23,254.40 $11.35 $23,603.22 $11.52 $23,957.262nd 6 months $11.62 $24,169.60 $11.79 $24,532.14 $11.97 $24,900.133rd 6 months $12.07 $25,105.60 $12.25 $25,482.18 $12.43 $25,864.42Thereafter $12.32 $25,625.60 $12.50 $26,009.98 $12.69 $26,400.13
530
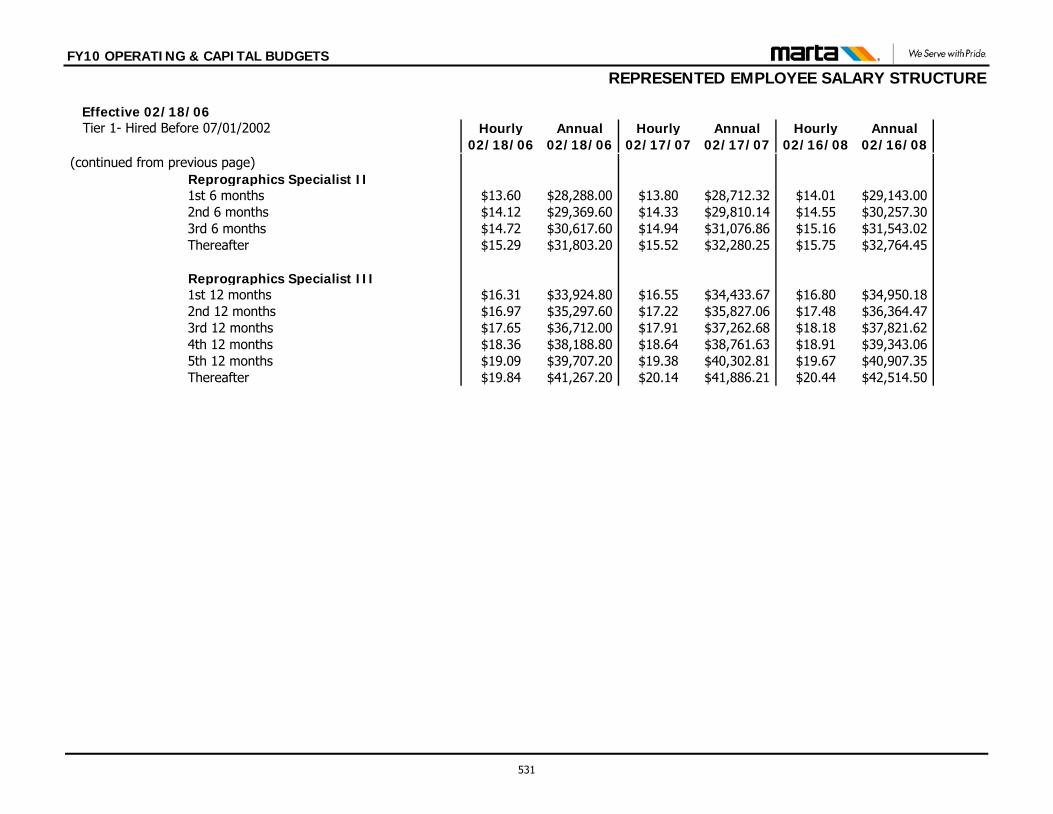
FY10 OPERATING & CAPITAL BUDGETS
REPRESENTED EMPLOYEE SALARY STRUCTURE
Effective 02/18/06 Tier 1- Hired Before 07/01/2002 Hourly Annual Hourly Annual Hourly Annual
02/18/06 02/18/06 02/17/07 02/17/07 02/16/08 02/16/08(continued from previous page) Reprographics Specialist II
1st 6 months $13.60 $28,288.00 $13.80 $28,712.32 $14.01 $29,143.002nd 6 months $14.12 $29,369.60 $14.33 $29,810.14 $14.55 $30,257.303rd 6 months $14.72 $30,617.60 $14.94 $31,076.86 $15.16 $31,543.02Thereafter $15.29 $31,803.20 $15.52 $32,280.25 $15.75 $32,764.45
Reprographics Specialist III 1st 12 months $16.31 $33,924.80 $16.55 $34,433.67 $16.80 $34,950.182nd 12 months $16.97 $35,297.60 $17.22 $35,827.06 $17.48 $36,364.473rd 12 months $17.65 $36,712.00 $17.91 $37,262.68 $18.18 $37,821.624th 12 months $18.36 $38,188.80 $18.64 $38,761.63 $18.91 $39,343.065th 12 months $19.09 $39,707.20 $19.38 $40,302.81 $19.67 $40,907.35Thereafter $19.84 $41,267.20 $20.14 $41,886.21 $20.44 $42,514.50
531
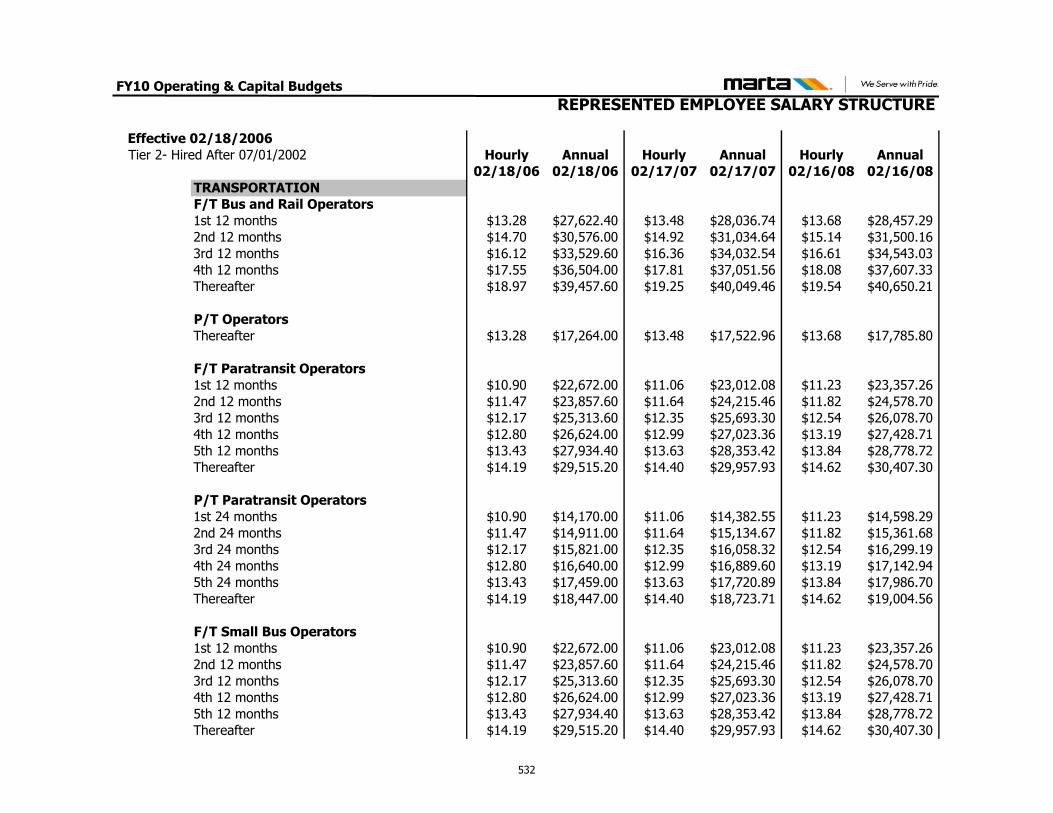
FY10 Operating & Capital Budgets
REPRESENTED EMPLOYEE SALARY STRUCTURE
Effective 02/18/2006
Tier 2- Hired After 07/01/2002 Hourly Annual Hourly Annual Hourly Annual
02/18/06 02/18/06 02/17/07 02/17/07 02/16/08 02/16/08
TRANSPORTATION
F/T Bus and Rail Operators
1st 12 months $13.28 $27,622.40 $13.48 $28,036.74 $13.68 $28,457.29
2nd 12 months $14.70 $30,576.00 $14.92 $31,034.64 $15.14 $31,500.16
3rd 12 months $16.12 $33,529.60 $16.36 $34,032.54 $16.61 $34,543.03
4th 12 months $17.55 $36,504.00 $17.81 $37,051.56 $18.08 $37,607.33
Thereafter $18.97 $39,457.60 $19.25 $40,049.46 $19.54 $40,650.21
P/T Operators
Thereafter $13.28 $17,264.00 $13.48 $17,522.96 $13.68 $17,785.80
F/T Paratransit Operators
1st 12 months $10.90 $22,672.00 $11.06 $23,012.08 $11.23 $23,357.26
2nd 12 months $11.47 $23,857.60 $11.64 $24,215.46 $11.82 $24,578.70
3rd 12 months $12.17 $25,313.60 $12.35 $25,693.30 $12.54 $26,078.70
4th 12 months $12.80 $26,624.00 $12.99 $27,023.36 $13.19 $27,428.71
5th 12 months $13.43 $27,934.40 $13.63 $28,353.42 $13.84 $28,778.72
Thereafter $14.19 $29,515.20 $14.40 $29,957.93 $14.62 $30,407.30
P/T Paratransit Operators
1st 24 months $10.90 $14,170.00 $11.06 $14,382.55 $11.23 $14,598.29
2nd 24 months $11.47 $14,911.00 $11.64 $15,134.67 $11.82 $15,361.68
3rd 24 months $12.17 $15,821.00 $12.35 $16,058.32 $12.54 $16,299.19
4th 24 months $12.80 $16,640.00 $12.99 $16,889.60 $13.19 $17,142.94
5th 24 months $13.43 $17,459.00 $13.63 $17,720.89 $13.84 $17,986.70
Thereafter $14.19 $18,447.00 $14.40 $18,723.71 $14.62 $19,004.56
F/T Small Bus Operators
1st 12 months $10.90 $22,672.00 $11.06 $23,012.08 $11.23 $23,357.26
2nd 12 months $11.47 $23,857.60 $11.64 $24,215.46 $11.82 $24,578.70
3rd 12 months $12.17 $25,313.60 $12.35 $25,693.30 $12.54 $26,078.70
4th 12 months $12.80 $26,624.00 $12.99 $27,023.36 $13.19 $27,428.71
5th 12 months $13.43 $27,934.40 $13.63 $28,353.42 $13.84 $28,778.72
Thereafter $14.19 $29,515.20 $14.40 $29,957.93 $14.62 $30,407.30
532
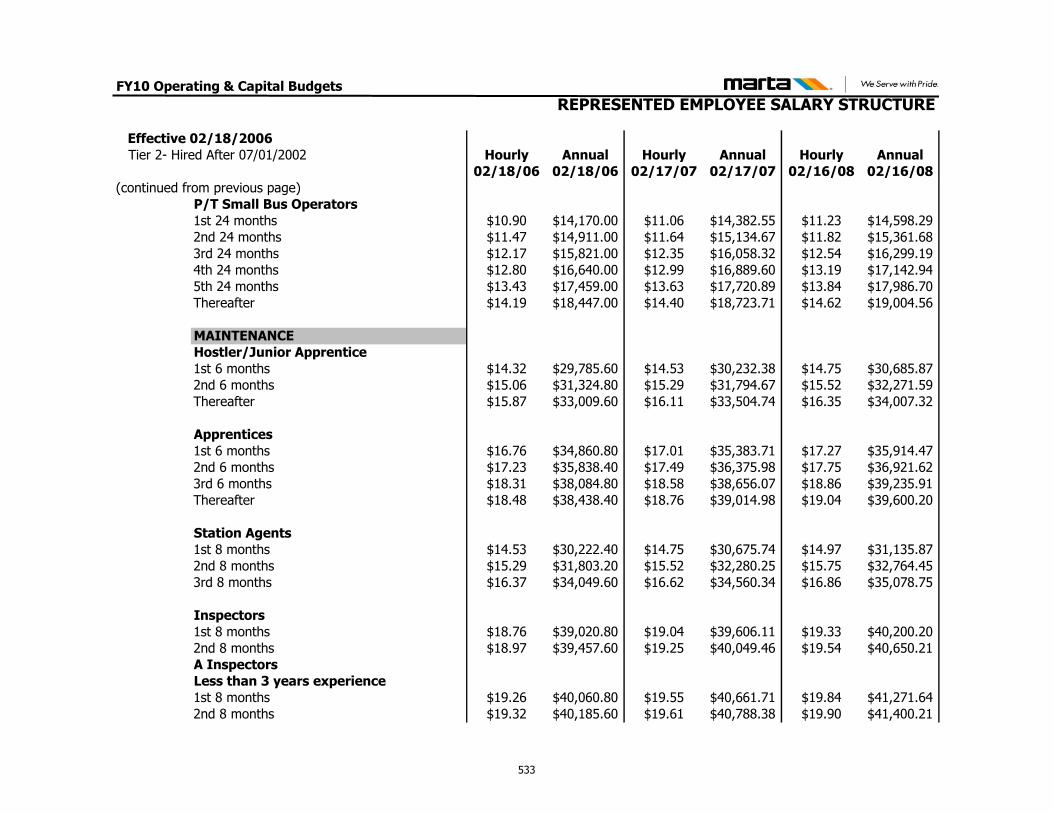
FY10 Operating & Capital Budgets
REPRESENTED EMPLOYEE SALARY STRUCTURE
Effective 02/18/2006
Tier 2- Hired After 07/01/2002 Hourly Annual Hourly Annual Hourly Annual
02/18/06 02/18/06 02/17/07 02/17/07 02/16/08 02/16/08
(continued from previous page)
P/T Small Bus Operators
1st 24 months $10.90 $14,170.00 $11.06 $14,382.55 $11.23 $14,598.29
2nd 24 months $11.47 $14,911.00 $11.64 $15,134.67 $11.82 $15,361.68
3rd 24 months $12.17 $15,821.00 $12.35 $16,058.32 $12.54 $16,299.19
4th 24 months $12.80 $16,640.00 $12.99 $16,889.60 $13.19 $17,142.94
5th 24 months $13.43 $17,459.00 $13.63 $17,720.89 $13.84 $17,986.70
Thereafter $14.19 $18,447.00 $14.40 $18,723.71 $14.62 $19,004.56
MAINTENANCE
Hostler/Junior Apprentice
1st 6 months $14.32 $29,785.60 $14.53 $30,232.38 $14.75 $30,685.87
2nd 6 months $15.06 $31,324.80 $15.29 $31,794.67 $15.52 $32,271.59
Thereafter $15.87 $33,009.60 $16.11 $33,504.74 $16.35 $34,007.32
Apprentices
1st 6 months $16.76 $34,860.80 $17.01 $35,383.71 $17.27 $35,914.47
2nd 6 months $17.23 $35,838.40 $17.49 $36,375.98 $17.75 $36,921.62
3rd 6 months $18.31 $38,084.80 $18.58 $38,656.07 $18.86 $39,235.91
Thereafter $18.48 $38,438.40 $18.76 $39,014.98 $19.04 $39,600.20
Station Agents
1st 8 months $14.53 $30,222.40 $14.75 $30,675.74 $14.97 $31,135.87
2nd 8 months $15.29 $31,803.20 $15.52 $32,280.25 $15.75 $32,764.45
3rd 8 months $16.37 $34,049.60 $16.62 $34,560.34 $16.86 $35,078.75
Inspectors
1st 8 months $18.76 $39,020.80 $19.04 $39,606.11 $19.33 $40,200.20
2nd 8 months $18.97 $39,457.60 $19.25 $40,049.46 $19.54 $40,650.21
A Inspectors
Less than 3 years experience
1st 8 months $19.26 $40,060.80 $19.55 $40,661.71 $19.84 $41,271.64
2nd 8 months $19.32 $40,185.60 $19.61 $40,788.38 $19.90 $41,400.21
533
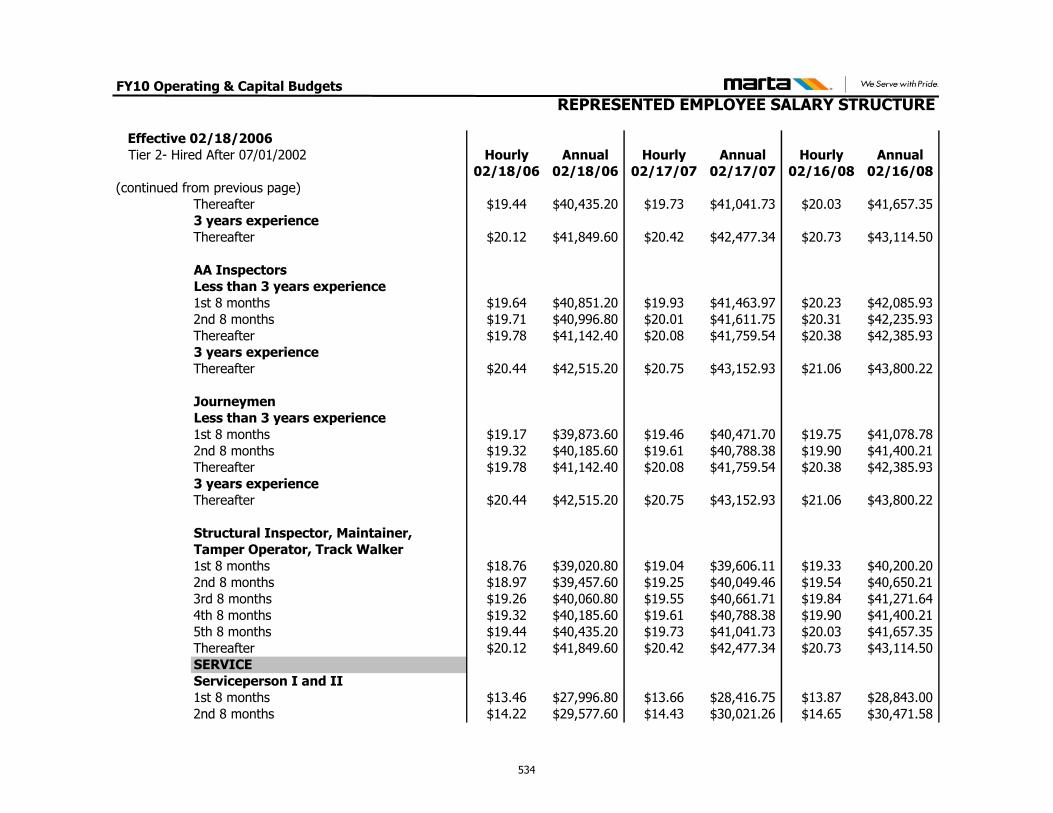
FY10 Operating & Capital Budgets
REPRESENTED EMPLOYEE SALARY STRUCTURE
Effective 02/18/2006
Tier 2- Hired After 07/01/2002 Hourly Annual Hourly Annual Hourly Annual
02/18/06 02/18/06 02/17/07 02/17/07 02/16/08 02/16/08
(continued from previous page)
Thereafter $19.44 $40,435.20 $19.73 $41,041.73 $20.03 $41,657.35
3 years experience
Thereafter $20.12 $41,849.60 $20.42 $42,477.34 $20.73 $43,114.50
AA Inspectors
Less than 3 years experience
1st 8 months $19.64 $40,851.20 $19.93 $41,463.97 $20.23 $42,085.93
2nd 8 months $19.71 $40,996.80 $20.01 $41,611.75 $20.31 $42,235.93
Thereafter $19.78 $41,142.40 $20.08 $41,759.54 $20.38 $42,385.93
3 years experience
Thereafter $20.44 $42,515.20 $20.75 $43,152.93 $21.06 $43,800.22
Journeymen
Less than 3 years experience
1st 8 months $19.17 $39,873.60 $19.46 $40,471.70 $19.75 $41,078.78
2nd 8 months $19.32 $40,185.60 $19.61 $40,788.38 $19.90 $41,400.21
Thereafter $19.78 $41,142.40 $20.08 $41,759.54 $20.38 $42,385.93
3 years experience
Thereafter $20.44 $42,515.20 $20.75 $43,152.93 $21.06 $43,800.22
Structural Inspector, Maintainer,
Tamper Operator, Track Walker
1st 8 months $18.76 $39,020.80 $19.04 $39,606.11 $19.33 $40,200.20
2nd 8 months $18.97 $39,457.60 $19.25 $40,049.46 $19.54 $40,650.21
3rd 8 months $19.26 $40,060.80 $19.55 $40,661.71 $19.84 $41,271.64
4th 8 months $19.32 $40,185.60 $19.61 $40,788.38 $19.90 $41,400.21
5th 8 months $19.44 $40,435.20 $19.73 $41,041.73 $20.03 $41,657.35
Thereafter $20.12 $41,849.60 $20.42 $42,477.34 $20.73 $43,114.50
SERVICE
Serviceperson I and II
1st 8 months $13.46 $27,996.80 $13.66 $28,416.75 $13.87 $28,843.00
2nd 8 months $14.22 $29,577.60 $14.43 $30,021.26 $14.65 $30,471.58
534
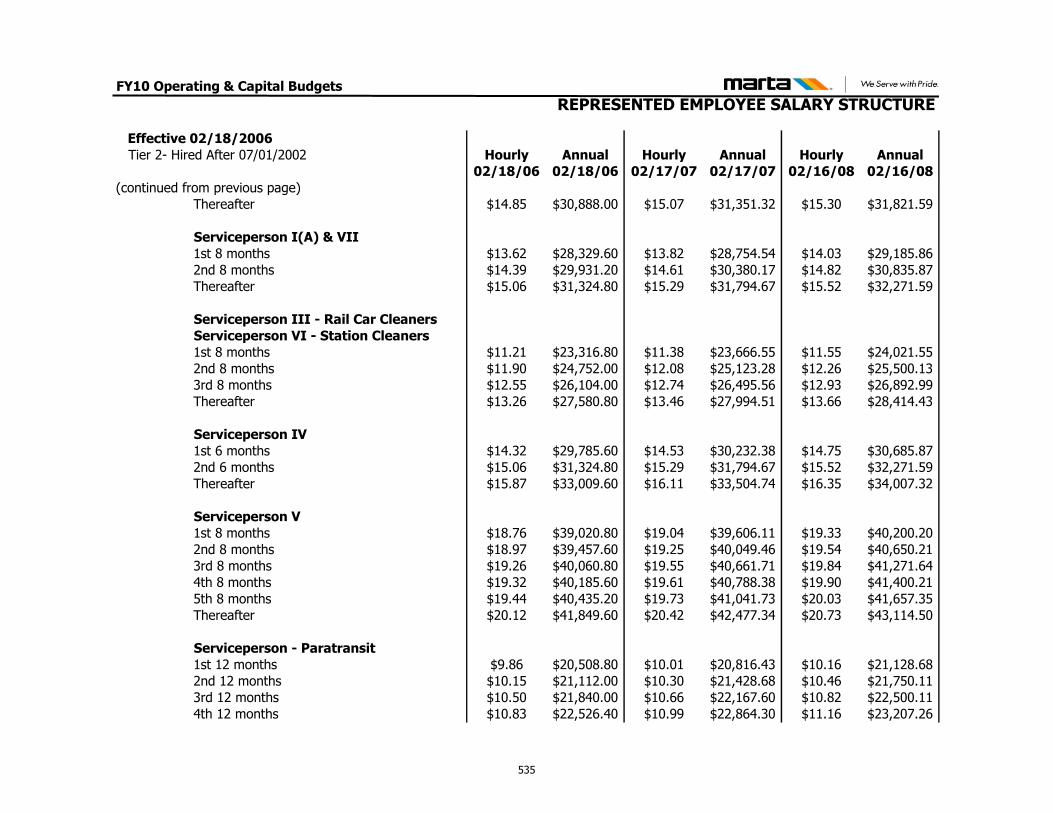
FY10 Operating & Capital Budgets
REPRESENTED EMPLOYEE SALARY STRUCTURE
Effective 02/18/2006
Tier 2- Hired After 07/01/2002 Hourly Annual Hourly Annual Hourly Annual
02/18/06 02/18/06 02/17/07 02/17/07 02/16/08 02/16/08
(continued from previous page)
Thereafter $14.85 $30,888.00 $15.07 $31,351.32 $15.30 $31,821.59
Serviceperson I(A) & VII
1st 8 months $13.62 $28,329.60 $13.82 $28,754.54 $14.03 $29,185.86
2nd 8 months $14.39 $29,931.20 $14.61 $30,380.17 $14.82 $30,835.87
Thereafter $15.06 $31,324.80 $15.29 $31,794.67 $15.52 $32,271.59
Serviceperson III - Rail Car Cleaners
Serviceperson VI - Station Cleaners
1st 8 months $11.21 $23,316.80 $11.38 $23,666.55 $11.55 $24,021.55
2nd 8 months $11.90 $24,752.00 $12.08 $25,123.28 $12.26 $25,500.13
3rd 8 months $12.55 $26,104.00 $12.74 $26,495.56 $12.93 $26,892.99
Thereafter $13.26 $27,580.80 $13.46 $27,994.51 $13.66 $28,414.43
Serviceperson IV
1st 6 months $14.32 $29,785.60 $14.53 $30,232.38 $14.75 $30,685.87
2nd 6 months $15.06 $31,324.80 $15.29 $31,794.67 $15.52 $32,271.59
Thereafter $15.87 $33,009.60 $16.11 $33,504.74 $16.35 $34,007.32
Serviceperson V
1st 8 months $18.76 $39,020.80 $19.04 $39,606.11 $19.33 $40,200.20
2nd 8 months $18.97 $39,457.60 $19.25 $40,049.46 $19.54 $40,650.21
3rd 8 months $19.26 $40,060.80 $19.55 $40,661.71 $19.84 $41,271.64
4th 8 months $19.32 $40,185.60 $19.61 $40,788.38 $19.90 $41,400.21
5th 8 months $19.44 $40,435.20 $19.73 $41,041.73 $20.03 $41,657.35
Thereafter $20.12 $41,849.60 $20.42 $42,477.34 $20.73 $43,114.50
Serviceperson - Paratransit
1st 12 months $9.86 $20,508.80 $10.01 $20,816.43 $10.16 $21,128.68
2nd 12 months $10.15 $21,112.00 $10.30 $21,428.68 $10.46 $21,750.11
3rd 12 months $10.50 $21,840.00 $10.66 $22,167.60 $10.82 $22,500.11
4th 12 months $10.83 $22,526.40 $10.99 $22,864.30 $11.16 $23,207.26
535
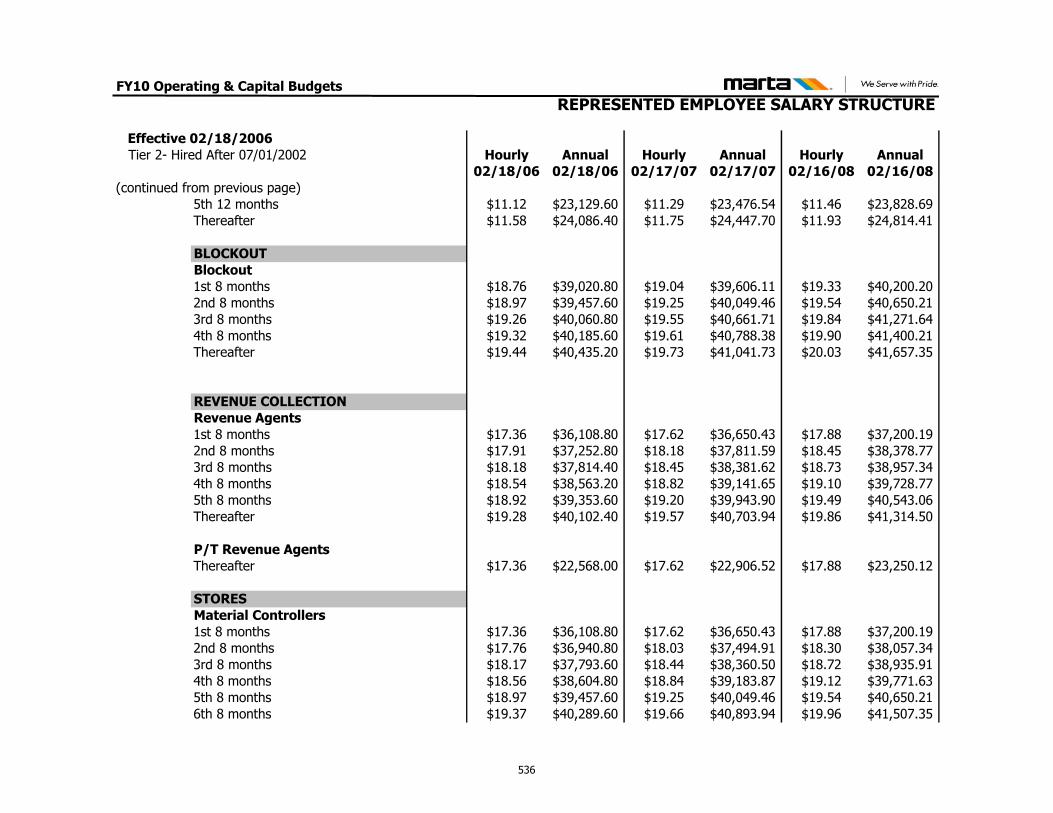
FY10 Operating & Capital Budgets
REPRESENTED EMPLOYEE SALARY STRUCTURE
Effective 02/18/2006
Tier 2- Hired After 07/01/2002 Hourly Annual Hourly Annual Hourly Annual
02/18/06 02/18/06 02/17/07 02/17/07 02/16/08 02/16/08
(continued from previous page)
5th 12 months $11.12 $23,129.60 $11.29 $23,476.54 $11.46 $23,828.69
Thereafter $11.58 $24,086.40 $11.75 $24,447.70 $11.93 $24,814.41
BLOCKOUT
Blockout
1st 8 months $18.76 $39,020.80 $19.04 $39,606.11 $19.33 $40,200.20
2nd 8 months $18.97 $39,457.60 $19.25 $40,049.46 $19.54 $40,650.21
3rd 8 months $19.26 $40,060.80 $19.55 $40,661.71 $19.84 $41,271.64
4th 8 months $19.32 $40,185.60 $19.61 $40,788.38 $19.90 $41,400.21
Thereafter $19.44 $40,435.20 $19.73 $41,041.73 $20.03 $41,657.35
REVENUE COLLECTION
Revenue Agents
1st 8 months $17.36 $36,108.80 $17.62 $36,650.43 $17.88 $37,200.19
2nd 8 months $17.91 $37,252.80 $18.18 $37,811.59 $18.45 $38,378.77
3rd 8 months $18.18 $37,814.40 $18.45 $38,381.62 $18.73 $38,957.34
4th 8 months $18.54 $38,563.20 $18.82 $39,141.65 $19.10 $39,728.77
5th 8 months $18.92 $39,353.60 $19.20 $39,943.90 $19.49 $40,543.06
Thereafter $19.28 $40,102.40 $19.57 $40,703.94 $19.86 $41,314.50
P/T Revenue Agents
Thereafter $17.36 $22,568.00 $17.62 $22,906.52 $17.88 $23,250.12
STORES
Material Controllers
1st 8 months $17.36 $36,108.80 $17.62 $36,650.43 $17.88 $37,200.19
2nd 8 months $17.76 $36,940.80 $18.03 $37,494.91 $18.30 $38,057.34
3rd 8 months $18.17 $37,793.60 $18.44 $38,360.50 $18.72 $38,935.91
4th 8 months $18.56 $38,604.80 $18.84 $39,183.87 $19.12 $39,771.63
5th 8 months $18.97 $39,457.60 $19.25 $40,049.46 $19.54 $40,650.21
6th 8 months $19.37 $40,289.60 $19.66 $40,893.94 $19.96 $41,507.35
536
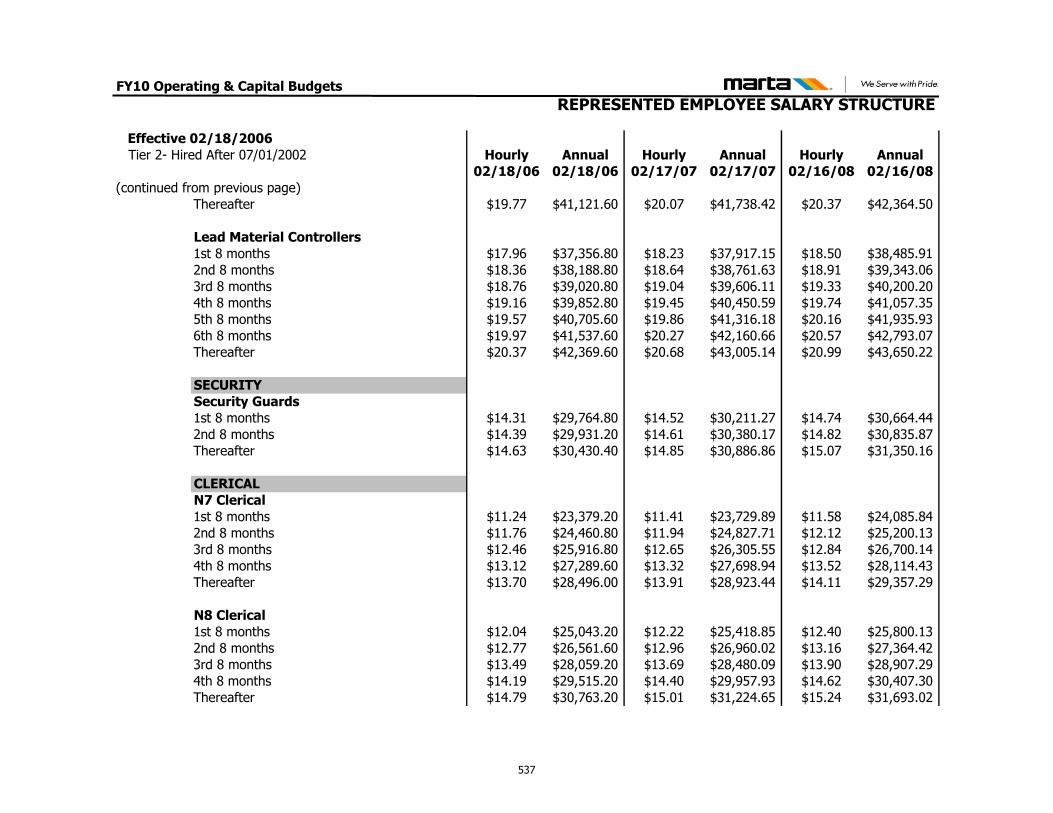
FY10 Operating & Capital Budgets
REPRESENTED EMPLOYEE SALARY STRUCTURE
Effective 02/18/2006
Tier 2- Hired After 07/01/2002 Hourly Annual Hourly Annual Hourly Annual
02/18/06 02/18/06 02/17/07 02/17/07 02/16/08 02/16/08
(continued from previous page)
Thereafter $19.77 $41,121.60 $20.07 $41,738.42 $20.37 $42,364.50
Lead Material Controllers
1st 8 months $17.96 $37,356.80 $18.23 $37,917.15 $18.50 $38,485.91
2nd 8 months $18.36 $38,188.80 $18.64 $38,761.63 $18.91 $39,343.06
3rd 8 months $18.76 $39,020.80 $19.04 $39,606.11 $19.33 $40,200.20
4th 8 months $19.16 $39,852.80 $19.45 $40,450.59 $19.74 $41,057.35
5th 8 months $19.57 $40,705.60 $19.86 $41,316.18 $20.16 $41,935.93
6th 8 months $19.97 $41,537.60 $20.27 $42,160.66 $20.57 $42,793.07
Thereafter $20.37 $42,369.60 $20.68 $43,005.14 $20.99 $43,650.22
SECURITY
Security Guards
1st 8 months $14.31 $29,764.80 $14.52 $30,211.27 $14.74 $30,664.44
2nd 8 months $14.39 $29,931.20 $14.61 $30,380.17 $14.82 $30,835.87
Thereafter $14.63 $30,430.40 $14.85 $30,886.86 $15.07 $31,350.16
CLERICAL
N7 Clerical
1st 8 months $11.24 $23,379.20 $11.41 $23,729.89 $11.58 $24,085.84
2nd 8 months $11.76 $24,460.80 $11.94 $24,827.71 $12.12 $25,200.13
3rd 8 months $12.46 $25,916.80 $12.65 $26,305.55 $12.84 $26,700.14
4th 8 months $13.12 $27,289.60 $13.32 $27,698.94 $13.52 $28,114.43
Thereafter $13.70 $28,496.00 $13.91 $28,923.44 $14.11 $29,357.29
N8 Clerical
1st 8 months $12.04 $25,043.20 $12.22 $25,418.85 $12.40 $25,800.13
2nd 8 months $12.77 $26,561.60 $12.96 $26,960.02 $13.16 $27,364.42
3rd 8 months $13.49 $28,059.20 $13.69 $28,480.09 $13.90 $28,907.29
4th 8 months $14.19 $29,515.20 $14.40 $29,957.93 $14.62 $30,407.30
Thereafter $14.79 $30,763.20 $15.01 $31,224.65 $15.24 $31,693.02
537
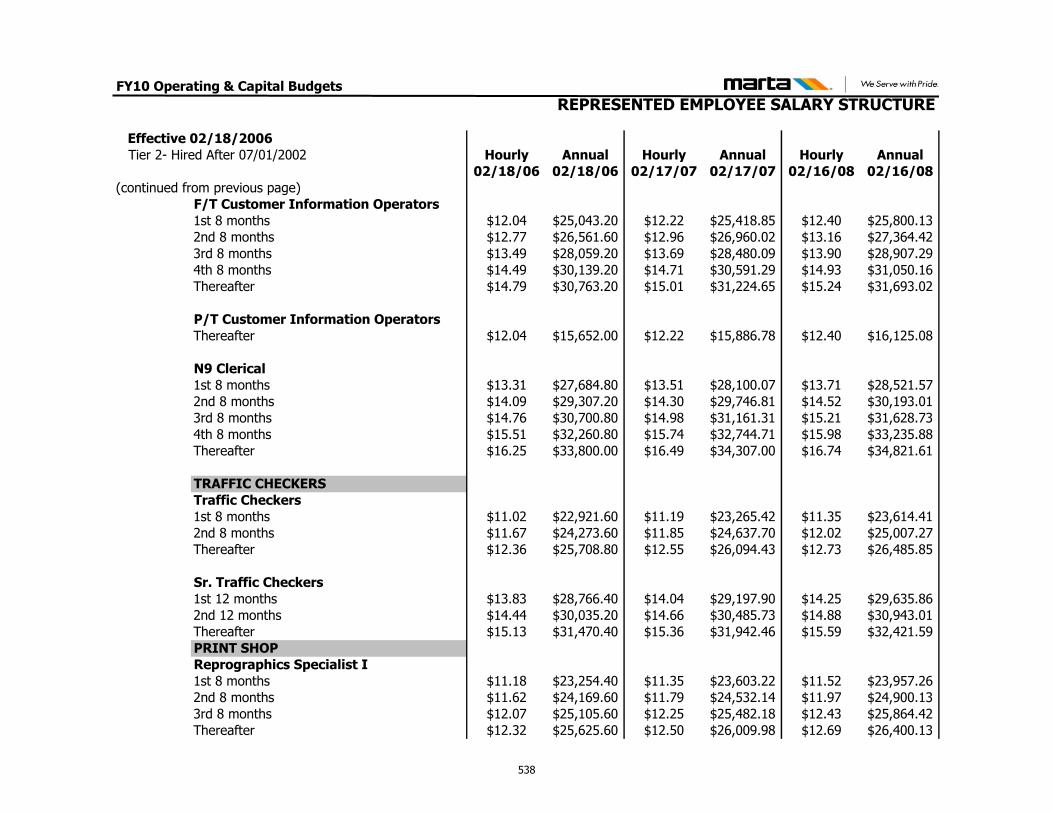
FY10 Operating & Capital Budgets
REPRESENTED EMPLOYEE SALARY STRUCTURE
Effective 02/18/2006
Tier 2- Hired After 07/01/2002 Hourly Annual Hourly Annual Hourly Annual
02/18/06 02/18/06 02/17/07 02/17/07 02/16/08 02/16/08
(continued from previous page)
F/T Customer Information Operators
1st 8 months $12.04 $25,043.20 $12.22 $25,418.85 $12.40 $25,800.13
2nd 8 months $12.77 $26,561.60 $12.96 $26,960.02 $13.16 $27,364.42
3rd 8 months $13.49 $28,059.20 $13.69 $28,480.09 $13.90 $28,907.29
4th 8 months $14.49 $30,139.20 $14.71 $30,591.29 $14.93 $31,050.16
Thereafter $14.79 $30,763.20 $15.01 $31,224.65 $15.24 $31,693.02
P/T Customer Information Operators
Thereafter $12.04 $15,652.00 $12.22 $15,886.78 $12.40 $16,125.08
N9 Clerical
1st 8 months $13.31 $27,684.80 $13.51 $28,100.07 $13.71 $28,521.57
2nd 8 months $14.09 $29,307.20 $14.30 $29,746.81 $14.52 $30,193.01
3rd 8 months $14.76 $30,700.80 $14.98 $31,161.31 $15.21 $31,628.73
4th 8 months $15.51 $32,260.80 $15.74 $32,744.71 $15.98 $33,235.88
Thereafter $16.25 $33,800.00 $16.49 $34,307.00 $16.74 $34,821.61
TRAFFIC CHECKERS
Traffic Checkers
1st 8 months $11.02 $22,921.60 $11.19 $23,265.42 $11.35 $23,614.41
2nd 8 months $11.67 $24,273.60 $11.85 $24,637.70 $12.02 $25,007.27
Thereafter $12.36 $25,708.80 $12.55 $26,094.43 $12.73 $26,485.85
Sr. Traffic Checkers
1st 12 months $13.83 $28,766.40 $14.04 $29,197.90 $14.25 $29,635.86
2nd 12 months $14.44 $30,035.20 $14.66 $30,485.73 $14.88 $30,943.01
Thereafter $15.13 $31,470.40 $15.36 $31,942.46 $15.59 $32,421.59
PRINT SHOP
Reprographics Specialist I
1st 8 months $11.18 $23,254.40 $11.35 $23,603.22 $11.52 $23,957.26
2nd 8 months $11.62 $24,169.60 $11.79 $24,532.14 $11.97 $24,900.13
3rd 8 months $12.07 $25,105.60 $12.25 $25,482.18 $12.43 $25,864.42
Thereafter $12.32 $25,625.60 $12.50 $26,009.98 $12.69 $26,400.13
538
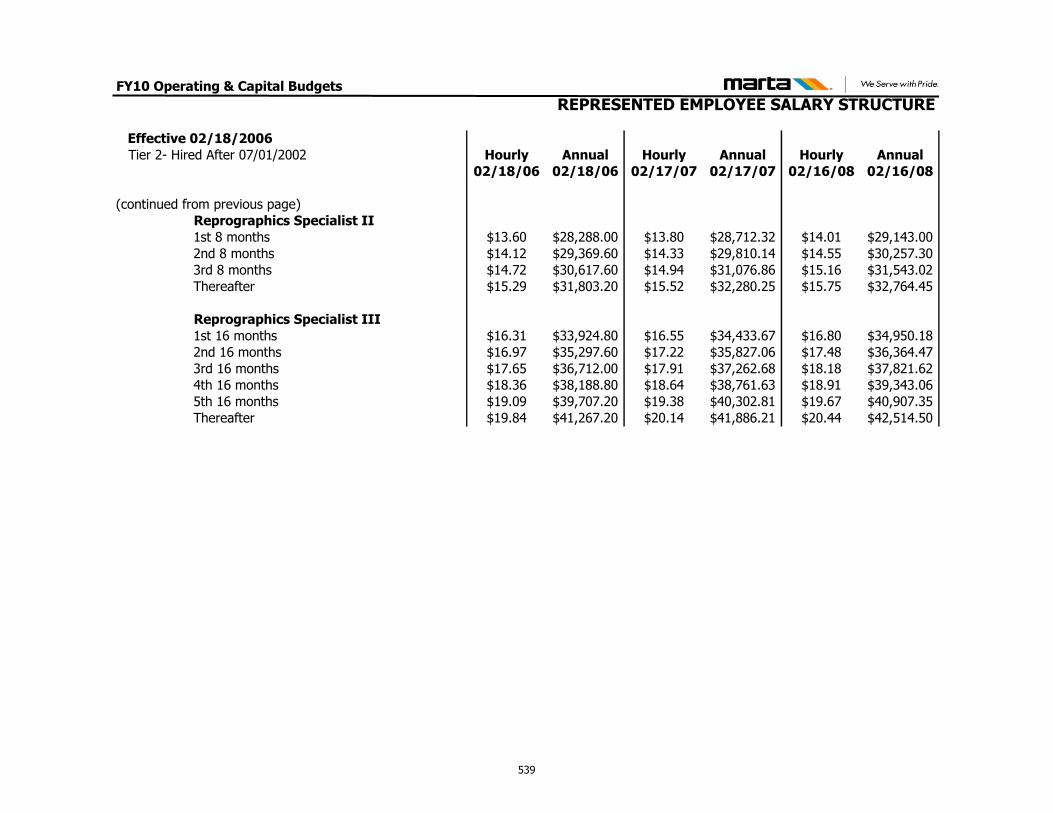
FY10 Operating & Capital Budgets
REPRESENTED EMPLOYEE SALARY STRUCTURE
Effective 02/18/2006
Tier 2- Hired After 07/01/2002 Hourly Annual Hourly Annual Hourly Annual
02/18/06 02/18/06 02/17/07 02/17/07 02/16/08 02/16/08
(continued from previous page)
Reprographics Specialist II
1st 8 months $13.60 $28,288.00 $13.80 $28,712.32 $14.01 $29,143.00
2nd 8 months $14.12 $29,369.60 $14.33 $29,810.14 $14.55 $30,257.30
3rd 8 months $14.72 $30,617.60 $14.94 $31,076.86 $15.16 $31,543.02
Thereafter $15.29 $31,803.20 $15.52 $32,280.25 $15.75 $32,764.45
Reprographics Specialist III
1st 16 months $16.31 $33,924.80 $16.55 $34,433.67 $16.80 $34,950.18
2nd 16 months $16.97 $35,297.60 $17.22 $35,827.06 $17.48 $36,364.47
3rd 16 months $17.65 $36,712.00 $17.91 $37,262.68 $18.18 $37,821.62
4th 16 months $18.36 $38,188.80 $18.64 $38,761.63 $18.91 $39,343.06
5th 16 months $19.09 $39,707.20 $19.38 $40,302.81 $19.67 $40,907.35
Thereafter $19.84 $41,267.20 $20.14 $41,886.21 $20.44 $42,514.50
539
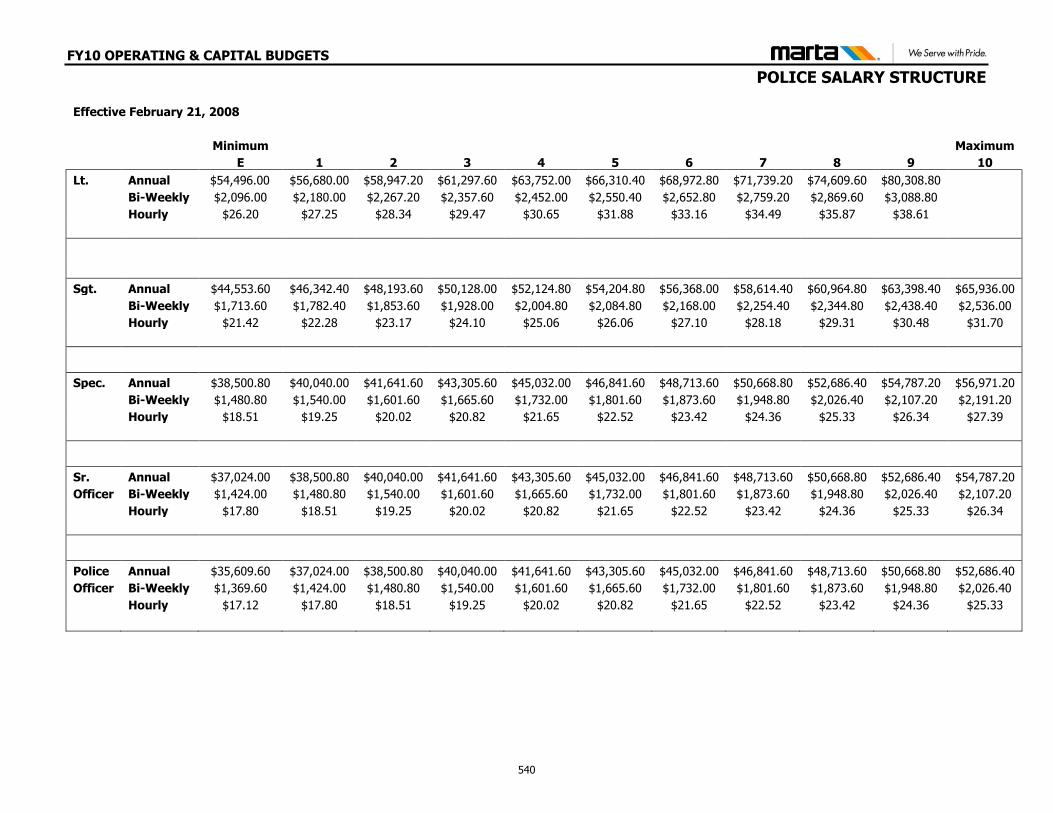
FY10 OPERATING & CAPITAL BUDGETS
POLICE SALARY STRUCTURE
Effective February 21, 2008
Minimum
Maximum
E 1 2 3 4 5 6 7 8 9 10
Lt. Annual $54,496.00 $56,680.00 $58,947.20 $61,297.60 $63,752.00 $66,310.40 $68,972.80 $71,739.20 $74,609.60 $80,308.80
Bi-Weekly $2,096.00 $2,180.00 $2,267.20 $2,357.60 $2,452.00 $2,550.40 $2,652.80 $2,759.20 $2,869.60 $3,088.80
Hourly $26.20 $27.25 $28.34 $29.47 $30.65 $31.88 $33.16 $34.49 $35.87 $38.61
Sgt. Annual $44,553.60 $46,342.40 $48,193.60 $50,128.00 $52,124.80 $54,204.80 $56,368.00 $58,614.40 $60,964.80 $63,398.40 $65,936.00
Bi-Weekly $1,713.60 $1,782.40 $1,853.60 $1,928.00 $2,004.80 $2,084.80 $2,168.00 $2,254.40 $2,344.80 $2,438.40 $2,536.00
Hourly $21.42 $22.28 $23.17 $24.10 $25.06 $26.06 $27.10 $28.18 $29.31 $30.48 $31.70
Spec. Annual $38,500.80 $40,040.00 $41,641.60 $43,305.60 $45,032.00 $46,841.60 $48,713.60 $50,668.80 $52,686.40 $54,787.20 $56,971.20
Bi-Weekly $1,480.80 $1,540.00 $1,601.60 $1,665.60 $1,732.00 $1,801.60 $1,873.60 $1,948.80 $2,026.40 $2,107.20 $2,191.20
Hourly $18.51 $19.25 $20.02 $20.82 $21.65 $22.52 $23.42 $24.36 $25.33 $26.34 $27.39
Sr. Annual $37,024.00 $38,500.80 $40,040.00 $41,641.60 $43,305.60 $45,032.00 $46,841.60 $48,713.60 $50,668.80 $52,686.40 $54,787.20
Officer Bi-Weekly $1,424.00 $1,480.80 $1,540.00 $1,601.60 $1,665.60 $1,732.00 $1,801.60 $1,873.60 $1,948.80 $2,026.40 $2,107.20
Hourly $17.80 $18.51 $19.25 $20.02 $20.82 $21.65 $22.52 $23.42 $24.36 $25.33 $26.34
Police Annual $35,609.60 $37,024.00 $38,500.80 $40,040.00 $41,641.60 $43,305.60 $45,032.00 $46,841.60 $48,713.60 $50,668.80 $52,686.40
Officer Bi-Weekly $1,369.60 $1,424.00 $1,480.80 $1,540.00 $1,601.60 $1,665.60 $1,732.00 $1,801.60 $1,873.60 $1,948.80 $2,026.40
Hourly $17.12 $17.80 $18.51 $19.25 $20.02 $20.82 $21.65 $22.52 $23.42 $24.36 $25.33
540
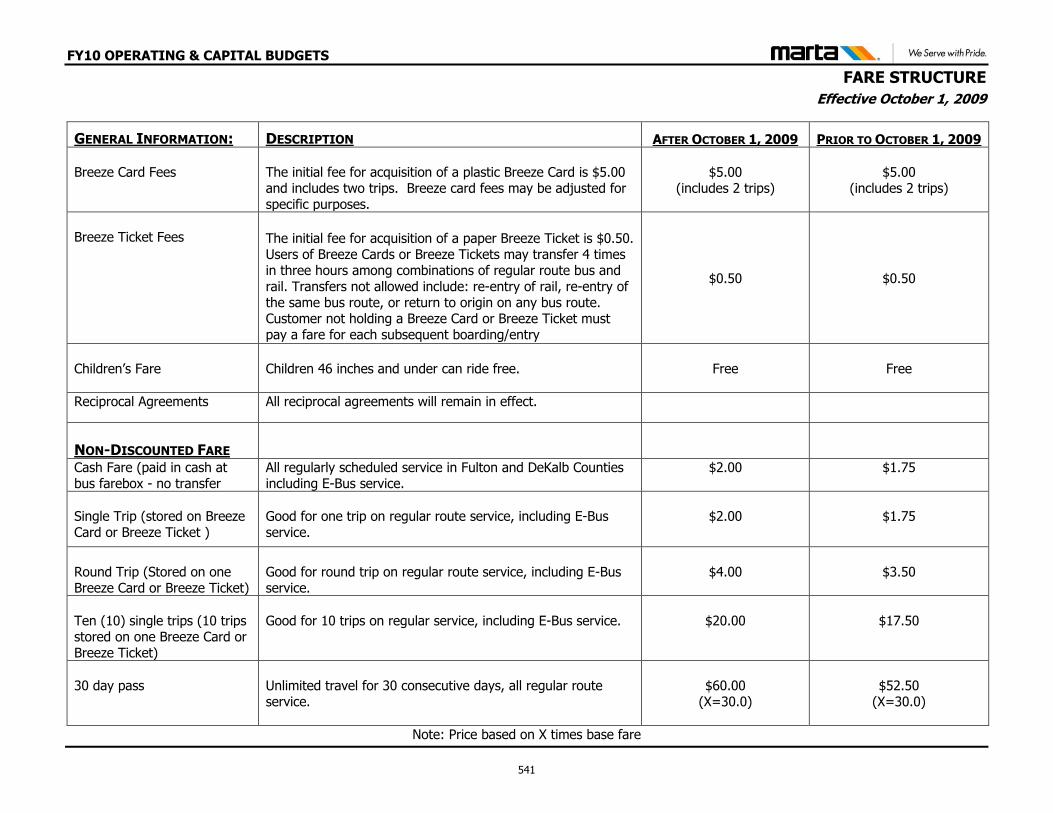
FY10 OPERATING & CAPITAL BUDGETS
FARE STRUCTURE
Effective October 1, 2009
GENERAL INFORMATION: DESCRIPTION AFTER OCTOBER 1, 2009 PRIOR TO OCTOBER 1, 2009
Breeze Card Fees
The initial fee for acquisition of a plastic Breeze Card is $5.00 and includes two trips. Breeze card fees may be adjusted for specific purposes.
$5.00 (includes 2 trips)
$5.00 (includes 2 trips)
Breeze Ticket Fees
The initial fee for acquisition of a paper Breeze Ticket is $0.50. Users of Breeze Cards or Breeze Tickets may transfer 4 times in three hours among combinations of regular route bus and rail. Transfers not allowed include: re-entry of rail, re-entry of the same bus route, or return to origin on any bus route. Customer not holding a Breeze Card or Breeze Ticket must pay a fare for each subsequent boarding/entry
$0.50
$0.50
Children’s Fare
Children 46 inches and under can ride free. Free Free
Reciprocal Agreements All reciprocal agreements will remain in effect.
NON-DISCOUNTED FARE
Cash Fare (paid in cash at bus farebox - no transfer
All regularly scheduled service in Fulton and DeKalb Counties including E-Bus service.
$2.00 $1.75
Single Trip (stored on Breeze Card or Breeze Ticket )
Good for one trip on regular route service, including E-Bus service.
$2.00
$1.75
Round Trip (Stored on one Breeze Card or Breeze Ticket)
Good for round trip on regular route service, including E-Bus service.
$4.00
$3.50
Ten (10) single trips (10 trips stored on one Breeze Card or Breeze Ticket)
Good for 10 trips on regular service, including E-Bus service.
$20.00
$17.50
30 day pass
Unlimited travel for 30 consecutive days, all regular route service.
$60.00
(X=30.0)
$52.50
(X=30.0)
Note: Price based on X times base fare
541
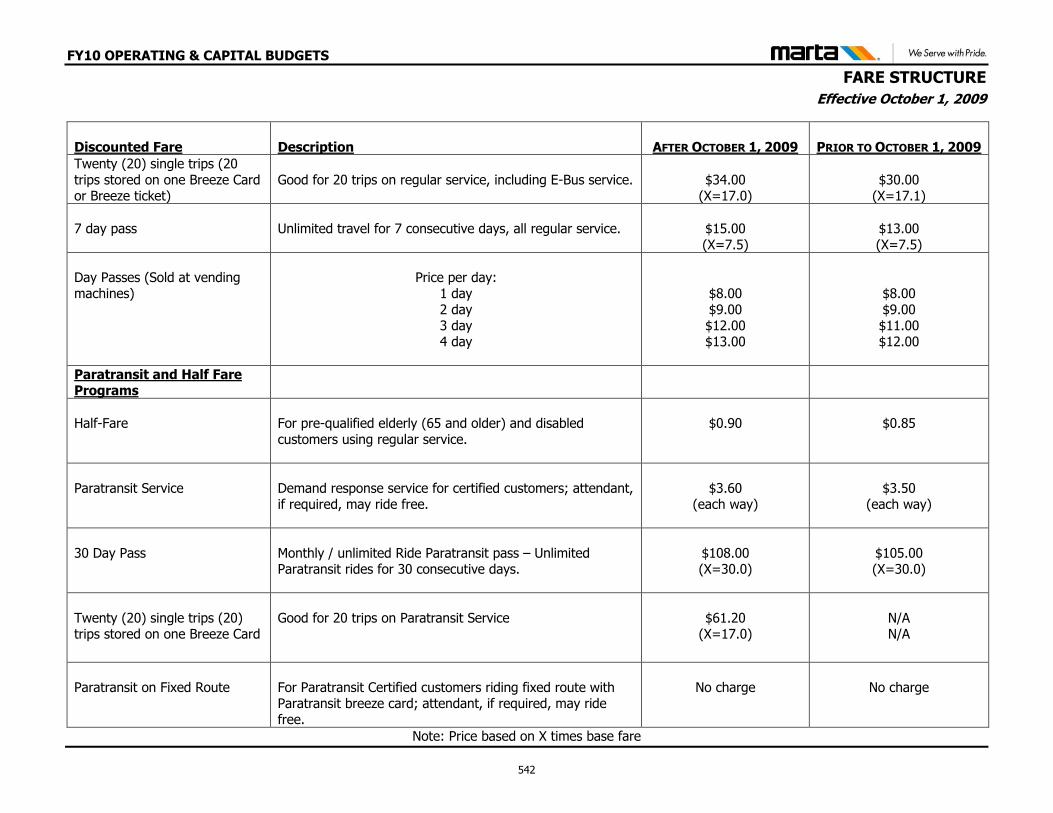
FY10 OPERATING & CAPITAL BUDGETS
FARE STRUCTURE
Effective October 1, 2009
Discounted Fare
Description AFTER OCTOBER 1, 2009 PRIOR TO OCTOBER 1, 2009
Twenty (20) single trips (20 trips stored on one Breeze Card or Breeze ticket)
Good for 20 trips on regular service, including E-Bus service.
$34.00
(X=17.0)
$30.00
(X=17.1)
7 day pass
Unlimited travel for 7 consecutive days, all regular service.
$15.00 (X=7.5)
$13.00 (X=7.5)
Day Passes (Sold at vending machines)
Price per day:
1 day 2 day 3 day 4 day
$8.00 $9.00 $12.00 $13.00
$8.00 $9.00 $11.00 $12.00
Paratransit and Half Fare Programs
Half-Fare
For pre-qualified elderly (65 and older) and disabled customers using regular service.
$0.90
$0.85
Paratransit Service
Demand response service for certified customers; attendant, if required, may ride free.
$3.60 (each way)
$3.50 (each way)
30 Day Pass
Monthly / unlimited Ride Paratransit pass – Unlimited Paratransit rides for 30 consecutive days.
$108.00 (X=30.0)
$105.00 (X=30.0)
Twenty (20) single trips (20) trips stored on one Breeze Card
Good for 20 trips on Paratransit Service
$61.20
(X=17.0)
N/A N/A
Paratransit on Fixed Route
For Paratransit Certified customers riding fixed route with Paratransit breeze card; attendant, if required, may ride free.
No charge
No charge
Note: Price based on X times base fare
542
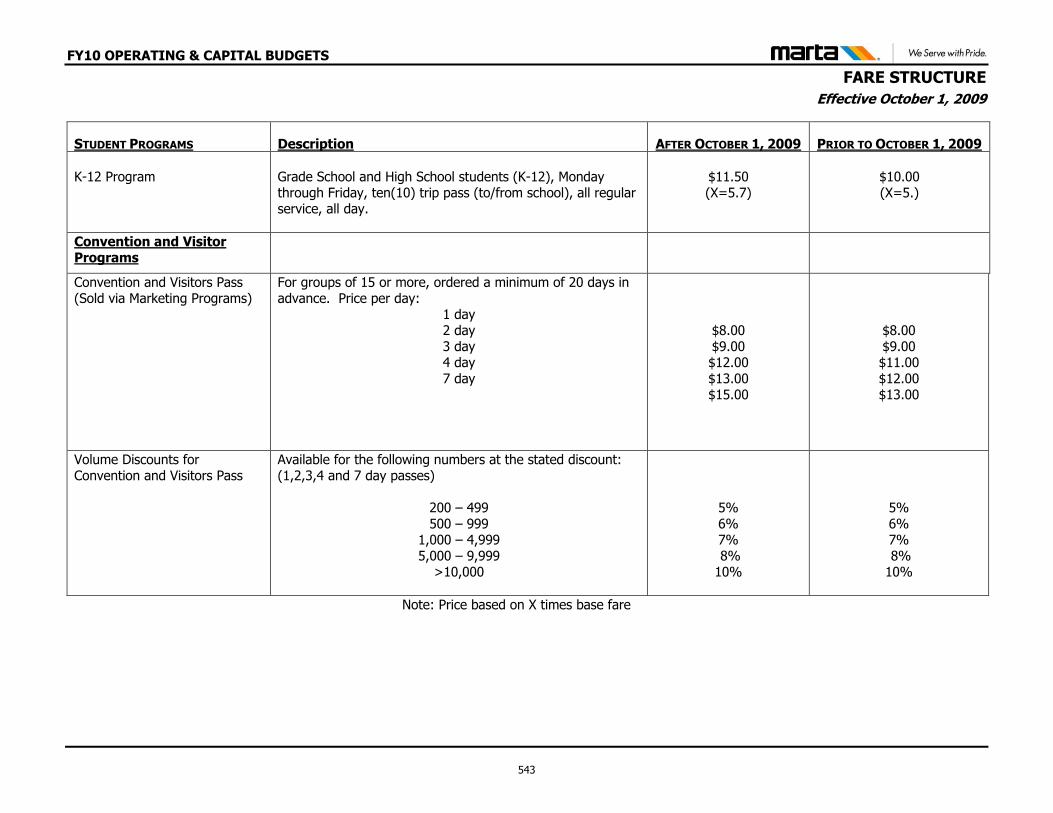
FY10 OPERATING & CAPITAL BUDGETS
FARE STRUCTURE
Effective October 1, 2009
STUDENT PROGRAMS Description AFTER OCTOBER 1, 2009 PRIOR TO OCTOBER 1, 2009
K-12 Program
Grade School and High School students (K-12), Monday through Friday, ten(10) trip pass (to/from school), all regular service, all day.
$11.50 (X=5.7)
$10.00 (X=5.)
Convention and Visitor Programs
Convention and Visitors Pass (Sold via Marketing Programs)
For groups of 15 or more, ordered a minimum of 20 days in advance. Price per day:
1 day 2 day 3 day 4 day 7 day
$8.00 $9.00 $12.00 $13.00 $15.00
$8.00 $9.00 $11.00 $12.00 $13.00
Volume Discounts for Convention and Visitors Pass
Available for the following numbers at the stated discount: (1,2,3,4 and 7 day passes)
200 – 499 500 – 999
1,000 – 4,999 5,000 – 9,999
>10,000
5% 6% 7% 8% 10%
5% 6% 7% 8% 10%
Note: Price based on X times base fare
543
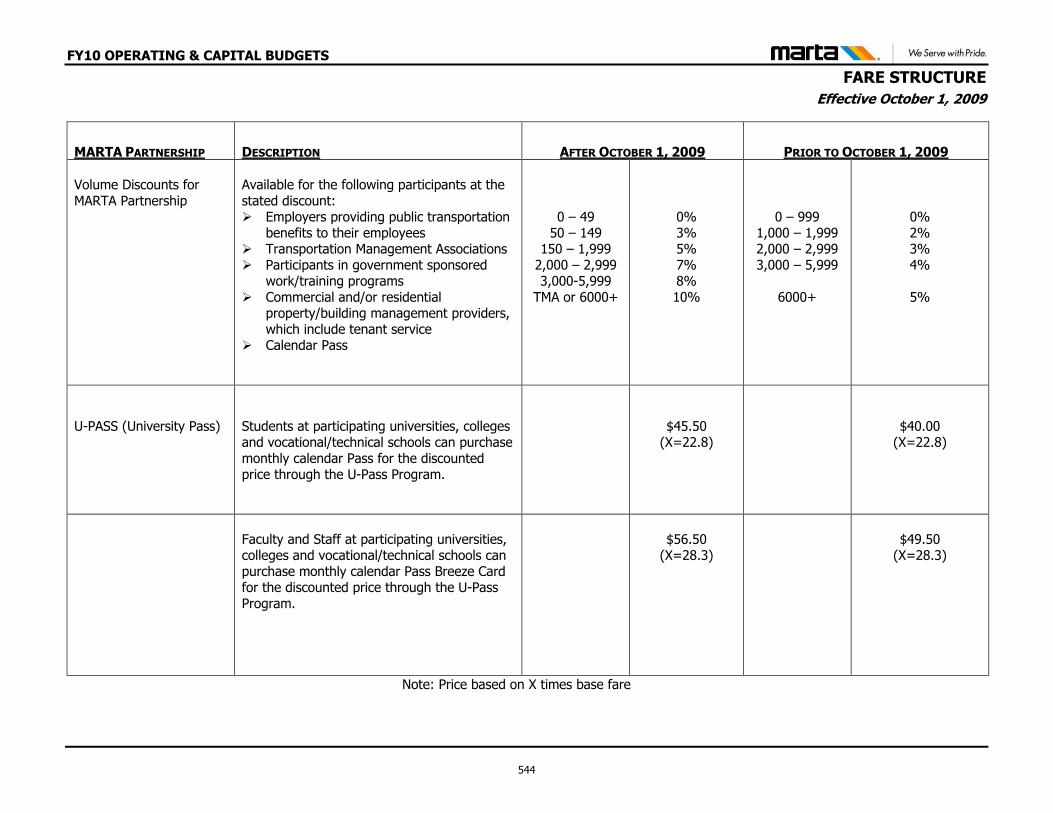
FY10 OPERATING & CAPITAL BUDGETS
FARE STRUCTURE
Effective October 1, 2009
MARTA PARTNERSHIP DESCRIPTION AFTER OCTOBER 1, 2009 PRIOR TO OCTOBER 1, 2009
Volume Discounts for MARTA Partnership
Available for the following participants at the stated discount: Employers providing public transportation
benefits to their employees Transportation Management Associations Participants in government sponsored
work/training programs Commercial and/or residential
property/building management providers, which include tenant service
Calendar Pass
0 – 49 50 – 149
150 – 1,999 2,000 – 2,999 3,000-5,999
TMA or 6000+
0% 3% 5% 7% 8% 10%
0 – 999 1,000 – 1,999 2,000 – 2,999 3,000 – 5,999
6000+
0% 2% 3% 4%
5%
U-PASS (University Pass)
Students at participating universities, colleges and vocational/technical schools can purchase monthly calendar Pass for the discounted price through the U-Pass Program.
$45.50 (X=22.8)
$40.00 (X=22.8)
Faculty and Staff at participating universities, colleges and vocational/technical schools can purchase monthly calendar Pass Breeze Card for the discounted price through the U-Pass Program.
$56.50
(X=28.3)
$49.50
(X=28.3)
Note: Price based on X times base fare
544
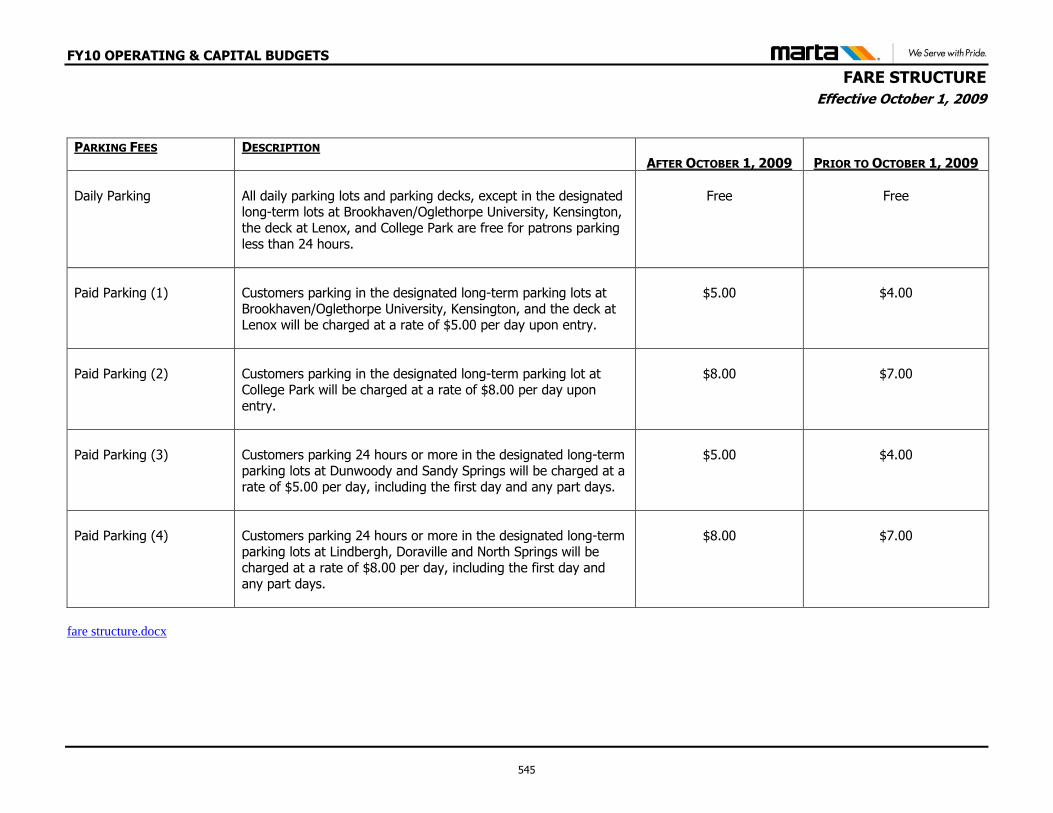
FY10 OPERATING & CAPITAL BUDGETS
FARE STRUCTURE
Effective October 1, 2009
PARKING FEES
DESCRIPTION AFTER OCTOBER 1, 2009 PRIOR TO OCTOBER 1, 2009
Daily Parking
All daily parking lots and parking decks, except in the designated long-term lots at Brookhaven/Oglethorpe University, Kensington, the deck at Lenox, and College Park are free for patrons parking less than 24 hours.
Free
Free
Paid Parking (1)
Customers parking in the designated long-term parking lots at Brookhaven/Oglethorpe University, Kensington, and the deck at Lenox will be charged at a rate of $5.00 per day upon entry.
$5.00
$4.00
Paid Parking (2)
Customers parking in the designated long-term parking lot at College Park will be charged at a rate of $8.00 per day upon entry.
$8.00
$7.00
Paid Parking (3)
Customers parking 24 hours or more in the designated long-term parking lots at Dunwoody and Sandy Springs will be charged at a rate of $5.00 per day, including the first day and any part days.
$5.00
$4.00
Paid Parking (4)
Customers parking 24 hours or more in the designated long-term parking lots at Lindbergh, Doraville and North Springs will be charged at a rate of $8.00 per day, including the first day and any part days.
$8.00
$7.00
fare structure.docx
545
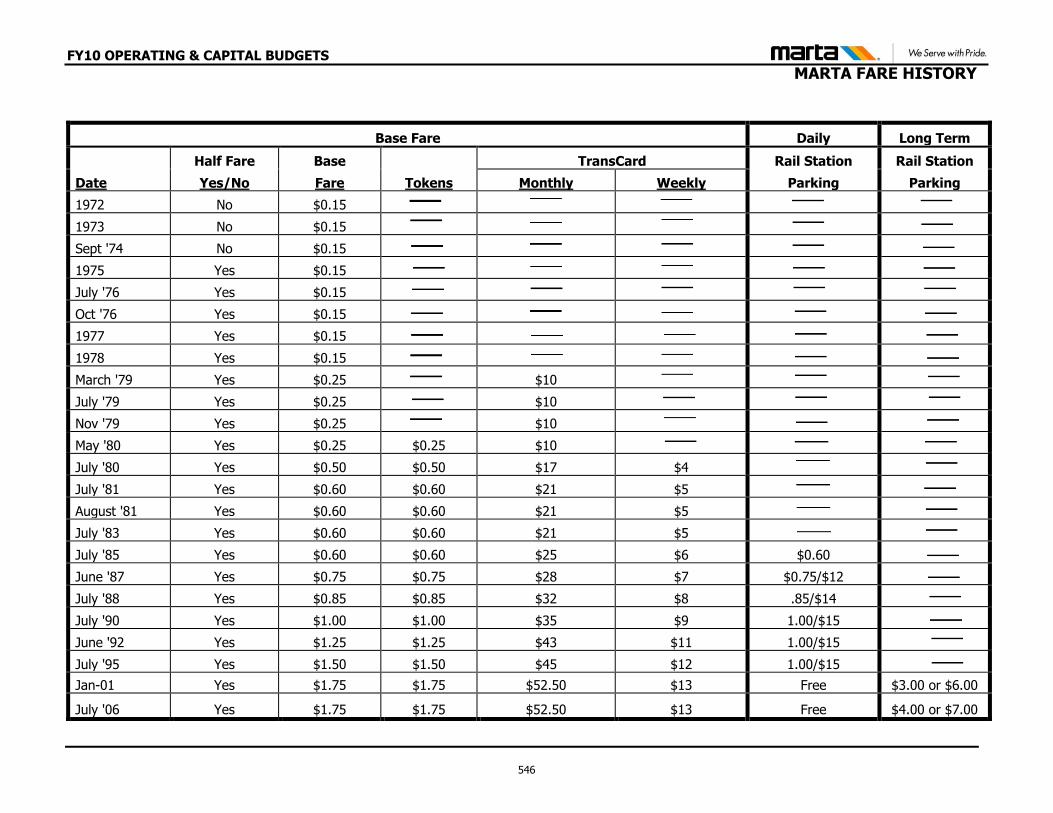
FY10 OPERATING & CAPITAL BUDGETS
MARTA FARE HISTORY
Base Fare Daily Long Term
Half Fare Base
TransCard Rail Station Rail Station
Date Yes/No Fare Tokens Monthly Weekly Parking Parking
1972 No $0.15
1973 No $0.15
Sept '74 No $0.15
1975 Yes $0.15
July '76 Yes $0.15
Oct '76 Yes $0.15
1977 Yes $0.15
1978 Yes $0.15
March '79 Yes $0.25
$10
July '79 Yes $0.25
$10
Nov '79 Yes $0.25
$10
May '80 Yes $0.25 $0.25 $10
July '80 Yes $0.50 $0.50 $17 $4
July '81 Yes $0.60 $0.60 $21 $5
August '81 Yes $0.60 $0.60 $21 $5
July '83 Yes $0.60 $0.60 $21 $5
July '85 Yes $0.60 $0.60 $25 $6 $0.60
June '87 Yes $0.75 $0.75 $28 $7 $0.75/$12
July '88 Yes $0.85 $0.85 $32 $8 .85/$14
July '90 Yes $1.00 $1.00 $35 $9 1.00/$15
June '92 Yes $1.25 $1.25 $43 $11 1.00/$15
July '95 Yes $1.50 $1.50 $45 $12 1.00/$15
Jan-01 Yes $1.75 $1.75 $52.50 $13 Free $3.00 or $6.00
July '06 Yes $1.75 $1.75 $52.50 $13 Free $4.00 or $7.00
546
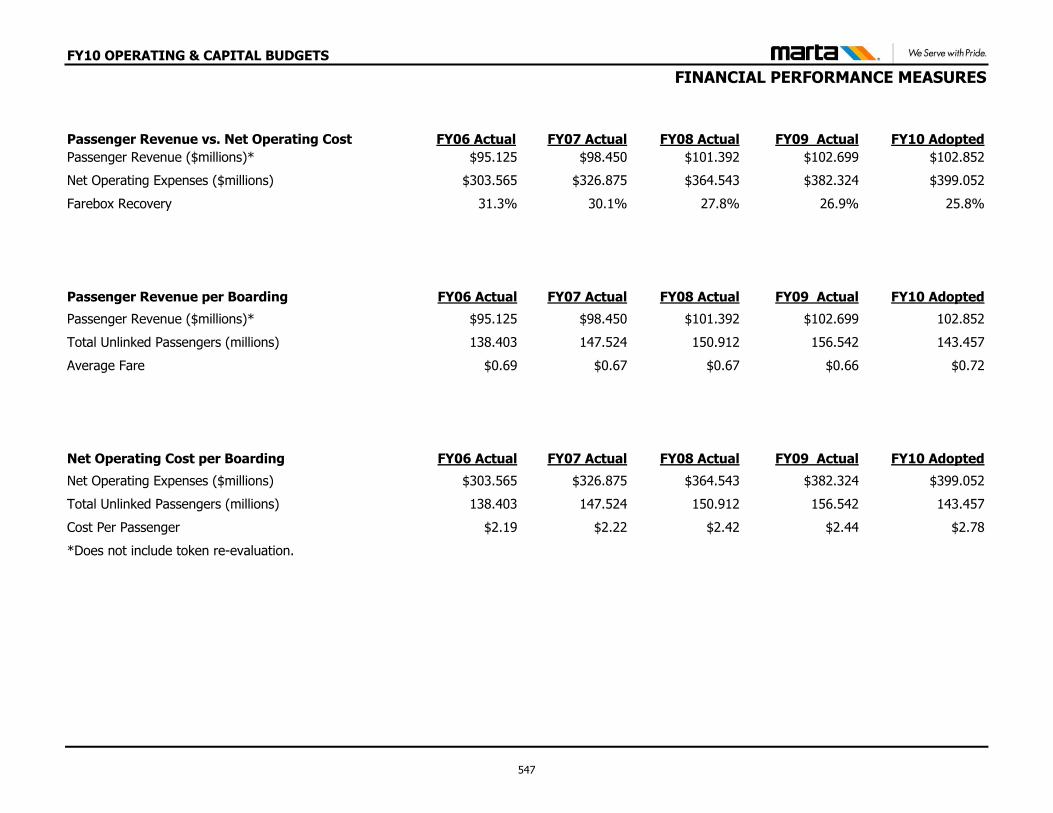
FY10 OPERATING & CAPITAL BUDGETS
FINANCIAL PERFORMANCE MEASURES
*Does not include token re-evaluation.
Passenger Revenue vs. Net Operating Cost FY06 Actual FY07 Actual FY08 Actual FY09 Actual FY10 Adopted
Passenger Revenue ($millions)* $95.125 $98.450 $101.392 $102.699 $102.852
Net Operating Expenses ($millions) $303.565 $326.875 $364.543 $382.324 $399.052
Farebox Recovery 31.3% 30.1% 27.8% 26.9% 25.8%
Passenger Revenue per Boarding FY06 Actual FY07 Actual FY08 Actual FY09 Actual FY10 Adopted
Passenger Revenue ($millions)* $95.125 $98.450 $101.392 $102.699 102.852
Total Unlinked Passengers (millions) 138.403 147.524 150.912 156.542 143.457
Average Fare $0.69 $0.67 $0.67 $0.66 $0.72
Net Operating Cost per Boarding FY06 Actual FY07 Actual FY08 Actual FY09 Actual FY10 Adopted
Net Operating Expenses ($millions) $303.565 $326.875 $364.543 $382.324 $399.052
Total Unlinked Passengers (millions) 138.403 147.524 150.912 156.542 143.457
Cost Per Passenger $2.19 $2.22 $2.42 $2.44 $2.78
547
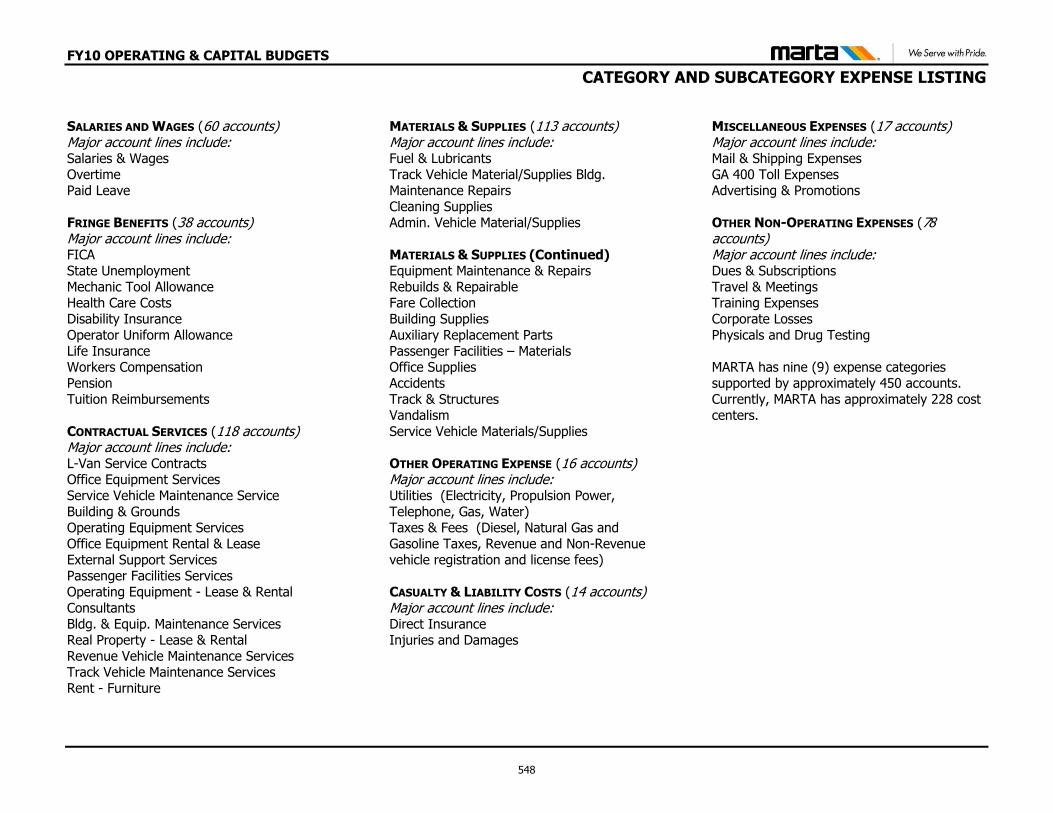
FY10 OPERATING & CAPITAL BUDGETS
CATEGORY AND SUBCATEGORY EXPENSE LISTING
SALARIES AND WAGES (60 accounts) Major account lines include: Salaries & Wages Overtime Paid Leave FRINGE BENEFITS (38 accounts) Major account lines include: FICA State Unemployment Mechanic Tool Allowance Health Care Costs Disability Insurance Operator Uniform Allowance Life Insurance Workers Compensation Pension Tuition Reimbursements CONTRACTUAL SERVICES (118 accounts) Major account lines include: L-Van Service Contracts Office Equipment Services Service Vehicle Maintenance Service Building & Grounds Operating Equipment Services Office Equipment Rental & Lease External Support Services Passenger Facilities Services Operating Equipment - Lease & Rental Consultants Bldg. & Equip. Maintenance Services Real Property - Lease & Rental Revenue Vehicle Maintenance Services Track Vehicle Maintenance Services Rent - Furniture
MATERIALS & SUPPLIES (113 accounts) Major account lines include: Fuel & Lubricants Track Vehicle Material/Supplies Bldg. Maintenance Repairs Cleaning Supplies Admin. Vehicle Material/Supplies MATERIALS & SUPPLIES (Continued) Equipment Maintenance & Repairs Rebuilds & Repairable Fare Collection Building Supplies Auxiliary Replacement Parts Passenger Facilities – Materials Office Supplies Accidents Track & Structures Vandalism Service Vehicle Materials/Supplies OTHER OPERATING EXPENSE (16 accounts) Major account lines include: Utilities (Electricity, Propulsion Power, Telephone, Gas, Water) Taxes & Fees (Diesel, Natural Gas and Gasoline Taxes, Revenue and Non-Revenue vehicle registration and license fees) CASUALTY & LIABILITY COSTS (14 accounts) Major account lines include: Direct Insurance Injuries and Damages
MISCELLANEOUS EXPENSES (17 accounts) Major account lines include: Mail & Shipping Expenses GA 400 Toll Expenses Advertising & Promotions OTHER NON-OPERATING EXPENSES (78 accounts) Major account lines include: Dues & Subscriptions Travel & Meetings Training Expenses Corporate Losses Physicals and Drug Testing MARTA has nine (9) expense categories supported by approximately 450 accounts. Currently, MARTA has approximately 228 cost centers.
548
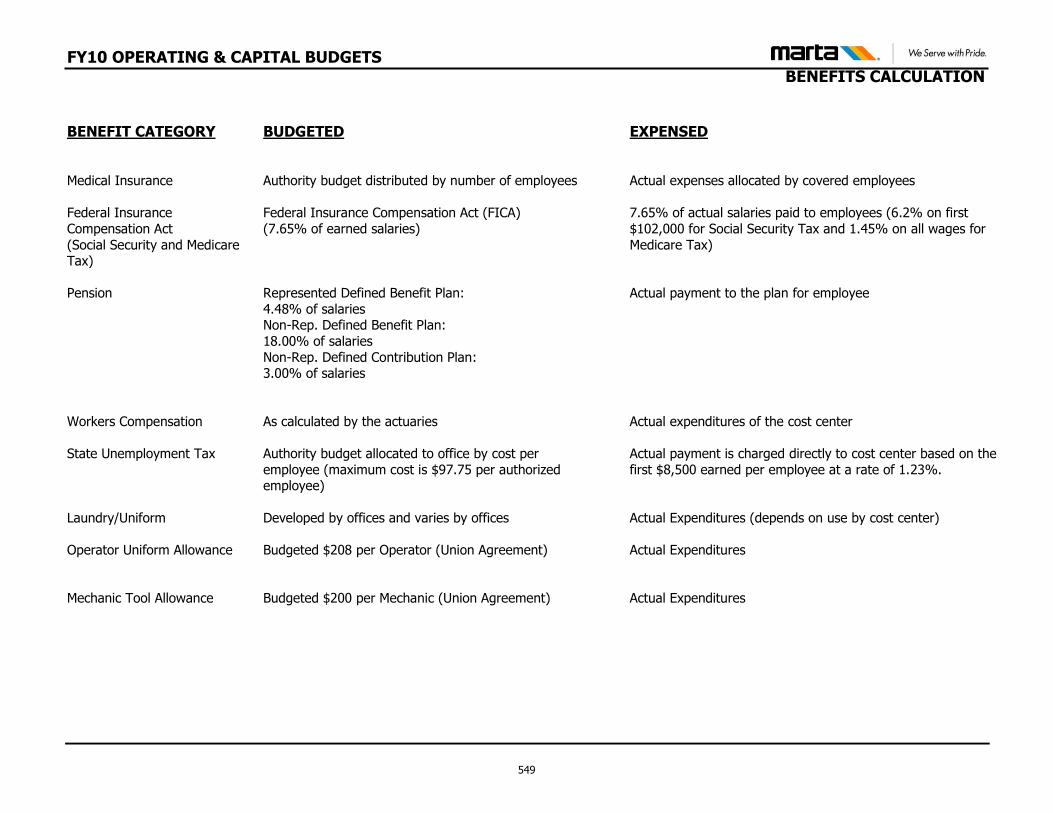
FY10 OPERATING & CAPITAL BUDGETS
BENEFITS CALCULATION
BENEFIT CATEGORY BUDGETED EXPENSED
Medical Insurance Authority budget distributed by number of employees Actual expenses allocated by covered employees
Federal Insurance
Compensation Act
(Social Security and Medicare Tax)
Federal Insurance Compensation Act (FICA)
(7.65% of earned salaries)
7.65% of actual salaries paid to employees (6.2% on first
$102,000 for Social Security Tax and 1.45% on all wages for
Medicare Tax)
Pension
Represented Defined Benefit Plan:
4.48% of salaries Non-Rep. Defined Benefit Plan:
18.00% of salaries
Non-Rep. Defined Contribution Plan: 3.00% of salaries
Actual payment to the plan for employee
Workers Compensation
As calculated by the actuaries
Actual expenditures of the cost center
State Unemployment Tax
Authority budget allocated to office by cost per
employee (maximum cost is $97.75 per authorized employee)
Actual payment is charged directly to cost center based on the
first $8,500 earned per employee at a rate of 1.23%.
Laundry/Uniform
Developed by offices and varies by offices
Actual Expenditures (depends on use by cost center)
Operator Uniform Allowance
Budgeted $208 per Operator (Union Agreement) Actual Expenditures
Mechanic Tool Allowance
Budgeted $200 per Mechanic (Union Agreement)
Actual Expenditures
549
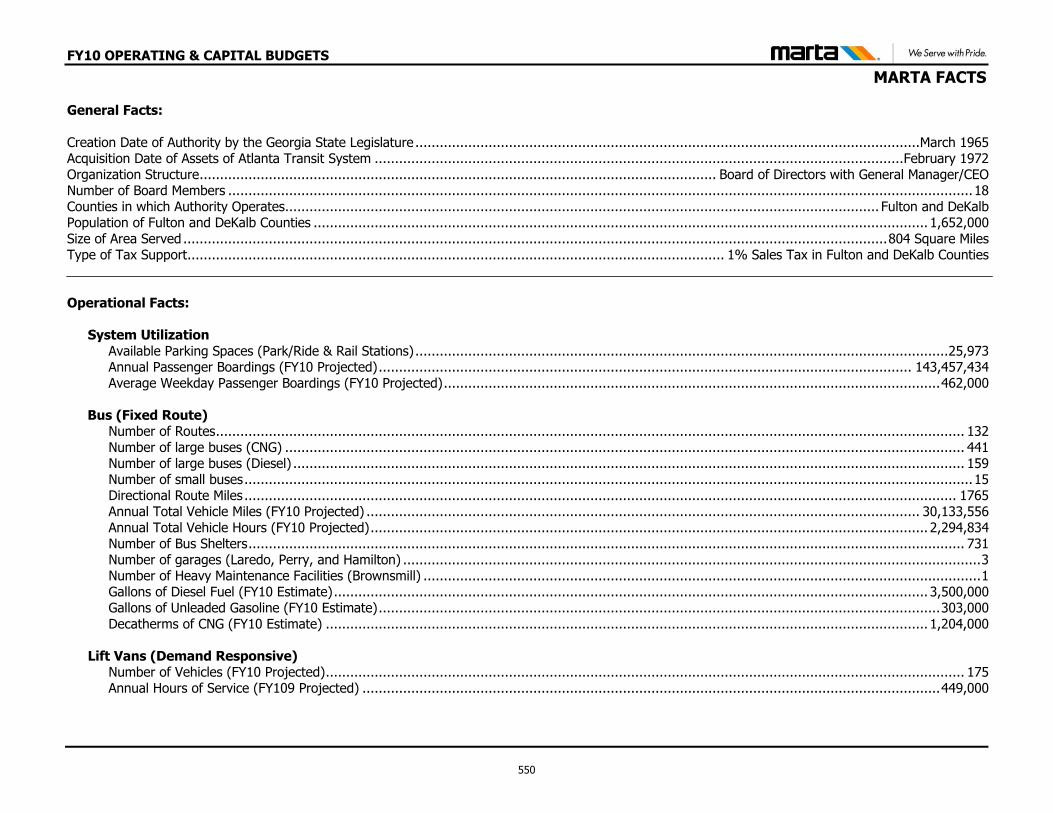
FY10 OPERATING & CAPITAL BUDGETS
MARTA FACTS
General Facts: Creation Date of Authority by the Georgia State Legislature ............................................................................................................................ March 1965 Acquisition Date of Assets of Atlanta Transit System .................................................................................................................................. February 1972 Organization Structure ............................................................................................................................... Board of Directors with General Manager/CEO Number of Board Members ....................................................................................................................................................................................... 18 Counties in which Authority Operates .................................................................................................................................................. Fulton and DeKalb Population of Fulton and DeKalb Counties ....................................................................................................................................................... 1,652,000 Size of Area Served ............................................................................................................................................................................. 804 Square Miles Type of Tax Support .................................................................................................................................... 1% Sales Tax in Fulton and DeKalb Counties Operational Facts:
System Utilization Available Parking Spaces (Park/Ride & Rail Stations) ................................................................................................................................... 25,973 Annual Passenger Boardings (FY10 Projected) ................................................................................................................................... 143,457,434 Average Weekday Passenger Boardings (FY10 Projected) .......................................................................................................................... 462,000 Bus (Fixed Route) Number of Routes ........................................................................................................................................................................................ 132 Number of large buses (CNG) ....................................................................................................................................................................... 441 Number of large buses (Diesel) ..................................................................................................................................................................... 159 Number of small buses ................................................................................................................................................................................... 15 Directional Route Miles ............................................................................................................................................................................... 1765 Annual Total Vehicle Miles (FY10 Projected) ........................................................................................................................................ 30,133,556 Annual Total Vehicle Hours (FY10 Projected) ......................................................................................................................................... 2,294,834 Number of Bus Shelters ................................................................................................................................................................................ 731 Number of garages (Laredo, Perry, and Hamilton) .............................................................................................................................................. 3 Number of Heavy Maintenance Facilities (Brownsmill) ......................................................................................................................................... 1 Gallons of Diesel Fuel (FY10 Estimate) .................................................................................................................................................. 3,500,000 Gallons of Unleaded Gasoline (FY10 Estimate) .......................................................................................................................................... 303,000 Decatherms of CNG (FY10 Estimate) .................................................................................................................................................... 1,204,000 Lift Vans (Demand Responsive) Number of Vehicles (FY10 Projected) ............................................................................................................................................................. 175 Annual Hours of Service (FY109 Projected) .............................................................................................................................................. 449,000
550
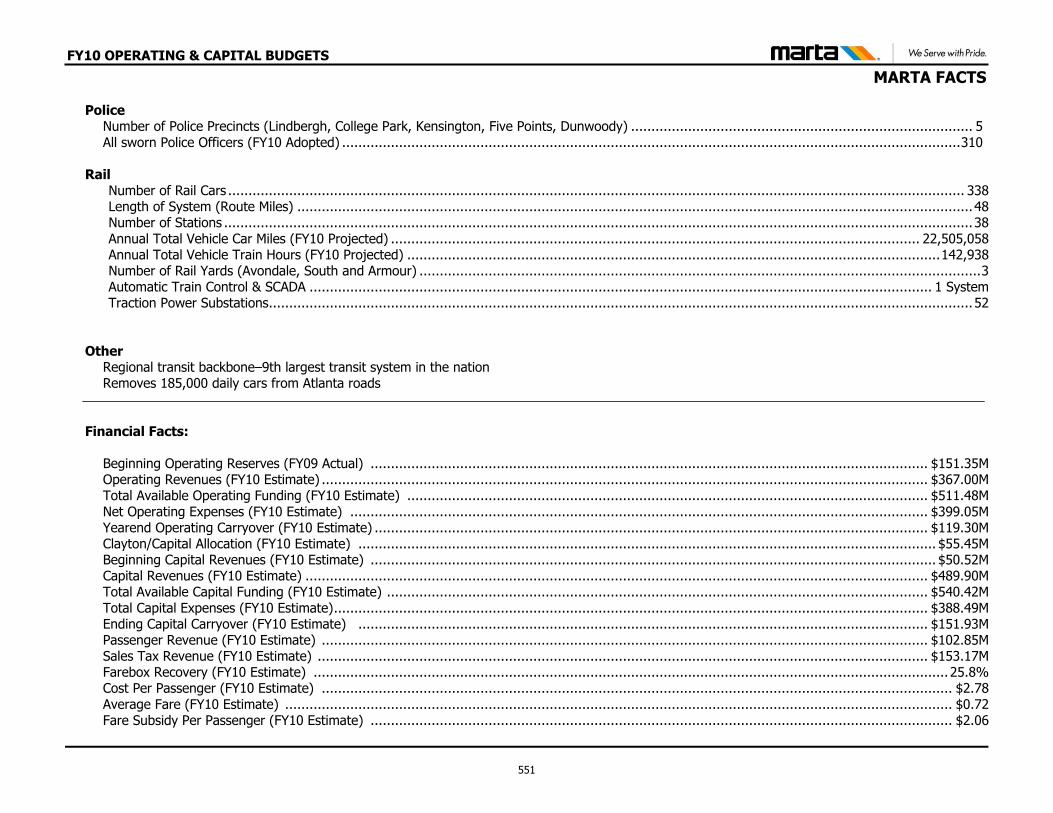
FY10 OPERATING & CAPITAL BUDGETS
MARTA FACTS
Police Number of Police Precincts (Lindbergh, College Park, Kensington, Five Points, Dunwoody) .................................................................................... 5 All sworn Police Officers (FY10 Adopted) ........................................................................................................................................................ 310
Rail
Number of Rail Cars ..................................................................................................................................................................................... 338 Length of System (Route Miles) ...................................................................................................................................................................... 48 Number of Stations ........................................................................................................................................................................................ 38 Annual Total Vehicle Car Miles (FY10 Projected) .................................................................................................................................. 22,505,058 Annual Total Vehicle Train Hours (FY10 Projected) ................................................................................................................................... 142,938 Number of Rail Yards (Avondale, South and Armour) .......................................................................................................................................... 3 Automatic Train Control & SCADA ......................................................................................................................................................... 1 System Traction Power Substations ............................................................................................................................................................................. 52
Other Regional transit backbone–9th largest transit system in the nation Removes 185,000 daily cars from Atlanta roads
Financial Facts:
Beginning Operating Reserves (FY09 Actual) ......................................................................................................................................... $151.35M Operating Revenues (FY10 Estimate) ..................................................................................................................................................... $367.00M Total Available Operating Funding (FY10 Estimate) ................................................................................................................................ $511.48M Net Operating Expenses (FY10 Estimate) .............................................................................................................................................. $399.05M Yearend Operating Carryover (FY10 Estimate) ........................................................................................................................................ $119.30M Clayton/Capital Allocation (FY10 Estimate) .............................................................................................................................................. $55.45M Beginning Capital Revenues (FY10 Estimate) ........................................................................................................................................... $50.52M Capital Revenues (FY10 Estimate) ......................................................................................................................................................... $489.90M Total Available Capital Funding (FY10 Estimate) ..................................................................................................................................... $540.42M Total Capital Expenses (FY10 Estimate) .................................................................................................................................................. $388.49M Ending Capital Carryover (FY10 Estimate) ............................................................................................................................................ $151.93M Passenger Revenue (FY10 Estimate) ..................................................................................................................................................... $102.85M Sales Tax Revenue (FY10 Estimate) ...................................................................................................................................................... $153.17M Farebox Recovery (FY10 Estimate) ............................................................................................................................................................ 25.8% Cost Per Passenger (FY10 Estimate) ........................................................................................................................................................... $2.78 Average Fare (FY10 Estimate) .................................................................................................................................................................... $0.72 Fare Subsidy Per Passenger (FY10 Estimate) ............................................................................................................................................... $2.06
551
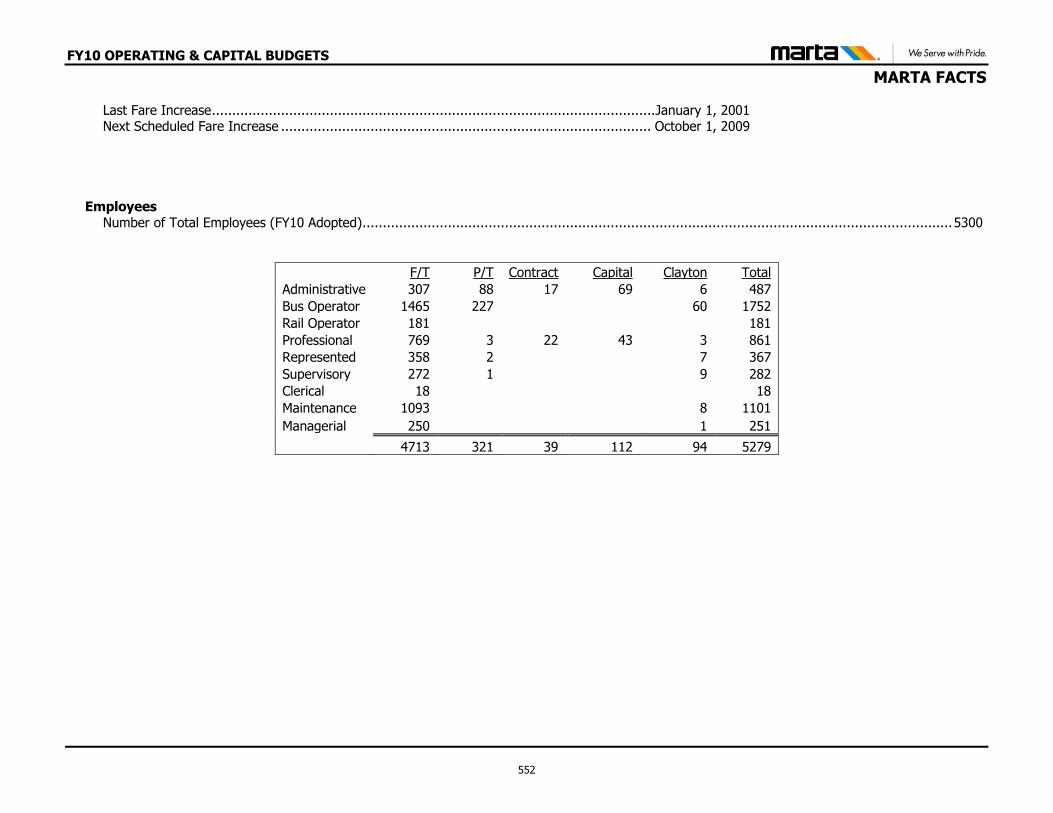
FY10 OPERATING & CAPITAL BUDGETS
MARTA FACTS
Last Fare Increase ............................................................................................................. January 1, 2001 Next Scheduled Fare Increase ........................................................................................... October 1, 2009
Employees
Number of Total Employees (FY10 Adopted) ................................................................................................................................................. 5300
F/T P/T Contract Capital Clayton Total
Administrative 307 88 17 69 6 487
Bus Operator 1465 227
60 1752
Rail Operator 181
181
Professional 769 3 22 43 3 861
Represented 358 2
7 367
Supervisory 272 1
9 282
Clerical 18
18
Maintenance 1093
8 1101
Managerial 250 1 251
4713 321 39 112 94 5279
552
FY10 OPERATING & CAPITAL BUDGETS
GLOSSARY
Accounting Basis - MARTA uses the accounting principles and methods appropriate for a government enterprise fund. Financial statements are prepared on the accrual basis of accounting under which revenues and expenses are recognized when earned or incurred. Americans with Disabilities Act (ADA) – Federal legislation which provides guidelines for assuring access to persons with disabilities. Assistant General Manager (AGM) - MARTA has several AGM’s who are direct reports to the General Manager. Associated Capital Maintenance (ACM) - A Federal Transit Administration capital program that subsidizes the cost of operations through the funding of certain bus and rail maintenance expenses. Atlanta Regional Commission (ARC) -An organization dedicated to improving the quality of life for all citizens of the Atlanta region through professional planning initiatives and the provision of objective information; Board membership currently comprised of 10 counties and 64 municipalities. Balanced Operating Budget - The budget is balanced when expenditures do not exceed the sources of revenue. These sources include sales tax revenue, interest income, funds under Section 5307 of the Federal Transit Act for preventive maintenance of vehicles, system and equipment, and 5% of the Sales tax revenues reserves may be applied to the operations of the transit system. (See Fiscal Policy Guide) Balanced Capital Improvements Budget – A balanced capital improvement budget is created by a Ten-Year Plan as set forth in the MARTA ACT and further restricted by the MARTA Board of Directors that the corresponding year’s debt service be no more than 45% of the corresponding year’s sales tax receipts. Basically, a balanced capital improvement budget is mandatory per MARTA’s policy. (See Fiscal Policy Guide) Bond Proceeds - Additional local capital funds raised, when necessary, by issuance of sales tax revenue bonds in the municipal markets. The proceeds are initially deposited with the Bond Trustee in a Construction Fund as required by the Trust Indenture between MARTA and the
Trustee. MARTA requisitions the funds as needed for the Capital Investment Program. Bus Rapid Transit (BRT) - BTP is a new program where buses have dedicated right-of-way and a limited number of stops. Some routes may utilize the HOV lanes. Business Transformation Program (BTP) - A fully integrated solution which will provide modern, integrated support for MARTA’s Finance, Maintenance, and Human Resources Business Areas. This initiative will not only meet MARTA’s current business and technical requirements but is flexible and scaleable to meet MARTA’s future needs. Integration will be achieved using software from Oracle, MAXIMUS, and Bentley Systems. This will improve MARTA’s core business processes by eliminating manual/non-value added processes, automating computer functionality, and creating safeguards that reduce data errors. The program began initial design in July 2005 and is scheduled to be completed August 2008. Capital Budget - The portion of the budget that provides for the funding of improvements, projects and major equipment purchases. Generally, a capital item is one that has a cost in excess of $300, increases the life or capacity of an asset, and has an economic life in excess of one year. Capital Expenditures - Expenditures which provide for the procurement of capital assets or increase the efficiency, capacity, useful life or economy of an existing asset; generally support the Rail Development Program, Capital Improvement Program, Planning Program and the debt service on revenue bonds. Capital Projects Funds - MARTA uses separate funds for major capital acquisition, construction and Authority’s planning needs that are financed through borrowings or contributions. This principle is in accordance with GAAP. Capital Revenues - Funds available to support the capital budget; sources include 50% of the sales tax, federal grants, state grants, interest income from the investment of capital funds, proceeds from the sale of revenue bonds and limited private sector participation.
553
FY10 OPERATING & CAPITAL BUDGETS
GLOSSARY
Clean Air Act Amendments (CAAA) - Federal legislation that protects and enhances the quality of the nation’s air resources; initiates and accelerates a national research and development program to prevent and control air pollution; provides technical and financial assistance to state and local governments for air pollution control programs; and encourages and assists regional air pollution control programs. Commercial driver's license (CDL) - Bus drivers are required to have a passing score on the written CDL test prior to employment. The practical exam for the completion of the CDL license is conducted as a component of the bus operator certification program. Compressed Natural Gas (CNG) - A fuel used in a clean engine technology. Congestion Mitigation & Air Quality (CMAQ) - This program is a federal program which funds transportation projects that will contribute to meeting the attainment of national ambient air quality standards. Contingency Funds - Operating and Capital funds reserved for unexpected expenditures during the fiscal year which were not addressed in the annual budget. Cost Allocation - The assignment of expenses accounted for in one fund to another fund. For example, certain operating expenses of a division may be charged to a capital grant. Debt Service Funds - MARTA uses separate funds for the Sinking Funds (Debt Service) to accumulate financial resources for the payment of long-term debt principal and interest. This principle is in accordance with GAAP. Enterprise Fund - Accounts for business-like activities that provide goods and/or services to the public and are financed primarily through user charges. Federal Operating Assistance - Revenue received from federal sources to compensate operating expenses.
Federal Transit Administration (FTA) - The agency of the Federal government within the U.S. Department of Transportation that is responsible for providing, administering and monitoring funds to transit agencies. Feeder Service - Bus service which delivers passengers to a rail station from the surrounding geographic area. Fixed Route Bus System - Bus routes that do not vary in schedule or route from day-to-day. General Operating Fund - MARTA uses a General Operating Fund for all operating activities and financial resources with the exception of those accounted for in another fund. This principle is in accordance with GAAP. Grant - Revenue from another governmental body or organization, usually in support of a specific program or function. Half-Fare Program - A MARTA program to subsidize the transit costs of the elderly and handicapped. Eligible participants may apply for an annual pass that allows the payment of a reduced fare. Headway - The time between the arrival of buses or trains on the same route. Intelligent Transportation Systems (ITS) - Advanced electronics and computer systems that increase the efficiency and safety of highway transportation and transit. At MARTA this includes Computer Aided Dispatch and Automated Vehicle Location, Automatic Passenger Counting, Audio and Video Announcement Devices, and the Advanced Traveler Information System. Interest Income on Capital Reserves - Income gained from interest on funds that have been placed in reserve for capital replacement and interest on real estate proceeds to be used to subsidize operations, as authorized by the MARTA Act with Board Approval. Life Cycle Asset Reliability Enhancement (L-CARE) - The L-CARE program directs preventive and predictive actions to be performed before failures occur in order to maintain the rail cars in a safe and reliable condition.
554
FY10 OPERATING & CAPITAL BUDGETS
GLOSSARY
Lift-Van (L-Van) Service - Demand responsive paratransit service that provides service upon scheduled request to serve the handicapped. The vehicles are equipped with a mechanism to lift wheel chairs. Linked Trip - A trip from point of origin to the final destination, regardless of how many modes or vehicles were used. MARTA Act - The legislation initially passed by the Georgia Legislature on March 10, 1965, which created and enabled the Metropolitan Atlanta Rapid Transit Authority. Mean Distance Between Failures (MDBF) - This is a performance measurement. Obligations - Funds that have been obligated to a specific purpose but have not been expended. Operating Budget - The portion of the budget that provides for the day-to-day operation of the Authority including salaries, benefits, services, materials and other expenses. Paratransit Service - Complementary transportation services for elderly and disabled established in accordance with the Americans with Disabilities Act (ADA). Passenger Revenue - Revenue earned through fares charged directly to passengers for transit services. Peak Period - The period during which the maximum amount of travel occurs. It may be specified as morning (a.m.), afternoon or evening (p.m.) peak. Prior Years Carry-Over - Funds which are available to fund subsequent fiscal years. The unexpended operating revenues provide carry-over funding for the operating budget while unexpended capital revenues fund the capital carry-over.
Revenue Bonds - A bond on which debt service is payable solely from a restricted revenue source. MARTA issues bonds obligating future sales tax revenues. Revenue Passengers - Transit passengers who enter the system through the payment of a fare as distinguished from those who enter via an employee or complimentary pass or transfer. Revenue Service - Transit service for the purpose of generating revenue as distinguished from trips which place vehicles at route beginning or ending points; trips run for maintenance purposes; or trips which carry passengers without charge. SAFETEA-LU - Surface Transportation Reauthorization Act is a federal law passed in 2005 to replace TEA-21 (Transportation Equity Act of 1998). It authorizes highway, highway safety, transit and other transportation programs for five years. The act provides operating and capital funds to MARTA. Sales Tax - A tax levied and collected by the State for the benefit of the Authority. The "MARTA Sales Tax" is a 1% sales and use tax generated in Fulton and DeKalb counties. Section 5309 (Formerly Section 3) - A federal grant authorized under Section 5309 of the Transportation Equity Act for the 21st Century (TEA-21, previously authorized under Section 3 of the Intermodal Surface Transportation Efficiency Act). These grants generally provide capital funds for acquisition of new rolling stock, new construction and rail modernization. Section 5307 (Formerly Section 9) - A federal grant authorized under Section 5307 of the Transportation Equity Act for the 21st Century (TEA-21, previously authorized under Section 9 of the Intermodal Surface Transportation Efficiency Act). These grants generally provide funds for routine capital replacement, planning and operating assistance programs. Senior Staff - MARTA management team at Director level and above.
555
FY10 OPERATING & CAPITAL BUDGETS
GLOSSARY
Trackway renovations, phase II (TRII) - A large multi-year program consisting of several individual projects to renovate the trackway. Transit Oriented Development (TOD) - MARTA has several TOD projects that are designed to increase ridership and advance the use of public transportation by promoting economic development activities in and around MARTA rail stations. Transit Operations - Those Authority functions directly or indirectly related to the provision of transportation service. Unlinked Trip - A passenger count based on each portion, or leg, of a transit trip. For example, a passenger journey that begins by bus, transfers to rail and then transfers to bus again before leaving the system counts as three unlinked trips.
556

INDEX
FY10 OPERATING & CAPITAL BUDGETS
INDEX
Accounting, Office of ................................................. 289
Administrative Services, Office of .................................. 322 AGM of Bus Operations ,Office of ............................... 185 AGM of Communications and External Affairs ,Office of ...... 129 AGM of Contract & Procurement ,Office of ...................... 313 AGM of Infrastructure ,Office of ..................................... 235 AGM of Finance, Office of ............................................ 285 AGM of Human Resources, Office of .............................. 330 AGM of Internal Audit, Office of ......................................89 AGM of Legal Services, Office of ......................................99 AGM of Planning Office of ............................................ 109 AGM of Police Office of ................................................ 259 AGM of Rail Operations Office of ................................... 205 AGM of Technology Office of ........................................ 369 Architecture and Design Office of .................................. 243 Authority
Chart of Expenses by Category ...................................... 54 Graph of Expenses by Fiscal Year ................................. 55 Graph of Personnel by Class ......................................... 73 Graph of Personnel by Status ....................................... 72 Graph of Total Authority Personnel ............................... 74 Organization Chart ........................................................ 62 Summary of Category Expenses ..................................... 45 Summary of Expenses by Organization ........................... 56 Summary of Personnel .................................................. 63
Board of Directors, Office of ..........................................83 Business Analysis and Assessment, Office of ..................... 273 Bus Maintenance, Office of ............................................ 194 Bus Transportation, Office of.......................................... 189
Capital Budget
Approved Projects Detail .............................................. 426 Approved Projects Ten-year Forecast ............................ 416 Capital Budget Overview .............................................. 389 Capital Improvement Program ..................................... 394 Federal Grant .............................................................. 498 Planning Program ........................................................ 407 Source and Applications of Funds ................................. 411
Chief of Business Support Services, Office of ..................... 269 Clayton County Transit Office of ..................................... 199 Communications and Customer Information, Office of ........ 228
Contracts & Procurement & Material, Office of ................... 317 Customer Services, Office of .......................................... 148 DEO ,Office of ............................................................ 365 Department of Bus Operations ......................................... 183 Department of Chief of Business Support Services ............. 267 Department of Communications and External Affairs .......... 127 Department of Contracts & Procurement .......................... 311 Department of the Deputy General Manager/COO ............. 161 Department of Finance .................................................... 283 Department of General Manager/ CEO ................................ 77 Department of Human Resources ..................................... 328 Department of Infrastructure ........................................... 233 Department of Internal Audit ............................................. 87 Department of Legal Services ............................................. 97 Department of Planning ................................................... 107 Department of Police Services .......................................... 257 Department of Rail Operations ......................................... 203 Department of Technology ............................................... 367
557
FY10 OPERATING & CAPITAL BUDGETS
INDEX
Directory of Officials ............................................................. i Division of Chief of Business Support Services .................... 265 Division of General Manager/CEO ....................................... 75 Division of Operations ...................................................... 159
Employee Availability, Office of ...................................... 356 Engineering, Office of ................................................... 239 Executive Management Listing ......................................... iii Expenditure Policies .......................................................... 30 External Affairs, Office of ............................................... 133
Facilities , Office of ..................................................... 247 Fare Structure .................................................................. 541
Federal and State Programs, Office of .............................. 307 Finance, Department of .................................................. 283 Finance, AGM, Office of ................................................. 285 Financial Performance Measures ................................... 547 Financial Summary
Capital Program Funding ............................................... 49 Financial Overview ........................................................ 36 Financial Overview ........................................................ 36 Financial and Budgetary Policies .................................... 23 Fiscal Policy Guide ........................................................ 15 Fiscal Year Budget Development .................................... 20 Operating Budget Expenditures ..................................... 53 Sources and Uses of Funds ............................................ 39
Strategic Planning Process at MARTA ............................. 15 Transit Subsidy – Table 6 .............................................. 47
FY10 Benefits Calculation .................................................. 579
General Manager/CEO, Department of ..............................77
General Manager/CEO, Office of .......................................79 GFOA Award ........................................................ Preface Glossary of Terms ...................................................... 553
Government & Constituent Relations, Office of .................. 143
Guide to Book Contents ................................................. vi Human Resource, Office of ......................................... 330 History and Overview .................................................. 1 Index ..................................................................... 557
Internal Audit, Department of ......................................... 87
Information System Audit, Office of ............................... 93
Labor Relations, Office of ............................................ 344
Legal Services, Department of ........................................... 97
Legal, AGM, Office of ..................................................... 99 Letter from the General Manager/CEO ......................... Preface
Maintenance of Way Office of ...................................... 223
Management & Budget, Office of .................................... 293 Marketing & Sales, Office of .......................................... 137 MARTA Facts ................................................................... 550 Media Relations, Office of ............................................. 154 Mobility Services, Office of .......................................... 167
Operations, Division of ................................................ 159 Operating Budget Expenditures ...................................... 53
Planning Program ................................................... 407 Police Services, Department of ........................................ 257 Police Services, AGM, Office of ....................................... 259 Program & Contracts Management, Office of .................... 252
Quality Assurance & Configuration Mgmt. Department of ...... 177
558
FY10 OPERATING & CAPITAL BUDGETS
INDEX
Rail Maintenance, Office of .......................................... 218 Rail Services, Office of .................................................. 213 Rail System Engineering, Office of ................................... 209 Regional Svc. Coordination & Special Projects, Office of ....... 122 Research & Analysis, Office of ........................................ 277 Revenue Operations, Office of ........................................ 297 Risk Management, Office of ........................................... 103 Safety, Office of ......................................................... 172 Salary Structure for all Employees ..................................... 523 Sources of Applications of Funds ....................................... 411 Senior Management Listing .................................................. iv Strategic Business Plan ........................................................ 9 System Map .............................................................. 560
Technology Enterprise Applications, Office of ................ 378
Technology Infrastructure & Operations, Office of .............. 373 Technology Programs Management, Office of ................... 383 Training, Office of ....................................................... 348 Transit Oriented Development Office of .......................... 113 Transit System Planning, Office of .................................. 117
Treasury Services, Office of ........................................... 303
559
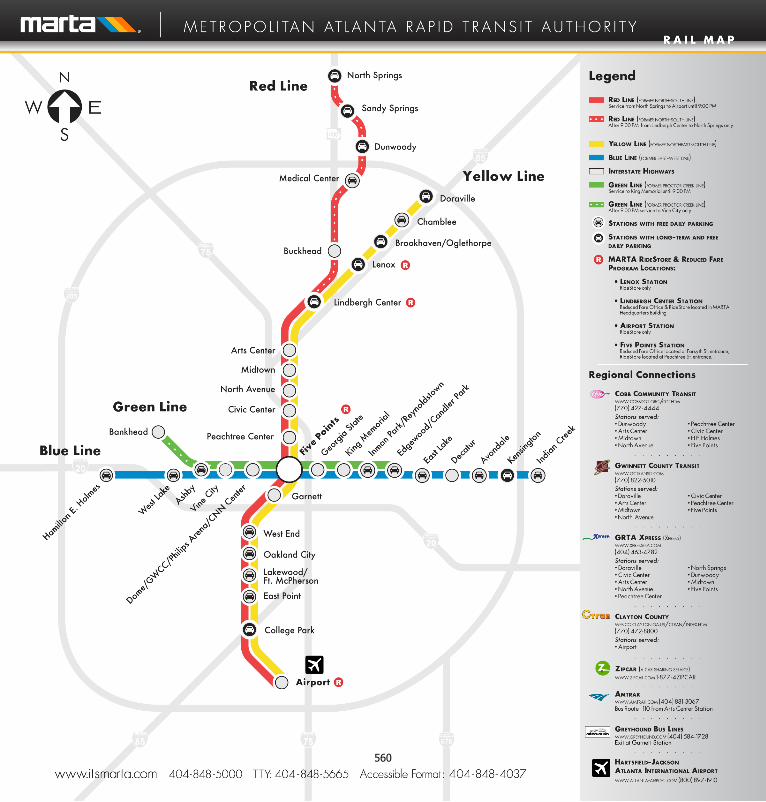
560
Related Documents