\.. CHAPTER 26. MARSHALL MIX DESIGN NPTEL May 8, 2007 C h ap te r 2 6 Marshall Mix Design 26.1 Overview The mix design (wetmix) d termines the optimum bitumen content. This is preceded by the dry mix design discussed in the previous chapter. There are many methods available for mix design which vary in the size. of the test specimen, compac ion, and other test specifications. Marshall method of mix design is the most popular one and is discussed below. 26.2 Marshall mix design The Marshall stability and flow test provides the performance prediction measure for the Marshall mix design method. The stability portion of the test measures the maximum load supported by the test specimen at a loading rate of 50. mm/rninute. Load is applied to the specimen till failure, and the maximum load is designated as stability. During the loading, an attached dial gauge measures the specimen's plastic flow (deformation) due to the loading. The flow value is recorded in 0.25 mm (0.01 inch) increments at the same time when the maximum load is recorded. The important steps involved in marshal mix design are summarized next. 26.3 Sp ec imen pr ep ar at ion Approximately 1200gm of aggregates and filler is heated to a temperature of 175 ~ 190°C. Bitumen is heated to a temperature of 121 ~ 125°C with the first trial percentage of bitumen (say 3.5 or 4% by weight of the mineral aggregates). The heated aggregates and bitumen are thoroughly mixed at a temperature of 154 ~ 160°C. The mix is placed in a preheated mould and compacted by a rammer with 50 blows on either side at t mperature of 138°C to 149°C. The weight of mixed aggregates taken for the preparation of the specimen may be suitably altered to obtain a compacted thickness of 63.5+/-3 mm. Vary the bitumen content in the next trial by +0.5% and repeat the above procedure. Number of trials are predetermined. The prepared mou1d is loaded in the Marshall test setup as shown in the figure 26:1. 26.4 Properties of the mix The properties that are of interest include the theoretical specific gravity Gt , the bulk specific gravity of the mix Gm , percent air voids V"' p erc en t v ol ume o f b it um en Vb, percent voi in mixed aggregate VMA and percent I nt ro duc ti on t o T ra ns po rt at io n E ng in ee rin g 26.1 Tom V. Mathew and K V Krishna Rao

Welcome message from author
This document is posted to help you gain knowledge. Please leave a comment to let me know what you think about it! Share it to your friends and learn new things together.
Transcript

8/7/2019 Marshall Mix Design Ch 26
http://slidepdf.com/reader/full/marshall-mix-design-ch-26 1/7
\..
CHAPTER 26. MARSHALL MIX DESIGN NPTEL May 8, 2007
Chapter 26
Marshall Mix Design
26.1 Overview
The mix design (wetmix) determines the optimum bitumen content. This is preceded by the dry mix design
discussed in the previous chapter. There are many methods available for mix design which vary in the size. of
the test specimen, compaction, and other test specifications. Marshall method of mix design is the most popular
one and is discussed below.
26.2 Marshall mix design
The Marshall stability and flow test provides the performance prediction measure for the Marshall mix design
method. The stability portion of the test measures the maximum load supported by the test specimen at a
loading rate of 50.8 mm/rninute. Load is applied to the specimen till failure, and the maximum load is designated
as stability. During the loading, an attached dial gauge measures the specimen's plastic flow (deformation) due
to the loading. The flow value is recorded in 0.25 mm (0.01 inch) increments at the same time when the
maximum load is recorded. The important steps involved in marshal mix design are summarized next.
26.3 Specimen preparation
Approximately 1200gm of aggregates and filler is heated to a temperature of 175 ~ 190°C. Bitumen is heated to
a temperature of 121 ~ 125°C with the first trial percentage of bitumen (say 3.5 or 4% by weight of the mineral
aggregates). The heated aggregates and bitumen are thoroughly mixed at a temperature of 154 ~ 160°C. The
mix is placed in a preheated mould and compacted by a rammer with 50 blows on either side at temperature
of 138°C to 149°C. The weight of mixed aggregates taken for the preparation of the specimen may be suitably
altered to obtain a compacted thickness of 63.5+/-3 mm. Vary the bitumen content in the next trial by +0.5%
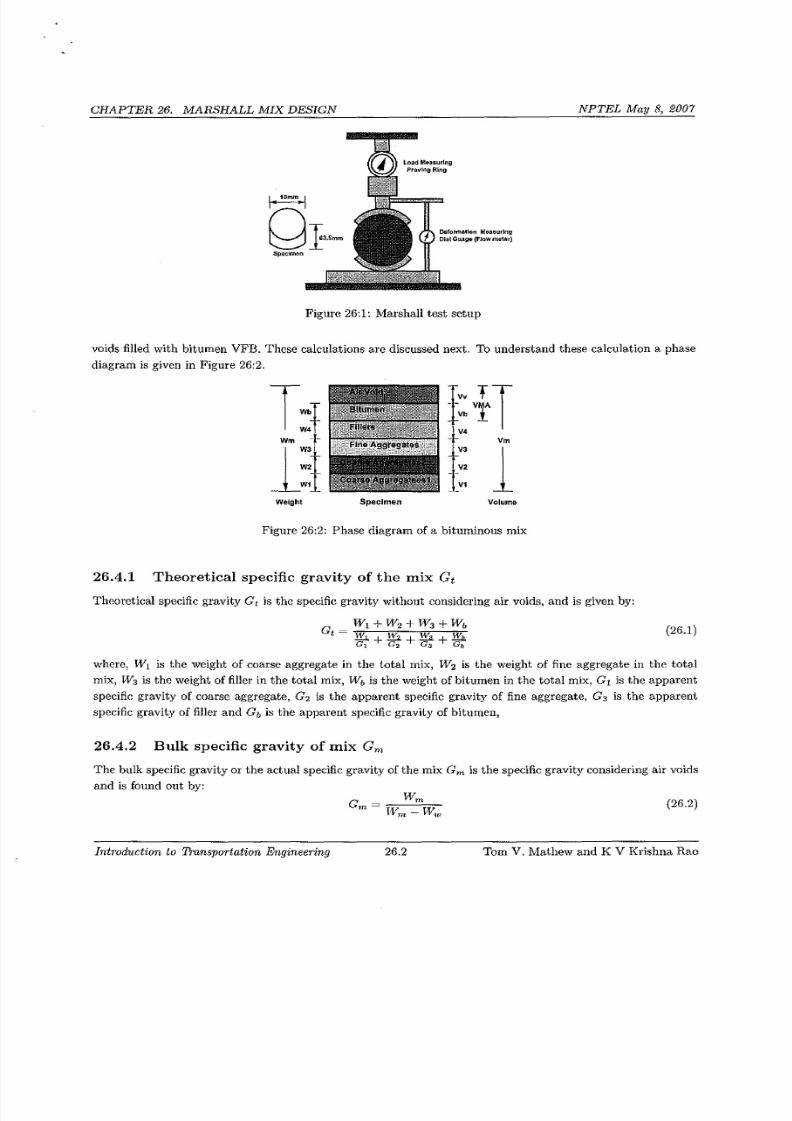
and repeat the above procedure. Number of trials are predetermined. The prepared mou1d is loaded in the
Marshall test setup as shown in the figure 26:1.
26.4 Properties of the mix
The properties that are of interest include the theoretical specific gravity Gt, the bulk specific gravity of the
mix Gm, percent air voids V"' percent volume of bitumen Vb, percent void in mixed aggregate VMA and percent
Introduction to Transportation Engineering 26.1 Tom V. Mathew and K V Krishna Rao
8/7/2019 Marshall Mix Design Ch 26
http://slidepdf.com/reader/full/marshall-mix-design-ch-26 2/7
CHAPTER 26. MARSHALL MIX DESIGN NPTEL May 8, 2007
~
Q r - . -pecimen
DeforrnaUoll Measurbg
D i al G u a ge ( F Jow m e t l! lr )
Figure 26:1: Marshall test setup
voids filledwith bitumen VFB. These calculations are discussed next. To understand these calculation a phasediagram is given in Figure 26:2.
T Wb
W4
Wm
1:WI
V V T TillA
Vb 1.V 4
Vr n
13
V2
V I
Weight Specimen Volume
Figure 26:2: Phase diagram ofa bituminous mix
26.4.1 Theoretical specific gravity of the mix Gt
Theoretical specific gravity Gt is the specific gravity without considering air voids, and is given by:
(26.1)
where, WI is the weight of coarse aggregate in the total mix, W2 is the weight of fine aggregate in the total
mix, W3 is the weight of filler in the total mix, Wb is the weight of bitumen in the total mix, G1 is the apparent
specific gravity of coarse aggregate, G2 is the apparent specific gravity of fine aggregate, G3 is the apparentspecific gravity of filler and Gb is the apparent specificgravity of bitumen,
26.4.2 Bulk specific gravity of mix Gm
The bulk specific gravity or the actual specific gravity ofthe mix Gm is the specific gravity considering air voids
and is found out by:
(26.2)
Intmduction to Transportation Engineering 26.2 Tom V. Mathew and K V Krishna Rao
8/7/2019 Marshall Mix Design Ch 26
http://slidepdf.com/reader/full/marshall-mix-design-ch-26 3/7
CHAPTER 26. MARSHALL MIX DESIGN NPTEL May 8,2007
where, Wm is the weight of mix in air, W", is the weight of mix in water, Note that Wm - W", gives the volume
of the mix. Sometimes to get accurate bulk specific gravity, the specimen is coated with thin film of paraffin
wax, when weight is taken in the water. This, however requires to consider the weight and volume of wax inthe calculations.
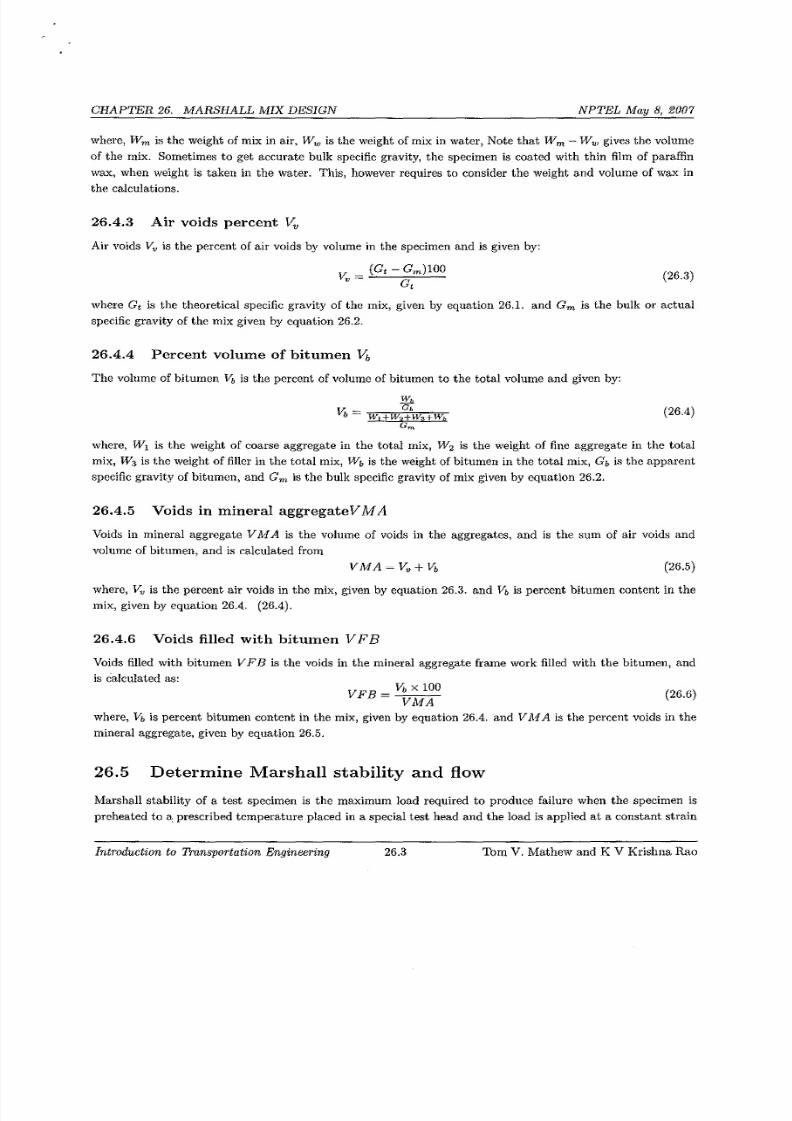
26.4.3 Air voids percent Vv
Air voids Vv is the percent of air voids by volume in the specimen and is given by:
Vv = (Gt - Gm)100
Gt
where Gt is the theoretical specific gravity of the mix, given by equation 26.1. and Om is the bulk or actual
(26.3)
specific gravity of the mix given by equation 26.2.
26.4.4 Percent volume of bitumen V b
The volume of bitumen Vb is the percent of volume of bitumen to the total volume and given by:
(26.4)
where, WI is the weight of coarse aggregate in the total mix, W2 is the weight of fine aggregate in the total
mix, W3 is the weight offiller in the total mix, Wb is the weight of bitumen in the total mix, Gb is the apparent
specific gravity of bitumen, and Gm is the bulk specific gravity of mix given by equation 26.2.
26.4.5 Voids in mineral aggregate VM A
Voids in mineral aggregate V 1 11A is the volume of voids in the aggregates, and is the sum of air voids and
volume of bitumen, and is calculated from
(26.5)
where, Vv is the percent air voids in the mix, given by equation 26.3. and Vb is percent bitumen content in the
mix, given by equation 26.4. (26.4).
26.4.6 Voids filled with bitumen V F B
Voids filled with bitumen V F B is the voids in the mineral aggregate frame work filled with the bitumen, and
is calculated as:VFB = V b x 100
VMA (26.6)
where, Vb is percent bitumen content in the mix, given by equation 26.4. and V 1 11A is the percent voids in the
mineral aggregate, given by equation 26.5.
26.5 Determine Marshall stability and flow
Marshall stability of a test specimen is the maximum load required to produce failure when the specimen is
preheated to a : prescribed temperature placed in a special test head and the load is applied at a constant strain
Introduction to Transportation Engineering 26.3 Tom V. Mathew and K V Krishna Rao
8/7/2019 Marshall Mix Design Ch 26
http://slidepdf.com/reader/full/marshall-mix-design-ch-26 4/7
CHAPTER 26. MARSHALL MIX DESIGN NPTEL May 8, 2007
(5 em per minute). While the stability test is in progress dial gauge is used to measure the vertical deformation
of the specimen. The deformation at the failure point expressed in units of 0.25 mm is called the Marshall flow
value of the specimen.
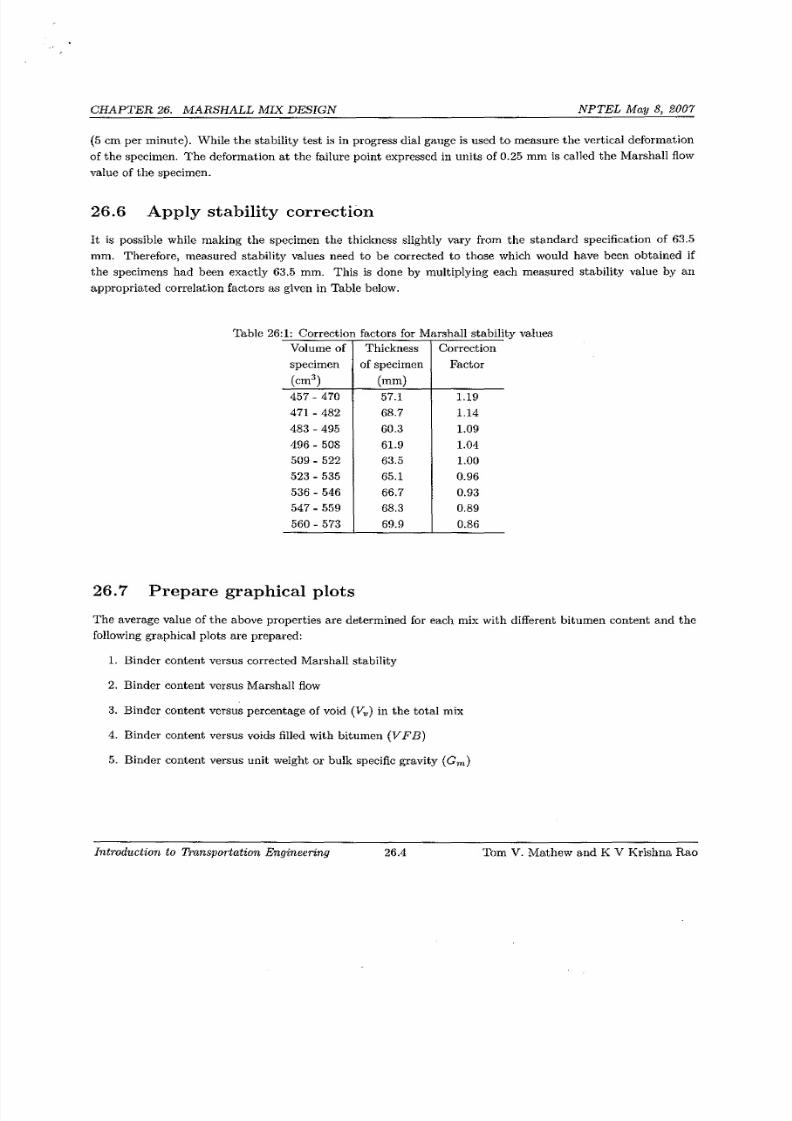
26.6 Apply stability correction
It is possible while making the specimen the thickness slightly vary from the standard specification of 63.5
mm. Therefore, measured stability values need to be corrected to those which would have been obtained if
the specimens had been exactly 63.5 mm. This is done by multiplying each measured stability value by an
appropriated correlation factors as given in Table below.
Table 26:1: Correction factors for Marshall stability values
Volume of Thickness Correction
specimen of specimen Factor
(cm3) (mm)
457 - 470 57.1 1.19
471- 482 68.7 1.14
483 - 495 60.3 1.09
496 - 508 61.9 1.04
509 - 522 63.5 1.00
523 - 535 65.1 0.96
536 - 546 66.7 0.93
547 - 559 68.3 0.89
560 - 573 69.9 0.86
26.7 Prepare graphical plots
The average value of the above properties are determined for each mix with different bitumen content and the
following graphical plots are prepared:
1. Binder content versus corrected Marshall stability
2. Binder content versus Marshall flow
3. Binder content versus percentage of void (Vv) in the total mix
4. Binder content versus voids filled with bitumen (V F B)
5. Binder content versus unit weight or bulk specific gravity (Cm)
Introduction to Transportation Engineering 26.4 Tom V. Mathew and K V Krishna Rao
8/7/2019 Marshall Mix Design Ch 26
http://slidepdf.com/reader/full/marshall-mix-design-ch-26 5/7
CHAPTER 26. MARSHALL MIX DESIGN NPTEL May 8, 2001
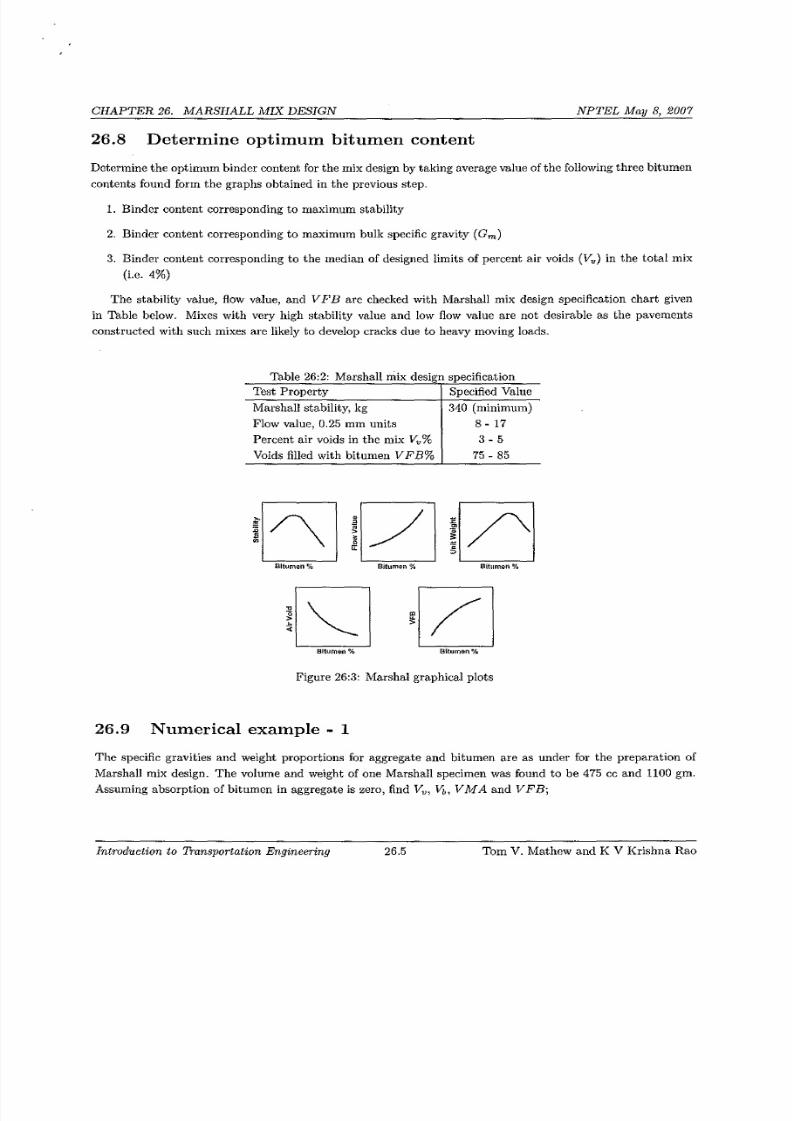
26.8 Determine optimum bitumen content
Determine the optimum binder content for the mix design by taking average value ofthe followingthree bitumen
contents found form the graphs obtained in the previous step.
1. Binder content corresponding to maximum stability
2. Binder content corresponding to maximum bulk specific gravity (Om )
3. Binder content corresponding to the median of designed limits of percent air voids ( V u ) in the total mix
(i.e. 4% )
The stability value, flowvalue, and V F B are checked with Marshall mix design specification chart given
in Table below. Mixes with very high stability value and low flow value are not desirable as the pavements
constructed with such mixes are likely to develop cracks due to heavy moving loads.
Table 26:2: Marshall m ix design specification
Test Property Specified Value
Marshall stability, kg 340 (minimum)
Flow value, 0.25 mm units 8 - 17
Percent air voids in the mix V u%
Voids filled with bitumen V F B%
3-5
75 - 85
' E S l ~ r 2 l I l 2 JItumen % Bitumen % Bitumen %
-: {2jEtum&n % B i t umen C o l a
Figure 26:3: Marshal graphical plots
26.9 Numerical example - 1
The specific gravities and weight proportions for aggregate and bitumen are as under for the preparation of
Marshall mix design. The volume and weight of one Marshall specimen was found to be 475 cc and 1100 gm.
Assuming absorption of bitumen in aggregate is zero, find Vu, Vb, VM A and V F B;
Introduction to Transportation Engineering 26.5 Tom V. Mathew and K V Krishna Rao
8/7/2019 Marshall Mix Design Ch 26
http://slidepdf.com/reader/full/marshall-mix-design-ch-26 6/7
CHAPTER 26. MARSHALL MIX DESIGN NPTEL May 8, 2007
Item A_I A_2 A_3 AA B
Wt (gm) 825 1200 325 150 100
Sp, Gr 2.63 2.51 2.46 2.43 1.05
Solution
VFB
825 + 1200 + 325 + 150 + 100825 + 1200 + _;g§_ + . . ! § Q _ + . lQ . Q .2.63 2.51 2.46 2.43 l.OS
2600
1080.862.4061100
475
2.3162.406 - 2.316 0
2.406 x 10
3.741 %100 2.316-x--1.05 110020.052 %
(3.741+ 20.05)
23.793 %
20.052 10023.793 x
84.277 %
VMA
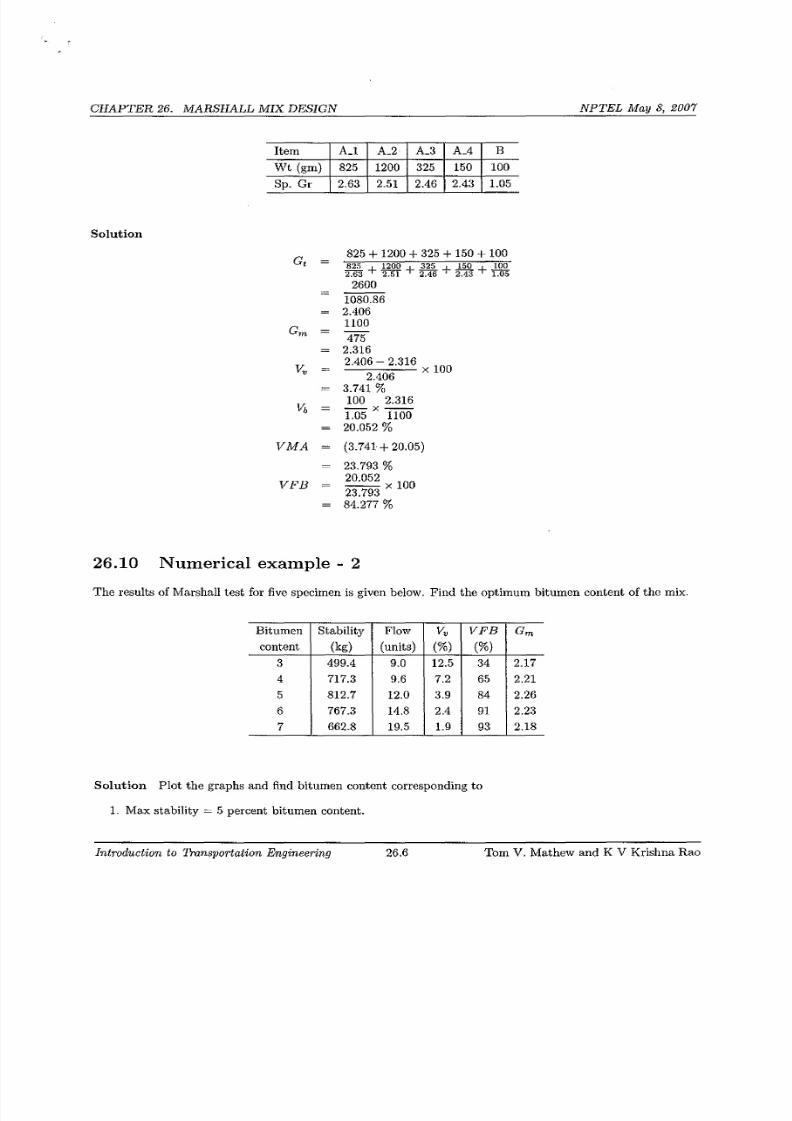
26.10 Numerical example - 2
The results of Marshall test for five specimen is given below. Find the optimum bitumen content of the mix.
Bitumen Stability Flow Vv VFB Gm
content (kg) (units) (%) (%)
3 499.4 9.0 12.5 34 2.17
4 717.3 9.6 7.2 65 2.21
5 812.7 12.0 3.9 84 2.266 767.3 14.8 2.4 91 2.23
7 662.8 19.5 1.9 93 2.18
Solution Plot the graphs and find bitumen content corresponding to
1. Max stability = 5 percent bitumen content.
Introduction to Transportation Engineering 26.6 Tom V. Mathew and K V Krishna Rao
8/7/2019 Marshall Mix Design Ch 26
http://slidepdf.com/reader/full/marshall-mix-design-ch-26 7/7
CHAPTER 26 . MARSHALL MIX DESIGN NPTEL May 8, 2007
2. Max Gm= 5 percent bitumen content.
3. 4% percent air void = 3 percent bitumen content.
The optimum bitumen extent is the average of above = 4.33 percent.
26.11 Summary
Marshal stability test is the performance prediction measure conducted on the bituminous nix. The procedure
consists of determination of properties of mix, Marshal stability and flow analysis and finally determination of
optimum bitumen content. The concept of phase diagram is used for the calculations.
26.12 Problems
1. In Marshall stability test, the sample is compacted using a rammer giving
(a) 50 blows
(b) 20 blows
(c) 25 blows
Cd) 75 blows
2. The Marshall flow value is expressed in units of
(a) 25 mm
(b) 2.5mm
(c) 5mm
(d) 3mm
26.13 Solutions
1. In Marshall stability test, the sample is compacted using a rammer giving
(a) 50 blowsJ
(b) 20 blows
(c) 25 blows
C d ) 75 blows
2. The Marshall flow value is expressed in units of
(a) 25 mm
(b) 2.5mmJ
(c) 5mm
(d) 3mm
Introduction to Transportation Engineering 26.7 Tom V. Mathew and K V Krishna Rao
Related Documents