Chapter 4 Marshall Mix Design and Analysis School of Engineering, Cochin University of Science and Technology 48 Chapter 4 MARSHALL MIX DESIGN AND ANALYSIS 4.1 INTRODUCTION Suitably designed bituminous mix will withstand heavy traffic loads under adverse climatic conditions and also fulfill the requirement of structural and pavement surface characteristics. The objective of the design of bituminous mix is to determine an economical blend through several trial mixes. The gradation of aggregate and the corresponding binder content should be such that the resultant mix should satisfy the following conditions. (i) Sufficient binder to ensure a durable pavement by providing a water proofing coating on the aggregate particles and binding them together under suitable compaction. (ii) Sufficient stability for providing resistance to deformation under sustained or repeated loads. This resistance in the mixture is obtained from aggregate interlocking and cohesion which generally develops due to binder in the mix. (iii) Sufficient flexibility to withstand deflection and bending without cracking. To obtain desired flexibility, it is necessary to have proper amount and grade of bitumen. (iv) Sufficient voids in the total compacted mix to provide space for additional compaction under traffic loading. (v) Sufficient workability for an efficient construction operation in laying the paving mixture. There are three principal bituminous mix design methods in general use. They are Marshall Method, Hveem Method and Superpave Method. Marshall mix design is the widely used method throughout India. In this method load is applied to a cylindrical specimen of bituminous mix and the sample is monitored till its failure as

Welcome message from author
This document is posted to help you gain knowledge. Please leave a comment to let me know what you think about it! Share it to your friends and learn new things together.
Transcript
Chapter 4 Marshall Mix Design and Analysis
School of Engineering, Cochin University of Science and Technology 48
Chapter 4
MARSHALL MIX DESIGN AND ANALYSIS
4.1 INTRODUCTION
Suitably designed bituminous mix will withstand heavy traffic loads under
adverse climatic conditions and also fulfill the requirement of structural and pavement
surface characteristics. The objective of the design of bituminous mix is to determine
an economical blend through several trial mixes. The gradation of aggregate and the
corresponding binder content should be such that the resultant mix should satisfy the
following conditions.
(i) Sufficient binder to ensure a durable pavement by providing a water proofing
coating on the aggregate particles and binding them together under suitable
compaction.
(ii) Sufficient stability for providing resistance to deformation under sustained or
repeated loads. This resistance in the mixture is obtained from aggregate
interlocking and cohesion which generally develops due to binder in the mix.
(iii) Sufficient flexibility to withstand deflection and bending without cracking.
To obtain desired flexibility, it is necessary to have proper amount and grade
of bitumen.
(iv) Sufficient voids in the total compacted mix to provide space for additional
compaction under traffic loading.
(v) Sufficient workability for an efficient construction operation in laying the
paving mixture.
There are three principal bituminous mix design methods in general use. They
are Marshall Method, Hveem Method and Superpave Method. Marshall mix design is
the widely used method throughout India. In this method load is applied to a
cylindrical specimen of bituminous mix and the sample is monitored till its failure as

Chapter 4 Marshall Mix Design and Analysis
School of Engineering, Cochin University of Science and Technology 49
specified in the ASTM standard (ASTM D1559). For the present work, the bituminous
mix is designed using the Marshall Method and arrived at the volumetric properties.
4.2 MARSHALL MIX DESIGN
This test procedure is used in designing and evaluating bituminous paving
mixes and is extensively used in routine test programmes for the paving jobs. There
are two major features of the Marshall method of designing mixes namely, density –
voids analysis and stability – flow test.
Strength is measured in terms of the ‘Marshall’s Stability’ of the mix following
the specification ASTM D 1559 (2004), which is defined as the maximum load carried
by a compacted specimen at a standard test temperature of 60˚C. In this test
compressive loading was applied on the specimen at the rate of 50.8 mm/min till it
was broken. The temperature 60˚C represents the weakest condition for a bituminous
pavement.
The flexibility is measured in terms of the ‘flow value’ which is measured by
the change in diameter of the sample in the direction of load application between the
start of loading and at the time of maximum load. During the loading, an attached dial
gauge measures the specimen's plastic flow (deformation) due to the loading. The
associated plastic flow of specimen at material failure is called flow value.
The density- voids analysis is done using the volumetric properties of the mix,
which will be described in the following sub sections.
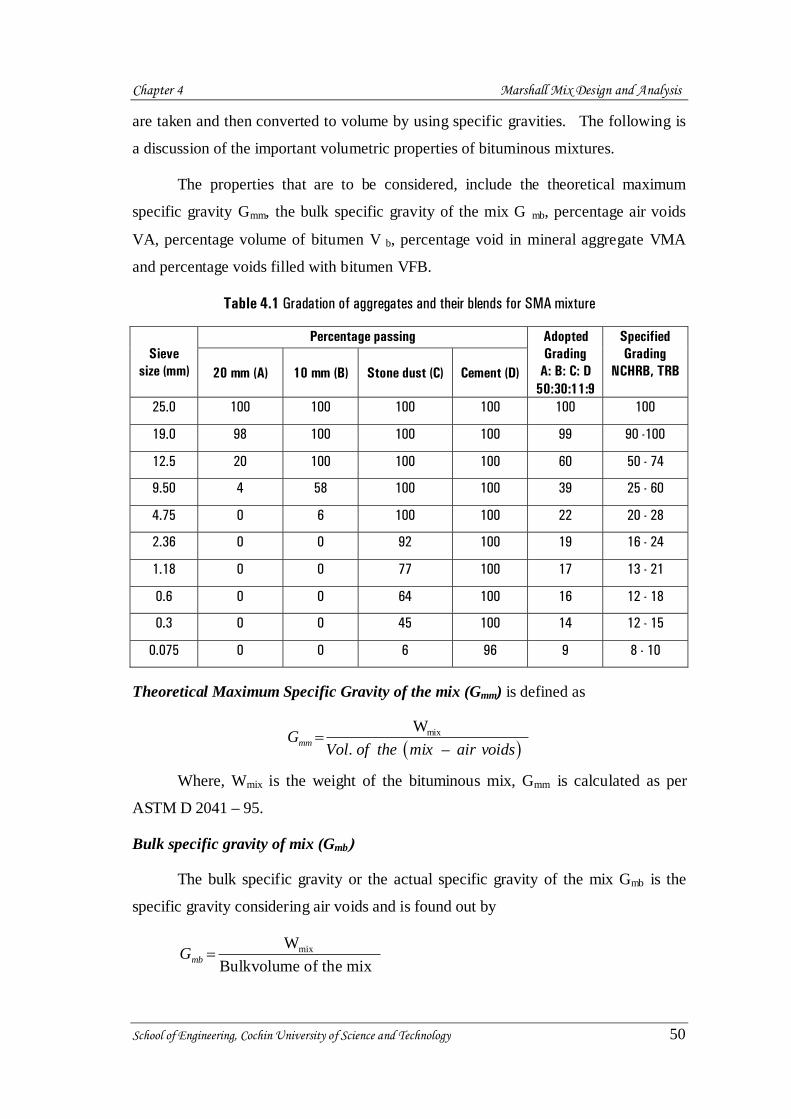
4.2.1 Gradation of aggregates
Gradation of aggregates is one of the most important factors for the design of
SMA mixture. The sieve analysis, blending and the specified limits of the SMA
mixture are given in Table 4.1 as per NCHRP - 425, TRB.
4.2.2 Volumetric properties
Fundamentally, mix design is meant to determine the volume of bitumen
binder and aggregates necessary to produce a mixture with the desired properties
(Roberts et al., 1996). Since weight measurements are typically much easier, weights
Chapter 4 Marshall Mix Design and Analysis
School of Engineering, Cochin University of Science and Technology 50
are taken and then converted to volume by using specific gravities. The following is
a discussion of the important volumetric properties of bituminous mixtures.
The properties that are to be considered, include the theoretical maximum
specific gravity Gmm, the bulk specific gravity of the mix G mb, percentage air voids
VA, percentage volume of bitumen V b, percentage void in mineral aggregate VMA
and percentage voids filled with bitumen VFB.
Table 4.1 Gradation of aggregates and their blends for SMA mixture
Sieve size (mm)
Percentage passing Adopted Grading
A: B: C: D 50:30:11:9
Specified Grading
NCHRB, TRB 20 mm (A) 10 mm (B) Stone dust (C) Cement (D)
25.0 100 100 100 100 100 100
19.0 98 100 100 100 99 90 -100
12.5 20 100 100 100 60 50 - 74
9.50 4 58 100 100 39 25 - 60
4.75 0 6 100 100 22 20 - 28
2.36 0 0 92 100 19 16 - 24
1.18 0 0 77 100 17 13 - 21
0.6 0 0 64 100 16 12 - 18
0.3 0 0 45 100 14 12 - 15
0.075 0 0 6 96 9 8 - 10
Theoretical Maximum Specific Gravity of the mix (Gmm) is defined as
( )mixW
. – mmG
Vol of the mix air voids=
Where, Wmix is the weight of the bituminous mix, Gmm is calculated as per
ASTM D 2041 – 95.
Bulk specific gravity of mix (Gmb)
The bulk specific gravity or the actual specific gravity of the mix Gmb is the
specific gravity considering air voids and is found out by
mixW
Bulkvolume of the mix mbG =

Chapter 4 Marshall Mix Design and Analysis
School of Engineering, Cochin University of Science and Technology 51
It is obtained by measuring the total weight of the mix and its volume. Volume
is determined by measuring the dimensions of the sample or for better accuracy it can
be measured by the volume of water it displaces. However, while the sample is
immersed in water, some water may be absorbed by the pores of the mix. Therefore,
the mix is covered with a thin film of paraffin and the volume of the sample is
measured by knowing the volume of paraffin used to coat its surface. The bulk
specific gravity of paraffin-coated specimen is determined in accordance with ASTM
standard test procedure D1188-96.
The phase diagram of the bituminous mix is given in Fig. 4.1. When aggregate
particles are coated with bitumen binder, a portion of the binder is absorbed into the
aggregate, whereas the remainder forms a film on the outside of the individual
aggregate particles. Since the aggregate particles do not consolidate to form a solid
mass, air pockets also appear within the bitumen-aggregate mixture. Therefore, as Fig.
4.1 illustrates, the four general components of HMA are: aggregate, absorbed
bitumen, bitumen not absorbed into the aggregate (effective bitumen) and air.
Fig. 4.1 Phase diagram of the bituminous mix
Effective Bitumen Content (Pbe)
It is the total bitumen binder content of the mixture less the portion of bitumen
binder that is lost by absorption into the aggregate.
VMA
Chapter 4 Marshall Mix Design and Analysis
School of Engineering, Cochin University of Science and Technology 52
Volume of Absorbed Bitumen (Vab)
It is the volume of bitumen binder in the mix that has been absorbed into the
pore structure of the aggregate. This volume is not accounted for the effective
bitumen content.
Air voids percent (VA)
It is the total volume of the small pockets of air between the coated aggregate
particles throughout a compacted paving mixture, expressed as a percent of the bulk
volume of the compacted paving mixture. The amount of air voids in a mixture is
extremely important and closely related to stability, durability and permeability.
The voids in a compacted mixture are obtained in accordance with ASTM
standard test method D3203-94. The following equation represents the percentage of
air voids in the specimen.
mm mb)
mm
(G – G 100VA
G =
where Gmm is the theoretical specific gravity of the mix and Gmb is the bulk
specific gravity of the mix.
Voids in mineral aggregate (VMA)
The total volume of voids in the aggregate mix (when there is no bitumen) is
called Voids in Mineral Aggregates (VMA). In other words, VMA is the volume of
intergranular void space between the aggregate particles of a compacted paving
mixture. It includes the air voids and the volume of bitumen not absorbed into the
aggregate. VMA is expressed as a percentage of the total volume of the mix.
When VMA is too low, there is not enough room in the mixture to add
sufficient bitumen binder to coat adequately over the individual aggregate particles.
Also, mixes with a low VMA are more sensitive to small changes in bitumen binder
content. Excessive VMA will cause unacceptably low mixture stability (Roberts et
al., 1996). Generally, a minimum VMA of 17% is specified. VMA can be calculated
as,

Chapter 4 Marshall Mix Design and Analysis
School of Engineering, Cochin University of Science and Technology 53
mb s
Sb
G PVMA 1 100
Gx⎛ ⎞
= −⎜ ⎟⎝ ⎠
where Ps is the fraction of aggregates present, by total weight of the mix and Gsb is the
bulk specific gravity of the mixed aggregates.
Voids Filled with Bitumen (VFB)
VFB is the voids in the mineral aggregate frame work filled with bitumen
binder. This represents the volume of the effective bitumen content. It can also be
described as the percent of the volume of the VMA that is filled with bitumen. VFB is
inversely related to air voids and hence as air voids decreases, the VFB increases.
100)( xVMA
VAVMAVFB −=
where, VA is air voids in the mix and VMA is the voids in the mineral aggregate.
The decrease of VFB indicates a decrease of effective bitumen film thickness
between aggregates, which will result in higher low-temperature cracking and lower
durability of bitumen mixture since bitumen perform the filling and healing effects to
improve the flexibility of mixture.
4.2.3 Role of volumetric parameters of mix
Bitumen holds the aggregates in position, and the load is taken by the
aggregate mass through the contact points. If all the voids are filled with bitumen, the
one to one contact of the aggregate particles may lose, and then the load is transmitted
by hydrostatic pressure through bitumen, and hence the strength of the mix reduces.
That is why stability of the mix starts reducing when bitumen content is increased
further beyond a certain value.
During summer season, bitumen softens and occupies the void space between
the aggregates and if void is unavailable, bleeding is caused. Thus, some amount of
void is necessary in a bituminous mix, even after the final stage of compaction.
However excess void will make the mix weak from its elastic modulus and fatigue life
considerations. Evaluation and selection of aggregate gradation to achieve the
specified minimum VMA is the most difficult and time-consuming step in the mix
design process.
Chapter 4 Marshall Mix Design and Analysis
School of Engineering, Cochin University of Science and Technology 54
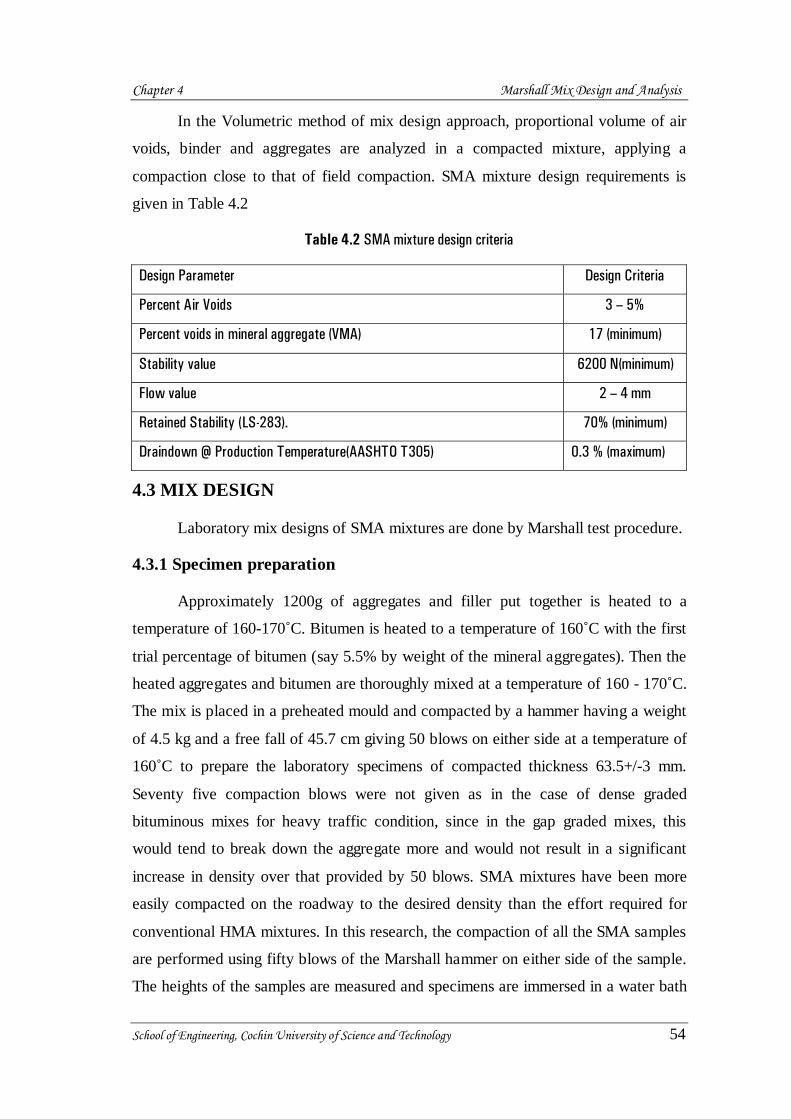
In the Volumetric method of mix design approach, proportional volume of air
voids, binder and aggregates are analyzed in a compacted mixture, applying a
compaction close to that of field compaction. SMA mixture design requirements is
given in Table 4.2
Table 4.2 SMA mixture design criteria
Design Parameter Design Criteria
Percent Air Voids 3 – 5%
Percent voids in mineral aggregate (VMA) 17 (minimum)
Stability value 6200 N(minimum)
Flow value 2 – 4 mm
Retained Stability (LS-283). 70% (minimum)
Draindown @ Production Temperature(AASHTO T305) 0.3 % (maximum)
4.3 MIX DESIGN
Laboratory mix designs of SMA mixtures are done by Marshall test procedure.
4.3.1 Specimen preparation
Approximately 1200g of aggregates and filler put together is heated to a
temperature of 160-170˚C. Bitumen is heated to a temperature of 160˚C with the first
trial percentage of bitumen (say 5.5% by weight of the mineral aggregates). Then the
heated aggregates and bitumen are thoroughly mixed at a temperature of 160 - 170˚C.
The mix is placed in a preheated mould and compacted by a hammer having a weight
of 4.5 kg and a free fall of 45.7 cm giving 50 blows on either side at a temperature of
160˚C to prepare the laboratory specimens of compacted thickness 63.5+/-3 mm.
Seventy five compaction blows were not given as in the case of dense graded
bituminous mixes for heavy traffic condition, since in the gap graded mixes, this
would tend to break down the aggregate more and would not result in a significant
increase in density over that provided by 50 blows. SMA mixtures have been more
easily compacted on the roadway to the desired density than the effort required for
conventional HMA mixtures. In this research, the compaction of all the SMA samples
are performed using fifty blows of the Marshall hammer on either side of the sample.
The heights of the samples are measured and specimens are immersed in a water bath

Chapter 4 Marshall Mix Design and Analysis
School of Engineering, Cochin University of Science and Technology 55
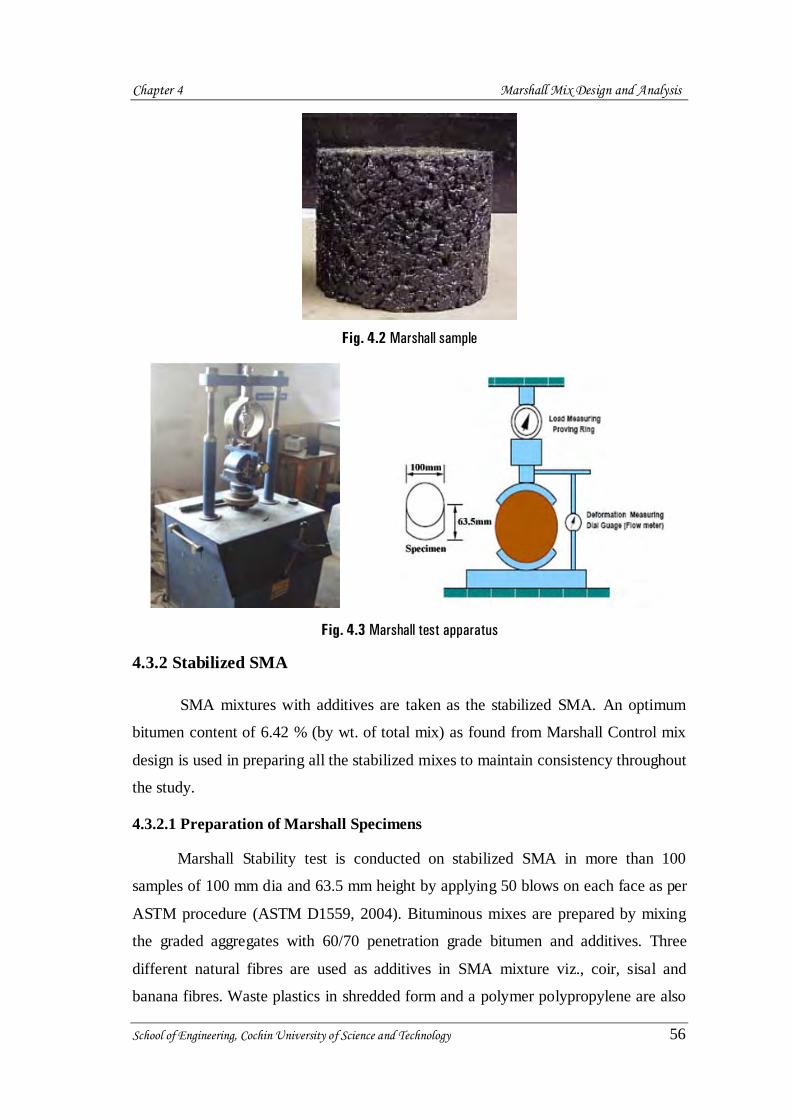
at 60˚C for 35±5 minutes. Samples (Fig. 4.2) are removed from the water bath and
placed immediately in the Marshall loading head as shown in Fig. 4.3. The load is
applied to the specimen at a deformation rate of 50.8 mm/minute. Stability is
measured as the maximum load sustained by the sample before failure. Flow is the
deformation at the maximum load. The stability values are then adjusted with respect
to the sample height (stability corrections).
For the proposed design mix gradation, four specimens are prepared for each
bitumen content within the range of 5.5 – 7.5% at increments of 0.5 percent, in
accordance with ASTM D 1559 using 50 blows/face compaction standards. All
bitumen content shall be in percentage by weight of the total mix. As soon as the
freshly compacted specimens have cooled to room temperature, the bulk specific
gravity of each test specimen shall be determined in accordance with ASTM D 2726.
The stability and flow value of each test specimen shall then be determined in
accordance with ASTM D 1559. After the completion of the stability and flow test,
specific gravity and voids analysis shall be carried out for each test specimen to
determine the percentage air voids in mineral aggregate and the percentage air voids
in the compacted mix and voids filled with bitumen. Values which are obviously
erratic shall be discarded before averaging. Where two or more specimens in any
group of four are so rejected, four more specimens are prepared and tested.
The average values of bulk specific gravity, stability, flow, VA, VMA and
VFB obtained above are plotted separately against the bitumen content and a smooth
curve drawn through the plotted values. Average of the binder content corresponding
to VMA of 17 % and an air void of 4% are considered as the optimum binder content
(Brown, 1992). Stability and Flow values at the optimum bitumen content are then
found from the plotted smooth curves and shall comply with the design parameters
given in Table 4.2.
The optimum bitumen content (OBC) for the SMA mixture is determined and
is found to be 6.42 % (by wt. of total mix). This SMA mixture without additives is
considered as the control mixture for the subsequent studies.
Chapter 4 Marshall Mix Design and Analysis
School of Engineering, Cochin University of Science and Technology 56
Fig. 4.2 Marshall sample
Fig. 4.3 Marshall test apparatus
4.3.2 Stabilized SMA
SMA mixtures with additives are taken as the stabilized SMA. An optimum
bitumen content of 6.42 % (by wt. of total mix) as found from Marshall Control mix
design is used in preparing all the stabilized mixes to maintain consistency throughout
the study.
4.3.2.1 Preparation of Marshall Specimens
Marshall Stability test is conducted on stabilized SMA in more than 100
samples of 100 mm dia and 63.5 mm height by applying 50 blows on each face as per
ASTM procedure (ASTM D1559, 2004). Bituminous mixes are prepared by mixing
the graded aggregates with 60/70 penetration grade bitumen and additives. Three
different natural fibres are used as additives in SMA mixture viz., coir, sisal and
banana fibres. Waste plastics in shredded form and a polymer polypropylene are also

Chapter 4 Marshall Mix Design and Analysis
School of Engineering, Cochin University of Science and Technology 57
tried as the additives. The fibre content in this research is varied between 0.1%, 0.2%,
0.3% and 0.4% by weight of mix and the polypropylene and the waste plastics content
as 1%, 3%, 5%, 7% and 9% by weight of mix. The procedure adopted for the
preparation of Marshall Specimen is the same as used in control mixtures (sec.4.3.1),
except, the additives are added in heated aggregate prior to mixing them with heated
bitumen (dry blending method). The fibre length in the mixture is preserved as a
constant parameter with a value equal to 6 mm. The mixing and compaction
temperatures are kept as 165˚C and 150˚C respectively (Brown and Manglorkar,
1993). A total of 120 Marshall samples for all percentages of different additives are
prepared.
4.4 MOISTURE SUSCEPTIBILITY TEST
It is well known that presence of moisture in a bituminous mix is a critical
factor, which leads to premature failure of the flexible pavement. The loss of adhesion
of aggregates with bitumen is studied by utilising Retained Stability test to examine
the effect of additive on resistance to moisture induced damage. This test measures the
stripping resistance of a bituminous mixture. The test is specified in IRC: SP 53-2002
and is conducted as per ASTM D 1075-1979 specifications. The standard Marshall
specimens of 100 mm diameter and 63.5 mm height are prepared. Marshall Stability
of compacted specimens is determined after conditioning them by keeping in water
bath maintained at 60˚C for 24 hours prior to testing. This stability, expressed as a
percentage of the stability of Marshall specimens determined under standard
conditions, is the retained stability of the mix. A higher value indicates lower moisture
susceptibility (higher moisture damage resistance).
4.5 MARSHALL TEST RESULTS AND DISCUSSION
Results of mix design and their discussion for the fibre stabilized mixtures and the
mixtures with waste plastics and polypropylene are given separately in this section.
4.5.1 Fibre stabilized mixtures
Test results of volumetric and mechanical properties of SMA mixtures using
different fibres are tabulated in Table 4.3 and discussed in this section.

Chapter 4 Marshall Mix Design and Analysis
School of Engineering, Cochin University of Science and Technology 58
4.5.1.1 Marshall stability and flow value
From Table 4.3, it is evident that the presence of fibre in the SMA mixtures
effectively improves the stability values, which will result in an improvement of
mixture toughness. This result indicates that the mixture using fibre would result in
higher performance than using the control mixture. Variation of Marshall stability and
flow value with different fibre contents are given in Fig. 4.4.a and Fig. 4.4.b
Fig. 4.4.a indicates that the stability of fibre stabilized mixtures increases
initially, reaches a maximum value and then decreases with increasing fibre content.
Bituminous mixture is an inconsistent, non-uniform, multi-phased composite material
consisting of aggregates and sticky bitumen. Therefore, excessive fibres may not
disperse uniformly, while coagulate together to form weak points inside the mixture.
As a result, stability decreases at high fibre contents.
Table 4.3 Variation of Marshall Properties of SMA with different % of fibres as additive.
Additive % Stability (kN)
Flow (mm)
Marshll Quotient (kN/mm)
Air void (%)
Bulk specific gravity
VMA (%)
VFB (%)
Nil 0 7.416 3.18 2.332 4 2.32 18.865 78.796
Coir fibre
0.1 8.19 3.14 2.609 4.14 2.318 18.935 78.135
0.2 10.073 3.05 3.303 4.31 2.315 19.039 77.363
0.3 12.58 2.83 4.445 4.46 2.308 19.284 76.872
0.4 7.936 2.72 2.918 4.64 2.298 19.634 76.368
Sisal fibre
0.1 7.743 3.17 2.443 4.09 2.31 19.214 78.714
0.2 8.701 3.07 2.834 4.24 2.3 19.564 78.328
0.3 11.862 2.86 4.148 4.37 2.291 19.879 78.017
0.4 8.742 2.77 3.156 4.54 2.278 20.333 77.672
Banana
fibre
0.1 7.732 3.16 2.447 4.09 2.308 19.284 78.791
0.2 8.703 3.09 2.817 4.22 2.296 19.704 78.583
0.3 11.854 2.86 4.145 4.34 2.286 20.030 78.333
0.4 8.643 2.76 3.132 4.50 2.275 20.438 77.982

Chapter 4 Marshall Mix Design and Analysis
School of Engineering, Cochin University of Science and Technology 59
Fig. 4.4.a Variation of stability with different fibre %
Fig. 4.4.b Variation of flow value with different fibre %
It may be noted that all fibre stabilized mixtures gave the maximum stability at
0.3% fibre content. Comparing different fibre stabilized mixtures, it is evident that the
mixtures with coir fibre have the highest stability (12.58 kN), indicating their higher
rutting resistance and better performance than mixtures with other fibres. The percentage
increase in stability with respect to the control mixture is about 70% for SMA with coir
fibre and about 60% for SMA with other fibres. This result could be attributed to fibre’s
adhesion and networking effects in the stabilized mixtures. The spatial networking effect
was regarded as the primary factors contributing to fibre’s reinforcement (Chen and Lin,
0
2
4
6
8
10
12
14
0 0.1 0.2 0.3 0.4 0.5
Stab
ility
(kN
)
Fibre content (%)
SMA with coir
SMA with sisal
SMA with banana
2.6
2.7
2.8
2.9
3
3.1
3.2
3.3
0 0.1 0.2 0.3 0.4 0.5
Flow
(mm
)
Fibre content (%)
SMA with coir
SMA with sisal
SMA with banana

Chapter 4 Marshall Mix Design and Analysis
School of Engineering, Cochin University of Science and Technology 60
2005). This trend could be explained as follows: fibre performs as ‘‘bridge” when
cracking of bitumen mixture appears and thus resists the propagation of cracking
development, which is called bridging cracking effect (Li., 1992). In addition, due to the
absorption of light component of bitumen (Serfass and Samanos, 1996), fibre improves
the viscosity and stiffness of bitumen (Huang and White, 2001).
Flow value of SMA mixtures decreases after adding fibres, as shown in Fig.
4.4.b. Owing to the stiffness of fibres in the mixture, the mixes become less flexible
and the resistance to deformation increases resulting in a low flow value. However,
flow values are located within the required specification range of 2 to 4 mm
(AASHTO T 245).
Marshall Quotient (MQ) also known as rigidity ratio is the ratio of stability to
flow value of the mixture and the Marshall Quotient values of SMA with different
fibre contents are shown in Fig. 4.4.c. It is found that MQ of the coir fibre stabilized
SMA at 0.3 % fibre content is almost doubled with respect to the control mixture. It
can be inferred that these stabilized SMA provide better resistance against permanent
deformations due to their high stability and high MQ and also indicate that these
mixtures can be used in pavements where stiff bituminous mixture is required.
Fig. 4.4.c Variation of Marshall Quotient with different fibre %
4.5.1.2 Bulk specific gravity
The bulk specific gravity of bituminous mixture decreases with increasing fibre
content in SMA as depicted in Fig. 4.4.d.
00.5
11.5
22.5
33.5
44.5
5
0 0.1 0.2 0.3 0.4
Mar
shal
l Quo
tient
(kN
/mm
)
Fibre content (%)
SMA with coir
SMA with sisal
SMA with banana

Chapter 4 Marshall Mix Design and Analysis
School of Engineering, Cochin University of Science and Technology 61
Fig. 4.4.d Variation of bulk specific gravity with different fibre %
This trend is in agreement with other research (Tapkın, 2008; Saeed and Ali,
2008). This result would be attributed due to the different specific gravities of
different fibres and the much lower specific gravity of fibre than that of aggregates.
Meanwhile, the elastic behavior of mixture increases with increase in fibre content,
due to the elastic nature of fibres. As a result, at the same compaction effort (50 blows
on both sides of Marshall sample), adding fibre reduces the specific gravity of the
control mixture. However, it is noted that the coir fibre stabilized SMA has the highest
specific gravity which is due to the fact that coir fibre has the maximum density
(Table 3.3) as compared to other fibres. Considering the fact that higher specific
gravity results in better design mixes, it can be inferred that coir fibre stabilized
mixtures perform better than the other stabilized mixtures.
4.5.1.3 Air void, VMA and VFB
Excessive air voids in the mixture would result in cracking due to insufficient
bitumen binders to coat on the aggregates, while too low air void may induce more
plastic flow (rutting) and bitumen bleeding. Here the test results (Fig. 4.4.e) show that
air void increases after adding fibres into bituminous mixtures. This may be due to the
net working effect of the fibre within the mix (lower Gmb correlates to higher air
voids). The mixtures with coir fibre has the highest air voids than the other mixtures.
However, the air voids of mixtures are located within the specification range of 3% to
5% (AASHTO T 312) which support the use of these additives.
2.27
2.28
2.29
2.3
2.31
2.32
2.33
0 0.1 0.2 0.3 0.4 0.5
Bul
k sp
ecifi
c gr
avity
Fibre content (%)
SMA with coir
SMA with sisal
SMA with banana

Chapter 4 Marshall Mix Design and Analysis
School of Engineering, Cochin University of Science and Technology 62
Fig. 4.4.e Variation of air void with different fibre %
Increasing the fibre content increases the VMA of SMA mixtures as shown in Fig. 4.4.f, while reduces VFB as shown in Fig. 4.4.g. With respect to the control mixture, when fibre content increases from 0% to 0.3%, air void increases by about 11.5%, VMA increases by 2.2%, while VFB decreases by 2.4% for coir fibre stabilized mixtures and the corresponding percentage changes are respectively about 9.25% increase, 5.4% increase and 1% decrease for sisal fibre stabilized mixtures and 8.5% increase, 6.2% increase and 1% decrease for banana fibre stabilized mixtures with respect to the control mixture. But all the results are within the required specification range which also supports the use of these additives.
Fig. 4.4.f Variation of VMA with different fibre %
3.9
4
4.1
4.2
4.3
4.4
4.5
4.6
4.7
0 0.1 0.2 0.3 0.4 0.5
Air
voi
d (%
)
Fibre content (%)
SMA with coir
SMA with sisal
SMA with banana
18.4
18.8
19.2
19.6
20
20.4
20.8
0 0.1 0.2 0.3 0.4 0.5
VMA
(%)
Fibre content (%)
SMA with coir
SMA with sisal
SMA with banana

Chapter 4 Marshall Mix Design and Analysis
School of Engineering, Cochin University of Science and Technology 63
Fig. 4.4.g Variation of VFB with different fibre %
4.5.2 Waste plastics and polypropylene stabilized mixtures
The variation in different Marshall properties for various percentages of waste
plastics (WP) and polypropylene (PP) contents are determined for each mix design
and is given in Table 4.4.
Table 4.4 Marshall Properties of waste plastics and polypropylene stabilized SMA.
Additive % Stability (kN)
Flow (mm)
Marshall Quotient (kN/mm)
Air void (%)
Bulk specific gravity
VMA (%) VFB (%)
Nil 0 7.416 3.18 2.332 4 2.32 18.865 78.796
WP
1 8.717 3.025 2.882 3.95 2.326 18.655 78.826
3 11.18 2.916 3.834 3.91 2.33 18.515 78.882
5 13.12 2.818 4.656 3.82 2.336 18.305 79.132
7 13.7 2.794 4.903 3.66 2.346 17.955 79.616
9 10.6 2.876 3.686 3.41 2.356 17.606 80.631
PP
1 8.252 3.085 2.675 3.94 2.328 18.585 78.800
3 10.213 2.923 3.494 3.86 2.338 18.235 78.832
5 12.843 2.828 4.541 3.75 2.346 17.955 79.115
7 11.25 2.83 3.975 3.59 2.355 17.641 79.646
9 10.52 2.872 3.664 3.34 2.368 17.186 80.566
76
76.5
77
77.5
78
78.5
79
0 0.1 0.2 0.3 0.4 0.5
VFB
(%)
Fibre content (%)
SMA with coir
SMA with sisal
SMA with banana

Chapter 4 Marshall Mix Design and Analysis
School of Engineering, Cochin University of Science and Technology 64
4.5.2.1 Marshall stability and flow value
Fig. 4.5.a and 4.5.b represent the effect of waste plastics and polypropylene
content on stability and flow value of the SMA mixtures. The figure indicates that as
the additive content increases, the stability value increases initially, reaches a
maximum and then decreases. The addition of 5% PP raises the Marshall stability of
control mix by 73% and the percentage increase for 7% WP is 85%. This was
attributed to the specific gravity of additive (less than 1) which is less than that of
bitumen (Table 3.6). This serves to penetrate between particles and enhanced the
interlock of aggregates, which increases the stability and decreases the flow value.
Beyond this percentage of additive content the stability value decreases. This is
related to the decrease in interlocking offered by bitumen binder and additive coated
aggregate particles while excess additive occupy the space to be occupied by the
bitumen. Test results indicate that the mixtures with waste plastics have the higher
stability (13.7 kN) than mixtures with polypropylene, indicating their higher rutting
resistance.
Failure in bituminous mixtures can occur within the binder (cohesive failure)
or at the aggregate-binder interface (adhesive failure). It can be considered that
adhesive bond strength controls the failure mechanism in the Marshall Stability test
(Kok and Kuloglu, 2007). The presence of additives in the bituminous mixtures
resulted in, increased adhesive bond strength which leads to increased stability values
of the mixtures.
Flow value of SMA mixtures decreases initially (up to 7% WP and 5% PP)
and after that there is an increase as shown in Fig. 4.5.b. This may be due to the
decrease in the stone to stone contact of SMA mixtures at higher additive contents.
However, flow values are located within the required specification range of 2 to 4mm
(AASHTO T 245).

Chapter 4 Marshall Mix Design and Analysis
School of Engineering, Cochin University of Science and Technology 65
Fig. 4.5.a Variation of stability with different additive %
Fig. 4.5.b Variation of flow value with different additive %
From the sited results in Fig. 4.5.c, it is found that the Marshall Quotient
almost doubled with respect to the control mixture at 5% PP content and 7% WP
content and is found that it is slightly higher with waste plastics additive. It can be
inferred that these stabilized SMA provide better resistance against permanent
deformations than the control mixture.
0
2
4
6
8
10
12
14
16
0 2 4 6 8 10
Stab
ility
(kN
)
Additive (%)
SMA with WP
SMA with PP
2.75
2.8
2.85
2.9
2.95
3
3.05
3.1
3.15
3.2
0 2 4 6 8 10
Flow
val
ue (m
m)
Additive (%)
SMA with WP
SMA with PP

Chapter 4 Marshall Mix Design and Analysis
School of Engineering, Cochin University of Science and Technology 66
Fig. 4.5.c Variation of Marshall Quotient with additive content
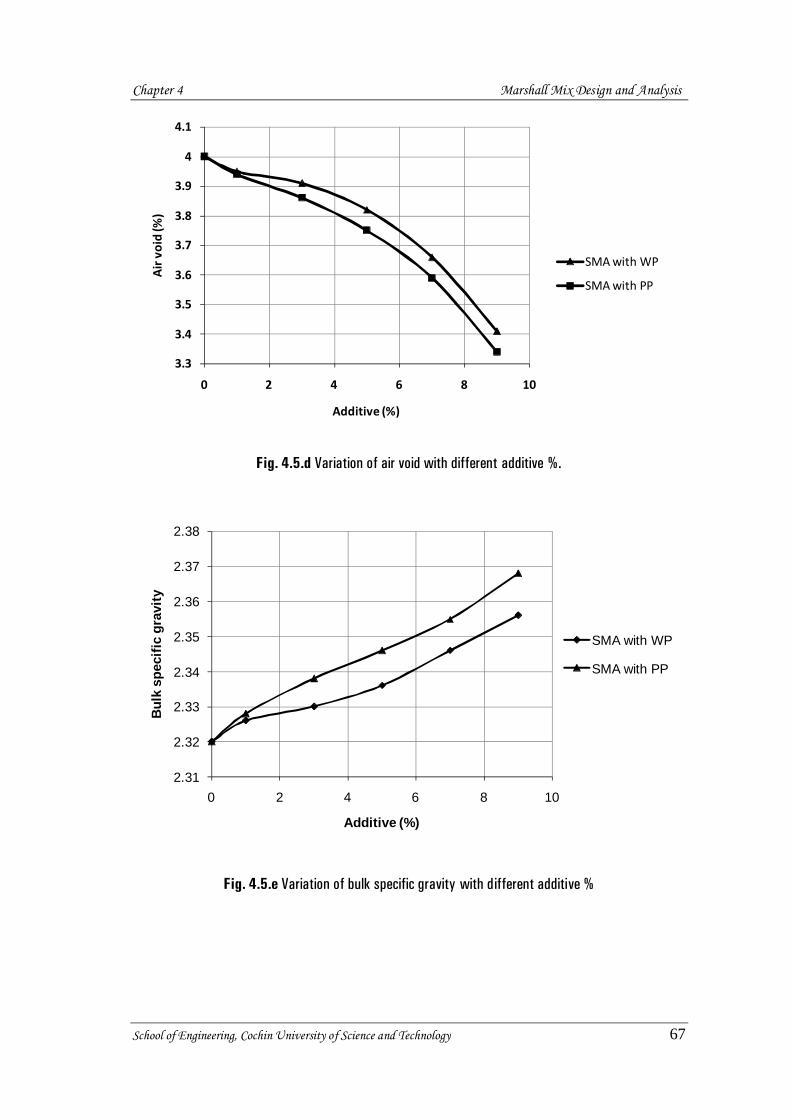
4.5.2.2 Air void and bulk specific gravity
The density of WP and PP is much less than that of aggregates and they will
penetrate into the aggregates and a proper coating is formed over it. Owing to the
filling property offered by these additives resulting in a less air void in the stabilized
mixture as compared to the control mixture (Fig. 4.5.d). But the values are within the
specified limit of 3 to 5% which support the use of these additives. Bulk specific
gravity of SMA mixture depends on the air voids. Less air voids lead to reduction in
bulk volume of the SMA mixture, as a result bulk specific gravity of SMA mix
increases with an increase in additive content as shown in Fig. 4.5.e.
4.5.2.3 VMA and VFB
It can be observed from Fig. 4.5.f that VMA decreases by the addition of
additives to the bituminous mixtures. This may be due to the decrease of bulk specific
gravity as indicated by equation for VMA (Section 4.2.2). But all the results are
within the specification range which also supports the use of these additives. VFB of
mixtures have an increase after adding additive into the mixture, as shown in Fig.
4.5.g. VFB which represents the volume of the effective bitumen content in the
mixture is inversely related to air voids and hence as air voids decreases, the VFB
increases. Both additives, waste plastics and polypropylene show the similar trend.
0
1
2
3
4
5
6
0 1 3 5 7 9
Marshall Q
uotien
t( kN/m
m)
Additive (%)
SMA with WP
SMA with PP
Chapter 4 Marshall Mix Design and Analysis
School of Engineering, Cochin University of Science and Technology 67
Fig. 4.5.d Variation of air void with different additive %.
Fig. 4.5.e Variation of bulk specific gravity with different additive %
3.3
3.4
3.5
3.6
3.7
3.8
3.9
4
4.1
0 2 4 6 8 10
Air void (%
)
Additive (%)
SMA with WP
SMA with PP
2.31
2.32
2.33
2.34
2.35
2.36
2.37
2.38
0 2 4 6 8 10
Bul
k sp
ecifi
c gr
avity
Additive (%)
SMA with WP
SMA with PP

Chapter 4 Marshall Mix Design and Analysis
School of Engineering, Cochin University of Science and Technology 68
Fig. 4.5.f Variation of VMA with different additive %
Fig. 4.5.g Variation of VFB with different additive %
4.5.3 Moisture susceptibility
From Table 4.5 and 4.6, it can be observed that the retained stability is
significantly higher in the stabilized SMA mixtures as compared to the control
17
17.2
17.4
17.6
17.8
18
18.2
18.4
18.6
18.8
19
0 2 4 6 8
VMA
(%)
Additive (%)
SMA with WP
SMA with PP
78.5
79
79.5
80
80.5
81
0 2 4 6 8 10
VFB
(%)
Additive (%)
SMA with WP
SMA with PP

Chapter 4 Marshall Mix Design and Analysis
School of Engineering, Cochin University of Science and Technology 69
mixture. Retained stability value of more than 70% (Table 4.2) is suggested as a
criterion for a mixture to be resistant to moisture induced damages. It is seen that for
the control mixture, it is only 69 %, supporting the need for an additive in SMA
mixture. It also shows that the retained stability of the mixture increases with
increasing additive content initially up to 0.3% for fibre, 7% for waste plastics and 5%
for polypropylene and beyond these contents, the value is found to be decreasing.
Addition of 7% waste plastics in SMA resulted in the highest retained stability of
98%. Among the fibre stabilized mixtures, coir fibre stabilized mixture exhibits the
maximum value (95%). These results show that the presence of additives in the Stone
Matrix Asphalt mixture leads to a higher protection against water damage.
Both the cohesive properties of the bitumen and the adhesion of the bitumen to
the aggregate surfaces may affect as a result of exposing the bituminous mixtures to
moisture. Additive incorporation into bituminous mixtures helps to reduce the high
level of moisture damage that was noted in the control mix. Among the fibre
stabilized mixtures, the coir fibre stabilized mixes showed lower moisture
susceptibility than those of the other fibre mixes at the same fibre concentration. 0.3%
fibre concentrated mixes showed better resistance to water damage than that at other
concentration. Higher fibre concentration may have far too high void contents (balling
effect) which allow more water penetration into SMA mixtures.
In plastics stabilized and polypropylene stabilized SMA mixtures, the coating
of molten-plastics or polypropylene over the aggregate results in lesser voids and a
reduction in the water absorption of the mix. This, obviously results in higher retained
stability for the stabilized mixtures than the control mixture.
Table 4.5 Retained stability of SMA mixtures with fibres
Additive (%)
Retained stability (%)
Coir fibre Sisal fibre Banana fibre
0 69 69 69
0.1 84 82 81
0.2 90 89 88
0.3 95 93 93
0.4 92 90 90

Chapter 4 Marshall Mix Design and Analysis
School of Engineering, Cochin University of Science and Technology 70
Table 4.6 Retained stability of SMA mixtures with WP and PP
Additive content (%) Retained stability (%)
Polypropylene Waste plastic
0 69 69
1 82 81
3 89 86
5 96 92
7 94 98
9 90 97
4.5.4 Influence of additive content on Optimum binder content
All the results discussed above are based on the tests conducted on SMA
samples with different additives at a binder content of 6.42%, which is the optimum
binder content (OBC) of the Control SMA mixture. In order to study the influence of
additive content on OBC, the binder content is varied from 5.5 to 7.5% at an
increment of 0.5% for each percentage of additive content for different additives. A
total of 230 samples are prepared for this purpose and the Marshall tests have been
conducted. The OBC is obtained for each fibre stabilized mixtures at fibre contents of
0.1%, 0.2%, 0.3% and 0.4%. It is the average of the bitumen content corresponding to
4% air void and 17% VMA and is given in Table 4.7. For PP and WP stabilized
mixtures, additive content is varied from 1% to 9% at an increment of 2% and the
corresponding OBC is tabulated in Table 4.8.
Table 4.7 Optimum Binder Content at various % of fibre content
Fibre Content (%) Optimum Binder content (%)
Coir Sisal Banana 0 6.42 6.42 6.42
0.1 6.46 6.45 6.45
0.2 6.52 6.51 6.52
0.3 6.58 6.56 6.57
0.4 6.54 6.52 6.53

Chapter 4 Marshall Mix Design and Analysis
School of Engineering, Cochin University of Science and Technology 71
Table 4.8 Optimum Binder Content at various % of WP and PP content
Additive content (%) Optimum bitumen content (%)
SMA with WP SMA with PP
0 6.42 6.42
1 6.45 6.44
3 6.50 6.47
5 6.52 6.50
7 6.50 6.52
9 6.48 6.50
Test results show that the OBC varies depending on the type and dosage of
additives and it increases initially and then decreases with increasing additive content.
OBC increases by about 2.5% when fibre content increases from 0% to 0.3% and by
about 1.6% when PP content increases from 0% to 5% and WP content from 0% to 7%.
This result is explained as follows: Adding fibre requires more bitumen to
wrap onto its surface due to its absorption of light components of bitumen as
compared to polymer (Serfass and Samanos, 1996). With an increase in fibre content,
specific surface area increases and fibre absorbs more bitumen and thus OBC
increases (Wo D., 2000). However, after the fibre content reaches a certain value,
excessive fibres are unable to disperse uniformly in the mixture and susceptible to
coagulate, which actually does not improve the total specific areas, thus OBC
decreases.
The resulted OBC for the fibres can be ranked in a decreased order as follows: coir
fibre > banana fibre > sisal fibre > no fibre. This result is primarily due to the different
specific areas and the resulted different bitumen absorptions of different fibres. The coir
fibre has a loose structure with the highest specific surface area, which results in the
highest absorption of bitumen among these fibres (Table 4.7). But when all the additives
for the present investigation are analysed, it is evident that waste plastics stabilized
mixtures having the least bitumen content is more economical.
Chapter 4 Marshall Mix Design and Analysis
School of Engineering, Cochin University of Science and Technology 72
4.6 COMPARISON OF VARIOUS STABILIZED MIXTURES
Test results have illustrated that type of additive and its content play significant
role in the volumetric and mechanical properties of bituminous mixtures. Meanwhile,
results have clearly shown that different additives have different reinforcing effects.
Therefore, choice of appropriate additive type, design of optimum bitumen content,
and design of optimum additive content would be among the primary objectives for
the design of additive -reinforced bituminous mixtures.
Based on the Marshall test results discussed previously, an optimum fibre
content of 0.3% is recommended for fibre stabilized SMA mixtures, with which fibre
mixture exhibits the highest stability, Marshall Quotient and the residual stability and
also the specified volumetric characteristics. For the other additive stabilized mixtures,
the optimum additive content is 7% for waste plastics and 5% for polypropylene
respectively. The choice of additive type would consider both additive characteristics
and its reinforcement effects.
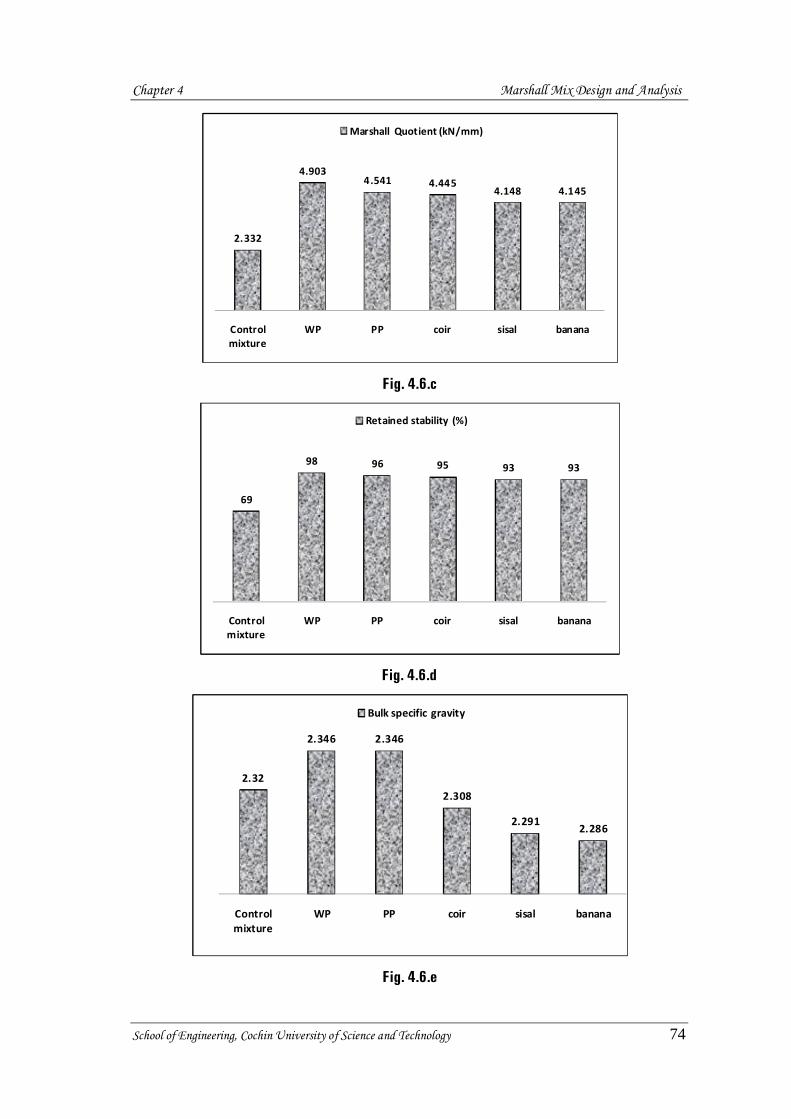
The variations of volumetric and mechanical properties of SMA at the
optimum additive content with different additives are shown in the Fig. 4.6.a to Fig.
4.6. h. It is observed that the additives have great impact on the properties of the gap
graded SMA mixture with rich binder content. There is significant improvement in the
characteristics of control mixture after adding additives, showing the influence of
additives on Stone Matrix Asphalt.
The percentage increase in stability value is significant at the optimum additive
content. The flow value of SMA mixtures decreases with an increase in additive
content. Stability and the Marshall quotient are almost doubled. Retained stability
result indicates that the extent of moisture induced damage is more for the control
mixture and it doesn’t fulfill the minimum criteria of 70%. But for all stabilized
mixtures, the value is more than 90% which supports the role of additives in SMA
mixture to reduce the moisture induced damages. Less flow value for the SMA
mixture with waste plastics shows the increased resistance of the mixture to plastic
flow. Regarding the voids, fibre stabilized mixtures show higher air voids and voids in
mineral aggregates than the other mixtures, but the voids filled with bitumen is more
in plastics stabilized mixtures. But in all stabilized mixtures, all the volumetric

Chapter 4 Marshall Mix Design and Analysis
School of Engineering, Cochin University of Science and Technology 73
characteristics are within the specification range which also supports the use of these
additives.
Among the fibre stabilized mixtures, coir stabilized SMA mix gives the best
results as compared to the other two stabilized mixtures. But, among all the mixtures
investigated, waste plastics stabilized SMA exhibits the highest stability, retained
stability, Marshall Quotient and bulk specific gravity as compared to the other
mixtures. So this waste material can be used as an effective additive in SMA instead
of expensive polymers and fibre additives.
Fig. 4.6.a
Fig. 4.6.b
7.416
13.712.843 12.58
11.862 11.854
Control mixture
WP PP coir sisal banana
Stability (kN)
3.18
2.792.83 2.83 2.86 2.86
Control mixture
WP PP coir sisal banana
Flow value(mm)
Chapter 4 Marshall Mix Design and Analysis
School of Engineering, Cochin University of Science and Technology 74
Fig. 4.6.c
Fig. 4.6.d
Fig. 4.6.e
2.332
4.9034.541 4.445
4.148 4.145
Control mixture
WP PP coir sisal banana
Marshall Quotient (kN/mm)
69
98 96 95 93 93
Control mixture
WP PP coir sisal banana
Retained stability (%)
2.32
2.346 2.346
2.308
2.2912.286
Control mixture
WP PP coir sisal banana
Bulk specific gravity

Chapter 4 Marshall Mix Design and Analysis
School of Engineering, Cochin University of Science and Technology 75
Fig. 4.6.f
Fig. 4.6.g
Fig. 4.6.h Fig.4.6 Comparison of the volumetric and mechanical properties of different stabilized
mixtures.
43.66 3.75
4.46 4.37 4.34
Control mixture
WP PP coir sisal banana
Air void (%)
18.86
17.96 17.96
19.28
19.88 20.03
Control mixture
WP PP coir sisal banana
VMA (%)

Chapter 4 Marshall Mix Design and Analysis
School of Engineering, Cochin University of Science and Technology 76
4.7. SUMMARY
The mix design and analysis of SMA mixtures stabilized with three natural
fibres (coir, sisal and banana), a waste material (shredded waste plastic) and a polymer
(polypropylene) are discussed in this chapter.
While increasing the percentage of additives in the mixture, Marshall stability
and retained stability of the mixture increases with respect to the control mixture and
obtained the maximum value at 0.3% fibre, 5% polypropylene and 7% waste plastic
content, beyond which these values show a decreasing trend. The flow value of the
mixtures decreases with respect to the control mixture. At any stage in all cases, the
values are within the required specified limits. As percentage fibre additive increases
in the SMA mixture, bulk specific gravity and VFB decreases while VMA and air
void increases irrespective of the type of fibre. In the case of other additives, the
increase in additive content resulted in an opposite trend for the above volumetric
properties. But all the results are within the specified limits.
Adding additives to Stone Matrix Asphalt mixture has shown improvement in
the volumetric and mechanical properties of the mixture. It can be inferred that these
stabilized SMA provide better resistance against permanent deformations (rutting) and
also indicate that these mixtures could be used in pavements where stiff bituminous
mixture is required.
Among the natural fibres, based on Marshall Mix design, coir fibre gives the
best result at 0.3 % fibre content with a percentage increase in stability value of about
70% and Marshall Quotient of 90% with respect to the control SMA. The retained
stability value is 95%. It can be observed that the highest Marshall stability is
achieved by specimens with 7% waste plastics and the percentage increase is about
82% with respect to the control SMA. This mixture also exhibits the highest retained
stability of 98%. The Marshall quotient is also doubled with respect to the control
mixture. It can be concluded that waste plastics stabilized Stone Matrix Asphalt
mixture provide better resistance against permanent deformations due to their high

Chapter 4 Marshall Mix Design and Analysis
School of Engineering, Cochin University of Science and Technology 77
stability and high MQ and it contributes to recirculation of plastic wastes as well as to
the protection of the environment. The effective utilisation of the waste plastics for
SMA mixtures will result in substantial increase in the scrap value for this otherwise
"undesirable waste material", which are getting littered all over the urban areas. This
will also lead to an ecofriendly sustainable construction method.
******
Related Documents
![MARSHALL MIX DESIGN METHOD FOR ASPHALTIC ... 832a February 22, 2013 (28 Pages) MARSHALL MIX DESIGN METHOD FOR ASPHALTIC CONCRETE (ASPHALT-RUBBER) [AR-AC] (An Arizona Method) 1. SCOPE](https://static.cupdf.com/doc/110x72/5aa5df047f8b9ab4788dc1c1/marshall-mix-design-method-for-asphaltic-832a-february-22-2013-28-pages-marshall.jpg)