Journal of Public Transportation Markets, Politics, and Environmental Policy Issues for Public Transit David A. Hens her The University of Sydney Michael E. Beesley London Business School Abstract 81 Economic deregulation of local bus services remains controversial in terms of the claimed gains and losses relative to competitive regulation in the form of competi- tive tendering or negotiated protected monopoly. The uncertainty over demonstrable net benefits has delayed, if not eliminated, any prospects for unleashing market forces in London where competitive tendering is claimed by its supporters to be at least as attractive as economic deregulation in terms of quantity and quality of service. While the literature has focused predominantly on the economic and social impacts of mar- ket reforms, some of the changes have brought about environmental gains and losses. These rarely have been documented, being overshadowed by the initial objectives motivating economic reform. One particular feature of economic deregulation in the United Kingdom (and to a lesser extent in Australia and New Zealand) has been the noticeable increase in minibus services. The impact that economic deregulation has on entrepreneurial innovation has been neglected in the public transport literature, yet it is a centerpiece of competitive strategy. We use the experience with minibuses in Britain to show how markets create environmentally compatible incentives. Environ- Vol. J, No. 4, 1997

Welcome message from author
This document is posted to help you gain knowledge. Please leave a comment to let me know what you think about it! Share it to your friends and learn new things together.
Transcript
Journal of Public Transportation
Markets, Politics, and Environmental Policy Issues for Public Transit
David A. Hens her The University of Sydney
Michael E. Beesley London Business School
Abstract
81
Economic deregulation of local bus services remains controversial in terms of the claimed gains and losses relative to competitive regulation in the form of competitive tendering or negotiated protected monopoly. The uncertainty over demonstrable net benefits has delayed, if not eliminated, any prospects for unleashing market forces in London where competitive tendering is claimed by its supporters to be at least as attractive as economic deregulation in terms of quantity and quality of service. While the literature has focused predominantly on the economic and social impacts of market reforms, some of the changes have brought about environmental gains and losses. These rarely have been documented, being overshadowed by the initial objectives motivating economic reform. One particular feature of economic deregulation in the United Kingdom (and to a lesser extent in Australia and New Zealand) has been the noticeable increase in minibus services. The impact that economic deregulation has on entrepreneurial innovation has been neglected in the public transport literature, yet it is a centerpiece of competitive strategy. We use the experience with minibuses in Britain to show how markets create environmentally compatible incentives. Environ-
Vol. J, No. 4, 1997
82 Journal of Public Transportation
mental gains attributable to market reform counter in part the negative evidence that minibuses in Britain have ''failed" to stimulate an aggregate increase in ridership. Without knowing the counterfactuals, one might speculate that the outcome would have been even worse without the introduction of the minibus.
Introduction The United Kingdom experience of bus deregulation and privatization has
been taken as perhaps the most important example of the role of using market forces to meet government objectives in transport. Economic deregulation in 1985 was designed to remove the binding constraint on competitive bus entry, leaving the latent barriers to entry to be revealed. The academic debate has been extensive (see Mackie and Preston 1996; Mackie et al. 1995; Beesley and Glaister 1985; Gwilliam et al. 1985). It has tended to be polarized as a confrontation of two views: either to let market forces decide what should be provided in terms of bus outputs and qualities, or retain government definitions of what should be produced, while using market processes to provide the means via competitive tendering. It is a common belief that either leads to substantial cost savings; the disagreement is about the resulting level and quality of outputs.
One important argument in the political debate that has assumed much greater practical importance in the last I 0 years-namely, environmental objectiveshas been neglected in the exchanges on bus policy. Specifically, it is unclear what influence the changes have had on emissions, which are seen of great environmental significance. We offer a preliminary view, concentrating in particular on the impact of the minibus "revolution" on greenhouse gas emissions and using the counterfactual of a similar aggregate bus sector output.
The impact that economic deregulation has on entrepreneurial innovation has been neglected in the public transport literature, yet it is a centerpiece of competitive strategy. Seeking out entrepreneurial activity is an attractive way of shifting political agendas, at least in the countries with which we are most familiar, the U.K. and Australia; yet it has not been fully exploited by the privatization process, which emphasizes almost exclusively the reduction in the burden of government debt.
Vol. I. No. 4. 1997
Journal of Public Transportation 83
A great attraction of the outcome of minibus provision is that it is politically'plausible, since the means employed to realize policy objectives are themselves credible-by reducing subsidy and improving customer service. Such innovation consistent with incentives, driven largely by market conditions, are fundamental to long-run profit and, hence, have appeal to entrepreneurial bus operators.
We use the experience with minibuses in Britain to show how markets create environmentally compatible incentives. Environmental gains attributable to market reform counter, in part, the negative evidence that minibuses in Britain have "failed" to stimulate an aggregate increase in ridership. Without knowing the true counterf actuals, one might speculate that the outcome would have been even worse without the introduction of the minibus.
Market Forces as Natural Generators of Innovative Activity The view that government must intervene in an overt way for negative envi
ronmental impacts to be minimized is as alive today as it was 30 years ago when, in July 1966, the U.K. Minister of Transport presented to Parliament the white paper titled "Transport Policy" (HMSO 1966). The first paragraph stated that:
. . . The rapid development and mass production of the motor vehicle over the past 20 years has brought immense benefits to millions of people: increased mobility, a fuller social life, family enjoyment, new experiences ..... But at the same time it has brought severe discomforts: congestion in the streets of our towns; the misery of the journey to work for commuters; noise, fumes and danger as the setting of our lives; a rising trend of casualties on our roads and a threat to our environment in both town and countryside which if it continues unchecked, will ensure that the pleasure and benefit for which we use the car will increasingly elude us. The aim of a rational transport policy must be to solve this paradox.
Vol. I, No. 4, 1997
84 Journal of Public Transportation
The policy statement went on to state:
. . . Our towns and cities will never be able to cope with their traffic, or the transport needs of millions of people, without strengthening, improving and expanding their public transport services .... Clearly these services must adapt themselves to new technological developments, but to get more people . . . moved with less road space is vital to the solution of our transport problems .... New thinking is required, not only about types and combinations of public transport, but also about how they should be financed. To attempt to solve these problems in exclusively commercial terms is to bring the Victorian mentality to the solution of modem needs.
An implication of this white paper is that government, through planning processes, has a greater chance of providing the necessary incentives to secure improved public transport as an antidote to the automobile, in contrast to the market. This duly underpinned the government's attitude toward public transport, and its willingness to subsidize to do so, whatever party was in power, up to the early 1980s. The position promoted in this paper is that the information required by government to plan can only be generated efficiently if markets are allowed to function. Deregulation in Britain since 1985 provides the best empirical setting for evaluating the innovations that have been initiated by the power of the market (even if the benefits have spilled over into all supply regimes) (Gomezlbafiez and Meyer 1997).
While it is true that, to date, demonstration of gains to bus business from environmental innovativeness, in particular, is not widespread, there is very encouraging evidence emerging (see below) that market forces create opportunities for innovative activity, which is not only supportive of profits but has desirable environmental outcomes. Through the example of minibuses-a product of market driven incentives-we show that government, prior to the 1985 Act, may have restricted the opportunities to improve public transport in contrast to acting as if they were embellishing opportunities for better public transport.
Vol. I. No. 4. 1997
Journal of Public Transportation 85
The question not addressed in the literature on bus provision is the extent to which innovative opportunities are greater under regimes that lessen the power of the regulator in delivery of services. It may be the case that the empirical evidence, as limited as it is, is misleading because of the failure of incentive structures to deliver the gains that are inherent in a less constrained market. What we need to understand are the circumstances under which incentives can evolve and be effective. One problem with the bus industry may be that the lack of experience in managing change and/or the reticence in being innovative, given a history of suppression of innovation, is hampering the speed of taking up opportunities waiting for action. Generational inheritance, for example, which often lacks an understanding of the need to sustain wealth and survival, leads to a reduction in entrepreneurial activity and, hence, a decline in any potential innovation. Why has the minibus and hail-n-ride only been introduced in the era of deregulation/competitive regulation and potential competition in the U.K., New Zealand, and Australia? As Porter and van der Linde ( 1995) comment in the context of environmental innovativeness spurred by competition:
We are currently in a transitional phase of industrial history where companies are still inexperienced in dealing creatively with environmental issues.
The literature that looks at the broader set of potential benefits concentrates on direct benefits to users (e.g., Nash 1988; Ellis et al. 1996; Evans 1990; Mackie et al. 1995) showing variability in gains and losses to users. A strong case has also been mounted against supply opportunities that do not preserve the regulator's control on demand-coordinating mechanisms such as timetables and ticketing (see also Tyson 1995). Indeed, Evans' ( 1990) argument for natural monopoly in the supply oflocal schedule route services is predicated entirely on the role of economies of network interdependencies so as to minimize uncertainty and waiting time, etc., in transfers.
Vol. I. No. 4. 1997
86 Journal of Public Transportation
The Minibus and the Environment Urban passenger transport demand is multi-dimensional. It encompasses
the location of activities, the alternative travel opportunities available, and the availability of types of motorized and non-motorized transport. A potential user of the transport system faces choice opportunities with varying degrees of availability. In the long run, individuals have increasing opportunities to review all key transport-related choices-where to live, where to work, the number and types of automobiles in the household, the choice of means of transport and time of departure for the journey to work, and even negotiation of the temporal and spatial nature of working hours (i.e., flextime, a compressed work week and telecommuting). In the short run, some of these choices are not available and, hence, condition the choices that can be evaluated and changed.
Using a model system of the household sector developed for Perth, West Australia (Hensher 1996), we have evaluated their impact over the period 1993-2003. The model system is an integrated land-use and transport system incorporating linked models for household location decisions, vehicle choice decisions and travel decisions (timing, mode choice, workplace location choice).
The behavioral models in the simulator are presented in sub-modules representing the four natural divisions of:
(I) commuter choice: spatial and temporal choice of working hours, de-partur~ time choice, mode choice, and workplace location choice;
(2) automobile choice: vehicle type choice and household fleet size choice; (3) residential choice: location and dwelling type choice; and ( 4) automobile use: total annual vehicle and household kilometers and the
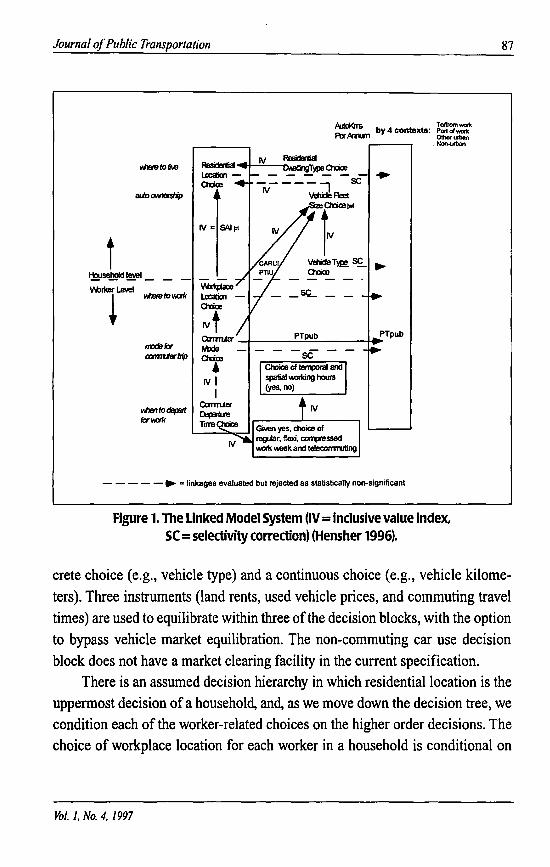
spatial composition of kilometers. The decision blocks for location decisions, vehicle decisions, and travel
decisions and their major linkages are summarized in Figure I. Each of the blocks has a set of internal linkages; the blocks are themselves linked by a set of external linkages. The inclusive value (IV) indices provide behavioral linkages between discrete choices that are globally consistent with utility maximization; the selectivity correction (SC) indices provide equivalent linkages between a dis-
Vol. I, No. 4, 1997
Journal of Public Transportation
A.ltd<n& by 4 contexts: • i~ = Per Mun Othctt urban
. Non-urblln
Residenia vhJt9 to rr.e
- ~)1)8~ - .. -----~
SC
stio CNnfJISlip N \lehidC Fleet
N= 5'\l jrt r~ i VdlideT~ ~ • ~~'-
ODm
V\.bfl<er Level Mtaeto\Ok _sc._
i - - • ODce
Nt PT pub PT pub
m:xJefor -axrmtertJfp ~
- - - - - • = linkages evaluated but rejected as statistically non-significant
Figure 1. The Linked Model System (IV= indusive value index, SC= selectivity correction) (Hensher 1996).
87
crete choice (e.g., vehicle type) and a continuous choice (e.g., vehicle kilometers). Three instruments (land rents, used vehicle prices, and commuting travel times) are used to equilibrate within three of the decision blocks, with the option to bypass vehicle market equilibration. The non-commuting car use decision block does not have a market clearing facility in the current specification.
There is an assumed decision hierarchy in which residential location is the uppermost decision of a household, and, as we move down the decision tree, we condition each of the worker-related choices on the higher order decisions. The choice of workplace location for each worker in a household is conditional on
Vol. 1, No. 4, I 997
88 Journal of Public Transportation
the household's choice of residential location. Likewise, the choice of commuter mode is conditional on the choice of residential and workplace location. The presence of more than one worker in a household is allowed for by having a separate choice for each worker, together with additional exogenous variables to account for the influence of the number of workers on each worker's choice of mode, workplace, and household residential location. The modal opportunities include the set of available alternatives and possible future investments in "new" modes in specific spatial contexts, such as light rail and bus priority systems. Stated choice experiments are combined with revealed preference data in the estimation of the departure time choice and commuter mode choice models. Full details of the simulator are presented in Hensher (1996) and Hensher et al. ( 1995).
To understand how we identify the impact of a policy instrument, consider an increase in service frequency. The imposition of this improved service via its impact on the generalized cost of using buses has an immediate and direct influence on (I) the use of each competing means of transport for particular trips such as the commuter trip, (2) a possible change in the timing of the particular journey, which creates a further change in the generalized costs associated with traffic congestion, and, hence, (3) a possible change in the overall and non-commuting use of each automobile available to a household. It may directly affect the household's choice of types of automobiles. The indirect impacts may, in the longer term, include a change in residential location via the change in modal and spatial accessibility to work opportunities, and a change in the number of vehicles in a household (given the reduced demand for auto use). Changes in residential location may further affect the total use of each automobile, as well as the mix of urban (commuting and non-commuting) and non-urban kilometers. The adjustment in commuter travel may also affect non-commuting car use.
The adjustments in vehicle, travel, and location choices at the household level translate at the aggregate level into a new set of equilibrium levels for traffic congestion (broadly measured by the ratio of travel time to distance traveled), residential densities, total kilometers of travel by automobiles and various forms of public transport, fuel consumed, and greenhouse gas emissions. Table 1
Vol. I. No. 4. I 997
Journal of Public Transportation
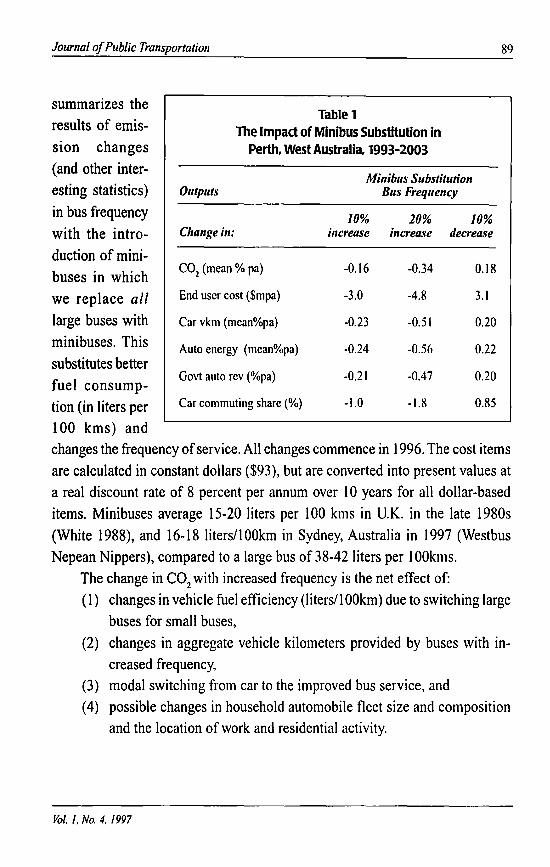
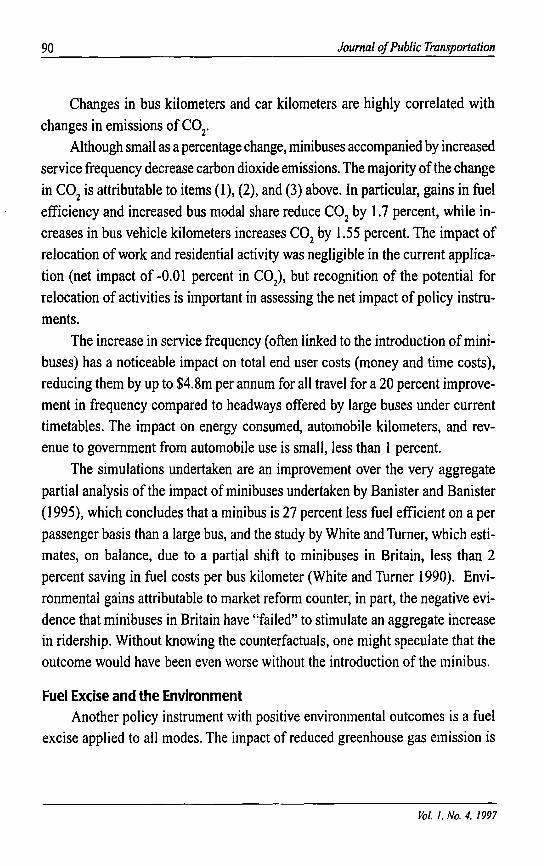
summarizes the results of emission changes (and other interesting statistics) in bus frequency with the introduction of minibuses in which we replace all
large buses with minibuses. This substitutes better fuel consumption (in liters per 100 kms) and
Table 1 The Impact of Minibus Substitution in
Perth, West Australia, 1993-2003
Mbrihus Substitution Outputs Bus Frequency
10% 10% 10% Change in: iii crease increase decrease
co2 (mean% pa) -0.16 -0.34 0.18
End user cost ($mpa) -3.0 -4.8 3.1
Car vkm (meano/opa) -0.23 -0.51 0.20
Auto energy (meano/opa) -0.24 -0.56 0.22
Govt auto rev (%pa) -0.21 -0.47 0.20
Car commuting share (%) -1.0 -1.8 0.85
89
changes the frequency of service. All changes commence in 1996. The cost items are calculated in constant dollars ($93), but are converted into present values at a real discount rate of 8 percent per annum over 10 years for all dollar-based items. Minibuses average 15-20 liters per 100 kms in U.K. in the late 1980s (White 1988), and 16-18 liters/I OOkm in Sydney, Australia in 1997 (Westbus Nepean Nippers), compared to a large bus of 38-42 liters per I OOkms.
The change in C02 with increased frequency is the net effect of:
( 1) changes in vehicle fuel efficiency (liters/ I OOkm) due to switching large buses for small buses,
(2) changes in aggregate vehicle kilometers provided by buses with in-creased frequency,
(3) modal switching from car to the improved bus service, and ( 4) possible changes in household automobile fleet size and composition
and the location of work and residential activity.
Vol. I. No. 4. 1997
90 Journal of Public Transportation
Changes in bus kilometers and car kilometers are highly correlated with changes in emissions of C0
2•
Although small as a percentage change, minibuses accompanied by increased service frequency decrease carbon dioxide emissions. The majority of the change in C0
2 is attributable to items (1), (2), and (3) above. In particular, gains in fuel
efficiency and increased bus modal share reduce CO 2 by 1. 7 percent, while increases in bus vehicle kilometers increases C02 by 1.55 percent. The impact of relocation of work and residential activity was negligible in the current application (net impact of -0.01 percent in C0
2), but recognition of the potential for
relocation of activities is important in assessing the net impact of policy instruments.
The increase in service frequency (often linked to the introduction of minibuses) has a noticeable impact on total end user costs (money and time costs), reducing them by up to $4.8m per annum for all travel for a 20 percent improvement in frequency compared to headways offered by large buses under current timetables. The impact on energy consumed, automobile kilometers, and revenue to government from automobile use is small, less than I percent.
The simulations undertaken are an improvement over the very aggregate partial analysis of the impact of minibuses undertaken by Banister and Banister ( 1995), which concludes that a minibus is 27 percent less fuel efficient on a per passenger basis than a large bus, and the study by White and Turner, which estimates, on balance, due to a partial shift to minibuses in Britain, less than 2 percent saving in fuel costs per bus kilometer (White and Turner 1990). Environmental gains attributable to market reform counter, in part, the negative evidence that minibuses in Britain have "failed" to stimulate an aggregate increase in ridership. Without knowing the counterfactuals, one might speculate that the outcome would have been even worse without the introduction of the minibus.
Fuel Excise and the Environment Another policy instrument with positive environmental outcomes is a fuel
excise applied to all modes. The impact of reduced greenhouse gas emission is
Vol. I. No. 4. 1997
Journal of Public Transportation
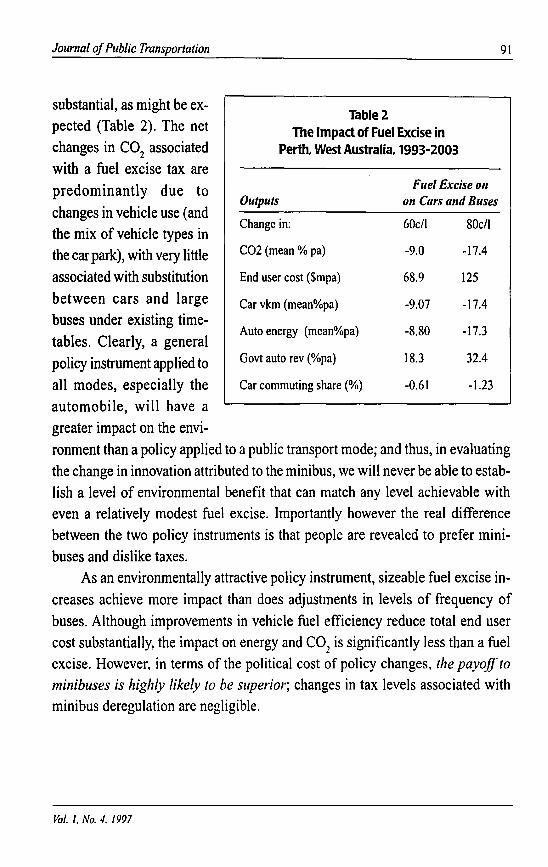
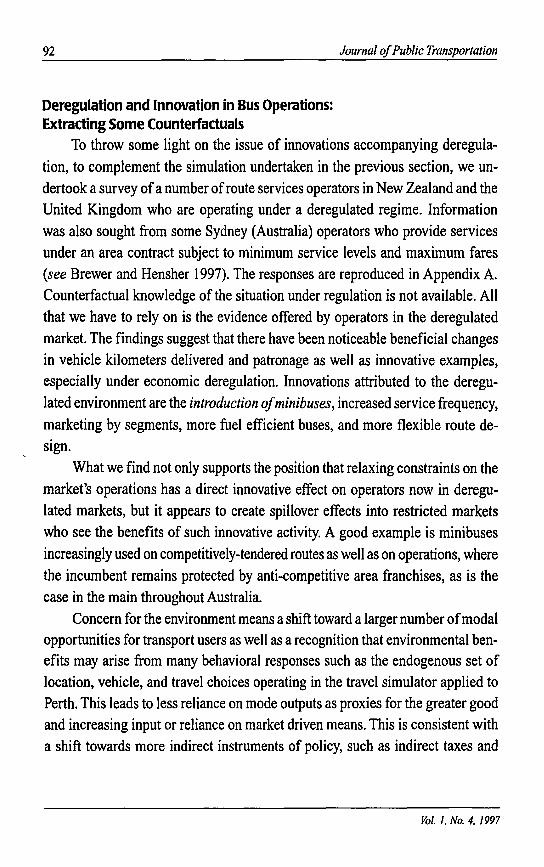
substantial, as might be expected (Table 2). The net changes in co2 associated with a fuel excise tax are predominantly due to changes in vehicle use (and the mix of vehicle types in the car park), with very little associated with substitution between cars and large buses under existing timetables. Clearly, a general policy instrument applied to all modes, especially the automobile, will have a greater impact on the envi-
Table 2 The Impact of Fuel Excise in
Perth, West Australia, 1993-2003
Fuel Excise on Outputs on Cars and Buses
Change in: 60c/I 80c/l
C02 (mean % pa) -9.0 -17.4
End user cost ($mpa) 68.9 125
Car vkm ( mean%pa) -9.07 -17.4
Auto energy ( mean%pa) -8.80 -17.3
Govt auto rev (%pa) 18.3 32.4
Car commuting share (%) -0.61 -1.23
91
ronment than a policy applied to a public transport mode; and thus, in evaluating the change in innovation attributed to the minibus, we will never be able to establish a level of environmental benefit that can match any level achievable with even a relatively modest fuel excise. Importantly however the real difference between the two policy instruments is that people are revealed to prefer minibuses and dislike taxes.
As an environmentally attractive policy instrument, sizeable fuel excise increases achieve more impact than does adjustments in levels of frequency of buses. Although improvements in vehicle fuel efficiency reduce total end user cost substantially, the impact on energy and C0
2 is significantly less than a fuel
excise. However, in terms of the political cost of policy changes, the payoff to minibuses is highly likely to be superior; changes in tax levels associated with minibus deregulation are negligible.
Vol. I. No. 4. 1997
92 Journal of Public Transportation
Deregulation and Innovation in Bus Operations: Extracting Some Counterfactuals
To throw some light on the issue of innovations accompanying deregulation, to complement the simulation undertaken in the previous section, we undertook a survey of a number of route services operators in New Zealand and the United Kingdom who are operating under a deregulated regime. Information was also sought from some Sydney (Australia) operators who provide services under an area contract subject to minimum service levels and maximum fares (see Brewer and Hensher 1997). The responses are reproduced in Appendix A. Counterfactual knowledge of the situation under regulation is not available. All that we have to rely on is the evidence offered by operators in the deregulated market. The findings suggest that there have been noticeable beneficial changes in vehicle kilometers delivered and patronage as well as innovative examples, especially under economic deregulation. Innovations attributed to the deregulated environment are the introduction of minibuses, increased service frequency, marketing by segments, more fuel efficient buses, and more flexible route design.
What we find not only supports the position that relaxing constraints on the market's operations has a direct innovative effect on operators now in deregulated markets, but it appears to create spillover effects into restricted markets who see the benefits of such innovative activity. A good example is minibuses increasingly used on competitively-tendered routes as well as on operations, where the incumbent remains protected by anti-competitive area franchises, as is the case in the main throughout Australia.
Concern for the environment means a shift toward a larger number of modal opportunities for transport users as well as a recognition that environmental benefits may arise from many behavioral responses such as the endogenous set of location, vehicle, and travel choices operating in the travel simulator applied to Perth. This leads to less reliance on mode outputs as proxies for the greater good and increasing input or reliance on market driven means. This is consistent with a shift towards more indirect instruments of policy, such as indirect taxes and
Vol. I, No. 4, 1997
Journal of Public Transportation 93
competitive rules, rather than protection or enhancement of particular transport modes.
Furthermore, allowing markets to generate fresh opportunities for profit making is a means to encourage relevant charitable activities. Successful business people are able to pursue their own enthusiasms because of that profit. Indeed, the outstanding innovations have arisen in this way. Perhaps most notable in the U.K. were the pioneering efforts in housing and planning by the chocolate and soap entrepreneurs, Cadbury, Rowntree, and Lever. Nowadays, environmental innovation should be no exception, and successful transport operators are seen as a fertile ground. In the research for this paper, for example, we found minibus operators to be unaware of the possible connection between their operation and pollution reduction. Once it is pointed out via the indirect effects we have described, interest is stimulated by the perception that here is another reason for minibus operations to be preferred by policymakers and is a case of promoting the public interest while making a profit. It is then quite conceivable that their interest will broaden into trade-offs that create more benefits even where this involves some increases in their outgoings-for example, on an excise tax imposed on all vehicles of a given engine capacity.
Concluding Thoughts If it can be shown that there are political credits from innovations in the bus
sector that are supportive of broad-based environmental objectives of government, then this gets political attention. It also raises the limitation of the promotion of better cost-benefit analysis in a political sense-at the margin, CBA enhancements cannot be traded since other politically-competing sectors fail dismally in producing such sophistication in technique to evaluate projects.
The empirical evidence that economic deregulation in the U.K. has produced sizeable increases in vehicle kilometers but no noticeable increase in passenger kilometers might, in a partial equilibrium setting, lead to the conclusion that the minibus has contributed to the aggregate reduction in passenger kilometers. What is missing in this inference is the counterfactual that may show an
Vol. 1, No. 4, 1997
94 Journal of Public Transportation
even worse diminution in passenger kilometers in the absence of the minibus "revolution." What we can suggest, however, is that the minibus has brought with it, on our evidence, small but noticeable environmental benefits (which may be even greater with the counterfactuals as the base).
If the unchanged quantity of patronage is now traveling on more environmentally-friendly bus systems in contrast to the pre-deregulated era, then the systemwide environmental benefits are positive. In particular, less greenhouse gas emissions are being generated in the delivery of an economic deregulated service. The example for greenhouse gas emissions should be extended to include other environmental impacts such as air quality, noise, and safety. •!•
References Banister, D., and C. Banister. 1995. Energy Consumption in Transport in Great Britain:
Macro Leve Estimates, Transportation Research, 29A (1 ): 21-32. Beesley, M.E., and S. Glaister. 1985. Deregulating the Bus Industry in Britain-(C) A
Response, Transport Reviews, 5: 105-132. Berechman, J. 1993 Public Transit Economics and Deregulation Policy, North Hol
land, Amsterdam. Brewer, A., and D. A. Hensher. 1997. Operating a Bus and Coach Business: Insights
and Practice, Sydney: Allen and Unwin. Brindle, R. E. 1992. Transport and Land Use: A "Neo-Modem" Approach, Proceed
ings 16th Australian road Research Board Conference, Part 6: 111-136. Ellis, C. J., and E. C. D. Silva. 1996. British Bus Deregulation, Preemption and De
mand Coordination, Department of Economics, Eugene: University of Oregon (mimeo).
Evans. A. 1990. Competition and the Structure of Local Bus Markets, Journal of TransportEconomics and Policy, XXXIV (3), September: 255-282.
Gastaldi, M., J. P. Pradayrol, E. Quinet, and M. Rega. 1996. Valuation of Environmental Externalities: From Theory to Decision-Making, Transportation Planning and Technology 19: 207-219.
Gomez-lbaiiez, J. A., and J. R. Meyer. 1997. Alternatives for Urban Bus Services: An
International Perspective on the British Reform, Transport Reviews, 17 (1 ): 17-30.
Vol. /,No. 4, 1997
Journal of Public Transportation 95
Goodwin, P. B., S. Hallett, F. Kenny, and G. Stokes. 1991. Transport: The New Realism, report to Rees Jeffrey Road Fund, Transport Studies Unit, University of Oxford.
Gwilliam, K. M., and D. M. Van De Velde. 1990. The Potential for Regulatory Change in European Bus Markets, Journal of Transport Economics and Policy, XXIV (3), September: 333-350.
Gwilliam, K. M., C. A. Nash, and P. J. Mackie. 1985. Deregulating the Bus Industry in Britain-- (B) The Case Against, Transport Reviews 5: 105-132.
Hensher, D. A. 1994. Transport Planning, Markets and Government: Challenges for the Future, International Journal of Transport Economics XXI (2): 147-156.
Hensher, D.A. 1996. An Integrated Approach to Modelling the Impact on Urban Travel Behaviour of Strategies to Reduce Enhanced Greenhouse Gas Emissions, World Transport Research, Proceedings of the 7th World Conference on Transport Research, edited by Hensher, D.A., J. King, and T. Oum, Oxford: Pergamon Press, Vol l: 271-286.
Hensher, D. A., F. W. Milthrope, and M. Lowe. 1995. Greenhouse Gas Emissions and
the Demand/or Urban Passenger Transport: Final Report: Summmy o.f Approach and Selective Results from Application of the ITSIBTCE SimulatOJ; Report 8, Institute of Transport Studies, The University of Sydney, November.
HMSO. 1966. Transport Policy, Cmnd. 3057, London: HMSO. Kennedy, D. 1996. London Bus Tendering: A Welfare Balance, Transport Policy 2 (4):
243-250. Klein, P. G. (ed.). 1993. The Fortunes of Liberalism: Essays 011 Austrian Economics
and the Ideal of Freedom, The Collected Works of EA. Hayek, Volume IV, London: Routledge.
Mackie, P., J. Preston, and C. A. Nash. 1995. Bus Deregulation: Ten Years On, Transport Reviews, 15(3 ): 229-25 l
Mackie, P., and J. Preston. 1996. The Local Bus Market: A Case Stm(v of Regulat01y Change, Aldershot: Avebury.
Nash, C. A. 1988. Integration of Public Transport: An Economic Assessment, in Dodgson, J.S., and N. Topham (eds.), Bus Deregulation and Privatization: An International Perspective, Aldershot: Avebury: 97-118.
Vol. J. No. 4, J 997
96 Journal of Public Transportation
Porter, M. E., and C. Van Der Linde. 1995. Toward a New Conception ofEnvironmentCompetitiveness Relationship, Journal of Economic Perspectives 9 (4): 97-118.
Salomon, I., P. Bovy, and J.P. Orfeuil (eds). 1993. A Billion Trips a Day: Tradition and Transition in European Travel Patterns, Dordrecht: Kluwer Academic Publishers.
Toleman, R. 1995. Refocussing the Role of Government in Transport: The New Zealand Experience, paper presented to 7th World Conference on Transport Research, July 16-21, Sydney.
Tyson, W. J. 1995 Bus Deregulation-The Planning Dilemma, Transport Reviews 15 (4): 307-314.
White, P.R. 1997. What Conclusions Can be Drawn about Bus Deregulation in Britain?, Transport Reviews 11 (I): 1-16.
White, E. P. R. 1988. An Overview of Urban Minibus Operations, paper presented at Symposium on Experiences of Urban Minibus Operations in Britain, City University, London, May 12.
White, P., and R. Turner. 1991. Overall Impacts of Local Bus Deregulation in Britain, Transportation Planning and Technology 15: 203-229.
Appendix A Innovative Opportunities and Key Changes in Operations
for "Better-Practice" Operators
Specific notable changes:
Monopoly Operations (threat of tendering only)
(I) Enhanced cross-regional services, improved off-peak services and introduced "set-down" on request.
Overall change in kilometers:
(I) Over period 92/93-95/96 increased by 12%. Overall change in passengers:
(1) Over period 92/93-95/96 increased by 3%. Overall change in fare levels:
(1) Over period 92/93-95/96, increased by 2% pa.
Vol. I. No. 4. 1997
Journal of Public Transportation
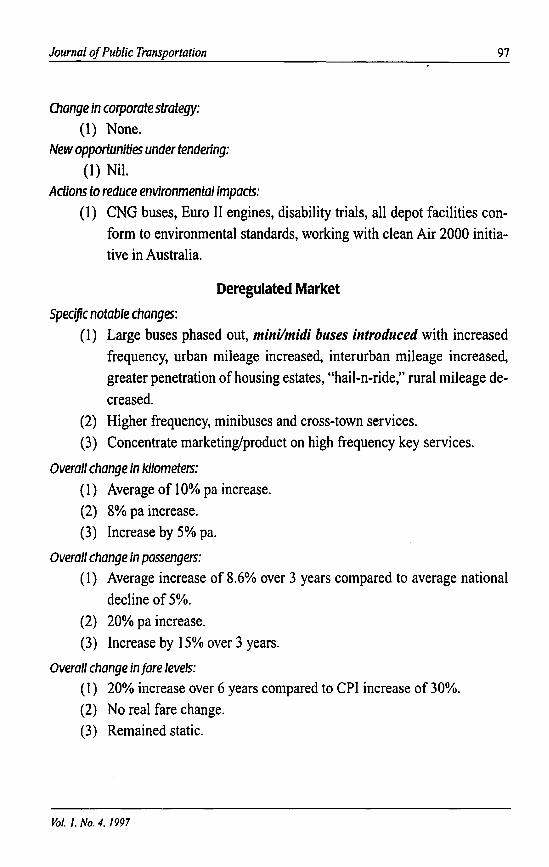
Change in corporate strategy: (1) None.
New opportunities under tendering:
(1) Nil. Actions to reduce environmental impacts:
97
(1) CNG buses, Euro II engines, disability trials, all depot facilities conform to environmental standards, working with clean Air 2000 initiative in Australia.
Deregulated Market
Specific notable changes: (I) Large buses phased out, mini/midi buses introduced with increased
frequency, urban mileage increased, interurban mileage increased, greater penetration of housing estates, "hail-n-ride," rural mileage decreased.
(2) Higher frequency, minibuses and cross-town services. (3) Concentrate marketing/product on high frequency key services.
Overall change in kilometers:
(I) Average of I 0% pa increase. (2) 8% pa increase. (3) Increase by 5% pa.
Overall change in passengers: ( 1) Average increase of 8.6% over 3 years compared to average national
decline of 5%. (2) 20% pa increase. (3) Increase by 15% over 3 years.
Overall change in fare levels:
( 1) 20% increase over 6 years compared to CPI increase of 30%. (2) No real fare change. (3) Remained static.
Vol. I. No. 4. 1997
98 Journal of Public Transportation
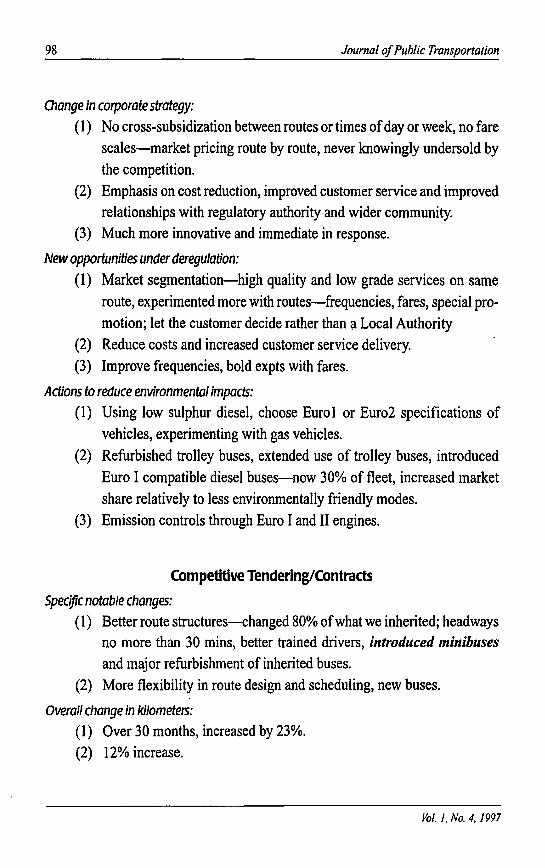
Change in corporate strategy:
( 1) No cross-subsidization between routes or times of day or week, no fare scales-market pricing route by route, never knowingly undersold by the competition.
(2) Emphasis on cost reduction, improved customer service and improved relationships with regulatory authority and wider community.
(3) Much more innovative and immediate in response.
New opportunities under deregulation:
( 1) Market segmentation-high quality and low grade services on same route, experimented more with routes-frequencies, fares, special promotion; let the customer decide rather than ~ Local Authority
(2) Reduce costs and increased customer service delivery. (3) Improve frequencies, bold expts with fares.
Actions to reduce environmental impacts:
(1) Using low sulphur diesel, choose Eurol or Euro2 specifications of vehicles, experimenting with gas vehicles.
(2) Refurbished trolley buses, extended use of trolley buses, introduced Euro I compatible diesel buses-now 30% of fleet, increased market share relatively to less environmentally friendly modes.
(3) Emission controls through Euro I and II engines.
Competitive Tendering/Contracts
Specific notable changes: ( 1) Better route structures-changed 80% of what we inherited; headways
no more than 30 mins, better trained drivers, introduced minibuses and major refurbishment of inherited buses.
(2) More flexibility in route design and scheduling, new buses.
Overall change in kilometers: (1) Over 30 months, increased by 23%. (2) 12% increase.
Vol. I, No. 4, 1997
Journal of Public Transportation
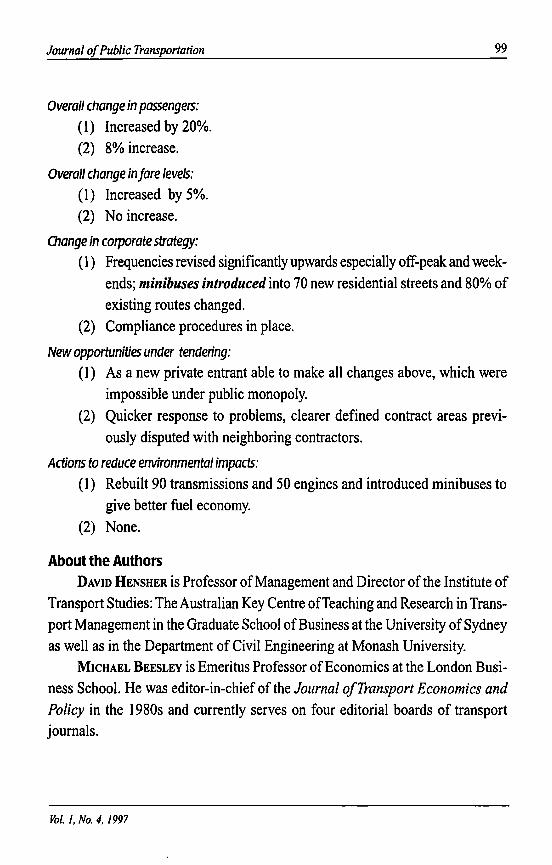
Overall change in passengers: ( 1) Increased by 20%. (2) 8% increase.
Overall change in fare levels: (1) Increased by 5%. (2) No increase.
Change in corporate strategy:
99
( 1) Frequencies revised significantly upwards especially off-peak and weekends; minibuses introduced into 70 new residential streets and 80% of existing routes changed.
(2) Compliance procedures in place.
New opportunities under tendering: (1) As a new private entrant able to make all changes above, which were
impossible under public monopoly. (2) Quicker response to problems, clearer defined contract areas previ
ously disputed with neighboring contractors.
Actions to reduce environmental impacts:
( 1) Rebuilt 90 transmissions and 50 engines and introduced minibuses to give better fuel economy.
(2) None.
About the Authors DAVID HENSHER is Professor of Managem~nt and Director of the Institute of
Transport Studies: The Australian Key Centre of Teaching and Research in Transport Management in the Graduate School of Business at the University of Sydney as well as in the Department of Civil Engineering at Monash University.
MICHAEL BEESLEY is Emeritus Professor of Economics at the London Business School. He was editor-in-chief of the Journal o.fTransport Economics and Policy in the 1980s and currently serves on four editorial boards of transport journals.
Vol./, No. 4, 1997
Related Documents