Marketing to Adults 50+ Marketing to Adults 50+ 1

Marketing to Adults 50+ 1. Demographic TrendsSlides 3-133-13 Spending PatternsSlides 14-1914-19 Media/Technology Usage Slides 20-2820-28 Marketing to.
Dec 16, 2015
Welcome message from author
This document is posted to help you gain knowledge. Please leave a comment to let me know what you think about it! Share it to your friends and learn new things together.
Transcript
Marketing to Adults 50+Marketing to Adults 50+Marketing to Adults 50+Marketing to Adults 50+
1
Marketing to Adults 50+Marketing to Adults 50+Marketing to Adults 50+Marketing to Adults 50+
Demographic Trends Slides 3-13 Spending Patterns Slides 14-19 Media/Technology Usage Slides 20-28 Marketing to Adults 50+ Slides 29-31
2
Demographic TrendsDemographic TrendsDemographic TrendsDemographic Trends
3
Marketing to Adults 50+ Marketing to Adults 50+ Grows in ImportanceGrows in Importance
Marketing to Adults 50+ Marketing to Adults 50+ Grows in ImportanceGrows in Importance
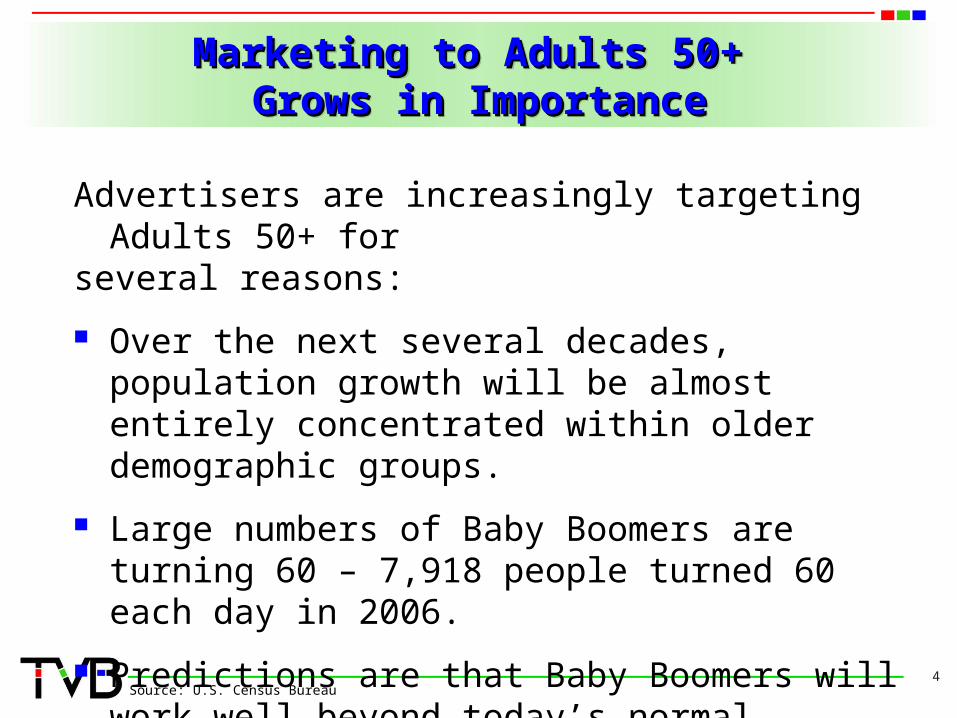
Advertisers are increasingly targeting Adults 50+ for
several reasons:
Over the next several decades, population growth will be almost entirely concentrated within older demographic groups.
Large numbers of Baby Boomers are turning 60 – 7,918 people turned 60 each day in 2006.
Predictions are that Baby Boomers will work well beyond today’s normal retirement age. 4
Source: U.S. Census Bureau
Percent Population Distribution Percent Population Distribution of Adults 50+of Adults 50+
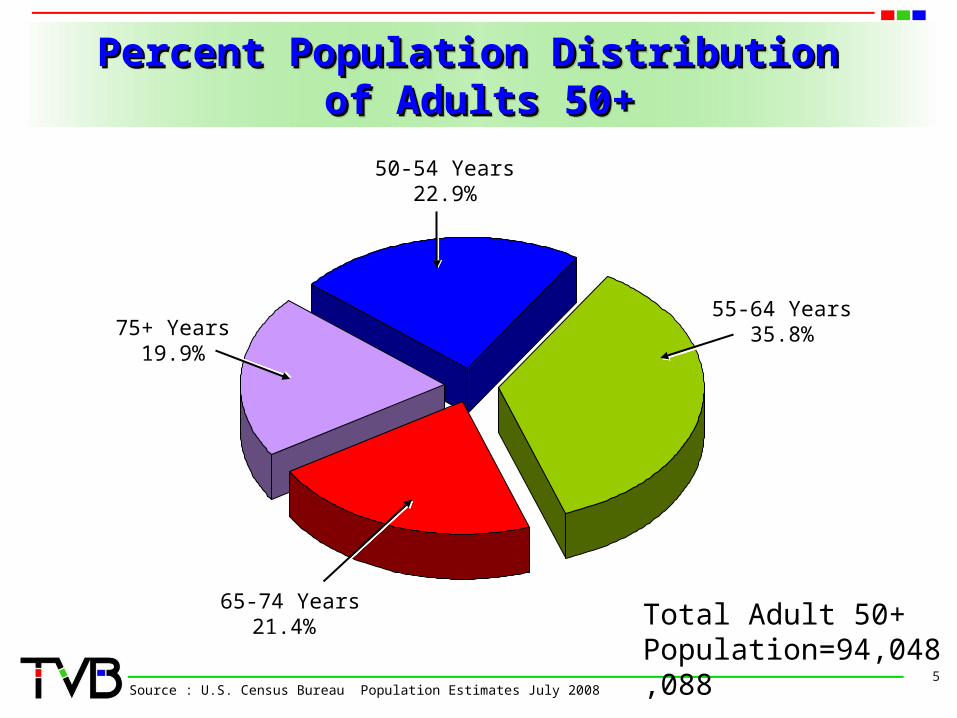
Percent Population Distribution Percent Population Distribution of Adults 50+of Adults 50+
5Source : U.S. Census Bureau Population Estimates July 2008
Total Adult 50+ Population=94,048,088
65-74 Years 21.4%
75+ Years19.9%
55-64 Years35.8%
50-54 Years22.9%

Size of the Adult 50+ MarketplaceSize of the Adult 50+ MarketplaceSize of the Adult 50+ MarketplaceSize of the Adult 50+ Marketplace
The first Baby Boomer turned 60 on Jan. 1, 2006.
According to AARP, an American turns 50 every 7 seconds – that’s more than 12,500 people every day.
By 2015, adults 50+ will represent 45% of the U.S. population.
In the next 10 years, the 50+ demographic will grow by 22 million.
In the next 15 years, the 50-64 age group will grow by 50%, and the 65+ population will grow by 50%.
By 2030, Americans 65+ will double to 71.5 million, and by 2050 will grow to 86.7 million people.
6Source: immersionactive.com (Digital Boomer Agency)
Baby Boomers and Seniors Still a Baby Boomers and Seniors Still a Powerful Market ForcePowerful Market Force
Baby Boomers and Seniors Still a Baby Boomers and Seniors Still a Powerful Market ForcePowerful Market Force
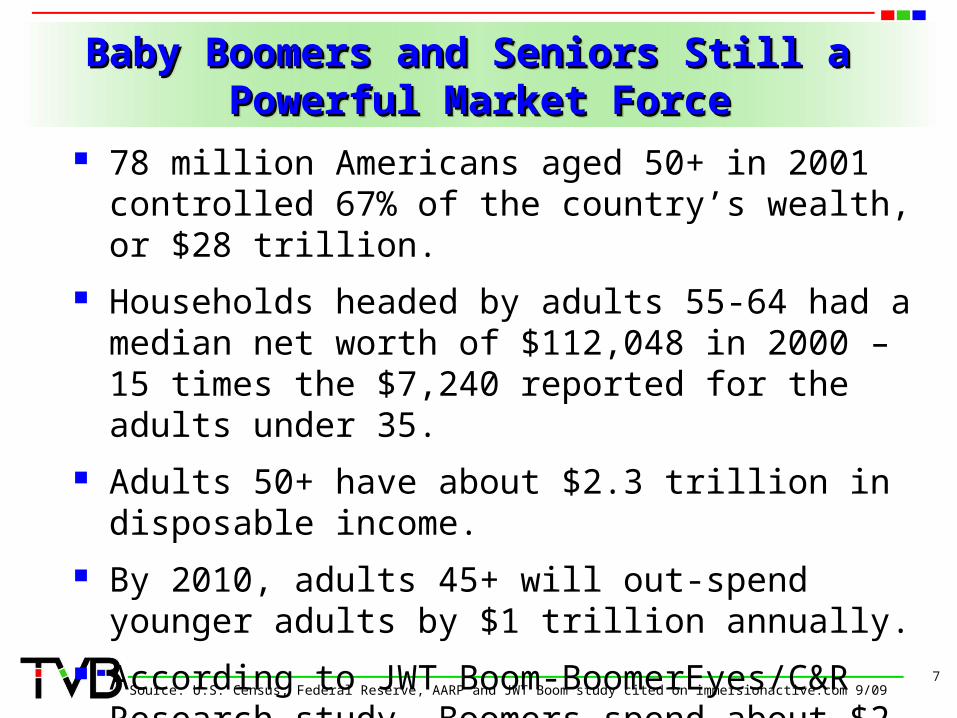
78 million Americans aged 50+ in 2001 controlled 67% of the country’s wealth, or $28 trillion.
Households headed by adults 55-64 had a median net worth of $112,048 in 2000 – 15 times the $7,240 reported for the adults under 35.
Adults 50+ have about $2.3 trillion in disposable income.
By 2010, adults 45+ will out-spend younger adults by $1 trillion annually.
According to JWT Boom-BoomerEyes/C&R Research study, Boomers spend about $2 trillion annually.
7Source: U.S. Census, Federal Reserve, AARP and JWT Boom study cited on immersionactive.com 9/09

States with Highest Percentage States with Highest Percentage of 50+ Residentsof 50+ Residents
States with Highest Percentage States with Highest Percentage of 50+ Residentsof 50+ Residents
Florida 33.5% West Virginia35.7%
West Virginia 32.7% Maine34.8%
Pennsylvania 31.3% Florida34.4%
Maine 31.2% Vermont33.9%
Arkansas 29.9% Montana33.9%
Iowa 29.9% Pennsylvania33.5%
Montana 29.7% Hawaii32.9%
Connecticut 29.6% North Dakota32.8%
Rhode Island 29.4% Wyoming32.6%
Vermont 29.3% Iowa32.5%
8Source: JWT Mature Market Group Live Wire Newsletter
State 2000 % 50+ State 2005 % 50+
Baby Boomer Consumer SegmentsBaby Boomer Consumer SegmentsBaby Boomer Consumer SegmentsBaby Boomer Consumer Segments
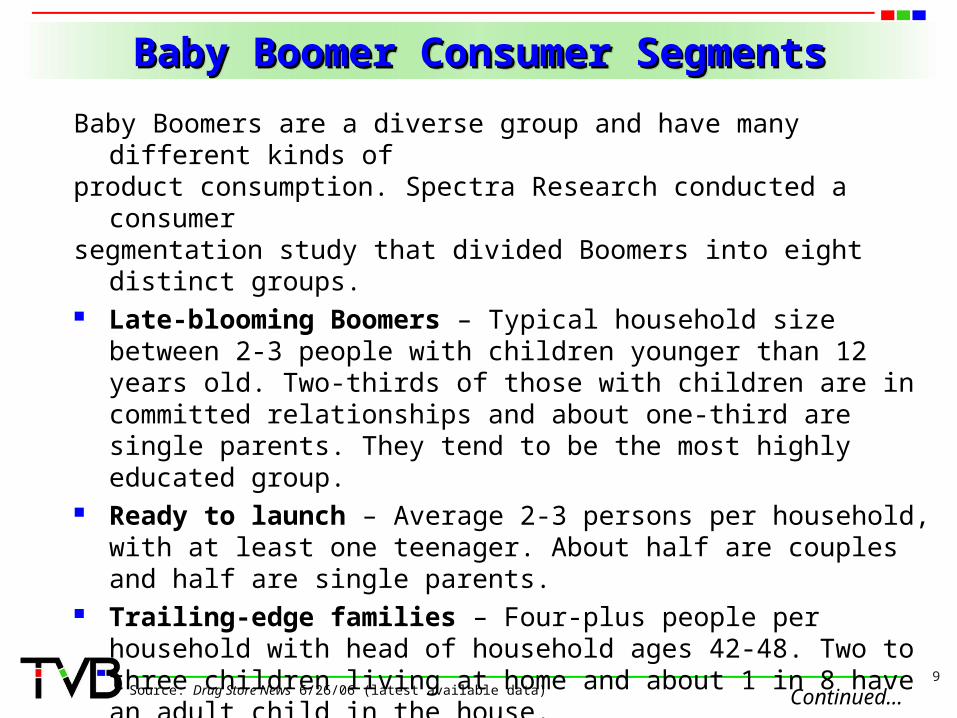
Baby Boomers are a diverse group and have many different kinds of
product consumption. Spectra Research conducted a consumer segmentation study that divided Boomers into eight distinct
groups. Late-blooming Boomers – Typical household size between
2-3 people with children younger than 12 years old. Two-thirds of those with children are in committed relationships and about one-third are single parents. They tend to be the most highly educated group.
Ready to launch – Average 2-3 persons per household, with at least one teenager. About half are couples and half are single parents.
Trailing-edge families – Four-plus people per household with head of household ages 42-48. Two to three children living at home and about 1 in 8 have an adult child in the house.
Leading-edge families – Four-plus people per household with head of household between 49 and 60. Also 2-3 children at home and twice as likely as Trailing-edge family to have an adult child at home.
9Source: Drug Store News 6/26/06 (latest available data) Continued…
Baby Boomer Consumer Segments Baby Boomer Consumer Segments (…(…continued)continued)
Baby Boomer Consumer Segments Baby Boomer Consumer Segments (…(…continued)continued)
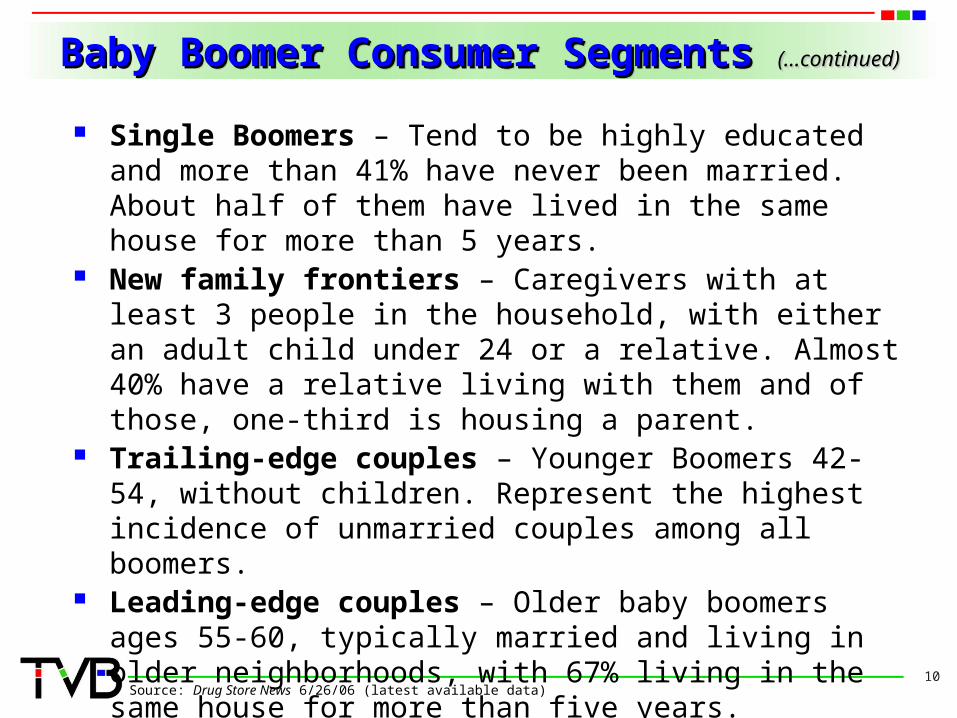
Single Boomers – Tend to be highly educated and more than 41% have never been married. About half of them have lived in the same house for more than 5 years.
New family frontiers – Caregivers with at least 3 people in the household, with either an adult child under 24 or a relative. Almost 40% have a relative living with them and of those, one-third is housing a parent.
Trailing-edge couples – Younger Boomers 42-54, without children. Represent the highest incidence of unmarried couples among all boomers.
Leading-edge couples – Older baby boomers ages 55-60, typically married and living in older neighborhoods, with 67% living in the same house for more than five years. 10
Source: Drug Store News 6/26/06 (latest available data)
Education Levels of Older AdultsEducation Levels of Older AdultsEducation Levels of Older AdultsEducation Levels of Older Adults
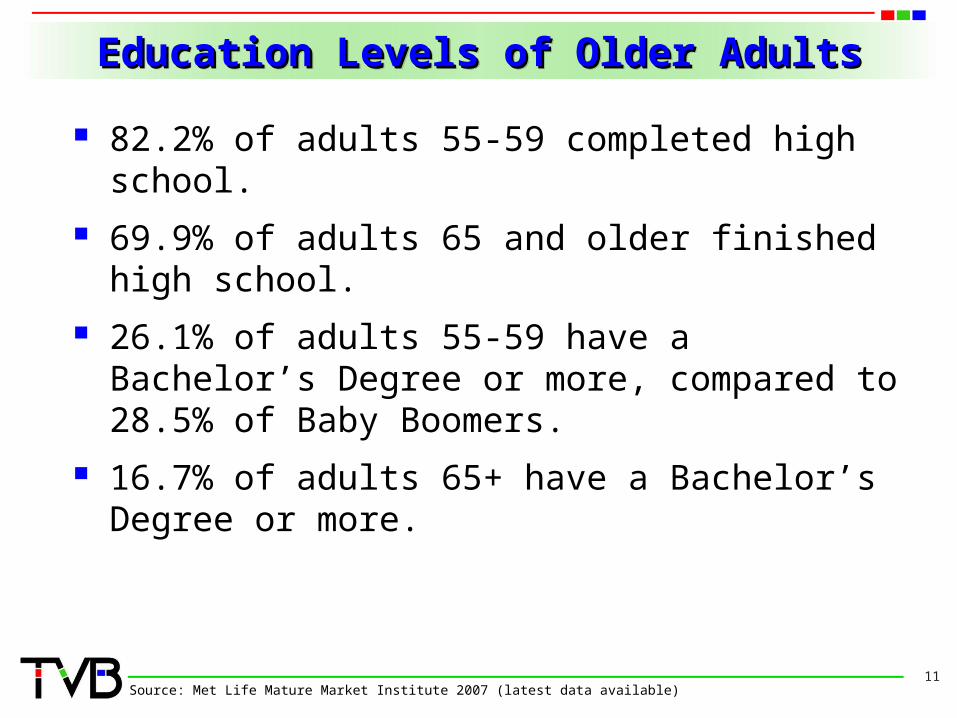
82.2% of adults 55-59 completed high school. 69.9% of adults 65 and older finished
high school. 26.1% of adults 55-59 have a Bachelor’s
Degree or more, compared to 28.5% of Baby Boomers.
16.7% of adults 65+ have a Bachelor’s Degree or more.
11Source: Met Life Mature Market Institute 2007 (latest data available)

Racial & Ethnic Composition of Adults Racial & Ethnic Composition of Adults 55-6455-64
Racial & Ethnic Composition of Adults Racial & Ethnic Composition of Adults 55-6455-64
8.5% of Adults ages 55-64 are minorities. 9.9% are Black. 7.5% are Hispanic origin. 3% are Asian or Pacific Islander. .9% are American Indian.
12Source: Met Life Mature Market Institute 2007 (latest data available)
Voting Patterns by Age GroupsVoting Patterns by Age GroupsVoting Patterns by Age GroupsVoting Patterns by Age Groups
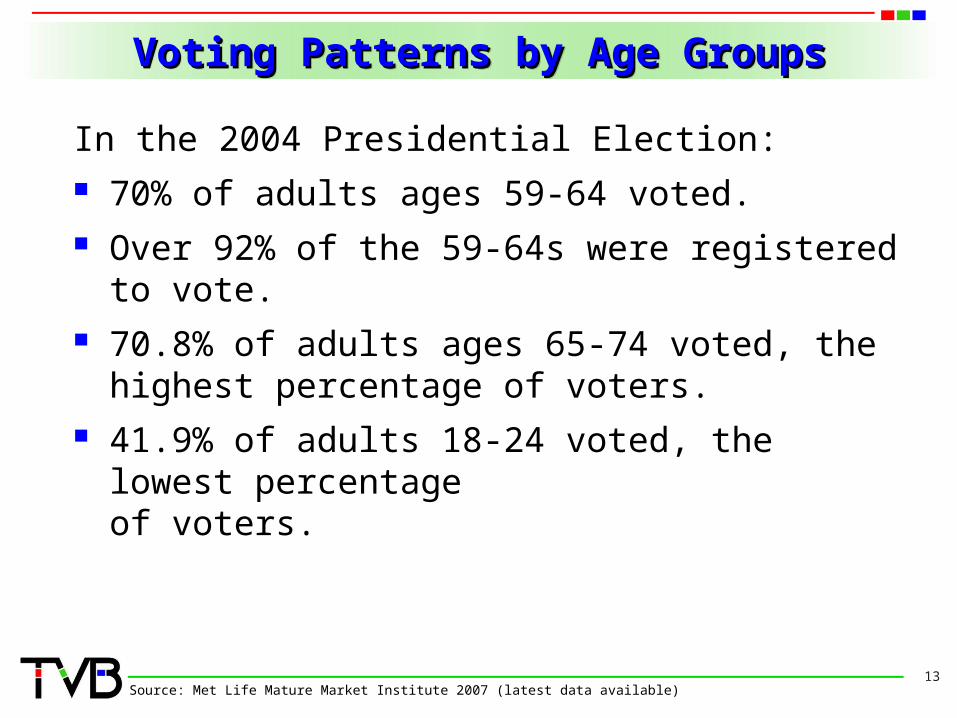
In the 2004 Presidential Election: 70% of adults ages 59-64 voted. Over 92% of the 59-64s were registered to
vote. 70.8% of adults ages 65-74 voted, the highest
percentage of voters. 41.9% of adults 18-24 voted, the lowest
percentage of voters.
13Source: Met Life Mature Market Institute 2007 (latest data available)

Spending Patterns of Adults Spending Patterns of Adults 50+50+
Spending Patterns of Adults Spending Patterns of Adults 50+50+
14

Average Annual Expenditures Average Annual Expenditures By Age – Consumer Expenditure Survey By Age – Consumer Expenditure Survey
20072007
Average Annual Expenditures Average Annual Expenditures By Age – Consumer Expenditure Survey By Age – Consumer Expenditure Survey
20072007
15Source: BLS.gov, Consumer Expenditure Survey 2007 (latest available data)
Total $49,638 $58,331 $53,786Food 6,133 7,181 6,241Housing 16,920 19,195 17,223Transportation 8,758 9,943 9,608Pers. Insur./Pensions 5,336 7,489 6,193 Health Care 2,853 2,792 3,476Entertainment 2,698 3,163 2,730Apparel & Services 1,881 2,191 1,888Cash Contributions 1,821 1,972 2,746Education 945 1,687 929Pers. Care Prods. 588 686 632Alcoholic Beverages 457 498 533
All 45-54 55-64Avg. Annual Expenditure Consumers Years Old Years Old
Profile of Older Baby Boomer Profile of Older Baby Boomer Households Households
vs. Younger Boomersvs. Younger Boomers
Profile of Older Baby Boomer Profile of Older Baby Boomer Households Households
vs. Younger Boomersvs. Younger Boomers
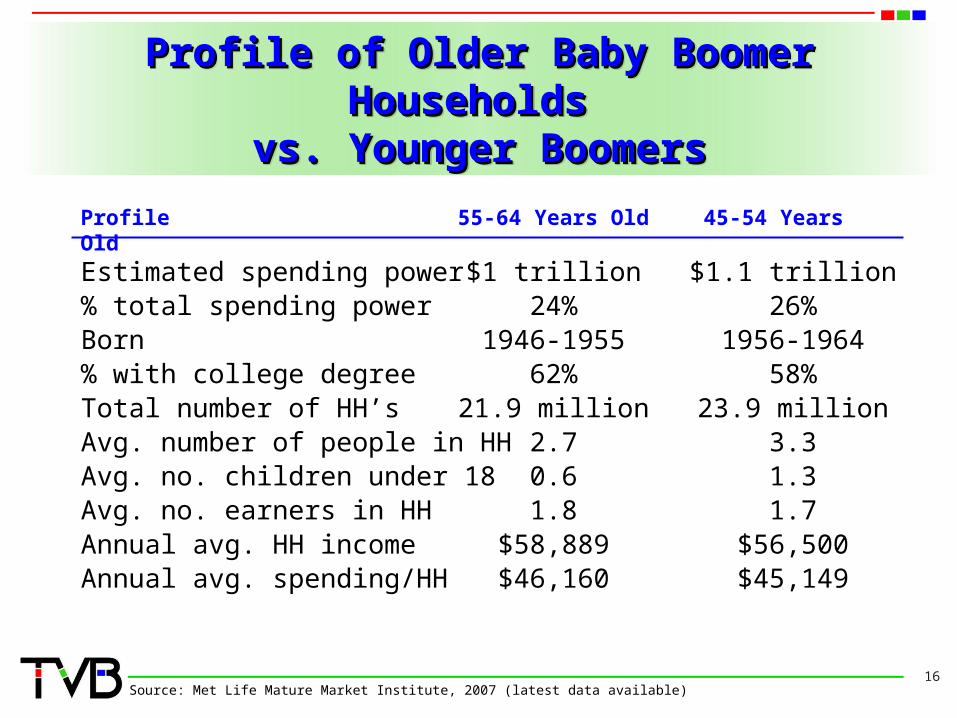
Estimated spending power $1 trillion $1.1 trillion% total spending power 24% 26%Born 1946-1955 1956-1964% with college degree 62% 58%Total number of HH’s 21.9 million 23.9 millionAvg. number of people in HH 2.7 3.3Avg. no. children under 18 0.6 1.3Avg. no. earners in HH 1.8 1.7Annual avg. HH income $58,889 $56,500Annual avg. spending/HH $46,160 $45,149
16Source: Met Life Mature Market Institute, 2007 (latest data available)
Profile 55-64 Years Old 45-54 Years Old

Spending Habits of Adults 50+Spending Habits of Adults 50+Spending Habits of Adults 50+Spending Habits of Adults 50+
Adults 50+ accounted for an estimated $2 trillion in total expenditures for 2005.
This consumer group has $2.3 trillion in disposable income.
Adults 50 and older own 65% of the aggregate net worth of all U.S. households.
Between Jan. 2007 and 2010, the total spending for 50+ households will increase by over $900 billion.
By 2010, adults 45+ will out-spend younger adults by $1 trillion annually.
17Source: immersionactive.com (Digital Boomer Agency)
Boomers Committed to Using Boomers Committed to Using Green ProductsGreen Products
Boomers Committed to Using Boomers Committed to Using Green ProductsGreen Products
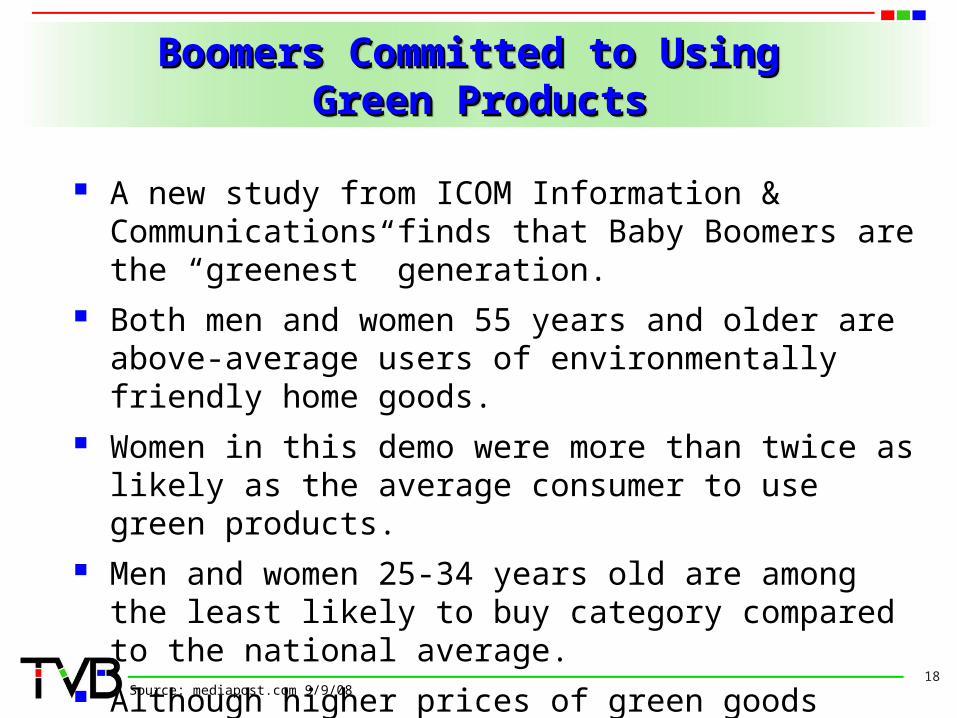
A new study from ICOM Information & Communications finds that Baby Boomers are the “greenest” generation.
Both men and women 55 years and older are above-average users of environmentally friendly home goods.
Women in this demo were more than twice as likely as the average consumer to use green products.
Men and women 25-34 years old are among the least likely to buy category compared to the national average.
Although higher prices of green goods deter many, more than 6 out of 10 say they are still buying such products.
18Source: mediapost.com 9/9/08
Today’s Grandparents Are Marketing Today’s Grandparents Are Marketing Targets Targets
Today’s Grandparents Are Marketing Today’s Grandparents Are Marketing Targets Targets
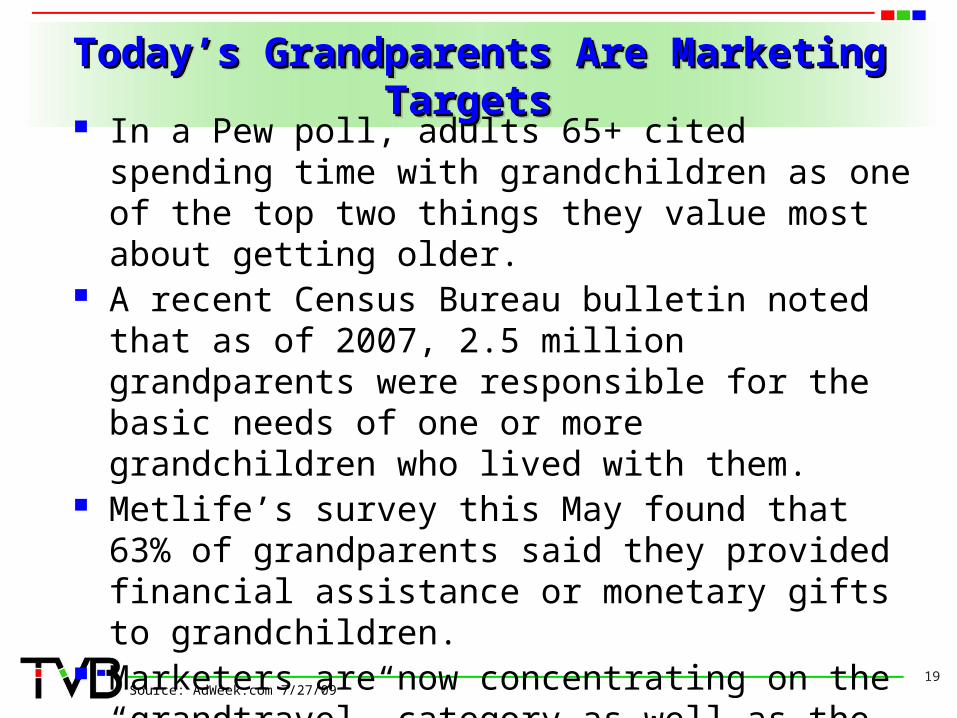
In a Pew poll, adults 65+ cited spending time with grandchildren as one of the top two things they value most about getting older.
A recent Census Bureau bulletin noted that as of 2007, 2.5 million grandparents were responsible for the basic needs of one or more grandchildren who lived with them.
Metlife’s survey this May found that 63% of grandparents said they provided financial assistance or monetary gifts to grandchildren.
Marketers are now concentrating on the “grandtravel” category as well as the usual toys and clothing advertising.
19Source: AdWeek.com 7/27/09

Media/Technology UsageMedia/Technology UsageMedia/Technology UsageMedia/Technology Usage
20

Daily Activities of U.S. Seniors Daily Activities of U.S. Seniors Daily Activities of U.S. Seniors Daily Activities of U.S. Seniors
According to Pew Research Center’s “Growing Old in America” study, 28% of seniors (adults 65+) had used the Internet in the 24 hours prior to polling.
The number one activity was talking with family and friends at 90%.
Reading a book, magazine, or newspaper was the number two activity, with 83% of the respondents.
Tied for the number two activity was taking prescription medicine.
Number four is “Watching 1+ hour of TV” for 77% of the respondents.
Nearly three-quarters of adults 65+ received very few or no calls on their cell phones.
21Source: Pew Research Center, “Growing Old in Amewrica: Expectations vs. Reality,” 6/09
Older Adults Go OnlineOlder Adults Go OnlineOlder Adults Go OnlineOlder Adults Go Online
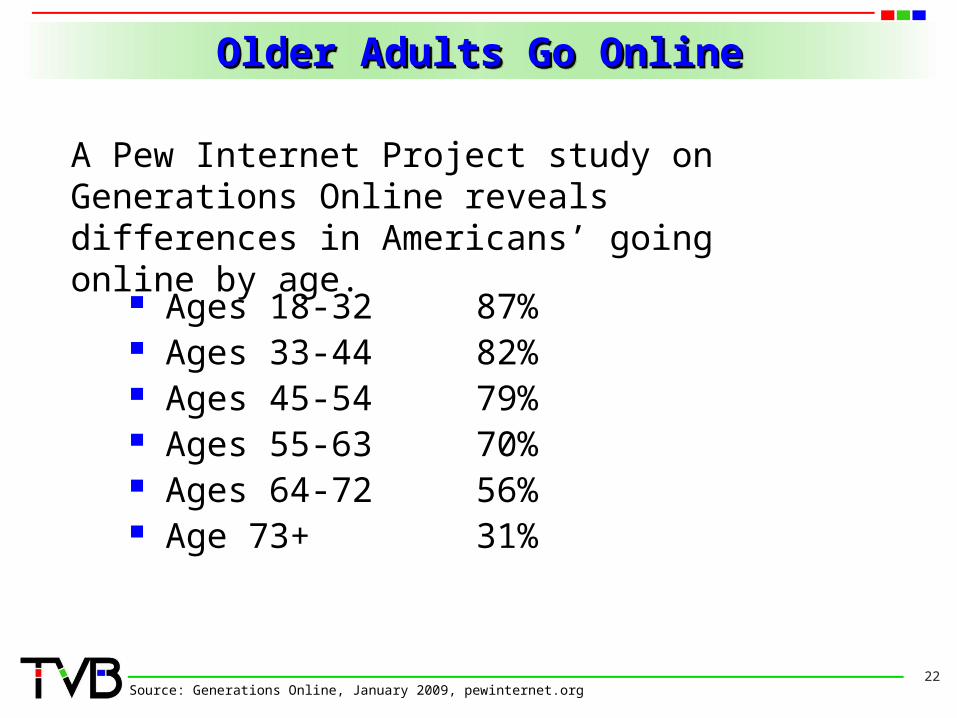
Ages 18-32 87% Ages 33-44 82% Ages 45-54 79% Ages 55-63 70% Ages 64-72 56% Age 73+ 31%
22Source: Generations Online, January 2009, pewinternet.org
A Pew Internet Project study on Generations Online reveals differences in Americans’ going online by age.
Reaching Baby Boomers OnlineReaching Baby Boomers OnlineReaching Baby Boomers OnlineReaching Baby Boomers Online
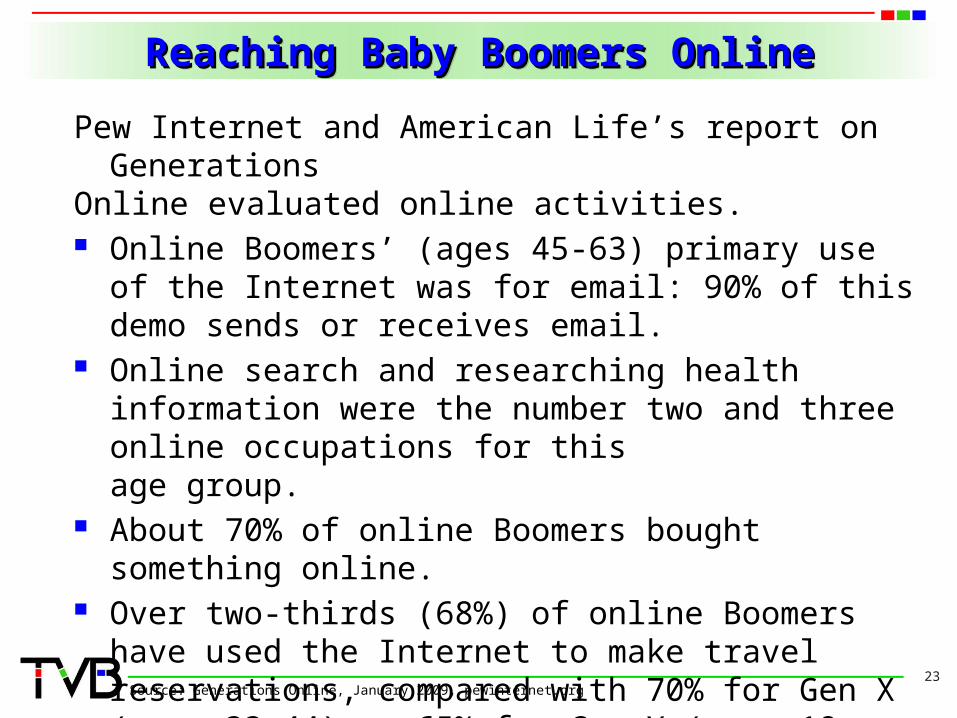
Pew Internet and American Life’s report on Generations
Online evaluated online activities. Online Boomers’ (ages 45-63) primary use of the
Internet was for email: 90% of this demo sends or receives email.
Online search and researching health information were the number two and three online occupations for this age group.
About 70% of online Boomers bought something online.
Over two-thirds (68%) of online Boomers have used the Internet to make travel reservations, compared with 70% for Gen X (ages 33-44) or 65% for Gen Y (ages 18-32).
23Source: Generations Online, January 2009, pewinternet.org
Top Online Activities for SeniorsTop Online Activities for SeniorsTop Online Activities for SeniorsTop Online Activities for Seniors
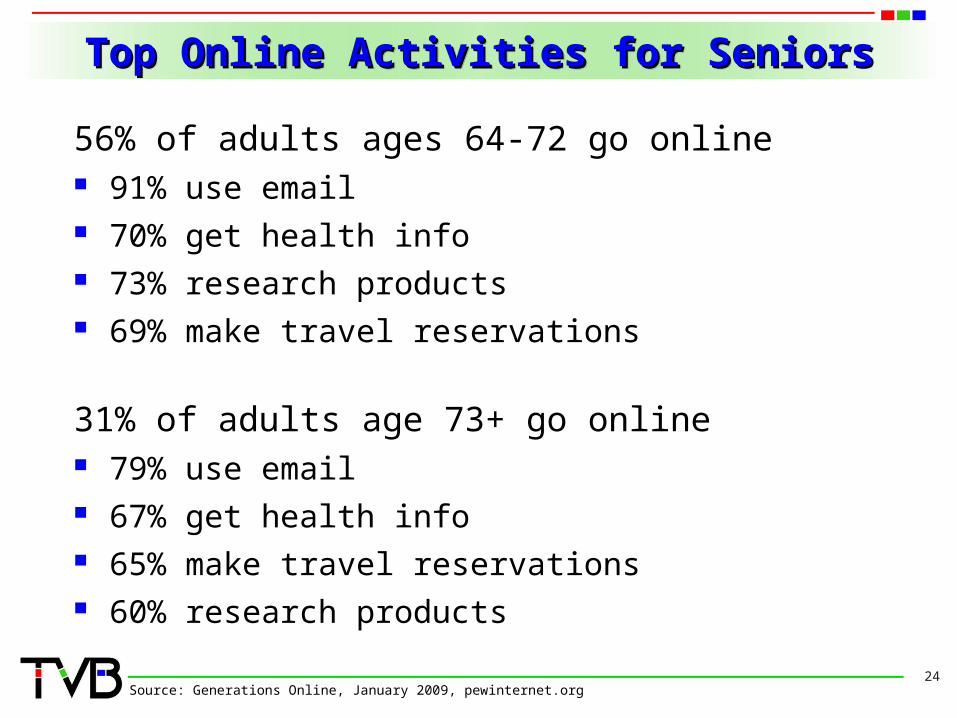
56% of adults ages 64-72 go online 91% use email 70% get health info 73% research products 69% make travel reservations
31% of adults age 73+ go online 79% use email 67% get health info 65% make travel reservations 60% research products
24Source: Generations Online, January 2009, pewinternet.org
Social Networking for BoomersSocial Networking for BoomersSocial Networking for BoomersSocial Networking for Boomers
Social networking sites are expanding their focus to older users
now that penetration among younger demos is nearly total. Boomers are an attractive target because they account for
aboutone third (the largest constituency) of the 193 million Internetusers in the U.S. 22% of adults 45-54 have a personal profile page on Facebook,
MySpace, LinkedIn or any other social networking website according to Arbitron/Edison Research.
About 10% of adults 55-64 have a personal profile page on any of the social networking websites.
According to the Pew Internet 2009 study, 20% of adults 45-54 have ever used a social networking site, compared to 9% of adults 55-64.
Some of the popular Boomer social networking sites are eons.com, with 100,000 members over 50; iRememberJFK.com focuses on nostalgia about the 50s and 60s; and Boomergirl.com, a site for females over 50.
25Source: Arbitron/Edison’s The New Media Consumer 2009; Pew Internet Generations Online 2009
More Boomers Are Watching Online More Boomers Are Watching Online VideoVideo
More Boomers Are Watching Online More Boomers Are Watching Online VideoVideo
Younger Boomers (ages 45-54) in particular are watching videos online – 49% according to the Pew Internet Generations Online Study 2009.
Older Boomers are also increasing their online video viewing, at 30% in the current Pew Internet study.
Arbitron/Edison Media Research’s 2009 New Media Consumer survey shows that 27% of people 12+ have watched Internet video in the last week, approximately 69 million people.
26% of the total surveyed by Arbitron/Edison (12+) have watched TV programming over the Internet without downloading.
26Source: Pew Internet Generations Online 2009; Arbitron/Edison Media Research New Media Consumer 2009
Time Spent Watching Online Video by Time Spent Watching Online Video by AgeAge
Time Spent Watching Online Video by Time Spent Watching Online Video by AgeAge
Monthly time spent (users 2+) watching video on the Internet at home or work has increased from 1 hour 57 minutes in 1Q08, to 3 hours in 1Q09.
Viewers ages 45-54 spent a monthly average of 2 hours 45 minutes, compared to 1 hour 44 minutes for viewers ages 55-64.
Video audience composition for the younger Boomers (ages 45-54) viewing video on the Internet is 22% vs. 15% for older Boomers (ages 55-64).
27Source: The Nielsen Company, A2/M2 Three Screen Report 1Q09
Boomers Are Big on Word-of-Mouth, Boomers Are Big on Word-of-Mouth, Not on BlogsNot on Blogs
Boomers Are Big on Word-of-Mouth, Boomers Are Big on Word-of-Mouth, Not on BlogsNot on Blogs
According to a study by BIGresearch, Baby Boomers prefer to talk face-to-face about products, brands or services.
Among the methods used by those on the Internet after online searches to communicate with others about products, 68.4% of adults 45-54 and 64.8% of adults 55-64 prefer face-to-face communications.
Younger and older Boomers both use Email communications for sending product news to friends – 51.9% and 53.4% respectively.
The mobile phone was used more by younger Boomers, 23% vs. 19.5% for older Boomers.
28Source: eMarketer 12/11/08

Marketing to Adults 50 PlusMarketing to Adults 50 PlusMarketing to Adults 50 PlusMarketing to Adults 50 Plus
29
Marketing to Adults 65+Marketing to Adults 65+Marketing to Adults 65+Marketing to Adults 65+
According to a survey by Pew Research Center, 60% of respondents age 65+ said they feel younger than their actual age.
Among respondents 65-74, 33% say they feel 10-19 years younger than their age, and one in six say they feel at least 20 years younger than their age.
In response to the question of whether they feel old, 78% of the 65-74 year-olds and 61% of the 75+ said no.
Marketing to this cohort is complex – with some companies using models 10-15 years younger than the target market and others relying on images of active and involved individuals.
30Source: AdWeek.com, 7/27/09
Marketing Campaigns Targeted toMarketing Campaigns Targeted toBaby BoomersBaby Boomers
Marketing Campaigns Targeted toMarketing Campaigns Targeted toBaby BoomersBaby Boomers
Starwood Hotels & Resorts Worldwide is targeting Boomers with two new cheap chic hotel chains.
OSI Restaurant Partners (owners of Outback Steakhouse) is trying to win back lost Boomer customers by reducing some menu prices and offering smaller cuts of beef to maintain margins.
Nordstrom’s began opening more lower-priced Nordstrom Rack stores to appeal to Boomers who still want fashion but at a discount.
Wal-Mart’s current tagline, “Live better, save more” captures the current Boomer attitude of acting frugally and getting more out of what they buy.
31Source: Businesweek.com 7/23/09, MediaPost Engage: Boomers 7/20/09

Thank You!Thank You!Thank You!Thank You!
32
Related Documents