Helsinki University of Technology Department of Industrial Engineering and Management Institute of Strategy and International Business Matti Jaakkola Strategic Marketing and Its Effect on Business Performance: Moderating Effect of Country-specific Factors Master’s thesis submitted in partial fulfillment of the requirements for the degree of Master of Science in Industrial Engineering and Management. Helsinki, 31 October 2006 Supervisor: Markku Maula, Professor, Helsinki University of Technology Instructor: Petri Parvinen, Docent, Helsinki School of Economics

Welcome message from author
This document is posted to help you gain knowledge. Please leave a comment to let me know what you think about it! Share it to your friends and learn new things together.
Transcript

Helsinki University of Technology
Department of Industrial Engineering and Management
Institute of Strategy and International Business
Matti Jaakkola
Strategic Marketing and Its Effect on
Business Performance: Moderating
Effect of Country-specific Factors
Master’s thesis submitted in partial fulfillment of the requirements for the degree of
Master of Science in Industrial Engineering and Management.
Helsinki, 31 October 2006
Supervisor: Markku Maula, Professor, Helsinki University of Technology
Instructor: Petri Parvinen, Docent, Helsinki School of Economics

HELSINKI UNIVERSITY OF TECHNOLOGY ABSTRACT OF THE MASTER´S THESISIndustrial Engineering and Management
Author: Matti Jaakkola
Subject of the thesis: Strategic Marketing and Its Effect on Business Performance:Moderating Effect of Country-specific Factors
Number of pages: 112 + 17 Date: 2006-10-31 Library location: TU
Professorship: Strategy and International Business Code of professorship: TU-91
Supervisor: Professor Markku Maula
Instructor: Docent Petri Parvinen, Helsinki School of Economics
The concept of strategic marketing is relatively young and yet unestablished. Also strategic mar-keting’s effect on business performance is considerably vague in companies. Effects are unclearsince they have not been studied very much, especially in different business environments. Thisstudy attempts to fulfill this evident research gap in effectiveness studies and to identify best prac-tices in strategic marketing for Finnish companies. This study offers one possible positioning forstrategic marketing relative to some more established concepts.
This study aims to answer the following problem: What kind of strategic marketing most posi-tively and effectively relates to companies’ financial performance in different business environ-ments? Three more specific questions – (1) What is the relationship between marketing resourcesand business orientations, and financial performance of a firm? (2) How sensitive are the results tocountry-specific and business environmental differences? (3) How is marketing effectiveness as-sessed today and potentially in the future? – form a diverse but coherent research entity.
Data containing marketing and performance data of 5627 companies in 13 countries is used inempirical part of the study. In addition to the full sample analysis, individual countries were exam-ined and two comparison studies – “low-cost” vs. “high-cost” countries and “engineering coun-tries” vs. each other – conducted. Statistical part of the study based largely on hypotheses derivedfrom literature. Structural equation modeling was the primary statistical method applied.
The full-sample results indicate that effect of inside-out marketing capabilities on financial per-formance is the strongest, followed by innovation orientation, outside-in marketing capabilitiesand market orientation. Majority of the hypotheses were supported and marketing performanceassessment tool for firm use was developed. Finnish companies were found to be among the leasteffective in strategic marketing. Differences between countries and groups were identified.
The study achieved its objectives and offers a basis for subsequent quantitative studies within theStratMark research project. Some avenues for further research were suggested.Keywords: strategic marketing, performance, marketing re-sources, business orientations, structural equation modeling
Publishing language: English

TEKNILLINEN KORKEAKOULU DIPLOMITYÖN TIIVISTELMÄTuotantotalouden osasto
Tekijä: Matti Jaakkola
Työn nimi: Strateginen markkinointi ja sen vaikuttavuus liiketoiminnan tuloksellisuuteen:maaspesifien tekijöiden moderoiva vaikutus
Sivumäärä: 112 + 17 Päiväys: 31.10.2006 Työn sijainti: TU
Professuuri: Yritysstrategia ja kansainvälinen liiketoiminta Koodi: TU-91
Työn valvoja: Professori Markku Maula
Työn ohjaaja: Dosentti Petri Parvinen, Helsingin kauppakorkeakoulu
Strategisen markkinoinnin käsite on suhteellisen nuori ja vielä vakiintumaton. Myös sen vaikut-tavuus liiketoiminnan tuloksellisuuteen on yrityksille huomattavan epäselvä. Vaikutussuhteetovat epäselviä, koska niitä ei ole tutkittu kovin paljon, etenkään erilaisissa liiketoimintaympä-ristöissä. Tämä tutkimus pyrkii vastaamaan tähän tutkimuksellisen tarpeeseen ja tunnistamaanstrategisen markkinoinnin parhaita käytäntöjä suomalaisyrityksille. Diplomityö asemoi strategi-sen markkinoinnin suhteessa joihinkin vakiintuneempiin käsitteisiin.
Tutkimus pyrkii vastaamaan seuraavaan ongelmaan: Minkälainen strateginen markkinointi liit-tyy positiivisimmalla ja vaikuttavimmalla tavalla yritysten taloudelliseen tuloksellisuuteen eri-laisissa liiketoimintaympäristöissä? Kolme spesifimpää kysymystä – (1) Mikä on markkinoin-nin resurssien ja liiketoiminnan orientaatioiden ja yritysten tuloksellisuuden välinen suhde? (2)Kuinka herkkiä tulokset ovat maaspesifeille ja liiketoimintaympäristön eroille? (3) Miten mark-kinoinnin vaikuttavuutta arvioidaan nyt ja tulevaisuudessa? – muodostavat monipuolisen, muttayhtenäisen tutkimuskokonaisuuden.
Tutkimuksen empiirisessä osassa käytetään 13 maata edustavien 5627 yrityksen markkinointi-ja tuloksellisuustiedot sisältävää dataa. Koko aineiston analysoinnin lisäksi yksittäisiä maitatutkittiin ja kaksi ryhmävertailua – ”halpatuotantomaat” vs. ”korkeiden tuotantokustannustenmaat” ja ”insinöörimaat” – suoritettiin. Tilastollinen osa pohjautui suurelta osin kirjallisuudes-ta johdettuihin hypoteeseihin. Rakenneyhtälömallinnus oli pääasiallisesti käytetty menetelmä.
Koko aineistoa koskevat tulokset viittaavat siihen, että sisäiset markkinointikyvykkyydet vai-kuttavat taloudelliseen tulokseen voimakkaimmin. Seuraavana tulevat innovaatio-orientaatio,ulkoiset markkinointikyvykkyydet ja markkinaorientaatio. Suurin osa hypoteeseista hyväksyt-tiin ja markkinoinnin tuloksellisuuden arviointiin kehitettiin yritystyökalu. Suomalaiset yrityk-set jäivät tulosten mukaan heikoimpien joukkoon strategisen markkinoinnin vaikuttavuudessamitattuna. Yrityksen kotimaan ja ryhmien välillä havaittiin eroja.
Työ saavutti sille asetetut tavoitteet ja tarjoaa lähtökohdan tuleville kvantitatiivisille tutkimuk-sille StratMark-projektissa. Muutamia jatkotutkimuskohteita ehdotettiin.Avainsanat: strateginen markkinointi, tuloksellisuus, markkinointi-resurssit, liiketoiminnan orientaatiot, rakenneyhtälömallinnus
Julkaisukieli: englanti

i
AcknowledgementsFirst of all, I want to thank Professor Kristian Möller, Professor Henrikki Tikkanen and
Docent Petri Parvinen at Helsinki School Economics (HSE) for giving me this great op-
portunity to work in an extremely interesting research project with potentially large im-
pact on Finnish business. I would also like to thank them for all the support during the
thesis writing. Working as a part of the StratMark project group has been very instruc-
tive which can surely be identified from publications yet to come. This thesis could not
have been conducted as such without enormous contribution of country representatives
in the MC21–project and its directors, Professors Graham Hooley of Aston University
and Gordon Greenley of Aston Business School.
People at the Department of Marketing and Management at HSE and the StratMark pro-
ject have indeed contributed to this study by sharing their brilliant ideas and academic
experience with me. In addition to those already mentioned, I am indebted to Matti Tuo-
minen, Arto Rajala and Sami Kajalo for always being there to help me in questions re-
lated to statistical analysis part of the study, and project coordinator Antti Vassinen for
valuable practical hints along the way. Additionally, special thanks to Erik Pöntiskoski
and Matti Santala for such an encouraging and unaffected atmosphere at our office.
I also want to greatly thank the Department of Industrial Engineering and Management
(DIEM) at Helsinki University of Technology. The supervisor of this thesis, Professor
Markku Maula, can well be considered as an embodiment of the wonderfully challeng-
ing and professional but, at the same time, flexible and relaxed atmosphere at the de-
partment. It was pleasant to work with such a brilliantly-minded and cooperative person.
Same applies to students at DIEM; especially a few of them preparing their theses con-
currently with me and thus forming my peer group are well worth special thanks.
Last, but with certainty not least importantly, I am grateful to my parents, sister and two
brothers and closest friends for always giving enormous support in everything that I
have ever done.
Helsinki, 31 October 2006
Matti Jaakkola

ii
Table of Contents
1. INTRODUCTION____________________________________________________________1
1.1. BACKGROUND ___________________________________________________________1
1.2. THE STRATMARK PROJECT __________________________________________________4
1.3. RESEARCH PROBLEM ______________________________________________________4
1.4. OBJECTIVES OF THE STUDY __________________________________________________6
1.5. METHODOLOGY __________________________________________________________7
1.6. SCOPE OF THE STUDY ______________________________________________________9
1.7. KEY CONCEPTS __________________________________________________________9
1.8. STRUCTURE OF THE THESIS _________________________________________________13
2. LITERATURE REVIEW AND HYPOTHESES DEVELOPMENT____________________14
2.1. STRATEGIC MARKETING ___________________________________________________142.1.1. Market Orientation ____________________________________________________142.1.2. Marketing Assets and Capabilities _________________________________________182.1.3. Innovation Orientation _________________________________________________212.1.4. Positioning Strategic Marketing___________________________________________22
2.2. GAINING AND SUSTAINING COMPETITIVE ADVANTAGES ___________________________25
2.3. PERFORMANCE MEASUREMENT______________________________________________282.3.1. Measuring Business Performance _________________________________________282.3.2. Measuring Marketing Performance ________________________________________312.3.3. Contribution of Performance Studies _______________________________________35
2.4. CONCEPTUAL AND THEORETICAL DEVELOPMENT ________________________________362.4.1. Performance Impact of Strategic Marketing __________________________________362.4.2. Performance Impact in Different Business Environments ________________________372.4.3. Frame of Reference of the Study___________________________________________39
2.5. HYPOTHESES DEVELOPMENT _______________________________________________41
3. RESEARCH METHODS _____________________________________________________46
3.1. RESEARCH DATA ________________________________________________________463.1.1. Full Sample__________________________________________________________463.1.2. Sub-samples _________________________________________________________47
3.2. CONSTRUCTION AND OPERATIONALIZATION OF VARIABLES _________________________493.2.1. Endogenous Variables__________________________________________________493.2.2. Exogenous Variables ___________________________________________________50
3.3. STATISTICAL ANALYSIS METHODS ___________________________________________533.3.1. Descriptive Analysis ___________________________________________________543.3.2. Factor Analyses_______________________________________________________563.3.3. Structural Equation Modeling ____________________________________________593.3.4. Statistical Tests _______________________________________________________63
4. RESULTS _________________________________________________________________66
4.1. FULL-SAMPLE ANALYSIS___________________________________________________66

iii
4.1.1. Confirmatory Factor Analysis ____________________________________________664.1.2. SEM Analysis ________________________________________________________70
4.2. SUB-SAMPLE ANALYSIS ___________________________________________________724.2.1. Finland _____________________________________________________________724.2.2. Sample Country Comparison _____________________________________________754.2.3. “Low-cost” vs. “High-cost” Countries _____________________________________794.2.4. Engineering Countries__________________________________________________81
4.3. NESTED MODEL TESTING __________________________________________________84
4.4. DEVELOPMENT OF MARKETING PERFORMANCE ASSESSMENT TOOL ___________________85
5. DISCUSSION AND CONCLUSIONS ___________________________________________88
5.1. DISCUSSION ON RESULTS __________________________________________________885.1.1. Success Factors and Their Performance Impact_______________________________895.1.2. Result Sensibility to Different Business Environments___________________________915.1.3. Marketing Performance Assessment________________________________________94
5.2. RELIABILITY AND VALIDITY ________________________________________________975.2.1. Reliability ___________________________________________________________975.2.2. Validity _____________________________________________________________98
5.3. IMPLICATIONS FOR FINNISH COMPANIES _______________________________________99
5.4. EVALUATING SUCCESS OF THE STUDY ________________________________________ 1015.4.1. Meeting the Objectives of the Study _______________________________________ 1015.4.2. Contribution of the Study_______________________________________________ 101
5.5. LIMITATIONS AND AVENUES FOR FURTHER RESEARCH____________________________ 102
6. REFERENCES ____________________________________________________________ 104
APPENDIX A – SURVEY QUESTIONNAIRE _______________________________________ 113
APPENDIX B – LIST OF INDICATORS PER FACTOR _______________________________ 122
APPENDIX C – GOODNESS OF MODEL FIT INDEXES ______________________________ 124
APPENDIX D – DISCRIMINANT AND CONVERGENT VALIDITY_____________________ 125
APPENDIX E – ITEM-TO-TOTAL CORRELATIONS AND CRONBACH'S ALPHAS_______ 126
APPENDIX F – GOODNESS OF MODEL FIT INDEXES ______________________________ 127
APPENDIX G – SQUARE MULTIPLE CORRELATIONS OF STRUCTURAL EQUATIONS _ 128
APPENDIX H – DESCRIPTIVE INDICATOR COMPARISON__________________________ 129
iv
Table of FiguresFIGURE 1 RESEARCH QUESTION DIAGRAM .........................................................................................................5
FIGURE 2 STRUCTURE OF THE STUDY .............................................................................................................. 13
FIGURE 3 CHARACTERISTICS OF MARKET ORIENTATION (NARVER AND SLATER, 1990) .............................. 16
FIGURE 4 THREE CATEGORIES OF FIRM CAPABILITIES (DAY, 1994)............................................................... 19
FIGURE 5 A RESOURCE-BASED MODEL (FAHY AND SMITHEE, 1999)............................................................. 21
FIGURE 6 POSITIONING STRATEGIC MARKETING ............................................................................................. 25
FIGURE 7 A NORMATIVE MPA SYSTEM (MORGAN, CLARK AND GOONER, 2002) ........................................ 34
FIGURE 8 FRAME OF REFERENCE OF THE STUDY ............................................................................................. 40
FIGURE 9 RESEARCH HYPOTHESES .................................................................................................................. 45
FIGURE 10 PROFIT MARGIN ACHIEVED RELATIVE TO MAIN COMPETITORS IN EACH SAMPLE COUNTRY......... 56
FIGURE 11 DIFFERENCES OF AN EFA (AT LEFT) AND A CFA MODEL (LONG, 1983)....................................... 57
FIGURE 12 EXAMPLE OF SEM PROCEDURE (JACCARD AND WAN, 1996)........................................................ 60
FIGURE 13 INITIAL CFA MODEL (COVARIANCES BETWEEN FACTORS EXCLUDED) ......................................... 67
FIGURE 14 CONFIRMATORY FACTOR ANALYSIS MODEL (INTERNATIONAL SAMPLE) ...................................... 69
FIGURE 15 STRUCTURAL EQUATION MODEL (INTERNATIONAL SAMPLE) ........................................................ 71
FIGURE 16 STRUCTURAL EQUATION MODEL (FINLAND) .................................................................................. 75
FIGURE 17 POSITIONING THE CONSTRUCTS OF THE STUDY FROM “MARKETING SPIRIT” TO PROFITABILITY.. 96
List of TablesTABLE 1 COMPONENTS OF STRATEGIC MARKETING IN RELATION TO GENERIC COMPETITIVE STRATEGIES
AND MARKETING CONCEPT............................................................................................................... 25
TABLE 2 RANKINGS OF MARKETING METRICS (AMBLER, KOKKINAKI AND PUNTONI, 2004) ..................... 33
TABLE 3 LATENT VARIABLES AND MEASUREMENT ITEMS.............................................................................. 52
TABLE 4 COMPANY FREQUENCIES BY COUNTRY IN THE DATA (N=5627)...................................................... 54
TABLE 5 NUMBER OF EMPLOYEES IN THE DATA (N=4675) ............................................................................ 55
TABLE 6 AMOUNT OF COMPANIES IN DIFFERENT INDUSTRY TYPES (N=4675) .............................................. 55
TABLE 7 DIFFERENT MARKET POSITIONS IN THE DATA (N=5627) ................................................................. 55
TABLE 8 FINAL INDICATOR LOADINGS AND COMMUNALITIES (INTERNATIONAL SAMPLE) ........................... 68
TABLE 9 CORRELATION MATRIX OF FACTOR CONSTRUCTS (INTERNATIONAL SAMPLE) ............................... 69
TABLE 10 COMPOSITE RELIABILITY AND AVERAGE VARIANCE EXTRACTED (INTERNATIONAL SAMPLE) ...... 70
TABLE 11 STANDARDIZED REGRESSION COEFFICIENTS (INTERNATIONAL SAMPLE) ....................................... 72
TABLE 12 COMPARISON OF CONSTRUCT MEANS OF FINNISH AND INTERNATIONAL DATA ............................. 73
TABLE 13 INDICATOR LOADINGS AND COMMUNALITIES (FINLAND) ............................................................... 74
TABLE 14 CORRELATION MATRIX OF FACTOR CONSTRUCTS (FINLAND) ......................................................... 74
TABLE 15 STANDARDIZED REGRESSION COEFFICIENT ESTIMATES BY COUNTRY ............................................ 76

v
TABLE 16 CONSTRUCT MEANS BY SAMPLE COUNTRY ...................................................................................... 78
TABLE 17 TOTAL AND INDIRECT EFFECTS (IN PARANTHESES) ON FINANCIAL PERFORMANCE IN SAMPLE
COUNTRIES ........................................................................................................................................ 78
TABLE 18 SEM ESTIMATION RESULTS BY GROUP............................................................................................. 79
TABLE 19 CONSTRUCT MEANS FOR “HIGH-COST” AND “LOW-COST” COUNTRIES........................................... 81
TABLE 20 PROBABILITIES ASSOCIATED WITH TWO-TAILED T-TEST (“LOW-COST” VS. “HIGH-COST”
COUNTRIES)....................................................................................................................................... 81
TABLE 21 STANDARDIZED REGRESSION COEFFICIENTS (AUSTRIA, FINLAND AND GERMANY)...................... 82
TABLE 22 CONSTRUCT MEANS FOR ENGINEERING COUNTRIES ........................................................................ 82
TABLE 23 PROBABILITIES ASSOCIATED WITH T-TESTS ASSUMING UNEQUAL VARIANCES (ENGINEERING
COUNTRIES)....................................................................................................................................... 84
TABLE 24 CHI-SQUARE DIFFERENCE TEST FOR NESTED MODELS ..................................................................... 85
TABLE 25 CONSTRUCTS' STANDARDIZED TOTAL AND INDIRECT (IN PARANTHESES) EFFECT ON FINANCIAL
PERFORMANCE .................................................................................................................................. 86
TABLE 26 MARKETING PERFORMANCE ASSESSMENT TOOL – A PRACTICAL EXAMPLE ................................... 86
TABLE 27 SUMMARY OF THE STATISTICAL RESULTS ........................................................................................ 91
TABLE 28 COMPARISON OF GROUP REGRESSION COEFFICIENTS ...................................................................... 93
1
1. Introduction
This chapter describes the background and the context of the thesis. It also presents the
research problems and key research objectives of this study and gives a short introduc-
tion to the methodology and concepts used in the later text. Additionally, the chapter dis-
cusses the scope of the study and outlines the structure of this master’s thesis.
1.1. Background
Marketing efforts and know-how are instrumental in commercializing ideas and inven-
tions successfully. Therefore, it could be fatal for companies to ignore the importance of
marketing (cf. e.g. Yli-Kovero, 2006; Salminen, 2006). Kotler (1999) emphasizes the
position of marketing to even argue that, in the future, marketing has the main responsi-
bility for achieving profitable revenue growth for the company. Today cost-efficiency
does not provide long-term competitive advantage for companies whereas marketing,
when well conducted, does. Especially in the field of strategic marketing, benefits are
still largely waiting for realization.
Marketing has traditionally been viewed and treated more as an operational rather than
strategic function in companies. It has focused on decisions related to analyzing and se-
lecting target markets, product and brand development, promotion, and channels of dis-
tribution (Hunt and Morgan, 2001). This perhaps somewhat biased standpoint presents
marketing as a task of creating, promoting and delivering goods and services to consum-
ers and businesses (Kotler, 2003). It is generally accepted that acquiring a new customer
may turn out to be considerably more expensive than building customer loyalty among
firm’s current customers (e.g. Kotler, 2003). This strongly speaks for the need for higher
levels of customer orientation among companies. Similarly to reward systems that base
on short-term performance, short-term marketing focus may start working against
longer-term market orientation, business performance and strategic intentions of a com-
pany.
2
From strategic point of view, as Morgan, Clark and Gooner (2002) argue, marketing
budgets should be seen as capital expenditure in building revenue generating marketing
assets rather than overhead expenditure; marketing resources ultimately drive long-term
marketing performance. It is not easy, however, for marketing managers to convince ex-
ecutives in the absence of valid, reliable, and credible marketing performance assess-
ment (MPA) systems. In addition to corporate executives, also marketing managers are
often unable to uncover and confidently support cause-and-effect relationships between
marketing inputs, marketing processes and marketing performance outcomes. (Morgan,
Clark and Gooner, 2002) Difficulty to assess the marketing performance is evident since
it depends on external, largely uncontrollable factors, such as customers and competitors
(Neely, 2002). Additionally, links to business performance are very often complex and
may include some irrationality; for example, success sometimes bases considerably on
luck. Thus, as the aggravated example shows, high performance of a product or a com-
pany may not have much to do with goodness of management.
It is nevertheless crucial to acknowledge the factors mainly affecting on goodness or
badness of performance. If the company is doing poorly, it has to unravel the reasons for
the current situation so that it can form a plan for a brighter future. On the other hand, a
firm doing well must know what the most influential factors behind its success are be-
cause only accordingly it can sustain its competitive position also in the future. To em-
phasize the importance of understanding long-term value of company resources, Reed
and DeFillippi (1990) state that ambiguous causalities in relationship between competi-
tive advantage in the marketplace and comparative advantage in resources may lead to
allowance of dissipation of comparative resource advantage. Barney (1991) gives hope
to firms not aware of their resource impact on competitive advantage and business per-
formance arguing that it may be as hard for its competitors, too. He puts it: “it is difficult
for firms that are attempting to duplicate a successful firm’s strategies through imitation
of its resources to know which resources it should imitate”.
Even though Bonoma and Clark (1988) argue that marketing’s outputs are subject to so
many internal and external influences that establishing causes-and-effect linkages is very
hard, if not impossible, it is somewhat alarming in the light of previous discussion how

3
the connection between marketing efforts and business performance is still relatively
vague for both academics and decision makers in business context. Increasingly, in order
to survive and excel in today’s heavily competitive environment, companies need to be
able to define their real competitive advantages and focus on them.
According to previous studies (e.g. Hooley et al., 2001; Fahy and Smithee, 1999), mar-
keting capabilities and assets possess potential to be important sources of competitive
advantage for companies. As a component of marketing orientation of a company, also
innovation orientation that situates between internal and external views has been showed
to influence performance (e.g. Matsuno, Mentzer and Özsomer, 2002). In addition, mar-
keting with strong market orientation seems to be increasingly important for firms (e.g.
Kohli and Jaworski, 1990). This is due to strong inward focus of resource-based view of
the firm which is at risk to ignore dynamic market conditions and nature of demand.
Clearly, firms should thus start adapting principles of strategic marketing.
Despite general acceptance of value creation of marketing activities, marketing practi-
tioners have found it difficult to measure and communicate to other functional execu-
tives and top management the value created by investments in marketing (Srivastava,
Shervani and Fahey, 1998). To bring light to the prevalent situation, confirmatory statis-
tical analysis basing on hypotheses from previous literature is a justified method to ex-
plore strategic marketing and its effectiveness.
It seems that studies attempting to link strategic marketing and its consequences on firm
performance have not been conducted too much and e.g. Cadogan et al. (2002) empha-
size the need for further research in different countries to advantage universality of the
previous results. Additionally, international or inter-industrial comparison studies are
lacking almost entirely. This study takes these research gaps into consideration and at-
tempts to fulfill them by analyzing “Marketing in the 21st Century” -data in order to find
common regularities in the background of company performance in general and in dif-
ferent business environments. Indeed, one of the main objectives of this study is to pro-
vide comparisons for sample countries and selected groups which is why this study truly
offers potential value-added to both science and business communities.

4
1.2. The StratMark Project
This Master’s thesis was accomplished as a part of the StratMark project which is a joint
research project of Helsinki School of Economics and Swedish School of Economics.
The project studies strategic marketing and marketing performance, aiming to provide
practical scientific information of the current level of strategic marketing know-how,
methods of measuring marketing performance, and ways to develop the know-how of
Finnish companies. Additionally, the project aims at facilitating a national discussion on
the role of strategic marketing in Finnish companies and governmental or educational
organizations. One of the principal goals of the project is to raise the skill-level, aware-
ness and valuation of marketing in the Finnish society.1
At this early phase of the project, it is necessary to conduct an international empirical
study that clarifies the links between strategic marketing practices and business perform-
ance, to shed light to question “How can marketing performance be managed in prac-
tice?” The primary contribution of this study to the StratMark project is to provide such
a quantitative study. Thereafter, valuable information of international best practices is
gained and it is easier to plan and conduct subsequent project studies.
1.3. Research Problem
One of the major aims of this study is to give guidance to Finnish business managers on
which marketing-related issues they should concentrate on in order to maximize their
companies’ long-term financial performance in Finland and in foreign countries. The
primary research problem for this study can thus be presented as follows:
What kind of strategic marketing most positively and effectively relates to com-
panies’ financial performance in different business environments?
This problem can be further divided into three sub-problems, or research questions, as
presented below:
1 For more detailed information, visit http://www.stratmark.fi

5
1. What is the relationship between marketing resources and business orientations,
and financial performance of a firm?
2. How sensitive are the results to country-specific and business environmental dif-
ferences?
3. How is marketing effectiveness assessed today and potentially in the future?
The first two sub-problems are closely related to each other. Additionally, they are both
empirical in nature. The clear implication of these research questions together is the an-
swer to the question: How should Finnish companies conduct their strategic marketing
in domestic and foreign markets and different business environmental contexts?
The third sub-problem is more analytical in nature. It attempts to bring up new ways to
measure and assess strategic marketing phenomena and their impacts on business per-
formance. The analysis focuses on indicators beyond typical financial measures, such as
return on investment (ROI) and profit margin.
The research question diagram, including the main problem, sub-questions and objec-
tives related to each sub-question, is presented in Figure 1.
Figure 1 Research question diagram
What kind of strategic marketing most positively and effectively relates to companies’ financial
performance in different business environments?
What is the relationship between marketingresources and business orientations, and fi-nancial performance of a firm?
How sensitive are the results to country-specific and business environmental differ-ences?
How is marketing effectiveness assessedtoday and potentially in the future?
Test hypothesized relationships between strate-gic marketing subjects and business perform-ance of a firm
Explore generalizability of the results to firmsin different countries and cultures
Discuss marketing performance assessment(MPA) systems and development areas relatedto themConstruct an MPA tool for company use

6
1.4. Objectives of the Study
First, and foremost, the objective of this study is to find answers to the main research
problem and the three sub-problems related to it. Consequently, arriving at usable mana-
gerial implications and action recommendations, which also are goals of the study, is of
relatively high probability. Individual sub-problems contain their own objectives, too.
These are next described.
Hooley et al. (2001) bring up the need to further theoretically and empirically develop
the strategically significant marketing concepts and their relationships with performance
measures. According to them, there has been especially little attempt to measure market-
ing assets and capabilities and assess their effects on business performance. Therefore,
one clear objective can be assigned to the first sub-problem: test hypothesized relation-
ships between strategic marketing subjects and business performance of a firm.
The objective here is not to form models that take into account each and every aspect of
marketing. Instead, it is to seek for such models that illuminate some of the most inter-
esting relationships between certain marketing resources, business orientations and per-
formance of firms. Data as a whole is used to come up with a model in which regression
coefficients, illustrating direction and magnitude of relationships, could be generally ap-
plicable.
The goal of the second research sub-problem is to explore generalizability of the results
to firms in different countries and market conditions. Somewhat more detailed, compara-
tive analysis is to be conducted at this stage. Naturally, samples of individual countries
and other groups are used here.
Two objectives are attached to the third research question:
1. Discuss marketing performance assessment (MPA) systems and development ar-
eas related to them
2. Construct an MPA assessment tool for company use

7
In regard with the first objective, different MPA systems are to be reviewed with an aim
to find advantages and disadvantages related to them. Future directions and possible ar-
eas of development are also discussed to, among others, help identifying those issued of
most importance in subsequent StratMark studies. Potential development of marketing
metrics could refer, for example, to situations where no detailed financial information is
available or a company has invested heavily and measures such as profitability are poor
indicators of successful business outcomes. Developing a tool for assessing marketing
effectiveness in company level is another goal related to the third research question.
1.5. Methodology
Data usedIn this thesis the “Marketing in the 21st Century” –data set is used. The data has been
collected in 2002 and 2003 as a postal survey in 14 countries around the world and it
contains information from 6038 companies in Australia, Austria, China, Finland, Ger-
many, Greece, Hong Kong, Hungary, Ireland, The Netherlands, New Zealand, Poland,
Slovenia and The United Kingdom. Information in the data set focuses on companies’
marketing resources, competitive positioning and business performance. The data set
will be described in more detail in Chapter 3.
The research questionnaire of the data set in different countries was not quite identical
which caused that one of the sample countries, Poland, had to be left outside the statisti-
cal analysis. Although some data imputation was made, Polish data set contained so se-
vere weaknesses (large amount of critical questions with no answers) that it had to be
ignored.
Research methods usedThe research can be divided into two parts. Consequently, also two main research meth-
ods, literature review and analysis, and statistical analysis, are used to solve the research
problem and answer the research questions. The methods are next shortly described.

8
Literature review and analysis
As the intention of the study is to test and potentially confirm certain theory-basing
causal relationships between companies’ marketing resources, business orientations and
business performance, it was rational to choose literature review as a preliminary re-
search method. Consequently, fairly detailed literature review is to be conducted on cer-
tain performance-related factors in the research field of strategic marketing. Due to rela-
tively young field of research in strategic marketing, literature section contains quite a
significant amount of material of more traditional frameworks, such as Porter’s generic
competitive strategies and resource-based view (RBV) of the firm. The review section
aims arriving at a framework between concept of strategic marketing and other related
and more established concepts. Finally, as a conclusion of the literature review, research
hypotheses on relationships between different business orientation and capabilities-
based factors and the performance of the company are developed.
Statistical analysis
The second part of the study is carried out by applying statistical analysis methods to the
research data. This empirical part builds upon the first, theoretical part of the study mak-
ing them closely interrelated.
As told before, there is not much research on relationships between marketing-related
issues and business performance. Further, a relatively remarkable part of it has based its
statistical analysis solely on exploratory methods, such as exploratory factor analysis
(EFA). Lack of more sophisticated statistical methods used has been easily identifiable;
e.g. Tuominen et al. (2003) propose further studies with confirmatory factor analysis
(CFA) and structural equation modeling (SEM). These methods offer accurate and veri-
fiable ways to test the theory-basing relationships in the field of strategic marketing from
the data. In addition to these predominant statistical methods, EFA and frequency analy-
sis are used in this study to partly determine the reliability and generalizability of the
results.
The data analysis is organized in the following way. Simple, descriptive analysis (in
Chapter 3) is being first performed in order to get a general picture of the country sam-
9
ples by providing some clarifying frequencies of marketing- and performance-related
factors compared to market and firm-specific characteristics. Actual analysis (in Chapter
4) starts with CFA to examine the validity of previously formed factors and their indica-
tors, and thus to test the goodness of measurement model fit with the data. Subsequently,
SEM is performed in order to test the research hypotheses of this study.
1.6. Scope of the Study
The scope of the study is somewhat evident from the research problem, research ques-
tions and objectives of the study. In addition, developing conceptual framework of stra-
tegic marketing is at the core of the research. Both academics and firm company audi-
ences are being considered in this study since, in addition to taking part to discourse of
strategic marketing, it also offers implications and even a concrete marketing perform-
ance assessment tool for firms.
The questionnaire included both strategic and more operational issues, offering plenty of
analysis possibilities. Though there would have been lots of possible constructs to in-
clude in the statistical analysis, this study has its focus on factors that have potential to
provide positive long-term performance impact for companies. At the core of the analy-
sis are different marketing-related capabilities and company orientations. Consequently,
both inner and outer perspectives are dealt within the study.
Both the comparison analysis entities of this study include Finnish company sample due
to probably highest interest in Finnish results, analysis and implications among majority
of potential readership of this report. Case Finland is also otherwise closely examined.
1.7. Key Concepts
MarketingMarketing has been diligently given definitions and practically every author has its own
interpretation of the concept. However, the definition most commonly used as a refer-
ence is that of The American Marketing Association (AMA). The current definition of
AMA is the following:
10
Marketing is an organizational function and a set of processes for creating,
communicating, and delivering value to customers and for managing customer
relationships in ways that benefit the organization and its stakeholders.2
Hooley et al. (2001), in turn, provide a following definition:
Marketing is the process of profitably matching organizational capabilities to
the requirements of chosen customers.
Both of the definitions are rather strategic and customer-oriented, not focusing on opera-
tional issues, such as 4P’s of marketing (or marketing mix; product, price, place, promo-
tion) or marketing channels. The marketing concept clearly argues that (1) all areas of
the firm should be customer oriented, (2) all marketing activities should be integrated,
and (3) profits, not just sales, should be the objective (Hunt and Morgan, 2001). The first
argument of these closely relates with the concept of market orientation.
StrategyIt is commonly argued that the first strategist of all-time was Sun Tzu, Chinese general
who lived in the fourth century B.C. He emphasized the need for far-sightedness and
good planning. Sun Tzu also put importance on knowing both your enemy and yourself,
and sensitively reacting to changing conditions. (Chen, 1994) Since the days of Sun Tzu,
many business-related phenomena have gone through significant changes but the con-
cept of strategy has remained essentially the same. Put simply, strategy is a long-term
plan for achieving a company goal.
To highlight the difference between strategic and operational management, Drucker
(1966) well claimed good strategic performance (effectiveness) as “doing the right
things” and good operational performance (efficiency) as “doing things right”. As for
concept of marketing, there are numerous definitions available for strategy in different
publications. One can therefore choose which of several strategic points of view best
suits the situation at hand. I next shortly consider two of them.
2 Dictionary of Marketing Terms, http://www.marketingpower.com/mg-dictionary-view1862.php

11
Porter (1980) defines competitive strategy as “a combination of the ends (goals) for
which the firm is striving and the means (policies) by which it is seeking to get there”.
He introduces three generic competitive strategies of overall cost leadership, differentia-
tion, and focus. Miles and Snow (1978) offer another set of business strategies: prospec-
tor, defender, analyzer and reactor, with somewhat close interpretations with those of
Porter. Evidence from everyday company communication and firm websites suggest that
companies’ strategic orientations are becoming increasingly customer-focused, implicat-
ing the current understanding of satisfied customer being a profitable customer.
Resource-based view (RBV) of the firm can be traced back to late 1950s and work of
Penrose (1959). This view offers a somewhat different angle to strategy with point of
departure of resource heterogeneity and immobility. It has closely to do with sustainabil-
ity of competitive advantages; according to resource-based theory, competitive advan-
tage, and subsequently performance, depends on historically developed resource en-
dowments (Hooley and Greenley, 2005).
Strategic MarketingThe concept of strategic marketing is used in various ways and any established defini-
tion is not yet available. This study aims to further develop the definition in relation with
other, more established concepts, such as strategy and marketing. To start with, the
StratMark project has defined strategic marketing as deeply customer-oriented concept
focusing on the top management’s long-term vision for competitive advantage through
product innovation, other functions being fully subservient to this process. While cus-
tomers are at the core of all thinking, innovation orientation must stem from the com-
pany (Vassinen, 2006). From the StratMark perspective, therefore, both inside-out and
outside-in orientations are of great importance in strategic marketing.
PerformancePerformance outcomes result from success or market position achieved (Hooley et al.,
2001). Performance can be determined in various ways. It might stand for financial per-
formance, market performance, customer performance or overall performance, at least.
In this thesis, term business performance is mainly used as a general performance meas-

12
ure. Financial performance literally refers to financial measures, such as profit margin
and return on investment (ROI). Market performance includes e.g. measures of market
share and sales volume. Additionally, superior performance in this study refers to per-
formance that exceeds that of its closest competitors (cf., Hunt and Morgan, 2001). Spe-
cially, superior market performance probably, but not necessarily, results in superior fi-
nancial performance (Hooley et al., 2001).
BenchmarkingThe concept of benchmarking is somewhat vague and needs further clarification in terms
of this study. Benchmarking is in this case used in the spirit of Mayle et al. (2002) who
define benchmarking as a process whereby organizations pursue enhanced performance
by learning from the successful practices of others, either from other parts of the same
organization, competitors or organizations operating in different business environments
but whose business processes are nevertheless in some way relevant. Best international
strategic marketing practices are, indeed, those that are at the core of this thesis.
Marketing ResourcesMarketing resources consist of marketing assets and marketing capabilities. Assets can
be defined as the resource endowments the business has accumulated (e.g. investments
in scale, scope, efficiency of facilities and systems, location and brand equity). Capabili-
ties, in turn, are “the glue that brings these assets together and enables them to be de-
ployed advantageously” (Day, 1994) or complex bundles of skills and collective learn-
ing, exercised through organizational processes that ensure superior co-ordination of
functional activities (Hooley and Greenley, 2005). Marketing capabilities play a central
role in this study. In his seminal article, Day (1994) suggests that there are three kinds of
capabilities in every firm: outside-in (customer linking) capabilities, inside-out (market-
ing support) capabilities and spanning capabilities. This study uses this framework to a
significant extent; spanning capabilities have been substituted by a relatively close con-
cept of innovation orientation.

13
1.8. Structure of the Thesis
This section presents the structure of this report which is rather similar than the structure
of the study, illustrated in Figure 2. Firstly, Chapter 1 presented the context, research
problem and objectives of the study. Chapter 2 is devoted to literature review. It focuses
on components of strategic marketing and positioning the concept. Also, performance
measurement and methods used for that are examined. At the end of chapter, hypotheses
for the empirical part of study are developed. Chapter 3 describes the methodology of
the study. It presents the data and statistical methods used in the study.
In Chapter 4 results from statistical analyses are presented and a possible implication on
results is made. Chapter 5 draws together results and discusses them in light of previous
research. Also reliability analysis is conducted and evaluation of the contribution of the
thesis is made. The report ends with presentation of limitations of the study and possible
avenues for further research.
Literature Review
Development of Research Hypotheses
Acquaintance with Data andSelection of Research Methods
Quantitative Analysis
Discussion and Conclusions
Figure 2 Structure of the study

14
2. Literature Review and Hypotheses Development
The purpose of this chapter is to present the concept “strategic marketing” in relation
with other, more established frameworks in marketing and strategy. The relationships
between different marketing resources and business orientations, and company perform-
ance are also examined. Performance studies and marketing strategy -related issues are,
as well, discussed. At the end of the chapter, the hypotheses for statistical analyses are
developed.
2.1. Strategic Marketing
The term “strategic marketing” suggests that it has something to do with both strategy
and marketing. Beyond that, it clearly requires further elaboration and development
since the concept is still relatively young and yet unestablished. This section first dis-
cusses different dimensions and concepts of strategic marketing that are of greatest rele-
vance in regard to this study. Subsequently, basing on the discussion, strategic marketing
is then positioned somewhere in the middle ground between more established concepts,
such as generic competitive strategies (Porter, 1980) and marketing framework (e.g.
Kotler, 2003).
2.1.1. Market OrientationUnderstanding competition is central to form marketing plans and strategy (Proctor,
2000). Chinese general Sun Tzu put importance on knowing both your enemy and your-
self, and sensitively reacting to changing conditions already in the fourth century B.C.
(Chen, 1994). This makes him one of the ancestors of market orientation. I think Day
(1994) quite well captures the essence of market orientation when defining that “in mar-
ket-driven firms the process for gathering, interpreting, and using market information are
more systematic than in other firms.” To simplify, every company has to choose from
two fundamentally different orientation approaches how to operate. First, it can sell what
it can make; in this case emphasis is on product features, quality and price. Second, it
can make what it can sell; now emphasis is on product benefits and ability to satisfy the
needs of customer or solve problems. Where the first alternative, product-orientation,

15
focuses on technical research, the second option, market-orientation, focuses on identify-
ing new opportunities and applying new technology to fulfill customer needs. Primary
focus in a market-oriented company is put on customer’s needs and market opportuni-
ties. (Walker, Mullins, Boyd, Larréché, 2006)
Customer is always right, they say. This leads to a challenge of always finding out what
the customer actually wants. However, one should also take into account how competi-
tors act and how to communicate and coordinate the information flow between business
functions. Combined, these dimensions contribute to market orientation of a company.
Market orientation is an important part of contemporary marketing thought with signifi-
cant amount of research from different perspectives available since the early 1990s.
Consequently, several definitions for this concept have also been offered, making it
carefully considered (Noble, Sinha and Kumar, 2002). Importance of market orientation
has not been questioned in marketing literature; Kotler (2003) even argues that segmen-
tation, targeting and positioning – which all can be effectively performed in companies
of high market orientation – is the essence of strategic marketing.
Especially two research groups, Kohli and Jaworski, and Narver and Slater, have put
enormous effort in developing the market orientation concept. Kohli and Jaworski
(1990) define market orientation as “organization-wide generation of market intelligence
pertaining to current and future customer needs, dissemination of the intelligence across
departments, and organization-wide responsiveness to it”. Put differently: know the
market, share the market information, and act on it. According to Narver and Slater
(1990), rather similarly, market orientation is about customer orientation, competitor
orientation and inter-functional coordination with long-term and profitability focuses.
This latter framework, used in subsequent statistical analysis, is presented in Figure 3.
Narver and Slater (1990) argue a fundamental benefit of being market oriented to be the
continuous superior performance for the business. Market orientation cannot be inter-
preted to exist in a vacuum from other activities and pressures in the business (Hooley et
al, 2001). On contrary, it can be evidenced that facing recent changes in business envi-
ronment, such as globalization, increased importance of services, information technol-

16
ogy and relationships across company functions and firms, have led to a situation where
most industries have to be more and more market-oriented (Walker, Mullins, Boyd, Lar-
réché, 2006). Further, without a doubt, market orientation that stresses the importance of
using both customer and competitor information (Hunt and Morgan, 2001) should
clearly be involved when formulating strategy.
Long-TermProfitFocus
Customer Orientation
CompetitorOrientation
InterfunctionalCoordination
Figure 3 Characteristics of market orientation (Narver and Slater, 1990)
Hunt and Morgan (1995) stress the importance of, in addition to current competitors and
customers, also analyzing potential competitors and market niches. This, I think, is a
good and necessary supplement to the definition of market orientation since myopic
market perspective may lead to success only in relatively short term. Market orientation,
defined by Hunt and Morgan (1995) is (1) systematic gathering of information on cus-
tomers and competitors, both present and potential, (2) systematic analysis of the infor-
mation for the purpose of developing market knowledge, and (3) systematic use of such
a knowledge to guide strategy recognition, understanding, creation, selection, implemen-
tation and modification.
Some researchers have ended up with somewhat different, but alike, definitions for mar-
ket orientation than those described above. For example, Noble, Sinha and Kumar
(2002) extend the definition of market orientation to include brand focus as one of its
dimension. On the other hand, e.g. Ruekert’s (1992) definition for market orientation
lacks the competitor component, being “the degree to which the business unit obtains

17
and uses information from customers, develops a strategy which will meet customer
needs, and implements that strategy by being responsive to customers’ needs and
wants”. Whatever the definition, market orientation clearly is intangible and cannot be
purchased in the marketplace. It may well be also true that, as Hunt and Morgan (2001)
argue, market orientation is socially complex in its structure, has components that are
highly interconnected, and has mass efficiencies and effectives that grow in strength in
time.
Rather closely related to market orientation framework, Treacy and Wiersema (1993)
presented the idea of delivering value to customers in one of the following three ways to
achieve market leadership: operational excellence, customer intimacy or product leader-
ship. By operational excellence, they mean providing customers with reliable products
or services at competitive prices and delivered with minimal difficulty or inconvenience.
Customer intimacy, the second value discipline, means segmenting and targeting mar-
kets precisely and then tailoring offerings to match exactly the demands of those niches.
Product leadership, in turn, refers to offering customers leading-edge products and ser-
vices that consistently enhance the customer’s use or application of the product, thereby
making rivals’ goods obsolete.
Of these three disciplines, customer intimacy and product leadership have, I think, most
to do with market orientation; while companies pursuing operational excellence concen-
trate on making their operations lean and efficient, those pursuing a strategy of customer
intimacy or product leadership build customer loyalty for longer term. Treacy and
Wiersema (1993) argue that companies, to achieve leading position in their industries,
should not broaden their business focus but narrow it; while mastering one of the disci-
plines, it is sufficient to meet industry standards in others. Performance impact of market
orientation can in this case be explained with commonly established argument according
to which satisfied customers are more loyal customers than unsatisfied ones (Srivastava,
Shervani and Fahey, 1998). Srivastava et al. (1998) also state that they extend their rela-
tionships with vendors to include other products and services and buy offerings in larger
quantities, and are willing to pay higher prices and spread the good word to their circles
of acquaintances. Further, due to probably several times lower costs of customer reten-

18
tion compared to new customer acquisition (e.g. Kotler, 2003), successful market orien-
tation rationally increases financial performance of a firm.
The empirical research of Narver and Slater (1990) found out the U-shaped relationship
between market orientation and business profitability in numerous industries. Thus,
companies with highest market orientation seem to perform best while those least mar-
ket oriented do also relatively well; here, as with generic competitive strategies of Porter
(1980) and value delivering (Treacy and Wiersema, 1993), it does not pay to be “stuck
in the middle”. Narver and Slater (1990) suggest this kind of relationship to be evident
especially in basic industries and long-established technology-driven industries. To date,
many authors have found the positive relationship between market orientation and busi-
ness performance. These will, however, be further considered in section 2.5.
According to Day (1994), market-driven organizations have superior market sensing,
customer linking, and channel bonding (i.e., outside-in marketing) capabilities. When
studying companies in the UK, Hooley et al. (2005) empirically found positive relation-
ship between market orientation and customer linking capabilities. Also conceptually,
market orientation and outside-in market capabilities are neighboring phenomena, even
partly interrelated. This fact leads us naturally to the next ingredients of strategic mar-
keting, namely marketing assets and capabilities.
2.1.2. Marketing Assets and CapabilitiesHunt and Morgan (2001) argue that the neoclassic theory of perfect competition does not
support the view of resources as a source of competitive advantage when presenting
“factors of production” as homogeneous and perfectly mobile. It can therefore not ex-
plain differences in, for example, innovativeness and quality or offerings among firms.
Instead of applying this static theory, there is a need for a more dynamic theory: re-
source-based view of the firm and comparative advantage theory of competition are
what we need; they treat resources as both significantly heterogeneous across firms and
imperfectly mobile. (Hunt and Morgan, 2001) According to Fahy and Smithee (1999),
an essential element of the RBV of the firm, in addition to firm’s key resources, is the
role of management in converting those resources into positions of sustainable competi-

19
tive advantage which ultimately leads to superior performance in the marketplace. Thus,
it is argued that resources have potential to offer a rather good explanation for the per-
formance differentials among firms.
Marketing resources of a firm consist of marketing assets and marketing capabilities.
Marketing assets is one category of firm’s organizational assets. Those include, among
others, distribution penetration, marketing expertise, market positioning, market knowl-
edge, customer loyalty, brand name reputation and relationships with distributors (Proc-
tor, 2000). The three capability categories potentially providing competitive advantage
are determined as outside-in capabilities, spanning capabilities and inside-out capabili-
ties. The division of capabilities into the three categories depends on orientation and fo-
cus of the defining processes (Day, 1994). This is presented in Figure 4.
EXTERNAL EMPHASIS INTERNAL EMPHASIS
Outside-InProcesses
Inside-OutProcesses
Spanning Processes
• Market Sensing
• Customer Linking
• Channel Bonding
• Technology Monitoring
• Customer Order Fulfillment• Pricing• Purchasing• Customer Service Delivery• New Product/ServiceDevelopment
• Strategy Development
• Financial Management• Cost Control• Technology Development• Integrated Logistics• Manufacturing/ Transformation
Processes• Human Resources Management• Environment Health and Safety
Figure 4 Three categories of firm capabilities (Day, 1994)
At the other extreme of the continuum in Figure 4 situate outside-in capabilities (or
processes). According to Day (1994), these capabilities connect the processes defining
other organizational capabilities to the external environment and enable the business to
compete by anticipating market requirements ahead of competitors thus creating durable
relationships with customers and other shareholders. At another end of the continuum

20
situate inside-out capabilities. They are highly internally emphasized and unfold what
the firm is good at and capable of doing. Somewhere between these extremes are span-
ning capabilities that are needed to integrate the outside-in and inside-out capabilities.
(Day, 1994) Regarding capabilities in this study, the predominant interest is put on out-
side-in and inside-out capabilities and not on spanning capabilities. The last category is,
however, in a way included in other phenomena of the study, namely in market and in-
novation orientation.
Day (1994) proposes that business organizations may become more market-oriented by
identifying and building the special capabilities which make market-driven organizations
distinct from one another. He argues that a company usually needs to possess a few su-
perior, distinctive capabilities to increase probability of outperforming the competition
and, eventually, succeed. For example, the inside-out capability of manufacturing cus-
tom products at low cost, combined with the outside-in capability for understanding the
evolving needs of the customer, can turn out to be an extremely powerful weapon in
competitive markets.
Evidenced by recent changes in the marketplace, such as increased competition in open
markets as a consequence of globalization, customer is stronger than ever. The situation
calls for stronger focus on him or her, the needs he or she may have, and customer satis-
faction fulfillment. Therefore, outside-in marketing capabilities are those growing most
in importance. It may, however, turn out to be very difficult to adopt and sustain external
orientation in practice; usually any minor changes do not shift an orientation of the firm
but wide-ranging cultural changes are necessary (Day, 1994). This is supported by
Treacy and Wiersema (1993) who suggest that the ultimate challenge is to confront radi-
cal change and develop internal consistency with the strategy focus.
Positioning decisions draw often heavily on the capabilities and assets available (Hooley
et al., 2001). Fahy and Smithee (1999) further emphasize that intangible resources and
capabilities are more difficult to duplicate and provide a more meaningful basis for mar-
keting strategy development. They also provide a good resource-based model where
they combine and build on several previous studies. They argue that resources are of un-

21
equal importance in achieving sustainable competitive advantages and that management
plays a critical role in the process of achieving them. The model, flowing from key re-
source base eventually to superior performance, moderated by management’s strategic
choices, is illustrated in Figure 5.
Key Resources
Value
Barriers toDuplication
Appropriability
TangibleAssets
IntangibleAssets
Capabilities SustainableCompetitiveAdvantage
Value toCustomers
SuperiorPerformance
Market Performance
Financial Performance
Resource Identification
Resource Development/Protection
Resource Deployment
Management’sStrategic Choices
Figure 5 A resource-based model (Fahy and Smithee, 1999)
2.1.3. Innovation OrientationBrilliant ideas are always needed to fuel marketing. To distinct innovation from inven-
tion, Joseph Schumpeter already in 1934 presented definition, stating that invention is
the creation of something new whereas innovation is the act through which these new
ideas are successfully introduced to the market (Schumpeter, 1934). Constant urge for
innovations is clearly a trait deep inside a firm; for example, Sony has generally been
regarded as a company with high innovation orientation.
Firms that possess high innovation orientation differentiate themselves from other com-
panies mainly with degree of innovation they build into their offerings (Hooley and
Greenley, 2005). Innovation orientation, as market orientation and marketing capabili-
ties, is a deeply inherent characteristic of a company; Howard (1983) argues that process
innovation is a prerequisite for successful product innovation. Innovation orientation
also has points of convergence with concepts of first-mover advantages and disadvan-
tages, introduced and developed by Lieberman and Montgomery (1988; 1998). The link

22
between innovation orientation and advantages gained from different entry timing strate-
gies is illustrated by Hooley and Greenley (2005): “Being first to market requires effec-
tive new product development systems and processes, effective R&D skills, and a de-
gree of creativity in identifying market gaps and opportunities. Because of the complex
interplay of resources required for effective innovation, a position based on this is likely
to enjoy a high degree of defensibility.” (Hooley and Greenley, 2005)
Continuous innovativeness (or, innovation orientation) makes it possible to pioneer, or
entry very early, on the market. Market pioneering, however, is neither necessary nor
sufficient for long-term success and leadership (Tellis and Golder, 1996). Additionally,
while it has several potential advantages to get to the market early, also some drawbacks
are related to it: for example, being first in market may turn to costly failure if demand is
significantly smaller than expected. On the other hand, the situation for a late-comer
may be difficult if first-mover has been able to establish strong foothold from the market
(Lieberman and Montgomery, 1988).
It is important to acknowledge that in strategic marketing, customers and companies are
involved in all phases of value cycle: value defining, value developing, value delivering
and value maintaining (Day, 1999). Understanding customer needs and providing cus-
tomer satisfaction with a help of best fitting market offering can be regarded as a major
success factor so that having high levels in both market and innovation orientation may
well turn out to be an ultimately competitive combination for companies.
2.1.4. Positioning Strategic MarketingVassinen (2006) performed an extensive bibliometric study to examine which concepts
have influenced most on strategic marketing discourse. He found those to be (i) the
competitive environment, (ii) operational marketing performance and international
growth, (c) the resource-based view of a firm, and (iv) market orientation and perform-
ance. Since the assumption that market orientation and marketing resources, and strate-
gic marketing are inseparable can based on previous sections of this chapter be made, in
this section my aim is to position strategic marketing in the grounds of two first concepts
in the list above. The concept of competitive environment culminates in Porter’s famous

23
generic competitive strategies (1980) whereas Kotler’s marketing concept (e.g. 1999;
2003) is used as a reference in operational marketing.
Although terms “strategic marketing” and “marketing strategy” are very close to each
other literally, they refer to considerably different phenomena; marketing strategy is
more about how to conduct operational marketing in long term (cf. Kotler, 2003). Intui-
tively, since the concept is not named as “operational marketing” but strategic market-
ing, suggestion is made that more importance should be put on doing the right things
than on doing things right (Drucker, 1966). Nevertheless, at least sufficiently high levels
in both efficiency and effectiveness are naturally needed for a business to become suc-
cess. It therefore is natural that strategic marketing builds on both “operational” market-
ing and strategic perspectives, adopting perhaps the best parts out of both of them.
Porter (1980) defines competitive strategy as “a combination of the ends (goals) for
which the firm is striving and the means (policies) by which it is seeking to get there”.
He introduces three generic competitive strategies: overall cost leadership, differentia-
tion and focus3. According to Porter, it is deadly to get stuck in the middle of these
strategies; a firm with an average-priced, not significantly unique product which has not
been focused to a particular target group is “almost guaranteed low profitability” (Porter,
1980). Of the concepts of this study, market orientation and outside-in capabilities
closely relate with differentiation strategy because in all of them market needs and com-
petitor emphasis are at the core of activities taken. Also innovation orientation, eventual
goal being to satisfy a customer, can be linked to differentiation strategy. Inside-out ca-
pabilities could be attributed to either cost leadership or differentiation strategy, perhaps
more to cost leadership. Narver and Slater (1990) have supported this view by stating
that differentiation strategy, being an external emphasis, is more likely to be pursued by
a company with a strong market orientation than a low cost strategy. Focus strategy can
be considered as linked with market orientation and outside-in capabilities since those,
3 “A firm has a cost advantage if its cumulative cost of performing all value activities is lower than com-petitor’s costs. Cost advantage leads to superior performance if the firm provides an acceptable level ofvalue to the buyer so that its cost advantage is not nullified by the need to charge a lower price than com-petitors. Differentiation will lead to superior performance if the value perceived by the buyer exceeds thecost of differentiation.” (Porter, 1980)

24
by increasing company’s knowledge on competitive environment and actors in it, may
especially lead to successfully taking advantage of lucrative market niches.
In fact, Porter’s differentiation strategy is not very far from marketing concept. Kotler
(2003) namely describes marketing as a customer-centered concept where the job is not
to find right customers for the product but right product for the customer. Further, the
key to achieving its organizational goals is company being more effective than competi-
tors in creating, delivering and communicating superior customer value to its chosen tar-
get markets. The marketing concept therefore takes an outside-in perspective: it starts
with a well-defined market, focuses on customer needs, co-ordinates all the activities
that will affect customers, and produces profits by satisfying customers (Kotler, 2003).
“Being more effective” and “choosing target markets” in the definition also argues that
low cost and focus strategies relate to the marketing concept.
Marketing management can be seen as consisting of five steps: (1) research, (2) segmen-
tation, targeting and positioning, (3) marketing mix, (4) implementation, and (5) control
(Kotler, 1999). Since the second phase of these is essentially overlapping with the dif-
ferentiation strategy, we concentrate here on other phases. Research (e.g. market re-
search) relates closely with market orientation and somewhat with outside-in capabili-
ties. Marketing mix (product, price, place and promotion) and implementation, in turn,
have heavily to do with inside-out capabilities; good operational performance, for exam-
ple. In implementation phase information is required to flow freely between company
functions so also market orientation (more specially, inter-functional coordination) is
linked with it. In control phase feedback needs to be collected from the marketplace and
corrective actions to be taken based on the information gathered so, all the categories of
strategic marketing are involved, especially market orientation and inside-out capabili-
ties.
The relationships between concepts in this study and those of generic competitive strate-
gies and marketing concept are gathered into Table 1 (“+” and “++” refers to strength of
relationships).

25
Table 1 Components of strategic marketing in relation to generic competitive strategies andmarketing concept
SM component Differentiation Low cost Focus Research Marketing mix Implementation ControlMarket orientation ++ ++ ++ + ++Innovation orientation ++ + +Inside-out capabilities + ++ ++ ++ ++Outside-in capabilities ++ + + +
Generic competitive strategies Marketing concept
In general, differentiation strategy is having strong relationship with almost all strategic
marketing components while low cost strategy only strongly relates with inside-out, or
marketing support capabilities. On the other hand, market orientation and inside-out ca-
pabilities have most to do with marketing concept. It is hard to conclude which concept
would be closer to concept of strategic marketing, taking into account also that relative
amount of plus marks is almost equal, so I end up positioning it symmetrically in the
midway between them. By taking also market orientation and resource-based view of the
firm into consideration, the following figure (Figure 6) results. It illustrates the final
proposition for strategic marketing’s position relative to the neighboring concepts.
CompetitiveStrategies
MarketingFramework
Resource-based Viewof the Firm
Market Orientation
SM
Figure 6 Positioning strategic marketing
2.2. Gaining and Sustaining Competitive Advantages
It is a fact that firms differ across and within countries and industries in size, scope,
methods of operation and performance. Also amount and quality of resources provide
potential source of firm differences. Still, for any business, in order to achieve superior

26
performance, developing and sustaining competitive advantage is required (Slater and
Narver, 1994). Often these advantages are achieved by successful market positioning;
choosing one of three competitive strategies is better than to be “stuck in the middle”
(Porter, 1985). Competitive advantages are often achieved with combination of good
strategic insight and resources required to implement the chosen strategy. Nevertheless,
Morgan, Clark and Gooner (2002) argue that, due to research ignorance of RBV, “we
have almost no knowledge concerning sources of advantage in marketing performance”.
According to Slater and Narver (1994), creation of competitive advantage has shifted
from structural characteristics, such as market power or economies of scale, to capabili-
ties that enable a business to consistently deliver superior value to its customers. Re-
source-based view of the firm, highlighting the importance of key resources in achieving
competitive advantages (Hooley et al., 2001) thus has significant amount of explanation
power when it comes to gaining competitive advantage. To take the idea even further,
competitive advantage, and subsequently performance, depends on historically devel-
oped resource endowments (Hooley and Greenley, 2005). Proctor (2000) supplements
these definitions by adding a sustainability component and arguing that “for a strategy to
be sustainable it has to be based on the firm’s resources and capabilities”.
Cadogan et al. (2002) present the concept of market-based resources to characterize
those resources that enable the firm to develop a sustainable competitive advantage and
create customer value in the marketplace. This definition is in line with marketing point
of view of developing competitive advantages and position, described by Hooley et al.
(2001). What resources, then, lead to sustainable competitive advantage? In his classic
article, Barney (1991) states that sustainable competitive advantages cannot be bought
from the marketplace. Instead, to be a source of sustainable competitive advantage, a
resource has to fulfill four conditions: 1) it must be valuable, 2) it must be rare among a
firm’s current and potential competition, 3) it must be imperfectly imitable, and 4) there
cannot be strategically equivalent substitutes for this resource that are valuable but nei-
ther rare or imperfectly imitable. These attributes, according to Barney, can be inter-
preted as empirical indicators of how heterogeneous and immobile a firm’s resources are
and, thus, how useful these resources are for generating sustained competitive advan-

27
tages. Day (1999) argue that committed relationships are among the most durable advan-
tages because they are hard for competition to understand, copy or displace. Market ori-
entation is learned, among others, by associating with other employees that are already
market oriented; it may therefore well be that a truly market-oriented firm can enjoy a
sustainable comparative advantage which in turn may lead to a position of sustainable
competitive advantage and eventually superior long-run financial performance (Hunt
and Morgan, 2001).
Sustainability of the competitive advantage and hence position, is seen to be achieved
through the deployment of isolating mechanisms to protect the advantage. Given the
many different ways in which competitive positions are created, and the complex inter-
play of the various dimensions of positioning, this is likely to cause a serious identifica-
tion problem for competitors (Hooley et al., 2001). Isolation mechanisms include causal
ambiguity (cf. Lippman and Rumelt, 1982) (difficulty competitors might experience in
identifying how an advantage was created in the first place, caused by resource com-
plexity and specificity (c.f. Reed and DeFilippini, 1990)), resource interconnectedness,
path dependency (need to pass through critical time dependent stages to create the ad-
vantage), economics (the cost of imitation) and legal barriers (such as property rights
and patents) (Fahy and Smithee, 1999; Hunt and Morgan, 2001).
Rate of innovativeness and timing of market entry are potential facilitators of achieving
competitive advantage for firms. So-called first-mover advantages may, however, not be
sustainable and early entrants are often overtaken by competitors with more potent re-
sources or capabilities as the market evolves (e.g. Lieberman and Montgomery, 1988;
1998; Porter, 1985). In fact, sustaining competitive advantage a firm has managed to
achieve probably only occurs when a firm’s comparative advantage in resources contin-
ues to yield a position of competitive advantage despite the actions of competitors (Hunt
and Morgan, 2001). Since a head start alone is not sufficient to achieve cost and differ-
entiation advantages over rivals that result in dominant and enduring market shares and
abnormal financial returns (Kerin, Varadarajan and Peterson, 1992), the only way a first-
mover can maintain its profits is to introduce new products and stay one step ahead of
competition (Rahman and Bhattachrayya, 2003). This calls for relentless innovativeness

28
which can, instead of only responding to customer needs but also influencing tastes of
consumers, lead to (sustainable) competitive advantage (Carpenter and Nakamoto,
1989).
Globalization and consequently increased networking and greater pace of market evolu-
tion have created conditions where catch-up strategies are favored more than ever before
(Mathews, 2002; Kerin, Varadarajan and Peterson, 1992). In addition, market potential
for innovative late-movers may be at least as high as that for the pioneers (Shankar, Car-
penter and Krishnamurthi, 1998). Fortunately, in addition to resource-based sustaining,
firms can attempt neutralizing competitive threats in the spirit of Porter’s Five Forces
model (1980): they can, for example, try to raise barriers to entry (e.g. create and exploit
economies of scale, differentiate products and patent technologies), compete on dimen-
sions above and beyond price and improve product attractiveness compared to its substi-
tutes (in terms of differentiation or cost leadership) (Barney, 1997).
Competitive position is argued to form the dynamic link between resources, strategies,
implementation and performance in all markets (Hooley et al., 2001). Nevertheless,
moderating effect of firms’ competitive positions on business performance is not studied
in this research; instead, how competitive advantages are gained and how they affect on
business performance of a firm are issues considered in the study.
2.3. Performance Measurement
2.3.1. Measuring Business PerformanceThere are several points of departure that can be used to assess performance of a busi-
ness. These include, among others, accounting perspective (assessment of financial
measures of performance), marketing perspective (assessment of marketing inputs, too)
and operations perspective (assessment of effectiveness and efficiency) (Neely, 2002).
Apart from purely accounting-based assessment, all the assessment systems are increas-
ingly using non-financial indicators as to help analyses. Especially concept of Balanced
Scorecard (BS), introduced by Kaplan and Norton (1992) has been lately applied (situa-
tion-sensitively) more than ever. Examination with a standard BS includes four dimen-

29
sions: financial, customer, internal business process, and learning and growth. In a way,
BS integrates all the distinct points of departure discussed above.
In general, performance assessment systems can be viewed as processes with four basic
steps: setting a desired performance standard, collecting and communicating information
relating to actual performance, comparing this information with the performance stan-
dard, and taking corrective action where necessary (Morgan, Clark and Gooner, 2002).
Austin and Gittell (2002) further argue that performance should be clearly defined and
accurately measured. They however report examples where business performance is
high even though these principles are not fulfilled, leading to a conclusion that the the-
ory they provide does not apply to all companies and business environments. Again,
luck sometimes creates success.
Although the concept of business performance is easily thought to be simple and un-
equivocal, this view is not supported by several researchers (e.g. Lebas and Euske, 2002;
Clark, 2000). On the contrary, business performance is not just something one observes
and measures. It is a relative concept defined in terms of some referent employing a
complex set of time-based and causality-based indicators bearing on future realizations.
Above all, performance is about the capability to generate future results. (Lebas and
Euske, 2002) Always this has not been considered adequately, however. In these occa-
sions, results typically assume that history repeats itself and for example changing busi-
ness environment and needs to modify the performance assessment protocol are ignored.
The three basic components of any performance study are (1) variables, (2) sample and
(3) results: variables, or factors of interest, are studied within sample of population to be
able to generalize the results to the entire population. There are, nevertheless, several
approaches to conducting such studies. Two main streams can be identified: sample data
may be collected from accounting records of a company, such as profit and loss state-
ment and balance sheet, or from the people who are experts or somehow otherwise in-
volved in the issue under study. The latter approach might be carried out, for example,
with a help of a questionnaire or structured interview. The former bases relatively more
on pure facts (financial figures) and can therefore be considered as the “objective”

30
method of these two while the latter is the “subjective” one. Many authors have brought
up the fact that even accounting measures can be calculated so that they present com-
pany success in positive light (e.g. Otley, 2002), making them less objective in nature.
When selecting the respondents of the survey, it should be made sure that they form the
most appropriate group of people regarding the issues of interest in the study, and
thereby assuring that meaningful interpretations on results can be made.
Questionnaire, such as a postal survey used to gather the data set used in this study, or
interview enables researcher to acquire information that is not available in financial
statements of a company. Weakness of these data gathering methods is that – unless per-
formed longitudinal – they do not capture causality or the dynamics of the development
of measurement, orientation and performance (Ambler, Kokkinaki and Puntoni, 2004).
This is because all the questions are presented essentially concurrently. In contrast,
firms’ accounting records are usually available at least on a yearly basis enabling longi-
tudinal examination so that causal relationships between explanatory variables and per-
formance can be found.
The Profit Impact of Market Strategy (PIMS) project is one of the most important em-
pirical studies regarding relationships between practices and company profitability (Sto-
elhorst and van Raaij, 2004). That is why it can well be used as an example of perform-
ance studies. The PIMS Program (Buzzell and Gale, 1987) was initially designed to ex-
plore dimensions of strategy and of the market environment that might influence per-
formance. It gathers information at strategic business unit level and the data is a collec-
tion of three kinds of information:
Ø A description of the market conditions in which the business operates
Ø The business unit’s competitive position in its marketplace
Ø Measures of the business unit’s financial and operating performance
Information about market conditions include, among others, the number and size of cus-
tomers and rates of market growth and inflation. Competitive positioning data, in turn,
includes market share, relative quality and prices, and degree of vertical integration rela-
31
tive to competition. Performance measures are collected on annual basis. Because of
very large data set, it is possible to find common patterns in relationships among differ-
ent business units. (Buzzell and Gale, 1987) Consequently, the PIMS project has been
able to establish links between such positional advantages as relative product and service
quality and market share on the other hand, and profitability on the other (Stoelhorst and
van Raaij, 2004).
2.3.2. Measuring Marketing PerformanceAssessing marketing performance is an increasingly important but unfortunately difficult
task for managers and other corporate stakeholders. The difficulty is apparent since mar-
keting performance depends on external, largely uncontrollable actors, such as custom-
ers and competitors, as well as on internal measures of performance (Clark, 2002). To
ease the complex situation at hand, several simplifications can be made. Sevin (1965)
takes this approach perhaps further than anyone else to propose simple profit-to market-
ing-expense-ratio measure of efficiency. In this measure, marketing expenses are as-
sumed to turn into profit in a “black box”. To understand the actual reasons behind suc-
cess, the “model” clearly is not sufficiently accurate. Some other problems related to
Sevin’s (1965) marketing performance measure include difficulties in appointing certain
costs to marketing, ignorance of time lag between marketing input and its effect upon
output and impact of cumulative effects. Due to fact that relationships in marketing are
not as straightforward as Sevin (1965) proposes, many later assessment procedures have
extended the seminal work of Sevin (Morgan, Clark and Gooner, 2002).
What complicates the interpretation and comparison of companies’ marketing perform-
ance is that companies face a need to come up with good marketing performance. This
influences the selection of marketing metrics and, consequently, “what you measure is
what you get” (Ambler, Kokkinaki and Puntoni, 2004). It is, however, crucial to meas-
ure the performance since, as they say, “if you don’t measure it, you can’t improve it”.
Also other needs are brought up in relation to marketing performance measurement: ac-
cording to Lehmann (2004), it is a prerequisite in getting marketing function involved to
important business decisions.

32
As a consequence of assessment-related difficulties, both academics and managers cur-
rently lack a comprehensive understanding of the marketing performance process and
factors that affect the design and use of assessment systems within companies (Morgan,
Clark and Gooner, 2002). Literature has, using one division, focused on three dimen-
sions of marketing performance: 1) effectiveness, the extent to which organizational
goals and objectives are achieved (e.g. marketing productivity analysis); 2) efficiency,
the relationship between performance outcomes and the inputs required to achieve them
(e.g. marketing audits); and 3) adaptiveness, the ability of the organization to respond to
environmental changes (Walker and Ruekert, 1987; Bonoma and Clark, 1988).
Clark (2000) argues that managers have a multidimensional view of marketing perform-
ance and they judge performance drawing on all the above-mentioned dimensions, to
different degrees. Generally, effectiveness matters most and several measures are often
used; sales being the most important. In regard to effectiveness, correct expectations are
very important. If those heavily base on previous performance, assumption of future
relatively similarly following the past is made; this kind of reactive control approaches
can become dangerous especially in markets experiencing fast structural changes.
(Clark, 2000)
Using another categorizing, literature in strategic marketing has highlighted three meas-
urement orientations relevant to performance assessment: customer-focused indicators,
(e.g. customer satisfaction and customer retention); competitor-centered indicators (e.g.
relative sales growth and relative market share); and internally oriented indicators (e.g.
profitability and ROI) (Morgan, Clark and Gooner, 2002). Eccles (1991) suggests that
companies are better off using current competitor referents than internally oriented past
company performance. We do not, however, have any empirical knowledge to suggest
that the use of any particular performance referent is inherently superior to any other.
Vagueness of market metrics selection has led Marketing Science Institute to appoint
marketing metrics research as one of its top research priorities in recent years (e.g. Mar-
keting Science Institute, 2004). Ambler, Kokkinaki and Puntoni (2004) performed an
empirical study to list marketing metrics most frequently used. The results, with several
accounting-based measures at the top of the list, are presented at Table 2. Clearly, tradi-

33
tional performance measures, such as profitability, sales volume and gross margin, fol-
lowed closely by awareness and market share, are used most. Consequently, these results
and Proctor’s (2000) proposition that most companies use sales and profitability targets
as key elements of their objectives are in line.
Table 2 Rankings of Marketing Metrics (Ambler, Kokkinaki and Puntoni, 2004)
Metric % claiming to usemeasure
% firms rating asvery important
% claimed to reachtop level
1. Profit/Profitability 92 80 712. Sales, Value and/or Volume 91 71 653. Gross Margin 81 66 584. Awareness 78 28 295.Market Share 78 37 346. Number of New Products 73 18 197. Relative Price 70 36 338. Number of Consumer Complaints 69 45 319. Consumer Satisfaction 68 48 3710. Distribution/Availability 66 18 11
Following from the problems in marketing performance assessment analyses, Morgan,
Clark and Gooner (2002) came up with two marketing performance assessment (MPA)
systems, namely normative and contextual MPAs. The general structural model used in
this study closely imitates the normative MPA system and stages of marketing perform-
ance process. These four stages are: (1) sources of advantage, or the resources and capa-
bilities of the firm; (2) positional advantages, or the realized strategy of the firm con-
cerning the value delivered to customers and the costs incurred by the firm relative to its
competitors; (3) market performance outcomes, or customer and competitor responses to
the firms’ realized positional advantages; and (4) financial performance outcomes, that
is, the costs and benefits to the firm of the achieved level of market performance (Mor-
gan, Clark and Gooner, 2002). Normative MPA system is illustrated in Figure 7. Stoel-
horst and van Raiij (2004) studied different schools of thought in marketing and strategic
management and their explanations for sources of performance differentials and ended
up with rather similar model. They propose the framework for performance differentials

34
between firms to be: Innovation à Resources à Business process efficiencies à Posi-
tional advantagesà Performance outcomes.
Dimensions of Marketing Performance
Stages of Marketing Performance Process
Adaptiveness Effectiveness Efficiency
Resources• Financial• Physical• Human• Legal• Organizational• Reputational• Informational• Relational
Capabilities• Individual• Single task• Specialized• Functional• Organizational
PositionalAdvantages• Product• Service• Price• Cost• Image• Delivery
MarketPerformance• CustomerPerceptions• CustomerBehaviors• SalesResponses• Market Share
FinancialPerformance• Revenue• Margin• Cash flow
Figure 7 A normative MPA system (Morgan, Clark and Gooner, 2002)
Morgan, Clark and Gooner (2002) suggest that effective MPA systems could be impor-
tant in generating future marketing performance and monitoring current marketing per-
formance. Despite several positive sides attached to MPA systems, it is possible that
managers create such systems that support their strategies and time span of objectives.
Further, Ambler, Kokkinaki and Puntoni (2004) argue that when it is more difficult to
evaluate marketing results, more reliance is probably placed on marketing expenditure
controls. Specialist marketers would therefore be likely to propose metrics that justify
budgets and past activities.
There are also some other phenomena causing performance measurement biases in mar-
keting. Lehmann (2004) suggests that marketing’s link to financial outcomes is too
rarely considered. Further, Lehmann argues that focus on margin or return on investment
can lead to over-concern on short-term results. He proposes that the financial, but non-
accounting, measures should be used concurrently with accounting measures and the
value of marketing assets that have long-term value, such as brand equity, when assess-
35
ing performance (Lehmann, 2004). Despite Lehmann’s opinion, much of marketing
strategy has focused on market-based performance and financial performance. What
have, however been ignored are risk aspects of performance and the impact of the differ-
ent marketing strategies on risk and the market value of the firm have not received much
attention in marketing strategy research. A broader performance focus would enable
marketers to more fully understand the performance consequences of their strategies,
compared with the understanding emerging from the more limited focus on such meas-
ures as market share and ROI (Varadarajan and Jayachandran, 1999).
2.3.3. Contribution of Performance StudiesIn terms of performance, managers often do not know what to measure or how to inter-
pret the results. They may collect wide collection of performance metrics but if these can
not be managed to change marketing activities and performance results, it is of not very
much use. (McGovern et al., 2004) Altogether, performance studies greatly contribute to
both business and academic discussion, giving important insights about real success of a
company. Basing on these studies, managers can evaluate the success of their firm gen-
erally or in a certain part of a business and to come to conclusions that benefit the firm
in both short and long term. They offer the systematic groundwork for favorable com-
petitive position and related financial performance. It needs to however be noticed that
performance is meaningful only when used by a decision maker (Lebas and Euske,
2002).
In 2000, Clark studied how managers actually judge marketing performance. In addition
to that study, there are not very many studies regarding the practical part of performance
managing, however. These kinds of studies would be of importance since it is often cru-
cial to know what part of performance managers are trying to maximize. That is why
researchers need to account for the measures managers are using. Also, of importance is
to what is performance compared (Clark, 2000). Ambler, Kokkinaki and Puntoni (2004)
argue that the extent to which top management is interested in assessing market per-
formance depends on the extent to which they are market-oriented. Nevertheless, con-
sumers come first, and only after that, results follow.

36
An essential question is how big a part of company profitability can be attributed to cer-
tain variables under study. Obviously, measurement systems should take different busi-
ness environments and firm characteristics and conditions well into account. Addition-
ally, measures of performance should be accurate enough but also simple enough to be
usable. There should be methods available to evaluate the metrics of performance even
if it is not possible to access the current “raw” accounting measures of the company in
question or its competitors. It can be possible that firm is, for example, experiencing
heavy investments and therefore its accounting measures (e.g. profitability) are lower
than usual, perhaps even negative.
2.4. Conceptual and Theoretical Development
2.4.1. Performance Impact of Strategic MarketingBefore 1990s, research interest in studies examining performance impact of strategic
marketing was focused on organizational resources and positions relating to sustainable
competitive advantage while organizational processes were not much considered.
Nowadays, however, both of these research streams that importantly explain long-term
competitive advantages and business performance are well represented.
Orientation research has been a fruitful field of study in the marketing literature. In the
beginning of 1990s and in the spirit of market orientation, Kohli and Jaworski (1990)
interviewed some American managers. They saw profitability as a consequence of mar-
ket orientation rather than part of it. How would market orientation lead to superior per-
formance, they suggested that it facilitates clarify focus and vision in an organization’s
strategy (Kohli and Jaworski, 1990). This is in a way also supported by PIMS studies
that concluded it is better to be small than “stuck in the middle” (Buzzell and Gale,
1987). Concurrently with Kohli and Jaworski, Narver and Slater (1990) explored the re-
lationship between market orientation and business profitability of 140 business units in
both commodity products businesses and non-commodity businesses only to find, in
both types of businesses, a substantial positive relationship. High level of market orien-
tation was also argued to lead to, among others, high customer satisfaction and high re-
peat sales (Kohli and Jaworski, 1990).

37
In addition to market orientation, as stated previously, also superior resources may lead
to great business performance, both market and financial. This is brought up by Hunt
and Morgan (2001) who argue that “a comparative advantage in resources … can trans-
late into a position of competitive advantage in the marketplace and superior financial
performance”. This is why firms constantly struggle for resources that could give them
comparative and, consequently, competitive advantage (Hunt and Morgan, 2001).
Based on the early work of Kohli and Jaworski (1990) and Narver and Slater (1990),
studies in different parts of world have been conducted. They have developed and re-
fined research tools for assessing degrees of market orientation in firms and examining
its links with both market and financial performance. In general, market orientation is
found to positively relate to performance; in rather many studies, however, the relation-
ship has been found to be relatively weak, though significant. Typically only less than
20% of performance variations between firms are explained through differences in mar-
ket orientation alone (Hooley et al., 2002). In addition to positive relationship between
market orientation and business performance, also innovation orientation and innova-
tiveness have been shown to have positive relationship with competitive advantage and
related isolation mechanisms (Hooley and Greenley, 2005) and financial performance
(Tuominen, 2003). Components within strategic marketing relate to each other, too. It is
for example argued that due to focus on developing information on markets, market-
oriented firms are sensitive to changing customer needs and therefore are more likely to
innovate successfully than other firms (Matsuno, Mentzer and Özsomer, 2002).
Several studies have supported the findings of studies presented above. Those, together
with capabilities-performance studies, will be examined in the hypotheses development
section below (section 2.5).
2.4.2. Performance Impact in Different Business EnvironmentsIt is reasonable to assume that same resources, strategies and orientations do not lead to
identical performance in different countries and business environments. This is due to
differences in, for example, market culture and buyer orientations. Phenomenon may be
considered as analogous to differences in market conditions when the entity under ex-
38
amination is an individual offering; the PIMS studies have confirmed the negative rela-
tionship between declining life cycle stage and ROI and the positive counterpart be-
tween growing market and ROI (Buzzell and Gale, 1987). Business environments are in
a state of continuous change, too. Competitive positions will themselves evolve and
change as the resource base and the market environment in which they are created
changes. In some markets this change will necessarily be very rapid. In others, it might
be occurring at a slower pace (Hooley et al., 2001). Whatever the environment, the job
of the marketing department is to adapt a firm’s strategy to different environmental con-
ditions in a way that produces a favorable response (Clark, 2000).
Several market orientation studies have proposed that market orientation effects on busi-
ness performance might be moderated by market environment (Hooley et al., 2002). For
example, according to Kohli and Jaworski (1990), the greater the market (technological)
turbulence, the stronger (weaker) the relationship between a market orientation and
business performance. They also argue that the greater the competition, the stronger the
relationship between a market orientation and business performance, and the weaker the
general economy, the stronger the relationship between a market orientation and busi-
ness performance. Slater and Narver (1994), too, found market and other stakeholder
effects on performance to be moderated by the operational environment. To sum up, it
seems that in certain circumstances, such as limited competition, stable market prefer-
ences and technologically turbulent industries, market orientation may not be critical
factor in good business performance. This is due to relatively high resource needs of
market orientation (Kohli and Jaworski, 1990).
The impact of a firm’s own orientation, and subsequent actions in the marketplace, are
likely to be effected by the actions of competitors, together with general market condi-
tions. This is why the choice of which capabilities to nurture and which investment
commitments to make must be guided by a shared understanding of the industry struc-
ture, the needs of target customer segments, positional advantages being sought, and
trends in the environment (Day, 1994).

39
Although the links between business orientations and company performance have been
studied, Noble, Sinha and Kumar (2002) bring up a need for studying them further. To
apply the contingency approach they propose, this study makes a contribution by com-
paring success factors and their magnitude on performance in different, country-specific
business environments. Two comparisons are being performed: (1) comparison study of
countries with relatively low production costs against countries where costs are signifi-
cantly higher, and (2) comparison among so-called engineering countries. The sample
groups are described in section 3.1.2. The purpose of these comparison studies is to find
out whether low-cost production is an advantage for those countries and whether engi-
neering countries perform similarly in terms of strategic marketing. Although, among
others proposition of Kohli and Jaworski (1990) presented above could be used to hy-
pothesize that the link between market orientation and business performance is stronger
in low-cost countries than in high-cost countries, actual research hypotheses on basis of
sample groups are not made.
2.4.3. Frame of Reference of the StudyBuilding on the previous sections of this chapter, Figure 8 presents the conceptual frame
of reference of this study. Operationalization of the frame of reference, or variables in-
cluded in it, is presented in section 3.2. In Figure 8, as in the thesis in general, links be-
tween business orientations and marketing resources, for example, are largely ignored.
Although I acknowledge that the constructs are not completely distinctive, taking all mi-
nor relationships into consideration would complicate the analysis with only little value
added to the study.
In Figure 8, components of strategic marketing are considered as inputs with effect on
company success. Rationale of this is explained in the following. It may well be so that
acknowledging the situation at the marketplace (e.g. customer needs and competitor
characteristics) together with good insight of market development and developing strong
relationships with key customers, or market orientation and outside-in marketing capa-
bilities, lead to competitive advantages and high business performance.

40
Components ofStrategic Marketing
- Business Orientations- Marketing Resources
Company Success- Competitive Advantages andtheir Sustainability
- Business Performance
Environmental Moderators- Macro Factors- Competitive Environment- Market Dynamics
Figure 8 Frame of reference of the study
On the other hand, innovation orientation might be a key driver in successfully matching
customer need with a good offering, also leading to company success. Also good inside-
out capabilities might prove helpful in converting company’s advantages into good mar-
ket and financial performance. Good inside-out capabilities alone could lead to a posi-
tion of competitive advantage, too, but perhaps only in short run. Put differently, both
resources and business orientations are of great importance in building success since, as
Proctor (2000) well notices, company must consider the demands of environmental
changes and concurrently develop company’s distinctive competencies to perform well.
Business environments in different kinds of countries, cultures and industries may devi-
ate from others considerably. For example, competition may be severe or essentially
non-existent, customers quality-conscious or primarily price-sensitive, economy strong
or weak, and rate of technological development high or low. Consequently, components
of strategic marketing may have effect of different magnitude in different environments.
What nevertheless applies to at least almost all situations is that good firm success fur-
ther feeds and strengthens business orientations and marketing resources a company has
adopted, though (marked with gray color and) not considered in this study. If a company
can stay ahead of its competitors in, for example, market sensing or innovation orienta-
tion or it can sustain the comparative resource advantage, competitive advantages gained
are potentially sustained. Company success could have a minor effect also on competi-

41
tive environment and market dynamics, but this would probably be ignorable and there-
fore it is left out of the frame of reference.
2.5. Hypotheses Development
In the middle of 1990s, Day (1994) claimed “it is almost an article of faith within mar-
keting that superior business performance is the result of superior skills in understanding
and satisfying customers.” Additionally, Hunt and Lambe (2000) argued that market ori-
entation “lacks an underlying theory that could provide an exploratory mechanism for
the positive relationship between market orientation and business performance”. Al-
though the findings on this relationship have not been conclusive (Weerawardena,
O’Cass and Julian, 2006; Tuominen et al., 2005), several empirical studies (e.g. Kohli
and Jaworski, 1990; Narver and Slater, 1990; Jaworski and Kohli, 1993; Han, Kim and
Srivastava, 1998; Matsuno, Mentzer and Özsomer, 2002; Chan, Ngai and Ellis, 1998;
Pulendran, Speed and Widing II, 2003; Hunt and Lambe, 2000) with relatively consis-
tent results have provided support to existence of the positive relationship between the
constructs. The results have been verified both in absolute terms and relative to relevant
competitors. Pulendran, Speed and Widing II (2003) report that some moderation by
business environment for the relationship between market orientation and business per-
formance can be identified but, regardless of industry conditions, positive relationship
remains (Hunt and Lambe, 2000).
Fahy and Smithee (1999) include resources enabling value creation to be potential
sources of competitive advantage. Thus, different business orientations, such as market
orientation, can be interpreted as raw materials of competitive advantage. Additionally,
Noble, Sinha and Kumar (2002) build on theory of sustainable competitive advantage to
argue that companies acting in a market-oriented way build an advantage with high bar-
riers for competitors to match; this may well be true if a company for example identifies
a suitable market opportunity for itself. The following set of hypotheses is thus devel-
oped:

42
H1a: Market orientation positively relates to market performance
H1b: Market orientation positively relates to financial performance
H1c: Market orientation positively relates to competitive advantage
As stated previously, also innovation orientation and innovativeness have been shown to
have positive relationship with competitive advantage and related isolation mechanisms
(Hooley and Greenley, 2005) and financial performance (Tuominen, 2003). In addition,
Matsuno, Mentzer and Özsomer (2002) found entrepreneurial proclivity (including in-
novativeness) to positively relate to market share (market performance) and ROI (finan-
cial performance). Also, what was said about relationship between business orientations
and competitive advantages above (Fahy and Smithee, 1999), applies also to innovation
orientation. It is therefore hypothesized that:
H2a: Innovation orientation positively relates to market performance
H2b: Innovation orientation positively relates to financial performance
H2c: Innovation orientation positively relates to competitive advantage
Competitive advantages can be achieved by possessing and effectively using certain re-
sources. As mentioned before, Barney (1991) states that resources have to be valuable,
rare, imperfectly imitable and substitutable to lead to such a position at marketplace. In
regard to this study, capabilities are of central interest among marketing resources; since
the capabilities are resources deeply at the core of companies, spirit, attitudes and effi-
ciency at one company are often difficult for other firms to imitate. Therefore, good out-
side-in and inside-out capabilities are likely to lead to a position of competitive advan-
tage. To add on this, businesses generally earn higher profits and have higher market
shares if they have better resources and make better use of them (Varadarajan and Jaya-
chandran, 1999). This is supported by Day (1994) who claims there to be a direct con-
nection between the mastery of distinctive capabilities and performance superiority.
Vorhies and Morgan (2005) found positive relationships for example between such in-
side-out capabilities as marketing implementation and channel management, and overall
43
firm performance. Also Tuominen et al. (2005) identified positive link between inside-
out capabilities and performance superiority. These arguments lead us to hypothesize
that:
H3a: Inside-out capabilities positively relate to market performance
H3b: Inside-out capabilities positively relate to financial performance
H3c: Inside-out capabilities positively relate to competitive advantage
Moreover, according to Hooley et al. (2005), outside-in capabilities statistically signifi-
cantly relate positively with market performance, which in turn positively relates to fi-
nancial performance of a firm. Tuominen et al. (2005) empirically verified positive rela-
tionship between outside-in capabilities and innovativeness which further drives per-
formance superiority. We thus come to hypothesize that:
H4a: Outside-in capabilities positively relate to market performance
H4b: Outside-in capabilities positively relate to financial performance
H4c: Outside-in capabilities positively relate to competitive advantage
Fahy and Smithee (1999) state that sustainable competitive advantages allow the firms
enjoy high market performance and earn above-average returns. Examples of this are
easy to develop. Namely, a company who possesses cost leadership can sell its offerings
at such a low price that customer base significantly increases but, still, not at expense of
profitability. On the other hand, differentiated offerings can often be sold with remarka-
bly high profit margin but concurrently, due to high customer interest, also strong mar-
ket penetration can be achieved. Isolating mechanisms, such as hardly identifiable way
of resource usage, create barriers to imitation which further increases the business per-
formance impact of competitive advantages (Fahy and Smithee, 1999).
The PIMS researchers have stated that “in the long run, the most important single factor
affecting a business unit’s performance is the quality of its products and services, rela-
tive to those of competitors”. Good performance may be due to stronger customer loy-

44
alty, more repeat purchases, less vulnerability to price wars, ability to command higher
relative price without affecting market share, lower marketing costs, or share improve-
ments (Buzzell and Gale, 1987). What was just discussed is essentially the core of com-
petitive advantage and its performance impact. Therefore, I come up with the following
hypotheses:
H5a: (Sustainable) competitive advantages positively relate to market perform-
ance
H5b: (Sustainable) competitive advantages positively relate to financial perform-
ance
Finally, although every firm should in principle seek for profitable growth instead of
having just sales focus, e.g. PIMS studies have found a strong positive link between
market share and ROI measure as a consequence of, for example, economies of scale,
risk aversion of customers and market power of companies with high market share
(Buzzell and Gale, 1987). Possession of a large and loyal customer base confers a degree
of legitimacy on the organization that is difficult for competitors to emulate. As a so-
cially complex, difficult-to-imitate and relatively rare asset, customer base creates barri-
ers for competition and thus increases the residual value of a business. (Srivastava,
Shervani and Fahey, 1998) Further, Jacobson (1988) found empirical evidence to the
robustness of the relationship between market share and profitability across different
sampling frames. Although there are also studies which argue that market share is not
always associated with increasing profits (e.g. Boulding and Staelin, 1990), consistently
with the majority of evidence, I end up hypothesizing that:
H6: Market performance is positively related to financial performance.
Some of the hypotheses presented above are either conceptually proposed or empirically
tested for a relatively long time ago. Information on whether the liabilities to superior
business performance still stand thus offers additional contribution to this study. Hy-
potheses just developed have been gathered into Figure 9.

45
Figure 9 Research hypotheses

46
3. Research Methods
The purpose of this chapter is to familiarize the reader with the data (“Marketing in the
21st Century”) used in this study. It also explains the rationale behind choosing the vari-
ables and constructs to be studied. Finally, the chapter introduces the quantitative analy-
sis techniques and statistical tests used in the study.
3.1. Research Data
3.1.1. Full SampleMarketing in the 21st Century -data was used in this study. It was collected during years
2002 and 2003 in fourteen countries: Australia, Austria, China (mainland), Finland,
Germany, Greece, Hong Kong, Hungary, Ireland, the Netherlands, New Zealand, Po-
land, Slovenia and the United Kingdom.4 Unfortunately, Polish data set had to be ex-
cluded from the analysis since it was lacking some critical pieces of information. This
made the final sample to include 5627 companies in thirteen countries.
The data contains information, among others, on marketing orientations, marketing as-
sets and capabilities, marketing strategy and competitive positioning, marketing activi-
ties and company performance. On purposes of this study, it was mainly orientations,
marketing resources and company performance that were chosen to be involved in the
statistical part. The questionnaire used in the UK is presented in Appendix A5.
What is notable is that quite a significant amount of the questions in the research ques-
tionnaire deals with firm-specific issues in relation to competitors i.e., firm representa-
tives are asked to estimate how they are doing in competitive sense. This is rational as,
for example, certain metrics in one industry or country may be interpreted as superb
4 Graham Hooley, professor of marketing and senior pro-vice chancellor of Aston University, and GordonGreenley, professor of marketing and head of faculty in Aston Business School, were in the project leadwhen the data was gathered. Professor Kristian Möller of Helsinki School of Economics was in chargeof Finnish data collection. See www.mc21.org for more information on the “Marketing in the 21st Cen-tury” project.
5 Essentially identical questionnaires, translated into one’s mother tongue, were used in different countries.

47
whereas in others it might be regarded as moderate or even poor. Most questions in the
research questionnaire were to be answered at five- or seven-point Likert scale.
Although the scales in the research questionnaire are ordinal in nature, the results are
treated as if they were given at continuous scales. To justify the action, Finney and
DiStefano (2006) argue that if the observed data have e.g. at least five ordered catego-
ries, use of maximum likelihood method (used in this study) does not result in severe
levels of bias regarding fit indices, parameter estimates and standard errors. Conse-
quently, this kind of treatment can be and often is made (Finney and DiStefano, 2006).
3.1.2. Sub-samplesSensitivity of the results was tested by running the statistical models in each sample
country and by conducting two group comparison entities. Firstly, “low-cost” countries
and “high-cost” countries were compared to explore if another of these rather hetero-
genic groups has advantage in effectiveness of strategic marketing over another. Sec-
ondly, so-called engineering countries were compared as differences in relationship
strengths and levels of constructs in more homogenous group context were searched for.
These sub-samples are next presented.
Low-cost Countries
“Low-cost” countries refers to group of countries where costs of production and manu-
facturing offerings are generally speaking low compared to those in some other coun-
tries (e.g. “high-cost” countries that are presented next). Also, although growing,
economies of low-cost countries are generally weak compared to “economic giants”. In
the actual data analysis, those countries to be included in this group are: China
(mainland), Slovenia and Hungary. All these economies can be regarded to be in a state
of transition with low cost of labor unit6.
6 http://www.global-production.com/scoreboard/indicators/labourcost.htm

48
High-cost Countries
“High-cost” countries refer to countries where production costs are, in general, signifi-
cantly higher than in “low-cost” countries. In this case, the four countries included to
this category were: Finland, New Zealand, Austria and the Netherlands7. Based on the
reference statistic, also for example Germany could have been included into this sub-
sample. However, it was important to keep the amount of firms between low-cost and
high-cost samples rather equal so it was not included. Individual countries in this group
have several common characteristics: their means of earning one’s living are relatively
alike (relatively strong emphasis is put on production industries). Additionally, while
companies in high-cost countries base their competitive power largely on high-
technology, innovations and differentiation, also purchasing power in these countries is
considerable. Thus, the group is supposed to be adequately homogenous thereby pos-
sessing good conditions to end up with meaningful and reliable results.
Engineering Countries
In this study, term “engineering countries” refers to countries where companies have
traditionally based significant amount of their competitive power on high- and process-
technological applications. The group of engineering countries, drawn from the full se-
lection of countries in the data set, contains Austria, Finland and Germany. Austria has
been among the European countries with fastest growing engineering industries and, in
absolute numbers, Germany remains by far the biggest producer of engineering equip-
ment in the EU (Ayala, Spiechowicz and Vidaller (2006). Also in Finland engineering is
of considerable importance. The above-mentioned countries have also other significant
similarities: high standard of living and membership of European Union. Although Fin-
nish competitive environment may be considered less intense as German or Austrian as a
consequence of its geometrical location somewhat far from Central-European trade clus-
ters, group of engineering countries seems to be adequately homogenous to offer fruitful
point of departure to examine if differences in regard to strategic marketing can, how-
ever, be identified.
7 http://www.econ.kuleuven.be/internationale.economie/home/Publications/CES_DPS/Dps0113.pdf

49
3.2. Construction and Operationalization of Variables
The construction of variables follows primarily the division of research consortium led
by Professors Hooley and Greenley. This is natural and makes sense since these authors
are also behind the research questionnaire used in this study. Essentially the same con-
structs have been used, among others, in Fahy, Moloney and McAleer (2005) and in
Hooley, Greenley, Cadogan and Fahy (2005). There are seven constructs in total in-
cluded in the empirical part of the study of which three are endogenous and four exoge-
nous in nature. The endogenous constructs are (sustainable) competitive advantage,
market performance and financial performance, whereas exogenous constructs are mar-
ket orientation, innovation orientation, inside-out marketing capabilities and outside-in
marketing capabilities. All the latent variables of the study with initial set of observed
variables related to them are presented at Table 3. The removal of statistically insignifi-
cant or conflicting variables is presented in Chapter 4, after we have covered the tech-
niques of performing such an operation. Cronbach’s alpha coefficients, indicating the
consistency of entire constructs, are presented in Appendix E.
3.2.1. Endogenous VariablesEndogenous latent variables are influenced by exogenous variables in the structural
model, either directly or indirectly. Variation in values of endogenous variables is said to
be explained by the model since all latent variables that influence them are included in
the model specification (Byrne, 1998). All the observed variables related to endogenous
variables, and their corresponding codes are presented in appendix B.
(Sustainable) Competitive Advantage
Competitive advantage may well result in high business performance, thus being an in-
teresting research topic. Competitive advantage was measured with nine five-point
scales. Underlying concepts in these measures include, among others, uniqueness and
scarcity of resources, economics (high cost of imitation), path dependency and causal
ambiguity. Respondents were asked to evaluate the reasons behind their position of
competitive advantage, or validity of the statements, from 1 = “Strongly disagree” to 5 =
“Strongly agree”.

50
Market Performance
Market performance variables were measured relative to those of principal competitors
of the company. Thus, the indicators are competition-centered. Two measures, sales vol-
ume and market share, were used. Also customer loyalty and customer satisfaction could
have been included into this construct, and actually they at first were, but this resulted in
inappropriate levels of unidimensionality. Therefore, they were eliminated and only two
indicators were sustained. Market performance scale extremes (compared to main com-
petitors) were 1 = “Much worse” and 5 = “Much better”.
Financial Performance
Financial performance of firms was one of the principal areas of interest in this study.
Also financial performance variables were measured relative to those of the firm’s main
competitors. This is fully relevant since accounting treatments vary from company to
company and substantial industry effects on performance complicate the use of objective
measures of performance thereby making their superiority over subjective measures illu-
sory (Slater and Narver, 1994; Otley, 2002). Additionally, this only follows the some-
what usual practice (cf., Jaworski and Kohli, 1993; Slater and Narver, 1994; Matsuno,
Mentzer and Özsomer, 2002). The scale here ranged from 1 = “Much worse” to 5 =
“Much better”, too.
3.2.2. Exogenous VariablesExogenous latent variables are synonymous to independent variables which cause fluc-
tuations in the values of other latent variables in the statistical model. Changes in the
values of exogenous variables are not explained by the model (Byrne, 1998). The set of
observed variables included in each exogenous variables used in this study are next
briefly described. Again, all the observed variables and their corresponding codes are
presented in appendix B.
51
Market Orientation
Varadarajan and Jayachandran (1999) argue that competitive behavior, the actions and
reactions of competitors, is central to marketing strategy research and practice. There-
fore, it is relevant and necessary to include market orientation as one exogenous vari-
able. To well represent the market orientation the company possesses, fairly large
amount of indicators (fourteen) were included in this construct. These considerably
strictly follow the market orientation scale developed by Narver and Slater (1990). The
set of key indicators in market orientation well covers all three underlying components
of the concept: customer orientation, competitor orientation and inter-functional coordi-
nation. Respondents were asked to indicate the degree to which each market orientation
statement relates to their company with 7-point scale from 1 = “not at all” to 7 = “to an
extreme extent”.
Innovation Orientation
Innovation orientation helps firms in search of new offerings that satisfy customers in a
superior way. The ingredients of innovation orientation construct follow those of Fahy,
Moloney and McAleer (2005). The statements presented in the questionnaire had to do
with innovativeness relative to competitors in decision-making, initiating new proce-
dures and changes in operations, and developing new business approaches. In this case
the scale extremes were at 1 = “Strongly disagree” and 5 = “Strongly agree”.
Inside-out Capabilities
A company with good inside-out, or marketing support capabilities, is probably able to
turn a good offering into profit. Inside-out capabilities were indicated by four observed
variables. They covered how well companies manage their finance, human resources and
operations, compared to their competitors. Also relative potential in marketing manage-
ment was included as one variable. This construct was measured with a five-point scale,
ranging from 1 = “strong competitors’ advantage” to 5 = “our strong advantage”.

52
Outside-in Capabilities
Outside-in capabilities are needed in e.g. market sensing and customer relationship
building. Similarly to inside-out capabilities, four indicators consisted outside-in, or cus-
tomer linking capabilities construct. These indicators were mainly about market infor-
mation usage, understanding customer needs and relationship building and maintenance.
Also in this case, five-point Likert scale from 1 = “strong competitors’ advantage” to 5 =
“our strong advantage” was used.
Table 3 Latent variables and measurement items
Construct
Endogenous LatentVariables Measurement ItemsCompetitiveAdvantage
1. Our products and services are highly valued by our customers creating a barrier against competitor products and services2. There would be significant costs for customers if they switched from our products and services to those of competitors3. Our competitive advantage is difficult for competitors to copy because it uses resources only we have access to4. It took time to build our competitive advantage and competitors would find it time- consuming to follow a similar route5. Competitors find it difficult to see how we created our competitive advantage in the first place6. Competitors could copy our competitive advantage but it would be uneconomic for them to do so7. We protect our advantage legally through copyrights and patents8. Our employees are the source of our competitive advantage and we ensure we won’t lose them to competitors9. Competitors would find it difficult to acquire the managerial capabilities needed to create a similar competitive advantage
Market Performance 1. Sales volume achieved2. Market share achieved3. Levels of customer satisfaction achieved4. Levels of customer loyalty achieved
Financial Performance 1. Profit Margins Achieved2. Return on Investment3. Overall Profit Margins Achieved
Exogenous latentvariables Measurement ItemsMarket Orientation 1. Our commitment to serving customer needs is closely monitored
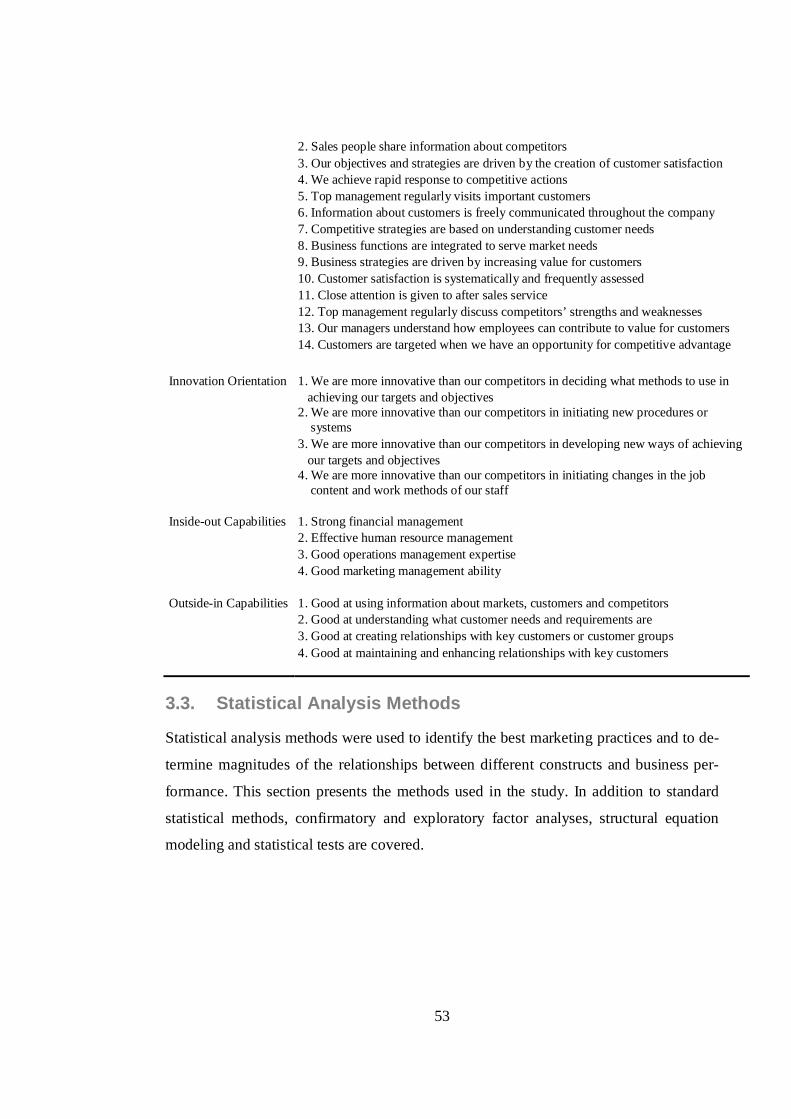
53
2. Sales people share information about competitors3. Our objectives and strategies are driven by the creation of customer satisfaction4. We achieve rapid response to competitive actions5. Top management regularly visits important customers6. Information about customers is freely communicated throughout the company7. Competitive strategies are based on understanding customer needs8. Business functions are integrated to serve market needs9. Business strategies are driven by increasing value for customers10. Customer satisfaction is systematically and frequently assessed11. Close attention is given to after sales service12. Top management regularly discuss competitors’ strengths and weaknesses13. Our managers understand how employees can contribute to value for customers14. Customers are targeted when we have an opportunity for competitive advantage
Innovation Orientation 1. We are more innovative than our competitors in deciding what methods to use in achieving our targets and objectives2. We are more innovative than our competitors in initiating new procedures or systems3. We are more innovative than our competitors in developing new ways of achieving our targets and objectives4. We are more innovative than our competitors in initiating changes in the job content and work methods of our staff
Inside-out Capabilities 1. Strong financial management2. Effective human resource management3. Good operations management expertise4. Good marketing management ability
Outside-in Capabilities 1. Good at using information about markets, customers and competitors2. Good at understanding what customer needs and requirements are3. Good at creating relationships with key customers or customer groups4. Good at maintaining and enhancing relationships with key customers
3.3. Statistical Analysis Methods
Statistical analysis methods were used to identify the best marketing practices and to de-
termine magnitudes of the relationships between different constructs and business per-
formance. This section presents the methods used in the study. In addition to standard
statistical methods, confirmatory and exploratory factor analyses, structural equation
modeling and statistical tests are covered.

54
3.3.1. Descriptive AnalysisFrequency analysis was used as a first descriptive analysis method in this study. Results
from the analysis, performed with SAS Enterprise Guide8, are presented next. Due to
missing information in some sample countries, sample sizes in different analyses differ
slightly.
First, the amount of companies in each sample country was counted. Table 4 presents
the distribution of companies and their corresponding percentage coverage over the full
sample. It can be seen from Table 4 that company frequencies relatively symmetrically
position around average of 432 companies per country; only the Netherlands (n=176)
and Slovenia (n=759) clearly differ from other frequencies. Finnish data consists of 327
companies which is a little less than six percents of full sample size.
Table 4 Company frequencies by country in the data (N=5627)
Country Frequency PercentAustralia 250 4.44Austria 249 4.43China 400 7.11
Finland 327 5.81Germany 400 7.11Greece 326 5.79
Hong Kong 552 9.81Hungary 572 10.17Ireland 657 11.68
Netherlands 176 3.13New Zealand 472 8.39
Slovenia 759 13.49United Kingdom 487 8.65
Table 5 shows company frequencies based on their size (indicated by number of em-
ployees). The frequencies can be interpreted so that the subsequent results on relation-
ships between strategic marketing issues and business performance are best applicable to
middle-sized companies (number of employees between 20 and 299) due to biggest
amount of them in the data. Distribution of Finnish company sizes is very similar to its
international counterpart which, from this perspective, eases the generalization of inter-
national results to Finnish firms.
8 SAS Enterprise Guide 3.0, http://www.sas.com/technologies/bi/query_reporting/guide/

55
Table 5 Number of employees in the data (N=4675)
Number of employees Frequency Percent Frequency PercentLess than 20 348 7.44 12 3.67
20-99 1902 40.68 147 44.95100-299 1162 24.86 83 25.38300-499 499 10.67 22 6.73500-999 327 6.99 20 6.12
1000-4999 329 7.04 30 9.17More than 5000 108 2.31 13 3.98
Whole sample Finland
Table 6 presents rather equal frequencies for the company sample in regard to industry
type. Internationally, services is the biggest single category while business goods and
consumer goods follow closely; combined, the two goods categories clearly count for
higher frequency than services alone. In Finnish sample, goods providing companies are
of significantly greater amount than there are service companies.
Table 6 Amount of companies in different industry types (N=4675)
Industry Frequency Percent Frequency PercentConsumer Goods 1227 26.25 107 32.72Business Goods 1336 28.58 144 44.04
Services 1413 30.22 69 21.10Other 699 14.95 7 2.14
Whole sample Finland
Table 7, in turn, presents the distribution for amount of companies in certain market po-
sition both internationally and in Finland. In both samples, the biggest part of companies
is market challengers, followed by market leaders. In general, frequency distributions
are relatively alike.
Table 7 Different market positions in the data (N=5627)
Market position Frequency Percent Frequency PercentThe only company in the
market100 1.78 1 0.31
Overall Market Leader 1237 21.98 93 28.44Market Challenger 1449 25.75 104 31.80Market Follower 948 16.85 34 10.40
Niche Leader 878 15.60 55 16.82Niche Challenger 572 10.17 34 10.40Niche Follower 443 7.87 6 1.83
Whole sample Finland

56
To give an example, Figure 10 presents how company managers in each country see
their company’s profit margin places compared to their main competitors. From the fig-
ure, it can be seen that in some countries companies’ ability to conduct high profit mar-
gins is considerably different than in some other countries. For example, in Hong Kong
only less than one fourth of the respondents argue that their margins are higher than
those of their competitors. On the contrary, in Ireland, New Zealand and United King-
dom corresponding rate is almost 60 percent. Differences of this scope cannot be ex-
plained solely on better business performance and margins possibly due to biased com-
pany sets; instead, here we see first signs of differences in cultural characteristics among
sample countries. From Figure 10, we can observe that Finnish companies seem to be
middle-of the-roaders when it comes to assessing comparative profit margin.
0 % 10 % 20 % 30 % 40 % 50 % 60 % 70 % 80 % 90 % 100 %
United Kingdom
Slovenia
New Zealand
Netherlands
Ireland
Hungary
Hong Kong
Greece
Germany
Finland
China
Austria
Australia
Cou
ntry
Cumulative percent
Much worse
Worse
The same
Better
Much Better
Figure 10 Profit margin achieved relative to main competitors in each sample country
3.3.2. Factor AnalysesThe principles of both exploratory and confirmatory factor analyses are illustrated in
Figure 11 (error terms of variables xi are excluded for the sake of clarity). The main dif-
ference among these two methods is in the nature of analyses. As EFA attempts to form
any kind of a factor structure from the data input, CFA analysis has more stringent, theo-

57
retical rules to follow. EFA does not require a priori hypotheses about how indicators are
related to underlying factors or even the number of factors (Kline, 2005). On the con-
trary, in CFA, observed variables (indicators) can only load on a certain factor and thus
all associations between factors are not being analyzed. Since our factor structure bases
on previous studies (e.g. Fahy, Moloney and McAleer, 2005; Hooley et al., 2005), it is
more consistent to use CFA in model development and assessment. It is, however, im-
portant to also assure the stability of the definitive CFA model. Therefore, EFA is to test
the discriminant validity of the model. Since (in EFA) all the indicators are allowed to
correlate with every factor, having the same factor model by using both methods indi-
cate good validity.
Factor 1 Factor2 Factor3
x1 x2 x3 x4 x5 x6 x7
Factor1 Factor2 Factor3
x1 x2 x3 x4 x5 x6 x7
Figure 11 Differences of an EFA (at left) and a CFA model (Long, 1983)
With the technique of CFA it is possible to analyze a priori measurement models in
which both the number of factors and their correspondence to the indicators are explic-
itly specified (Kline, 2005). The measurement model defines relations between the ob-
served and unobserved variables. It thus specifies the pattern by which each variable
loads on a particular factor, or the extent to which the factor is reflected in the scores of
that indicator. Therefore, a measurement model can be viewed as a structural model of
presumed causal effects of latent variables on observed scores. (Byrne, 1998; Kline,
2005)
Central question in CFA is whether the model given at the beginning of the analysis is
supported by the data. In CFA, fit statistics related to individual indicators of most inter-

58
est are factor loadings and communalities. Value of a factor loading describes in what
way (direction and magnitude) factor and an indicator are influenced by each other;
loading is thus essentially a regression coefficient, either in standardized or unstandard-
ized form. Communality value gives an amount the model characteristics of the indicator
can be explained by data. (Kline, 2005)
If the researcher’s a priori measurement model is reasonably correct, one should see the
following pattern of results: (1) indicators specified to measure a common underlying
factor all have relatively high standardized loadings on that factor, and (2) estimated cor-
relations between the factors are not excessively high (e.g. > 0.85). The former result
indicates convergent validity and the latter discriminant validity (Kline, 2005). Overall
goodness of CFA model fit can be interpreted from certain model indices. These fit
measures are further elaborated later in this chapter.
The aim of the CFA was to confirm the factors that were formed from the questionnaire.
CFA was partly used to simplify the initial, relatively complex model and the subse-
quent analysis. Therefore, the analysis also contains descriptive features, aiming to
maintain the nature and character of the original variables while concurrently reducing
their number (Hair et al., 2006). While the use of several measures in a construct re-
duces the effect of measurement error in any individual indicator on the accuracy of the
results (Kline, 2005), those indicators just barely providing statistical significance to the
model can well be excluded. This is supported by Hair et al. (2006): “The researcher
should always try to obtain the highest cases-per-variable ratio to minimize the chances
of over-fitting the data (i.e. deriving factors that are sample-specific with little gener-
alizability).”
This kind of data reduction rationale cannot, however, be always applied till the very
end. Otherwise, at the level of individual factors, model builder will eventually start
running into model identification problems. This is because a standard CFA model with
two or more factors has to include at least two indicators per factor to be identified. To
have at least three indicators per factor is, anyhow, recommended due to possible esti-
mation problems. Empirical under-identification is possible even if a model is theoreti-

59
cally identified; this can occur if correlations between factors in measurement model are
excessively high, indicating that there are too many factors in the model. For a CFA
model to be identified, its number of free parameters must be less than or equal to the
number of observations. (Kline, 2005)
3.3.3. Structural Equation ModelingThis section sheds light on structural equation modeling (SEM), both in terms of indi-
vidual group and multiple group modeling.
Individual Group SEM
Structural equation modeling (SEM) is a rational subsequent technique for confirmatory
factor analysis. This is since the structural model defines relations among the unob-
served variables. Accordingly, it specifies which latent constructs directly or indirectly
influences changes in the values of other latent constructs in the model (Byrne, 1998).
Actually, SEM is a combination of CFA and path (or, regression) analysis.
The following list describes some of the most important characteristics of SEM (Kline,
2005):
1. SEM is a priori method and requires researchers to think in terms of models.
However, instead of being exclusively confirmatory, many SEM applications are
a combination of both exploratory and confirmatory analyses.
2. The explicit representation of the distinction between observed and latent vari-
ances is characteristic of many structural equation models. This distinction
makes it possible for researchers to test a wide variety of hypotheses.
3. Most applications of SEM require large samples (N > 200 can generally be con-
sidered large). The more complex the model, the bigger sample is needed.
The SEM procedure consists of seven basic iterative steps: (1) specify the model, (2)
determine whether the model is identified, (3) select measures of the variables and col-
lect, prepare and screen the data, (4) use a computer program to estimate the model,
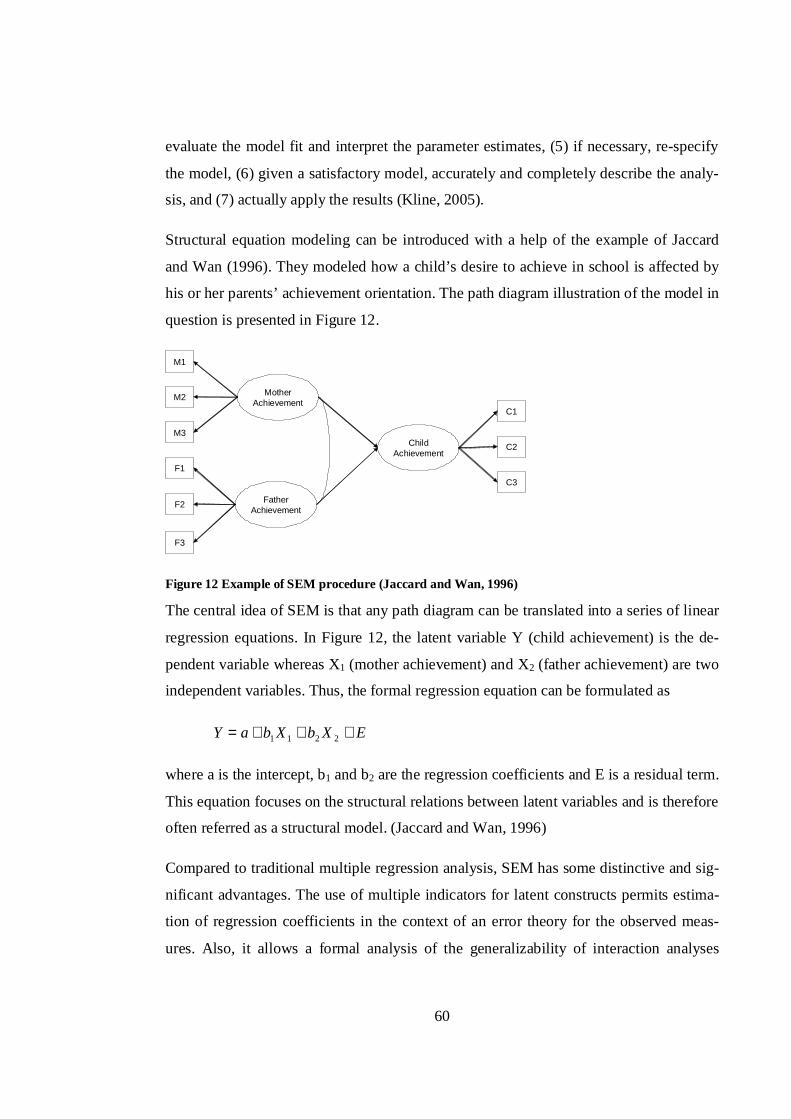
60
evaluate the model fit and interpret the parameter estimates, (5) if necessary, re-specify
the model, (6) given a satisfactory model, accurately and completely describe the analy-
sis, and (7) actually apply the results (Kline, 2005).
Structural equation modeling can be introduced with a help of the example of Jaccard
and Wan (1996). They modeled how a child’s desire to achieve in school is affected by
his or her parents’ achievement orientation. The path diagram illustration of the model in
question is presented in Figure 12.
MotherAchievement
FatherAchievement
ChildAchievement
M1
M2
M3
F1
F2
F3
C1
C2
C3
Figure 12 Example of SEM procedure (Jaccard and Wan, 1996)
The central idea of SEM is that any path diagram can be translated into a series of linear
regression equations. In Figure 12, the latent variable Y (child achievement) is the de-
pendent variable whereas X1 (mother achievement) and X2 (father achievement) are two
independent variables. Thus, the formal regression equation can be formulated as
EXbXbaY +++= 2211
where a is the intercept, b1 and b2 are the regression coefficients and E is a residual term.
This equation focuses on the structural relations between latent variables and is therefore
often referred as a structural model. (Jaccard and Wan, 1996)
Compared to traditional multiple regression analysis, SEM has some distinctive and sig-
nificant advantages. The use of multiple indicators for latent constructs permits estima-
tion of regression coefficients in the context of an error theory for the observed meas-
ures. Also, it allows a formal analysis of the generalizability of interaction analyses

61
across divergent measures. Still, since traditional regression analysis assumes the reli-
ability to be equal and perfect across all groups, bias in the parameter estimates would
probably occur due to different “answering orientation” across countries. Kline (2005)
remarks that maximal likelihood (ML) method, but not multiple regression, can be used
to estimate measurement models and structural regression models. Therefore, ML is
used also in the data analyses of this study.
A valid measurement model is needed before the structural component of structural re-
gression model can be evaluated (Kline, 2005). Diamantopoulos and Siguaw (2000) ar-
gue that, to determine whether the data supports the structural model, three issues are of
most relevance. First, the signs of the parameters representing the paths between the la-
tent variables indicate whether the direction of the hypothesized relationships is as sup-
posed. Second, the magnitude of estimated parameters provides important information
on the strength of the hypothesized relationships. Third, the square multiple correlations
(R2) for the structural equations indicate the amount of variance in each endogenous la-
tent variable accounted for by the independent latent variables that are expected to im-
pact upon it (Diamantopoulos and Siguaw, 2000). ML estimates for path models are in-
terpreted as regression coefficients in multiple regression. Indirect effects are estimated
statistically as the product of direct effects that comprise them. Therefore, total effect of
a variable to another is the sum of all direct and indirect effects (Kline, 2005).
While SEM clearly has advantages over other statistical methods, it is good to be aware
of the phenomenon “garbage in, garbage out”; even SEM cannot serve as a substitute for
poor measures. In addition, although the SEM technique is very diversified and flexible,
“the ability to analyze basically any kind of structural equation model across multiple
samples further extends the range of hypotheses that can be tested in SEM” (Kline,
2005). This does not mean that the researcher should blindly rely on the results of the
SEM analysis; they should not at least be treated as a substitute for researcher profes-
sionalism. According to Jaccard and Wan (1996), most methodologists recommend the
number of indicators per construct to be at least three due to potential empirical underi-
dentification and consequent analytic complications. Overidentified models, or those
identified models with fewer parameters than observations, are preferred.
62
Covariance is the basic statistic of SEM. This is because there are two main goals of the
analysis: to understand patterns of correlations among a set of variables, and to explain
as much of their variance as possible with the model specified by the researcher. Covari-
ance between variables X and Y can be calculated as follows:
YXXYXY SDSDr=cov
where rXY is the Pearson correlation between X and Y and where SDX and SDY are their
standard deviations. Covariance, also known as an unstandardized correlation, therefore
possesses more information than correlation (Kline, 2005).
“Moderating effect is an effect of a third variable or a construct changing the relation-
ship between two related variables or constructs.” (Hair et al., 2006) Moderating vari-
ables thus predict the relation between other variables. In this study, country (or more
specifically, business environmental) characteristics are used as a moderating variable,
as illustrated in Figure 8 it is not included in structural models but are instead interpreted
from results of group comparisons.
Multiple-group SEM
In multi-group analysis for structural models, the interest focuses on similarities and dif-
ferences between structural parameters indicating differences in relationships between
the groups. SEM programs can be used to analyze data from several samples or groups
simultaneously. Constraining parameters to be invariant across groups allows for a sim-
ple test of potential contextual differences. Multi-group analysis allows for many useful
extensions of the basic SEM framework (e.g. latent mean analysis) (Kline, 2005). One
has to however assure that one group’s error terms do not dominate over those of an-
other’s. We will next discuss a case with two groups to be analyzed.
The first step of cross-validation is loose cross-validation established by separately ap-
plying CFA to the same measurement model in both groups. Subsequently, actual multi-
group analyses begin with test of factor structure equivalence. It examines measurement
model so that the model is estimated simultaneously in each of the two groups; fit indi-
ces now achieved refer to how accurately the measurement model reproduces the ob-
63
served covariance matrix for each group. Test of factor loading equivalence constrains
the CFA model to require the factor loading estimates in the two groups are equal. Fac-
tor loading equivalence is then tested by examining the effects of adding this constraint
on the fit of the totally free model. (Hair et al., 2006)
According to Jaccard and Wan (1996), when testing for group differences in parameters,
some investigators adopt an approach of first conducting an overall test of the equiva-
lence of covariance matrices between groups. The rationale behind this is that if differ-
ences in parameters exist between the groups, then these differences should manifest
themselves as also different covariance values between groups (Jaccard and Wan, 1996).
Since we do not have developed hypotheses about group differences in structural model
parameters, we also conduct test of covariance matrix equivalence as a preliminary
multi-group analysis.
One type of multiple group comparison is the test for differences in construct means. It
would have been possible to test for differences in construct means with SEM software
also but, due to some technical difficulties, this was done by conducting individual, two-
tailed t-tests for summed construct scales in different sample groups.
3.3.4. Statistical TestsDifferent kinds of statistical tests are conducted when applying statistical methods.
Some of them need to be calculated by hand while others are identifiable from SEM
program printouts. These are discussed next.
Structural model’s fit refers to the extent to which a hypothesized model is consistent
with the data (Diamantopoulos and Siguaw, 2000). The overall fit indexes used in de-
termining the statistical goodness of the achieved measurement and structural models
include (similarly to e.g. Hooley et al., 2005): root mean square error of approximation
(RMSEA), goodness of fit index (GFI), non-normed fit index (NNFI), and comparative
fit index (CFI). RMSEA is usually regarded as one of the most informative fit indices; it
shows how well the model, with unknown but optimally chosen parameter values, would
fit the population covariance matrix if it were available. GFI shows how closely the

64
model comes to perfectly reproducing the observed covariance matrix. Where GFI is an
example of absolute fit index, NNFI and CFI are relative fit indices (Diamantopoulos
and Siguaw, 2000). How to calculate these indices is presented in Appendix C.
Jaccard and Wan (1996) communicate a frequently suggested rule of thumb according to
which models that yield a GFI lower than 0.90 are of questionable fit. Also many other
publications (e.g. Hair et al., 2006; Yliluoma, 1996) confirm that the GFI values greater
than 0.90 are typically considered good. Browne and Cudek (1993) and Diamantopoulos
and Siguaw (2000), for their part, suggest that RMSEA values less than 0.08 imply ade-
quate model fit and values below 0.05 imply good model fit. According to Jaccard and
Wan (1996), CFI index has been found to be a well-behaving index of model fit. They
state that models with a CFI less than 0.90 are suspect. Especially, models yielding uni-
formly unacceptable values across the fit indices are suspect. When the fit indices do not
converge – some imply good model fit and others do not – care must be taken in assert-
ing the model (Jaccard and Wan, 1996). This is rational since different fit indices assess
fit in different ways and to reach a judgment concerning the overall model fit one has to
rely on multiple criteria (Diamantopoulos and Siguaw, 2000). Therefore, a single fit in-
dex of bad value does not necessarily need to lead to rejection of a structural model.
Cross-validation of the structural equation model refers to the ability of the model to be
invariant across two or more random samples from the same population. The assessment
consists of testing the null hypothesis (H0) that the model is identical across groups
against alternative hypothesis (H1) that the model is not identical across the groups. A
chi-square difference test is used to test H0 and H1. The test statistic value for the test is
merely the difference between the goodness-of-fit Chi-square test statistic values of the
multiple group structural models under the null and the alternative hypotheses. The as-
sociated degrees of freedom are arrived at similarly (Mels, 2005). In relation to compar-
ing statistical significance of construct means among different samples, Student’s t-test
is used. The test helps in examining whether two samples are likely to have come from
the same two underlying populations that have the same mean. High probability (e.g.
higher than 0.05) associated to two-tailed t-test indicates that sample means are statisti-
cally equal. (Hair et al., 2006)

65
Because of different types of random error, it is often necessary to evaluate different as-
pects of score reliability. The most commonly reported estimate of reliability is Cron-
bach’s alpha ( ). This statistic measures internal consistency reliability, the degree to
which responses are consistent across the items within a single measure. If internal con-
sistency reliability is low, the content of the items may be so heterogeneous that the total
score is not the best possible unit of analysis for the measure. Generally, reliability coef-
ficients around 0.9 are considered excellent, values around 0.8 as very good and values
around 0.7 adequate. (Kline, 2005)
Also composite reliability and the average variance extracted are rather often used.
These combined are actually quite close substitutes to Cronbach’s alpha. Diamantopou-
los and Siguaw (2000) state that, to calculate a composite reliability value for each latent
variable, information on the indicator loadings and error variances in completely stan-
dardized form are used. This reliability measure can be calculated from the following
equation:
( )( ) ( )∑∑
∑+
=θλ
λρ 2
2
C
where c refers to composite reliability, refers to indicator loadings, refers to indica-
tor error variances and refers to summation over the indicators of the latent variable.
Composite reliability values of greater than 0.6 are desirable. A complementary measure
to composite reliability is the average variance extracted ( v). This shows directly the
amount of variance that is captured by the construct in relation to the amount of variance
due to measurement error; values less than 0.5 indicate that measurement error accounts
for a greater amount of variance in the indicators than does the underlying latent vari-
able. v can be calculated as follows:
( )( )∑∑
∑+
=θλ
λρ 2
2
C
where , and are defined as above (Diamantopoulos and Siguaw, 2000).
66
4. Results
This chapter presents the results of applying statistical methods to the data. First, “uni-
versal” CFA model is developed using all the companies in the data set as input. The
constructs are then used in international SEM analysis. Similar analyses with the same
models are then performed with Finnish data, too. Subsequently, two comparison analy-
ses are conducted. The chapter concludes with development of marketing performance
tool for company use.
4.1. Full-sample Analysis
CFA and SEM were first applied to the data set as a whole. Analyses are performed us-
ing LISREL9.
4.1.1. Confirmatory Factor AnalysisThe hypothesized indicators in each of the seven factors, presented in section 3.2, were
tested with a help of confirmatory factor analysis (CFA). Sample used here contained
company information from all thirteen countries in the data set.
First step of the analysis was to evaluate a model containing all the relevant indicators of
the questionnaire. The initial CFA model is illustrated in Figure 13. The results show
that the overall model fit is relatively good (value of RMSEA = 0.051). This is supported
also by other fit indices; goodness of fit index (GFI) = 0.91, comparative fit index (CFI)
= 0.96 and non-normed fit index (NNFI) = 0.95 are all above the most often used
threshold level of 0.90. However, low loading and communality values in some model
indicators suggest that in statistical sense the model is not at its optimum.
9 LISREL 8.72, http://www.ssicentral.com/lisrel/index.html

67
Figure 13 Initial CFA model (covariances between factors excluded)
Development of the CFA model was conducted accordingly: all the variables having ei-
ther loading or communality (or both) below threshold 0.40 were excluded from the
model. Two iteration rounds were performed due to changes in individual indicator load-
ings and communalities after removing some of the variables from the model. Firstly,
variable RV199 was excluded since it had both low loading and communality values.
Due to low communality, also variables RV021, RV023, RV024, RV025, RV029,

68
RV030, RV033, RV116, RV189, RV190, RV194, RV195, RV197, RV199 and RV200
were removed from the model at the first stage of data reduction.
Removal of the above-mentioned variables caused some changes to the other indicators.
As a consequence of low communalities, some variables were still to be eliminated. The
indicators now excluded were: RV020, RV031 and RV117.
After excluding also the second set of variables, all the loadings and communalities were
at acceptable level, above threshold 0.40. This indicated that we had managed to arrive
at the final CFA model. In summary, total amount of 18 indicators were left without fur-
ther analysis and 22 remaining variables are those statistically most significant and
without contradictory loadings, therefore to be focused on. Loadings and communalities
related to each final indicator are presented at Table 8.
Table 8 Final indicator loadings and communalities (international sample)
Indicator CommunalityRV022 0.87 0.46RV026 0.94 0.52RV027 0.94 0.49RV028 0.97 0.48RV032 0.85 0.40RV073 0.76 0.65RV074 0.82 0.75RV075 0.78 0.76RV076 0.66 0.48RV109 0.59 0.41RV110 0.59 0.51RV111 0.59 0.52RV113 0.56 0.40RV119 0.70 0.78RV120 0.69 0.75RV191 0.73 0.44RV193 0.79 0.58RV225 0.83 0.73RV226 0.81 0.75RV227 0.73 0.57RV228 0.80 0.69RV229 0.72 0.66
Loading
Correlations between latent variables in final CFA model are presented at Table 9. Since
they are all considerably low, empirical support for the theoretical constructs and
thereby number of factors (seven) in the model is given.

69
Table 9 Correlation matrix of factor constructs (international sample)
Construct 1 2 3 4 5 6 71. Market Orientation 1.002. Innovation Orientation 0.37 1.003. Inside-out Capabilities 0.33 0.49 1.004. Outside-in Capabilities 0.31 0.30 0.45 1.005. Competitive Advantage 0.20 0.36 0.32 0.19 1.006. Market Performance 0.20 0.33 0.42 0.27 0.29 1.007. Financial performance 0.20 0.31 0.45 0.26 0.22 0.62 1.00
From the LISREL output it can be seen that fit indicators of the final model are im-
proved considerably from the initial model phase, now being: RMSEA=0.037;
GFI=0.97; NNFI=0.98; and CFI=0.99. All these values refer to very good model fit. The
final CFA model is illustrated in Figure 14.
Figure 14 Confirmatory factor analysis model (international sample)

70
To test discriminant and convergent validity of the model just arrived at, exploratory
factor analysis was conducted10. Analysis, performed with SAS Enterprise Guide, of-
fered strong support to model validity since exactly the same factor constructs were
identified when including the final set of indicators in the analysis and not initially ap-
pointing them to any factor. The detailed discriminant and convergent validity analysis
can be found in Appendix D. Also Cronbach’s alpha coefficients ( ) (in Appendix E)
and composite reliabilities ( c) and averages variance extracted ( v) (at table 10) were
almost without exceptions at satisfactory level: > 0.7; c > 0.6; v > 0.5.
Table 10 Composite reliability and average variance extracted (international sample)
Construct sum(loading) sum(loading²) sum (errorvariance)
Compositereliability
Average varianceextracted
Market Orientation 3.41 2.33 2.65 0.81 0.47Innovation Orientation 3.24 2.65 1.36 0.89 0.66Inside-out Capabilities 2.7 1.83 2.17 0.77 0.46Outside-in Capabilities 1.75 1.53 0.47 0.87 0.77Competitive advantage 1.42 1.01 0.98 0.67 0.51Market Performance 1.64 1.35 0.65 0.81 0.67
Financial Performance 2.47 2.04 0.95 0.87 0.68
4.1.2. SEM AnalysisTo extend the CFA analysis, structural equation model
(SEM) analysis was conducted. Construction of the model – where relationships be-
tween latent variables base on the theoretical part of the study – was made to end up
with the following structural model (Figure 15).
10 “Orthogonal varimax”- rotation method was used in the analysis to help the interpretation of the results.

71
Figure 15 Structural equation model (international sample)
The inter-factor relationships (regression coefficients or betas) of the full-sample SEM
are presented at Table 11. There are six links, between outside-in capabilities and com-
petitive advantage, between competitive advantage and financial performance, between
market orientation and both market and financial performance, between innovation ori-
entation and financial performance, and between outside-in capabilities and financial
performance, that are not statistically significant (using two-tailed significance level
0.05). However, all the statistically significant relationships are positive, and therefore
coherent with the underlying theory. The strongest links are those between market per-
formance and financial performance (0.52), inside-out capabilities and market perform-
ance (0.32) and innovation orientation and competitive advantage (0.26).

72
Table 11 Standardized regression coefficients (international sample)
Market Orientation -> Competitive Advantage 0.05 *Innovation Orientation -> Competitive Advantage 0.25 **Inside-out Capabilities -> Competitive Advantage 0.17 **Outside-in Capabilities -> Competitive Advantage 0.02Competitive Advantage -> Market Performance 0.14 **Market Orientation -> Market Performance 0.01Inside-out Capabilities -> Market Performance 0.27 **Outside-in Capabilities -> Market Performance 0.08 **Innovation Orientation -> Market Performance 0.11 **Competitive Advantage -> Financial Performance -0.01Market Performance -> Financial Performance 0.52 **Market Orientation -> Financial Performance 0.01Inside-out Capabilities -> Financial Performance 0.21 **Outside-in Capabilities -> Financial Performance 0.01Innovation Orientation -> Financial Performance 0.03
* p < 0.05 (two-tailed)** p < 0.01 (two-tailed)
Regression coefficientPath
As with the CFA model, the structural equation model fit values are very good, thereby
implying very good general fit between the model and data; 2 = 1617.75 (with 188 de-
grees of freedom), RMSEA = 0.037, CFI = 0.99, NNFI = 0.98 and GFI = 0.97. Good-
ness of model fit indices for international sample, as well as for all sample countries and
groups under study, are gathered into Appendix F. Square multiple correlations for
structural equations are not very high, though: only 0.16 for competitive advantage, 0.22
for market performance and 0.43 for financial performance. All square multiple correla-
tions relevant to this study, including those of international sample, are presented in Ap-
pendix G.
4.2. Sub-sample Analysis
4.2.1. FinlandDue to substantive interest in the Finnish data, it is next individually analyzed. Some
descriptive analysis was first conducted to shed light on relative marketing resources and
performance outcomes of Finnish companies. This was done by comparing the construct
means of Finnish data and their international counterparts; at this point, Finnish compa-
nies were not excluded from the international sample. The comparison was based on

73
those constructs and indicators included to the final CFA model. According to the results
presented at Table 12, it seems that Finnish companies have adopted significantly higher
market orientation than international sample on average. Finnish companies seem to also
possess somewhat more (sustainable) competitive advantages than companies in other
countries. However, it seems to be also so that those competitive advantages are not be-
ing realized as effectively as in other sample companies. Results also suggest that the
innovation orientation, inside-out capabilities and outside-in capabilities are at lower
level in Finland than in the sample countries, on average. Means and standard deviations
for each indicator in the final model among Finnish and full company set are presented
in Appendix H.
Table 12 Comparison of construct means of Finnish and international data
Construct Finnish mean International mean DifferenceMarket orientation 5.85 4.95 0.90Innovation orientation 3.29 3.49 -0.20Inside-out capabilities 3.25 3.43 -0.19Outside-in capabilities 3.73 3.87 -0.15Competitive advantages 3.36 3.06 0.30Financial performance 3.29 3.37 -0.07Market performance 3.24 3.41 -0.17
To move to the confirmatory part of the analysis, structural model developed previously
was applied to the data set of Finnish companies. Fit indexes of the model indicate that it
can well be used; RMSEA=0.063; GFI=0.89; NNFI=0.95; and CFI=0.96. Out of these,
only goodness-of-fit index (GFI) is slightly below the critical value 0.90. According to
closer examination of individual variables (at Table 13), factor “inside-out capabilities”
could be removed from the Finnish model due to its somewhat low explanation power.
Since the loadings and communalities for the factor in question are not awfully low, it is
nevertheless included in the model to help in conducting subsequent group comparisons.

74
Table 13 Indicator loadings and communalities (Finland)
Indicator CommunalityRV022 0.62 0.53RV026 0.78 0.59RV027 0.76 0.45RV028 0.79 0.60RV032 0.76 0.45RV073 0.68 0.56RV074 0.81 0.63RV075 0.79 0.77RV076 0.67 0.46RV109 0.43 0.26RV110 0.39 0.26RV111 0.46 0.35RV113 0.61 0.45RV119 0.71 0.76RV120 0.68 0.74RV191 0.93 0.62RV193 0.67 0.43RV225 0.91 0.82RV226 0.97 0.92RV227 0.75 0.51RV228 0.86 0.75RV229 0.61 0.40
Loading
Consequently, correlations between factors in the model are presented in Table 14. All
the correlations are sufficiently low so it can be argued that good discriminant validity is
at place also in Finnish sample.
Table 14 Correlation matrix of factor constructs (Finland)
Construct 1 2 3 4 5 6 71. Market Orientation 1.002. Innovation Orientation 0.51 1.003. Inside-out Capabilities 0.45 0.61 1.004. Outside-in Capabilities 0.32 0.39 0.60 1.005. Competitive Advantage 0.29 0.44 0.47 0.21 1.006. Market Performance 0.01 0.24 0.48 0.17 0.10 1.007. Financial performance 0.10 0.16 0.39 0.20 0.17 0.31 1.00
The structural equation model applied to Finnish data, with regression coefficients, is
illustrated in Figure 16.

75
Figure 16 Structural equation model (Finland)
Fit indices for structural model, presented in Appendix F, dominantly suggest model fit
to be good.
4.2.2. Sample Country ComparisonTo find the most appropriate benchmark groups for Finnish companies, information
from all the sample countries were separately applied to the structural model developed
previously. Standardized regression coefficients between latent factors are presented at
Table 15. They can be interpreted similarly than in conventional regression analysis
(Diamantopoulos and Siguaw, 2000). Direct comparisons between regression coeffi-
cients can be made since the models, and therefore, scales are similar in all sample coun-
tries.

76
Table 15 Standardized regression coefficient estimates by country
Market Orientation -> Competitive Advantage -0.06 0.09 0.16 0.03 -0.04 -0.03 0.00Innovation Orientation -> Competitive Advantage 0.30 ** 0.40 ** 0.08 0.24 * 0.40 ** 0.36 ** 0.11Inside-out Capabilities -> Competitive Advantage 0.08 -0.11 0.24 ** 0.38 ** -0.05 0.14 0.40 **
Outside-in Capabilities -> Competitive Advantage 0.04 0.21 ** 0.11 -0.12 0.11 -0.05 -0.11Competitive Advantage -> Market Performance 0.20 * 0.08 0.20 * -0.17 0.14 * 0.24 ** 0.21 **
Market Orientation -> Market Performance 0.18 -0.04 0.09 -0.24 ** 0.04 -0.08 0.21 **
Inside-out Capabilities -> Market Performance 0.02 0.20 * 0.21 ** 0.73 ** 0.29 ** 0.24 ** 0.25 **
Outside-in Capabilities -> Market Performance 0.23 * 0.23 ** 0.07 -0.18 -0.15 -0.11 0.07Innovation Orientation -> Market Performance 0.01 0.06 0.03 0.07 0.18 * 0.20 * -0.02Competitive Advantage -> Financial Performance -0.20 * 0.12 0.07 0.03 0.08 0.01 0.07Market Performance -> Financial Performance 0.41 ** 0.35 ** 0.82 ** 0.16 0.65 ** 0.47 ** 0.78 **
Market Orientation -> Financial Performance -0.12 -0.12 -0.08 -0.02 0.03 0.14 0.17 **
Inside-out Capabilities -> Financial Performance 0.39 ** 0.24 * -0.07 0.38 ** 0.09 0.17 * -0.01Outside-in Capabilities -> Financial Performance -0.30 ** -0.12 0.12 * -0.01 0.08 0.11 -0.09 *
Innovation Orientation -> Financial Performance 0.09 0.12 0.08 -0.11 -0.02 0.07 -0.05
Market Orientation -> Competitive Advantage 0.06 0.00 -0.01 -0.02 -0.12 * 0.04Innovation Orientation -> Competitive Advantage 0.18 * 0.32 ** 0.01 0.25 ** 0.30 ** 0.21 *
Inside-out Capabilities -> Competitive Advantage 0.28 ** 0.06 0.04 0.08 0.17 * 0.06Outside-in Capabilities -> Competitive Advantage -0.04 0.02 0.04 0.01 0.06 0.00Competitive Advantage -> Market Performance 0.23 ** 0.20 ** -0.05 0.04 -0.03 0.16 **
Market Orientation -> Market Performance 0.02 -0.03 -0.03 -0.10 -0.06 -0.13Inside-out Capabilities -> Market Performance 0.33 ** 0.11 0.25 ** 0.33 ** 0.36 ** 0.16Outside-in Capabilities -> Market Performance 0.02 0.16 ** 0.28 ** 0.31 ** 0.10 * 0.15 **
Innovation Orientation -> Market Performance 0.06 0.19 ** 0.34 ** 0.11 0.21 ** 0.19 **
Competitive Advantage -> Financial Performance -0.05 -0.05 0.03 -0.12 -0.07 0.04Market Performance -> Financial Performance 0.46 ** 0.43 ** 0.64 ** 0.41 ** 0.60 ** 0.44 **
Market Orientation -> Financial Performance 0.03 -0.01 -0.16 -0.03 -0.04 -0.10Inside-out Capabilities -> Financial Performance 0.17 ** 0.34 ** 0.34 ** 0.22 ** 0.19 ** 0.46 **
Outside-in Capabilities -> Financial Performance 0.05 0.07 -0.01 0.12 * 0.03 -0.09Innovation Orientation -> Financial Performance 0.18 ** -0.01 0.28 ** 0.00 0.04 -0.04
* p < 0.05 (two-tailed)** p < 0.01 (two-tailed)
Path
Path Australia
United Kingdom
Hong KongGreeceGermanyFinlandChinaAustria
New ZealandNetherlandsIrelandHungary Slovenia
As can be seen from Table 15, in only one sample country (Slovenia) the regression co-
efficient between market orientation and competitive advantage differs statistically sig-
nificantly from zero, with a confidence level of 95%. Additionally, path coefficients be-
tween outside-in marketing capabilities and competitive advantage, competitive advan-
tage and financial performance, and market orientation and financial performance, are
statistically significant in only three countries. At the opposite end, links between inno-
vation orientation and competitive advantage, inside-out capabilities and market per-
formance, market performance and financial performance, and inside-out capabilities

77
and financial performance can be identified in statistically significant manner in almost
every country. Practically all the statistically significant estimates are in the expected
(i.e. positive) direction, with only a few exceptions. One of these situates in Finnish re-
sults: market orientation negatively relates with market performance.
In addition to regression coefficients, we are interested in structural models’ construct
means. Thereby we get to know which countries are good at certain aspects of strategic
marketing. By linking the results for construct means to those of regression coefficients,
we get a more comprehensive picture of what issues are most important and taken well
care of in the country of analysis. This is helpful when seeking countries to learn from; if
companies in a country achieve “high points” on some strategic marketing issue and are
able to strongly benefit from it – indicated by large positive regression coefficient – why
not try to act like them?
Country-specific construct means are presented at Table 16. At this point, as previously,
it must be acknowledged that the results are subjective, and not objective, by nature. An-
swers are, after all, given by a manager or other employee in each company. Neverthe-
less, Table 16 indicates that Finnish companies would be most market oriented along
with Greek, German and Slovenian companies. Further, companies in New Zealand are
being most innovation oriented; the differences in means are not very large, though.
Greek companies either possess the best inside-out and outside-in marketing capabilities
or tend to overestimate them more than others. Statistics also show that Greek compa-
nies have been able to create competitive advantages better than firms in other sample
countries.
Differences in answering habits can be clearly seen at Table 16. While Greek companies
are in top-3 on every construct mean, Australia, Hong Kong, Hungary, the Netherlands,
Slovenia and the United Kingdom have none such a placing.

78
Table 16 Construct means by sample country
Construct Austria Australia China Finland Germany Greece Hong KongMarket orientation 4.91 4.80 4.68 5.85 5.32 5.41 4.35Innovation Orientation 3.51 3.62 3.68 3.29 3.31 3.71 3.61Inside-out Capabilities 3.49 3.58 3.46 3.25 3.59 3.74 3.23Outside-in Capabilities 3.85 3.88 3.92 3.73 3.99 4.06 3.72Competitive Advantage 3.25 3.08 3.19 3.36 3.13 3.46 2.90Market Performance 3.46 3.50 3.55 3.24 3.43 3.73 3.01Financial Performance 3.46 3.44 3.51 3.29 3.44 3.57 2.96
Construct Hungary Ireland Netherlands New Zealand Slovenia United KingdomMarket orientation 4.91 4.78 4.74 4.94 5.26 4.60Innovation Orientation 3.05 3.56 3.41 3.80 3.49 3.39Inside-out Capabilities 3.20 3.57 3.40 3.60 3.31 3.49Outside-in Capabilities 3.76 3.95 3.66 3.95 3.84 3.94Competitive Advantage 2.62 3.08 2.78 3.23 2.98 3.05Market Performance 3.28 3.45 3.39 3.68 3.37 3.41Financial Performance 3.09 3.57 3.39 3.65 3.21 3.48
Table 17 presents total and indirect effects for the constructs of the study on financial
performance. Highest total effects are identified in Hungary (0.67), Greece (0.65) and
Ireland (0.60). At the opposite side, Finland is among least effective “strategic market-
ers” with Australia and Netherlands. Hong Kong is lonely one benefiting from relatively
higher levels of market orientation whereas in almost all other sample countries effect is
negative. Total effect of innovation orientation is highest in Hungary and Greece. Fur-
ther, firms in the United Kingdom and Finland are those having most positive effect of
inside-out capabilities on financial performance. When it comes to effectiveness of out-
side-in capabilities on financial performance, New Zealand and China are in the lead.
Table 17 Total and indirect effects (in parantheses) on financial performance in sample countries
Australia Austria China Finland GermanyMarket orientation -0.04 (0.08) -0.12 (0.00) 0.03 (0.11) -0.06 (-0.04) 0.05 (-0.01)Innovation orientation 0.06 (-0.03) 0.20 (0.08) 0.12 (0.04) -0.09 (0.01) 0.16 (0.18)Inside-out capabilities 0.39 (0.00) 0.29 (0.05) 0.16 (0.23) 0.49 (0.12) 0.27 (0.18)Outside-in capabilities -0.21 (0.09) -0.01 (0.11) 0.20 (0.08) -0.04 (-0.03) 0.01 (-0.08)Total effects combined 0.20 0.36 0.51 0.30 0.49
Greece Hong Kong Hungary IrelandMarket orientation 0.09 (-0.04) 0.33 (0.16) 0.05 (0.01) -0.02 (-0.01)Innovation orientation 0.21 (0.14) -0.04 (0.01) 0.22 (0.04) 0.09 (0.10)Inside-out capabilities 0.30 (0.13) 0.28 (0.29) 0.34 (0.17) 0.39 (0.05)Outside-in capabilities 0.05 (-0.06) -0.06 (0.03) 0.06 (0.01) 0.14 (0.07)Total effects combined 0.65 0.51 0.67 0.60

79
Netherlands New Zealand Slovenia United KingdomMarket orientation -0.16 (0.02) -0.07 (-0.04) -0.06 (-0.02) -0.15 (-0.05)Innovation orientation 0.20 (0.08) 0.02 (0.02) 0.15 (0.10) 0.07 (0.11)Inside-out capabilities 0.32 (0.10) 0.34 (0.13) 0.39 (0.20) 0.53 (0.08)Outside-in capabilities -0.01 (0.01) 0.25 (0.12) 0.02 (0.06) -0.03 (0.07)Total effects combined 0.35 0.54 0.50 0.42
4.2.3. “Low-cost” vs. “High-cost” CountriesTo find out whether characteristics of “low-cost” countries favor them in gaining sus-
tainable competitive advantages and superior business performance over “high-cost”
countries, analysis comparing, among others, regression coefficients and construct
means in the two groups was conducted. Table 18 first represents regression coefficients
for the groups.
Table 18 SEM estimation results by group
PathMarket Orientation -> Competitive Advantage -0.02 0.16 **
Innovation Orientation -> Competitive Advantage 0.3 ** 0.26 **
Inside-out Capabilities -> Competitive Advantage 0.2 ** 0.05
Outside-in Capabilities -> Competitive Advantage 0.04 0.04
Competitive Advantage -> Market Performance 0.12 ** 0.02
Market Orientation -> Market Performance -0.01 -0.12 **
Inside-out Capabilities -> Market Performance 0.33 ** 0.29 **
Outside-in Capabilities -> Market Performance 0.06 * 0.2 **
Innovation Orientation -> Market Performance 0.14 ** 0.15 **
Competitive Advantage -> Financial Performance -0.04 -0.01
Market Performance -> Financial Performance 0.6 ** 0.38 **
Market Orientation -> Financial Performance -0.03 -0.02
Inside-out Capabilities -> Financial Performance 0.11 ** 0.22 **
Outside-in Capabilities -> Financial Performance 0.04 0.05
Innovation Orientation -> Financial Performance 0.13 ** 0.02
* p < 0.05 (two-tailed)** p < 0.01 (two-tailed)
"Low-cost" countries "High-cost" countries
Since the overall fit indices in concurrent model estimation (RMSEA=0.048,
NNFI=0.97, CFI=0.97, GFI=0.95) are high and considerably close to those of individual
group indices, equality of factor structures is supported. Subsequently, equality of co-
variance matrices among ”low-cost” and ”high-cost” countries was first examined by
forcing them to be invariant in multi-sample measurement model test and interpreting

80
the results. The probability related to chi-square statistic was essentially zero, indicating
that the covariance matrices cannot be treated as statistically equal. Rather similarly,
equality of individual factor loading matrices was tested by forcing matrices among
groups to be invariant. Examination could be only performed in those factors with at
least three indicators, namely market orientation, innovation orientation, inside-out mar-
keting capabilities and financial performance. All the tests showed that, additionally,
loading matrices are statistically insignificantly equal. Partially due to relatively similar
sample sizes, neither group got a chance to severely dominate another in terms of contri-
bution to chi-square statistic and therefore affect strong bias to the results. However,
“low-cost” countries affect almost two thirds (64.14 %) of chi-square value so the results
must be interpreted with some caution.
Whether regression coefficients for these two groups are statistically significantly equal
was tested by running a multi-sample model where they were forced to be invariant in
both groups. According to results, regression coefficients as a whole do not match statis-
tically between groups (p-value < 0.001). Statistical comparison of only those regression
coefficients that were found statistically significant in both individual group analyses
provides meaningful interpretations. Naturally, if the same path in both groups is estab-
lished as statistically non-significant, it can be also considered as invariant between
groups. Following somewhat similar logic, if individual in another group is found to be
statistically significant and insignificant in another, conclusion that path coefficients
vary from group to another can be made.
Although regression coefficient matrix between the two groups is not statistically invari-
ant, several single matches can be identified. In fact, after conducting the analysis ac-
cording to procedure presented above, only one third of the coefficients were found to
vary (significance level 0.05) between groups. These links situate between competitive
advantage and market performance, market orientation and competitive advantage, mar-
ket orientation and market performance, innovation orientation and financial perform-
ance, and inside-out capabilities and competitive advantage. All the statistically verified
similarities are at place with significance level of 0.0001 or smaller.

81
For ”high-cost” and ”low-cost” countries, construct means for all seven factors are pre-
sented at Table 19. It can be seen that high-cost countries are ahead of low-cost coun-
tries in market and innovation orientations and inside-out capabilities. In outside-in ca-
pabilities low-cost countries seem to be doing somewhat better but, as Table 20 shows,
the difference in mean is not statistically significant. This is indicated by high probabil-
ity associated with the (two-tailed) t-test. Also achievement and sustainability of com-
petitive advantages and components of business performance are arguably higher in
high-cost countries than in low-cost countries. T-tests were performed in MS Excel.
Table 19 Construct means for “high-cost” and “low-cost” countries
GroupMarket
OrientationInnovationOrientation
Inside-outcapabilities
Outside-incapabilities
CompetitiveAdvantage
MarketPerformance
FinancialPerformance
High-cost countries 5.15 3.55 3.45 3.83 3.21 3.47 3.48Low-cost countries 5.01 3.39 3.31 3.83 2.91 3.38 3.24
Table 20 Probabilities associated with two-tailed t-test (“low-cost” vs. “high-cost” countries)
AssumptionMarket
OrientationInnovationOrientation
Inside-outcapabilities
Outside-incapabilities
CompetitiveAdvantage
MarketPerformance
FinancialPerformance
Equal variances 0.000 0.000 0.000 0.784 0.000 0.003 0.000Unequal variances 0.000 0.000 0.000 0.782 0.000 0.003 0.000
4.2.4. Engineering CountriesNow that we have seen how strategic marketing affects business performance of compa-
nies in groups considerably heterogeneous in nature, we will next provide an essentially
similar analysis on countries with several similarities. Namely, we will compare strate-
gic marketing and its effectiveness in “engineering countries”, Austria, Finland and
Germany. Construct means and regression coefficients for these countries were pre-
sented among other sample countries already in section 4.3, titled “Country compari-
sons”. However, for sake of clarity, they are included also here (Tables 21 and 22).

82
Table 21 Standardized regression coefficients (Austria, Finland and Germany)
PathMarket Orientation -> Competitive Advantage 0.09 0.03 -0.04Innovation Orientation -> Competitive Advantage 0.40 ** 0.24 * 0.40 **
Inside-out Capabilities -> Competitive Advantage -0.11 0.38 ** -0.05Outside-in Capabilities -> Competitive Advantage 0.21 ** -0.12 0.11Competitive Advantage -> Market Performance 0.08 -0.17 0.14 *
Market Orientation -> Market Performance -0.04 -0.24 ** 0.04Inside-out Capabilities -> Market Performance 0.20 * 0.73 ** 0.29 **
Outside-in Capabilities -> Market Performance 0.23 ** -0.18 -0.15Innovation Orientation -> Market Performance 0.06 0.07 0.18 *
Competitive Advantage -> Financial Performance 0.12 0.03 0.08Market Performance -> Financial Performance 0.35 ** 0.16 0.65 **
Market Orientation -> Financial Performance -0.12 -0.02 0.03Inside-out Capabilities -> Financial Performance 0.24 * 0.38 * 0.09Outside-in Capabilities -> Financial Performance -0.12 -0.01 0.08Innovation Orientation -> Financial Performance 0.12 -0.11 -0.02
Austria Finland Germany
Table 22 Construct means for engineering countries
CountryMarket
OrientationInnovationOrientation
Inside-outcapabilities
Outside-incapabilities
CompetitiveAdvantage
MarketPerformance
FinancialPerformance
Finland 5.845 3.291 3.248 3.726 3.361 3.239 3.294Austria 4.910 3.514 3.487 3.847 3.253 3.462 3.463Germany 5.323 3.309 3.588 3.993 3.125 3.426 3.438
Similarly to that in previous section (“Low-cost” vs. “high-cost” countries), analysis of
statistical difference in regression coefficients was conducted. Firstly, equality of factor
structures among engineering countries was tested. Again, overall fit indices in concur-
rent model estimation support the equality of structures: Finland vs. Austria,
RMSEA=0.060, NNFI=0.95, CFI=0.95, GFI=0.87; Finland vs. Germany,
RMSEA=0.059, NNFI=0.96, CFI=0.96, GFI=0.91; Austria vs. Germany,
RMSEA=0.057, NNFI=0.96, CFI=0.96, GFI=0.91. Also among engineering countries,
covariance matrices were found to be statistically unequal. However, loading matrices of
innovation orientation (between Finland and Austria) and financial performance (be-
tween Finland and Germany, and Austria and Germany) can be interpreted as statisti-
cally equal since these comparisons led to probability over 0.05. Again, problematic
group dominance was not at place.

83
The results show that, in Finland and Austria, regression coefficients as a whole are not
statistically invariant (p=0.034 < 0.05). Contributions to chi-square are close to each
other (for Austria, 54.43%) so the results are not severely biased. Five statistically dif-
fering coefficients were found: relationships between market performance and financial
performance, market orientation and market performance, inside-out capabilities and
competitive advantage, outside-in capabilities and competitive advantage, and outside-in
capabilities and market performance. Differences that were statistically verified are so
with significance level 0.0001 or lower.
Turning to compare Finland and Germany, German data counts for 62.15 % of contribu-
tion to chi-square statistic so we have to be somewhat conservative when drawing con-
clusions on the results. As in previous comparisons, whole regression coefficient matrix
is not statistically invariant among the countries (p = 0.0021 < 0.05). In Finland and
Germany, those six individual links of statistically inequality lie between competitive
advantage and market performance, market performance and financial performance,
market orientation and market performance, innovation orientation and market perform-
ance, inside-out capabilities and competitive advantage, and inside-out capabilities and
financial performance.
Between Austria and Germany, regression coefficient matrixes are statistically invariant
(p = 0.10 > 0.05). Also, most of the links individually fulfill the invariance requirements.
Only links between competitive advantage and market performance, innovation orienta-
tion and market performance, inside-out capabilities and financial performance, outside-
in capabilities and competitive advantage, and outside-in capabilities and market per-
formance are statistically invariant. Results are not severely biased since Germany’s
contribution to chi-square statistic is only 59.55%.
From Table 23, differences in outside-in capabilities and achieving and sustaining com-
petitive advantages are not significantly different in magnitude in Finland and Austria.
However, while results show that Finland would be more market-oriented than Austria,
it seems to beat us in innovation orientation, inside-out capabilities and, leading to better
business performance, too, than in Finland.

84
In comparison between Finland and Germany, innovation orientation does not favour
(statistically significantly) either of the countries. However, Finnish firms are more mar-
ket-oriented than those in Germany and are able to develop and sustain competitive ad-
vantages more effectively. German companies, in turn, lead Finnish counterparts in both
inside-out and outside-in capabilities. German respondents also report higher business
performance than Finnish respondents.
German and Austrian results related to factor construct means are considerably alike;
statistically significant differences are identifiable only in market orientation, innovation
orientation and outside-in capabilities. Companies in Germany have adopted more mar-
ket oriented way to operate and have better outside-in capabilities whereas Austrian
firms are more innovation oriented than those in Germany.
Table 23 Probabilities associated with t-tests assuming unequal variances (engineering countries)
ComparisonFIN vs. AUT 0.000 ** 0.001 ** 0.000 ** 0.055 0.174 0.002 ** 0.025 *FIN vs. GER 0.000 ** 0.771 0.000 ** 0.000 ** 0.003 ** 0.005 ** 0.031 *AUT vs. GER 0.000 ** 0.004 ** 0.053 0.013 * 0.136 0.616 0.714
** p < 0.01 (two-tailed)* p < 0.05 (two-tailed)
InnovationOrientatio
Inside-outcapabilities
Outside-incapabilities
CompetitiveAdvantage
MarketPerformance
FinancialPerformance
MarketOrientation
4.3. Nested Model Testing
Since we wanted to test our hypotheses in all individual groups of the study, it was rea-
sonable to use completely similar models. We can, however, now test whether it is pos-
sible to find a model that fits the overall data even better than the one achieved previ-
ously. This is called nested (Hair et al., 2006), or equivalent model testing (Diaman-
topoulos and Siguaw, 2000). Two competing models were tested with international data
sample.
The testing was performed as follows. Relationships with no statistical significance were
eliminated from the international structural equation model. These relationships can be
found from Table 11. Subsequently, the chi-square difference test for the original model
and new, nested model was conducted. The results of this test are presented at Table 24.
Since removing insignificant links does not reduce chi-square statistic by more than 2.43

85
(when decrease in degree of freedom is six units), it leads us to conclude that the re-
duced model’s general fit is not statistically significantly (reliability level of 95 %;
p=0.876) better than that of the structural model used in the study. Therefore, perform-
ing statistical analyses with our model is now also statistically justified.
Table 24 Chi-square difference test for nested models
Hypothesis Chi^2 Df P-valueAll Relationships 1620.18 194Only Stat. Sign. Relationships 1617.75 188Difference 2.43 6 0.876
4.4. Development of Marketing Performance Assessment Tool
This section presents one potential application for the results achieved in this study,
namely development of a somewhat readily applicable tool for determining success of
strategic marketing in individual firm context. Since it does not use accounting informa-
tion as its input, this kind of a tool is especially useful e.g. in a situation where such in-
formation of a firm is not available. Further, even if detailed financial information was
available, a firm may have just made heavy investments and, consequently, its profitabil-
ity is low or even negative; in situations just described, it is of use to acknowledge which
factors usually drive the success from marketing perspective.
Although market performance is a prerequisite for business success, we are eventually
most interested in factors that positively relate to financial performance of a firm. Those
factors are sought for also at this point. Table 25 presents total and indirect effect of this
study’s four constructs on financial performance in the full international sample and
Finnish companies. As Table 25 shows, inside-out capabilities are those that seem to
have largest impact on financial performance. Based on total effect indicators, relative
weights are appointed for our tool; indicators are drawn from the 13-country sample due
to more reliable results (larger sample) and somewhat surprising results gained from
Finnish company data.

86
Table 25 Constructs' standardized total and indirect (in parantheses) effect on financialperformance
Construct International sample FinlandMarket orientation 0.02 (0.01) -0.06 (-0.04)Innovation orientation 0.10 (0.08) -0.09 (0.01)Inside-out capabilities 0.36 (0.15) 0.49 (0.12)Outside-in capabilities 0.06 (0.05) -0.04 (-0.03)
By assessing the current level of certain orientation or capability construct presented in
this study, it can measure the second component of the assessment tool, namely relative
construct performance against averages from the full sample. As accurate evaluation re-
garding each measurement item of constructs as possible are required; this is a very im-
portant issue since it increases the reliability of the company results. Table 26 illustrates
the use of the tool with a help of an example. “Points of the company” refers to the indi-
vidual company points as an average of market orientation scale indicators. “Relative
construct performance” communicates how well a company is doing relative to an aver-
age company in international sample. Effects on financial performance are readily avail-
able at Table 25 and these are converted into percentages (“weight”). Finally, “relative
construct performance” and “weight” are multiplied to end up with a marketing per-
formance measure. This measure is obtained by summing up individual marketing per-
formance values. In the example at Table 26 company is above average in market and
innovation orientation, and outside-in capabilities but below average in inside-out capa-
bilities. Considerably large impact of inside-out capabilities on performance causes the
company to get a marketing performance measure of 1 percent lower than an average
sample company although it is doing better than average in the three other factors.
Table 26 Marketing performance assessment tool – a practical example
Construct
Internationalaverage
Points ofthe
company
Relativeconstruct
performance
Construct effecton financialperformance
Weight Marketingperformance
Market orientation 4.95 5.2 1.05 0.02 4 % 0.04Innovation orientation 3.49 3.7 1.06 0.10 19 % 0.20Inside-out capabilities 3.43 3.3 0.96 0.36 67 % 0.64Outside-in capabilities 3.87 4 1.03 0.06 11 % 0.11
-1 %

87
However, the tool lacks some precision because it does not take into account the com-
petitive situation on the market. We can though assume that every industry, for example,
has certain fraction of companies doing badly, averagely and well according to certain
criteria; under the “normal distribution” assumption shortages of the tool are not very
severe, at least if acknowledged. Due to insensibility for different environments and
business situations, the tool can only be used for general marketing performance assess-
ment, as a kind of first aid kit.
Even if we assumed that the regression coefficients that were arrived at in this study act
similarly in all conditions, or whether a company possesses poor or excellent level in
e.g. innovation orientation, there remains phenomenon of diminishing rate of return.
This issue, introduced in economics literature, argues that the amount of effort put in
increasing the innovation orientation benefits a firm in a way illustrated by an S-shaped
curve. The better you are, the less you benefit from any extra effort, and vice versa.
Firms also have very different characteristics so interpretation of results cannot be made
solely on general basis but must be taken also to the individual firm level.
88
5. Discussion and Conclusions
This study can be considered as consisting of two rather individual but strongly interre-
lated parts, theoretical and empirical, and the synthesis of these two. Results of quantita-
tive analysis form without a doubt the most important contribution for this study. How-
ever, also the third, analytical research question dealing with marketing effectiveness
measurement is necessary in providing coherent picture for the phenomenon tackled sta-
tistically in the two other questions. The reader should consequently be persuaded after
reading this thesis that there is no simple means of measuring marketing effectiveness
accurately. Also, he or she might agree that knowing performance impact of marketing
resources and business orientations, for example, is one considerable factor explaining
performance differentials between firms due to vagueness of the relationships. Due to
largely confirmatory nature of the study, results that support literature-basing hypotheses
are interpreted as strong indicators of relationship existence.
The purpose of this final chapter is to discuss the research results and to draw conclu-
sions on them, providing concrete recommendations especially for companies in
Finland. Firstly, we discuss on results of the study and answer the assigned research
questions. We also discuss reliability and validity of the results of this thesis, define the
magnitude of success in meeting the goals of the study and evaluate the contribution of
it. Finally, possible paths for further research are provided.
5.1. Discussion on Results
Each subsection of this section is devoted to one research question of this study. In addi-
tion to presenting answers to the questions, potential implications are discussed. Frame
of reference of the study, illustrated in Figure 8, is well present in each of the questions.
Linking the results of the study to previous studies hopefully complements the previous
analyses, giving “flesh on bones”.

89
5.1.1. Success Factors and Their Performance ImpactThe first research question dealt with examining the relationships between marketing
resources and practices and financial performance of a firm. The ultimate intention was
to find those factors contributing most positively to business performance of companies.
To meet this goal, the entire thirteen-country company sample was fitted to one theory-
basing model, having rather similar structure as in normative MPA model, developed by
Morgan, Clark and Gooner (2002).
The fit of structural model and the data was found to be well adequate so generally ap-
plicable relationships were arrived at. According to the evidence provided by research
results, clearly the strongest link is found between market and financial performance
(standardized regression coefficient of 0.52). This is not very surprising since, by com-
mon sense, for example sales volume has strongly to do with amount of profits gained.
The next strongest relationships are identified between inside-out capabilities and mar-
ket performance (0.27), innovation orientation and competitive advantage (0.25), inside-
out capabilities and financial performance (0.21), inside-out capabilities and competitive
advantage (0.17), and competitive advantage and market performance (0.14). The results
therefore indicate that inside-out capabilities are, of the constructs included in this study,
those influencing most positively to business performance of companies (total effect on
financial performance 0.51) whereas market orientation has an effect of only 0.02; in
fact, the effect of market orientation is not even statistically significant. Innovation ori-
entation (0.11) and outside-in capabilities (0.07) fall in between these two extremes.
The results are partly surprising. One could for example have thought that inside-out ca-
pabilities would not have significantly larger impact on business performance than those
of other constructs, or not the largest at all. On the other hand, Barney (1991) provides
potential reasoning behind the large performance effect of inside-out capabilities. He
states that, although rare and valuable resources are those which gather the most of the
attention in most circumstances, also common (into which category inside-out capabili-
ties can now be appointed) resources play important roles in companies’ success, espe-
cially under the intimate competitive environment; by saying this, I argue that inside-out
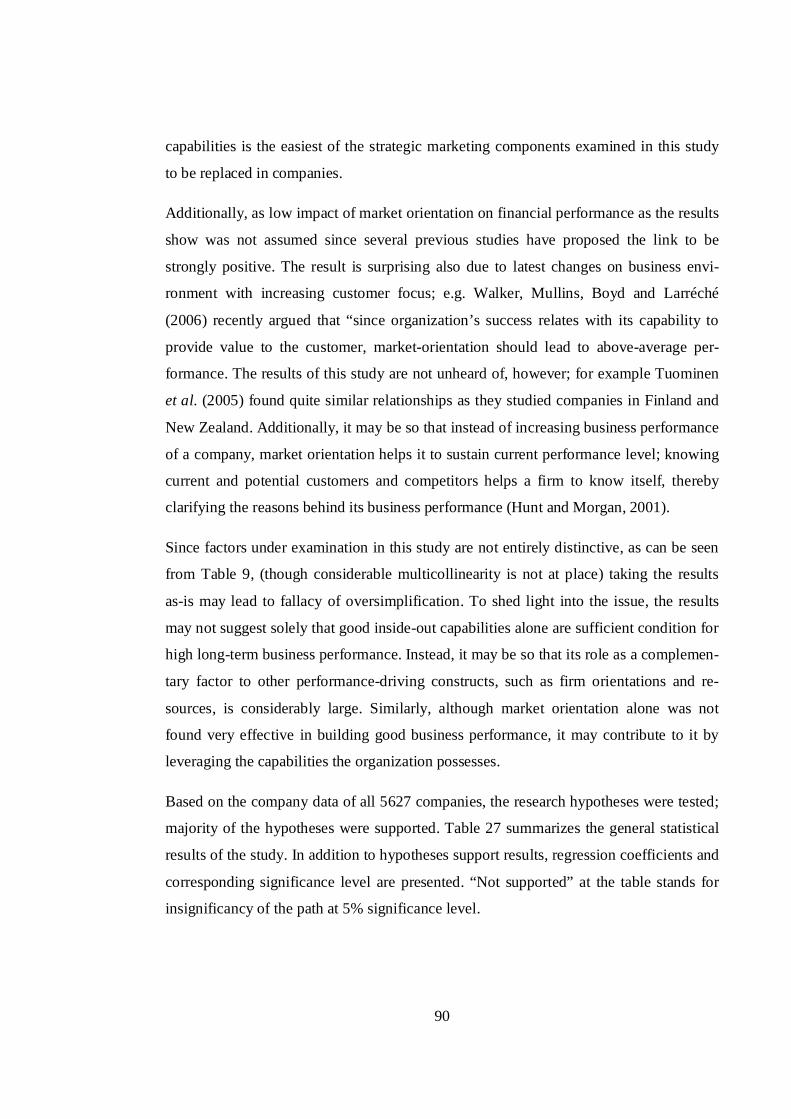
90
capabilities is the easiest of the strategic marketing components examined in this study
to be replaced in companies.
Additionally, as low impact of market orientation on financial performance as the results
show was not assumed since several previous studies have proposed the link to be
strongly positive. The result is surprising also due to latest changes on business envi-
ronment with increasing customer focus; e.g. Walker, Mullins, Boyd and Larréché
(2006) recently argued that “since organization’s success relates with its capability to
provide value to the customer, market-orientation should lead to above-average per-
formance. The results of this study are not unheard of, however; for example Tuominen
et al. (2005) found quite similar relationships as they studied companies in Finland and
New Zealand. Additionally, it may be so that instead of increasing business performance
of a company, market orientation helps it to sustain current performance level; knowing
current and potential customers and competitors helps a firm to know itself, thereby
clarifying the reasons behind its business performance (Hunt and Morgan, 2001).
Since factors under examination in this study are not entirely distinctive, as can be seen
from Table 9, (though considerable multicollinearity is not at place) taking the results
as-is may lead to fallacy of oversimplification. To shed light into the issue, the results
may not suggest solely that good inside-out capabilities alone are sufficient condition for
high long-term business performance. Instead, it may be so that its role as a complemen-
tary factor to other performance-driving constructs, such as firm orientations and re-
sources, is considerably large. Similarly, although market orientation alone was not
found very effective in building good business performance, it may contribute to it by
leveraging the capabilities the organization possesses.
Based on the company data of all 5627 companies, the research hypotheses were tested;
majority of the hypotheses were supported. Table 27 summarizes the general statistical
results of the study. In addition to hypotheses support results, regression coefficients and
corresponding significance level are presented. “Not supported” at the table stands for
insignificancy of the path at 5% significance level.
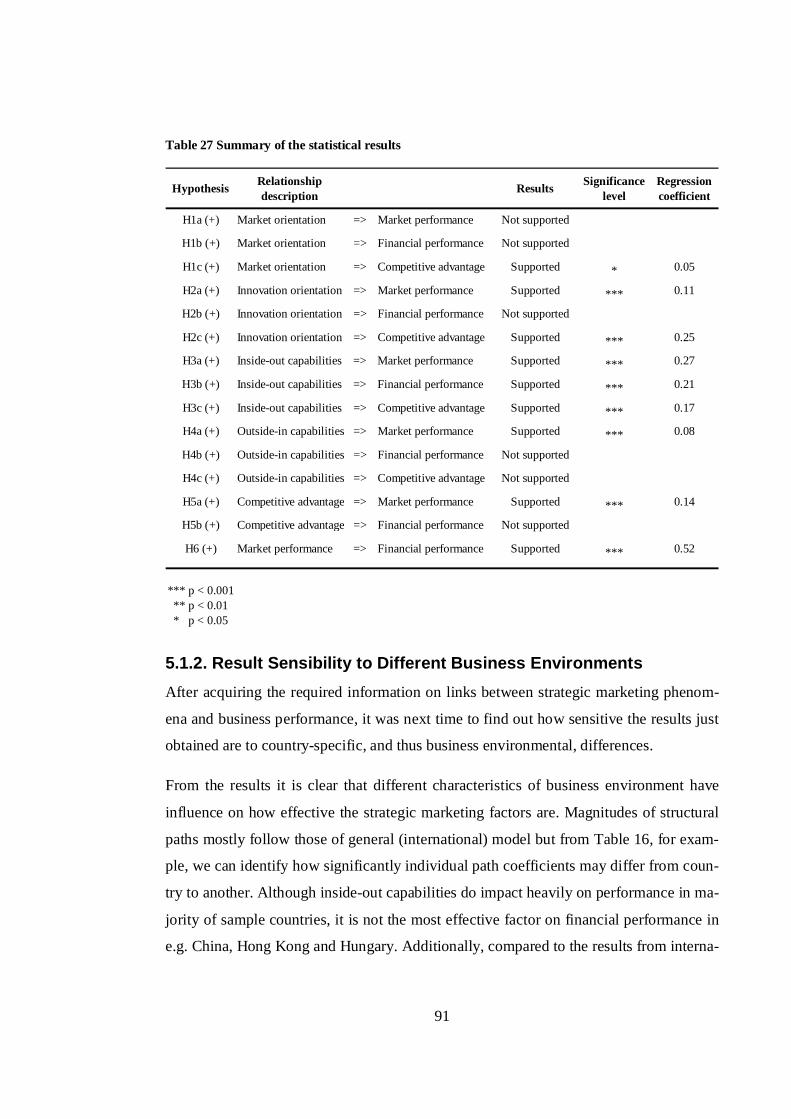
91
Table 27 Summary of the statistical results
Hypothesis Relationshipdescription Results Significance
levelRegressioncoefficient
H1a (+) Market orientation => Market performance Not supported
H1b (+) Market orientation => Financial performance Not supported
H1c (+) Market orientation => Competitive advantage Supported * 0.05
H2a (+) Innovation orientation => Market performance Supported *** 0.11
H2b (+) Innovation orientation => Financial performance Not supported
H2c (+) Innovation orientation => Competitive advantage Supported *** 0.25
H3a (+) Inside-out capabilities => Market performance Supported *** 0.27
H3b (+) Inside-out capabilities => Financial performance Supported *** 0.21
H3c (+) Inside-out capabilities => Competitive advantage Supported *** 0.17
H4a (+) Outside-in capabilities => Market performance Supported *** 0.08
H4b (+) Outside-in capabilities => Financial performance Not supported
H4c (+) Outside-in capabilities => Competitive advantage Not supported
H5a (+) Competitive advantage => Market performance Supported *** 0.14
H5b (+) Competitive advantage => Financial performance Not supported
H6 (+) Market performance => Financial performance Supported *** 0.52
*** p < 0.001** p < 0.01* p < 0.05
5.1.2. Result Sensibility to Different Business EnvironmentsAfter acquiring the required information on links between strategic marketing phenom-
ena and business performance, it was next time to find out how sensitive the results just
obtained are to country-specific, and thus business environmental, differences.
From the results it is clear that different characteristics of business environment have
influence on how effective the strategic marketing factors are. Magnitudes of structural
paths mostly follow those of general (international) model but from Table 16, for exam-
ple, we can identify how significantly individual path coefficients may differ from coun-
try to another. Although inside-out capabilities do impact heavily on performance in ma-
jority of sample countries, it is not the most effective factor on financial performance in
e.g. China, Hong Kong and Hungary. Additionally, compared to the results from interna-

92
tional sample, effects on competitive advantage and business performance in Finnish
companies are smaller in outside-in capabilities, market orientation and innovation ori-
entation. In turn, in Finland inside-out capabilities have significantly stronger relation-
ships with performance measures. Thus, evidence is given that even when certain re-
gression coefficient for one country is statistically significantly positive it can be simi-
larly significantly negative in another.
Two comparison studies were conducted to examine the level of sensitivity of results to
different group characteristics. In addition to possible changes in regression coefficients,
among others, differences in construct means were tested. First, “high-cost” and “low-
cost” countries were brought to analysis. It was found that, having confidence level of
0.0001, links between competitive advantage and market performance (“low-cost” coun-
tries better off), market orientation and competitive advantage (“high-cost”), market ori-
entation and market performance (“low-cost”), innovation orientation and financial per-
formance (“low-cost”), and inside-out capabilities and competitive advantage (“low-
cost”) vary among the two groups, i.e. moderating effect is in place. The results are pre-
sented at Table 28.
Although regression coefficients as a whole were not established to vary statistically
significantly between groups, these results argue that in “low-cost” countries strategic
marketing is somewhat more effective. This may not, however, be the case. The expla-
nation may instead lie at least partly in the fact that means for the three independent con-
structs are larger for “high-cost” countries than for “low-cost” ones; only for outside-in
capabilities factor means are found to be statistically invariant. According to decreasing
marginal utility theorem, which can be assumed to be in effect in this case, one unit of
increase at the scale top does not add the value as much as an increase of one unit at the
bottom or middle part of the scale. What also needs to be considered is that differences
in regression coefficients may be a consequence of differences in business environments
and not necessarily indicate solely superiority or inferiority in strategic marketing. It
could, for example, be so that in Hong Kong market structure and intensity of competi-
tion favor firms with high market orientation more than firms in Slovenia.

93
Another comparison study was performed among the so-called engineering countries, or
Austria, Finland and Germany. The results from regression part of analysis are again
presented at Table 28. Also now, moderating country-specific effects exist. The results
argue that rather similar number of statistically significantly different regression coeffi-
cients was found in each of three two-country comparison analyses. Relationship be-
tween market orientation and market performance was the lowest in Finland; this may
indicate either bad conduction of market orientation or a business context where having
high market orientation does not pay off. The latter explanation would – according to the
results of Kohli and Jaworski (1990) – refer to relatively weak competitive environment,
great technological turbulence and strong general economy taking place in Finland; all
these issues could, I think, be used to describe the current situation in Finnish business
environment. Finnish companies were, however, the best in turning inside-out capabili-
ties into good business performance, whereas Austria was clearly the best in benefiting
from its level of outside-in capabilities. German companies seem to convert innovation
orientation best into market performance outcomes. Between Austria and Germany, re-
gression coefficient matrixes were found as statistically invariant ( = 0.05).
Table 28 Comparison of group regression coefficients
Path Cheap vs Expensive FIN vs AUT FIN vs GER AUT vs GERMarket Orientation => Competitive Advantage ExpensiveMarket Orientation => Market Performance Cheap AUT GERInnovation Orientation => Market Performance GER GERInnovation Orientation => Financial Performance CheapInside-out Capabilities => Competitive Advantage Cheap FIN FINInside-out Capabilities => Financial Performance FIN AUTOutside-in Capabilities => Competitive Advantage AUT AUTOutside-in Capabilities => Market Performance AUT AUTCompetitive Advantage => Market Performance Cheap GER GERMarket Performance => Financial Performance AUT GER
Interpreting the table: e.g. regression coefficient between market orientation and competitive advantage is statistically significantly ( =0.05) more positive or less negative in expensive countries than in cheap countries.
Cadogan et al. (2002) examined market capabilities aiming to find out if there are differ-
ences in capabilities required to be successful in service industries in the UK and New
Zealand. They found empirical evidence for universality of success capabilities. How-
ever, the group comparison part of this study has shown that best practices clearly can-

94
not be transferred to different markets and cultures in a very straightforward manner.
This is why companies acting globally have to take the differences in customer needs
and other market characteristics into serious consideration.
To conclude the answer to second research question, general results cannot be directly
generalized into individual countries and market environments; this is especially the case
in countries not included in the data sample. Although regression coefficients mostly
follow the pattern familiar from the international sample case, some significant devia-
tions from the “expected” values could be identified.
5.1.3. Marketing Performance AssessmentAs a third, and final research question, it was asked what kind of metrics is used today to
assess marketing performance and effectiveness and how should it be measured in the
future. With closely related issues, of central interests were to define marketing per-
formance and how different variables link to it.
Performance is a relative concept about capability to generate future results (Lebas and
Euske, 2002). From the reviewed literature, it became clear that marketing performance
assessment is not an easy job to do. This may be, for example, due to resources that are
socially complex or otherwise interrelated therefore making achievement of clear per-
formance impact of these assets and capabilities even impossible (Barney, 1991). It is
also easier to focus on short-term profitability measures and reduce investments in new
products and other factors with long-term payoffs although performance measures ought
to reflect the long-term viability and health of company (Proctor, 2000). Ability to dem-
onstrate relationships between marketing inputs and outputs would however be highly
valued and warmly welcomed by corporate-level managers who would then be better
equipped to distinguish between marketing expenditure and investment (Morgan, Clark
and Gooner, 2002).
Proctor (2000) argues that, in marketing performance measurement, serious attention
should be paid for resources and capabilities which underlie current and future strategies
and their strategic competitive advantages. In terms of actual measurement, this could

95
mean having, for example, customer satisfaction, brand loyalty measures, product and
service quality measures, relative cost, new product activity and capabilities of managers
and employees, as performance measures (Proctor, 2000). This would obviously reduce
problematic short-sightedness present in many performance measurement situations.
Current trend seems to be that measurement systems basing solely on accounting based
measures have been overcome by those including also diverse non-accounting measures,
in the spirit of Balanced Scorecard (Kaplan and Norton, 1992). Being not focused
strictly on, for example, market share or ROI measures is fortunate since a broader per-
formance focus increases understanding of performance consequences of the strategies
among decision makers (Varadarajan and Jayachandran, 1999).
It is extremely vital to know which marketing resources and capabilities are of impor-
tance so that assessment of marketing performance can base on truly significant meas-
ures. To this end, the present study contributes to the research stream by offering further
empirical evidence about these critical factors (Morgan, Clark and Gooner, 2002). This
study contributes on marketing performance measurement and metrics research also by
developing a practical measurement tool for the general level of marketing performance
evaluation. The tool is, however, constructed to predominantly help applying the results
of this study so it can be considered as a prototype, waiting for further development. Es-
pecially the ease of its use should be improved in the future so that more concrete bene-
fits within firms could be ended up with.
Four sets of measures, market and innovation orientation, and inside-out and outside-in
marketing capabilities, were used in this study to assess marketing performance in sam-
ple companies. They also are the core of the developed assessment tool. The outline of
how the constructs can be positioned to the continuum from deeply company-inherent
concept of marketing spirit11 to actual business performance and profitability is illus-
trated in Figure 17. Its rationale is based on the following arguments. Firstly, acknowl-
edging firm’s current and potential customers and competitors and successfully spread-
ing information on these (market orientation) is a necessary starting point for any com-
11 Marketing spirit is an innovative, courageous, and creative attitude towards work and business (Strat-Mark definition).

96
pany since these help clarifying its market position and understanding customer re-
quirements. Secondly, innovation orientation helps in finding more innovative ways to
satisfy these needs or develop new needs. As is market orientation, innovation orienta-
tion is a strongly firm-inherent construct. After feasibility of company’s solutions has
been assured, ability to create and maintain customer relationships with a help of market
information (outside-in capabilities) play a crucial role. Finally, supporting or inside-out
capabilities facilitate in turning the three first factors into competitive advantages and
market success, and consequently financial success. The framework just described in a
sense falls between models proposed by Stoelhoerst and van Raaij (2004) and Morgan,
Clark and Gooner (2002).
Marketorientation
Inside-outcapabilities
Outside-incapabilties
Innovationorientation
Competitiveadvantage
Marketperformance Financial
performance
”Marketing spirit” Profitability
Figure 17 Positioning the constructs of the study from “marketing spirit” to profitability
Framework of Sevin (1965) can serve as a point of departure in measuring effectiveness
of strategic marketing but it should take into account diverse measures along the contin-
uum; like is done in company tool, for example. Although financial performance meas-
ures are characteristically relatively objective, managers can use those measures show-
ing them in best light, perhaps with short-term orientation. For example, in the presence
of unclear marketing outputs, those people responsible for conducting marketing may
put overly emphasis on marketing cost control and be willing to calculate performance
of marketing with a help of profit-to-expense-ratio.
Operationalization of certain strategic marketing factors may prove to be very hard,
though. While market performance can be measured, for example, with measures such
as market share, customer satisfaction and customer loyalty, and innovation orientation
through R&D expenditure, number of patents or new product revenue, how would you
measure outside-in marketing capabilities or brand equity, for example? Even if we

97
could operationalize marketing factors, every company has its special traits. What works
in another company may not work in another; it is very difficult to develop a universally
applicable measurement system. Such should take into account both norms and context.
However, as stated above, current trend is fortunately such that measurement systems
take increasingly into account diverse set of also non-accountant or non-financial meas-
ures. This is promising since processes in marketing and quality of marketing ingredi-
ents is what firms should dominantly measure. Exploring cause-and-effect relationships
of individual marketing components – and how they relate to unities of marketing and
business – has potential to lead to good performance in the long run and, therefore, also
measurement of marketing effectiveness should become more “strategic”.
5.2. Reliability and Validity
It is important to examine the reliability and validity of the results. Only accordingly we
get to know on what conditions they can be interpreted and relied on. Evidently, some of
the findings in this study should be interpreted with caution.
5.2.1. ReliabilityReliability refers to degree to which the scores are free from random measurement error
(Kline, 2005) and can be examined through assessing the degree of consistency between
multiple measures of a latent variable (Hair et al., 2006). Results in Appendix E suggest
high reliability for both each separate measure and scales since all the item-to-total cor-
relations among indicators are above 0.5 and Cronbach’s alpha measures that assess the
consistency of entire scales – with only one slight exception – are above threshold level
of 0.7. All inter-item-correlations also are above 0.3. Although majority of measures in-
dicate good reliability in the study, relatively low square multiple correlations, or expla-
nation power, especially in structural equations for competitive advantage suggest that
the corresponding results should be interpreted with some caution.
The survey questionnaire was answered by company managers which causes some prob-
lems when it comes to reliability of the results. This is due to subjective rather than ob-
jective nature of answers. Among others, it is often easier to give neutral answers than to

98
answer either of the scale extremes. Also, survey participants may find it difficult to
compare their company’s performance relative to its main competitors and past perform-
ance. Further, even though the results of the survey are treated anonymously, the re-
spondent may feel tempted to give a somehow biased impression of the company in
question. Whether research data is objective or subjective may have an effect on results
obtained (cf. e.g. Jaworski and Kohli, 1993).
The results of the full international sample and Finnish sample can be rather well and
reliably compared due to closely similar firm frequencies in company size, industry type
and market position. However, one weakness of the data being studied is that it does not
tell whether a certain company only operates domestically or also in foreign markets.
Therefore some of the comparison result interpretations may be biased due to somewhat
incorrect grouping of firms. Possible bias is, however, assumed to be significantly small
so that it can be ignored. It must also be acknowledged that performance and profitabil-
ity of the firm may vary significantly much from year to another. Similarly, current mar-
ket leader companies may not be the ones to dominate the market also in the future. Fur-
ther, due to phenomenon of diminishing rate of return, performance impact of a con-
struct for groups with high mean in corresponding construct is somewhat downward bi-
ased, and vice versa. Variations in firm- or larger context by time force the reader to
very carefully interpret some of the results of this study.
5.2.2. Validity“Validity concerns the soundness of the inferences based on the scores – that is, whether
the scores measure what they are supposed to measure, but also not measure what they
are not supposed to measure.“(Kline, 2005) Validity can be divided into discriminant
and convergent validities. All the statistical models used in this study are unidimen-
sional, or the indicators only depend on a single factor. Therefore, as Kline (2005) ar-
gues, they provide better measurement of convergent and discriminant validity.
While constructing the general measurement model, several indicators had to be re-
moved to achieve unidimensional and statistically best model. It could therefore be sug-
gested that the questionnaire is at least in some sections of questionable validity. Conse-

99
quently, some factors only included two indicators which is less than recommended;
relatively small number of indicators may have caused some loss of validity since meas-
urement items of those factors might not have been adequately diverse to take the full
breath of constructs.
In this study, correlations between latent variables are reasonable low, in every model
under examination less than threshold level of 0.85 suggested by Kline (2005). This in-
dicates good discriminant validity for different models. Additionally, for the interna-
tional model, composite reliabilities and average variances extracted are almost solely
above the respective thresholds of 0.6 and 0.5 recommended by Diamantopoulos and
Siguaw (2000). The model goodness-of-fit indices, too, generally indicate that the speci-
fied measurement structures fit different data sets acceptably well; good fit measures of
structural models among different samples specially support high cross-validity.
One issue reducing the validity of this study is the self-evident variation in cultural
backgrounds and valuations among the postal survey respondents which causes different
performance assessment orientations. It is probable that people in certain countries differ
significantly when it comes to answering habits from people in some other countries.
This is evident also based on the fact that certain countries were at top 3 in practically
every factor under study while others were far behind them. For example, differences in
construct means in each construct between Greece and Hong Kong were such large that
I think they cannot possibly be explained only by actual marketing and performance dif-
ferences in these countries.
5.3. Implications for Finnish Companies
Hunt and Morgan (2001) argue that firms should build on resources that contribute to
the firm’s ability to produce valuable market offerings efficiently or effectively. How
about especially Finnish companies – how should they conduct their strategic marketing
to achieve best possible outcomes from it? According to the results of this study, effec-
tiveness of strategic marketing in Finnish companies is at rather low level, compared to
other sample countries. This refers to strong focus put on technical product development
whilst emphasis should be put more on immaterial development of processes and capa-

100
bilities of firms. Finnish results also show that inside-out capabilities is the individual
construct having largest impact on competitive advantage development and sustaining
and business performance, suggesting that more emphasis should be put into develop-
ment of those. This is true especially since the current level, according to the results of
this study, the level of inside-out capabilities is not very high so much can be done in
this area. Also innovation orientation positively relates to competitive advantages and
market performance but still its total effect on financial performance is negative. Ac-
cording to the results, outside-in capabilities and market orientation have slight negative
effect on business performance of a firm, too; it is nevertheless possible that although
current and potential customer needs and competitors are well taken into consideration,
company does not succeed due to, among others, inappropriate operational marketing.
In light of results is thus seems that although Finnish companies act in a very market-
oriented way, they find difficult to turn that into success at the marketplace; on the other
hand, it may well be true that Finnish respondents have an outlook more positive than
those in other sample countries of e.g. market orientation. Also outside-in capabilities
are seen more as a burden than benefit from business performance point of view. One
possible explanation could be that continuously taking customer and competitors into
account binds resources so that financial performance suffers from it. Another explana-
tion lies in theory of diminishing rate of return. Because Finland on average clearly per-
forms well in terms of market orientation, it probably is more difficult to increase mar-
ket-orientation than performance measures which are not yet at such a high level; as
Kohli and Jaworski (1990) noticed, extreme market orientation may lead to poor finan-
cial performance due to either uneconomical operations (high costs) or dissatisfied cus-
tomers (heightened expectations level).
Where can then best practices for Finnish companies be found? We should perhaps seek
for guidance from countries where constructs’ total effect on financial performance is
among the highest. Such countries are, according to Table 18, for example Hungary,
Greece, Ireland and New Zealand. Best general practices in terms of individual variables
can be benchmarked from Hong Kong (market orientation), Hungary and Greece (inno-
vation orientation), the United Kingdom (inside-out capabilities) and New Zealand and

101
China (outside-in capabilities). Again, however, one cannot say surely whether the suc-
cess in these countries is caused predominantly by superior strategic marketing conduc-
tance or favorable business environment. If a company is planning to start acting at in-
ternational markets, it should first gain those capabilities and orientations already highly
adopted by the firms in the target country to eliminate their advantages and to take bene-
fit from the receipt found successful.
Even if a firm got to know how they should manage their strategic marketing, difficulty
in applying the results in practice remains. This is because good strategy needs good
strategy implementation to result in good business performance (e.g. Kennie, 2006;
Shoham and Fiegenbaum, 1999).
5.4. Evaluating Success of the Study
5.4.1. Meeting the Objectives of the StudyAs stated in first chapter, the primary objective of this thesis was to explore how differ-
ent marketing resources and orientations affect firms’ financial performance through
competitive advantages and market performance. Under the examination were also how
strength of these relationships varies in different countries and business environments
and how to develop marketing metrics to better assess marketing performance.
All the research questions were answered so from that perspective the study can be con-
sidered as a success. I was able to construct a structural model to explore the defined re-
lationships between strategic marketing and business performance. The results domi-
nantly supported the hypotheses building on literature sources reviewed. Some surprises
were however faced, especially in terms of impact magnitudes. Different groups were
compared and the results were found to be quite well generalizable. The metrics of mar-
keting performance was also discussed and a concrete implication of performance as-
sessment was provided.
5.4.2. Contribution of the StudyThe treatment of market orientation provides value added knowledge to managers on
how business processes turn relative resource advantages into positional advantages.
102
Subsequently, this study explains how these advantages further lead to performance suc-
cess in different market environments. Especially, acknowledging sensitivity of strategic
marketing’s effectiveness in different business environments and countries is vital for
global companies.
This study has for its part somewhat clarified the understanding of the environmental
factors favoring some orientations and capabilities over others. Marketing performance
is treated as one subject of the study and marketing performance assessment framework
has been taken into consideration and contribution with a help of readily applicable firm
tool is made.
For the StratMark project, main contribution is that empirical, international comparison
study on strategic marketing’s effectiveness is now performed. Results of this study can
be used to plan and conduct further effectiveness studies.
5.5. Limitations and Avenues for Further Research
The research, being performed as a cross-sectional survey, does not capture causality or
the dynamics of the phenomena examined, namely different kinds of capabilities and
orientations and business performance. Additionally, in SEM analysis, it is possible that
different models fit the data equally well. If this happens, there is no statistical basis for
choosing one model over another (Kline, 2005). Consequently, the final measurement
and structural models in this study are my personal interpretations of the conceptual and
empirical results combined.
It is not always easy to explore the relationships between certain activities and resources
and performance. It may, for example, be so that “a piece of property in its distant past
may be now providing it a unique source of comparative advantage and influencing its
size, scope, or profitability” (Hunt and Morgan, 2001). As mentioned at the very begin-
ning of this report, also luck and other non-rational activities sometimes cause success.
Therefore, it is never possible to find a perfect model to explain all the relationships be-
tween strategic marketing and business performance.

103
Fahy et al. (2000) studied the nature of marketing capabilities across a range of firm
types in Central Europe. They found that firms with foreign participation are able to de-
velop a sophisticated level of marketing capability with a resulting positive impact on
business performance. Unfortunately the research questionnaire (presented in Appendix
A) does not gather information from firms’ international activity so that it was not pos-
sible to study relationships between international involvedness and business perform-
ance. In future, however, it would be interesting to examine if result from Fahy et al.
(2000) study can be generalized to different countries and business environments around
the world. Since American or African countries were not involved in the data, they
would be natural objects of further research.
It would also be of great interest to conduct a study where the “Marketing in the 21st
Century” -data set was used as a reference data to new information, to help apply longi-
tudinal research setting. This would help for example in finding sources of sustainable
competitive advantages among the international and national firm samples. Long-term
performance could thus also be automatically taken into account since this kind of ex-
amination demands for observations of actions, operative situation and results over a
sufficiently long period of time since factors such as marketing capabilities and different
orientations are deeply imbedded and slowly evolving. Specifically, cross-sectional data
does not assume sequential, temporal order of causality that the models in this study
conceptually assume. Fortunately, the second round of information gathering has been
planned to take place in near future (StratMark, 2005).
Although statistical models would thus become more complex, including one or two op-
erational variables in the research setting would clarify the relative effect of strategic
marketing issues. Relating to moderating effects, several analyses basing on the “Mar-
keting in the 21st Century” -data would be of interest; for example, sensitivity of results
in regard to 1) industry type, 2) market position, and 3) size of company could be worth
further studying. Additionally, conducting more comprehensive studies with solely indi-
vidual country focus would be tempting. In this case, Finnish data would naturally be the
most interesting object of further analysis from Finnish point of view.

104
6. References
Ambler, T., Kokkinaki, F. and Puntoni, S. (2004) Assessing Marketing Performance:
Reasons for Metrics Selection. Journal of Marketing Management. 20(3-4): 475-498.
Ayala, P., Spiechowicz, M. and Vidaller, J. (2006) EU Engineering Competitive Update.
Available in the Internet: http://ec.europa.eu/enterprise/electr_equipment/en-
gin/engineer_compet_2006.pdf [referenced 2006-11-11].
Barney, J. (1991) Firm Resources and Sustained Competitive Advantage. Journal of
Management. 17(1): 99-120.
Barney, J. (1996) Gaining and Sustaining Competitive Advantage. Addison-Wesley.
Bonoma, T.V. and Clark, B.H. (1988) Marketing performance assessment. Harvard
Business School Press.
Browne, M.W. and Cudek, R. (1993) Alternative ways of assessing model fit. In Bollen,
K. and Long, J.S. (editors) Testing Structural Equation Models. Sage.
Byrne, B.M. (1998) Structural Equation Modeling with LISREL, PRELIS, and SIMPLIS:
Basic Concepts, Applications, and Programming. Lawrence Erlbaum Associates, Inc.
Cadogan, J.W., Hooley, G.J., Douglas, S., Matear, S. and Greenley, G.E. (2002) Meas-
uring Marketing Capabilities: a Cross-national Study. Joint ANZMAC/EMAC sympo-
sium Marketing Networks in a Global Marketplace. Perth, Australia, December.

105
Carpenter, G. and Nakamoto, K. (1989) Consumer Preference Formation and Pio-
neering Advantage. Journal of Marketing Research. 26(10): 285-298.
Chan, J., Ngai, H. and Ellis, P. (1998) Market orientation and business performance:
some evidence from Hong Kong. International Marketing Review. 15(2): 119-139.
Chen, M. (1994) Sun Tzu’s Strategic Thinking and Contemporary Business. Business
Horizons. 37(2): 42-48.
Clark, B.H. (2000) Managerial perceptions of marketing performance: efficiency,
adaptability, effectiveness and satisfaction. Journal of Strategic Marketing. 8(1): 3-25.
Claycomb, C., Germain, R. and Dröge, C. (2000) The Effects of Formal Strategic Mar-
keting Planning on the Industrial Firm’s Configuration, Structure, Exchange Patterns,
and Performance. Industrial Marketing Management. 29(3): 219-234.
Day, G.S. (1994) The capabilities of market-driven organizations. Journal of Marketing.
58(4): 37-52.
Day, G.S. (1999) The Market Driven Organization: Understanding, Attracting, and
Keeping Valuable Customers. The Free Press.
Diamantopoulos, A. and Siguaw, .A. (2000) Introducing Lisrel. SAGE Publications.
Drucker, P. (1966) The effective executive. Harper & Row.
Fahy, J., Moloney, S. and Mc Aleer, S. (2005) Marketing in the 21st century: A Study of
Marketing Practice and Performance in Ireland. UL/IMI Centre for Marketing Studies.

106
Fahy, J. and Smithee, A. (1999) Strategic Marketing and the Resource Based View of
the Firm. Academy of Marketing Science Review. (10): 1-18.
Fahy, J., Hooley, G.J., Cox, A.J., Beracs, J., Fonfara, K. and Snoj. B.(2000) The devel-
opment and impact of marketing capabilities in Central Europe. Journal of International
Business Studies. 31(1): 63-81.
Finney, S.J. and DiStefano, C. (2006) Non-normal and Categorical Data in Structural
Equation Modeling. In Hancock, G.R. and Mueller, R.O. (editors) Structural Equation
Modeling:A Second Course. Information Age Publishing, Inc.
Han, J.K., Kim, N. and Srivastava, R.K. (1998) Market Orientation and Organizational
Performance: Is Innovation a Missing Link? Journal of Marketing. 62(4):30-45.
Hooley, G. and Greenley, G. (2005) The Resource underpinnings of competitive posi-
tions. Journal of Strategic Marketing. 13(2): 93-116.
Hooley, G., Greenley, G., Fahy, J. and Cadogan, J. (2001) Market-focused Resources,
Competitive Positioning and Firm Performance. Journal of Marketing Management.
17(5-6): 503-520.
Hooley, G.J., Greenley, G., Cadogan, J.W. and Fahy J. (2005) The performance impact
of marketing resources. Journal of Business Research. 58(1): 18-27.
Hooley, G.J., Saunders, J.A. and Piercy, N.F. (1998) Marketing strategy & Competitive
positioning (Second edition). Prentice Hall Europe.

107
Howard, J. A. (1983) Marketing Theory of the Firm. Journal of Marketing. 47(4): 90-
100.
Hunt, S.D. and Lambe, C.J. (2000) Marketing’s contribution to business strategy: market
orientation, relationship marketing and resource-advantage theory. International Journal
of Management Reviews. 2(1): 17-43.
Jaccard, J. and Wan, C.K. (1996) Lisrel approaches to interaction effects in multiple
regression. Sage Publications.
Jacobson, R. (1988) Distinguishing Among Competing Theories of the Market Share
Effect. Journal of Marketing. 52(4): 68-80.
Jaworski, B.J. and Kohli, A.K. (1993) Market Orientation: Antecedents and Conse-
quences. Journal of Marketing. 57(3): 53-70.
Kaplan, R.S. and Norton, D.P. (1992) The balanced scorecard – measures that drive per-
formance. Harvard Business Review. 70(1): 71-79.
Kennie, T. (2006) Strategic Practice Management: How Strategic is Your Plan? XXIII
FIG Congress. Munich, Germany.
Kerin, R., Varadarajan, P. and Peterson, R. (1992) First-Mover Advantage: A Synthesis,
Conceptual Framework, and Research Propositions. Journal of Marketing. 56(4): 33-50.
Kline, R.B. (2005) Principles and Practice of Structural Equation Modeling (2nd edi-
tion). The Guilford Press.

108
Kotler, P. (2003) Marketing management (11th edition). Prentice Hall.
Kotler, P. (1999) Kotler on marketing: How to create, win, and dominate markets. The
Free Press.
Lebas, M. and Euske, K. (2002) A conceptual and operational delineation of perform-
ance. In Neely, A. Business performance measurement: Theory and practice. Cambridge
University Press.
Lieberman, M., Montgomery, D. (1988) First-Mover Advantages. Strategic Manage-
ment Journal. 9: 41-58.
Lieberman, M., Montgomery, D. (1998) First-Mover (Dis)advantages: Retrospective
And Link with the Resource-Based View. Strategic Management Journal. 19(12): 1111-
1125.
Lippman, S. A. and Rumelt, R.P. (1982) Uncertain imitability: An analysis of interfirm
differences in efficiency under competition. Bell Journal of Economics. 13(Autumn):
418-438.
Long, J.S. (1983) Confirmatory Factor Analysis. Sage University Papers. Series: Quanti-
tative Applications in the Social Sciences. Sage Publications.
Marketing Science Institute (2004) Research Priorities 2004-2006: A Guide to MSI Re-
search Programs and Procedures. Available in the Internet:
http://www.msi.org/msi/pdf/MSI_RP04-06.pdf [referenced 2006-29-10].
109
Mathews, J. (2002) Competitive Advantages of the Latecomer Firm: A Resource-Based
Account of Industrial Catch-Up Strategies. Asia Pacific Journal of Management. 19:
467-488.
Matsuno, K., Mentzer, J.T. and Özsomer, A. (2002) The Effects of Entrepreneurial Pro-
clivity and Market Orientation on Business Performance. Journal of Marketing. 66(3):
18-32.
Mayle, D., Hinton, M., Francis, G. and Holloway, J. (2002) What really goes on in the
name of benchmarking? In Neely, A. Business performance measurement: Theory and
practice. Cambridge University Press.
McGovern, G.J., Court, D., Quelch, J.A. and Crawford, B. (2004) Bringing Customers
into the Boardroom. Harvard Business Review. 82(11): 70-80.
Mels, G. (2005) The analysis of continuous data from multiple groups. Available in the
Internet, www.ssicentral.com/lisrel/techdocs/Session7.pdf [referenced 2006-09-06].
Miles, R.E. and Snow, C.C. (1978) Organizational Strategy: Structure and Process.
McGraw-Hill.
Morgan, N.A., Clark, B.H. and Gooner, R. (2002) Marketing productivity, marketing
audits, and systems for marketing performance assessment: Integrating multiple perspec-
tives. Journal of Business Research. 55(5): 363-375.
Narver, J.C. and Slater, S.F. (1990) The Effect of a Market Orientation on Business
Profitability. Journal of Marketing. 54(4): 20-35.

110
Neely, A. (2002) Business performance measurement: Theory and practice. Cambridge
University Press.
Noble, C.H., Sinha, R.K. and Kumar, A. (2002) Market Orientation and Alternative
Strategic Orientations: A Longitudinal Assessment of Performance Implications. Jour-
nal of Marketing. 66(4): 25-39.
Otley, D. (2002) Measuring performance: The accounting perspective. In Neely, A.
Business performance measurement: Theory and practice. Cambridge University Press.
Porter, M. (1980) Competitive Strategy: Techniques for Analyzing Industries and Com-
petitors. The Free Press.
Porter, M. (1985) Competitive Advantage: Creating and Sustaining Superior Perform-
ance. The Free Press.
Proctor, T. (2000) Strategic marketing: an introduction. Routledge.
Pulendran, Speed and Widing II (2003) Marketing planning, market orientation and
business performance. European Journal of Management. 37(3): 476-497.
Rahman, Z., Bhattacharyya, S. (2003) Sources of first mover advantages in emerging
markets – an Indian perspective. European Business Review. 15(6): 361-371.
Reed, R. and DeFillippi, R.J. (1990) Causal Ambiguity, Barriers to Imitation and Sus-
tainable Competitive Advantage. Academy of Management Review. 15(1): 88-102.
Salminen, M. (2006) Innovaatioyrittäjä jää laakereille lepäämään. Kauppalehti.12:18-19.
111
Schumpeter, J.A. (1934) The Theory of Economic Development. Cambride: Harvard
University Press.
Sevin, C.H. (1965) Marketing productivity analysis. McGraw-Hill.
Shankar, V., Carpenter, G., Krishnamurthi, L. (1998) Late Mover Advantage: How In-
novative Late Entrants Outsell Pioneers. Journal of Marketing Research. 35(1): 54-70.
Shoham, A. and Fieganbaum, A. (1999) Extending the Competitive Marketing Strategy
Paradigm: The Role of Strategic Reference Points Theory. Academy of Marketing Sci-
ence. 27(4): 442-454.
Slater, S.F. and Narver, J.C. (1994) Does Competitive Environment Moderate the Mar-
ket Orientation-Performance Relationship? Journal of Marketing. 58(1): 46-55.
Srivastava, R.K., Shervani, T.A. and Fahey, L. (1998) Market-Based Assets and Share-
holder Value: A Framework for Analysis. Journal of Marketing. 62(1): 2-18.
Stoelhorst, J.W. and van Raaij, E.M. (2004) On explaining performance differentials:
Marketing and the managerial theory of the firm. Journal of Business Research. 57: 462-
477.
StratMark (2005) StratMark: Strateginen markkinointi ja markkinoinnin vaikuttavuus.
Research proposal.
Treacy, M. and Wiersema, F. (1993) Customer Intimacy and Other Value Disciplines.
Harvard Business Review. 71(1): 84-93.
112
Tuominen, M. (2003) Business innovation and channel collaboration: driving forces in
firm value delivery. In Tuominen, M. (ed.) Essays on capabilities based marketing and
competitive superiority. HeSE Print.
Tuominen, M., Matear, S., Hyvönen, S., Rajala, A.., Kajalo, S., Möller, K., Greenley,
G.E. and Hooley, G.J. (2005) Market Driven Intangibles: Critical Indicators for Firm
Performance Superiority in Small Open Economies. ANZMAC Conference: Strategic
Marketing and Market Orientation.
Vassinen, A. (2006) The Concept of Strategic Marketing in Marketing Discourse – a
Bibliometric Study. M.Sc. Thesis, Helsinki University of Technology.
Vorhies, D.W. and Morgan, N.A. (2005) Benchmarking Marketing Capabilities for Sus-
tainable Competitive Advantage. Journal of Marketing. 69(1): 80-94.
Walker, O.C., Mullins, J.W., Boyd, H.W. and Larréché, J-C. (2006) Marketing strategy
– a decision-focused approach (5th edition). McGraw-Hill.
Weerawardena, J., O’Cass, A. and Julian, C. (2006) Does industry matter? Examining
the role of industry structure and organizational learning in innovation and brand per-
formance. Journal of Business Research. 59(1): 37-45.
Yli-Kovero, K. (2006) Tuotekehitysjohtaja Mäyrä-Mäkinen jättää pettyneenä Raision.
Helsingin Sanomat. 2006-08-25.
Yliluoma, P.V.J. (1996) Lisrel. IMDL.

113
Appendix A – Survey QuestionnaireMARKETING IN THE 21ST CENTURY
Q1: Here are a number of statements other managers have madeabout the markets in which they operate. Thinking about the main mar-ket or industry in which you operate, how far do the following describethat market? Please write in the number from the scale below closest toyour views. If you have no opinion or don’t know please write ‘X’
StronglyDisagree
Disagree Neither Ag-ree nor Di-
sagree
Agree StronglyAgree
No Opinionor Don’tKnow
1 2 3 4 5 X
In Our Main Markets:
Customers are increasingly demanding better quality and reliability in the productsand services they buy
c
New products and services are coming to market more quickly than in the past cThe Internet and e-commerce is having a significant impact on business practices c
Competition is now global rather than just domestic cCustomer wants, needs and expectations are changing rapidly c
We operate in a market where all customers want essentially the same thing cCompetition for sales is intense c
Competition is well established and entrenched cThere is a significant threat that new firms will enter the market c
There is a significant threat that substitute products or technologies will enter themarket
c
Technological change in this industry is rapid cThe bargaining power of suppliers to the industry is strong c
Q2: Which of the following best describes the main market or industryin which you operate? Please tick ONE box only.
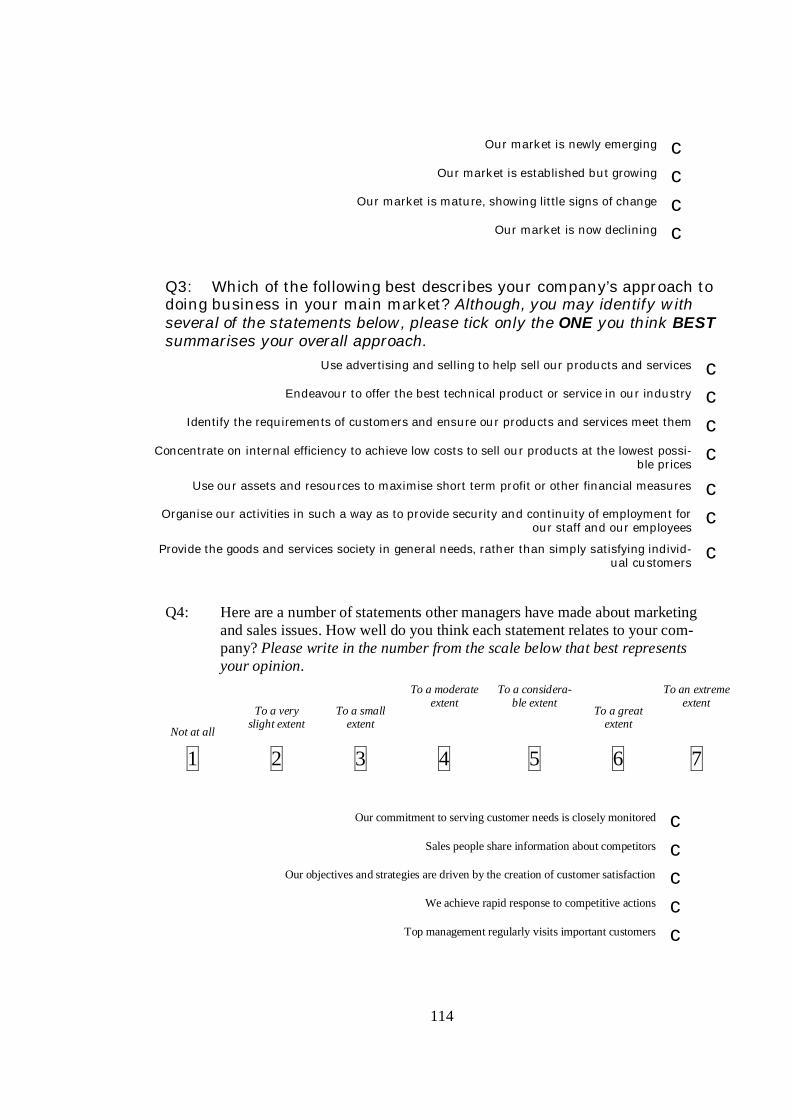
114
Our market is newly emerging cOur market is established but growing c
Our market is mature, showing little signs of change cOur market is now declining c
Q3: Which of the following best describes your company’s approach todoing business in your main market? Although, you may identify withseveral of the statements below, please tick only the ONE you think BESTsummarises your overall approach.
Use advertising and selling to help sell our products and services cEndeavour to offer the best technical product or service in our industry c
Identify the requirements of customers and ensure our products and services meet them cConcentrate on internal efficiency to achieve low costs to sell our products at the lowest possi-
ble pricesc
Use our assets and resources to maximise short term profit or other financial measures cOrganise our activities in such a way as to provide security and continuity of employment for
our staff and our employeesc
Provide the goods and services society in general needs, rather than simply satisfying individ-ual customers
c
Q4: Here are a number of statements other managers have made about marketingand sales issues. How well do you think each statement relates to your com-pany? Please write in the number from the scale below that best representsyour opinion.
Not at all
To a veryslight extent
To a smallextent
To a moderateextent
To a considera-ble extent
To a greatextent
To an extremeextent
1 2 3 4 5 6 7
Our commitment to serving customer needs is closely monitored cSales people share information about competitors c
Our objectives and strategies are driven by the creation of customer satisfaction cWe achieve rapid response to competitive actions c
Top management regularly visits important customers c

115
Information about customers is freely communicated throughout the company cCompetitive strategies are based on understanding customer needs c
Business functions are integrated to serve market needs cBusiness strategies are driven by increasing value for customers cCustomer satisfaction is systematically and frequently assessed c
Close attention is given to after sales service cTop management regularly discuss competitors’ strengths and weaknesses c
Our managers understand how employees can contribute to value for customers cCustomers are targeted when we have an opportunity for competitive advantage c
Q5: Here are some other statements managers have made about theirbusiness approach. How far do the following statements describe yourcompany’s approach in your main market? Please write in the numberfrom the scale below closest to your views.
StronglyDisagree
Disagree Neither Agree StronglyAgree
NoOpinion
1 2 3 4 5 XOur main focus has been on winning market share from competitors c
We are prepared to sacrifice short term profitability to gain market share cOver the last few years we have been aiming to build our long term position in the market c
Resource allocation generally reflects long term rather than short term considerations cOur main focus has been on expanding the total market for our products and services c
Our main strategic priority over the last few years has been to survive cOur main focus has been on cost reduction and efficiency gains c
Our objectives are driven by creating shareholder wealth cSenior managers have regular meetings with shareholders c
We regularly compare our share value to that of our competitors cWe regularly carry out public relations aimed at shareholders c
Designated managers have responsibility for aiming to satisfy shareholders’ interests c

116
We have regular staff appraisals in which we discuss employees needs cWe have regular staff meetings with employees c
As a manger I try to find out the true feelings of my staff about their jobs cWe survey staff at least once each year to assess their attitudes to their work c
Managers agree that our company’s ability to learn is the key to competitive advantage cEmployee training and learning is seen as an investment rather than an expense cThe underlying values of our company include learning as a key to improvement c
Our staff realise that our perceptions of the marketplace must be continually questioned cWe are more innovative than our competitors in deciding what methods to use in achieving
our targets and objectivesc
We are more innovative than our competitors in initiating new procedures or systems cWe are more innovative than our competitors in developing new ways of achieving our tar-
gets and objectivesc
We are more innovative than our competitors in initiating changes in the job contents andwork methods of our staff
c
Q6: Here is a list of marketing assets and capabilities supplied byother managers. Please indicate on which of these you believe yourcompany has an advantage over competitors and on which competitorshave an advantage over you. Can you please also indicate which of theseyou think are most important in your market. Please tick up to FIVEmost important factors for your company
Strong Compe-titors’ Advan-
tage Competitors’Advantage No Difference
Our Advanta-ge
Our StrongAdvantage Don’t Know
1 2 3 4 5 XAdvantage
ScoreImportance
(tick up to 5)
Company or brand name and reputation c cCredibility with customers due to being well established in the market c c
Superior levels of customer service and support c cRelationships with key target customers c c
Cost advantage in production c cSuperior marketing information systems c c
Superior cost control systems c cCopyrights and patents c c

117
Good relationships with suppliers c cExtent or nature of the distribution network c c
The uniqueness of our distribution approach c cRelationships with distribution channel intermediaries c c
Market access through strategic alliances or partnerships c cShared technology through strategic alliances or partnerships c c
Access to strategic partners’ managerial know-how and expertise c cAccess to strategic partners’ financial resources c c
Strong financial management c cEffective human resource management c c
Good operations management expertise c cGood marketing management ability c c
Good at using information about markets, customers and competitors c cGood at understanding what customer needs and requirements are c c
Good at creating relationships with key customers or customer groups c cGood at maintaining and enhancing relationships with key customers c c
Ability to launch successful new products c cGood at setting prices which attract customers and achieve financial goals c c
Good at communicating internally across the organisation c cEffective new product/service development processes c c
Ability to manage relationships with suppliers c cGood at pooling expertise with strategic partners c c
Good at sharing mutual trust with strategic partners c cGood at sharing mutual commitment and goals with strategic partners c c
Q7: Which of the following best describes your position in your mainmarket? Please tick ONE box only.
The only company in the market cOverall Market Leader (largest market share) c
Market Challenger (close second or third largest market share) cMarket Follower (smaller market share) c
Niche Leader (largest market share in chosen market segment) cNiche Challenger (close second or third in chosen market segment) c
Niche Follower (lower market share in chosen market segment) c

118
Q8: Thinking now about your marketing strategy in your main market.Please indicate how far you agree with each of the following statementsusing the scale:
StronglyDisagree
Disagree Neither Agree StronglyAgree
NoOpinion
1 2 3 4 5 X
Our objectives are to defend our current market position cOur objectives are to gain steady sales growth c
Our objectives are to achieve aggressive sales growth to dominate our market cWe seek to attack the whole market c
We target selected market segments within the total market cWe seek to serve selected individual customers within the total market c
We seek to differentiate our products and services from competitors in themarket
c
We aim to be the lowest cost producer in our industry c
Q9: Can you now please tell us how your products and services compare tothose of your main competitors, on the following factors. Please use thefollowing scale. The terms ‘lower’ or ‘higher’ are not intended to imply in-ferior or superior, merely a different competitive positioning in the market:
Much Lo-wer than
Competitors Lower thanCompetitors
The same asCompetitors
Higher thanCompetitors
MuchHigher thanCompetitors
Don’t Know
1 2 3 4 5 XPlease also indicate which of these factors are the most important in po-sitioning your products and services against your main competitors.Please tick the THREE most important factors for your positioning.
Comparison Importance
The technical quality of our products and services c cThe level of customer service and support provided c c
The strength of the relationships we have with our customers c c

119
The price levels charged for our products and services c cThe degree of innovation in our products and services c c
The uniqueness of our products and services c cThe degree of customisation to individual customer requirements c c
The speed of delivery to our customers c cThe degree of responsiveness to customer enquiries and requests c c
Q10: Do you believe your company has a competitive advantage over itsmarket place rivals? If so, how do you go about protecting and enhanc-ing this advantage? Please use the scale below:
StronglyDisagree
Disagree Neither Agree
StronglyAgree
No Opinion
1 2 3 4 5 XOur products and services are highly valued by our customers creating a
barrier against competitor products and servicesc
There would be significant costs for customers if they switched from ourproducts and services to those of competitors
c
Our competitive advantage is difficult for competitors to copy because ituses resources only we have access to
c
It took time to build our competitive advantage and competitors wouldfind it time-consuming to follow a similar route
c
Competitors find it difficult to see how we created our competitive advan-tage in the first place
c
Competitors could copy our competitive advantage but it would be uneco-nomic for them to do so
c
We protect our advantage legally through copyrights and patents cOur employees are the source of our competitive advantage and we ensure
we won’t lose them to competitorsc
Competitors would find it difficult to acquire the managerial capabilitiesneeded to create a similar competitive advantage
c
Q11: Thinking now about how you go about your marketing, how far wouldyou agree with the following statements? Please use the scale below:
StronglyDisagree
Disagree Neither Agree StronglyAgree
NoOpinion
1 2 3 4 5 X
We make extensive use of market research c

120
Our market research is focussed on understanding customer needs and re-quirements
c
We generally try to standardise our offerings so they can sell across severalmarkets
c
We customise our products and services so that they meet the requirementsof individual customers
c
We are investing in creating strong well known brands in the minds of cus-tomers
c
Company and brand reputation are more important to our customers thankeeping prices down
c
We do no new product development cWe actively develop new products and services to lead the market c
We place great emphasis on building long term relationships with key cus-tomers
c
We regularly monitor and analyse the level of customer satisfaction achieved cWe regularly communicate internally about our objectives and strategies c
We adopt an internal marketing approach whereby one part of our organisa-tion is seen as the internal customer to other internal suppliers
c
We set prices on the basis of costs of producing plus a fixed margin for profit cWe set prices based on what the market is prepared to pay c
We distribute our products direct to our customers cWe use wholesalers and/or retailers to distribute our products c
We make extensive use of media advertising cWe make extensive use of the Internet for promoting our products and ser-
vicesc
The main source of promotion we use is our sales force cWe place great emphasis on building long term relationships with key suppli-
ersc
We place great emphasis on building long term relationships with other or-ganisations and institutions influencing buyers’ purchasing decisions
c
Q12: In your last financial year, how well did your company performcompared with your main competitors on the following criteria? Howwell did your company perform relative to the previous financial year?For both of these questions please use the scale below. Can you also tellus which are the most important measures of performance in your com-pany. Please tick the FIVE most important factors as far as your companyis concerned..

121
Much Worse Worse The same Better Much Better Don’t Know
1 2 3 4 5 XRelative to
main compe-titors
Relative tolast financial
year
Importance(tick up to
five factors)
Overall Profit Levels Achieved c c cProfit Margins Achieved c c c
Return on Investment c c cSales Volume Achieved c c cMarket share achieved c c c
Levels of customer satisfaction achieved c c cLevels of customer loyalty achieved c c c
Levels of employee satisfaction with their jobs c c cLevels of employee retention c c c
Providing employment and income locally c c cShareholder satisfaction with financial performance c c c
Q13: Can you please now tell us a little more about your company.Which of the following best describes the main industry your companyoperates in. Please tick ONE only:
Consumer Durables c Capital Industrial Equipment cFast Moving Consumer Goods (FMCG) c Business Services c
Materials and Components c Consumer Services cOther c
Q14: What is the approximate number of employees in your company inthe UK?
Less than 20 c 300-499 c More than 5000 c20-99 c 500-999 c Don’t Know c
100-299 c 1000-4999 c
Q15: What was the approximate turnover and pre-tax profit of yourcompany in the UK in your last financial year? Please write in:
Turnover: £ ___________________ Pre-tax Profit: £____________________
Thank you very much for your time and your help.

122
Appendix B – List of Indicators per FactorThe bolded indicators are those included to final universal structural model.
IndicatorRV020 Our commitment to serving customer needs is closely monitoredRV021 Sales people share information about competitorsRV022 Our objectives and strategies are driven by the creation of customer satisfactionRV023 We achieve rapid response to competitive actionsRV024 Top management regularly visits important customersRV025 Information about customers is freely communicated throughout the companyRV026 Competitive strategies are based on understanding customer needsRV027 Business functions are integrated to serve market needsRV028 Business strategies are driven by increasing value for customersRV029 Customer satisfaction is systematically and frequently assessedRV030 Close attention is given to after sales serviceRV031 Top management regularly discuss competitors’ strengths and weaknessesRV032 Our managers understand how employees can contribute to value for customersRV033 Customers are targeted when we have an opportunity for competitive advantage
Market Orientation
Seven-point scale anchored at 1 = “not at all” and 7 = “to a great extent”
IndicatorRV073 We are more innovative than our competitors in deciding what methods to use in
achieving our targets and objectivesRV074 We are more innovative than our competitors in initiating new procedures or systemsRV075 We are more innovative than our competitors in developing new ways of achieving
our targets and objectivesRV076 We are more innovative than our competitors in initiating changes in the job content
and work methods of our staff
Innovation Orientation
Five-point scale anchored at 1 = “strongly disagree” and 5 = “strongly agree”
Indicator Inside-Out CapabilitiesRV109 Strong financial managementRV110 Effective human resource managementRV111 Good operations management expertiseRV113 Good marketing management ability
Five-point scale anchored at 1 = “strong competitor’s advantage” and 5 = “our strong advantage”
IndicatorRV116 Good at using information about markets, customers and competitorsRV117 Good at understanding what customer needs and requirements areRV119 Good at creating relationships with key customers or customer groupsRV120 Good at maintaining and enhancing relationships with key customers
Outside-In Capabilities
Five-point scale anchored at 1 = “strong competitor’s advantage” and 5 = “our strong advantage”

123
IndicatorRV189 Our products and services are highly valued by our customers creating a barrier
against competitor products and servicesRV190 There would be significant costs for customers if they switched from our products
and services to those of competitorsRV191 Our competitive advantage is difficult for competitors to copy because it uses
resources only we have access toRV193 It took time to build our competitive advantage and competitors would find it time-
consuming to follow a similar routeRV194 Competitors find it difficult to see how we created our competitive advantage in the
first placeRV195 Competitors could copy our competitive advantage but it would be uneconomic for
them to do soRV197 We protect our advantage legally through copyrights and patentsRV199 Our employees are the source of our competitive advantage and we ensure we won’t
lose them to competitorsRV200 Competitors would find it difficult to acquire the managerial capabilities needed to
create a similar competitive advantage
Competitive Advantage
Five-point scale anchored at 1 = “strongly disagree” and 5 = “strongly agree”
IndicatorRV228 Sales volume achieved relative to main competitorsRV229 Market share achieved relative to main competitors
Market Performance
Five-point scale anchored at 1 = “much worse” and 5 = “much better”
IndicatorRV225 Profit Margins Achieved relative to main competitorsRV226 Return on Investment relative to main competitorsRV227 Overall Profit Margins Achieved relative to main competitors
Financial Performance
Five-point scale anchored at 1 = “much worse” and 5 = “much better”

124
Appendix C – Goodness of Model Fit Indexes
All fit index descriptions are adapted from Kline (2005).
RMSEA =)1(
ˆ
−NdfM
Mδ
where M = max( 2M-dfM, 0). RMSEA can be interpreted as “error of approximation”.
Value of zero indicates the best fit and higher values indicate worse fit.
GFI = totres VV /1−
where Vres refers to unexplained variability in sample covariance matrix and Vtot to total
variability in sample covariance matrix. GFI is analogous to a squared multiple correla-
tion (R2); GFI = 1.0 indicates perfect model fit, and GFI > 0.9 indicates good fit.
NNFI = BM NCNC /1−
where NC refers to normed chi-square in researcher’s model (M) and in independence
model (B). The bigger the NNFI, the better.
CFI = BM δδ ˆ/ˆ1−
where M and B estimate the non-centrality parameter of a non-central chi-square distri-
bution for, respectively, the researcher’s model and the baseline model. CFI = 1.0 means
that 2M < dfM and not that the model has perfect fit.

125
Appendix D – Discriminant and Convergent Validity
Validity of the final model of international sample
Construct Variable Factor1 Factor2 Factor3 Factor4 Factor5 Factor6 Factor7RV074 0.85 0.12 0.09 0.15 0.06 0.08 0.09RV075 0.85 0.15 0.08 0.15 0.07 0.10 0.10RV073 0.82 0.12 0.09 0.14 0.10 0.08 0.09RV076 0.75 0.15 0.09 0.16 0.05 0.02 0.07RV022 0.00 0.77 0.01 0.03 0.08 0.06 0.02RV028 0.07 0.77 0.04 0.04 0.03 0.04 0.02RV026 0.12 0.77 0.03 0.04 0.08 0.03 0.06RV027 0.15 0.74 0.07 0.06 0.05 -0.03 0.05RV032 0.21 0.65 0.06 0.21 0.05 0.05 0.02RV226 0.11 0.06 0.87 0.14 0.07 0.16 0.03RV225 0.11 0.05 0.83 0.17 0.05 0.23 0.04RV227 0.09 0.08 0.82 0.13 0.07 0.15 0.06RV111 0.13 0.12 0.08 0.78 0.12 0.08 0.02RV110 0.18 0.16 0.10 0.76 0.07 0.05 0.02RV109 0.09 0.00 0.26 0.72 0.05 0.01 0.10RV113 0.23 0.06 0.05 0.61 0.19 0.20 0.12RV120 0.09 0.14 0.11 0.17 0.90 0.06 0.04RV119 0.14 0.13 0.07 0.18 0.90 0.07 0.04RV229 0.11 0.07 0.25 0.15 0.07 0.85 0.12RV228 0.12 0.06 0.31 0.12 0.07 0.83 0.03RV191 0.16 0.05 0.03 0.05 0.02 0.04 0.85RV193 0.11 0.07 0.09 0.12 0.05 0.09 0.84
Rotated Factor Pattern
Innovationorientation
Marketorientation
Financialperformance
Competitiveadvantage
Inside-outcapabilities
Outside-incapabilities
Marketperformance

126
Appendix E – Item-to-total Correlations and Cronbach'sAlphas
Correlations and alphas for the final international model
Construct Variable Correlation with Total Cronbach's AlphaRV022 0.61RV026 0.63RV027 0.61RV028 0.62RV032 0.55RV073 0.74RV074 0.79RV075 0.80RV076 0.65RV109 0.54RV110 0.60RV111 0.62RV113 0.51RV119 0.77RV120 0.77RV191 0.51RV193 0.51RV225 0.75RV226 0.78RV227 0.69RV228 0.68RV229 0.68
CompetitiveAdvantage
FinancialPerformance
MarketPerformance
MarketOrientation
InnovationOrientation
Inside-outCapabilities
Outside-inCapabilities
0.67
0.81
0.86
0.81
0.88
0.77
0.87

127
Appendix F – Goodness of Model Fit Indexes
Country Chi^2 N RMSEA CFI NNFI GFIAustralia 373.54 250 0.063 0.95 0.94 0.88Austria 371.61 249 0.063 0.95 0.94 0.88China 437.15 400 0.058 0.95 0.94 0.91Finland 436.95 327 0.064 0.96 0.95 0.89Germany 393.69 400 0.052 0.97 0.97 0.92Greece 397.96 326 0.059 0.96 0.96 0.90Hong Kong 517.70 552 0.056 0.96 0.96 0.92Hungary 536.51 572 0.057 0.97 0.96 0.92Ireland 592.00 657 0.057 0.96 0.95 0.92The Netherlands 325.92 176 0.065 0.91 0.89 0.86New Zealand 487.39 472 0.058 0.95 0.94 0.91Slovenia 450.79 759 0.043 0.98 0.98 0.95United Kingdom 541.95 487 0.062 0.96 0.95 0.91
Group Chi^2 N RMSEA CFI NNFI GFIWhole sample 1617.75 5627 0.037 0.99 0.98 0.97"Cheap" countries 775.81 1731 0.043 0.98 0.98 0.96"Expensive" countries 780.80 1224 0.051 0.97 0.96 0.95

128
Appendix G – Square Multiple Correlations of StructuralEquations
Country Competitive Advantage Market Performance Financial PerformanceAustralia 0.11 0.19 0.28Austria 0.26 0.15 0.26China 0.20 0.19 0.74Finland 0.27 0.31 0.18Germany 0.16 0.20 0.53Greece 0.18 0.22 0.46Hong Kong 0.17 0.24 0.67Hungary 0.18 0.28 0.47Ireland 0.13 0.21 0.42Netherlands 0.10 0.24 0.45New Zealand 0.08 0.29 0.35Slovenia 0.17 0.29 0.50United Kingdom 0.08 0.17 0.41
Group Competitive Advantage Market Performance Financial PerformanceWhole sample 0.16 0.22 0.43"Cheap" countries 0.21 0.27 0.52"Expensive" countries 0.15 0.24 0.30

129
Appendix H – Descriptive Indicator Comparison
DifferenceConstruct Variable Mean Std Dev Mean Std Dev Mean
RV022 6.41 0.85 5.36 1.29 -1.05RV026 5.98 1.01 5.05 1.30 -0.93RV027 5.45 1.13 4.75 1.35 -0.70RV028 6.11 1.01 4.81 1.39 -1.30RV032 5.28 1.13 4.76 1.34 -0.52RV073 3.30 0.90 3.55 0.94 0.25RV074 3.32 1.01 3.51 0.94 0.19RV075 3.35 0.90 3.52 0.89 0.17RV076 3.19 0.98 3.38 0.95 0.19RV109 3.32 0.84 3.41 0.92 0.09RV110 3.17 0.76 3.37 0.83 0.20RV111 3.39 0.77 3.56 0.81 0.17RV113 3.11 0.91 3.41 0.88 0.30RV119 3.67 0.81 3.86 0.79 0.19RV120 3.78 0.79 3.88 0.79 0.10RV191 3.12 1.18 2.88 1.11 -0.24RV193 3.60 1.02 3.24 1.03 -0.36RV225 3.34 1.00 3.40 0.97 0.06RV226 3.31 1.01 3.36 0.93 0.05RV227 3.23 1.05 3.34 0.96 0.11RV228 3.19 1.00 3.41 0.96 0.22RV229 3.29 0.96 3.41 0.89 0.12
Marketperformance
Inside-outcapabilities
Outside-incapabilitiesCompetitiveadvantages
Financialperformance
International sampleFinland
MarketOrientation
InnovationOrientation
Variables RV022-RV032: Scale 1-7Variables RV073-RV229: Scale 1-5
Related Documents