Market ing Resear ch Report May 18 2012 Title page, Table of contents, Executive summary, Research Objectives, Concise statement of method, Summary of key findings, Conclusion and recommendations, Introduction, Research method and procedures, Data analysis and findings, Bibliography PS3 vs. Xbox 360

Welcome message from author
This document is posted to help you gain knowledge. Please leave a comment to let me know what you think about it! Share it to your friends and learn new things together.
Transcript

Marketing Research Report
May 18
2012Title page, Table of contents, Executive summary, Research Objectives, Concise statement of method, Summary of key findings, Conclusion and recommendations, Introduction, Research method and procedures, Data analysis and findings, Bibliography
PS3 vs. Xbox 360
Table of contents………….
1. Title page 2. Table of contents3. Executive summary
A. Research Objectives B. Concise Statement of methodC. Summary of Key FindingsD. Conclusions & Recommendations
4 Introduction5 Research Method and procedures 6 Data analysis and findings7 Conclusions and Recommendations8 Bibliography
Executive summary
Research Objectives –
To collect behavioral, demographic and socioeconomic data as well as to try and get a better grasp
of the consumer motivation in the purchase of the two biggest game consoles on the market Sony’s
PS3 and Microsoft’s Xbox 360. Also to make an attempt to answer questions such as
How willing are these users to adapt to new technological advances?
What is the demographic profile of these “console” players?
How frequently do they play?
Is price a factor when it comes to online gaming?
What improvements should be made regarding Xbox 360 or PS3?
How long have they been playing video games?
What are the benefits of each game console?
What type of games do they prefer?
How much would they be willing to pay for online gaming?
Concise Statement of method-
Research Method-Quantitative, Exploratory and Descriptive
Sample size-200
Total respondents-88
Target Population-The target population consists of teens and adults who are current
gaming console owners and/or previous console owners. The age ranges of the subjects go
from 18-45 because according to the ESA the bulk of “gamers” are in this age range.
The Questionnaire was self-administered . The respondents filled out the survey in the
privacy of their home without the presence of an interviewer whether it was handed out in
person, or via email/social networking sites.
Summary of Key Findings-
65% of the respondents have been playing video games for over 15 years
A majority believe PS3 is a more reliable game console (which shows that there is a
negative perception of Xbox 360)
A majority of the respondents believe that Xbox 360 has a more reliable online gaming
network (which gives PS3 something to improve in)
A majority of respondents are willing to pay 20-50 dollars for online gaming services
(which means they value it and that free isn’t always better)
Exclusive titles were a major factor in the purchase of these consoles
Demographics
Over half of the respondents had a household income ranging from under $15,000 to
$24,999
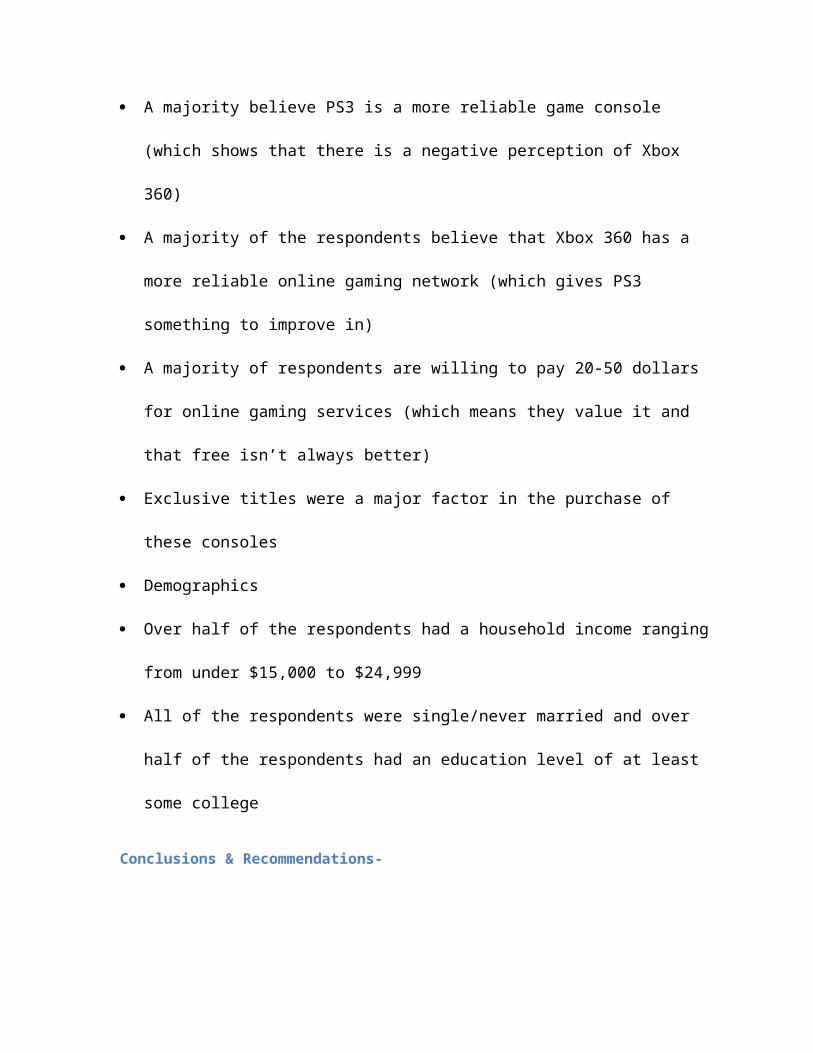
All of the respondents were single/never married and over half of the respondents had
an education level of at least some college
Conclusions & Recommendations-
Being PS3 isn’t so far behind Xbox 360 in sales figures I believe that people viewing PS3 as a more
reliable console will be one of the factors that end up pushing it past Xbox 360 in sales figures. As far
as recommendations go PS3 should improve its online gaming network in terms of presentability,
efficiency, and reliability. As far as Xbox 360 goes it should focus on improving its image and
perception of reliability.

Introduction
The purpose of this research project is to collect behavioral, demographic and
socioeconomic data as well as to try and get a better grasp of the consumer motivation in the
purchase of the two biggest game consoles on the market Sony’s PS3 and Microsoft’s Xbox 360.
My belief is that Sony’s PS3 will surpass Microsoft’s Xbox 360’s market share if Xbox 360 does
not improve the quality & perception of their game consoles. Some of the questions I was
looking to answer were as follows:
1 Which game console is selling more?
2 How willing are these users to adapt to new technological advances?
3 What is the demographic profile of these “console” players?
4 How frequently do they play?
5 Is price a factor when it comes to online gaming?
6 What improvements should be made regarding Xbox or PS3?
7 How long have they been playing video games?
What are the benefits of each game console?
What type of games do they prefer?
How much would they be willing to pay for online gaming?

How often do they go out during the week?
What was the previous game console you owned?
What is your perception of each gaming console?
Do you use your console for anything other than gaming?
What is your perception of the companies that manufacture these consoles?
This is some background information on the gaming industry provided Via the ESA;
According to a study released by the ESA (Entertainment Software Association) in 2011 (Ipsos
MediaCT, 2011)
72% of American households play computer or video games
Eighty-two percent of gamers are 18 years of age or older.
Of the most frequent game purchasers, 52% are male and 48% are female
Forty-two percent of all players are women.
12 is the average number of years adult gamers have been playing computer or video games
What about the numbers? You might ask, as far as the numbers go, sales say a lot and these are the
sales figures for Xbox 360 and PS3
Sales figures - 65.8 million units sold as of 12 January 2012 (Q2. Microsoft., 2012)
Sales Figures - 62 million units sold as of 31 December 2011 (Inc.., 2011)
Research Method and procedures
Research Design used-Quantitative, Exploratory and Descriptive
The study will be descriptive because many questions focus on identifying perceived
awareness, attitudes, and consumer habits’ of each person. It will be exploratory since it is
looking for the perceived strengths and weaknesses of each game console and looking how
each console can adapt or adjust to beat out its competitor. It will be quantitative since I
will be conducting surveys to get a better understanding of the individuals in this
marketplace.
Self-administered Questionnaire to males and females from the ages of 18-45.
Sample size-200
Total respondents-88
Target Population-The target population consists of teens and adults who are current
gaming console owners and/or previous console owners. The age ranges of the subjects go
from 18-45 because according to the ESA the bulk of “gamers” are in this age range.
Questions measured:
Perceived awareness
Attitudes
Consumer habits
Perceived strengths and weaknesses of each game console
Demographics-Age, Education, Income, Ethnicity
Secondary Data included-
"Earnings Release FY12 Q2". Microsoft. Retrieved March 11, 2012.
"PlayStation®3 Worldwide Hardware Unit Sales (Unit: million)". Sony Computer
Entertainment Inc.. Retrieved 2012-04-03.
The 2011 Essential Facts About The Computer and Video Game Industry

Data analysis and findings1) How long have you been playing video
gamesFrequency
00
111958
Mode=E Mean= 4.534090909 Median=E2) When was the last time you played a video
game?Frequency
808000
Mode=A Mean= 1.090909091 Median=A3) Graphic quality played a big role in the purchase of your game
consoleFrequency
293722
00
Mode=B Mean=1.090909091 Median=B
4) About how many hours a week do you play console games
Frequency A=30B=20C=26D=12
E=0Mode=A Mean=1.920454545 Median=B
5) Price plays a factor in the purchasing of a game consoleFrequency
A=18B=32C=31
D=7E=0
Mode=b(30) and c(30)Mean=1.920454545
Median=B6) The Xbox 360 is a reliable console
Frequency A=16B=26C=23D=8
E=15Mode=b(27)
Mean=2.227272727Median=3
7) The PS3 is a
reliable console
Frequency
A=23
B=38
C=27
D=0
E=0
Mean=2.227272727
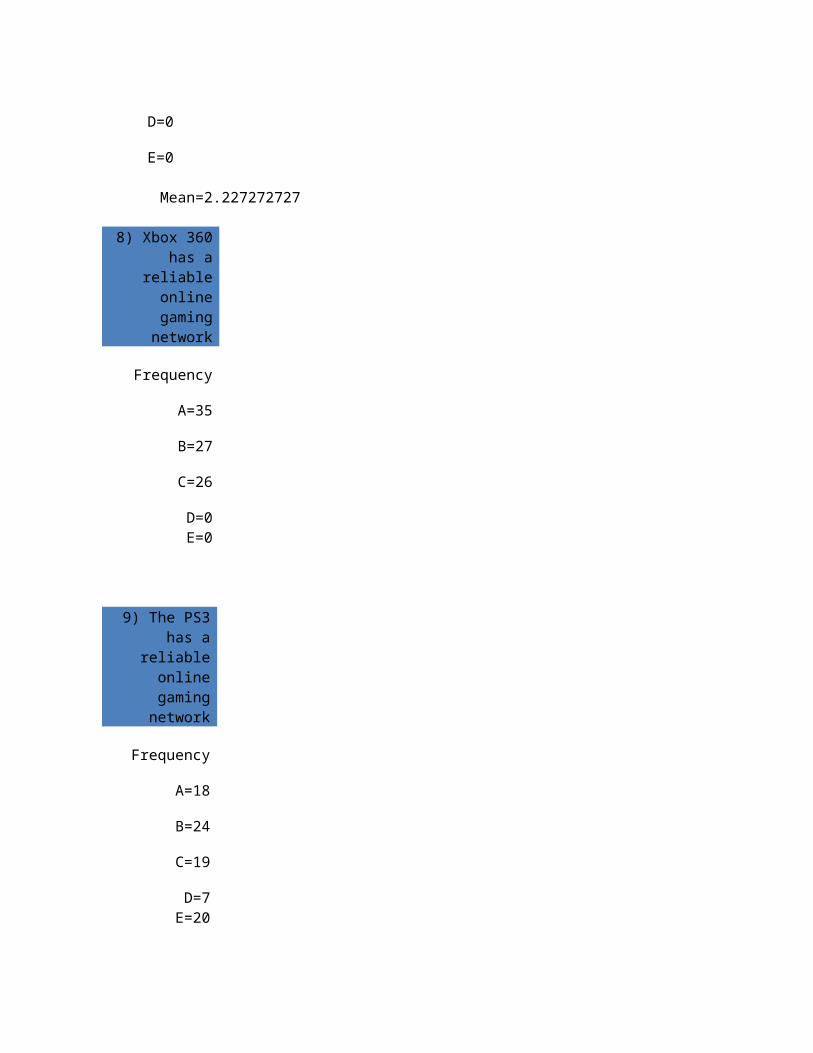
8) Xbox 360 has a reliable online gaming network
Frequency
A=35
B=27
C=26

D=0E=0
9) The PS3 has a reliable online
gaming network
Frequency
A=18
B=24
C=19
D=7E=20
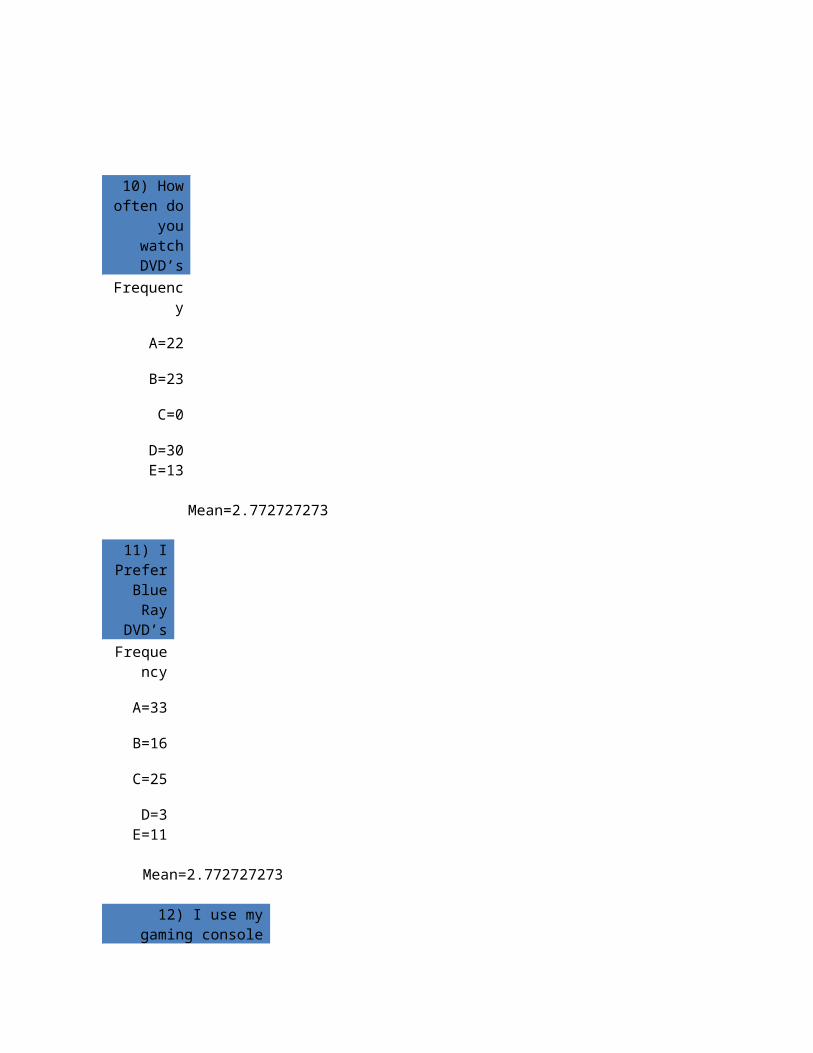
10) How often do
you watch DVD’s
Frequency
A=22
B=23
C=0
D=30E=13
11) I Prefer
Blue Ray DVD’s

Frequency
A=33
B=16
C=25
D=3E=11
Mean=2.772727273
12) I use my gaming console for other things
besides playing video games
Frequency A=35B=35
C=0D=3
E=15
13) Xbox 360 has a better
variety of games
Frequency
A=21
B=17
C=36
D=10
E=4
14) PS3 has a better
variety of games
Frequency
A=11
B=15
C=55
D=4
E=3
15) Xbox has a better variety of
multiplayer games
Frequency
A=25
B=25
C=35
D=3E=0
16) PS3 has a better variety of
single player games
Frequency
A=18
B=12
C=45
D=0E=13
17) How much are you willing to play for online
gaming services (per year)
Frequency A=15
B=0C=14D=40 E=19
18) On PS3 online gaming is Free, This influenced my decision to purchase this
console, how much do you agree with this statement
Frequency A=23B=18
C=7D=12E=28
19) Exclusive titles were a big factor
in my purchase
Frequency
A=11
B=45
C=8

D=8E=16
20) X box 360’s “red rings of death” discouraged me
from purchasing a X box 360Frequency
A=7B=4
C=12D=33E=32
21) What Genre of Games do you play most? (if more than
one check the one that applies the most)
Frequency A=26B=31C=31D=0E=0
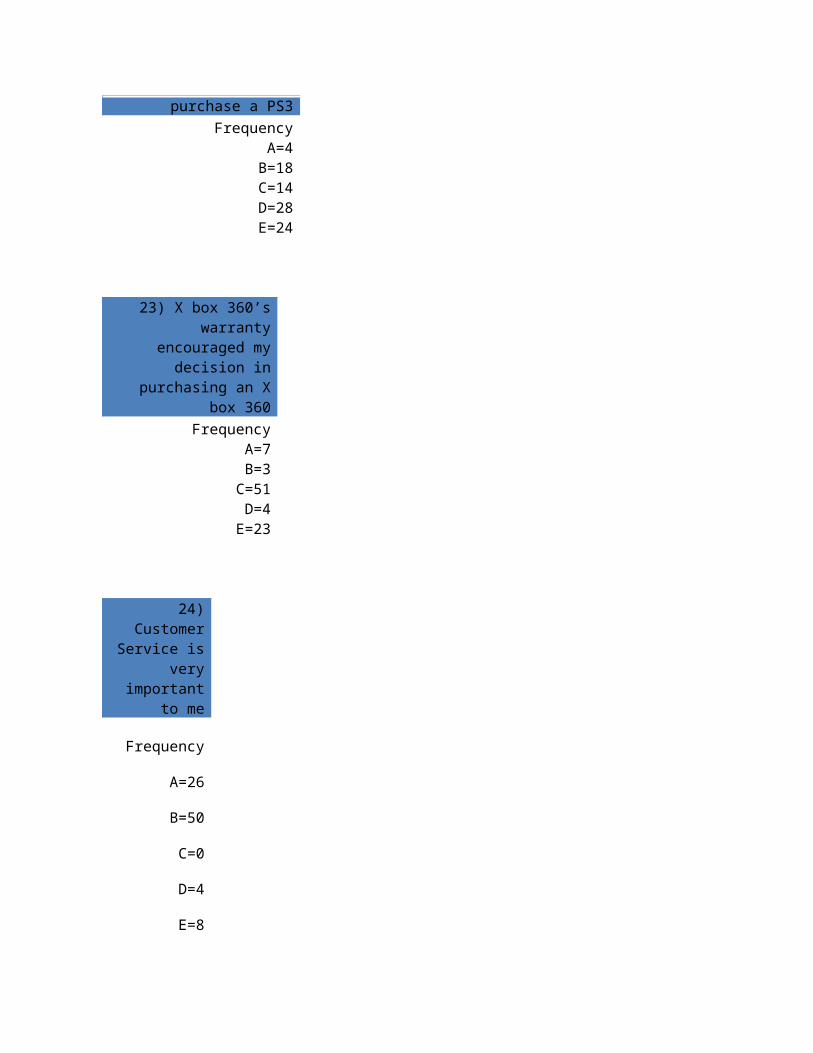
22) PS3 controls are wireless & come with a charger this
encouraged me to purchase a PS3
Frequency A=4
B=18C=14D=28E=24

23) X box 360’s warranty encouraged my decision in
purchasing an X box 360Frequency
A=7B=3
C=51D=4
E=23
24) Customer Service is very
important to me
Frequency
A=26
B=50
C=0
D=4
E=8
25) The Hacking of the PS3 online network discouraged
me from purchasing a PS3Frequency
A=0B=10C=47D=7
E=24
26) Current marital

status:Frequenc
y
A=0
B=88
C=0
D=0
E=0
Mean=2.693181818
27) Total household Income (before taxes)
for the past 12 months:
Frequency
A=24
B=23
C=19
D=15E=7
28) Your
ethnicity:
Frequency
A=34
B=11
C=29
D=7

E=7
Mean=2.18181818
29) Your
education:
Frequency
A=0
B=8
C=47
D=33E=0
Mean=2.181818182
Conclusions and Recommendations
Being PS3 isn’t so far behind Xbox 360 in sales figures I believe that people viewing PS3 as a more
reliable console will be one of the factors that end up pushing it past Xbox 360 in sales figures. As far
as recommendations go PS3 should improve its online gaming network in terms of presentability,
efficiency, and reliability. As far as Xbox 360 goes it should focus on improving its image and
perception of reliability.
Appendixes
Works CitedInc.., P. W. (2011, December 31). (http://www.scei.co.jp/corporate/data/bizdataps3_sale_e.html). Retrieved from (http://www.scei.co.jp/corporate/data/bizdataps3_sale_e.html): (http://www.scei.co.jp/corporate/data/bizdataps3_sale_e.html)
Ipsos MediaCT. (2011). The 2011 Essential Facts About the Computer and Video Game Industry . ESA.
Q2. Microsoft., E. R. (2012, March 11). http://www.microsoft.com/investor/EarningsAndFinancials/Earnings/SegmentResults/EntertainmentAndDevicesDivision/FY12/Q2/Kpi.aspx). Retrieved from http://www.microsoft.com: http://www.microsoft.com/investor/EarningsAndFinancials/Earnings/SegmentResults/EntertainmentAndDevicesDivision/FY12/Q2/Kpi.aspx)
Related Documents