Marketing in successful agri-food Small and Medium Sized Enterprises in the North of England. by Konstantinos Tsorbatzoglou A thesis submitted to the University of Newcastle upon Tyne for the degree of Doctor of Philosophy No portion of the work referred to in this thesis has been submitted in support of an application for any other degree or qualification from this or any other University or Institute of learning. NEWCASTLE UNIVERSITY LIBRARY ---------------------------- zoo 10037 6 ---------------------------- Thesic' Lb7o$ June 2000

Welcome message from author
This document is posted to help you gain knowledge. Please leave a comment to let me know what you think about it! Share it to your friends and learn new things together.
Transcript
Marketing in successful agri-food Small and Medium Sized Enterprises in the North
of England.
by
Konstantinos Tsorbatzoglou
A thesis submitted to the University of Newcastle upon Tyne
for the degree of Doctor of Philosophy
No portion of the work referred to in this thesis has been submitted in support of an
application for any other degree or qualification from this or any other University or
Institute of learning.
NEWCASTLE UNIVERSITY LIBRARY ----------------------------
zoo 10037 6 ----------------------------
Thesic' Lb7o$
June 2000
1
ABSTRACT
Small and Medium sized Enterprises (SMEs) are vital components of many economic
sectors including agri-food. However, due to their nature, SMEs face a number of
developmental problems in their growth stages, including a lack of formalised marketing.
Improving marketing is thus a potential source of competitive advantage for the industry
and is therefore of policy interest to the Ministry of Agriculture Fisheries and Foods
(MAFF). This research is an attempt to understand SMEs marketing and identify the
successful patterns of agri-food SMEs in the North of England, in terms of their marketing
practices.
The comparative, integrated model to marketing research, blending the process model with
the contingency approach was employed. Both quantitative and qualitative techniques from
the transactional and relational marketing literature were used in order to examine twenty
hypotheses, and test the marketing practices of agri-food SMEs, and their influence on
performance. Furthermore, the ownership status effect (subsidiary or independent) on
marketing of SMEs was examined. Then, five cases were analysed to verify the survey's
results, and gain a deeper understanding of how and why marketing is practised the way
that it is, in successful agri-food SMEs.
This research provided evidence to suggest that agri-food SMEs differ from other SMEs in
terms of their marketing orientation. It also provided evidence to suggest that the most
successful have a very good understanding of the fundamental marketing principles.
Moreover, it showed that marketing practices differ between subsidiary and independent
SMEs, in three marketing areas, namely Strengths Weaknesses Opportunities Threats
(SWOT) analysis, strategic focus, company/brand reputation. There is also an
11
environmental difference between the two groups namely European or government
regulation posing a threat to the survival of the company.
The case studies showed that most successful SMEs are product oriented and pay attention
to high quality, variety and service. They all operate on distinct niche markets or have a
niche product in an established market. They are familiar with planning and strategy
concepts, undertake many of them internally and constantly seek to strengthen their
relationship with their customers. Furthermore, the independent companies do not have the
tendency to spend large budgets on marketing research, but try to gain marketing
information from family, friends, their sales-force and their customers. Subsidiaries, on the
other hand, tend to have bigger contracts/accounts, which allow them to get information
from their customers.
The thesis concluded by proposing a model of successful marketing for agri-food SME,
and making recommendations for policy makers. These included the following areas:
1. Emphasis on high product quality, and niche market or product;
2. Control of the marketing effort, by means of regular performance feedback meetings;
and
3. The establishment of an on-going marketing information gathering system, by using all
available employees who are in contact with customers, including van drivers and the
sales-force.

111
ACKNOWLEDGMENTS
I would like to thank my supervisor Dr Andrew Moxey for his support throughout this
project. I would also like to thank the assistance of members of staff of the department of
Agricultural Economics and Food Marketing.
The Ministry of Agriculture, Fisheries and Foods (MAFF) and Mr N. Efthymiadis are
greatly acknowledged for their financial support.
There are a number of colleagues and friends from Hong Kong, UK, Ireland, Mexico,
Denmark, Greece and Australia that I would also like to thank for their support. Your help
is highly appreciated.
Most importantly, I am grateful to my family and friends in Greece for both their financial
and mental support. I love you all.
In memory of my grandmother, Alexandra Tsorbatzoglou, and my godfather Stelios
Sapountzoglou.
iv
TABLE OF CONTENTS
ABSTRACT i
ACKNOWLEDGEMENTS iii
TABLE OF CONTENTS iv
LIST OF TABLES xi
LIST OF FIGURES xx
LIST OF MAP xxi
Chapter 1 INTRODUCTION I
1.1 Introduction 1
1.2 Research objectives and stages 2
1.3 Structure of the thesis 4
Chapter 2 BACKGROUND TO THE STUDY 6
2.1 Introduction 6
2.2 Geographical Characteristics 6
2.3 Political issues of SMEs and the agri-food industry in the UK 7
2.4 Economics of SMEs, the agri-food industry and agri-food SMEs 9
2.4.1 SMEs in the UK 9
2.4.2 The agri-food industry in the UK 12
Agri-food Manufacturing industry 14
Agricultural industry 16
Agri-food Wholesaling industry 17
2.4.3 Agri-food SMEs 17
2.5 Social trends in the agri-food industry 20
V
2.6 Summary 22
Chapter 3 LITERATURE REVIEW 23
3.1 Introduction 23
3.2 The approach 24
3.2.1 Marketing and aari-food marketing: a definition and the state of current
research. 24
3.2.2 Market orientation, the transactional approach. 30
3.2.3 Marketing criticisms; the relational approach 33
3.3 The model 42
3.3.1 Marketing differences between Independent and Subsidiary SMEs 42
3.3.2 Overview of marketing approaches for SMEs 47
3.3.3 Critique of the approaches 52
3.3.4 The integrated model 54
3.4 Conclusions 55
Chapter 4 METHODOLOGY 56
4.1 Introduction 56
4.2 Research rationale 56
4.3 Research questions 57
4.4 Research objectives 58
4.5 Significance of research 58
4.6 Research methodology 59
4.6.1 Stage one: Descriptive research 60
Research design 60
vi
Sampling frame design 61
Sample size determination 62
Sample selection 63
The Instrument 66
Questionnaire administration 68
Data analysis 68
Summary 69
4.6.2 Stage two: Case studies and personal interviews 70
Research design 71
Evaluation of research method 71
Sampling plan 72
The Instrument 73
Analytical method 73
Contribution to the thesis 74
4.7 Conclusions 75
Chapter 5 HYPOTHESES RATIONALE 76
5.1 Intro duction 76
5.2 Model selection 76
5.2.1 Hypotheses relating to business philosophy 78
5.2.2 Hypotheses relating to strategic analysis 79
5.2.3 Hypotheses relating to marketing strategy 82
5.2.4 Hypotheses relating to marketing organisation 83
5.2.5 Hypotheses relating to marketing control 84
5.2.6 Hypotheses relating to networks and the UK agri-food environment 85
vii
5.3 Performance instrument 86
5.3.1 Classification selection and criteria 88
5.4 Rationale behind split of sample to independent and subsidiary SMEs 89
5.5 Conclusions 91
Chapter 6 SURVEY RESULTS 92
6.1 Introduction 92
6.2 Hypotheses testing 92
6.2.1 Hypothesis relating to business philosophy
(hypothesis IA, 1B and IC) 93
6.2.2 Hypotheses relating to strategic analysis
(hypotheses from 2A to 8C) 95
6.2.3 Hypotheses relating to marketing strategy
(hypotheses from 9A to 12C) 101
6.2.4 Hypotheses relating to marketing organisation
(hypotheses from 13A to 14C) 105
6.2.5 Hypotheses relating to marketing control
(hypotheses from 15A to 16C) 107
6.2.6 Hypotheses relating to networks and the agri-food environment
(hypotheses from 17A to 20C) 109
6.2.7 Summary 112
6.3 Marketing process Effect on Marketing Performance 114
6.3.1 Analytical method 115
6.3.2 Discriminant Analysis for the independent SMEs 116
Implications for independent SMEs 123
viii
6.3.3 Discriminant Analysis for the subsidiary SMEs 123
Implications for the subsidiary SMEs 130
6.3.4 Discriminant Analysis for all agri-food SMEs 131
Implications for the agri-food industry 138
6.4 Ownership status and its effect on performance 139
6.4.1 Analytical method 140
Role of usage of SWOT analysis 142
European or government regulation 146
6.4.2 Implications 148
6.5 Conclusions 150
Chapter 7 CASE STUDY RESULTS 152
7.1 Introduction 152
7.2 Business Philosophy 154
7.3 Strategic Analysis 156
7.3.1 Strategic Planning Concepts 156
7.4 Marketing Strategy 161
7.5 Marketing organisation 163
7.6 Marketing control 164
7.7 Networks and the agri-food environment 165
7.8 A Proposed model of successful agri-food SMEs marketing 168
7.8.1 Business Philosophy 170
7.8.2 Strategic Analysis 170
7.8.3 Marketing strategy 171
7.8.4 Marketing organisation 172
ix
7.8.5 Marketing control 172
7.8.6 Networks and agri-food environment 173
7.9 Conclusions 174
Chapter 8 CONCLUSIONS AND FURTHER RESEARCH 175
8.1 Introduction 175
8.2 Research aims and objectives 175
8.3 Research design 176
8.3.1 Research process 176
8.3.2 Mail survey 177
8.3.3 Personal interviews 177
8.4 Contribution 178
8.4.1 Theoretical contributions 178
8.4.2 Methodological Contributions 179
8.4.3 Managerial contributions 180
8.5 Conclusions and areas of further research 181
Appendix a Letter for Survey Participation 184
Appendix b Questionnaire 185
Appendix c Chi-square analysis, Discriminant analysis, Log-linear analysis and
Appendix d Performance measure validation and interview questions 198
The High Performer. 200
The Medium Performer. 201
The Low performer. 202
Methodology 206
Results from the ANOVA tests 207

Interview schedule 215
Qualitative data analysis 218
Appendix e Chi-square Tables 221
Appendix f Two cases of independent and subsidiary agri-food SMEs 261
References 274
xi
LIST OF TABLES
Table 1 Distribution of UK Businesses Turnover and Turnover 10
Table 2 Change of food sub-sectors sales (in billion £s) 15
Table 3 Establishment size and Employment Distribution in the Food, Drink and
Tobacco Industries 18
Table 4 Size distribution of establishments in the UK Food and Drink industry 19
Table 5 Classification of subject area of agri-food marketing 28
Table 6 Marketing criticisms 36
Table 7 Differences between Subsidiary and Independent SMEs 47
Table 8A Literature review of Small Business Marketing 51
Table 9 Performance instrument 63
Table 10 Codes and names of sectors which define the agri-food industry. 64
Table 11 Types of questions and appropriate methodology adapted 72
Table 12 Performance instrument 87
Table 16 Chi-square of ownership status and performance 90
Table 17 Ownership status to performance 91
Table 18 Summary of Chi-square results 113
Table 19 Box's M test for the independent SMEs 116
Table 20 Summary of discriminant analysis of the independent SMEs 116
Table 21 Test of Equality of Group Means of the independent SMEs 117
Table 22 Wilks' Lambda Test of the independent SMEs 118
Table 23 Eigenvalues of the independent SMEs 118
Table 24 Discriminant Function Coefficients of the independent SMEs 118
Table 25 Group centroids of the independent SMEs 120
Table 26 Classification results for independent SMEs 120
X11
Table 27 Structure matrix of independent SMEs 121
Table 28 Performance by marketing practices of independent SMEs 122
Table 29 Box's M test for the subsidiary SMEs 123
Table 30 Summary of discriminant analysis of subsidiary SMEs 124
Table 31 Test of Equality of Group Means of subsidiary SMEs 124
Table 32 Wilks' Lambda test for subsidiary SMEs 125
Table 33 Eigenvalues of subsidiary SMEs 125
Table 34 Discriminant Function Coefficients for subsidiary SMEs 126
Table 35 Group centroids for the subsidiary SMEs 127
Table 36 Classification results for the subsidiary SMEs 127
Table 37 Structure matrix for subsidiary SMEs 128
Table 38 Performance by marketing practices of subsidiary SMEs 129
Table 39 Box's M test for the agri-food SMEs 131
Table 40 Summary of discriminant analysis of the agri-food SMEs 132
Table 41 Test of equality of group means of the agri-food SMEs 132
Table 42 Wilks' Lambda test for the agri-food SMEs 133
Table 43 Eigenvalues of agri-food SMEs 133
Table 44 Discriminant Function Coefficients for the agri-food SMEs 134
Table 45 Group centroids of agri-food SMEs 135
Table 46 Structure matrix of agri-food SMEs 136
Table 47 Performance by marketing practices of all agri-food SMEs 137
Table 48 Categorical Data Analysis of Performance by Usage of SWOT
analysis by ownership status 142
Table 49 Independent SMEs 143
Table 50 Subsidiary SMEs 143
X111
Table 51 Categorical Data Analysis of Performance by the Company's Strategic
Focus by Ownership Status 144
Table 52 Independent SMEs 144
Table 53 Subsidiary SMEs 145
Table 54 Categorical Data Analysis of Performance by Company/brand
Reputation by Ownership Status 145
Table 55 Independent SMEs 146
Table 56 Subsidiary SMEs 146
Table 57 Categorical Data Analysis of Performance by European/government
Regulation by Ownership Status 147
Table 58 Independent SMEs 148
Table 59 Subsidiary SMEs 148
Table 60 Summary of results of the log-linear analysis 149
Table 61 Details of the five successful Northern SMEs 153
Table 62 Sources of Information 158
Table d-1 Test of Homogeneity of variances 207
Table d-2 Descriptives of ANOVA 208
Table d-3 ANOVA results for the performance variables 209
Table e-1 QIMarketing Approach of Independent SMEs 221
Table e-2 Chi Square Test 221
Table e-3 Q1 Marketing Approach of Subsidiary SMEs 221
Table e-4 Chi Square Test 222
Table e-5 Q1 Marketing Approach of all agri-food SMEs 222
Table e-6 Chi Square Test 222
Table e-7 Q2 Formal strategic marketing planning of independent SMEs 223
xiv
Table e-8 Chi Square Test 223
Table e-9 Q2 Formal strategic marketing planning of subsidiary SMEs 223
Table e-10 Chi Square Test 224
Table e-11 Q2 Formal strategic marketing planning of all agri-food SMEs 224
Table e-12 Chi Square Test 224
Table e- 13 Q3 Importance attached to situation analysis of independent SMEs 225
Table e-14 Chi Square Test 225
Table e- 15 Q3 Importance attached to situation analysis of subsidiary SMEs 225
Table e-16 Chi Square Test 226
Table e- 17 Q3 Importance attached to situation analysis of all agri-food SMEs 226
Table e-18 Chi Square Test 226
Table e-19 Q4 al) Usage of SWOT analysis of independent SMEs 227
Table e-20 Chi Square Test 227
Table e-21 Q4 al) Usage of SWOT analysis of subsidiary SMEs 227
Table e-22 Chi Square Test 228
Table e-23 Q4 al) Usage of SWOT analysis of all agri-food SMEs 228
Table e-24 Chi Square Test 228
Table e-25 Q4 a2) Awareness of SWOT analysis of independent SMEs 229
Table e-26 Chi Square Test 229
Table e-27 Q4 a2) Awareness of SWOT analysis of subsidiary SMEs 229
Table e-28 Chi Square Test 230
Table e-29 Q4 a2) Awareness of SWOT analysis of all agri-food SMEs 230
Table e-30 Chi Square Test 230
Table e-31 Q4 bl) PLC levels of usage of independent SMEs 231
Table e-32 Chi Square Test 231
xv
Table e-33 Q4 bl) PLC levels of usage of subsidiary SMEs 231
Table e-34 Chi Square Test 232
Table e-35 Q4 bi) PLC levels of usage of all agri-food SMEs 232
Table e-36 Chi Square Test 232
Table e-37 Q4 b2) Awareness of PLC analysis of independent SMEs 233
Table e-38 Chi Square Test 233
Table e-39 Q4 b2) Awareness of PLC analysis of subsidiary SMEs 233
Table e-40 Chi Square Test 234
Table e-41 Q4 b2) Awareness of PLC analysis of all agri-food SMEs 234
Table e-42 Chi Square Test 234
Table e-43 Q5 Use of either self generated or commissioned market research
of independent SMEs 235
Table e-44 Chi Square Test 235
Table e-45 Q5 Use of either self generated or commissioned market research
of subsidiary SMEs 235
Table e-46 Chi Square Test 236
Table e-47 Q5 Use of either self generated or commissioned market research
of all agri-food SMEs 236
Table e-48 Chi Square Test 236
Table e-49 Q6 The strategic focus of the company of independent SMEs 237
Table e-50 Chi Square Test 237
Table e-51 Q6 The strategic focus of the company of subsidiary SMEs 237
Table e-52 Chi Square Test 238
Table e-53 Q6 The strategic focus of the company of all agri-food SMEs 238
Table e-54 Chi Square Test 238
xvi
Table e-55 Q7 Overall product quality in relation to competition of independent
SMEs 239
Table e-56 Chi Square Test 239
Table e-57 Q7 Overall product quality in relation to competition of subsidiary
SMEs 239
Table e-58 Chi Square Test 240
Table e-59 Q7 Overall product quality in relation to competition of all agri-food
SMEs 240
Table e-60 Chi Square Test 240
Table e-61 Q8 Company/brand reputation in relation to your competitors
of independent SMEs 241
Table e-62 Chi Square Test 241
Table e-63 Q8 Company/brand reputation in relation to your competitors
of subsidiary SMEs 241
Table e-64 Chi Square Test 242
Table e-65 Q8 Company/brand reputation in relation to your competitors
of all agri-food SMEs 242
Table e-66 Chi Square Test 242
Table e-67 Q9 Company's distribution in relation to competition of independent
SMEs 243
Table e-68 Chi Square Test 243
Table e-69 Q9 Company's distribution in relation to competition of subsidiary
SMEs 243
Table e-70 Chi Square Test 244
xvii
Table e-71 Q9 Company's distribution in relation to competition of all agri-food
SMEs 244
Table e-72 Chi Square Test 244
Table e-73 Q 10 Integration of marketing with other business functions
of independent SMEs 245
Table e-74 Chi Square Test 245
Table e-75 Q 10 Integration of marketing with other business functions of subsidiary
SMEs 245
Table e-76 Chi Square Test 246
Table e-77 Q 10 Integration of marketing with other business functions of all
agri-food SMEs 246
Table e-78 Chi Square Test 246
Table e-79 Q 11 Response to customer changes of independent SMEs 247
Table e-80 Chi Square Test 247
Table e-81 Q 11 Response to customer changes of subsidiary SMEs 247
Table e-82 Chi Square Test 248
Table e-83 Q11 Response to customer changes of all agri-food SMEs 248
Table e-84 Chi Square Test 248
Table e-85 Q 12 Frequency of customer satisfaction surveys of independent
SMEs 249
Table e-86 Chi Square Test 249
Table e-87 Q12 Frequency of customer satisfaction survey of subsidiary SMEs 249
Table e-88 Chi Square Test 250
Table e-89 Q12 Frequency of customer satisfaction surveys of all agri-food
SMEs 250
xviii
Table e-90 Chi Square Test 250
Table e-91 Q 13 Usage of on-going marketing intelligence gathering system
of independent SMEs 251
Table e-92 Chi Square Test 251
Table e-93 Q 13 Usage of on-going marketing intelligence gathering system
of subsidiary SMEs 251
Table e-94 Chi Square Test 252
Table e-95 Q 13 Usage of on-going marketing intelligence gathering system
of all agri-food SMEs 252
Table e-96 Chi Square Test 252
Table e-97 Q14 a) Usage of networks of independent SMEs 253
Table e-98 Chi Square Test 253
Table e-99 Q14 a) Usage of networks of subsidiary SMEs 253
Table e-100 Chi Square Test 254
Table e-101 Q14 a) Usage of networks of all agri-food SMEs 254
Table e-102 Chi Square Test 254
Table e-103 Q14 b) Importance of networks of independent SMEs 255
Table e-104 Chi Square Test 255
Table e-105 Q14 b) Importance of networks of subsidiary SMEs 255
Table e-106 Chi Square Test 256
Table e-107 Q14 b) Importance of networks of all agri-food SMEs 256
Table e-108 Chi Square Test 256
Table e- 109 Q 15 a) Government or European regulation poses a threat
to independent SMEs 257
Table e-110 Chi Square Test 257
xix
Table e-111 Q15 a) Government or European regulation poses a threat to
subsidiary SMEs 257
Table e-112Chi Square Test 258
Table e-113 Q15 a) Government or European regulation poses a threat to
all agri-food SMEs 258
Table e-114 Chi Square Test 258
Table e- 115 Q15 b) The big players pose a threat to our survival of independent
SMEs 259
Table e-116 Chi Square Test 259
Table e-117 Q15 b) The big players pose a threat to our survival of subsidiary
SMEs 259
Table e-118 Chi Square Test 260
Table e- 119 Q15 b) The big players pose a threat to our survival of all agri-food
SMEs 260
Table e-120 Chi Square Test 260
Table f-I Total Sandwich Market 262
Table f-2 Total Fresh Fruit Salads Market 269
Table f-3 Growth of Fresh Fruit Salads 269
xx
LIST OF FIGURES
Figure 1 Research stages 4
Figure 2 Competitiveness Index 11
Figure 3 Agri-food chain 13
Figure 4 Share of Sectors of UK GDP 15
Figure 5 Shares of UK Employment by Industry sector, 1996 16
Figure 6 The model 77
Figure 7 Theory of successful agri-food SMEs 169
Figure d-1 Profit per employee of company A (high performer) 200
Figure d-2 Return on Capital of company A (high performer) 200
Figure d-3 Profit before tax of company B (medium performer) 201
Figure d-4 Return of Capital of company B (medium performer) 202
Figure d-5 Profit Margin of company B (medium performer) 202
Figure d-6 Profit before tax of company C (low performer) 203
Figure d-7 Return on Capital of company C (low performer) 203
Figure d-8 Profit Margin of company C (low performer) 203
Figure d-9 Means plot of profit margin to performance 210
Figure d-10 Box-Whisker plot of profit margin to performance 211
Figure d-11 Means plot of ROC to performance 211
Figure d-12 Box-Whisker plot of ROC with performance 212
Figure d-13 Means plot of gearing to performance 213
Figure d-14 Box-Whisker plot of gearing to performance 213
Figure d-15 Means plot of profit per employee to performance 214
Figure d-16 Box-Whisker plot of profit per employee to performance 214
Figure d-17 QSR NUD. IST 4 analysis process 220

xxi
LIST OF MAP
Map 1 Research area
1
Chapter 1 INTRODUCTION
1.1 Introduction
Small and Medium sized Enterprises (SMEs), are an important component of many
economic sectors, including agri-food. Yet, due to their small size, SMEs face a
number of developmental problems in their growth stages, including a lack of
formalised marketing knowledge and activities. These manifest themselves as, for
example, over-dependency on the owner/manager's marketing competency, a lack
of formalised planning, limited marketing expertise, reactive (not pro-active)
marketing, and difficulty in defending niche markets (Stokes and Fitchew, 1997).
Management and small business researchers acknowledge the importance of finance
and marketing for the success of SMEs (Hills and LaForge, 1992). Improving
marketing within SMEs is thus a potential source of competitive advantage and is
therefore of policy interest (Hogarth-Scott et al, 1996). This research is therefore an
attempt to understand SMEs' marketing. Because the agri-food sector comprises of
over 65% of SMEs and since the UK agri-food industry lacks behind the European
competition, (Mann et al, 1999), there is further need for research in the
competitiveness of the agri-food SME sector.
The framework used is derived from an integrative approach first used by Siu
(1997). This is a blending of the contingency approach (Brooksbank, 1990b) with
the process model (Brooksbank et al, 1992), in order to advance knowledge of
marketing within an SME context.
2
1.2 Research objectives and stages
Based on literature from both food and SME marketing and using a comparative
study of independent and subsidiary SMEs, proposed by Shrader and Simon (1997)
and Cooper (1993), this thesis aims to:
1. Examine the marketing practices of agri-food SMEs in order to see how they
affect their performance;
2. Identify the differences and similarities between three groups; independent,
subsidiary and the whole agri-food SMEs in order to advance knowledge of
marketing, and gain a deeper understanding of marketing practised in different
contexts;
3. Investigate how and why successful agri-food SMEs practice marketing the way
they do in order to propose a model of successful marketing practices, and;
4. Make recommendations for the agri-food industry in the North of England.
For the purposes of this thesis an SME is defined as follows:
1. No of employees between 10-500;
2. Turnover between £l00,000-£25 million;
3. Companies with registered trading addresses in the North and North West of
England, including the following regions; Northumberland, Cumbria, County
Durham, North Yorkshire, Tyne & Wear, Lancashire, Greater Manchester.
In order to split the sample to independent and subsidiary SMEs an independent
company is defined as not partly or wholly subsidiary or holding company. There is
a further discussion of the definitions used in chapter 4.
3
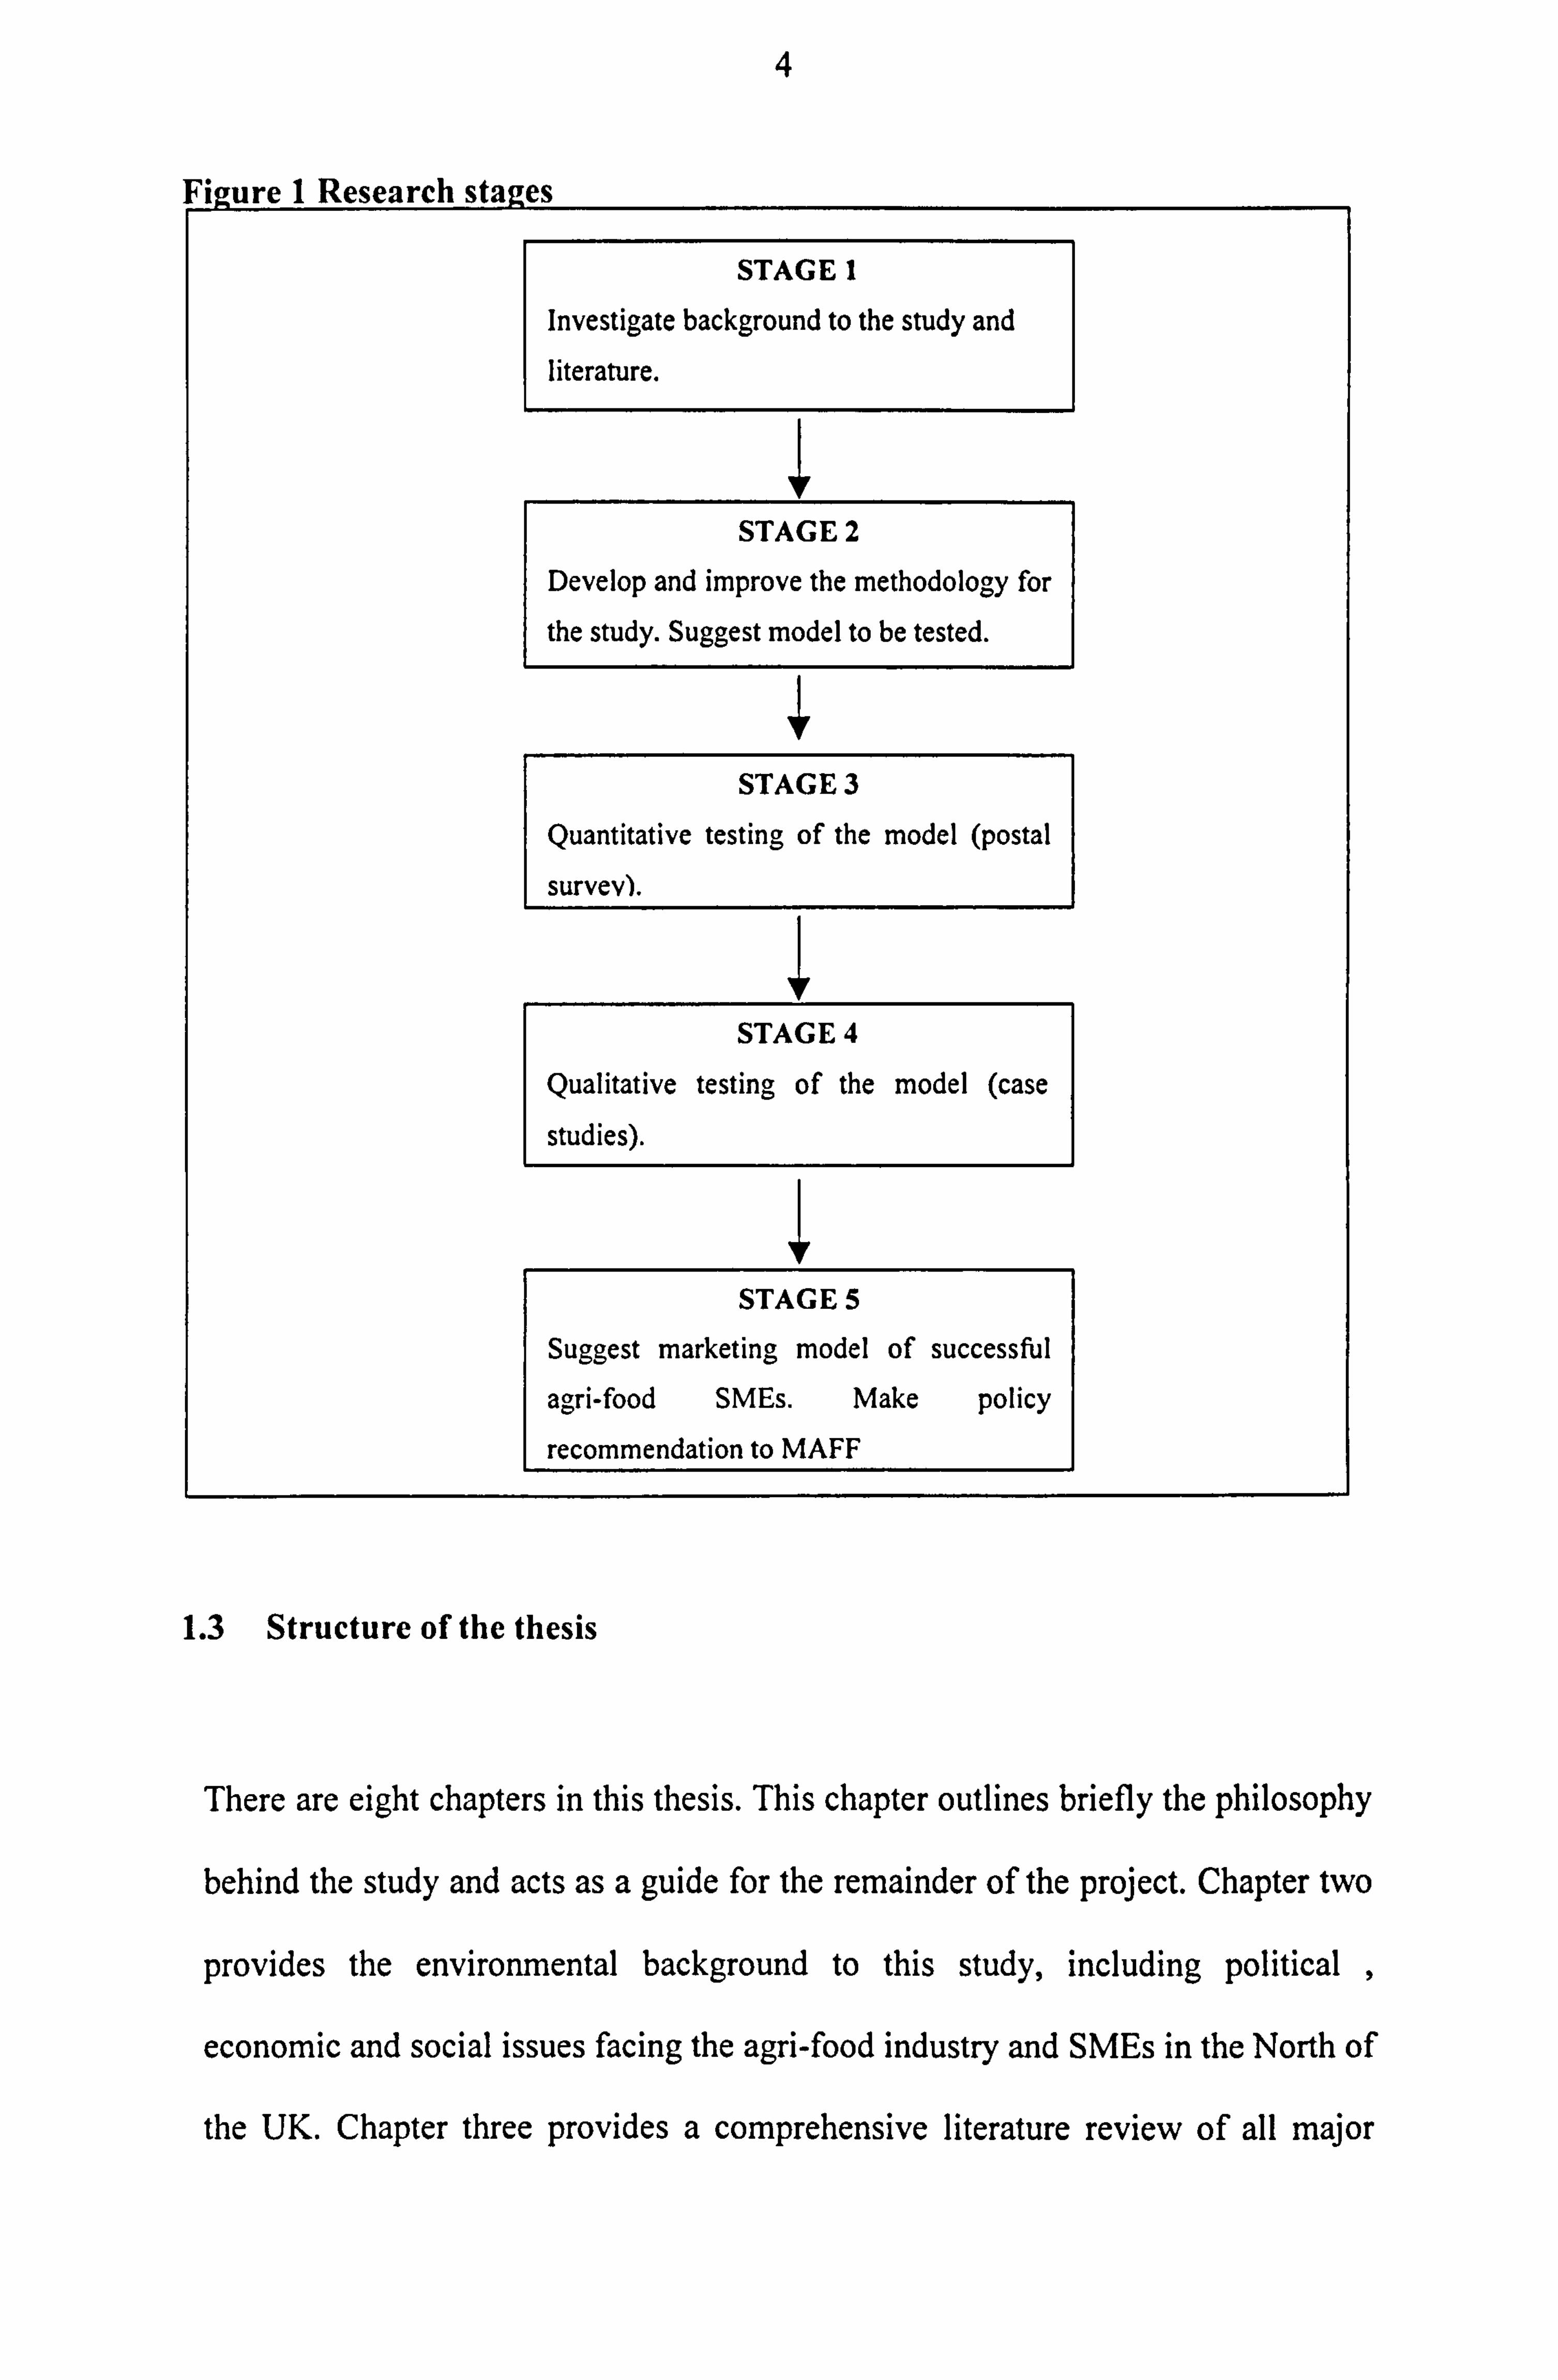
This research is presented in five stages, as shown in figure 1. Reflecting the
research process undertaken, the first stage is concerned with the background to the
study, in terms of state of SMEs and the agri-food industry in the UK and the North
of England. This stage also examines literature in order to investigate the latest
developments on the subject of agri-food marketing and small business research.
The second stage develops and improves existing methodology in order to select the
appropriate model for the thesis. The third stage tests the model statistically through
a mail survey. The comparative nature of independent, subsidiary and the whole
agri-food SMEs provides insights into the differences and similarities between such
companies. Two statistical software packages were utilised for the analysis of the
data, Statistical Package for the Social Sciences (SPSS) and Statistical Analysis
System (SAS). A tentative model of successful marketing practices and agri-food
SMEs was constructed. The fourth stage focuses on the findings of a series of five
case studies of successful agri-food SMEs, three independently owned and two
subsidiaries of multinationals. The interview data were transcribed and analysed
using Nonnumerical Unstructured Data Indexing Searching and Theory-building
(QSR NUD. IST 4) software and the case study approach was utilised to analyse the
five companies. The final stage presents a model of marketing of successful agri-
food SMEs. It also makes policy recommendations to the Ministry of Agriculture
Fisheries and Food (MAFF), on how to target and improve marketing support to
agri-food SMEs.
4
1 Kesearcn
STAGE 1
Investigate background to the study and literature.
STAGE 2
Develop and improve the methodology for
the study. Suggest model to be tested.
STAGE 3
Quantitative testing of the model (postal
survev).
STAGE 4
Qualitative testing of the model (case
studies).
1 STAGE 5
Suggest marketing model of successful
agri-food SMEs. Make policy
recommendation to MAFF
1.3 Structure of the thesis
There are eight chapters in this thesis. This chapter outlines briefly the philosophy
behind the study and acts as a guide for the remainder of the project. Chapter two
provides the environmental background to this study, including political ,
economic and social issues facing the agri-food industry and SMEs in the North of
the UK. Chapter three provides a comprehensive literature review of all major
5
concepts within both SME marketing literature and agri-food marketing literature.
It specifically outlines the approach and model chosen for the thesis. Chapter four
addresses the research rationale, research questions and objectives. It also
describes the research methodology and design for the thesis. Finally it analyses
the theoretical framework and describes the quantitative and qualitative
approaches used for the project.
Chapter five examines the contingency approach in more detail and provides the
justification behind the selection of the model and the chosen hypotheses. Chapters
six provides the findings of the mail survey of the marketing practices of agri-food
SMEs and their influence on performance, combined with a comparison between
independent, subsidiary and the whole agri-food groups. Chapter seven analyses the
results of the five successful cases and proposes a theory of successful marketing
within the agri-food industry, together with recommendations for the whole agri-
food industry. Furthermore, the chapter attempts to verify the survey results.
Finally, chapter eight talks about the conclusions and theoretical contribution of the
thesis, and touches upon new areas of research within the SME field.
6
Chapter 2 BACKGROUND TO THE STUDY
2.1 Introduction
This chapter provides the marketing environment to the thesis. The Political,
Economic, Social and Technological (PEST) model (Kotler, 1994) is modified for
the purposes of this study. The first part briefly outlines some of the main
geographical characteristics of the study. The political issues of SMEs and the agri-
food industry are also discussed. Economic characteristics of the SMEs, the agri-food
industry and agri-food SMEs are given together with some of the main social issues
facing the agri-food industry in the UK.
2.2 Geographical Characteristics
The following map shows the specific Northern regions that this thesis is involved
with (the area within the two thick black lines, from the Northern border of England
with Scotland, stretching down to encompass North Yorkshire and Lancashire but
excluding the rest of Yorkshire):

7
Map I Research area
2.3 Political issues of SMEs and the agri-food industry in the UK
An important theme in the 1971 Bolton Report. the first major political report on the
state and importance of SMEs in the UK. was that small firms were the 'seed bed' of
the UK economy (Bolton. 1971). The role of the small firm in injecting new blood
into the economy has been an important policy theme since the 1980s, because they
often represent the cutting edge of new technology, create new jobs and wealth and
make major contribution to exports (Storey. 1982). It has been shown that, on
aggregate. SMEs make a greater contribution to new employment than larger firms
(Westhead and Birley, 1995). More recently, Blair (D"1'1.1998) stated that the
creation of new SMEs is the key to improve competitiveness and the ability of the
8
UK to cope with a more uncertain, complex and increasingly globally exposed
society. Hence, supported by British and European policy, SMEs grew impressively
in the 1980s and 1990s (Gray, 1992; Stokes, 1998).
SMEs are also a vital part of all EU economies, accounting for 65 per cent of EU
turnover (DTI, 1999a). They dominate many service sectors particularly hotels,
catering, retailing and wholesaling.
However, in the UK, SMEs provide a smaller share of employment (58 per cent)
than in other EU countries, although the trend is upwards, towards the EU average of
66 per cent. SMEs vary widely in the resources that they allocate to innovation. Of
SMEs with more than 20 employees, one in ten spends 10 per cent or more of
turnover on new product and process development. But over one third of
manufacturing SMEs spend nothing at all. SMEs also report a shortage of skilled
workers. UK firms are particularly concerned about a shortage of skilled managers
and many do not see a way to rectify this. This is a matter of concern when the
changing nature of work and technological development means that increasingly
higher skills will be needed in all sectors. Finally, the export record of UK SMEs is
not as strong as that of EU countries. The UK is thirteenth in the EU in terms of the
proportion of SMEs that export. This partly reflects the UK's geographical position,
and partly the previous generally lower skilled workforce, in particular in relation to
languages where UK is second last in term of the proportion of its executives able to
communicate in more than one language (DTI, 1998). Therefore, the need for further
research into the SME sector, in order to improve its competitiveness, is of current

9
and future policy importance, if the UK is to compete effectively with other EU
countries.
The UK agri-food chain on the other hand, is influenced by two major policy issues.
The primary production of the food chain (see figure 3) is heavily influenced by the
Common Agricultural Policy (CAP) which may send economic signals that are not
totally aligned with those of the market. In the recent CAP negotiations (Agenda
2000) the UK pressed for substantial reform. The Food Chain Group (1999) with its
consultation document issued on the 26`h of August 1999 stresses the importance of a
farming industry that is: competitive diverse and flexible; responsive to consumer
wishes for example concerning welfare of animals; the quality and value of produce;
environmentally responsible; and an integral part of the rural and wider economy.
European Community regulation on issues like labelling and safety is another issue
that influences the chain. In the UK, the regulation of food and drink will become the
responsibility of the Food Standards Agency due to be established in 2000. The Food
Standards Bill, established by the Agency, will also give high priority to
considerations of food safety.
2.4 Economics of SMEs, the agri-food industry and agri-food SMEs
2.4.1 SMEs in the UK
There were an estimated 3.7 million active businesses in the UK at the start of 1998.
Of these, over 2.3 million were `size class zero' businesses, i. e. those made up of
sole traders or partners without employees. The following table shows clearly the
10
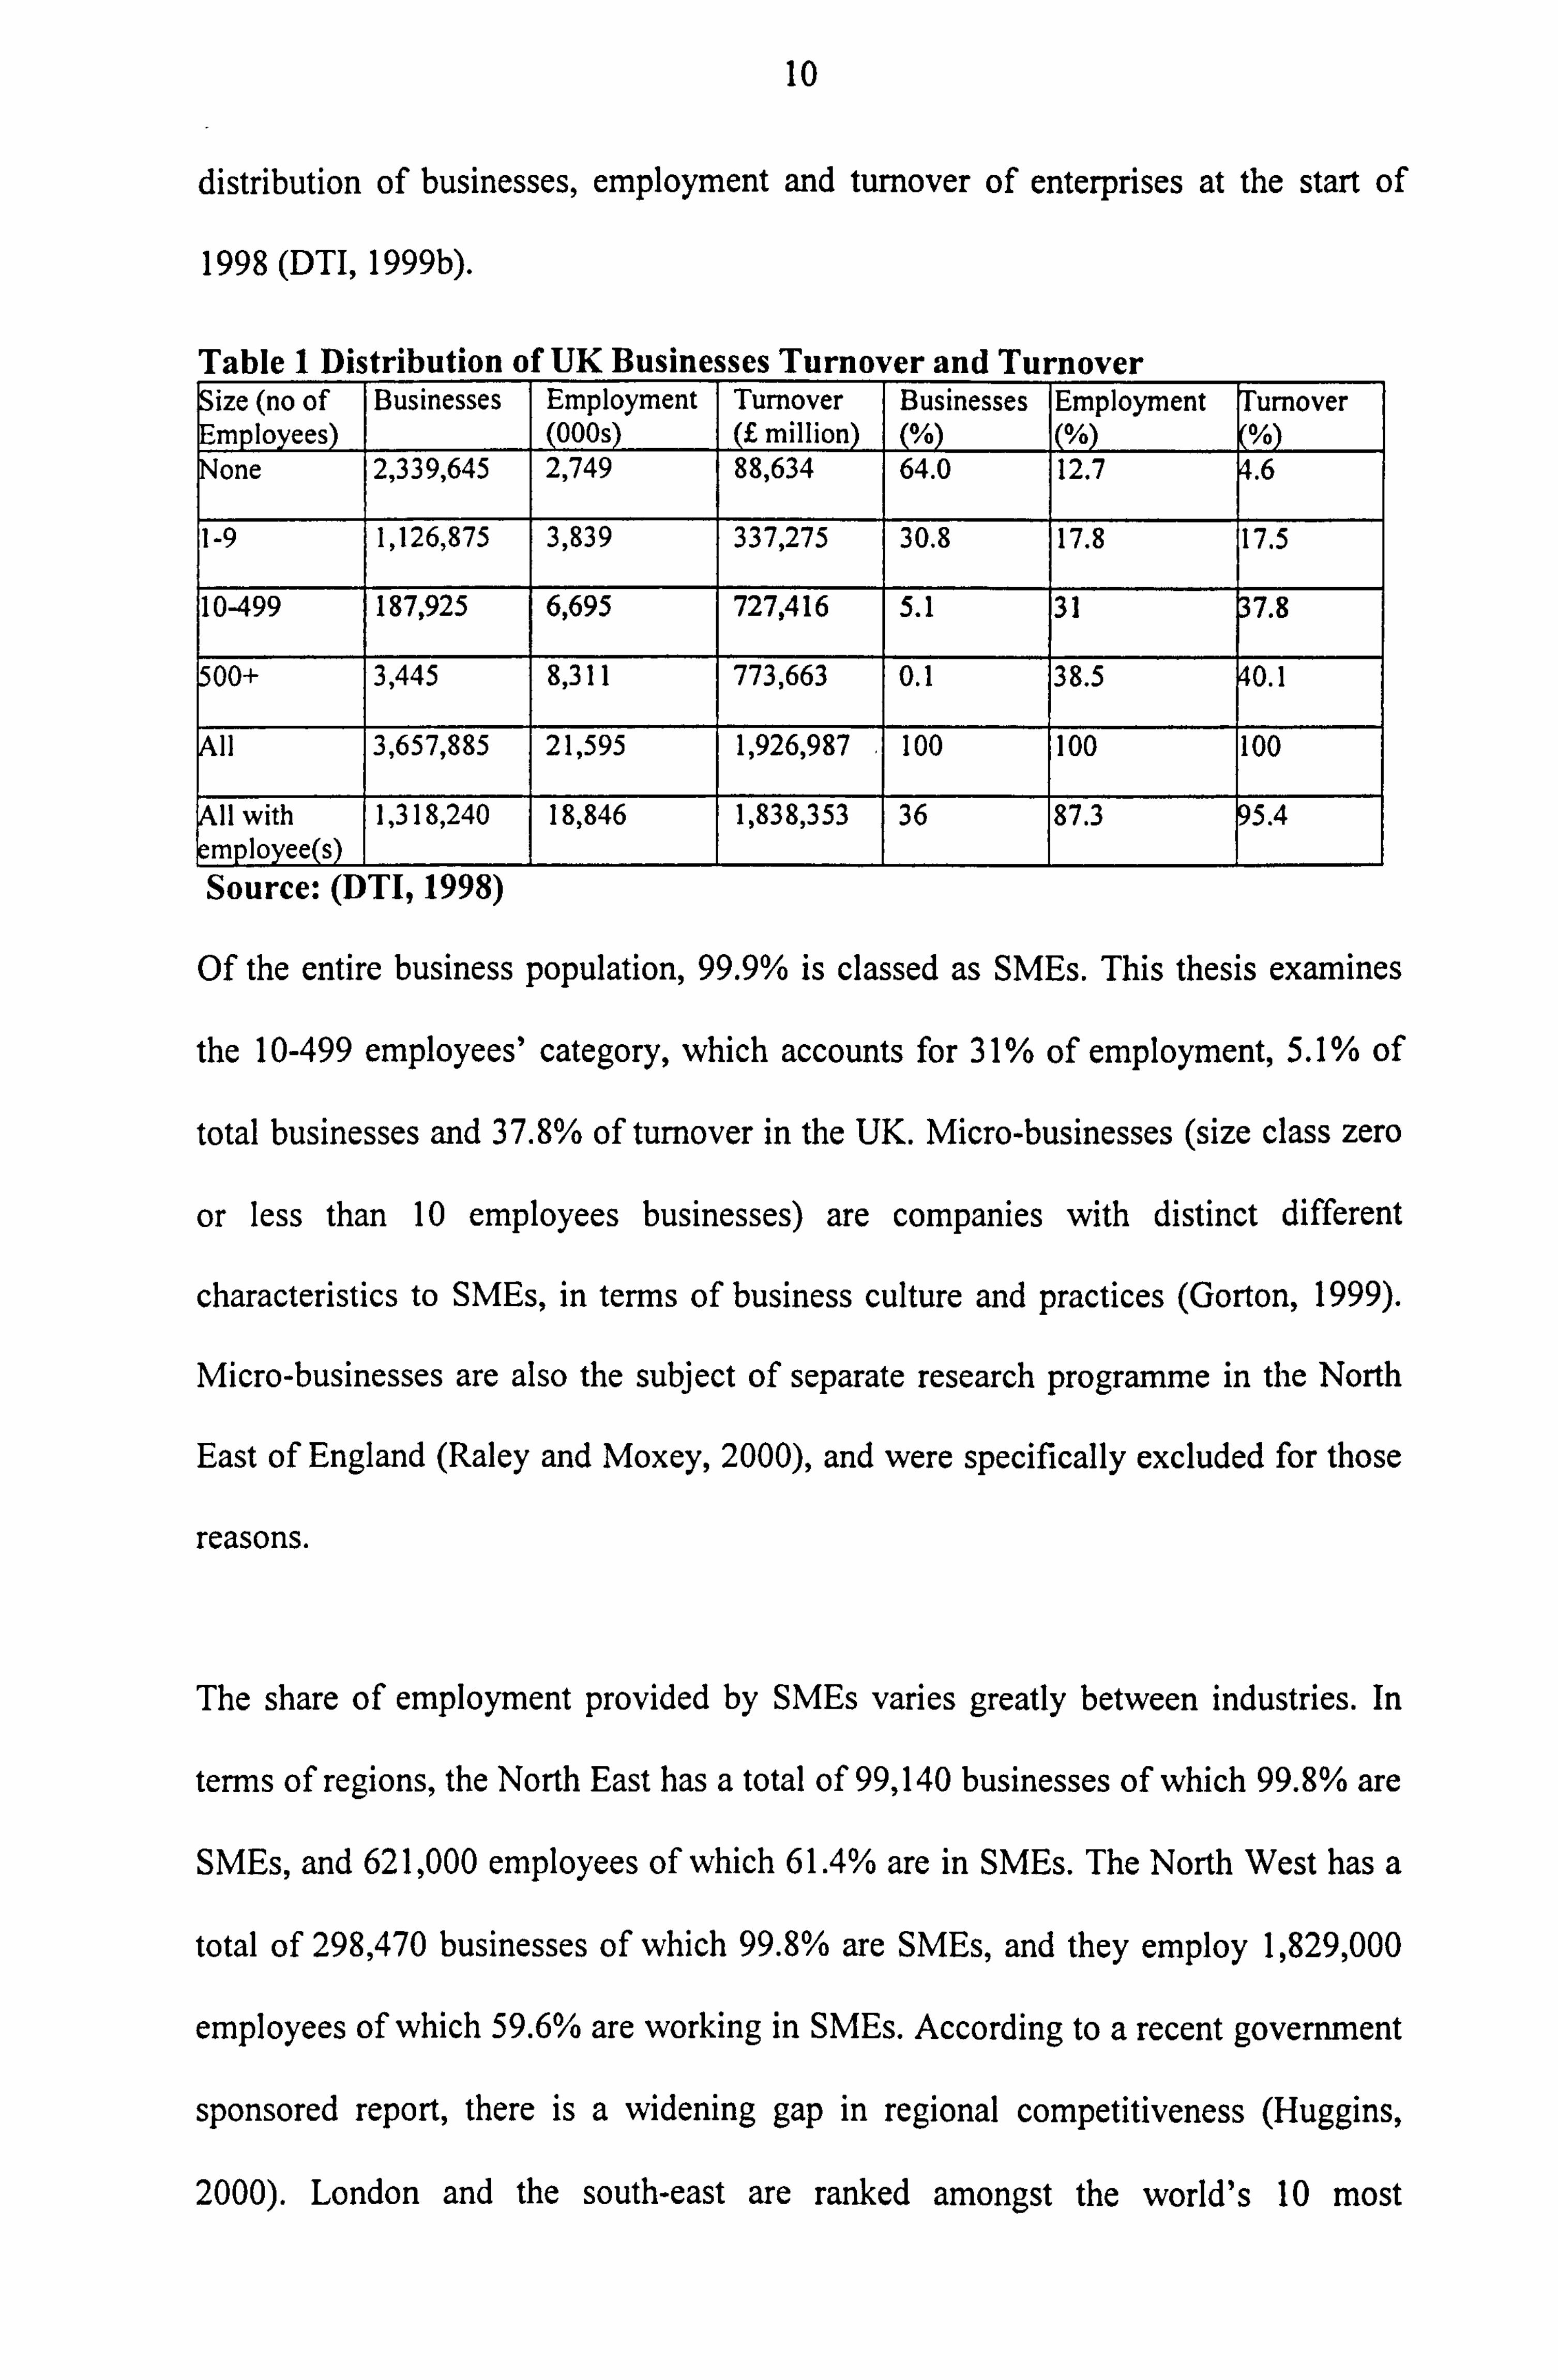
distribution of businesses, employment and turnover of enterprises at the start of
1998 (DTI, 1999b).
Table 1 Distribution of UK Businesses Turnover and Turnover Size (no of Employees)
Businesses Employment (000s)
Turnover £ million)
Businesses Employment Turnover
None 2,339,645 2,749 88,634 64.0 12.7 .6
1-9 1,126,875 3,839 337,275 30.8 17.8 17.5
10-499 187,925 6,695 727,416 5.1 31 7.8
00+ 3,445 8,311 773,663 0.1 38.5 0.1
All 3,657,885 21,595 1,926,987 100 100 100
Il with employee(s)
1,318,240 18,846 1,838,353 36 87.3 5.4
Source: (DTI, 1998)
Of the entire business population, 99.9% is classed as SMEs. This thesis examines
the 10-499 employees' category, which accounts for 31 % of employment, 5.1 % of
total businesses and 37.8% of turnover in the UK. Micro-businesses (size class zero
or less than 10 employees businesses) are companies with distinct different
characteristics to SMEs, in terms of business culture and practices (Gorton, 1999).
Micro-businesses are also the subject of separate research programme in the North
East of England (Raley and Moxey, 2000), and were specifically excluded for those
reasons.
The share of employment provided by SMEs varies greatly between industries. In
terms of regions, the North East has a total of 99,140 businesses of which 99.8% are
SMEs, and 621,000 employees of which 61.4% are in SMEs. The North West has a
total of 298,470 businesses of which 99.8% are SMEs, and they employ 1,829,000
employees of which 59.6% are working in SMEs. According to a recent government
sponsored report, there is a widening gap in regional competitiveness (Huggins,
2000). London and the south-east are ranked amongst the world's 10 most
11
competitive nations, but Wales, North East England and Yorkshire are ranked with
countries such as Chile, Hungary and Israel. The results emerge from a
competitiveness index developed by Robert Huggins (2000). Huggins suggested that
the government was unwilling to highlight the widening gulf "for political reasons".
Although the DTI has carried out certain research on competitiveness in the UK it
has been reluctant to measure the actual comparative performance of regions and
localities, the report states. The report also argues that the concentration of the most
competitive firms on the South and South East may result in the widening of the gap
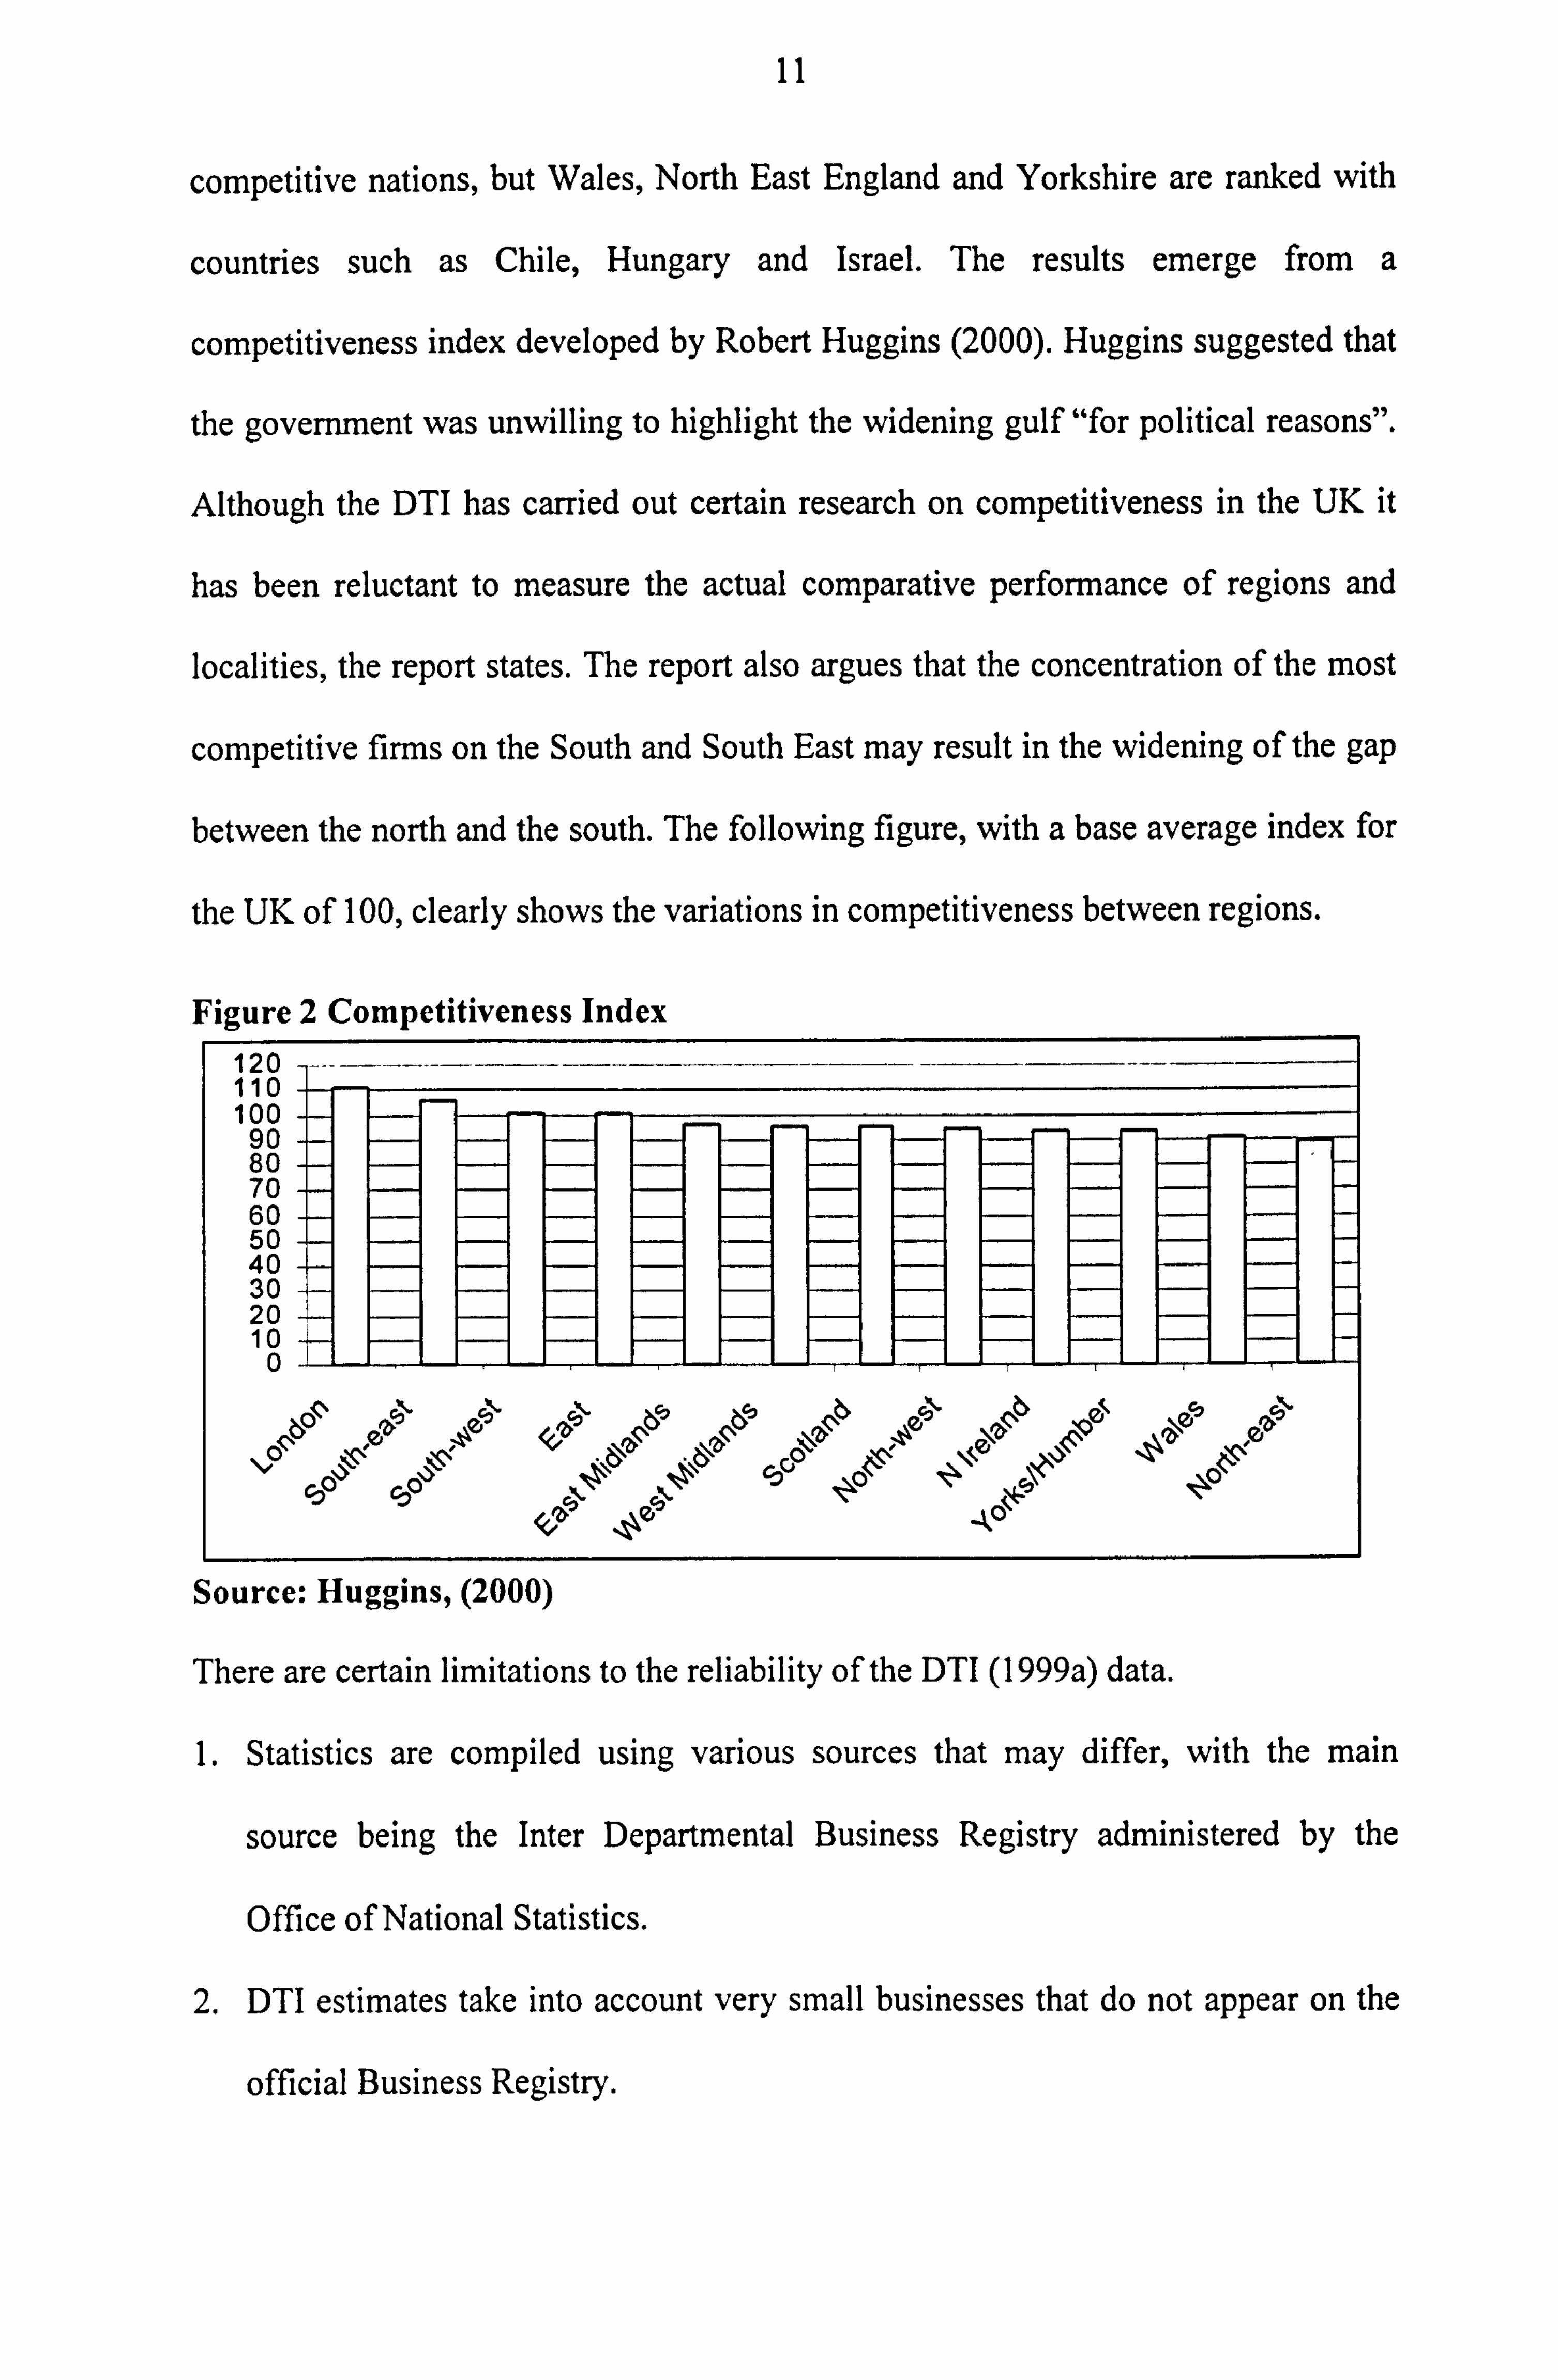
between the north and the south. The following figure, with a base average index for
the UK of 100, clearly shows the variations in competitiveness between regions.
Figure 2 Competitiveness Index 120 -- - ----- --- ---- - 110 100
80 70 60 50 40 30 20 10
0
Jp
Source: Huggins, (2000)
There are certain limitations to the reliability of the DTI (1999a) data.
1. Statistics are compiled using various sources that may differ, with the main
source being the Inter Departmental Business Registry administered by the
Office of National Statistics.
2. DTI estimates take into account very small businesses that do not appear on the
official Business Registry.
12
3. The SMEs statistics are published every 18 months after the start of the reference
year. This reflects the delay in the reporting of a minority of business births and
deaths.
Therefore, this thesis could not use more up to date data since it was written before
August 2000, which is when the 1999 SME report would be published.
2.4.2 The agri-food industry in the UK
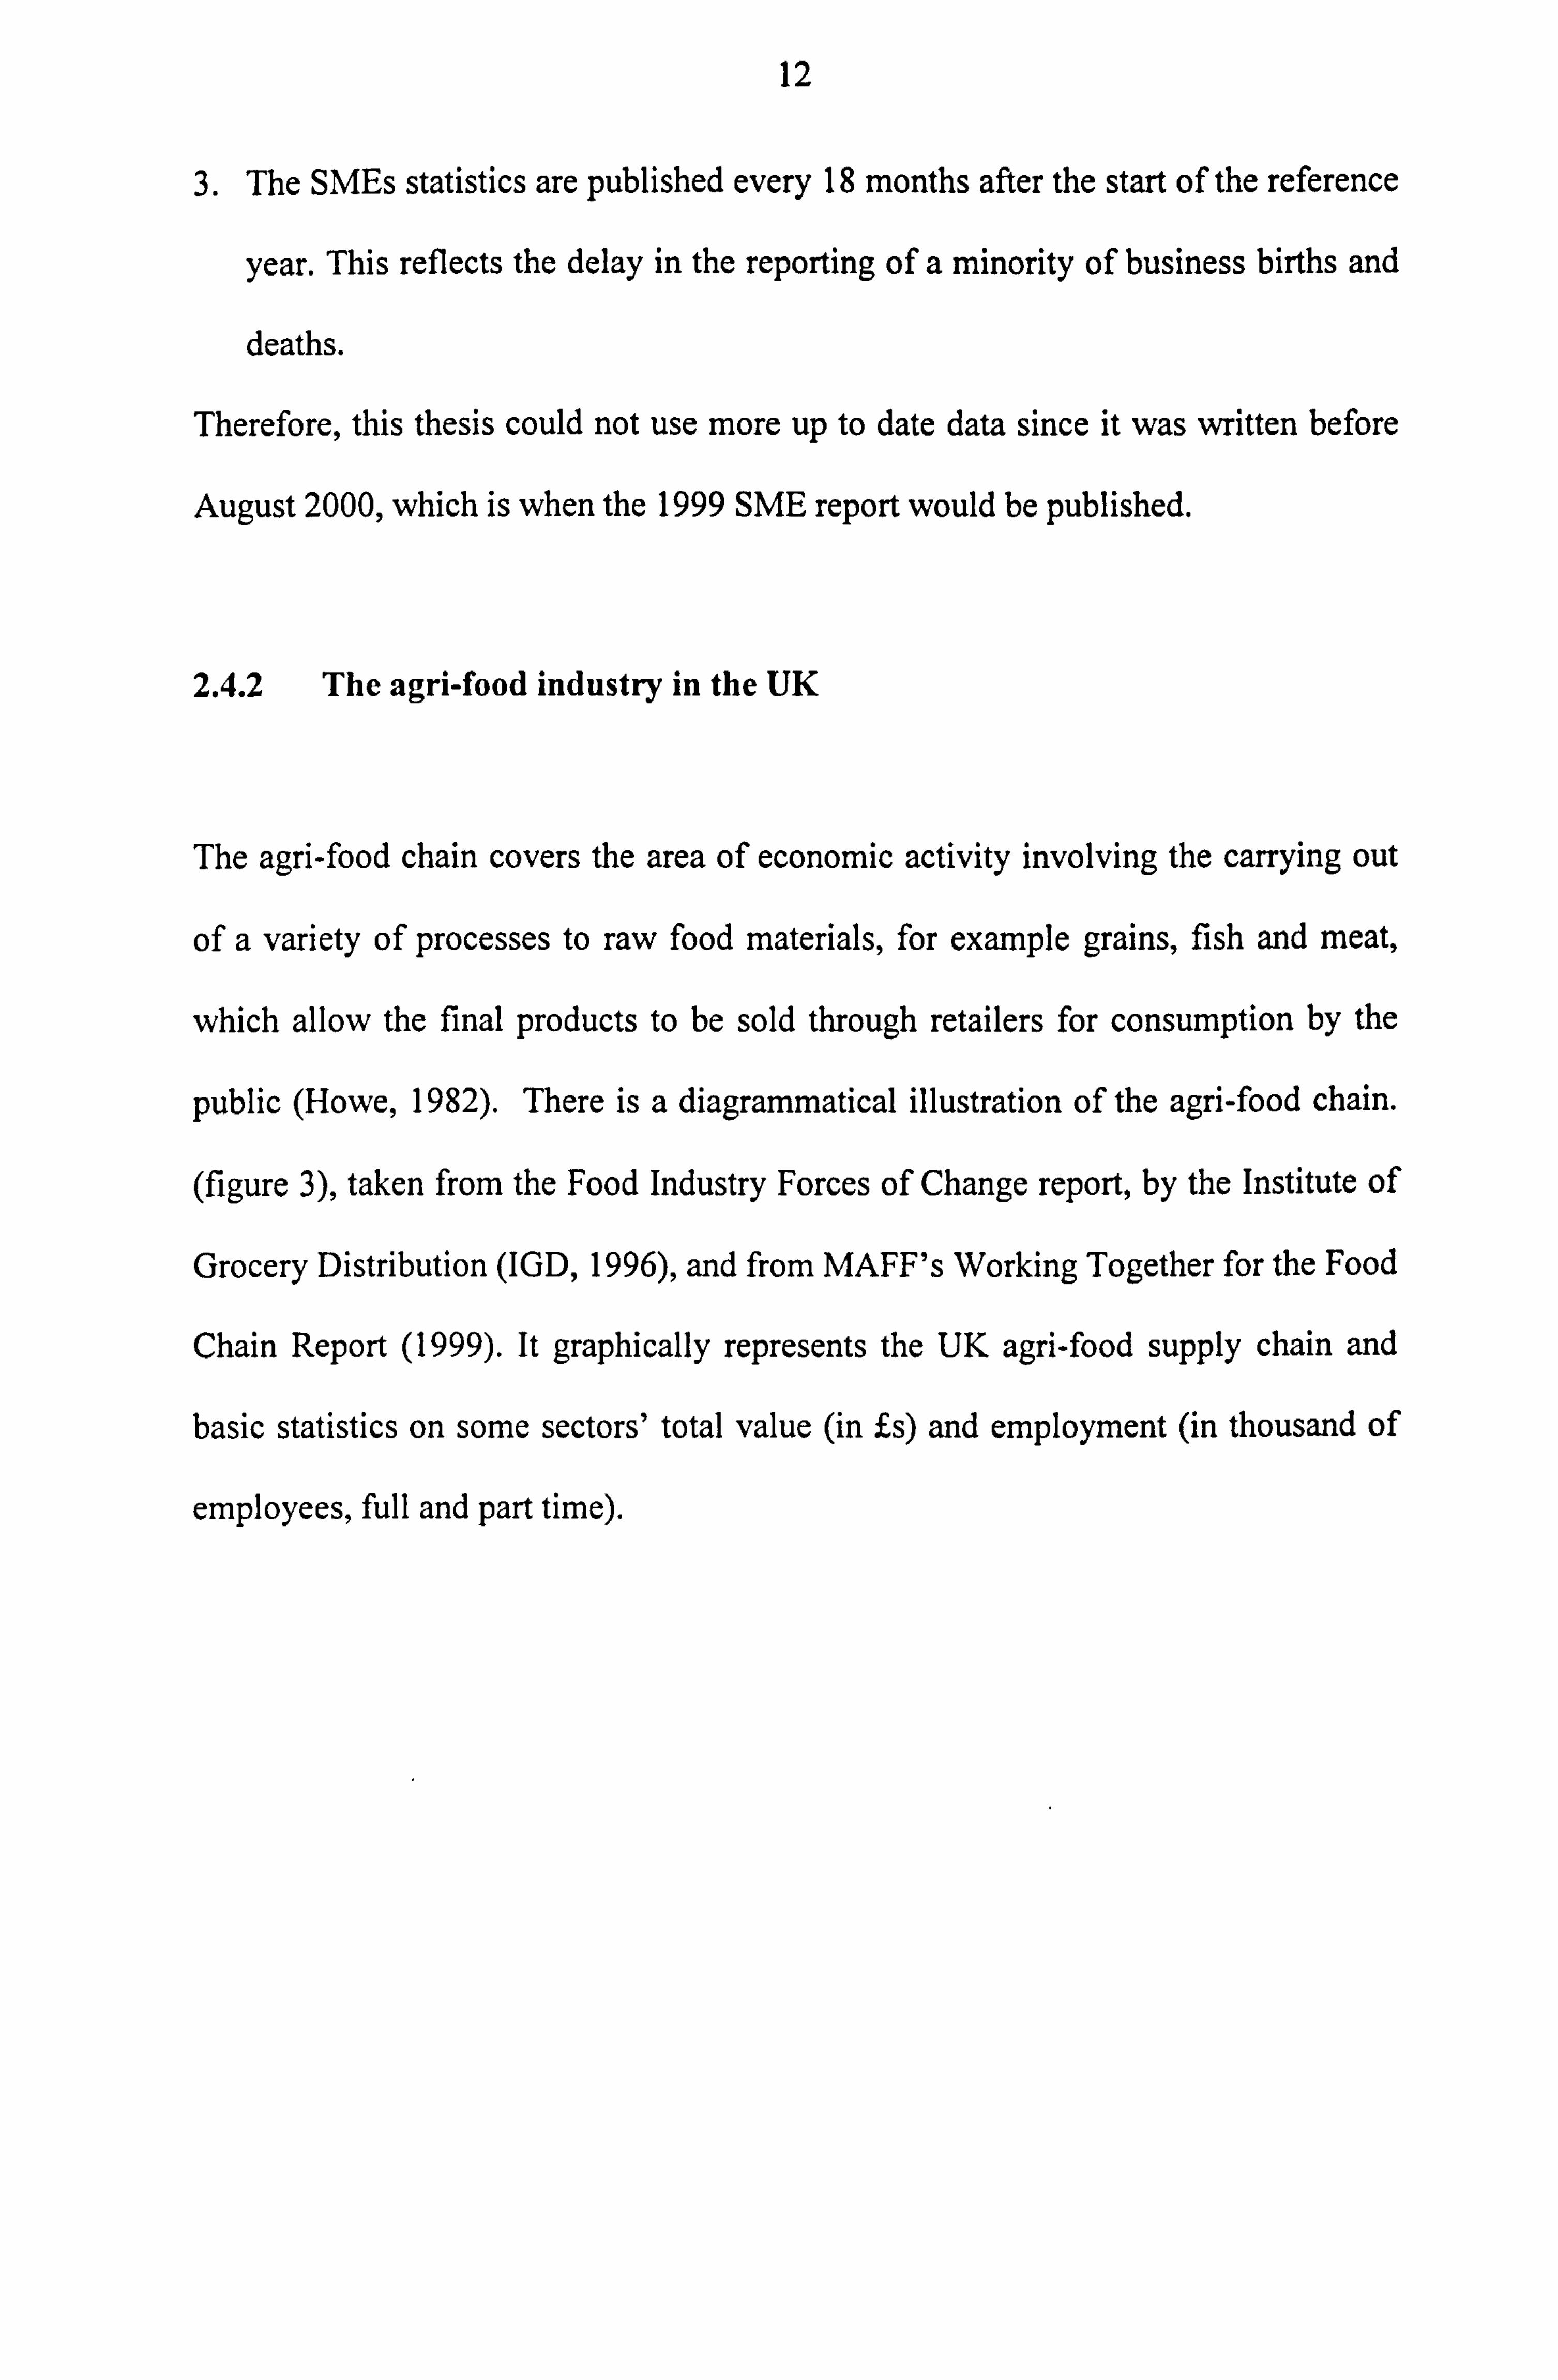
The agri-food chain covers the area of economic activity involving the carrying out
of a variety of processes to raw food materials, for example grains, fish and meat,
which allow the final products to be sold through retailers for consumption by the
public (Howe, 1982). There is a diagrammatical illustration of the agri-food chain.
(figure 3), taken from the Food Industry Forces of Change report, by the Institute of
Grocery Distribution (IGD, 1996), and from MAFF's Working Together for the Food
Chain Report (1999). It graphically represents the UK agri-food supply chain and
basic statistics on some sectors' total value (in £s) and employment (in thousand of
employees, full and part time).
13
Figure 3 Agri-food chain
AGRICULTURE (inc. primary producers) . jobs)
D
I IMPORTS
S (£16.9bn) EXPORTS
T (£9.1 bn)
R FISHING
(£0.9bn)
B
U FOOD AND GROCERY T MANUFACTURING
I (£18.7bn/455th jobs)
O
N
WHOLESALING
LS (£4.6bn/220th jobs)
E
R
V
I CATERING RETAILING C £11.8bn/1,190th jobs) (£12.5bn/947tn
jobs) E
S CONSUMERS
...................... (59 million)
Source: IGD, (1996)
14
The UK agri-food chain comprises of the agriculture, horticulture, fisheries and
acquaculture, food and drink manufacturing, food and drink wholesaling, food and
drink retailing and catering industries. Excluding fisheries and acquaculture,
residential catering and traders (agents), it accounts for gross value added of £56
billion (nearly 8 per cent of gross domestic product), provides 3.3 million jobs (over
12 per cent of total employment) and exports goods worth £9 billion (some 6 per cent
of total UK exports) (Euro PA, 1998). The UK is a net importer of food and in 1998
the trade deficit in the food sector had reached £7.47bn compared to £6.03bn in
1994. This has prompted extensive research on the competitiveness of the food
industry. Projects such as the Strathclyde Food project were launched in order to
reduce this gap (Shaw, 1994).
This thesis is concerned with food and drink manufacturing, the wholesaling sectors
and some diversified farms (which are part of the agriculture in the chain) in the
North of England due to the availability of the above companies in Financial
Analysis Made Easy (FAME) database. Therefore, the next sections will examine
each sector in turn.
Agri food Manufacturing industry
Nationally, only about 8000 businesses are classified as food/drink manufacturers
and the industry is highly concentrated. Although the largest 10 food manufacturers
account for only 21 per cent of the industry's turnover, for many products three firms
account for over 75 per cent of turnover. The following table shows that growth in
the food and drinks market is limited to specific sectors led by rapid changes in
consumer behaviour.
15
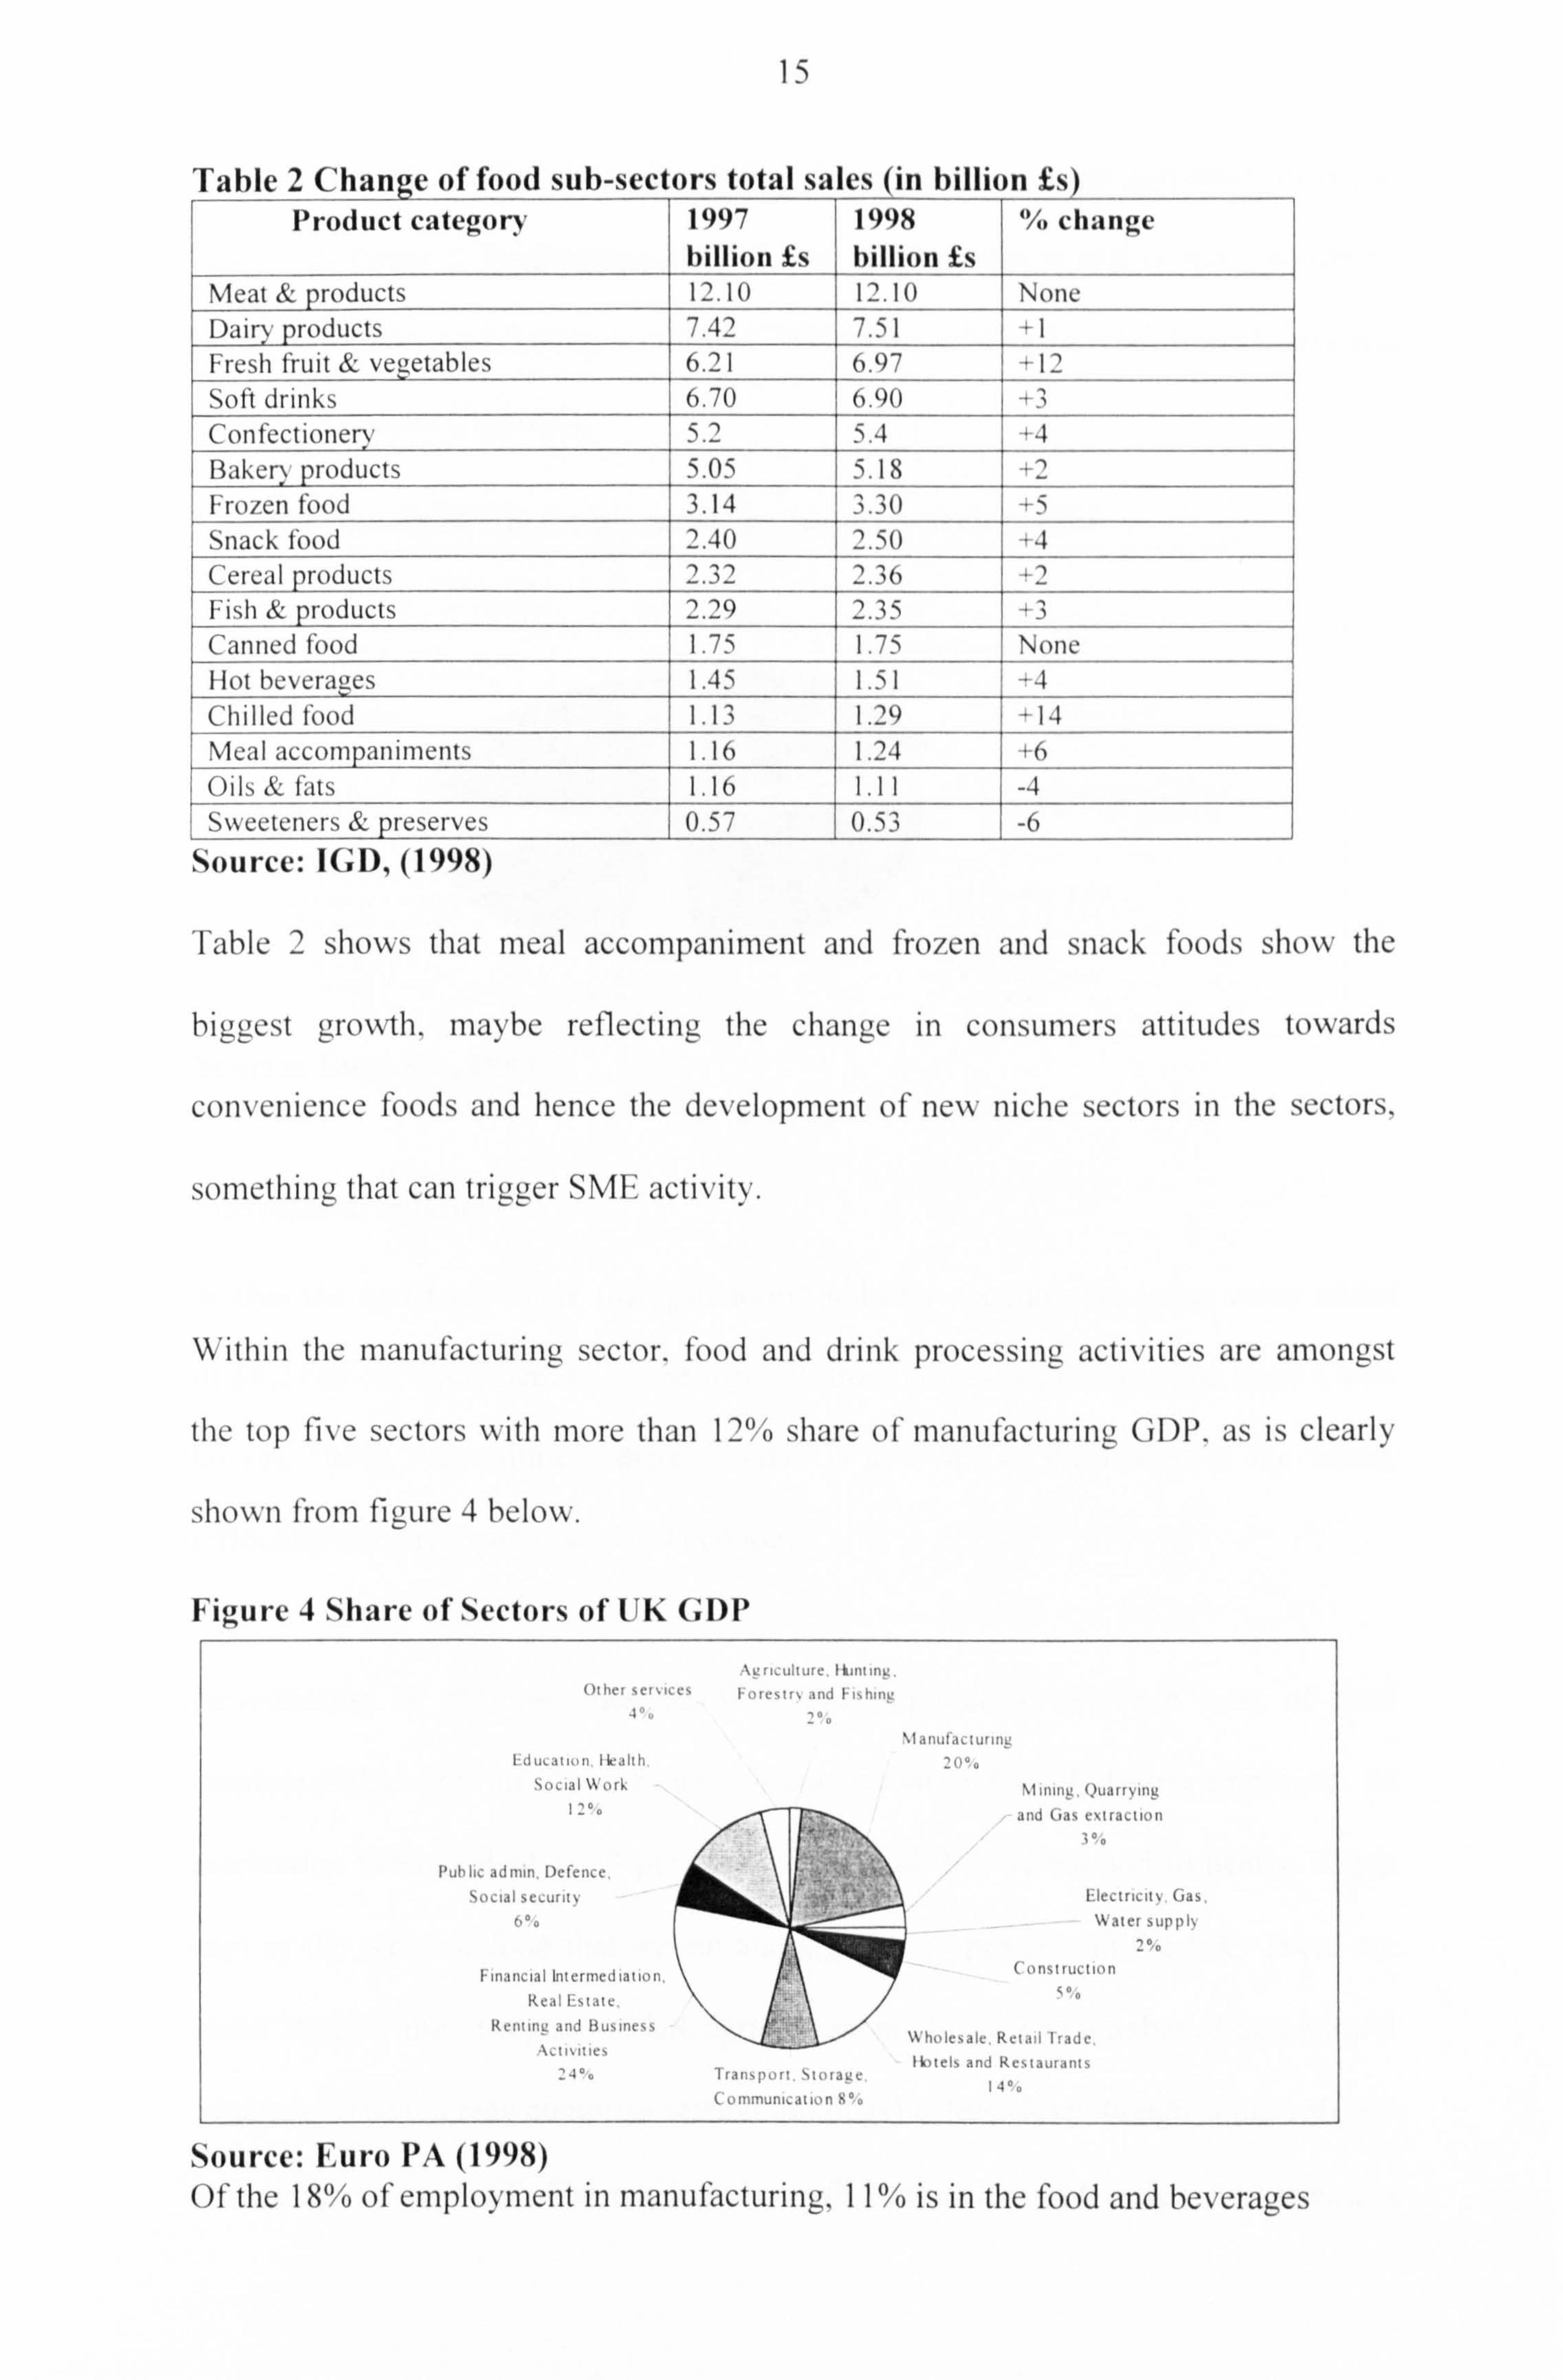
Table 2 Change of food sub-sectors total sales (in billion £s) Product category 1997
billion is 1998 billion is
% change
Meat products 12.10 12.10 None Dairy products 7.42 7.51 +I Fresh fruit & vegetables 6.21 6.97 +12 Soft drinks 6.70 6.90 +3 Confectionery 5.2 5.4 +4 Bakery products 5.05 5.18 +2 Frozen food 3.14 3.30 +5 Snack food 2.40 2.50 +4 Cereal products 2.32 2.36 +2 Fish & products 2.29 2.35 +3 Canned food 1.75 1.75 None Hot beverages 1.45 1.51 +4 Chilled food 1.13 1.29 +14 Meal accompaniments 1.16 1.24 +6 Oils & fats 1.16 1.11 -4 Sweeteners & preserves 0.57 0.53 -6
Source: IGD, (1998)
Table 2 shows that meal accompaniment and frozen and snack foods show the
biggest gC, I rowth. maybe reflecting the change in consumers attitudes towards
convenience foods and hence the development of new niche sectors in the sectors,
something that can trigger SME activity.
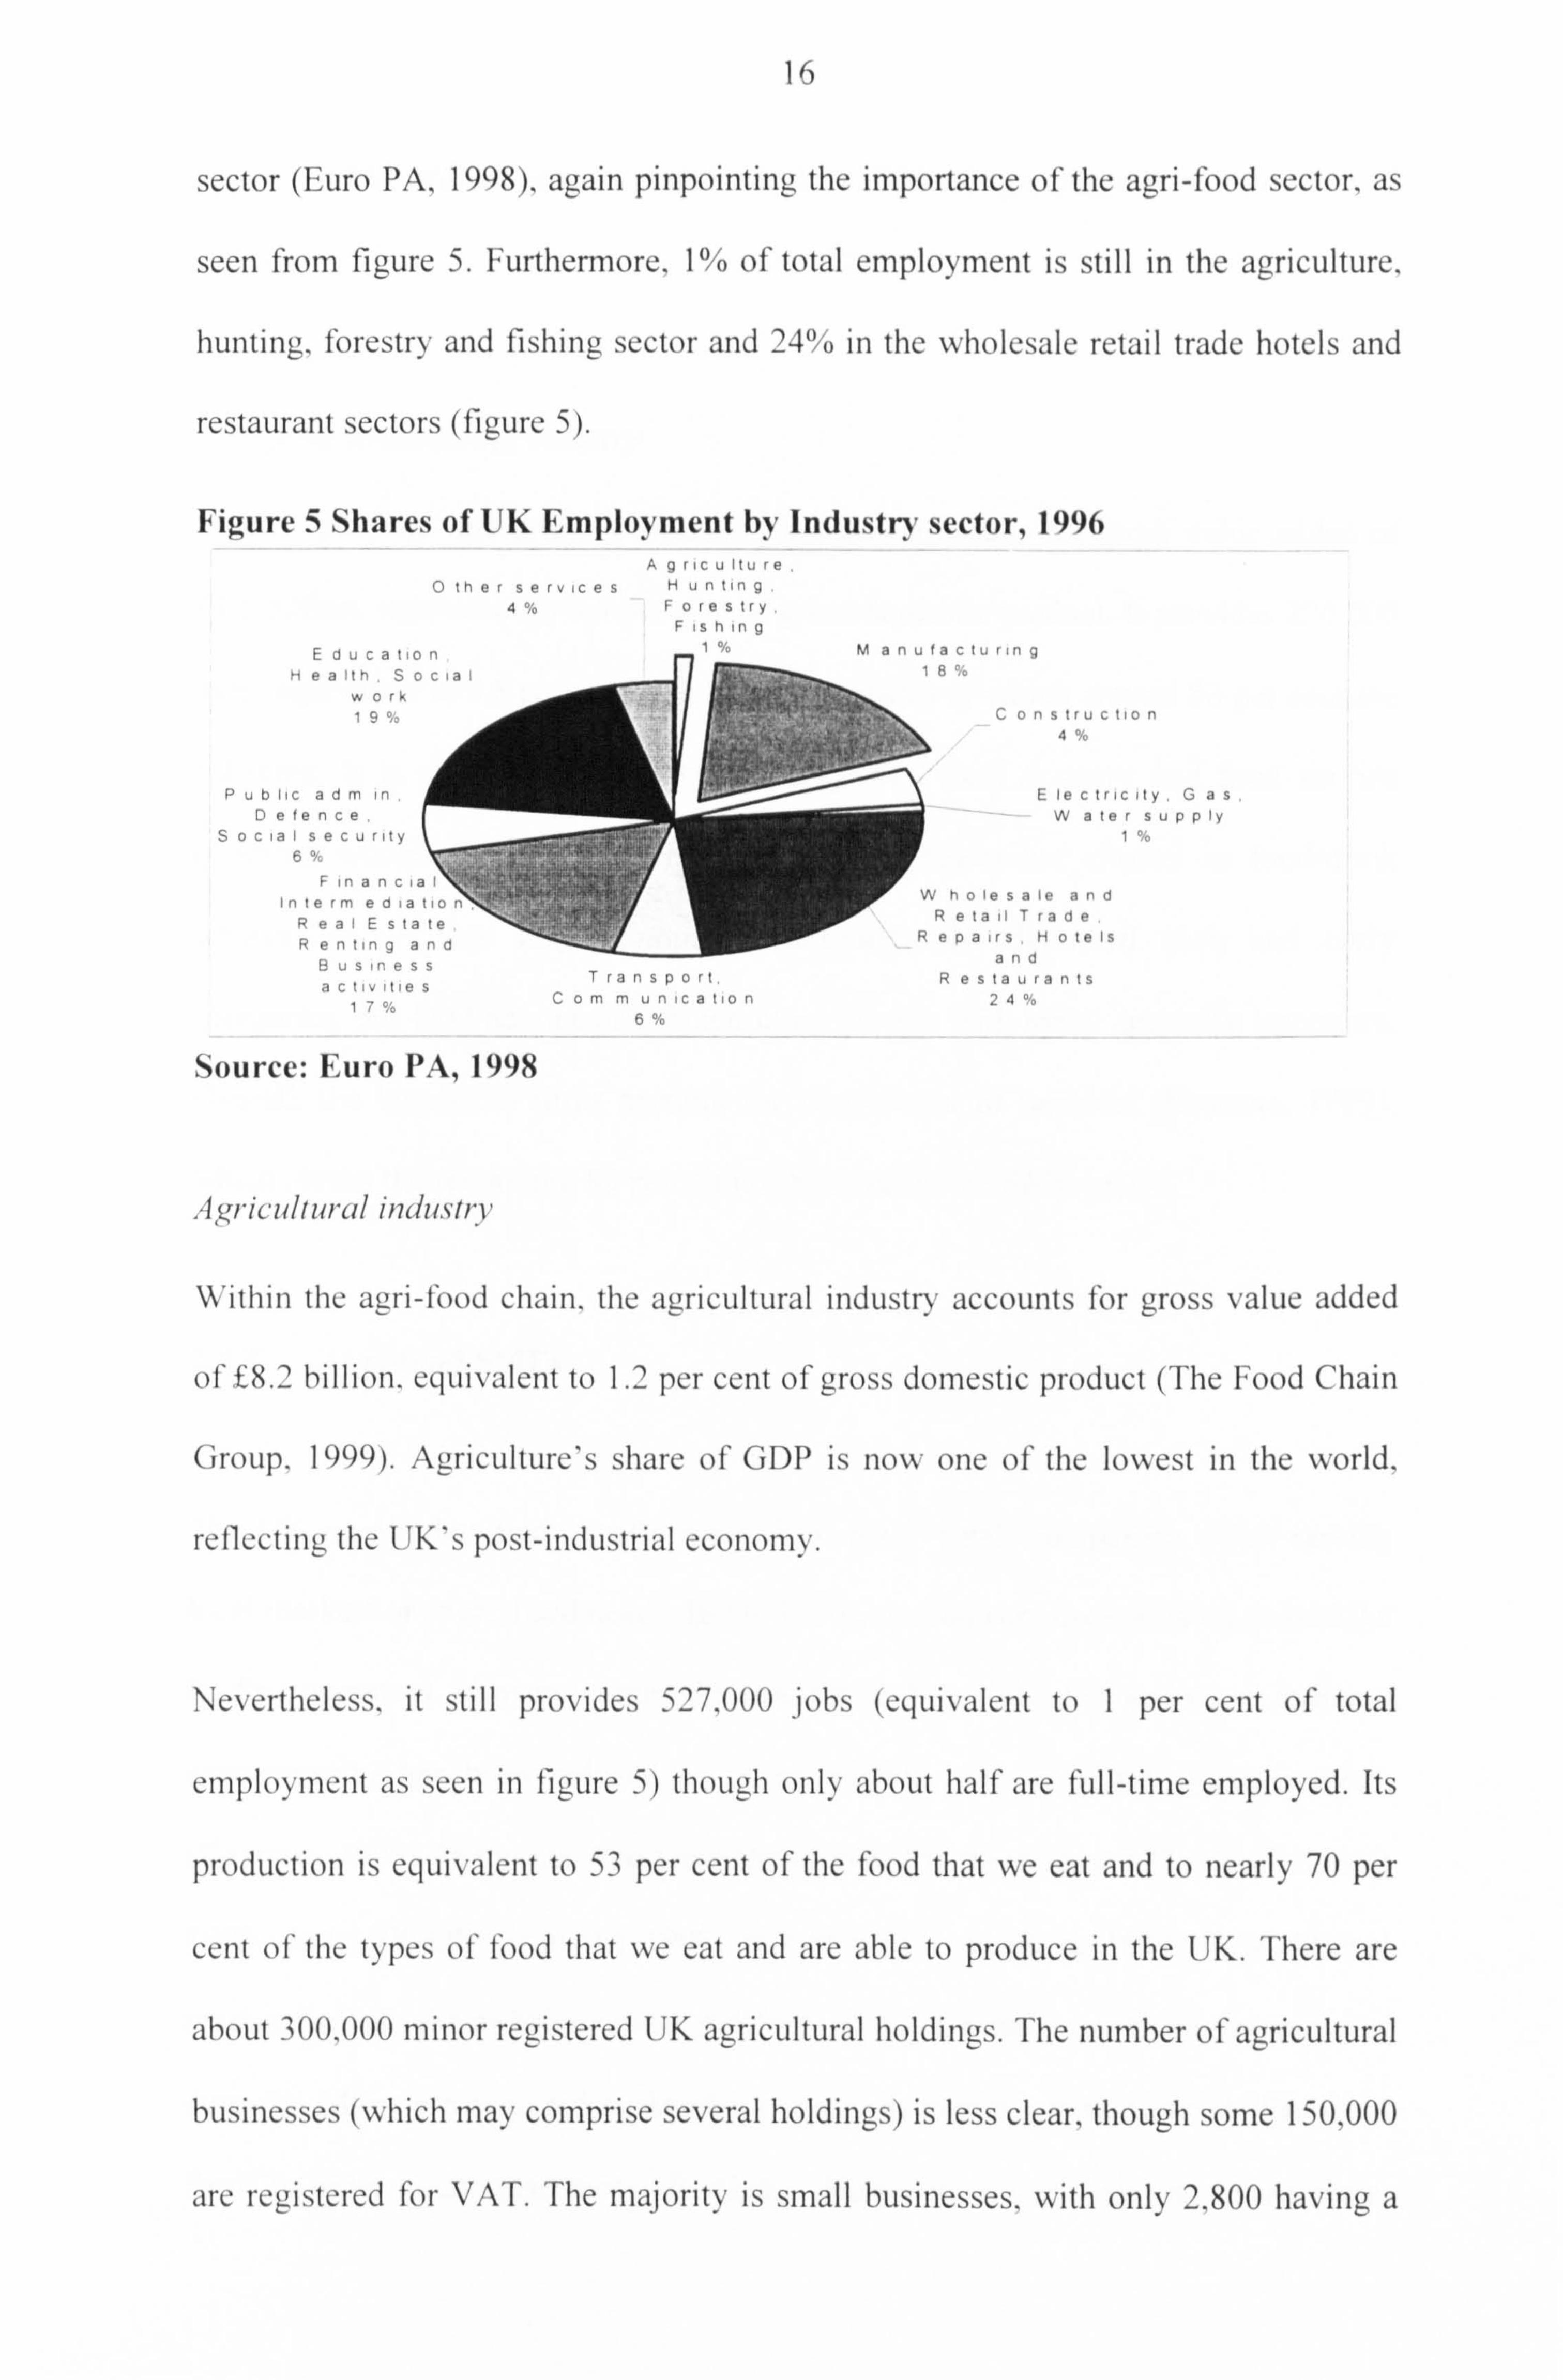
Within the manufacturing sector. food and drink processing activities are amongst
the top five sectors with more than 12% share of manufacturing GDP. as is clearly
shown from figure 4 below.
Figure4Share ofSectors ofUKCDP \en; uhure. tutu mc.
Other services Forestry and Fishing a°°
M anufacIunn¢ Pducatmn health 1011°
Social \u ork Aiming. Qua rrVmü I, °O
and Gas extract n
°
Public admin. Defcn. c Social seeunn `, ', ý ý`" Electncity Gas.
Water supph
Financial Intermcdi riioi. :r
%
( onsiruclion
Real Estate.
Renting and Business Nhuleszle. Retail Trade,
-\ctiýnies ]J°° Transport. Storage.
Hotels and Restaurants
14°° C ummumcatiun 11°.
Source: Euro PA (1998) Of the 18% of employment in manufacturing, 11% is in the food and beverages
16
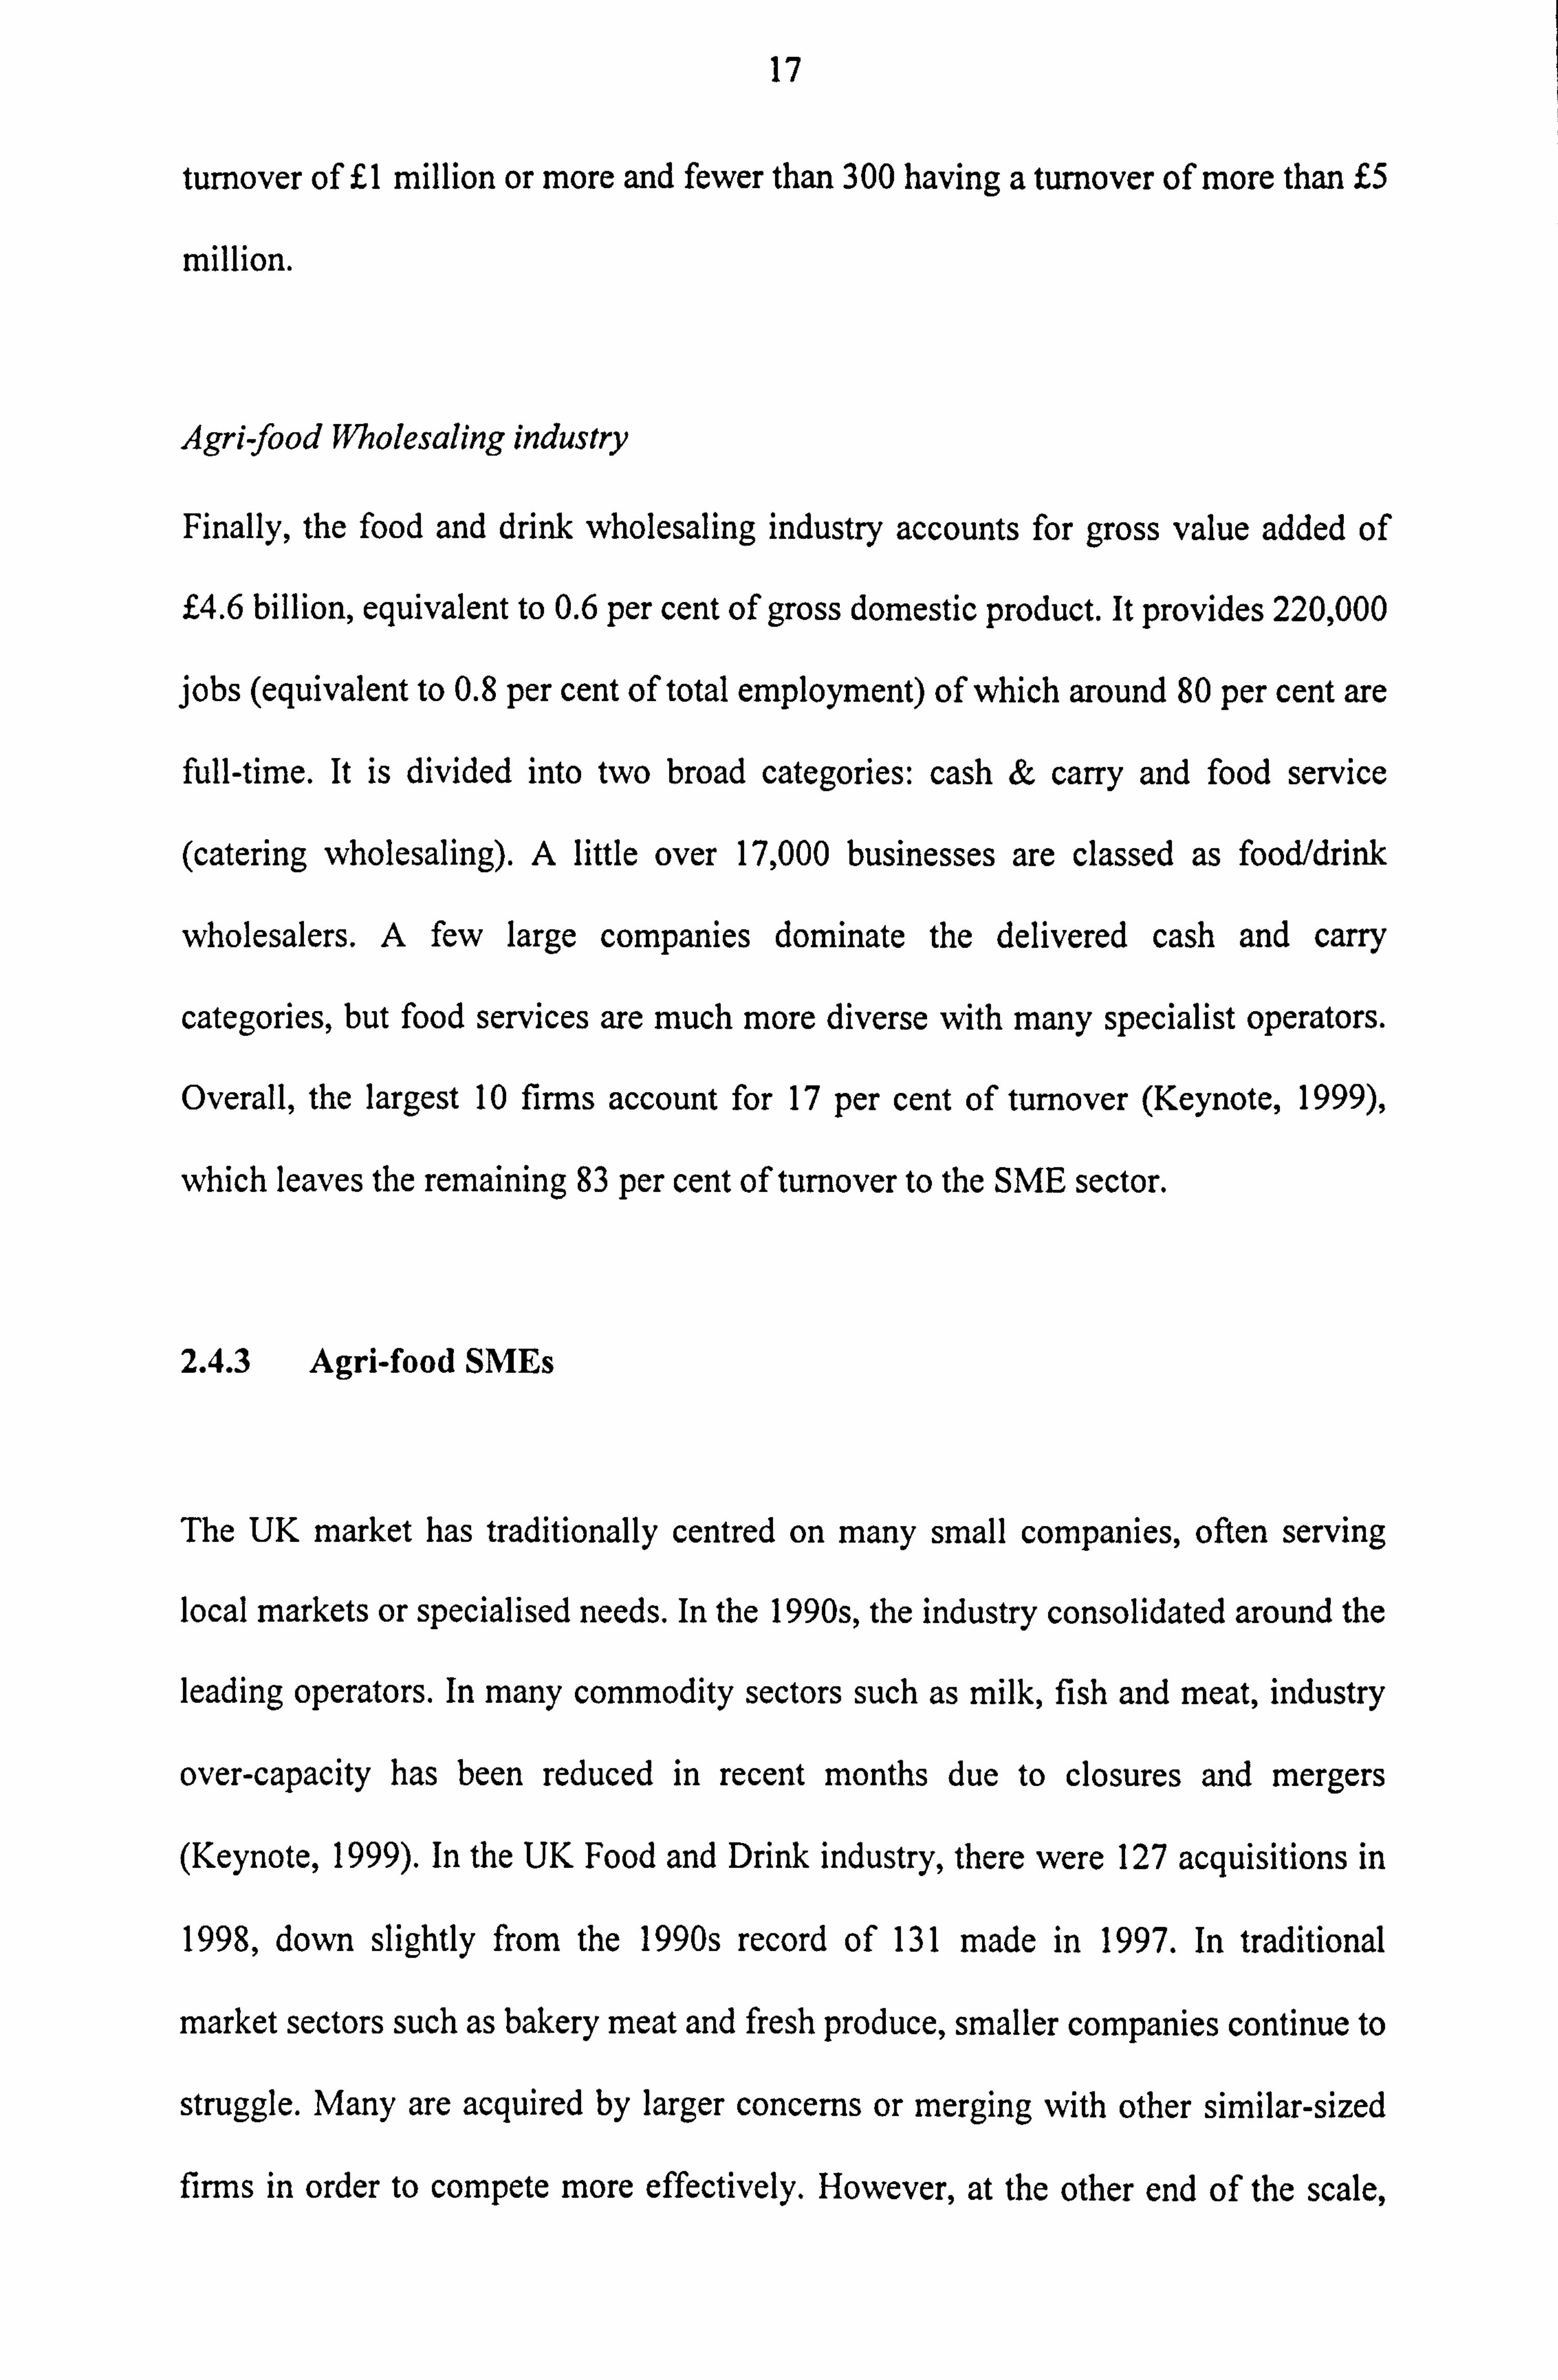
sector (Euro PA, 1998), again pinpointing the importance of the agri-food sector, as
seen from figure 5. Furthermore, 1% of total employment is still in the agriculture,
hunting, forestry and fishing sector and 24% in the wholesale retail trade hotels and
restaurant sectors (figure 5).
Figure 5 Shares of UK Employment by Industr-*" sector, 1996 Agricu Itu re
Other services Hunting
40F ores try Fi shin g
c,. ... ..,. .. I°ý M anutacturina
Hea It- - ''
S
wcr.
Pub lia adm D ete n ce
Soc is isecur. ty 6
F in anc is In term edat ,o
ReaIEstate
Ren tin gaud 8us in ess
ac tiv lire s
176
Source: Euro PA, 1998
/igricul ral industry
Cnns tru c do n 4%
le cIric ity Gas N afar supply
.ýhr le 5 lI .ý .1
RetaiITra It e
Repairs, Hotels
and Res tau rants
24%
Within the agri-food chain, the agricultural industry accounts for gross value added
off8.2 billion. equivalent to 1.2 per cent of gross domestic product (The Food Chain
Group. 1999). Agriculture's share of GDP is now one of the lowest in the world.
reflecting the UK's post-industrial economy.
Nevertheless, it still provides 527.000 jobs (equivalent to 1 per cent of total
employment as seen in figure 5) though only about half are full-time employed. Its
production is equivalent to 53 per cent of the food that we eat and to nearly 70 per
cent of the types of food that we eat and are able to produce in the UK. There are
about 300,000 minor registered UK agricultural holdings. The number of agricultural
businesses (which may comprise several holdings) is less clear, though some 150,000
, ý: ý _a
are registered for VAT. The majority is small businesses. with only 2.800 having a
Transport, Commun is a do n
6%
17
turnover of £1 million or more and fewer than 300 having a turnover of more than £5
million.
Agri food Wholesaling industry
Finally, the food and drink wholesaling industry accounts for gross value added of
£4.6 billion, equivalent to 0.6 per cent of gross domestic product. It provides 220,000
jobs (equivalent to 0.8 per cent of total employment) of which around 80 per cent are
full-time. It is divided into two broad categories: cash & carry and food service
(catering wholesaling). A little over 17,000 businesses are classed as food/drink
wholesalers. A few large companies dominate the delivered cash and carry
categories, but food services are much more diverse with many specialist operators.
Overall, the largest 10 firms account for 17 per cent of turnover (Keynote, 1999),
which leaves the remaining 83 per cent of turnover to the SME sector.
2.4.3 Agri-food SMEs
The UK market has traditionally centred on many small companies, often serving
local markets or specialised needs. In the 1990s, the industry consolidated around the
leading operators. In many commodity sectors such as milk, fish and meat, industry
over-capacity has been reduced in recent months due to closures and mergers
(Keynote, 1999). In the UK Food and Drink industry, there were 127 acquisitions in
1998, down slightly from the 1990s record of 131 made in 1997. In traditional
market sectors such as bakery meat and fresh produce, smaller companies continue to
struggle. Many are acquired by larger concerns or merging with other similar-sized
firms in order to compete more effectively. However, at the other end of the scale,
18
among the larger food and drink companies in the UK, there has been a general trend
towards refocusing on core activities and divesting smaller, non-core businesses
(Leatherhead, 1999).
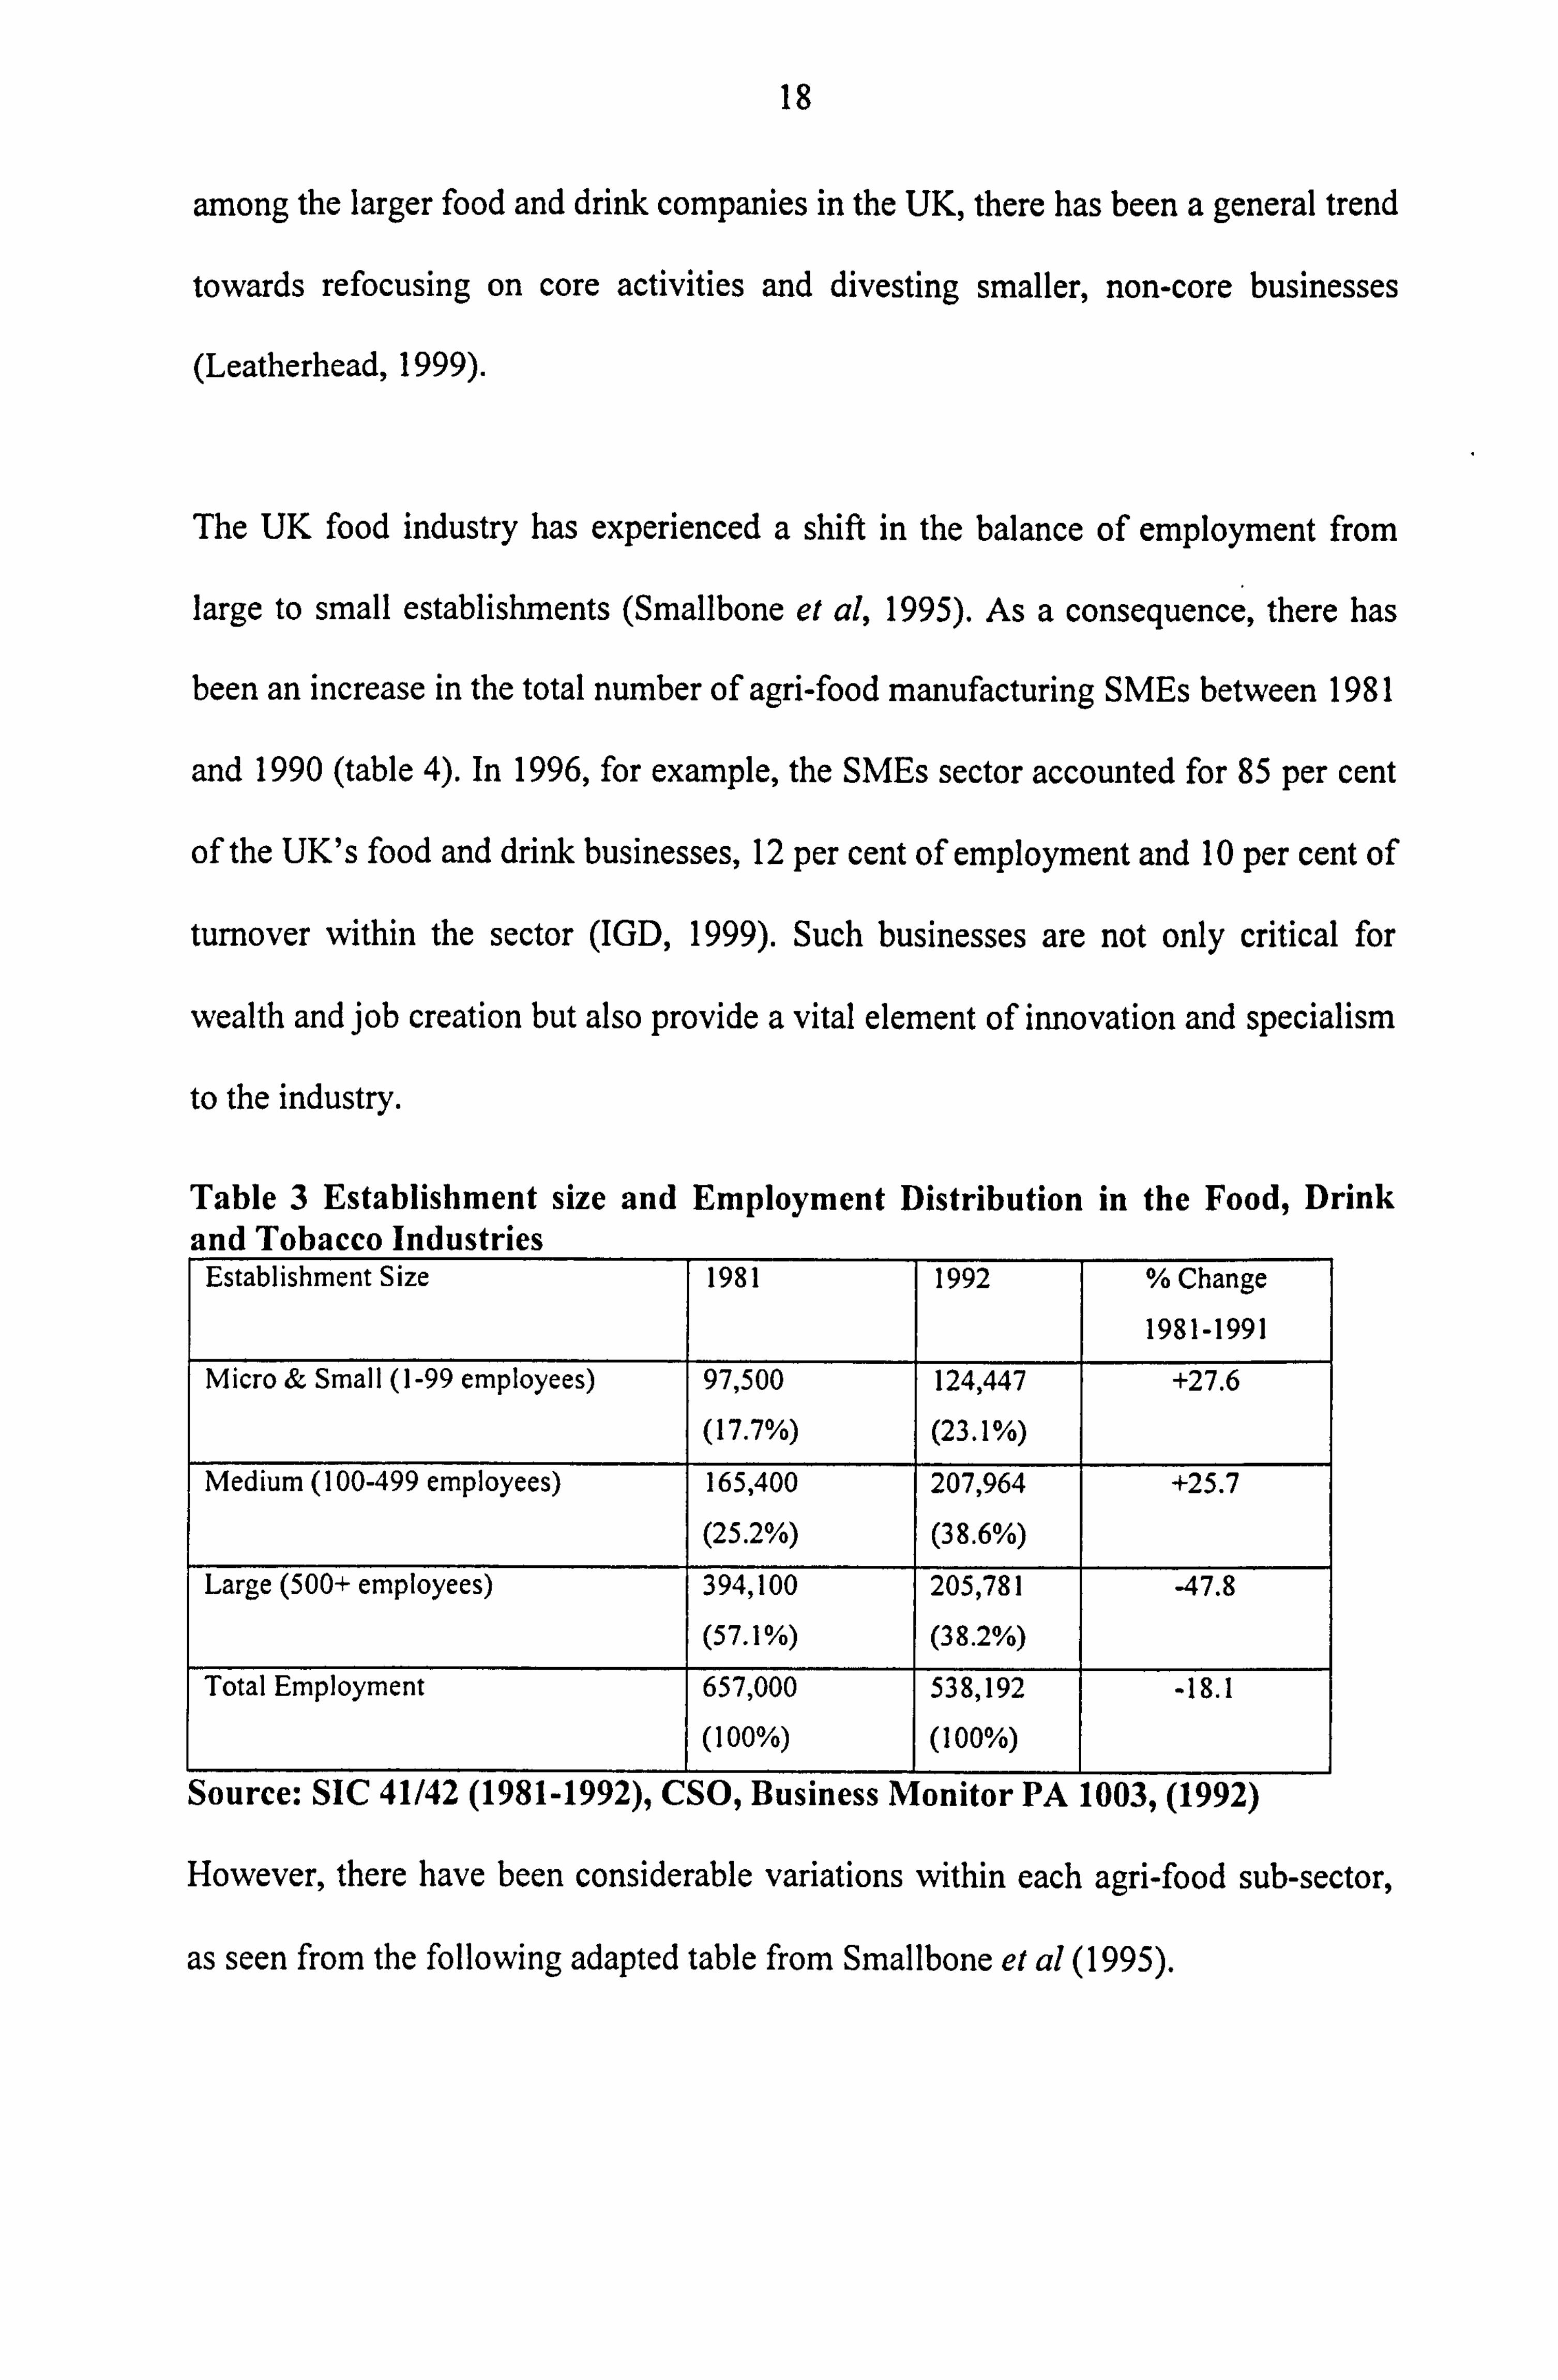
The UK food industry has experienced a shift in the balance of employment from
large to small establishments (Smallbone et al, 1995). As a consequence, there has
been an increase in the total number of agri-food manufacturing SMEs between 1981
and 1990 (table 4). In 1996, for example, the SMEs sector accounted for 85 per cent
of the UK's food and drink businesses, 12 per cent of employment and 10 per cent of
turnover within the sector (IGD, 1999). Such businesses are not only critical for
wealth and job creation but also provide a vital element of innovation and specialism
to the industry.
Table 3 Establishment size and Employment Distribution in the Food, Drink and Tobacco Industries Establishment Size 1981 1992 % Change
1981-1991
Micro & Small (1-99 employees) 97,500 124,447 +27.6
(17.7%) (23.1%)
Medium (100-499 employees) 165,400 207,964 +25.7
(25.2%) (38.6%)
Large (500+ employees) 394,100 205,781 -47.8 (57.1%) (38.2%)
Total Employment 657,000 538,192 -18.1 (100%) (100%)
Source: SIC 41/42 (1981-1992), CSO, Business Monitor PA 1003, (1992)
However, there have been considerable variations within each agri-food sub-sector,
as seen from the following adapted table from Smalibone et al (1995).
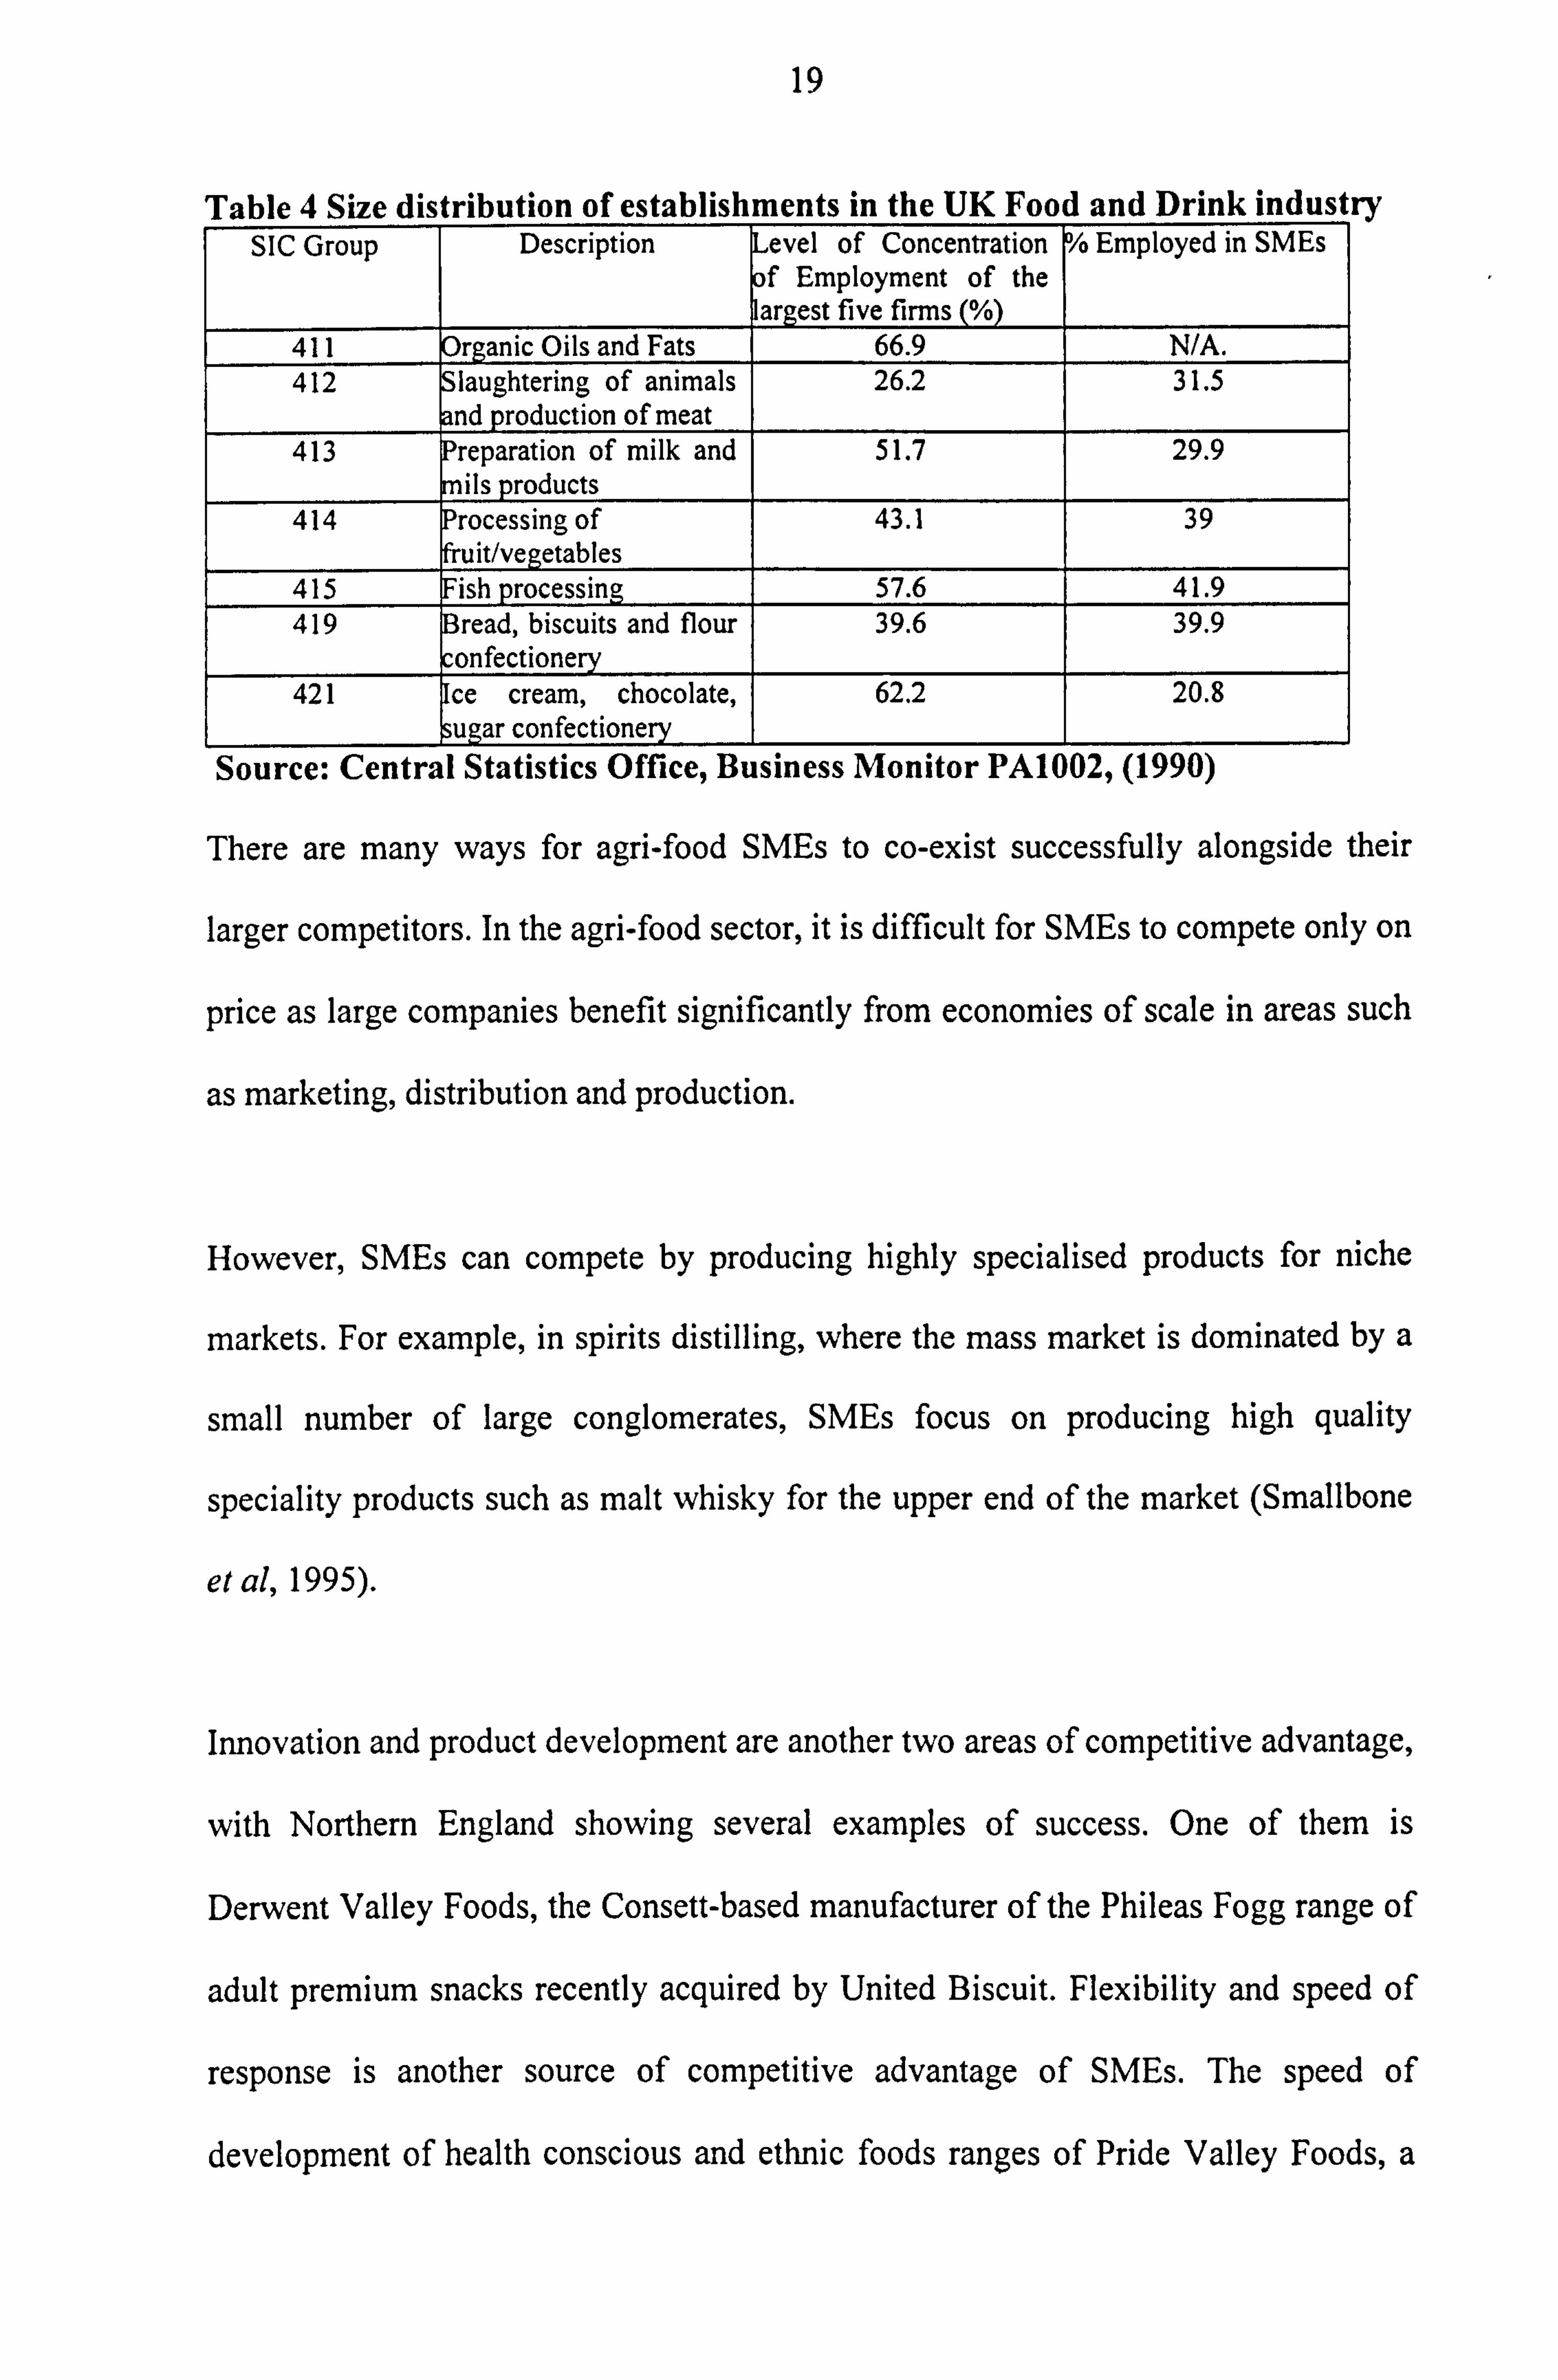
19
Table 4 Size distribution of establishments in the UK Food and Drink industry SIC Group Description Level of Concentration /o Employed in SMEs
of Employment of the ar est five firms
411 Organic Oils and Fats 66.9 N/A. _ 412 Slaughtering of animals 26.2 31.5
and production of meat 413 reparation of milk and 51.7 29.9
mils prod cts 414 Processing of 43.1 39
fruit/vegetables 415 Fish processing 57.6 41.9 419 read, biscuits and flour 39.6 39.9
confectionery 421 ce cream, chocolate, 62.2 20.8
u ar confectionery Source: Central Statistics Office, Business Monitor PA1002, (1990)
There are many ways for agri-food SMEs to co-exist successfully alongside their
larger competitors. In the agri-food sector, it is difficult for SMEs to compete only on
price as large companies benefit significantly from economies of scale in areas such
as marketing, distribution and production.
However, SMEs can compete by producing highly specialised products for niche
markets. For example, in spirits distilling, where the mass market is dominated by a
small number of large conglomerates, SMEs focus on producing high quality
speciality products such as malt whisky for the upper end of the market (Smallbone
et al, 1995).
Innovation and product development are another two areas of competitive advantage,
with Northern England showing several examples of success. One of them is
Derwent Valley Foods, the Consett-based manufacturer of the Phileas Fogg range of
adult premium snacks recently acquired by United Biscuit. Flexibility and speed of
response is another source of competitive advantage of SMEs. The speed of
development of health conscious and ethnic foods ranges of Pride Valley Foods, a
20
successful and innovative Northern company, shows the possibilities of the Northern
region to become more competitive and reduce the gap with the South.
Some SMEs supply national markets with basic products through supply
relationships with major retail chains and caterers. Other firms are highly niche
focused (for example speciality foods, a market worth approximately £3 billion)
supplying national and sometimes international markets with a high quality branded
product (malt whisky or quality chocolates) or specialise in supplying particular
segments of the market (ethnic or health foods). Such firms may be own-label
suppliers to the retail trade, although they may also have branded products within
their portfolio (May, 1997). Finally, there are SMEs that serve predominantly local
markets either because they are unable to compete at a national level in price or
production terms, or because they wish to avoid becoming overly dependent on the
large retail chains.
2.5 Social trends in the agri-food industry
In terms of trends, food share of total consumer spending has been falling steadily,
and similarly food business numbers have been declining in recent years (Keynote,
1999). The rapid development of out-of-town superstores across the UK offering
convenience and a wide-choice of goods has created a one-stop shopping experience
for the family and at the same time was the major factor behind the closure of
smaller food retailers. More specifically, over the past thirty years, supermarkets
have developed through diversification and growth. On the other end of the scale,
this trend has led to a decline in independent grocers, retailers, butchers and
21
neighbourhood stores. It has also led to a decline in trade of food wholesalers such as
cash and carry, delivered wholesalers and so on. Public concerns on issues like
Genetically Modified Foods and food safety, have recently added pressure to the
dynamic environment of the agri-food industry. This has also led to supermarkets
sourcing their products through preferred suppliers, which in turn have designated
groups supplying them to a particular specification (Mintel, 1998).
Furthermore, rapid changes of consumer preferences with more emphasis on
convenience foods and functional foods (Wood, 1998) an ageing population, rise of
single member households, the increasing role of women as consumers/employees
are all some of the new forces that influence and change both the retailers and the
agri-food chain beyond recognition (Mintel, 1998). The increase in expenditure on
food services is providing important opportunities as well as threats to the chain. For
example, Tesco is investing heavily in its new e-business by creating 8000 new jobs
in the UK alone and 12,000 world-wide (Marketing Week, 2000). This trend towards
less time spent on food preparation will make the chain even more segmented, and
will provide potential niche markets for SMEs (The Food Chain Group, 1999).
Because of the continuous pressure on the UK agri-food industry, for example the
cost of new regulation (Heasman and Henson, 1997), and since the UK agri-food
industry lacks behind the European competition, (Mann, 1999), there is further need
for research in the competitiveness of the agri-food SME sector.

22
2.6 Summary
In this chapter, an environmental analysis was taken and issues relating to the UK
SMEs and the agri-food industry were discussed. Furthermore, some social trends of
the overall industry were analysed together with some future trends and possibilities
for northern agri-food SMEs competing in the market. In the next chapter, there will
be a discussion of the literature relating to agri-food SMEs with particular relevance
to marketing.
23
Chapter 3 LITERATURE REVIEW
3.1 Introduction
This chapter discusses the comparative, integrated model to marketing research in
agri-food SMEs. It is divided into two parts. The first part describes the approach
used in the thesis to do research in marketing of agri-food SMEs. In doing so, it
analyses the current state of research in marketing and agri-food marketing. It also
identifies and clarifies their differences. It then proposes the blending of the
transactional and relational marketing approaches for this research project.
The second part of the review proposes a comparative, integrated model to research
marketing in agri-food SMEs. It suggests the use of the comparative study of
independent and subsidiary SMEs in order to gain a better understanding of the effect
and importance of marketing, as Shrader and Simon (1997) and Cooper (1993)
suggested. This part also argues for an integrative model in researching marketing in
SMEs. By doing so, it identifies the possible models, critically examines them and
proposes the comparative integrated model to research in marketing in agri-food
SMEs.
24
3.2 The approach
3.2.1 Marketing and agri-food marketing; a definition and the state of
current research.
Defining marketing is, and has always been, very controversial. According to
Webster, (1992) marketing had a managerial approach in the 1950s and 1960s, but
has evolved to reach today's relational character.
Early managerial authors identified marketing as a decision making or problem
solving process and relied on analytical frameworks from economics, psychology,
sociology and statistics. Marketing analysis focused on demand, costs and
profitability, and the use of traditional economic analysis to find the point where
marginal costs equal marginal revenue. This fitted well with strategy structure and
culture of multinational, hierarchical organisations. One of the few examples of
marketing analysis at the time was Levitt's attempt to identify the problems with
many US based organisations in terms of not identifying their market segments
properly and failing to take opportunities, what he termed as marketing myopia
(Levitt, 1960).
In the late 1960s, Kotler and Levy discussed, in one of the most influential papers in
marketing, the broadening concept of marketing (Kotler and Levy, 1969). They
argued that marketing does not only apply to business but also to non-business
organisations like universities, hospitals etc. They believed that marketing is a
pervasive activity that goes beyond the selling of toothpaste or soap and concluded
25
by stating that the marketing concept should guide all non-business organisations if
they are to succeed.
In the 1970s and 1980s, the concept of strategic business unit (SBU) emerged.
Marketing became more decentralised, which resulted in the disappearance of the
middle layers of management. Downsizing and delayering, in order to reduce costs,
was the norm. Bagozzi (1975) argued in favour of a new paradigm which viewed
marketing as exchanges. This was the first indication that marketing was moving
away from the traditional optimisation problem towards a more interactionist
approach.
During the 1980s, new forms of business organisations emerged. There was a shift
away from formal contracting and managerial reporting towards increased emphasis
on flexibility, multiple types of ownership, partnering within the organisation and
sharing of technologies. Marketing was identified as the process whereby an
organisation accurately identifies and meets its customers' needs and wants, in order
to fulfil its objectives (Ritson, 1986). Houston, (1986, p. 85) proposed the concept
that the achievements of an entity's exchange-determined goals are most efficiently
met through a thorough understanding of the needs and wants of the potential
exchange partners. The latter is accomplished by comprehending the costs associated
with satisfying those needs and wants, and then designing producing and offering
products in light of this understanding. At an operational level, the American
Marketing Association defined the marketing concept as follows:
26
"Marketing is the process of planning and executing the conception, pricing,
promotion and distribution of ideas, goods and services to create exchange and
satisfy individual and organisational objectives"
(AMA, 1985).
One of the main limitations in defining marketing is that in many instances, the
practitioners' opinion is ignored. The Economic and Social Research Council
(ESRC) attempted to capture the practitioners' perspective in marketing. They
conducted a large-scale survey investigating attitudes of UK executives towards
marketing and the organisation and execution of their marketing efforts (Hooley and
Lynch, 1991). They found that in terms of approaches to marketing, they could group
the respondents into the following four categories.
1. Marketing philosophers see marketing as a function with the responsibility of
identifying and meeting customers' needs and as a philosophy for the whole
organisation. They also do not see marketing confined to the marketing
department, but as integrated between all functions of the organisations.
2. Sales supporters hold the view that marketing was about sales and promotions
and it was restricted to the marketing department.
3. Departmental marketers believe that though marketing is confined to the
marketing department, it is central for the identification and meeting of
customers needs.
4. The `unsures' did not accept any of statements of the questionnaire as exactly
describing the role of marketing in their companies.
27
An interesting result is that most of the companies grouped as marketing
philosophers, were the consumer marketers including parts of the agri-food industry
(Hooley and Lynch, 1991). However, there are distinct differences between
traditional marketing and agri-food marketing.
Agri-food marketing has its roots in the early 20th century. American Midwestern
universities and farmers were interested in the processes by which products were
brought from the farmers to the market and the end consumer. Analysis was also
involved with the determination of prices for those agricultural products. As Webster
points out (1992) these early approaches to the study are interesting because they do
not have a managerial orientation. Marketing was perceived as a set of social and
economic processes rather than a set of managerial activities and responsibilities.
Similarly, Jones (1990) refers to a number of articles and books published in the
1920s referring to marketing of farm products. However, marketing in Europe took
off in the second half of the century. The Chair of Agricultural Marketing established
in the University of Newcastle in 1963 was the first in Europe with the term
"marketing" in its title.
Agricultural marketing, in contrast to marketing, is used as a descriptive word
referring to part of the economy, namely the agricultural or food sector. Its main
preoccupation has been with economic structure and efficiency of the agricultural
marketing sector, and the government's role in intervening to improve the
performance of agricultural markets and increasing the share of expenditure on food
received by farming (Ritson, 1997). However in the late 1980s and 1990s there has
28
been general agreement that agri-food marketing is converging with the general
principle of marketing management (Meulenberg, 1986, Richardson, 1986), despite
earlier criticisms and arguments against a business approach to agri-food marketing
(Watson, 1983).
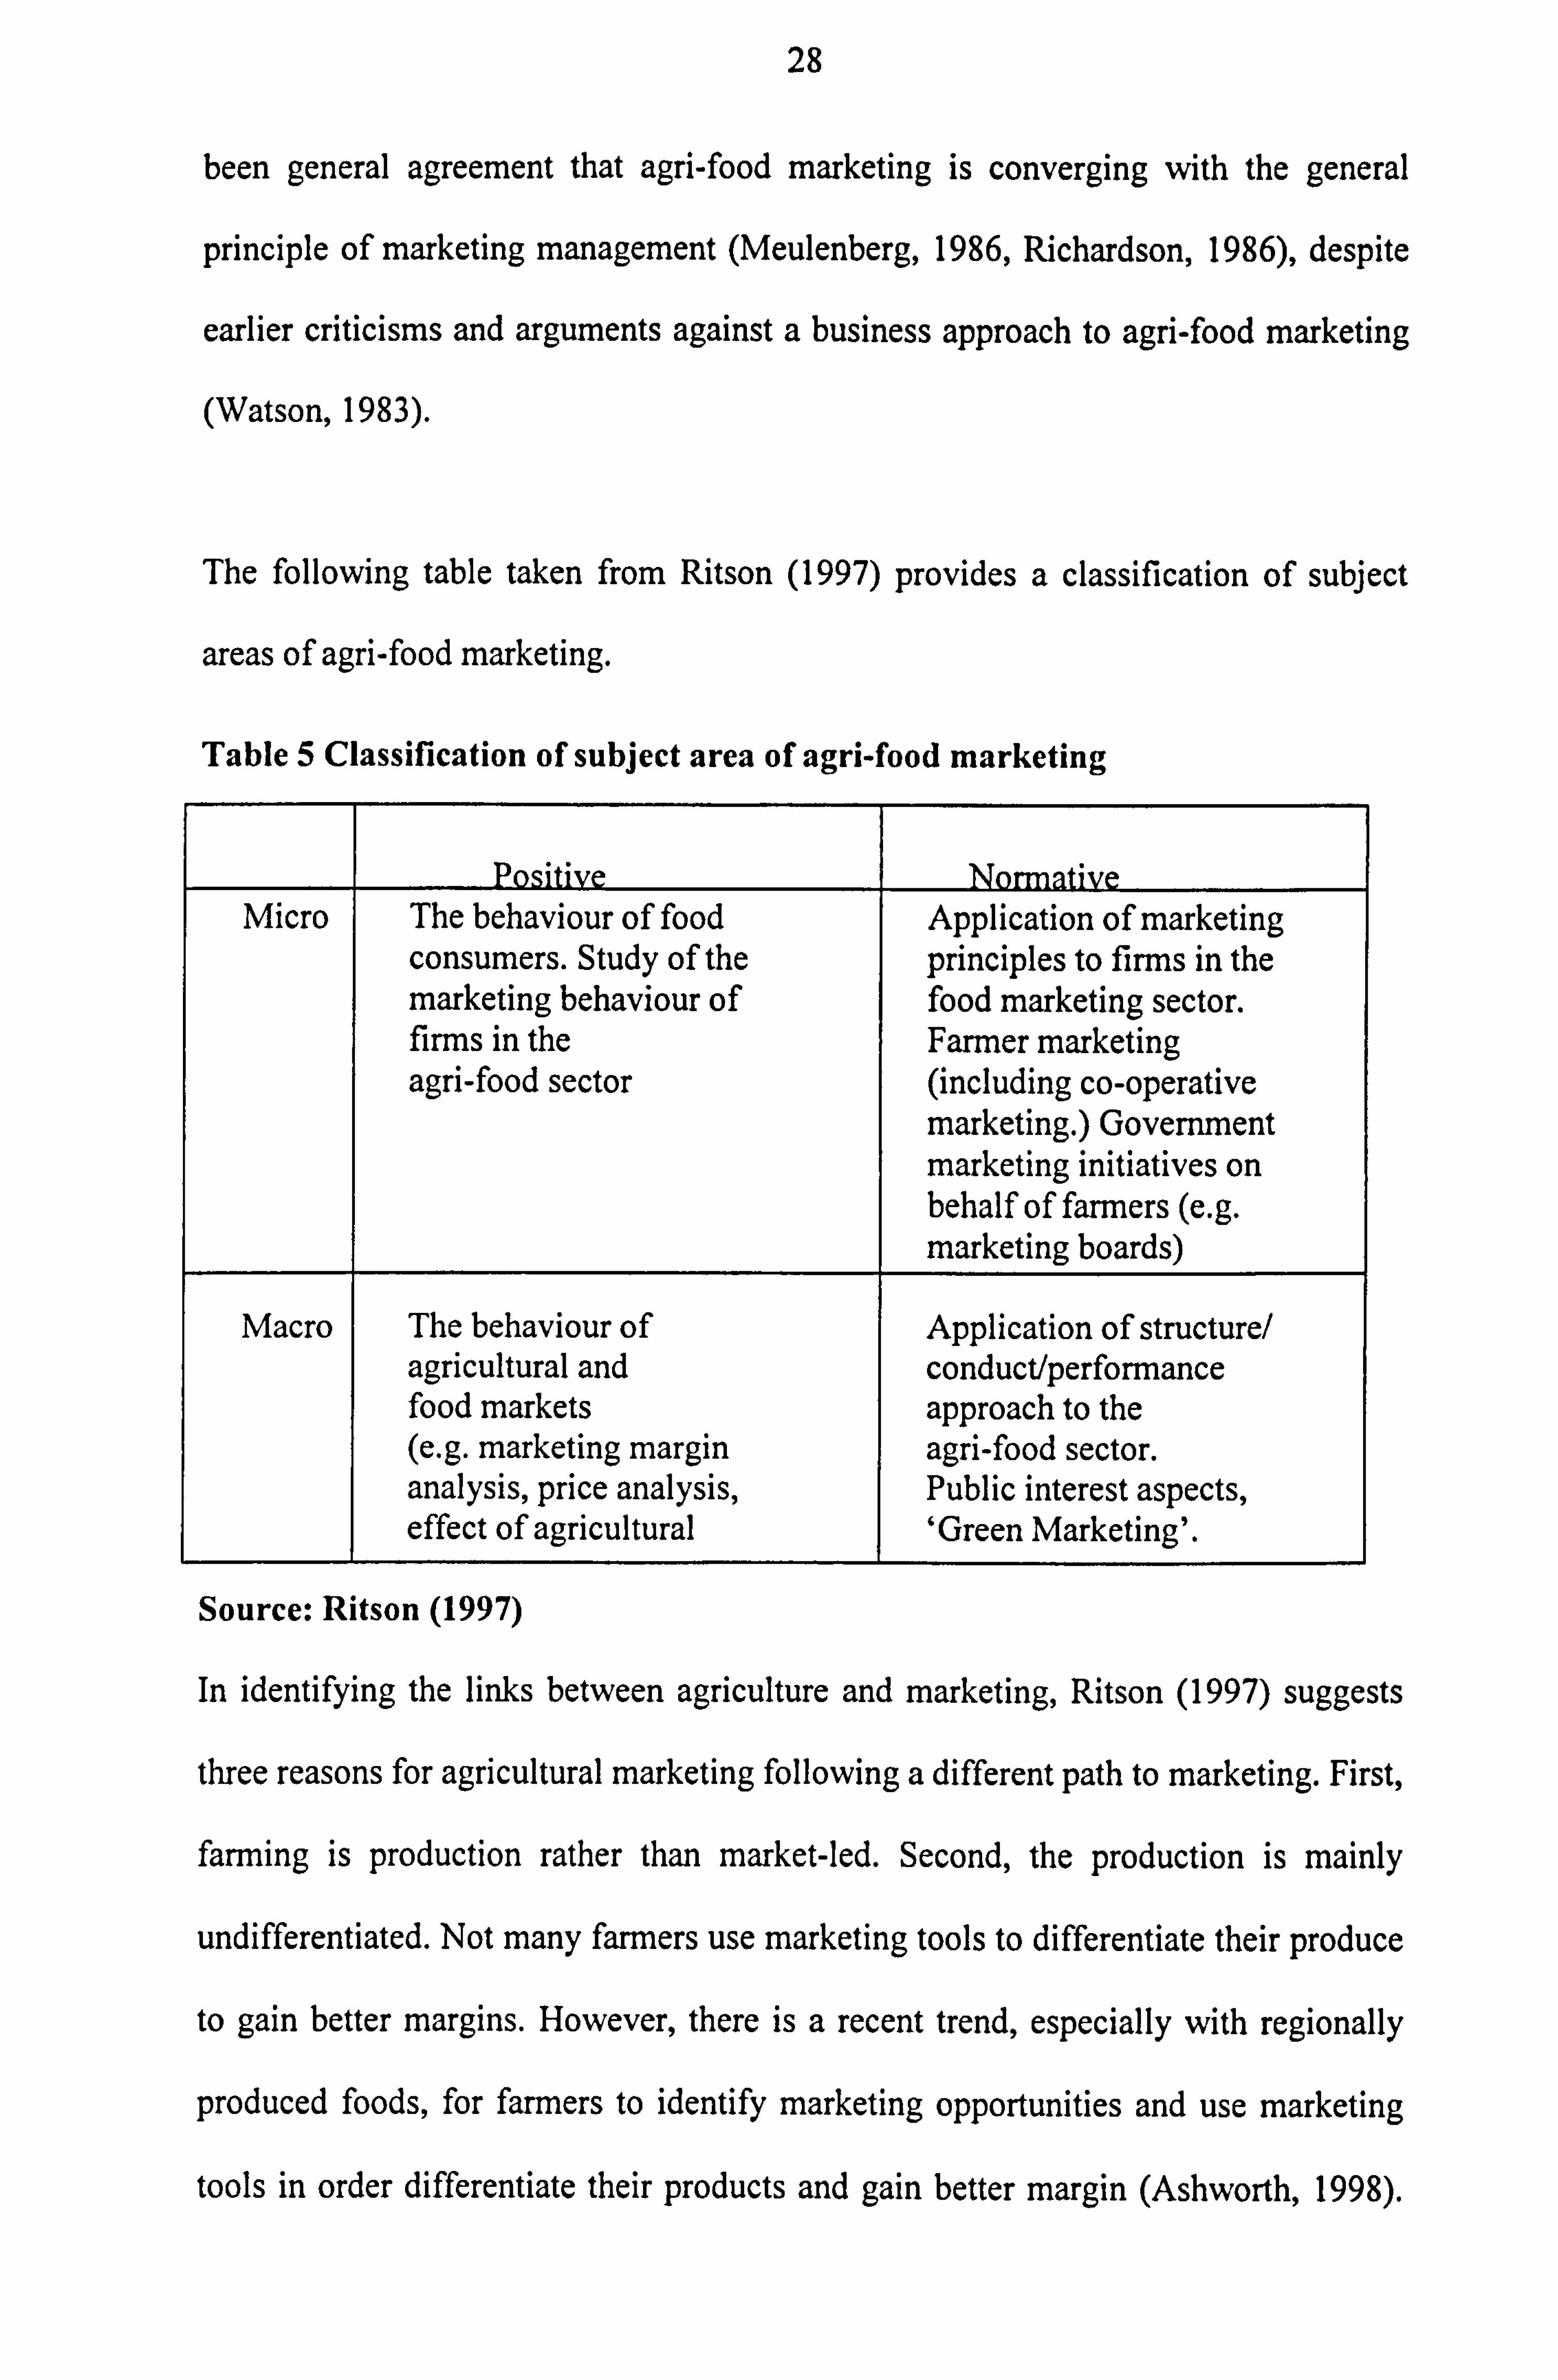
The following table taken from Ritson (1997) provides a classification of subject
areas of agri-food marketing.
Table 5 Classification of subject area of agri-food marketing
Positive Normative Micro The behaviour of food Application of marketing
consumers. Study of the principles to firms in the marketing behaviour of food marketing sector. firms in the Farmer marketing agri-food sector (including co-operative
marketing. ) Government marketing initiatives on behalf of farmers (e. g. marketing boards)
Macro The behaviour of Application of structure/ agricultural and conduct/performance food markets approach to the (e. g. marketing margin agri-food sector. analysis, price analysis, Public interest aspects, effect of agricultural `Green Marketing'.
Source: Ritson (1997)
In identifying the links between agriculture and marketing, Ritson (1997) suggests
three reasons for agricultural marketing following a different path to marketing. First,
farming is production rather than market-led. Second, the production is mainly
undifferentiated. Not many farmers use marketing tools to differentiate their produce
to gain better margins. However, there is a recent trend, especially with regionally
produced foods, for farmers to identify marketing opportunities and use marketing
tools in order differentiate their products and gain better margin (Ashworth, 1998).
29
Finally, farmers are geographically remote from the final consumer. Food value
typically more than doubles between farm gate and retail sale, and this process is
controlled by businesses independent of farmers. Most of the opportunities for
profitably matching organisational objectives with consumer requirements occur at
this part of the supply chain. As we move further down the supply chain, from farmer
to consumer, opportunities for businesses to exploit marketing advantages increase.
Therefore, marketing in the agri-food industry has more similarities with business to
business or transactional marketing rather than some traditional consumer marketing.
As well as the Ministry of Agriculture, Fisheries and Food (MAFF) which is
interested in this project, other researchers of agri-food marketing have claimed that
the sector is in more need of improving its level of market orientation than many
other industries (Bove et al, 1996). One of the few attempts at applying the
marketing orientation concept to the agri-food industry has been made by some
Danish researchers like Grunert et al (1996). They made two recommendations for
research directions; first the combination of research methodologies into a
contingency theory of company competencies, and second the creation of a catalogue
of competencies of relevance on the agri-food industry (Grunert et al, 1996, p. 252).
Both of these recommendations will be followed in this research project.
This section defined marketing and agri-food marketing and identified its
differences, which are similar to differences between transactional and relational
marketing. The next section will examine the two issues in more detail.
30
3.2.2 Market orientation, the transactional approach.
Marketing academics and practitioners have been observing business performance in
order to see how market orientation has influenced performance. But what is market
orientation and what is its difference to our previous discussion of the marketing
concept?
Trustrum (1989) defines a marketing-oriented company as one that strives to satisfy
the customer but also to achieve a match between market requirements and
organisational capabilities. However, he continues, the company should not overstate
the need of customers. Whilst the customer's needs are important, the objective of
the marketing concept is to balance these with organisational capabilities to achieve
stated objectives.
Market orientation has been approached in two perspectives: ̀market orientation as a
philosophy of the organisations', that is linked to our previous discussion of the
marketing concept, as an overriding philosophy of the organisation, and `market
orientation as behaviour'. The operationalisation of market orientation by both
Narver and Slater (1990) and Kohli and Jaworski (1990) fall into the latter category,
and will be the topic of this section.
Kohli and Jaworski (1990) and Jaworski and Kohli (1993) consider a market oriented
organisation as one that's actions are consistent with the marketing concept. They
define market orientation as consisting of three organisation wide activities: market
31
intelligence generation; the dissemination of this intelligence across departments; and
responsiveness to intelligence.
Market intelligence generation consists of defining current and future needs of
customers, and identifying and monitoring exogenous market factors such as
competition, regulation, technology and so on. This is the responsibility of all
departments. Intelligence must be disseminated to the relevant departments and
individuals in order for the correct responses to be generated. The responsiveness of
this intelligence is conceptualised in two ways: firstly it consists of a response design
(developing plans in response to market intelligence) and response implementation
(the implementation of these plans). Again all departments participate in responding
to market trends.
The operationalisation of this model resulted into a 32-item measuring instrument.
The score for market orientation was calculated by equally weighting and summing
the item scores of the three components of intelligence generation, dissemination and
responsiveness.
In another study, a different measure of market orientation was provided. Narver and
Slater's (1990) definition of market orientation tries to include both the philosophical
and behavioural perspectives of market orientation. However, their operationalisation
is behavioural, reflecting the degree to which Strategic Business Units are engaged
with practices of customer orientation, competitor orientation and interfunctional
orientation. There are also two decision criteria, long term focus and profitability.
32
Customer and competitor orientation include all the activities involved in acquiring
information about the buyers and competitors in the target market and disseminating
it throughout the business (Narver and Slater, 1990, p. 21). Interfunctional co-
ordination is based on information from customers and competitors and comprises
the businesses' co-ordination effort to create superior value for the customer. This
typically involves more than the customer department. Market orientation, in order to
be effective needs a long-term focus even more so with today's competitive
environment (Narver and Slater, 1990). They also found that the overriding
objective of the business is profitability (or economic wealth) (Narver and Slater,
1990, p. 22).
Since then, a number of academics have applied the above models or a combination
thereof (Cadogan and Diamantopouos, 1995), in order to examine relationships
between market oriented companies and performance, within the domestic or
international environments.
UK studies on market orientation have produced some contradictory results. Hooley
and Lynch (1991) claim in their cross-sectional study of UK companies, that high
performing companies do more formal marketing planning than other organisations,
and that marketing's role in strategic planning is greater in better performing
companies. However, Greenley (1995) found, in another cross sectional UK study,
that the influence of market orientation on performance is highly moderated by the
external environment. Furthermore, there is evidence that larger companies in the
UK are more market oriented than medium sized ones, and that further research is
needed in order to investigate the reasons behind this (Liu, 1995).
33
There are also criticisms of the use of the models, even from their creators. Slater
(1995) argues that single industry studies have greater internal validity than multi-
industry studies. Market research studies should be conducted with smaller numbers
of businesses and more respondents in each business, if it is to be relevant. He
concludes by encouraging more longitudinal studies.
This section showed that transactional marketing could be defined differently by
academics and by practitioners. Furthermore, there is a lack of market orientation
research in the UK medium and smaller sized businesses with notable exception of
Cox et al (1994) and Brooksbanks (1990) studies, and very limited studies examining
the UK agri-food sector.
3.2.3 Marketing criticisms; the relational approach
Marketing, according to many scholars, is in a mid-life crisis. How this affects this
thesis, together with alternative viewpoints and approaches to marketing research
will be investigated.
Marketing, an art or a science, objective or subjective, realist or relativist? This
debate reached its peak in the mid 1980s and continued through to the end of the
1990s.
The first claim that marketing is a science, was made fifty-five years ago in
Converse's much cited article The Development of the Science of Marketing
(Converse, 1945). It was the beginning of a long debate in the 1950s and 1960s about
34
the status of marketing. In that first phase, the endeavours of marketing as a science
"won" the science or art debate (Brown, 1996, p. 246).
The second phase started in the beginning of the eighties when Paul Anderson
challenged the fundamental philosophical premises of marketing "science". He
questioned empiricism and concluded that in order for marketing to become a
science it should look to the recognised social and natural sciences for guidance, and
make a greater commitment to theory-driven programmatic research aimed at solving
cognitively and socially significant problems (Anderson, 1983). Peter and Olsen
(1983) showed that many aspects of scientific activity are consistent with basic
marketing concepts and processes. They also argued that the
relativistic/constructionist approach to marketing could produce more creative and
useful theories.
In later years, Hunt (Hunt, 1992; Hunt, 1993; Hunt, 1994; Hunt and Edison, 1995)
wrote extensively to defend his position on marketing as a science, first stated in
1976 (Hunt, 1976). The author argued that if qualitative techniques are to progress
and take their place as useful complements to quantitative methods, they need to
become more positivistic, (Hunt, 1994). Bass also suggests pursuing the traditional
path of empirical research as a guide to fruitful directions for future research in
marketing (Bass, 1993).
In the debate between Hunt and Anderson, Kavanagh (1994) argues that the
anthropocentric focus of the debate has limited the breadth of the philosophical
discussion on marketing. He also encourages researchers to look to the world of art
35
for metaphors and analogies, which might guide the future development of
marketing.
Some authors, both in consumer research and marketing research, have started, in the
mid-late eighties up to the end of the nineties, arguing in favour of the post-modern
approach in studies of marketing. For example, in examining whether marketing is
an art, Brown concludes that marketing has more similarities with the world of arts,
rather than with science (Brown, 1996). In Post-modern Marketing Brown criticises
most of academia for following the traditional positivistic logic in marketing (Brown,
1998a; Brown, 1995) and claims that the "four most horrifying, most blood-curdling
words in the marketing lexicon are ̀ I have a model'. " (Brown, 1998b, p. 226). There
have also been consumer researchers, most notably Hirschman, Holbrook, Firat and
Sherry (Holbrook, 1995; Hirschman and Holbrook, 1992; Firat et al, 1994; Sherry,
1990; Sherry, 1991) pursuing the path of post-modem marketing research.
An examination of Western marketing prescriptions and practices work in Eastern
European transitional economies concludes that the traditional Western marketing
models arc not entirely appropriate, even though Thomas (1994), is still "forced" to
use and consult them, assuming they are correct.
There has been a shift in marketing thought during the late 1980s and most of the
1990s, along the post"modcrnist marketing criticisms. Academics like Grönroos and
Foxall, started to question seriously the universal applicability of the marketing
concept. Foxall (1989) argues that the concept of exchange cannot be applied to say
family relations or crime prevention. Furthermore, he believes that the concept of
36
exchange is seriously distorted when applied to managerial social or non-business
marketing problems. He believes "matching" is a better concept than exchange to
delineate marketing's domain. Moreover, some of the most prominent advocates of
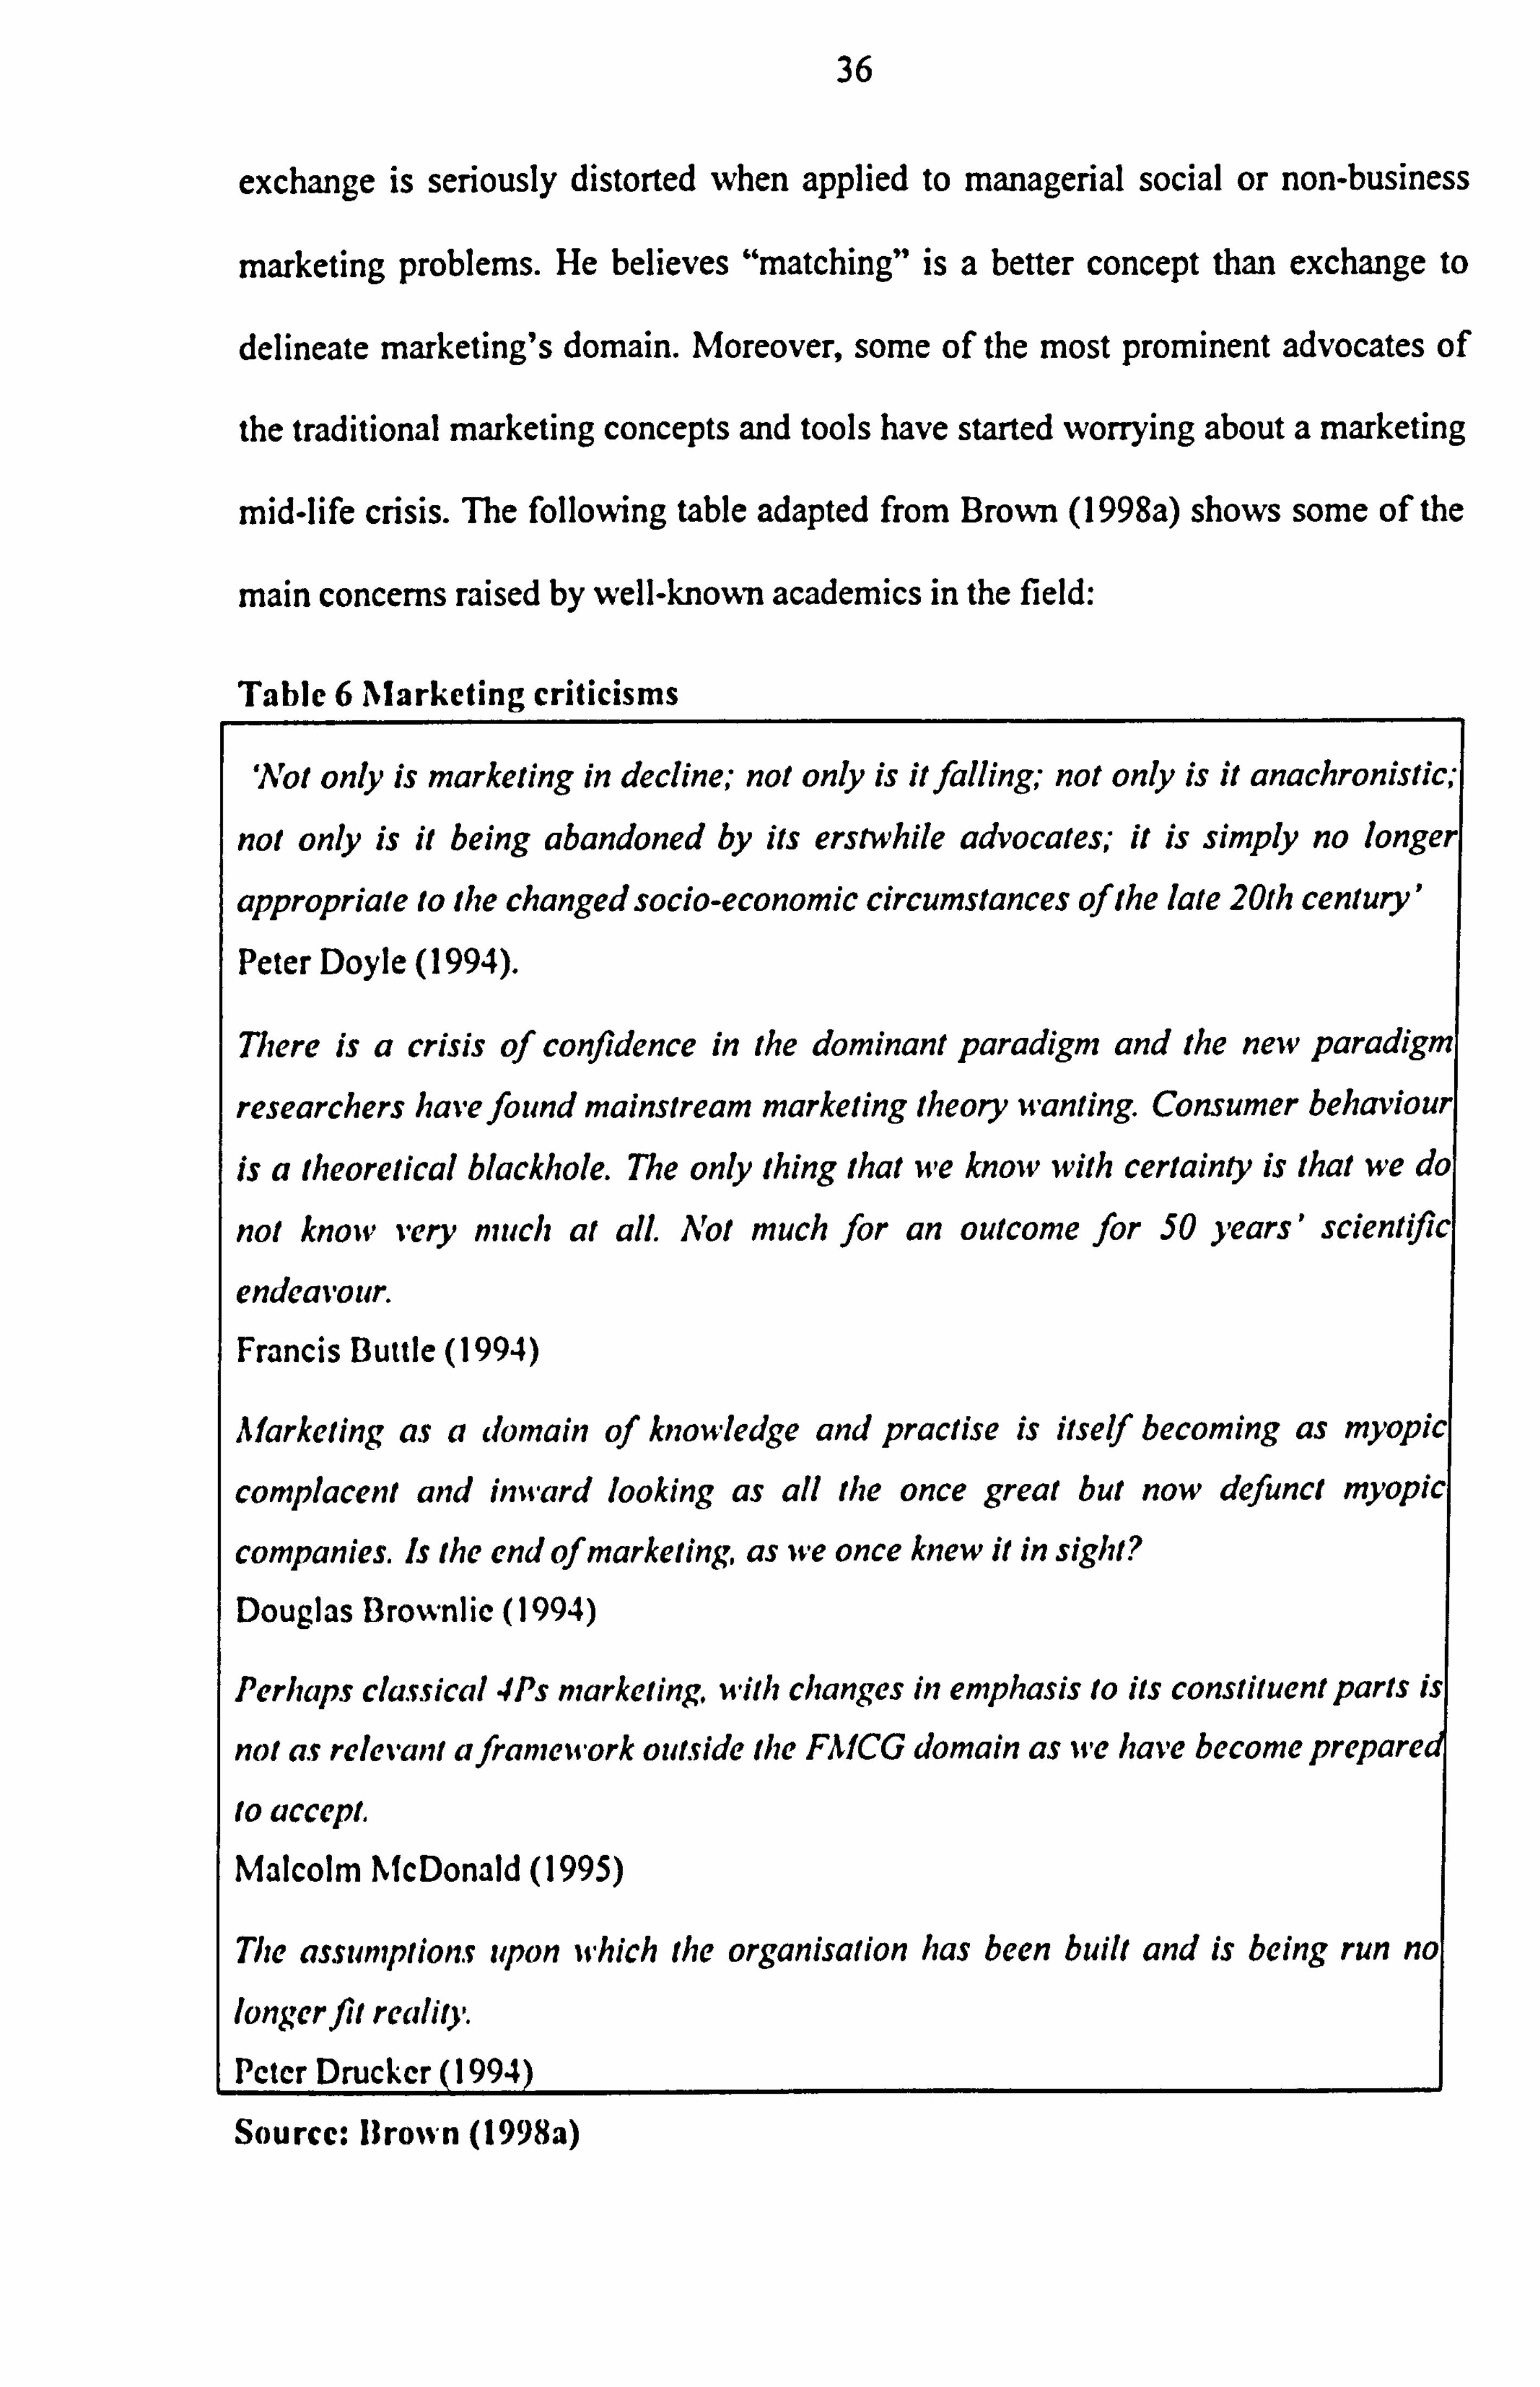
the traditional marketing concepts and tools have started worrying about a marketing
mid-life crisis. The following table adapted from Brown (1998a) shows some of the
main concerns raised by well-known academics in the field:
Table 6 Marketing criticisms
'R'ot only is marketing in decline; not only is it falling; not only is it anachronistic;
not only is it being abandoned by its erstwhile advocates; it is simply no longer
appropriate to the changed socio-economic circumstances of the late 20th century'
Peter Doyle (1994).
There is a crisis of confidence in the dominant paradigm and the new parade
researchers have found mainstream marketing theory wanting. Consumer behavi,
is a theoretical blackhole. The only thing that we know with certainty is that we
not know very much at all. Not much for an outcome for 50 years' scient
endeavour. Francis ßuttle (1994)
Marketing as a domain of knowledge and practise is itself becoming as myo,
complacent and inward looking as all the once great but now defunct myoi
companies. Is the end of marketing, as we once knew it in sight? Douglas Brownlic (1994)
Perhaps classical 4Ps marketing, with changes in emphasis to its constituent parts
not as relevant a framework outside the FMCG domain as we have become prepare
to accept.
Malcolm McDonald (1995)
The assumptions upon which the organisation has been built and is being run i langer fit reality. Peter Drucker (1994
Sourcc: Brown (1998a)
37
In recent years relationship marketing has drawn widespread attention in the
marketing literature and practice because of the limitation of traditional marketing
principles (i. e. Grönroos, 1997; Morgan and Hunt, 1994; Piercy, 1998; Sheth and
Prvatiyar, 1995). Grönroos defines relationship marketing's role as:
"... to establish, maintain, and enhance relationships with customers and other
partners, at a profit, so that the objectives of the parties involved are met. This is
achieved by a mutual exchange and fulfilment of promises" (Grönroos, 1997, p. 327)
Relationship marketing expanded in Europe with ideas into the marketing function as
viewed from the perspective of customers of companies operating in the industrial
and service sectors of Northern Europe. The term itself was first mentioned by Berry
(1983) and adopted in the US services marketing literature. According to Berry,
customer relationship is best achieved around a "core service" which ideally attracts
new customers through its need-meeting character". Creating customer loyalty
among the old customers is one of the main goals of Relationship Marketing. Finally
Berry defines internal marketing as a "pivotal relationship marketing strategy",
where employees are considered as customers inside the organisations.
Grönroos (1989), in criticising the nature of transactional marketing concluded that:
1. Marketing models of the standard literature on marketing management are not
always geared to the customer relationships of firms because they are based on
North American marketing situations and empirical data from consumer
packagcd goods.
2. Marketing is more of a management issue than a specialist function only.
3. The marketing function is spread all over the firm, outside the realms of the
marketing department. Because of this there are a lot part-time marketers whose
38
main duties relate to production, deliveries invoicing, customer training,
technical service, claims handling and telephone reception, and many other tasks
and functions. In spite of these main duties, they have marketing responsibilities
as well.
4. Marketing is not only to plan and implement a given set of means of competition
in a marketing mix, but to establish develop and commercialise customer
relations so that individual and organisational objectives are met. The customer
relationship concept is the core of marketing thought.
5. Promises of various kinds are mutually exchanged and kept in the relation
between the buyer and seller, so that the customer relation may be established,
strengthened and developed and commercialised (Grönroos, 1989, p. 58)
The role of relationship marketing challenges the transactional focus of traditional
marketing and highlights limitations-the four Ps and the microeconomic market
model-around that it was build. Gronroos also believes that the main reason for the
problematic nature of the transactional approach is the fact that the four Ps
framework makes teaching marketing easy, simplistic and straightforward. However
marketing involves many social processes and consequently researchers and
marketers are constrained by its simplistic nature (Grönroos, 1997).
1lowever, there are major problems and criticisms of the concept of relationship
marketing. In a special edition of the Journal of Strategic Marketing, various papers
were presented in order to identify some of the limitations and directions for further
research. Covicllo and Brodie (1998) accept the view that the axioms of relationship
marketing represent better the nature and practice of modem marketing. The authors
39
report on a study designed to test the perceived relevance of a set of relationship
marketing axioms when applied to a variety of businesses from different sectors. The
findings of their paper, suggest some lack of support for the relationship marketing
propositions. In their implications, the authors encourage a new framework
integrating the transactional with the relational models of marketing.
Saren and Tzokas (1998) argue that the propositions for relationship marketing need
reconceptualisation. They conclude by redefining relationship marketing as "the
process of planning, developing and nurturing a relationship climate that will
promote a dialogue between a firm and its customers which aims to imbue an
understanding, confidence and respect of each other's capabilities and concerns when
enacting their role in the market place and the society". (Saren and Tzokas, 1998,
p. 192).
Gummesson (1997) argues in favour of relationship marketing and that there is
indeed a shift in the marketing paradigm, and concludes that society is a network of
relationships in which we interact. Business and marketing are embedded in society
and marketing is a property or a subset of society. Consequently marketing can be
viewed as part of that network of relationships. An understanding of the structures
and processes by which those relationships can be nurtured and managed is hence
important. Network theory attempts to do that. Network theory in marketing can be
described as follows:
"Colloquially, networking as a verb used to describe the initiation and sustenance of
interpersonal connections for the rather Machiavellian purpose of tapping those
relationships later for commercial gain ... As a noun, a network describes a collection
40
of actors (person, departments, firms, countries, and so on) and their structural
connections (familial, social, communicative, financial, strategic, business alliances,
and so on)... Social networks traditionally were those networks whose relational ties
were primarily social in nature (e. g., communication patterns, interpersonal liking
and so on), developing largely within the discipline of sociology... Networks in
marketing represent the study of structural links of any sort including, but not limited
to, social ties as applied to problems within marketing. " (Iacobucci and Zerrillo,
1996, p. 393).
Due to the competitive environment of the 1980s and the 1990s, many firms had to
participate in more interorganisational relationships than at any other time in the
modern history of business. In doing that, they intentionally or unintentionally
created business networks (Zerrillo and Raina, 1996). The research on networks that
seems to have future potential in marketing is the one that disaggregates networks
into dyads and examines the effect on dyads that are connected negatively or
positively to other nodes in the system (Stem, 1996). However there are various
types of networks or as lacobucci and Zerrillo (1996) state, multiple levels of
relational marketing phenomena and dyads is one of them. Networks are another
level of examining phenomena, where typically the whole marketplace of an industry
including all the competitors and their connections are researched (lacobucci and
Zerrillo, 1996). Research in SMEs and entrepreneurship distinguish between types of
networks (e. g. professional, social and commercial) and highlight the interaction
between these networks in entrepreneurial settings. Entrepreneurs mobilise different
networks (e. g. business contacts, family friends and so on) for resources (e. g.,
information, capital and so on) to translate their visions and business plans not reality
41
(Araujo and Easton, 1996). Furthermore, the actor-network approach has been use in
order to explain how entrepreneurial driven firms use networks to gain access to
resources and to establish stable exchange structures based on trust, reputation, and
reciprocity (Larson, 1992).
One of the most appropriate views of conducting marketing research is presented and
summed up by Foxall (1995) and Zaltman (1997). Foxall (1995, p. 14) states that:
"... all philosophising is a perversion of reality: for, in a sense, no philosophic theory
makes any difference to practice. It has no working by which we can test it. It is an
attempt to organise the confused and contradictory world of common sense, and an
attempt which invariably meets with partial failure-and with partial success... almost
every philosophy seems to begin as a revolt of common sense against some other
theory, and ends-as it becomes itself more developed and approaches completeness-
by itself becoming more preposterous-to everyone but the author. (Italics in
original)"
He goes on to suggest not to pursue any theory to a conclusion. He finally
recommends that both experience, leading to empirical evidence, and interpretation,
conferring order and meaning on sense data are essential elements of any system of
knowledge derived from the world of phenomena (the natural world by which the
author draws parallels). Moreover attempts to separate them to promote one at the
cost of disparaging the other, shows misunderstanding of their interactive
contribution. The thesis follows Foxall's view, which argues for toleration of
paradigms, of ontologies of methodologies.
42
Zaltman (1997) stresses the importance of human processes such as storytelling,
metaphors, sensory images that may be used in the design of research methods in
order to incorporate existing and new techniques. Important qualities of customer
and manager thought that are absent from most standard research tools. Brinberg
(1986) also points out that the strengths of marketing research with an academic
orientation (rigour to bear on concepts and their relations) combined with the
strengths of marketing practitioners orientation (pragmatic relevance of the problem
under study and the sophistication used to articulate the problem) should be
combined and co-operate for the advancement of the marketing field.
In this section, there was a discussion of transactional marketing and criticisms of the
approach, together with a description of relational marketing literature. This thesis
advocates towards a blend of research methodologies from the traditional positivistic
combined with the qualitative paradigm, the transactional as well as the relational
marketing approaches.
3.3 The model
3.3.1 Marketing differences between Independent and Subsidiary SMEs
After discussing the blending of the approaches, this section argues in favour of a
comparative, integrated model to research in marketing of agri-food SMEs. The
comparative nature is followed to gain a deeper understanding of differences
between marketing of subsidiaries and independent SMEs (Carson, 1998). Also
targeted marketing policy recommendations can be made to subsidiary and
independent SMEs.
43
There are three types of major influences on marketing of SMEs; the capital and
environment influences related with the small size of the enterprise; the entrepreneur
or person in charge of marketing; and the internal system of control of the SME. The
following section will describe marketing practices of both independent and
subsidiary SMEs, in relation to capital and environmental influences, the
entrepreneur or chief marketer and internal control issues.
Capital and environmental influences
There is a general lack of financial resources within independent SMEs, which
suppresses their growth potential. Furthermore, they do not have a team of specialist
experts on aspects of the business but instead must rely on generalist individuals,
which in many cases is the owner/manager (Carson, 1998).
However subsidiary SMEs have both the capital resources and the management
capability to respond to rapid levels of growth (Hines, 1957), even though
subsidiaries in their early business cycle stages may not have part of the expertise. In
terms of assets, subsidiary SMEs are able to get the parent's brand reputation and
trademarks, as well as having access to effective distribution systems and dealers at
low cost (Caves and Porter, 1977; Hines, 1957). CVs are also able to gain economies
of scale due to their parent's capacity or integration (Caves and Porter, 1977).
Externally, the SMEs small size means that they have limited control and influence
over their operational environments. Thus, they are vulnerable to competitive threats
and environmental change, and they find it difficult to position themselves against a
competitor. There may be a great number of competitors, which will be complicated
44
and costly to analyse. Furthermore, targeting will require sophisticated methods and
SMEs will have neither the money nor the time to engage with.
On the other hand subsidiaries are regularly the market leaders of their sub-markets
and hence act as a leader rather than a follower. They may have access to executives
from diverse functional areas and emphasise the marketing function (Knight, 1989),
due to is importance for the company.
The entrepreneur or chief marketer innfluence
Independent SMEs will be shaped heavily by the owner/manager, because most of
the decision making throughout the enterprise is made by him/her. The
entrepreneur's style and background will also influence his/her decision-making.
Since the entrepreneur tends to get involved in all aspects of the SMEs' activities,
they tend to be generalists. Limited expertise in marketing as well as other functions,
combined with limited resources to acquire such knowledgeable employees makes
the entrepreneur involved in all marketing aspects like pricing, distribution and
product development. In the case of a charismatic entrepreneur, this charisma
becomes an embodiment of the marketing concept in SMEs (Morris, 1995). A drive
and enthusiasm for the company makes entrepreneurs highly motivated individuals
(Gardner, 1991). This motivation can assist marketing activity particularly in
developing new products or markets and acquiring new customers. Customers are
stimulated by this high enthusiasm and dedication and perceive it as a higher degree
of personal service. Therefore, size limitations and entrepreneurial influence are
likely to lead to unstructured, unsophisticated, and simplistic decision-making.
Internally, most independent SMEs will have a limited range of products, with
45
pricing decision being made in a cost plus method, or discounted because of
competitive pressures. Promotion and advertising budgets will be limited.
Distribution and delivery will also be limited to servicing the individual customer's
requirements and will not conform to a co-ordinated pattern (Stokes 1998,
Waterworth, 1987). It will however be opportunistic and flexible, changeable and
innovative in a competitive and customer-oriented way (Carson et al, 1995 p. 81).
Entrepreneurs tend to be change-focused, always looking for new opportunities
(Carson et al, 1995). The search for new opportunities and the generation of new
ideas often lead the enterprise new and unplanned directions, even changing the
emphasis of the entire business. This change in focus may lead the entrepreneur to
fall into a new niche target market that requires him/her to experiment with new
approaches to marketing to fully exploit this new market.
Subsidiary SMEs on the other hand may expect professional marketing and
management assistance from the parent company and many of the traditional
marketing principles (Kotler, 1997) can be applied. Furthermore professional
managers must balance a variety of conflicting political and corporate objectives
(Fast, 1981), and since they are evaluated on adhering to specific objectives their
marketing behaviour becomes less entrepreneurial (Weiss, 1981).
Internal control influence
Internally, power in SMEs remains largely in the hands of one individual, that is the
owner-manager/entrepreneur. There is a general reluctance to entrust responsibility
for key marketing activities to others. Generally the entrepreneur will exert power
and influence over marketing expenditure by deciding to do promotions or
46
advertising based on an impromptus basis. As the enterprise grows it becomes harder
to exert internal power and to influence company marketing activity in this way.
Externally this power is mainly related to influence key outsiders for the benefit of
the company, a term that is called networking
Subsidiary SMEs have multiple sophisticated review levels and structures. This is
mainly imposed by the parent company to impose control mechanisms and
processes, so that the corporate objectives, regularly short-term quantitative
objectives, could be met (Sykes, 1986). This restricts marketing to a function of
objective setting, and marketing to a more functional role in the company. The
differences are briefly outlined in table 7.
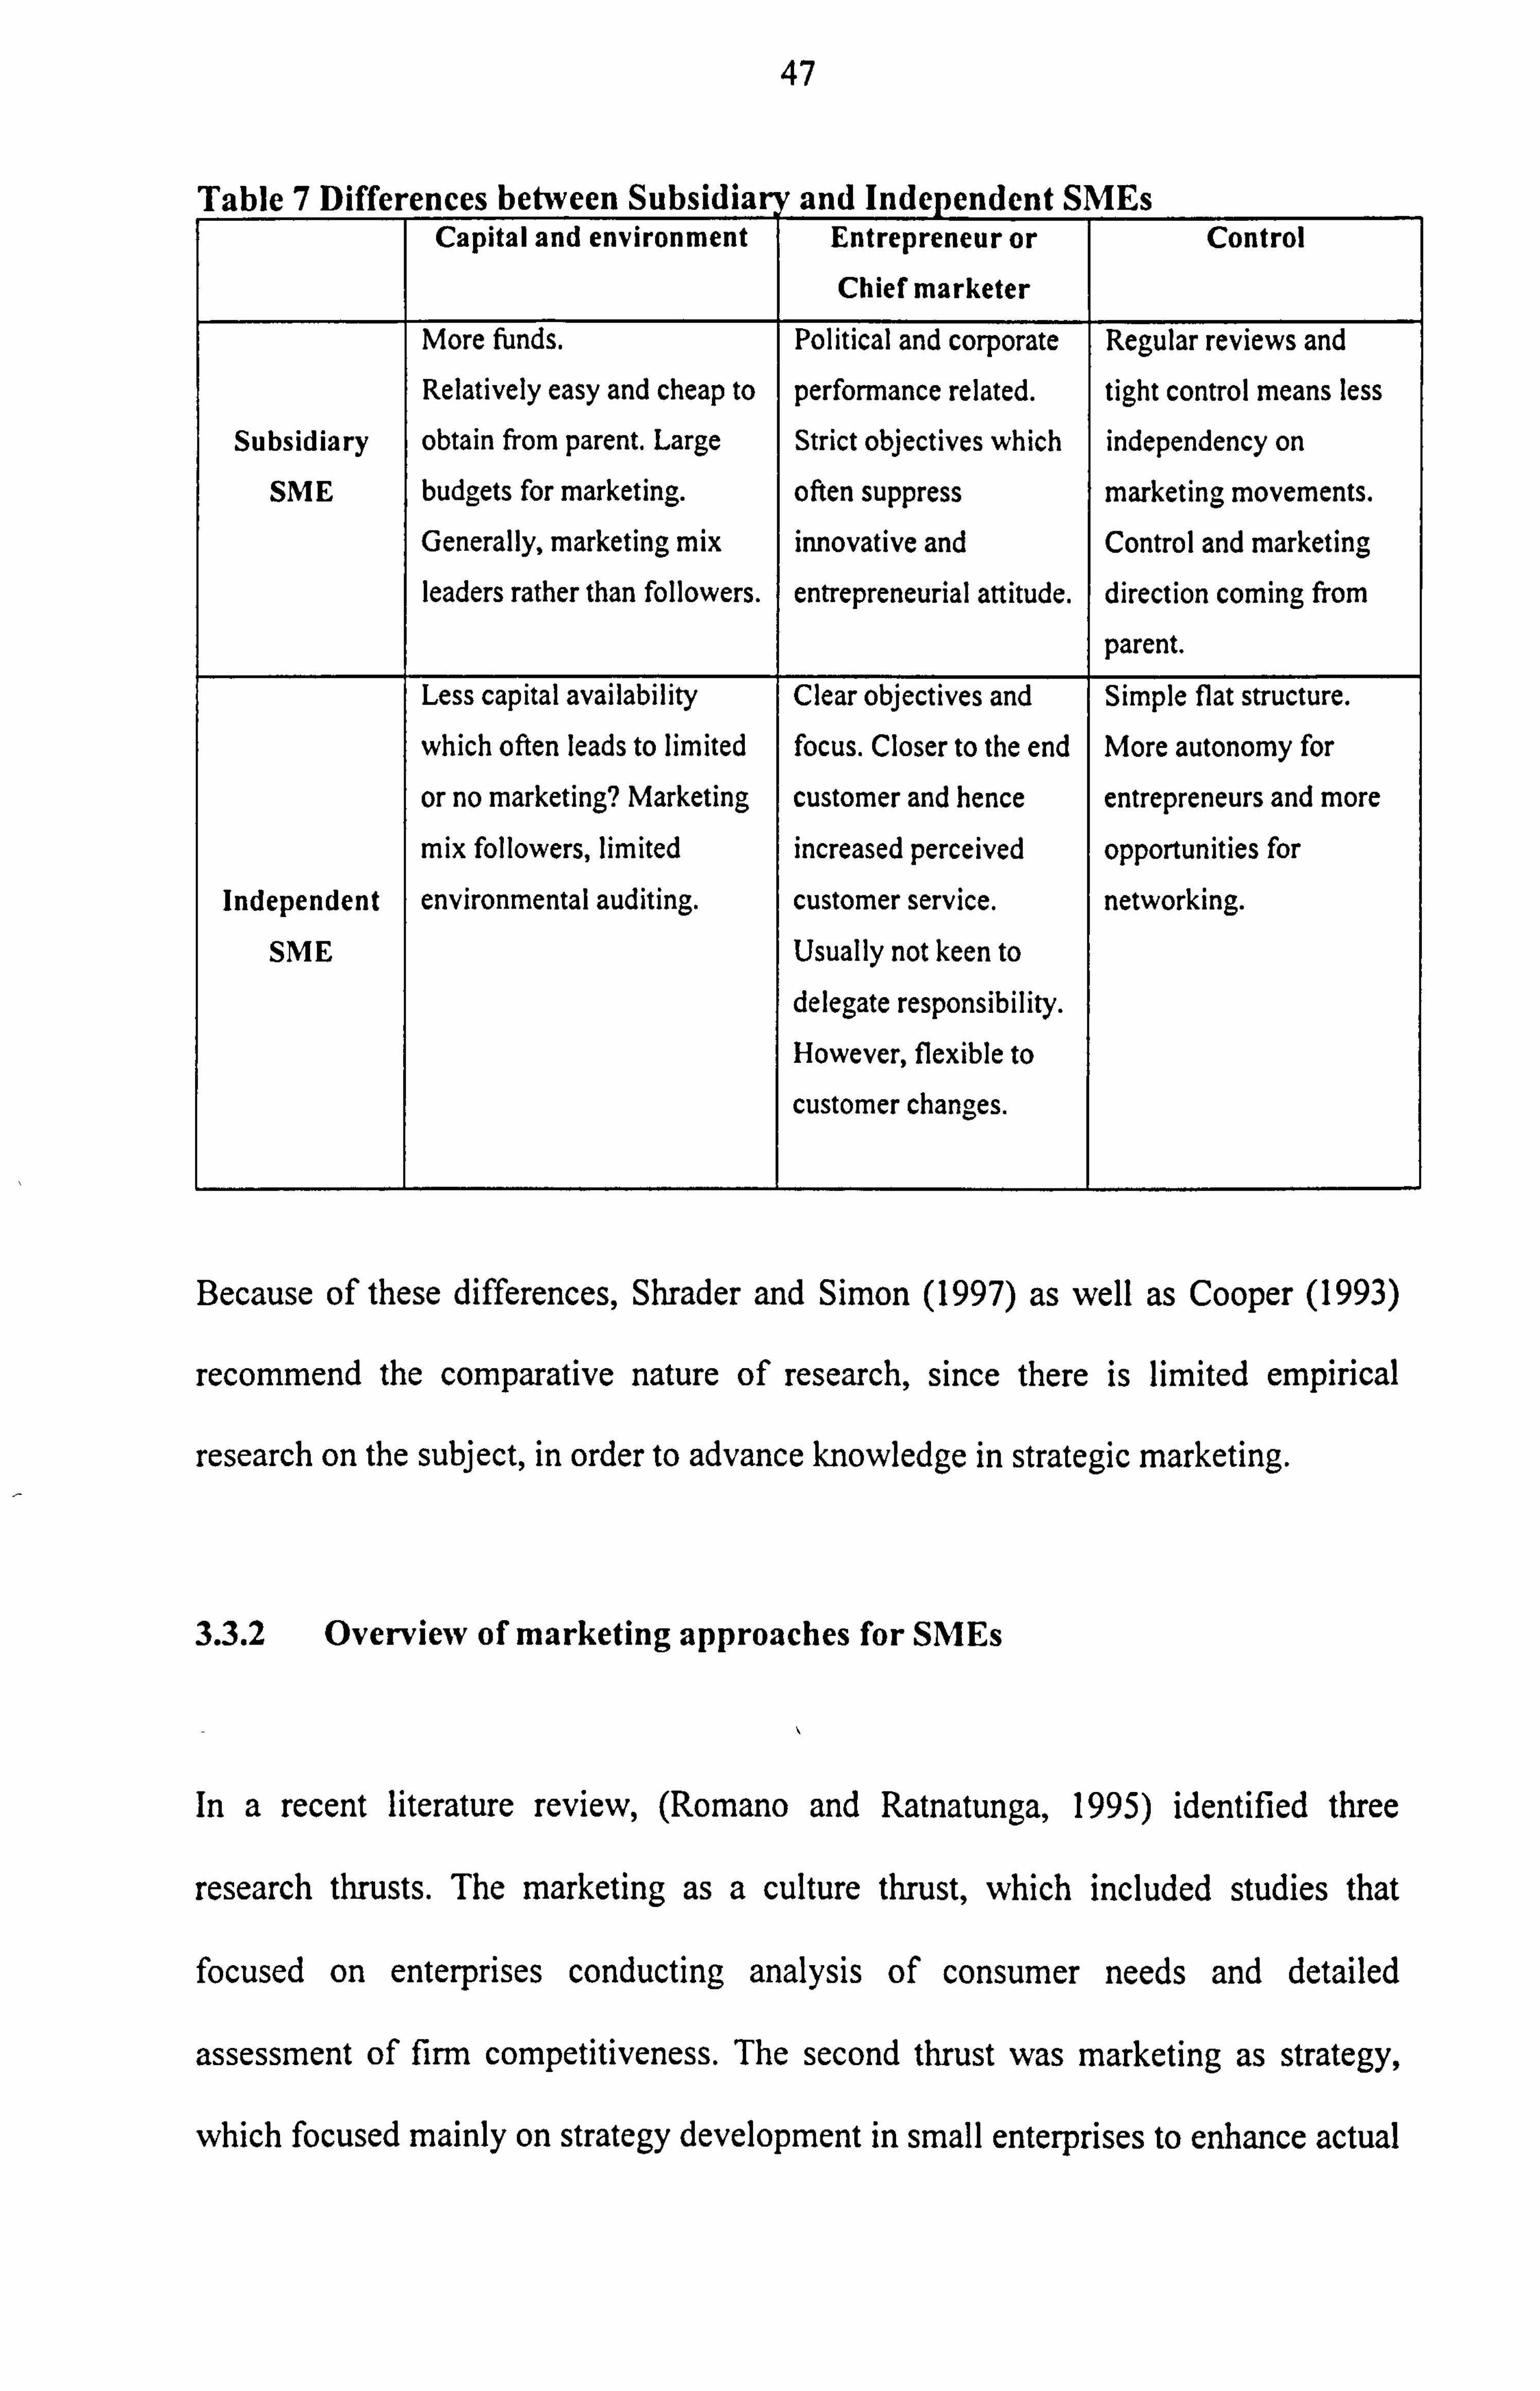
47
Table 7 Differences between Subsidiary and Indenendent SMEs Capital and environment Entrepreneur or
Chief marketer
Control
More funds. Political and corporate Regular reviews and Relatively easy and cheap to performance related. tight control means less
Subsidiary obtain from parent. Large Strict objectives which independency on SME budgets for marketing. often suppress marketing movements.
Generally, marketing mix innovative and Control and marketing leaders rather than followers. entrepreneurial attitude. direction coming from
parent. Less capital availability Clear objectives and Simple flat structure.
which often leads to limited focus. Closer to the end More autonomy for
or no marketing? Marketing customer and hence entrepreneurs and more
mix followers, limited increased perceived opportunities for
Independent environmental auditing. customer service. networking.
SME Usually not keen to
delegate responsibility. However, flexible to
customer changes.
Because of these differences, Shrader and Simon (1997) as well as Cooper (1993)
recommend the comparative nature of research, since there is limited empirical
research on the subject, in order to advance knowledge in strategic marketing.
3.3.2 Overview of marketing approaches for SMEs
In a recent literature review, (Romano and Ratnatunga, 1995) identified three
research thrusts. The marketing as a culture thrust, which included studies that
focused on enterprises conducting analysis of consumer needs and detailed
assessment of firm competitiveness. The second thrust was marketing as strategy,
which focused mainly on strategy development in small enterprises to enhance actual
48
and potential market position. Finally, the marketing as tactics thrust was involved
with the analysis of the 4Ps and their influence on growth and performance.
Siu and Kirby (1998), however, identified four approaches of research; the
stages/grow model; the management styles model; the marketing as a function model
and the contingency model (Siu and Kirby, 1998). Notably, however, the two studies
are not mutually exclusive and overlap with each other in some areas. Siu and
Kirby's (1998) classifications (see table 8) is split into the following four groups:
The Stages/Growth Model suggests that any model of SMEs marketing must
consider the stages of the development of the business the principal focus is on the
types of problems encountered and the consequent business activities and marketing
behaviour of the small business or owner manager (Churchill and Lewis, 1983). It is
further divided into the traditional category and the environmental category. The
traditional category is mainly concerned with marketing as a functional problem
within SMEs, and the unit of analysis is the organisational structure and strategy
(Kazanjian, 1984). On the other hand, the environmental category is concerned with
marketing as a business philosophy, and the unit of analysis is marketing structure
and strategy (Carson, 1985).
The Management Styles Approach suggests that the environment and SMEs size
make the owner/manager act as a responsive marketer. This approach mainly
acknowledges characteristics of the small firm and its environment. It is subdivided
into the pull, push and behavioural streams. The pull stream looks at environmental
influences on SMEs marketing, and external factors are the units of analysis. It is
49
named as `look after itself marketing' because businesses seem to be pulled into it,
by external environmental influences and the structure of their businesses (Watkins
and Blackburn, 1986). The push stream emphasises the personal characteristics of the
entrepreneur, and has the psychograpgic characteristics of the entrepreneur as the
unit of analysis (Smart and Conant, 1994)
The Marketing as Management Function Model views marketing as one of the main
functions of the firm, similar to that of finance, human resource management and
production. These studies have been wide ranging and fall under the `marketing as a
business function', `marketing as an essential ingredient in strategic planning', and
`marketing as a business concept/philosophy' categories. The first one has its
emphasis on solving management problems of SMEs, and has the marketing
department or the owner manager as the unit of analysis (Broom and Longenecker,
1979). Marketing as a planning component is focused on strategic planning and has
the entrepreneur or owner/manager as the unit of analysis (Wellsfry, 1983). Finally,
the business philosophy stream focuses on the strategic marketing concept and has
the firm as the unit of analysis. (Waterworth, 1987).
Finally, the contingency approach consists of studies aiming at bridging the gap
between marketing and small firm research. They are classed as small business
orientation and marketing orientation. Small business orientation studies, where the
unit of analysis is the small business, examine the limitation of small businesses
(Carson, 1995), whereas marketing orientation studies, where the unit of analysis is
the marketing discipline, examine problems associated with the marketing discipline
(Brooksbank, 1992).
50
Contingency approaches are positioned as mid-range management theories between
the two extreme views that:
1. Universal principles of organisation and management exist; and
2. Each organisation is unique and must be analysed separately (Zeithaml, 1988).
Contingency theories have been used and tested in a variety of contexts including
organisational and management (Hofer, 1975), strategy and performance (Hambrick,
1985; Ruekert, 1985), and management characteristics and performance (Miller,
1986). Yet, the contingency approach is rarely used explicitly in small firms
marketing literature, with exceptions of studies such as Yeoh and Jeong (1995) who
attempted to propose an integration of the exporting, entrepreneurship and
organisational behaviour literatures, with the aim of employing a contingent
approach.
The contingency approach has contributed to the small firms' marketing literature in
acknowledging, implicitly, that the marketing-strategy-performance relationships can
vary across different environments and firm sizes (Lee, 1993). Adopting the
contingency approach allows the researcher to focus on exploring mid-range
relationships that hold within particular types of settings rather than to search for a
grand universal theory that is appropriate across all possible settings (Siu amd Kirby,
1998). It is split into the small business orientation and the marketing discipline
orientation
Table 8 (taken from Siu, 1997) demonstrates the classification of the approaches of
studies on SME marketing.
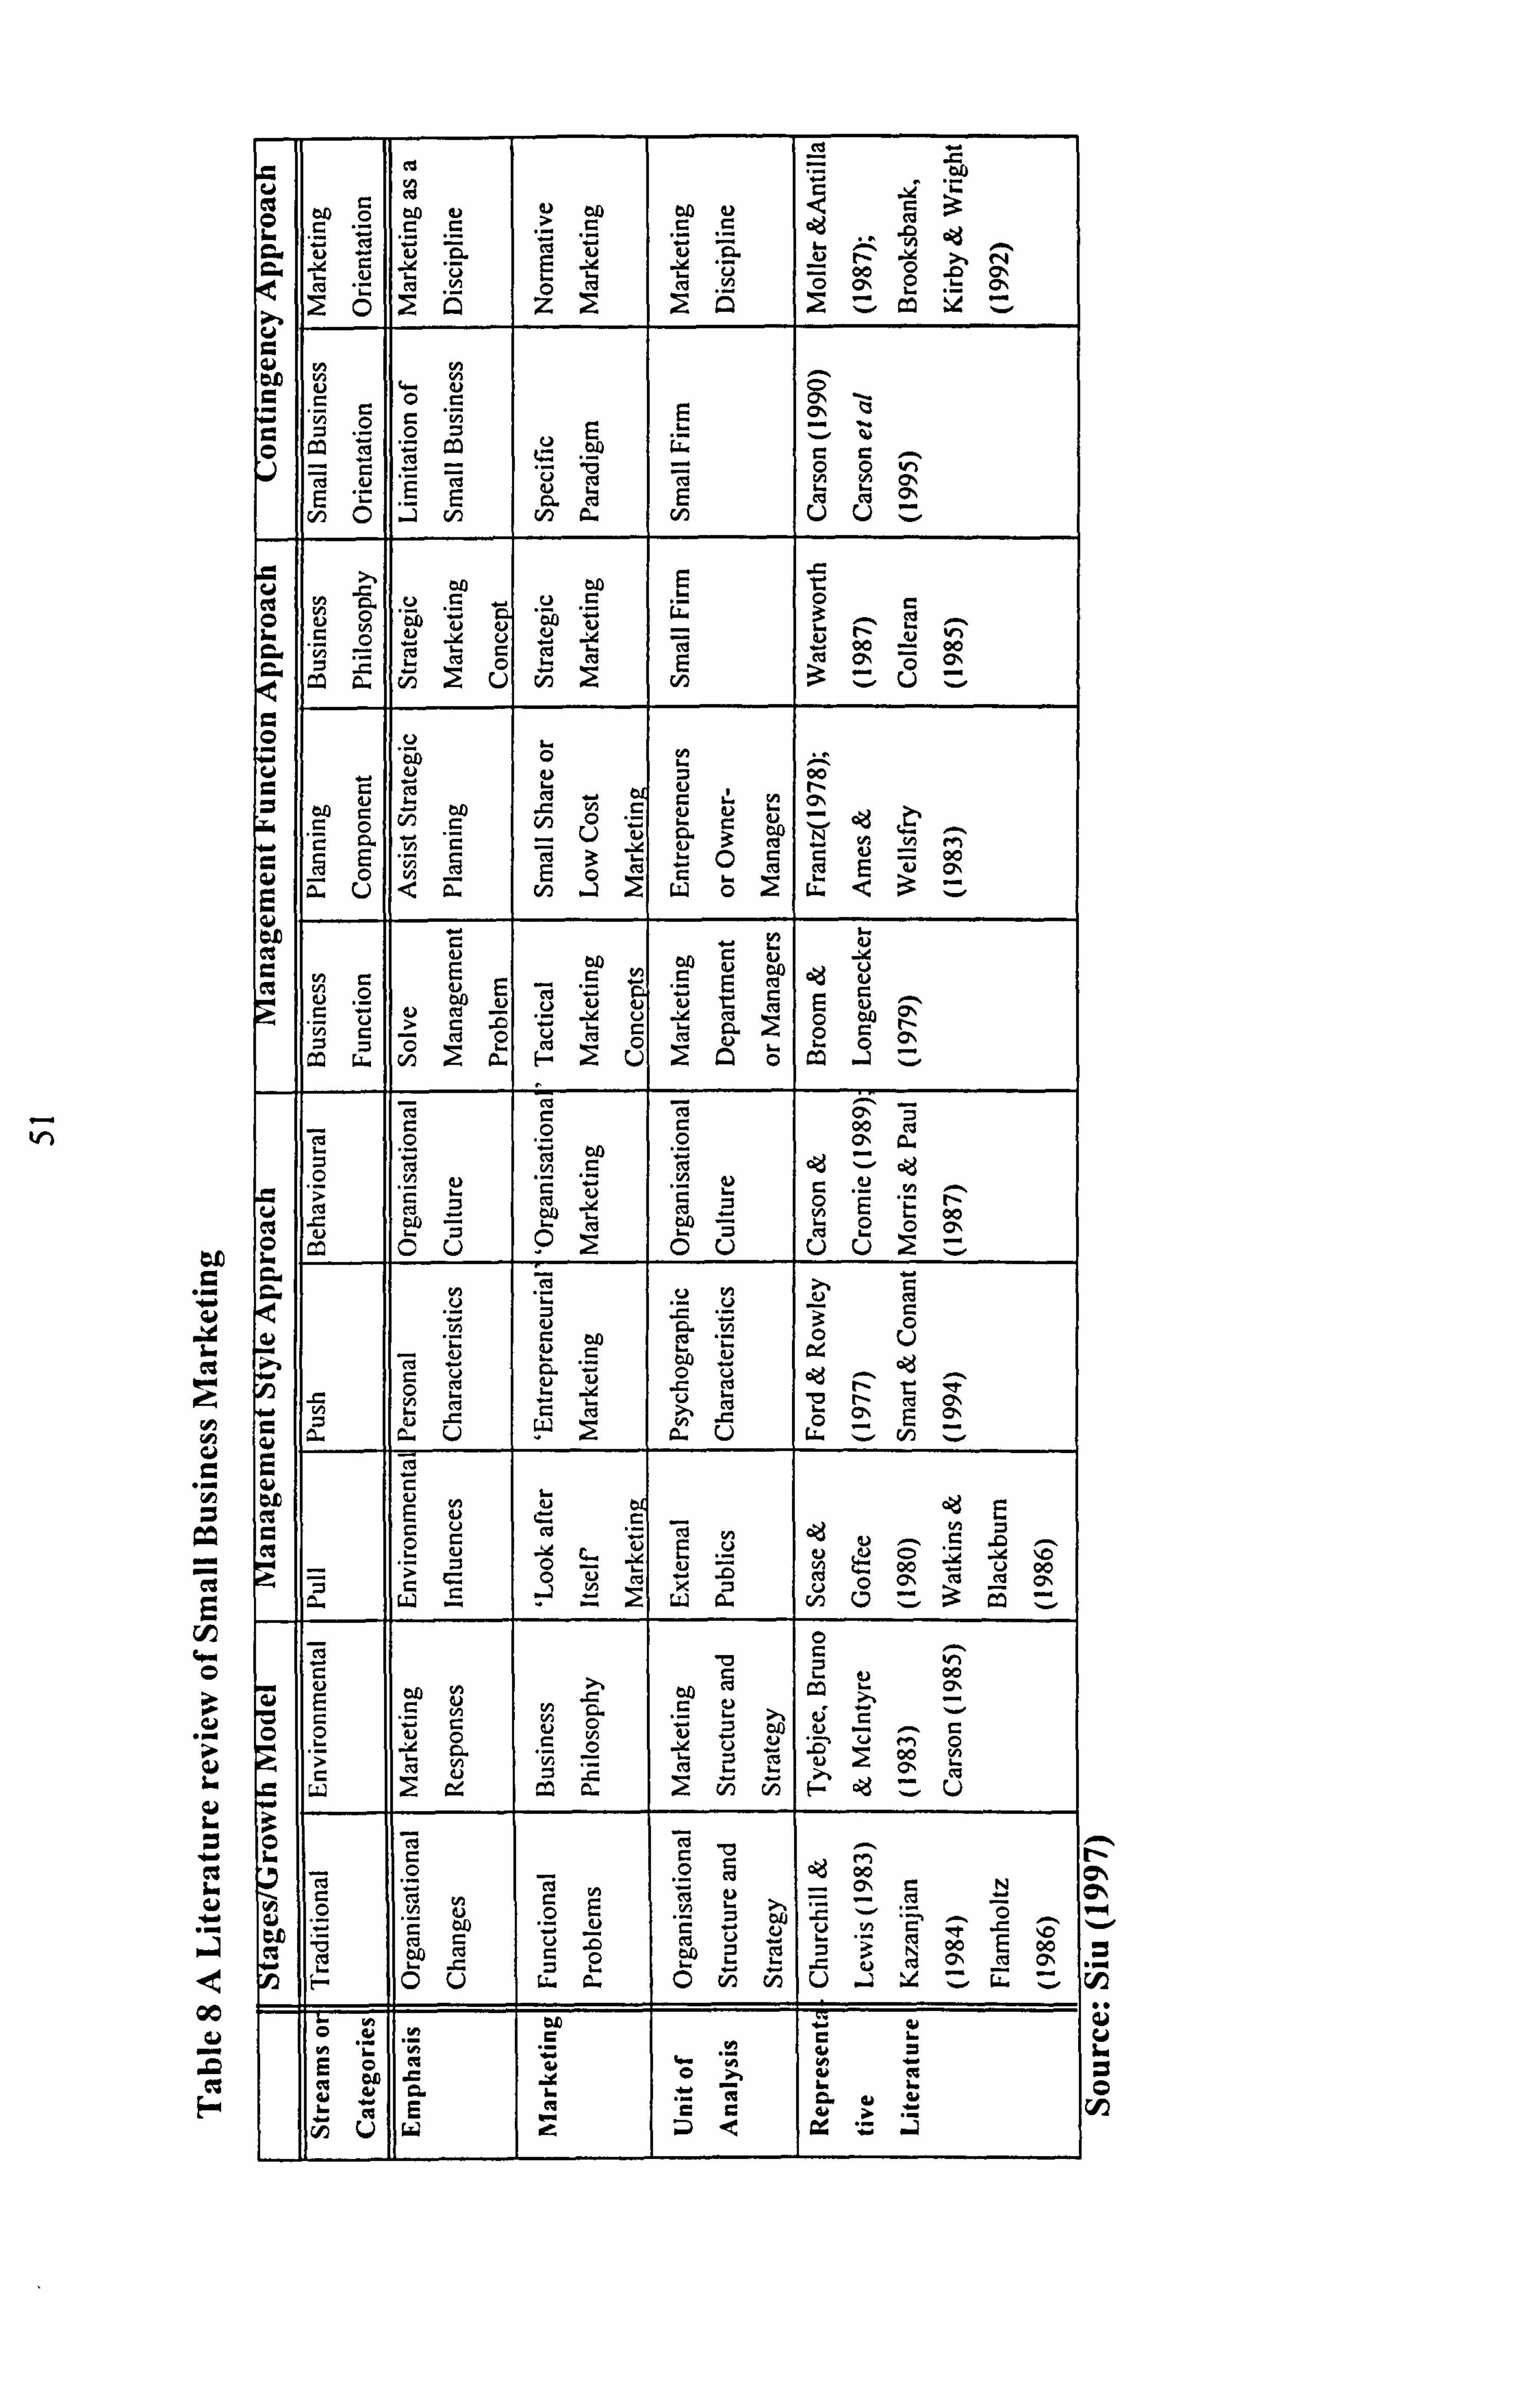
bn 460
L
CO)
P
CC
r. +
r. ý
OC
CC E-
C CO = on
' G äý C N d äý 7ý Ö. N n ý,
N
C CO "V f C N (p CO N O
"
47,
u 00 N N
t- äi ö S c °
"c Ö
0 O p m c c . -.
E E E ý Cýa 0 °
.. cn O .j V) V) a V) U U ..
to to E t: N 4 U ,C ,., U
.c O
c ö e w u G N id ý'" C CO CO cc
_ cc
W ä vý U vý v) 3
.. U ..
O U I� 0 0 ` 00
co C C. % V N
04 a Cn to y
O ý
G N ý
16, C O C V) i"" c ý ýý
O N
`l 3
oo Ü ¢ n ° w o ` 3
C',
E a. c c a rJ . ¢ L
Gei E c c
C U
C ýL V -
V '
U ýýj y y
N ö c ä o C ä
ö 0 0 cd a ON 0" - CO y
OA C
- . -
> m M « O
N E 'ý,
L N co
CC 0j) Ü (71 L C2 C Ü 0 Ü Ü 2 :. C+ N
C y V N
T U
y ' ä y y a ý c cn CO r 0 0 0
a ý'3
Vý C L
as 2 c U . 2 o. U ti . vii .. Q . - .
E a) c CD U
E N N oZj E CC U
r- C CO C CO C °d aý
N C
2 GC 0
L V x E
C , u - ö x ýö
C 0 0 C) CO cý
_ NN t,,,, 00 C id U 00
c w J ri ä ýn v 3 ca
0
aci N L cad p °'_ oý N C ö . own aý i -c c
ý c m V) CO E ° p v CO
55 -: 8 L C
2 ed
0
C N _
6w O C Cd
to r u
U C CO V U U L
C 4 =
m L C v _ CO ON CO O, l- o V LL
O 0. 0 ! /ý 65 , U .; : +L 7,. LL 7,,
o = = '
CD C w 6ý
N 'L N 61 ý E .
61 G. L ±ý ä 4A
y
CO w 40 ; b. v5 c ä ¢
*z -J
n a
clD
u I. O O
rI)
52
3.3.3 Critique of the approaches
The Stages/Growth Model suggests that any model of small firm marketing must
take into account the stage of development of the business. However, according to
Siu and Kirby (1998), there are two weak assumptions in this model:
First, many businesses may not adhere to the assumption that change in the business
and marketing practices of the owner or the enterprise will enable the progression of
the business from one stage to the next; and the awareness, and ability of the owner-
manager to deal with different problems. Entrepreneurs with prior marketing
knowledge may benefit from adopting a professional marketing approach early on
the life-cycle of the business, like some new high-tech start-ups.
Second the stages of the life of a business may be variable, and there may be no
progression from one stage to the next.
Finally, the external environmental influences that will shape the cycle of the
business are ignored.
The management style approach (table 8) acknowledges the importance of the small
firm's limitations and provides a useful explanation for the development of the small
firm. However, both the pull and push models are black-box models as interactions
between variables, such as the organisational structure and the owner-manager's
marketing decision process and behaviour are ignored. On the other hand, the
behavioural stream, by examining relationships between entrepreneurial style and
53
company performance, ignores contributions of the professional marketer and
marketing processes. This is because entrepreneurial orientation and marketing
orientation are not the same business philosophies (Miles and Arnold, 1991).
The major contribution of the management function approach is the
acknowledgement of marketing as an important function and an essential concept in
small firm growth and survival.
However much of the literature on business function has ignored the strategic and
competitive dimensions and has confined marketing to the management function.
The major contribution of the planning and business philosophy streams is their
acknowledgement of the use of strategic orientation in the small firm's planning
process. However, the empirical studies have focussed on the functional approach
rather than the strategic perspectives (Brooksbank, 1999). Marketing researchers
apply normative marketing concepts that come from the positivist approach to
research, in order to study small business activities. This approach emphasises the
disciplinary foundation of marketing without paying attention to the limitation and
constraints of small firms. On the other hand, small business researchers, when
studying marketing in small firms, pay insufficient attention to marketing and too
much attention to the constraints and limitations of small firms.
The contingency approach acknowledges that various factors affect marketing
performance of small businesses.
54
However, this approach is still primitive, with a major problem being a lack of a
common platform (Cannon 1991). Zeithmal (1998) proposes the contingency
approach to theory building and research. However the contingency theory has not
been used appropriately and rigorously. There is also a lack of empirical studies
using the contingency approach. One limitation of this approach is that it is an
outcome not a process model. Marketing involves human dimensions, which have a
socio-cultural perspective and are ignored by the contingency approach (Hooley and
Saunders, 1993; Piercy and Morgan 1994). It is true that marketing concepts are
universally applicable but the implementation processes are different. Unfortunately,
as reported earlier, the researchers tend to place major emphasis on the outcome not
the process of marketing in small businesses.
3.3.4 The integrated model
Hybrid designs have slowly started incorporating attributes of both qualitative and
quantitative methodologies in small business studies (Siu and Kirby, 1997,
Brooksbank, 1992, Cox, 1994, Carson, 1991). This review shows that a theoretical
framework integrating the contingency approach with the process model is suitable
and appropriate for advancing theories in small business marketing. Quantitative
research strategies may be useful to identify the specific marketing practices of
successful small firms, but not appropriate when trying to determine how and why
small firms perform the way that they do.
55
Thus, qualitative research methods, for example ethnographies and case studies,
seem to be a complementary alternatives in advancing understanding of small
business marketing (Siu, 1999).
Siu and Kirby (1998) propose an integrated approach, consisting of two
methodologies:
1. The application of the contingency approach quantitatively to identify strategy-
performance relationships in small firm marketing; and
2. The application of the process model qualitatively to examine the marketing
implementation process in small firm is the way forward to advance theory in
small firm marketing.
3.4 Conclusions
In this chapter, we examined literature from areas of general marketing in order to
identify and conceptualise marketing and agri-food marketing. There was also a
suggestion of a blend of the transactional with the relational approaches of
marketing, in order to advance knowledge of agri-food marketing, as suggested by
Covelio and Brodie (1998).
The second part of the review discussed the differences between independent and
subsidiary SMEs, and the importance of researching comparative groups of both to
advance knowledge in agri-food marketing. Finally, there was a review of small
business marketing literature, and the suggestion of a hybrid integrative model, in
order to advance the theory of marketing practices in small agri-food firms.
56
Chapter 4 METHODOLOGY
4.1 Introduction
This chapter describes the research questions and objectives of the thesis as well as
the research design and methodologies. It splits the methodology into two stages and
analyses the theoretical framework underpinning the comparative integrated model
as suggested by the literature review findings in chapter 3.
4.2 Research rationale
Many researchers have highlighted the importance of small businesses in the general
economic environment of a country, mainly due to their job creation capabilities
(Gray, 1995; Gallagher and Robson, 1995). Hills and LaForge (1991) and academics
from the entrepreneurship, marketing and small business fields (Brooksbank et al,
1999; Sashittal and Wilemon, 1997; Brooksbank et al, 1992; Cannon, 1991;
Hogarth-Scot et al, 1996; Waterworth, 1987), point to the importance of marketing
for small business success. The UK government has also been supporting the role of
small businesses in the economic life of a region, by initiatives like the new Small
Business Service (SBS). According to the DTI (1999b), the Small Business Service
(SBS) is intended to contribute to the Government's wider economic and social
objectives, and to sustainable development more generally. SBS main mission is to
help build an enterprise society in which small firms of all kinds thrive and achieve
their potential. The main aims were set by DTI (2000) as helping all SMEs overcome
57
the barriers to their success and enhance the performance of SMEs with high growth
potential. There is also further interest by the Ministry of Agriculture Fisheries and
Food (MAFF) to explore the role of small businesses in the agri"food sector in order
to improve its competitiveness
Despite this interest, there is a lack of empirical studies in small business marketing
using the integrative approach, as seen from chapter 3.
This study, therefore, identifies, analyses, compares and evaluates small firm
marketing at a regional level, in the agri-food industry.
4.3 Research questions
It is intended that this study will build upon and expand the knowledge of marketing
activities of small firms, in a specific industry and environment, and also benefit
from a comparison of small independent and subsidiary firms as proposed by Shrader
and Simon (1997) and Cooper (1993). This research will therefore address these
questions:
1. What are the approaches of independent agri-food SMEs to marketing?
2. Are there any differences and similarities between independent and subsidiary
agri-food SMEs in their marketing practices, and if so which ones are
influencing marketing performance the most?
3. What are the marketing practices of the agri-food industry?
4. How and why do successful independent SMEs' marketing implementation
practices differ from the subsidiary SMEs?
58
4.4 Research objectives
Based on the above questions this study aims to:
1. Understand the marketing practices of agri-food SMEs including business
philosophy, strategic awareness, marketing strategies, marketing organisation,
marketing control, the importance of networks and the agri-food environment;
2. Identify the components of marketing that have the most influence on marketing
performance of independent, subsidiary and the whole agri-food industry's
SMEs to use for clear marketing policy recommendations;
3. Determine the marketing differences between independent, subsidiary and the
whole group's SMEs by comparing and contrasting their marketing practices and
impact on performance.
4. Determine why successful independent and subsidiary SMEs behave the way
that they do in their implementation of their marketing practices; and
5. Construct an explanatory model to describe the marketing activities and
implementation processes of successful agri-food SMEs.
4.5 Significance of research
This research tries to examine the extent to which the agri-food industry has adopted
traditional marketing tools in order to survive and prosper. It is the first attempt to
use the integrative approach, described in chapter three, within a single industry and
region. Furthermore, the comparative nature of the study (independent versus
subsidiary SMEs) builds on existing work from Shrader and Simon (1997) to gain a
deeper understanding of agri-food marketing of SMEs. Finally, it improves the
59
performance instrument used in the previous works of Hooley and Lynch (1991),
Brooksbank et al (1992,1999), Siu (1997) Siu and Kirby (1998a) and Cox et al
(1994), by testing statistically its validity.
The thesis will thus address both fundamental requirements towards advancing
theory as stated by Anderson (1983), which are the pursuit of marketing knowledge
and improving the efficiency and effectiveness of marketing practice, thereby
contributing to scientific progress and advancement in science. It will also contribute
to the MAFF policy recommendations on improving the competitive position of the
agri-food industry.
4.6 Research methodology
Hoffer and Bygrave (1992) suggest that the entrepreneurial process, which involves
the dynamic state of change, limits the applicability of traditional management
research methodologies in small business theory building. Davis, Hills and LaForge
(1985) note that it is difficult for SMEs to provide accurate and up-to-date data.
Therefore they suggest a ̀ stream of research' where each study is carefully examined
to build upon what has been previously learnt and to contribute to the established
knowledge base. Specifically, they suggest the use of case studies initially, then a
small-scale exploratory study followed by a large-scale survey research, controlled
by a final field study. Similarly, Gibb (1992), Siu (1997) and Kirby (1992) advocate
the use of a blend of both qualitative and quantitative techniques in a multistage
project, to advance knowledge in the small business field.
60
Research methodologists claim that the sequencing of stages is not fixed, and
researchers often skip over one or more stages and sometimes move backwards as
well as forwards (Siu 1997). Thus the research strategies used in this project will be
based on Davis Hills and LaForge (1985), Gibb (1992), Kirby (1992), Siu (1997) and
Shrader and Simon (1996).
The following sections describe the two different stages of this research project. The
first stage is involved with a large-scale survey of SMEs in the North of the UK. The
second stage of in-depth personal interviews and case studies will look at specific
successful SMEs in order to verify the survey results and better understand the
implementation of marketing in successful agri-food SMEs.
4.6.1 Stage one: Descriptive research
This stage is intended to provide a clearer understanding of the marketing practices
of agri-food SMEs in the North of the UK. The literature review in chapter 3
suggests an integrative approach to advance SME marketing theory and develop a
better understanding of the marketing process of SMEs. The contingency model for
marketing research used by Brooksbank et al (1992) and Siu (1997) was adopted to
classify SMEs into performance groups (high, medium and low), and to answer the
research questions stated earlier in the chapter.
Research design
The descriptive method is appropriate when the research purpose is to describe
characteristics of certain objects, without just being a fact-gathering expedition but:
61
"a glue of explanation and understanding" (Siu, 1999, p. 138). The survey research
method is a branch of descriptive research used for obtaining data from respondents.
Three common survey administered methods are identified; telephone interview,
personal interview and mail interview. Though the mail survey is widely criticised
due to potentially low response rates, low data reliability and non-response error
(Siu, 1999), it has proven to be a valuable and widely used method of collecting
information in the marketing and small firm's marketing literature. This is due to its
low cost, no or limited interviewer's bias, and the ability of the respondents to
complete it at their convenience (Erdos, 1970; Yu, 1983). The researcher assured
confidentiality and anonymity in order to encourage respondents to give sensitive
information about marketing practices and performance, relative to their competitors.
Thus, the mail survey methodology was adopted for this stage of the research.
Sampling frame design
The sampling frame was derived from the Financial Analysis Made Easy (Fame) on-
line database (1998). This is a database of companies in the UK and Ireland. As
stated in the web-site: (http: //Fame. bvdep. com/cgi/template. dll? product=l)
"Fame gives detailed financial reports for up to 460,000 companies including
ownership, and descriptive information for 1.3 million additional companies. "
The database includes the company's full name and registered address, phone and
fax number, and the names of the directors together with the ownership status and all
financial report items like balance sheet, profit and loss account and cash flow.
Additionally, there are, on selected firms, calculated financial ratios. The possibilities
62
presented by the database made comparisons between financial data (accounts data)
of SMEs and respondents performance data given from the owner-managers
possible. This increased the validity of the performance instrument used in the
survey. Furthermore, comparisons within the same industry (peer group
comparisons) were made as a further measure of increasing the reliability of the
survey.
Sample size determination
Strategy-performance studies using the contingency model have an important
indicator in their models, the relative performance of the company in relation to their
marketing practices. According to Kirby (1992), relative marketing performance can
be measured by asking respondents to rate their company's performance in relation
to their competitors during the last financial year in terms of (1) profitability, (2)
sales volume, (3) market share and (4) return on investment. Companies are given a
rating between 1 and 3 (1 being "Better than", 2 being "Worse than" and 3 "Do not
Know") which is, according to Hooley and Lynch (1991), an appropriate
measurement scale. This produces a combination of 12 possible occurrences, which
can be presented by a matrix, or table, of 12 cells. The Chi-square test used in this
thesis requires the minimum expected value in each cell being 5 (Churchill, 1987).
Industrial surveys have an expected response of about 15% (Baldauf, 1998) and
hence the target set for this thesis was set at about 10% (Jobber 1989). This gave an
overall sample frame of about 600 Northern agri-food SMEs.
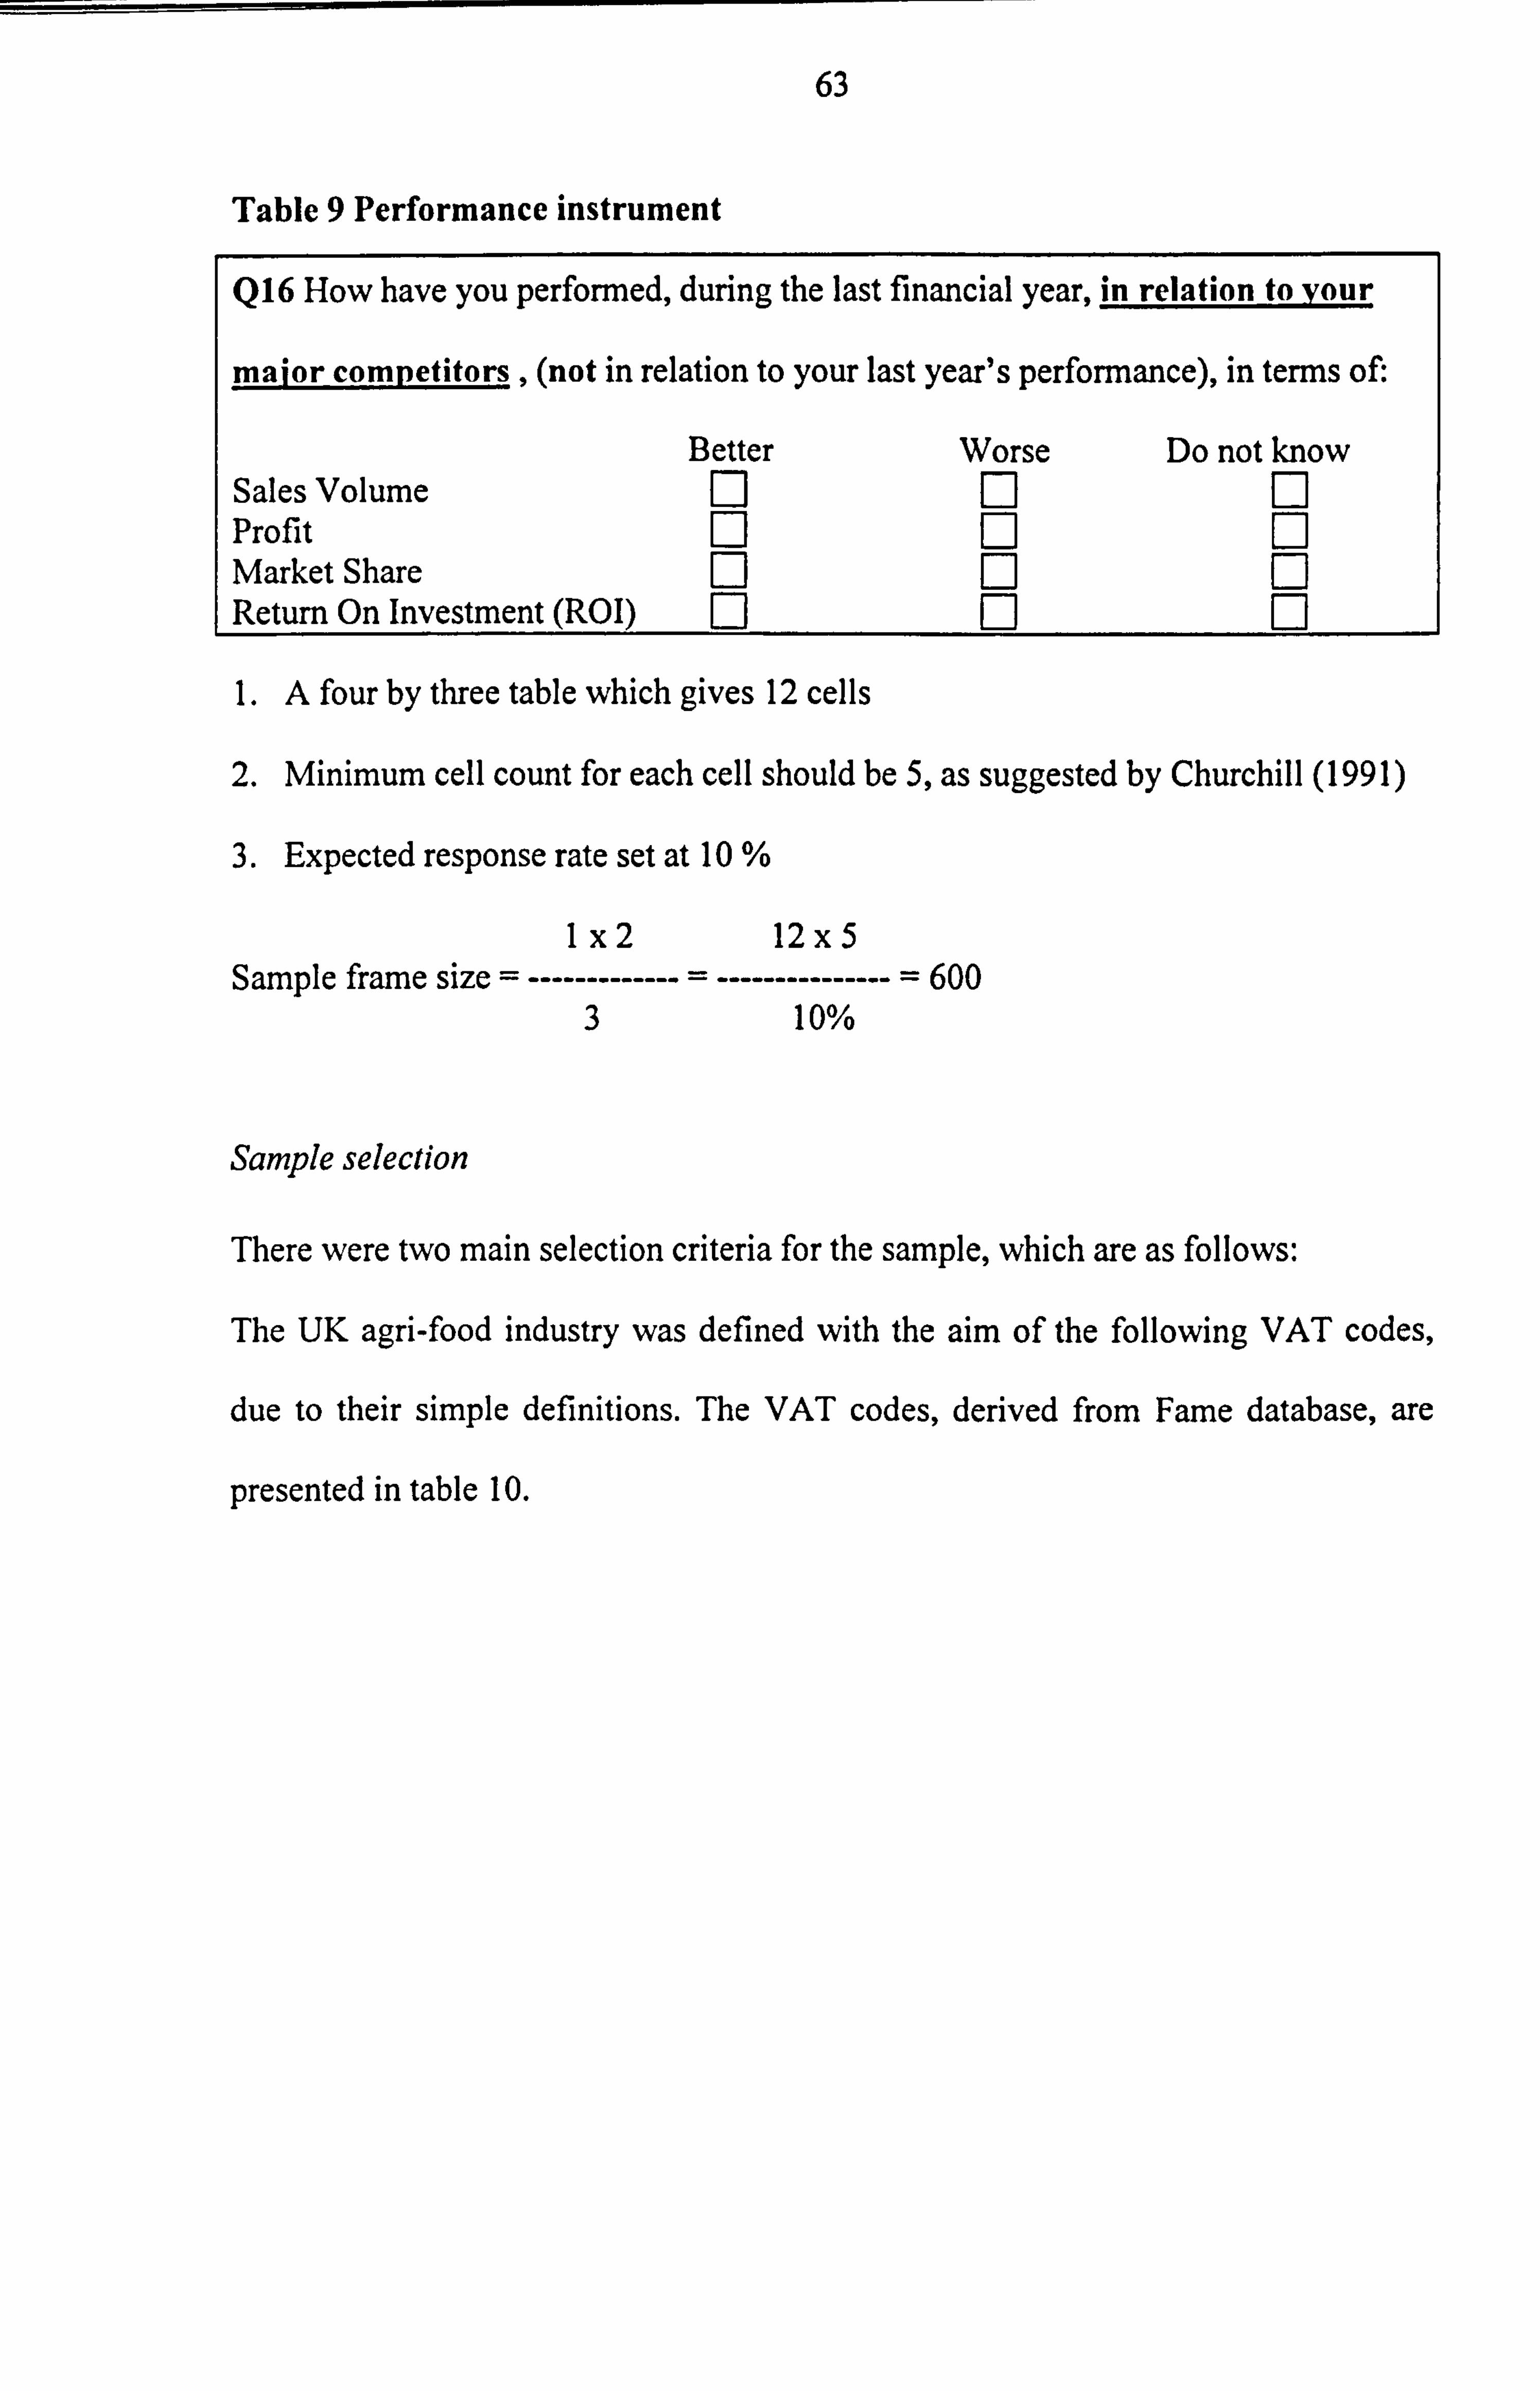
63
Table 9 Performance instrument
Q16 How have you performed, during the last financial year, in relation to your
maior competitors , (not in relation to your last year's performance), in terms of:
Better Worse Do not know Sales Volume Q Q Q Profit Q Q Q Market Share Q Q Q Return On Investment (ROI) Q Q Q
1. A four by three table which gives 12 cells
2. Minimum cell count for each cell should be 5, as suggested by Churchill (1991)
3. Expected response rate set at 10
1x2 12x5 Sample frame size = ------------- = --------------- = 600
3 10%
Sample selection
There were two main selection criteria for the sample, which are as follows:
The UK agri-food industry was defined with the aim of the following VAT codes,
due to their simple definitions. The VAT codes, derived from Fame database, are
presented in table 10.
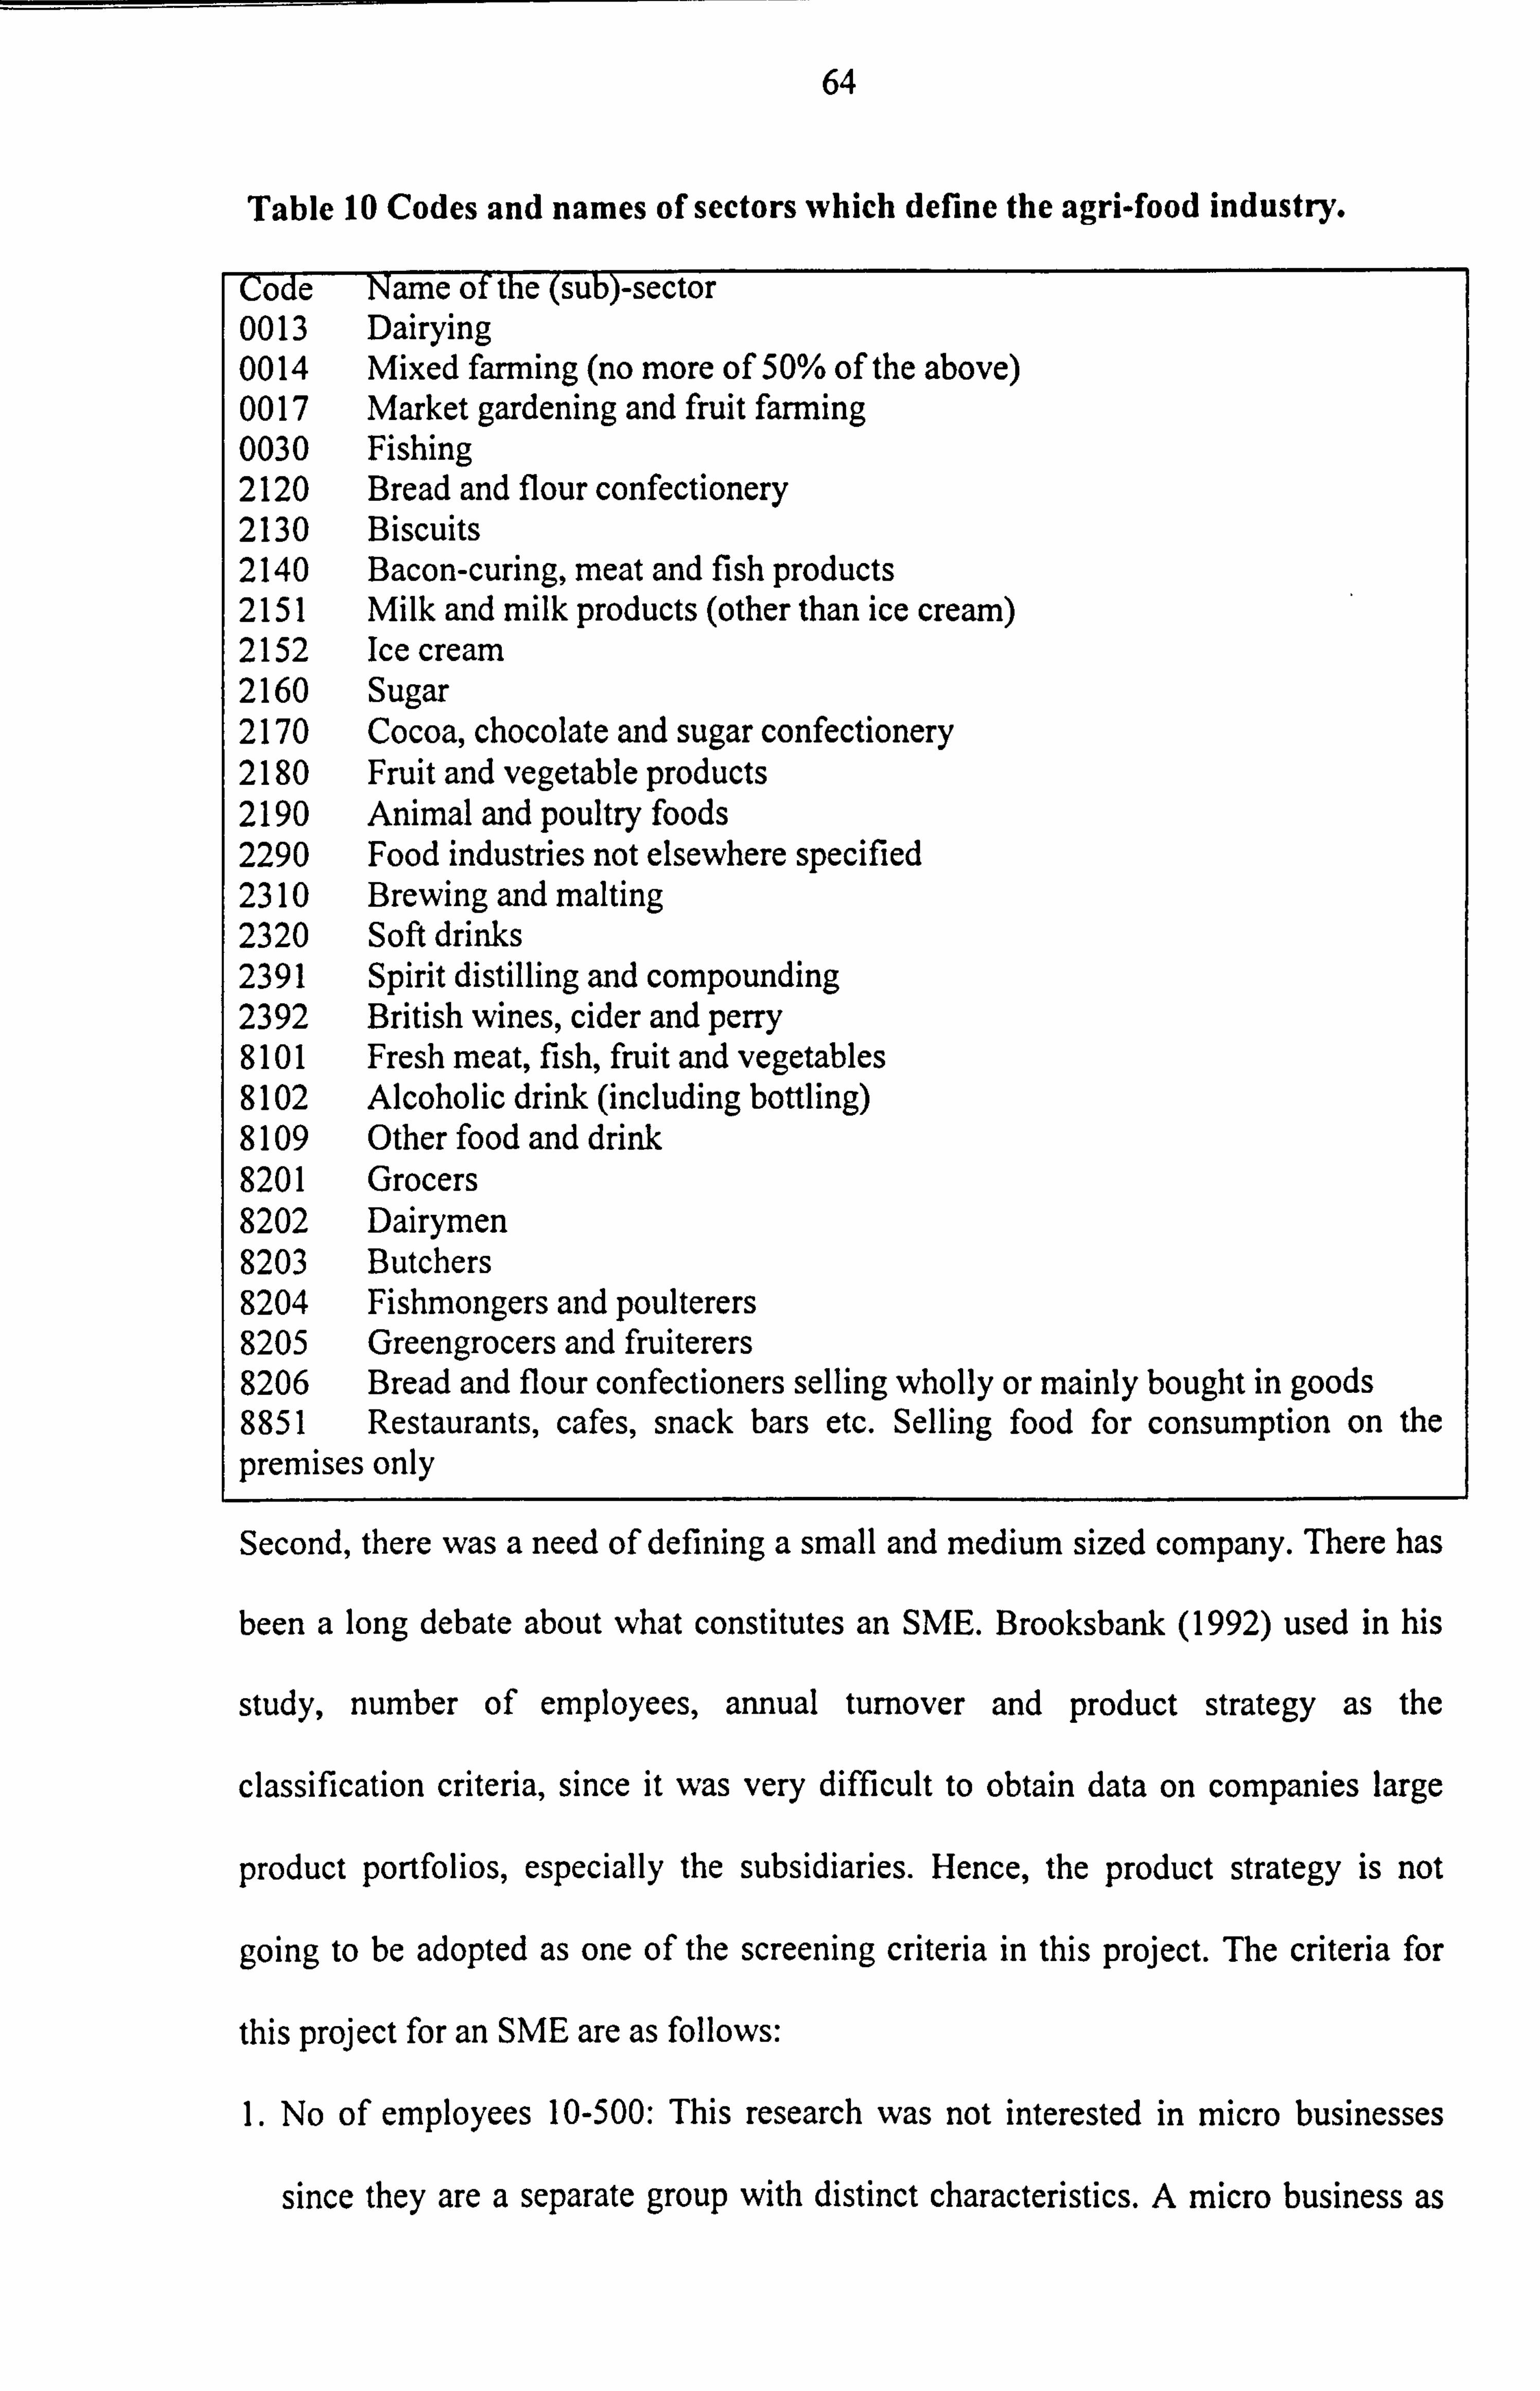
64
Table 10 Codes and names of sectors which define the agri-food industry.
Code Name of the (sub)-sector 0013 Dairying 0014 Mixed farming (no more of 50% of the above) 0017 Market gardening and fruit farming 0030 Fishing 2120 Bread and flour confectionery 2130 Biscuits 2140 Bacon-curing, meat and fish products 2151 Milk and milk products (other than ice cream) 2152 Ice cream 2160 Sugar 2170 Cocoa, chocolate and sugar confectionery 2180 Fruit and vegetable products 2190 Animal and poultry foods 2290 Food industries not elsewhere specified 2310 Brewing and malting 2320 Soft drinks 2391 Spirit distilling and compounding 2392 British wines, cider and perry 8101 Fresh meat, fish, fruit and vegetables 8102 Alcoholic drink (including bottling) 8109 Other food and drink 8201 Grocers 8202 Dairymen 8203 Butchers 8204 Fishmongers and poulterers 8205 Greengrocers and fruiterers 8206 Bread and flour confectioners selling wholly or mainly bought in goods 8851 Restaurants, cafes, snack bars etc. Selling food for consumption on the premises only
Second, there was a need of defining a small and medium sized company. There has
been a long debate about what constitutes an SME. Brooksbank (1992) used in his
study, number of employees, annual turnover and product strategy as the
classification criteria, since it was very difficult to obtain data on companies large
product portfolios, especially the subsidiaries. Hence, the product strategy is not
going to be adopted as one of the screening criteria in this project. The criteria for
this project for an SME are as follows:
1. No of employees 10-500: This research was not interested in micro businesses
since they are a separate group with distinct characteristics. A micro business as
65
defined by the EU is "... enterprises having fewer than ten employees" (Papoutsis,
1998). The companies therefore are between 10-500 employees or officially
classed as small and medium sized businesses (EU, 1996). Most companies in the
sample have been in operation for 5 years or more, which implies knowledge
accumulation and financial stability.
2. Turnover £100,000-£25 million: According to the latest report of the European
Commission "... an SME is a company which.. . has annual turnover of not more
than 40 million ECU" (Papoutsis, 1998). With an exchange rate at the time of the
survey (March 1999) of 1.6 ECU to a pound sterling this worked out as £25
million.
3. Companies with registered trading addresses in the North and North West of
England. That included the following regions; Northumberland, Cumbria, County
Durham, North Yorkshire, Tyne & Wear, Lancashire, Greater Manchester.
The following criterion was used in order to split the sample to independent and
subsidiary SMEs:
1. Independent companies defined by FAME database. The definition is that an
independent company is not partly or wholly subsidiary or holding company.
Independence by the EU is defined as follows :
"Independent enterprises are those which are not owned as to 25% or more of the
capital or the voting rights by one enterprise, or jointly by several enterprises, falling
66
outside the definitions of an SME or a small enterprise, whichever may apply. This
threshold may be exceeded in the following two cases:
a) If the enterprise is held by public investment corporations, venture capital
companies or institutional investors, provided no control is exercised either
individually or jointly;
b) If the capital is spread in such a way that it is not possible to determine by whom
it is held and if the enterprise declares that it can legitimately presume that it is
not owned as to 25% or more by one enterprise, or jointly by several enterprises,
falling outside the definitions of an SME or a small enterprise, whichever may
apply.
From these criteria, subsidiary companies were classed as those, which did not
satisfy the ownership status of the above definition, in order to compare them with
the independent companies. The total sampling frame generated was 600 sample
units of which 380 were independent and 220 subsidiary SMEs.
The Instrument
The questionnaire was developed through a combination of the literature review on
small business marketing, with particular emphasis on the studies of Cox et al
(1994), Brooksbank et al (1992), and Siu (1997). It was modified in the light of the
literature on market orientation and the specific issues associated with the UK agri-
food industry and the smaller businesses. The single-page length (two-up, double
sided) format was described as appropriate for industrial mail surveys (Jobber, 1989;
Baldauf, 1998), and the professional survey approach (Erdos, 1970), was adopted. In
67
addition, recommendations by small business researchers (Alpar and Spitzer, 1989;
Forsgren, 1989) and marketing researchers (Baldauf, 1998) on small firms mail
surveys were used to motivate high response rates. An original letter (see appendix a)
was sent together with an A4, one-page questionnaire to the Managing Directors or
Marketing Directors addressed as either Dear Managing Director/Marketing Director
or the specific name of the person, if known. The name of the addressee and
company address appeared in the covering letter, as well as the printed outgoing
envelope. The covering letter invited companies to participate in research in order to
attract their attention since the four most important reasons for low response rates in
surveys are as follows:
1. Not enough time for the manager/owner to fill it in
2. The large number of questionnaires received by the company.
3. The questionnaires being too long.
4. The lack of perceived benefits for the company. (Baldauf, 1998)
In mail surveys, "timing" and "technique" dimensions must be considered in order to
achieve high response rates. Consequently, the questionnaire was sent in March
1999, a relatively quiet time for agri-food businesses. Furthermore, a full report of
the results was promised to the respondents including recommendations to improve
their marketing practices. Confidentiality was stressed by the researcher, and
respondents were given one month to return the questionnaire. No follow-ups were
used for the independent sample since the response rate was higher than the average
and was considered adequate. However, there was a follow up telephone call for the
subsidiary companies in order to increase the response rate.
Four experts, two in agri-food marketing and two in small business marketing
reviewed the questionnaire. Piloting the original questionnaire with ten agri-food
68
SMEs tested the structure and format of the questionnaire and the covering letter.
Their useful comments improved the layout of the questionnaire and helped
determine the classification system for the performance tool. An amended
questionnaire was adopted as the finalised version (appendix b).
Questionnaire administration
The questionnaire was designed to compile information about agri-food SMEs
operating in the North of the UK, concerning their marketing practices and
performance. The first batch was sent in March 1999 and questionnaires were
returned within one month. The effective mail out was 380 independent companies
and 220 subsidiary companies. Sixteen responses were excluded since they were
returned by post as undeliverable (ceased to operate), of which 12 were independent
and 4 were subsidiaries.
The valid responses were 92 for the independent SMEs (24.2% response rate), and
59 subsidiary SMEs (26.8% response rate). The response rates were higher than
previous studies (Brooksbank, 1992, Hooley and Lynch 1994, Saunders 1994, Siu
1997).
Data analysis
From the valid returned questionnaires (92 independent and 59 subsidiaries) six
independent and four subsidiaries were excluded from the study, since they did not
fully meet the criteria set out in the previous section (sample characteristics).
Therefore, the first sample included 86 independent agri-food SMEs, all operating in
the North of England, from a total sample of 368. In terms of subsidiary SMEs, from
69
an effective sample of 216, the used responses were 55. Because of the low actual
absolute number of the subsidiary SMEs (even after the follow up phone-calls) the
medium and low performance groups were merged into one medium/low
performance group. This issue will be further discussed in chapter 5.
The information from the mail survey was analysed in three steps, using SPSS 9.0
for Windows 95/NT software. First, the chi-square test in the CROSSTABS routine
was used. Second, discriminant analysis was used to determine the relative
importance of various marketing components on the company's marketing
performance. Finally, the Log Linear Model for Contingency Tables in the
CATMOD routine for SAS for Unix was used to examine the differences between
independent and subsidiary SMEs in their respective approaches to marketing. A
detailed examination of all three techniques is given in appendix c.
Summary
The findings from stage one provide an evaluation of marketing practices of
independent and subsidiary SMEs. In particular, the chi-square results provide the
description of how, and to what extent, agri-food SMEs make marketing decisions
and maintain competitiveness, and how the more successful performers differ in the
independent and subsidiary SMEs from the low performers. Discriminant analysis
findings classify the importance of the marketing practices of SMEs in terms of their
importance on performance. Finally, the use of Log Linear Analysis for Three-
variable table identifies the differences between the two groups in terms of their
marketing practices. The overall results assist the development of stage two, which is
70
to verify the results of the survey and gain a better understanding as to how and why
financially successful SMEs practice marketing the way that they do.
4.6.2 Stage two: Case studies and personal interviews
Although a mail survey can help to identify the marketing practices of agri-food
SMEs, it provides limited information as to how and why successful SMEs practice
marketing the way they do. As Yin (1994) stated, the case study inquiry is more
appropriate for research because it:
1. Copes with a distinctive situation in which there will be many more variables than
data points. As in this case, the marketing process consists not only of marketing
practices, but also of interactions between these practices, the nature of which is
impossible to capture in a survey.
2. Relies on multiple sources of evidence, with data needing to convergence in a
triangular fashion, that is from three different types of sources, and;
3. Benefits from the prior development of theoretical propositions to guide data
collection and analysis.
The purpose of this research stage is threefold:
1. To verify the survey results using five case studies as a vehicle for triangulation;
2. To gain a better understanding of why financially successful agri-food SMEs
practice marketing the way that they do, and;
3. To understand the differences in marketing practices between successful
independent and subsidiary agri-food SMEs.
71
Research design
The methodological instrument used for this stage was the case study. Yin (1994)
defines a case study as "an empirical inquiry that investigates a contemporary
phenomenon within its real-life context".
Criticisms of case study include lack of rigour, little basis for scientific
generalisations, excessive length and the collection of massive unreliable documents
(Yin, 1997). Yet it is very useful in expanding analysis of a situation, generalising
and even generating theory (Eisenhardt, 1989).
Evaluation of research method
The selection criteria for the choice of methodology are shown in table 11.
According to Yin (1994), these criteria are:
1. The type of research question that needs to be proposed (like who, where, how
and why);
2. The extent of control that the researcher has over the actual behavioural events,
and;
3. The degree of focus on contemporary as opposed to historical events.
Since this research is trying to identify why and how marketing is practised and
implemented in successful SMEs, and there is no need for control over the marketing
operations of the SMEs, case study research is the appropriate methodology.
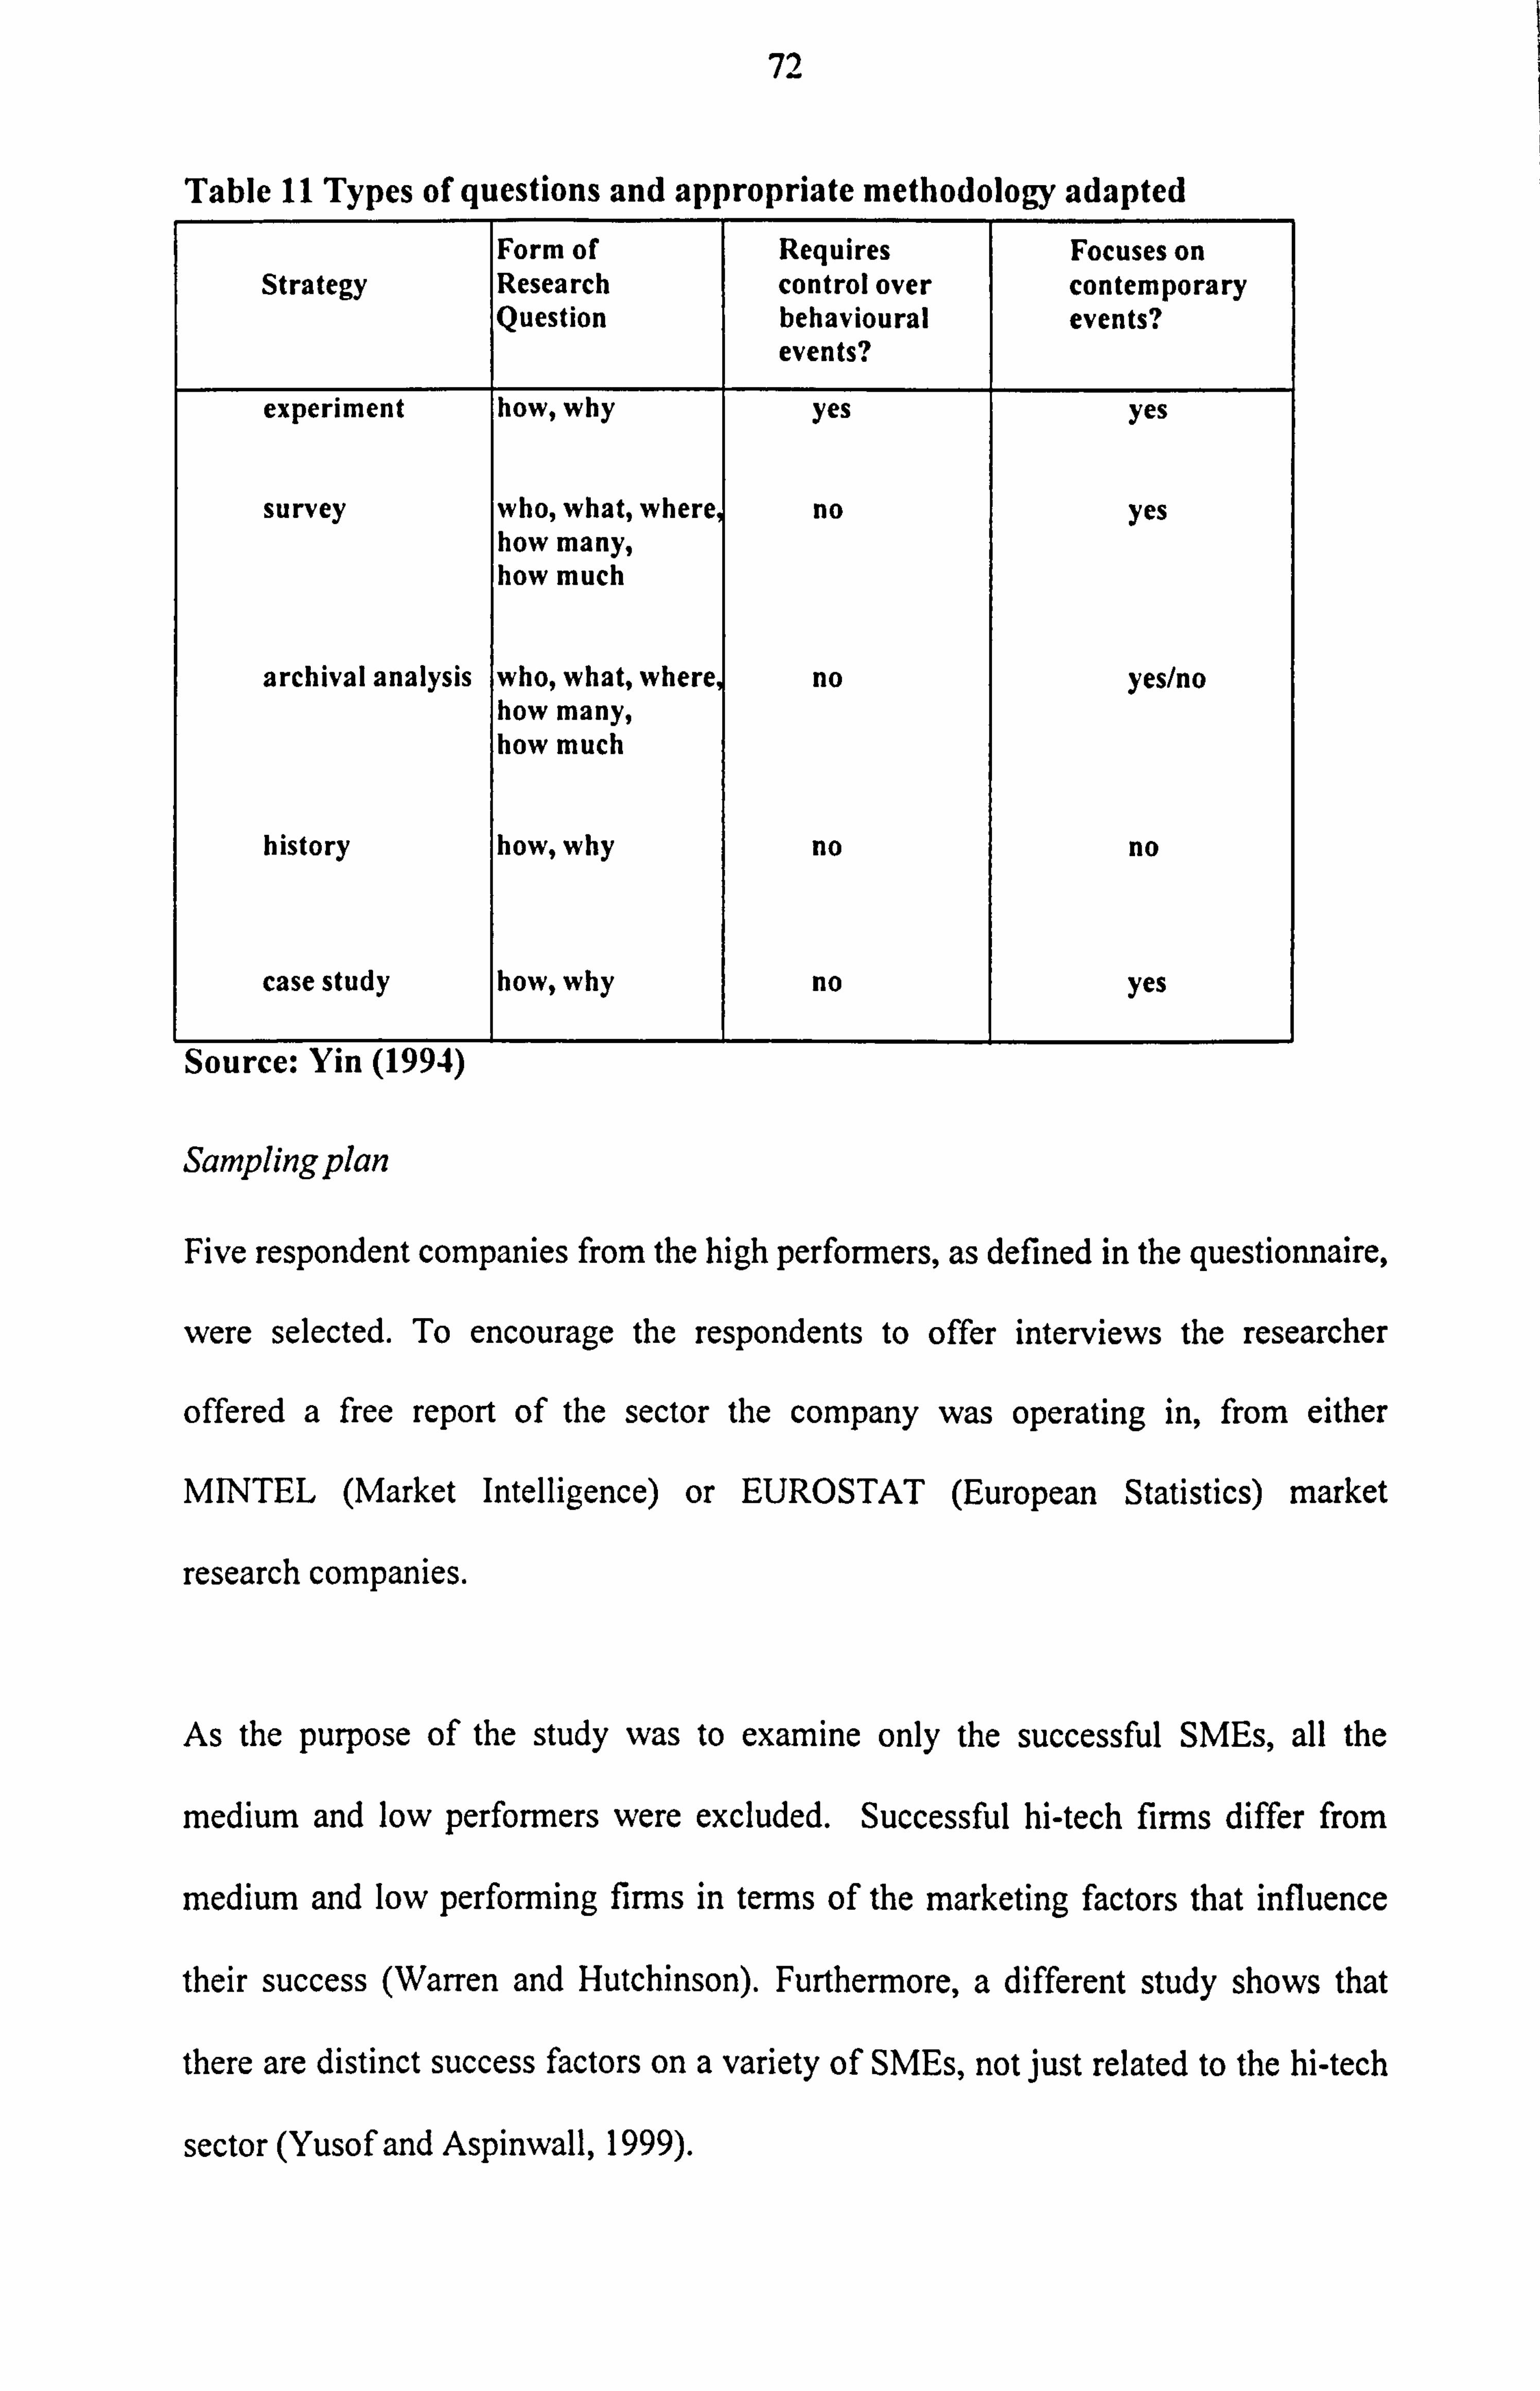
72
Table 11 Types of questions and appropriate methodology adapted
Strategy Form of Research Question
Requires control over behavioural events?
Focuses on contemporary events?
experiment how, why yes yes
survey who, what, where no yes how many, how much
archival analysis who, what, where no yes/no how many, how much
history how, why no no
case study how, why no yes
Source: Yin (1994)
Sampling plan
Five respondent companies from the high performers, as defined in the questionnaire,
were selected. To encourage the respondents to offer interviews the researcher
offered a free report of the sector the company was operating in, from either
MINTEL (Market Intelligence) or EUROSTAT (European Statistics) market
research companies.
As the purpose of the study was to examine only the successful SMEs, all the
medium and low performers were excluded. Successful hi-tech firms differ from
medium and low performing firms in terms of the marketing factors that influence
their success (Warren and Hutchinson). Furthermore, a different study shows that
there are distinct success factors on a variety of SMEs, not just related to the hi-tech
sector (Yusof and Aspinwall, 1999).
73
A follow-up telephone call was made to confirm the interviews and the possibility of
interviewing either the owner/manager, or if they were not available, the marketing
executive/manager.
The Instrument
The long interview technique (McCracken, 1988) was utilised. It focused on a series
of open-ended questions relating to the marketing decision of owner/managers of
agri-food SMEs. Various researchers on small businesses (Shaw, 1998, Eisenhardt,
1989) and strategic marketing (McKiernan, 1993, Thomas 1993) have used
interviewing as their instrument for data collection. Furthermore, Siu (1997) Siu and
Kirby (1999) and Carson et al (1990,1996) have expanded this methodology to
SMEs marketing research, giving it validity and acceptance within the small business
and marketing academic communities. The process model of Brooksbank et al
(1992) and Siu (1997) was used and adapted for the Northern agri-food industry.
Thus, an interview schedule with a questionnaire was designed to give a framework
and discipline to the interview. A semi-structured interview process was followed,
(appendix d), in order to add flexibility to the discussion.
Analytical method
Five companies were examined, two subsidiary agri-food SMEs operating in
Newcastle upon Tyne, and three independent agri-food SMEs, having their trading
offices either in Newcastle, Northumberland or Middlesborough. The interviews
ranged from 45 minutes to two and half-hours, were tape recorded with the consent
of the respondents and subsequently transcribed. QSR NUD. IST 4 (1997), a
74
computer aided qualitative research software was used (appendix d) to process the
data in Word 5 (for Macintosh) format. NUD. IST software has been praised for its
validity and ability of replicability of studies in marketing research (Prothero, 1996).
The use of qualitative software is not new in the social sciences. Both marketing
academics as well as other social scientists such as ethnographers and sociologists
use software similar to NUD. IST to analyse their data (for example see Richards and
Richards, 1994; Strauss and Corbin, 1990; Fielding and Lee, 1991). There have been
qualitative issues also relating to the marketing/entrepreneurship interface (Carson
and Coviello, 1996), the use of qualitative software in psychology (Cohen, 1999), as
well as other diverse areas like consumer preferences in fashion (Souza, 1996).
Qualitative research and strategic marketing planning research has also been applied
by researchers with agri-food related background (Hill and McGowan, 1999) to
investigate strategic marketing issues.
Concepts found in the interview transcripts were taxonomised and then drawn from
the transcribed interviews, with the aid of NUD. IST. There was triangulation of the
interview scripts with one researcher to ensure reliability of the conclusions and the
scripts, as suggested by Miles et al (1994) and Yin (1994).
Contribution to the thesis
Analysis of the survey results, combined with this part of the thesis, will lead to a
better understanding of the marketing implementation processes of successful agri-
food SMEs. It will also help in the development of a ̀ best practice' marketing model
for agri-food SMEs.
75
4.7 Conclusions
This chapter argues in favour of a stepwise approach to marketing research in SMEs.
It proposes a two-stage approach, starting with a quantitative survey of agri-food
SMEs, and a comparison of the two ownership groups within that. The second stage
is qualitative in nature, representing the integration of the contingency and process
models as suggested by Siu (1997).
The survey results identify the marketing practices of independent and subsidiary
agri-food SMEs, and their impact on company performance. There is also a
comparison between the independent and subsidiary groups to gain better insights of
the effect of ownership status on marketing and performance.
However, there is a need to gain a deeper understanding of the nature of SMEs
(Carson, 1990) and their different marketing processes, as described in chapter 3.
While quantitative research strategies may be useful for identifying the most
important marketing practices, they do not provide information on why and how
these marketing practices are carried out. Therefore, personal interviews are
proposed as a complementary method to provide insights into the effect of ownership
status on small firm marketing, in order to advance understanding of agri-food SMEs
marketing. The following chapters will first examine the rationale behind the model
selection, and then analyse the results of both the quantitative and qualitative
research.
76
Chapter 5 HYPOTHESES RATIONALE
5.1 Introduction
This chapter outlines the rationale behind the chosen hypotheses. The process model
chosen for the study is examined. Twenty hypotheses for three groups, namely
independent, subsidiary and the whole agri-food SMEs are discussed. Furthermore,
the performance indicator will be analysed, together with the sample characteristics.
Finally, the correlation between subsidiary and independent SMEs' performance will
be statistically tested by means of a Chi-square test.
5.2 Model selection
Figure 6 is the marketing process model adapted from Brooksbank (1990b) in order
to meet the needs of the smaller agri-food business. Twenty hypotheses were
formulated based on a review of empirical and normative literature on marketing and
SMEs for each of the three groups under investigation, group A, the independents,
group B the subsidiaries and group C the overall agri-food sample. The primary
objective was to test these hypotheses in the context of the agri-food SME
environment in the North of England (see map 1, p. 5). The model/framework used
was adapted from Brooksbank's et al (1992) research on medium manufacturing
companies in the UK, and Cox's et al cross-sectional study of SMEs around the UK
(Cox et al, 1994). Furthermore, the existing models of market orientation combined
with Hooley and Lynch research (1991) add to this framework.
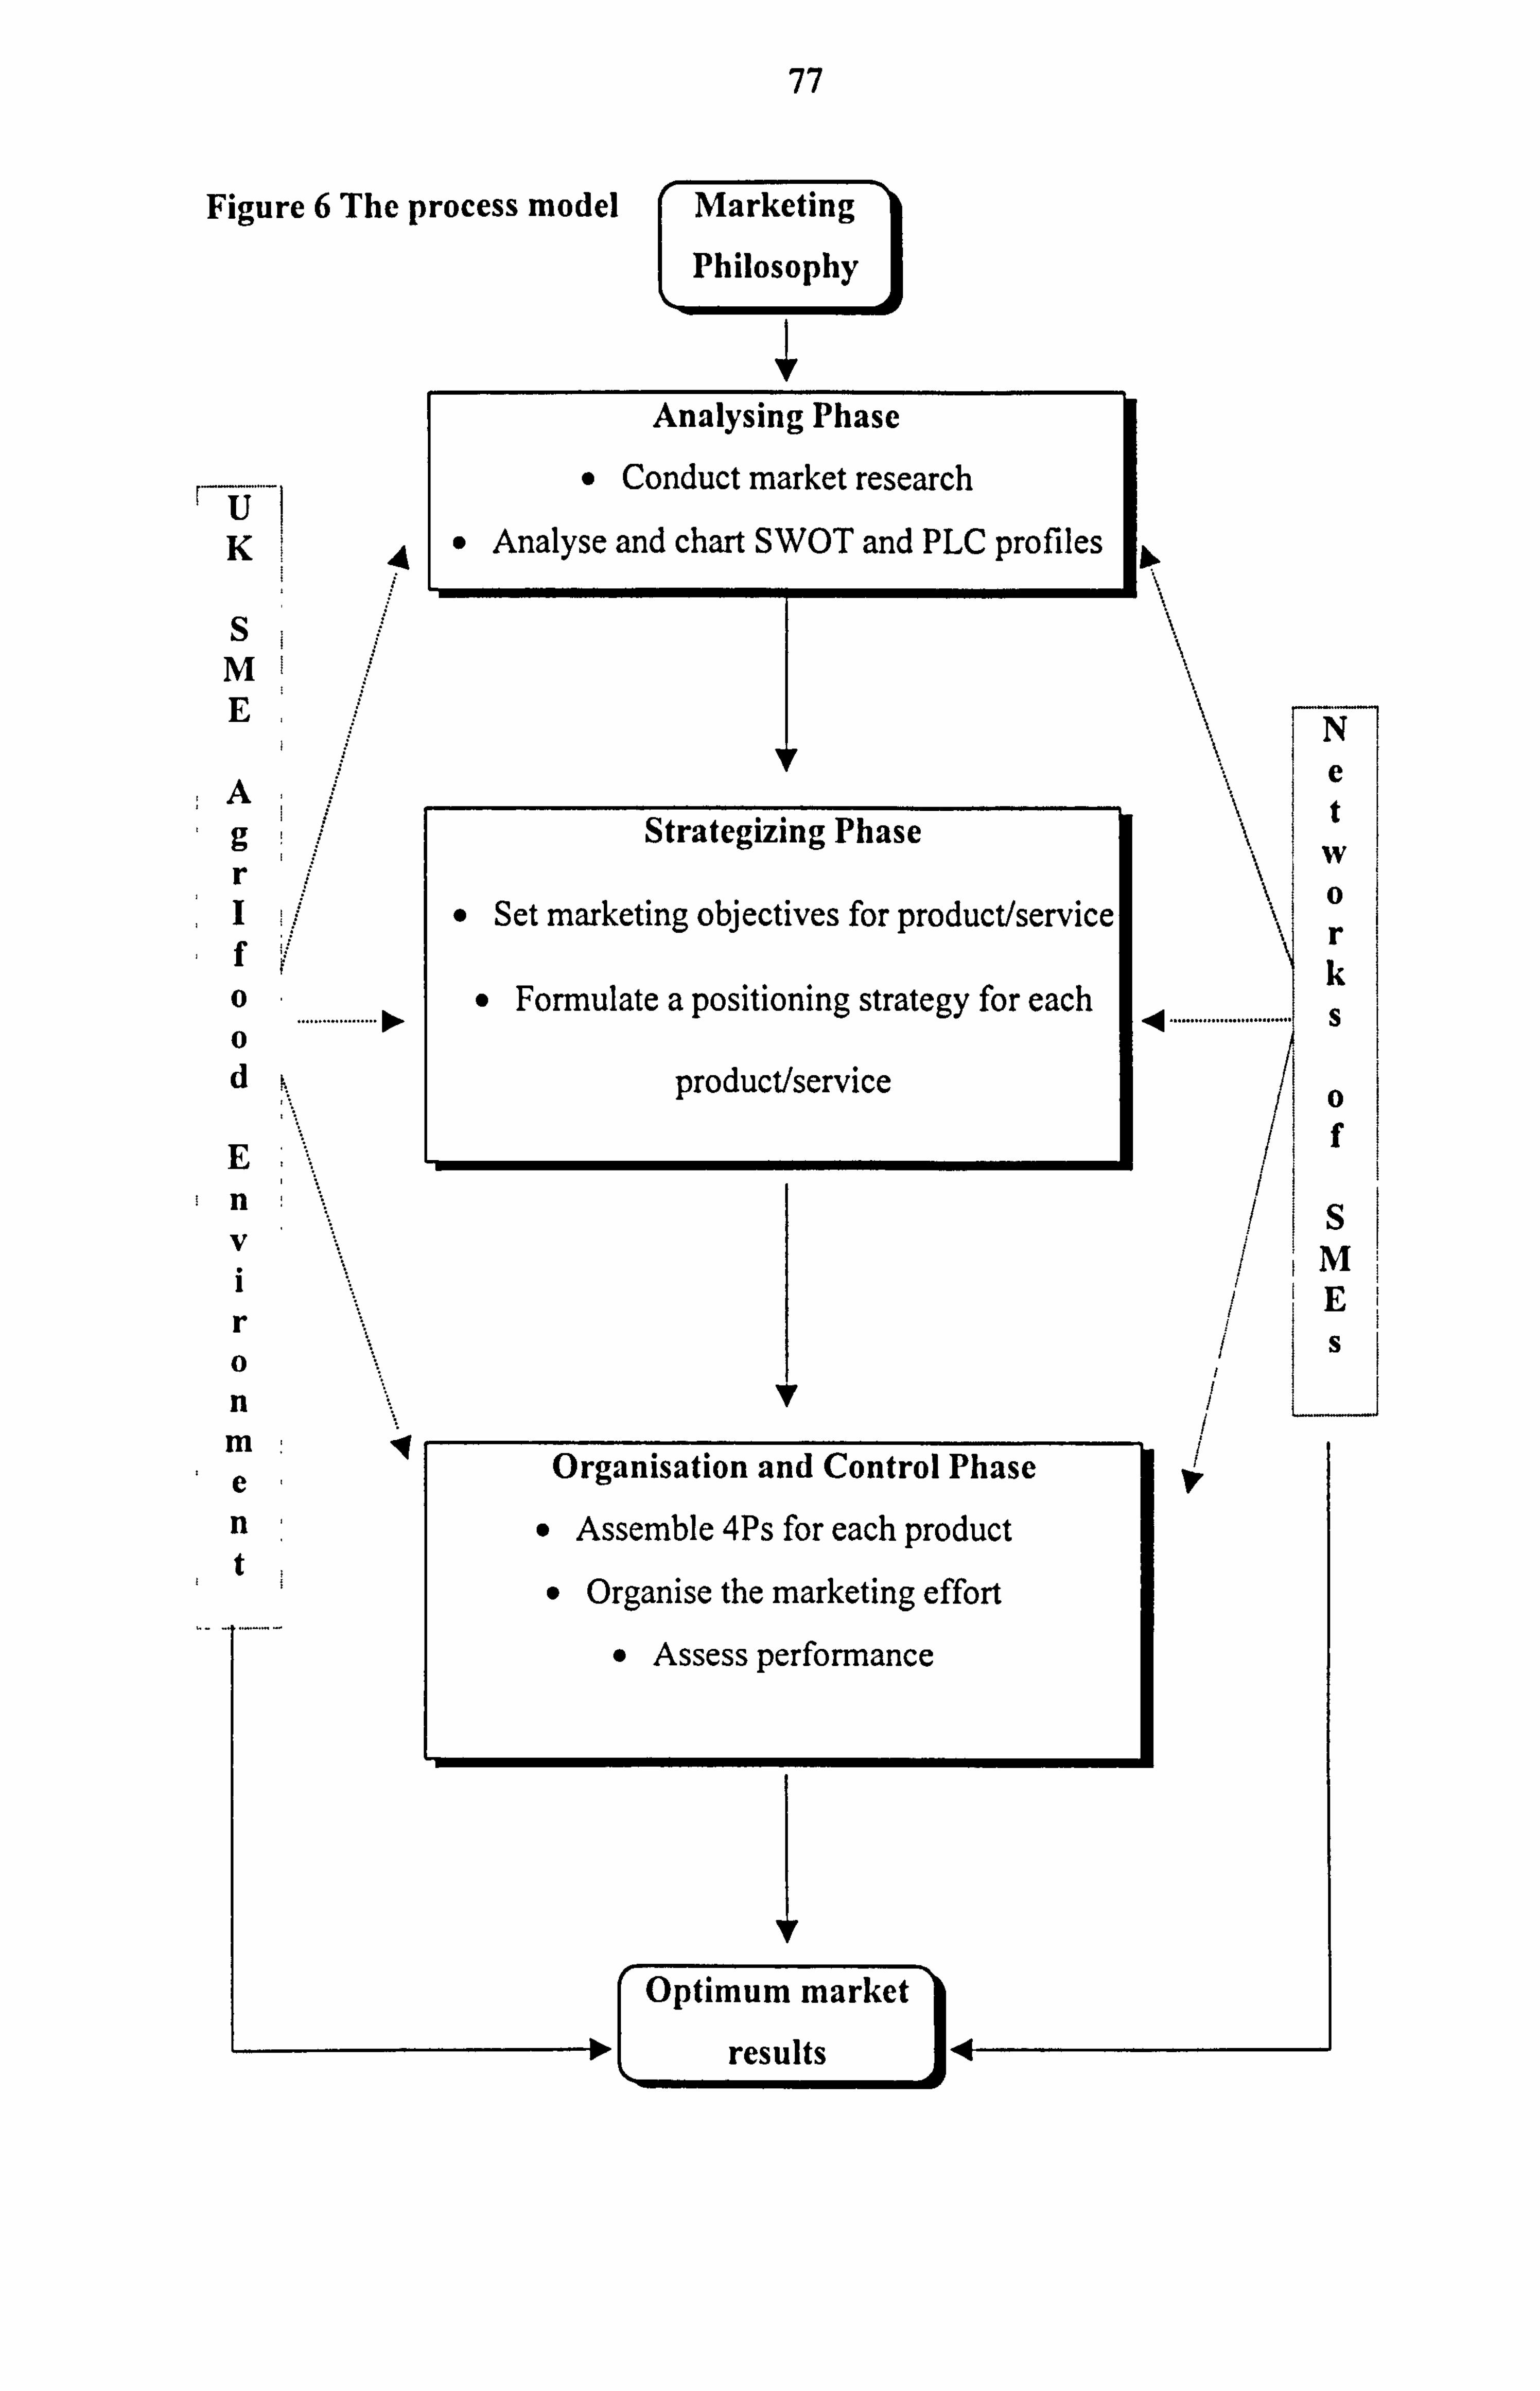
77
Figure 6 The process model Marketing
L Philosophy
Analysing Phase
" Conduct market research
KA" Analyse and chart SWOT and PLC profiles
S; Mt E
A g
Ii f
0 0 d
E n V i r 0 n m e n t
Strategizing Phase
" Set marketing objectives for product/servicel
to. " Formulate a positioning strategy for each
product/service
A
Organisation and Control
" Assemble 4Ps for each pro
" Organise the marketing of
" Assess performance
I
Optimum market
results
N e t w 0 r k s
0 f
!S
fE s
78
The hypotheses will be grouped into the following general categories, for
independent (group A), subsidiaries (group B) and the whole agri-food firms (group
C):
1. Business philosophy
2. Strategy analysis
3. Marketing strategy
4. Marketing organisation and control
Furthermore marketing networks and the external environment will be examined,
since chapter 3 showed their importance for relational marketing and market
orientation research.
5.2.1 Hypotheses relating to business philosophy
Hypotheses IA, 1B and 1C
Higher Performing Small and Medium sized independent (Hypothesis IA),
subsidiary (Hypothesis I B) and the whole agri-food (Hypothesis 1 C) Enterprises are
more likely to define their marketing as customer-driven rather than selling or
production driven.
Research by Peterson and Lill (1981) and Brooksbank et al (1992) showed that there
is a significant relationship between customer orientation and high performing
companies. Furthermore, literature on market orientation argues that customer
orientation is an important part of the market orientation construct and therefore
plays a significant role in high performing companies (Kohli and Jaworski, 1990;
Narver and Slater, 1990; Jaworski and Kohli, 1993). Finally, literature from food
79
marketing claims that there is a strong relationship between business to business
marketing and retail organisations' choices for their food suppliers (Scellhase et al,
2000).
5.2.2 Hypotheses relating to strategic analysis
Hypothesis 2A, 2B and 2C
Higher Performing Small and Medium sized independent, subsidiary and the whole
agri-food Enterprises are more formal marketing planning oriented than other
SMEs.
Small business and marketing researchers (Brooksbank et al, 1992; Cox et al, 1994)
found a positive relationship between organisational performance and formal
planning. Moreover, research in the marketing and strategy literature (McDonald,
1984; Mintzberg, 1994) points to the importance of planning for performance.
Empirical evidence in SMEs in the UK also highlighted the importance of formal-
long term strategic planning (Carson and Cromie, 1989). However, some academics
examining the relationship between SMEs planning and financial performance found
their results inconclusive (McKieman and Morris, 1994) and criticise the
methodological and theoretical foundations of similar studies. Although there is
literature to suggest that the food industry does a lot of marketing planning
(Wringley, 2000), the findings do not apply to the SME sized agri-food business.
Therefore, empirical testing is needed.
80
Hypothesis 3A, 3B and 3C
Higher Performing Small and Medium sized independent, subsidiary and the whole
agri-food Enterprises place major emphasis on a comprehensive situation analysis.
Empirical findings both from the marketing study of UK companies (Hooley and
Lynch, 1991), and of UK SMEs (Brooksbank et al, 1992; Cox et al 1994;
Brooksbank et al, 1999) support the notion that a situation analysis, consisting of
internal, competitor, customer, market, and the wider business analysis will have a
positive influence on performance.
Hypothesis 4A, 4B, 4C, 5A, 5B, 5C, 6A, 6B, 6C & 7A, 7B and 7C
Higher Performing Small and Medium sized independent, subsidiary and the whole
agri-food Enterprises make greater use of SWOT (Strengths, Weaknesses,
Opportunities, Threats) analysis.
Higher Performing Small and Medium sized independent, subsidiary and the whole
agri-food Enterprises are more aware of SJVOT analysis.
Higher Performing Small and Medium sized independent, subsidiary and the whole
agri-food Enterprises make greater use of PLC (Product Life Cycle) analysis.
Higher Performing Small and Medium sized independent, subsidiary and the whole
agri food Enterprises are more aware of PLC analysis.
Much of the marketing literature (Doyle, 1994; Kotler, 1994) encourages the use of
strategic marketing tools in order to achieve high performance. Empirical evidence in
the UK and in particular in the SME sector also show support for this hypothesis
(Hooley and Lynch, 1985; Carson and Cromie, 1989; Cox et al, 1994; Appiah-Adu,
81
1997), even though some academics argue for a change of the traditional promotional
mix in today's communication's environment (Cowles and Kiecker, 1998). There is
also literature on the food industry in Denmark pointing out to the importance and
lack of use of strategic tools such as SWOT and PLC analysis (Grunert et al, 1996).
Hypothesis 8A, 8B and 8C
Higher Performing Small and Medium sized independent, subsidiary and the whole
agri-food Enterprises make greater use of marketing research in their planning
activities.
Brooksbank (1990c) and Brooksbank et al (1992) show that smaller businesses
benefit from the use of marketing research in their planning activities, and that they
can as a result reach high performance levels (Carson et al, 1995). In order to
measure this, we will include both commissioned market research and research
carried out by the company itself. Literature on the issue of the use of market
research by non-retail organisations does not exist in the UK. However in Denmark
in a similar study for the food industry, Grunert et al (1997) found there is a
relationship between performance and high levels of marketing research.
82
5.2.3 Hypotheses relating to marketing strategy
Hypothesis 9A, 9B and 9C
Higher Performing Small and Medium sized independent, subsidiary and the whole
agri-food Enterprises have a strategic focus based on raising volume rather than
productivity improvement.
Most of the "excellence" literature of the eighties (Hooley and Lynch, 1985; Peters,
1982; Saunders and Wong, 1985) supported the assertion that aggressive marketing
objectives characterise higher performers, which are more likely to be differentiated
by the strategic focus based on increased volume rather than productivity
improvements (Brooksbank et al, 1992).
Hypothesis 10A, 10B, 10C, 11A, 11B, 11C, & 12A, 12B and 12C
Higher Performing Small and Medium sized independent, subsidiary and the whole
agri-food Enterprises produce better quality products than their competitors.
Higher Performing Small and Medium sized independent, subsidiary and the whole
agri-food Enterprises reputation is better than their competitors.
Higher Performing Small and Medium sized independent, subsidiary and the whole
agri-food Enterprises distribution is better than their competitors.
Marketing strategy, and in particular the above elements of the marketing mix, were
shown, in previous empirical studies, to be positively related with high levels of
performance (Brooksbank et al, 1992). Furthermore, normative research in SMEs
suggests that these are the main value adding mechanisms of the marketing mix in
83
SMEs (Carson, 1990; Carson et al, 1995). Finally, food marketing literature shows
that these are significant factors for the success of the food industry (Deliza et al,
1999).
5.2.4 Hypotheses relating to marketing organisation
Hypothesis 13A, 13B, and 13C
Higher Performing Small and Medium sized independent, subsidiary and the whole
agri food Enterprises have more flexible marketing organisational structures.
Brooksbank et al (1992) suggested the overlap between marketing and other
functions as one measure of flexibility. There are more recent examples from the
marketing implementation literature pointing to the importance of flexibility,
integration and co-operation of all the departments of the company, for a high
performing enterprise (Pelham, 2000). Literature from food marketing also point to
the distinct flexibility of smaller enterprises (Dana, 1999).
Hypothesis 14A, 14B and 14C
Higher Performing Small and Medium sized independent, subsidiary and the whole
agri-food Enterprises respond more quickly to changes in customer requirements or
to negative customer satisfaction information.
Walker, (1987, p. 32) found a positive relationship between performance and
effectiveness in relation to competitor's products, efficiency (Return On Investment),
and adaptability (business's success to adapt over time in changing conditions). The
84
speed of response to changes or complaints of customers was adopted by Appiah-
Adu, (1997) as part of the measure of market orientation for small firms, which was
also found to be related to high levels of performance. Brooksbank (1990b) and Siu
(1997) also point to the importance of speed of change of SMEs, and conclude that
there is a significant relationship between the high performing companies and the
above variable.
5.2.5 Hypotheses relating to marketing control
Hypotheses 15A, 15B, 15C & 16A, 16B and 16C
Formal customer feedback improves performance of SMEs
Marketing intelligence systems improve performance of SMEs
The above propositions are strongly supported by empirical literature (Brooksbank,
1990c; Brooksbank et al, 1992; Carson et al, 1995; Cousins et al, 1988; Coxet al,
1994; McDonald, 1984; Piercy, 1989).
Another study of implementation processes in the SME sector, (Sashittal and
Wilemon, 1996) state the importance of viewing the marketing implementation
interface as a singularly interactive process, integrating marketing within the whole
business functions. In all of the firms that they sampled, they also found that
managers agreed to the latter synergy and its importance to the successful
implementation of marketing strategy, and ultimate high performance.
85
Sashittal and Tankersley (1997) also point to the importance of the environment and
the above interface and conclude by stressing that the increasing integration of the
cross functions of the organisations will be a vital part for the successful planning-
implementation interface to be successful. Therefore, this study will try to test
whether this hypothesis applies to the agri-food industry.
5.2.6 Hypotheses relating to networks and the UK agri-food environment
Hypothesis 17A, 17B, 17C &18A, 18B and 18C
Higher Performing Small and Medium sized independent, subsidiary and the whole
agri-food Enterprises make greater use of their networks.
Higher Performing Small and Medium sized independent, subsidiary and the whole
agri-food Enterprises attach greater importance to their networks
The importance of networking in the marketing performance of SMEs has been
stressed by many academics (Brown et al, 1990; Larson, 1992; Zerrillo and Raina,
1996). There is also a trend amongst small business researchers to examine the
importance of networks within a small business environment and many have found a
positive relationship between network use and importance, and HPSMEs (Shaw,
1998; Siu and Kirby, 1998c; Brown et al, 1990). Furthermore, it was considered
critical to include networks and the environment in the model as vital elements of the
relational and transactional approaches to marketing (chapter 3).
86
Hypothesis 19A, 19B and 19C & 20A, 20B and 20C
Higher Performing Small and Medium sized independent, subsidiary and the whole
agri-food Enterprises view government or European regulation as a threat.
Higher Performing Small and Medium sized independent, subsidiary and the whole
agri-food Enterprises view the major market leaders as a threat for their survival
Most of the studies on market orientation and performance use the environment as
part of the measurement construct (Narver and Slater, 1990; Jaworski and Kohli,
1993; Cadogan and Diamantopoulos, 1995). UK studies, (Greenley, 1995) and SME
studies in particular (Appiah-Adu, 1997) show the importance of this variable for the
marketing-performance relationship, by empirically testing its relationship with high
performing companies. However, this study was in a specific area, within a specific
industry, and thus, the environment was controlled. Two questions were generated,
one relating to the recent trend of mergers and acquisitions within the agri-food
industry, and whether SMEs view that as a threat. The second was related to UK and
European regulation.
5.3 Performance instrument
Although firm performance plays an essential role in strategy research, there is
considerable debate on the appropriateness of various approaches to the concept and
measurement of organisational performance. The complexity of performance is the
major factor contributing to the debate.
87
Objective measures from accounts data are preferable to subjective measures from
owner-managers. However they are not usually available because most small firms
are privately held and the owners are neither required by law to publish financial
results nor are they willing to reveal such information to outsiders (Beal, 2000).
Although sometimes financial data may be available, they may be inaccurate because
they are not audited.
For this study, it was necessary to classify companies according to their financial
performance. Perceptual measures of performance were used. In particular
respondents were asked to give information on their companies' performance
measures in relation to their major competitors, in the last financial year. These
financial measurements are widely considered as appropriate and are used in similar
studies to classify performance (Brooksbank, 1990c; Brooksbank et al, 1999;
Brooksbank et al, 1992; Chander and Hanks, 1993; Cox et al, 1994, Hooley and
Lynch, 1986,1991). They consist of Sales Volume, Profit, Market Share and Return
on Investment (ROI) in relation to their main competitor, in the last financial year.
Table 12 shows the exact nature of the performance question and is taken from the
actual questionnaire.
Table 12 Performance instrument Performance indicators
Q16 How have you performed, during the last financial year, in relation to your
major competitors , (not in relation to your last year's performance), in terms of: Better (1) Worse (2) Do not know (3)
Sales Volume QQQ Profit QQQ Market Share QQQ Return On Investment (ROI) El Ll 1-71
88
5.3.1 Classification selection and criteria
Based on the answers, the companies were classified into three groups, "high",
"medium" and "low" performers. This classification was supported from both
previous studies (Hooley and Lynch, 1991) and personal informal interviews with
various owners of the companies, in the piloting stage of the questionnaire. This
stage included the test of the structure and format of the letter with the questionnaire
to 15 companies. Their useful comments improved the layout of the questionnaire
and determined the performance classification system used in this study. The
classification criteria were as follows:
" High Performing firms were companies with at least three out of the four
measurements better than their competitors (the order does not matter since all
four measurements carried equal importance ̀ weight').
9 Low Performing firms were companies which had the following combinations
(similarly the order does not matter since all four measurements carried equal
importance `weight'):
a) All four measurements worse than their competitors
b) All four measurements as do not know (interpreted as they did not understand
their market position or they did not want to disclose such sensitive information).
c) Three worse and one do not know
d) Three do not knows and one worse
e) Two worse and two do not knows, and finally
f) Two worse and two blank
" Medium performing firms were companies that had all other possible
combinations.
89
A summary of the classification criteria is presented below, where 1 is `better', 2 is
`worse', 3 is `do not know' and 9 is `blank'.
High performers = 1111,1112,1113,1119.
Low performers = 2222,3333,2223,3332,2233,2299
Medium performer = 1122,1222,1333,2239,1239,1299,1999,9999,9933,9333.
However, the above classifications can be criticised as soft measures and subjective
in nature. Hence, there is a two-stage validation of the performance measure. First, a
comparison between three companies and their immediate competitors, in terms of
financial data is made. The second stage of the validation process of the performance
construct tests statistically the relationship between the three groups of performance
(high, medium and low) with financial ratios of 69 companies for which objective
accounts data were available from Fame database (appendix c).
5.4 Rationale behind split of sample to independent and subsidiary SMEs
Earlier in the thesis, there have been discussions on the importance of marketing
within the SME sector, in order to improve its competitiveness. Furthermore, the
importance of the agri-food industry was outlined together with a need for the
industry to become more market orientated and examine its marketing practices.
Chapter 3 also pointed out the importance of examining SME marketing separately
to marketing of big businesses, and highlighted the importance of comparative
studies within SME research, for example, between independent and subsidiary
SMEs (Shrader and Simon, 1997; Cooper, 1993).
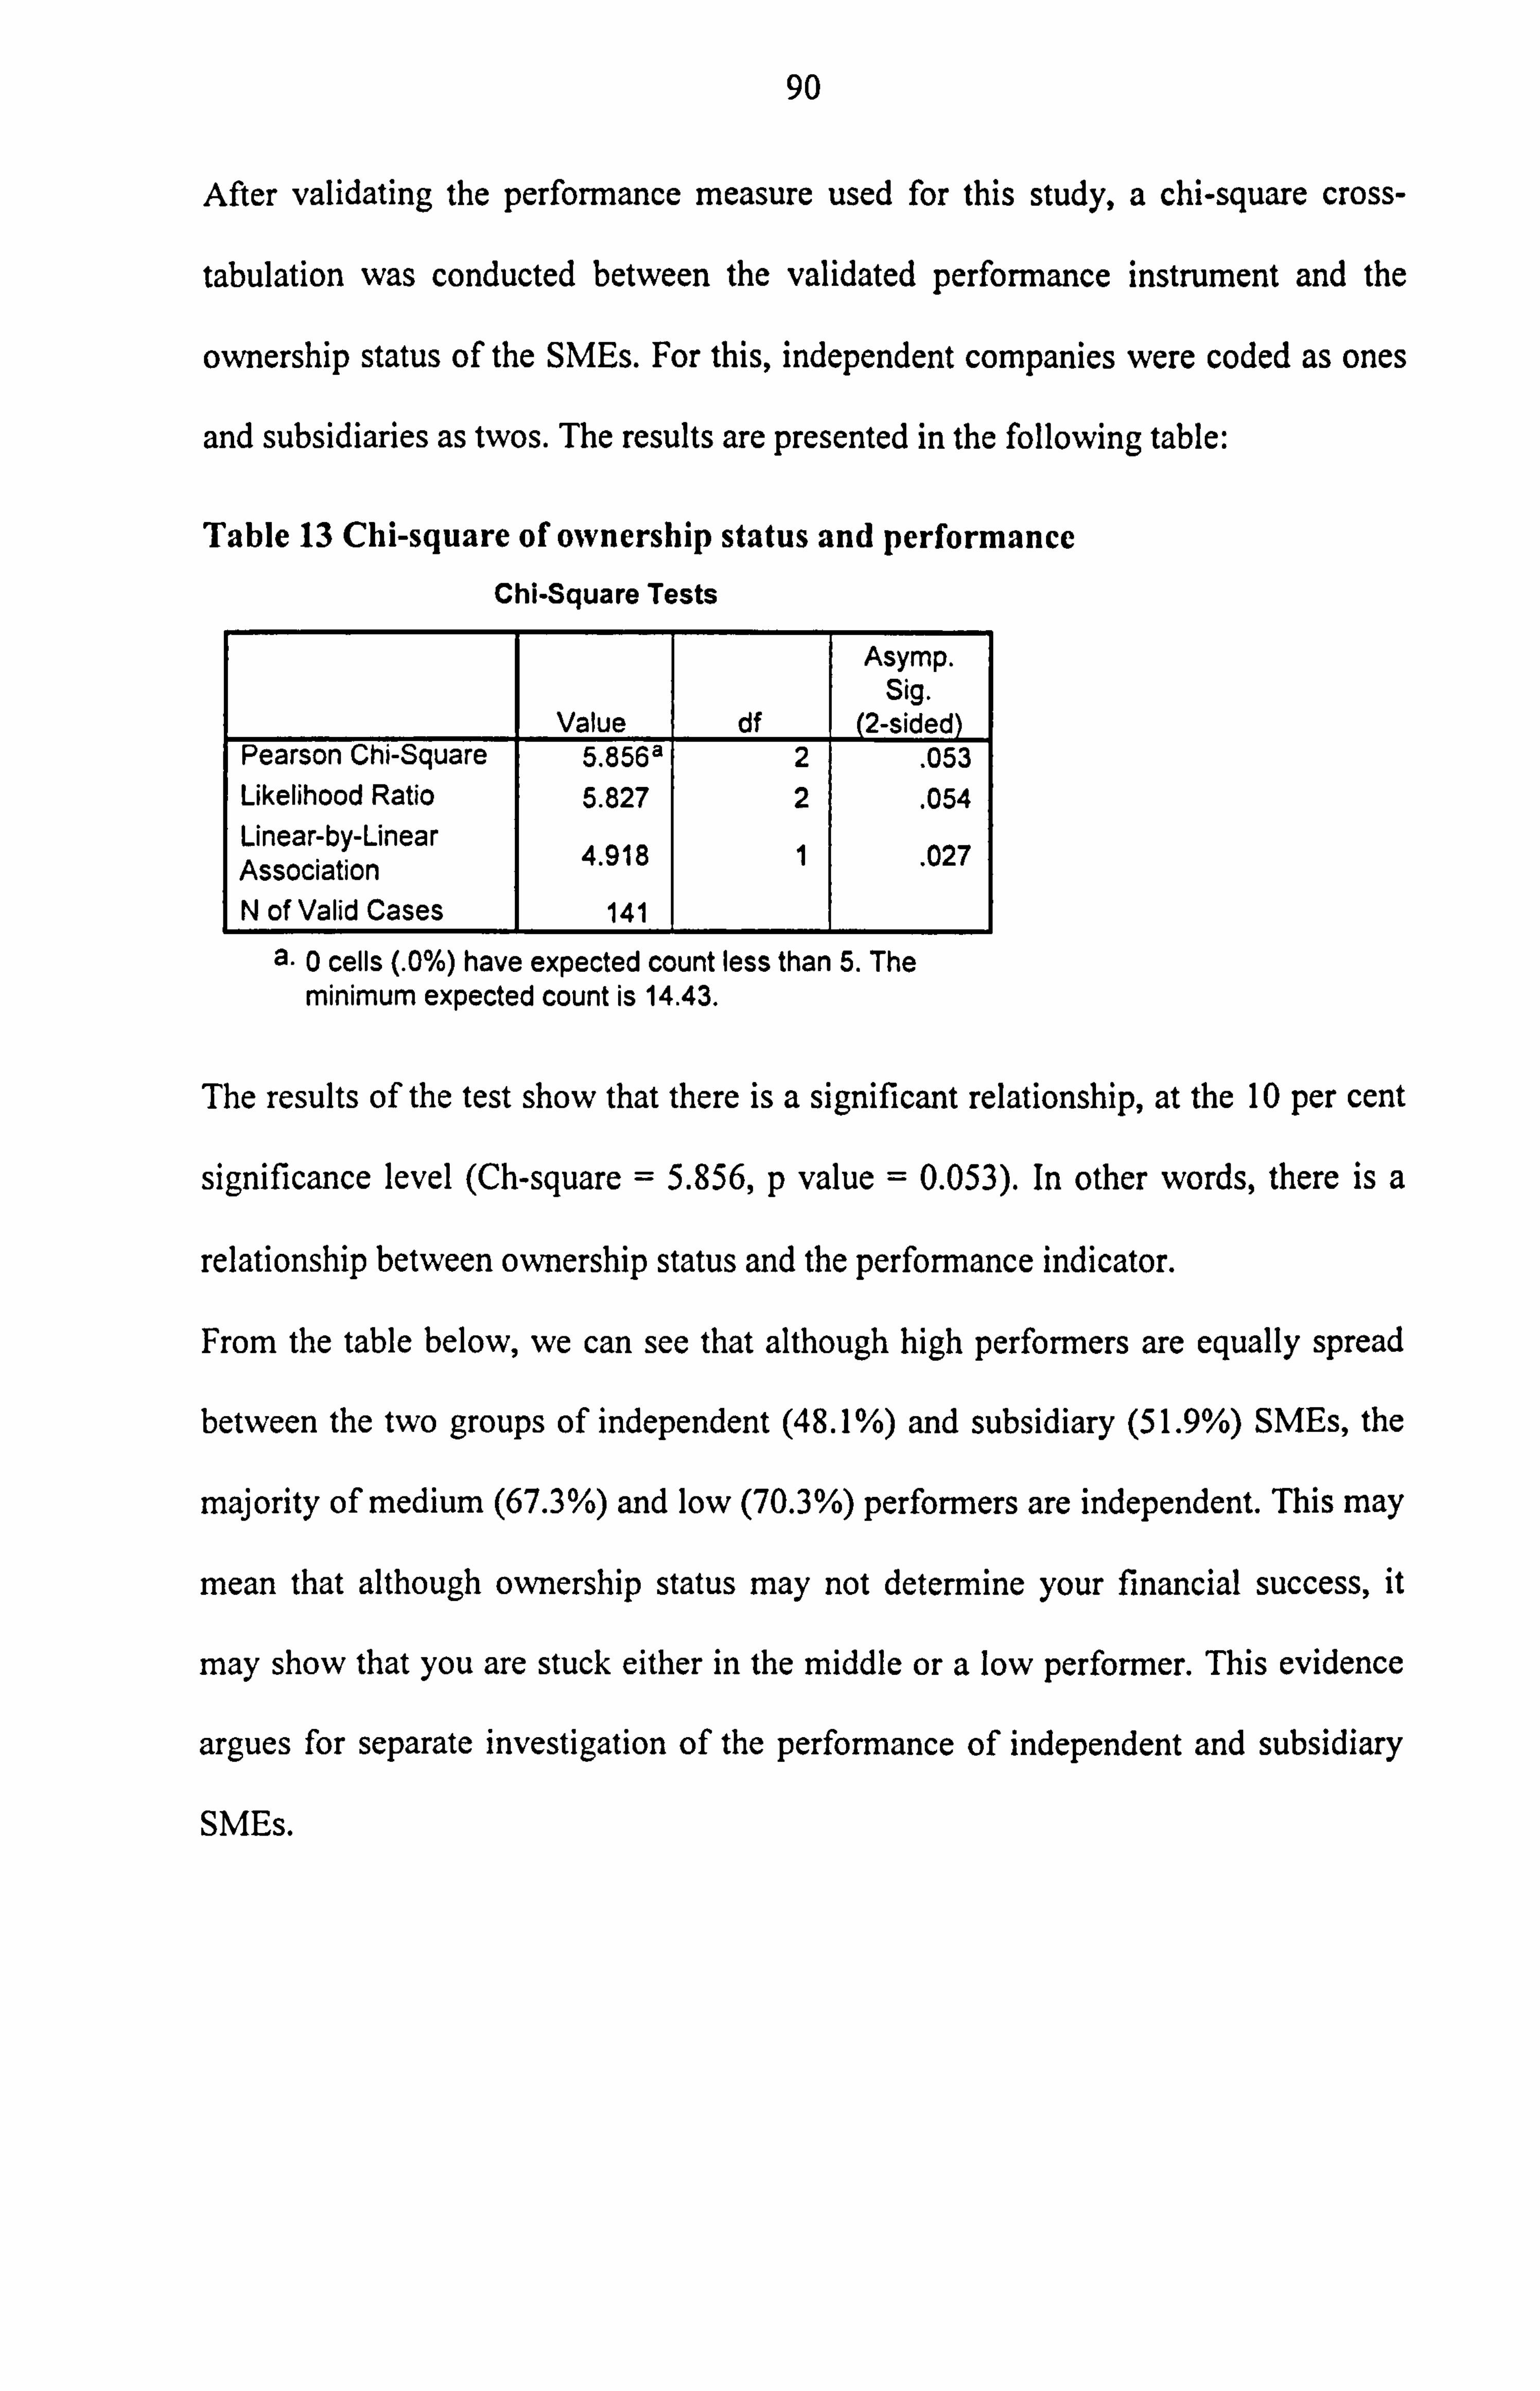
90
After validating the performance measure used for this study, a chi-square cross-
tabulation was conducted between the validated performance instrument and the
ownership status of the SMEs. For this, independent companies were coded as ones
and subsidiaries as twos. The results are presented in the following table:
Table 13 Chi-square of ownership status and performance Chi-Square Tests
Asymp. Sig.
Value df (2-sided) Pearson Chi-Square 5.856a 2 . 053 Likelihood Ratio 5.827 2 . 054 Linear-by-Linear Association 4.918 1 . 027
N of Valid Cases 141
a0 cells (. 0%) have expected count less than 5. The minimum expected count is 14.43.
The results of the test show that there is a significant relationship, at the 10 per cent
significance level (Ch-square = 5.856, p value = 0.053). In other words, there is a
relationship between ownership status and the performance indicator.
From the table below, we can see that although high performers are equally spread
between the two groups of independent (48.1%) and subsidiary (51.9%) SMEs, the
majority of medium (67.3%) and low (70.3%) performers are independent. This may
mean that although ownership status may not determine your financial success, it
may show that you are stuck either in the middle or a low performer. This evidence
argues for separate investigation of the performance of independent and subsidiary
SMEs.
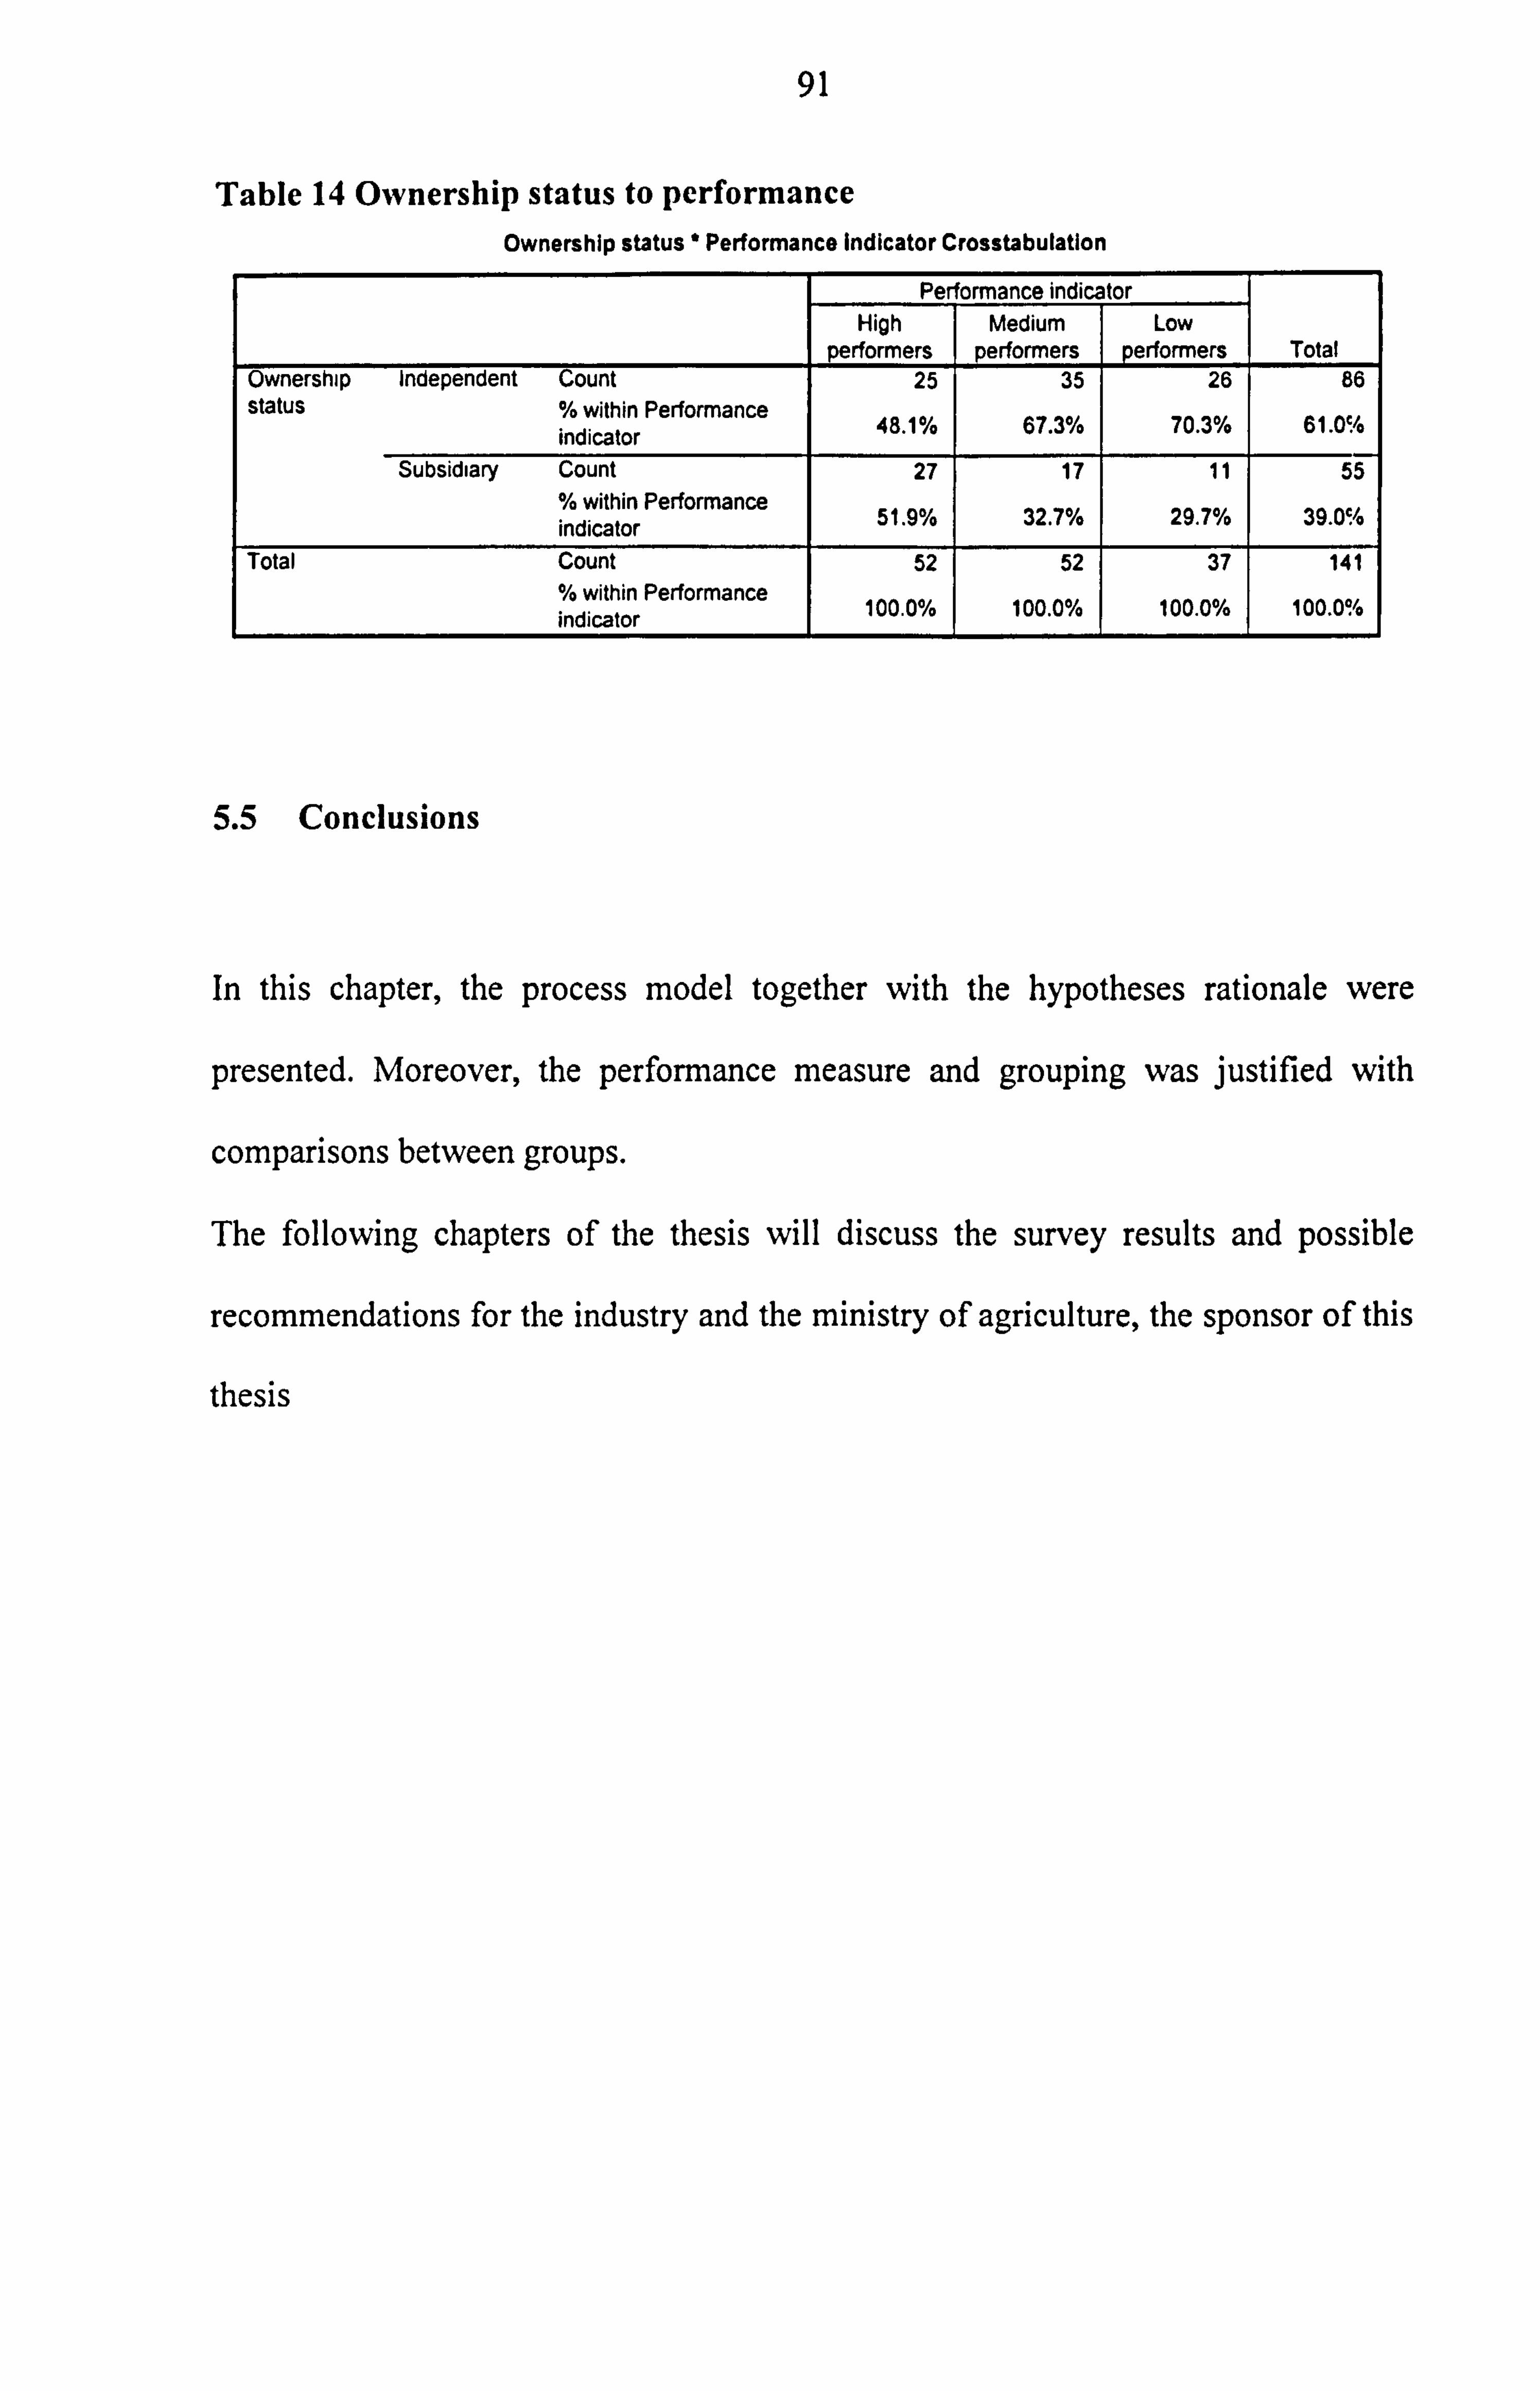
91
Table 14 Ownership status to performance Ownership status * Performance Indicator Crosstabulation
Per formance indicator High Medium Low
performers performers performers Total Ownership Independent Count 25 35 26 86 status % within Performance
indicator 48.1% 67.3% 70.3% 61.0%
Subsidiary Count 27 17 11 55 % within Performance indicator 51.9% 32.7% 29.7% 39.0%
Total Count 52 52 37 141 % within Performance indicator 100.0% 100.0% 100.0% 100.0%
5.5 Conclusions
In this chapter, the process model together with the hypotheses rationale were
presented. Moreover, the performance measure and grouping was justified with
comparisons between groups.
The following chapters of the thesis will discuss the survey results and possible
recommendations for the industry and the ministry of agriculture, the sponsor of this
thesis
92
Chapter 6 SURVEY RESULTS
6.1 Introduction
This chapter tests the twenty hypotheses formulated in chapter 5, based on the
literature review on SMEs (chapter 3). To elaborate how and to what extent
independent agri-food SMEs are different to subsidiary SMEs, this chapter proceeds
to use the data collected in the survey in order to test the hypotheses. Furthermore, it
will test the whole sample of agri-food SMEs and compare it to the two separate
groups, in order to make clearer recommendations about the state of the industry, in
terms of SMEs in the North of England. There are three parts to the chapter. The first
part uses the chi-square contingency tables, for the independent, subsidiary and all
agri-food SME groups to see whether various marketing practices are significantly
related to performance. The second part tests the significance of these practices in
order of their importance weight, by using Discriminant Analysis. Finally, the
significant marketing differences between subsidiary and independent SMEs are
tested using log-linear analysis.
6.2 Hypotheses testing
This section will test the hypotheses using the Chi-square tests for contingency tables
for the independent, the subsidiary and finally a comparison of the two groups with
all of the agri-food SMEs. Because of the small number of respondents of the
subsidiary group (55 companies), and in order to satisfy the Chi-square assumption
that expected values should be greater than five, the performance measure was
93
merged from high, medium and low performers, into financially successful (the high
performers) and financially average/low (the medium and low performers merged in
one group). The rationale for this split is that the thesis concentrates on the successful
high performers and their difference to the rest of the performers. Therefore, the
major group of interest is the high performers. The full contingency tables are given
in appendix e and the results of the tests are summarised in table 18. It is worth
noting that due to the exploratory nature of the research and the purpose of building a
tentative model, the confidence level is set at the 90% level. This is also in line with
Brooksbank's (1990c) study of marketing practices of medium sized businesses.
Another main point is that some Chi-square tests have expected counts of less than
five, therefore their results and explanatory power is limited. This is explicitly stated
in the results section. Finally in two hypotheses (11A and 14A) in the independent
group, the financial performance had to be integrated into two measures in a similar
fashion to the subsidiary group, because of the low expected variables.
6.2.1 Hypothesis relating to business philosophy (hypothesis IA, 1B and 1C)
Hypothesis IA, High Performing Independent SMEs (HPISMEs) are more likely to
define their company's approach as marketing driven.
As shown from tables el-e2 (appendix e), there is no statistical relationship between
financial performance and the marketing approach of the company (Chi-square value
= 1.84, p value = 0.399). However the majority of the high performers (60%) place
major emphasis on prior analysis of market needs, whereas the majority of both
94
medium (53.1%) and low (59.1%) performers place major emphasis on either
advertising, public relations, or sell to whoever will buy. Therefore, H1A is rejected.
Hypothesis 1B, High Performing Subsidiary SMEs (HPSSMEs) are more likely to
define their company's approach as marketing driven.
Tables e3-e4 show that there is no statistical relationship between the marketing
approach and the financial performance of subsidiary SMEs (Chi-square value =
0.057, p value = 0.811). Furthermore, there is no distinct difference between the
marketing approach of financially successful, and financially average/low SMEs.
Similarly, H1B is rejected.
Hypothesis 1C, High Performing Agri food SMEs (HPASMEs) are more likely to
define their company's approach as marketing driven.
There is no significant relationship between marketing approach and financial
performance of the companies in the survey, as revealed in tables e5-e6 (Chi-square
value = 1.539, p value = 0.463). From a brief comparison we see that high
performers tend to place major emphasis on prior analysis of market needs (57.7%).
However all three categories were found to have no statistical relationship showing
maybe that traditional textbook marketing does not apply to the SME sector, as
mentioned in chapter 2, in particular not in the agri-food industry. Hence, HIC is
rejected.
95
6.2.2 Hypotheses relating to strategic analysis (hypotheses from 2A to 8C)
Hypothesis 2A, HPISMEs tend to have formal strategic marketing plans.
Tables e7-e8 (Chi-square = 4.687, p value = 0.096) show that there is a significant
relationship, at the 10 per cent level, between high performers and formal strategic
marketing planning. From the above tables, it is clear that the majority of the higher
performers (66.7%) have annual and longer-term plans, whereas the majority of the
low performers (60%) have only annual or no marketing plans. H2A is therefore
accepted.
Hypothesis 2B, HPSSMEs tend to have formal strategic marketing plans.
From tables e9-e10 there is no significant relationship between high performing
subsidiary SMEs and strategic market planning (Chi-square value = 1.569, p value =
0.210). However, the majority of the high performers (66.7%) have annual and
longer-term plans. Hence, H2B is rejected.
Hypothesis 2C, HPASMEs tend to have formal strategic marketing plans.
Hypothesis 2 (tables el 1-e12) shows at the 5 per cent significance level, a statistical
relationship with performance (Chi-square value = 6.926, p value = 0.031).
Furthermore, 66.7% of the high performers have longer term planning whereas the
equivalent for medium is 44.9% and it drops to 41.9% for the low performers. This
shows an acceptance of H2C.
96
Hypothesis 3A, HPISMEs attach more importance to a comprehensive situation
analysis.
From tables e13-e14 we conclude that there is a significant relationship between
company performance and the degree of importance attached to a comprehensive
situation analysis (Ch-square value = 5.895, p value = 0.052), at the 10 per cent level.
Furthermore, the high performers attach more importance to a situation analysis
(66.7%) than the medium (50%) and the low (32%) performers. Therefore, H3A is
accepted.
Hypothesis 3B, HPSSMEs attach more importance to a comprehensive situation
analysis.
On the contrary, high performing subsidiary SMEs (tables e15-e16) show no
statistical relationship with the importance of situation analysis (Chi-square = 0.016,
p value = 0.898). Furthermore, there is not a big difference between high (51.9%)
and average/low (53.6%) performers attaching high importance in a situation
analysis. In other words H3B is not significant and therefore is rejected.
Hypothesis 3C, HPASMMEs attach more importance to a comprehensive situation
analysis.
Tables el7-e18 show that there is no relationship, in the overall sample, between
performance and a situation analysis (Chi-square = 3.357, p=0.187). However we
have to acknowledge the fact that high performers consider situation analysis
important (58.8%) whereas low performers do not consider it very important
(38.9%). Therefore, there is no support for H3C.
97
Hypothesis 4A, HPISMEs make greater use of SWOT analysis.
There is a significant relationship at the 0.1 per cent significance level, between
usage of Strengths Weaknesses, Opportunities, Threats (SWOT) analysis and high
performance (Chi-square = 18.102, p value = 0.001). Tables e19-e20 also show that
from the high performers 47% make high use and 47% make medium use, with only
4.3% having low use. The majority of low performing (60%) makes low usage of
this tool. The results point to the acceptance of H4A.
Hypothesis 4B, HPSSMEs make greater use of SWOT analysis.
Tables e21-e22 show that there is a relationship, at the 10 pr cent level, between
performance of subsidiary SMEs and SWOT analysis (Chi-square = 3.229, p value =
0.072). However, the majority of high performers (61.5%) make medium or low use
of SWOT analysis. Nevertheless, the equivalent percentage for average/low
performers was 84%. Hence, H4B is also supported.
Hypothesis 4C, HPASMEs make greater use of SNOT analysis.
From the tables e23-e24, we see that there is a significant relationship in the agri-
food industry between performance and SWOT analysis at the I per cent significance
level (Chi-square = 14.050, p value = 0.007). It is evident that there is a clear link in
all types of companies between usage of SWOT analysis (or something equivalent)
and performance. Therefore, this is of policy interest and H4C is accepted.
Hypothesis 5A, HPISMEs are more aware of SWOT analysis.
In terms of levels of awareness of SWOT analysis (tables e25-e26), there is a
significant relationship at the 5 per cent level (Chi-square = 7.666, p value = 0.022),
98
between performance and high awareness of this tool. It is also evident that high
performers are very aware of this or similar tools (72.7%) whereas only 33.3% of
low performers have high awareness of SWOT analysis. In other words results show
support for H5A.
Hypothesis 5B, HPSSMEs are more aware of SWOT analysis.
There seems to be no statistical relationship between awareness levels of SWOT and
performance (Chi-square = 0.014, p value = 0.905), as seen from tables e27-e28.
Similarly 54.2% of the high performers had average to low awareness of SWOT
analysis, and the equivalent for medium/low performers was 52.4%. Hence, H5B is
not supported.
Hypothesis 5C, HPASMEs are more aware of SWOT analysis.
Tables e29-e30 show no relationship between SWOT levels of awareness and
performance (Chi-square = 4.521, p value = 0.104). The majority of low performers
(65.6%) have medium or low awareness of SWOT analysis, whereas the majority of
high performers (58.7%) have high levels of awareness of SWOT analysis.
Therefore, H5C is rejected.
Hypothesis 6A, HPISMEs make greater use of PLC analysis.
Product Life Cycle (PLC) levels of usage is significantly related to performance at
the 10 per cent level (Chi-square = 13.723, p value = 0.08). It is also evident from
tables e31-e32 that 52.2% of high performers have high use of PLC whereas only
13% of low performers having high use. Furthermore, 65.2% of low performers have
low usage of PLC. The results point to the acceptance of H6A.
99
Hypothesis 6B, HPSSMEs make greater use of PLC analysis.
On the contrary with independent SMEs, high performing subsidiary SMEs seem to
have no significant relationship with PLC usage levels (Chi-square = 0.944, p value
= 0.331). However, this is a very careful estimation since the expected count for two
cells (50%) is less than five as seen from tables e33-e34. Hence, this limitation
makes the test very weak.
Hypothesis 6C, HPASMEs make greater use of PLC analysis.
Tables e35-e36 show that there is a significant relationship between high
performance and usage of PLC at the 5 per cent level (Ch-square = 9.631, p value =
0.047). Therefore, H6C is supported.
Hypothesis 7A, HPISMEs are more aware of PLC.
There is a 10 per cent significant relationship between awareness of PLC and
performance (Chi-square = 4.849, p value = 0.089). As shown from tables e37-e38,
54.5% of high performers have high awareness of PLC. However, what is interesting
is that the lowest percentage of high awareness of PLC is the medium performers
with only 25.8% of them having high levels of awareness. Hence, H7A is accepted.
Hypothesis 7B, HPSSMEs are more aware of PLC.
Tables e39-e40 show no relationship between performance and awareness of PLC
(Chi-square = 0.548, p value = 0.459). 64% of high performers claim medium and
low awareness of the tool, whereas 73.9% of low performers claim the same. There
is no support for H7B.
100
Hypothesis 7C, HPASMEs are more aware of PLC.
There seem to be no relationship between PLC awareness and performance in the
agri-food sample (Chi-square = 3.832, p value 0.147). Tables e41-e42 however show
that 44.7% of high performers are highly aware of PLC while only 28.9% of medium
and 25.8% of low performers are highly aware of PLC. Again it may be the case that
some companies in the industry value this tool's usage and not awareness and believe
there is no direct link between performance and its awareness. Results point to the
rejection of H7C.
Hypotheses 8A, HPISMEs make greater use of marketing research in their planning
activities.
Tables e43-e44 show a significant relationship at the 10 per cent level between
performance and usage of shelf generated or commissioned market research (Chi-
square = 9.357, p value = 0.053). Furthermore, 44% of high performers use this type
of research very often, at least once every six months, whereas the equivalent for
medium performers is 20% and for low performers is 12%. Therefore, H8A is
accepted.
Hypothesis 8B, HPSSMEs make greater use of marketing research in their planning
activities.
There also seem to be a significant relationship between performance and market
research usage at the 10 per cent level (Chi-square = 2.763, p value = 0.096).
However, from tables e45-e46 we see that 33.3% of high performers use it at least
once every 6 months whereas only 14.3 of medium/low performers use it as often.
Results in other words lead to the support of H8B.
101
Hypothesis 8C, HPASMEs make greater use of marketing research in their planning
activities.
At the 5 per cent level, there is a relationship between performance and market
research usage in the overall agri-food SME industry (Chi-square = 13.122, p value =
0.011), as tables e47-e48 show. A similar pattern with the previous two groups
appeared, that is 38.5% of high performers use it often, whereas only 8.3% of low
performers use as often. This result is of policy interest since there is a consistency
on its importance to all types of companies. Hence, H8C is also accepted.
6.2.3 Hypotheses relating to marketing strategy (hypotheses from 9A to 12C)
Hypothesis 9A, HPISMEs have a strategic focus based on raising volume.
There is no relationship between strategic focus and performance (Chi-square =
3.181, p value = 0.204). From tables e49-e50,73.9% of high performers focus on
expanding their total markets and winning share from their competitors, whereas the
percentage for medium performers is 50% and for low performers 56.5%. Therefore,
H9A is rejected.
Hypothesis 9B, HPSSMEs have a strategic focus based on raising volume.
Similarly there is no relationship between performance and strategic focus of
subsidiary SMEs (Chi-square = 0.537, p value = 0.464). Tables e51-e52 show that
the high performers and the medium/low performers are close into their strategic
focus (45.8% expand their market/win market share from competitors, whereas the
equivalent for medium/low performers is 56.5%). This may show that in terms of
102
strategy there is not such a big differentiation between subsidiary companies. H9B is
also rejected.
Hypothesis 9C, HPASMEs have a strategic focus based on raising volume.
Tables e53-e54 show that there is also no relationship between performance and
strategic focus of agri-food SMEs (Chi-square = 2.662, p value = 0.264). From that,
we conclude that strategy focus and a lot of its literature relating it to high
performance may not apply to the SME sector in the agri-food industry. Therefore,
H9C is rejected.
Hypothesis JOA, HPISMEs have better product quality than their competition.
There is, at the 10 per cent level of significance, a relationship between performance
and product quality in relation to competitors (Chi-square = 4.632, p value = 0.099).
Tables e55-e56 also show the importance of quality since 80% of the high
performers claim superior quality to their competitors, whereas only 56.5% of the
low performers claim the same. The results show support for Hl OA.
Hypothesis IOB, HPSSMEs have better product quality than their competition.
Tables e57-e58 show a significant relationship, at the 5 per cent level, between
performance and product quality (Chi-square = 4.964, p value = 0.026). It is also
clear from the tables that 77.8% of high performers have superior quality whereas
only 48% of low performers claim superior quality. Similarly, H1 OB is also accepted.
103
Hypothesis IOC, HPASMEs have better product quality than their competition.
There seem to be a relationship, at the 1 per cent level, (Chi-square = 9.221, p value
= 0.01), between performance and product quality, as tables e59-e60. This comes as
a confirmation to the increasing importance in the sector of the quality of products,
especially during the last 5-10 years after public scares like the BSE crisis, and
consumers decreased confidence. Hence, HIOC is supported.
Hypothesis HA, HPISMEs company/brand reputation is better than their
competition.
As mentioned at the beginning of the section, in this test we integrated medium and
low performance into one group since the expected values were less than five. So we
are a bit cautious on the reliability of this finding. Company/brand reputation is, at
the 5 per cent level, significantly related to performance (Chi-square = 3.999, p value
= 0.046). This confirms some literature on the importance of word of mouth effect
and reputation on an SMEs performance. As tables e61-e62 show, 72% of high
performers have superior reputation. There was no medium performer claiming
inferior company/brand reputation and 51.7% of the medium/low performers stated
inferior reputation. There is in other words support for H 11 A.
Hypothesis 11 B, HPSSMEs company/brand reputation is better than their
competition.
There is no relationship (tables e63-e64) between companylbrand reputation and
performance in the subsidiary group (Chi-square = 1.160, p value = 0.282). Since the
brand, in a lot of the cases, is associated with the parent company, subsidiary SMEs
104
do not see a reason for a link between their performance and their company/brand
reputation. Hence, H 11 B is rejected.
Hypothesis 11 C, HPASMEs company/brand reputation is better than their
competition.
Tables e65-e66 show a 10 per cent level significant relationship (Chi-square = 5.513,
p value = 0.064) between performance and company/brand reputation. Therefore, it
is of policy importance for agri-food SMEs to protect and improve their reputation in
order to increase profitability. H11C is therefore supported.
Hypothesis 12A, HPISMEs' distribution is better than their competition.
There seems to be no relationship between performance and distribution of SMEs
(Chi-square = 2.616, p value = 0.270). However, 63.5% of high performers claim
superior distribution whereas only 39.1% of low performers make the same claim
(tables e67-e68). The results do not support H12A.
Hypothesis 12B, HPSSMEs' distribution is better than their competition.
There also seems to be no link between performance and distribution within the
subsidiary group (Chi-square = 0.010, p value = 0.922) as indicated in tables e69-
e70. The results therefore point to the rejection of H12B.
105
Hypothesis 12C, HPASMEs' distribution is better than their competition.
Distribution has no direct effect on performance of agri-food SMEs (Chi-square =
3.188, p value = 0.203). Similarly from tables e71-e72 we can see that the results
lead to the rejection of H12C.
6.2.4 Hypotheses relating to marketing organisation (hypotheses from 13A to
14C)
Hypothesis 13A, HPISMEs have integrated marketing with the overall business
functions.
There seems to be a relationship at the 5 per cent significant level between
performance and the degree of integration of marketing with other business functions
(Chi-square = 7.307, p value = 0.026). Tables e73-e74 also show that 70.8% of high
performers have much integration whereas only 37.1 % are the medium and 40% are
the low performers with high levels of marketing integration. Hence, H13A is
accepted.
Hypothesis 13B, HPSSMEs have integrated marketing with the overall business
functions.
Tables e75-e76 show a5 per cent significant relationship between performance and
degree of integration (Chi square 4.259, p value = 0.039). Similarly, 63% of high
performers claimed much integration whereas only 34.6% of the medium/low
performers claimed much marketing integration. Similarly to the independent SMEs,
H13B is supported.
106
Hypothesis 13C, HPASMEs have integrated marketing with the overall business
functions.
The agri-food SMEs' performance is related to the degree of marketing integration
with the other business function. More specifically, at the 1 per cent significant level,
there is a relationship between the two (Chi-square = 11.151, p value = 0.004).
Tables e77-e78 prove that point, and the fact that this area is of also of policy interest
for MAFF, and that H13C is accepted.
Hypothesis 14A, HPISMEs are faster to changes in customer requirements.
This test as mentioned at the beginning of the section was the second within the
independent group to have expected values (25%) of less than five, even after the
integration of the performance variables, and hence its results should be interpreted
with great caution.
Tables e79-e80 show a 2.5 per cent significant relationship between performance and
response to customer changes (Chi-square = 8.003, p value = 0.018). What is
interesting from the tables are that 95.8% of high performers claimed very fast
responses to customer changes, whereas only 68% of low performers claimed the
same. Therefore, H 14A is accepted.
Hypothesis 14B, HPSSMEs are faster to changes in customer requirements.
On the other hand there is no relationship between performance and SMEs response
to customers changes (Chi-square = 0.617, p value = 0.432), as tables e81-e82 show.
Hence, H 14B is not supported.
107
Hypothesis 14C, HPASMEs are faster to changes in customer requirements.
There is a1 per cent significant relationship between performance and responses to
customer changes within the whole SME agri-food industry in the North (Chi-square
= 11.654, p value = 0.003). As tables e83-e84 show 84.3% of high performers are
very fast /responsive whereas the equivalent for low performers is only 58.3%. The
results point to the acceptance of H14C.
6.2.5 Hypotheses relating to marketing control (hypotheses from 15A to 16C)
Hypothesis 15A, HPISMEs use formal customer feedback.
Although there is a cell with expected count of less than five, it only constitutes
11.1 % of the total so the results are valid. There seem to be a1 per cent relationship
between performance and frequency of customer satisfaction surveys (Ch-square =
14.495, p value = 0.006). Tables e85-e86 however show that the majority of high
performers (58.3%) only sometimes conduct this type of survey. Therefore, H15A is
supported.
Hypothesis 15B, HPSSMEs use formal customer feedback.
There is no statistical relationship between frequency of customer satisfaction
surveys and performance (Chi-square = 0.895, p value = 0.344), as tables e87-e88
show. Therefore, H15B is not supported for subsidiary SMEs.
108
Hypothesis 15C, HPASMEs use formal customer feedback.
From tables e89-e90 we see that there is a1 per cent significant relationship between
frequency of customer satisfaction surveys and performance (Chi-square = 19.689, p
value = 0.001). Therefore, in the agri-food industry H 15C is supported.
Hypothesis 16A, HPISMEs have an on-going marketing intelligence gathering
system.
There is also a1 per cent significant relationship between performance and usage of
an on-going marketing intelligence system (Chi-square = 13.502, p value = 0.009).
Therefore from tables e91-e92, we see a distinct difference between high performers
and low performers since 75% of the former have high use and only 29% of the latter
has high usage of intelligence gathering systems. Therefore, H16A is accepted.
Hypothesis 16B, HPSSMEs have an on-going marketing intelligence gathering
system.
There also seem to be a significant relationship at the 1 per cent level between usage
of an on-going marketing intelligence gathering system and performance (Chi-square
= 9.968, p value = 0.002), as shown in tables e93-e94. Therefore, H16B is also
supported in the subsidiary group.
Hypothesis 16C, HPASMEs have an on-going marketing intelligence gathering
system.
This test has one cell with expected count of less than five, which constitutes 11.1%
of total cells. Therefore, we can accept the results. Tables e95-e96 also prove that
there is a significant relationship at the 0.1 per cent level (Chi-square = 24.218, p
109
value = 0.000) between performance and usage of marketing intelligence gathering
systems, within the whole agri-food sample. Therefore H16C is accepted and is of
policy interest.
6.2.6 Hypotheses relating to networks and the agri-food environment
(hypotheses from 17A to 20C)
Hypothesis 17A, HPISMEs make greater use of their networks.
There seem to be no relationship between usage of networks and performance (Chi-
square = 0.512, p value = 0.774). Therefore, from tables e97-e98, H 17A is not
accepted.
Hypothesis 17B, HPSSMEs make greater use of their networks.
Similarly there is no statistical relationship between performance and usage of
networks within the subsidiary group (Chi-square = 0.127, p value = 0.721).
Interestingly the medium/low performers make greater use of their networks (43.5%)
than high performers (just 38.5%). Nevertheless, from tables e99-e100, the
conclusion is that H17B should be rejected.
Hypothesis 17C, HPASMEs make greater use of their networks.
There is also no relationship between usage of networks and financial performance
within the whole SME sample (Chi-square = 1.177, pa value = 0.555). As tables
e101-e102 show medium performers make higher use of networks (42.9%) than high
performers (40.8%). There is no support for H17C.
110
Hypothesis 18A, HPISMEs attach greater importance to their networks.
There seems to be no relationship between the importance of networks and
performance (Chi-square = 2.798, p value = 0.247). Tables e103-e104 show however
that 60.9% of high performers believe that networks are important, whereas the
equivalent for low performers is 39.1%. This leads to the rejection of H18A.
Hypothesis 18B, HPSSMEs attach greater importance to their networks.
Tables e105-e106 show no relationship between performance and importance of
networks (Chi-square = 0.201, p value = 0.654). Furthermore, 54.5% of average/low
performers believe that networks are very important whereas only 48% of high
performers believe in the importance of networks. Therefore, H18B is rejected.
Hypothesis 18C, HPASMEs attach greater importance to their networks.
Similarly tables e107-e108 show no relationship between performance and
importance of networks (Chi-square = 1.306, p value = 0.520). In this case, most
high performers (54.2%) believe in the high importance of networks whereas the
equivalent for medium is 42.6% and for low 46.9%. Hence, H18C is not supported.
Hypothesis 19A, HPISMEs view government or European regulation as a threat.
From tables e109-el 10 there seems to be no relationship between performance and
government or European regulation posing a threat (Chi-square = 1.00, p value =
0.606). Of the high performers 60% agree with the statement whereas, only 45.8% of
low performers agree with the statement. Therefore, H19A is rejected.
111
Hypothesis 19B, HPSSMEs view government or European regulation as a threat.
There seems to be a 2.5 per cent significant relationship between performance and
government or European regulation posing a threat (Chi-square = 5.263, p value =
0.022). Tables el l 1-e112 also show that 71.4% of the medium/low performers agree
with the statement whereas only 40.7% of the high performers agree. Hence, H19B is
accepted.
Hypothesis 19C, HPASMEs view government or European regulation as a threat.
There also seems to be no significant relationship between performance and
regulation posing a threat to the agri-food industry (Chi-square = 0.973, p value =
0.615). Tables el 13-el 14 therefore lead to the rejection of H19C.
Hypothesis 20A, HPISMEs view the major market leaders as a threat.
Tables el 15-e116 show no statistical relationship between performance and the big
players posing a threat to the survival of independent SMEs (Chi-square = 1.970, p
value = 0.373). Furthermore, 54.3% of the medium performers agree with the
comment whereas only 48% of the high and 36% of the low performers agree.
Hence, the results point to the rejection of H2OA.
Hypothesis 20B, HPSSMEs view the major market leaders as a threat.
Similarly there seems to be no relationship between performance and the big players
within the subsidiary group (Chi-square = 2.289, p value = 0.130). As tables e117-
el 18 show 53.6% of the medium/low performers agree with the hypothesis whereas
only 33.3% of the high performers agree with the statement. Maybe this reflects the
112
fact that subsidiaries are the big players in many food sub-sectors. Hence, H2OB is
not supported.
Hypothesis 20C, HPASMEs view the major market leaders as a threat.
Finally tables e119-e120 show no relationship between performance and big players
posing a threat (Chi-square = 1.426, p value = 0.490). The SMEs in the agri-food
industry therefore aren't influenced by strong competition. Hence, H2OC is rejected.
6.2.7 Summary
From the results of the survey, it seems that the overall business philosophy of SMEs
is not directly linked with performance. However, strategic analysis for independent
companies is definitely linked to performance, whereas it is not so important for the
subsidiary SMEs. Marketing strategy is low in the subsidiary's agenda whereas the
independents show more interest in quality and reputation, similar to the overall
group. In addition, marketing organisation is directly linked with independent SMEs
performance and the overall sample's performance. However, subsidiary SMEs
performance is not linked to their response to customer changes. Marketing control
has an effect on the performance of independents but not on subsidiaries, although it
looks particularly important for the overall agri-food SME sector.
Finally, networks and the agri-food environment have no effect on performance other
than regulation, which may influence subsidiary companies more than independents.
The next part of the research is concerned with the importance of these marketing
practices, and their relative weight, on the performance of the SMEs.
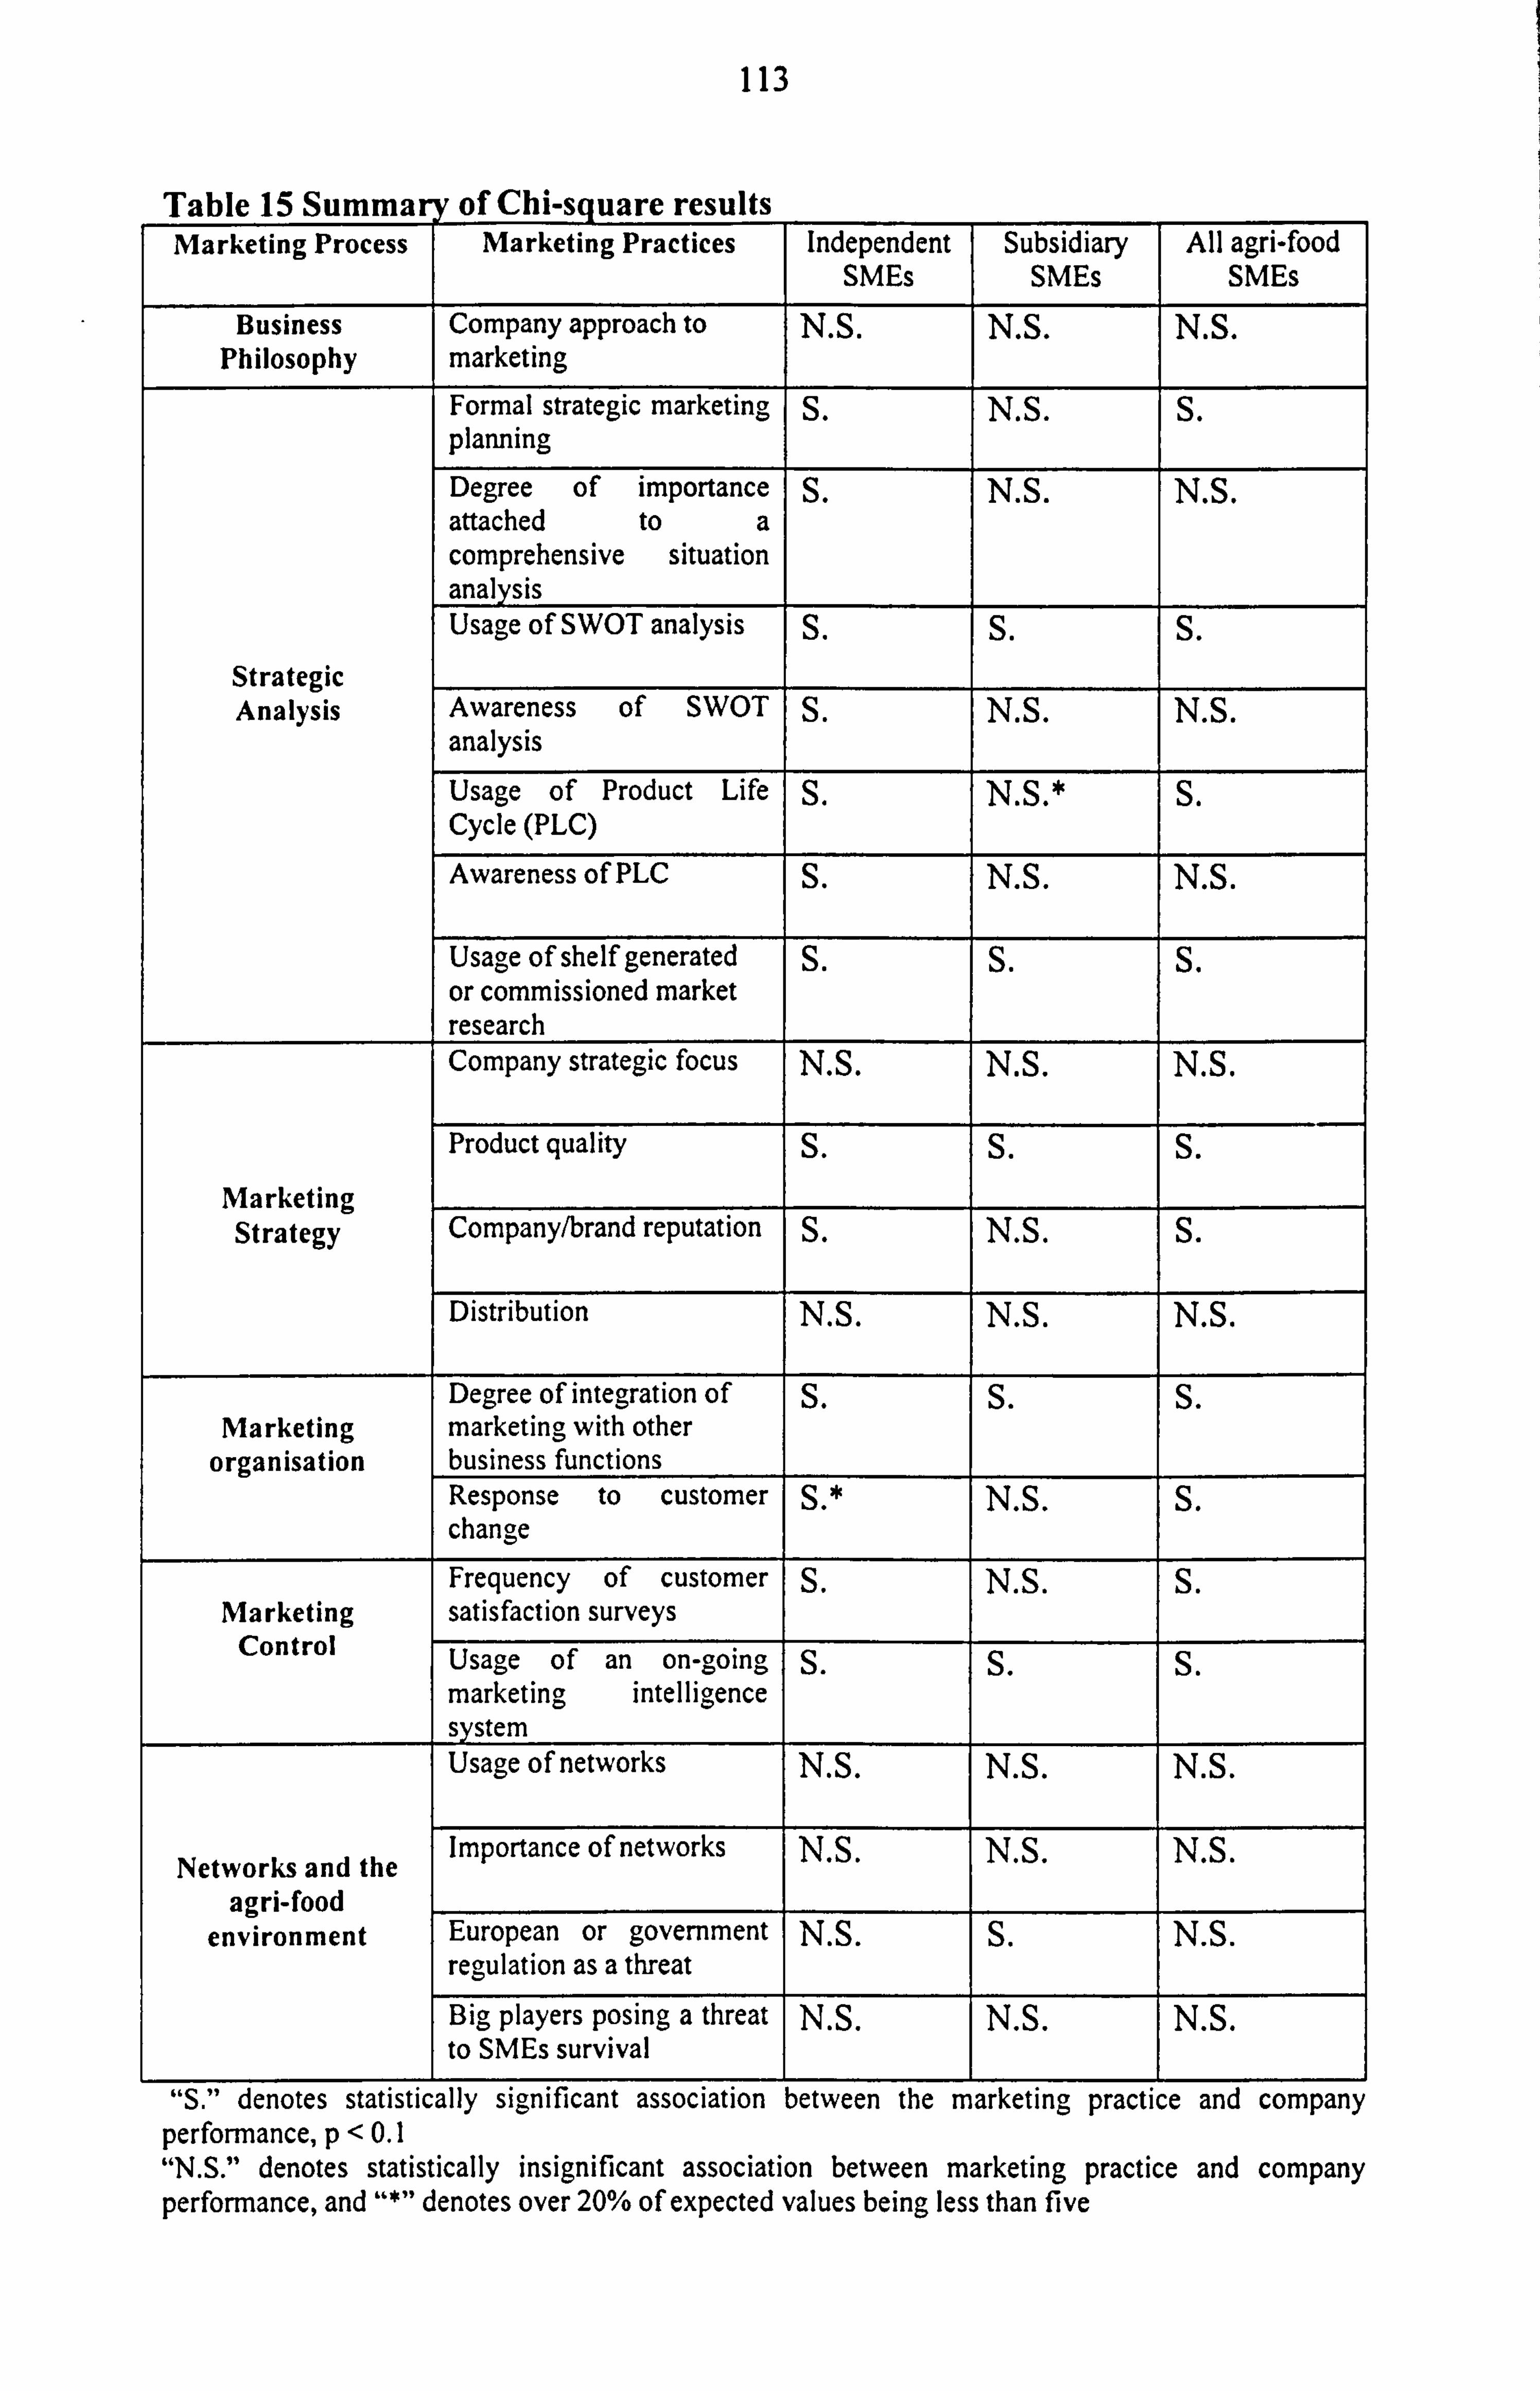
113
Table 15 Summary of Chi-square results Marketing Process Marketing Practices Independent Subsidiary All agri-food
SMEs SMEs SMEs
Business Company approach to N. S. N. S. N. S. Philosophy marketing
Formal strategic marketing S. N. S. S. planning Degree of importance S. N. S. N. S. attached to a comprehensive situation analysis Usage of SWOT analysis S. S. S.
Strategic Analysis Awareness of SWOT S. N. S. N. S.
analysis Usage of Product Life S. N. S. * S. Cycle (PLC)
Awareness of PLC S. N. S. N. S.
Usage of shelf generated S. S. S. or commissioned market research Company strategic focus N. S. N. S. N. S.
Product quality S. S. S.
Marketing Strategy Companylbrand reputation S. N. S. S.
Distribution N. S. N. S. N. S.
Degree of integration of S. S. S. Marketing marketing with other
organisation business functions Response to customer S. * N. S. S. change
Frequency of customer S. N. S. S. Marketing satisfaction surveys
Control Usage of an on-going S. S. S. marketing intelligence system Usage of networks N. S. N. S. N. S.
Importance of networks N. S. N S N S. Networks and the . . .
agri-food environment European or government N. S. S. N. S.
regulation as a threat
Big players posing a threat N. S. N. S. N. S. to SMEs survival
"S. " denotes statistically significant association between the marketing practice and company performance, p<0.1 "N. S. " denotes statistically insignificant association between marketing practice and company performance, and "*" denotes over 20% of expected values being less than five
114
6.3 Marketing process Effect on Marketing Performance
Though comparison of company performance by means of independent components
in the marketing process throws light on the marketing practices of SMEs, it tells
little about their weight and contribution to high performance and competitive
position. The preceding section has been concerned primarily with identifying the
significance of differences between performers across various marketing practices
using the chi-square statistical test. The causal relationship, however, has not been
examined. For example, higher performing independent agri-food SMEs give priority
to integrating marketing with other business functions, though this process has not
been investigated in detail.
Using the chi-square test assumed that each marketing practice is an independent and
separate measure. Yet, the marketing process components are interrelated and
interactive, as shown by Brooksbank (1990b, c) and Siu (1997). For example, regular
customer feedback would lead to the development of a better marketing control and
planning process. It is very unlikely that all variables will have independent effects.
Therefore, rather than relying solely on using the chi-square test on each marketing
component as a separate measure, a weighted combination of all components would
be useful to predict whether or not a company is likely to attain success. This section
will identify, for independent, subsidiary and all combined agri-food SMEs, the
marketing practices/components that have the greatest impact on performance
through:
1. Identifying the marketing components that tend to have the greatest impact on
performance
115
2. Determining a weighted combination of the marketing process components to
predict the likelihood that an SME will attain higher or lower level of company
performance.
6.3.1 Analytical method
To achieve these aims, discriminant analysis in SPSS 9.0 for Windows NT is used to
identify the features of different levels of SMEs performance, namely financially
successful and financially average/low This technique is used to obtain a weighted
combination of all the marketing practices that are significant in the chi-square
analysis. For example, in the independent SMEs sample, there were thirteen
significant marketing practices whereas in the subsidiary there were six but only five
highly significant variables were included (see discussion in chapter 4, appendix c
discriminant analysis). Finally, in the whole agri-food sample, there were ten
significant variables (see section 6.2.7 for a summary of the chi-square results). Each
of the variables in the marketing process components was classified into dummy (0,
1) variables, because the option under each question could not be considered an
interval scale measurement.
The discriminant analysis will start with the independent SME group. Then there will
be an analysis of the subsidiary group and finally the whole agri-food SMEs of the
North of England will be analysed to make recommendations for policy in the
industry. It is worth mentioning that due to the exploratory nature of the research, the
relatively low discriminative power of the model as will be shown (29%, 28.9% and
30.9%) is accepted.
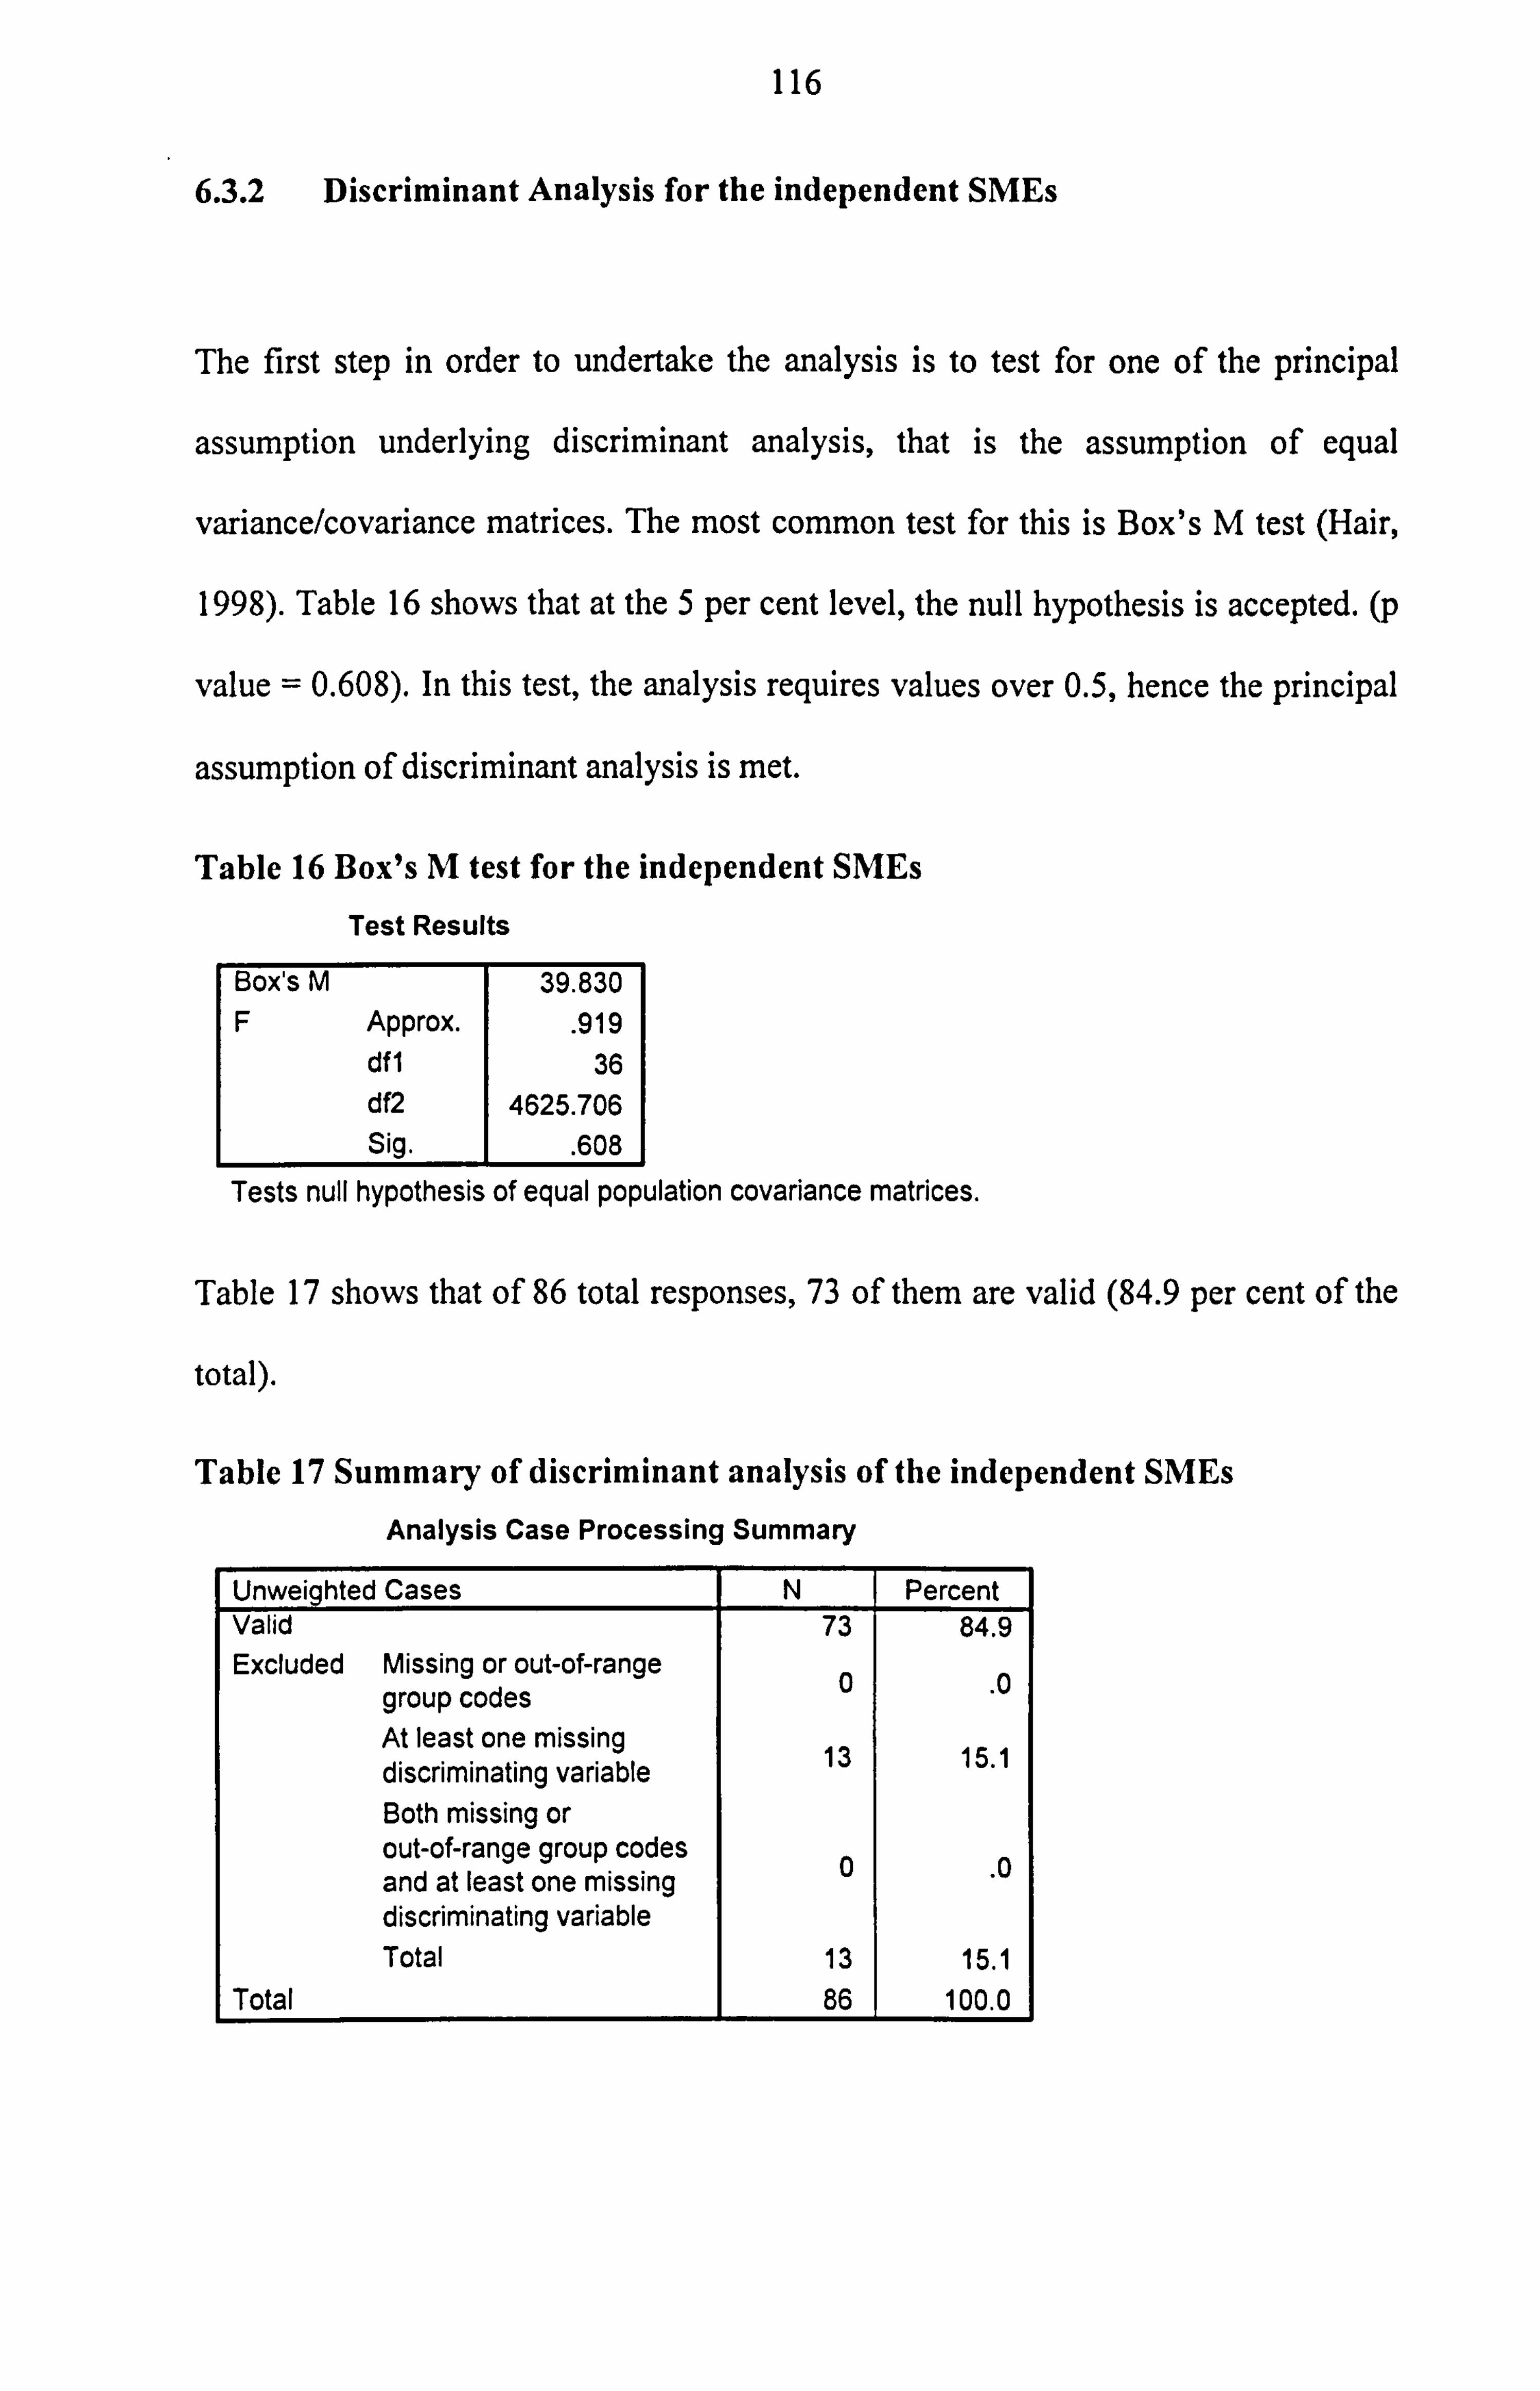
116
6.3.2 Discriminant Analysis for the independent SMEs
The first step in order to undertake the analysis is to test for one of the principal
assumption underlying discriminant analysis, that is the assumption of equal
variance/covariance matrices. The most common test for this is Box's M test (Hair,
1998). Table 16 shows that at the 5 per cent level, the null hypothesis is accepted. (p
value = 0.608). In this test, the analysis requires values over 0.5, hence the principal
assumption of discriminant analysis is met.
Table 16 Box's M test for the independent SMEs
Test Results
Box's M 39.830 F Approx.
. 919 df1 36 df2 4625.706 Sig.
. 608
Tests null hypothesis of equal population covariance matrices.
Table 17 shows that of 86 total responses, 73 of them are valid (84.9 per cent of the
total).
Table 17 Summary of discriminant analysis of the independent SMEs
Analysis Case Processing Summary
Unweighted Cases N Percent Valid 73 84.9 Excluded Missing or out-of-range
group codes 0 .0
At least one missing discriminating variable
13 15.1
Both missing or out-of-range group codes and at least one missing
0 .0
discriminating variable Total 13 15.1
Total 86 100.0
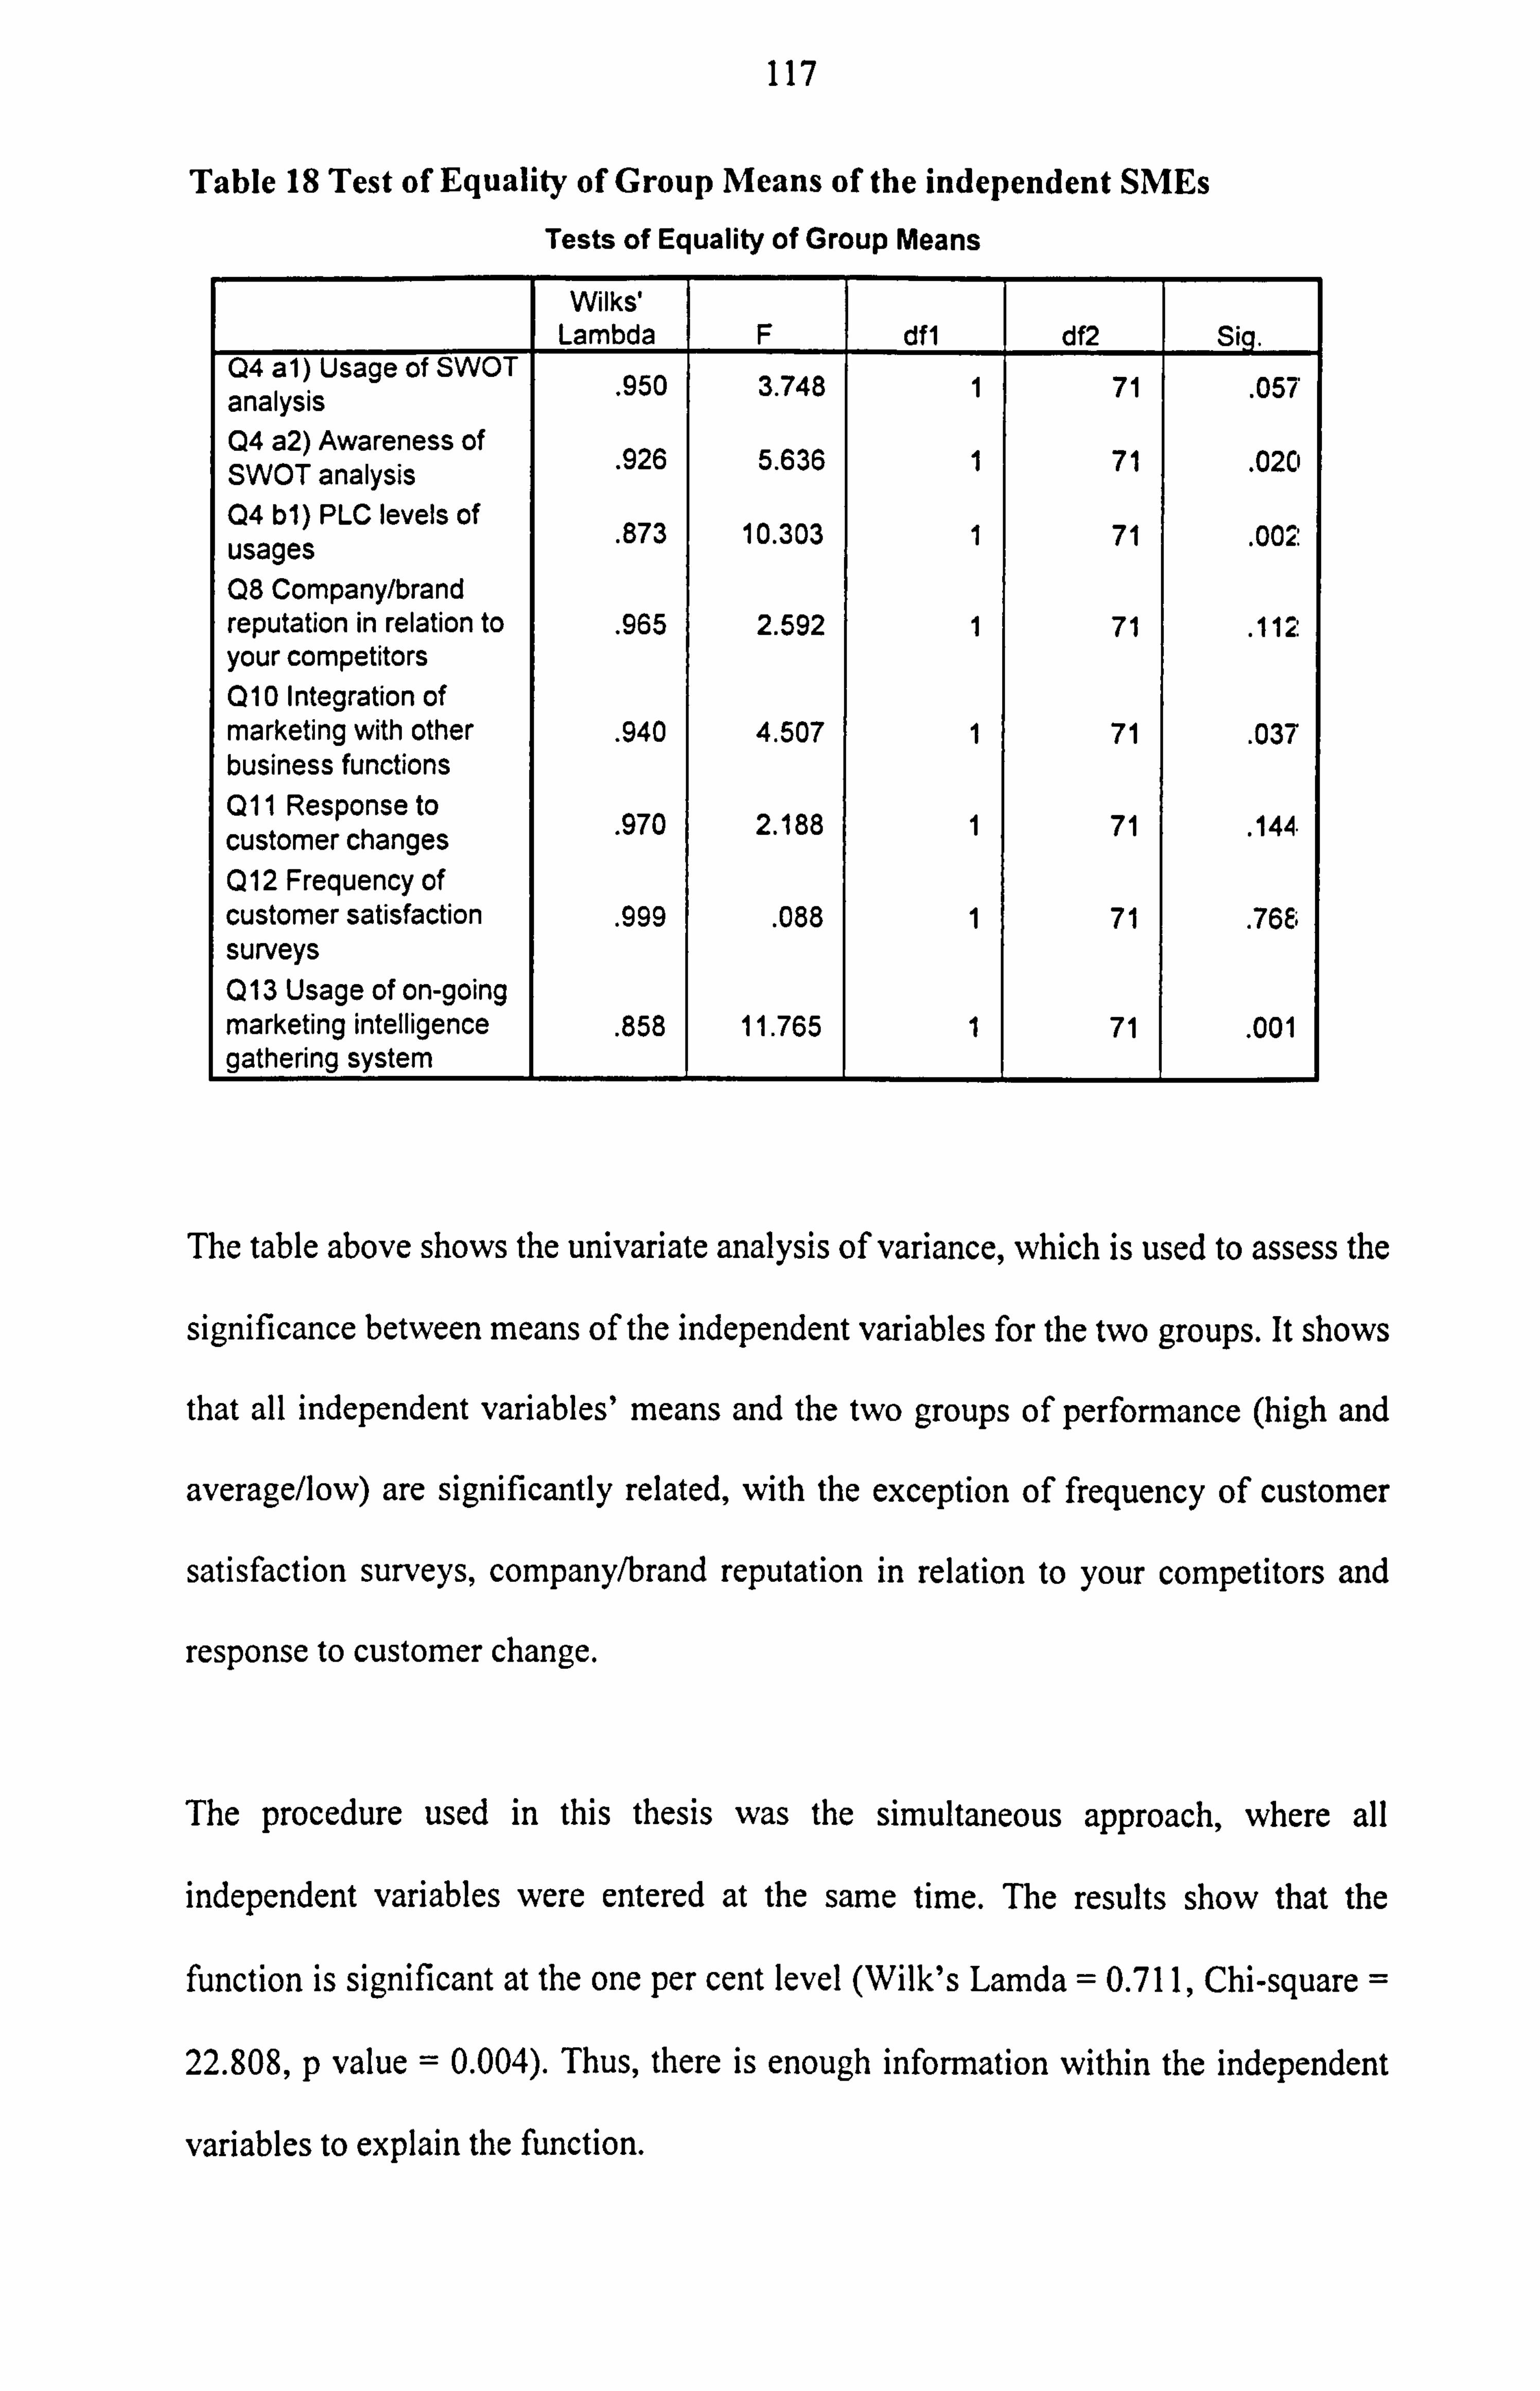
117
Table 18 Test of Equality of Group Means of the independent SMEs
Tests of Equality of Group Means
Wilks' Lambda F dfl df2 Sig.
Q4 a1) Usage of SWOT analysis . 950 3.748 1 71 . 057
Q4 a2) Awareness of SWOT analysis . 926 5.636 1 71 . 020
Q4 b1) PLC levels of . 873 10.303 1 71 . 002 usages
Q8 Company/brand reputation in relation to . 965 2.592 1 71 . 112 your competitors Q10 Integration of marketing with other . 940 4.507 1 71 . 037 business functions Q11 Response to customer changes . 970 2.188 1 71 . 144
Q12 Frequency of customer satisfaction . 999 . 088 1 71 . 766 surveys Q13 Usage of on-going marketing intelligence
. 858 11.765 1 71 . 001 gathering system
The table above shows the univariate analysis of variance, which is used to assess the
significance between means of the independent variables for the two groups. It shows
that all independent variables' means and the two groups of performance (high and
average/low) are significantly related, with the exception of frequency of customer
satisfaction surveys, company/brand reputation in relation to your competitors and
response to customer change.
The procedure used in this thesis was the simultaneous approach, where all
independent variables were entered at the same time. The results show that the
function is significant at the one per cent level (Wilk's Lamda = 0.711, Chi-square =
22.808, p value = 0.004). Thus, there is enough information within the independent
variables to explain the function.
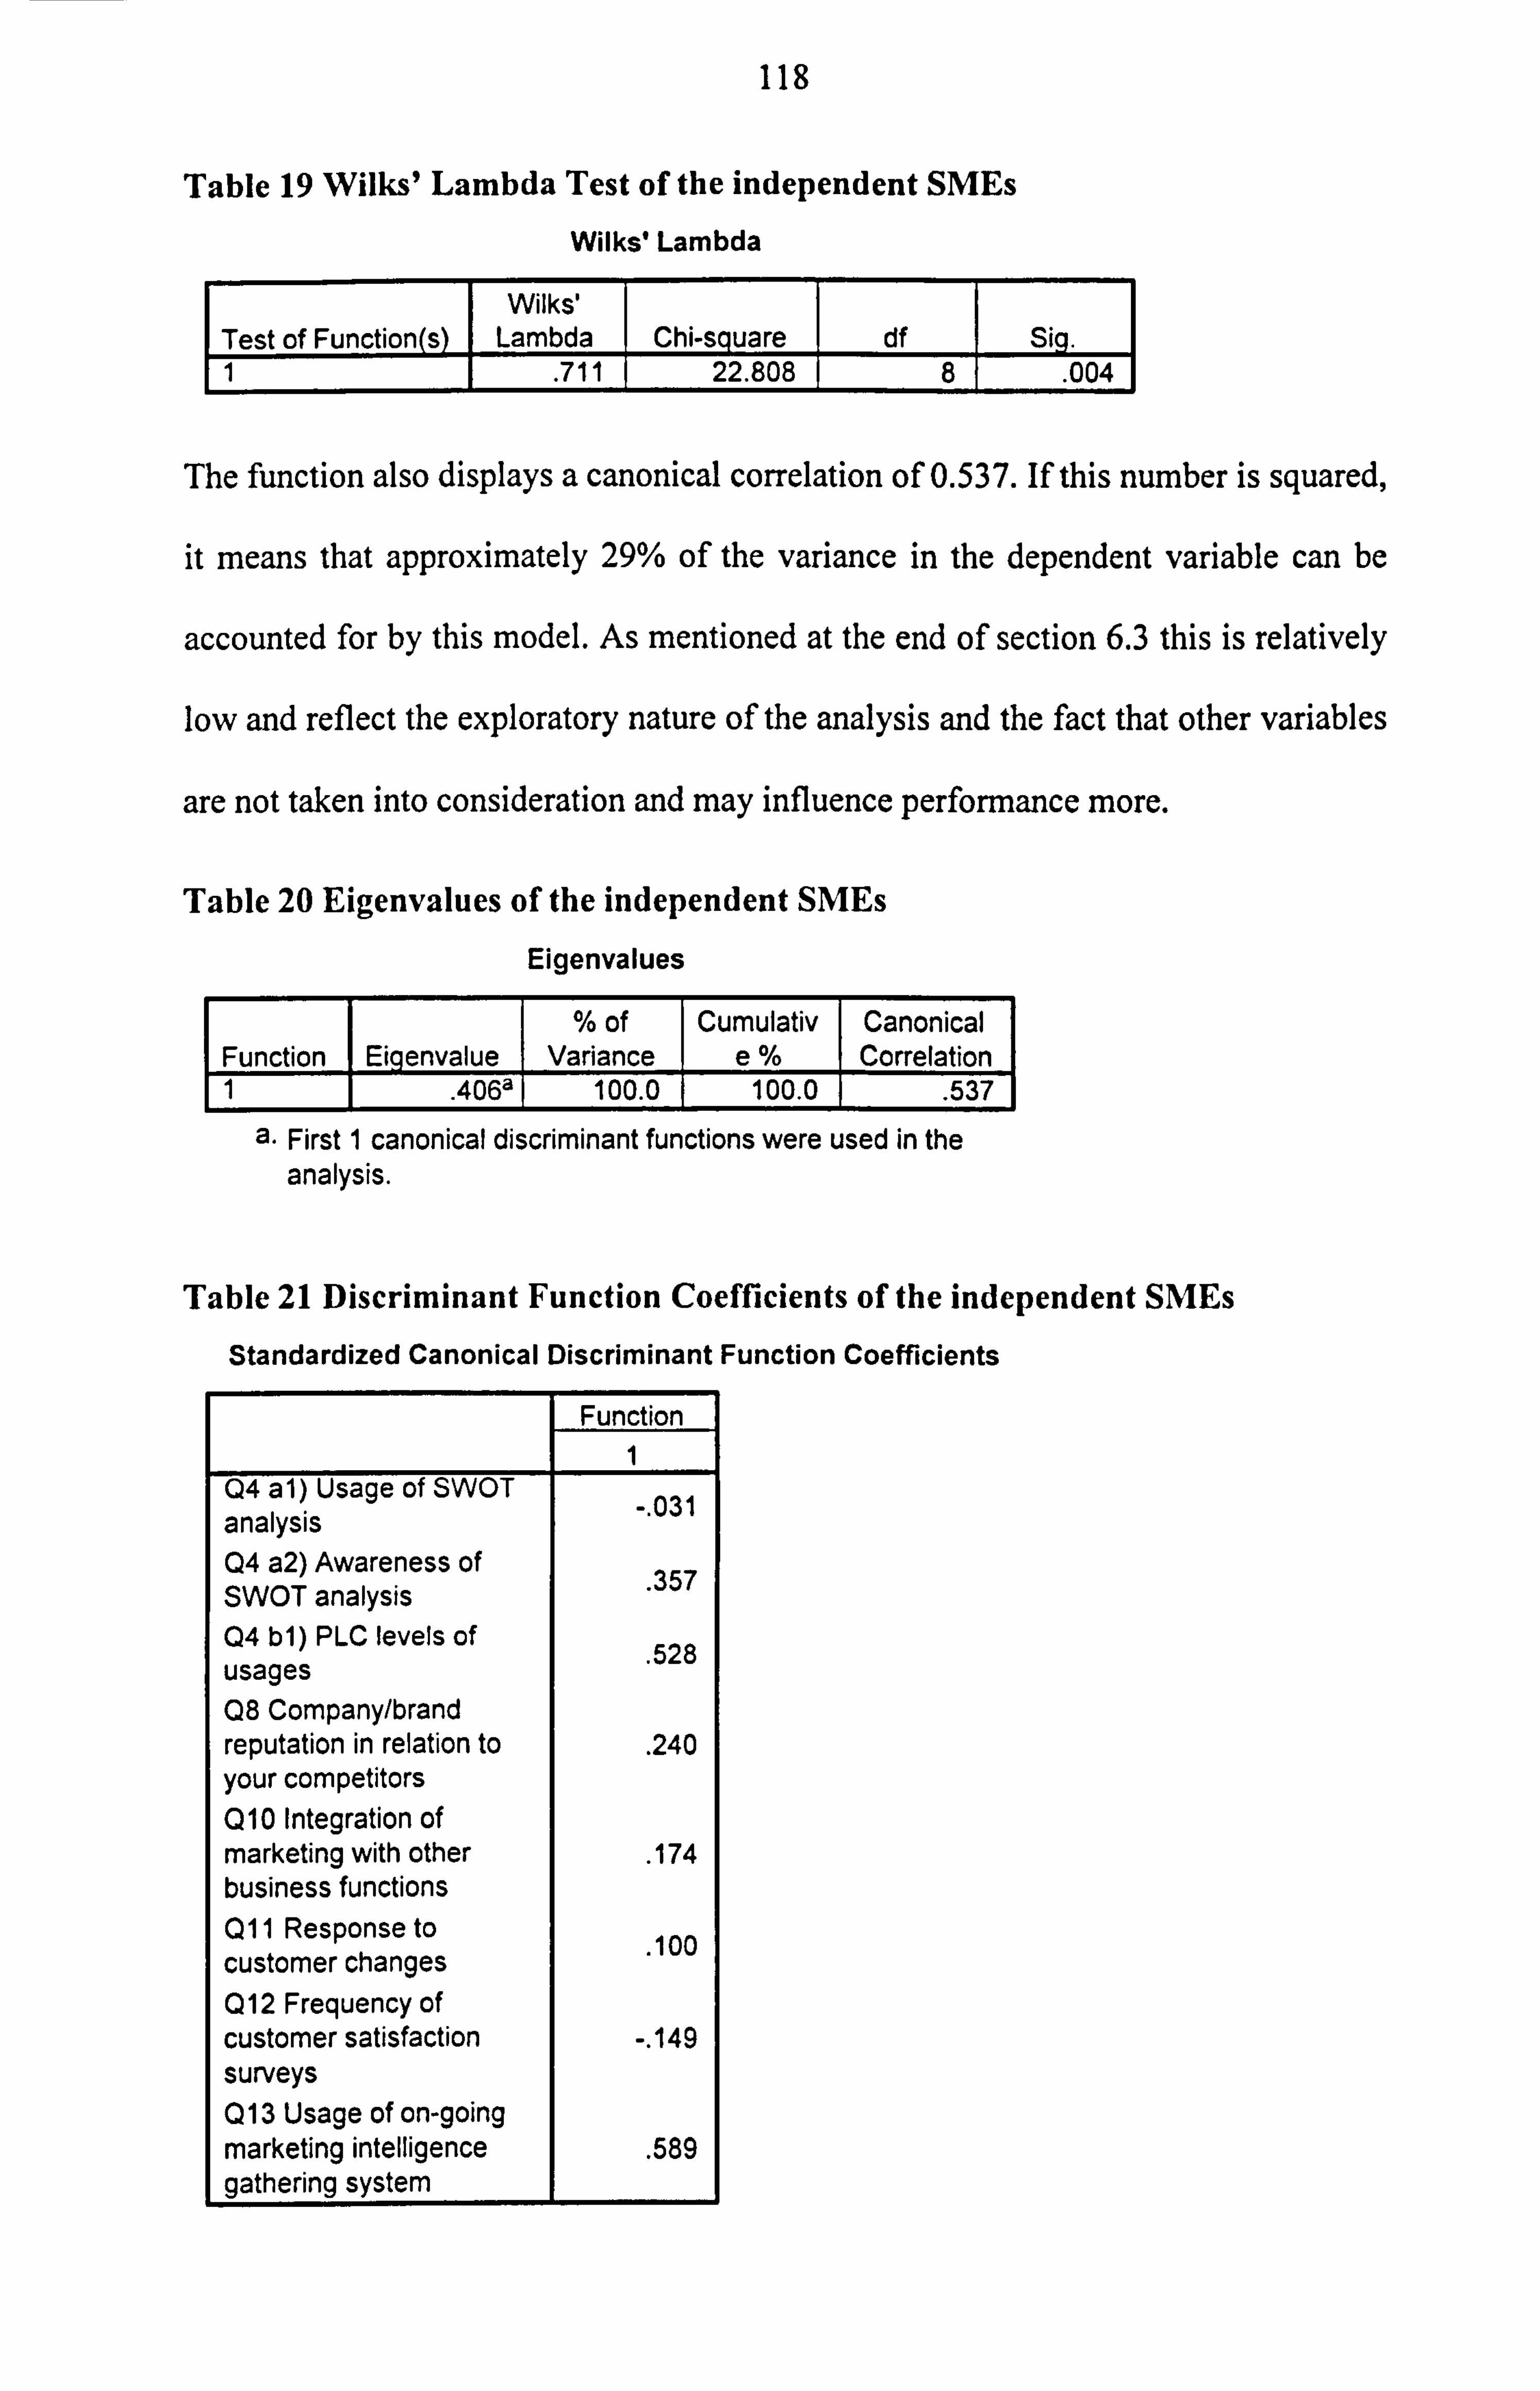
118
Table 19 Wilks' Lambda Test of the independent SMEs
Wilks' Lambda
s Test of Function Wilks'
Lambda Chi-square df Si q. 1 . 711 22.808 8 . 004
The function also displays a canonical correlation of 0.537. If this number is squared,
it means that approximately 29% of the variance in the dependent variable can be
accounted for by this model. As mentioned at the end of section 6.3 this is relatively
low and reflect the exploratory nature of the analysis and the fact that other variables
are not taken into consideration and may influence performance more.
Table 20 Eigenvalues of the independent SMEs
Eigenvalues
Function Eiqenvalue % of
Variance Cumulativ
e% Canonical Correlation
1 . 406a 100.0 100.0 . 537
a. First 1 canonical discriminant functions were used in the analysis.
Table 21 Discriminant Function Coefficients of the independent SMEs
Standardized Canonical Discriminant Function Coefficients
Function 1
Q4 a1) Usage of SWOT - 031
analysis . Q4 a2) Awareness of 357 SWOT analysis . Q4 b1) PLC levels of 528 usages 08 Company/brand reputation in relation to . 240 your competitors Q10 Integration of marketing with other . 174 business functions Q11 Response to
. 100 customer changes Q12 Frequency of customer satisfaction -. 149 surveys Q13 Usage of on-going marketing intelligence
. 589 gathering system
119
Based on the canonical function coefficients (table 21), the function takes the
following form:
PER = -0.031USESWOT + 0.357AWARESWOT + 0.528USEPLC +
0.24000BRREPU + 0.1741NTMKT + 0.100RECUCHA - 0.149FREQCSS +
0.589USEMIS
Where PER = Performance
USESWOT = Usage of Swot Analysis
AWARESWOT = Awareness of Swot
USEPLC = Use of PLC
CO/BRREPU = Company/Brand reputation
INTMKT = Integration of Marketing with other business functions
RECUCHA = Response to customer change
FREQCSS = Frequency of customer satisfaction surveys
USEMIS = Usage of an on-going marketing intelligence gathering system
From examining the coefficients, the importance of usage of a marketing intelligence
gathering system and the usage of PLC and awareness of SWOT analysis are the
three most important independent variables on effecting performance.
Group centroids can be used to interpret the discriminant function results from a
global or overall perspective. For the average/low performers, it is negative (-0.386)
whereas for the higher performers it is positive, (1.022). This shows the distinct
differences between the two groups and the marketing practices associated with
them.
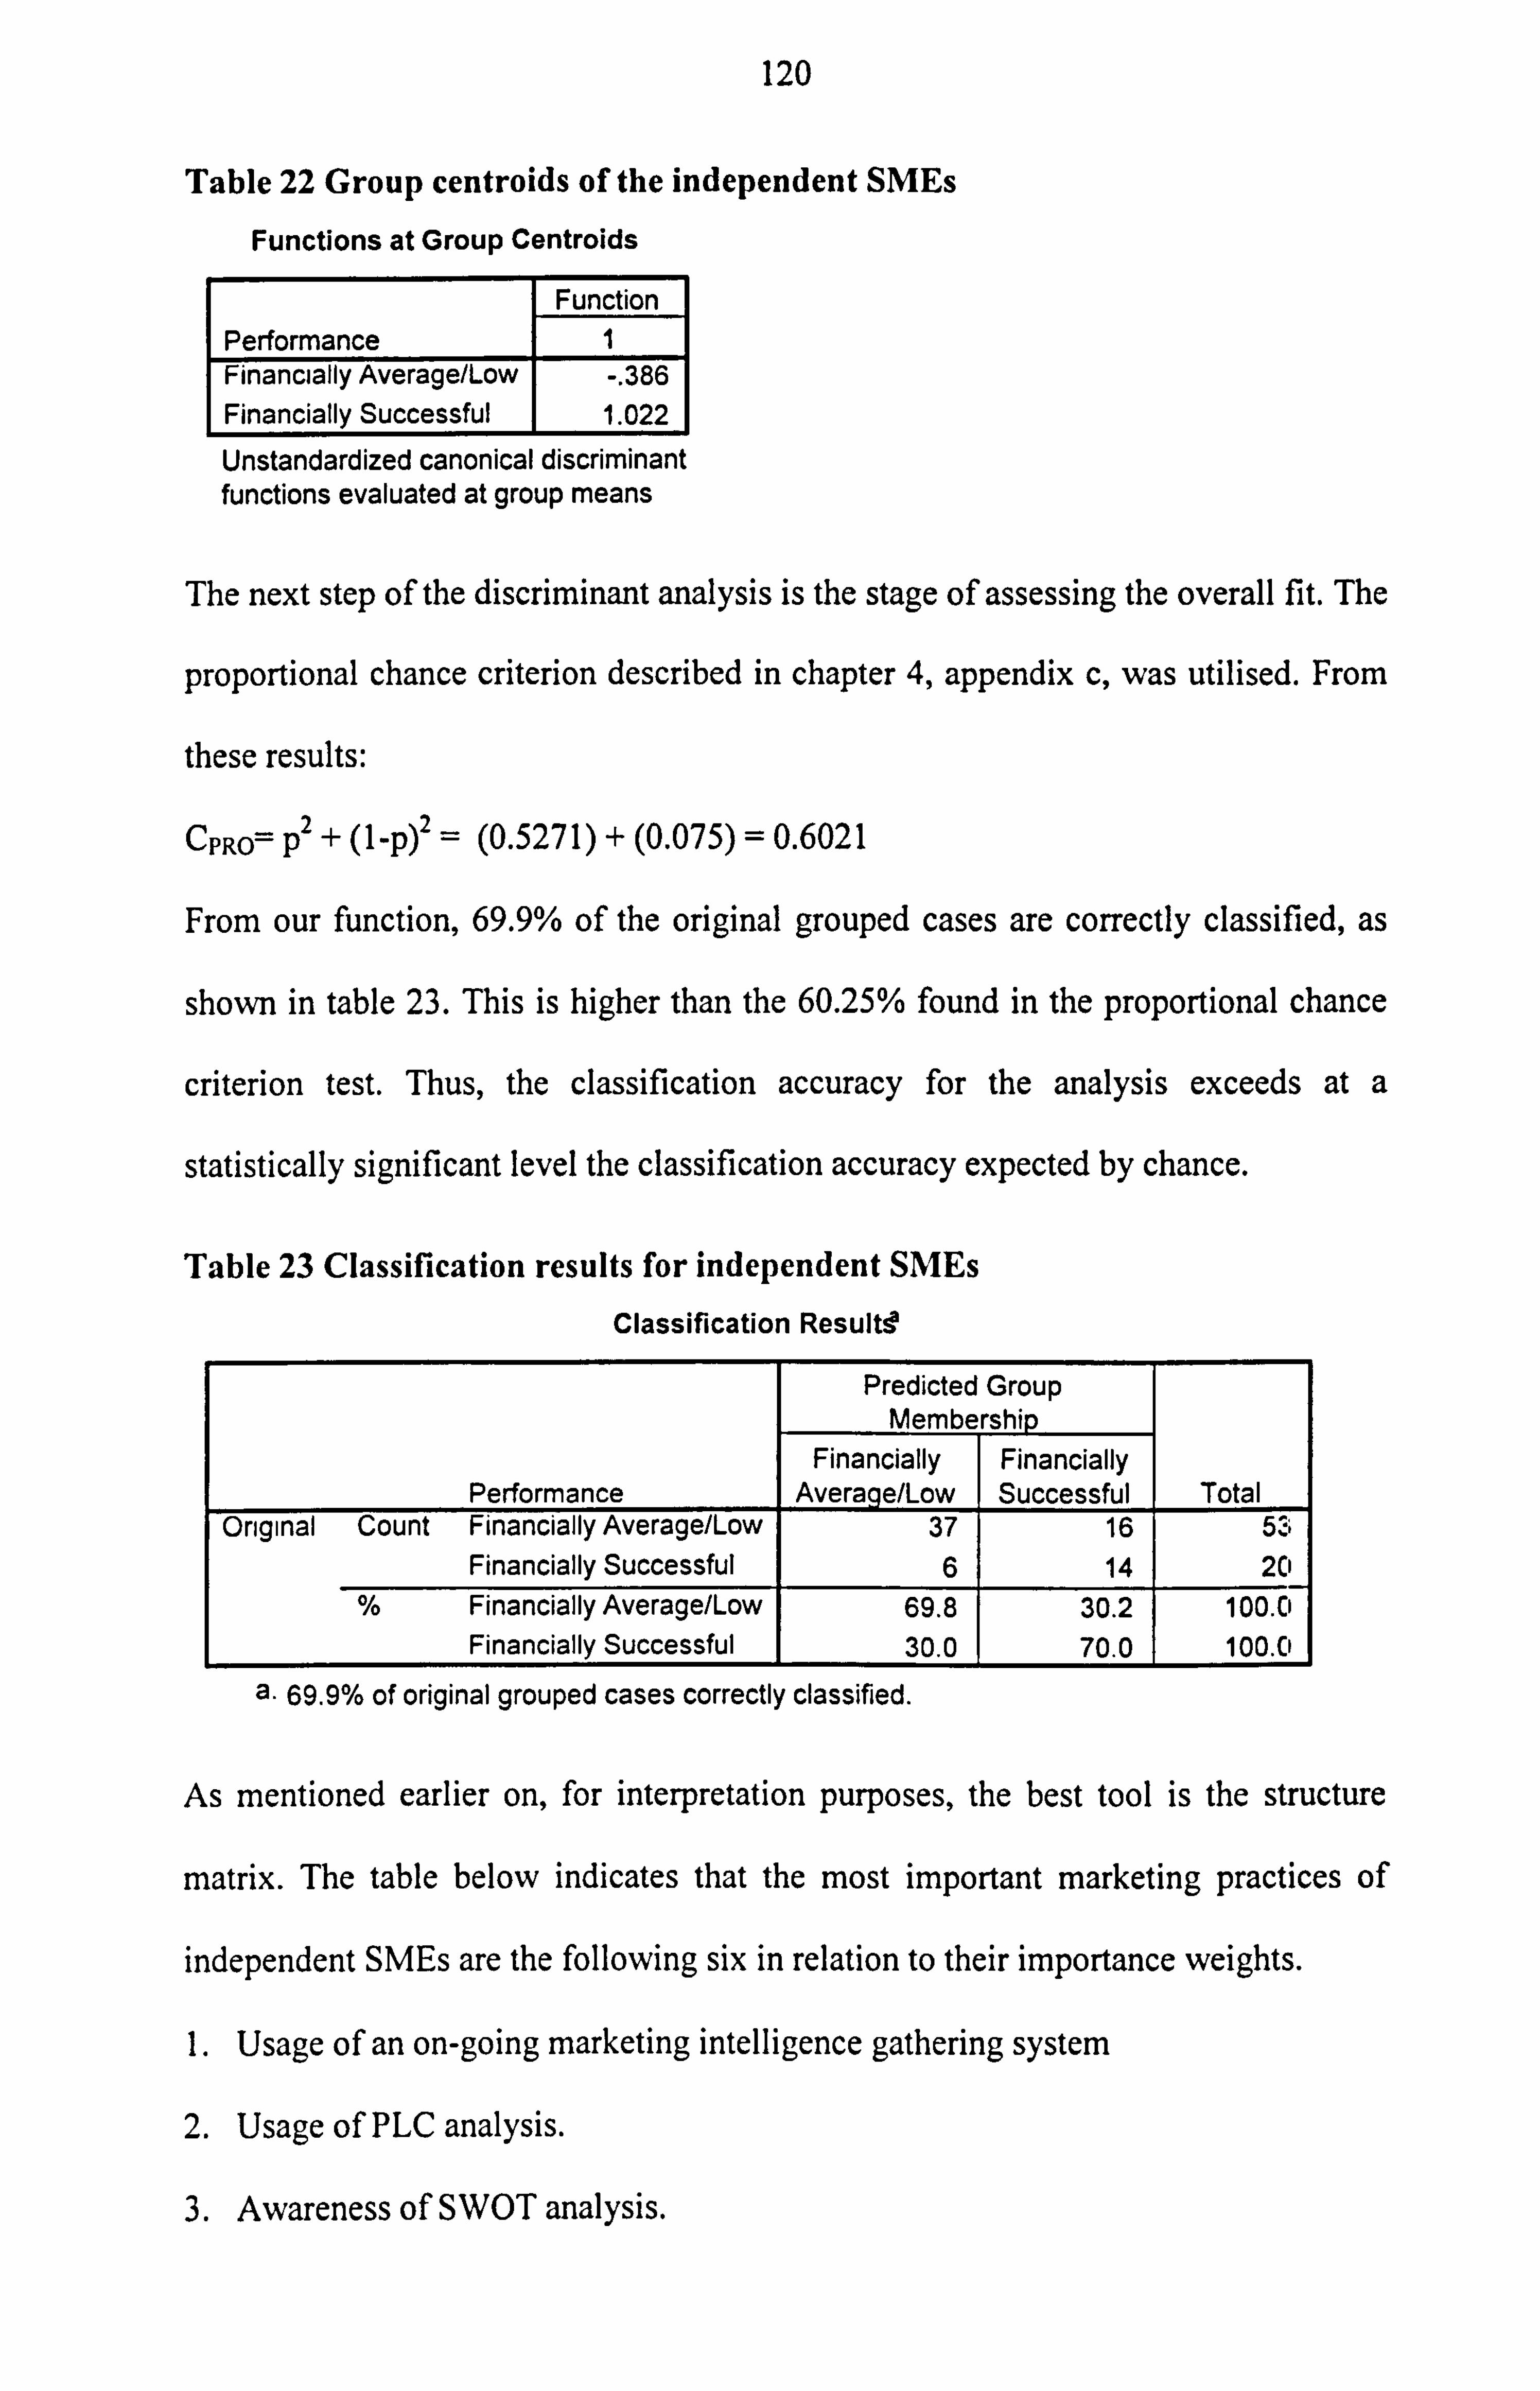
120
Table 22 Group centroids of the independent SMEs
Functions at Group Centroids
Function Performance 1 Financially Average/Low -. 386
Financially Successful 1.022 Unstandardized canonical discriminant functions evaluated at group means
The next step of the discriminant analysis is the stage of assessing the overall fit. The
proportional chance criterion described in chapter 4, appendix c, was utilised. From
these results:
CPRO= p2 + (1-p)2 = (0.5271) + (0.075) = 0.6021
From our function, 69.9% of the original grouped cases are correctly classified, as
shown in table 23. This is higher than the 60.25% found in the proportional chance
criterion test. Thus, the classification accuracy for the analysis exceeds at a
statistically significant level the classification accuracy expected by chance.
Table 23 Classification results for independent SMEs
Classification Results?
Predicted Group Membership
Financially Financially Performance Avera e/Low Successful Total
Original Count Financially Average/Low 37 16 53 Financially Successful 6 14 20
% Financially Average/Low 69.8 30.2 100.0 Financially Successful 30.0 70.0 100.0
a. 69.9% of original grouped cases correctly classified.
As mentioned earlier on, for interpretation purposes, the best tool is the structure
matrix. The table below indicates that the most important marketing practices of
independent SMEs are the following six in relation to their importance weights.
1. Usage of an on-going marketing intelligence gathering system
2. Usage of PLC analysis.
3. Awareness of SWOT analysis.
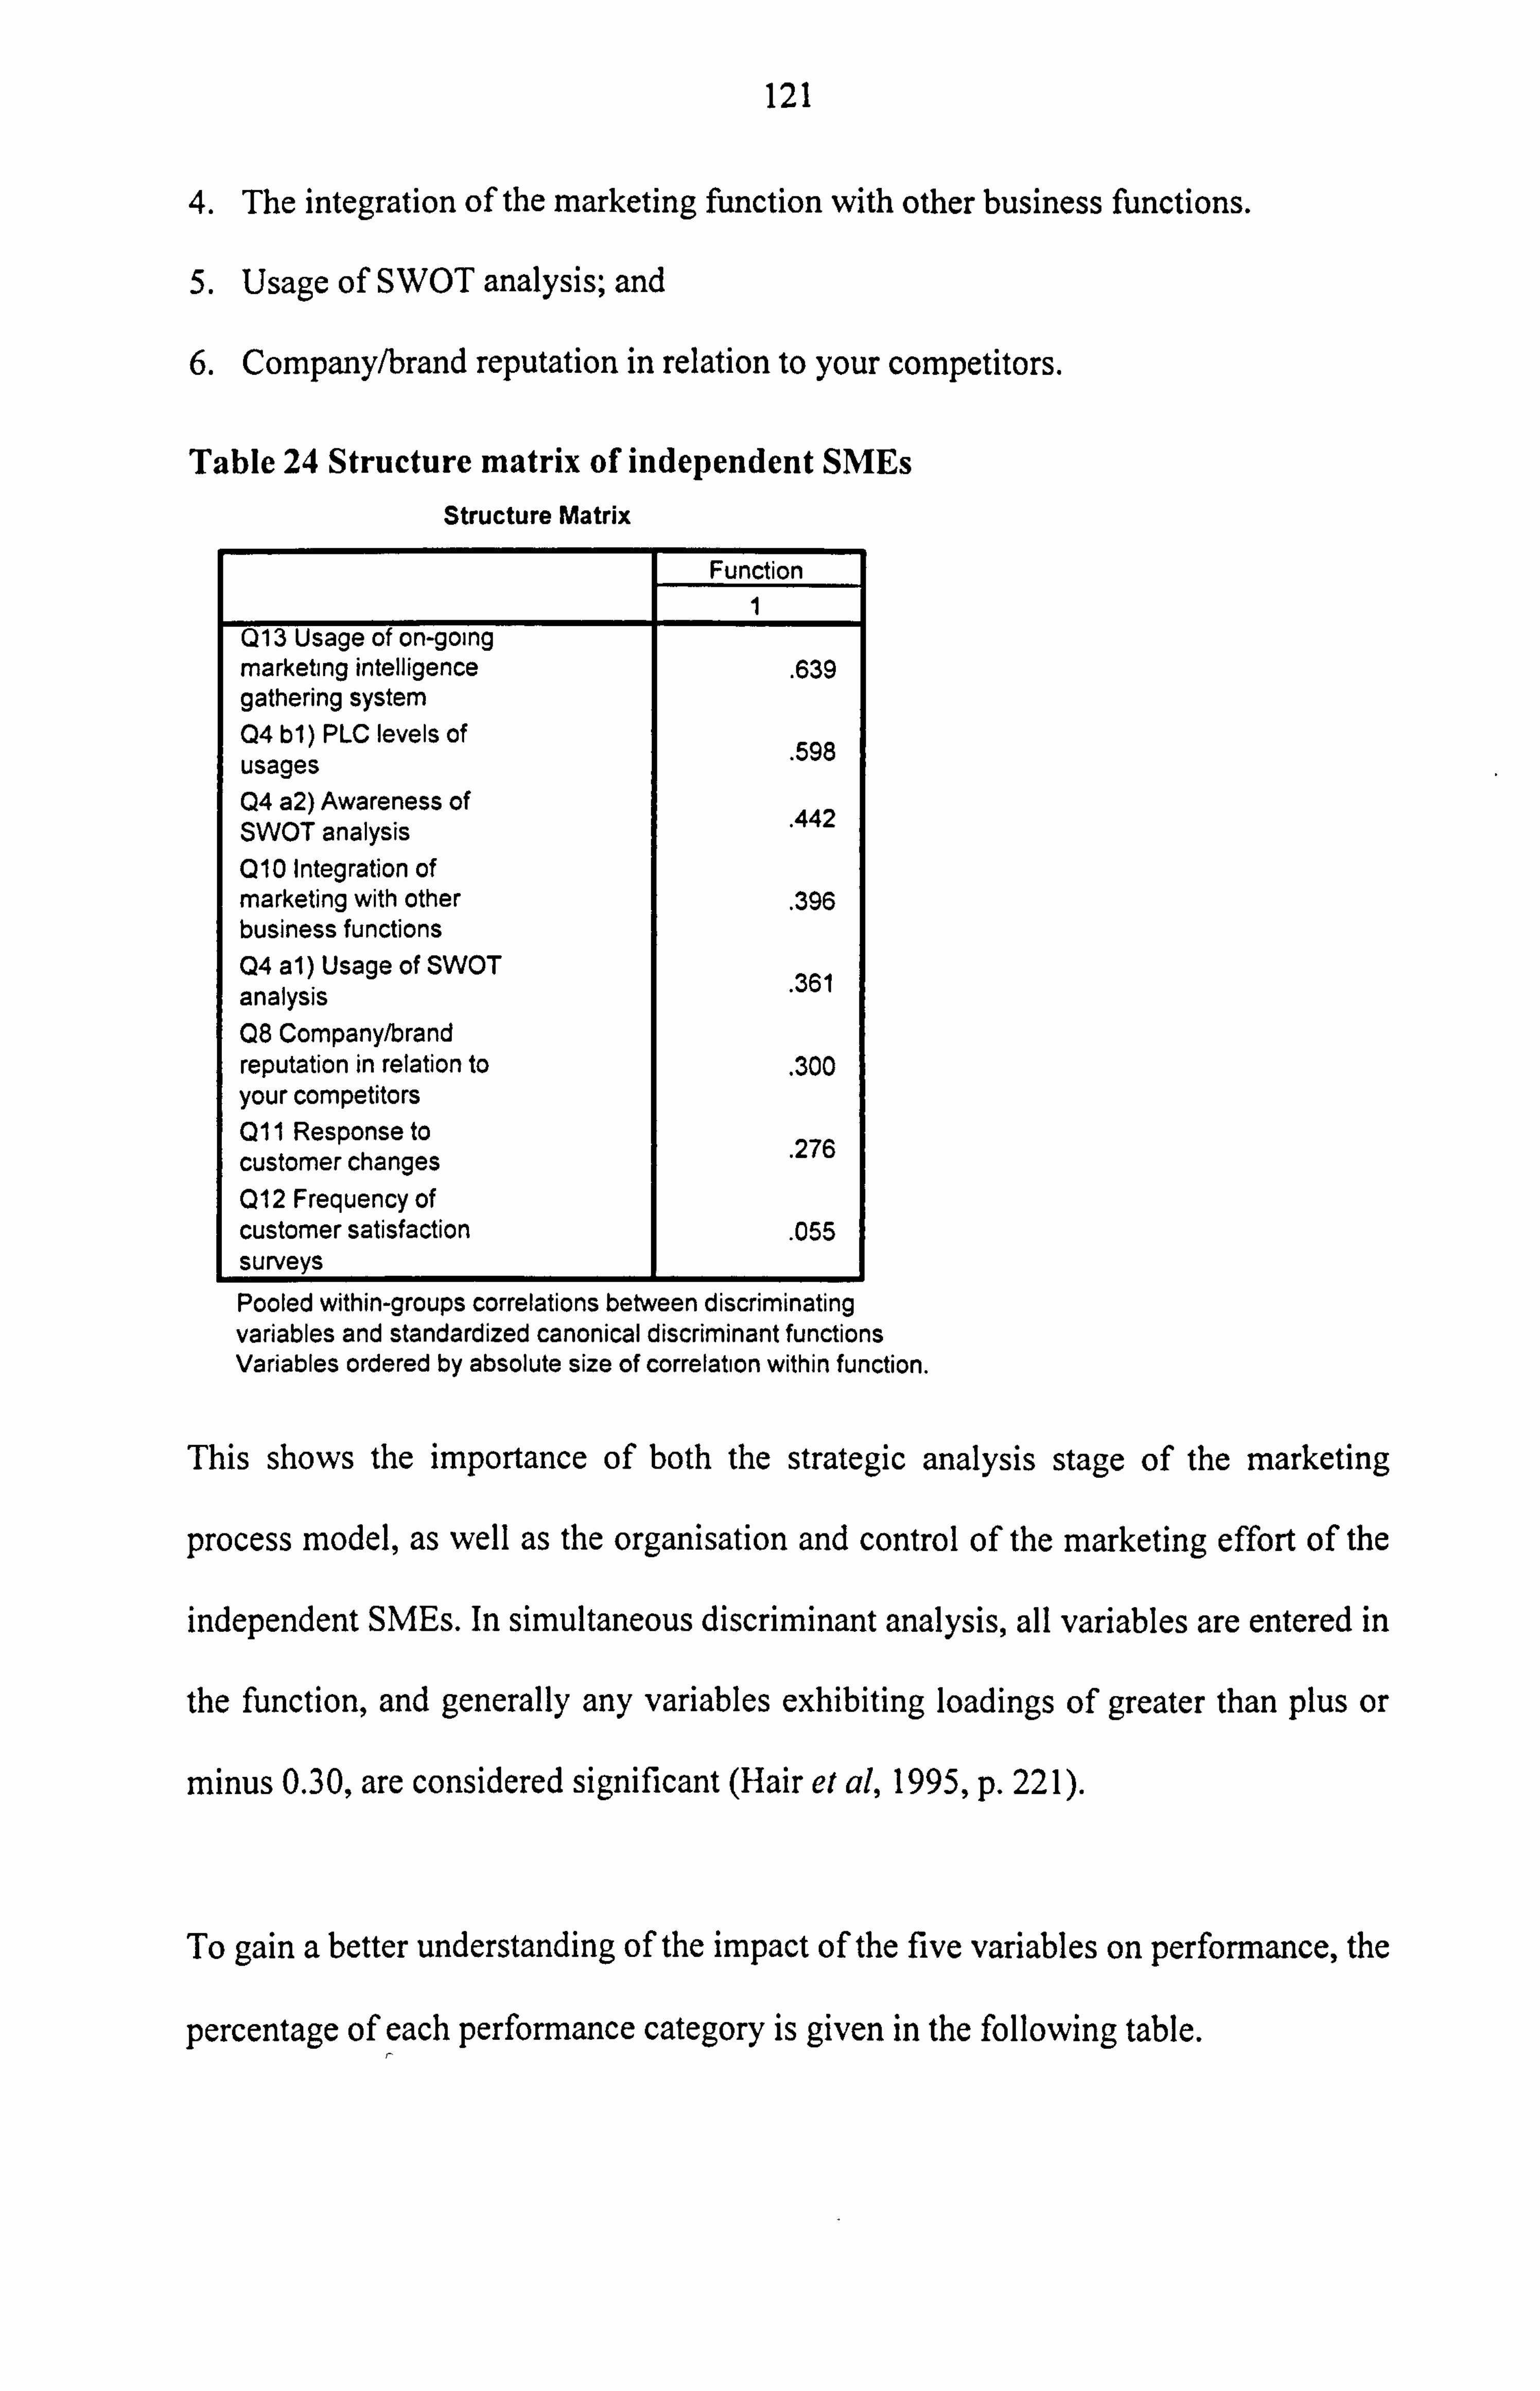
121
4. The integration of the marketing function with other business functions.
5. Usage of SWOT analysis; and
6. Company/brand reputation in relation to your competitors.
Table 24 Structure matrix of independent SMEs Structure Matrix
Function 1
Q13 Usage of on-going marketing intelligence
. 639 gathering system Q4 b1) PLC levels of 598 usages Q4 a2) Awareness of SWOT analysis
442
Q10 Integration of marketing with other . 396 business functions Q4 a1) Usage of SWOT analysis
361
Q8 Company/brand reputation in relation to
. 300 your competitors Q11 Response to
276 customer changes Q12 Frequency of customer satisfaction . 055 surveys Pooled within-groups correlations between discriminating variables and standardized canonical discriminant functions Variables ordered by absolute size of correlation within function.
This shows the importance of both the strategic analysis stage of the marketing
process model, as well as the organisation and control of the marketing effort of the
independent SMEs. In simultaneous discriminant analysis, all variables are entered in
the function, and generally any variables exhibiting loadings of greater than plus or
minus 0.30, are considered significant (Hair et al, 1995, p. 221).
To gain a better understanding of the impact of the five variables on performance, the
percentage of each performance category is given in the following table.
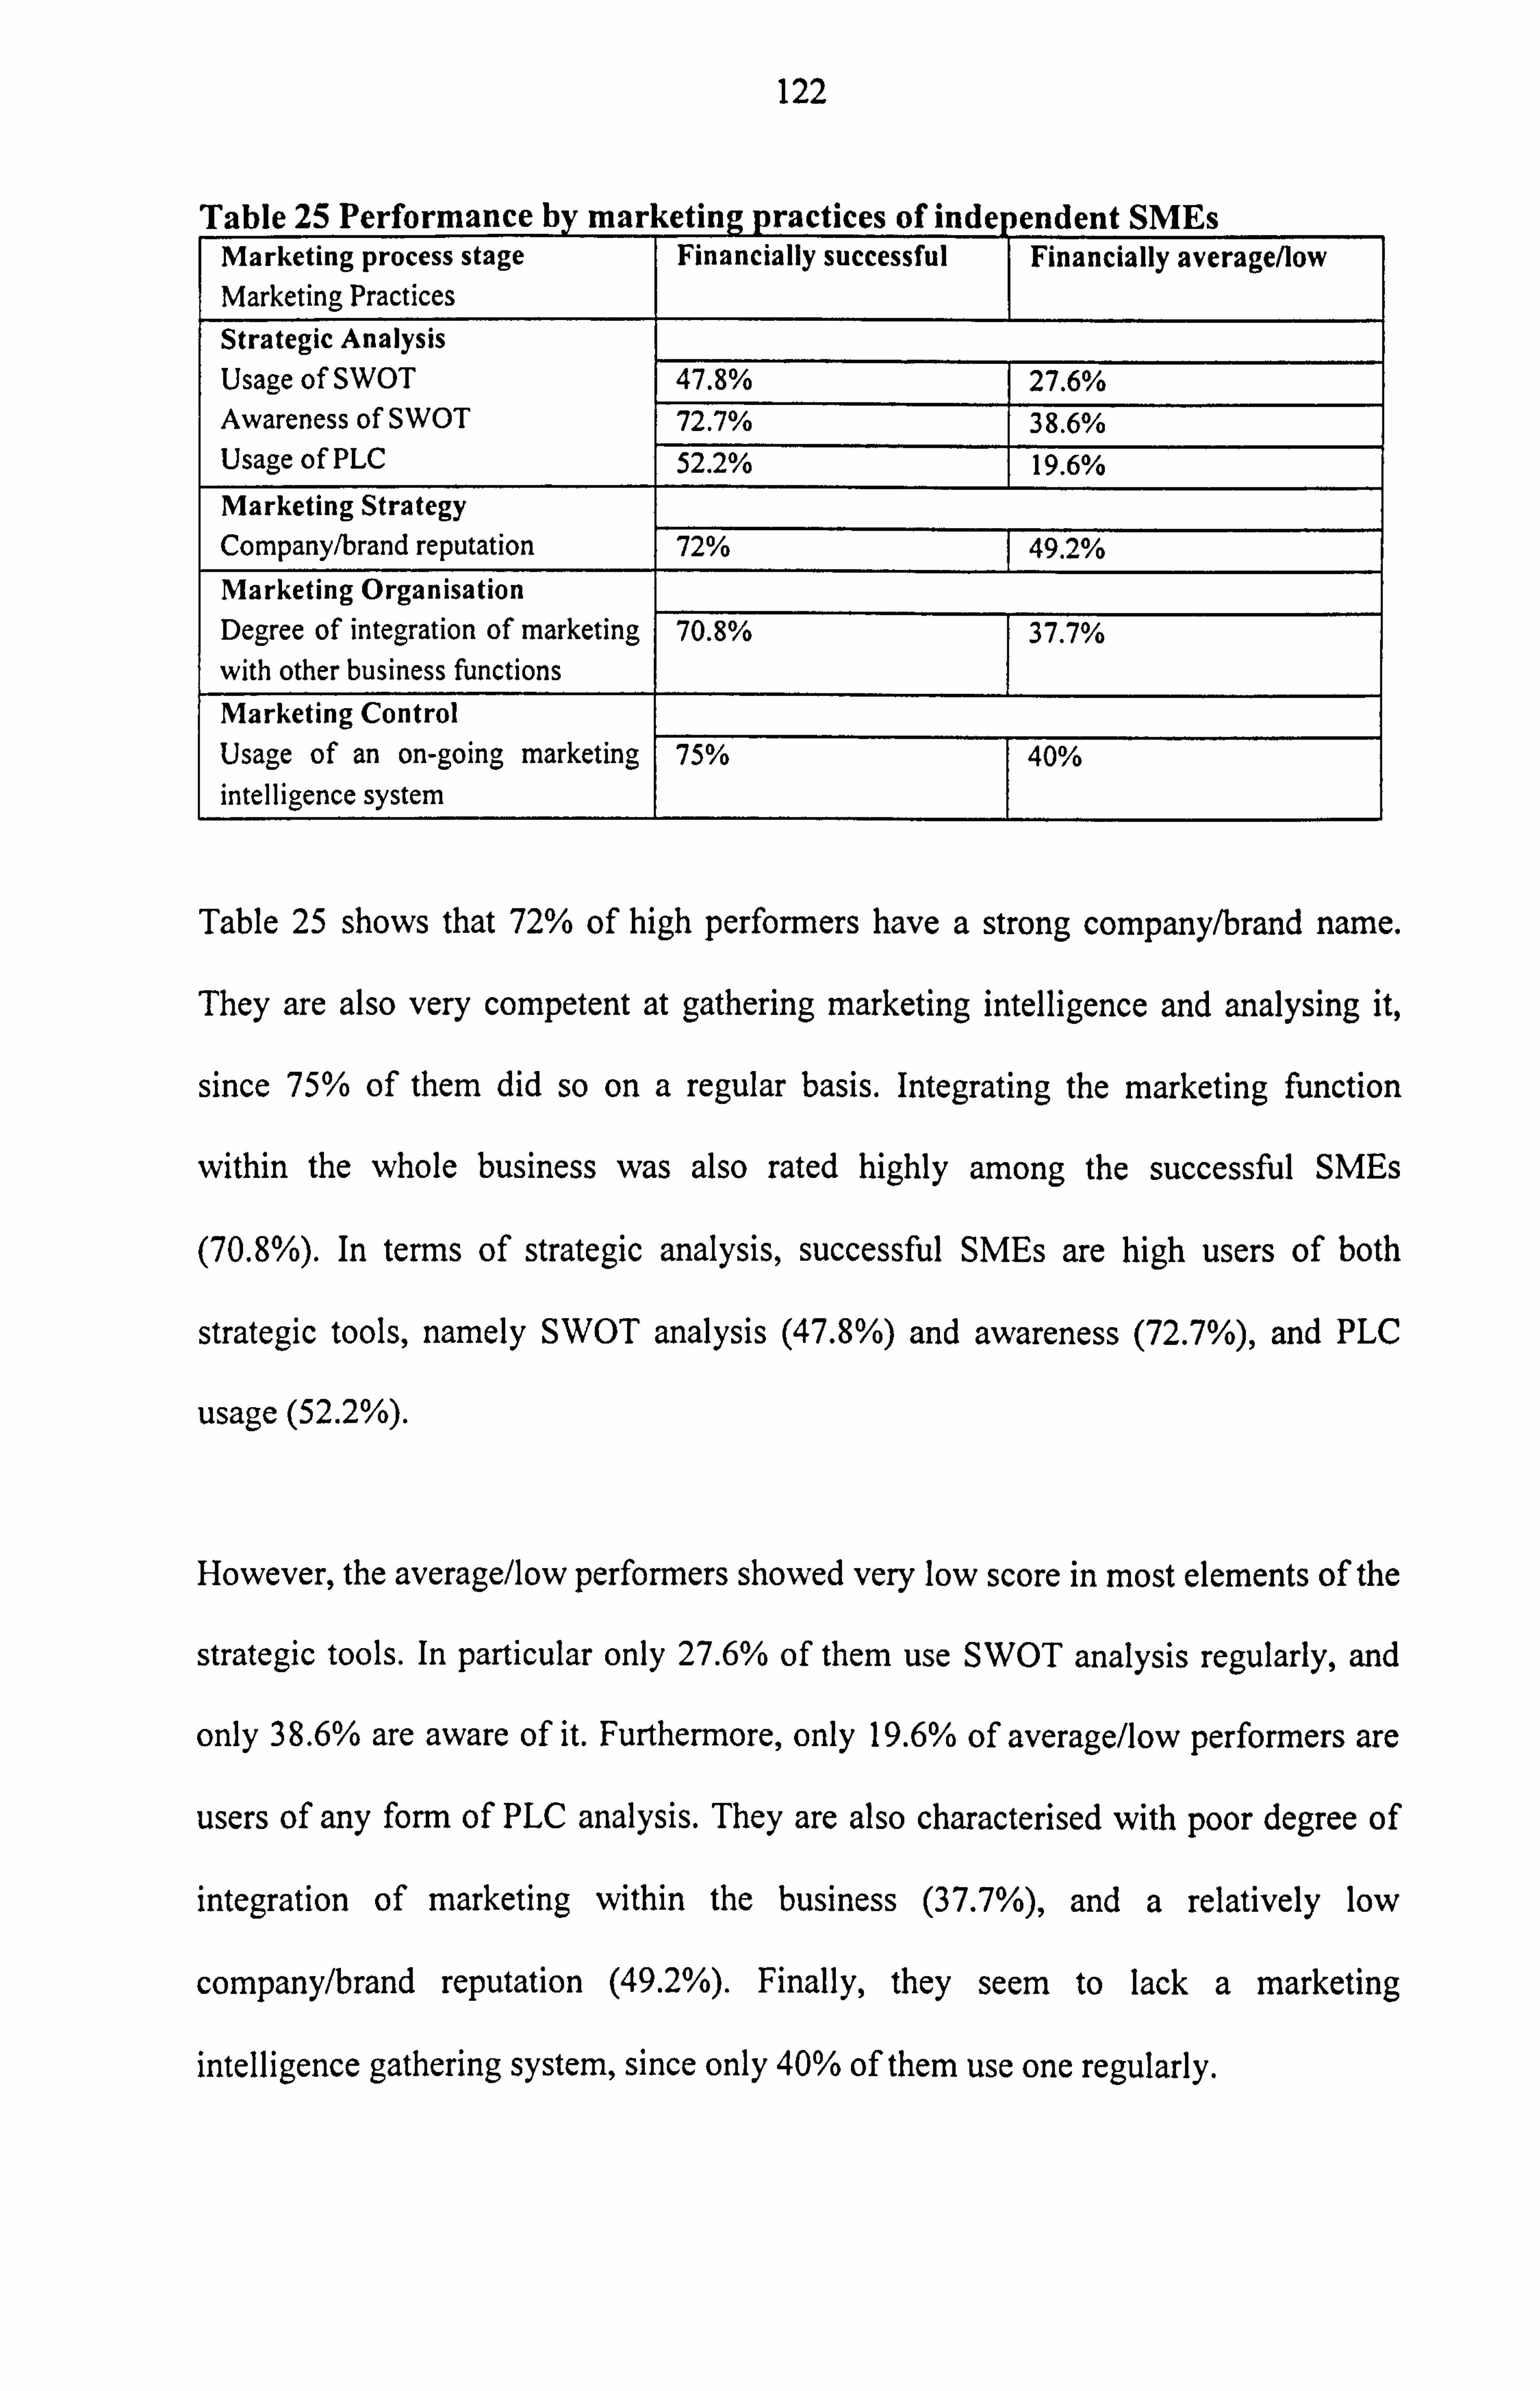
122
Table 25 Performance by marketing practices of indenendent SMEs Marketing process stage Marketing Practices
Financially successful Financially average/low
Strategic Analysis Usage of SWOT 47.8% 27.6% Awareness of SWOT 72.7% 38.6% Usage of PLC 52.2% 19.6% Marketing Strategy
Company/brand reputation 72% 49.2% Marketing Organisation Degree of integration of marketing with other business functions
70.8% 7.7%
Marketing Control
Usage of an on-going marketing intelligence system
75% 40%
Table 25 shows that 72% of high performers have a strong company/brand name.
They are also very competent at gathering marketing intelligence and analysing it,
since 75% of them did so on a regular basis. Integrating the marketing function
within the whole business was also rated highly among the successful SMEs
(70.8%). In terms of strategic analysis, successful SMEs are high users of both
strategic tools, namely SWOT analysis (47.8%) and awareness (72.7%), and PLC
usage (52.2%).
However, the average/low performers showed very low score in most elements of the
strategic tools. In particular only 27.6% of them use SWOT analysis regularly, and
only 38.6% are aware of it. Furthermore, only 19.6% of average/low performers are
users of any form of PLC analysis. They are also characterised with poor degree of
integration of marketing within the business (37.7%), and a relatively low
company/brand reputation (49.2%). Finally, they seem to lack a marketing
intelligence gathering system, since only 40% of them use one regularly.
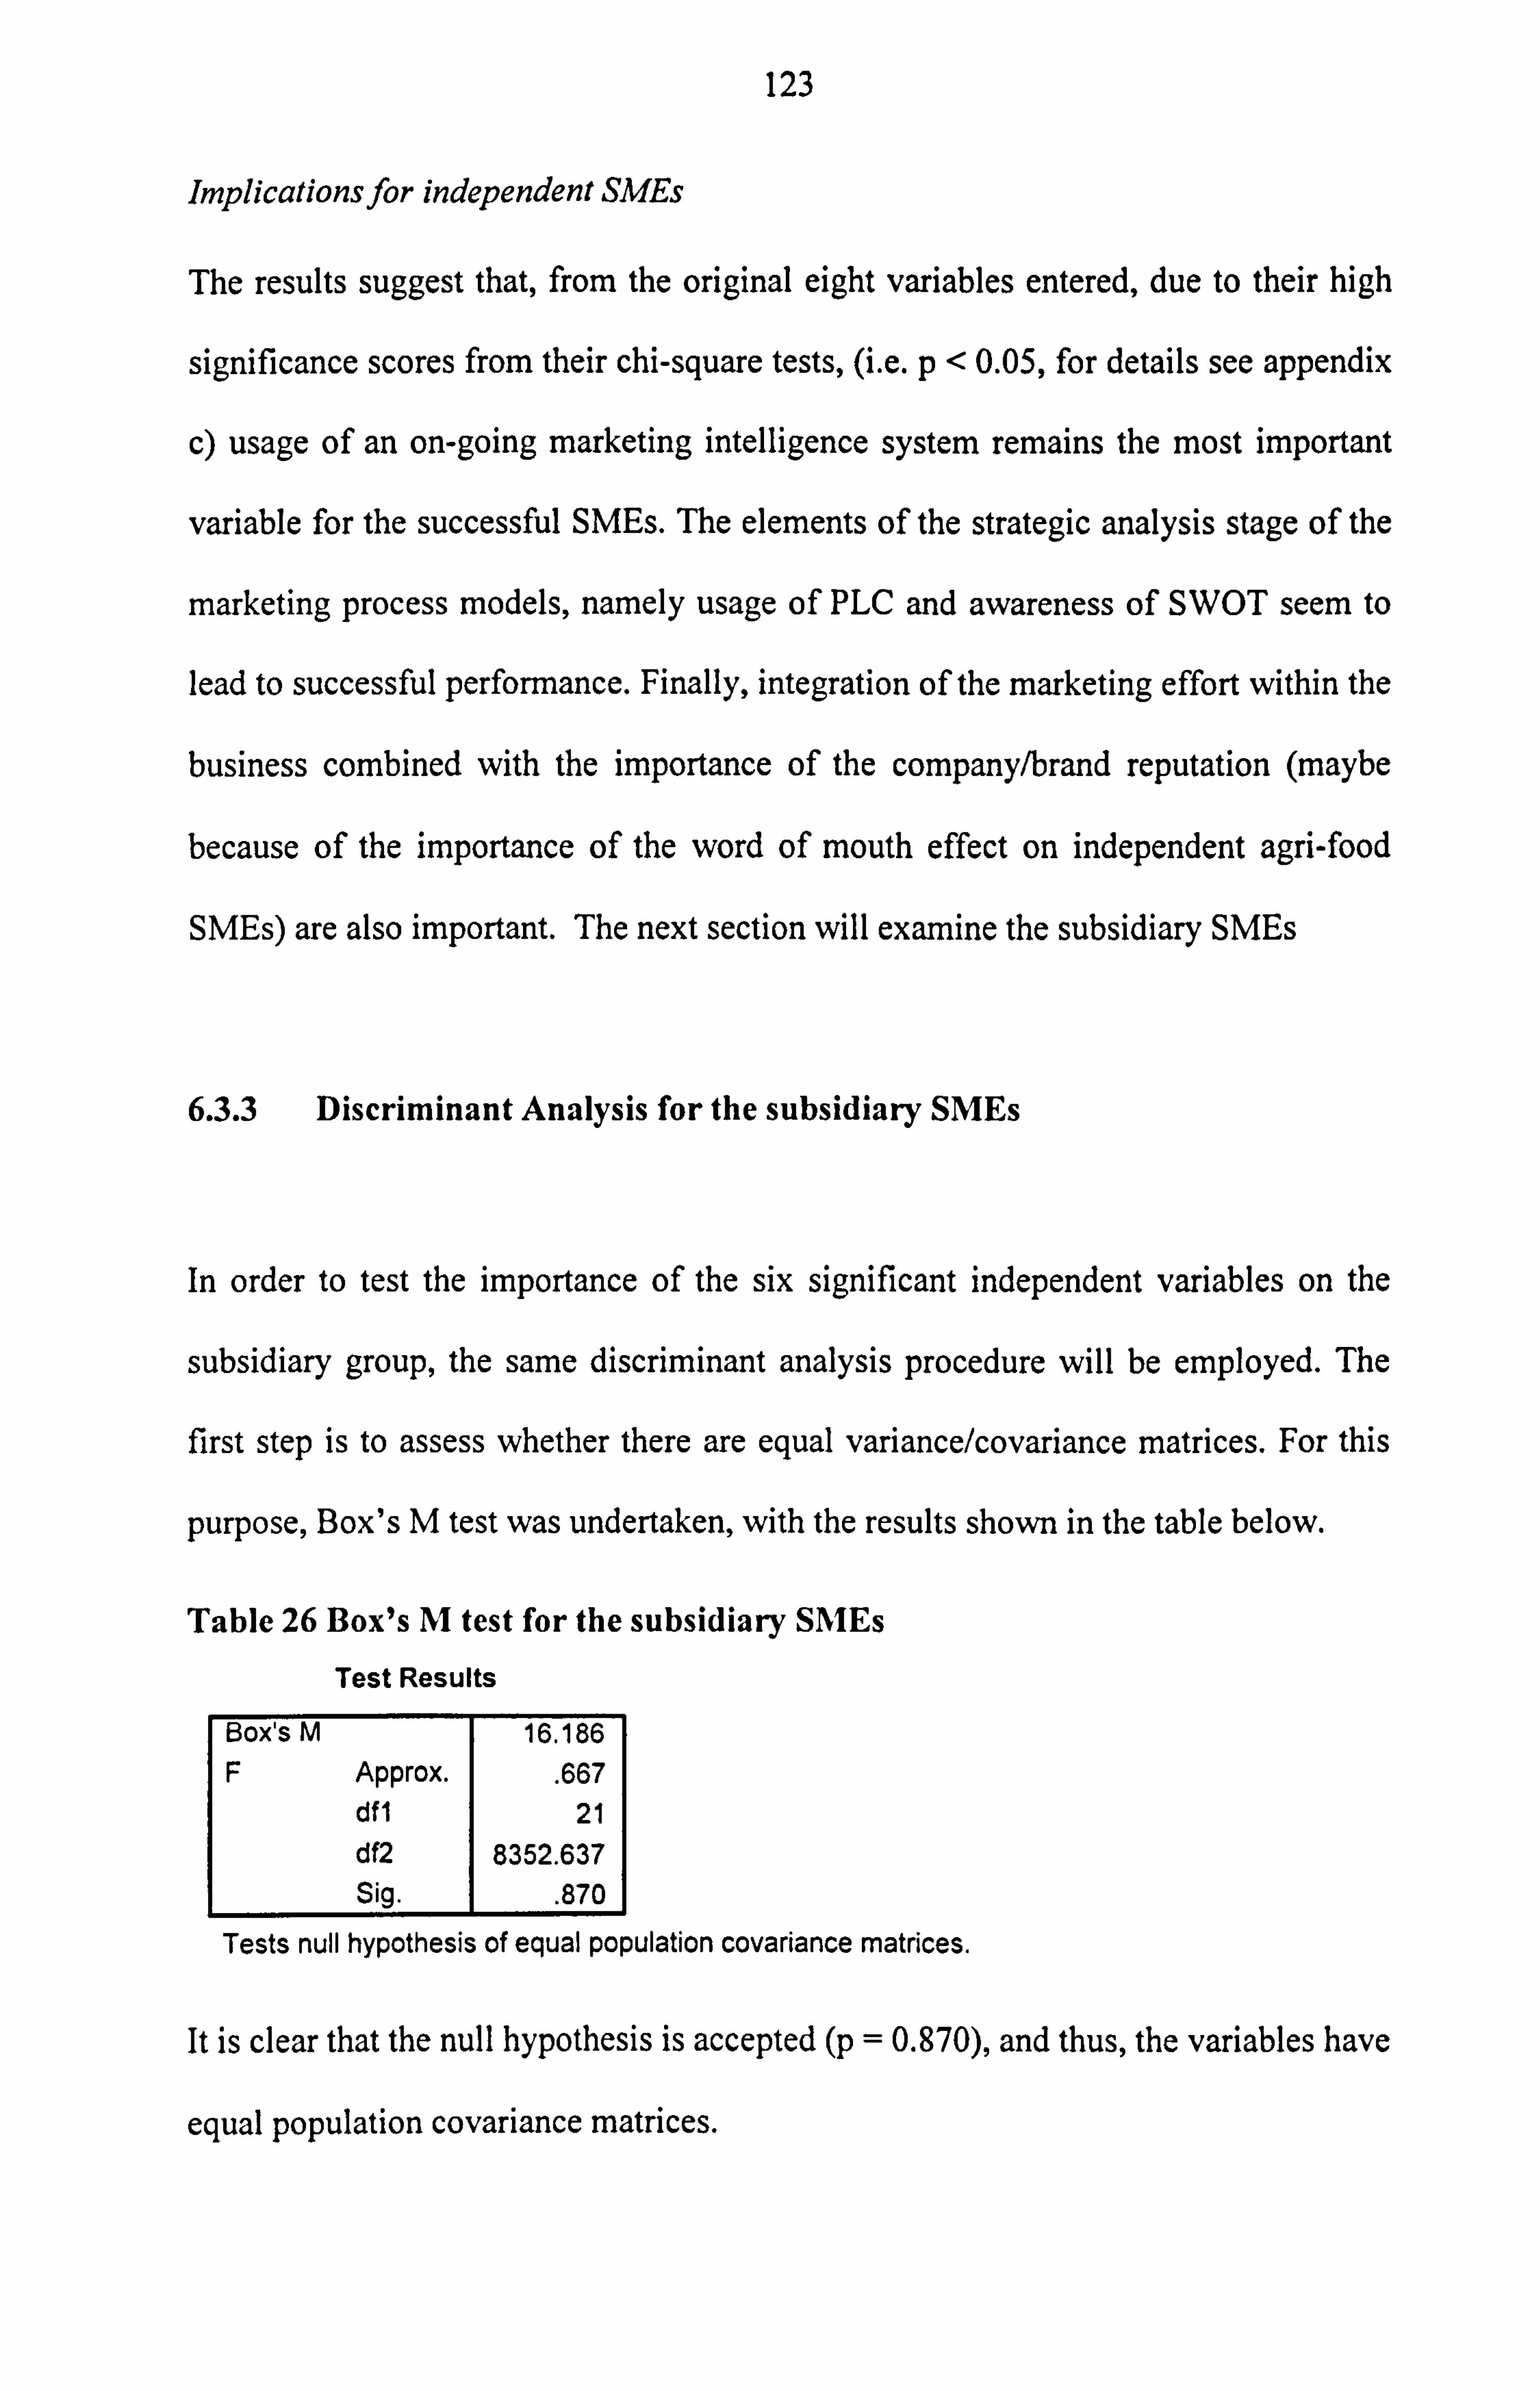
123
Implications for independent SMEs
The results suggest that, from the original eight variables entered, due to their high
significance scores from their chi-square tests, (i. e. p<0.05, for details see appendix
c) usage of an on-going marketing intelligence system remains the most important
variable for the successful SMEs. The elements of the strategic analysis stage of the
marketing process models, namely usage of PLC and awareness of SWOT seem to
lead to successful performance. Finally, integration of the marketing effort within the
business combined with the importance of the company/brand reputation (maybe
because of the importance of the word of mouth effect on independent agri-food
SMEs) are also important. The next section will examine the subsidiary SMEs
6.3.3 Discriminant Analysis for the subsidiary SMEs
In order to test the importance of the six significant independent variables on the
subsidiary group, the same discriminant analysis procedure will be employed. The
first step is to assess whether there are equal variance/covariance matrices. For this
purpose, Box's M test was undertaken, with the results shown in the table below.
Table 26 Box's M test for the subsidiary SMEs
Test Results
Box's M 16.186 F Approx.
. 667 dfl 21 df2 8352.637 Sig.
. 870
Tests null hypothesis of equal population covariance matrices.
It is clear that the null hypothesis is accepted (p = 0.870), and thus, the variables have
equal population covariance matrices.
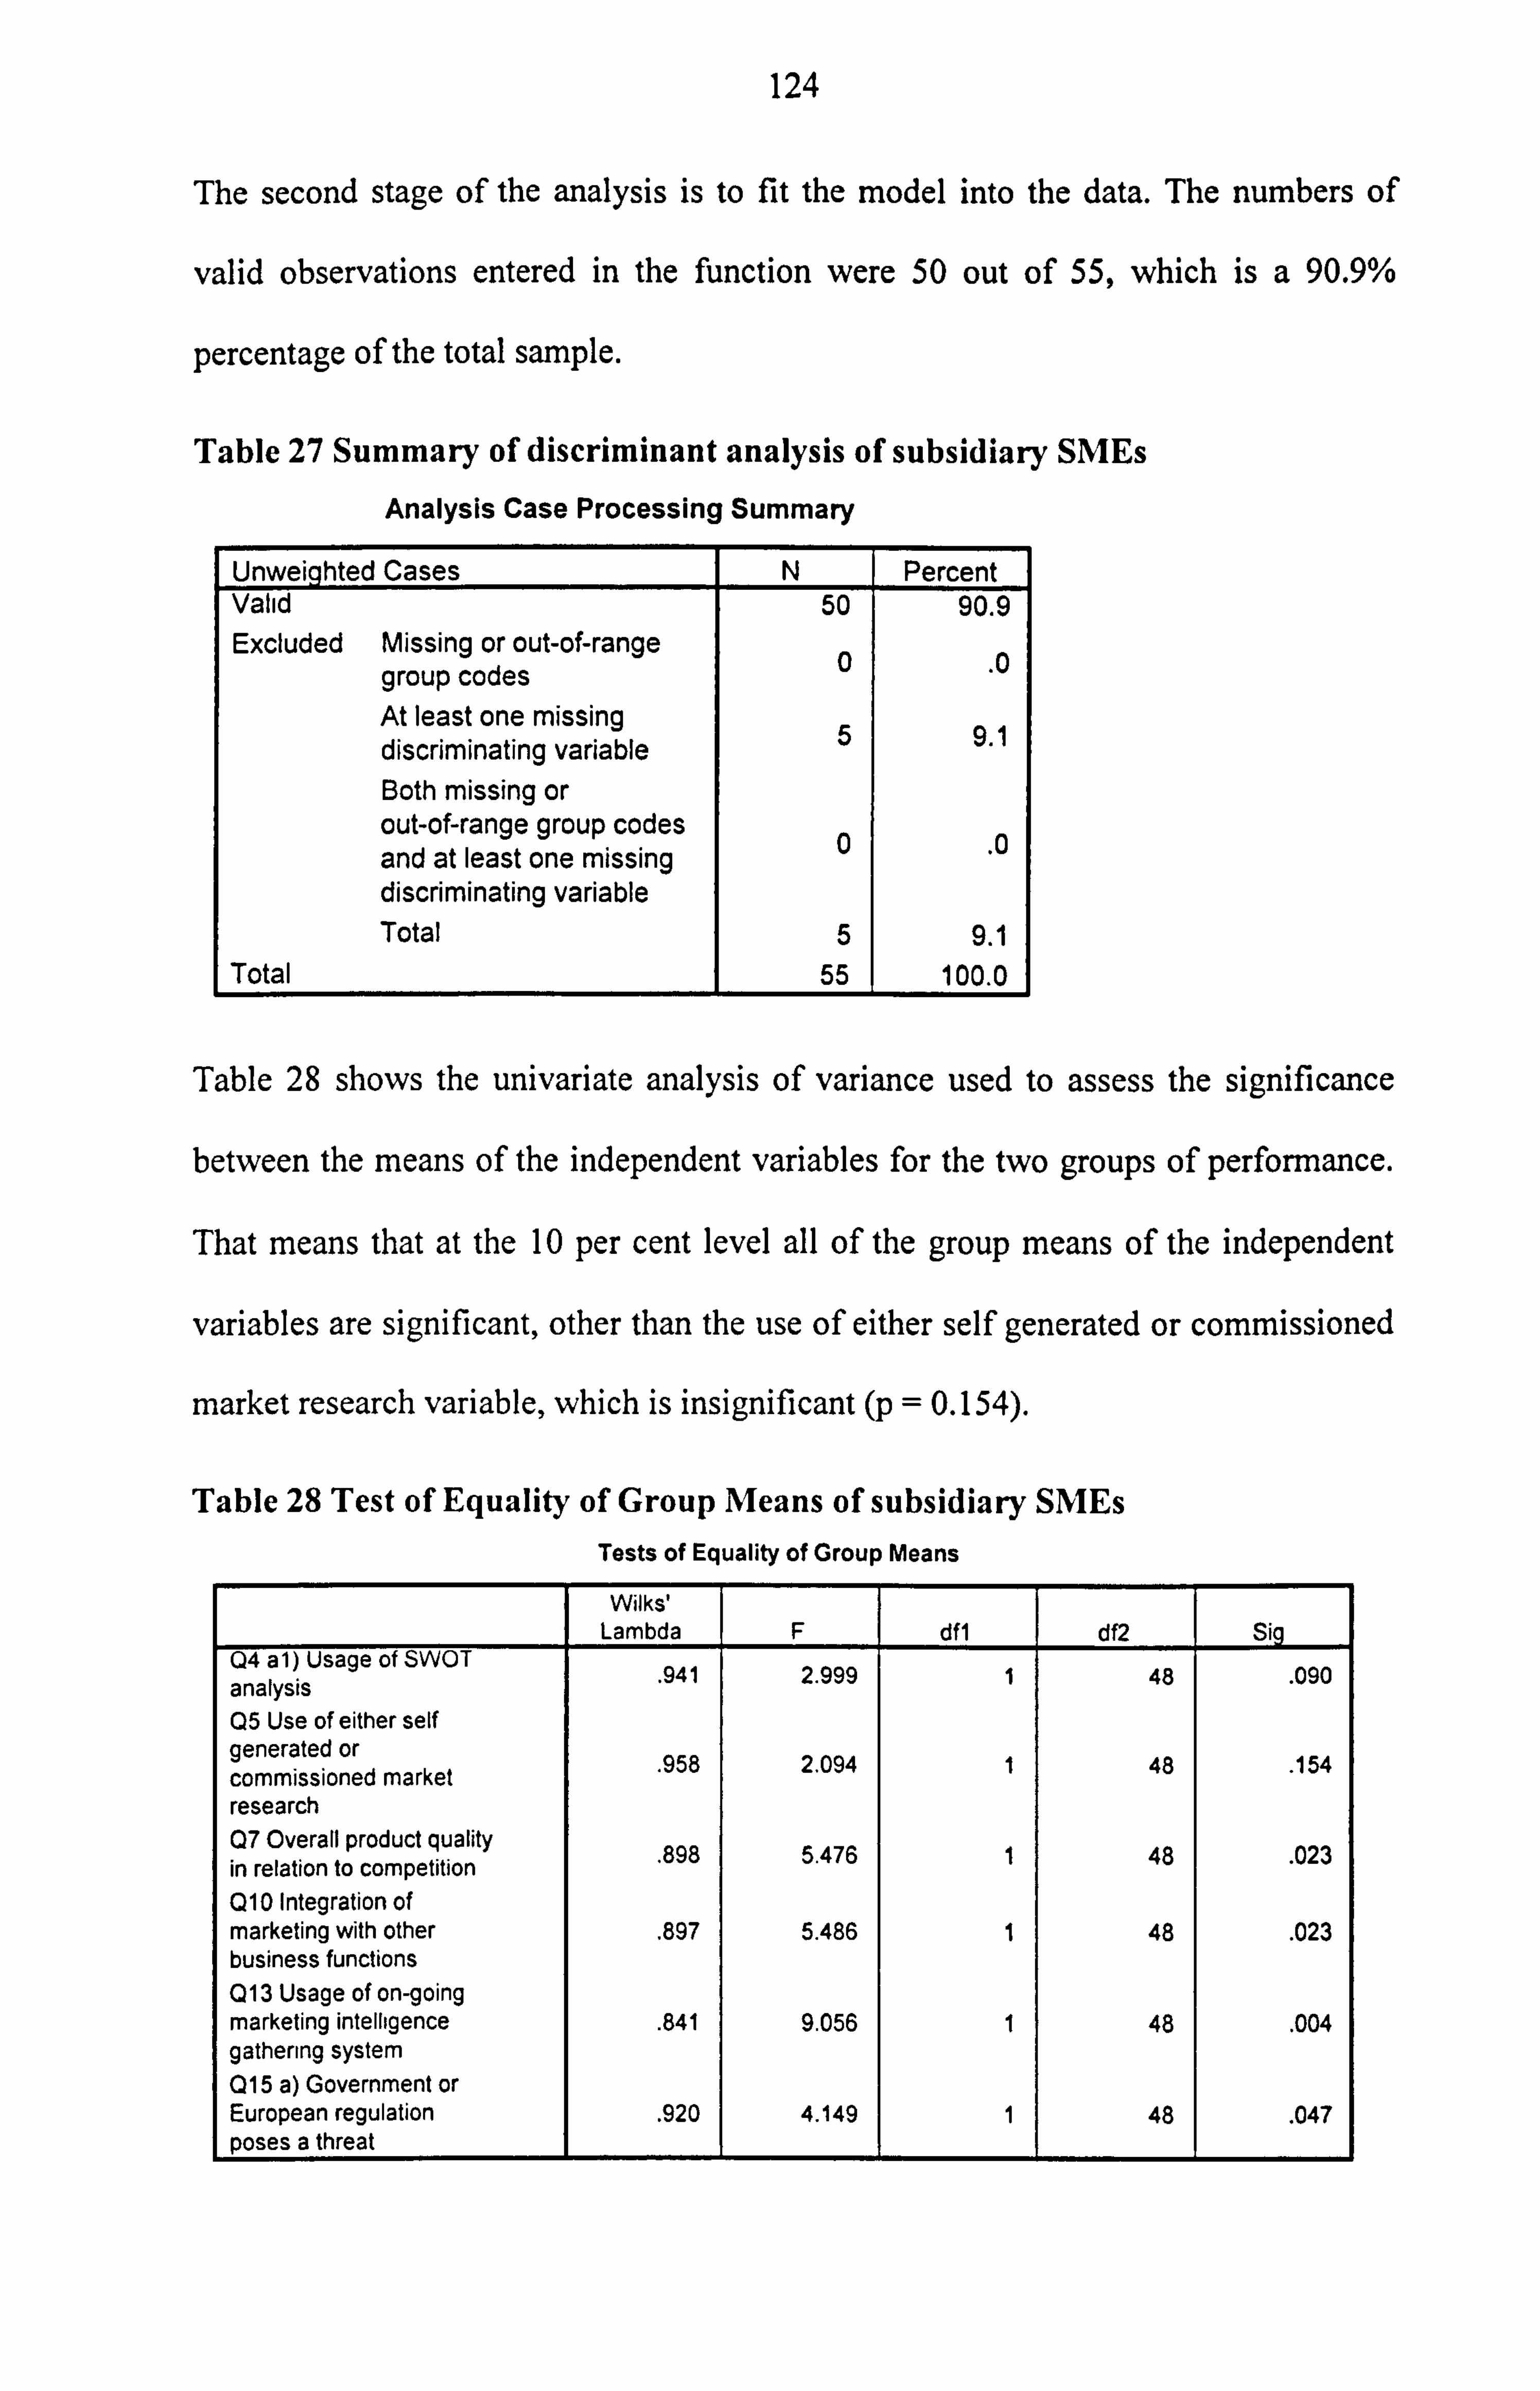
124
The second stage of the analysis is to fit the model into the data. The numbers of
valid observations entered in the function were 50 out of 55, which is a 90.9%
percentage of the total sample.
Table 27 Summary of discriminant analysis of subsidiary SMEs
Analysis Case Processing Summary
Unweighted Cases N Percent Valid 50 90.9 Excluded Missing or out-of-range
group codes 0 .0
At least one missing discriminating variable
5 9.1
Both missing or out-of-range group codes and at least one missing
0 .0 discriminating variable Total 5 9.1
Total 55 100.0
Table 28 shows the univariate analysis of variance used to assess the significance
between the means of the independent variables for the two groups of performance.
That means that at the 10 per cent level all of the group means of the independent
variables are significant, other than the use of either self generated or commissioned
market research variable, which is insignificant (p = 0.154).
Table 28 Test of Equality of Group Means of subsidiary SMEs Tests of Equality of Group Means
Wilks' Lambda F df1 df2 Sig
Q4 a1) Usage of SWOT analysis . 941 2.999 1 48 . 090
Q5 Use of either self generated or
. 958 2.094 1 48 154 commissioned market . research Q7 Overall product quality in relation to competition . 898 5.476 1 48 .
023
Q10 Integration of marketing with other . 897 5.486 1 48 .
023 business functions
Q13 Usage of on-going marketing intelligence . 841 9.056 1 48 . 004 gathering system Q15 a) Government or European regulation . 920 4.149 1 48 . 047 poses a threat
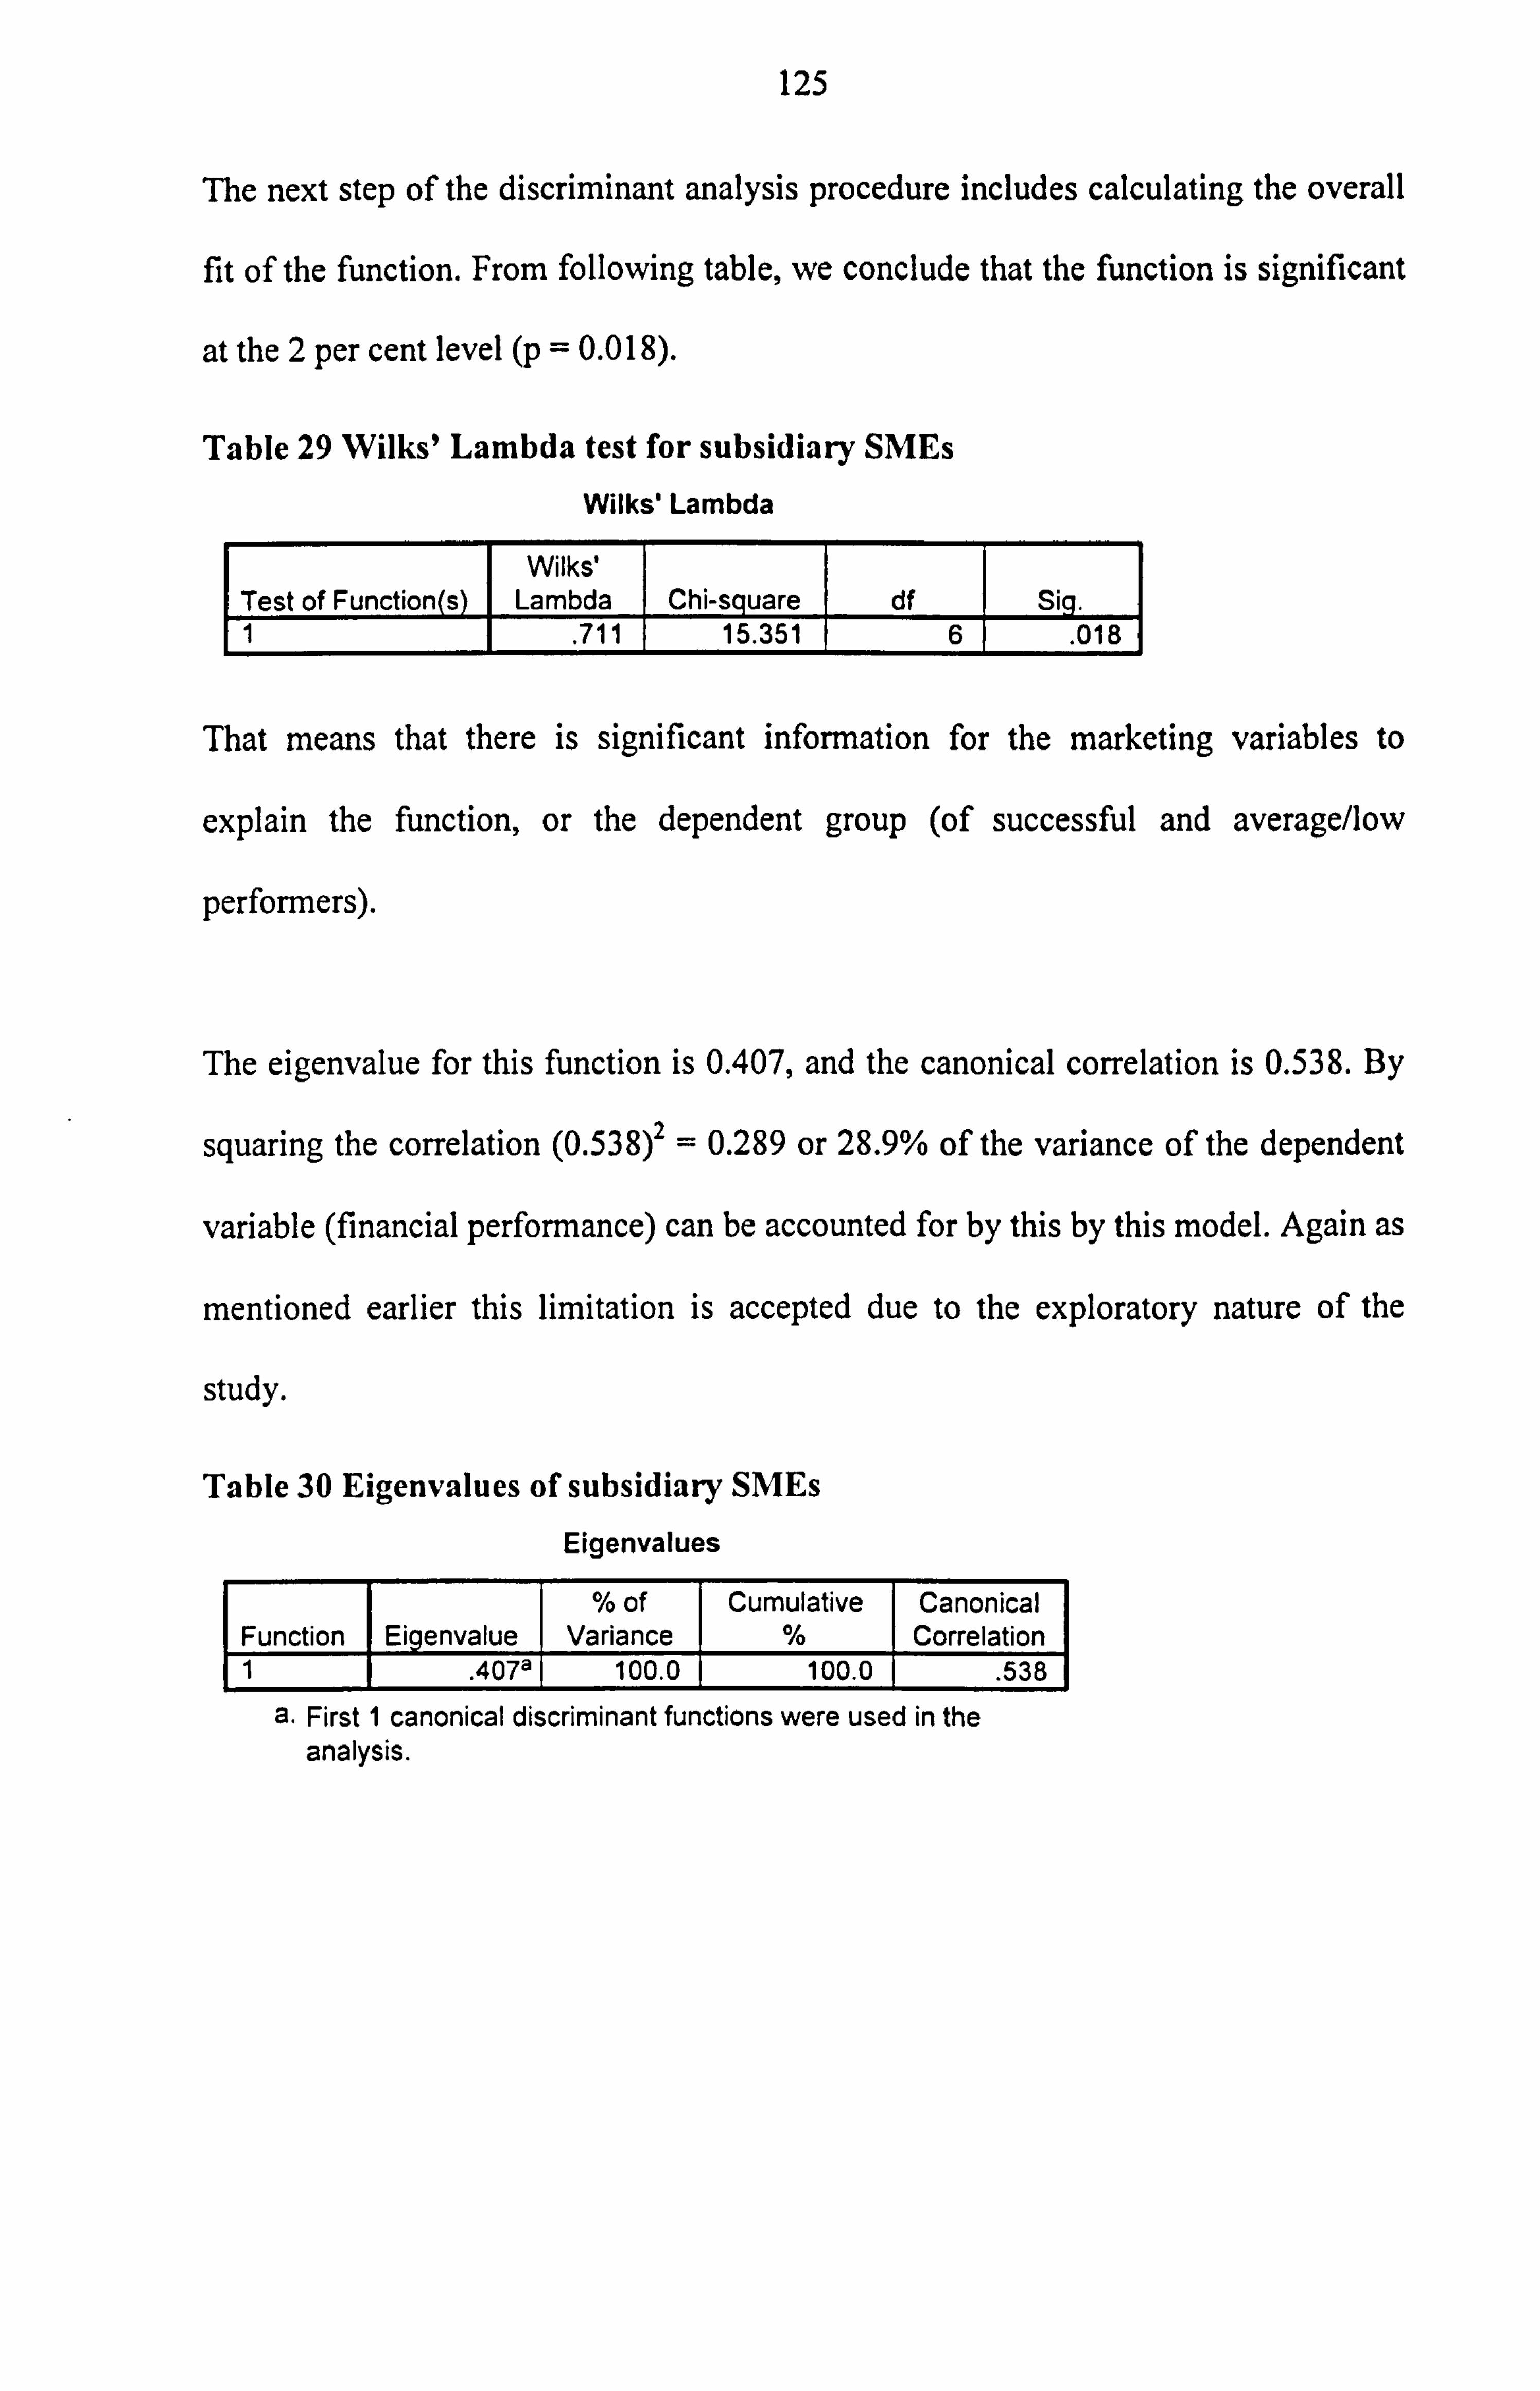
125
The next step of the discriminant analysis procedure includes calculating the overall
fit of the function. From following table, we conclude that the function is significant
at the 2 per cent level (p = 0.018).
Table 29 Wilks' Lambda test for subsidiary SMEs
Wilks' Lambda
Test of Function(s) Wilks'
Lambda Chi-square df Si q. 1 . 711 15.351 6 . 018
That means that there is significant information for the marketing variables to
explain the function, or the dependent group (of successful and average/low
performers).
The eigenvalue for this function is 0.407, and the canonical correlation is 0.538. By
squaring the correlation (0.538) 2=0.289 or 28.9% of the variance of the dependent
variable (financial performance) can be accounted for by this by this model. Again as
mentioned earlier this limitation is accepted due to the exploratory nature of the
study.
Table 30 Eigenvalues of subsidiary SMEs
Eigenvalues
Function Eigenvalue % of
Variance Cumulative
% Canonical Correlation
1 . 407a 100.0 100.0
. 538
a. First 1 canonical discriminant functions were used in the analysis.
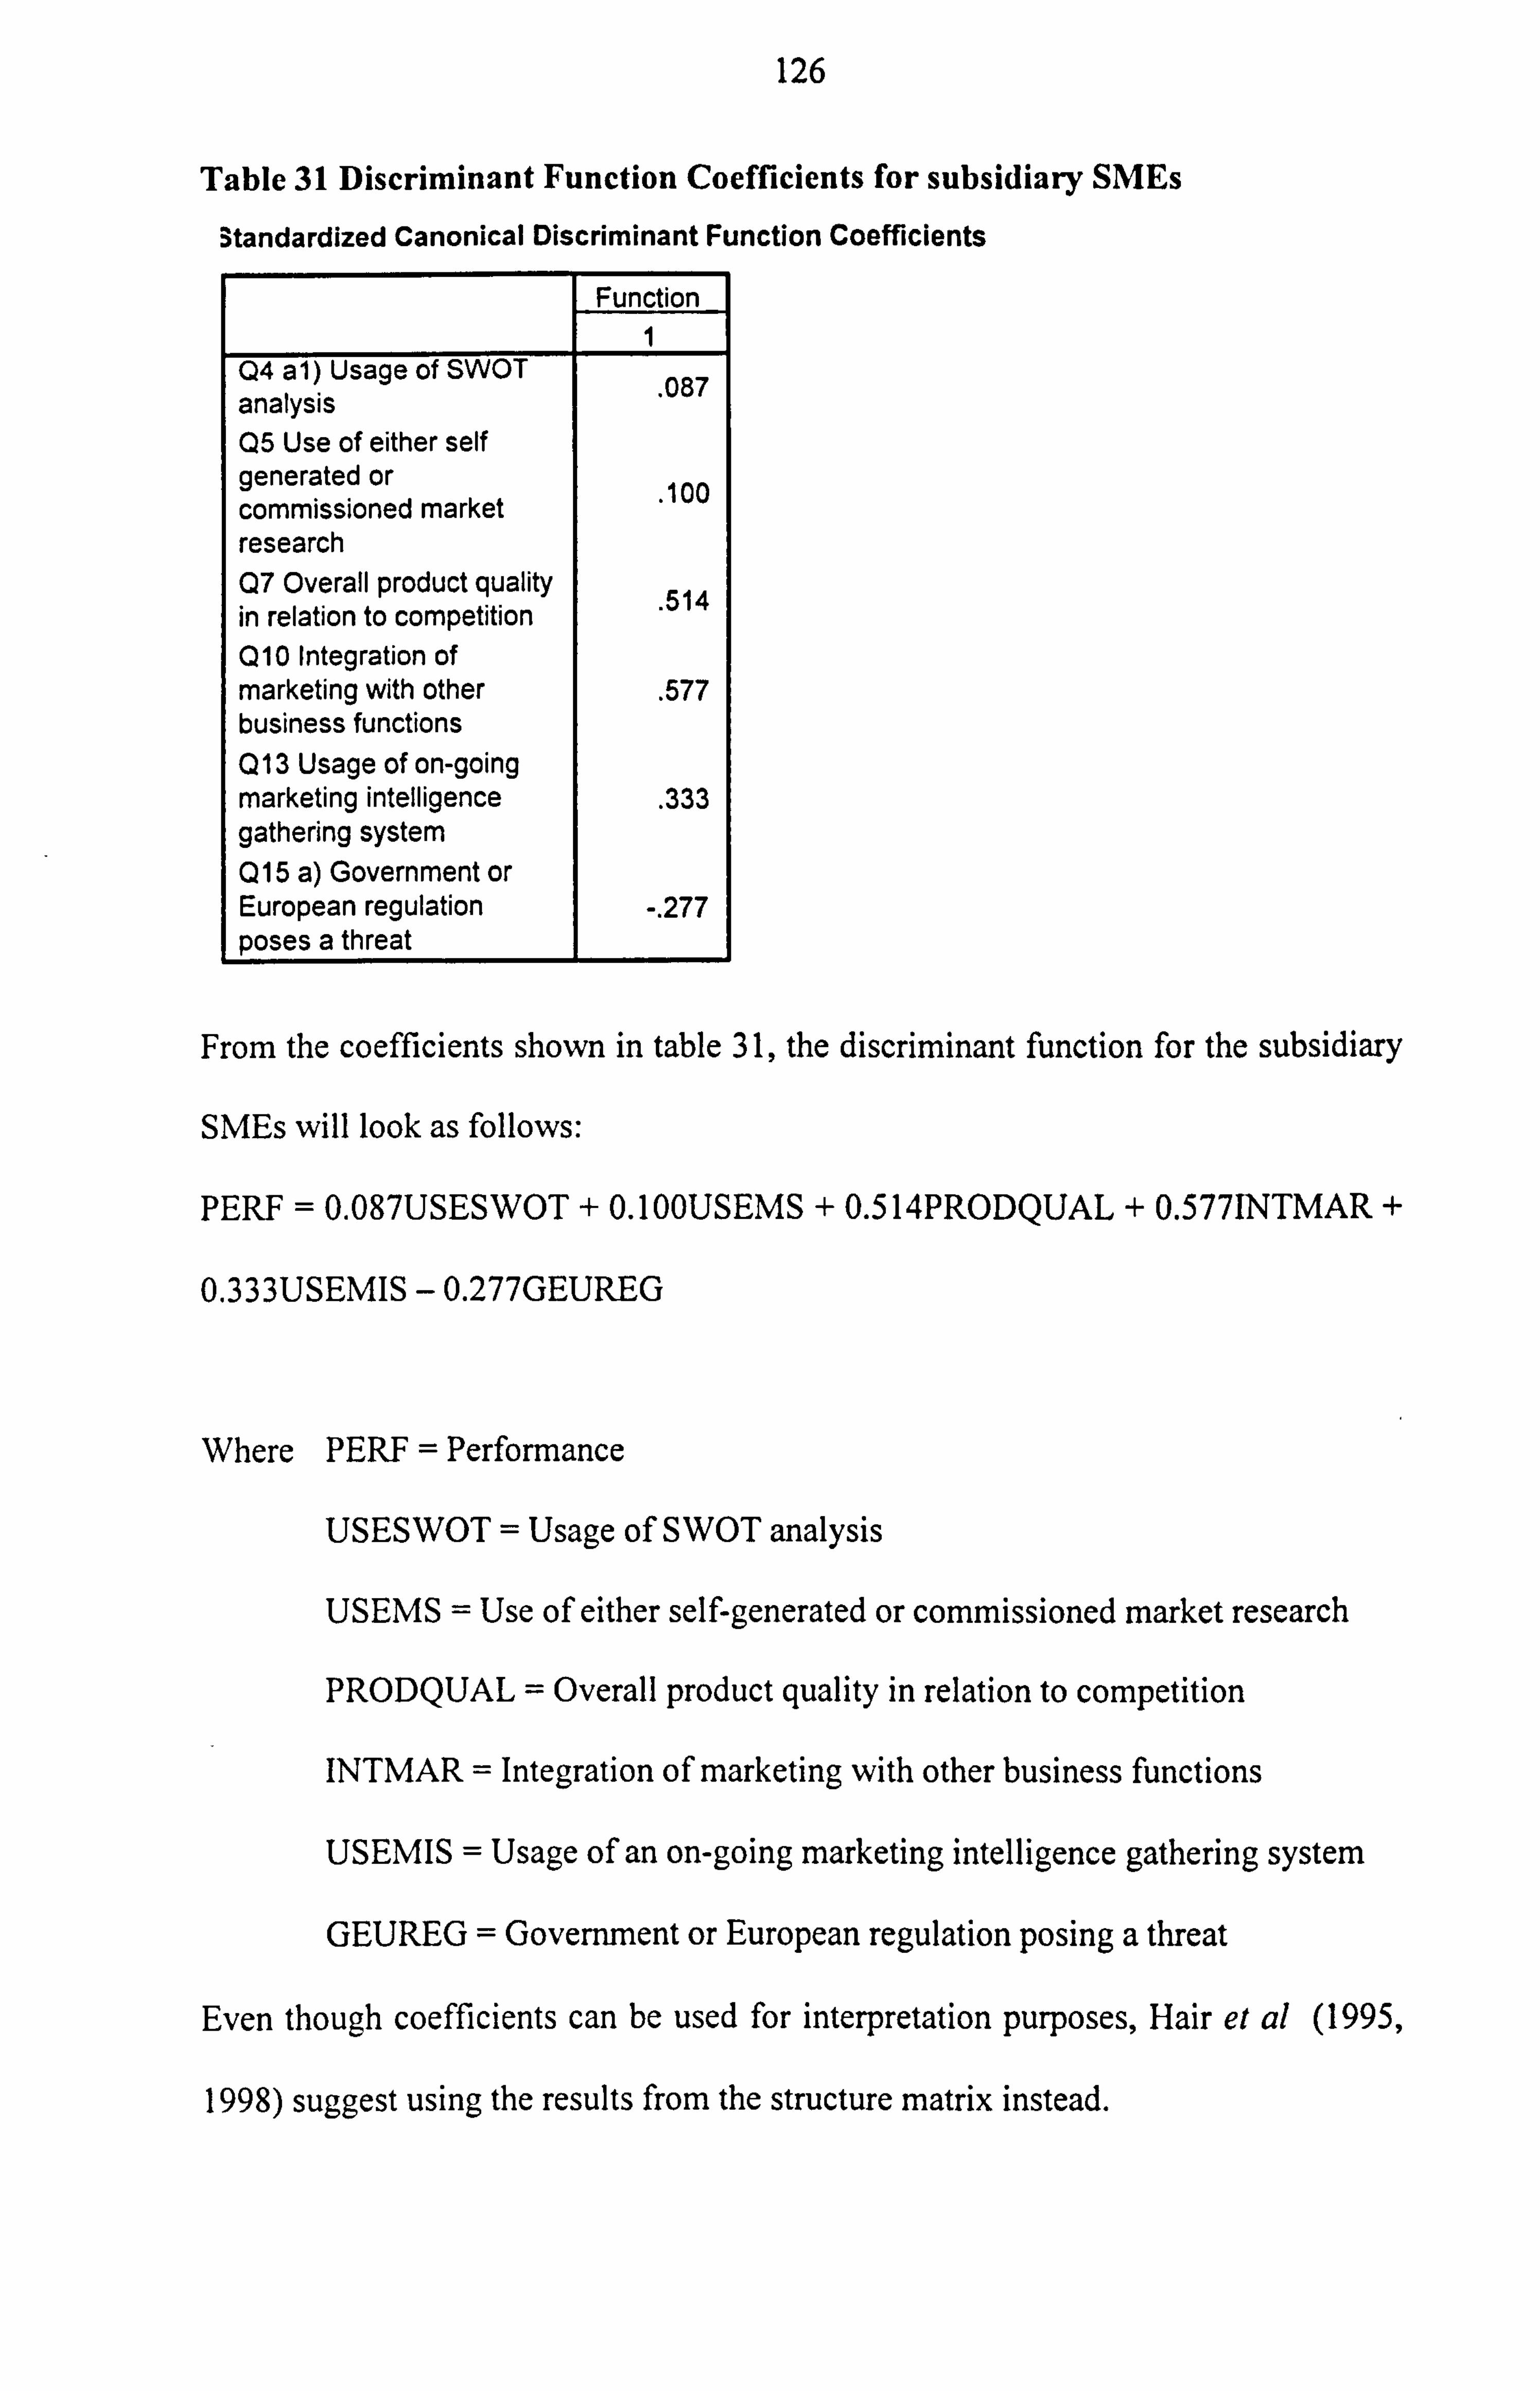
126
Table 31 Discriminant Function Coefficients for subsidiary SMEs
Standardized Canonical Discriminant Function Coefficients
Function 1
Q4 al) Usage of SWOT 087
analysis Q5 Use of either self generated or 100 commissioned market . research Q7 Overall product quality
. 514 in relation to competition Q10 Integration of marketing with other . 577 business functions Q13 Usage of on-going marketing intelligence
. 333 gathering system Q15 a) Government or European regulation -. 277 poses a threat
From the coefficients shown in table 31, the discriminant function for the subsidiary
SMEs will look as follows:
PERF = 0.087USESWOT + 0.100USEMS + 0.514PRODQUAL + 0.577INTMAR +
0.333USEMIS - 0.277GEUREG
Where PERF = Performance
USESWOT = Usage of SWOT analysis
USEMS = Use of either self-generated or commissioned market research
PRODQUAL = Overall product quality in relation to competition
INTMAR = Integration of marketing with other business functions
USEMIS = Usage of an on-going marketing intelligence gathering system
GEUREG = Government or European regulation posing a threat
Even though coefficients can be used for interpretation purposes, Hair et al (1995,
1998) suggest using the results from the structure matrix instead.
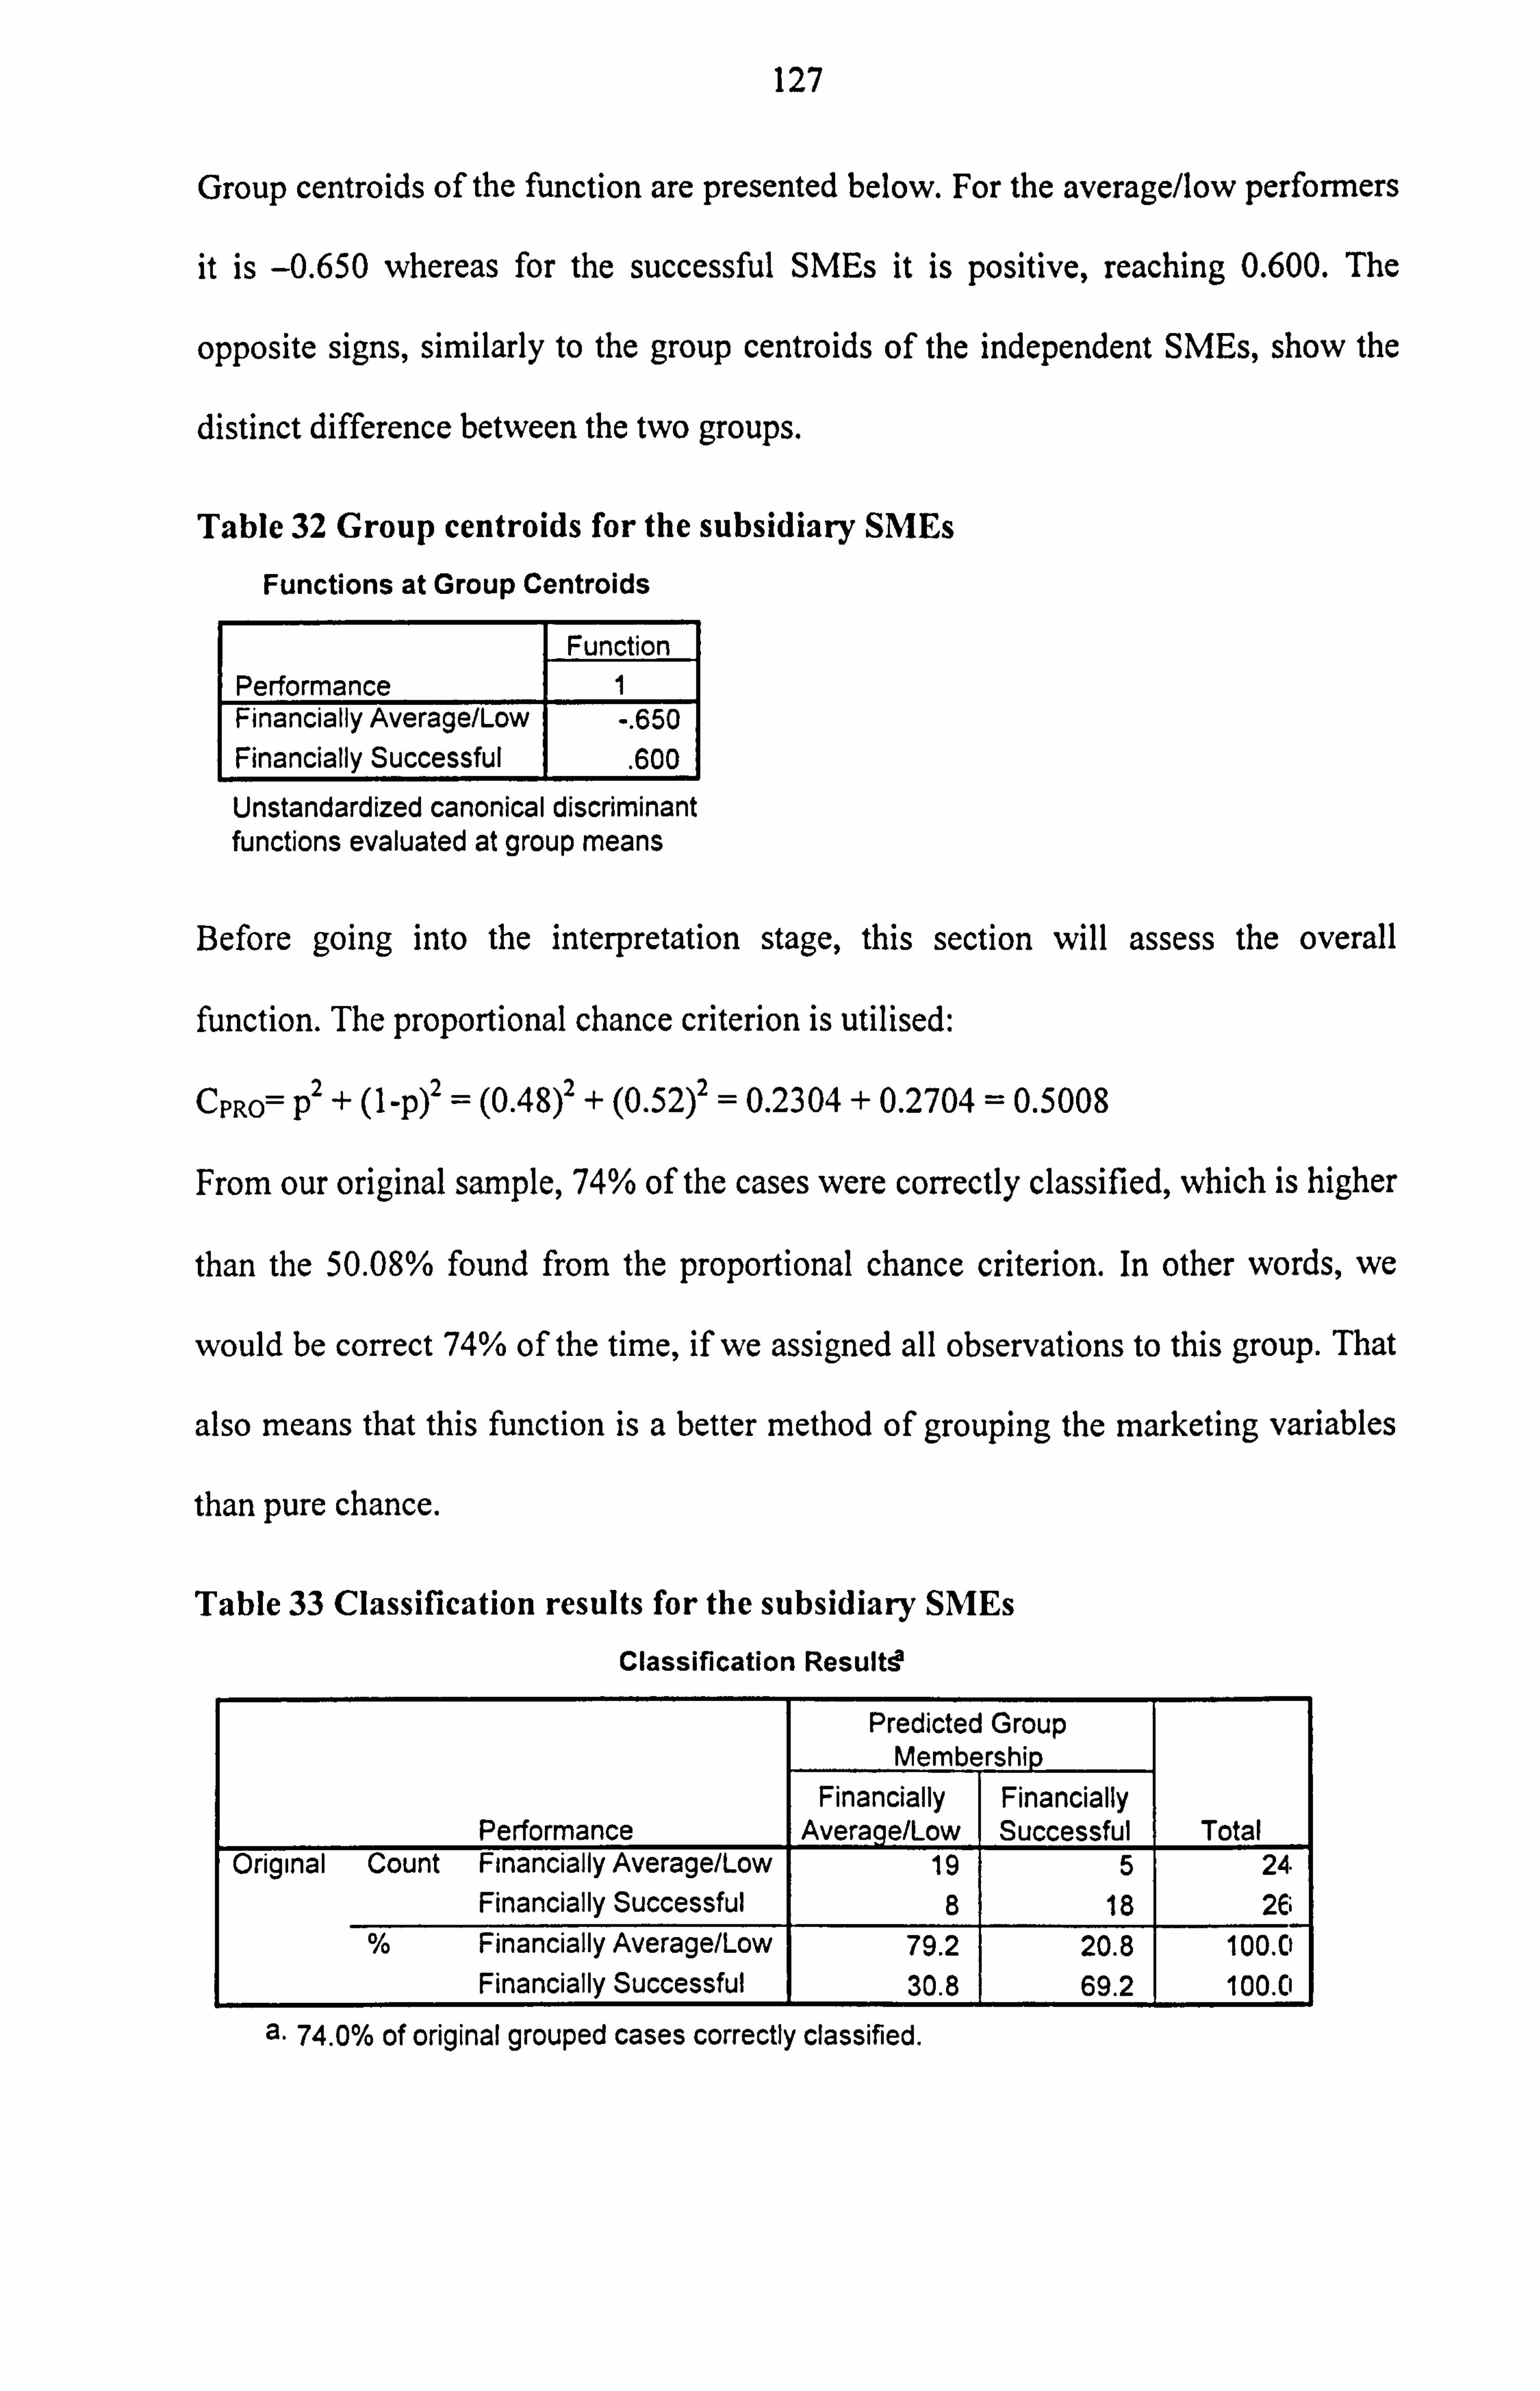
127
Group centroids of the function are presented below. For the average/low performers
it is -0.650 whereas for the successful SMEs it is positive, reaching 0.600. The
opposite signs, similarly to the group centroids of the independent SMEs, show the
distinct difference between the two groups.
Table 32 Group centroids for the subsidiary SMEs
Functions at Group Centroids
Function Performance 1 Financially Average/Low -. 650 Financially Successful
. 600
Unstandardized canonical discriminant functions evaluated at group means
Before going into the interpretation stage, this section will assess the overall
function. The proportional chance criterion is utilised:
CPRO= p2 + (1-p)2 = (0.48)2 + (0.52)2 = 0.2304 + 0.2704 = 0.5008
From our original sample, 74% of the cases were correctly classified, which is higher
than the 50.08% found from the proportional chance criterion. In other words, we
would be correct 74% of the time, if we assigned all observations to this group. That
also means that this function is a better method of grouping the marketing variables
than pure chance.
Table 33 Classification results for the subsidiary SMEs
Classification Resultsa
Predicted Group Membership
Financially Financially Performance Avera e/Low Successful Total
Original Count Financially Average/Low 19 5 24 Financially Successful 8 18 26
% Financially Average/Low 79.2 20.8 100.0 Financially Successful 30.8 69.2 100.0
a. 74.0% of original grouped cases correctly classified.
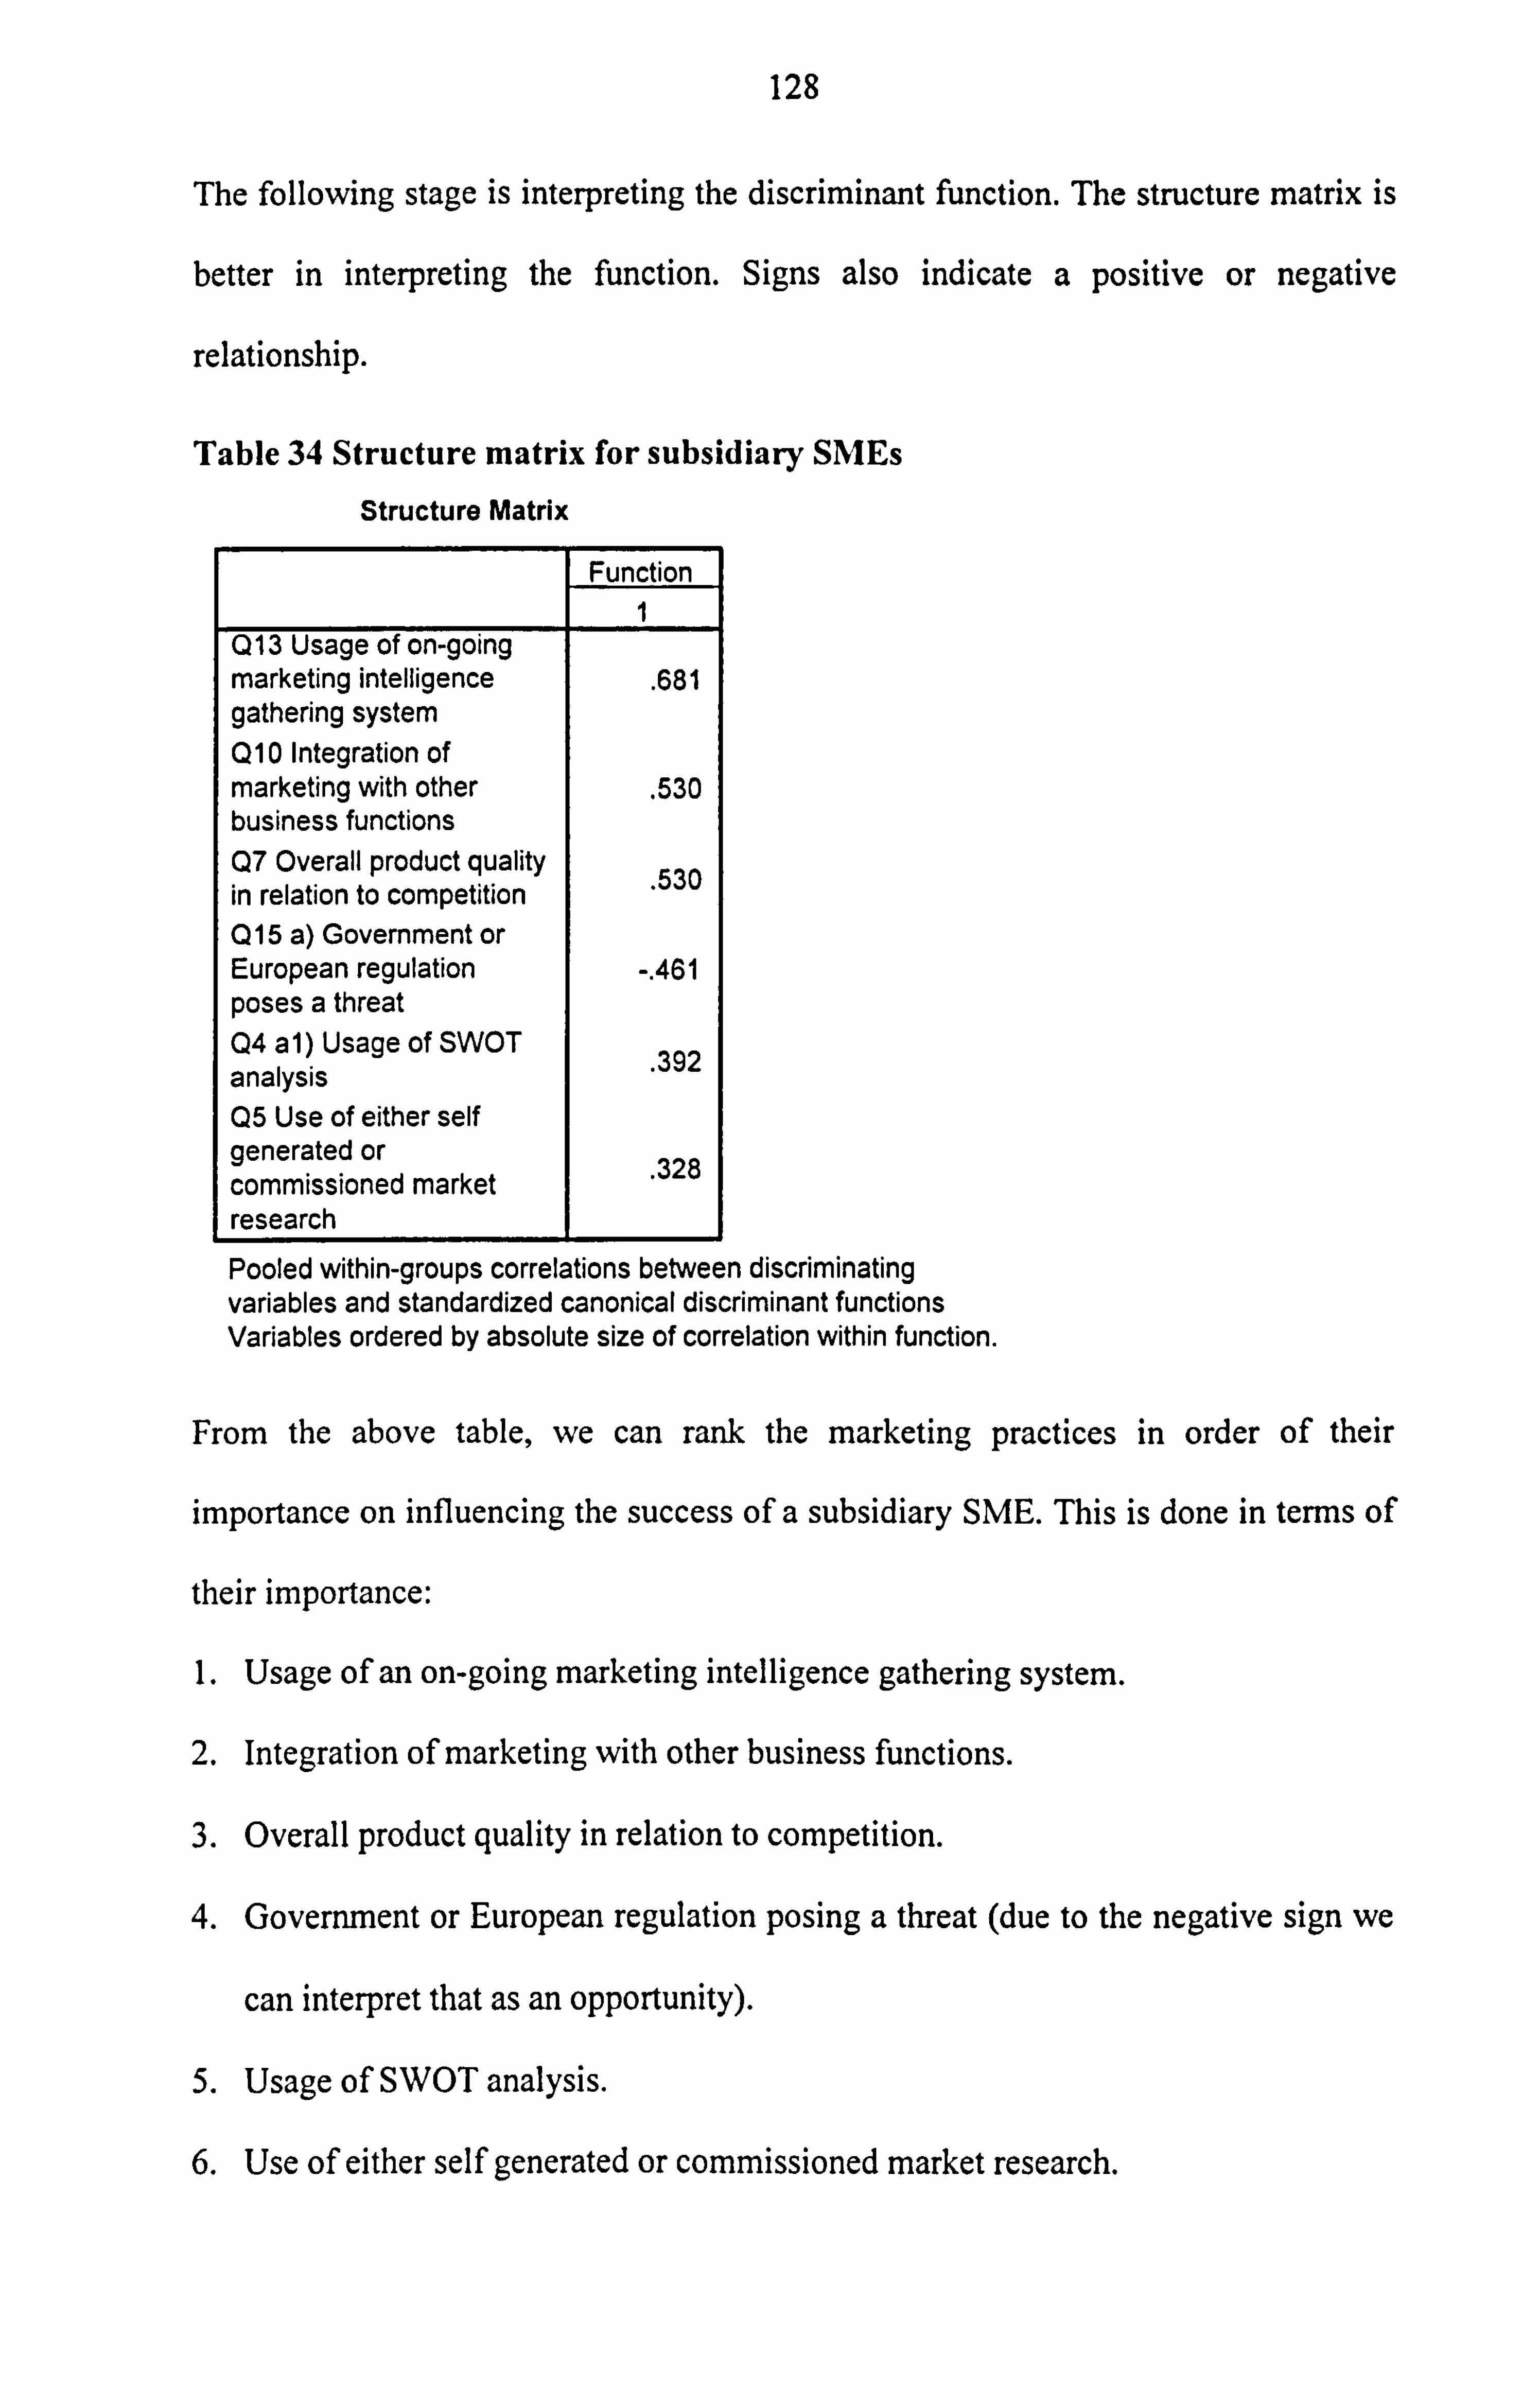
128
The following stage is interpreting the discriminant function. The structure matrix is
better in interpreting the function. Signs also indicate a positive or negative
relationship.
Table 34 Structure matrix for subsidiary SMEs
Structure Matrix
Function
Q13 Usage of on-going marketing intelligence
. 681 gathering system Q10 Integration of marketing with other . 530 business functions Q7 Overall product quality 530 in relation to competition . Q15 a) Government or European regulation -. 461 poses a threat Q4 al) Usage of SWOT analysis
392
Q5 Use of either self generated or 328 commissioned market research Pooled within-groups correlations between discriminating variables and standardized canonical discriminant functions Variables ordered by absolute size of correlation within function.
From the above table, we can rank the marketing practices in order of their
importance on influencing the success of a subsidiary SME. This is done in terms of
their importance:
1. Usage of an on-going marketing intelligence gathering system.
2. Integration of marketing with other business functions.
3. Overall product quality in relation to competition.
4. Government or European regulation posing a threat (due to the negative sign we
can interpret that as an opportunity).
5. Usage of SWOT analysis.
6. Use of either self generated or commissioned market research.
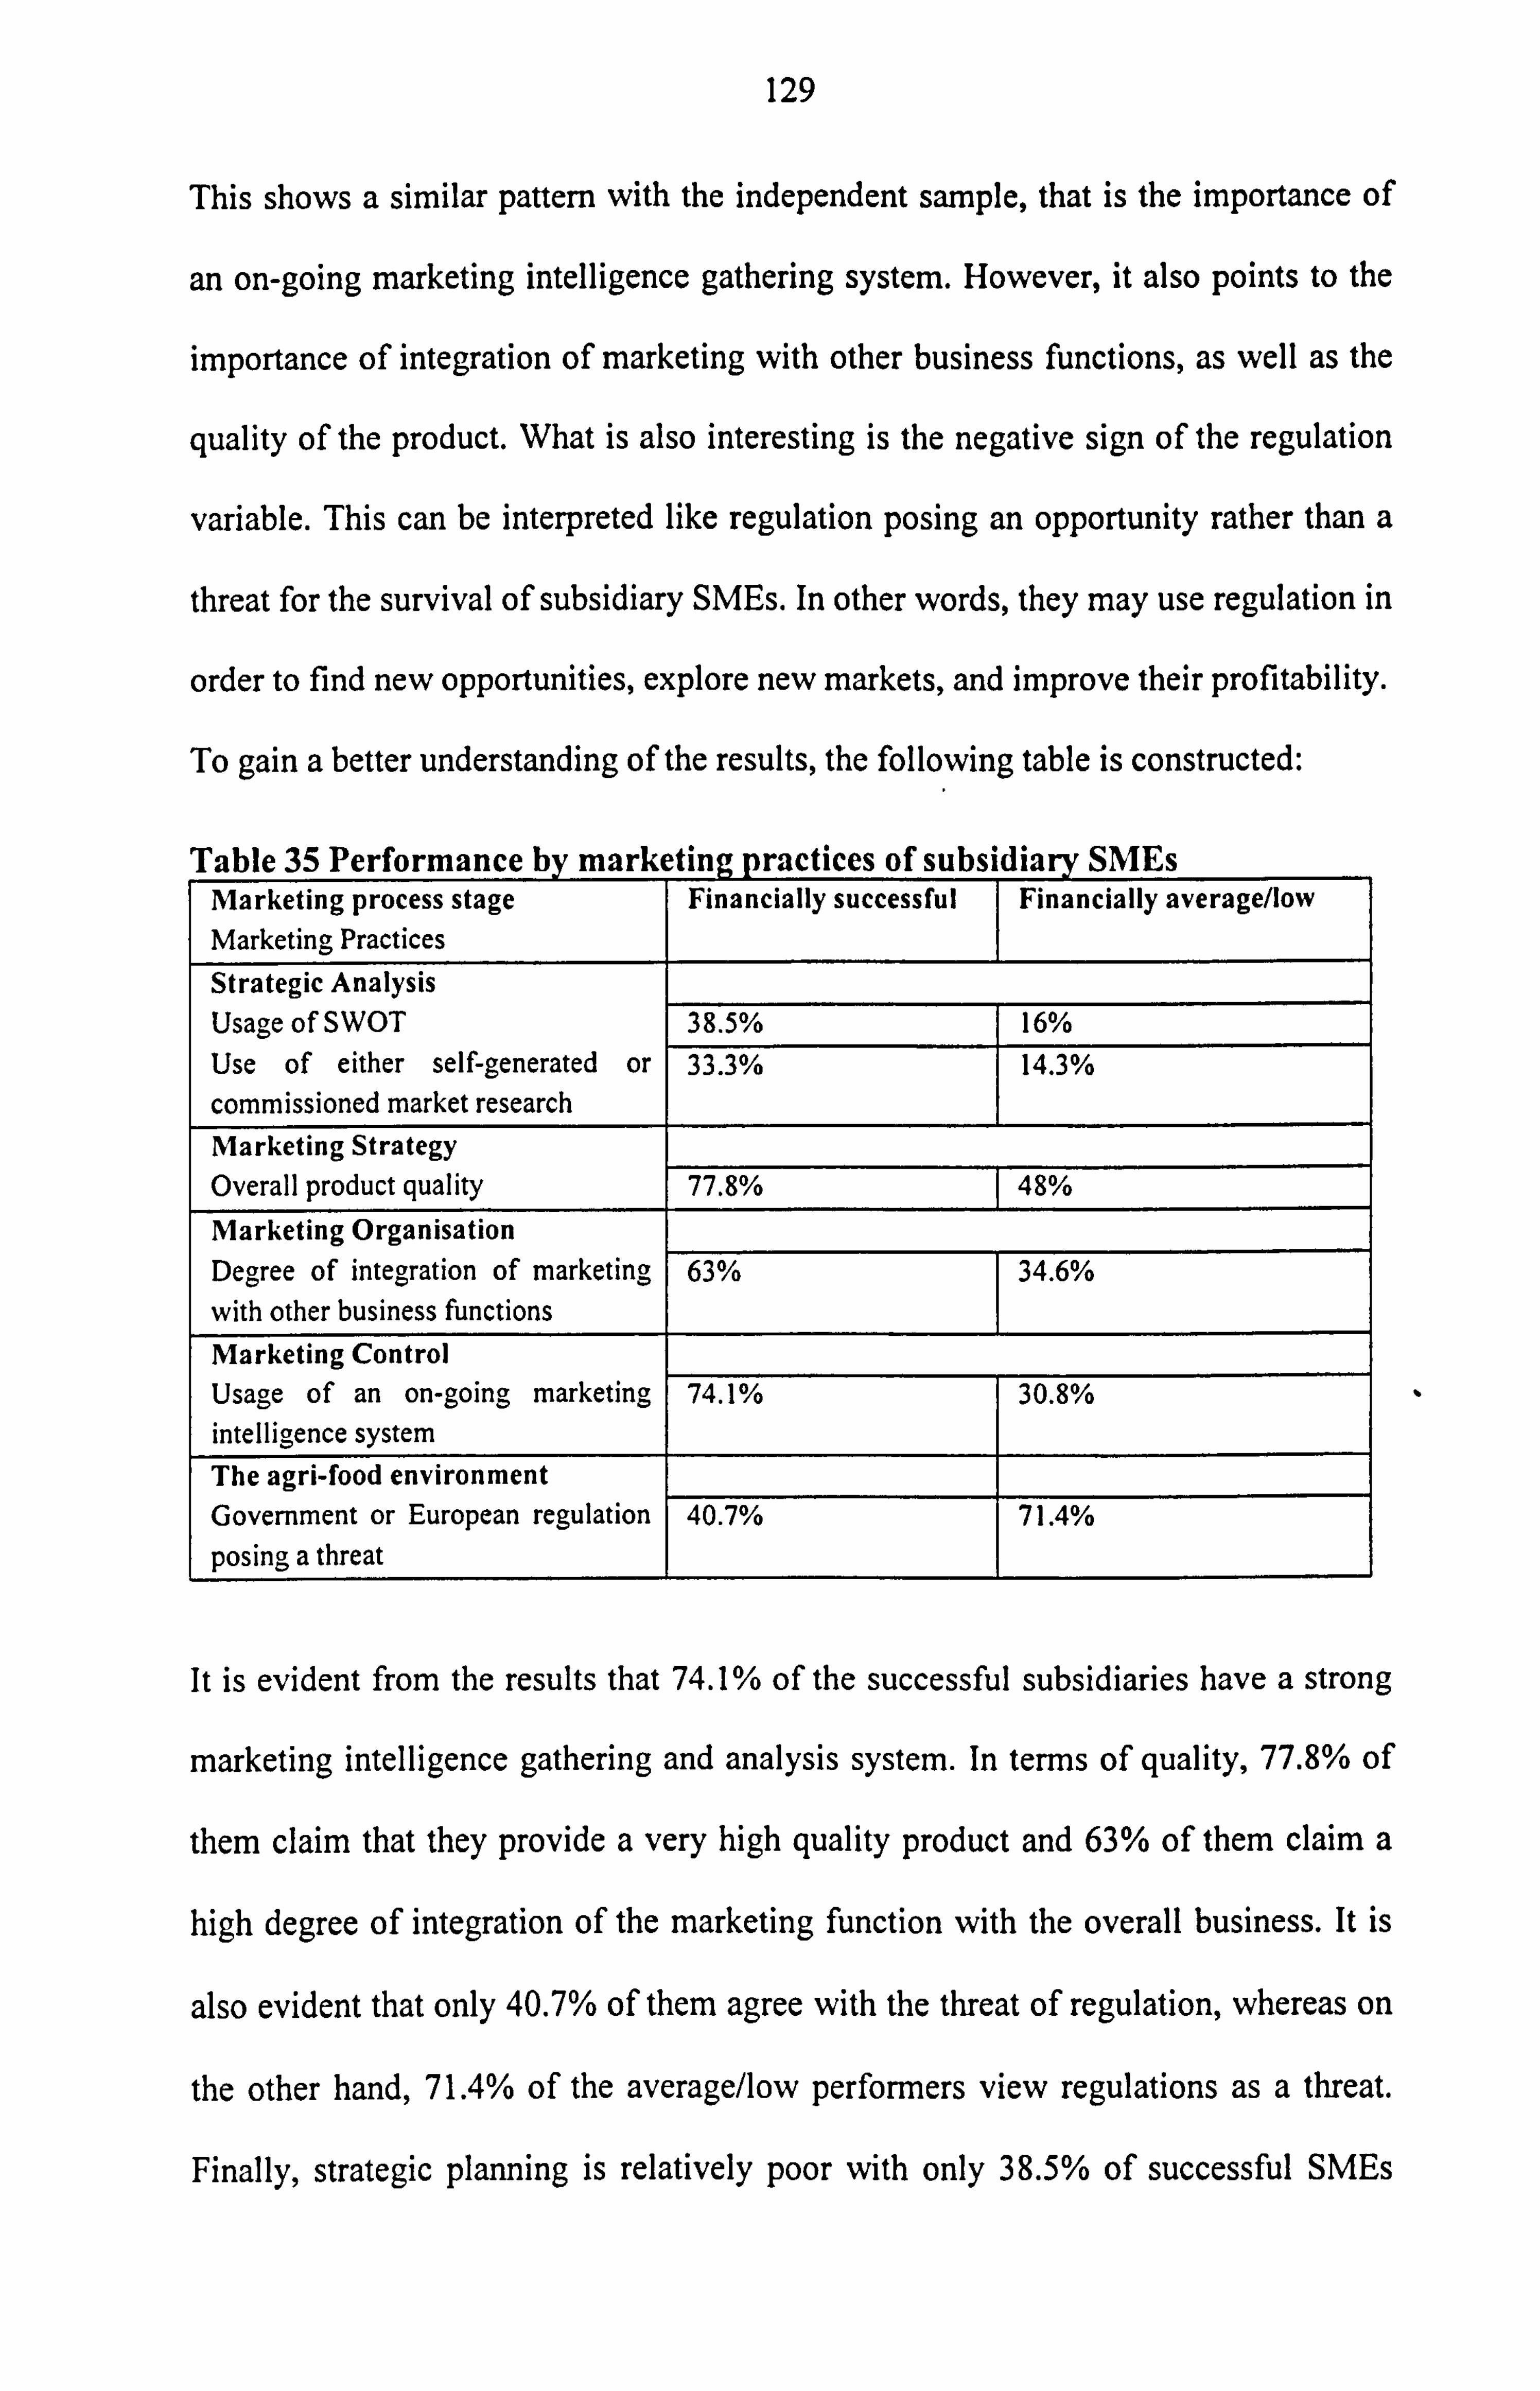
129
This shows a similar pattern with the independent sample, that is the importance of
an on-going marketing intelligence gathering system. However, it also points to the
importance of integration of marketing with other business functions, as well as the
quality of the product. What is also interesting is the negative sign of the regulation
variable. This can be interpreted like regulation posing an opportunity rather than a
threat for the survival of subsidiary SMEs. In other words, they may use regulation in
order to find new opportunities, explore new markets, and improve their profitability.
To gain a better understanding of the results, the following table is constructed:
Table 35 Performance by marketinif nractices of subsidiary SMEs Marketing process stage Marketing Practices
Financially successful Financially average/low
Strategic Analysis Usage of SWOT 38.5% 16% Use of either self-generated or commissioned market research
33.3% 14.3%
Marketing Strategy
Overall product quality 77.8% 48% Marketing Organisation Degree of integration of marketing with other business functions
63% 7 34.6%
Marketing Control Usage of an on-going marketing intelligence system
74.1% 30.8%
The agri-food environment Government or European regulation posing a threat
40.7% 71.4%
It is evident from the results that 74.1% of the successful subsidiaries have a strong
marketing intelligence gathering and analysis system. In terms of quality, 77.8% of
them claim that they provide a very high quality product and 63% of them claim a
high degree of integration of the marketing function with the overall business. It is
also evident that only 40.7% of them agree with the threat of regulation, whereas on
the other hand, 71.4% of the average/low performers view regulations as a threat.
Finally, strategic planning is relatively poor with only 38.5% of successful SMEs

130
using SWOT regularly and 33.3% of them using market research regularly. This may
be attributed to the fact that market research is usually bought from external
agencies, whereas SWOT analysis may be heavily dependent upon the holding
companies strategies.
The average/low performers on the other hand can be characterised with limited
expertise on strategic planning tools (only 16% use SWOT and 14.3% of them use
any form of market research). Their product quality is relatively high with 48%
claiming high levels, but still nowhere near the 77.8% of the successful companies.
About 34.8% of them claim some degree of integration of marketing with other
functions, whereas only 30.8% of them have a system of marketing intelligence
information and analysis. The latter is supposed to be the most significant factor for
high performance, and is inevitably lacking from the low performers.
Implications for the subsidiary SMEs
From the above results we can characterise high performers as competent marketing
managers with solid organisational and control skills, whereas the low performers
may be weak in management, with very limited use of strategic analysis. Another
distinct difference between successful and average/low subsidiary performers is the
role of regulation. Successful subsidiaries view regulation as an opportunity to
improve their financial position, whereas average/low subsidiaries view it
predominantly as a threat for their survival.
An important similarity with the independent SMEs is the high importance of
marketing intelligence gathering system for their success. What would be therefore
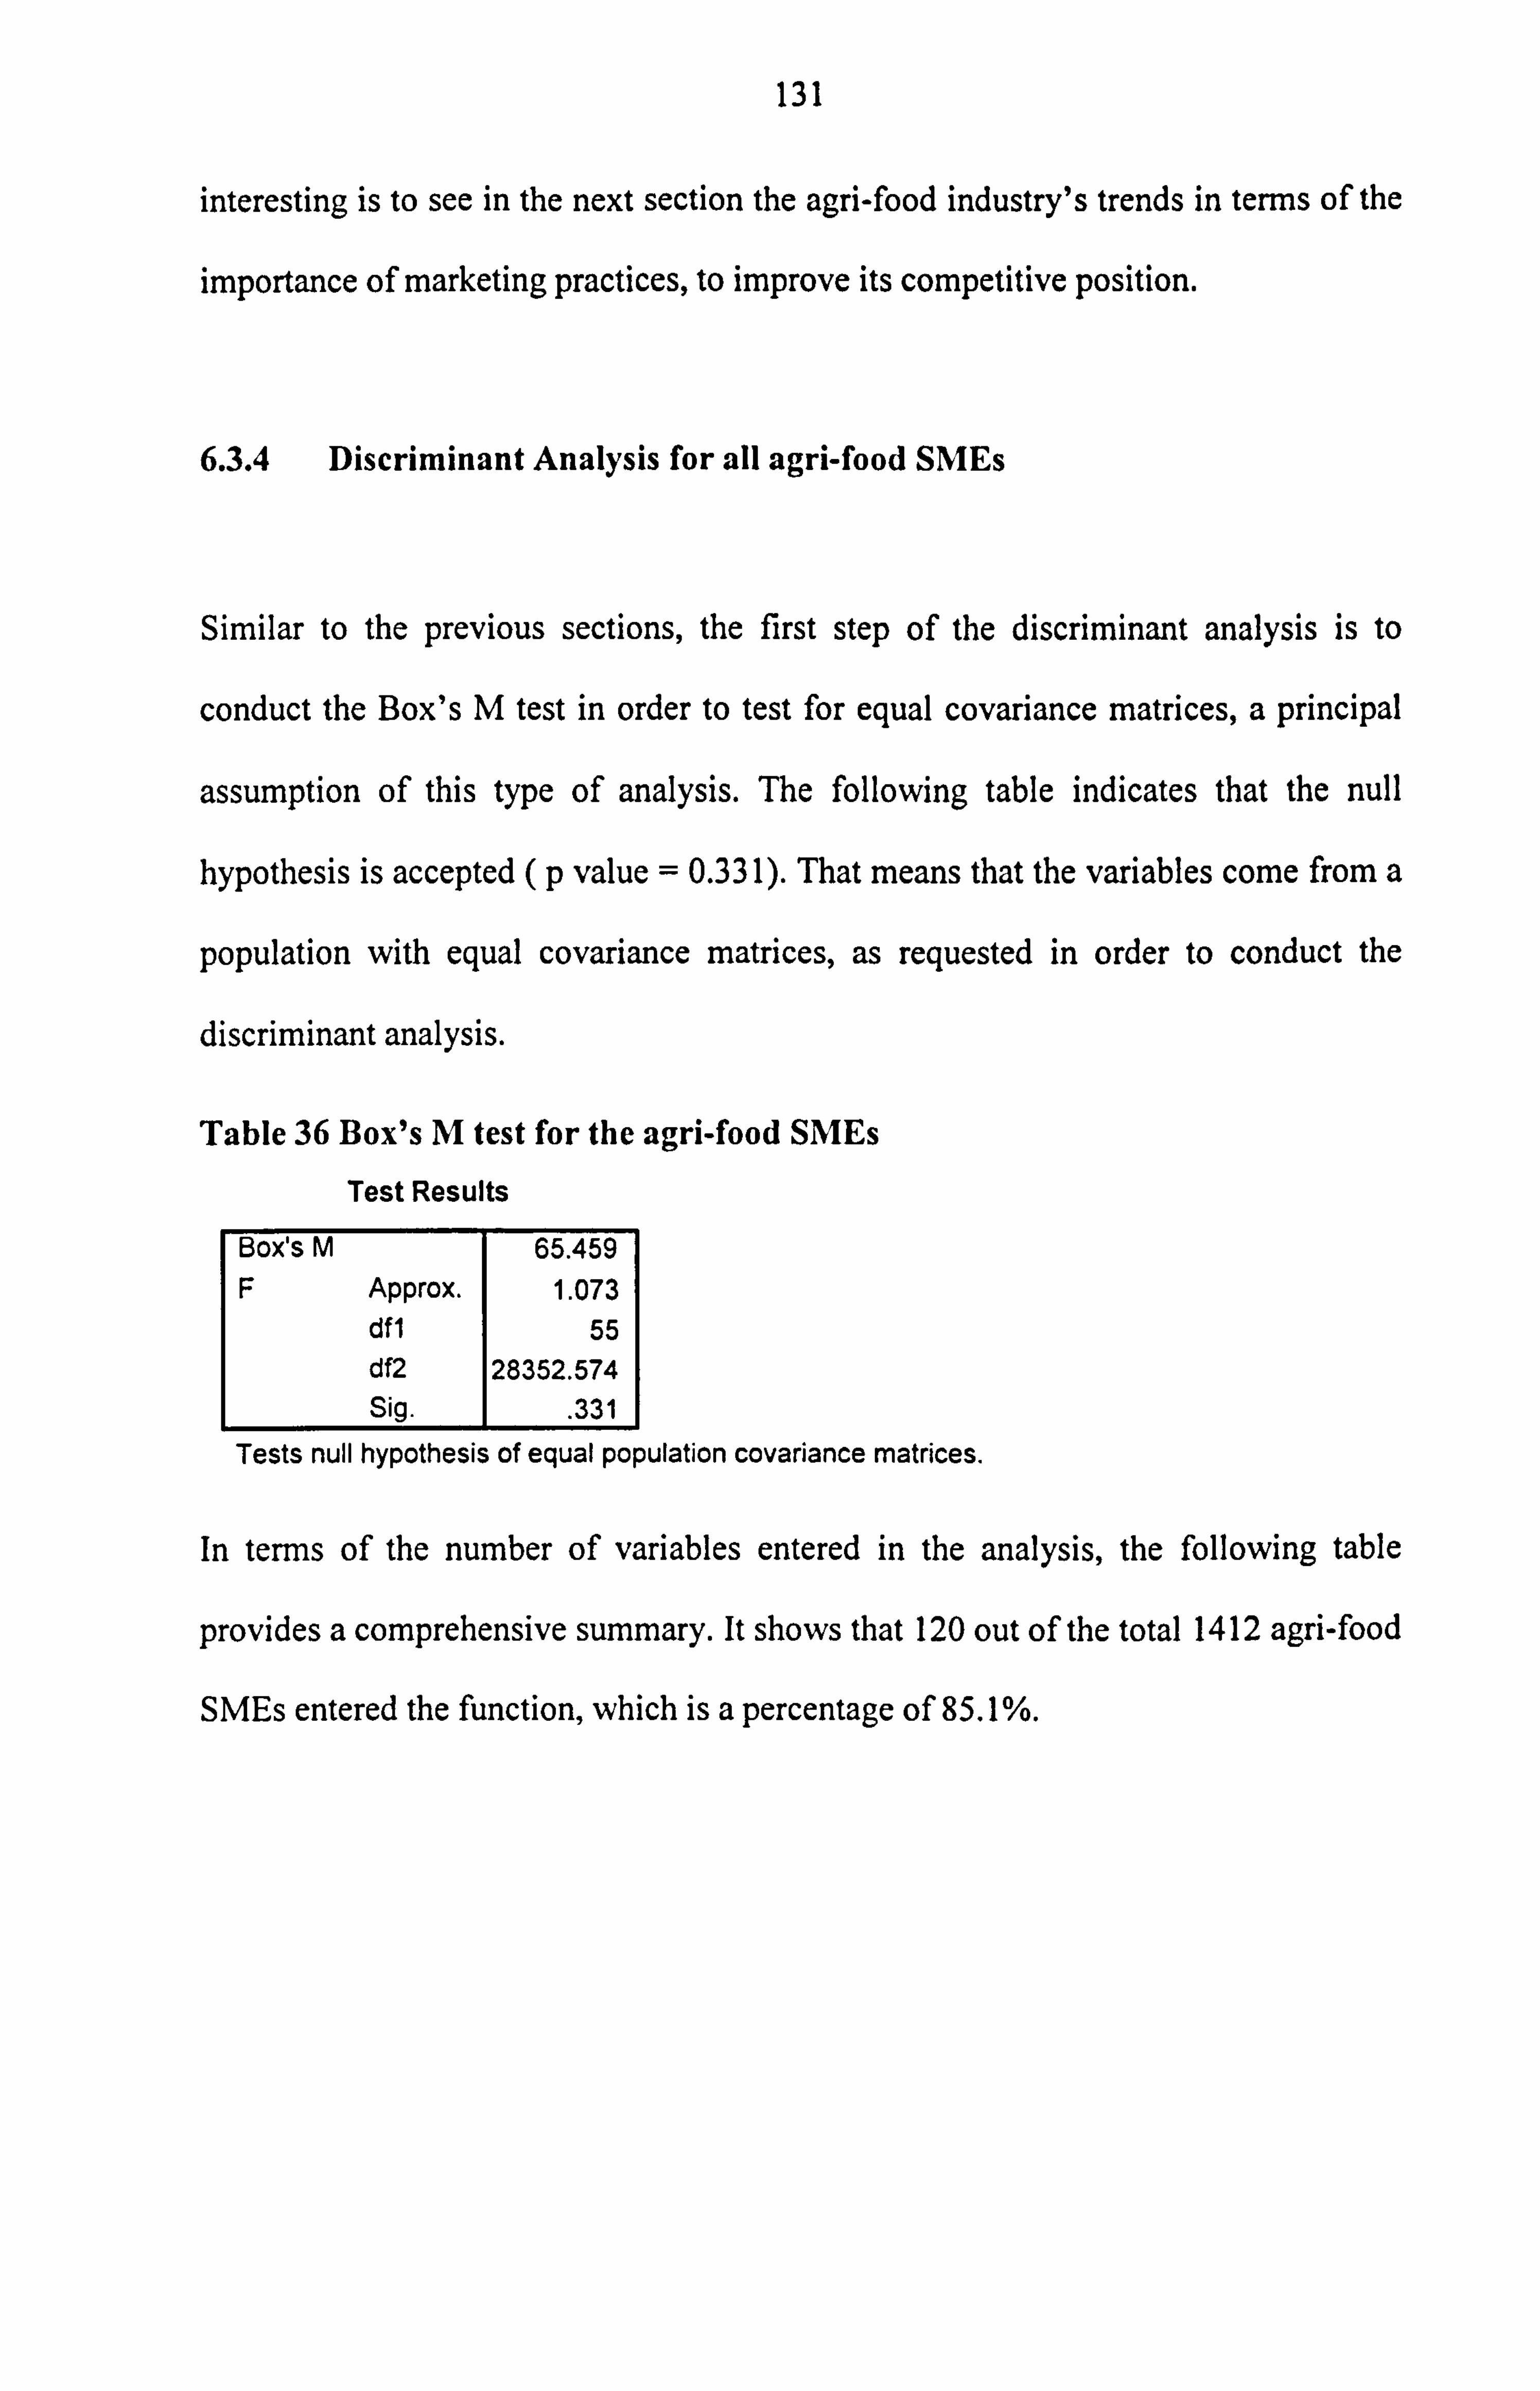
131
interesting is to see in the next section the agri-food industry's trends in terms of the
importance of marketing practices, to improve its competitive position.
6.3.4 Discriminant Analysis for all agri-food SMEs
Similar to the previous sections, the first step of the discriminant analysis is to
conduct the Box's M test in order to test for equal covariance matrices, a principal
assumption of this type of analysis. The following table indicates that the null
hypothesis is accepted (p value = 0.33 1). That means that the variables come from a
population with equal covariance matrices, as requested in order to conduct the
discriminant analysis.
Table 36 Box's M test for the agri-food SMEs
Test Results
Box's M 65.459 F Approx. 1.073
dfl 55 df2 28352.574 Sig.
. 331 Tests null hypothesis of equal population covariance matrices.
In terms of the number of variables entered in the analysis, the following table
provides a comprehensive summary. It shows that 120 out of the total 1412 agri-food
SMEs entered the function, which is a percentage of 85.1%.
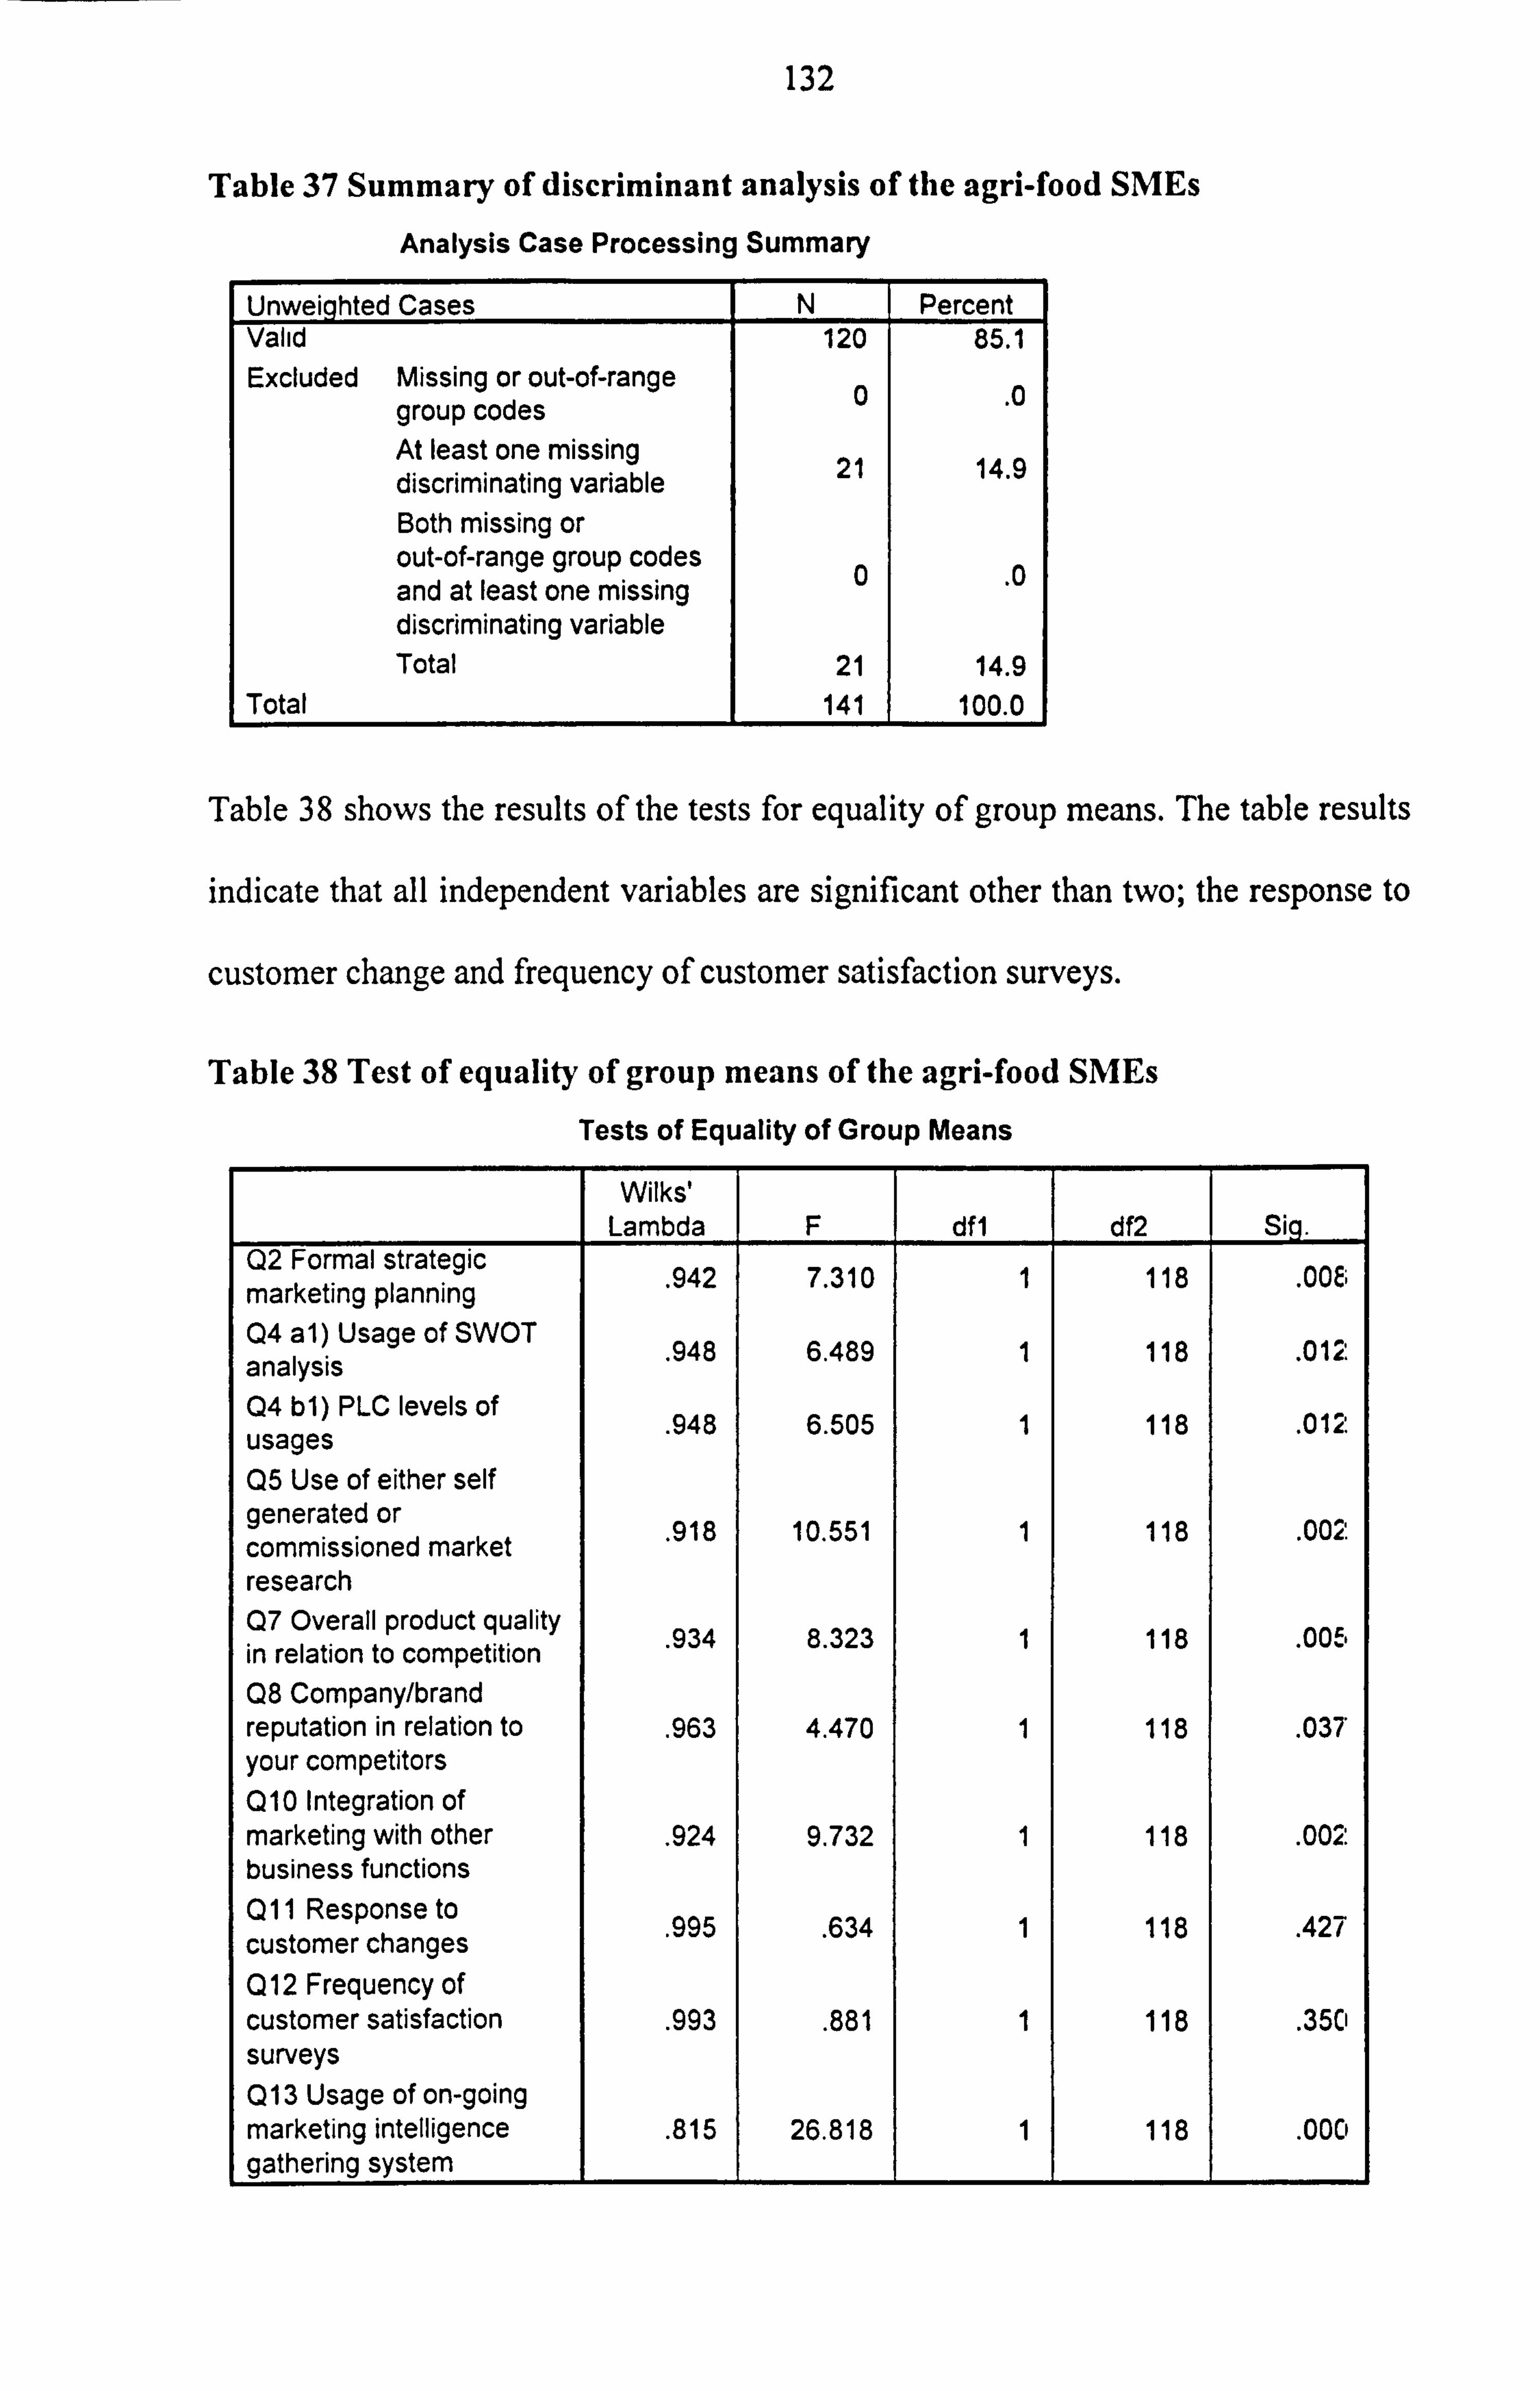
132
Table 37 Summary of discriminant analysis of the agri-food SMEs
Analysis Case Processing Summary
Unweighted Cases N Percent Valid 120 85.1 Excluded Missing or out-of-range
group codes 0 .0
At least one missing discriminating variable
21 14.9
Both missing or out-of-range group codes and at least one missing
0 .0 discriminating variable Total 21 14.9
Total 141 100.0
Table 38 shows the results of the tests for equality of group means. The table results
indicate that all independent variables are significant other than two; the response to
customer change and frequency of customer satisfaction surveys.
Table 38 Test of equality of group means of the agri-food SMEs
Tests of Equality of Group Means
Wilks' Lambda F dfl df2 Si q.
Q2 Formal strategic 942 7 310 1 118 008 marketing planning . . . Q4 al) Usage of SWOT analysis . 948 6.489 1 118 . 012:
Q4 b1) PLC levels of . 948 6.505 1 118 . 012
usages Q5 Use of either self generated or 918 551 10 1 118 . 00ý: commissioned market . . research Q7 Overall product quality in relation to competition . 934 8.323 1 118 . 005 . Q8 Company/brand reputation in relation to . 963 4.470 1 118 . 037' your competitors Q10 Integration of marketing with other . 924 9.732 1 118 . 002: business functions Q11 Response to customer changes . 995 . 634 1 118 . 427
Q12 Frequency of customer satisfaction . 993
. 881 1 118 . 350
surveys Q13 Usage of on-going marketing intelligence . 815 26.818 1 118 . 000 gathering system
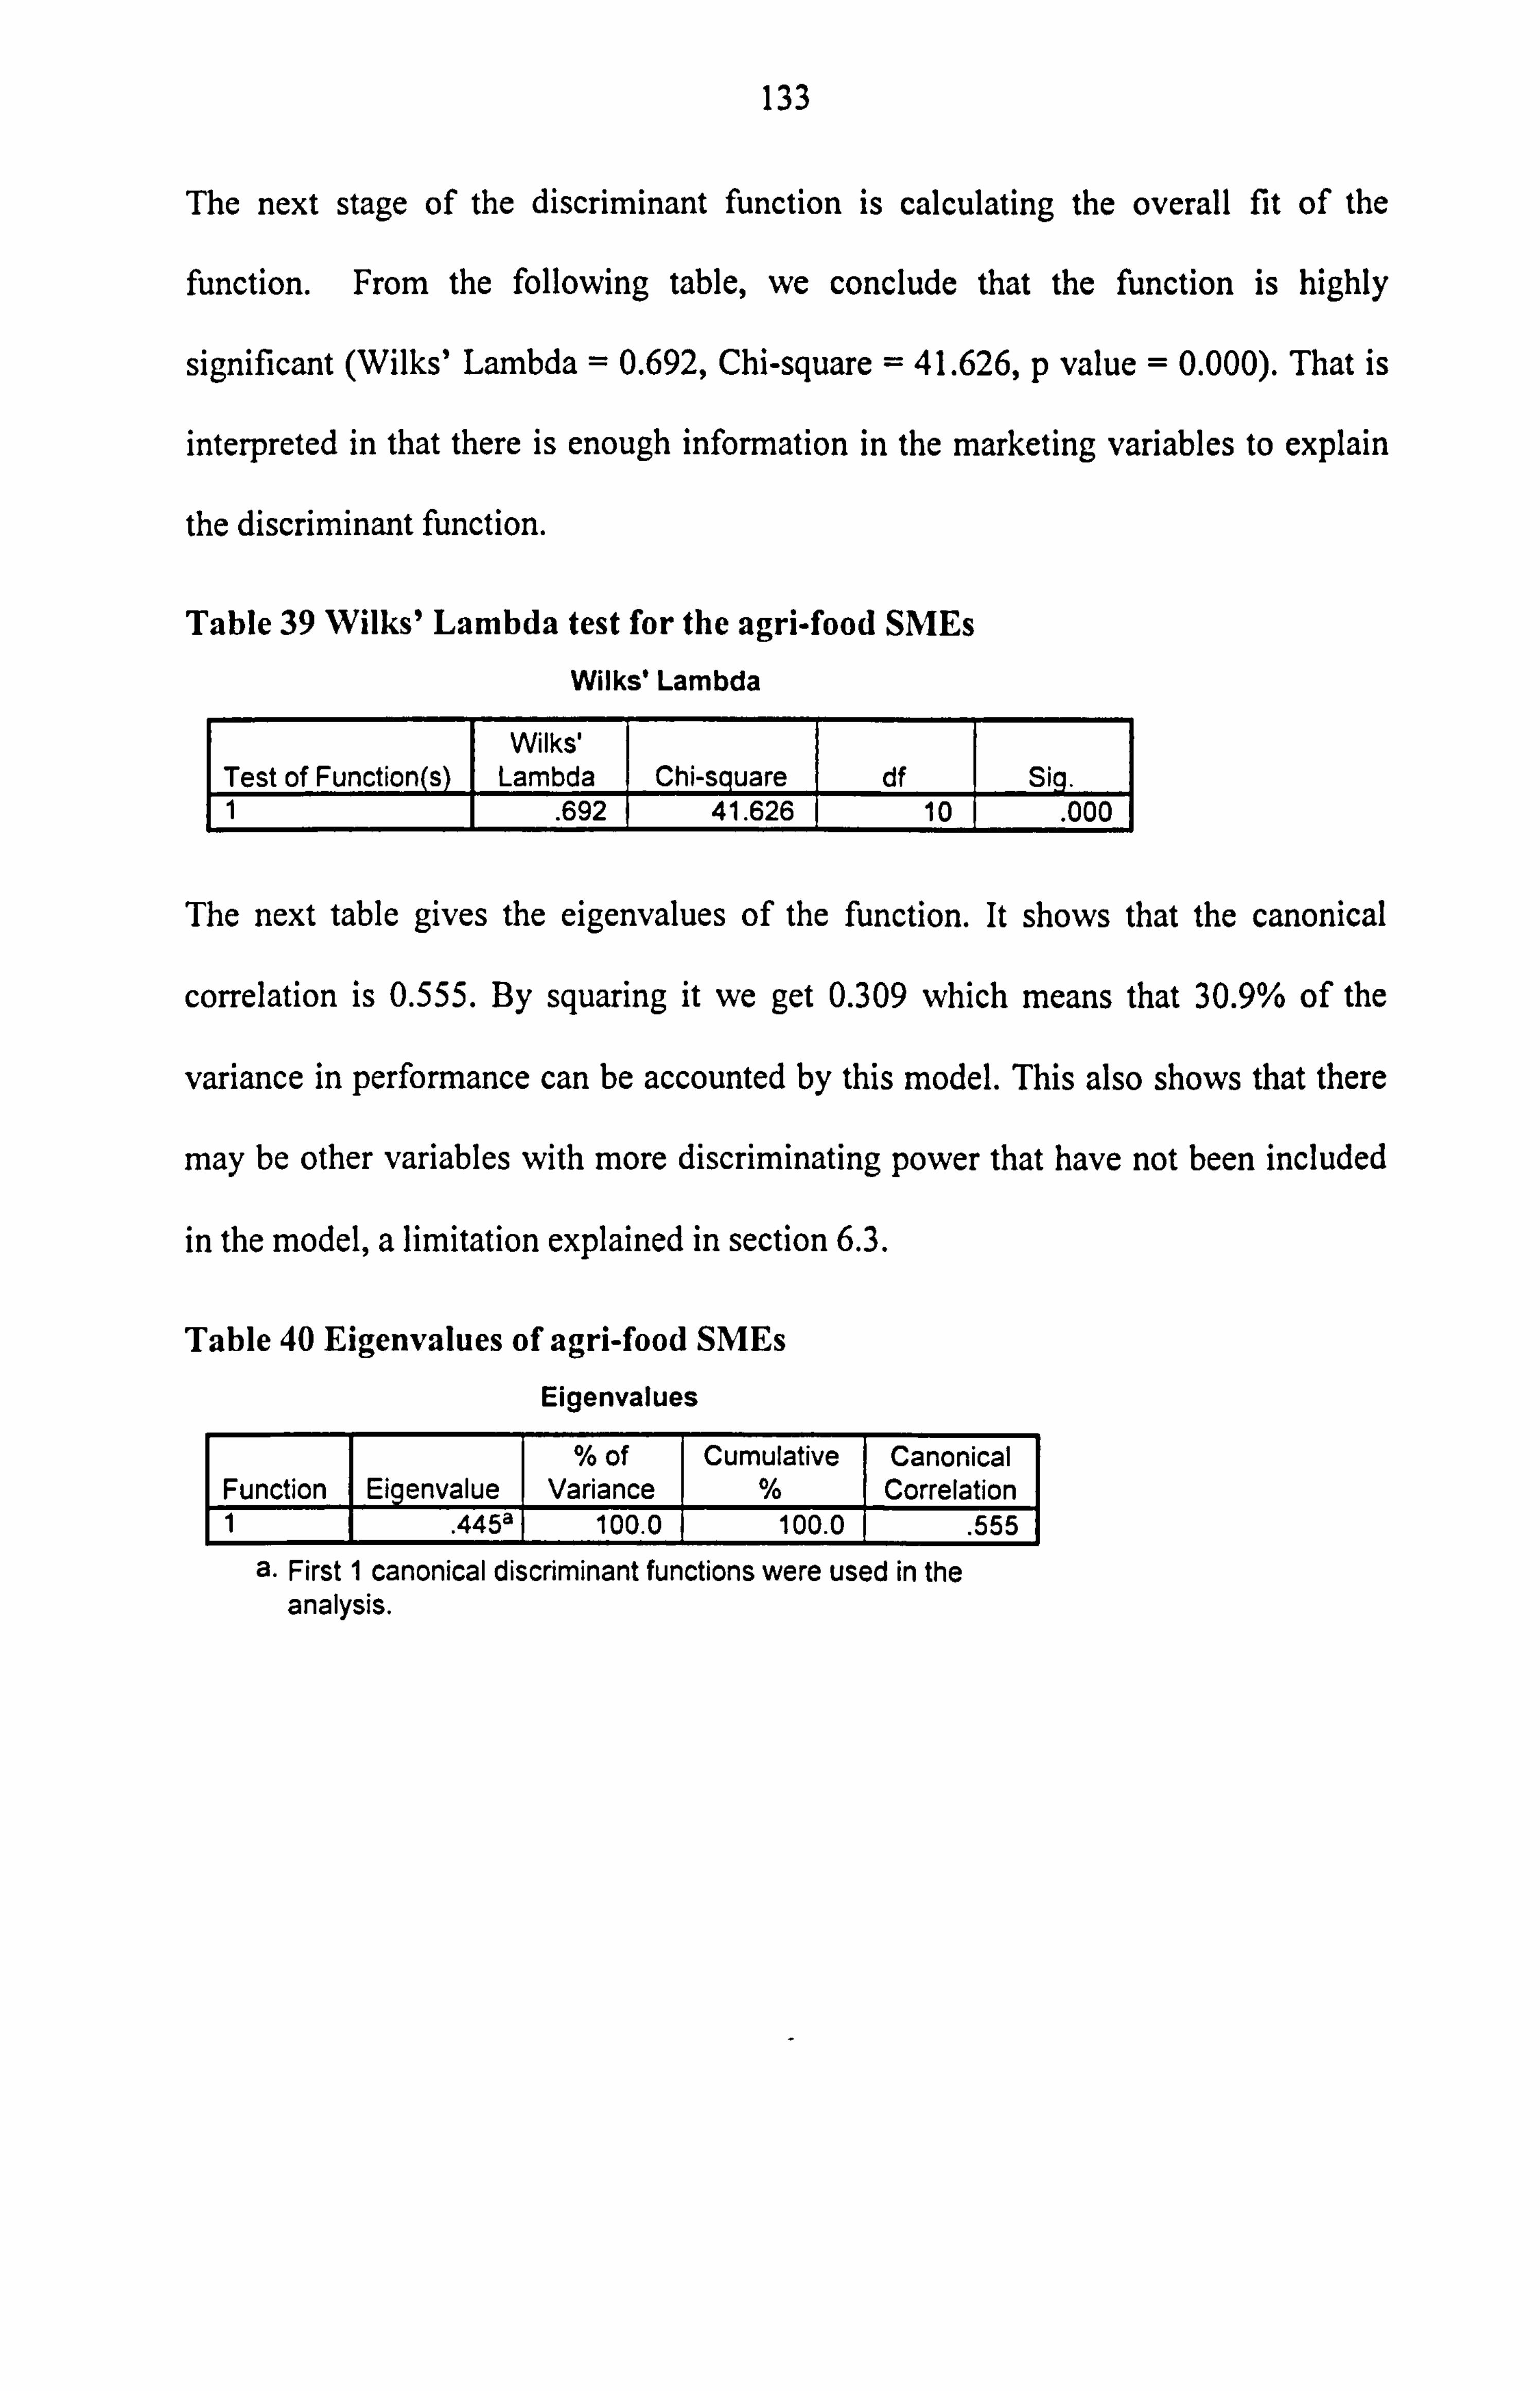
133
The next stage of the discriminant function is calculating the overall fit of the
function. From the following table, we conclude that the function is highly
significant (Wilks' Lambda = 0.692, Chi-square = 41.626, p value = 0.000). That is
interpreted in that there is enough information in the marketing variables to explain
the discriminant function.
Table 39 Wilks' Lambda test for the agri-food SMEs
Wilks' Lambda
Test of Function(s) Wilks'
Lambda Chi-square df Si q. 1
. 692 41.626 10
. 000
The next table gives the eigenvalues of the function. It shows that the canonical
correlation is 0.555. By squaring it we get 0.309 which means that 30.9% of the
variance in performance can be accounted by this model. This also shows that there
may be other variables with more discriminating power that have not been included
in the model, a limitation explained in section 6.3.
Table 40 Eigenvalues of agri-food SMEs
Eigenvalues
Function Eigenvalue % of
Variance Cumulative
% Canonical Correlation
1 . 445a 100.0 100.0
. 555
a. First 1 canonical discriminant functions were used in the analysis.
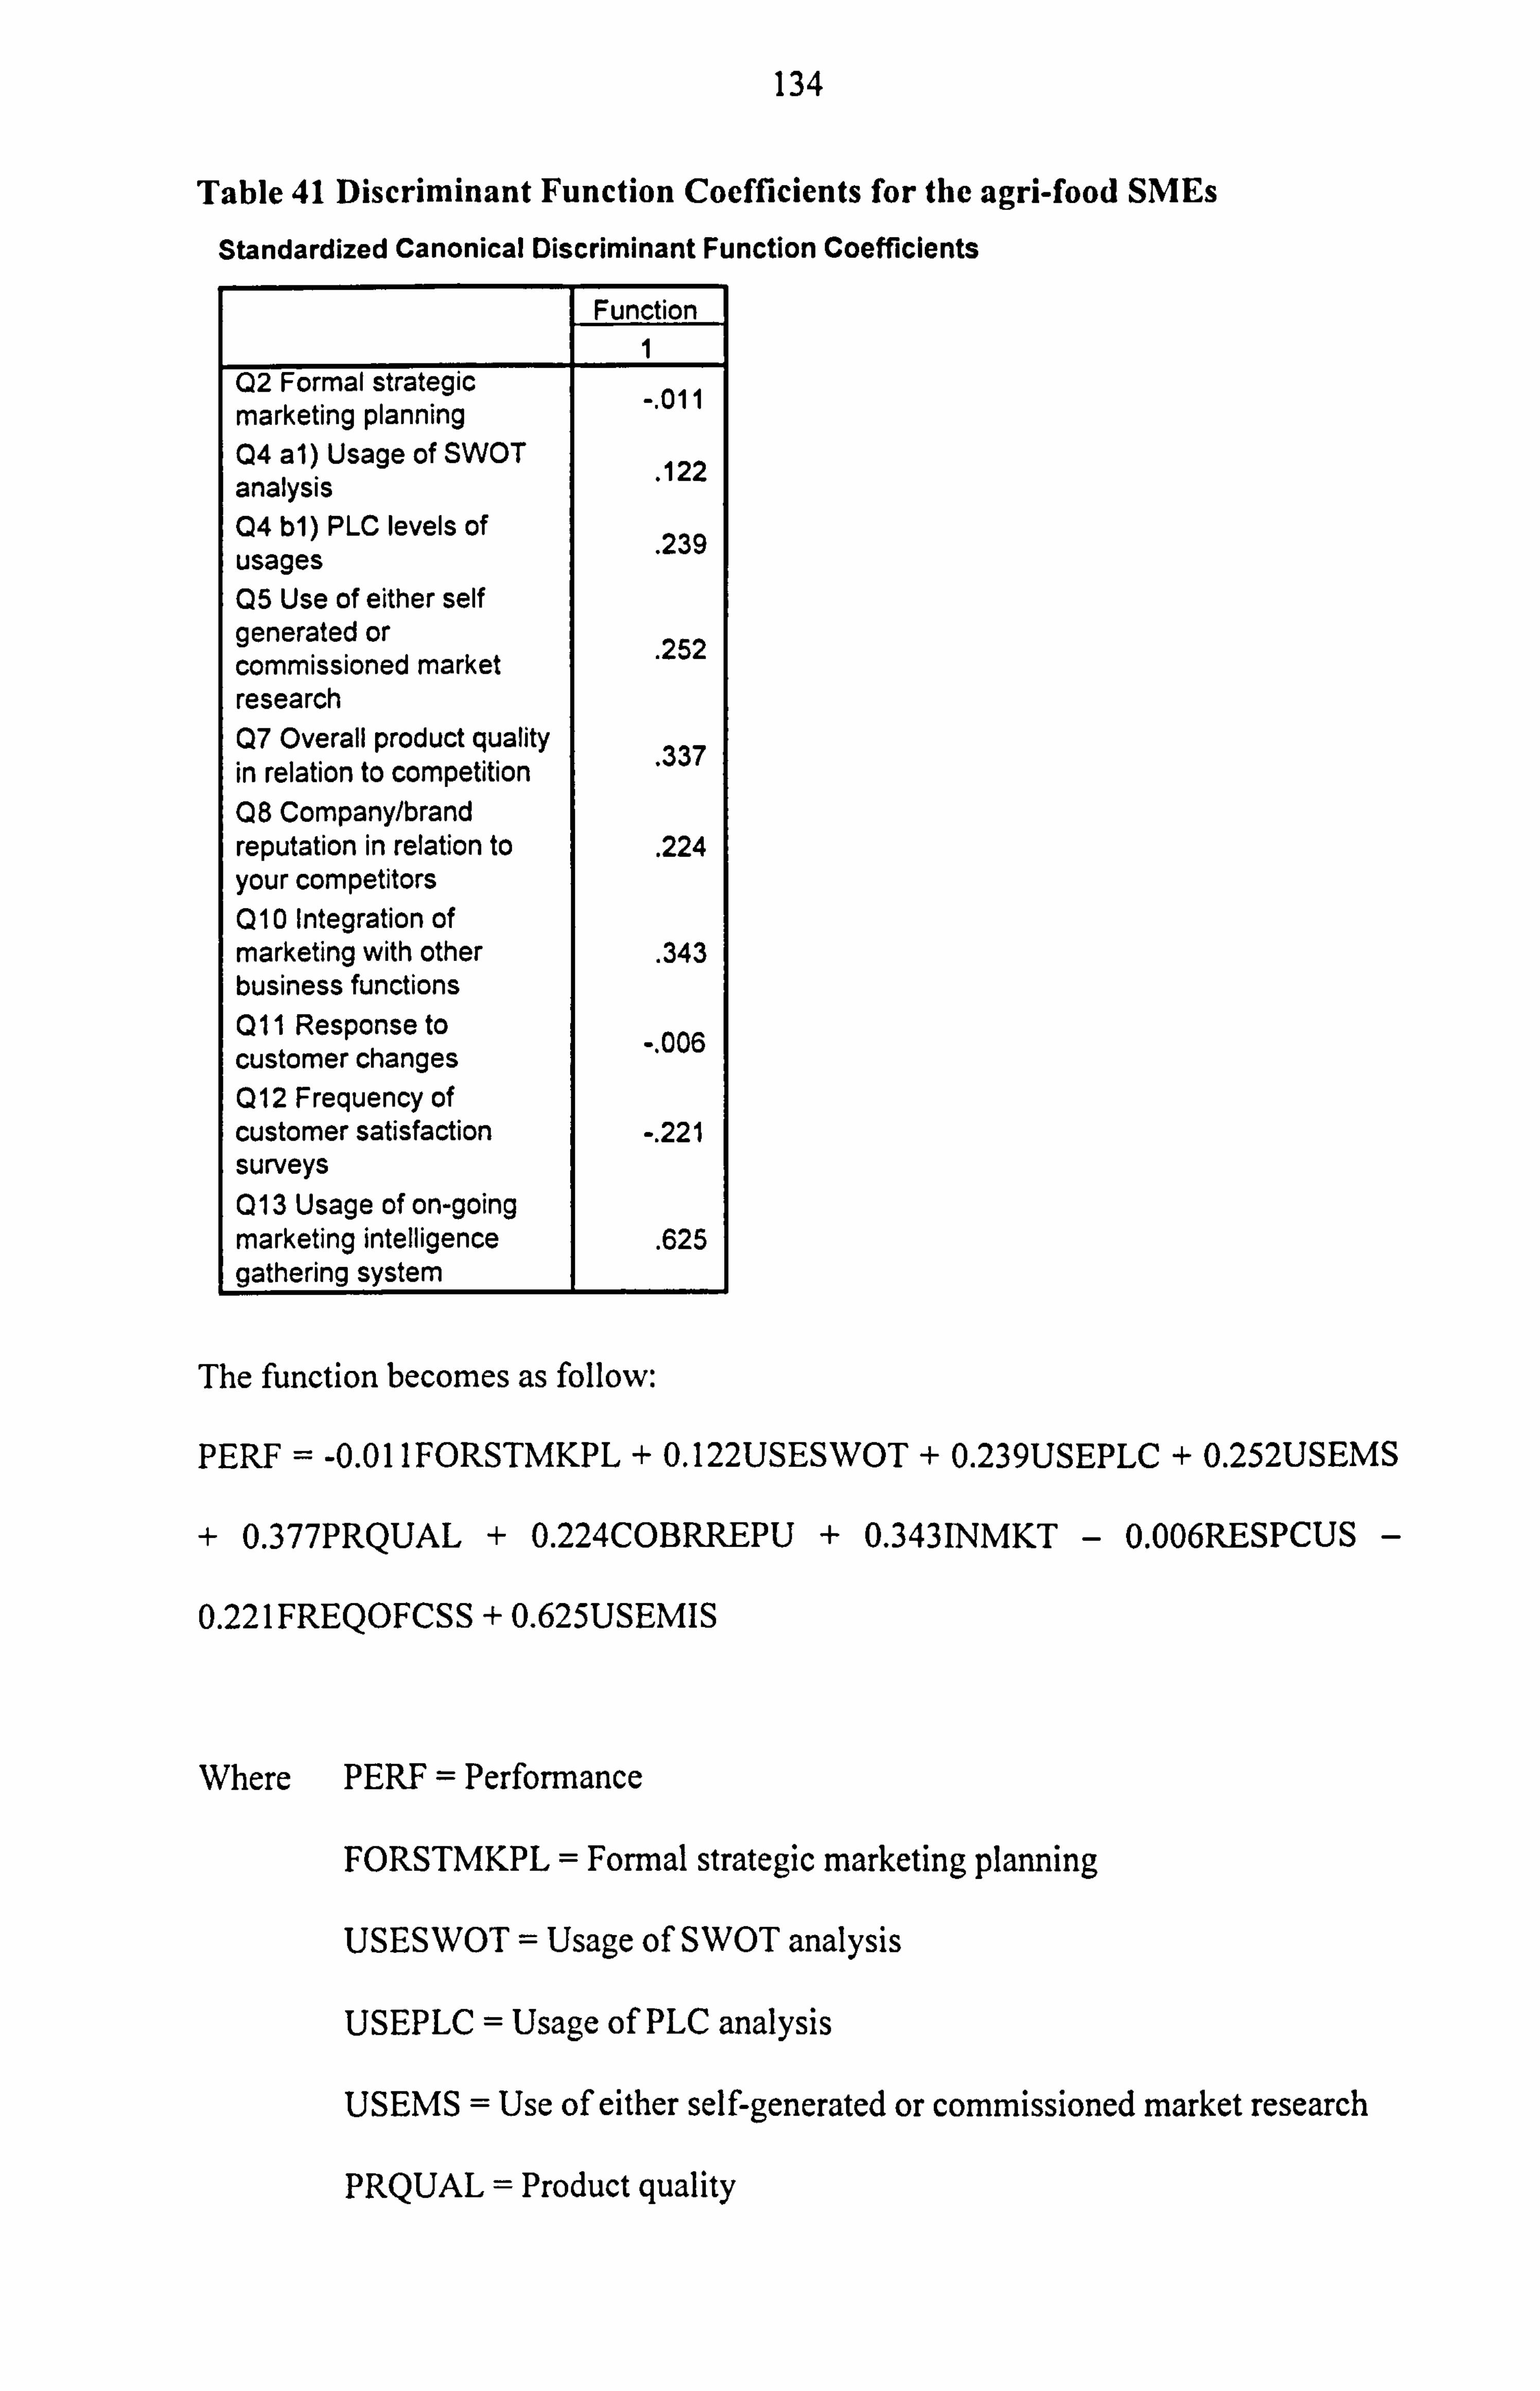
134
Table 41 Discriminant Function Coefficients for the agri-food SMEs
Standardized Canonical Discriminant Function Coefficients
Function
Q2 Formal strategic - 011
marketing planning ,
Q4 al) Usage of SWOT 122
analysis Q4 b1) PLC levels of 239 usages Q5 Use of either self generated or 252 commissioned market research Q7 Overall product quality 337 in relation to competition . Q8 Company/brand reputation in relation to . 224 your competitors Q10 Integration of marketing with other . 343 business functions Q11 Response to
-. 006 customer changes Q12 Frequency of customer satisfaction -. 221 surveys 013 Usage of on-going marketing intelligence
. 625 gathering system
The function becomes as follow:
PERF = -0.011FORSTMKPL + 0.122USESWOT + 0.239USEPLC + 0.252USEMS
+ 0.377PRQUAL + 0.224COBRREPU + 0.343INMKT - 0.006RESPCUS -
0.221FREQOFCSS + 0.625USEMIS
Where PERF = Performance
FORSTMKPL = Formal strategic marketing planning
USESWOT = Usage of SWOT analysis
USEPLC = Usage of PLC analysis
USEMS = Use of either self-generated or commissioned market research
PRQUAL = Product quality
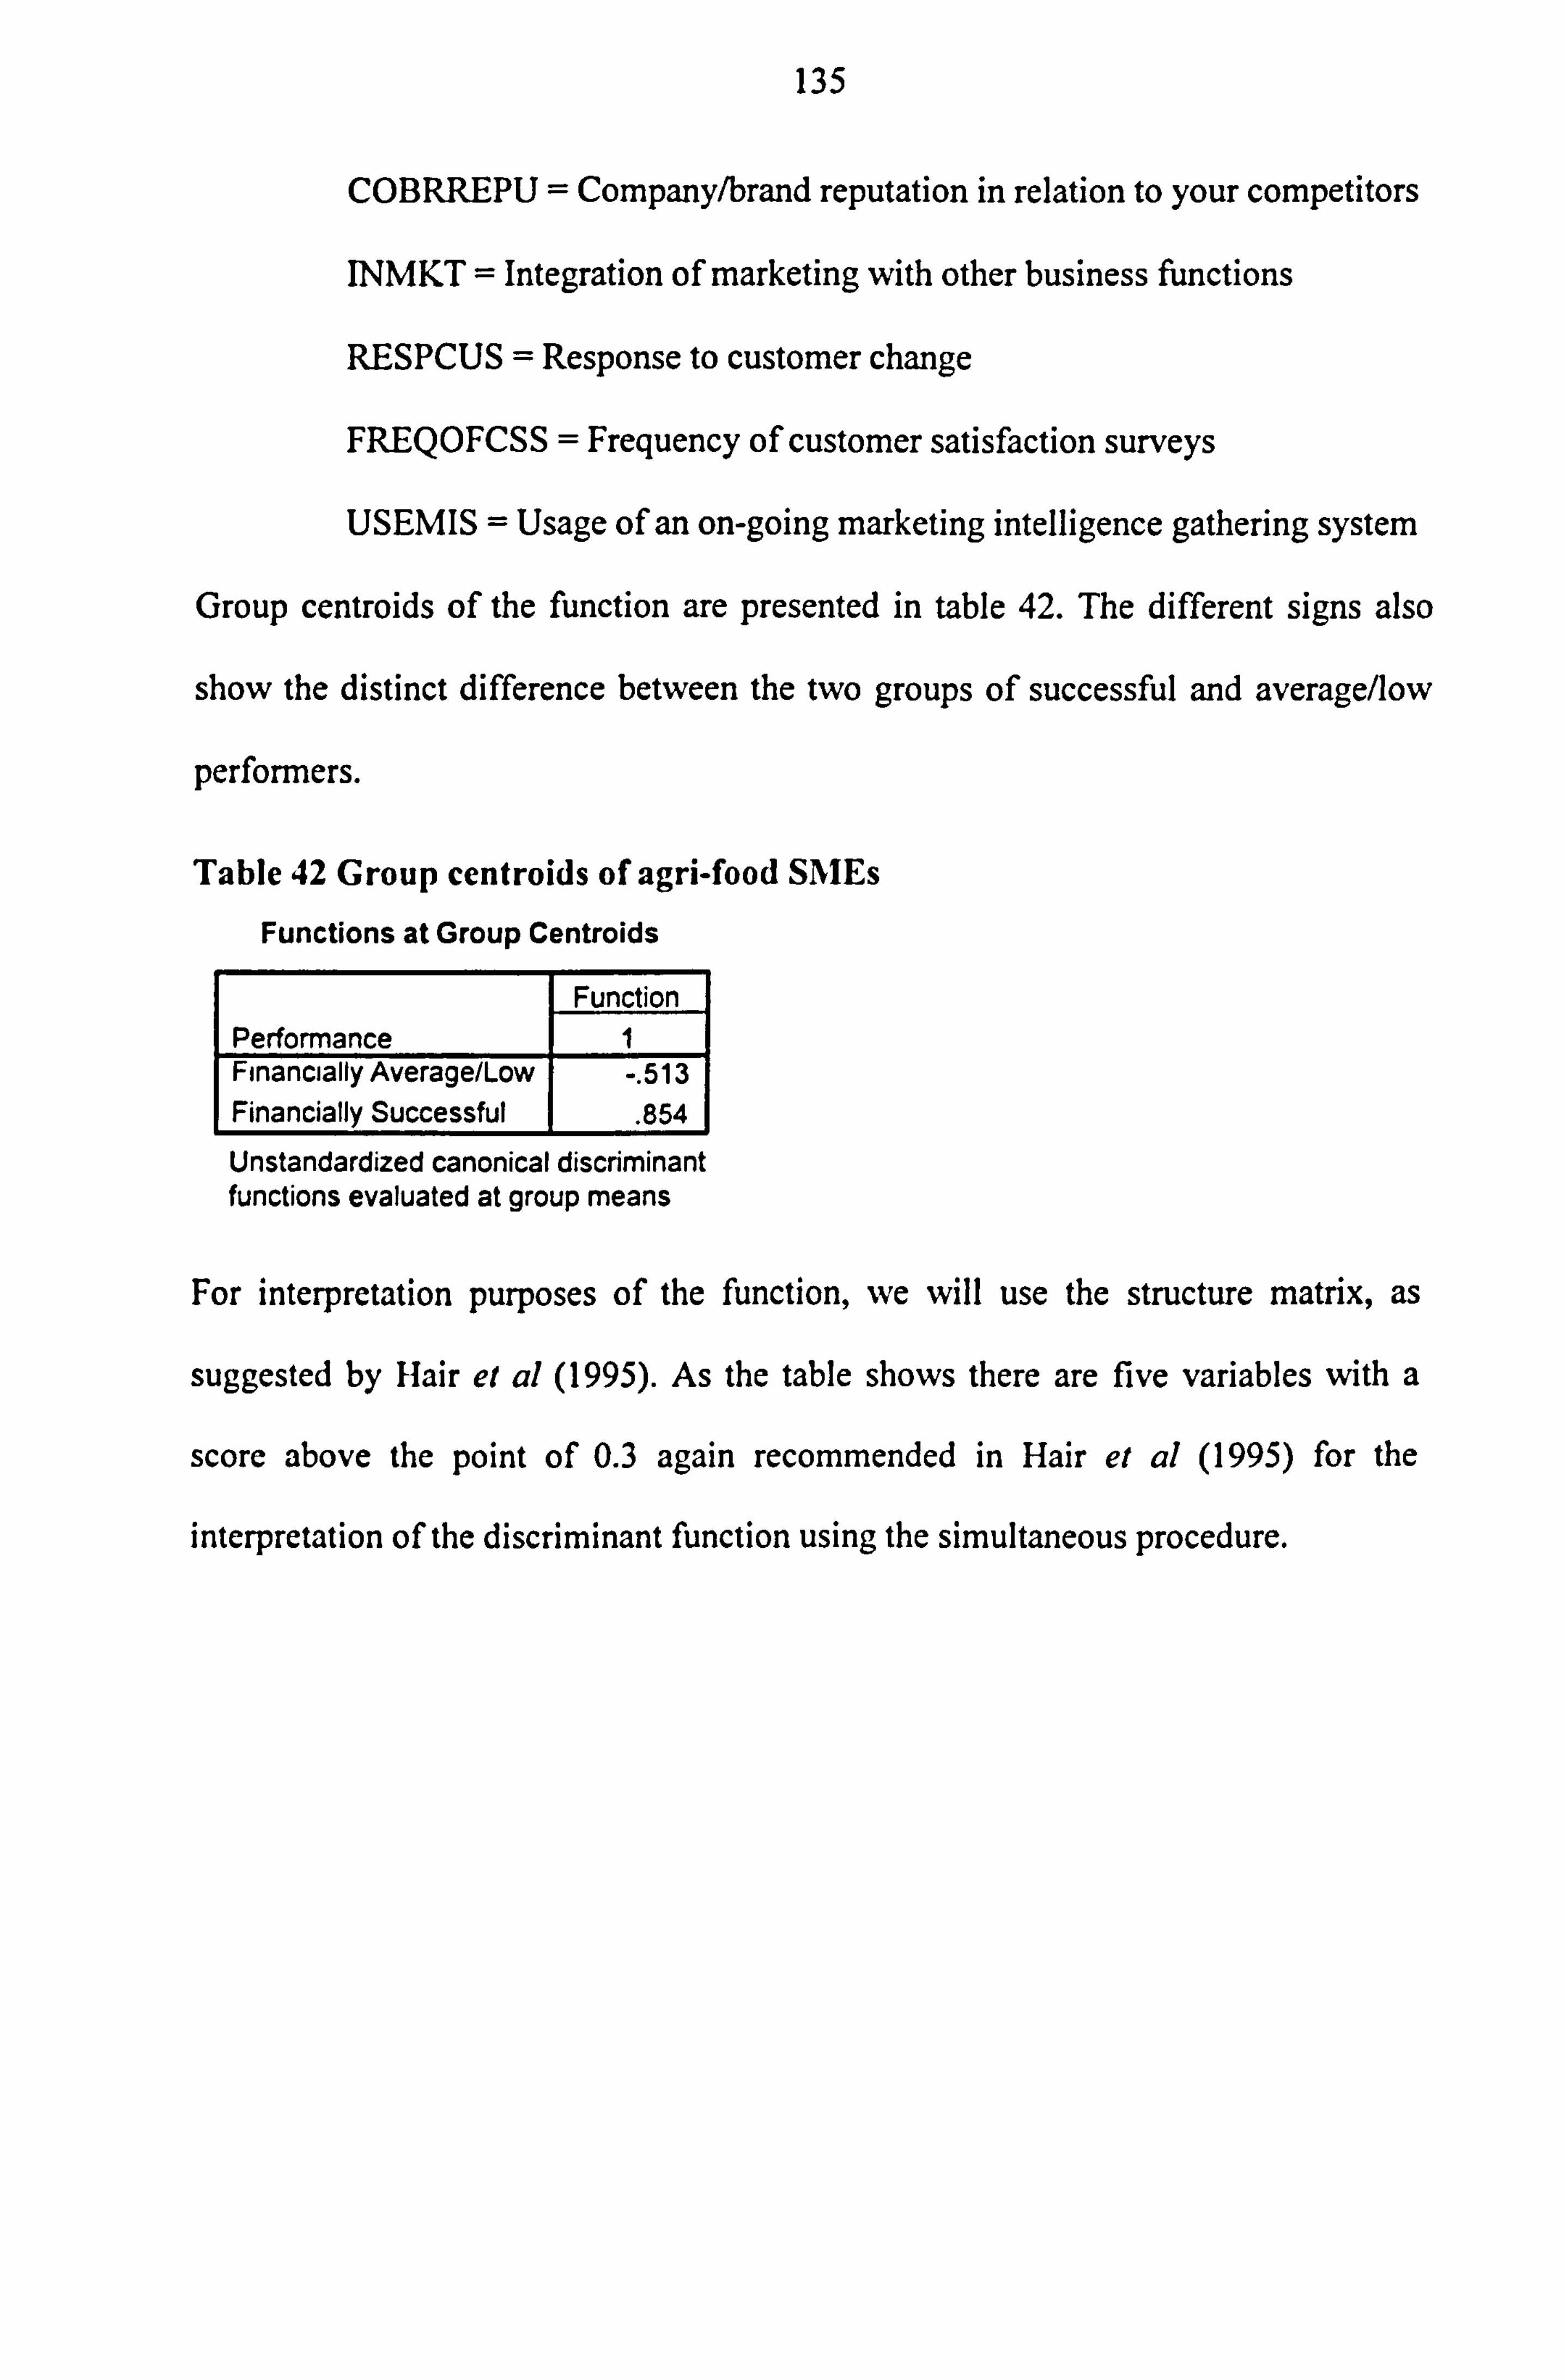
135
COBRREPU = Company/brand reputation in relation to your competitors
INMKT = Integration of marketing with other business functions
RESPCUS = Response to customer change
FREQOFCSS = Frequency of customer satisfaction surveys
USEMIS = Usage of an on-going marketing intelligence gathering system
Group centroids of the function are presented in table 42. The different signs also
show the distinct difference between the two groups of successful and average/low
performers.
Table 42 Group centroids of agri-food S1 IEs
Functions at Group Centroids
Function Performance 1 Financially Average/Low Financially Successful
-. 513
. 854
Unstandardized canonical discriminant functions evaluated at group means
For interpretation purposes of the function, we will use the structure matrix, as
suggested by Hair et al (1995). As the table shows there are five variables with a
score above the point of 0.3 again recommended in Hair et al (1995) for the
interpretation of the discriminant function using the simultaneous procedure.
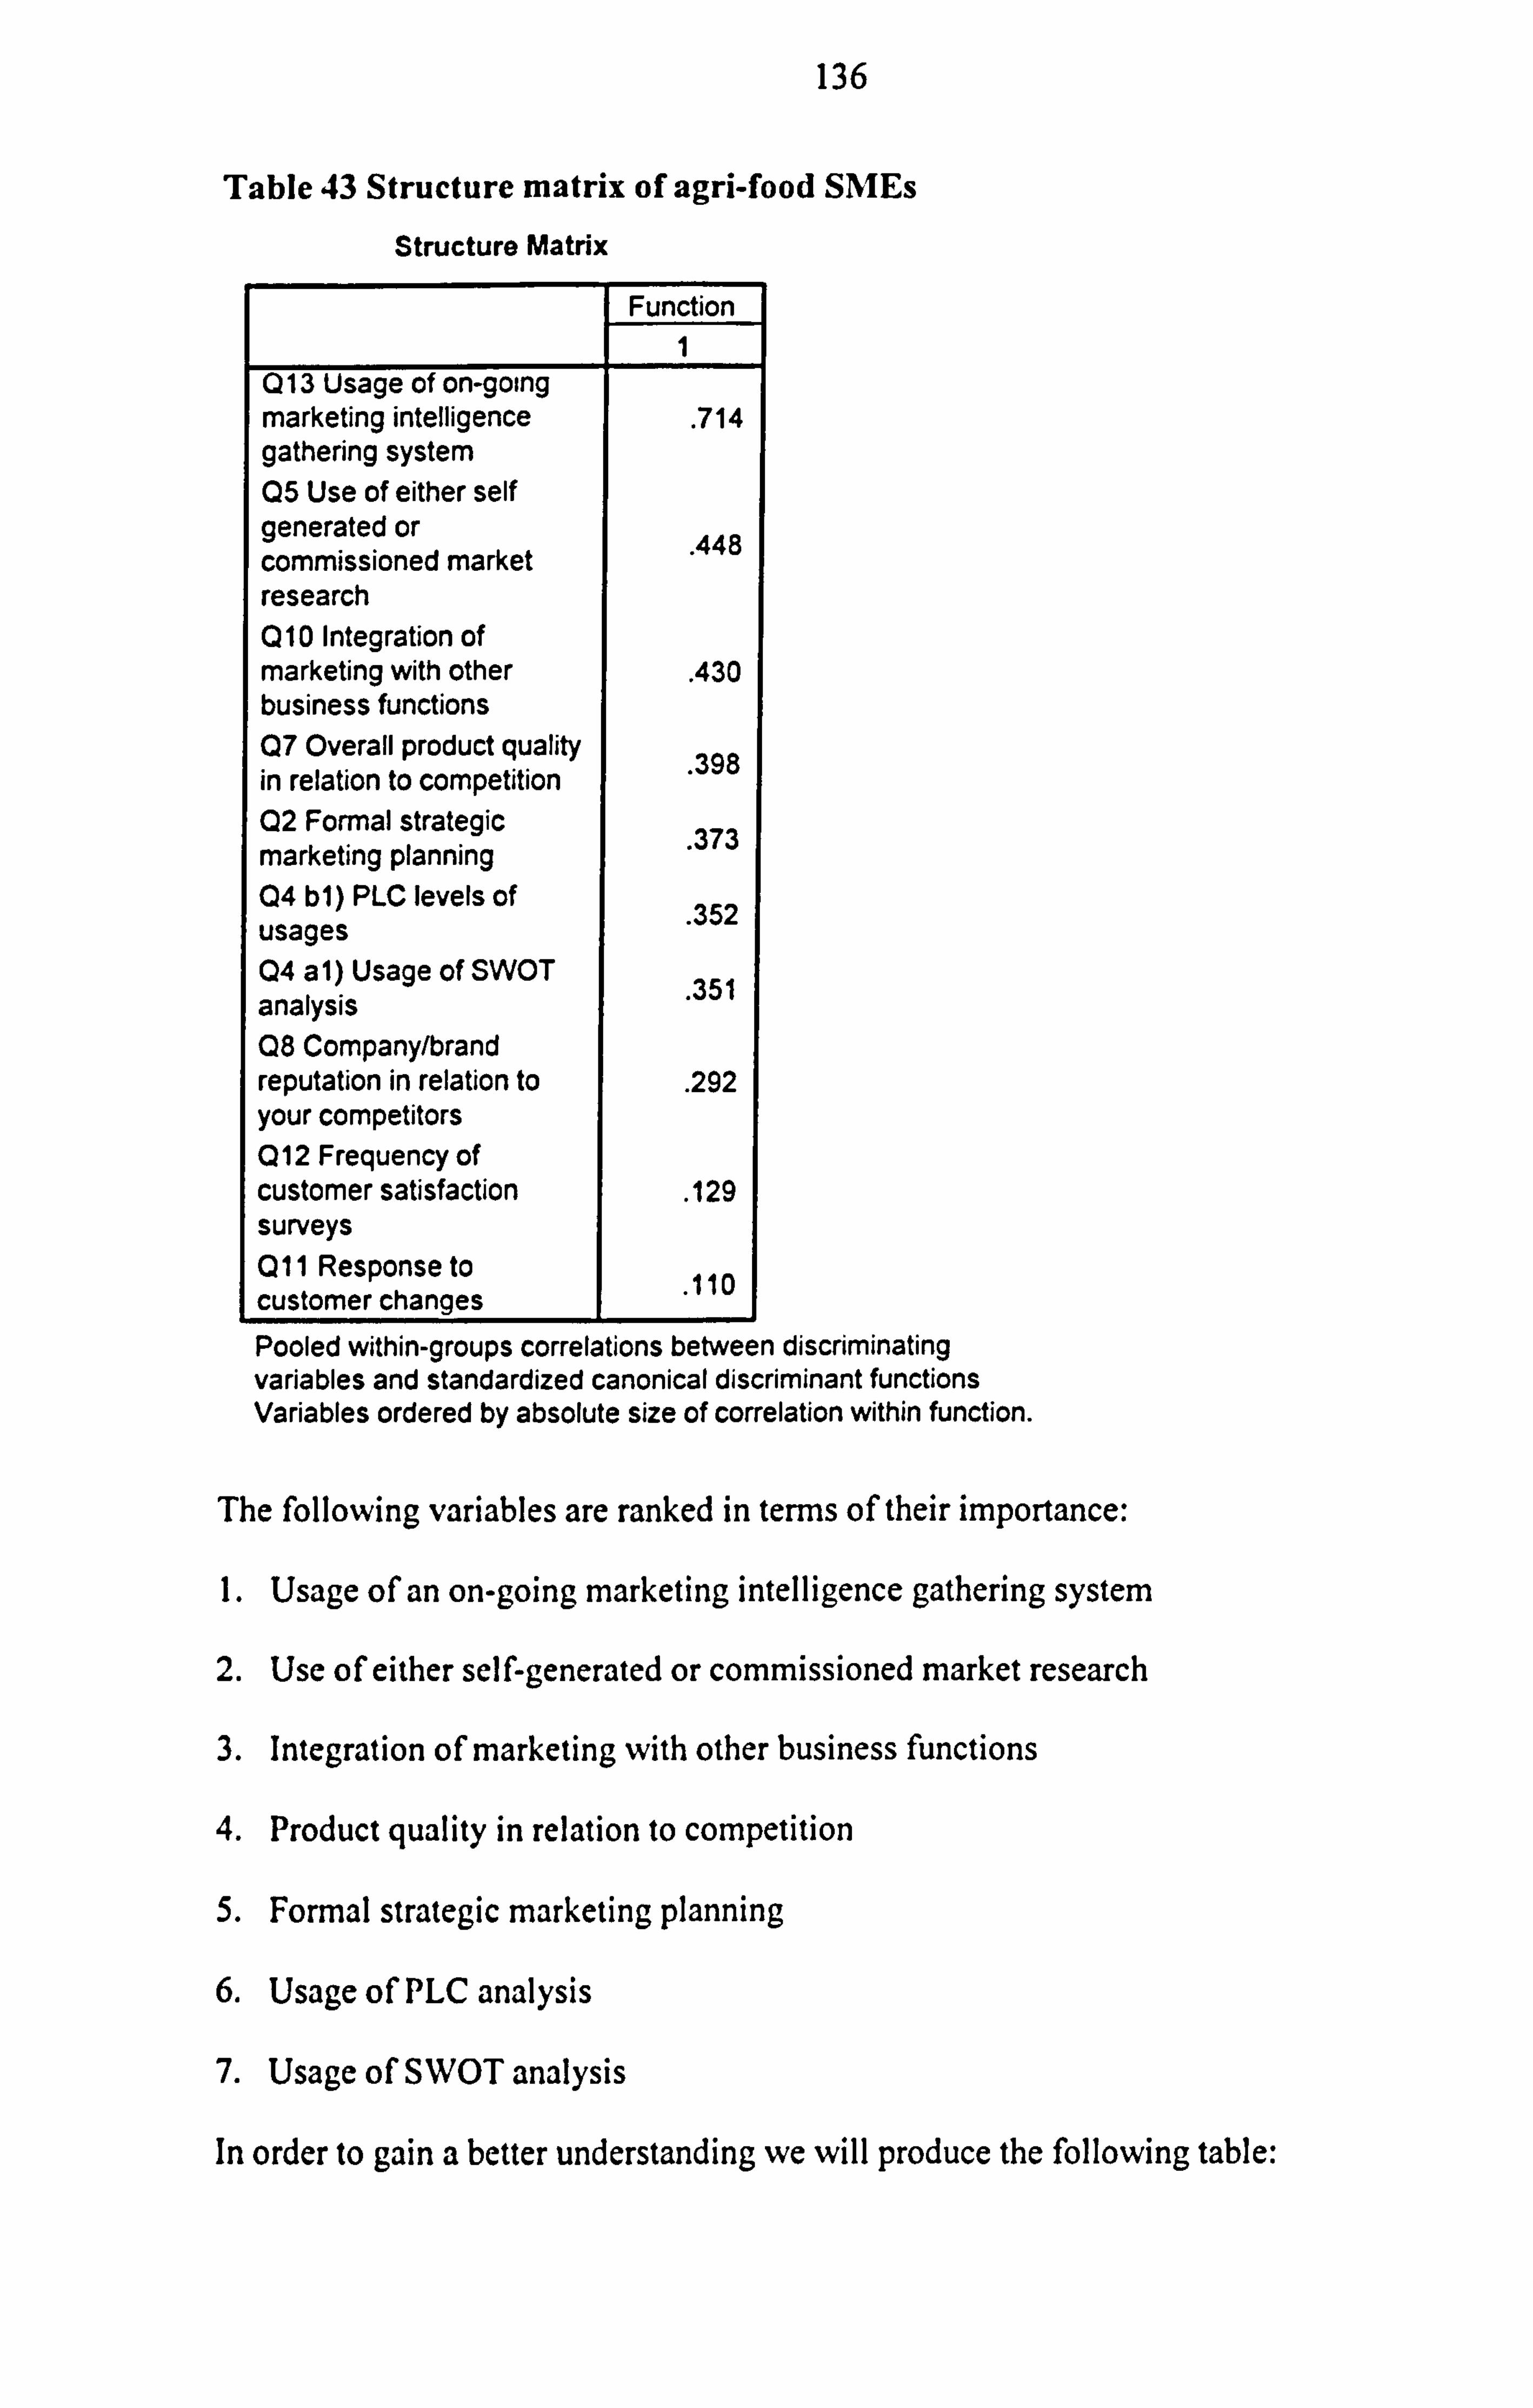
136
Table 43 Structure matrix of agri-food SMEs
Structure Matrix
Function
1 Q13 Usage of on-going marketing intelligence
. 714
gathering system Q5 Use of either self generated or 448 commissioned market . research Q10 Integration of marketing with other . 430 business functions Q7 Overall product quality 398 in relation to competition Q2 Formal strategic 373 marketing planning . 04 b1) PLC levels of
. 352 usages 04 a1) Usage of SWOT
351 analysis . Q8 Company/brand reputation in relation to . 292 your competitors 012 Frequency of customer satisfaction . 129 surveys Q11 Response to 110 customer changes Pooled within-groups correlations between discriminating variables and standardized canonical discriminant functions Variables ordered by absolute size of correlation within function.
The following variables are ranked in terms of their importance:
1. Usage of an on-going marketing intelligence gathering system
2. Use of either self-generated or commissioned market research
3. Integration of marketing with other business functions
4. Product quality in relation to competition
5. Formal strategic marketing planning
6. Usage of PLC analysis
7. Usage of SWOT analysis
In order to gain a better understanding we will produce the following table:
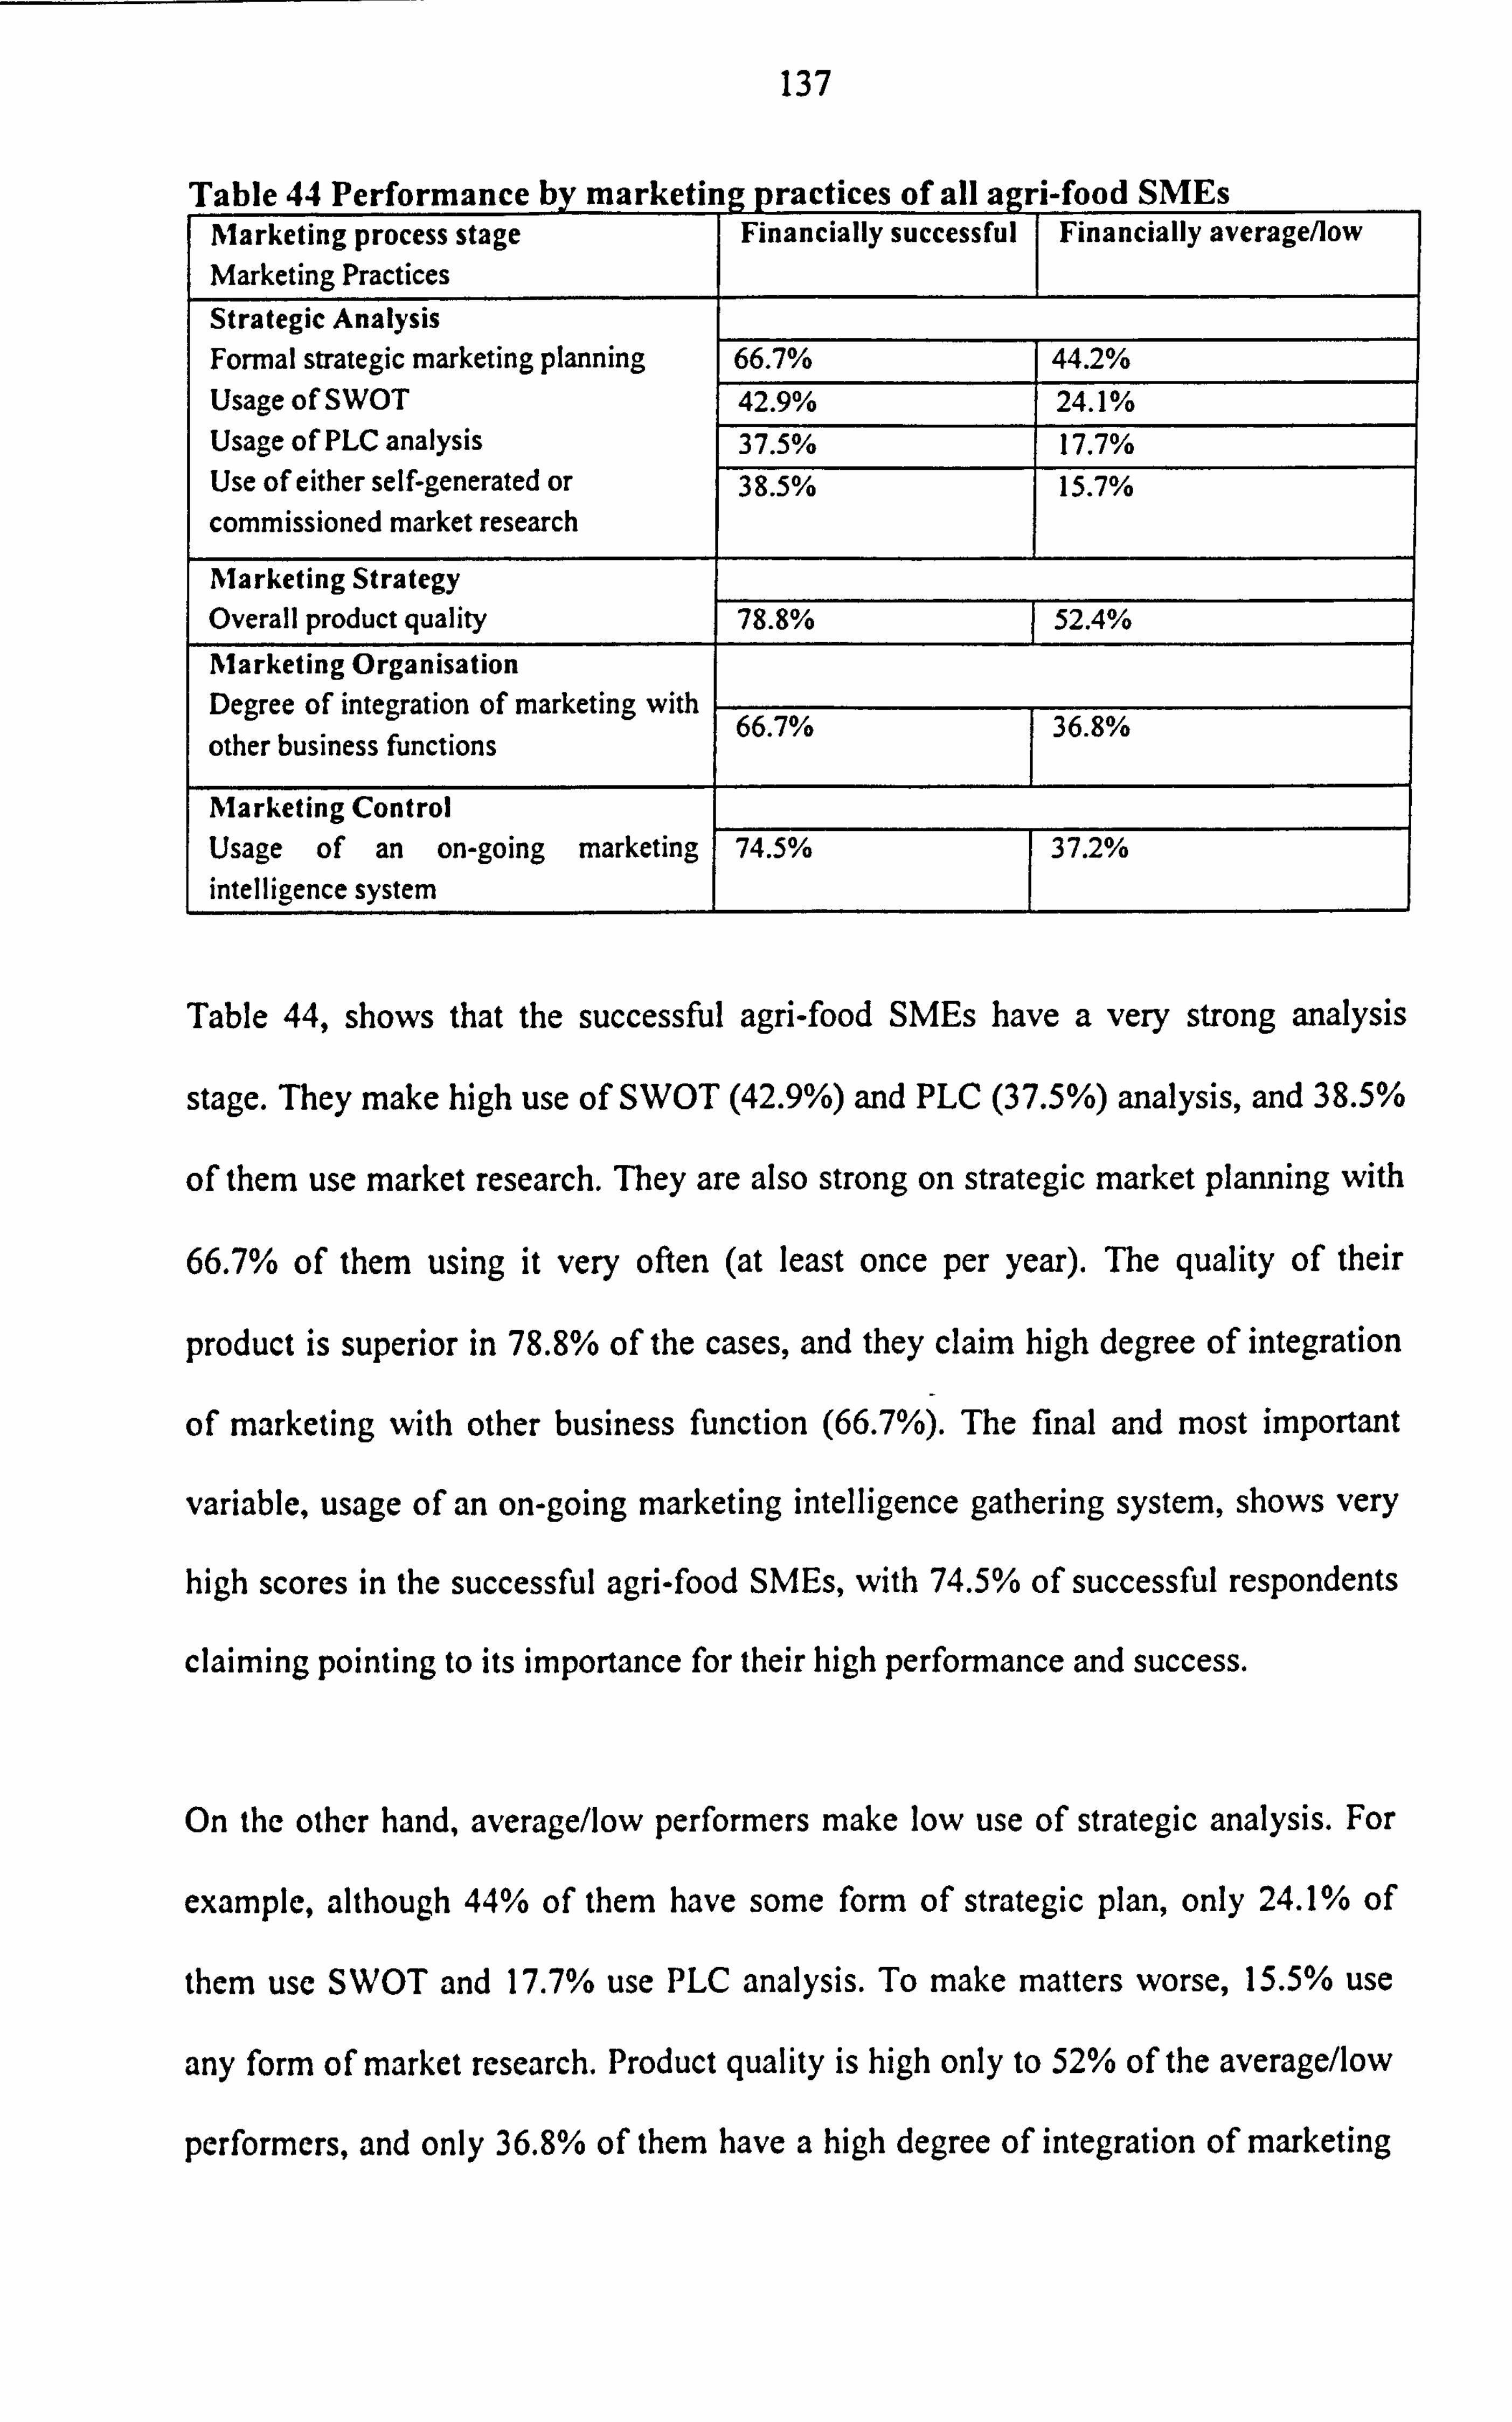
137
Table 44 Performance by marketing nractices of all agri-food SMEs Marketing process stage Marketing Practices
Financially successful Financially average/low
Strategic Analysis
Formal strategic marketing planning 66.7% 44.2% Usage of SWOT 42.9% 24.1% Usage of PLC analysis 37.5% 17.7% Use of either self-generated or commissioned market research
38.5% 15.7%
Marketing Strategy Overall product quality 78.8% 52.4% Marketing Organisation
with ration of marketin De ree of inte g g g other business functions 66.7% 36.8%
Marketing Control
Usage of an on-going marketing intelligence system
74.5% 37.2%
Table 44, shows that the successful agri-food SMEs have a very strong analysis
stage. They make high use of SWOT (42.9%) and PLC (37.5%) analysis, and 38.5%
of them use market research. They are also strong on strategic market planning with
66.7% of them using it very often (at least once per year). The quality of their
product is superior in 78.8% of the cases, and they claim high degree of integration
of marketing with other business function (66.7%). The final and most important
variable, usage of an on-going marketing intelligence gathering system, shows very
high scores in the successful agri-food SMEs, with 74.5% of successful respondents
claiming pointing to its importance for their high performance and success.
On the other hand, average/low performers make low use of strategic analysis. For
example, although 44% of them have some form of strategic plan, only 24.1% of
them use SWOT and 17.7% use PLC analysis. To make matters worse, 15.5% use
any form of market research. Product quality is high only to 52% of the average/low
performers, and only 36.8% of them have a high degree of integration of marketing
138
with the other business functions. Most importantly, only 37.2% of them have a
marketing intelligence gathering system in place.
Implications for the agri-food industry
Form this final section of discriminant analysis, government and industry experts
working towards improving the competitiveness and marketing of the agri-food
SMEs should concentrate on the following areas:
Strategic analysis, particularly a regular plan, followed by assessment of the position
of the company within its environment and competitors (SWOT analysis) and its
products (PLC analysis). Market research use is also vital for high performance, as
the results showed.
Marketing mix: The industry should also not forget that one of the most important
issues for its success is the quality standards of the product, especially the last
decade with consumers' power and concerns increasing, and putting the industry
under continuous pressure (MINTEL, 1999).
Marketing organisation: Integration of marketing with other business functions is
also an important component of the success of agri-food SMEs.
Marketing control: Finally, the industry should start developing systems by which
marketing intelligence information should be easily reached within a company.
From the results of this study and previous studies (Brooksbank, 1999, Carson,
139
1995), the above issues remain important but with particular emphasis to this
industry.
This research has still not addressed the question of what the differences are between
independent and subsidiaries, because of their ownership status, rather than because
of chance or just different marketing practices. The next section will address this
question.
6.4 Ownership status and its effect on performance
The results of this project so far suggest that there are some differences between
independent and subsidiary agri-food SMEs. For example, in terms of strategic
analysis, there seem to be a relationship with high performers in the independent
group, whereas in the subsidiary group the marketing planning may already be
determined by the parent company and therefore not contribute to the direct financial
success of the company. Another example may be the company/brand reputation. It
looks as if there is a relationship between high performing independent SMEs and
their reputations, maybe due to the importance of the word of mouth effect. However
subsidiary SMEs tend to rate it not as high especially since there is no direct link
between high performing subsidiary SMEs and their company/brand reputation.
Response to customer change and frequency of customer satisfaction surveys both
are significantly related to high performing independent SMEs, whereas there is
again no direct link with subsidiary SMEs. This may be because they use either
research done by the parent company, or have the resources to commission an
agency and do this part of the marketing implementation process externally.
140
However are the differences statistically significant, or are they just a result of
chance? In addition, the interdependence relationships among marketing
performance marketing practices and ownership status have not been examined. The
differences in performance may be due to differences in marketing behaviour and not
necessarily to ownership status. The following section will therefore investigate the
hypothesis of whether there are any differences between subsidiary and independent
(ownership) SMEs, in terms of their marketing practices and performance.
Ho: No statistical difference between ownership and marketing practices of SMEs',
and performance.
HI: There is a statistical difference between ownership and marketing practices of
SMEs' and performance.
Thus to understand how independent and subsidiary companies are different, there is
a need to examine the interdependence among the three variables-performance,
marketing practices and ownership status.
Against this background this section aims to:
1. Compare the statistical differences between the marketing practices of
independent and subsidiary agri-food SMEs and their impact on performance;
and
2. Investigate the independence among performance, marketing practices and
ownership status.
6.4.1 Analytical method
The log-linear model is utilised to examine the independence among the three
variables by identifying the odd ratio of occurrence. The log-linear models are
141
analysis of variance models applied to the natural logarithms of multinomial
probabilities or expected cell counts so as to determine the interdependence of three
or more variables in cross-classification.
The log-linear models have been applied in a variety of studies and contexts. For
example, Susan and Bang Nam (1999) applied log-linear analysis to foreign direct
investment data to estimate the flow determinants of direct investment. Furthermore,
the log-linear technique was used to examine the relationship between network
theory and small business growth. The results showed that networks have an
influence on growth of a small business, especially through contacts with national
and international entrepreneurs (Donckels and Lambrecht, 1995). This technique has
also been used in food consumer research. The relationship between consumer unit
type and expenditures on food away from home using micro-data from the 1989
Consumer Expenditure survey was explored. A log-linear model was used to purge
the effects of income and race from consumer unit type/food-away-from-home
expenditure relationship. Log-linear analysis was shown as a valuable tool for
consumer researchers in the food industry (Louis and Sukgoo, 1995). Therefore this
technique has already been employed on both food and small business contexts.
In this thesis, Categorical Data Analysis for Log Linear Model for Three-variable
Tables is used, as suggested by Stoke et al (1995). Since the main purpose is to
determine the ownership status effect on performance, only the main effect model
which is the effects influenced independently by ownership status and marketing
practice is adopted, rather than the interactive model which is the joint and
interactive effect of ownership status and marketing practices. The CATMOD
routine in the SAS software package was used for the analysis of the data.
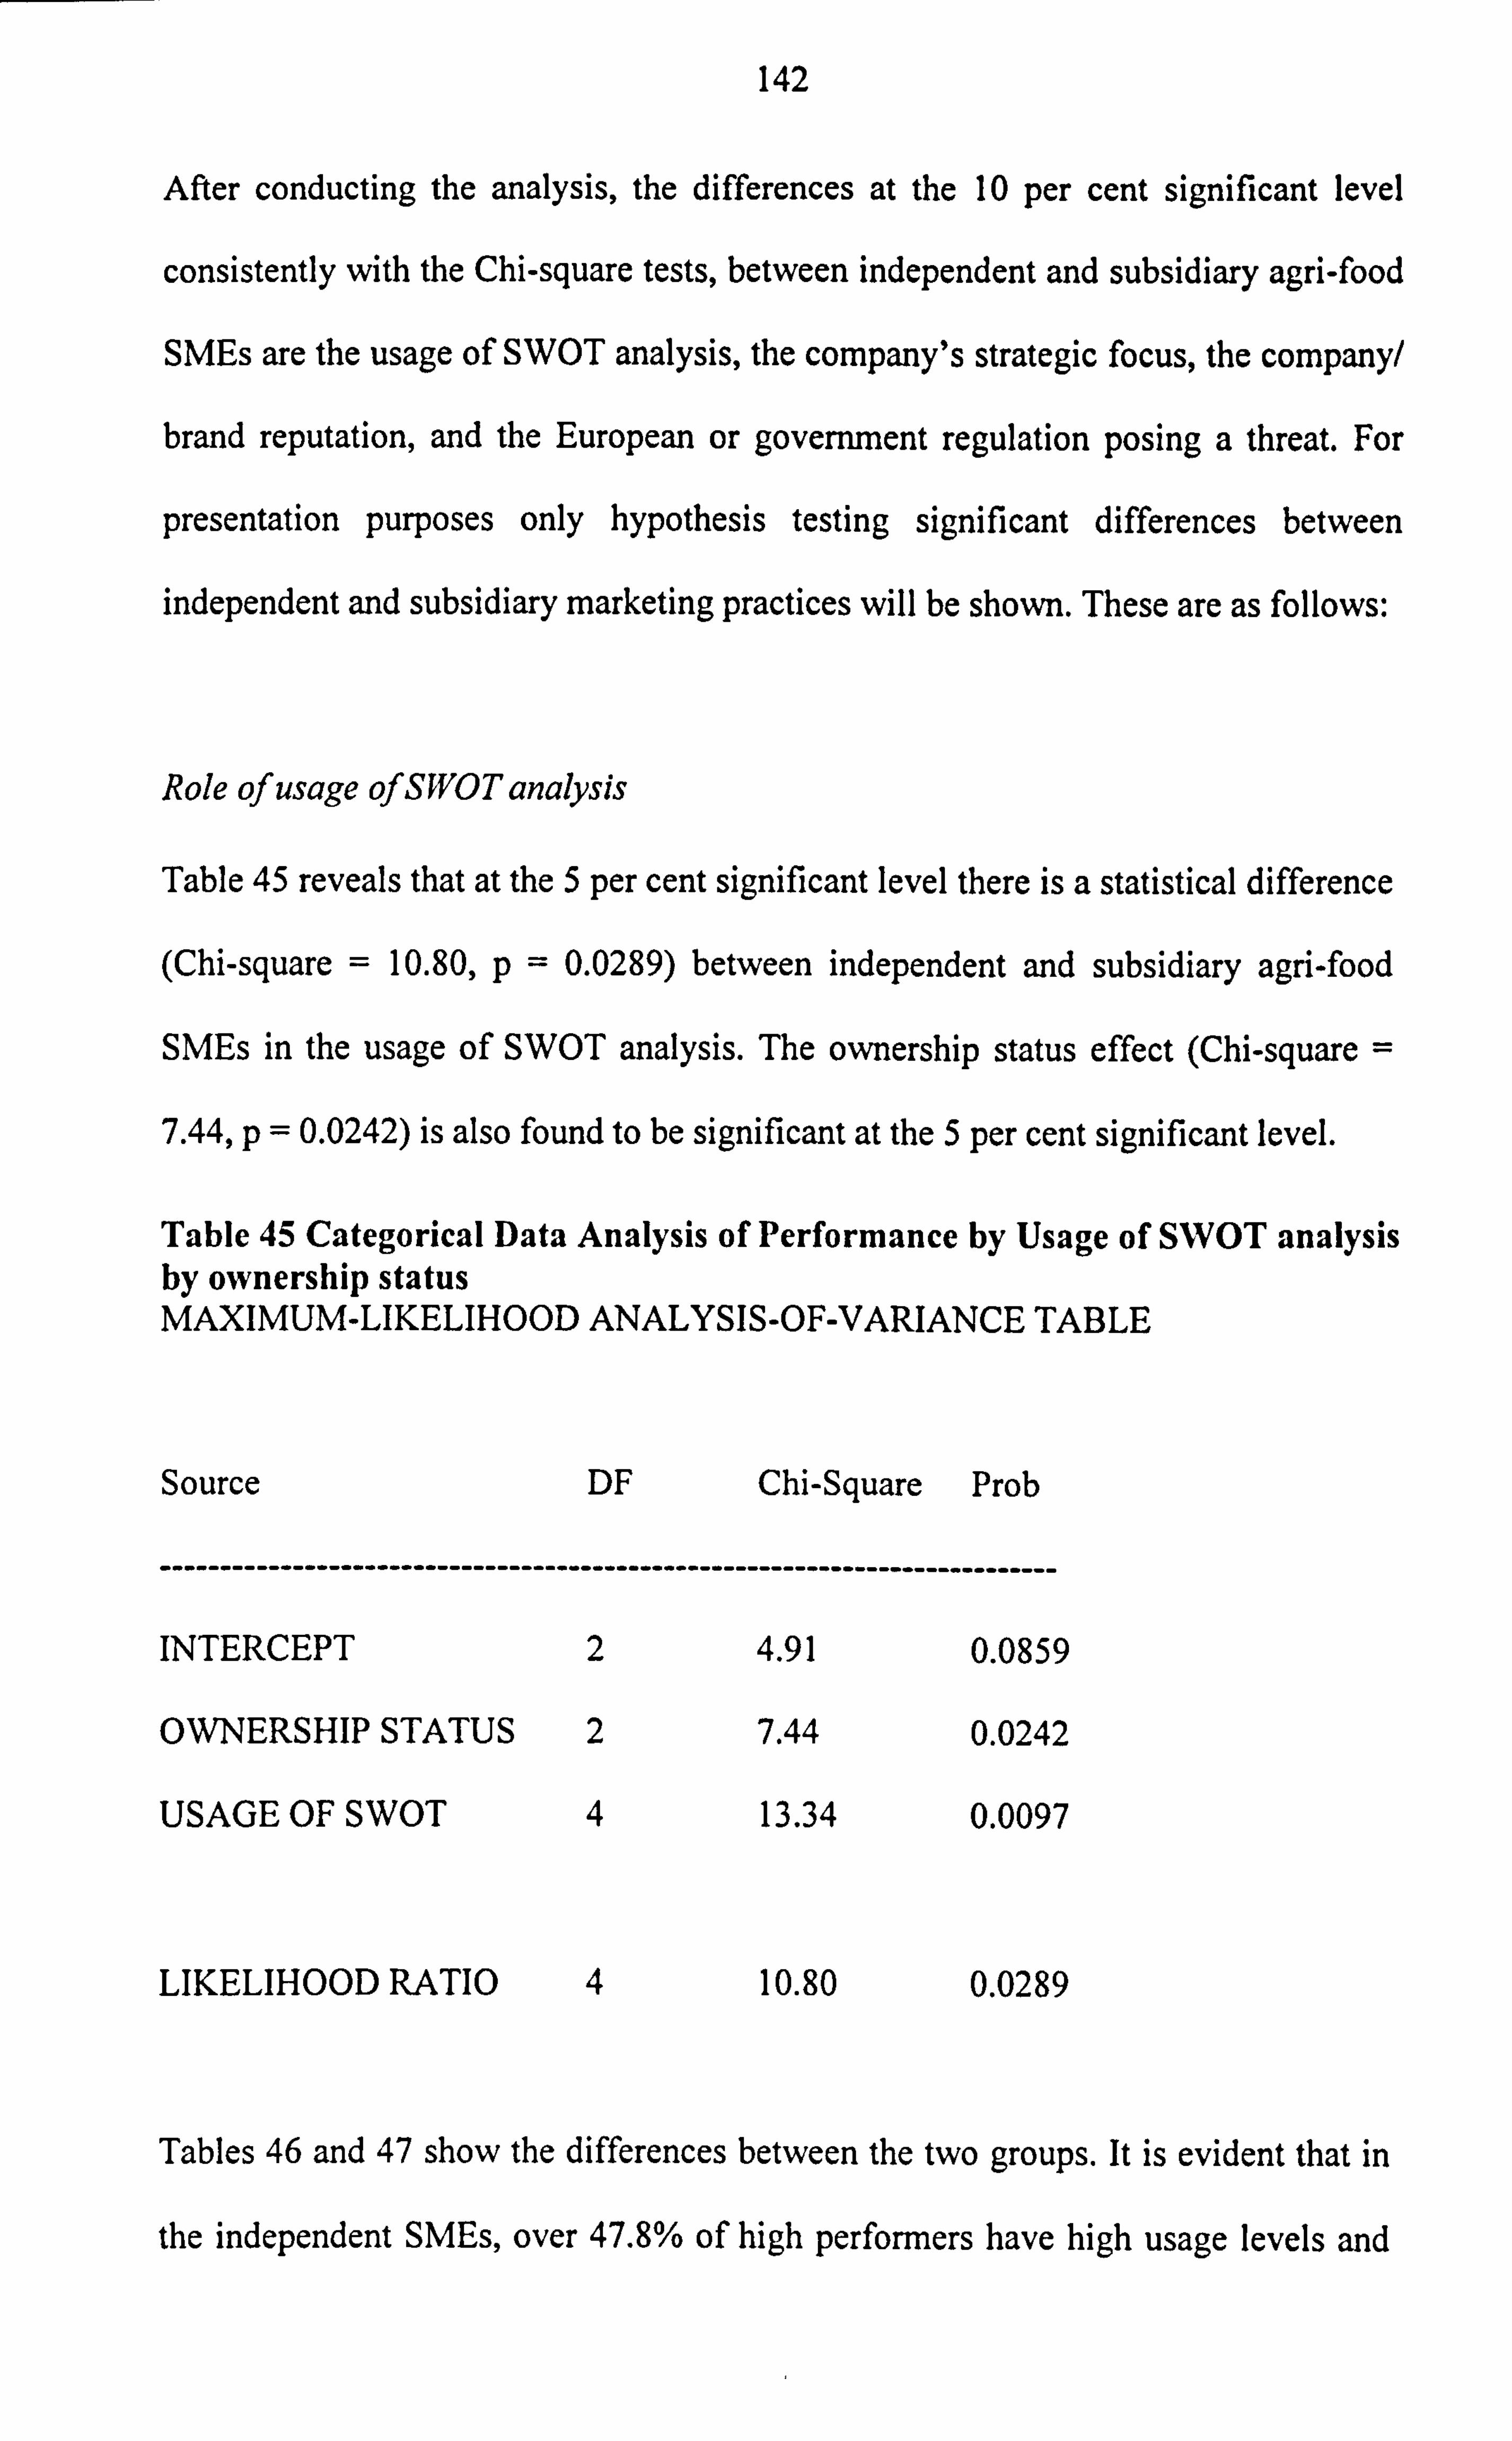
142
After conducting the analysis, the differences at the 10 per cent significant level
consistently with the Chi-square tests, between independent and subsidiary agri-food
SMEs are the usage of SWOT analysis, the company's strategic focus, the company/
brand reputation, and the European or government regulation posing a threat. For
presentation purposes only hypothesis testing significant differences between
independent and subsidiary marketing practices will be shown. These are as follows:
Role of usage of SWOT analysis
Table 45 reveals that at the 5 per cent significant level there is a statistical difference
(Chi-square = 10.80, p=0.0289) between independent and subsidiary agri-food
SMEs in the usage of SWOT analysis. The ownership status effect (Chi-square =
7.44, p=0.0242) is also found to be significant at the 5 per cent significant level.
Table 45 Categorical Data Analysis of Performance by Usage of SWOT analysis by ownership status MAXIMUM-LIKELIHOOD ANALYSIS-OF-VARIANCE TABLE
Source DF Chi-Square Prob
---------------------------------
INTERCEPT
-----------
2
------------------
4.91
-------------
0.0859
OWNERSHIP STATUS 2 7.44 0.0242
USAGE OF SWOT 4 13.34 0.0097
LIKELIHOOD RATIO 4 10.80 0.0289
Tables 46 and 47 show the differences between the two groups. It is evident that in
the independent SMEs, over 47.8% of high performers have high usage levels and
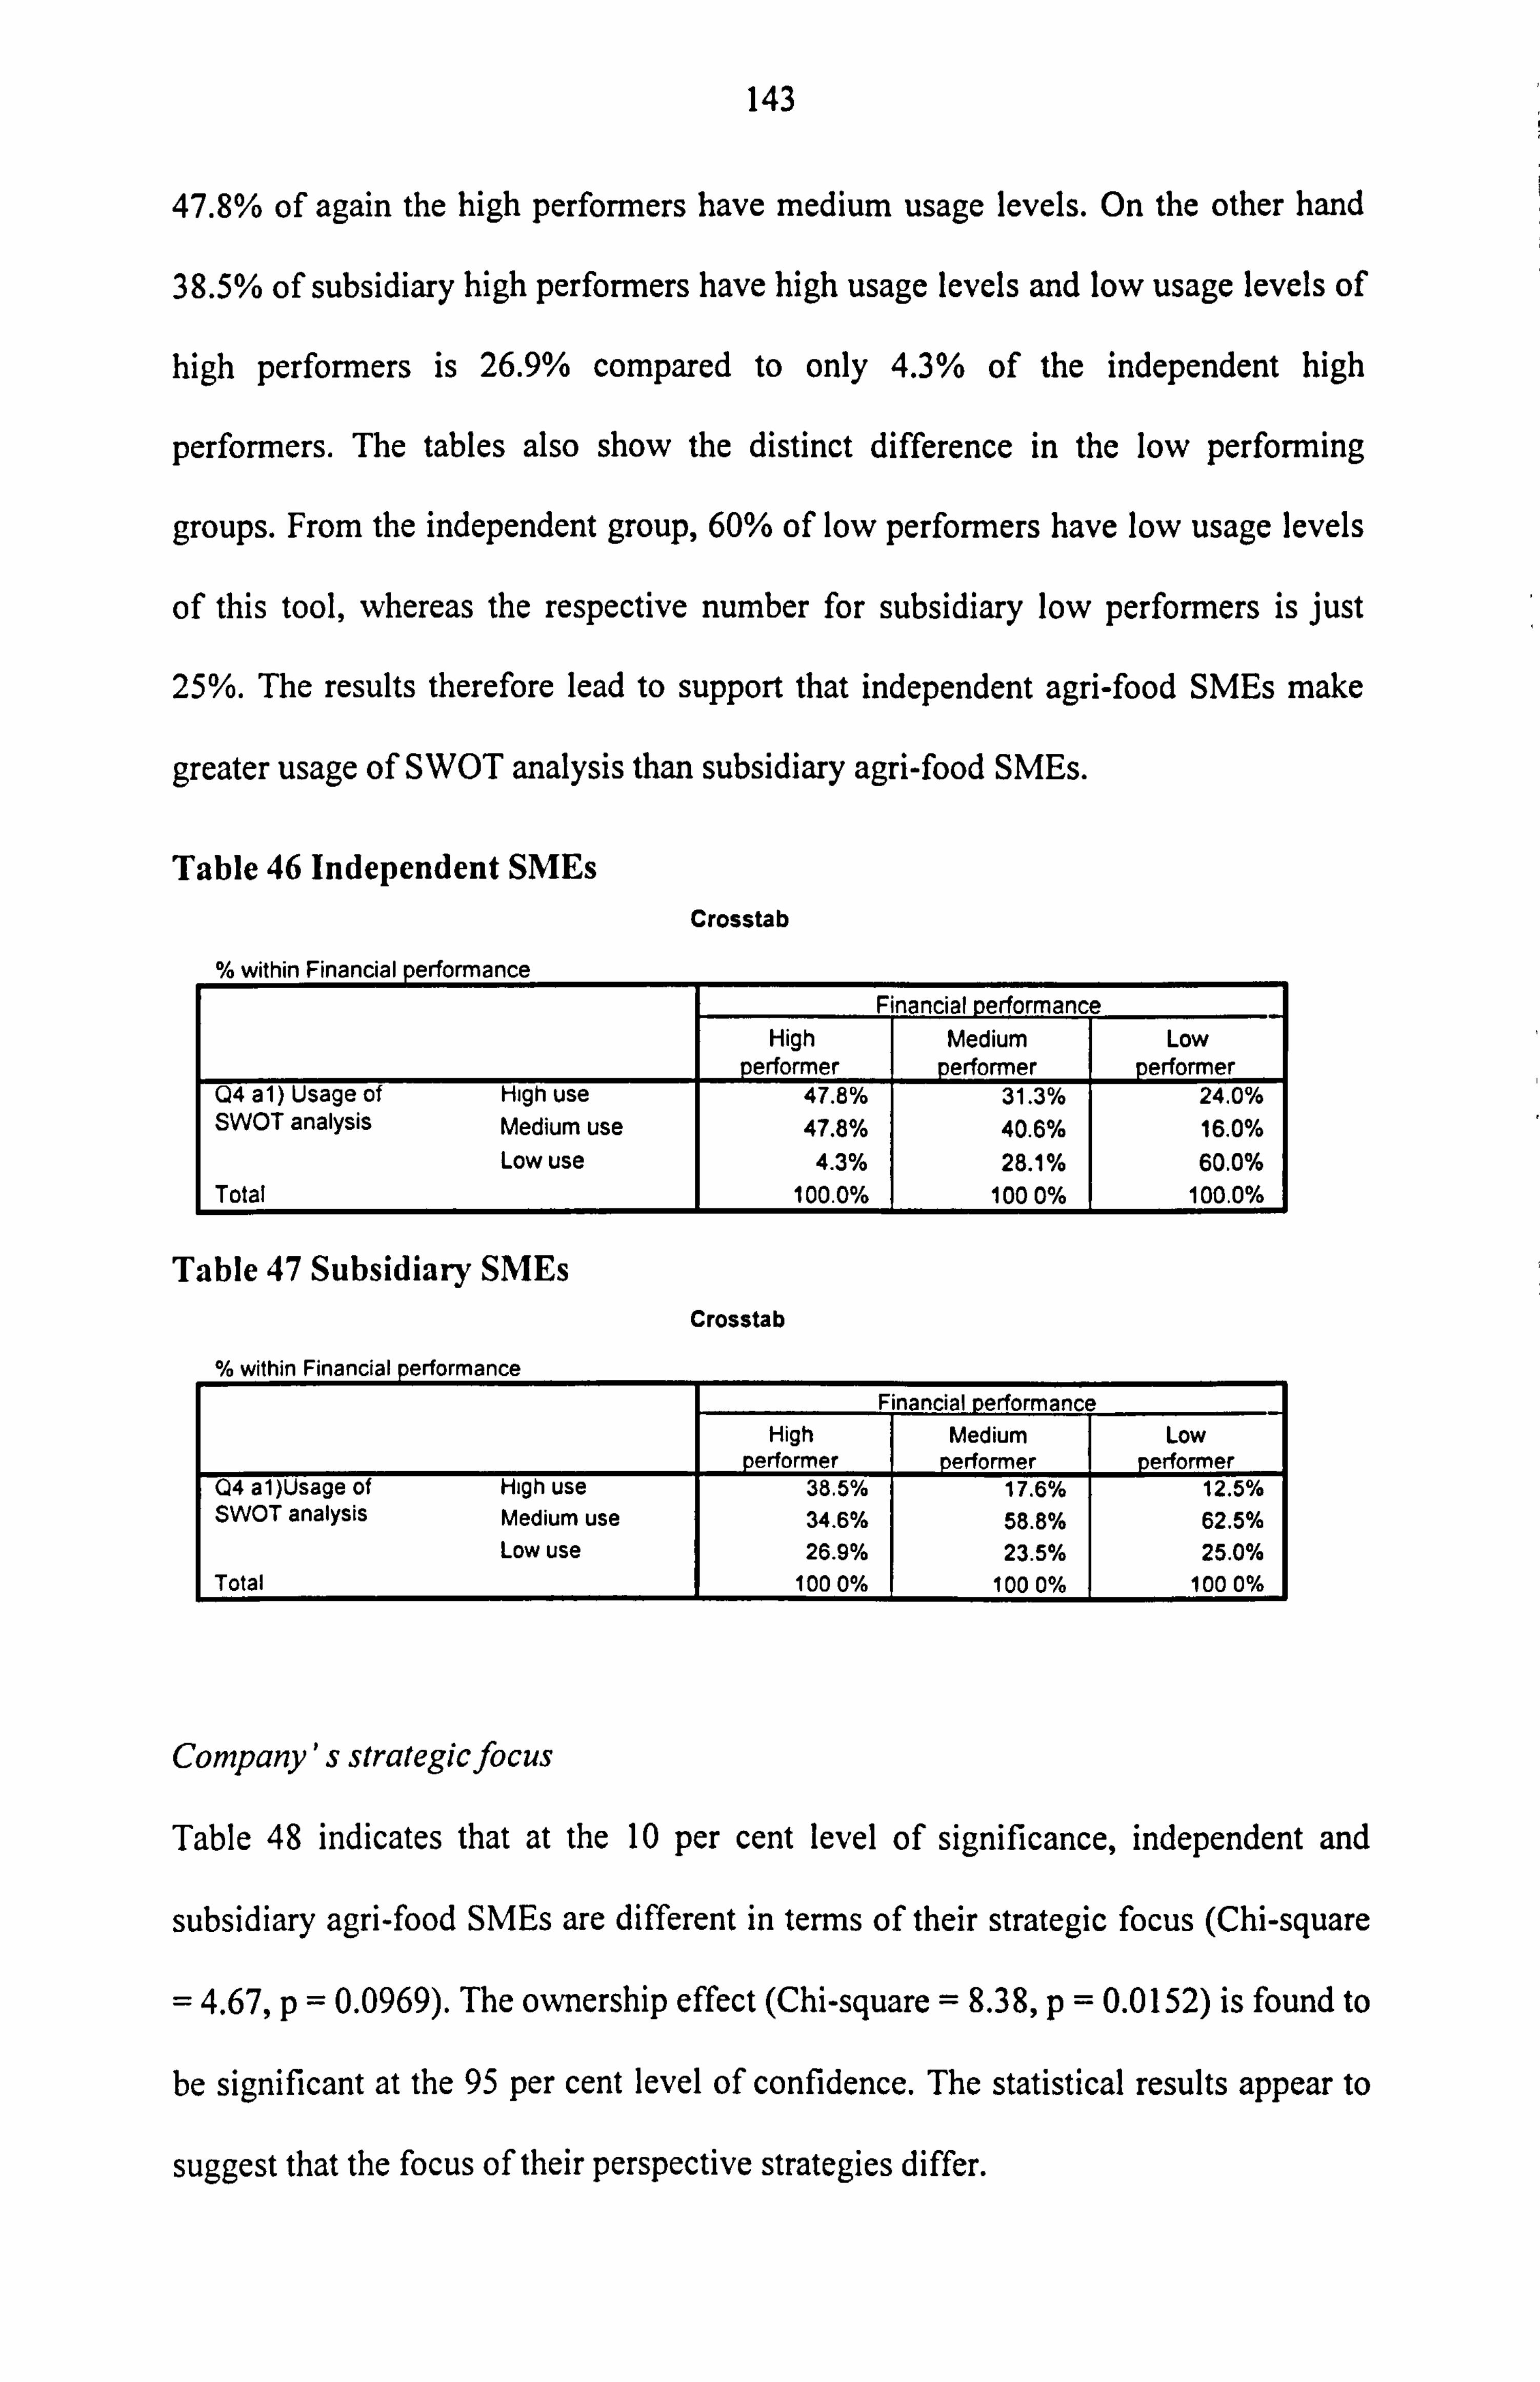
143
47.8% of again the high performers have medium usage levels. On the other hand
38.5% of subsidiary high performers have high usage levels and low usage levels of
high performers is 26.9% compared to only 4.3% of the independent high
performers. The tables also show the distinct difference in the low performing
groups. From the independent group, 60% of low performers have low usage levels
of this tool, whereas the respective number for subsidiary low performers is just
25%. The results therefore lead to support that independent agri-food SMEs make
greater usage of SWOT analysis than subsidiary agri-food SMEs.
Table 46 Independent SMEs Crosstab
O/ within Finanrial norfnrmanro
Fi nancial erformanc e High Medium Low
performer performer Q4 al) Usage of High use 47.8% 31.3% 24.0% SWOT analysis Medium use 47.8% 40.6% 16.0%
Low use 4.3% 28.1% 60.0% Total 100.0% 1000% 100.0%
Table 47 Subsidiary SMEs Crosstab
% within Financial performance
F inancial erformanc e High Medium Low
performer nerformer Q4 al)Usage of High use 38.5% 17.6% 12.5% SWOT analysis Medium use 34.6% 58.8% 62.5%
Low use 26.9% 23.5% 25.0% Total 1000% 1000% 1000%
Company's strategic focus
Table 48 indicates that at the 10 per cent level of significance, independent and
subsidiary agri-food SMEs are different in terms of their strategic focus (Chi-square
= 4.67, p=0.0969). The ownership effect (Chi-square = 8.38, p=0.0152) is found to
be significant at the 95 per cent level of confidence. The statistical results appear to
suggest that the focus of their perspective strategies differ.
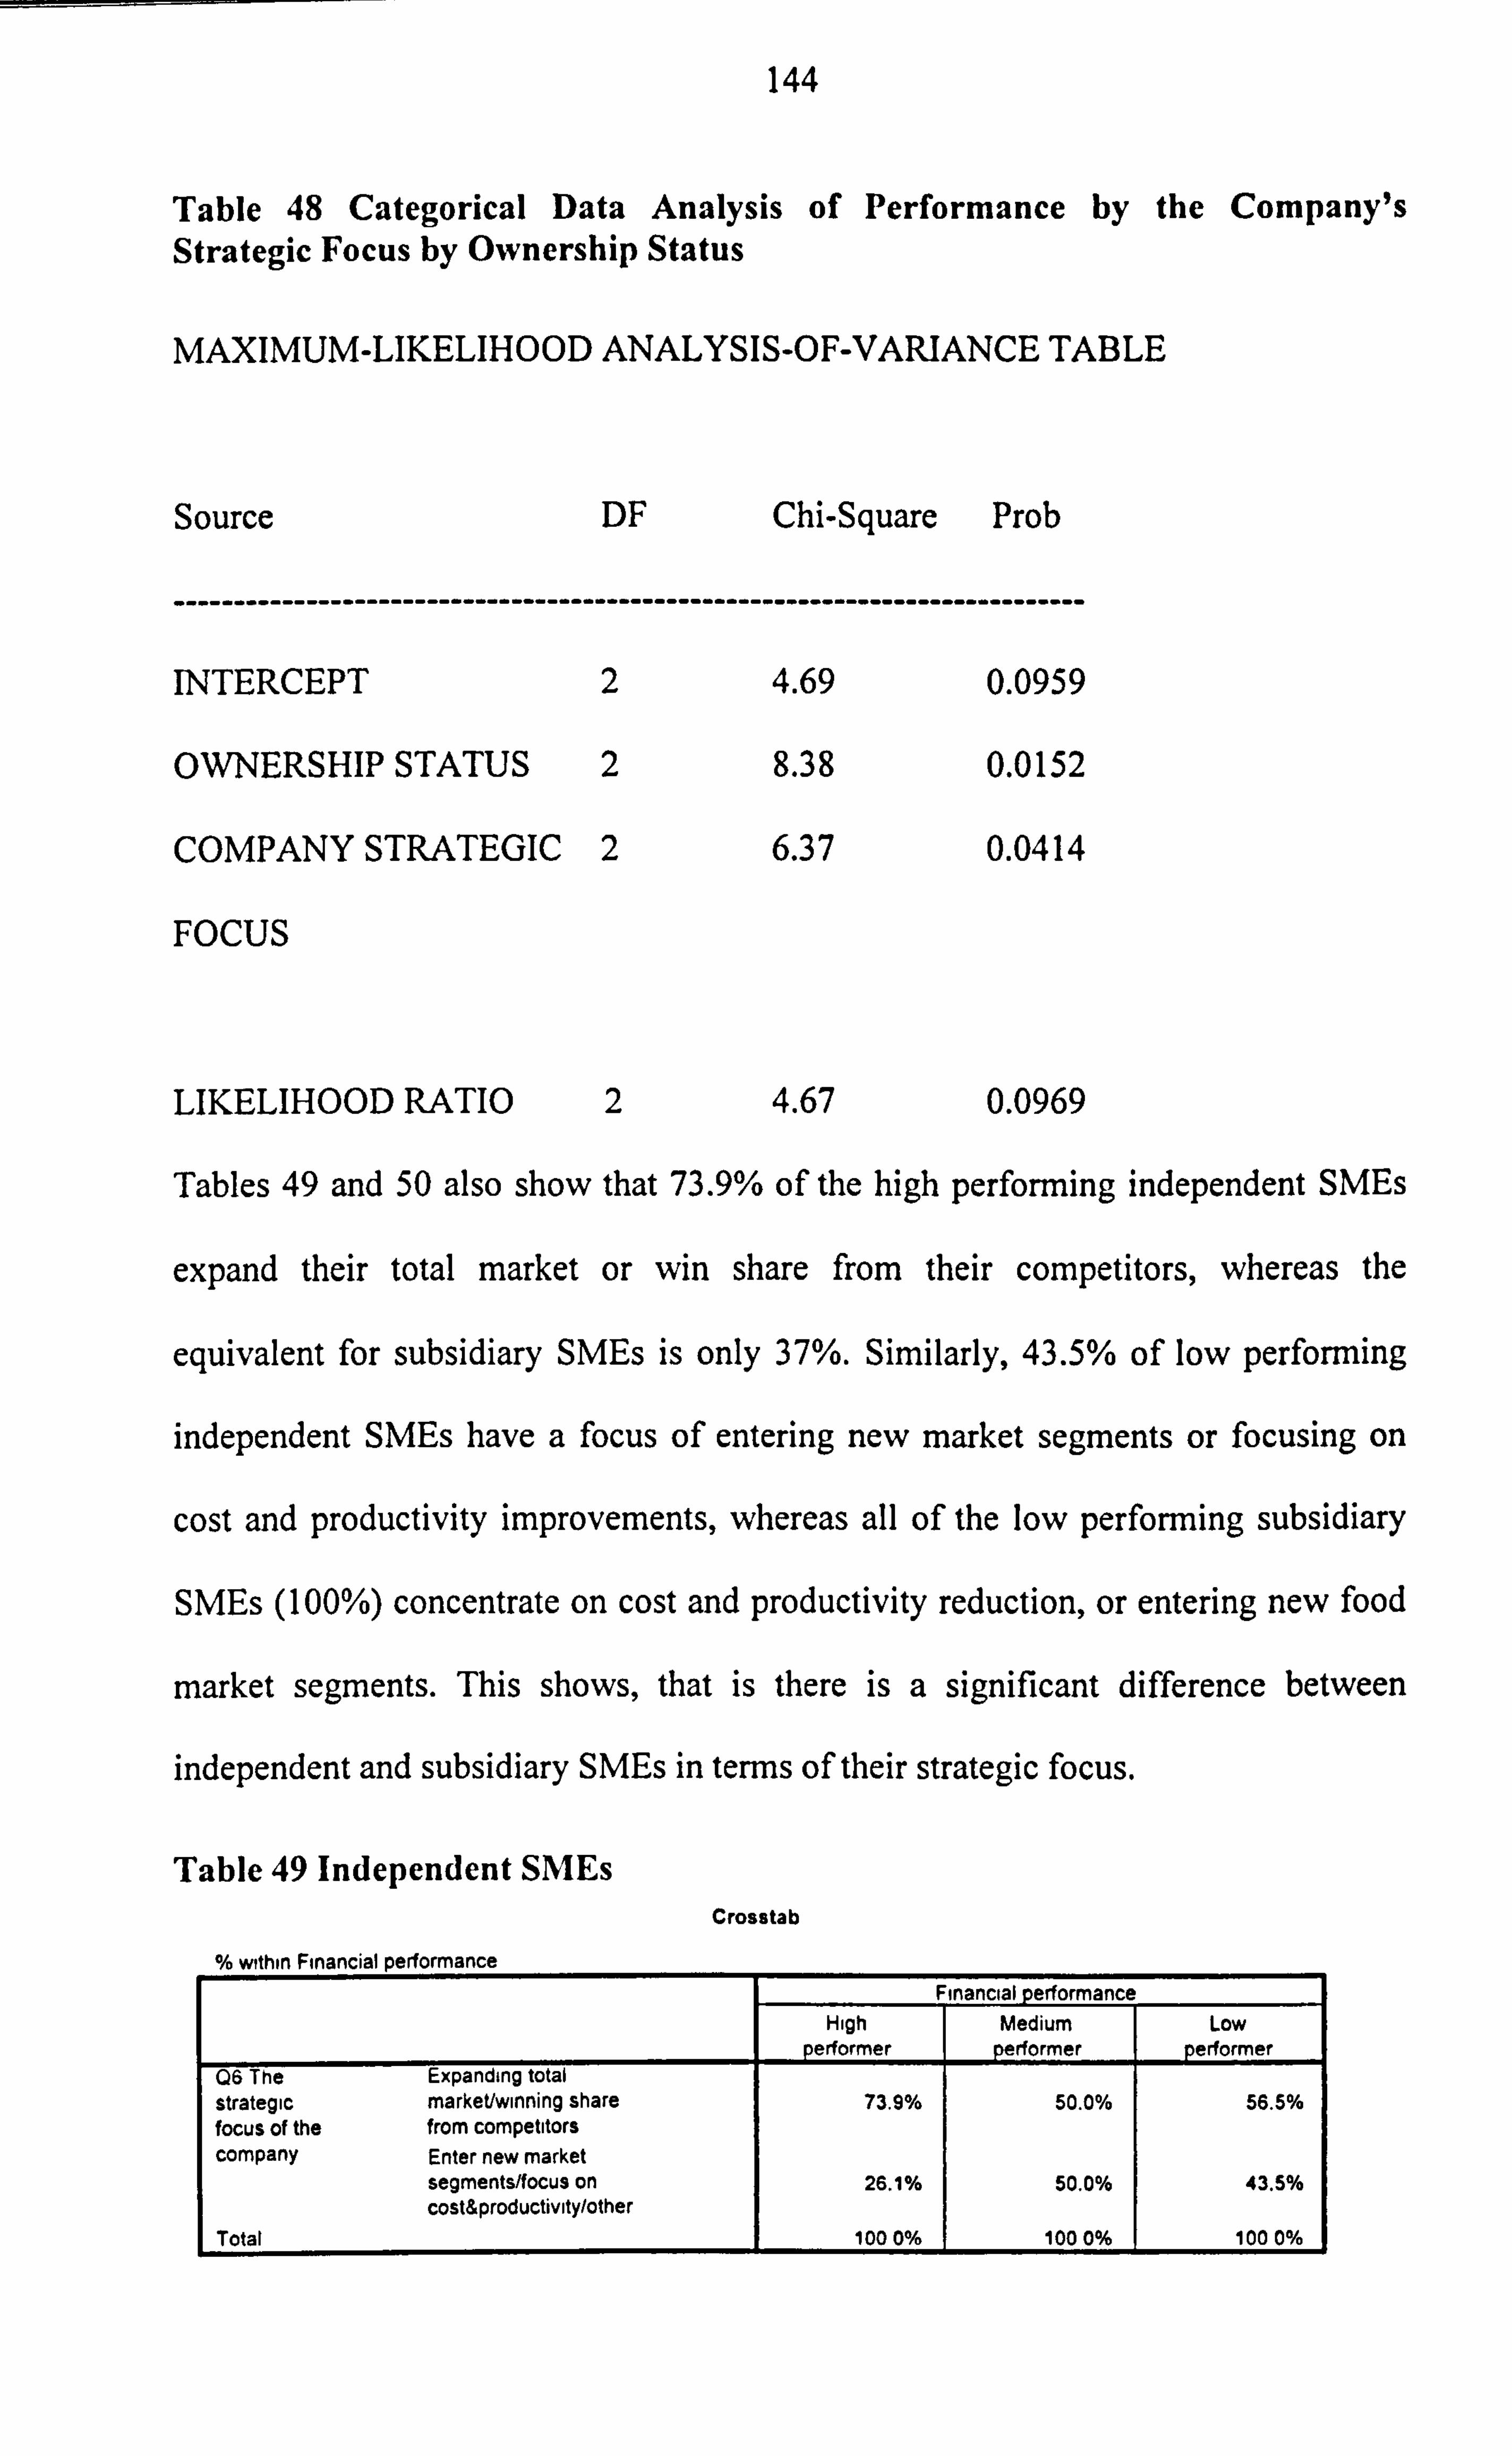
144
Table 48 Categorical Data Analysis of Performance by the Company's Strategic Focus by Ownership Status
MAXIMUM-LIKELIHOOD ANALYSIS-OF-VARIANCE TABLE
Source DF Chi-Square Prob
INTERCEPT 2
OWNERSHIP STATUS 2
COMPANY STRATEGIC 2
FOCUS
4.69 0.0959
8.38 0.0152
6.37 0.0414
LIKELIHOOD RATIO 2 4.67 0.0969
Tables 49 and 50 also show that 73.9% of the high performing independent SMEs
expand their total market or win share from their competitors, whereas the
equivalent for subsidiary SMEs is only 37%. Similarly, 43.5% of low performing
independent SMEs have a focus of entering new market segments or focusing on
cost and productivity improvements, whereas all of the low performing subsidiary
SMEs (100%) concentrate on cost and productivity reduction, or entering new food
market segments. This shows, that is there is a significant difference between
independent and subsidiary SMEs in terms of their strategic focus.
Table 49 Independent SMEs
0/n -, thin Financial nerformance
Crosstab
Financial performance High Medium Low
erformer performer performer 06 The Expanding total strategic market/winning share 73.9% 50.0% 56.5% focus of the from competitors company Enter new market
segments/focus on 26.1% 50.0% 43.5% cost&productivity/other
Total 1000% 1000% 1000%
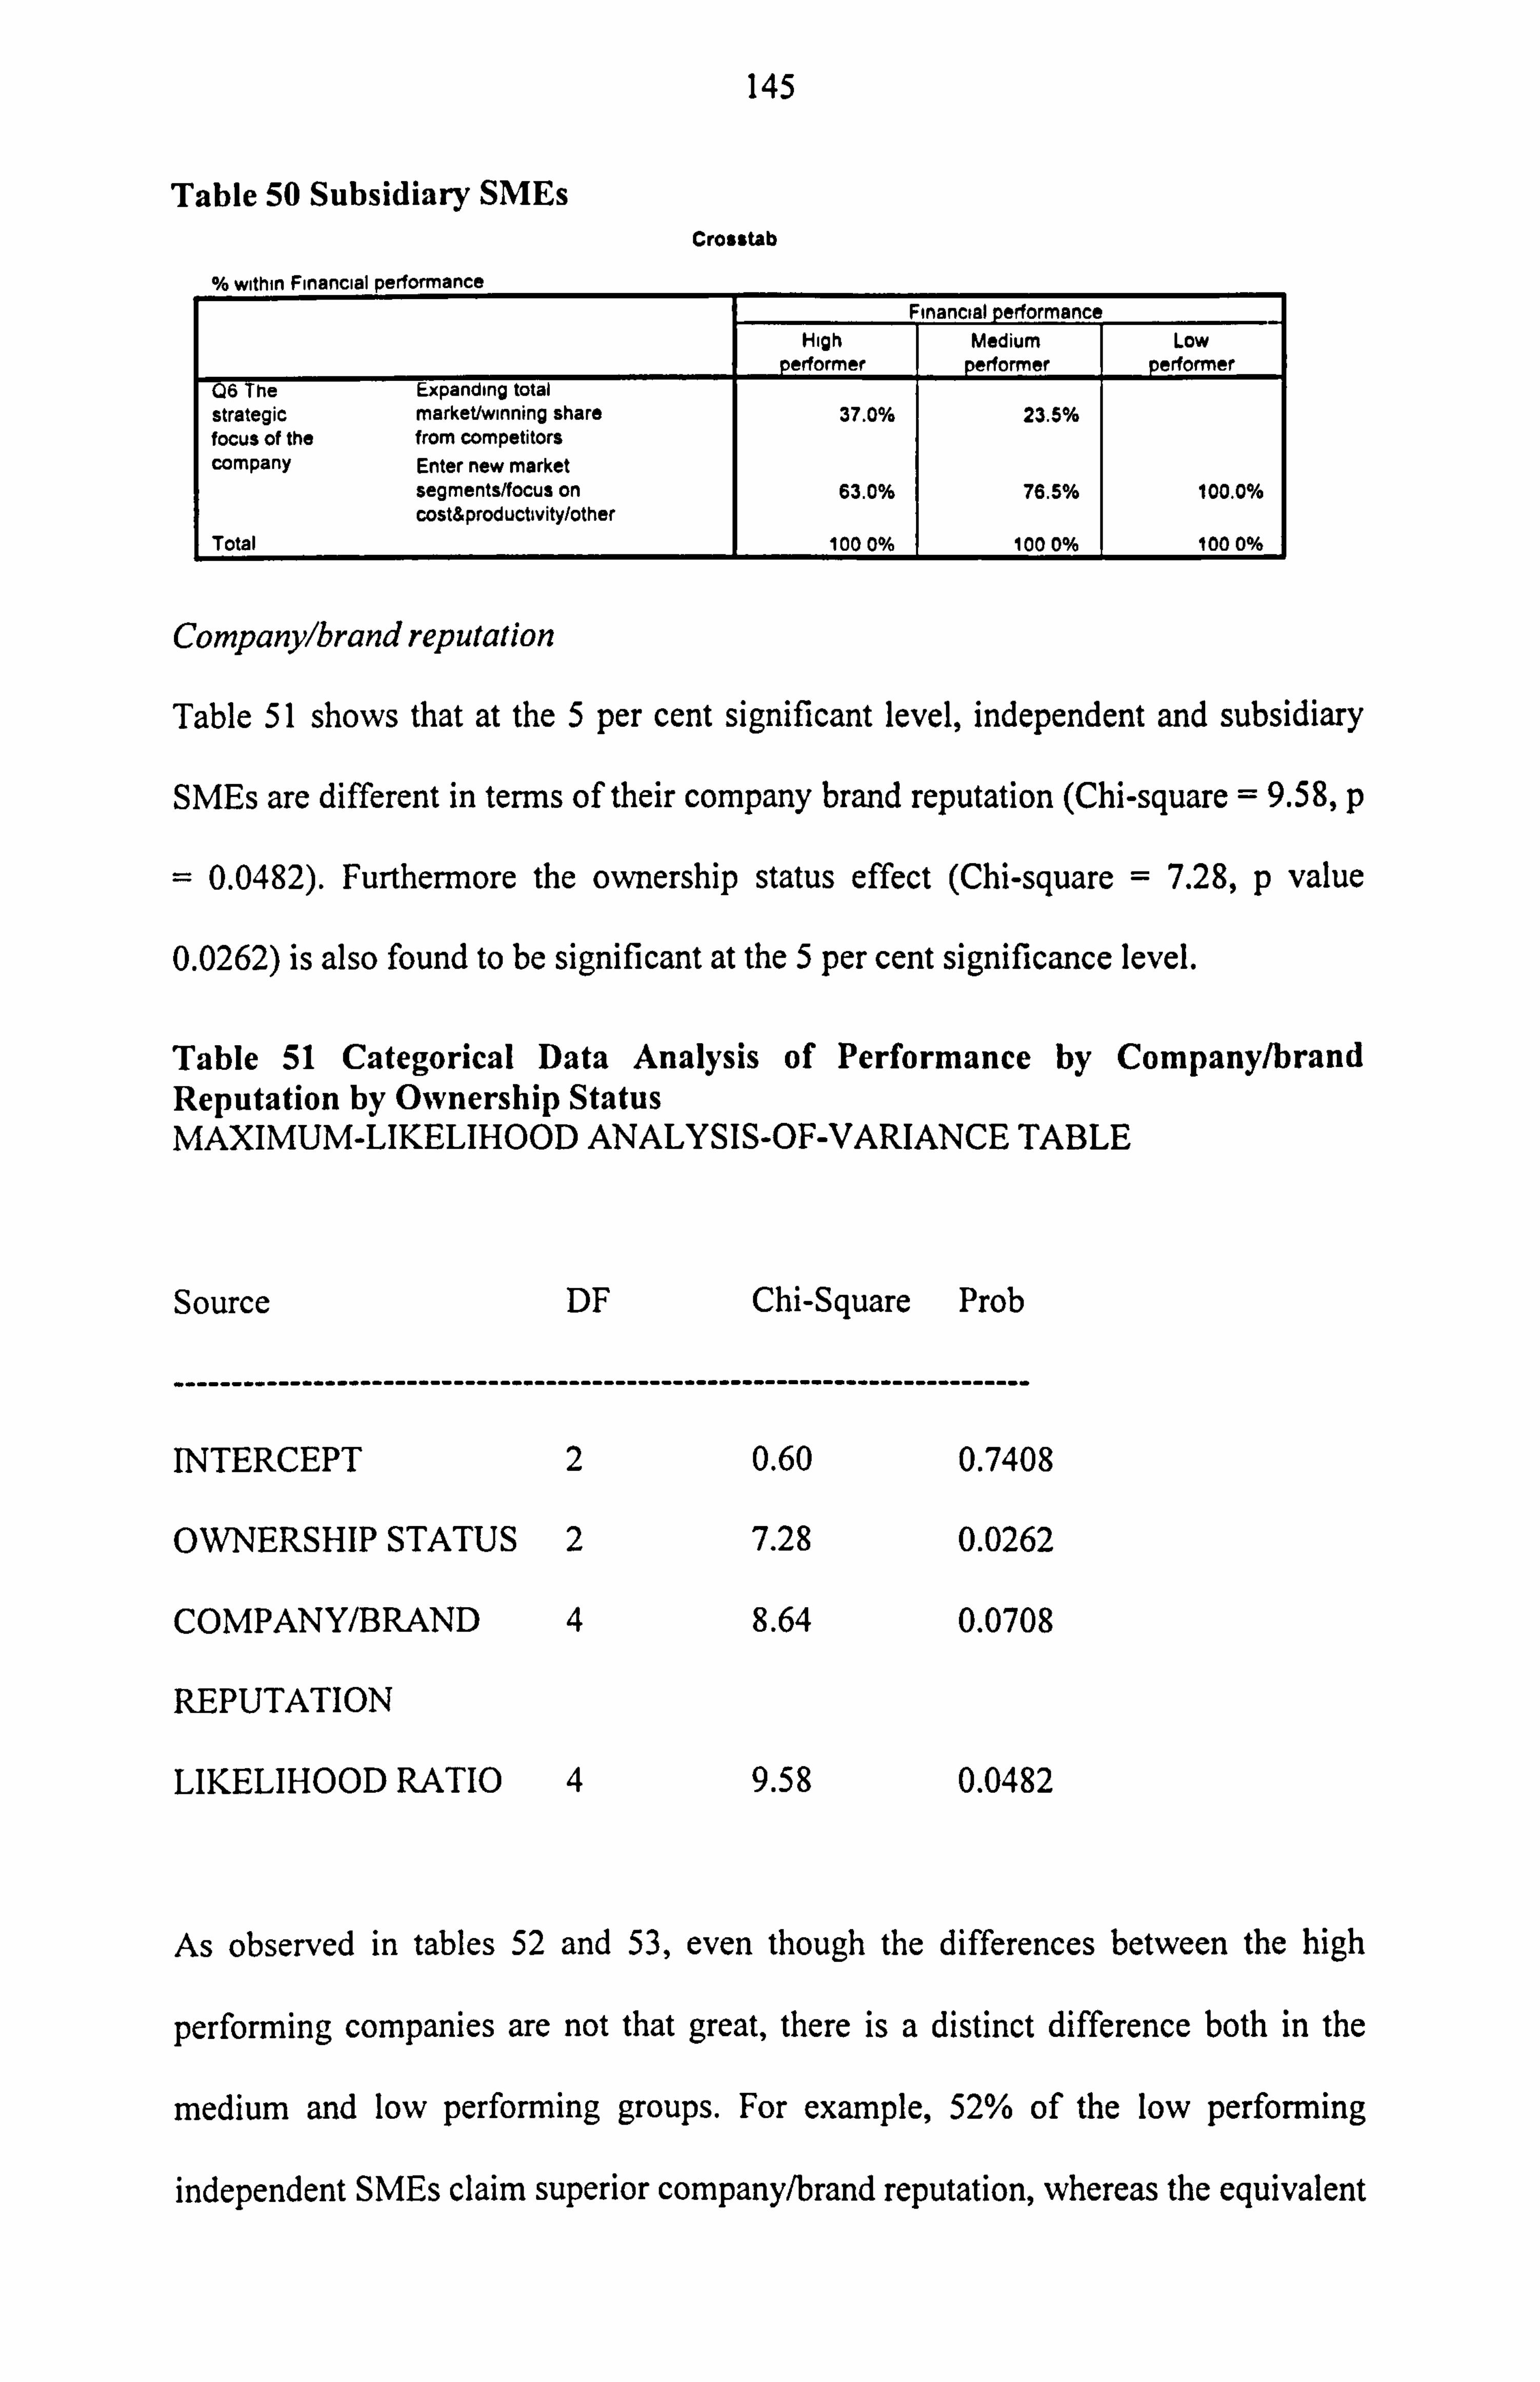
145
Table 50 Subsidiary SMEs Crosstab
o/, u, dhýn Financial nirfnrmanen
Financial performance High Medium Low
erformer performer performer 06 The Expanding total strategic markettwinning share 37.0% 23.5% focus of the from competitors company Enter new market
segments/focus on 63.0% 76.5% 100.0% cost&productivity/other
Total 1000% 1000% 1000%
Company/brand reputation
Table 51 shows that at the 5 per cent significant level, independent and subsidiary
SMEs are different in terms of their company brand reputation (Chi-square = 9.58, p
= 0.0482). Furthermore the ownership status effect (Chi-square = 7.28, p value
0.0262) is also found to be significant at the 5 per cent significance level.
Table 51 Categorical Data Analysis of Performance by Company/brand Reputation by Ownership Status MAXIMUM-LIKELIHOOD ANALYSIS-OF-VARIANCE TABLE
Source DF Chi-Square Prob
INTERCEPT 2 0.60 0.7408
OWNERSHIP STATUS 2 7.28 0.0262
COMPANY/BRAND 4 8.64 0.0708
REPUTATION
LIKELIHOOD RATIO 4 9.58 0.0482
As observed in tables 52 and 53, even though the differences between the high
performing companies are not that great, there is a distinct difference both in the
medium and low performing groups. For example, 52% of the low performing
independent SMEs claim superior company/brand reputation, whereas the equivalent
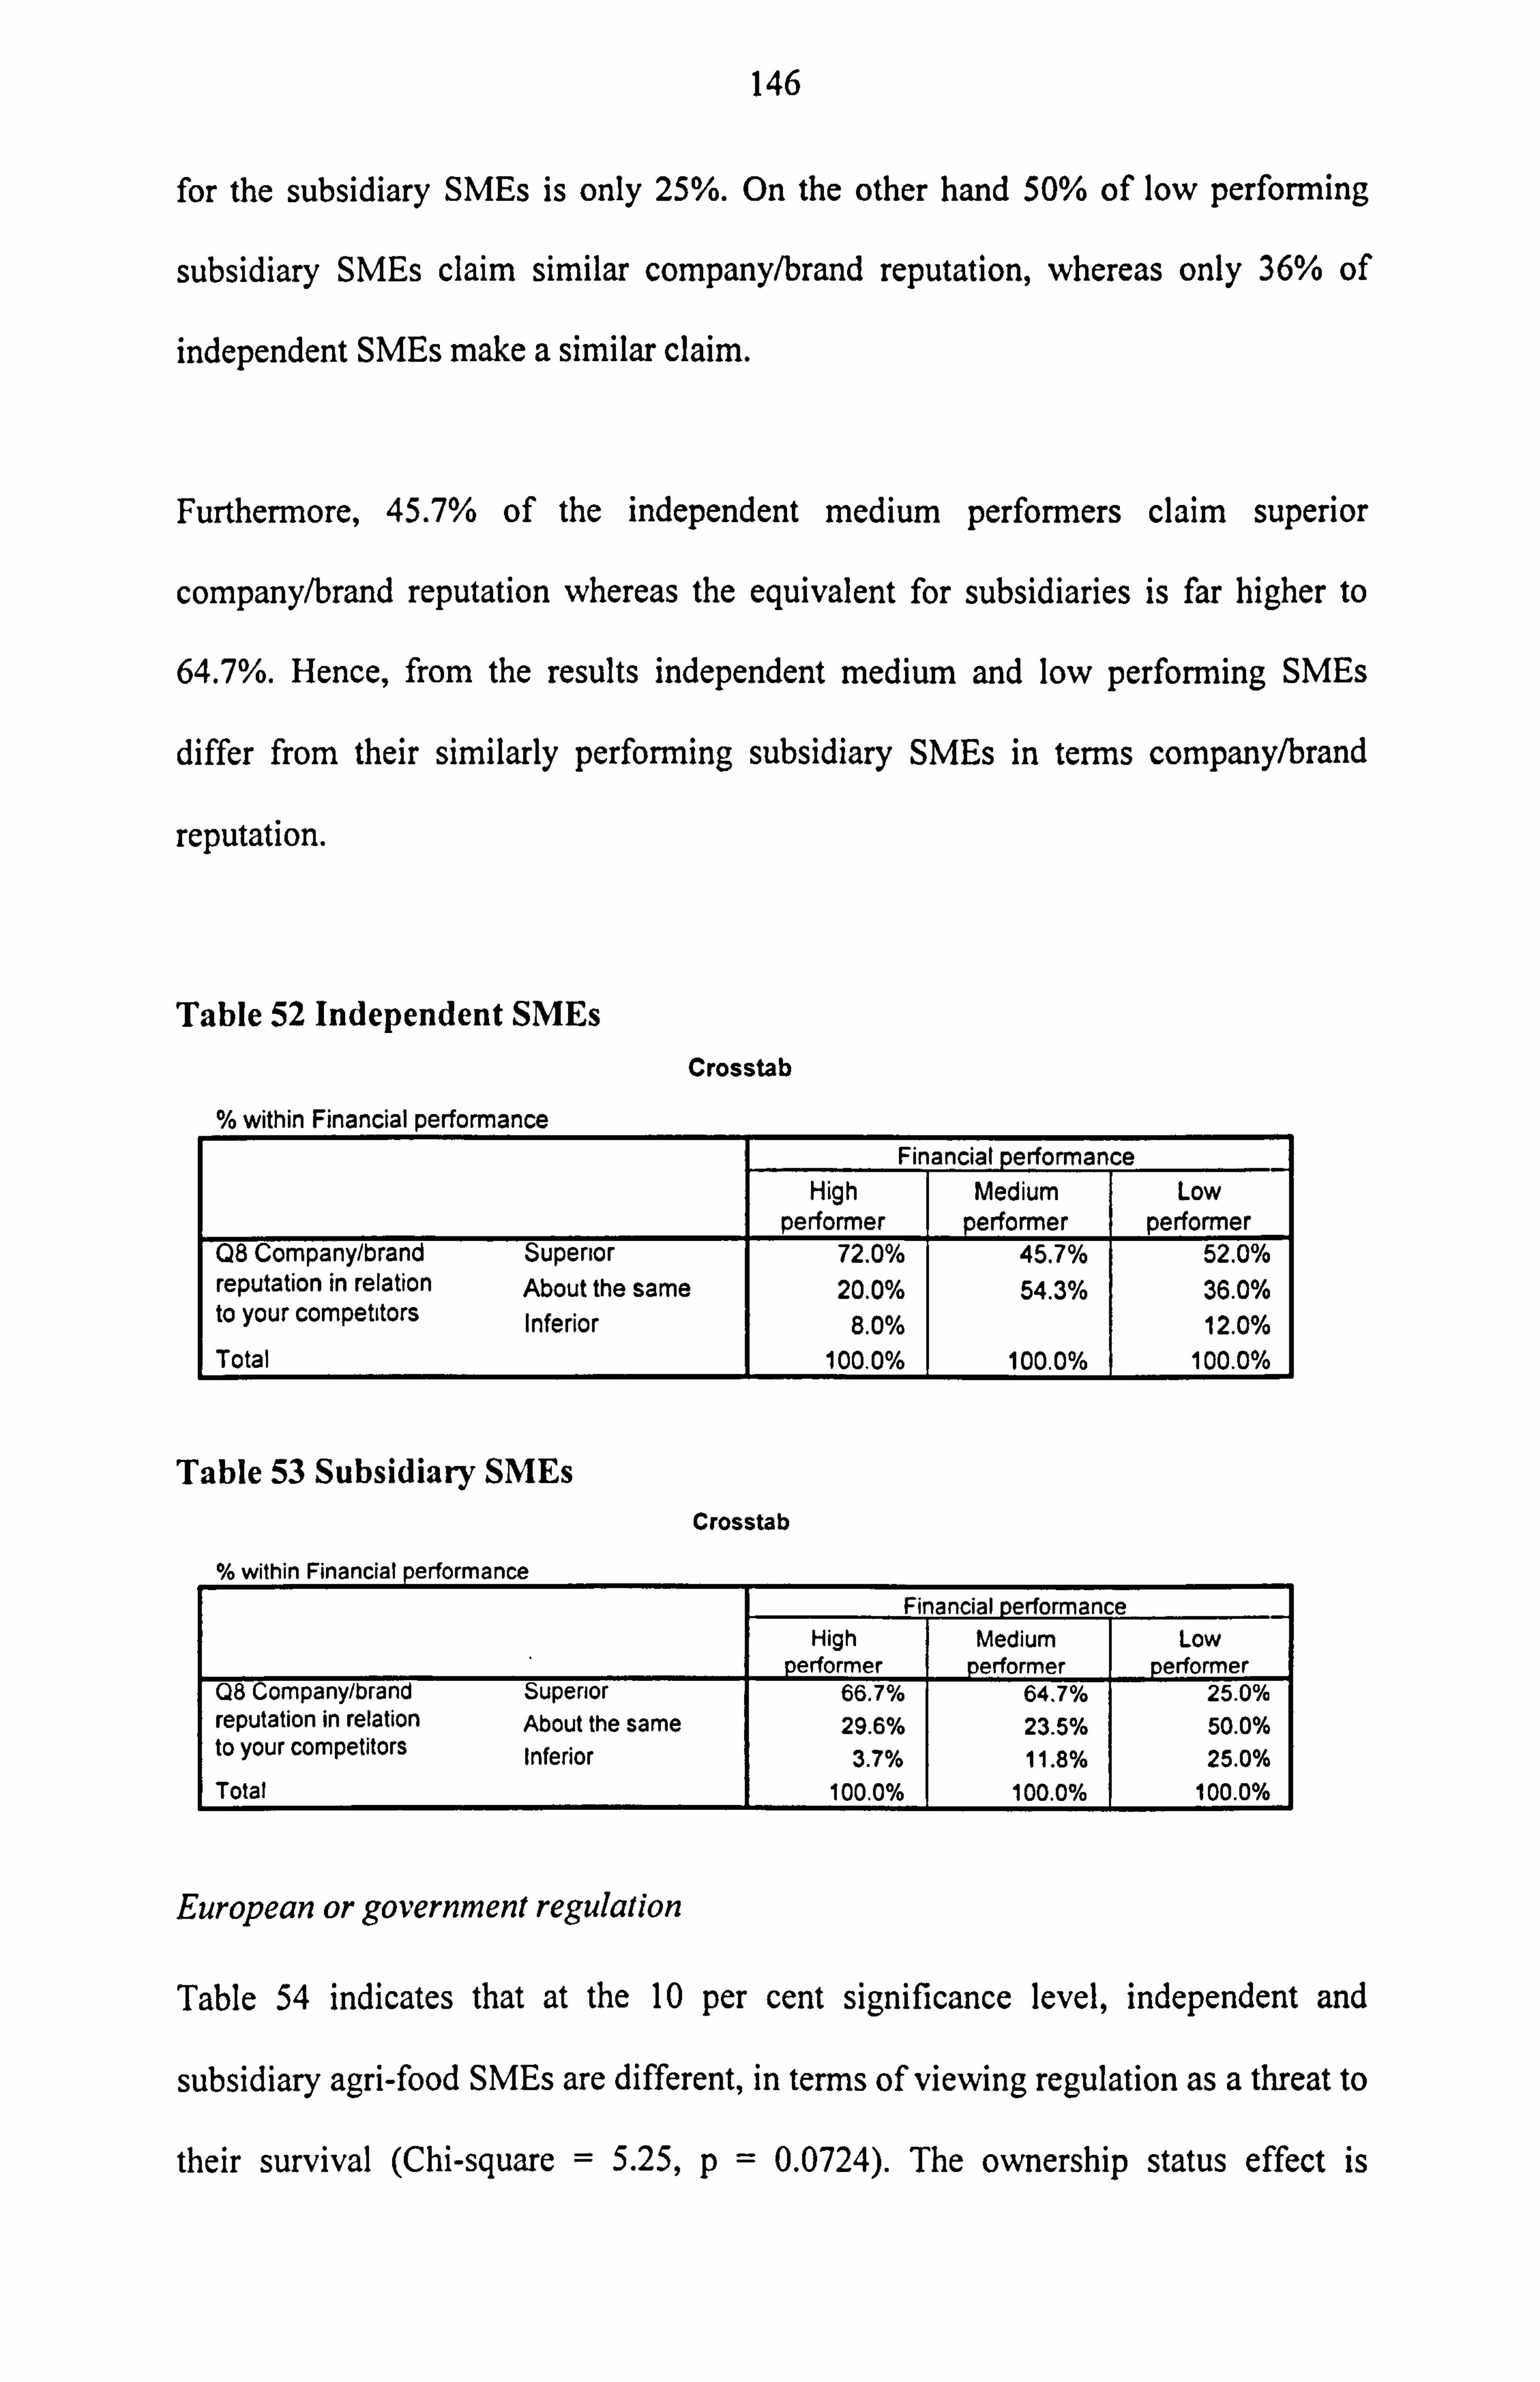
146
for the subsidiary SMEs is only 25%. On the other hand 50% of low performing
subsidiary SMEs claim similar company/brand reputation, whereas only 36% of
independent SMEs make a similar claim.
Furthermore, 45.7% of the independent medium performers claim superior
company/brand reputation whereas the equivalent for subsidiaries is far higher to
64.7%. Hence, from the results independent medium and low performing SMEs
differ from their similarly performing subsidiary SMEs in terms companylbrand
reputation.
Table 52 Independent SMEs Crosstab
within Financial performance Financial performance
High Medium Low performer performer performer
Q8 Company/brand Superior 72.0% 45.7% 52.0% reputation in relation About the same 20.0% 54.3% 36.0% to your competitors Inferior 8.0% 12.0% Total 100.0% 100.0% 100.0%
Table 53 Subsidiary SMEs Crosstab
o/ within Finnnrial nerfnrmanra
Financial erformance High Medium Low
perform r er performer Q8 Company/brand Superior 66.7% 64.7% 25.0% reputation in relation About the same 29.6% 23.5% 50.0% to your competitors Inferior 3.7% 11.8% 25.0% Total 100.0% 100.0% 100.0%
European or government regulation
Table 54 indicates that at the 10 per cent significance level, independent and
subsidiary agri-food SMEs are different, in terms of viewing regulation as a threat to
their survival (Chi-square = 5.25, p=0.0724). The ownership status effect is
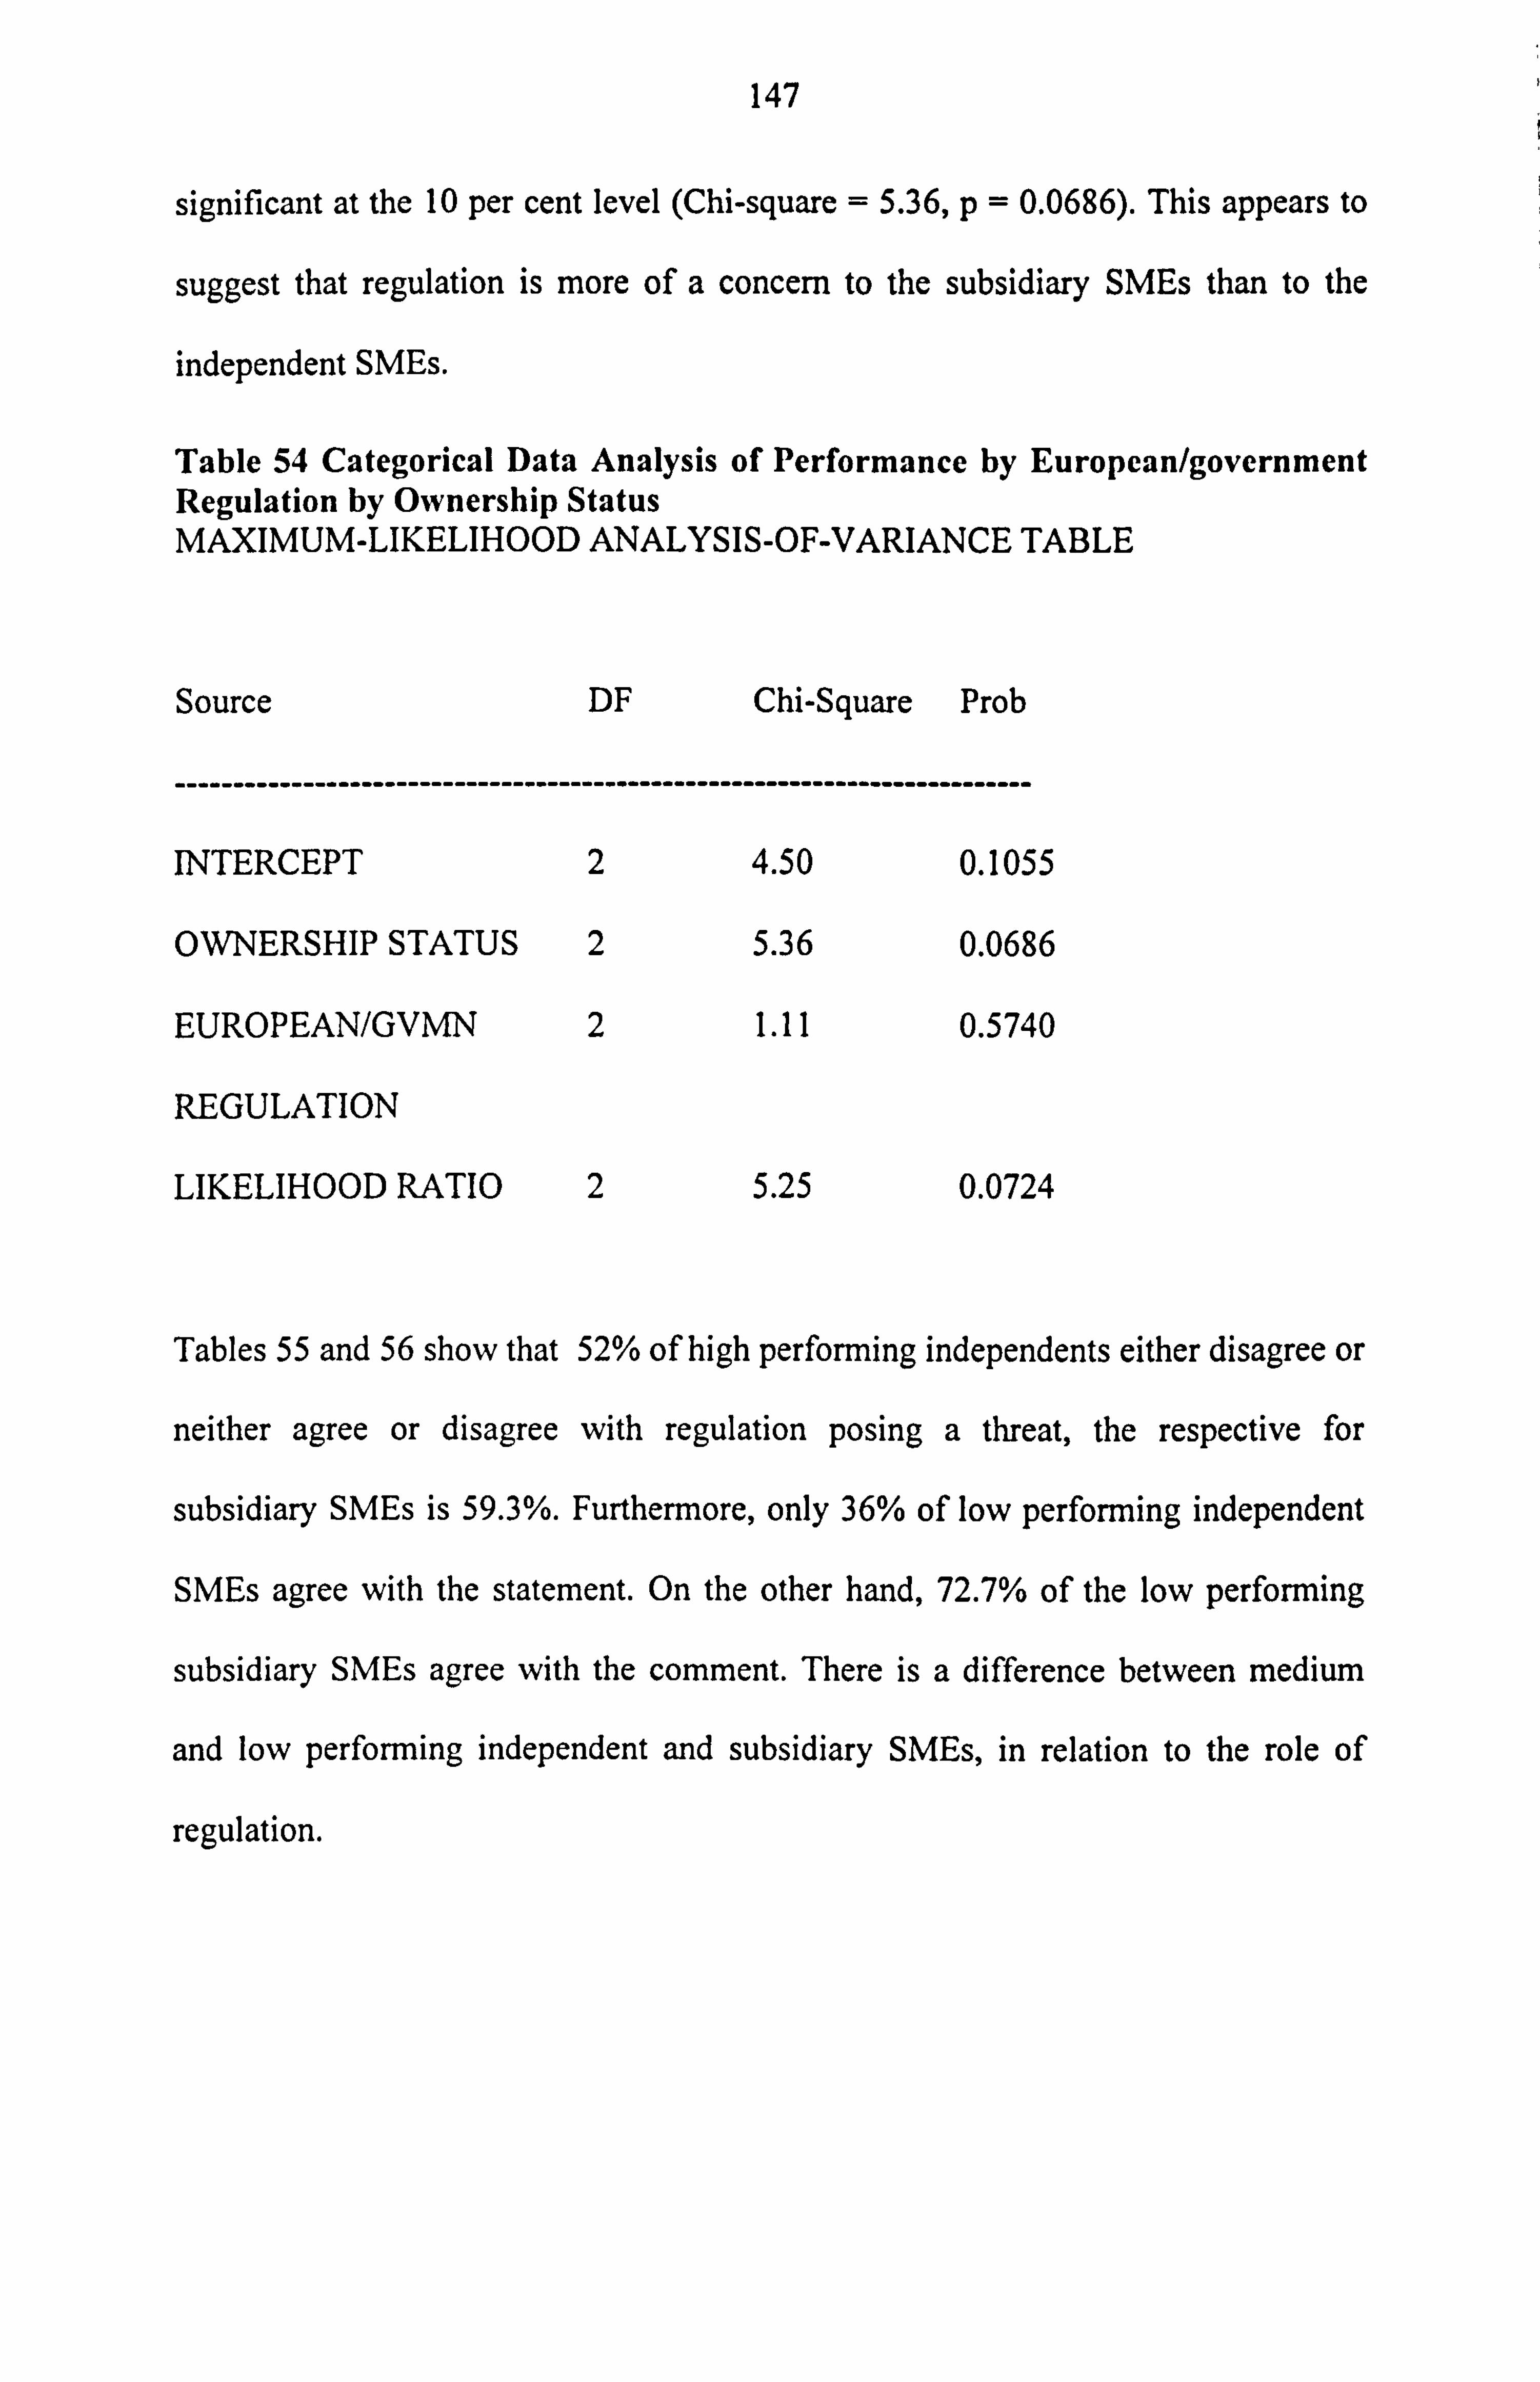
147
significant at the 10 per cent level (Chi-square = 5.36, p=0.0686). This appears to
suggest that regulation is more of a concern to the subsidiary SMEs than to the
independent SMEs.
Table 54 Categorical Data Analysis of Performance by European/government Regulation by Ownership Status MAXIMUM-LIKELIHOOD ANALYSIS-OF-VARIANCE TABLE
Source DF Chi-Square Prob
---------------------------------
INTERCEPT
----------
2
-------------------
4.50
------------
0.1055
OWNERSHIP STATUS 2 5.36 0.0686
EUROPEAN/GVMN 2 1.11 0.5740
REGULATION
LIKELIHOOD RATIO 2 5.25 0.0724
Tables 55 and 56 show that 52% of high performing independents either disagree or
neither agree or disagree with regulation posing a threat, the respective for
subsidiary SMEs is 59.3%. Furthermore, only 36% of low performing independent
SMEs agree with the statement. On the other hand, 72.7% of the low performing
subsidiary SMEs agree with the comment. There is a difference between medium
and low performing independent and subsidiary SMEs, in relation to the role of
regulation.
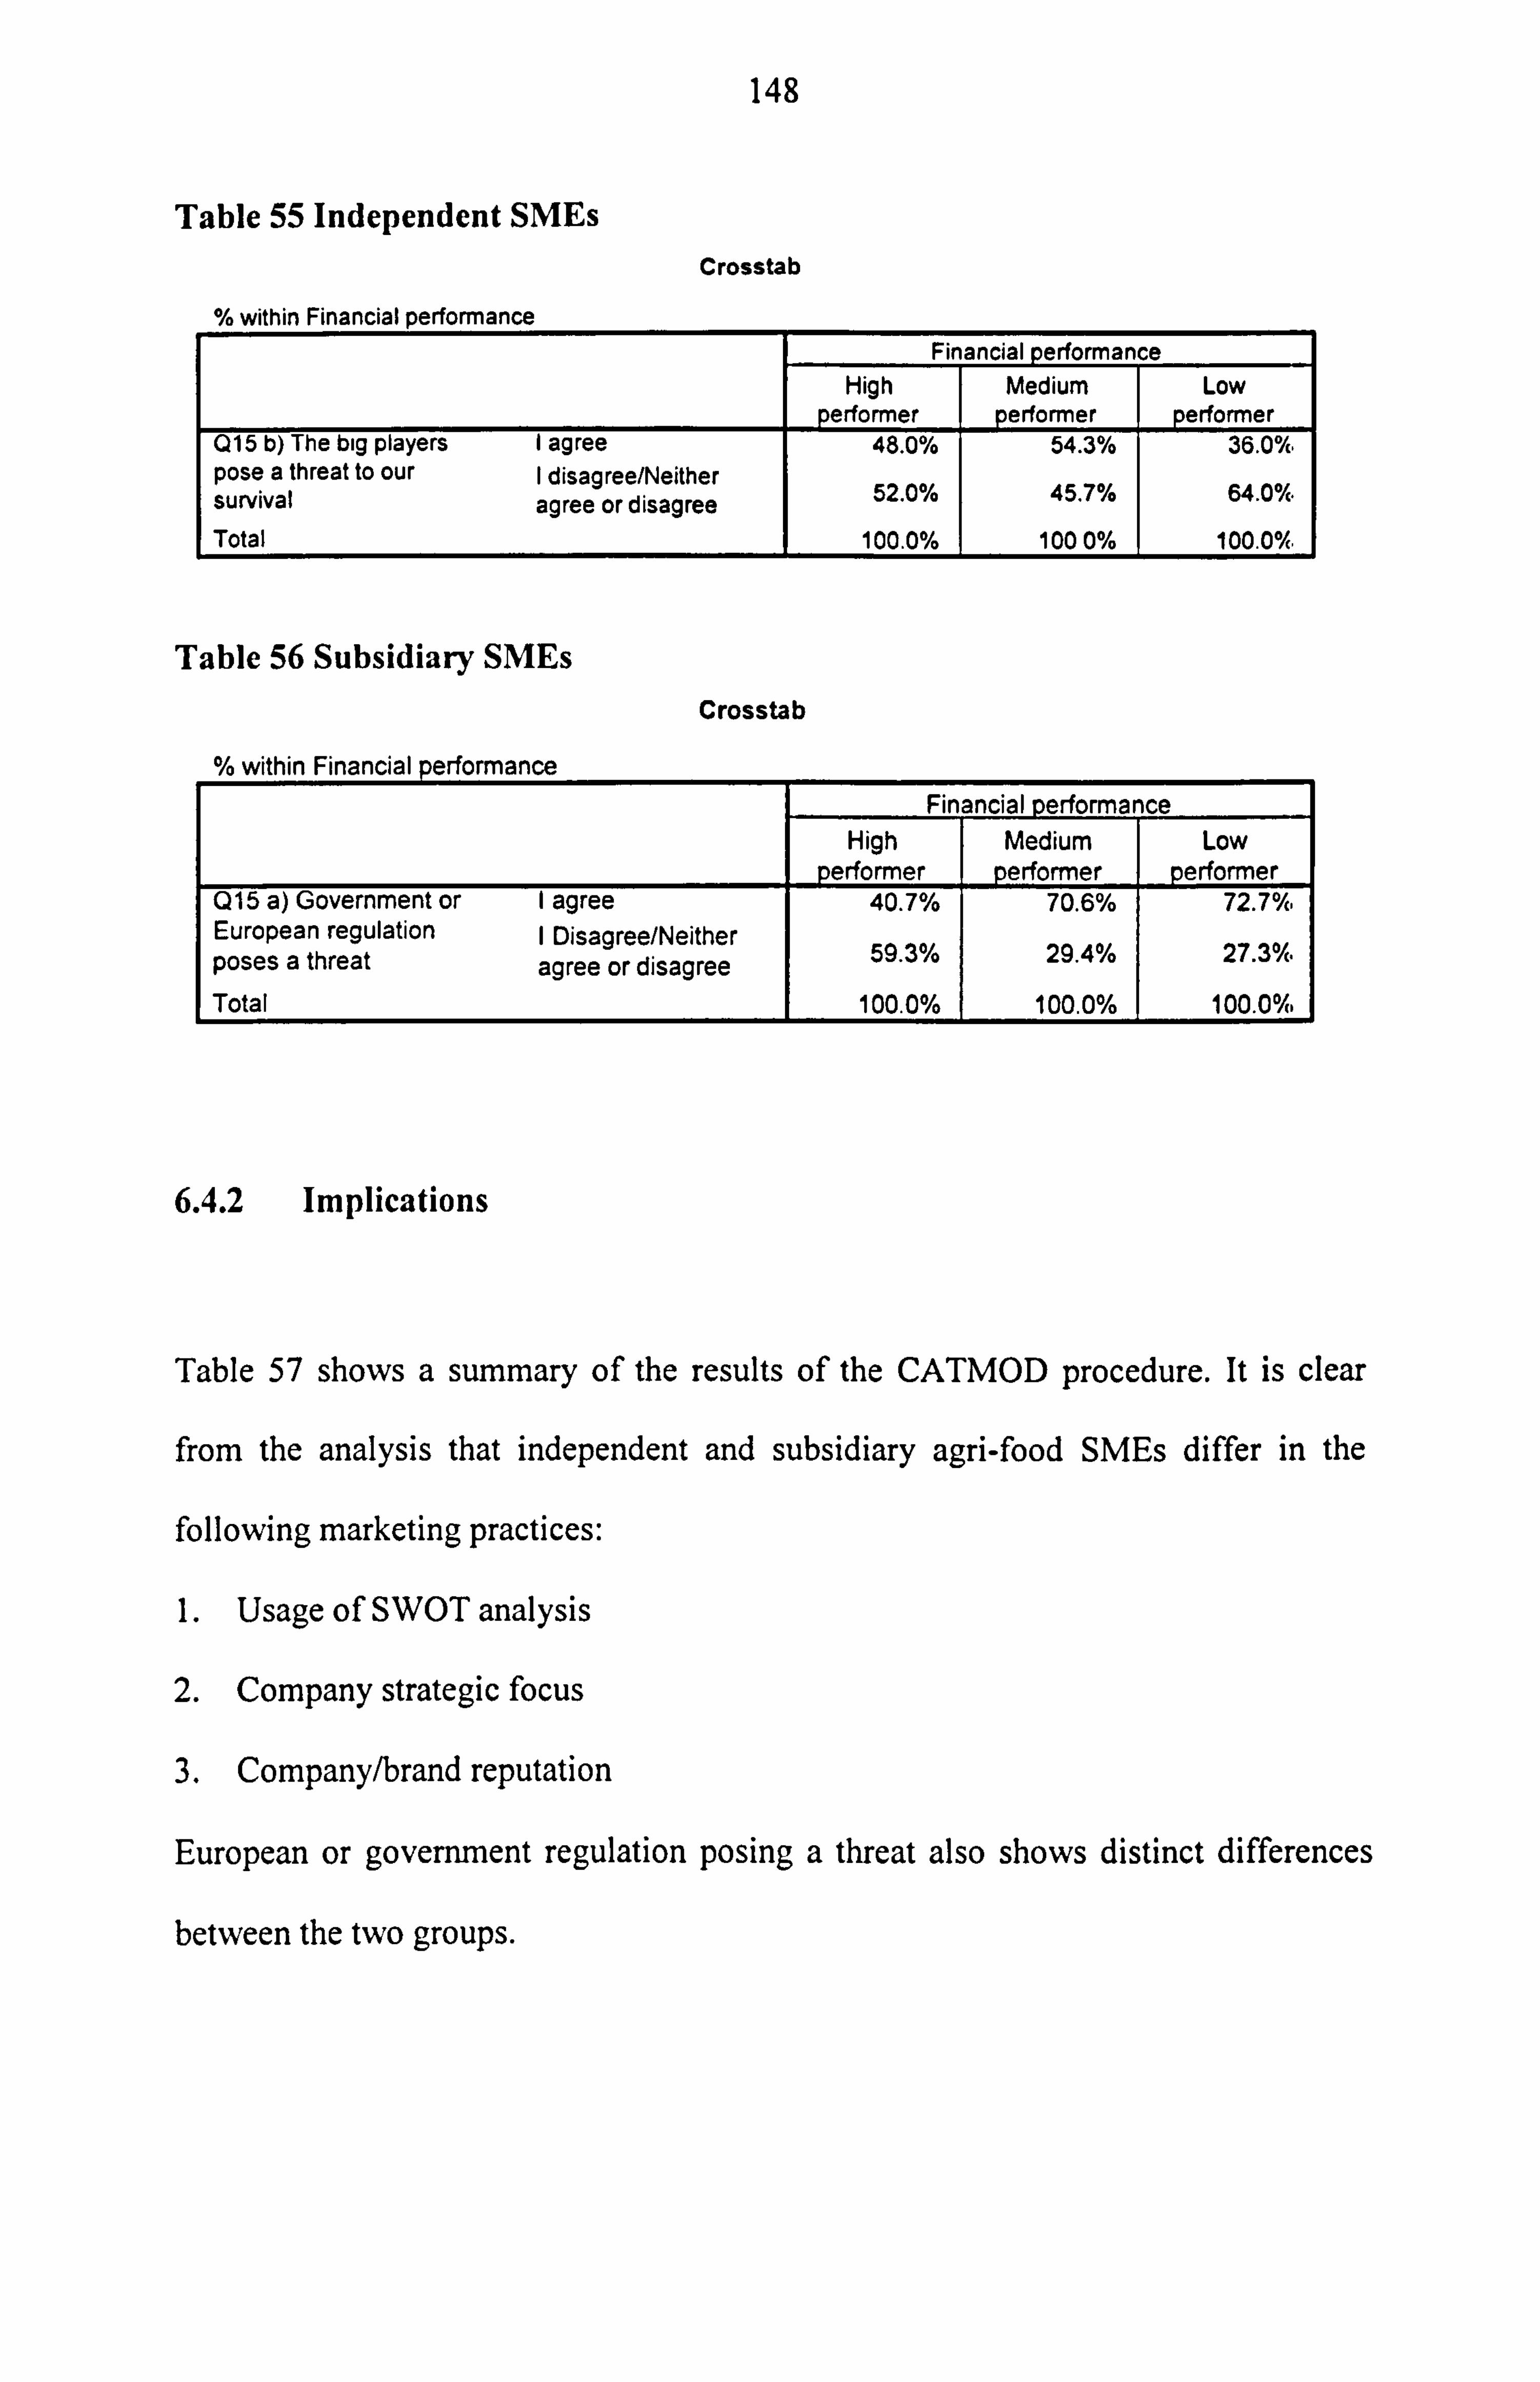
148
Table 55 Independent SMEs Crosstab
within Financial oerformance Financial performance
High Medium Low performer performer performer
Q15 b) The big players I agree 48.0% 54.3% 36.0%. pose a threat to our I disagree/Neither survival agree or disagree o 52.0% 0 45.7% . 64.00
Total 100.0% 1000% 100.00/c.
Table 56 Subsidiary SMEs Crosstab
o/ within Financial nerfnrmanca
Financial erformance High Medium Low
performer performer performer Q15 a) Government or I agree 40.7% 70.6% 72.70/c. European regulation I Disagree/Neither poses a threat agree or disagree o 59.3 /0 0 29.4 /0 27.30/c.
Total 100.0% 100.0% 100.00%
6.4.2 Implications
Table 57 shows a summary of the results of the CATMOD procedure. It is clear
from the analysis that independent and subsidiary agri-food SMEs differ in the
following marketing practices:
1. Usage of SWOT analysis
2. Company strategic focus
3. Company/brand reputation
European or government regulation posing a threat also shows distinct differences
between the two groups.
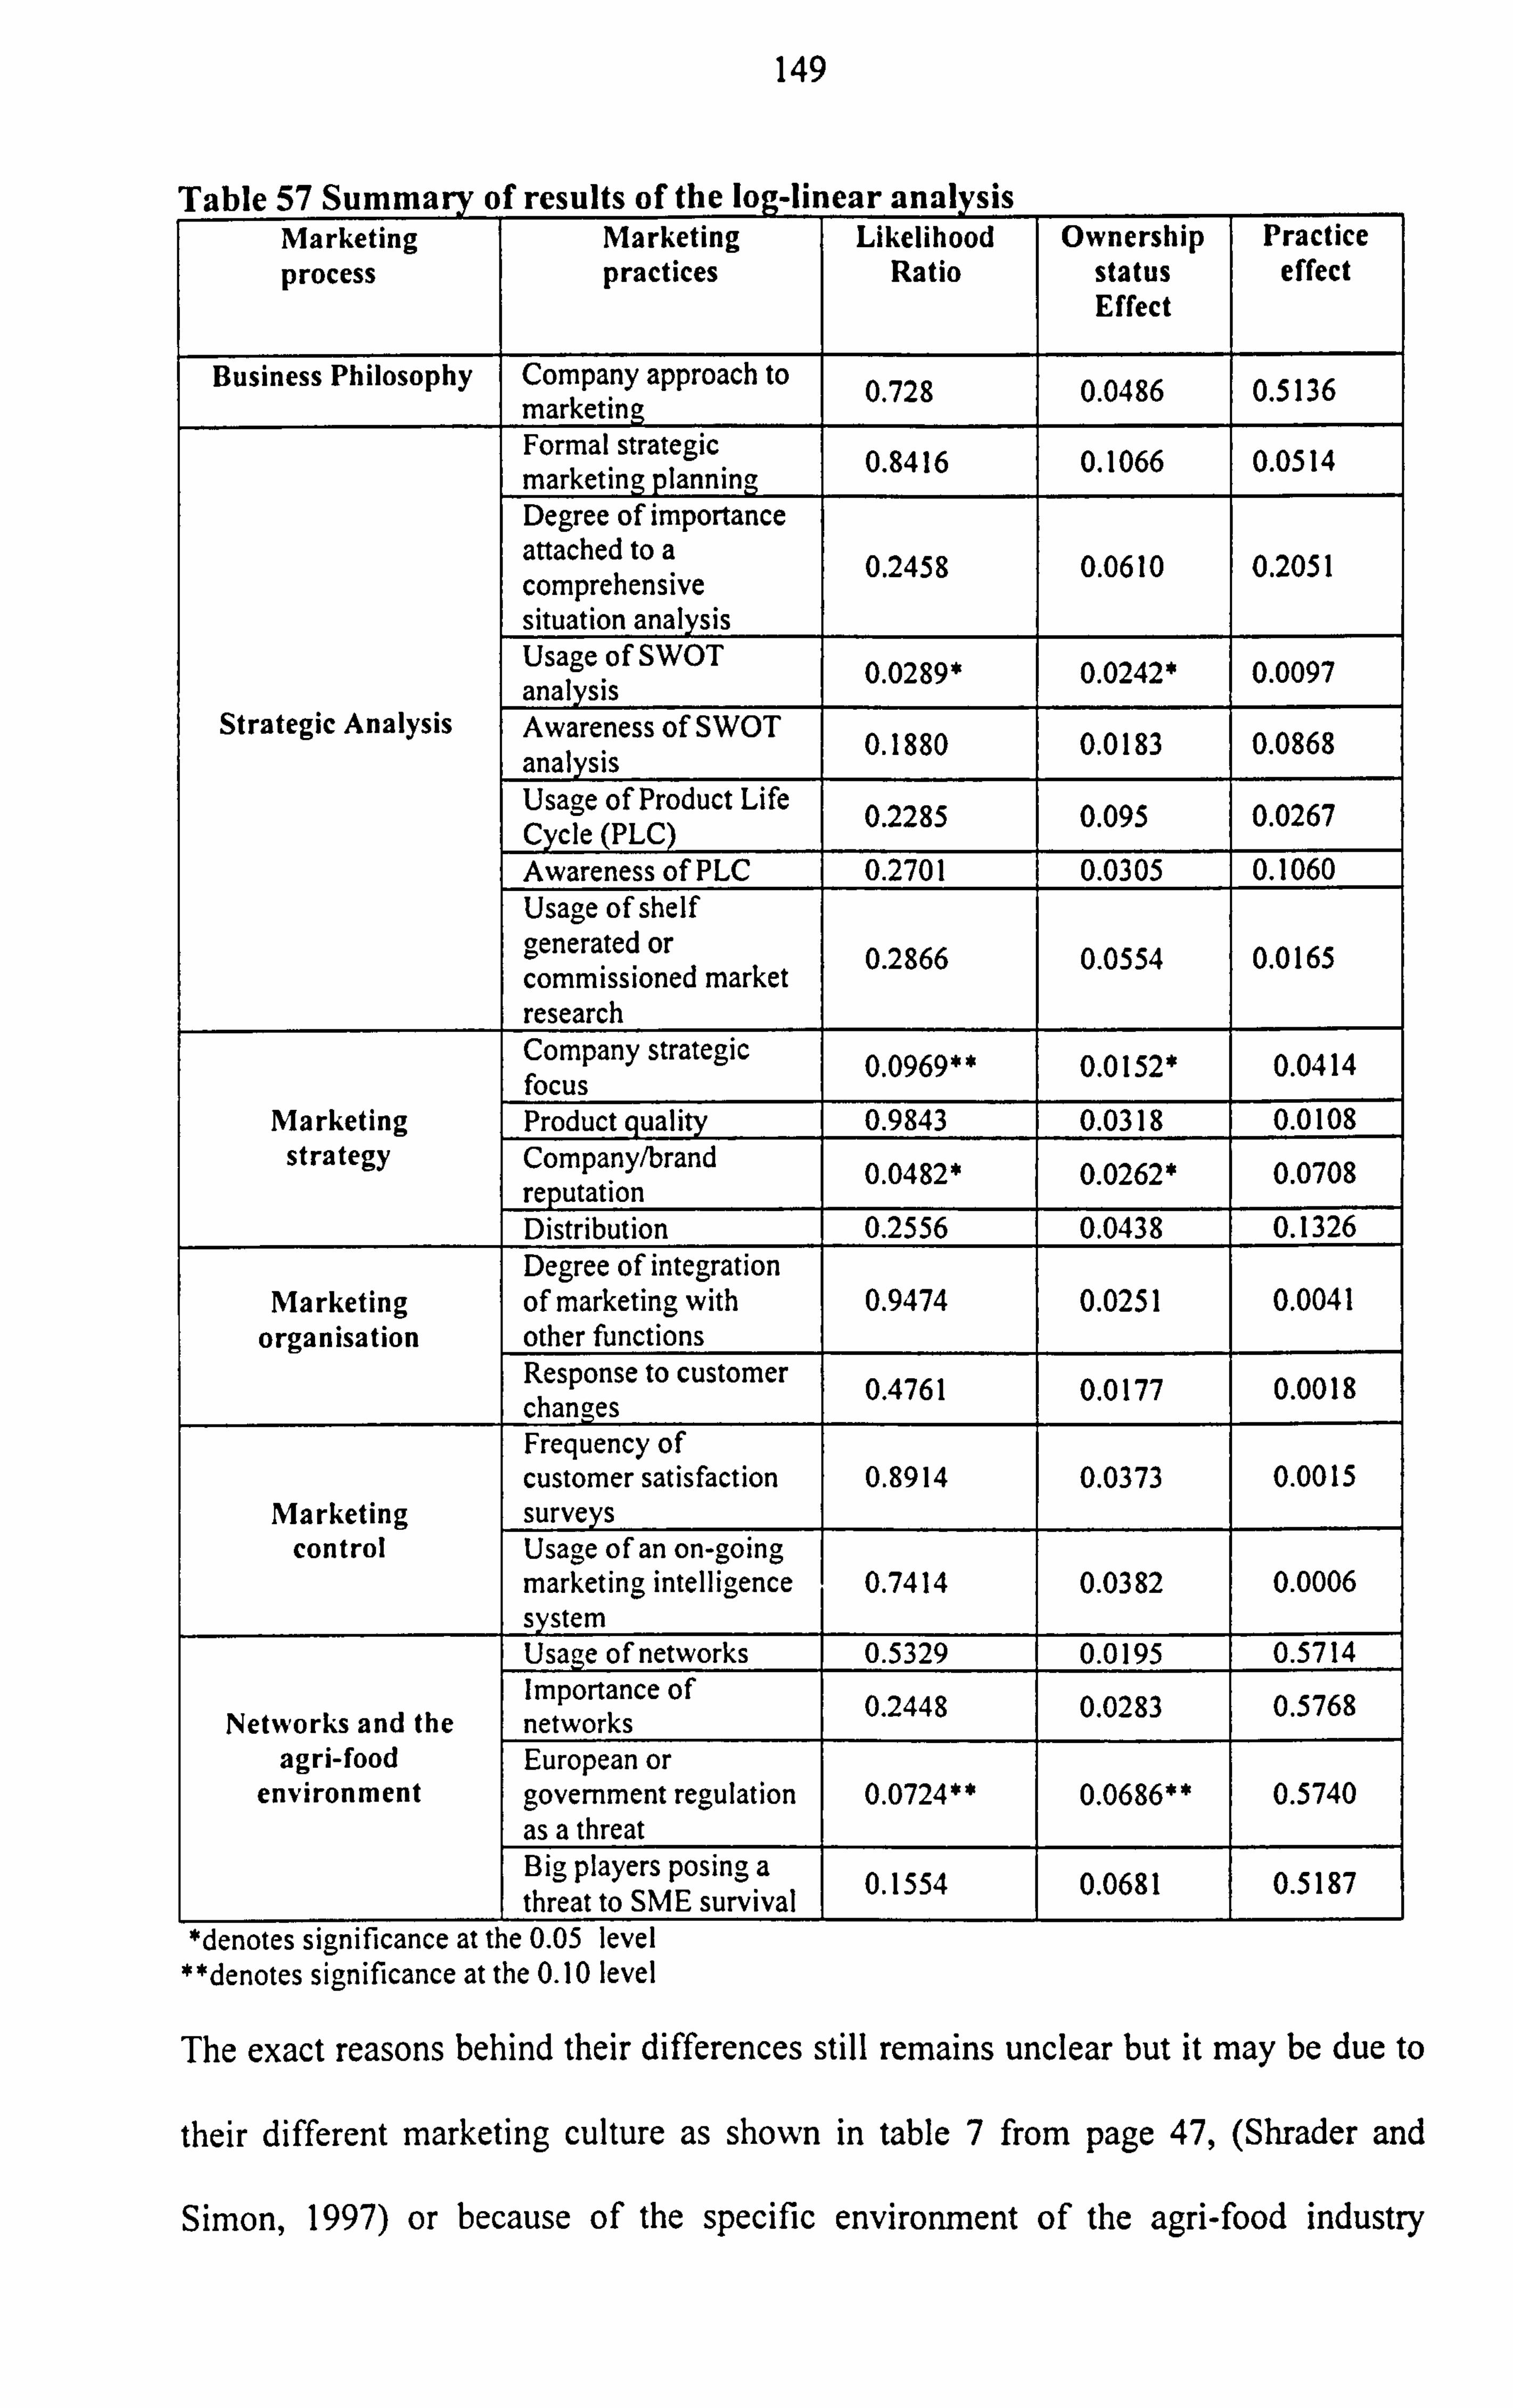
149
Tahle 57 Summary of results of the log-linear analysis Marketing Marketing Likelihood Ownership Practice process practices Ratio status effect
Effect
Business Philosophy Company approach to 0.728 0.0486 0.5136 marketin Formal strategic 0 8416 0.1066 0.0514 marketing planning . Degree of importance attached to a 0.2458 0.0610 0.2051 comprehensive situation analysis Usage of SWOT 0.0289* 0.0242* 0.0097 analysis
Strategic Analysis Awareness of SWOT 0.1880 0.0183 0.0868 analysis Usage of Product Life 0 2285 0 095 0.0267 Cycle (PLC) . . Awareness of PLC 0.2701 0.0305 0.1060 Usage of shelf generated or 0.2866 0 0554 0.0165 commissioned market . research Company strategic 0.0969** 0.0152* 0.0414 focus
Marketing Product quality 0.9843 0.0318 0.0108 strategy Company/brand 0.0482* 0.0262* 0.0708
reputation Distribution 0.2556 0.0438 0.1326 Degree of integration
Marketing of marketing with 0.9474 0.0251 0.0041 organisation other functions
Response to customer 0.4761 0177 0 0.0018 changes . Frequency of customer satisfaction 0.8914 0.0373 0.0015
Marketing surve s control Usage of an on-going
marketing intelligence 0.7414 0.0382 0.0006 system Usage of networks 0.5329 0.0195 0.5714 Importance of 0.2448 0 0283 0.5768 Networks and the networks .
agri-food European or environment government regulation 0.0724** 0.0686** 0.5740
as a threat Big players posing a 0 1554 0681 0 0.5187 threat to SME survival . .
*denotes significance at the 0.05 level **denotes significance at the 0.10 level
The exact reasons behind their differences still remains unclear but it may be due to
their different marketing culture as shown in table 7 from page 47, (Shrader and
Simon, 1997) or because of the specific environment of the agri-food industry
150
(Ritson, 1997; Grunert, 1996). Thus, the evidence from this section supports the
notion that marketing behaviours and practices within a specific environment may be
different between subsidiary and independent SMEs. In other words, their ownership
status may be a determinant of their marketing behaviours, and researchers interested
in SMEs should distinguish between these two if they are to make reasonable
recommendations and conclusions for their marketing.
6.5 Conclusions
This chapter reports the main survey findings of 141 agri-food SMEs in the North of
England. The subsidiary, independent and the whole agri-food samples showed
interesting results. Distinct marketing practices like for example usage of SWOT
analysis and use of customer research contribute to their success. However, other
marketing practices have an impact only on one group and not on the other. For
example, company/brand reputation seems to be related with high performing
independent SMEs, but not subsidiary SMEs. Discriminant analysis also showed the
degree of importance of some of the results found in the Chi-square analysis. For
example, the importance of an on-going intelligence gathering system was found in
the subsidiary, independent and the whole agri-food groups, as the most important
variable for the success of agri-food SMEs. This section also showed where policy
should be mainly targeted to, if it is to become more effective. It is worth mentioning
that the discriminant functions of all three groups had relatively low goodness of fit
scores' (around 30%). This suggests that there are other factors influencing the two
The percentage of variance in the dependent variable (performance groups) that can be explained
by the function.
151
groups of successful and medium/low performance. However, the results show that
not following some marketing practices is associated with the lower performance
group. In other words agri-food SMEs need to practice marketing so that they will
not enter the lower performing group. However, marketing on its own, is not
sufficient to achieve high performance.
The final part of this chapter explained the role of ownership effect on the marketing
practices of the SMEs. It showed that there are four areas of differences in marketing
practices, because of the ownership status of the company, namely the way of use of
SWOT analysis, the strategic focus and brand reputation of the company, and finally
the role of regulation. By comparison with similar studies, (Brooksbank et al, 1992)
the results show some agreement in that most successful agri-food SMEs have a
good knowledge of the main principles of marketing. However, the reasons behind
their decisions, and the fact that marketing is not the main business philosophy of
this industry, raises further questions about the marketing practices of these
companies. Therefore, a more in depth qualitative methodology like case studies and
personal interviews, seem to advance knowledge of this industry's marketing
activities. Hence, having provided a quantitative analysis of the marketing practices
of agri-food SMEs and their impact on performance, this study will progress with a
detailed in-depth analysis of five successful cases selected from the sample,
examining in more detail the practices of the companies, and verifying the results of
the main survey.
152
Chapter 7 CASE STUDY RESULTS
7.1 Introduction
The previous chapter discussed the importance of the survey methodology in order to
identify the marketing practices most associated with high performance. It also
distinguished between subsidiary and independent agri-food SMEs and identified
differences, either due to their marketing practices or ownership status. This chapter
reports on the results of five case studies of agri-food SMEs in the Northeast. Details
of the firms are shown in the table below. All five firms are operating in the agri-
food industry as defined in chapter 4, and are based in the North of England. Three
of them are independently owned whereas two of them are subsidiary companies of
multinational companies. The products that they sell include sandwiches, fresh fruit
salads, fruit and vegetables, ready made meals and meat. The focus of this chapter is
on why and how do successful (chosen by their responses in the questionnaire) agri-
food SMEs practice marketing the way they do as well as confirm the results of the
survey. Furthermore a detailed analysis of two cases, one independent and one
subsidiary agri-food SME, is given in appendix f. This is done to provide evidence
for this chapter. Finally, this chapter develops a theory of successful marketing of
agri-food SMEs and makes policy recommendations, in order to improve the
performance and competitiveness of the UK agri-food industry.
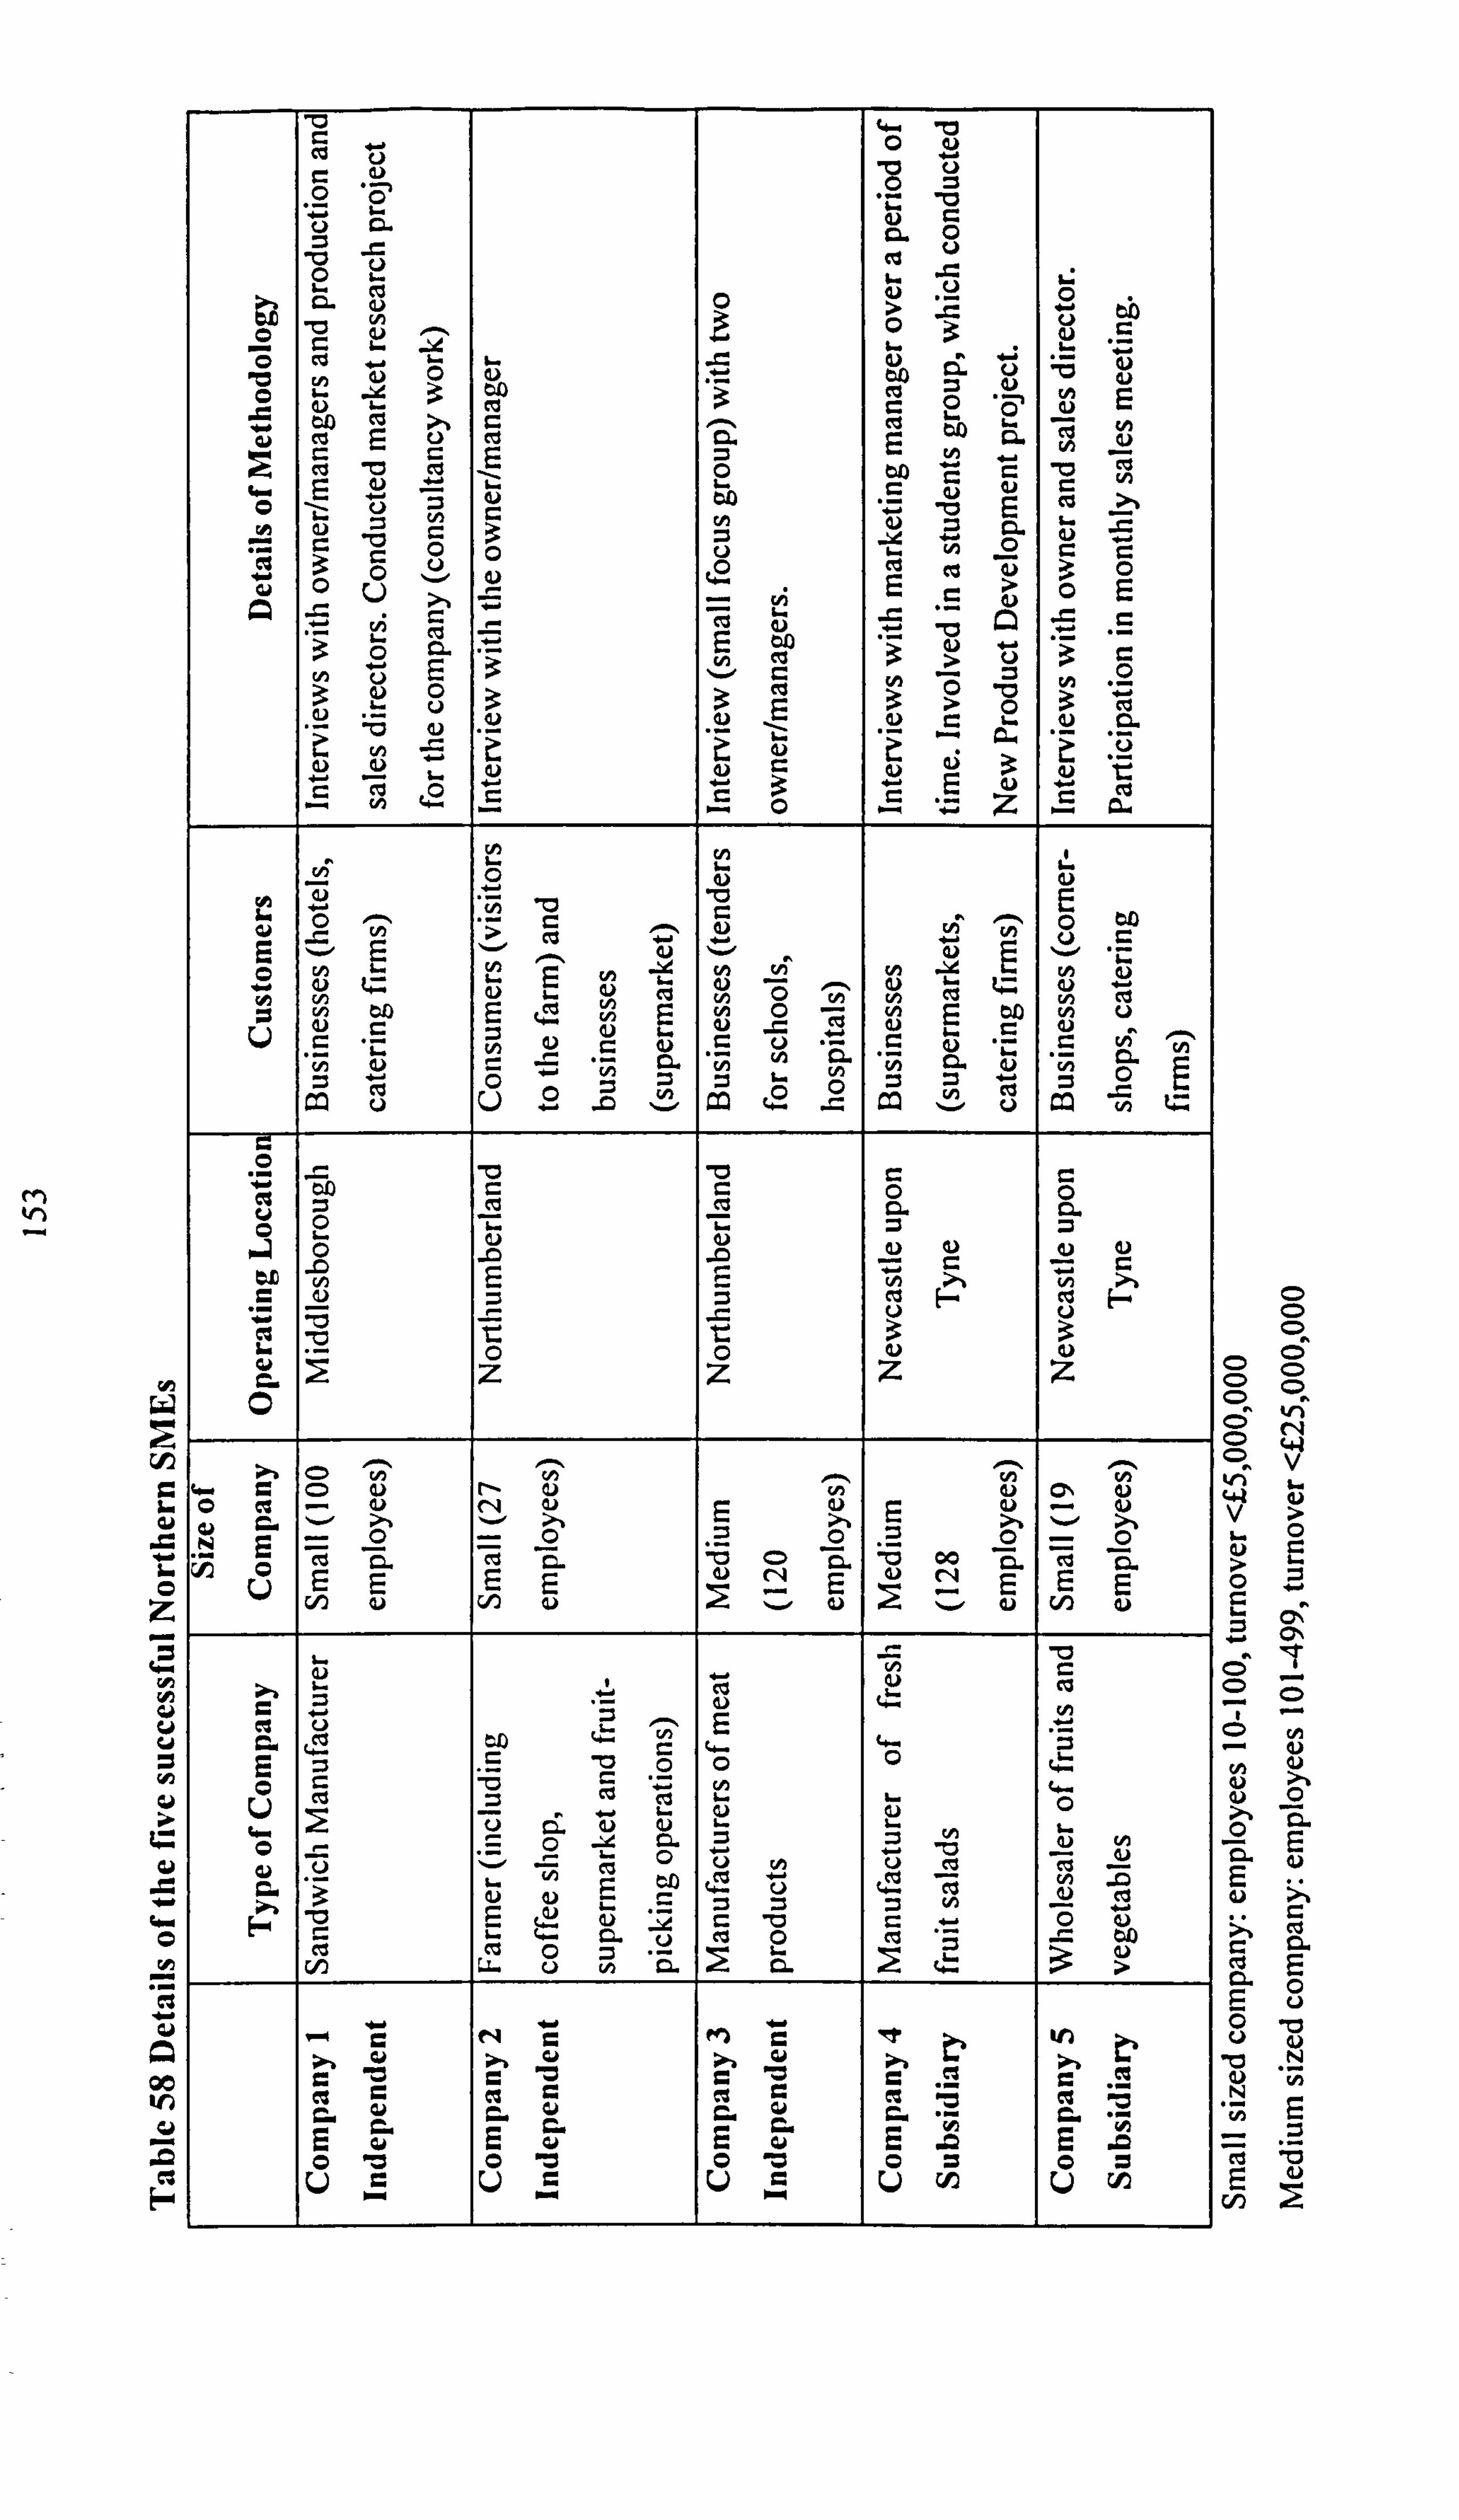
M N
_o
73 r
o O
o
r G
v Ö
ä `f,
w 0
L
0 L
-rj
'C
-o
3 a"i &- : O '=
s
O
"= m Ä
CA CA ý mw O
O 3 o
y
'' L- E
=
0 U
ö
y
0 3 0 O
73 V1 o
ý,
E
4o
0
Cl
V C. o
aý
3 3 G)
c
w
ä
O to Vl
U w - &
3
c
ý'
C
L 3
bA c
bA ° '0
b. (1 E
3
N
c
o
= U 0
N
ca 5
> ° L
º-
-Z
y
o ä
C " 0
O V >
> ö L a °Z
Z
'G c
'ý t Cl C
0
3
C)
c
u u E-
y
>,
C o
ö
cu a
td
rA O
..
N u 0
C G)
v`ni C
C]
L"
t4
bA r.
v
0
V
y
rA
U
10 E
L
O
°
y
v`ýi C
.ö
-
cd E
O
10
y
=
CC
fn
o O U
c°
^
°
N
C
W
`
E
O
bA ' Z�
v
Cn
v`ni E-
m
"w
v
(4
CA
tom,
o 'cl ö
.4 u
s
o o
-0
Cl
.0
Cl 0 > aý =
0
L
°' ý
0 ý z
o ý
z 3
z F- 3
z E-ý
C
c.. C O 4) N- C) vi 0)) O\ V
O N
G E
V -
Ö -ý Ö ?
' Ö
? ý
Ö v -
Ö
_ V
iö
E Q
aýi
Cl
cn
0. v O a v cc p,
00i
G E
U
je o
ti) = 'ß
Cd
am
r- O
Cl S
C- O L
4. O
L L
4,
o
O G , iý F"
2
V
'3 ,ý c vD
U
ý.. ý y
L L
Ö.
^
w
°
G )
F L fl. H
4)
O
U
n.
U
c: °. 7 Cl
Vý v O
0 ä
U
cý O
Cl
y
L
cC äi
3
c'Ol 4-
>
-
C
E
p
ä'
N
C
E Q
try
C
0
C
V
'ý .
C
E
E
0
In
C
E a O "O O 'O O 'O O O O O
z
Gn
t.;
00
v
cs F
CD 0 0
00 00 o o ov
L c4 0 V>
0ý
^'r
y
N
a) O
C1. y
a)
EÜ Ob Uy
"p N
NN N
Cn 2
154
7.2 Business Philosophy
After analysing the interview transcripts, it is revealed that the business philosophy
of all five successful agri-food SMEs can be characterised as product orientated. All
five companies believe strongly in the power of their product, emphasising the
importance of its quality and price.
The following excerpt is a typical example of a response of one company on their
business philosophy of operating:
"Firstly, we do not need much advertising. We have to be there when a customer
wants something. For example, mince meat is £1.50 a pound a day then you have a
sale, but tomorrow the guy down the road sells his mince at £1.30 a pound so you do
not sell any tomorrow because the other guy goes in cheaper. You have to be
making contact with the price and the customer. You do not necessarily want it. I
mean we make what we can and sell it to whoever will buy. " (Company 3)
However, product oriented manufacturers still stress the importance of finding a
niche market for their product or even producing a new product. Two of the
companies either produce niche products or operate in a niche market. That is
because of a technological breakthrough, or because of their new idea.
For example, the first one, a subsidiary, uses a patented packaging technology, which
increases the fruit salad shelf-life, and therefore reduces the wastage from
supermarkets and caterers (their major customers). As the marketing director states:
155
" Because of the new product development that goes on with our new technology
and product, and because of our growth, marketing is ignored at the moment. It is
very product-focused. We do some marketing, and we have the parent company
providing some reports but it (marketing) has been retailer led. As we grow, more
resources will be provided for marketing, but it is still ignored. " (Company 4)
The second SME on the other hand, an independent farmer, operates his farm as a
family experience and has in store a coffee shop and a small supermarket, with ready
made meals (made in the farm) and various other high quality high value items. In
the owner/manager's words:
"The essence of the farm ... is to be different. When you go to a farm you want to buy
fresh produce which is probably a bit more expensive and of a higher quality. Unlike
anybody else (farms) we have our own shop and the customer can buy absolutely
everything. They can also walk around the farm and the shop (supermarket), have
their tea or coffee! I consider this a leisure industry rather than the traditional
farming industry. We offer entertainment for the family and that is our niche. "
(Company 2)
From the statistical results, it is also evident that there is no relationship between the
marketing approach of the company and the performance of independent or
subsidiary SMEs (chapter 6). Therefore the findings from this section come to
provide further evidence as to how successful agri-food SMEs perceive their
philosophy and why. The results also support research in the food marketing field
156
supporting the fact that the agri-food industry does not have marketing as the
overriding business philosophy (Grunert, 1996).
7.3 Strategic Analysis
7.3.1 Strategic Planning Concepts
The interview results show that despite their product orientation, most of the
successful companies are aware of some of the strategic planning concepts. One of
the examples of the companies is an owner of a farm. He claims that:
"... we have annual and longer term plans... The budget is done three years ahead, all
improvements in equipment are done three years ahead and the food cropping is done
about four years ahead so that we know where we are going! We also need to check
whether we change the direction of the shop (the supermarket within the farm). We
know next season for example, will be fine for our Christmas turkeys. We have
someone working on our finances, an important person, myself. " (Company 2)
The major reasons behind using, for example, SWOT analysis is that the SMEs need
to plan because of the dynamic nature of the industry they operate. It would be
impossible to operate with no planning. As another respondent who was talking
about the commodity nature (wholesaler of fruits and vegetables) said about strategic
analysis:
157
"We do have annual and longer term plans! ... sometimes we have no control because
we do not have a constant stream of supply (weather). Citrus is expensive because of
a frozen zone in California. It is a lot of demand and supply because of the
commodity nature of the product. So we have to plan ahead to know where we can
get our produce from, even if there is a disaster somewhere. " (Company 5)
On a strategic level, most respondents also agreed with the notion of the importance
and use of SWOT analysis. However, the main difference between the independents
and the subsidiaries was that it seemed that independents conduct SWOT analysis to
evaluate their position within the market. On the other hand, while undertaking
SWOT analysis subsidiaries examined the position of the company in respect to their
parent's activities. One respondent claimed that:
"We do a meeting once every month with an agenda and everything to see how we
are doing, something like SWOT. The agenda so far is done every month; January,
February, March etc. We set objectives for every sales person and we see at the end
of the month how much we have met these objectives-especially with the
salespeople. We also check any problems complaints etc. ... try to make sure that our
branch in Glasgow for example does not interfere and compete with us... we are all
one team" (Company 5)
However, from the interview results, PLC usage and awareness was low. Most
respondents have either never heard of the concept, or do not heavily use it. The
farmer for example claimed that:
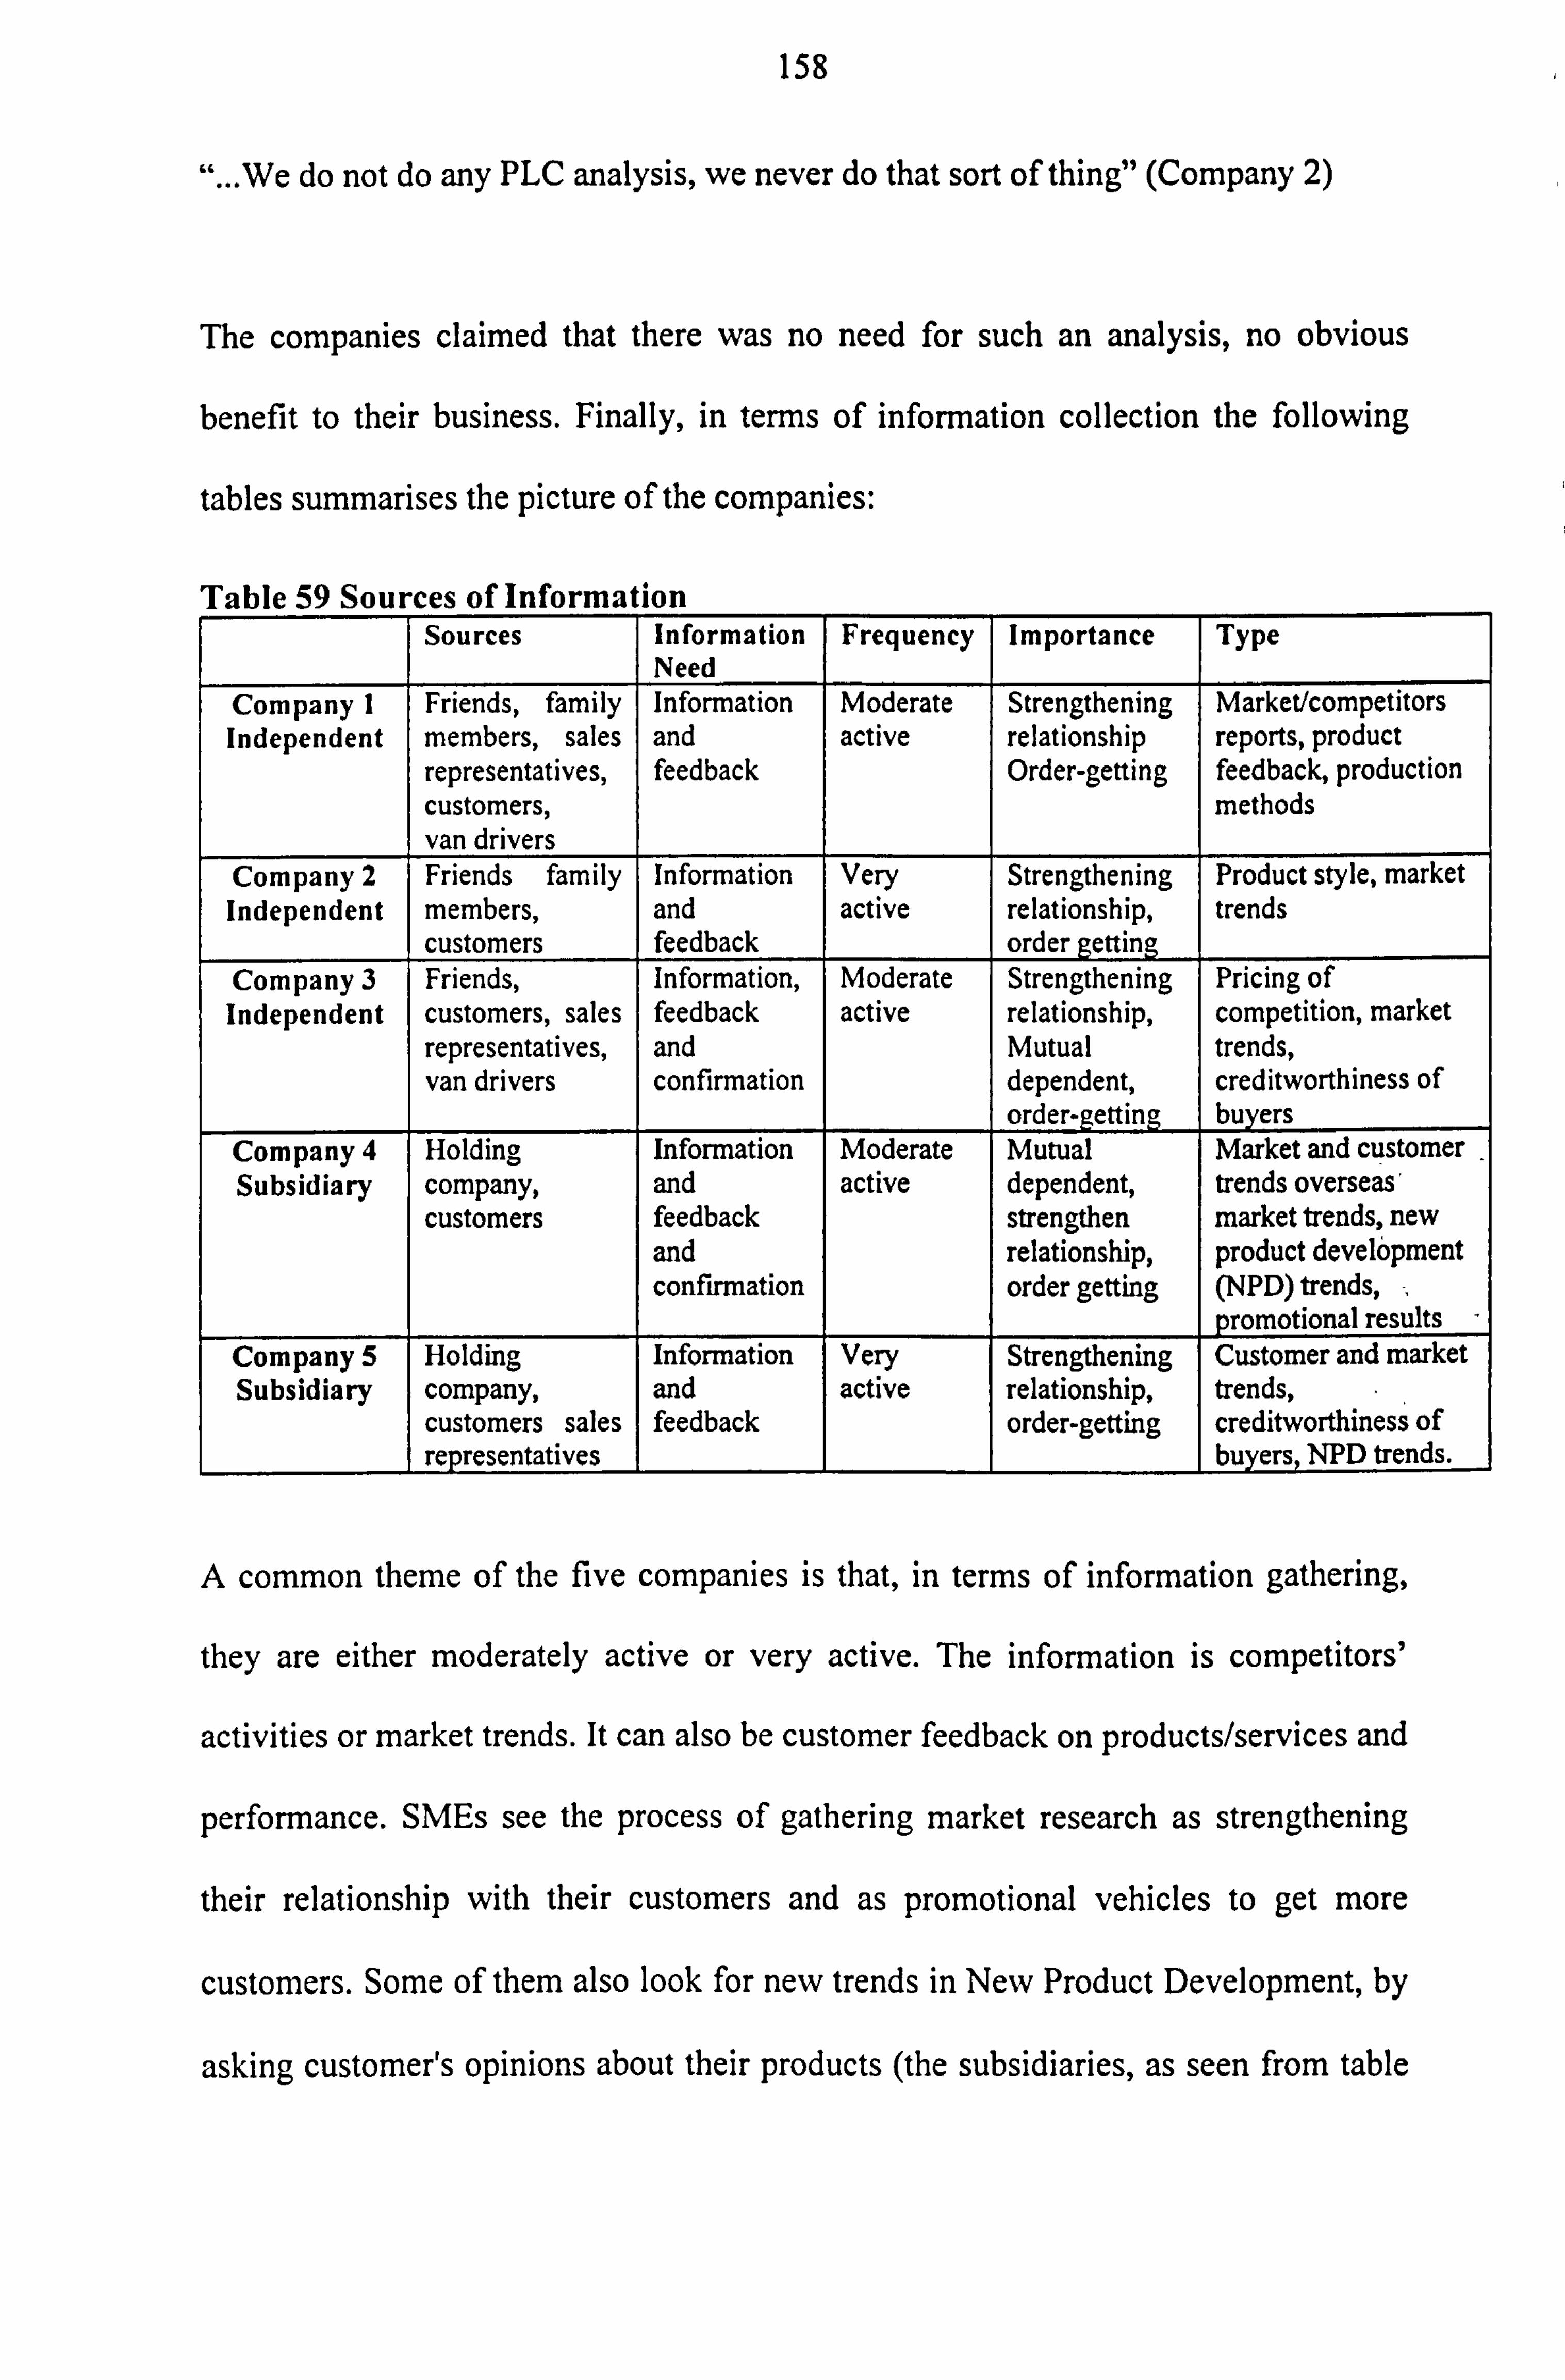
158
"... We do not do any PLC analysis, we never do that sort of thing" (Company 2)
The companies claimed that there was no need for such an analysis, no obvious
benefit to their business. Finally, in terms of information collection the following
tables summarises the picture of the companies:
Tnhle 59 Sources of information Sources Information Frequency Importance Type
Need Company I Friends, family Information Moderate Strengthening Market/competitors Independent members, sales and active relationship reports, product
representatives, feedback Order-getting feedback, production customers, methods van drivers
Company 2 Friends family Information Very Strengthening Product style, market Independent members, and active relationship, trends
customers feedback order getting Company 3 Friends, Information, Moderate Strengthening Pricing of Independent customers, sales feedback active relationship, competition, market
representatives, and Mutual trends, van drivers confirmation dependent, creditworthiness of
order-getting buyers Company 4 Holding Information Moderate Mutual Market and customer _ Subsidiary company, and active dependent, trends overseas'
customers feedback strengthen market trends, new and relationship, product development confirmation order getting (NPD) trends,
promotional results Company 5 Holding Information Very Strengthening Customer and market Subsidiary company, and active relationship, trends, '
customers sales feedback order-getting creditworthiness of representatives buyers, NPD trends.
A common theme of the five companies is that, in terms of information gathering,
they are either moderately active or very active. The information is competitors'
activities or market trends. It can also be customer feedback on products/services and
performance. SMEs see the process of gathering market research as strengthening
their relationship with their customers and as promotional vehicles to get more
customers. Some of them also look for new trends in New Product Development, by
asking customer's opinions about their products (the subsidiaries, as seen from table
159
59 tend to have a more formal and structured way of customer feedback on their
products) which is of significant importance in the food industry (Deliza, 1999).
The subsidiaries use their holding companies' resources for market research whereas
the independent use a lot of friends and family members as well as their customers
and sales-force, confirming some researchers' point of view (Carson et al, 1995;
Stokes and Fitchew, 1998).
Companies with their own distribution place their van drivers as an integral part for
information gathering and feedback. They even provide them training. One
respondents claims:
"Our van-drivers are our ambassadors so they gather information. They are our first
touch with the customers and they get instructions in what they should do. They are
heavily involved in giving feedback. We have a relatively flat structure so everyone
can have feedback... every driver has a radio in the van so if there is something
wrong like giving credit to the customer or whatever he calls us back in the centre
and we tell him how do deal with the customer. " (Company 3)
What is interesting is the fact that companies, which relied on big contracts (for
example companies 3 and 4), have a mutual dependency on information exchanges.
In other words, because they spend a lot of their time and effort on those big
contracts, they need the information as much as their customers need their
information on how they are doing business. Due to those contracts, they need
160
information for feedback on their performance and for confirmation that what they
are providing them is of high standards.
All five companies mentioned that the owner/manager was responsible for collecting
the information. They also remarked on the importance of the sales-force in
collecting information and passing it in on to the owner/managers. In the case of one
company, there were early steps for the creation of a marketing department with
distinct responsibilities of marketing research and information gathering. That was
mainly because of the size of the company (medium sized with turnover in excess of
15 million pounds) and the help that they got from their parent company. However,
most companies were happy with the amount of information that they got and the
limited amount of money they were spending on the process.
From the results of the case studies, we can see that there is still a high importance
attached to a SWOT analysis, confirming the positive statistical relationship found in
the survey results of chapter 6.
However, the awareness and usage of PLC analysis was variable, with most
companies not knowing the concept but some of them undertaking it without
understanding its full meaning. Finally, market research was also proven to be of
significant importance for performance, particularly for the subsidiaries, as shown
from the discriminant analysis (chapter 6, section 6.3)
161
7.4 Marketing Strategy
In terms of their strategic focus, SMEs had a common response, which was
expanding their total market and winning market share form their competitors. The
subsidiary companies were more involved with exporting activities as well as
looking at Europe more aggressively at new markets, whereas the independents
generally operate locally.
This may also be related to the results of the CATMOD analysis (chapter 6) that their
strategy is integrated with the holding company's strategy, whereas the independents
follow their own strategic plans. However, the statistical results show no relationship
between the strategic focus and high performance, something shared by the
respondents. They did not believe that a strategic focus would give them higher
returns.
The interview scripts showed that in terms of some of the traditional marketing mix
components, the five successful companies show particular strength in product
quality and some of them in distribution. One respondents says:
"We are superior I would say in terms of both our company/brand reputation and
product quality. We are definitely superior. Many people see us as a leader in our
sub-market although our size is not extremely big. We have our own vehicles so we
do the distribution ourselves. However, how do you rate distribution? If we are
talking about the area, we are relatively local; if you talk about efficiency and the
quality of our vans and that sort of thing we are better. We have a new fleet of 16
162
vans both with frozen and fridge temperature control with our name badge on the
van; not that many companies have such distribution" (Company 3)
Another respondent claims that one of their main success factors is their quality
product. Their attitude towards quality is as the owner/manager claims:
"We always aim at a high specification at the fillings that we put in our sandwiches,
and we always look for good quality ingredients; I am not saying we always meet
this but we try very hard. We do not really want to make cuts. We know you can get
cheaper bread or cheaper chicken or use dark and white chicken but we always go for
the chicken breasts... So we always aim at a better quality product. We feel that the
price we can sell it for can only go so far. " (Company 1)
Hence, having good suppliers and aiming at high quality is an important factor for
this industry. Company/brand reputation has also been of importance with the
independent companies relying more on the word of mouth effect, and the
subsidiaries being more into their (or their parent's) established brand name.
From the statistical results, we see that although quality and brand reputation are
related to high performers, distribution is not so important. Maybe this is because of
the nature of the sub-markets of the five companies. For example, many agri-food
companies do not have their own distribution or provide a service rather than being
in the manufacturing industry. Nevertheless, from a manufacturer perspective, the
whole distribution effort, from educating the drivers when interacting with the
customers, to the logos used on the vans, contributes to the success of a company.
163
7.5 Marketing organisation
In terms of marketing organisation the interview transcripts showed that the
owner/manager takes the marketing decisions in four out of the five cases.
Furthermore, the degree of integration of the marketing function with the other
business functions was very high. For example, a respondent said that:
"I know exactly what I need. I buy peanut cheese and pies. I then have to look at
what I have got and compare it with supermarkets just to make sure that I am more or
less there. I know perfectly well what I need to sell and I know that my strawberries
should be priced from £1.45 to £1.65 but it does not really matter where you are
between those prices. That little bit of falling outside is sometimes resolved by
information I get from my staff. They tell me that. " (Company 2)
Another respondent reacted as follows:
"I would say we are very responsive and are very integrated as a marketing function
within the whole business. For example when a customer does not come back then I
know. With 19 salesmen, if one of the customers falls out with a salesman hopefully
the others will get new customers... and the problem will be resolved soon enough for
the customer to come back.... This network is very important-market trends come
from that network and responses are very fast". (Company 5)
The results seem to agree with the survey results that there is a high degree of
marketing integration in both subsidiary and independent high performing agri-food
164
SMEs. Furthermore, the response to customer change seems to be also related to the
high performers in the independent groups, but not in the subsidiary and the whole
agri-food group. From the interview transcripts however both subsidiaries believed
that if they do not respond fast they will lose their competitive position.
7.6 Marketing control
In terms of the marketing control function, and the tools used, the successful
companies seem to have an on-going marketing intelligence gathering system which
could include weekly or monthly planning meetings, where SWOT analysis and
planning is made. However, these meetings are also there to set new objectives and
see how many of the old objectives are met.
Another respondent said that they have a special meeting in order to check and
control the function organised mainly by the sales-force whereas the owner/managers
do not attend but get a report and set the agenda:
"We have another meeting behind closed doors we do not go there and we get a
report. Because Friday is such a busy afternoon for us out there, we meet up to
exchange views on a Monday. The sales director is in charge of the meeting. We also
set the agenda to check how we have performed. " (Company 3)
Therefore, there are certain ways the SMEs control the information gathering system
and objective setting. It is evident that in all five cases, there have been meetings,
sometimes separate from planning, where the marketing function is controlled. The
165
sales people are a highly significant part of this function since most of the time they
are the ones who attend or even control the meeting.
From the statistical tests, there is a significant relationship between usage of an on-
going marketing intelligence system and high performers within the independent,
subsidiary and within the whole agri-food sample. Discriminant analysis also showed
that usage of an on-going marketing intelligence gathering system is the most
important component of agri-food SMEs for financial success.
7.7 Networks and the agri-food environment
Respondents of the five companies varied significantly in relation to the importance
of networks. They define networks as their friends and family. They also include
colleagues and employees and their network. For example, respondents placed a high
degree of importance because they use them in order to get market information and
pricing decisions are based on these networks:
"We have a network of 19 sales people and their working "network" and our holding
company's subsidiaries... This network is very important as market trends come from
that network. For example one day we had to decide on the price of strawberries
depending on the weather forecast.... but we used our network in the South to tell us
that the weather was getting worse there, (therefore the pickers could not pick
strawberries) in spite of the weather forecast which said that the weather was going
to be sunny. We then used this information to sell our produce later, when the prices
were going to be higher. " (Company 5)

166
On the other extreme, we got responses such as the following:
"A network? No, no we do not need or use a network. There is no need for that. All
the information that I need to run the business comes from here" (Company 2)
The statistical results also confirm that there is no relationship between usage and
importance of networks and high performance of both independent and subsidiary
groups.
In terms of regulation, there are some interesting findings. Respondents generally
tend to use regulation for their own success and they only complain in rare cases
where they do not see the need for it. For example a subsidiary said:
"We English always play by the rules. So it is true because we play by the book all
the time so therefore costs are up. Do you know for example that we are not allowed
to sell a large orange? Do you know why? I have no bloody idea! They are putting a
lot of restrictions on us. We are not allowed to cut a cucumber in halves because of
safety and hygienic reasons whereas the retailer is allowed to do that. It can get
frustrating but we find ways around it. " (Company 5)
However most cases claimed that it does not influence them. In one case it is actually
good for the industry they were operating:
"We are carrying out a safer operation because of regulations. It is not really a threat.
It is better cut (meat) and more hygienic, so other than BSE, we do not feel
167
regulation has done any harm. The standard has improved dramatically from a safety
perspective. " (Company 3)
Another respondent went even further to claim that:
"I do not think the European regulation is going to pose a threat. Not at all. No way.
They are not there to get us out of business. We have vastly improved as an industry
in the last ten years. What is happening in Spain.. . ten years ago we were trying to get
to their standards. Now, we are very good if not better than them. " (Company 3)
In terms of competition and the big players, similarly none of the companies felt
threatened. One company went as far to say that intense competition and the big
players could become beneficial:
"They (supermarkets) are competition but they are good for us. I have learned more
from the big multiples than I have learned from anybody else. They are brilliant in
selling-you cannot say that anybody who is brilliant in selling is bad, you want to go
and learn from them. " (Company 2)
From the statistical results, we see that there is no direct link between networks and
high performance. Something that is also proved by the interview results. However,
in terms of regulation it looks as if most successful companies either do not care or
even use it to their advantage. Even from the Chi-square results we found a
relationship between regulation posing a threat to survival and high performers, in
168
the subsidiary group, the discriminant analysis results showed that this may be not a
threat but an opportunity.
7.8 A Proposed model of successful agri-food SMEs marketing
This section will try to link the research findings from both the survey results and the
case studies, in order to provide a theory of successful agri-food marketing within the
SME sector. The following table integrates the marketing process model with the
actual marketing behaviour of both subsidiary and independent SMEs, to provide a
diagrammatic representation of the model:
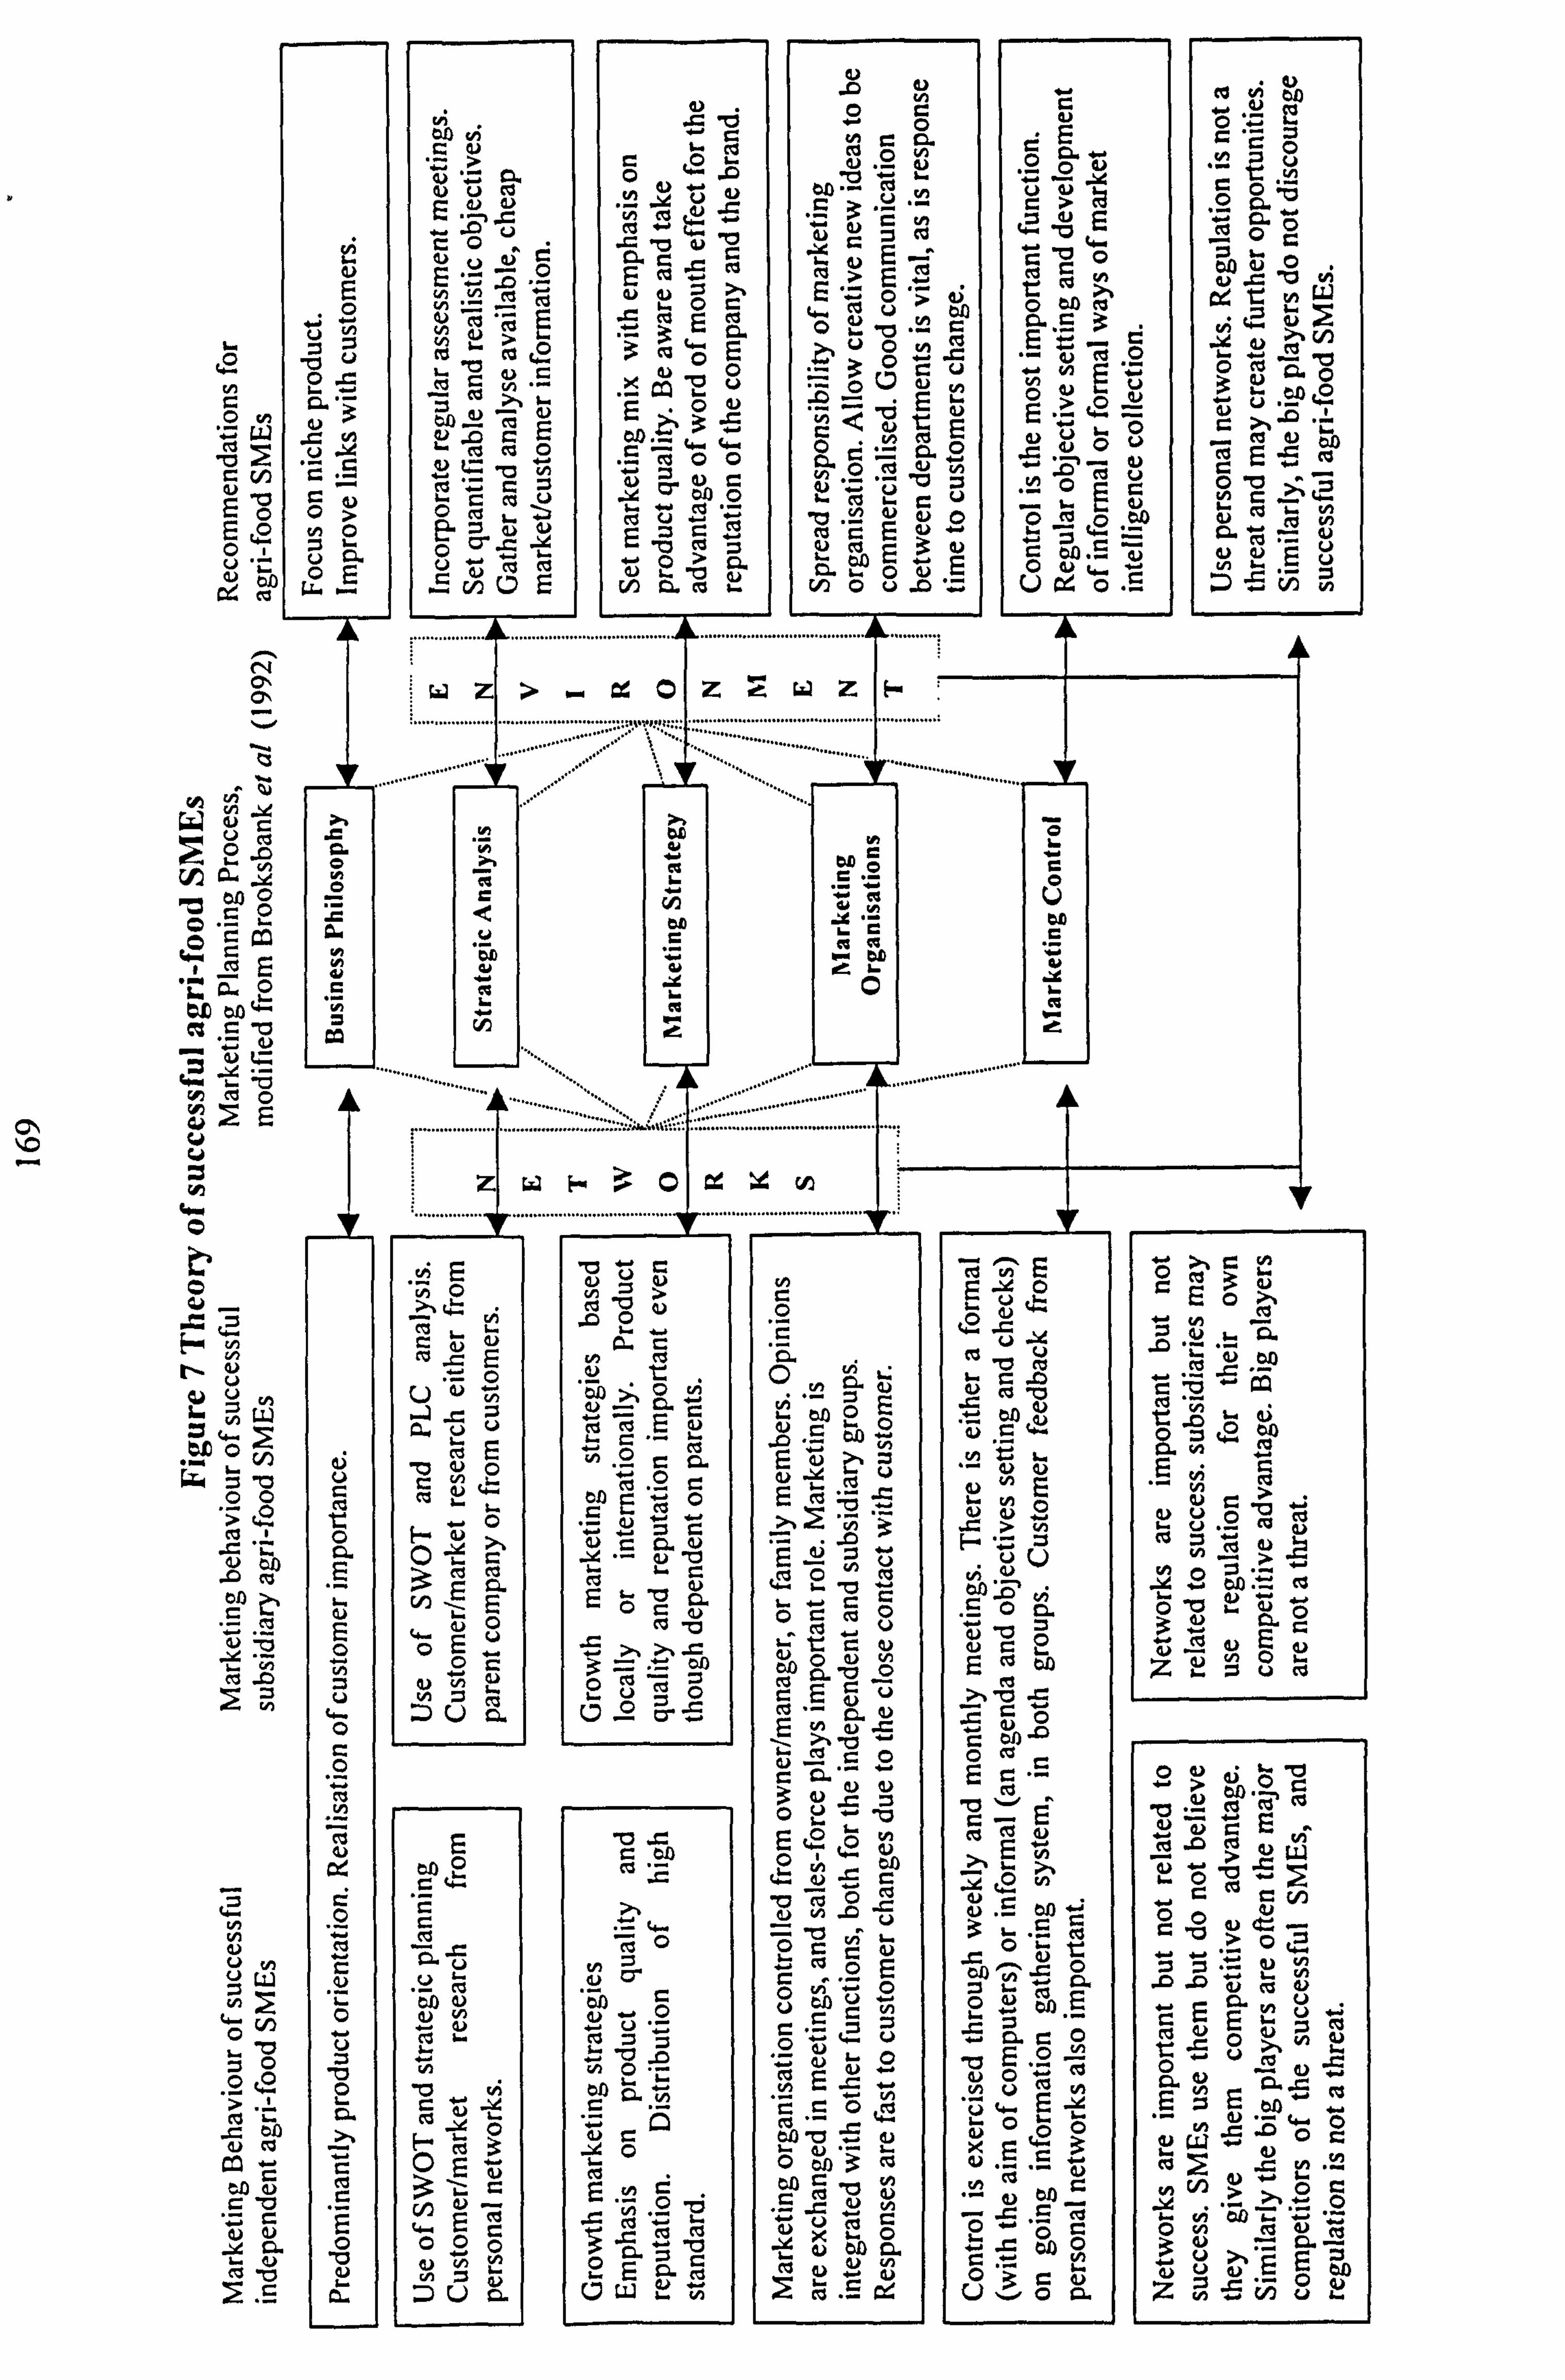
CN
412
U, CH
M C 4!
0 O
U
i
Rf
yd
WUZ
0 .0
0 r- CZ
"L p� O bD 00 c`" CC
"Z IL)
O ei -
N U)
r- u
O_ O
fei 1
.. Z:
.0 c'3
bA eu
CO 10
H
w ul U Uý
(y)
ta+ ý
Lö
.2 , 02
c ön
on aci c-a
. Z: a se ti. Ä
v 2. r-
N E
"O UN
. ZJ U O .L L r+
U .x 'C Cr.
O> rn O
U 0.
t; to vi c aý
"Ü ldd
NVö
NN
0Nw Cy .ý
wt"'fl H
VCýV
OcV
O C'
.Cb oc
.0V 'V
0 r_ 3ýöE 25 km 12 chi
oV ý3w m00
.e °'önö
> L1, V) Ä.
cýC
N
OC "0
C 0. yOU
v
ä
E E E
4r 0
bA O 'gyp.. C
UO pvdy
¢
ä cn .-ö.
ß v
UU 2i
cC au3U i°. 0äE V] 0U0 "-
w ZI >- w Ol z ý, wz 1F
u
ou c>
cý ýE
O fý y
O cnýa ¢ý 3 "-0, ;;
~ ýý lC Ü OC v aý Ö=O bA
V Cý O ,C
C OTD y O
G. h y et
p O
L C
e ý ý ee t Q pp .Y "= pp
G. u ý Rý e d aj GO oeý
I u a
cl CO V) L
w ý- ý,,, 01 C4 x (A
O
I-
O
U 4.. O
O c3
O
aý O U
O 0
O
,A 1C3 - r_
NS LC fn av
.. C U ýd fC ý
oca, cC Lý bA O
cC _
_ O ý' > O
aý OA 3 ß' o yýR 0UO
E cw
U
e G) UN Iv L h
10 v; rU ýt
ö00
vs c o0
w RO
HO .ýVO Qi
_
NO
fC
o QM V ty L
N C 0
.. -, zu,
UÜ
r . _O E E) 7 O, ý 2
C
LCU O r- (0
oO CL -0
CE�
0, co c 0.
aý aý
E c° öy
ö= 'd NU
OCy
0O O vi V0 O U0CN Ö. 0 4' U
UL
NELN CCÖ bA
II N Ö
pip 3 cCl N U r- b =tUN
V f1
Ca RS "ý ii
y
E -14 L U 19 to VY
I- cVC
c-
OA 'ý cw O
N Y. " L.
.. C >N
UV NU
0C
OC
lC0 cý%
N
ET
1O N
3. E L .C eCC
L R
M. p, C0
.yE '- id
U ýc N U 4. G yO0O
XC3
y p() C
O ý' 'p C
U00.
own
a "ý ö av
o p, 'o ýaö
0 yes V vi
OG CW a
3ýa
=
fß/1 lEt r'7
ý. + V1 vii
Ö
äyp,
0. (n m
vi > U Co
k. "0 cu
O'
c
Z7v c`d
.! 2 m (U (Z U JD (N
1.. O
OO4. Gýý0w
vAN O
ö vi oO ä
yUy . ý_ ý
CD
Vif r Vi UL
170
7.8.1 Business Philosophy
The research results seem to indicate that the business philosophy of agri-food SMEs
is product orientated. The most successful independent and subsidiary SMEs operate
in either a niche market or have a niche product, which helps them differentiate
themselves from competition. However, both groups seem to indicate a high degree
of awareness of the importance of the customer. Though product orientated, they
seem to either know or practice, without their conscious awareness, different degrees
of customer retention and satisfaction techniques. Therefore, the customer is not
ignored. Thus, it is reasonable to explain why there is no statistical relationship
between business philosophy and high levels of financial performance as indicated
by the survey results.
7.8.2 Strategic Analysis
From the results of both survey and the case studies, strategic formal planning tends
to be of financial significance mainly to independent SMEs. Due to their ownership
status, SWOT analysis is undertaken differently. Independent SMEs use their
personal network to gather market and customer information as cheaply as possible.
The subsidiary SMEs use their parent company's information, buy their own or use
their customers' database for information on their performance. Therefore, for a
successful agri-food SME it would make sense to incorporate a systematic meeting
procedure either weekly or monthly to assess performance and set new objectives.
They should also incorporate a SWOT analysis or something similar, which would
provide them with information about their performance. Information should be
171
collected with the help of the personal networks of employees including the
owner/managers and the sales-force, with a minimum cost. Since this is of
importance to high performers, it is also of policy interest to the agri-food industry,
especially the independent group.
7.8.3 Marketing strategy
The successful SMEs employ a growth marketing strategy, constantly seeking new
markets, locally, nationally or within an international context. The subsidiaries are
more capable of that due to their expertise and resources, as the statistical analysis
confirmed.
In terms of the marketing mix, the common characteristic as mentioned earlier
between successful SMEs was the high quality of their product and the importance of
company/brand reputation. However, the independent group has a brand reputation
and uses the word of mouth effect more often than the subsidiaries, which rely more
on their parent companies reputation and brand name. Interestingly, the product
quality and reputation within the independent group are statistically related to high
performance, whereas there seems to be no statistical relationship within the
subsidiary group.
Successful SMEs look constantly for new opportunities for growth, and aim at a high
quality product, something that is both statistically related with high performance
and of importance (see discriminant analysis, chapter 6). Furthermore, there should
be an emphasis on brand and company reputation and awareness that the word of
172
mouth effect can become one of the most effective tools of the mix. Distribution
should not be ignored, since the successful companies use vehicles and drivers as a
means of promoting their companies.
7.8.4 Marketing organisation
Marketing organisation is mainly controlled by the owner/managers. Employees
however are exchanging opinions in either the weekly or monthly meetings about
possible improvements or new ideas, in both independent and subsidiary successful
agri-food SMEs. The sales-force also has an important input on that. The degree of
integration of marketing with other departments is of vital importance. There is also
a statistical link between high performance and the degree of integration in both
groups. Finally, because of the close interaction with the customers, the response to
customer changes is very fast, and is related to high performers.
7.8.5 Marketing control
This is one of the most important functions of the marketing processes of SMEs. The
cases also confirmed its importance through owners/managers expressing the
importance of objective-setting and control on a regular basis. Marketing intelligence
gathering, either done informally with the aims of an agenda setting and meeting or
via a computer system, is also vital for the effective control of the marketing
function. It is also the most important component of high performance for all three
groups (see discriminant analysis, section 6.3).
173
Customer feedback on the overall marketing effort is mainly done by the successful
companies' customers themselves, or by utilising the personal network and the sales-
force. Statistically, marketing control is both related to high performers and has very
important weight on the success of the companies of both groups (shown from the
discriminant analysis results in chapter 6).
Recommendations for agri-food SMEs include the development of objective settings,
and an intelligence gathering system, either informally or when resources allow it
formally.
7.8.6 Networks and agri-food environment
Personal networks are, as already shown, in high use in all of the successful agri-
food SMEs. However, according to the cases and the statistical results, they do not
contribute to their high financial performance in either groups of independent and
subsidiary.
The regulation, whether European or government, is not related to high performance
in independent SMEs. However, the subsidiaries often use it in order to improve their
competitive position by either learning or doing their products better. It is also highly
important for their performance from the statistical result in chapter 6. Finally, the
big players are either competitors to the successful agri-food SMEs (even though
some of them may be small in absolute size), or in the case of subsidiaries, may be
the big players themselves.
174
The agri-food SME should not view the environment as a threat, in terms of the big
sized competitors and use a lot of environmental information like regulation or even
techniques of competitors in order to improve their competitive position.
7.9 Conclusions
The evidence from this chapter shows that successful subsidiary and independent
SMEs have many common characteristics, but still have some distinct differences.
Although the industry is mainly product-orientated, even within the successful
SMEs, there were several strategic and marketing principles that are used in order to
give them this competitive edge. For example, regular SWOT analysis and the
quality of the product have both led to positive influences on SMEs performance.
Furthermore, the importance of the company/brand reputation was also stressed from
the respondents, together with an effective control system. The most influential
factor for success is the development of an intelligence gathering system.
As shown from the statistical results, companies will be successful despite their
environments or the strong competition, and though they may use their networks for
their advantage, it will not be a determining factor in their success. Finally, the
proposed theory can act as guidance to both SMEs and policy makers to target the
areas that contribute most to the success of the agri-food companies.
175
Chapter 8 CONCLUSIONS AND FURTHER RESEARCH
8.1 Introduction
This chapter is a summary of the research project and is split into the following
sections:
Section 8.2 describes the research aims and objectives, whereas section 8.3 examines
the research design with a brief review of the research process employed, together
with its strengths and limitations. Section 8.4 evaluates the theoretical,
methodological and managerial contributions. This chapter concludes by giving
suggestions for further research into the area.
8.2 Research aims and objectives
Though marketing principles apply to a certain extent to the SME sector, it is agreed
that, due to their characteristics, SMEs practice marketing in a different way than
bigger companies. Furthermore, there has been increasing interest within the agri-
food sector towards the development and improvement of the SMEs of the industry,
due to their job and wealth creation potential. Regional studies also point to the
importance of SMEs for local communities, and thus the European Union funds a
number of projects for support of food SMEs. It is also commonly agreed that the
two most important factors for the success of an SME are finance and marketing
(Hills and LaForge, 1992). Therefore it is vital to understand how and why marketing
176
is practised in agri-food SMEs, and how do subsidiary and independent SMEs differ
in practising marketing. Hence this project:
1. Investigated the relationship between marketing practices and performance of
subsidiary, independent and the whole agri-food industry's SMEs
2. Identified the differences between the two groups of companies and provided a
tool for policy makers interested in helping the overall industry
3. Developed a marketing model followed by the successful agri-food SMEs
8.3 Research design
8.3.1 Research process
This thesis used a stepwise approach to understand SMEs marketing. Each step was
designed to build upon what has been learned in the previous stage to make an
incremental contribution to the established knowledge base. This allowed the
research to provide an in-depth and focused analysis of agri-food SMEs in the North
of England. Methodologically, this thesis uses a two-stage approach utilising the
survey approach to investigate the relationship between marketing practices and
performance of 141 agri-food SMEs, of which 86 are independent and 55 are
subsidiary. Subsequently, in-depth interviews with five successful companies were
conducted, to identify the reasons behind how marketing is practised in successful
SMEs, and to validate the survey results. Theoretically, the research adopts an
integrative approach using the contingency approach to conduct the survey and then
blends the process model to undertake the case studies, in order to advance research
177
in marketing theory as proposed by Anderson (1983). Some of the advantages and
disadvantages of the research approaches are given below.
8.3.2 Mail survey
Mail survey is a very valuable method of collecting data from industrial populations
because of its low cost, its ability to collect data from wide geographical areas, and
the lack of interviewer bias. It also allows respondents to complete it in their own
time, and the researcher to store detailed data on marketing practices and
performance.
However, using mail survey in industrial research has a low response rate. In this
thesis, the 15-20% response rate is considered high for industrial research. The non-
response error was reduced, because of the relatively high response rate. Follow up
telephone calls with some subsidiary companies to improve their response rate also
increased the validity of the results. Hence, it was felt that the results accurately
reflect the situation.
8.3.3 Personal interviews
Case studies using in depth personal interviews provide an opportunity to investigate
issues related to the marketing of agri-food SMEs in more depth. The purpose of
using this technique in the thesis is threefold:
1. To verify the findings of the survey, using the interview data as a vehicle of
triangulation;
178
2. To gain a deeper understanding of how and why successful SMEs practice
marketing the way they do; and finally
3. To recognise any differences between subsidiary and independent SMEs in their
marketing practices.
However, case studies have faced criticisms like lack of rigour, little basis for
scientific generalisation and the generation of massive unreliable data. To minimise
the above effects, the following measures were taken. McCracken's (1988) long
interview technique was used to steer the interview, focusing on a semi-structured,
open-ended technique where the respondent had the freedom to expand on a
structured interview agenda. The QSR NUDIST 4 computer software was used to
process the interview transcripts. The interview results were co-examined by a
researcher present in the interviews, as a method of co-inquiry. This assured
triangulation of data information as recommended by Lincoln and Cuba (1986). It is
believed that this model is a rigorous approach and assists to the construction of a
model of successful marketing of agri-food SMEs.
8.4 Contribution
8.4.1 Theoretical contributions
This research is the first attempt to use an integrative approach- blending the
contingency approach with the process model- in a specific region (Northern
England) of a specific industry (the agri-food industry). It is also building on the
179
knowledge base of SME marketing, since it examines and confirms theories of small
business marketing that have not been empirically proved.
This study is also building on the Shrader and Simon (1997) call for more empirical
marketing research on comparative issues of subsidiary and independent SMEs. It is
the first attempt to build on existing knowledge on comparative literature on strategic
marketing of SMEs.
The results of this project suggest that industry combined with ownership variations
influence the marketing practices of agri-food SMEs and their effect on performance.
Therefore, great caution should be taken when generalisations are attempted for
marketing practices.
8.4.2 Methodological Contributions
This project acknowledges the importance of a stepwise staged approach (Gibb,
1992, Siu, 1997, Siu and Kirby, 1998b), as well as the multidimensional approach
suggested by Greenley (1983,1986) in strategic marketing research.
Previous studies have used the chi-square test to compare marketing practices and
performance of medium sized companies (Brooksbank, 1990c). However, the chi-
square approach assumes that each marketing practice is an independent and separate
measure. In fact, marketing process components are interrelated and interactive.
Hence, discriminant analysis is used to identify a weighted combination of all
180
components to predict whether a company is likely to attain higher performance
levels, and compare differences between independent and subsidiary SMEs.
Most strategy studies assume that the owner/managers' financial responses are an
accurate statement of reality. The performance classification instrument (high,
medium and low) was compared statistically with 69 respondent SMEs' accounts
data. This research proved, that for Northern agri-food SMEs, the subjective
classification of the performance instrument used in the thesis was statistically
related to accounts data (four financial ratios).
The results prove to be valuable since they help improve the understanding of
marketing differences between higher and lower performing companies, and identify
the marketing practice components that have the greatest positive impact on
performance.
8.4.3 Managerial contributions
This thesis identifies some distinctive characteristics of the most successful agri-food
SMEs in the North of England. It shows that successful SMEs, though product
orientated, have a strong use of strategic planning tools, and superior levels of
product quality and company/brand reputation. They are trying to find new areas of
expansion both in terms of their products but also in terms of service levels. If there
is a marketing department it is integrated within the whole business functions, and
the more resources the company gains, the more money goes into the marketing
function. Activities such as creation of customer databases, promotional material as
181
well as low-cost advertising are the responsibilities of the low budgeted marketing
departments. Customer surveys are relatively rare because of their high cost.
However some form of customer feedback is coming from their customers and in
extreme cases external bodies are hired (with the financial help of Business Link) in
order to consult on marketing issues, and conduct consumer research. Finally, the
successful performers do not view the environment they operate as a threat, rather
they use it many times for their advantage. Regulation is not considered a threat
rather than a way of improving the industry standards, and big players are in cases
the direct competitors of these companies, which despite their size, are market
leaders in their sub-markets.
The results do show a consistent pattern in terms of differences and similarities in
marketing practices. The adoption of marketing does contribute to their financial
success, and high performers tend to show higher appreciation of some fundamental
planning, strategic, and control marketing principles.
8.5 Conclusions and areas of further research
This research provided evidence to suggest that agri-food SMEs differ from other
SMEs in terms of their marketing orientation. However, it also provided evidence to
suggest that the most successful of them have got a very good understanding of the
fundamental marketing principles. It also showed that agri-food SMEs need to
practice marketing so that they will not enter the lower performers, but marketing
alone is not sufficient for high performance.
182
It also provided empirical evidence to support the notion that marketing differs
between subsidiary and independent SMEs, in four of the marketing areas, namely
SWOT analysis, strategic focus, company/brand reputation and European or
government regulation posing a threat to the survival of the company.
The case studies further showed that most successful SMEs are product oriented with
high degrees of quality, variety and service. They all operate on distinct niche
markets or have a niche product in an established market. They are also familiar with
many planning and strategy concepts, undertaking many of them internally and
constantly seeking to strengthen their relationship with their customers.
Furthermore, the independent companies do not have the tendency to spend big
budgets on marketing research but try to gain them from family, friends or their
sales-force and their customers. Subsidiaries, on the other hand, tend to have bigger
contracts/accounts, which allows them to get information from their customers. A
common theme however was that the more the business resources expand, the more
money will be spend on marketing function or departments.
There are certain limitations of this research project. First of all the sample size of
the subsidiary SMEs, despite its high response rate, was in absolute terms small and
did not allow the differentiation of three groups of performers. Instead, it was
necessary to merge the medium and low performers into one category, since the
focus of the thesis was the identification of the successful SMEs and their differences
with the lower performers. What would be interesting is the extension of this type of
183
research to more regions of the UK in order to have a bigger sample and to test for
differences (if any) in marketing due to geographical and environmental variations.
The theory proposed in chapter seven links the marketing process model with the
actual marketing behaviour of successful independent and subsidiary SMEs.
However, there is no examination of medium and low performing companies in order
to investigate further the differences between the groups. Thus, a possible area that
goes beyond the scope of this thesis could be the examination and differences
between the marketing behaviour of various performing companies and their
marketing practices.
The survey and case studies were made in an industry that is very dynamic and
changes constantly. Systematic research over a longer period of time as suggested by
Schwarz (1998), or in other words longitudinal analysis, would make the theory
more valid in the face of new environmental changes, for example the effect of
internet food shopping. Finally, other important factors for the success of an SME as
indicated in chapter 1, like finance, were inevitably neglected, which could be
another fertile area of research.
To conclude, this thesis suggests that researchers examining small firm marketing
practices should pay attention to business settings and ownership status, and if
possible examine single-industry settings. It also indicates that the integrative
approach- blending the process model into the contingency approach- is useful to
advance small firm marketing.

184
Appendix a Letter for Survey Participation University of Newcastle
Dear Sir/Madam
I would like to invite you to participate in research currently being undertaken by the
department of Agricultural Economics & Food Marketing, of the University of
Newcastle upon Tyne. This research examines the marketing practices of a range of
agri-food Small and Medium sized Enterprises (SMEs) in the North of England.
In return for your co-operation you will receive:
"A report of the results of the existing marketing practices of Northern agri-food
Small and Medium Sized Enterprises (SMEs).
" Recommendations for the improvement of current marketing practices of agri-
food SMEs.
All we ask for is five minutes of your valuable time to complete the attached
questionnaire and return it in the envelope provided. Confidentiality will be assured.
Thank you very much, and I am looking forward to hearing from you soon.
Yours faithfully,
Konstantinos Tsorbatzoglou
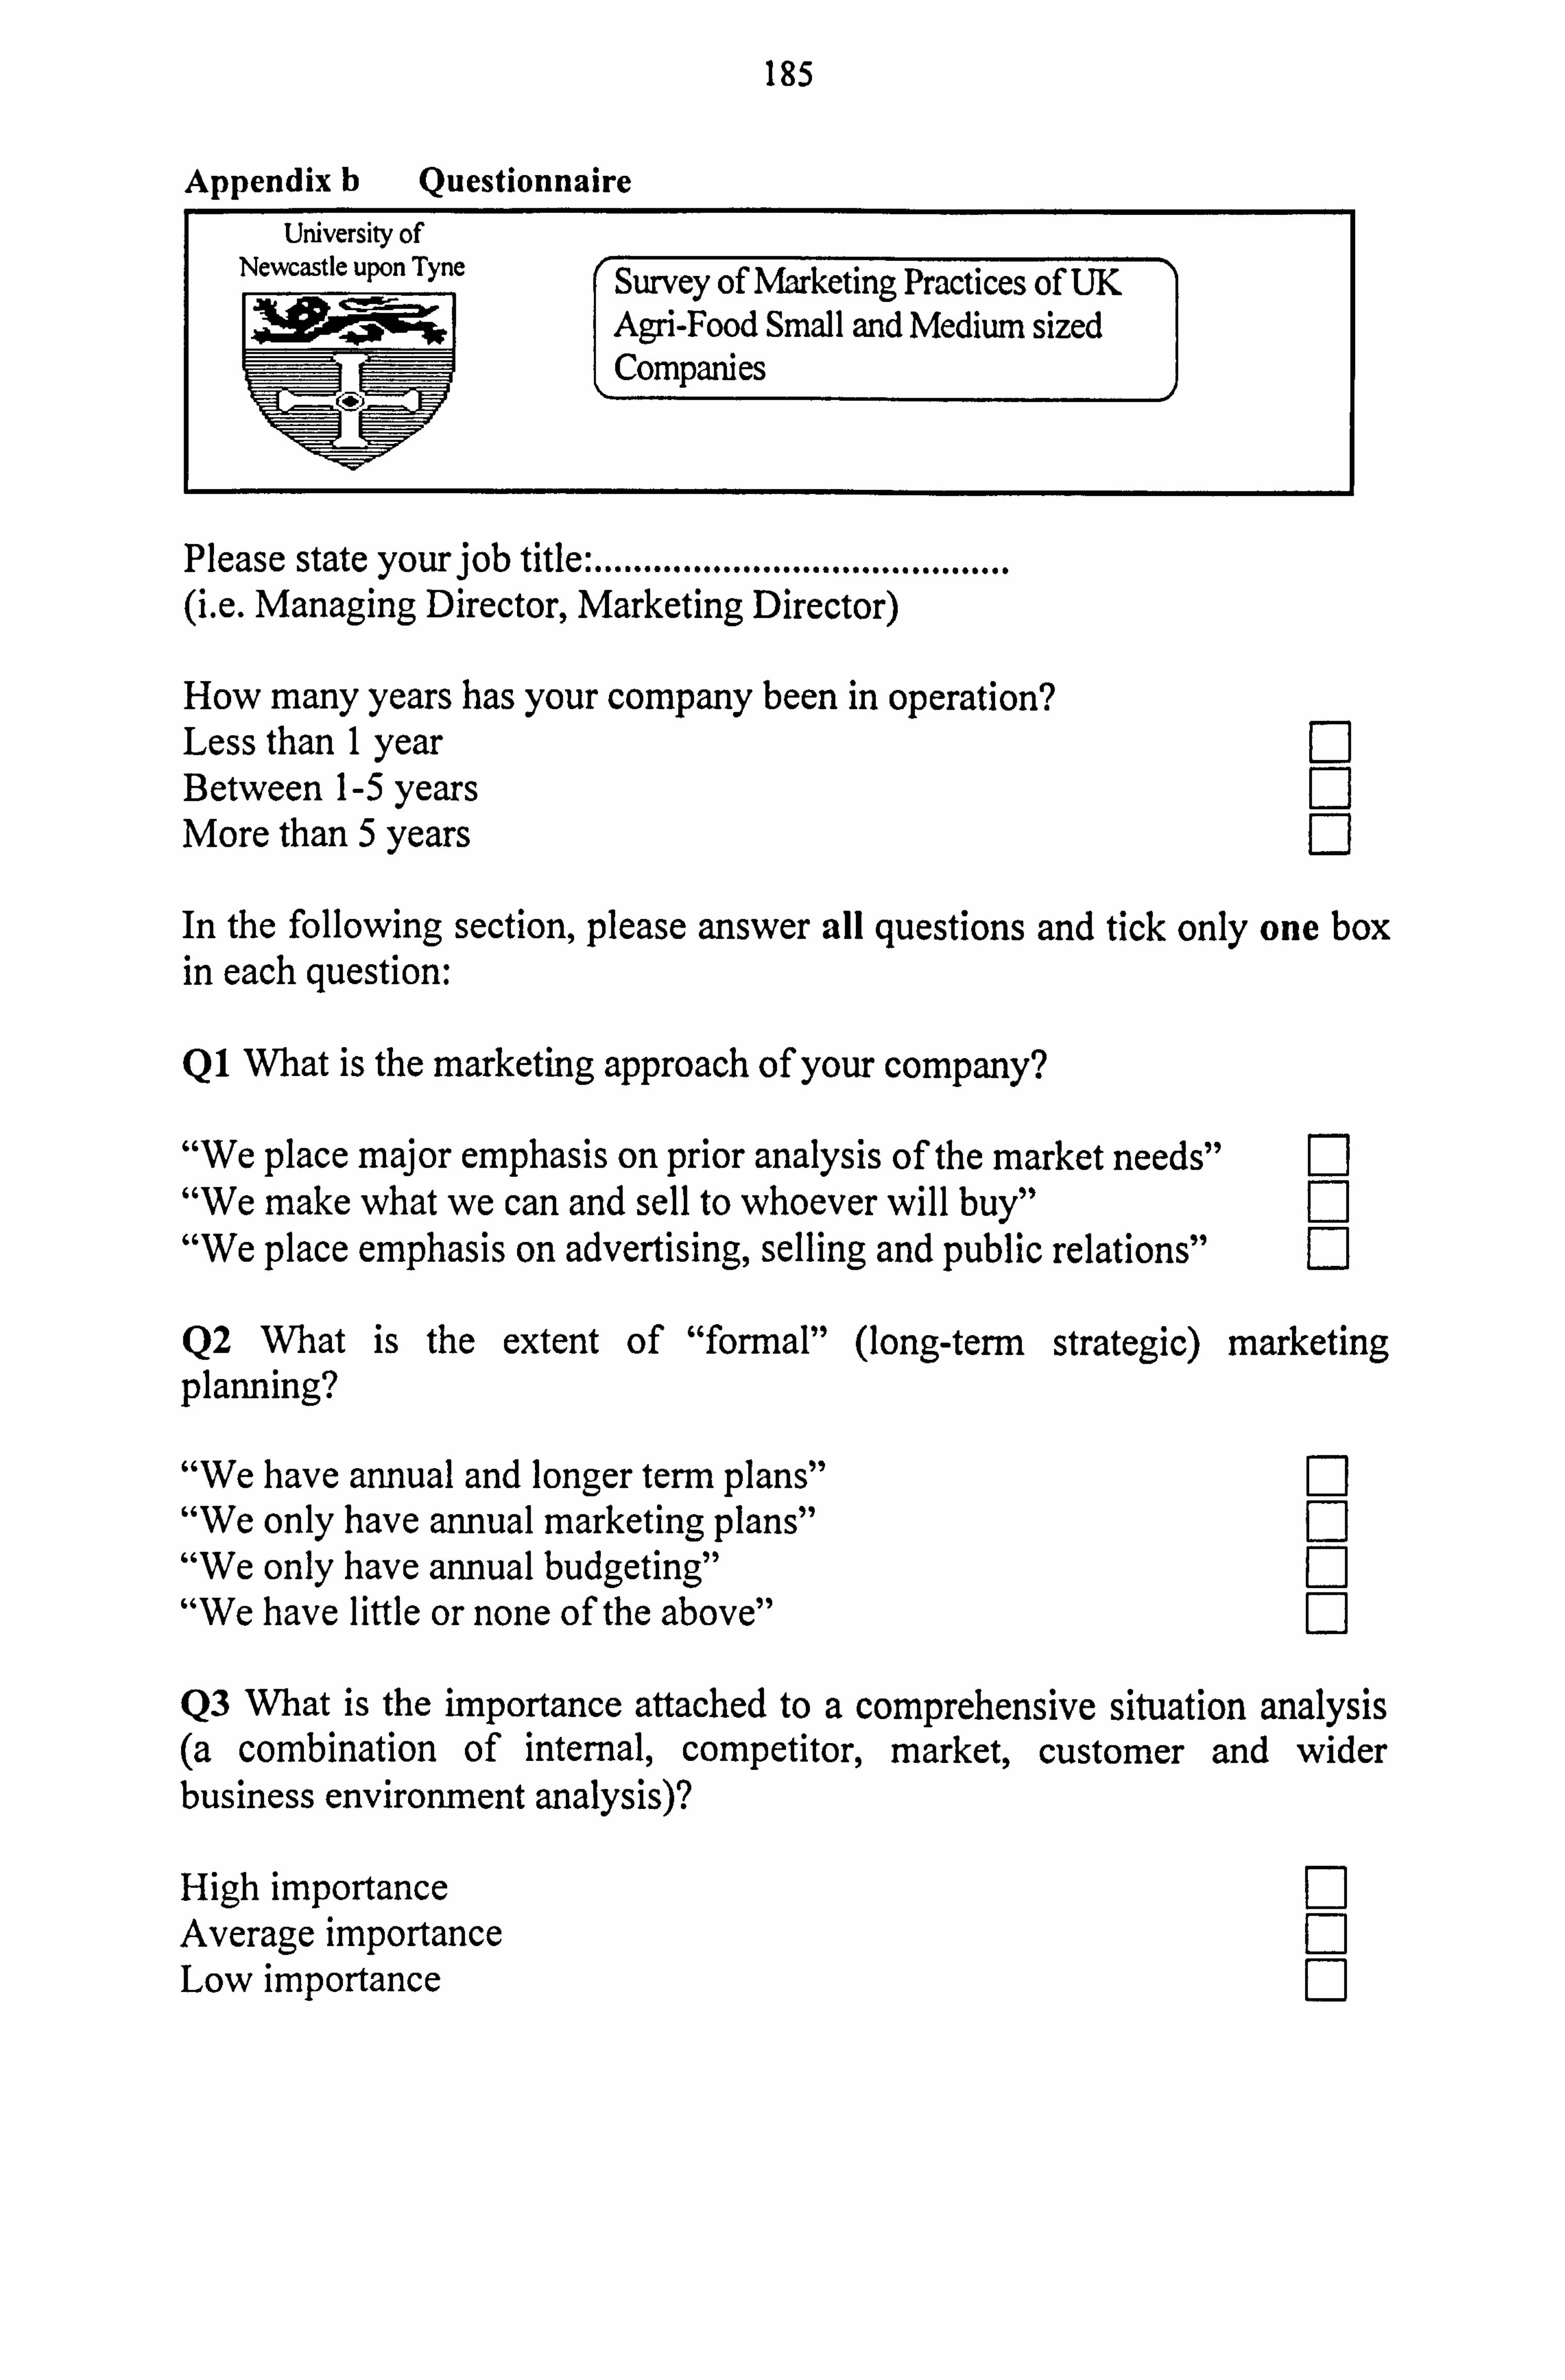
185
Appendix b Questionnaire University of
Newcastle upon Tyne Survey of Marketing Practices of UK Agri-Food Small and Medium sized Companies
c"ý
Please state your job title: .......................................... (i. e. Managing Director, Marketing Director)
How many years has your company been in operation? Less than 1 year Q Between 1-5 years Q More than 5 years Q
In the following section, please answer all questions and tick only one box in each question:
Q1 What is the marketing approach of your company?
"We place major emphasis on prior analysis of the market needs" Q "We make what we can and sell to whoever will buy" Q "We place emphasis on advertising, selling and public relations" Q
Q2 What is the extent of "formal" (long-term strategic) marketing planning?
"We have annual and longer term plans" Q "We only have annual marketing plans" Q "We only have annual budgeting" Q "We have little or none of the above" Q
Q3 What is the importance attached to a comprehensive situation analysis (a combination of internal, competitor, market, customer and wider business environment analysis)?
High importance Q Average importance Q Low importance Q
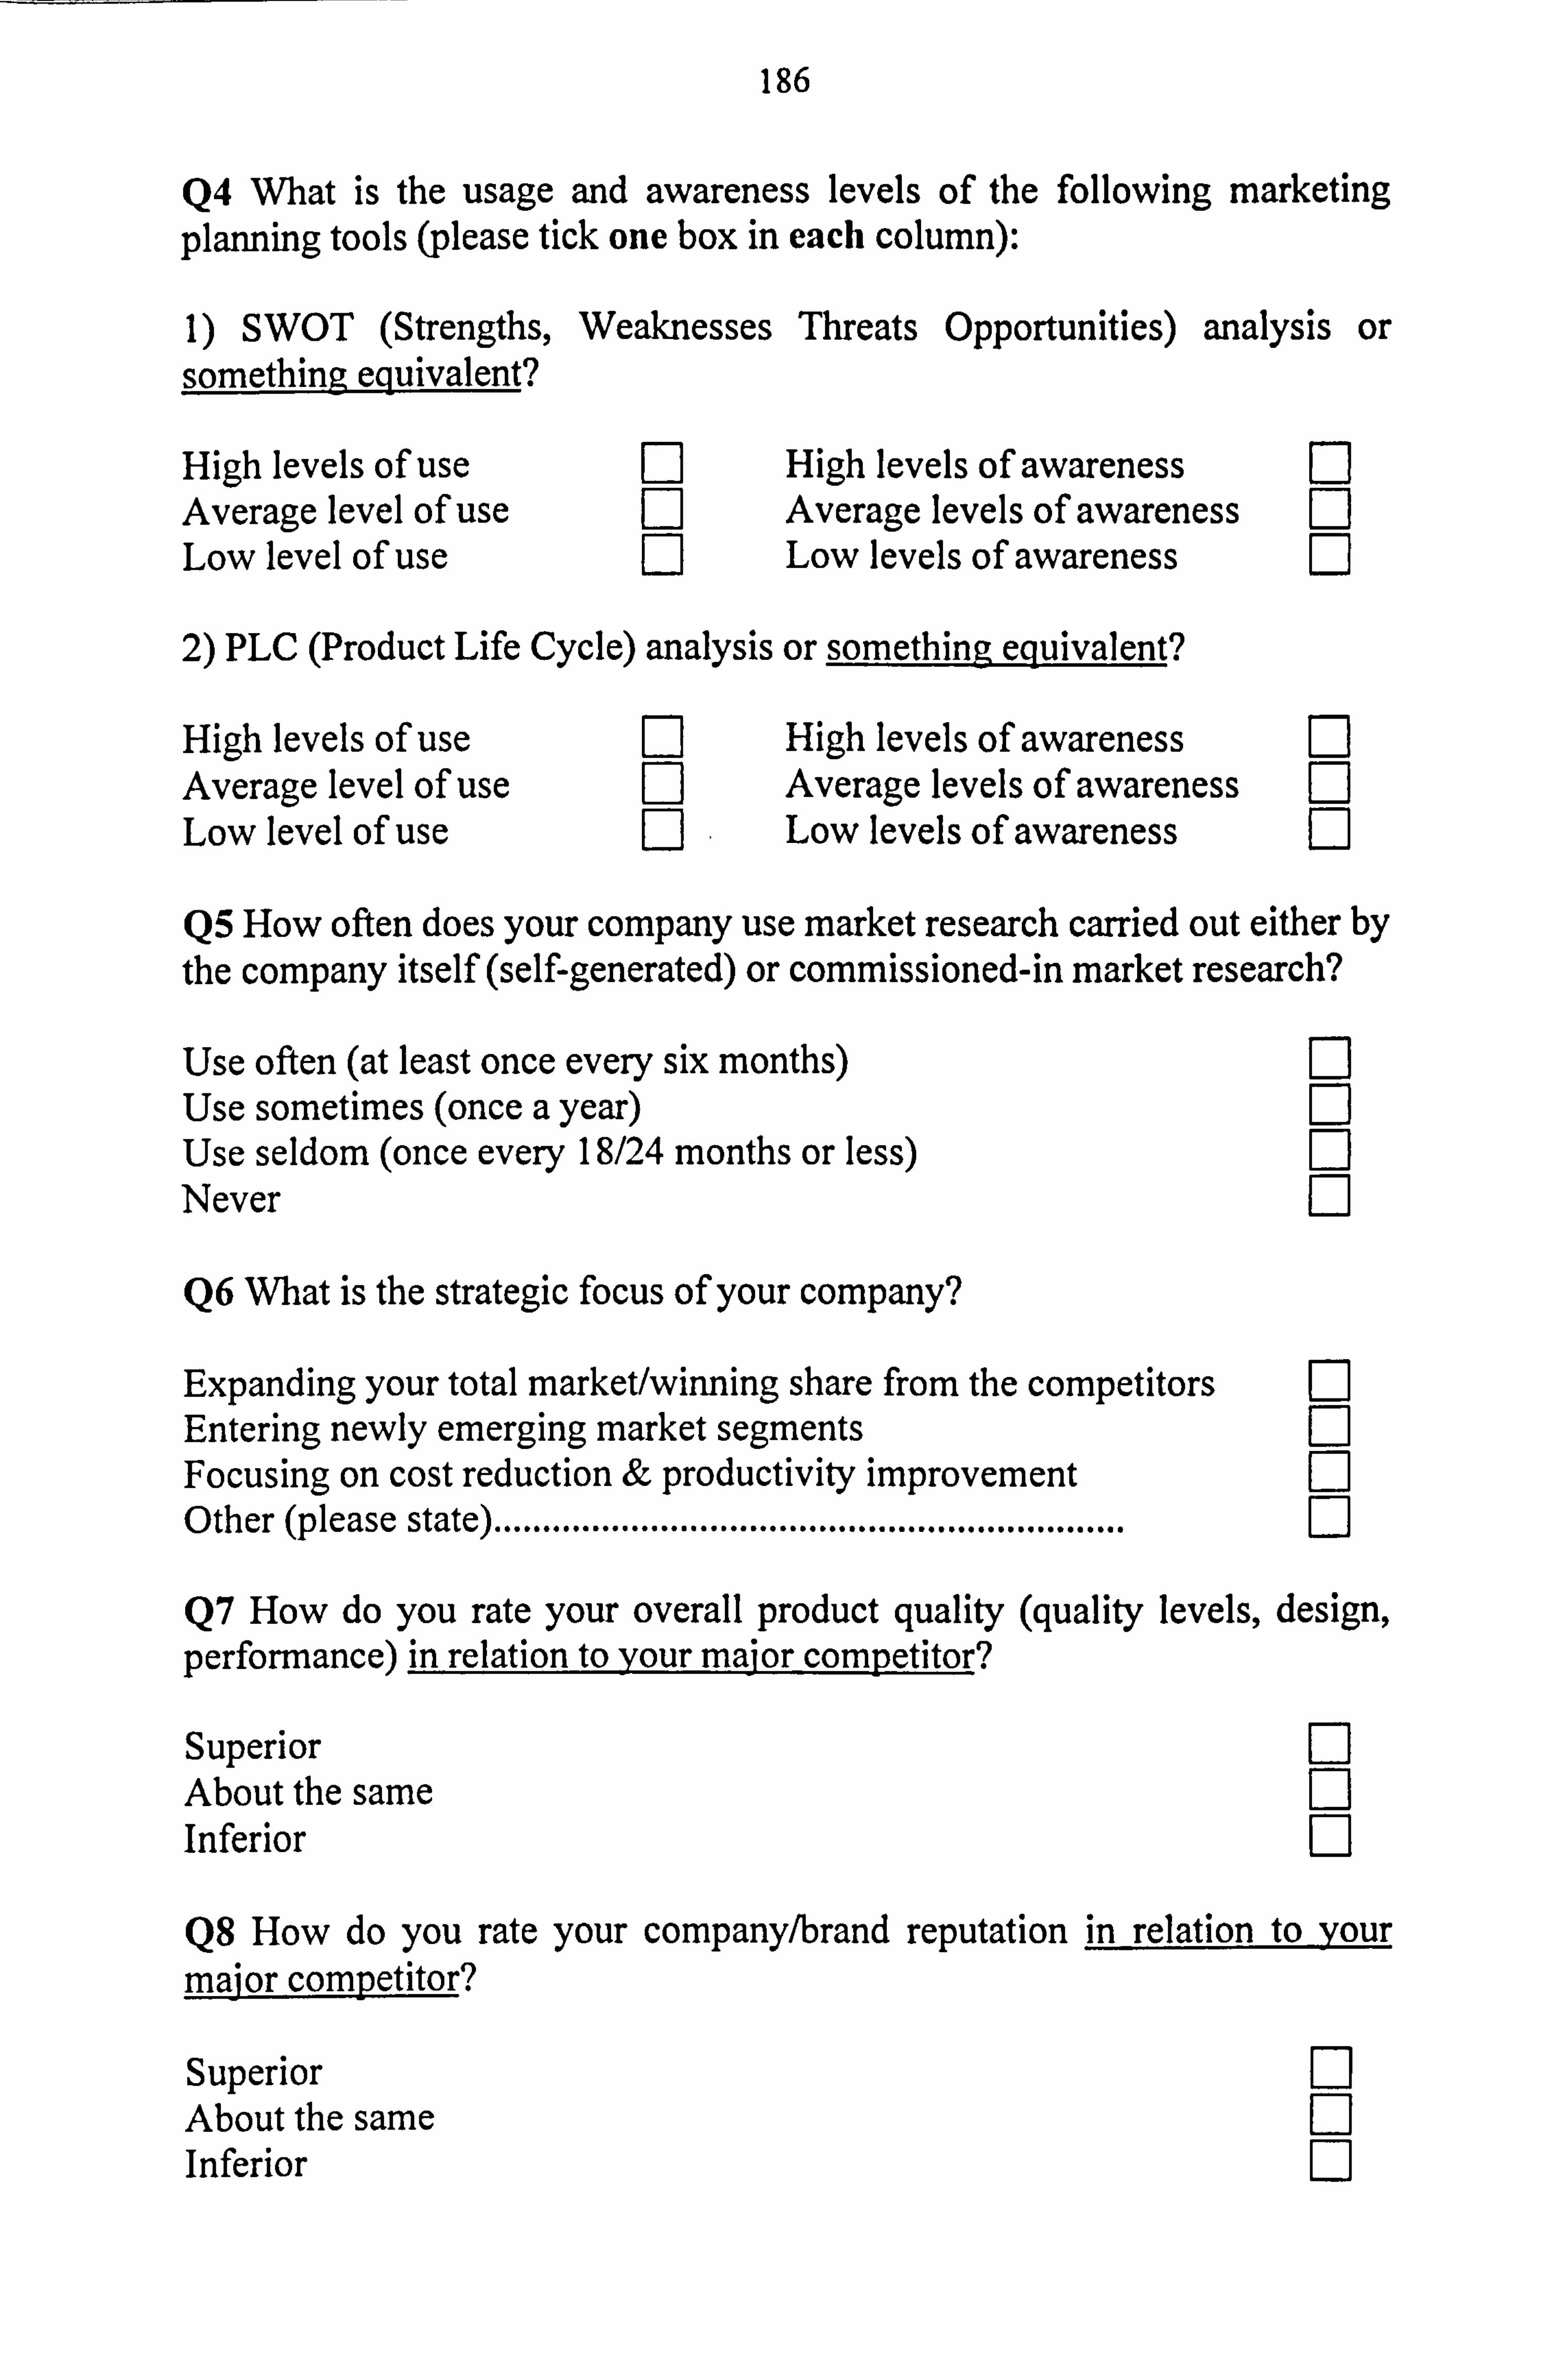
186
Q4 What is the usage and awareness levels of the following marketing planning tools (please tick one box in each column):
1) SWOT (Strengths, Weaknesses Threats Opportunities) analysis or something equivalent?
High levels of use Q High levels of awareness Q Average level of use Q Average levels of awareness Q Low level of use Q Low levels of awareness Q
2) PLC (Product Life Cycle) analysis or something equivalent?
High levels of use Q High levels of awareness Q Average level of use Q Average levels of awareness Q Low level of use Q Low levels of awareness Q
Q5 How often does your company use market research carried out either by the company itself (self-generated) or commissioned-in market research?
Use often (at least once every six months) Q Use sometimes (once a year) Q Use seldom (once every 18/24 months or less) Q Never Q
Q6 What is the strategic focus of your company?
Expanding your total market/winning share from the competitors Q Entering newly emerging market segments Q Focusing on cost reduction & productivity improvement Q Other (please state) ................................................................
Q
Q7 How do you rate your overall product quality (quality levels, design, performance) in relation to your major competitor?
Superior Q About the same Q Inferior Q
Q8 How do you rate your company/brand reputation in relation to your major competitor?
Superior Q About the same Q Inferior Q
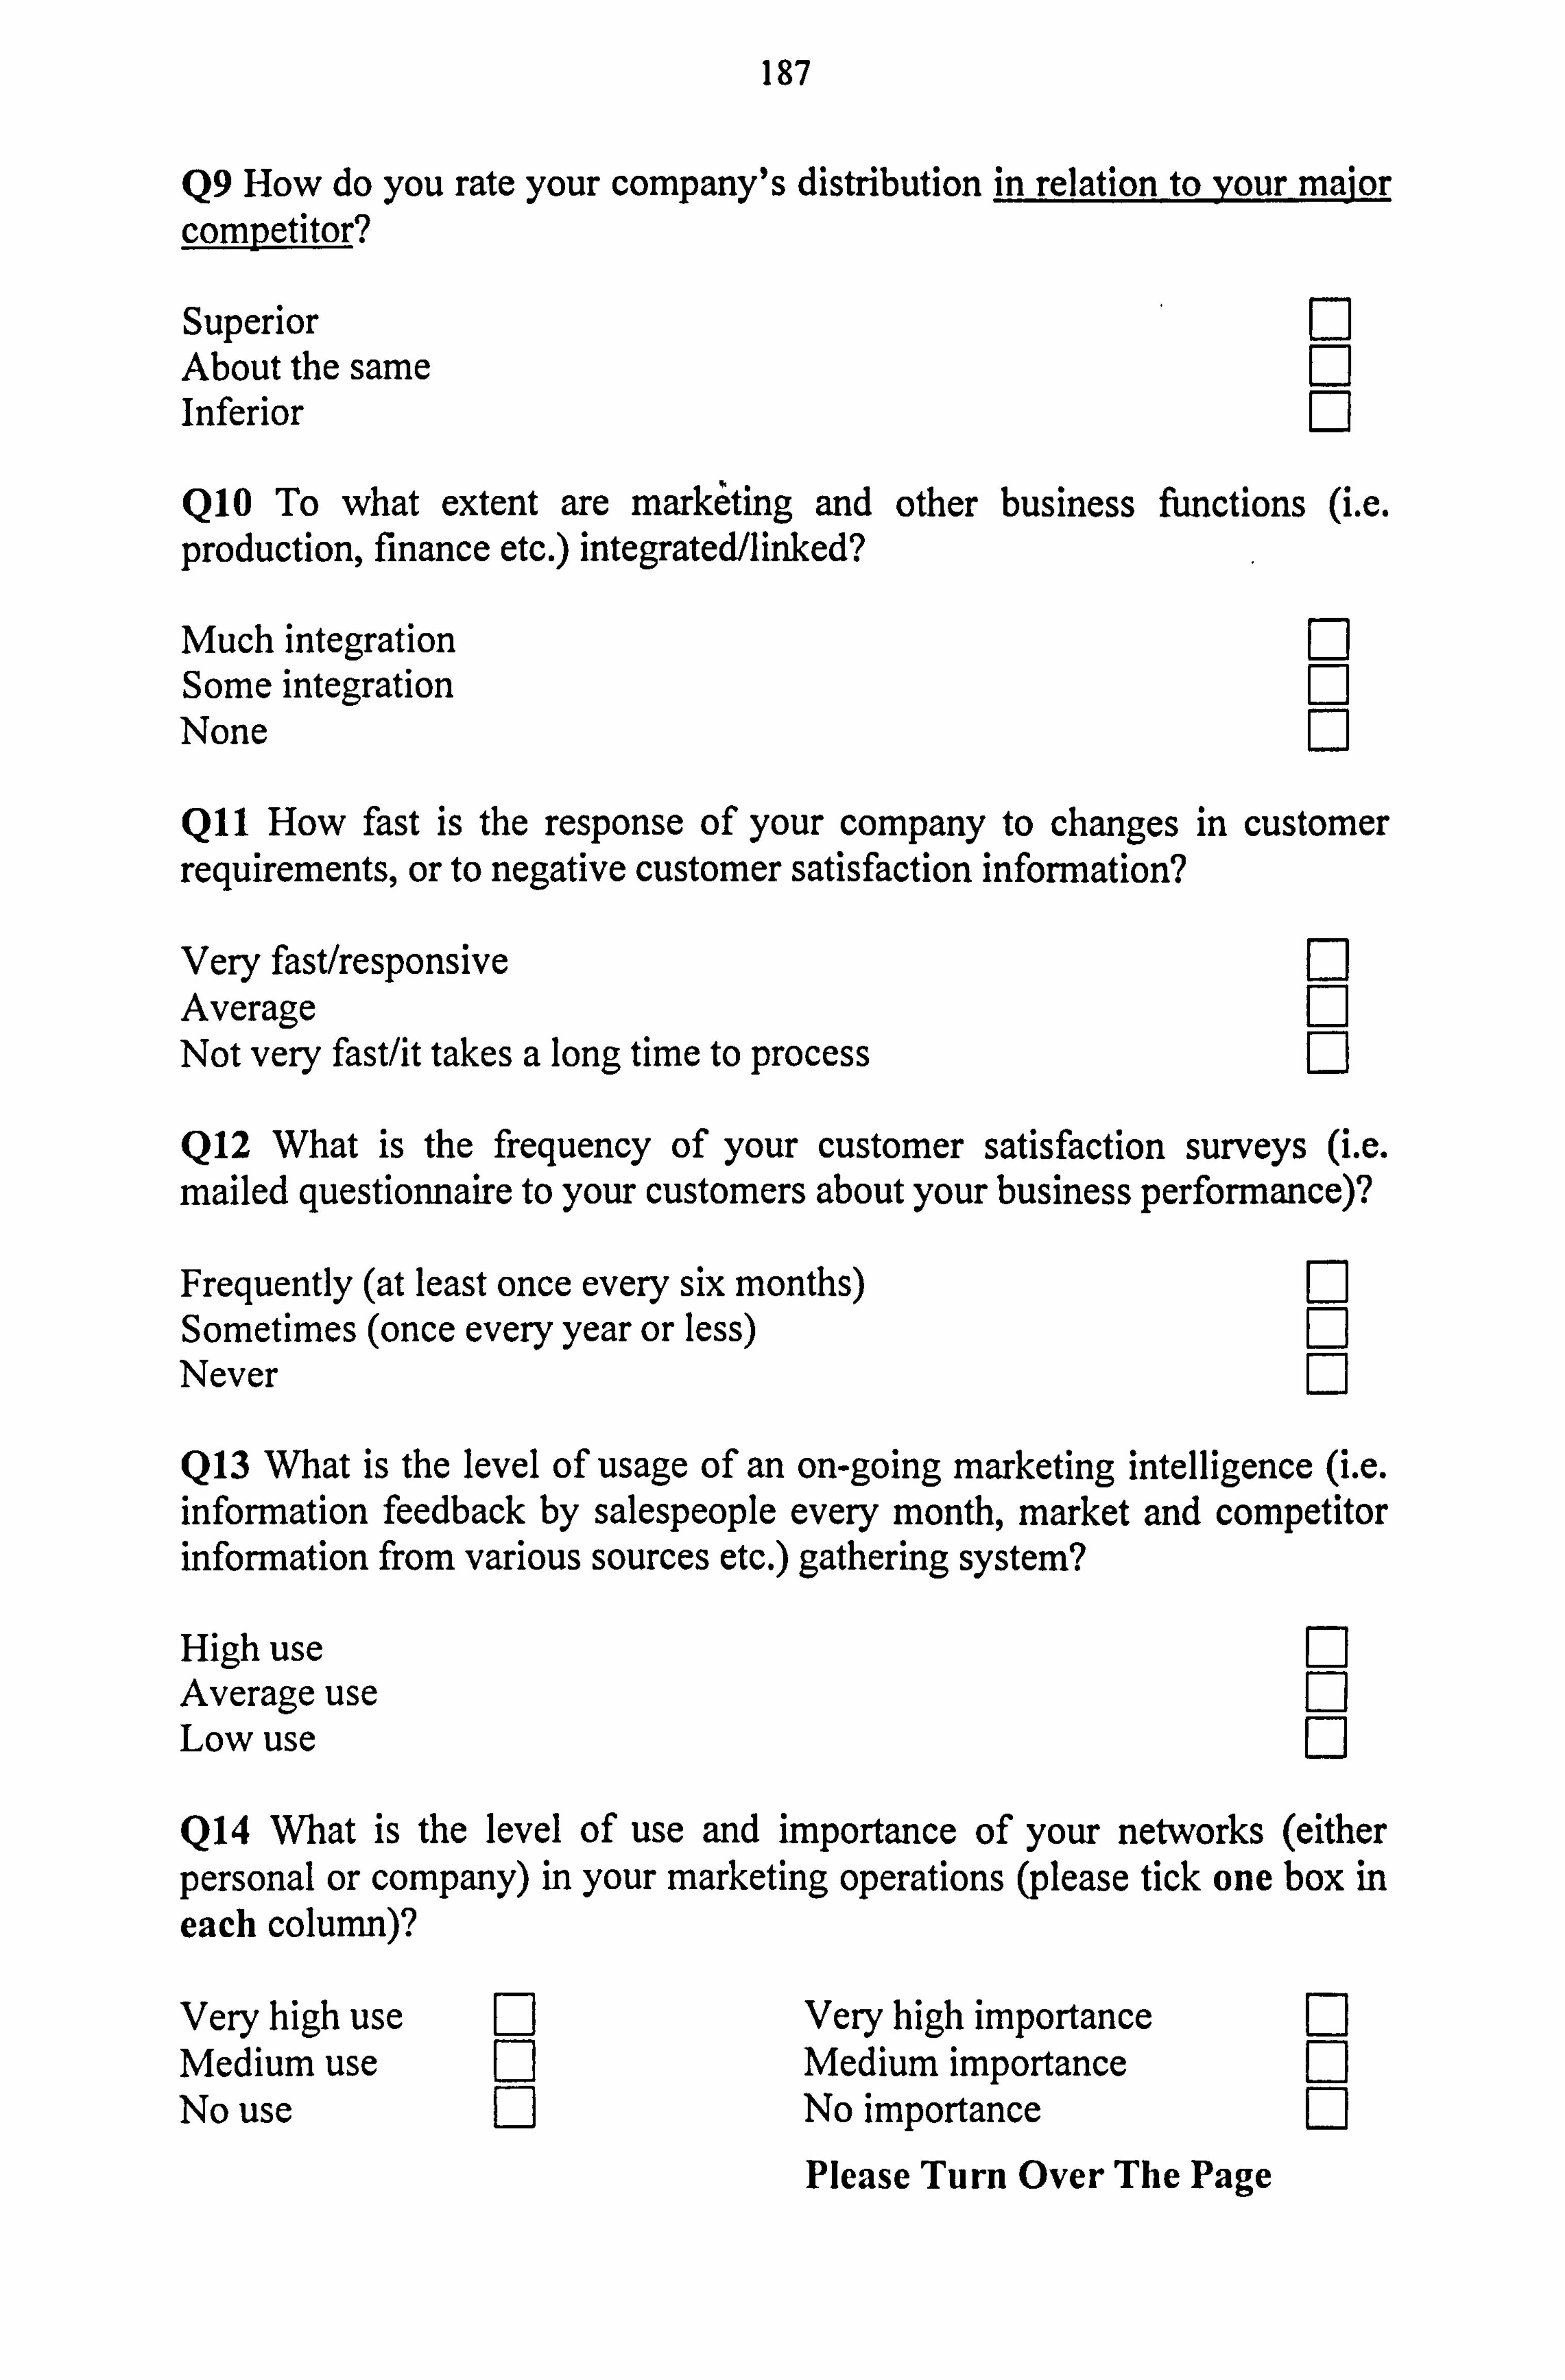
187
Q9 How do you rate your company's distribution in relation to your mayor competitor?
Superior Q About the same Q Inferior Q
Q10 To what extent are marketing and other business functions (i. e. production, finance etc. ) integrated/linked?
Much integration Q Some integration Q None Q
Q11 How fast is the response of your company to changes in customer requirements, or to negative customer satisfaction information?
Very fast/responsive Average Not very fast/it takes a long time to process
F-I F-1 El
Q12 What is the frequency of your customer satisfaction surveys (i. e. mailed questionnaire to your customers about your business performance)?
Frequently (at least once every six months) Sometimes (once every year or less) Never
F-I F-I El
Q13 What is the level of usage of an on-going marketing intelligence (i. e. information feedback by salespeople every month, market and competitor information from various sources etc. ) gathering system?
High use Q Average use Q Low use Q
Q14 What is the level of use and importance of your networks (either personal or company) in your marketing operations (please tick one box in each column)?
Very high use Q Very high importance Q Medium use Q Medium importance Q No use Q No importance Q
Please Turn Over The Page
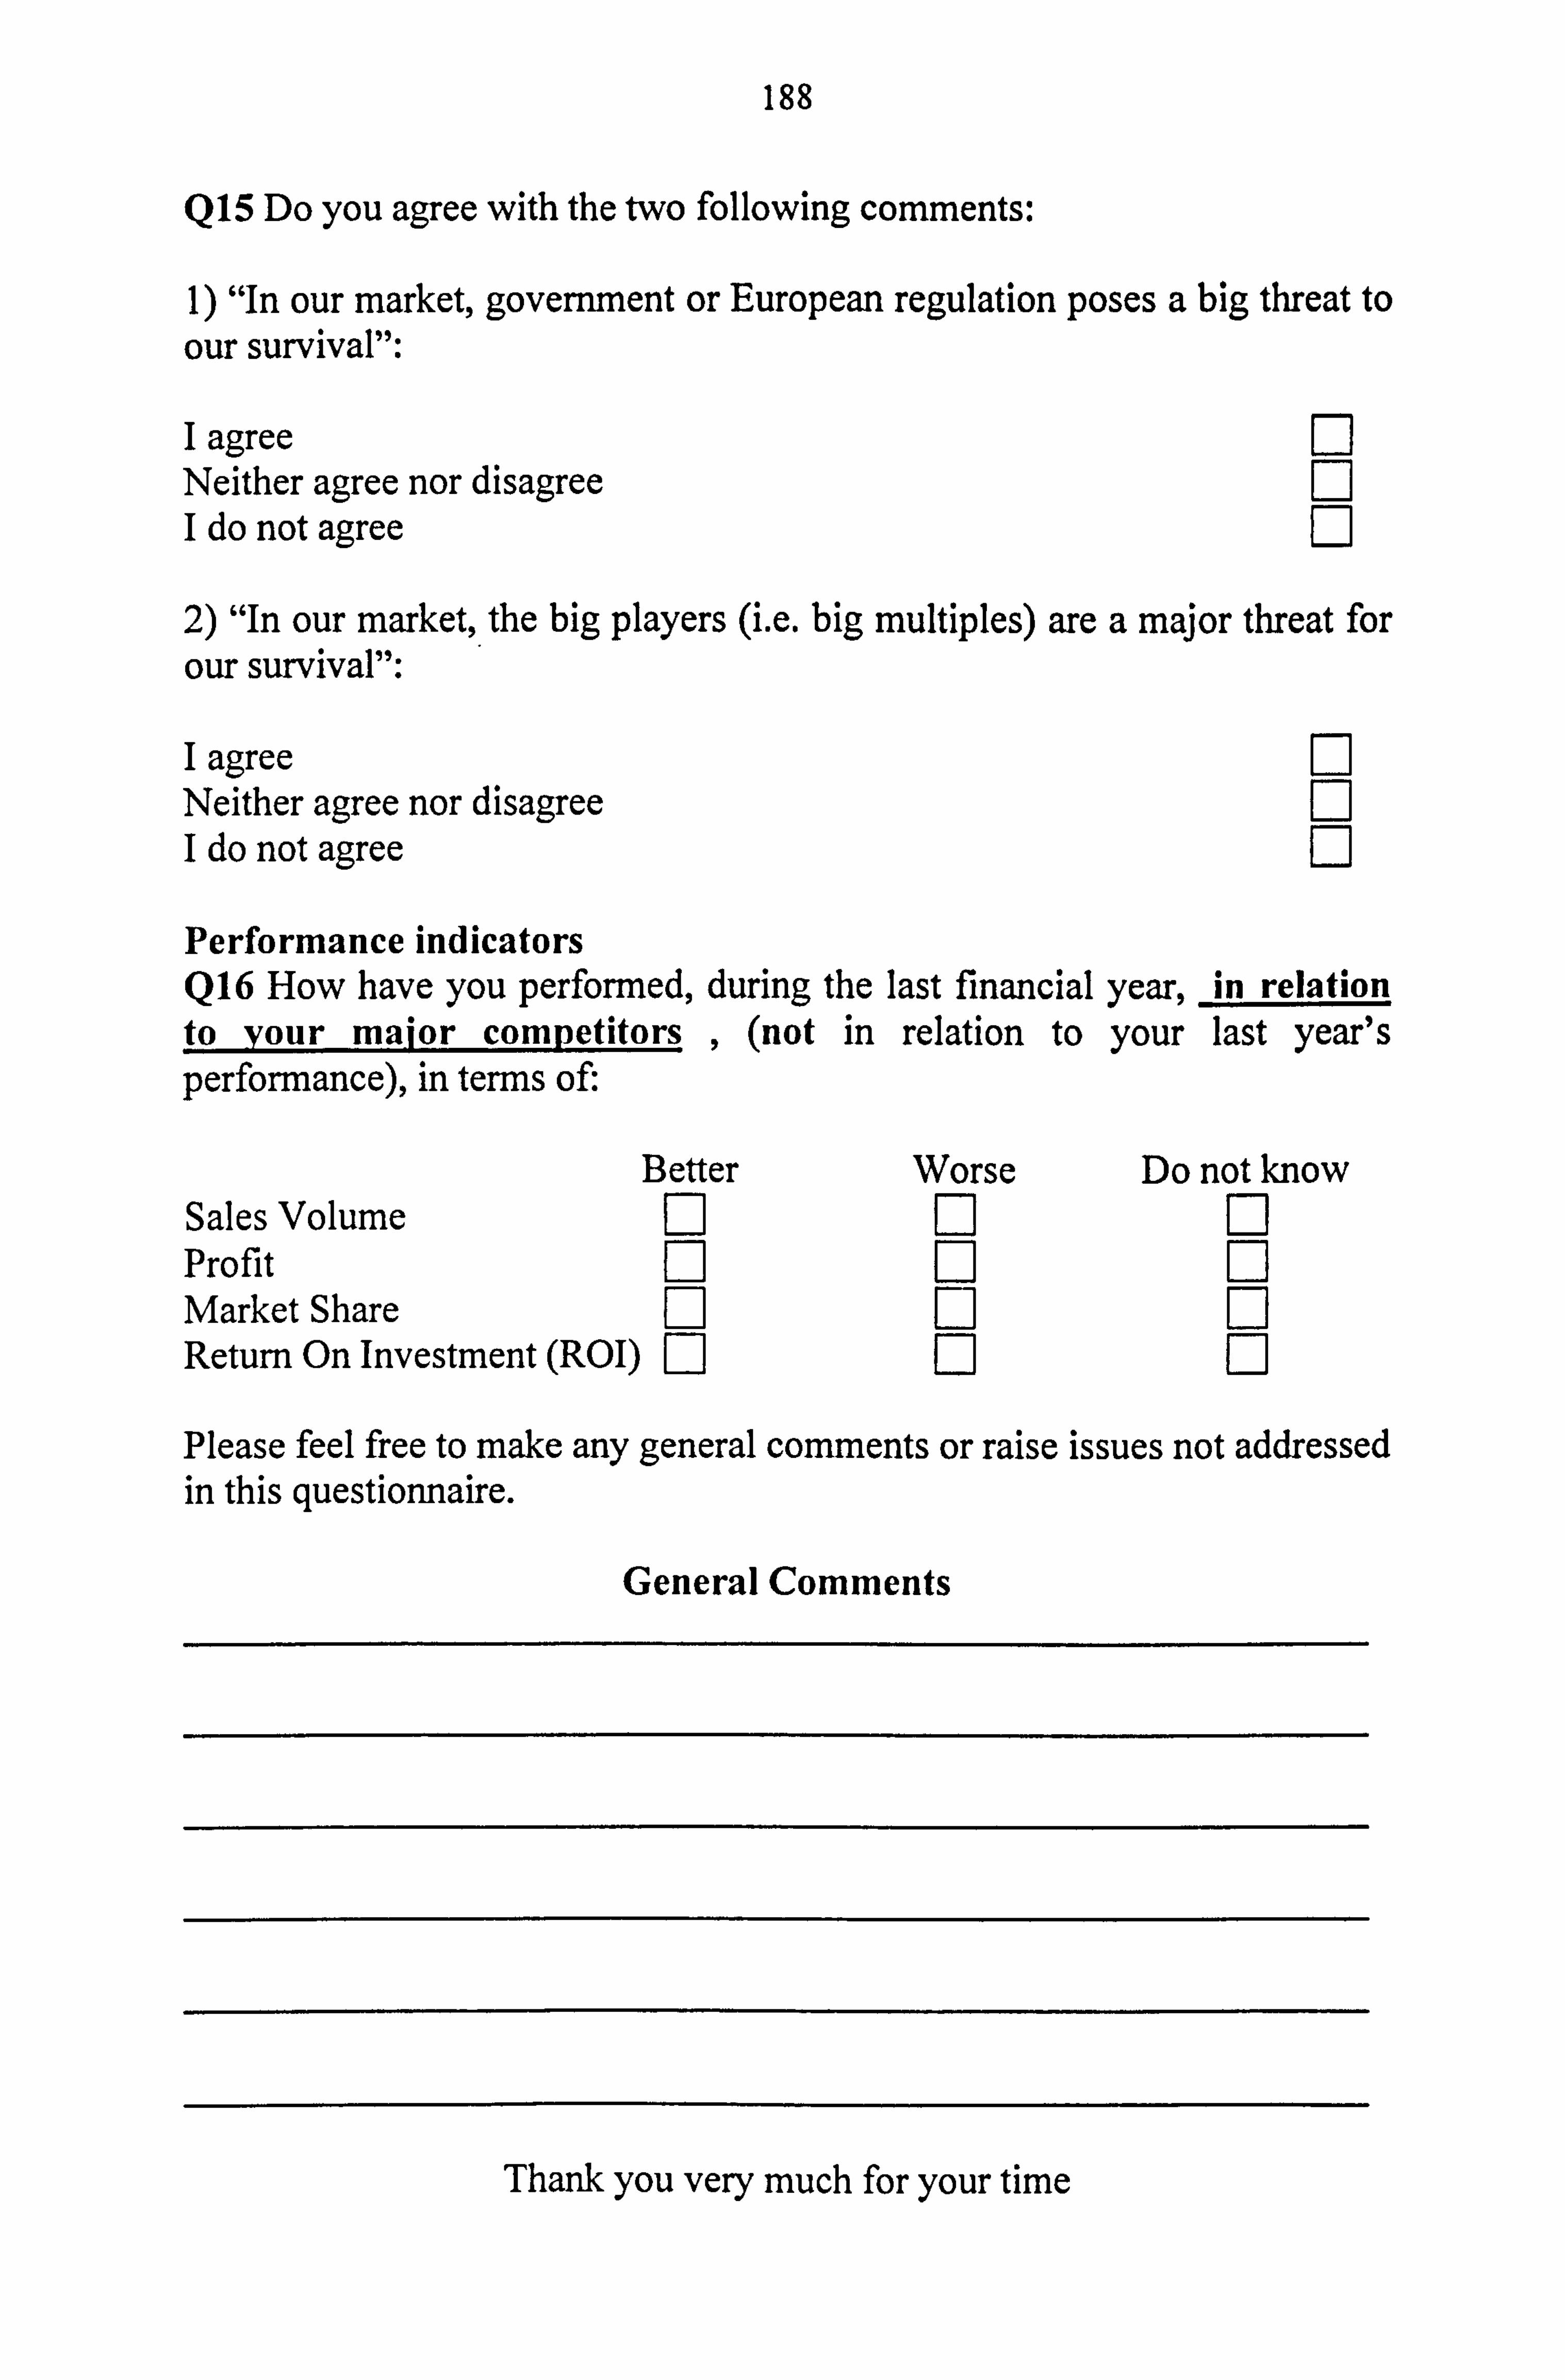
188
Q15 Do you agree with the two following comments:
1) "In our market, government or European regulation poses a big threat to our survival":
I agree Q Neither agree nor disagree Q I do not agree Q
2) "In our market, the big players (i. e. big multiples) are a major threat for our survival":
I agree Neither agree nor disagree I do not agree r-i Performance indicators Q16 How have you performed, during the last financial year, in relation to your major competitors ,
(not in relation to your last year's performance), in terms of:
Better Worse Do not know Sales Volume QQQ Profit QQQ Market Share QQQ Return On Investment (ROI) QQQ
Please feel free to make any general comments or raise issues not addressed in this questionnaire.
General Comments
Thank you very much for your time
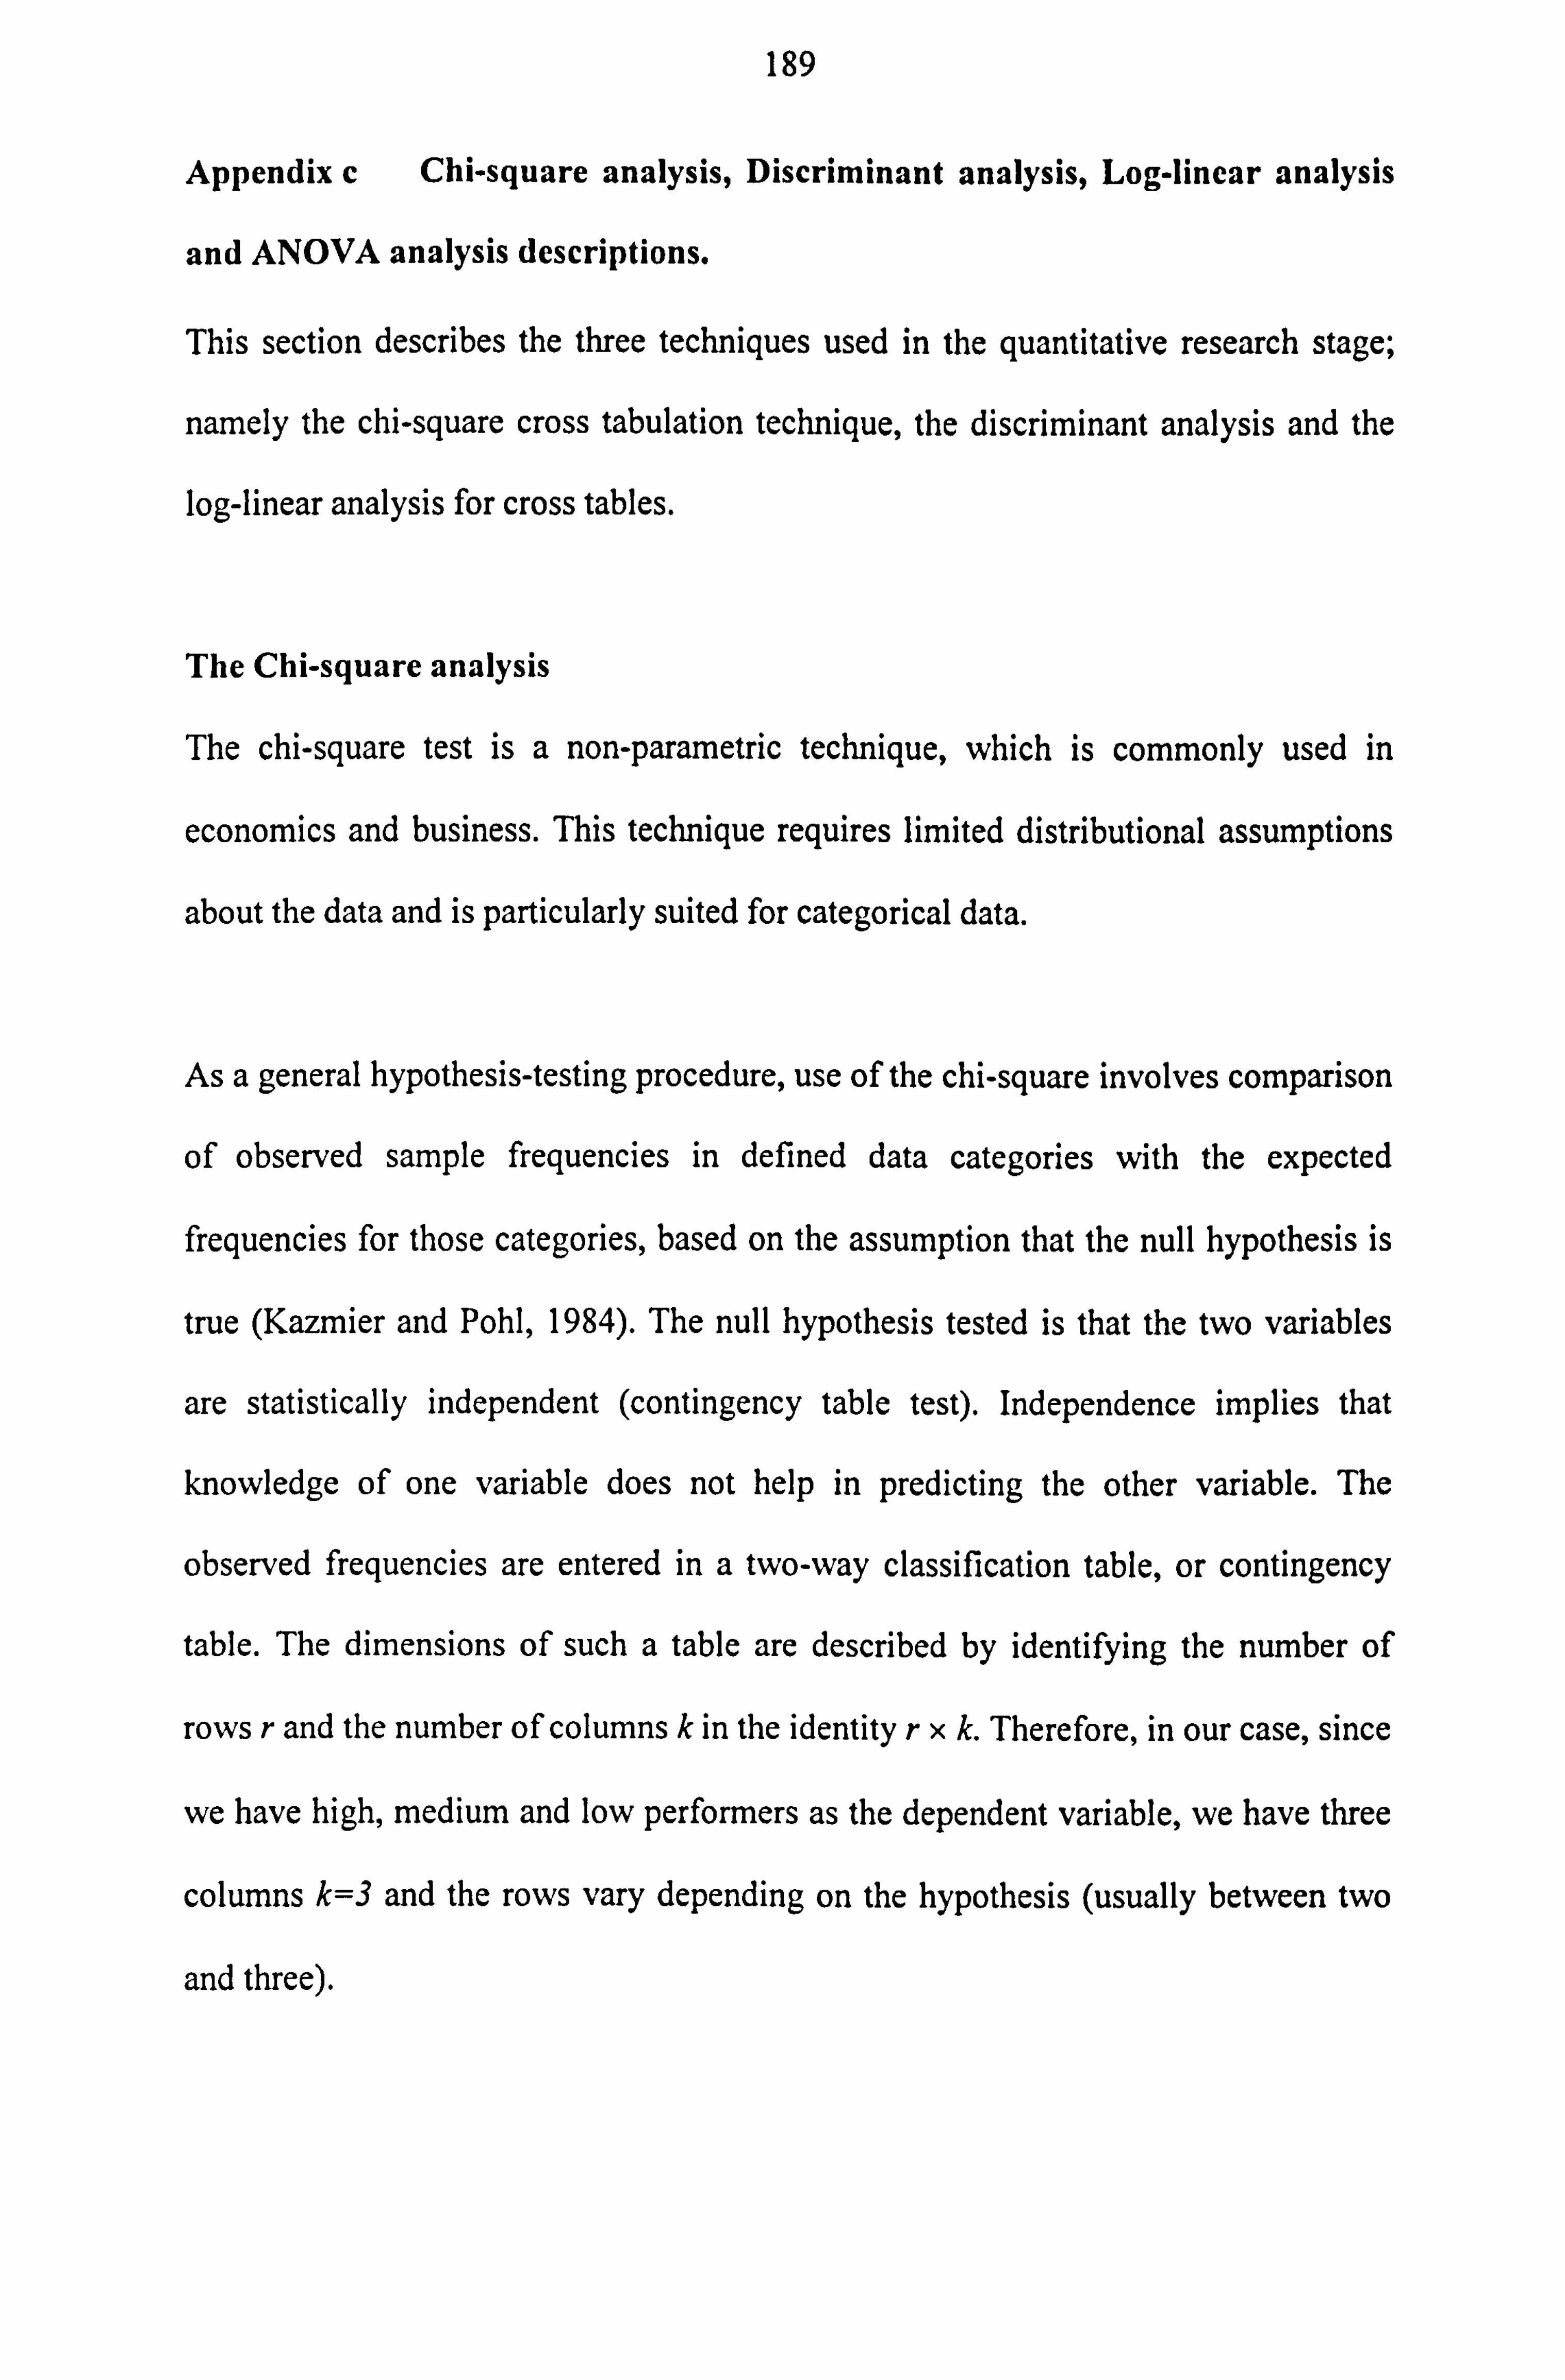
189
Appendix c Chi-square analysis, Discriminant analysis, Log-linear analysis
and ANOVA analysis descriptions.
This section describes the three techniques used in the quantitative research stage;
namely the chi-square cross tabulation technique, the discriminant analysis and the
log-linear analysis for cross tables.
The Chi-square analysis
The chi-square test is a non-parametric technique, which is commonly used in
economics and business. This technique requires limited distributional assumptions
about the data and is particularly suited for categorical data.
As a general hypothesis-testing procedure, use of the chi-square involves comparison
of observed sample frequencies in defined data categories with the expected
frequencies for those categories, based on the assumption that the null hypothesis is
true (Kazmier and Pohl, 1984). The null hypothesis tested is that the two variables
are statistically independent (contingency table test). Independence implies that
knowledge of one variable does not help in predicting the other variable. The
observed frequencies are entered in a two-way classification table, or contingency
table. The dimensions of such a table are described by identifying the number of
rows r and the number of columns k in the identity rxk. Therefore, in our case, since
we have high, medium and low performers as the dependent variable, we have three
columns k=3 and the rows vary depending on the hypothesis (usually between two
and three).
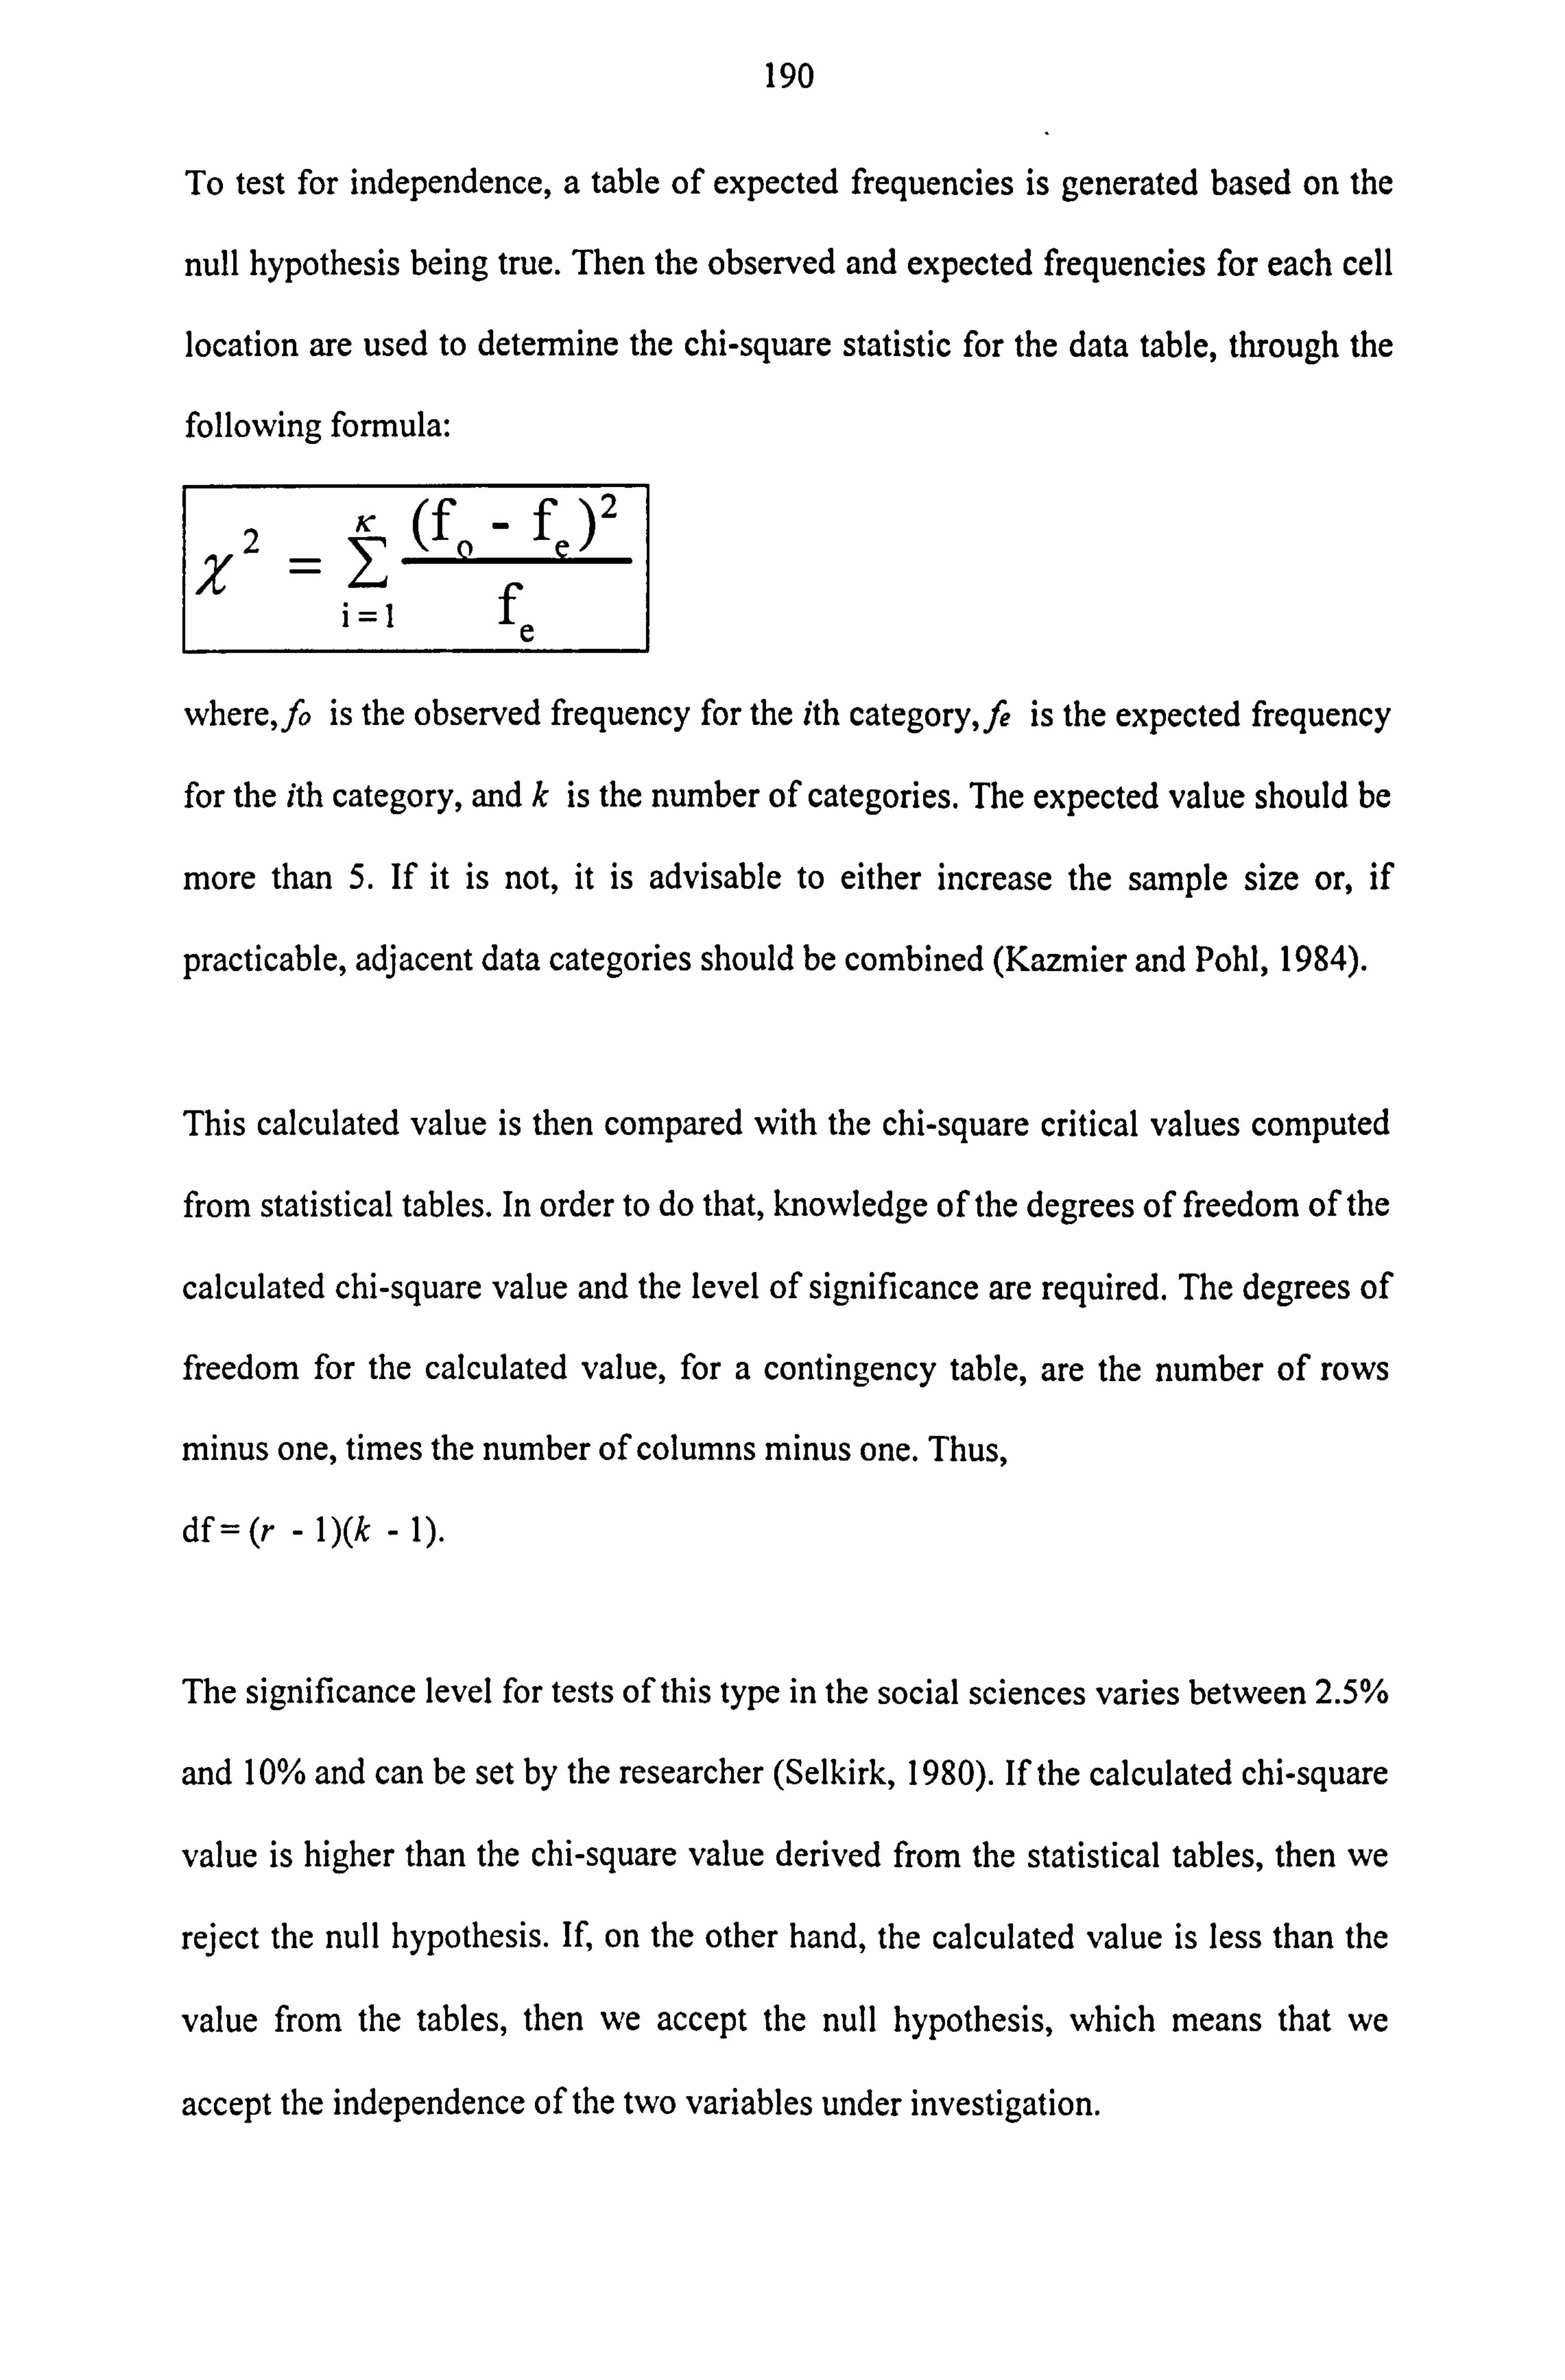
190
To test for independence, a table of expected frequencies is generated based on the
null hypothesis being true. Then the observed and expected frequencies for each cell
location are used to determine the chi-square statistic for the data table, through the
following formula:
2K (f
0 fe 12
x =ý J
=1 f
where, fo is the observed frequency for the ith category, fe is the expected frequency
for the ith category, and k is the number of categories. The expected value should be
more than 5. If it is not, it is advisable to either increase the sample size or, if
practicable, adjacent data categories should be combined (Kazmier and Pohl, 1984).
This calculated value is then compared with the chi-square critical values computed
from statistical tables. In order to do that, knowledge of the degrees of freedom of the
calculated chi-square value and the level of significance are required. The degrees of
freedom for the calculated value, for a contingency table, are the number of rows
minus one, times the number of columns minus one. Thus,
df = (r - 1)(k - 1).
The significance level for tests of this type in the social sciences varies between 2.5%
and 10% and can be set by the researcher (Selkirk, 1980). If the calculated chi-square
value is higher than the chi-square value derived from the statistical tables, then we
reject the null hypothesis. If, on the other hand, the calculated value is less than the
value from the tables, then we accept the null hypothesis, which means that we
accept the independence of the two variables under investigation.
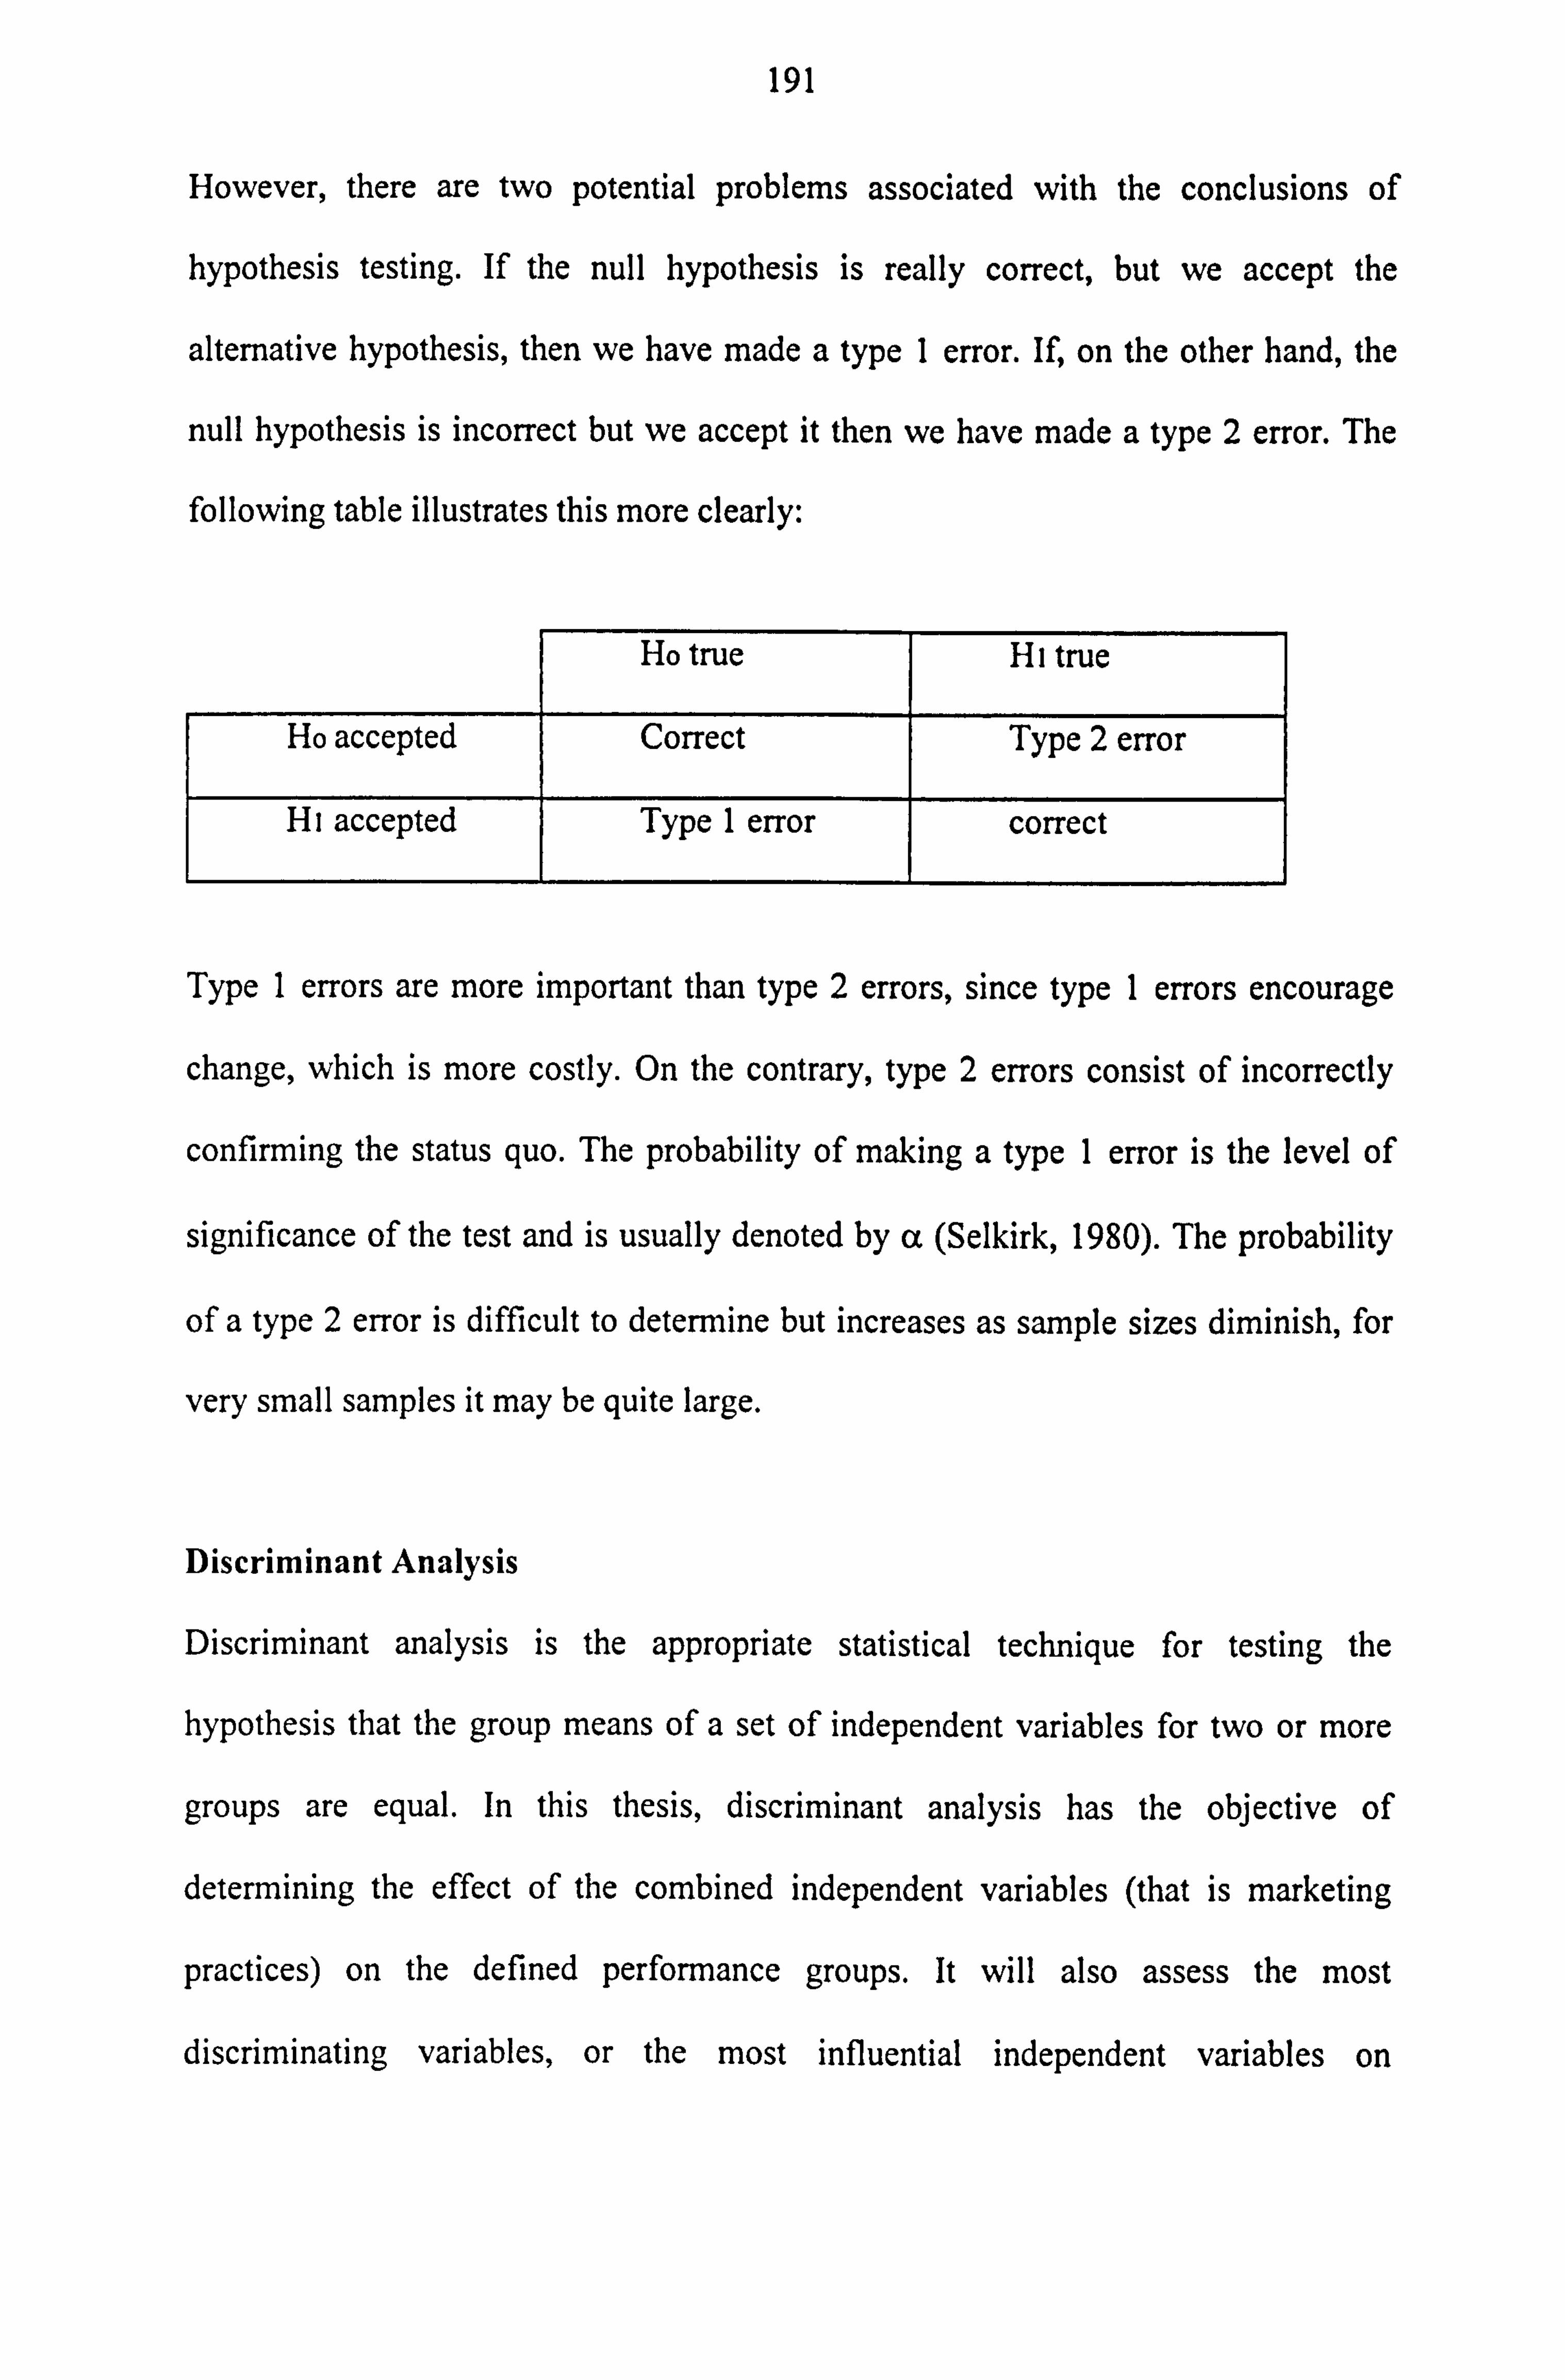
191
However, there are two potential problems associated with the conclusions of
hypothesis testing. If the null hypothesis is really correct, but we accept the
alternative hypothesis, then we have made a type 1 error. If, on the other hand, the
null hypothesis is incorrect but we accept it then we have made a type 2 error. The
following table illustrates this more clearly:
Ho true Hi true
Ho accepted Correct Type 2 error
Hi accepted Type 1 error correct
Type 1 errors are more important than type 2 errors, since type 1 errors encourage
change, which is more costly. On the contrary, type 2 errors consist of incorrectly
confirming the status quo. The probability of making a type 1 error is the level of
significance of the test and is usually denoted by a (Selkirk, 1980). The probability
of a type 2 error is difficult to determine but increases as sample sizes diminish, for
very small samples it may be quite large.
Discriminant Analysis
Discriminant analysis is the appropriate statistical technique for testing the
hypothesis that the group means of a set of independent variables for two or more
groups are equal. In this thesis, discriminant analysis has the objective of
determining the effect of the combined independent variables (that is marketing
practices) on the defined performance groups. It will also assess the most
discriminating variables, or the most influential independent variables on
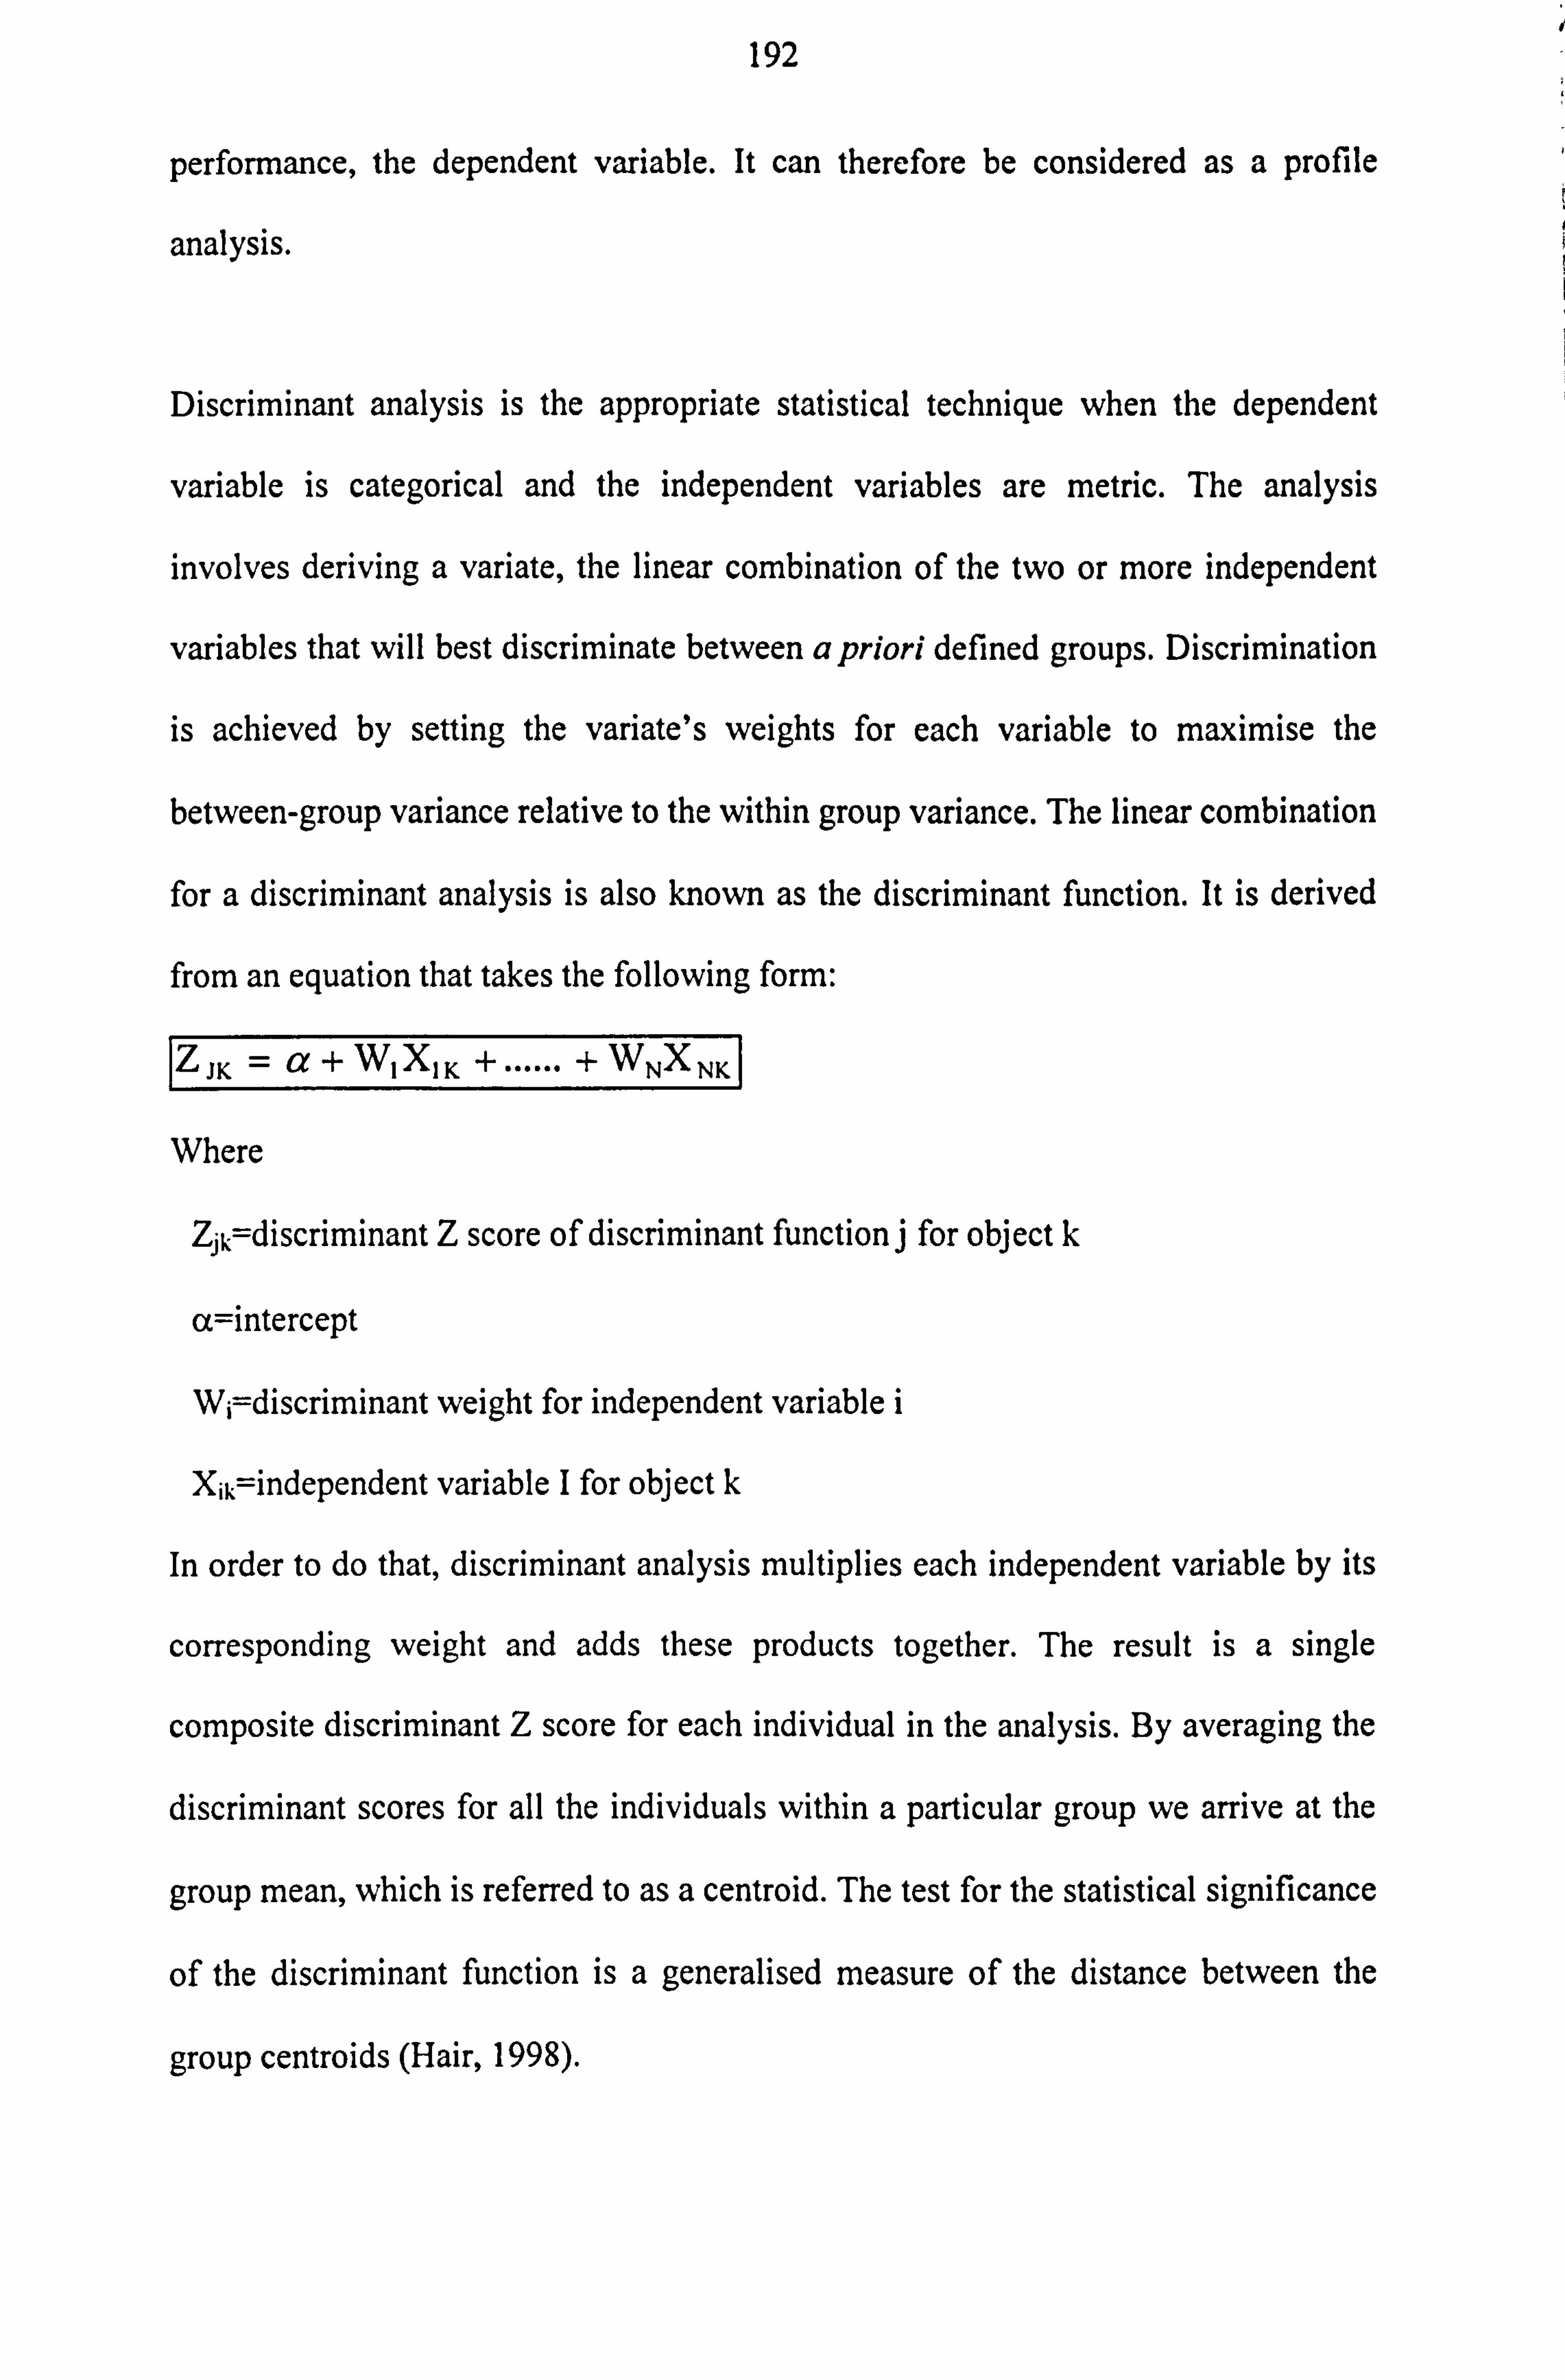
192
performance, the dependent variable. It can therefore be considered as a profile
analysis.
Discriminant analysis is the appropriate statistical technique when the dependent
variable is categorical and the independent variables are metric. The analysis
involves deriving a variate, the linear combination of the two or more independent
variables that will best discriminate between a priori defined groups. Discrimination
is achieved by setting the variate's weights for each variable to maximise the
between-group variance relative to the within group variance. The linear combination
for a discriminant analysis is also known as the discriminant function. It is derived
from an equation that takes the following form:
ZJK = a+ WIXI K +...... + WNXNK
Where
Zjk=discriminant Z score of discriminant function j for object k
a=intercept
W; discriminant weight for independent variable i
X; k=independent variable I for object k
In order to do that, discriminant analysis multiplies each independent variable by its
corresponding weight and adds these products together. The result is a single
composite discriminant Z score for each individual in the analysis. By averaging the
discriminant scores for all the individuals within a particular group we arrive at the
group mean, which is referred to as a centroid. The test for the statistical significance
of the discriminant function is a generalised measure of the distance between the
group centroids (Hair, 1998).
193
In terms of the research design there are issues associated with the selection of the
dependent variables. The researcher should choose the dependent variables first. In
this project, the polar extreme approach is followed. This approach states that the
research should compare only the two extreme groups. This approach becomes
particularly useful when regression results are poor; that is the polar extremes
approach with discriminant analysis can reveal differences that are not as prominent
in a regression analysis of the full data set (Hair, 1995, p. 195). In our case medium
and low financial performers are merged into one (average/low) performance group.
Furthermore, no holdout sample needs to be used (Hair, 1995; Siu, 1997), especially
since the sample size is small.
Independent variables that had either a significant (p < 0.1) or highly significant (p
<0.05) relationship with high performance, in the chi-square tests (for a detailed
examination see chapter 6, section 6.2), are the variables included in the discriminant
analysis. In particular, the subsidiary and the agri-food SMEs' independent variables
are the significant variables from their perspective results of their chi-square tests.
The independent SMEs independent variables were all the highly significant (p <
0.05) variables from its chi-square results. The rationale behind this was to add
statistical robustness to the model, since the simultaneous estimation accounts for
carefully selected independent variables. According to Hair et al (1998), the
minimum sample size should be the number of independent variables multiplied by
five. As a practical guideline, each group of the dependent variable should have at
least 20 observations or more.
194
The principal assumptions underlying discriminant analysis are as follows:
1. normality of the independent variables,
2. unknown dispersion and covariance structures as defined by the dependent
variables,
3. no multicollinearity or dependence of the independent variables,
4. and that all relationships are linear
In terms of computational methods, there are two alternatives, the simultaneous
estimation and the stepwise procedure. In simultaneous estimation, the discriminant
function is computed based on the entire set of independent variables, regardless of
the discriminating power of each independent variable. Multicollinearity is
considered to have a greater effect on the stepwise procedure than on the
simultaneous procedure, since it involves more independent variables in the function
(Hair, 1995).
The Wilk's Lambda test was used in order to evaluate the statistical significance of
the discriminatory power of the discriminant function. Once the discriminant
function is identified, the attention shifts to the overall fit of the retained discriminant
function. This assessment involves either the proportional chance criterion or the
Press Q statistic. The formula for the proportional chance criterion is as follows:
CPRO- P2 + (I -p)2
Where
CPRO= proportion chance criterion
p= proportion of firms in the average/low performers group
1-p= proportion of firms in the successful performers group
195
Finally, the interpretation of results stage involves either looking at the discriminant
weights (function coefficients table), the discriminant loadings (structure matrix
table) or the partial F values (group means table). According to Hair et al (1998), the
discriminant loadings should be preferred for that purpose. Any negative signs in the
discriminant loadings should be interpreted as this variable is having the opposite
effect.
Log-linear Model for Three-variable Tables
The log linear model is a categorical data analysis method, which is an analysis of
variance model applied to the natural logarithms of multinomial probabilities or
expected cell counts, used to investigate whether an association between two
variables changes when other variables are considered (Siu, 1997). For a single
response, it is simpler and more natural to use logit models (Agresti, 1996). The log-
linear model for three variable table can be utilised to examine the independence
among the three variables in cross classifications by identifying the odd ratio of
occurrence.
The log-linear model can be presented as follows:
EA (F) =F (n) = Xß
Where EA denotes asymptotic expectation
X is the design matrix containing fixed constants, and
P is a vector of parameters to be estimated
As for each sample i, the probability of the jth response (7tij ) is estimated by the
sample proportion pu = nj/n;. The vector (p) of all proportions is then transformed
into F=F (p), a vector of functions. If n denotes the vector of true probabilities of
the population, then the functions of the true probabilities will be by F (n).
196
In this research project, the ownership status effect on company performance is
investigated. Therefore, the main effect model is used, which is the effects influenced
independently of ownership status and marketing practices. Thus, the model is
presented as follows:
Categorical variable y: p= Pr (y = 1),
1p= Pr (y=2).
The probability p depends on factors A and B. Thus,
P= Pr (y =1 for A=i, B =j), where i=1... a; j= 1... b.
A logistic linear model with main effect only is:
Phi In------------ =µ+ Al +B
1-p, j
There are two approaches to the analysis of the data: the maximum likelihood
approach and the weighted least square method. The maximum likelihood approach
is commonly used by researchers because of the widespread availability of statistical
software like SAS and SPSS. This research uses the maximum likelihood approach
of the SAS CATMOD routine to analyse the data as specified by Stokes et al .
(1995).
ANOVA analysis
The one factor randomised design of the analysis of variance is concerned with
testing the differences among k population means when the subjects are assigned
randomly to each of the k treatment groups. The `one factor' is the method of
instruction with three treatment levels associated with this factor.
197
As a way of describing and differentiating the various types of experimental designs
in the analysis of variance, each type of design can be represented in terms of the-
linear model that identifies the components influencing the value of the random
variable. The linear equation that represents the one-factor completely randomised
design is defined as follows:
X-1u+ak+Eik
Where p= overall mean of all treatment population
ak = effect of the treatment in the particular group k from which the value
was sampled
sk = random error associated with the process of sampling
The test statistic, F, is defined as:
MSTR F= --------------
MSE
Where MSTR = The mean square based on the differences among treatment-group
means
MSE = Means Square within each group (does not include any influences
associated with the treatment).
198
Appendix d Performance measure validation and interview questions
In this appendix, there will be a comparison of the performance measure used in the
questionnaire with accounts financial data from FAME database of 69 available
companies. There will also give the questions asked during the interviews as well as
the detailed analysis process, which was undertaken with the aim of NUD. IST
software.
Comparison of three companies with their competition
The approach of positioning financial performance measures in the context of the
owner/managers perception, and comparing that to a national and market level is not
new. Ettlinger (1996) used this approach in order to evaluate small firms'
performance in a local context. Several more studies have been undertaken to
identify the financial ratios used by owner/managers of small and growing businesses
to monitor their businesses (Holmes and Nicholls, 1989, McMahon and Davies,
1991).
Three of the respondent companies' financial data (classed from their performance
responses as high, medium and low) were compared to the overall average of the
original sampling frame of 600 agri-food SMEs. Furthermore, a peer group of
companies who operate in the same or similar market was also averaged and
compared to the companies' data. These peer companies may not meet the SME
criteria, since many of the SMEs analysed operate in markets with large companies
as their major competitors.
The peer group was specified by FAME database as "companies with the same
Primary UK SIC-92 code". Unfortunately it was impossible to change the SIC
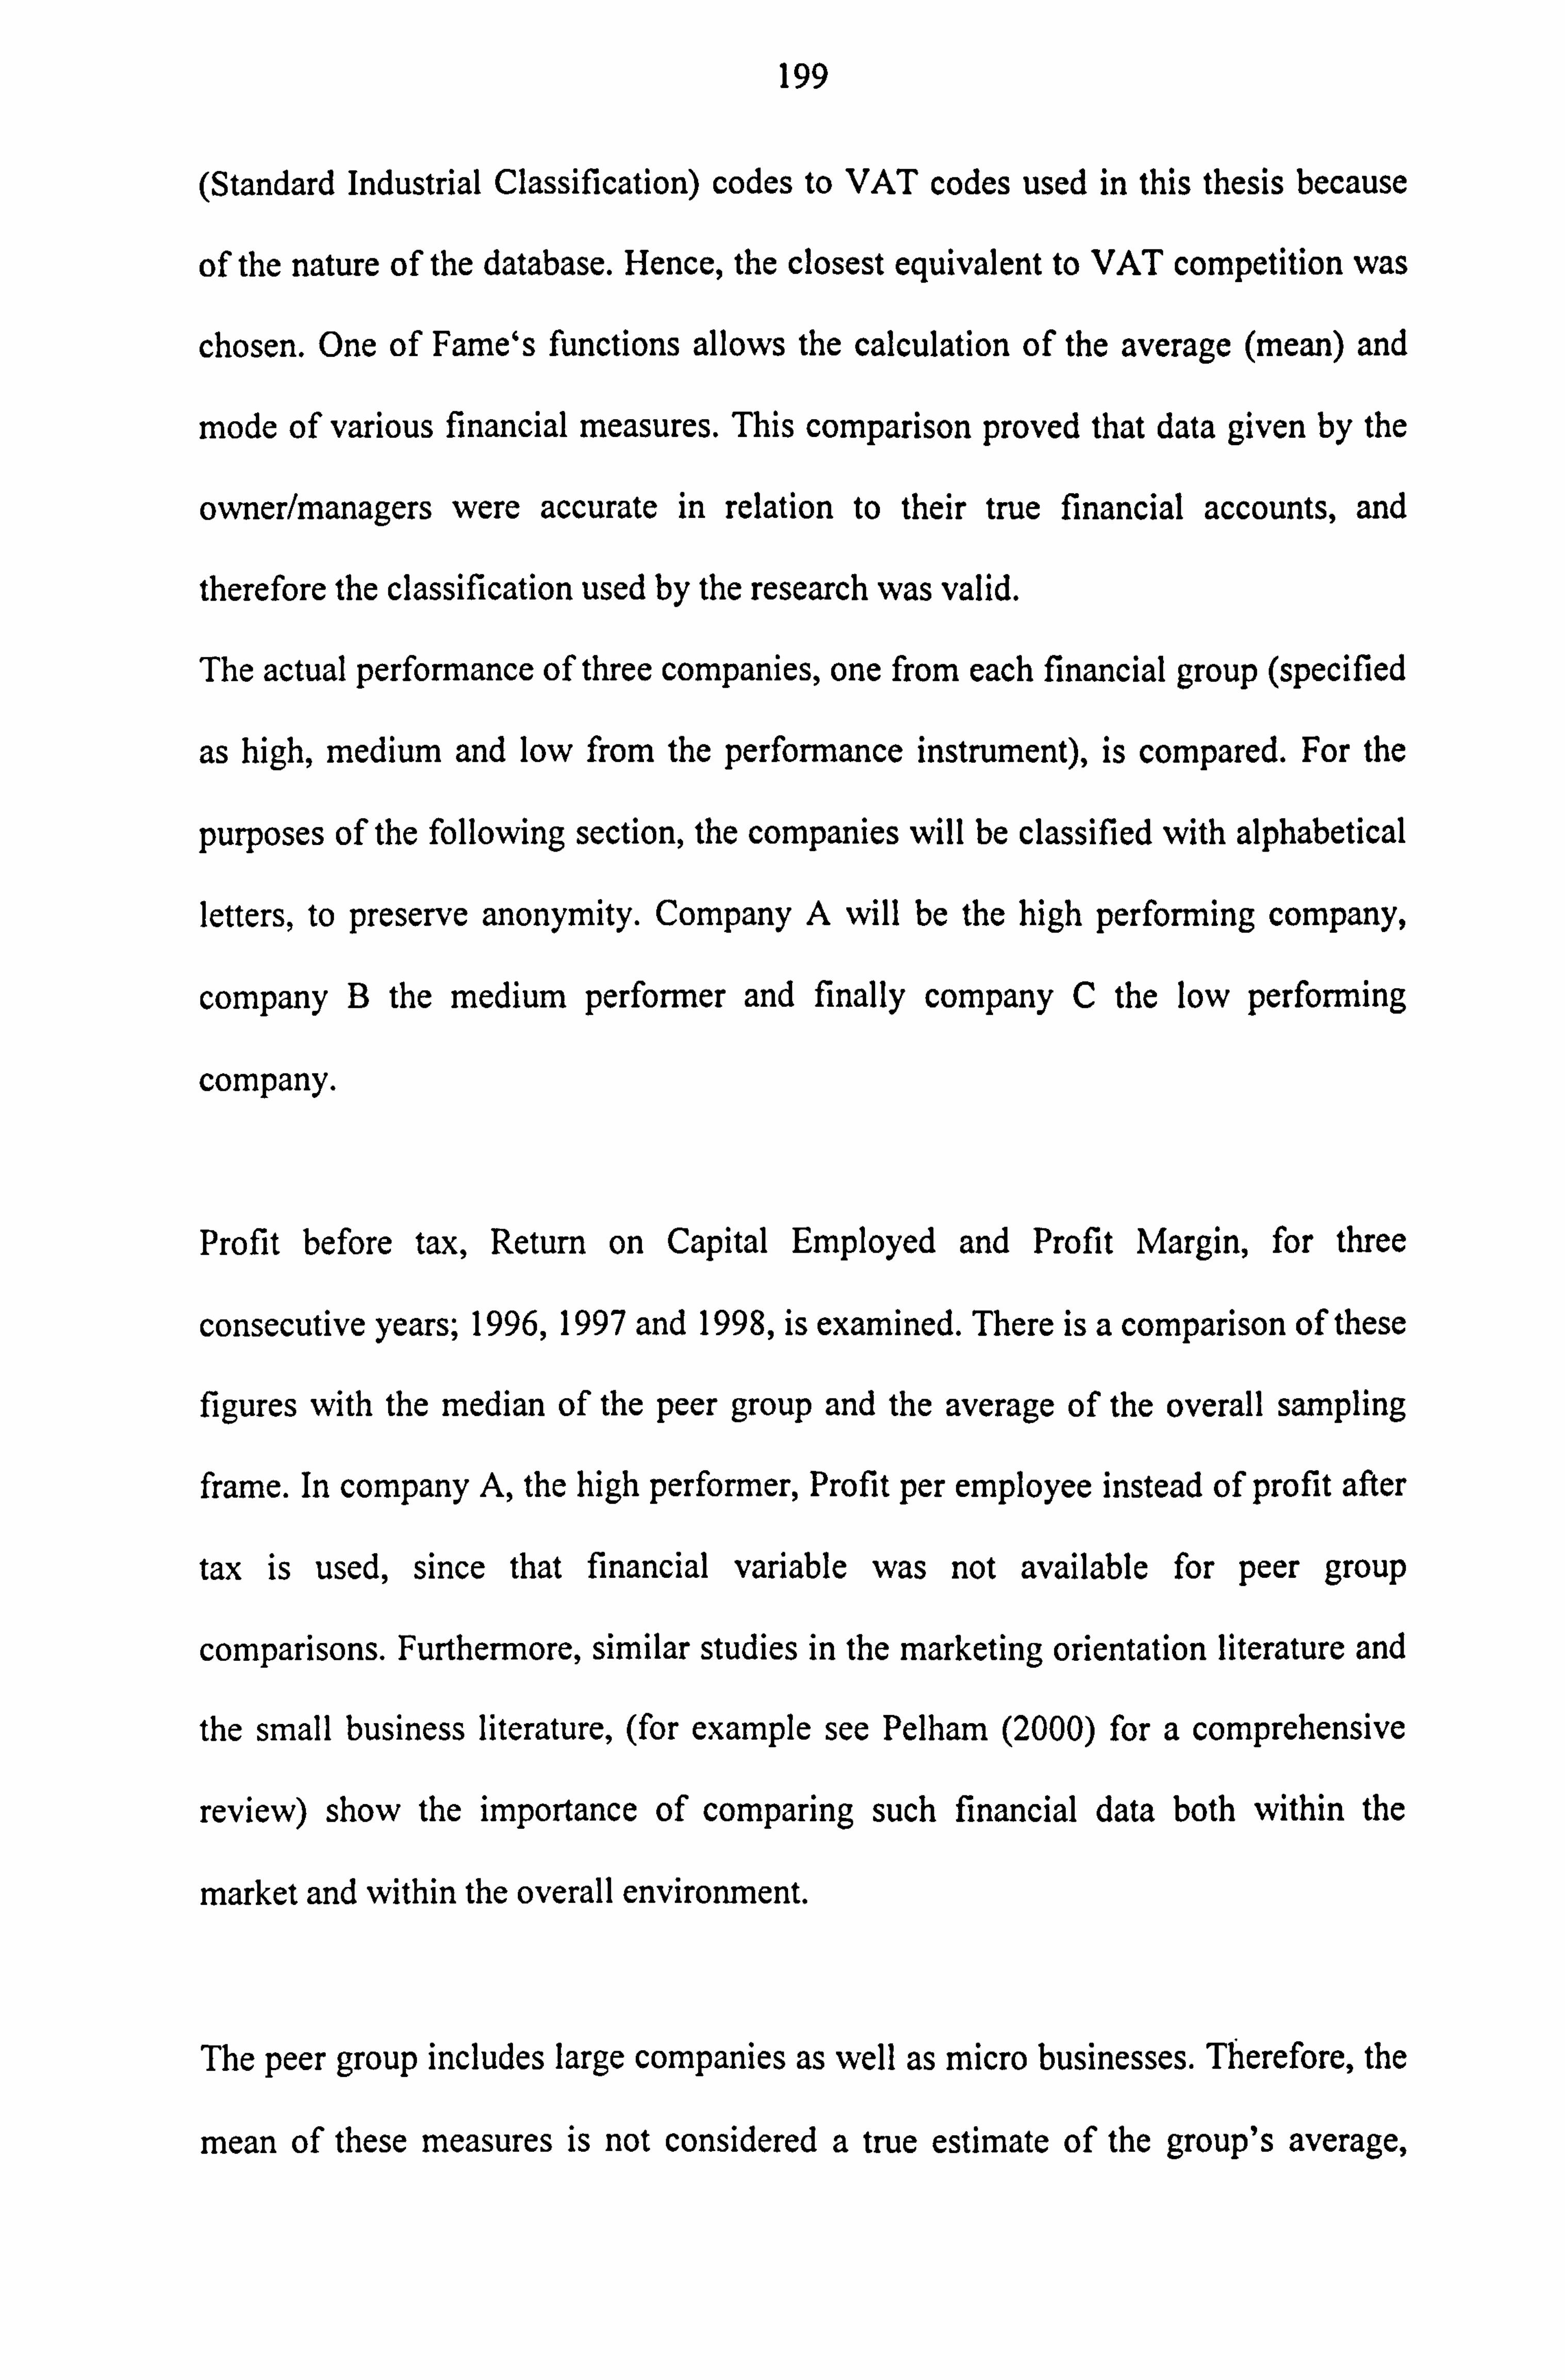
199
(Standard Industrial Classification) codes to VAT codes used in this thesis because
of the nature of the database. Hence, the closest equivalent to VAT competition was
chosen. One of Fame's functions allows the calculation of the average (mean) and
mode of various financial measures. This comparison proved that data given by the
owner/managers were accurate in relation to their true financial accounts, and
therefore the classification used by the research was valid.
The actual performance of three companies, one from each financial group (specified
as high, medium and low from the performance instrument), is compared. For the
purposes of the following section, the companies will be classified with alphabetical
letters, to preserve anonymity. Company A will be the high performing company,
company B the medium performer and finally company C the low performing
company.
Profit before tax, Return on Capital Employed and Profit Margin, for three
consecutive years; 1996,1997 and 1998, is examined. There is a comparison of these
figures with the median of the peer group and the average of the overall sampling
frame. In company A, the high performer, Profit per employee instead of profit after
tax is used, since that financial variable was not available for peer group
comparisons. Furthermore, similar studies in the marketing orientation literature and
the small business literature, (for example see Pelham (2000) for a comprehensive
review) show the importance of comparing such financial data both within the
market and within the overall environment.
The peer group includes large companies as well as micro businesses. Therefore, the
mean of these measures is not considered a true estimate of the group's average,
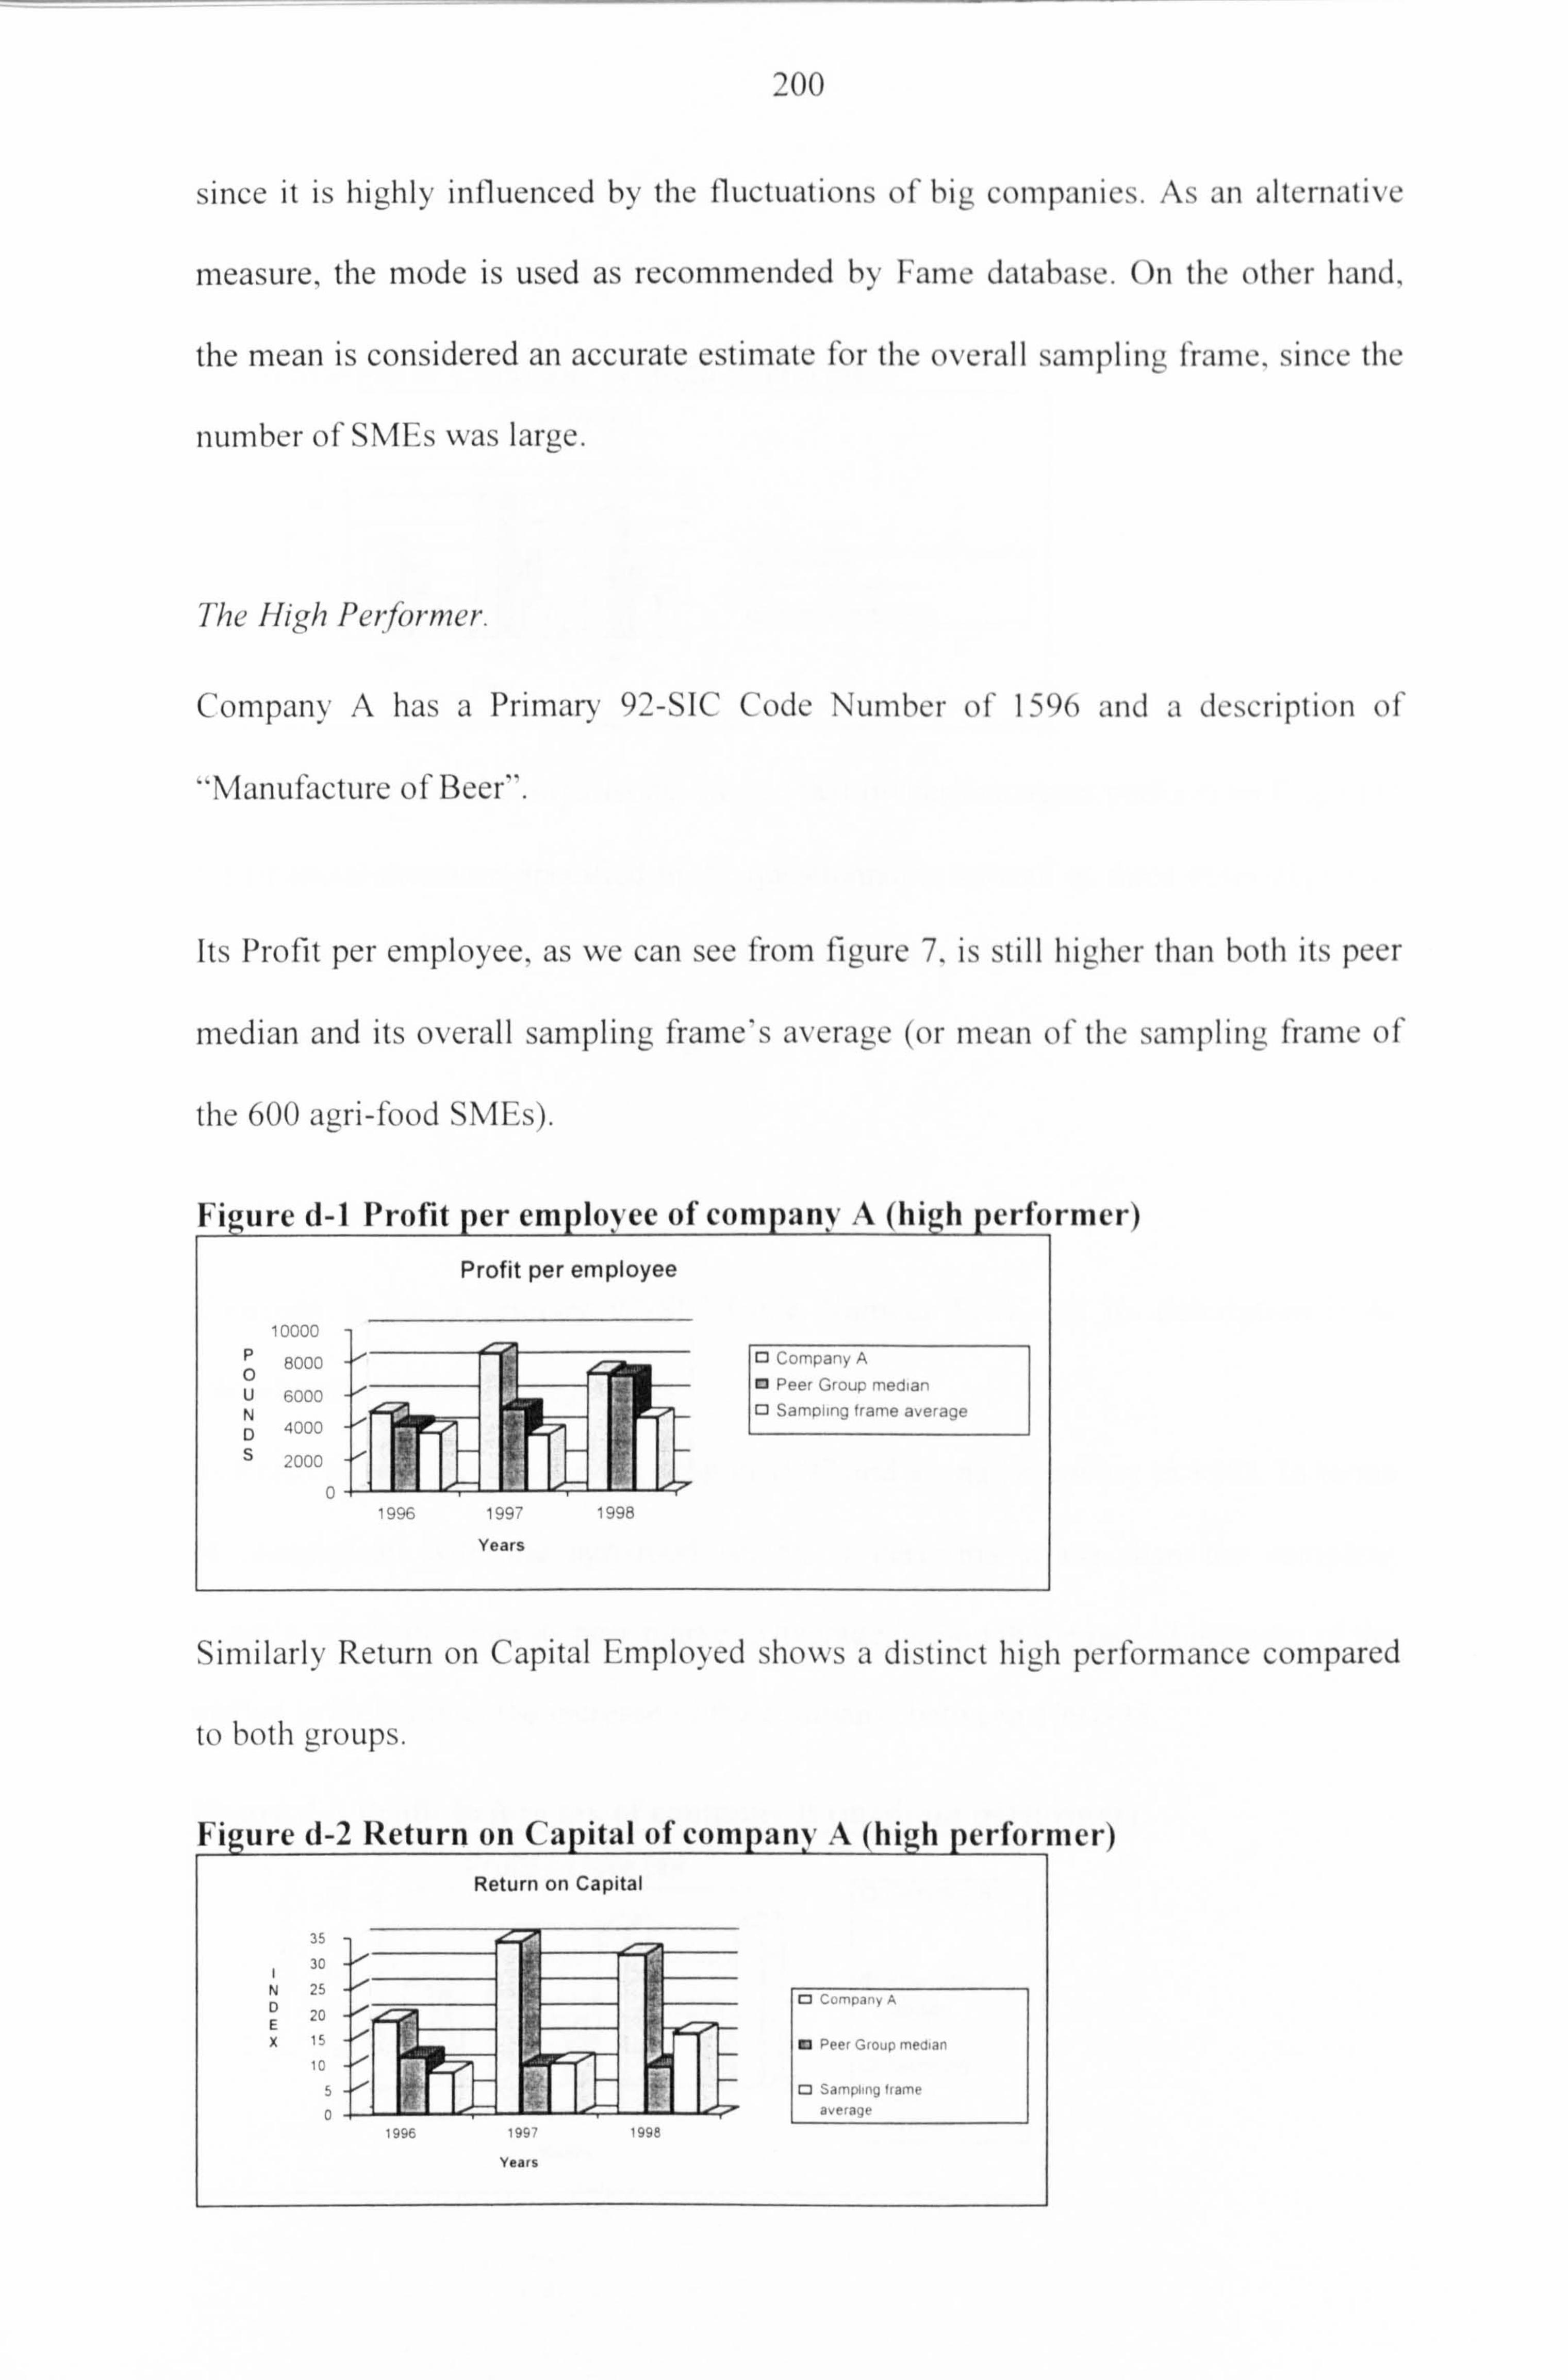
200
since it is highly influenced by the fluctuations of big companies. As an alternative
measure, the mode is used as recommended by Fame database. On the other hand,
the mean is considered an accurate estimate for the overall sampling: frame, since the
number of SMEs was large.
The High Pei. -former.
Company A has a Primary 92-SIC Code Number of 1596 and a description of
"Manufacture of Beer".
Its Profit per employee, as we can see from figure 7, is still higher than both its peer
median and its overall sampling frame's average (or mean of the sampling frame of
the 600 agri-food SMEs).
Ni ure d-1 Yrolit per employee of company A (high perle
Profit per employee
10000
P 8000 O
U 6000 N
4000 D S 2000
0
1996 199 1998
Years
Company A
0 Peer Group median 0 Sampiinp frame average
rmcr)
Similarly Return on Capital Employed shows a distinct high performance compared
to both groups.
re ü-2 Return on kapital of company' A (h12tI pertor
Return on Capital
35
30
N 25 DO C-p-y A
E 20
X10 Peer Group memaý
1C
5O Samplmq ham,
0 ave qr
.. 199? 199F
Years
ier)
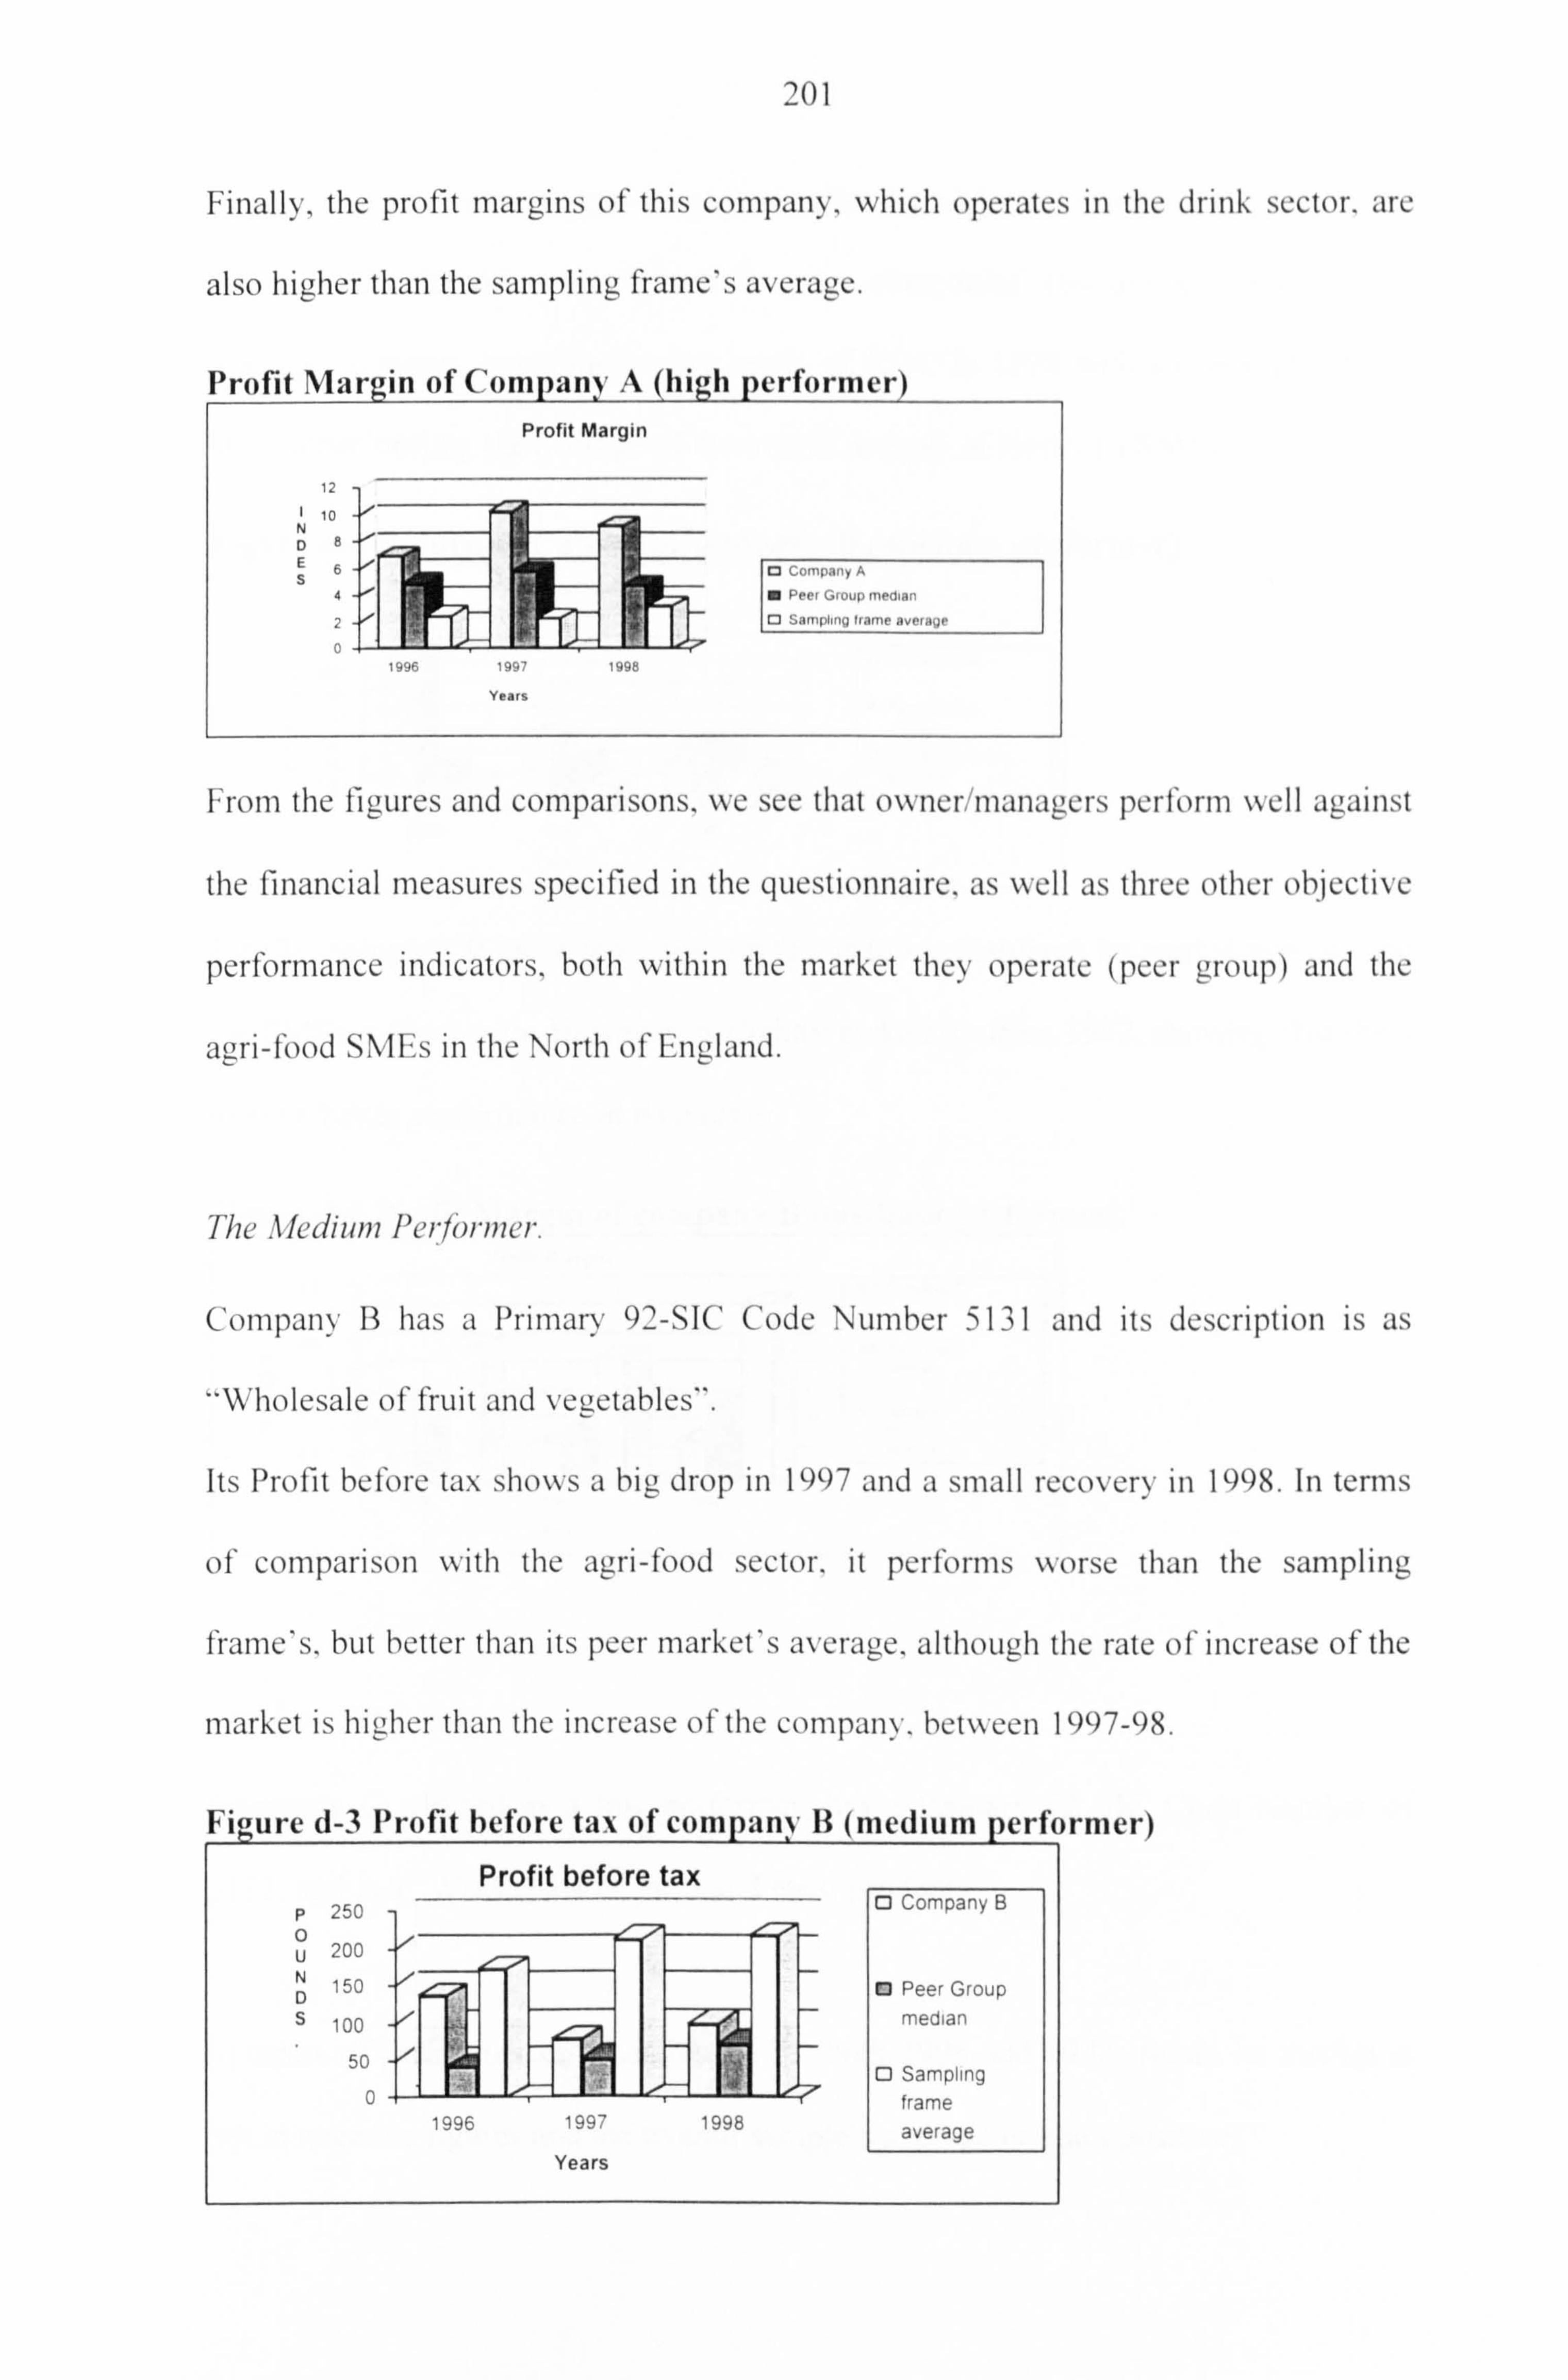
201
Finally, the profit margins of this company, which operates in the drink sector. are
also higher than the sampling frame's average.
Profit Margin of ('ompany A Profit Margin
iz
io N DB
6
4
i4ýý t9cr 1988
Years
rmer)
O Company A
0 Pry' Group median O Sampling frame average
From the figures and comparisons, we see that owner managers periiorm vve11 against
the financial measures specified in the questionnaire. as well as three other objective
performance indicators. both within the market they operate (peer group) and the
agri-food S1V11: s in the North of England.
The . 1lccfiurrr Performer.
Company B has a Primary 92-SIC Code Number 5 131 and its description is as
"Wholesale of fruit and vegetables".
Its Profit before tax shOvVs a bid drop in 1997 and a small recovery in 1998. In terms
of comparison with the agri-food sector, it performs worse than the sampling
frame's, but hotter than its peer market's average, although the rate of increase of the
market is higher than the increase of the company. between 1997-98.
Figure d-3 Profit before tax of company B (medium erformer)
Profit before tax P 250 O Company B
0 200
N 150 O Peer Group D S 100 median
50 ID Sampling 0 frame
1998 average Years
Profit before tax p 250 0 Company B
U 200
N 150 D O Peer Group S 100 median
50 0 Sampling frame
1998 average Years
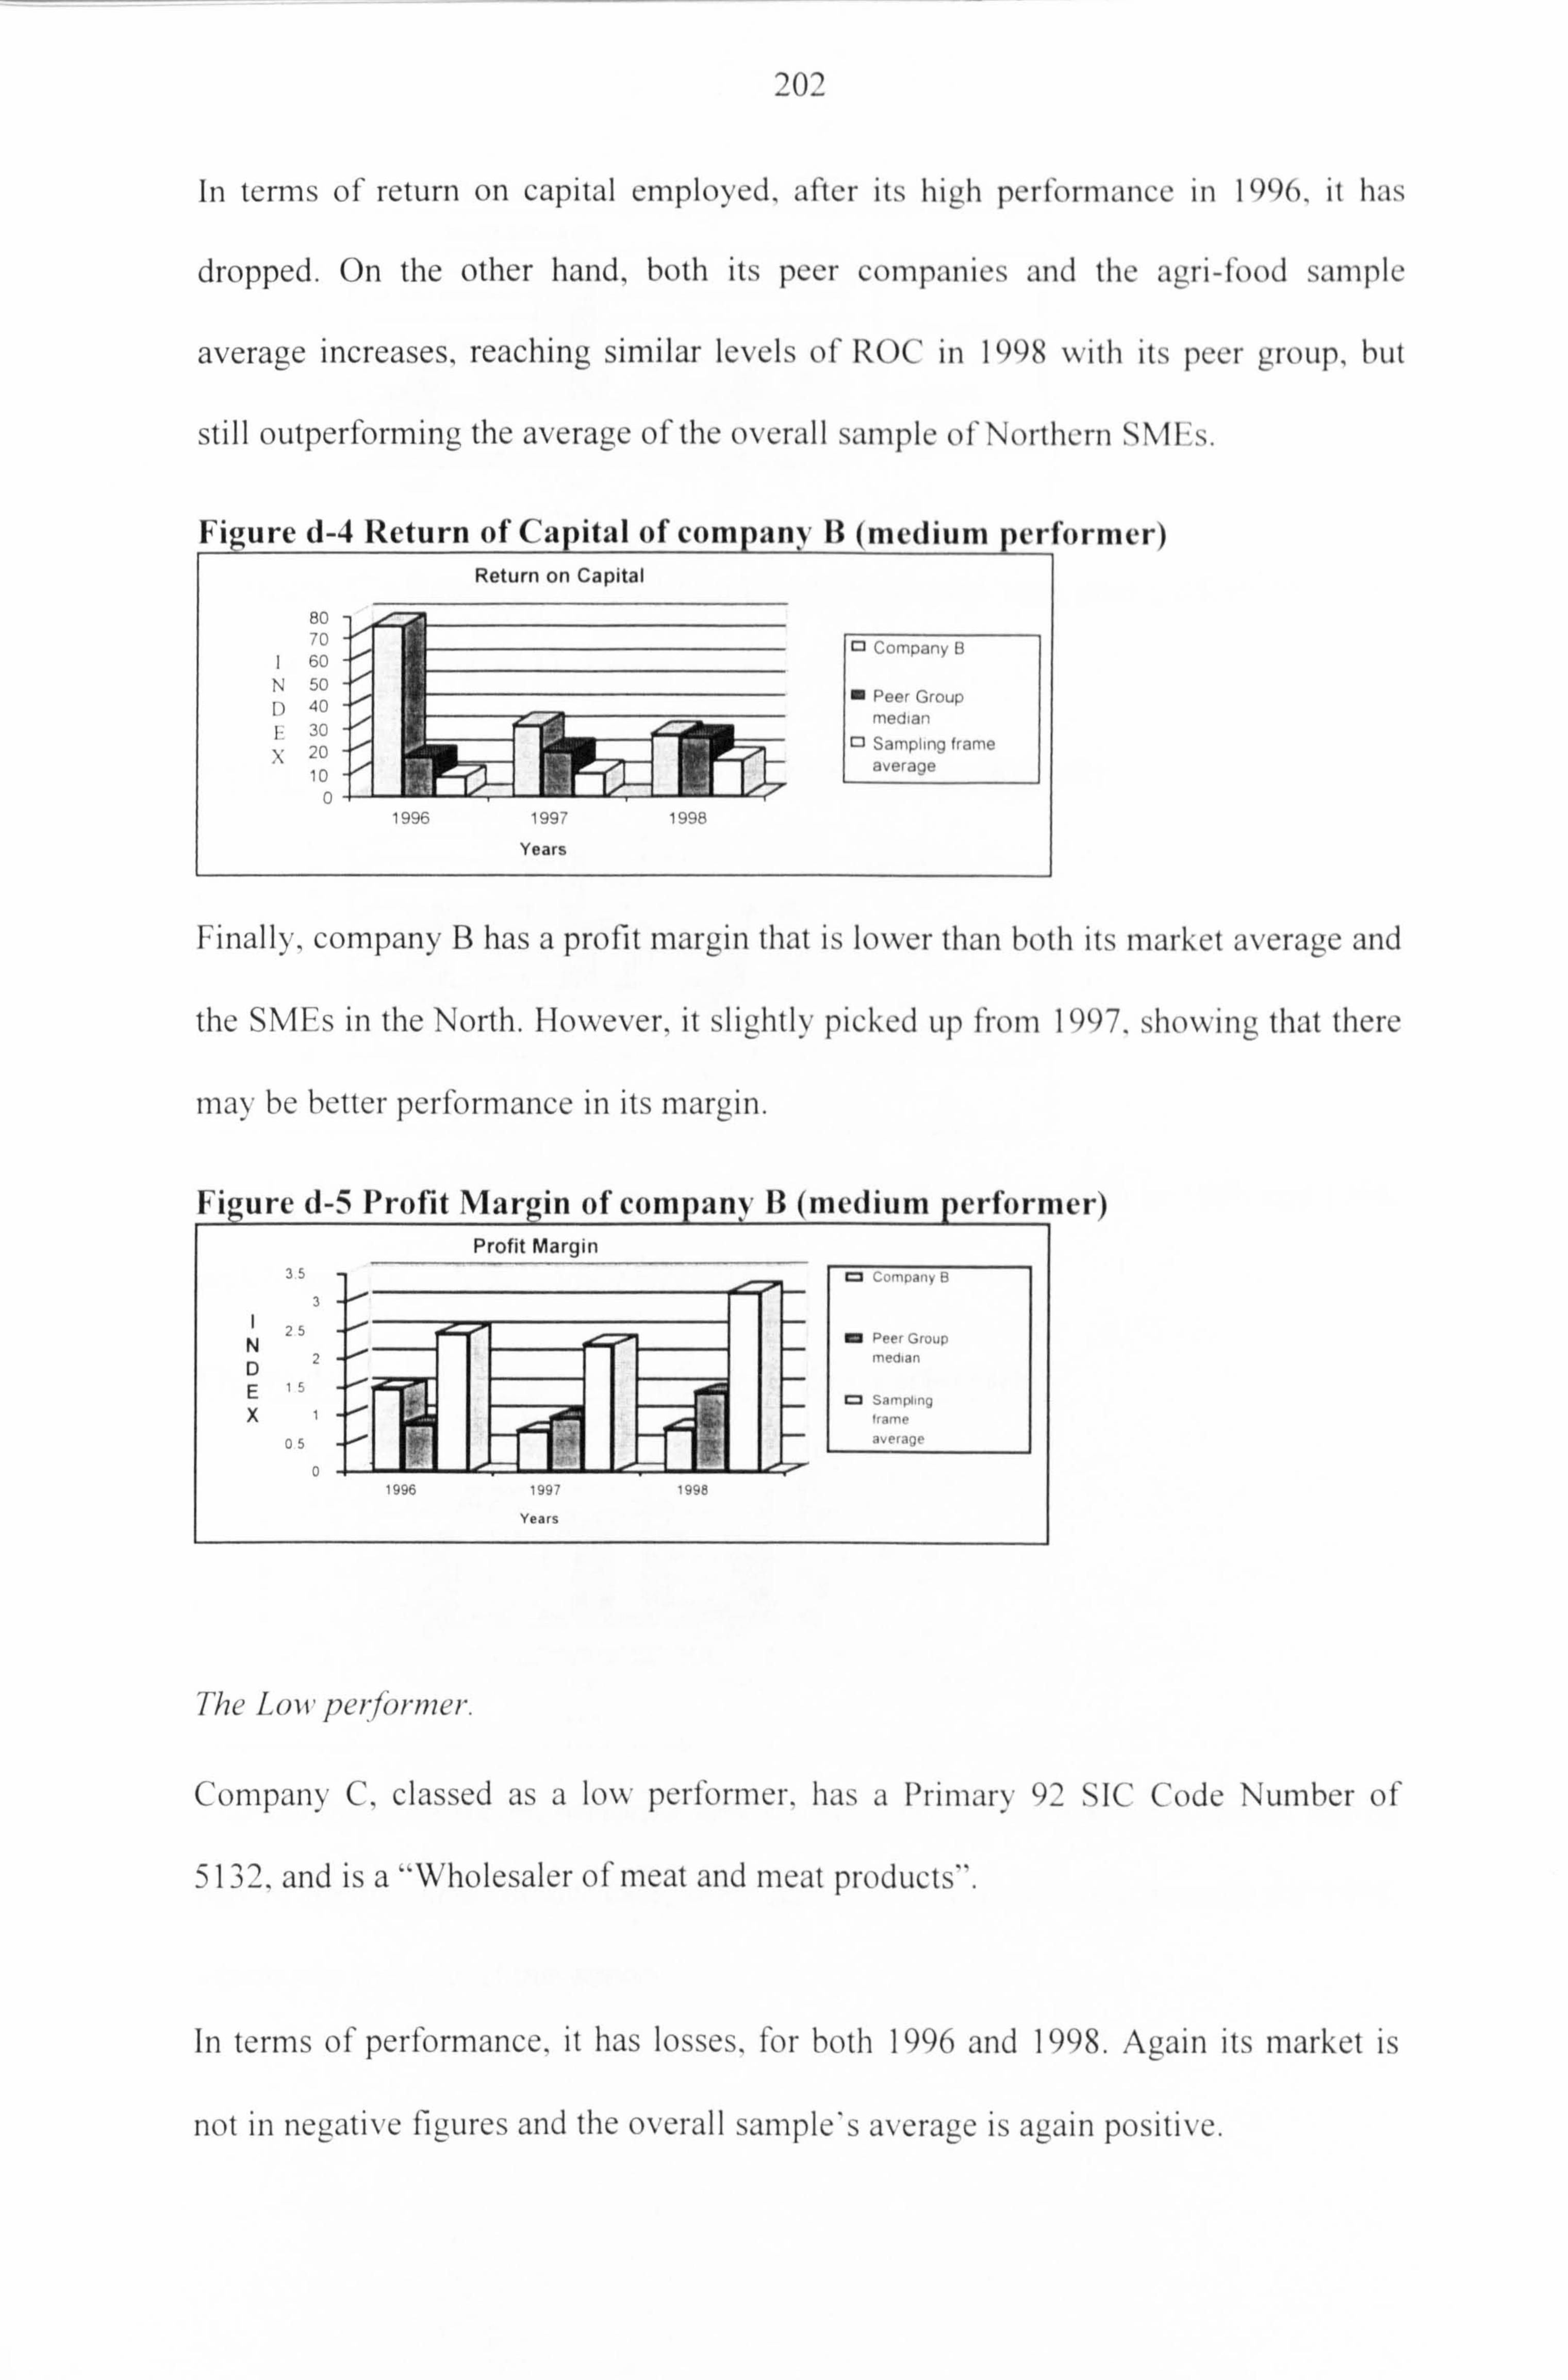
202
In terms of return on capital employed, after its high performance in I x)96, it has
dropped. On the other hand, both its peer companies and the agri-food sample
average increases, reaching similar levels of ROC in 1998 with its peer group, but
still outperforming the average ofthe overall sample of Northern SMEs.
d-4 Return of capital of company Ii (medium
Return on Capital 80
_ 60O Company 8 60
0 4 5
0" Peer Group fý 4 f: 30 median
o Sampling frame 20 10 average
0 1996 1997 1998
Years
rmer)
Finally. company B has a profit margin that is lower than both its market average and
the SMEs in the North. However, it slightly picked up from 1997, showing that there
may be better performance in its margin.
Figure u-"-, ý rrotIt 1v7argIn of company ti (mculum pcrton Profit Margin
35G co,, Pani B
3
050 Peer Group
D median
E C3 samnh. y
x era...
05t4 q''i -i. r9,
0 1996 155? 1998
Years
The Lou per/örnier.
ter)
Company C, classed as a low performer. has a Primary 92 SIC Code Number of
5132. and is a "Wholesaler of meat and meat products".
In terms of performance, it has losses, for both 1996 and 1998. Again its market is
not in negative figures and the overall samples average is again positive.
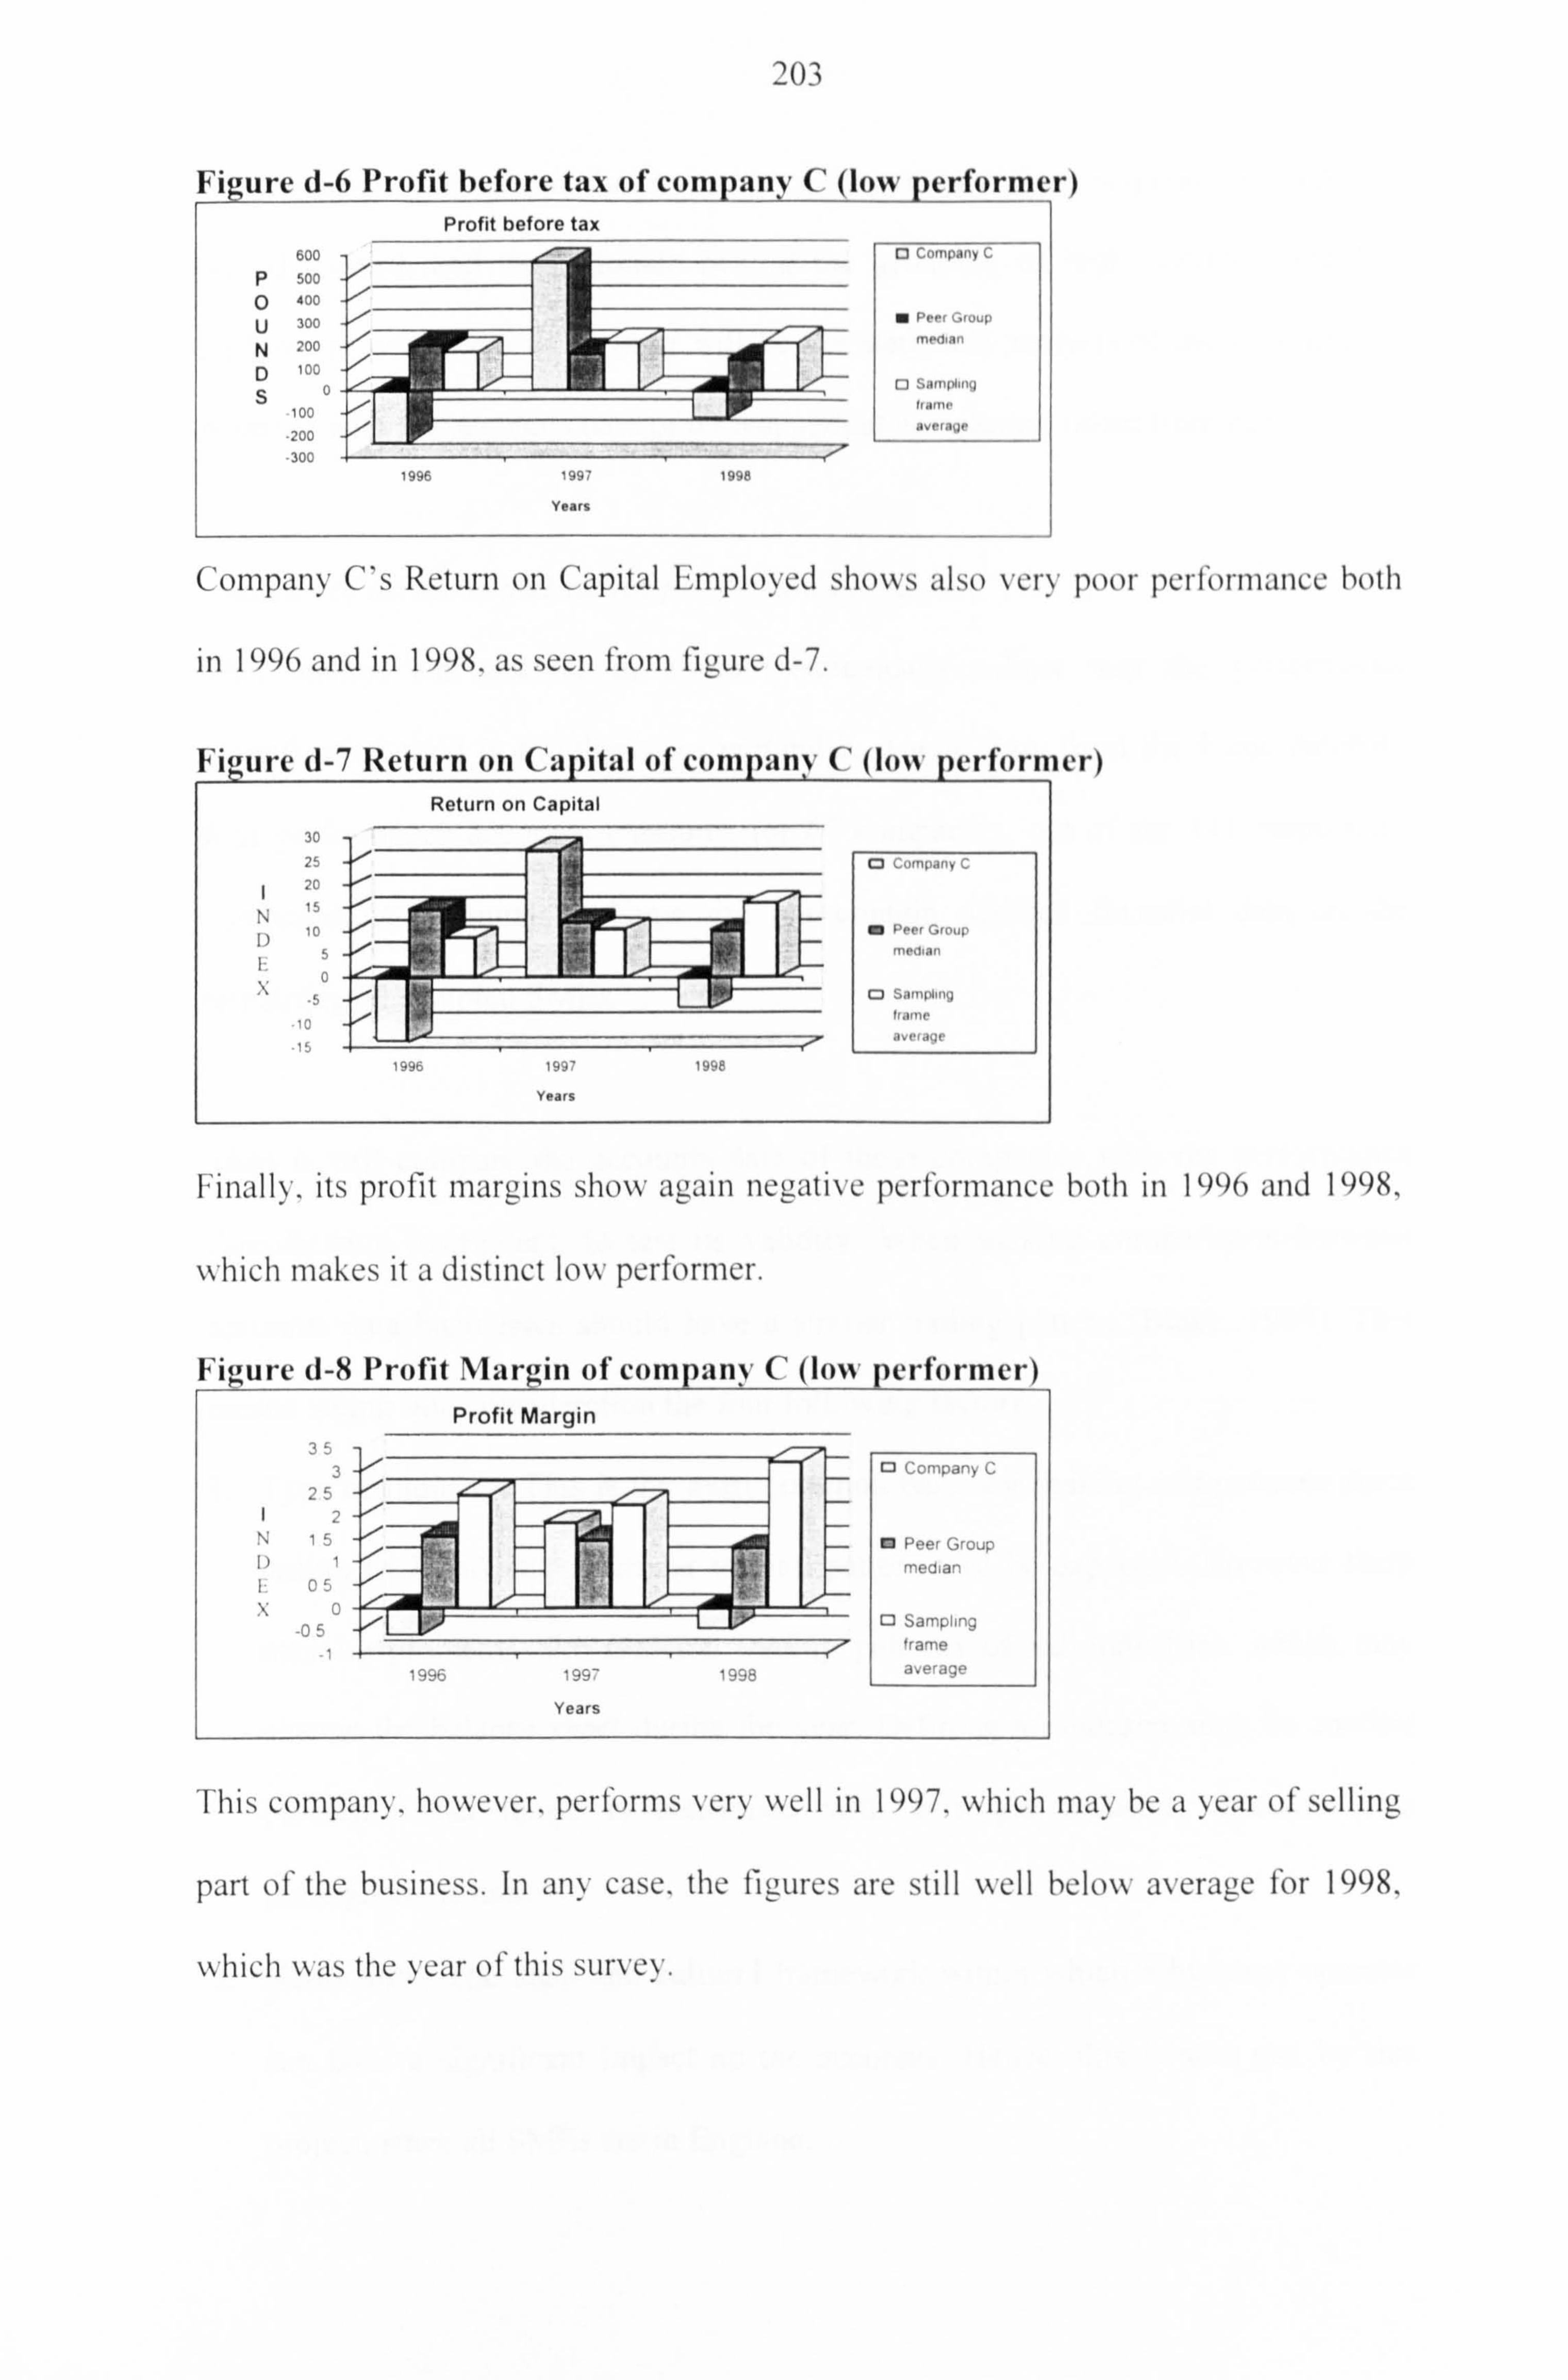
203
N'iLyure d-6 Profit before tax of comnanN' C' (low+, nertorme Profit before tax
600 0 Company C
P 500 p 400 U 300 a Pre, Group
N 200 -0-1
D 100 0 Q Sampmg
S bamr 100
-200 averepr
-300 1996 1997 1998
Years
r)
Company C's Return on Capital F, mploved shows also very poor performance both
in 1996 and in 1998. as seen from figure d-7.
hwure d-7 Return on t: apital of comnan ( (low pertorn Return on Capital
30 2o cu, nlýd nv c
zo
15 h I) 10 M Prer GiPiil,
5 mra do
0
.5O Ssm"mg
Iranre
d V-(IC
1996 1997 1998
Years
er)
Finally, its profit margins show again negative performance both in 1996 and 1998,
which makes it a distinct low performer.
FiLyure d-2i Profit Mar<jin of Profit Margin
3 25
N i5
o p5
o Company C
O Peer Group
median
Q Sampling
frame
average
This company. however. performs very well in 1997. which may be a year of selling
part of the business. In any case. the figures are still well below average for 1998,
which was the year of this survey.
c'
1996 199- 1998
Years
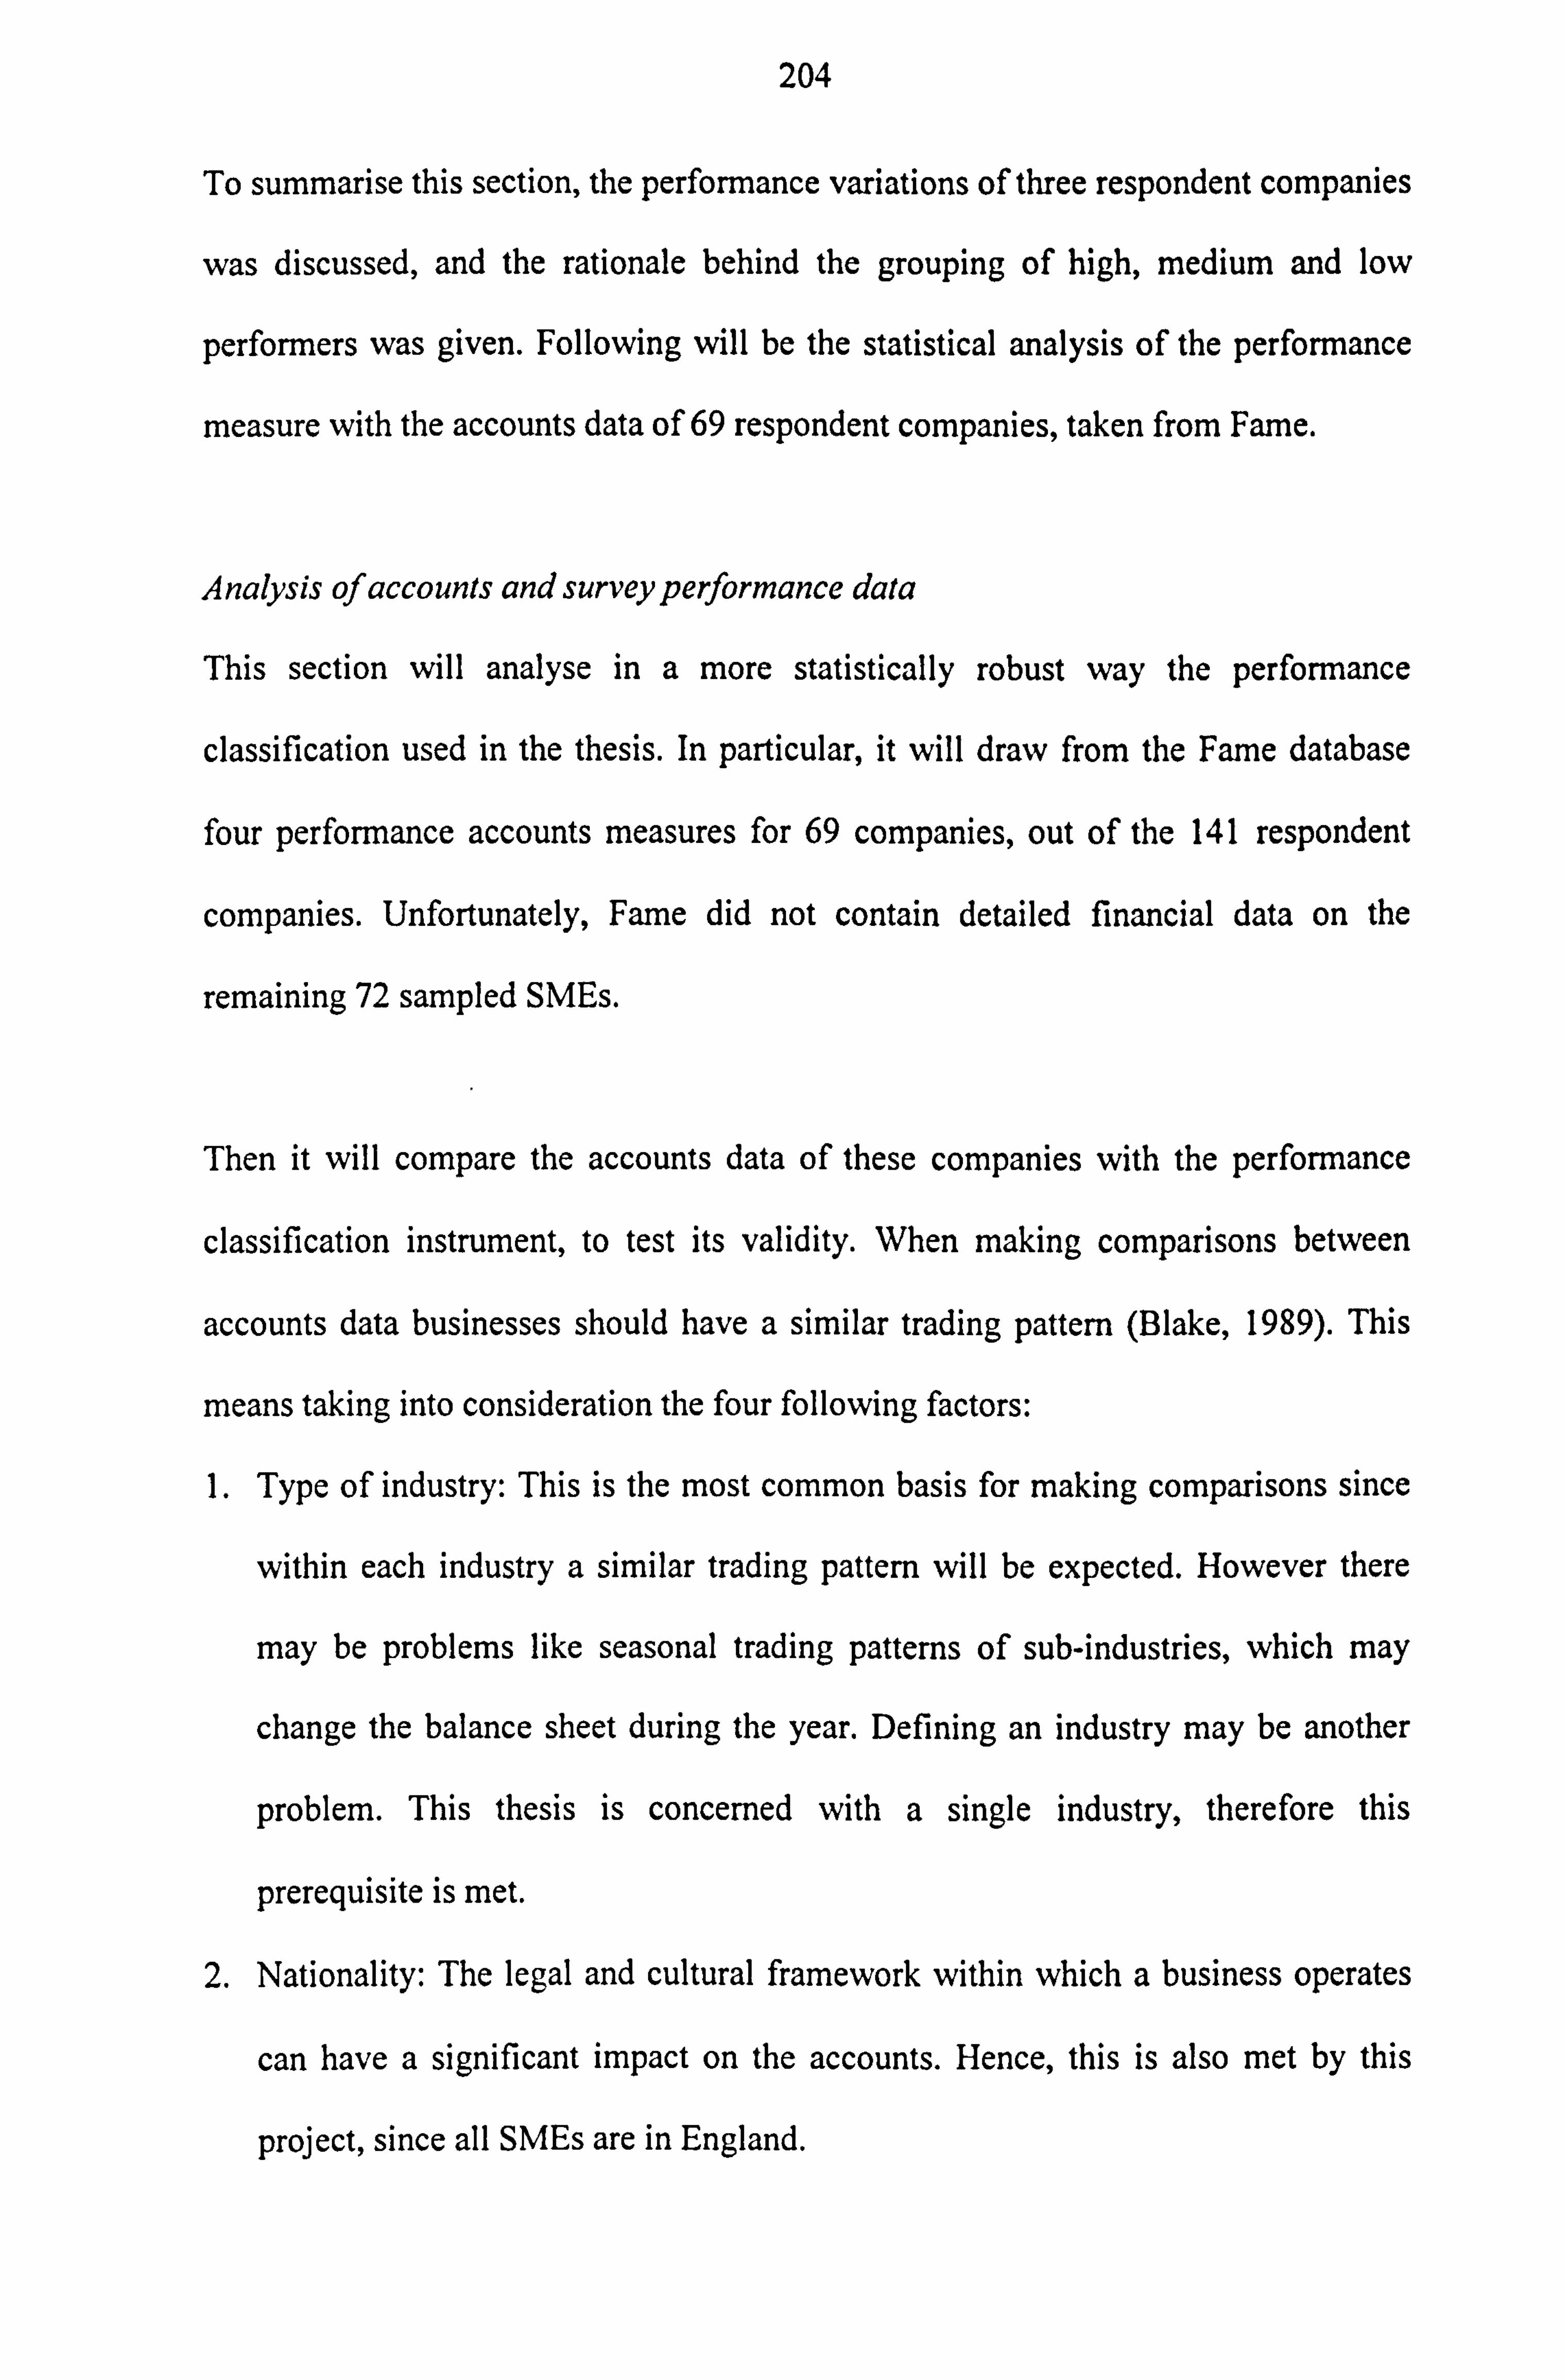
204
To summarise this section, the performance variations of three respondent companies
was discussed, and the rationale behind the grouping of high, medium and low
performers was given. Following will be the statistical analysis of the performance
measure with the accounts data of 69 respondent companies, taken from Fame.
Analysis of accounts and survey performance data
This section will analyse in a more statistically robust way the performance
classification used in the thesis. In particular, it will draw from the Fame database
four performance accounts measures for 69 companies, out of the 141 respondent
companies. Unfortunately, Fame did not contain detailed financial data on the
remaining 72 sampled SMEs.
Then it will compare the accounts data of these companies with the performance
classification instrument, to test its validity. When making comparisons between
accounts data businesses should have a similar trading pattern (Blake, 1989). This
means taking into consideration the four following factors:
1. Type of industry: This is the most common basis for making comparisons since
within each industry a similar trading pattern will be expected. However there
may be problems like seasonal trading patterns of sub-industries, which may
change the balance sheet during the year. Defining an industry may be another
problem. This thesis is concerned with a single industry, therefore this
prerequisite is met.
2. Nationality: The legal and cultural framework within which a business operates
can have a significant impact on the accounts. Hence, this is also met by this
project, since all SMEs are in England.
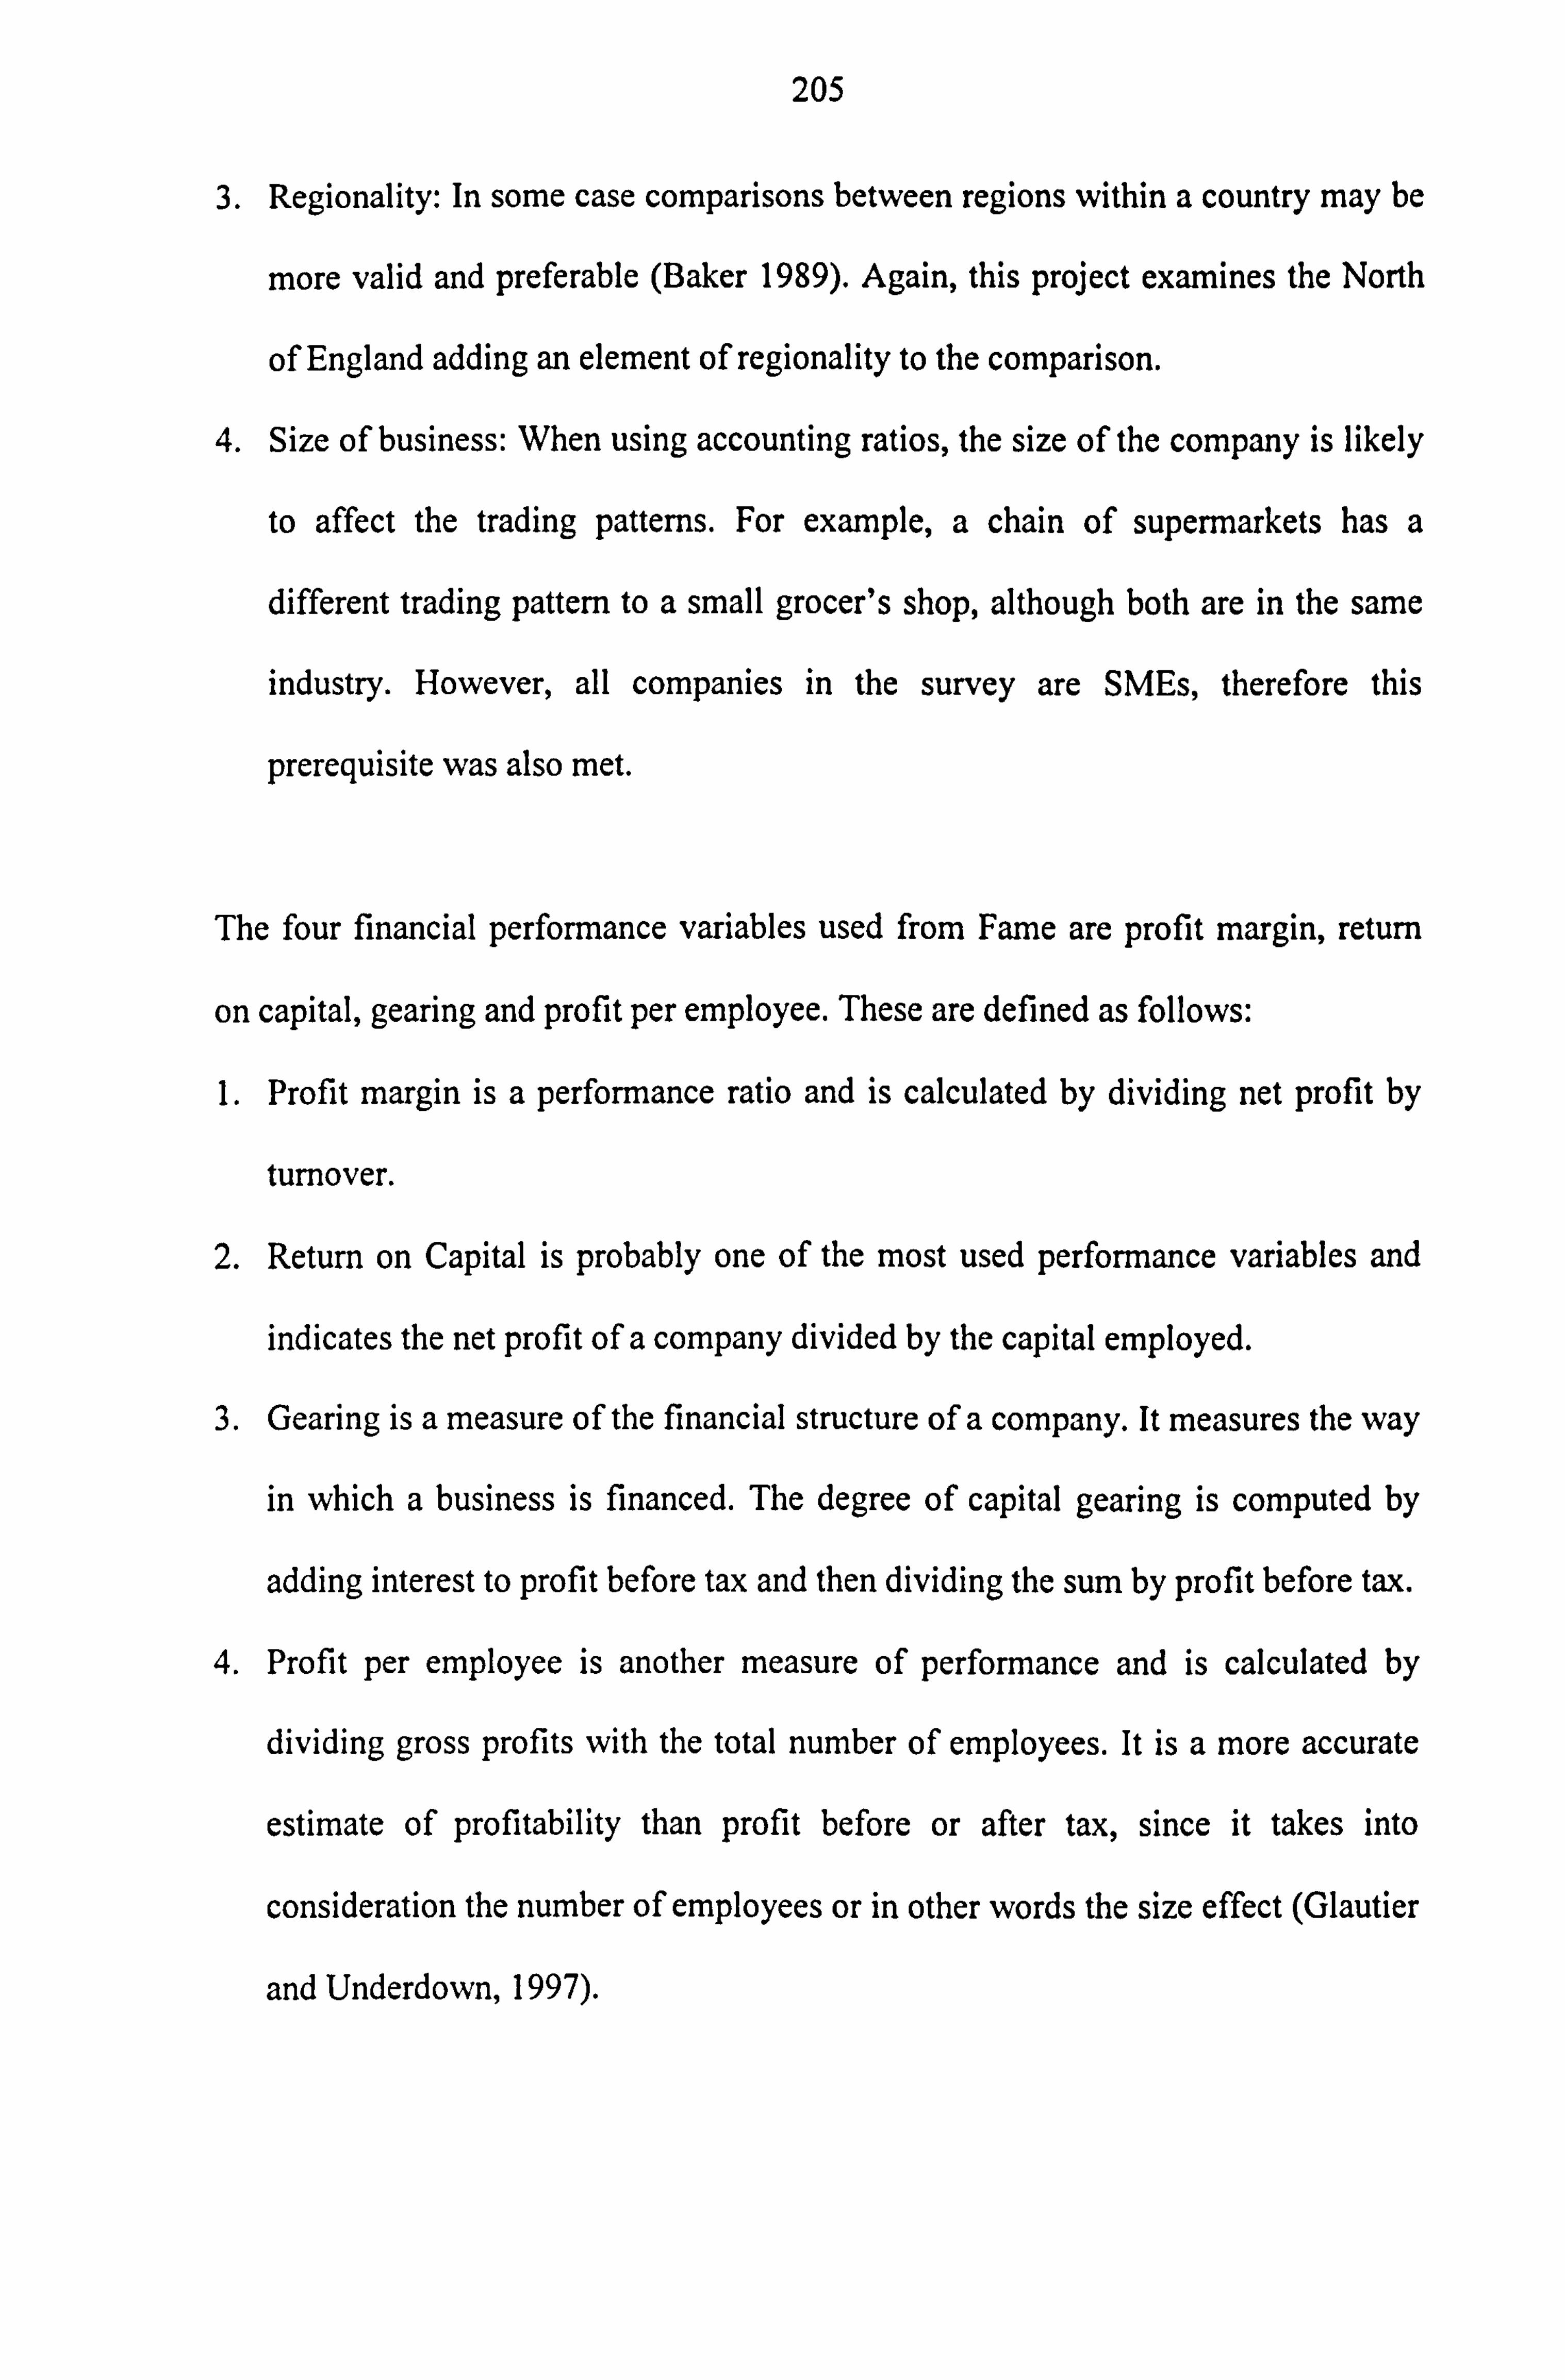
205
3. Regionality: In some case comparisons between regions within a country may be
more valid and preferable (Baker 1989). Again, this project examines the North
of England adding an element of regionality to the comparison.
4. Size of business: When using accounting ratios, the size of the company is likely
to affect the trading patterns. For example, a chain of supermarkets has a
different trading pattern to a small grocer's shop, although both are in the same
industry. However, all companies in the survey are SMEs, therefore this
prerequisite was also met.
The four financial performance variables used from Fame are profit margin, return
on capital, gearing and profit per employee. These are defined as follows:
1. Profit margin is a performance ratio and is calculated by dividing net profit by
turnover.
2. Return on Capital is probably one of the most used performance variables and
indicates the net profit of a company divided by the capital employed.
3. Gearing is a measure of the financial structure of a company. It measures the way
in which a business is financed. The degree of capital gearing is computed by
adding interest to profit before tax and then dividing the sum by profit before tax.
4. Profit per employee is another measure of performance and is calculated by
dividing gross profits with the total number of employees. It is a more accurate
estimate of profitability than profit before or after tax, since it takes into
consideration the number of employees or in other words the size effect (Glautier
and Underdown, 1997).
206
Methodology
Since there was data available from Fame on the above four variables, one way
analysis of variance (ANOVA test) was considered the appropriate methodological
tool. The ANOVA procedure (for a detailed analysis, see the next appendix d)
produces a one-way analysis of variance for a quantitative dependent (financial ratios
from Fame database) and a factor (subjective performance groups from survey
responses) variable. In this case the dependent variables are the four financial ratios
derived from Fame, namely profit margin, return on capital employed, gearing, profit
per employee and current ratio. This technique tests whether differences exist
between means of groups. The assumptions are the following:
1. Each group is an independent random sample from a normal population
2. Data should be symmetric and
3. The groups should come from populations with equal variances.
To test the last assumption the analysis uses Levene's homogeneity-of-variance test.
The SPSS 9.0 for Windows computer software was utilised. The examination, as
mentioned earlier, is to test the null hypotheses that the means between the three
performance classifications used in the survey (high, medium and low) and the four
accounts variables were not different.
In order to test the validity of the results one of the assumptions stated should be
examined, and the Levene's homogeneity-of-variance test should be used.
Performing the test for all four variables produces the following results:
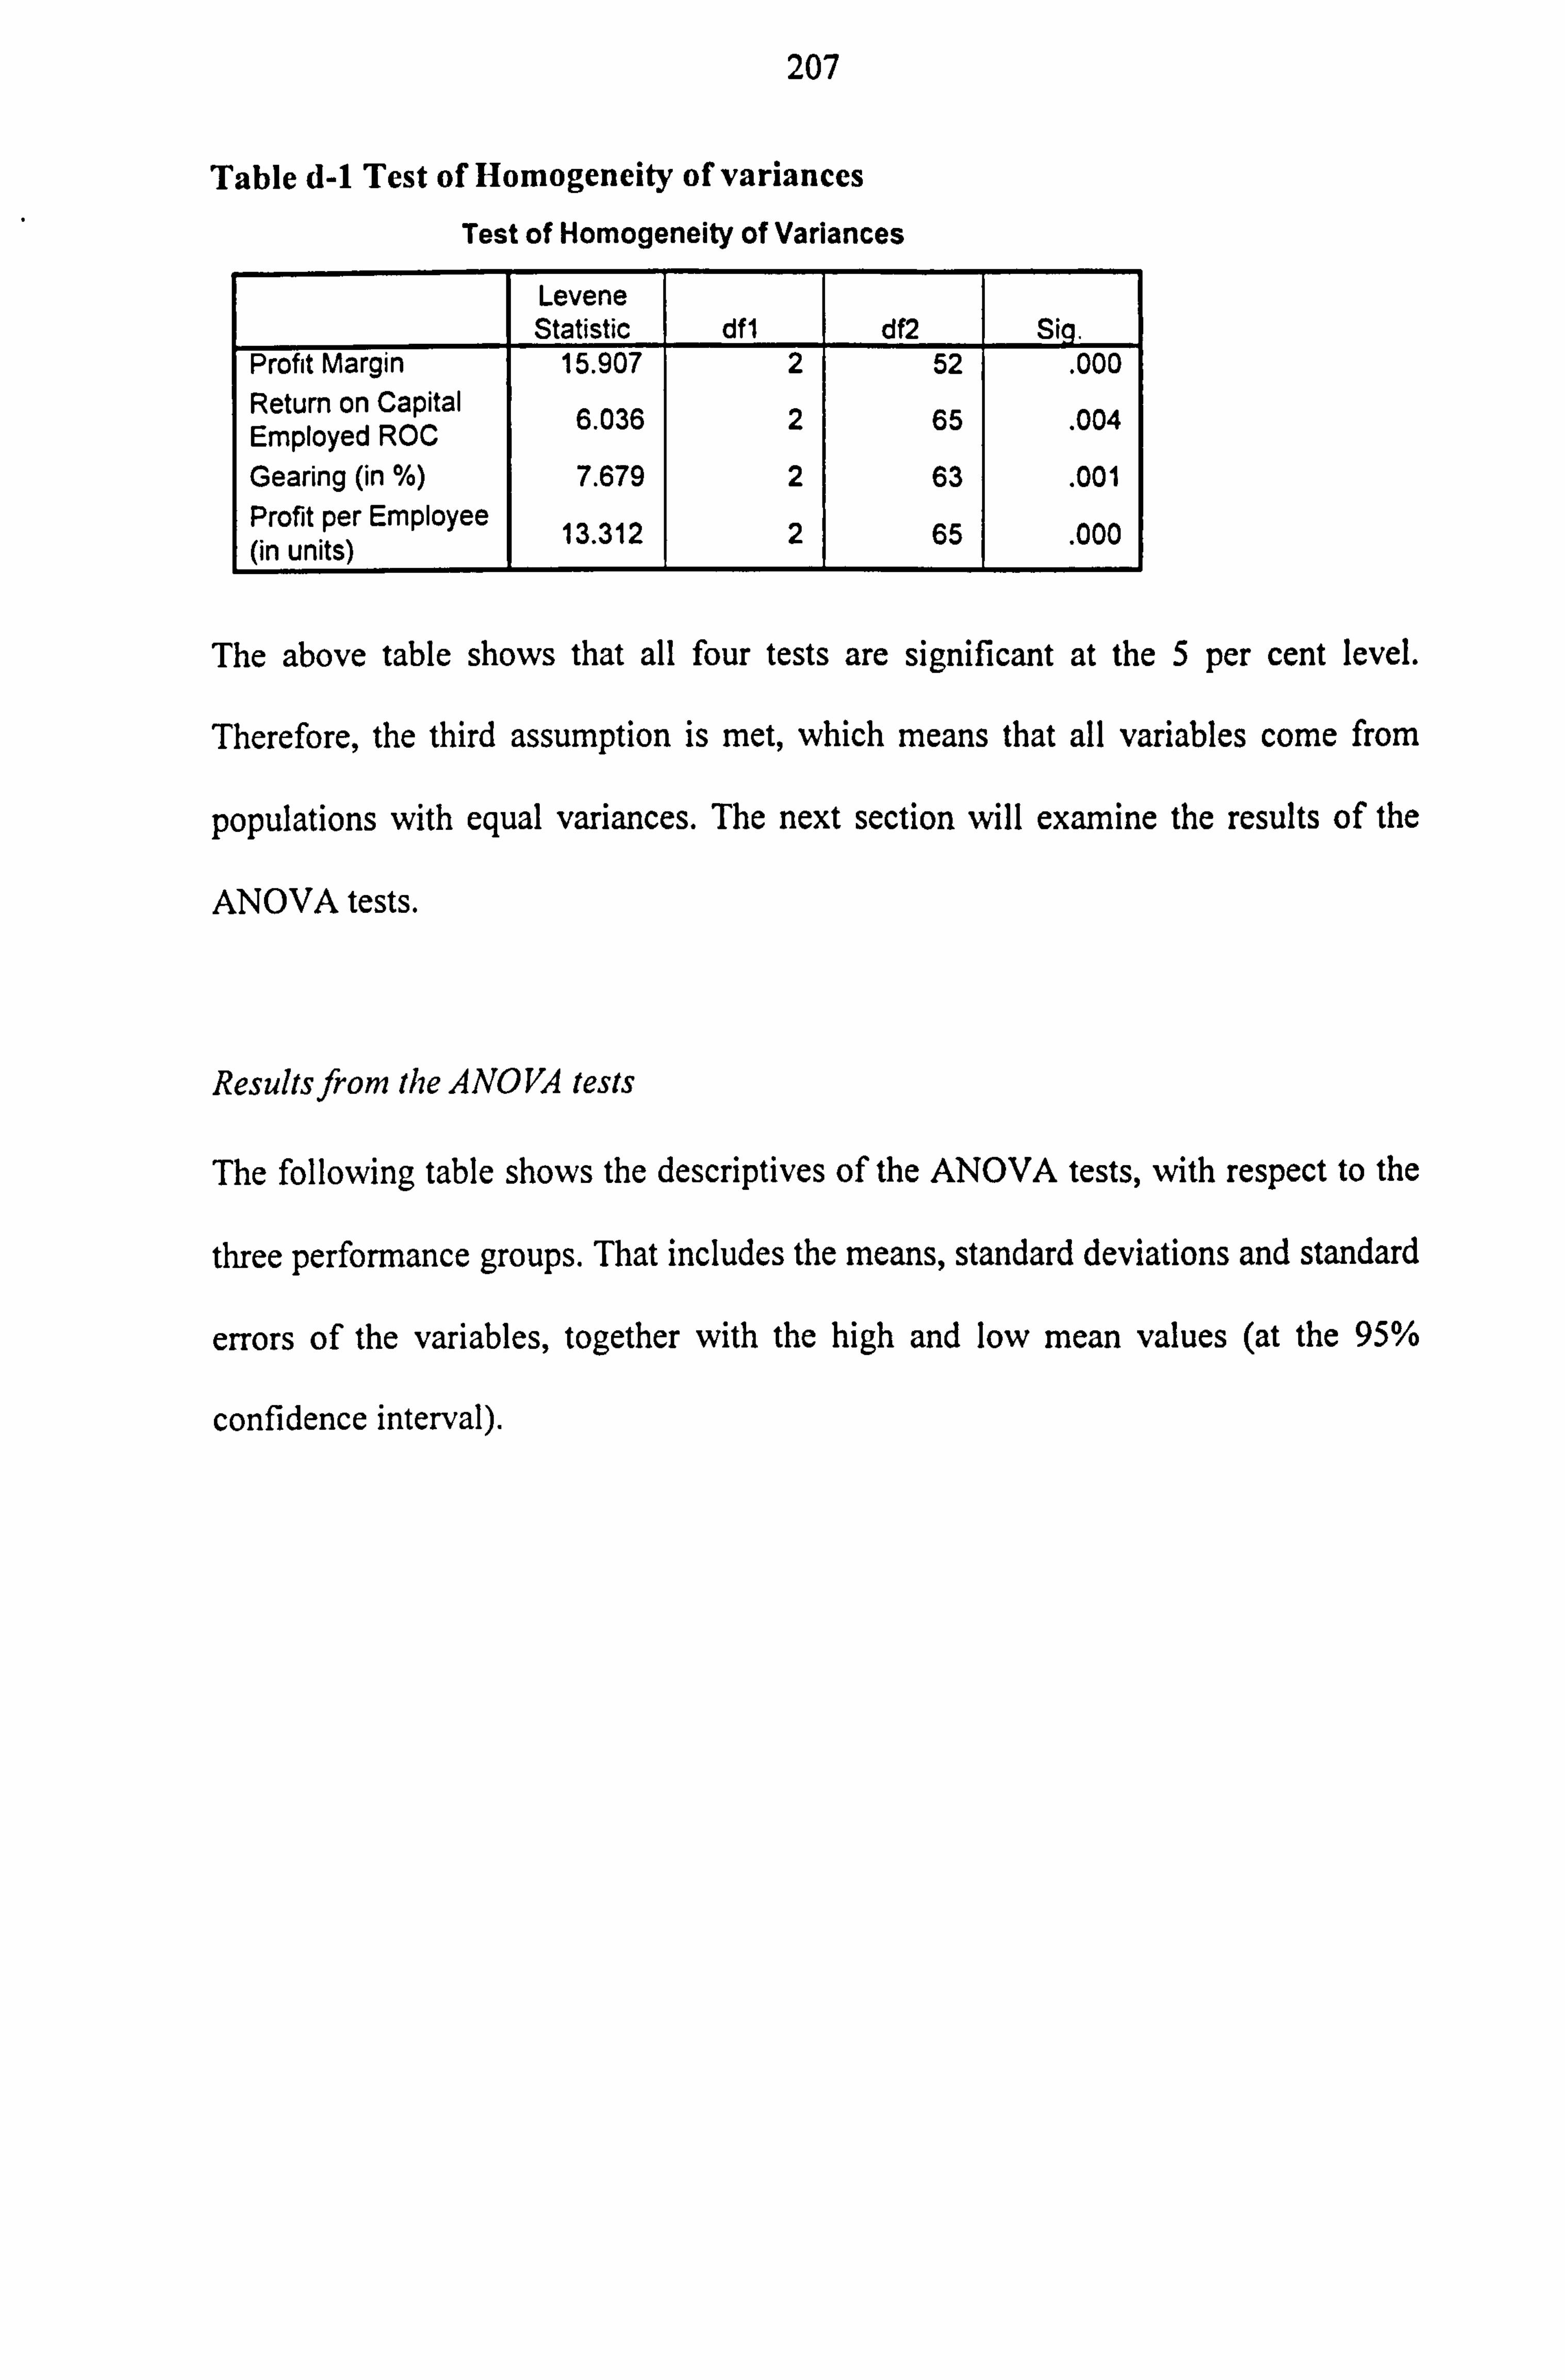
207
Table d-1 Test of Homogeneity of variances
Test of Homogeneity of Variances
Levene Statistic df1 df2 Si q.
Profit Margin 15.907 2 52 . 000 Return on Capital Employed ROC 6.036 2 65 . 004
Gearing (in %) 7.679 2 63 . 001 Profit per Employee 13.312 2 65 000 (in units) .
The above table shows that all four tests are significant at the 5 per cent level.
Therefore, the third assumption is met, which means that all variables come from
populations with equal variances. The next section will examine the results of the
ANOVA tests.
Results from the ANOVA tests
The following table shows the descriptives of the ANOVA tests, with respect to the
three performance groups. That includes the means, standard deviations and standard
errors of the variables, together with the high and low mean values (at the 95%
confidence interval).
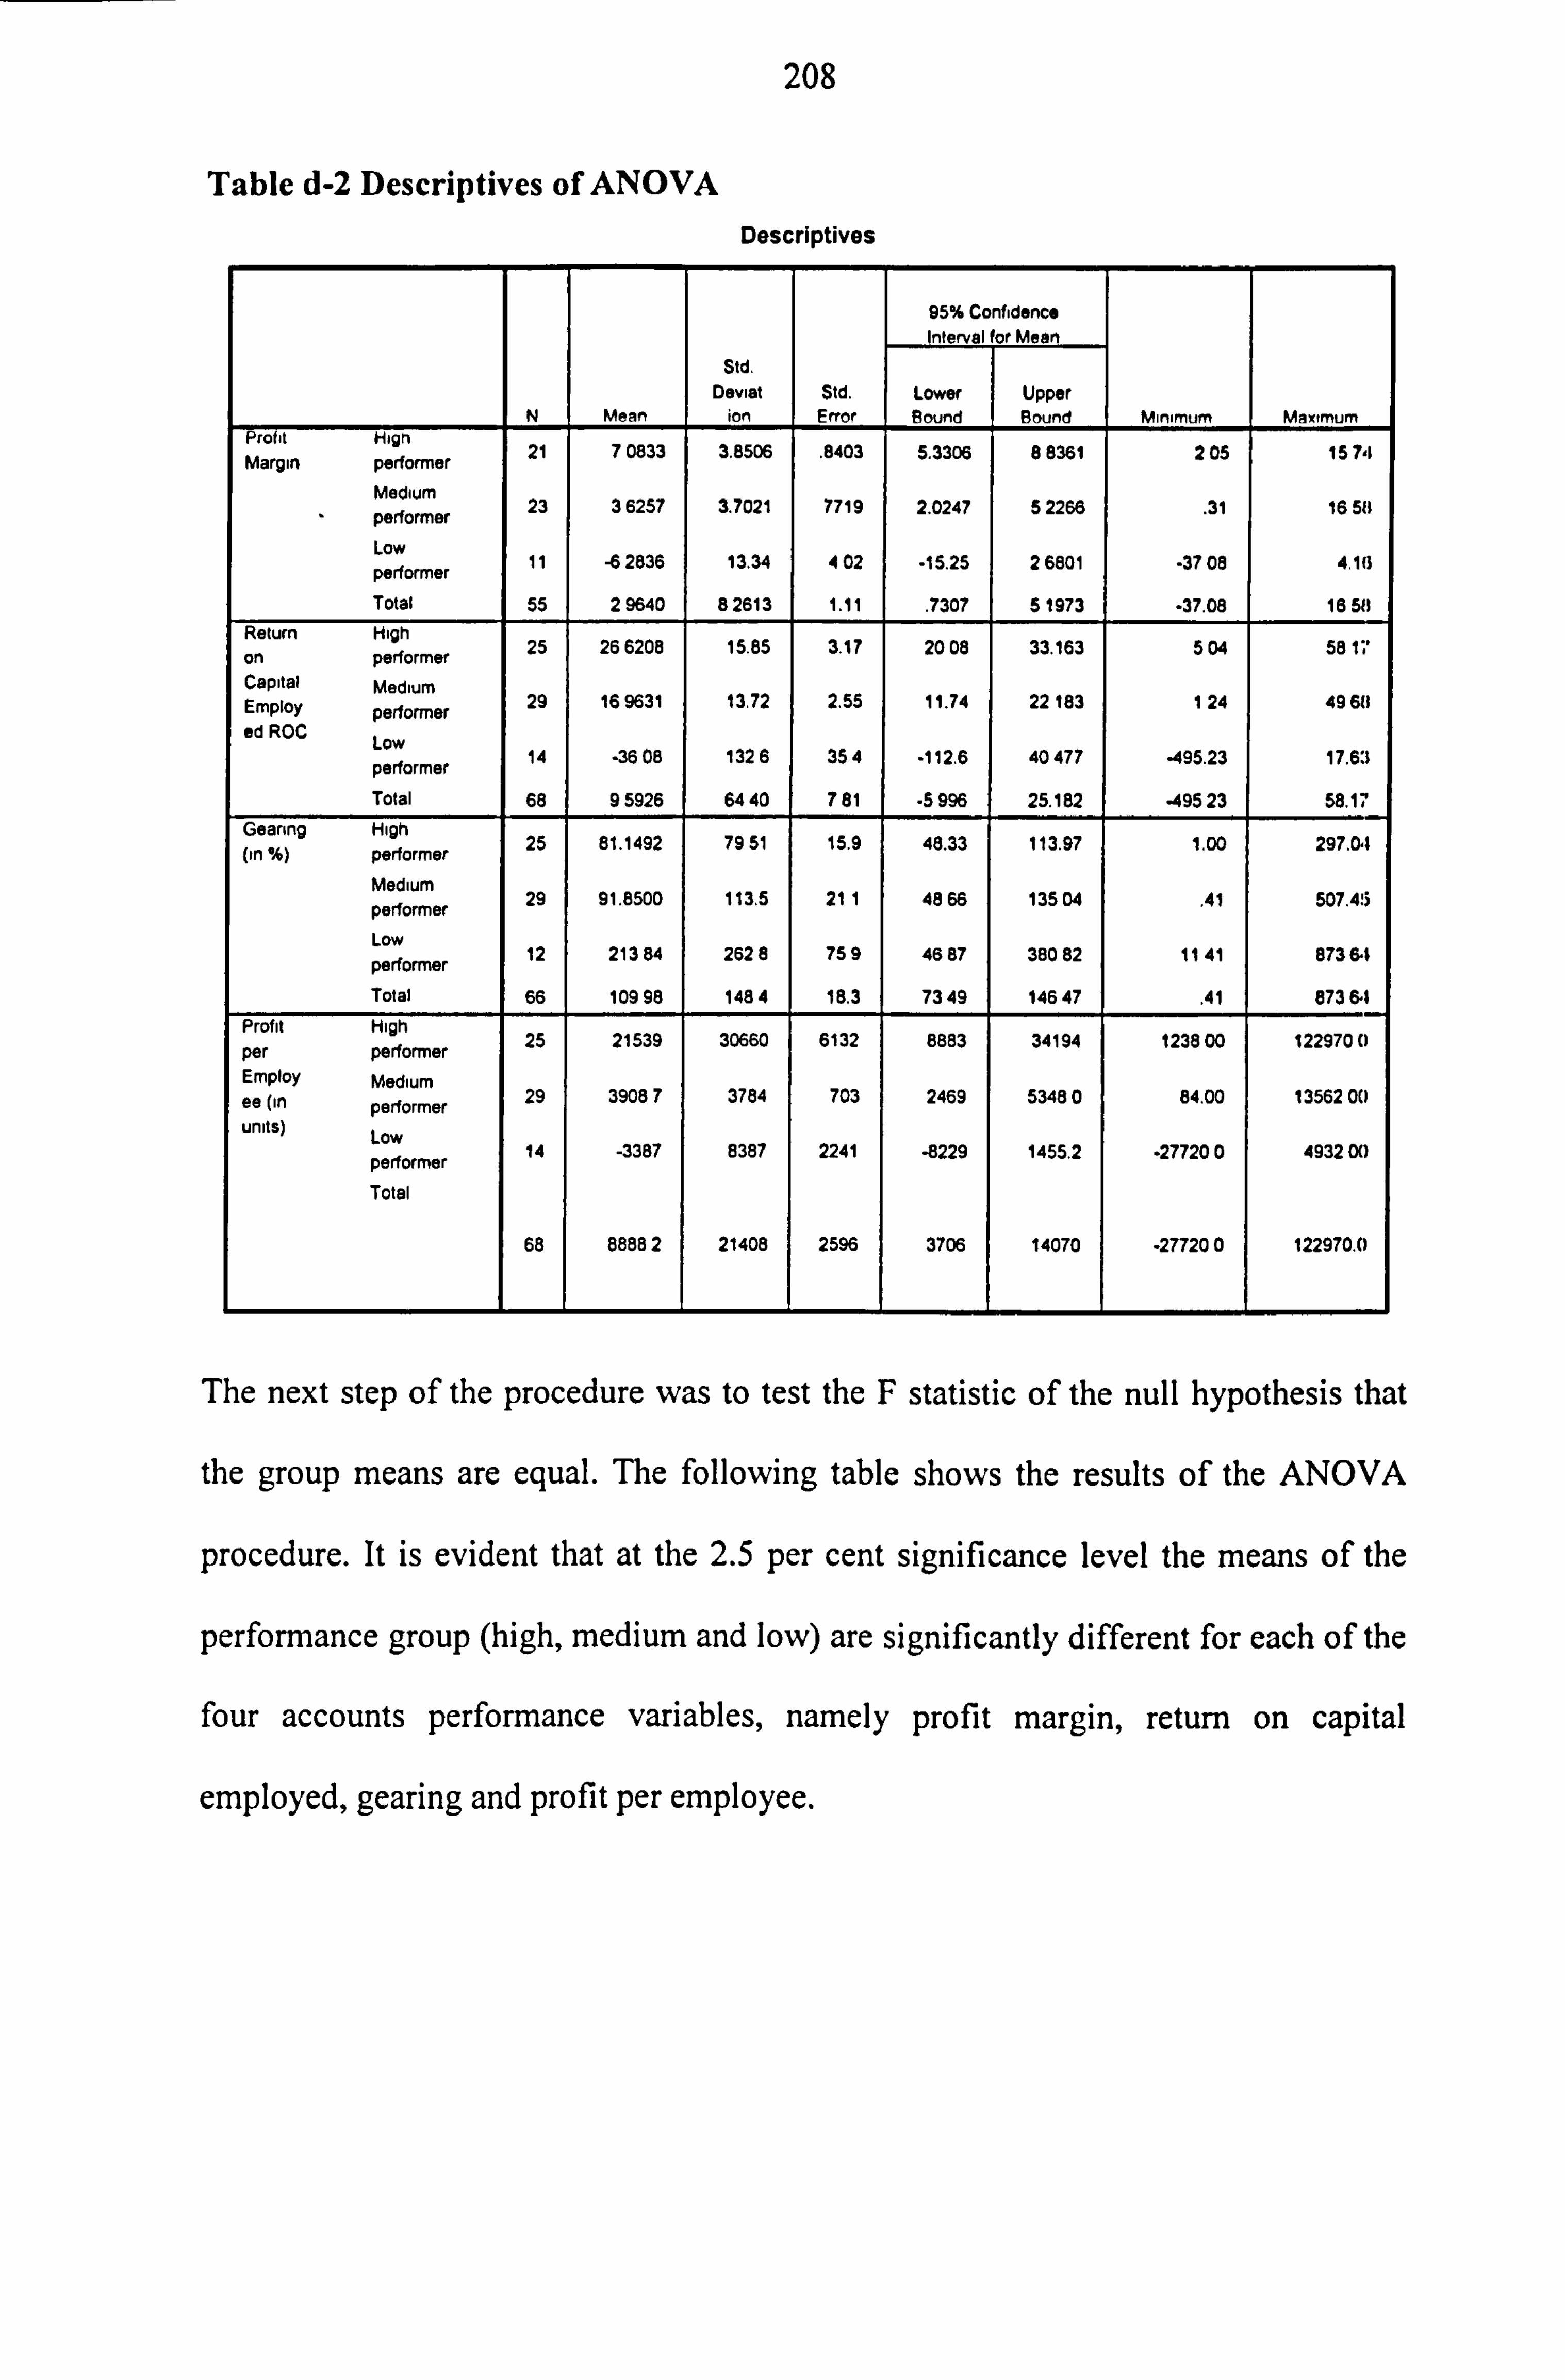
208
Table d-2 Descriptives of ANOVA Descriptives
95% Confidence Interval for Mean
Std. Deviat Std. Lower Upper
N Mean ion Error Bound Bound Minimum Maximum Profit High Margin performer
21 70833 3.8506 . 8403 5.3306 88361 2 05 1574
Medium performer
23 36257 3.7021 7719 2.0247 52266 . 31 16 58
Low performer
11 -62836 13.34 4 02 -15.25 26801 -37 08 4.16
Total 55 2 9640 82613 1.11 . 7307 51973 -37.08 16 58 Return High
on performer 25 266208 15.85 3.17 2008 33.163 504 58 17
Capital Medium Employ performer
29 169631 13.72 2.55 11.74 22 183 1 24 4960
ad ROC Low 14 -3608 1326 354 -112.6 40 477 -495.23 17 63
performer .
Total 68 95926 6440 781 -5996 25.182 -49523 58.17 Gearing High
25 81.1492 79 51 15.9 48.33 113.97 1.00 297.04 (in %) performer Medium
29 91.8500 113.5 21 1 4866 135 04 41 45 507 performer . .
Low
performer 12 213 84 2628 759 4687 380 82 11 41 87361
Total 66 109 98 1484 18.3 7349 14647 . 41 873 61 Profit High
25 21539 30660 6132 8883 34194 123800 1229700 per performer Employ Medium as (in performer
29 39087 3784 703 2469 53480 84.00 1356200
units) Low 14 -3387 8387 2241 -8229 1455.2 -277200 493200
performer Total
68 88882 21408 2596 3706 14070 -277200 122970.0
The next step of the procedure was to test the F statistic of the null hypothesis that
the group means are equal. The following table shows the results of the ANOVA
procedure. It is evident that at the 2.5 per cent significance level the means of the
performance group (high, medium and low) are significantly different for each of the
four accounts performance variables, namely profit margin, return on capital
employed, gearing and profit per employee.
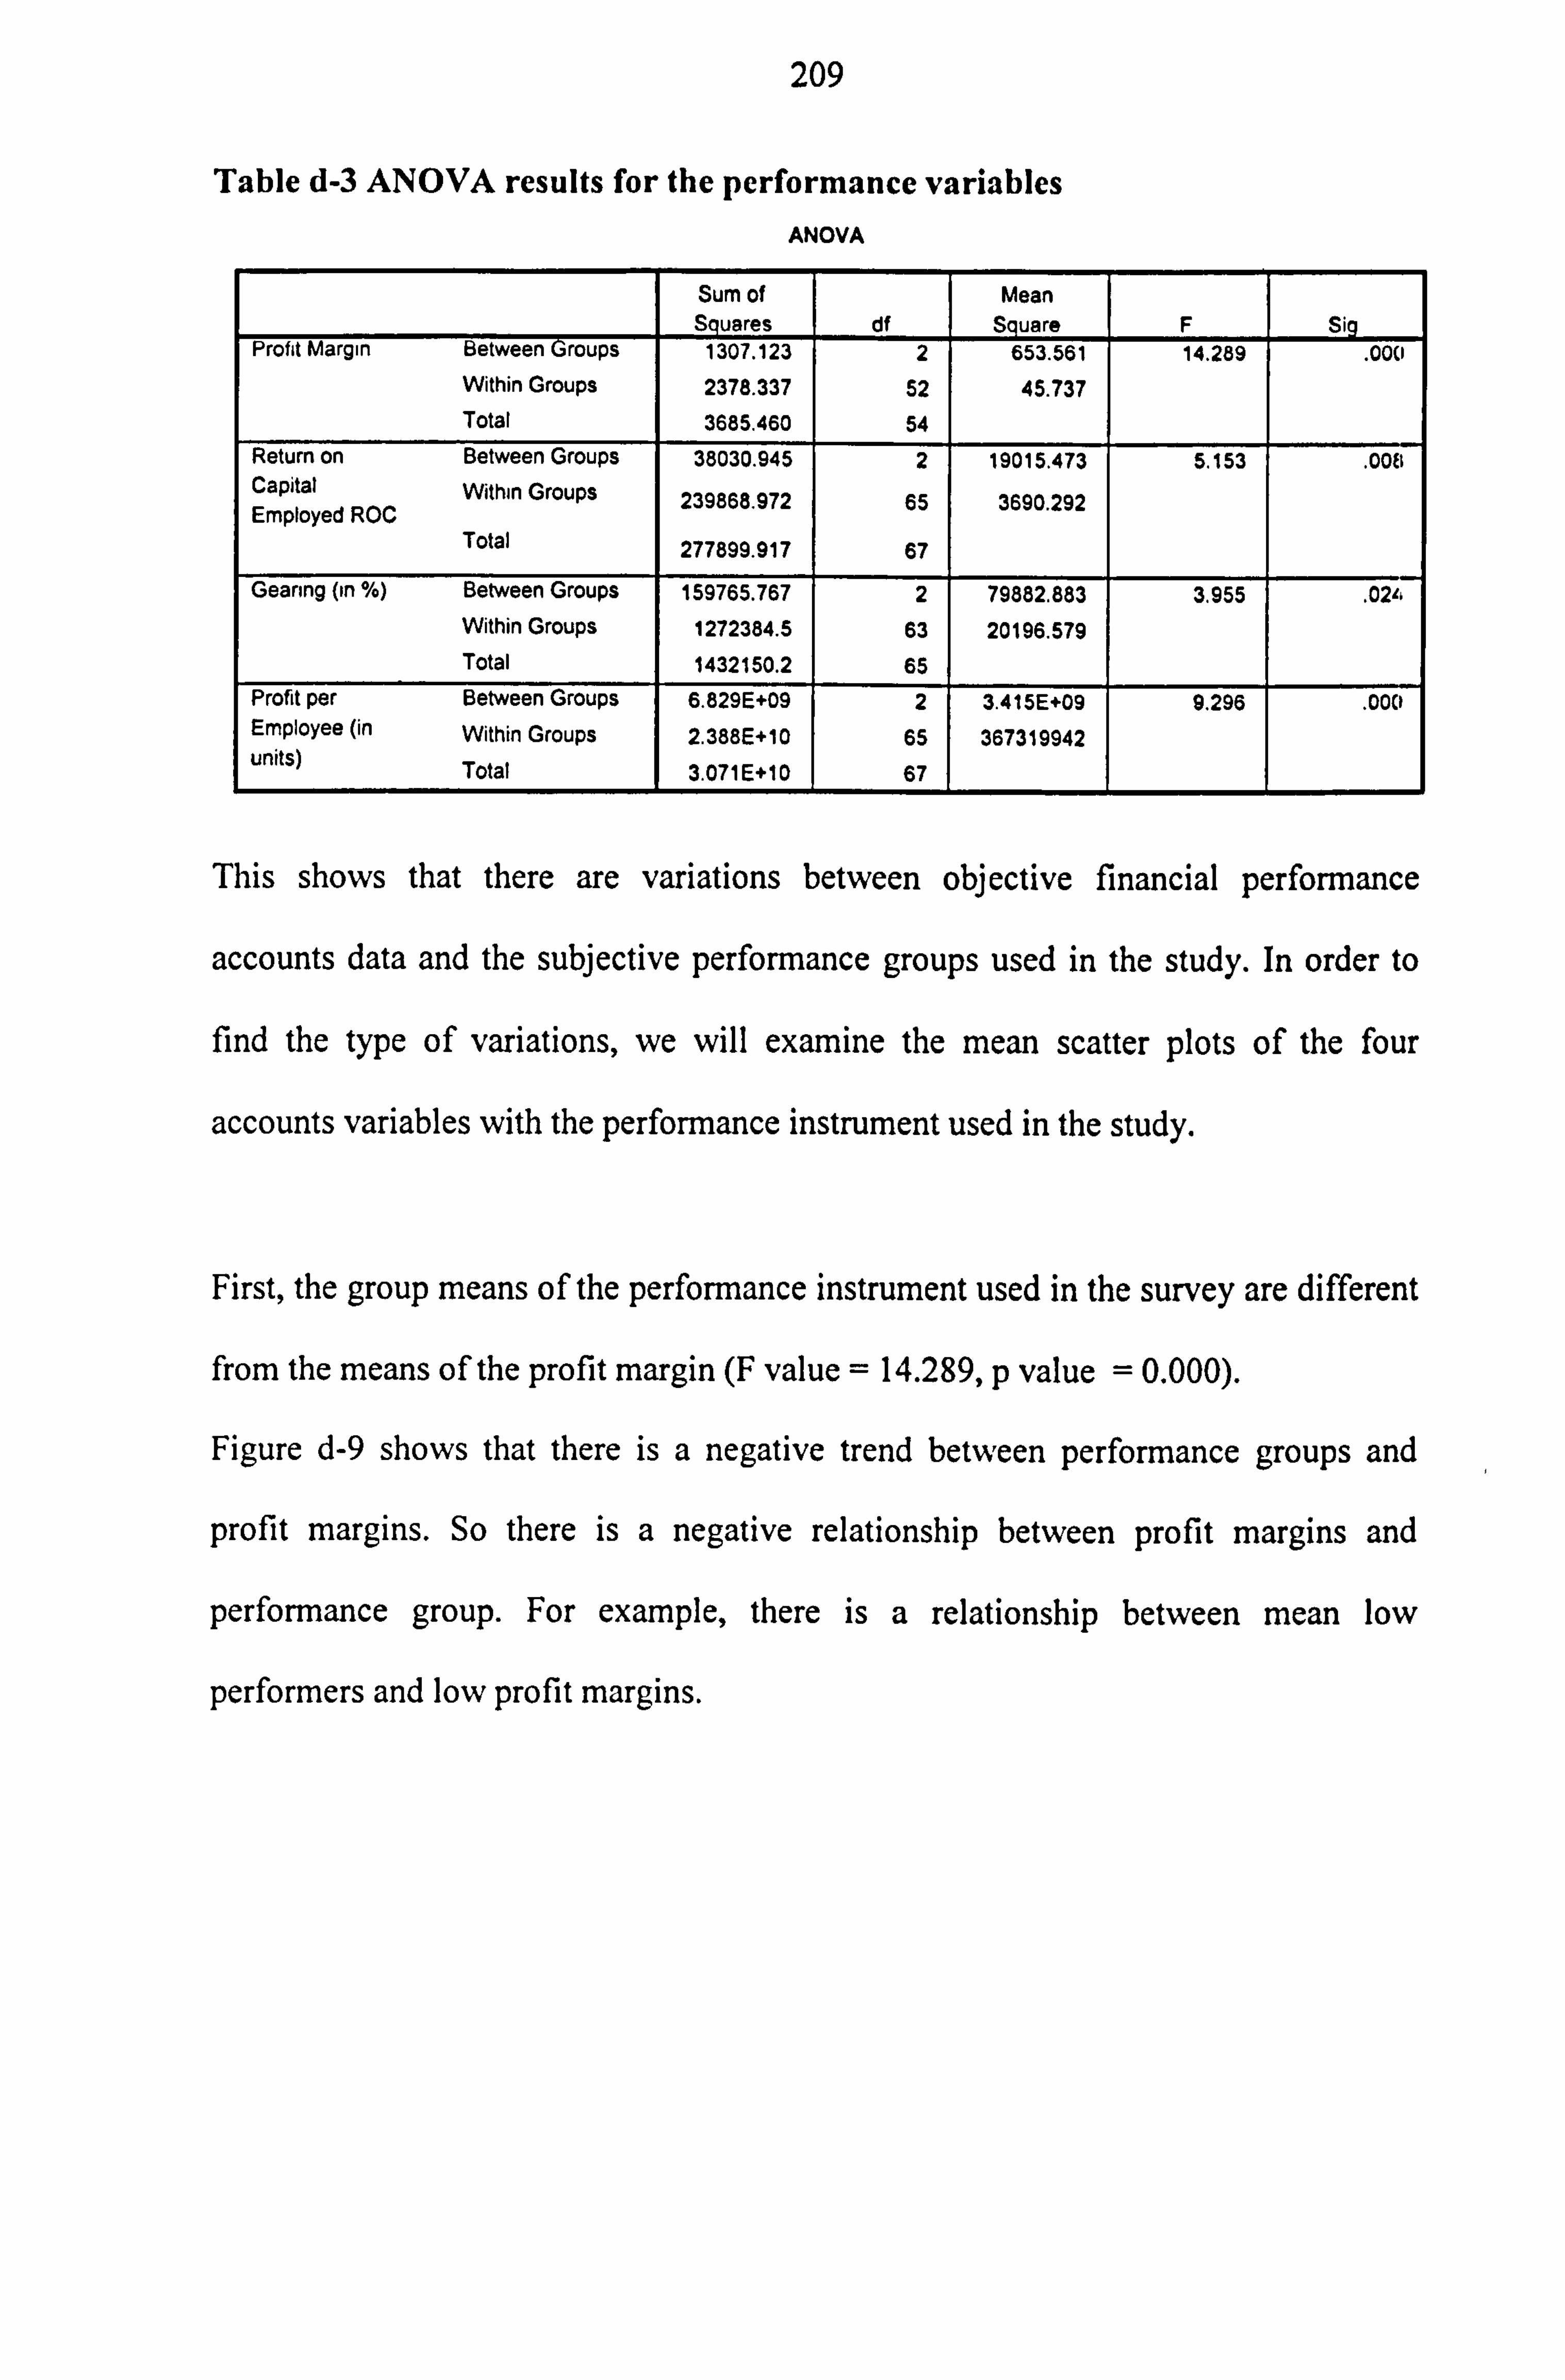
209
Table d-3 ANOVA results for the performance variables ANOVA
Sum of Mean Squares df Square F Sig
Profit Margin Between Groups 1307.123 2 653.561 14.289 . 000
Within Groups 2378.337 52 45.737 Total 3685.460 54
Return on Between Groups 38030.945 2 19015.473 5.153 . 008 Capital Within Groups 239868.972 65 3690 292 Employed ROC .
Total 277899.917 67
Gearing (in %) Between Groups 159765.767 2 79882.883 3.955 . 02<< Within Groups 1272384.5 63 20196.579 Total 1432150.2 65
Profit per Between Groups 6.829E+09 2 3.415E+09 9.296 . 000 Employee (in Within Groups 2.388E+10 65 367319942 units) Total 3.071E+10 67
This shows that there are variations between objective financial performance
accounts data and the subjective performance groups used in the study. In order to
find the type of variations, we will examine the mean scatter plots of the four
accounts variables with the performance instrument used in the study.
First, the group means of the performance instrument used in the survey are different
from the means of the profit margin (F value = 14.289, p value = 0.000).
Figure d-9 shows that there is a negative trend between performance groups and
profit margins. So there is a negative relationship between profit margins and
performance group. For example, there is a relationship between mean low
performers and low profit margins.
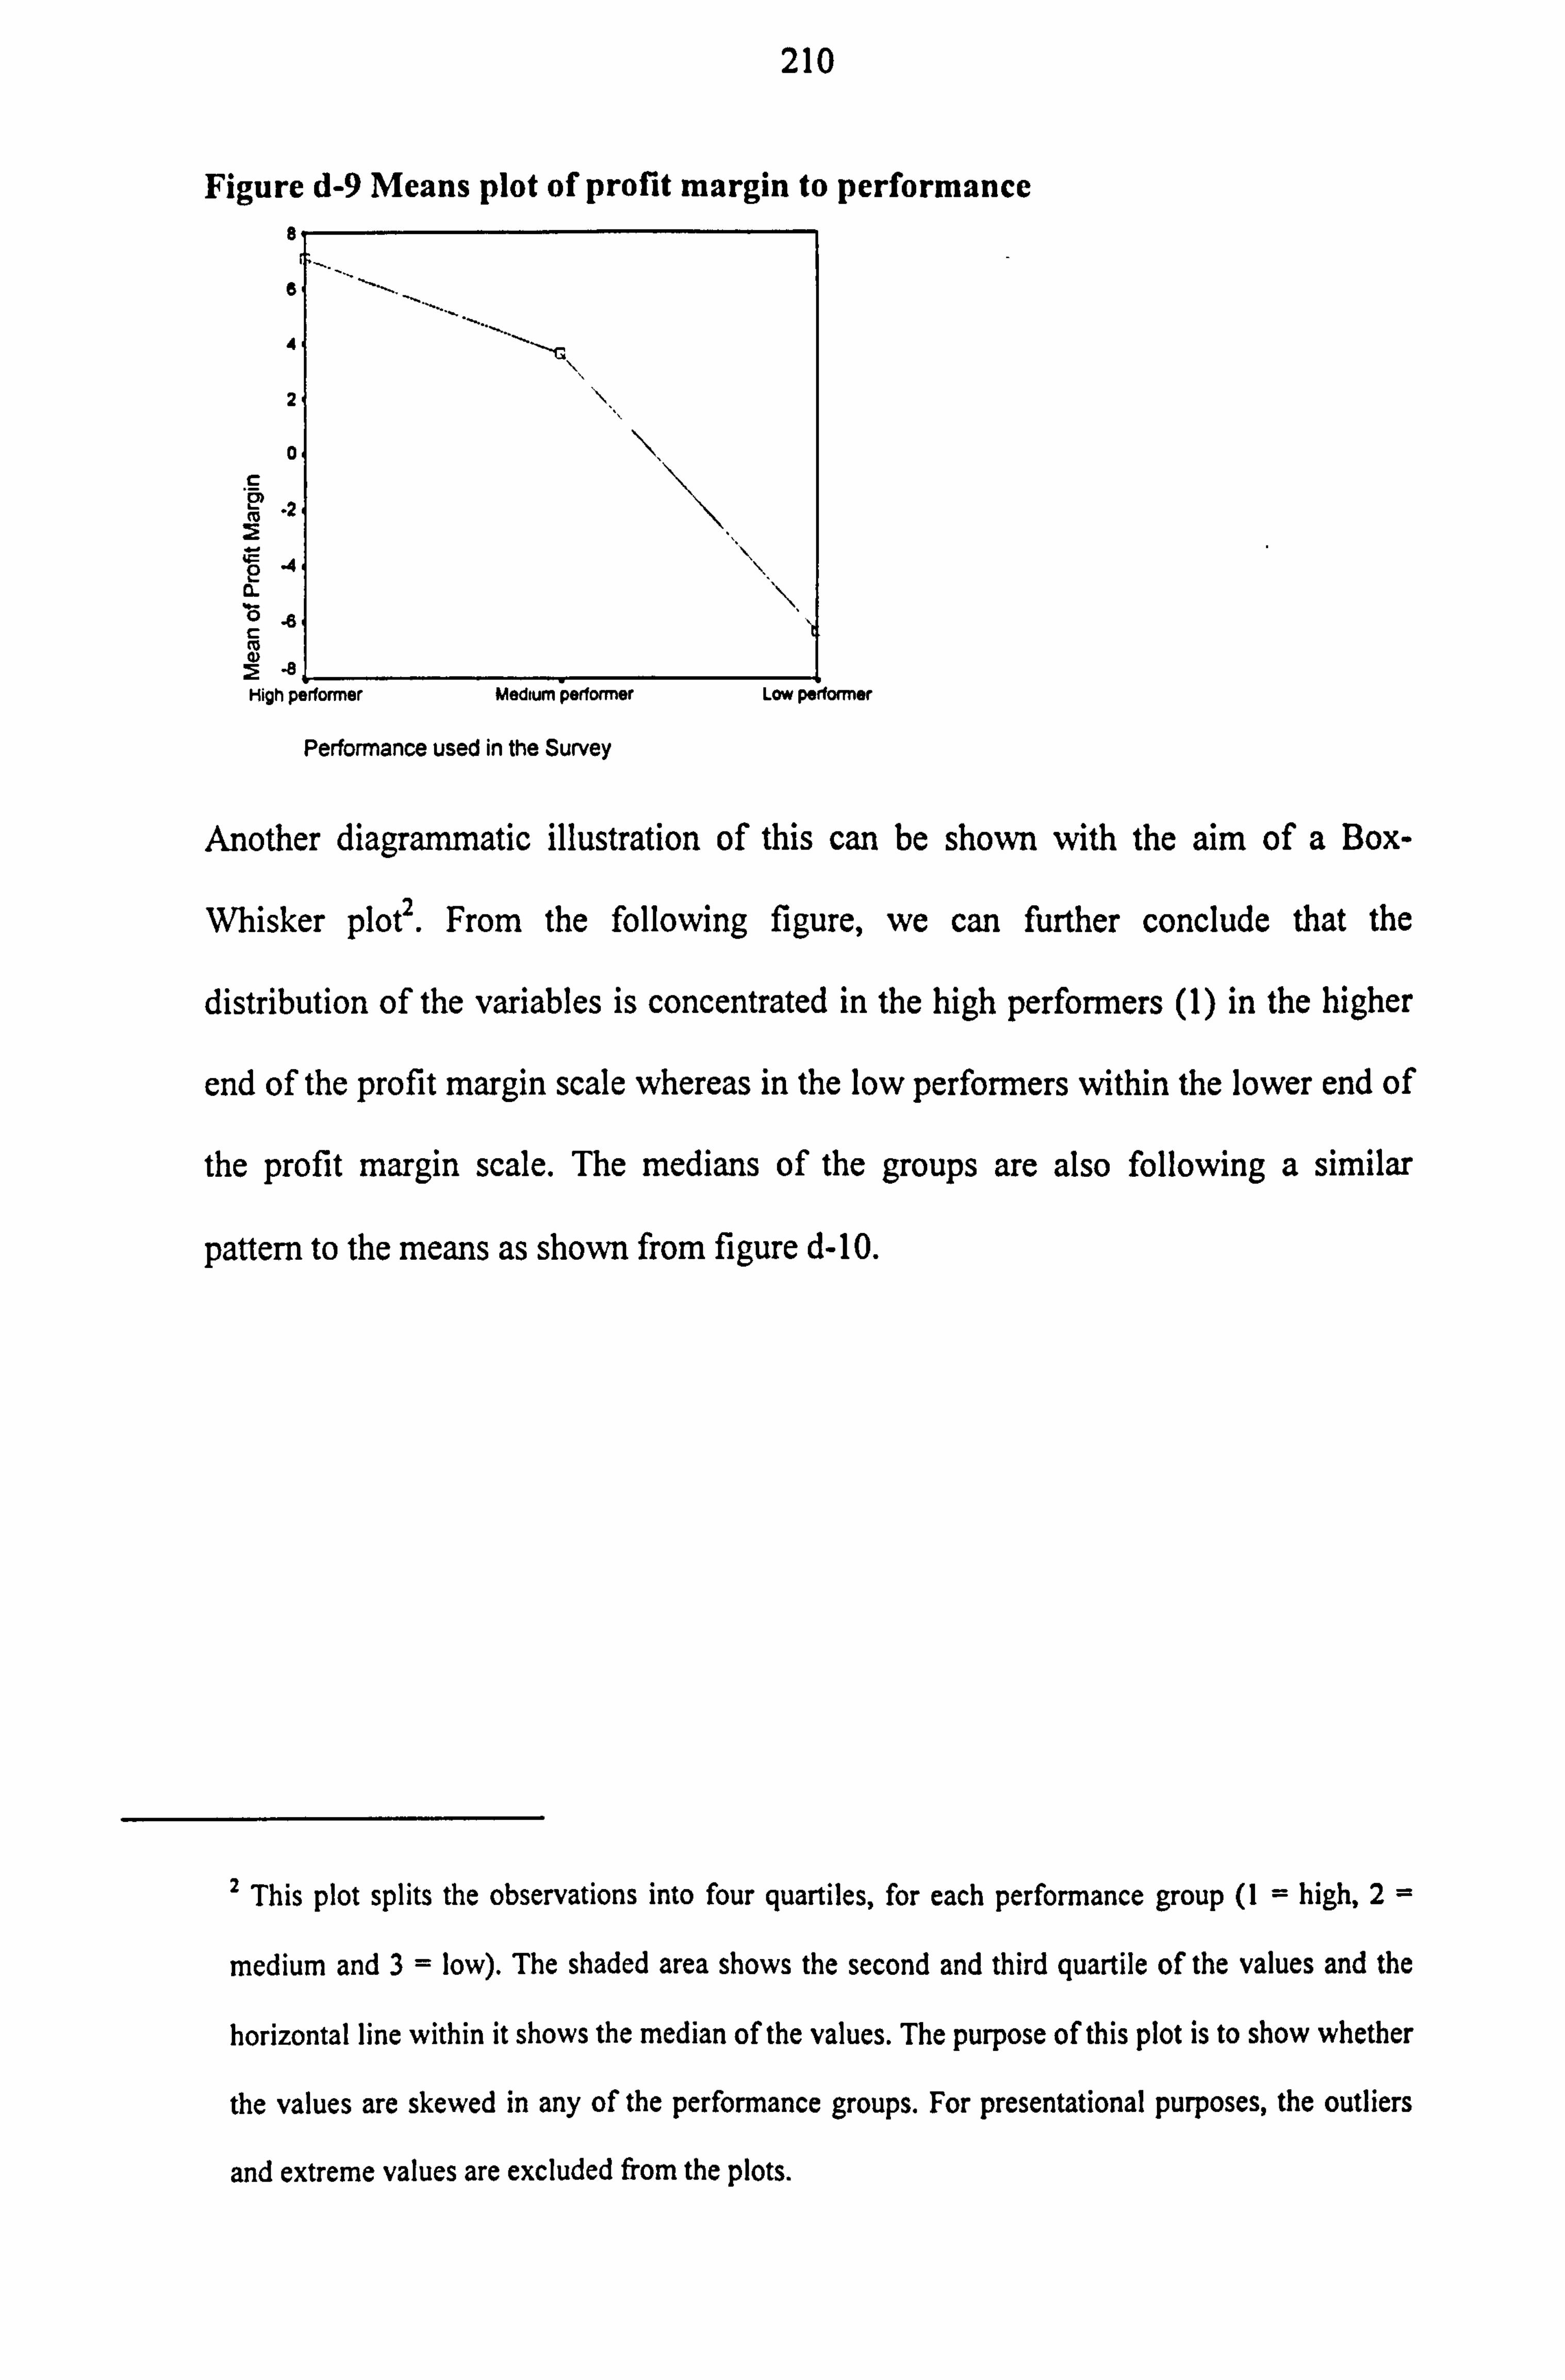
210
Figure d-9 Means plot of profit margin to performance
C
.2 t6
a o$ c 0
\.
High performer Medium performer Low performer
Performance used in the Survey
Another diagrammatic illustration of this can be shown with the aim of a Box-
Whisker plotz. From the following figure, we can further conclude that the
distribution of the variables is concentrated in the high performers (1) in the higher
end of the profit margin scale whereas in the low performers within the lower end of
the profit margin scale. The medians of the groups are also following a similar
pattern to the means as shown from figure d-10.
2 This plot splits the observations into four quartiles, for each performance group (1 = high, 2=
medium and 3= low). The shaded area shows the second and third quartile of the values and the
horizontal line within it shows the median of the values. The purpose of this plot is to show whether
the values are skewed in any of the performance groups. For presentational purposes, the outliers
and extreme values are excluded from the plots.
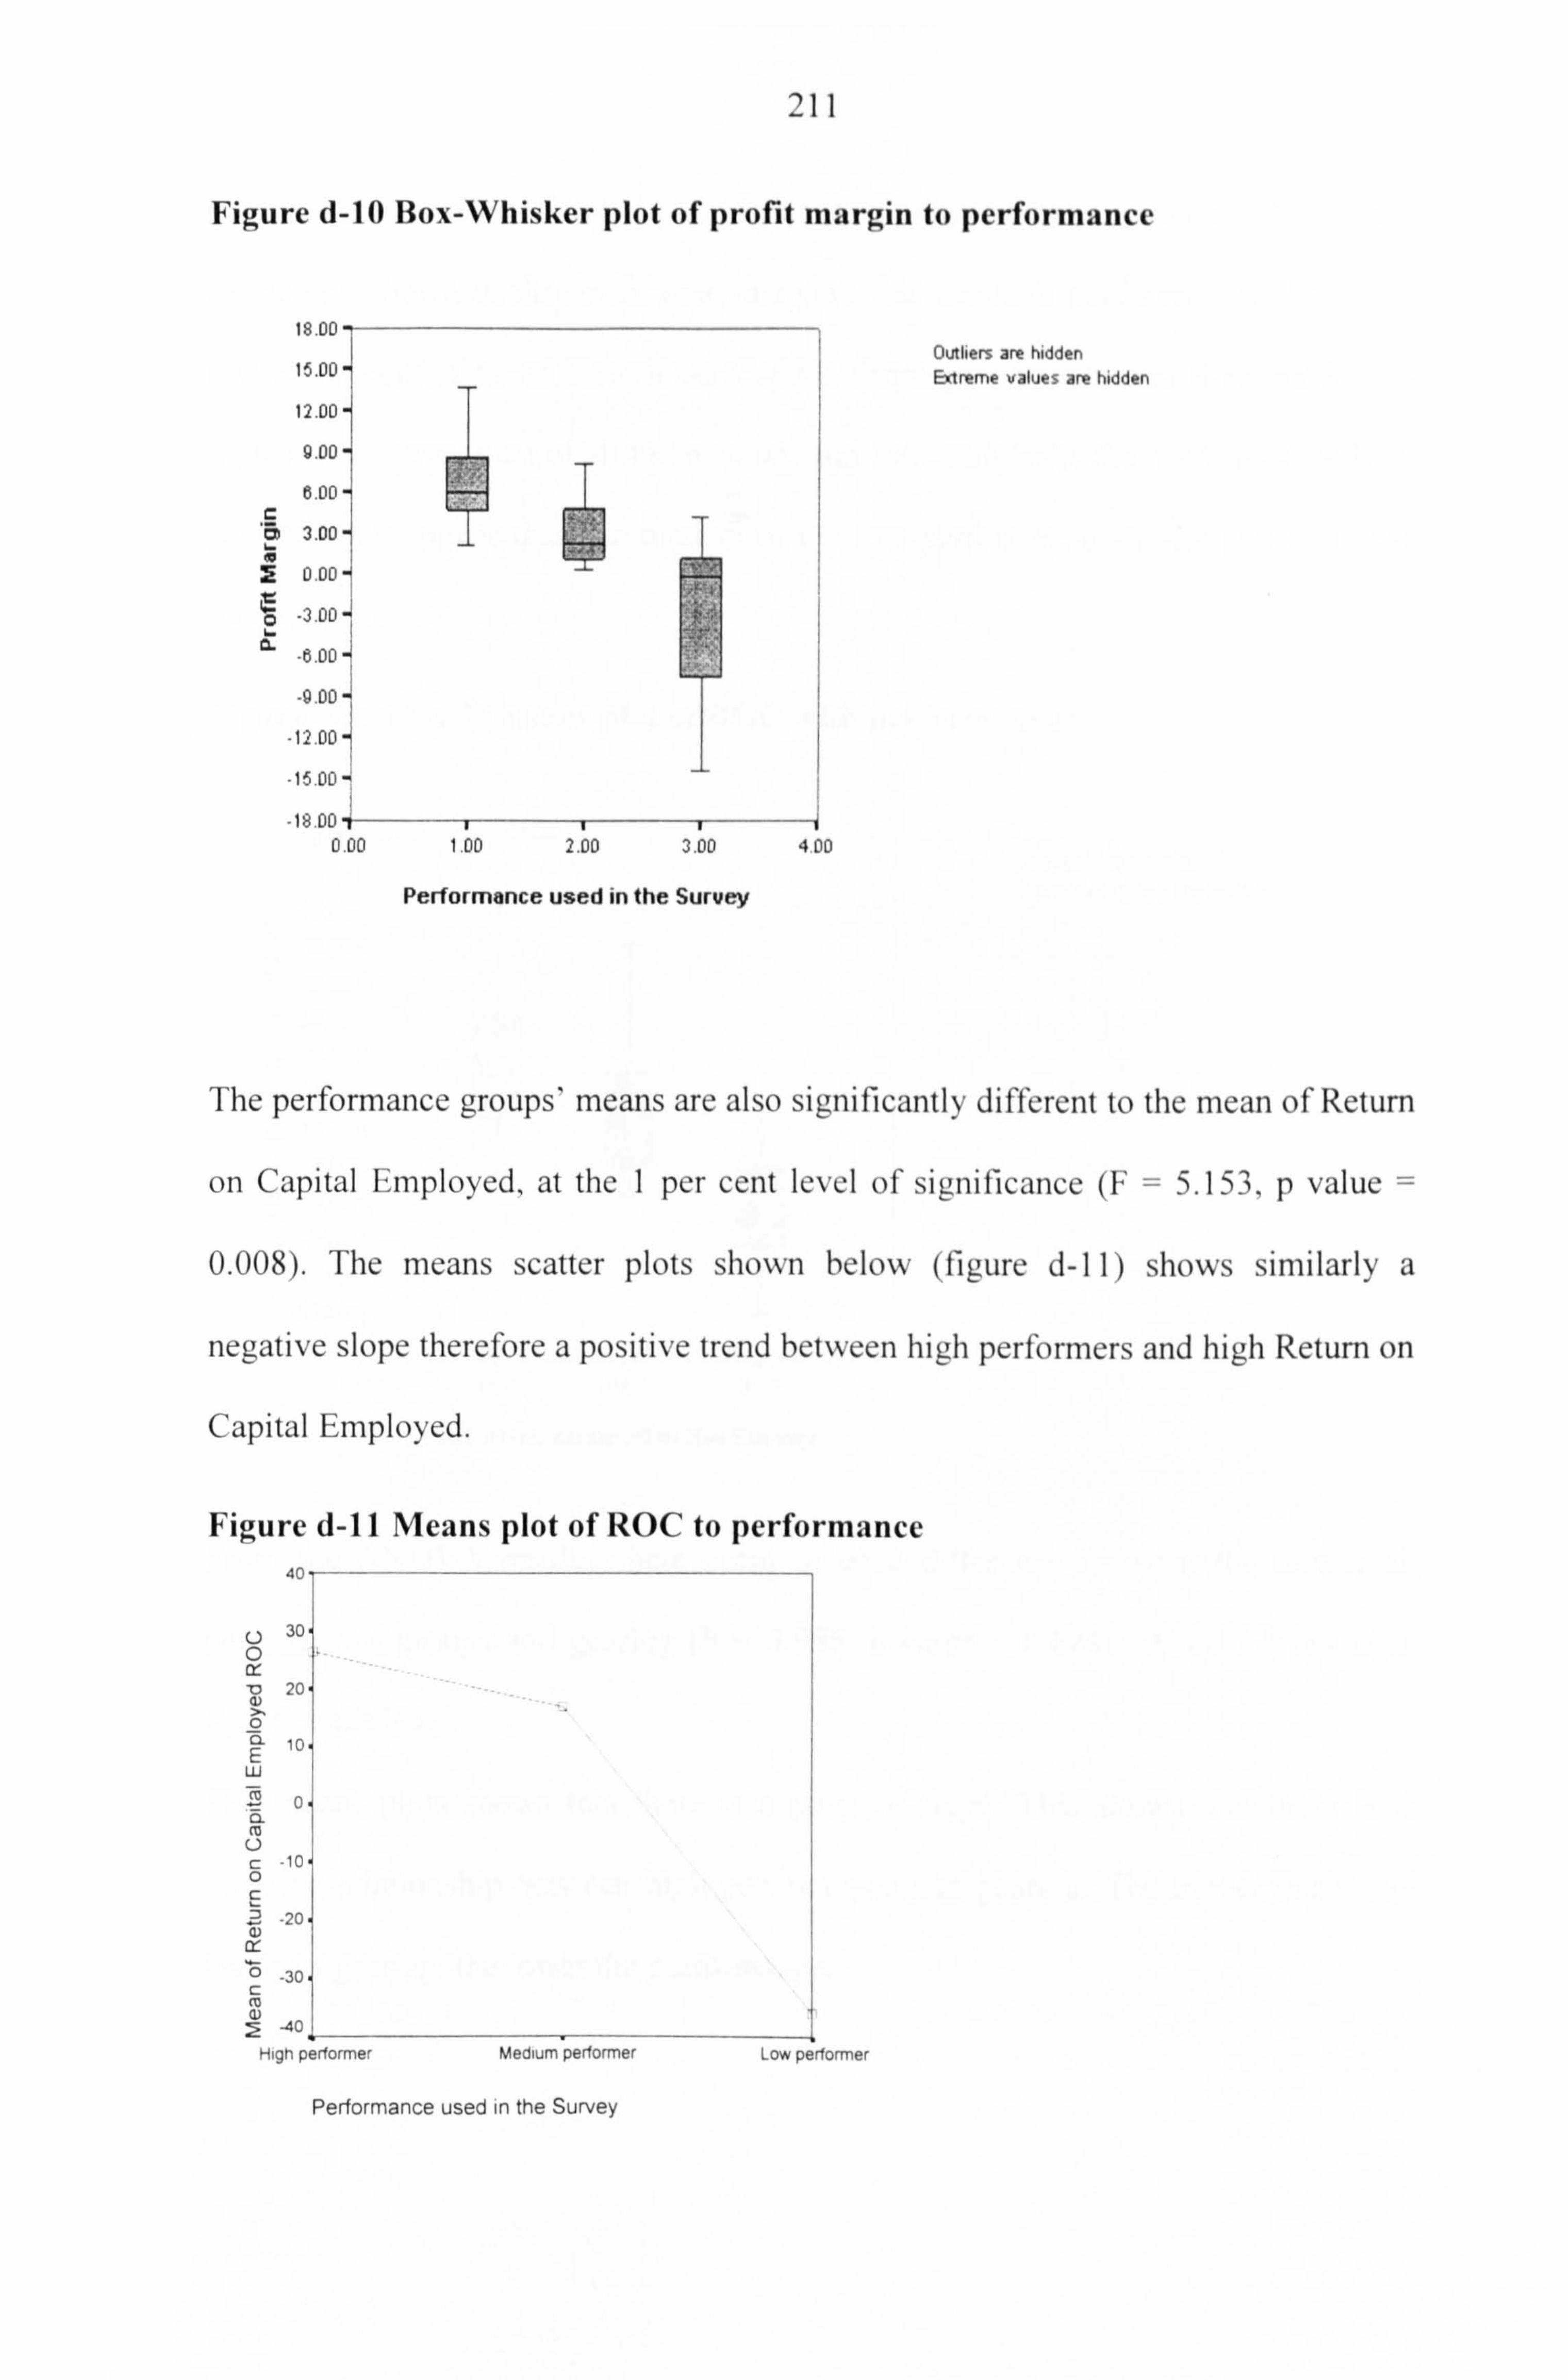
211
Figure d-10 Box-Whisker plot of profit margin to performance
18.00
15.00
12.00
9.00
6.00
äo 3.00
0.00
p -3.00 a
-6.00
-9.00
-12.00
15.00
-1800
1
1
a J
1
0.00 1.00 2.00 3.00 4.00
Performance used in the Survey
Outliers are hidden Extreme values are hidden
The performance groups' means are also significantly different to the mean of Return
on Capital Employed, at the I per cent level of significance (F = 5.153, p value =
0.008). The means scatter plots shown below (figure d-11) shows similarly a
negative slope therefore a positive trend betvveen high performers and high Return on
Capital Employed.
Figure d-11 Means plot of ROC to performance 40 r- __
U 30 0 0: m 20 0)
F 10 w
co o ä m U c -10 0 c
-20
-30 c a
-40 High performer Medium performer Low performer
Performance used in the Survey
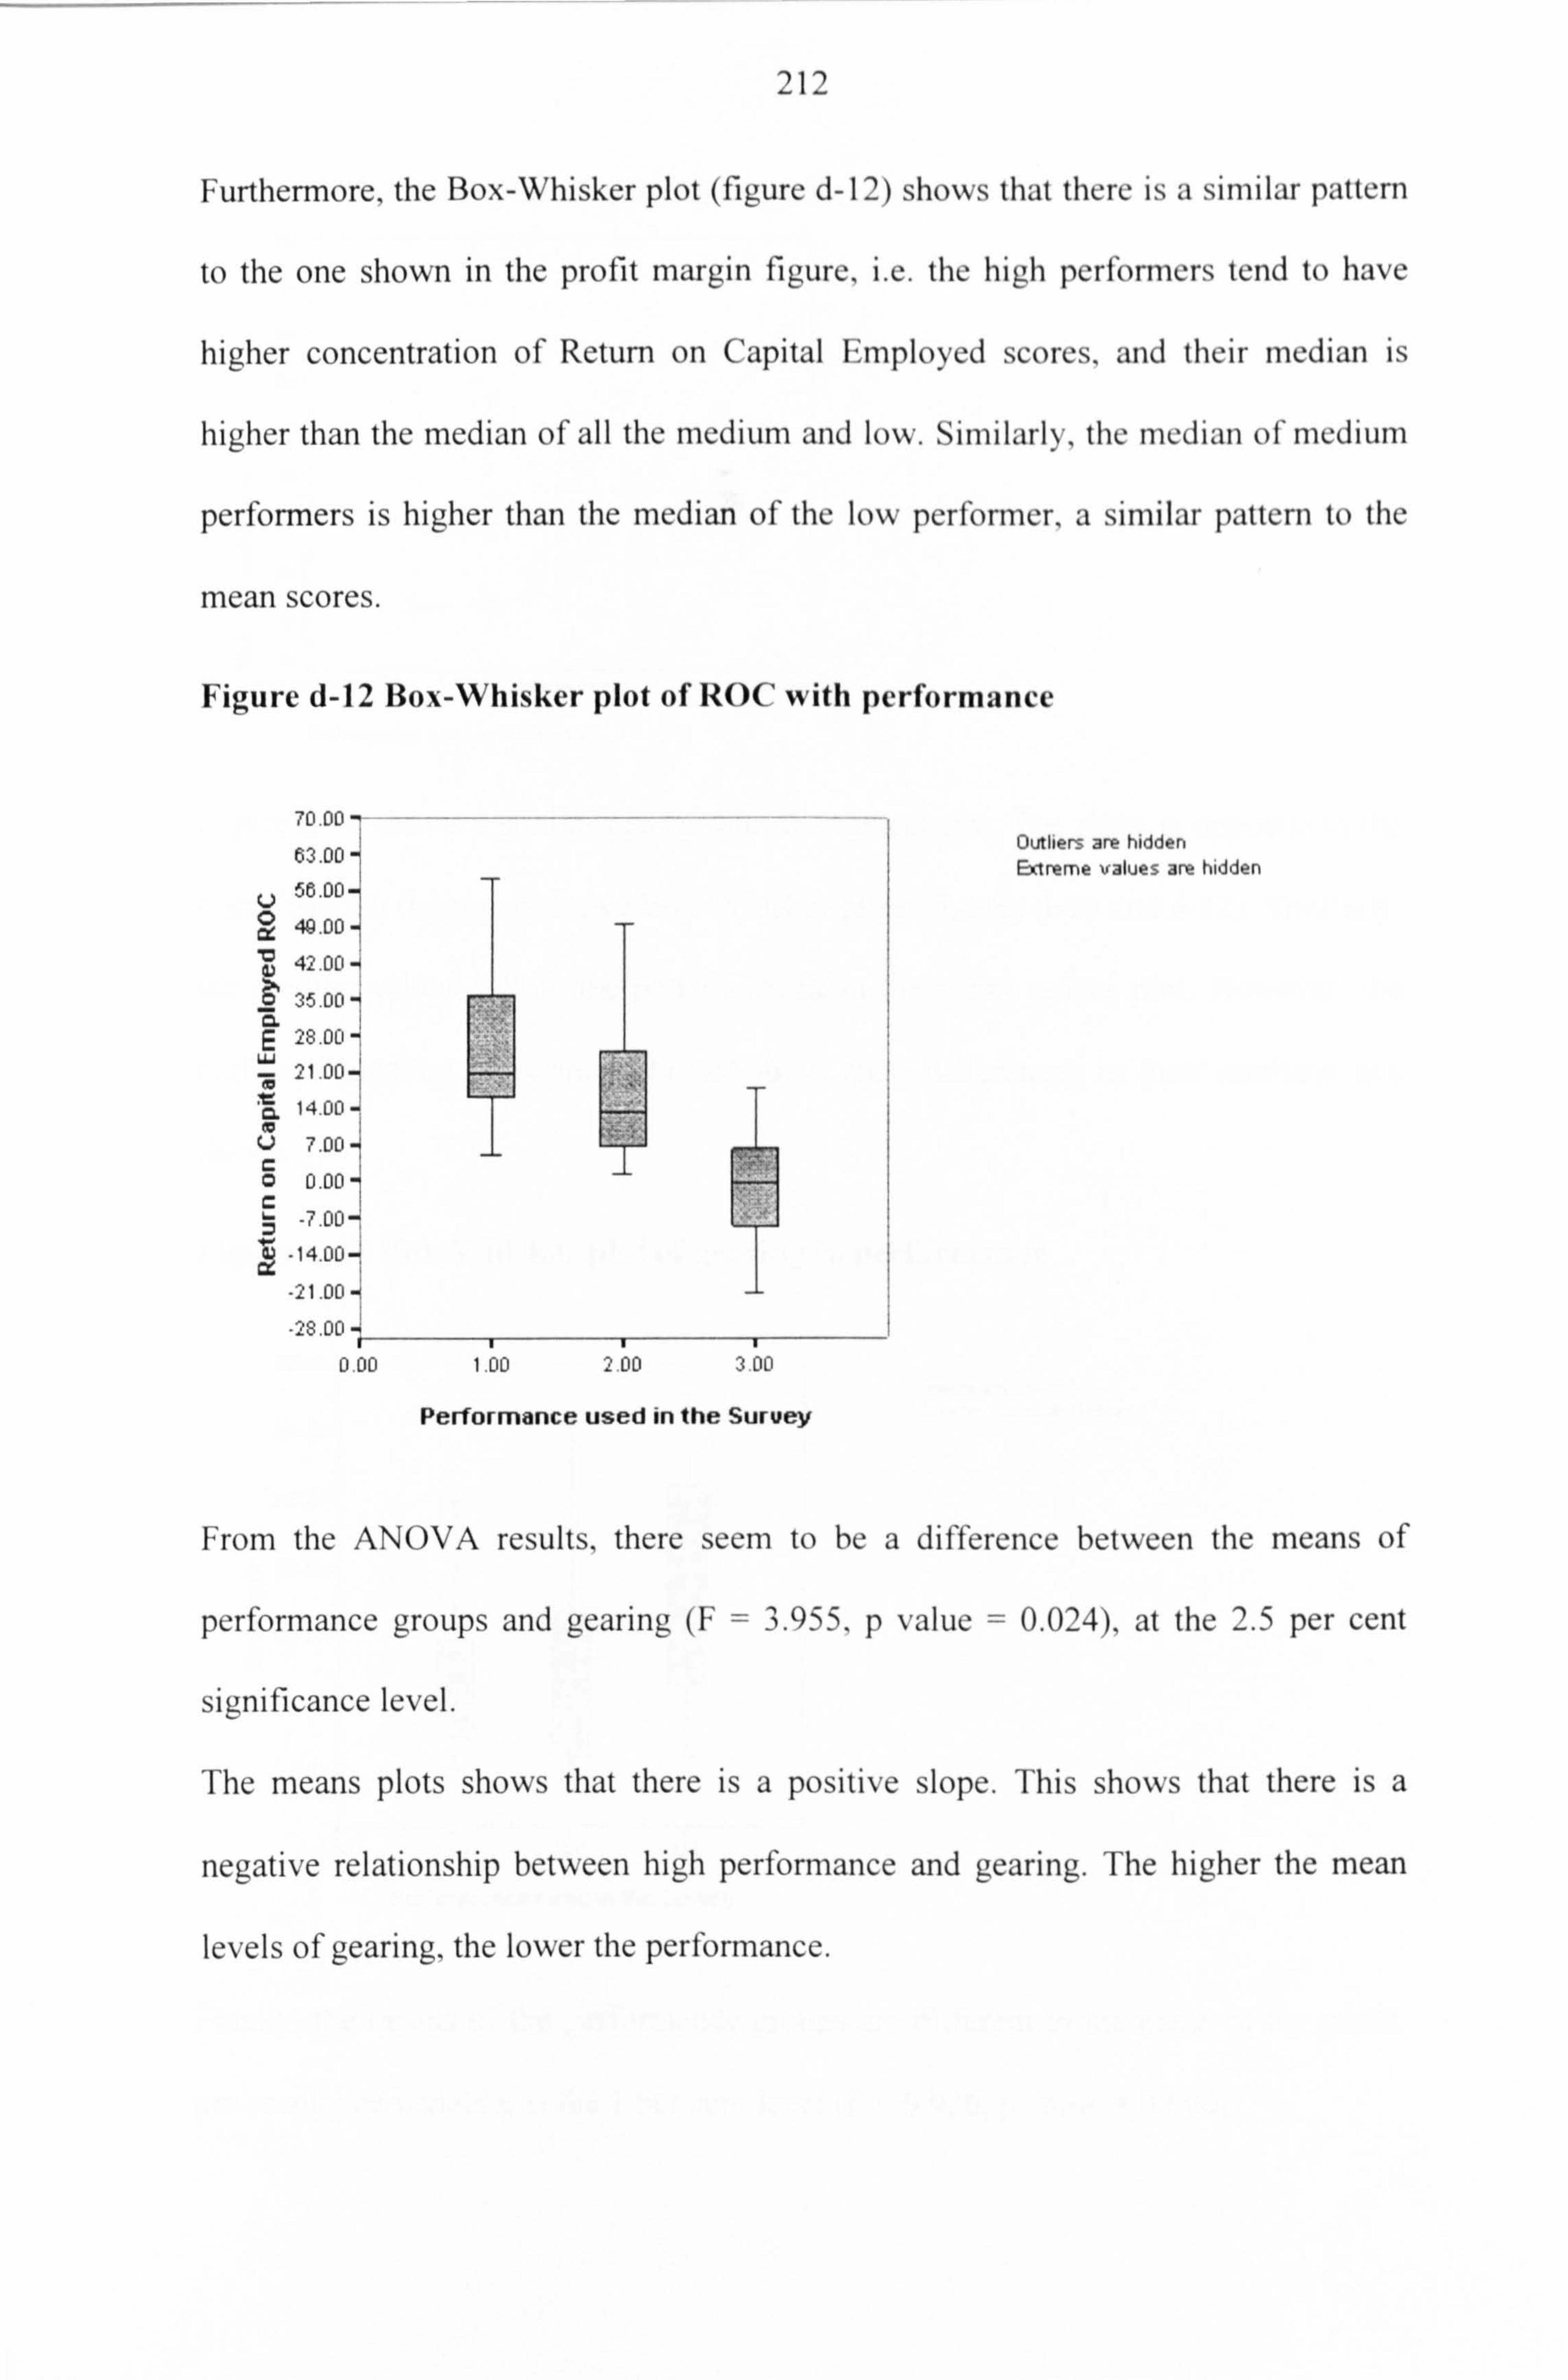
212
Furthermore, the Box-Whisker plot (figure d-12) shows that there is a similar pattern
to the one shown in the profit margin figure, i. e. the high performers tend to have
higher concentration of Return on Capital Employed scores, and their median is
higher than the median of all the medium and low. Similarly, the median of medium
performers is higher than the median of the low performer, a similar pattern to the
mean scores.
Figure d-12 Box-Whisker plot of ROC with performance
70.00 - -- 63.00
U 58.00 a 48.00
42.00-4 i
35.00 -{ E
28.00 -
21 00 .
14.00 - U 7.00 Ö
0.00
-7.00 "14.00- 21.00 -
-28.00- i
0 00 1.00 2.00 3.00
Performance used in the Survey
Outliers are hidden Extreme values are hidden
From the ANOVA results, there seem to be a difference between the means of
performance groups and gearing (F = 3.955, p -value = 0.024), at the 2.5 per cent
significance level.
The means plots shows that there is a positive slope. This shows that there is a
negative relationship between high performance and gearing. The higher the mean
levels of gearing, the lower the performance.
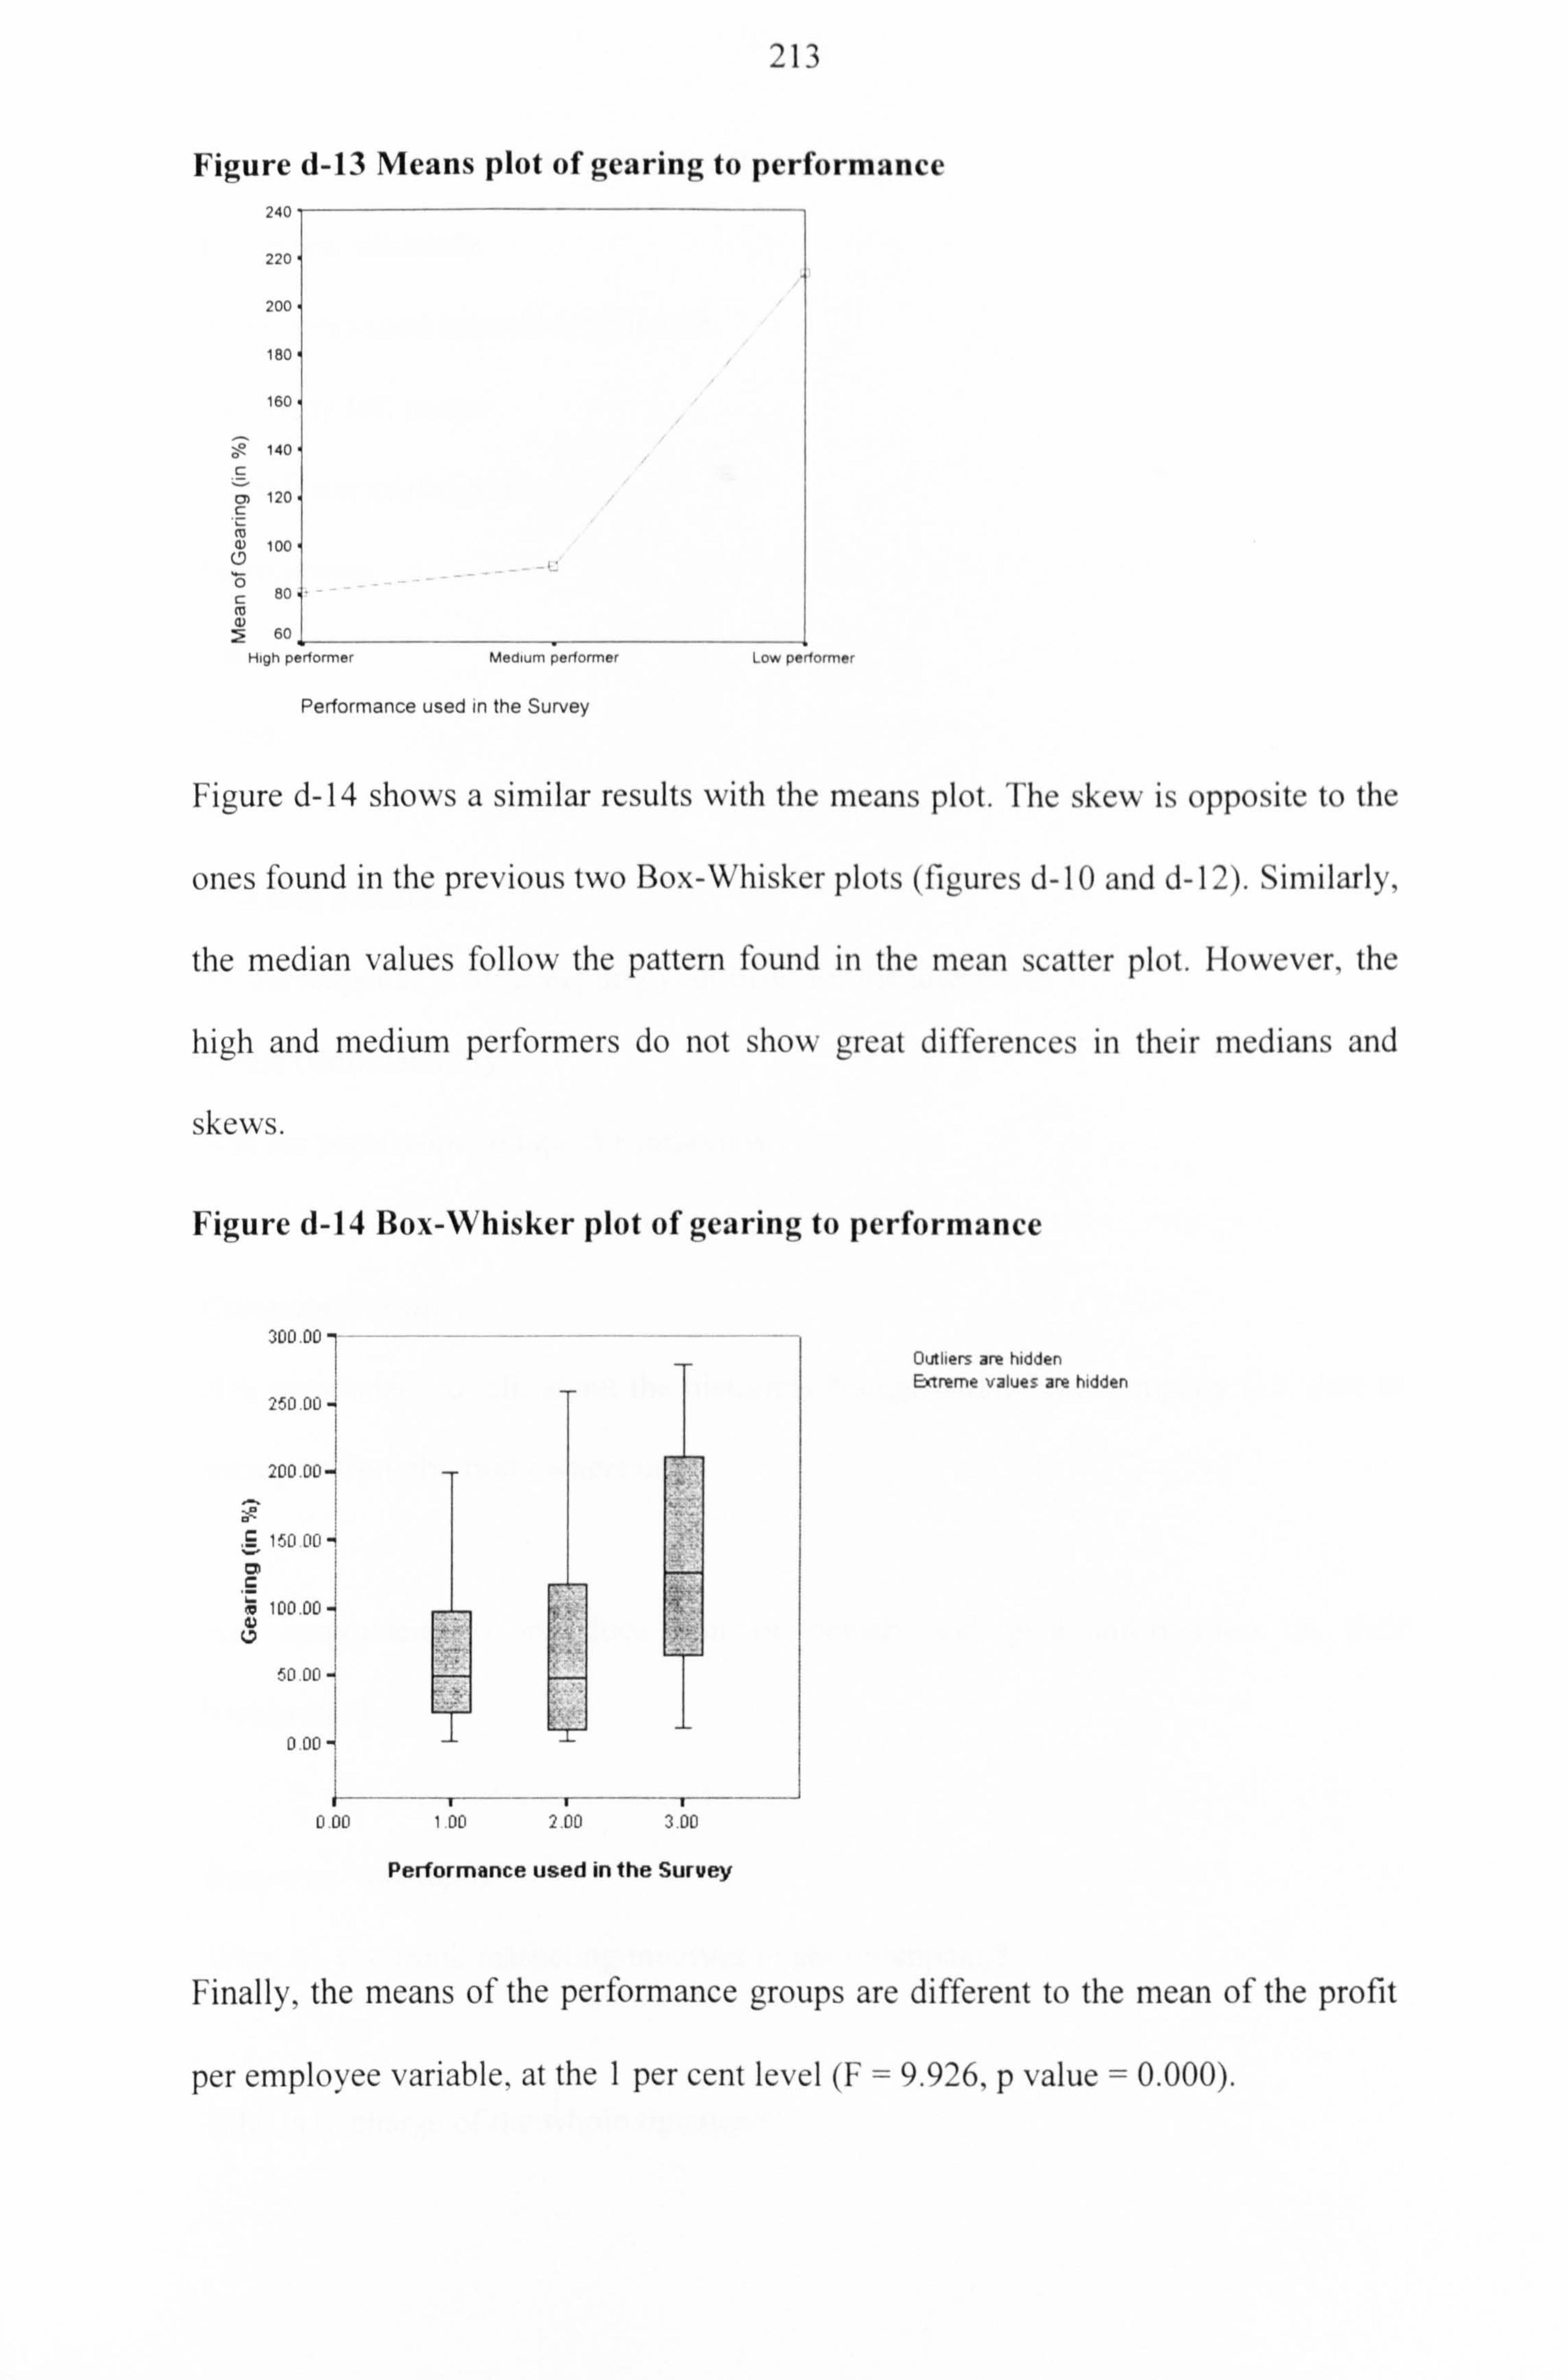
21 3
Figure d-13 Means plot of gearing to performance 240 ------_-
220
200
180 160
140
C
rn 120 C
100
Ö 80
f0 N
ý 60
High performer Medium performer Low performer
Performance used in the Survey
Figure d-14 shows a similar results with the means plot. The skew is opposite to the
ones found in the previous two Box-Whisker plots (figures d- 10 and d-12). Similarly,
the median values follow the pattern found in the mean scatter plot. However, the
high and medium performers do not show great differences in their medians and
skews.
Figure d-14 Box-Whisker plot of gearing to performance
300.00
250 00
200 00i
150 001
100.00; 'ý.
Cý 50 00
0.00
fTf 000 100 2.00 3.00
Performance used in the Survey
Outliers are hidden Extreme values are hidden
Finally, the means of the performance groups are different to the mean of the profit
per employee variable, at the 1 per cent level (F = 9.926, p value = 0.000).

PAGES MISSING
IN ORIGINAL
215
Interview Schedule and qualitative data analysis
Interview schedule
Semi-Structured Interview Schedule
Company full name:
Interviewer participants:
Interviewee:
Venue:
Time:
Opening questions:
Thank respondent for accepting your offer for the interview
Stress confidentiality
Ask for permission to tape the interview
Company's history
Ask respondent to talk about the historical background of the company (i. e. date of
incorporation, the first owners etc. ).
Ask respondent to introduce him or herself and give information on their
background.
Business Philosophy
What do you think marketing involves in your company?
Who is in charge of the whole function?
216
What are some of the tasks of marketing in your company?
What is the marketing philosophy of your company (probe them to the question from
the questionnaire)? Why?
Strategic Analysis
Do you have any strategic plans? If so what sort of plans and how often do you plan?
Are you aware of any planning tools like SWOT analysis or something similar?
(explain if they do not understand what SWOT analysis involves)
How exactly do you use this type of tools and why do you believe they are
important/not important?
What about market information, like market trends, competitor analysis, and so on.
Do you gather any and if so from where and how. Do you find it useful?
If so who is in charge of analysing the data? How do you do that and how many
people are involved? Do you use the data for strategic decisions?
Marketing strategy
How would you describe your overall marketing strategy (probe them with the
questions from the survey)? Where do you focus, cost reduction and productivity
improvement? Why?
217
What is your marketing mix strategy, i. e. product, price, promotion, place (explain).
In other word which of the 4 Ps are your strongest areas? Why? How have you
developed them?
Has your company recently developed a new product or new idea? Please describe
the process of change.
Would you describe your company as aggressive or conservative? Why? Do you
think you can tap to new markets?
Marketing organisation
What is the structure of the management of the company?
How is the communication within the company and the departments? How do you
respond to changes in customers requirements, and how does the communication
flow within the company?
Who makes the decisions? How much are the departments integrated with the
marketing department?
Marketing control
Do you have a marketing intelligence gathering system? If so why? How does it
work?
Do you get any feedback on your performance and objectives by your customers?
218
Do you have an internal method of assessing your effort?
Networks and agri-food environment
Do you use any network of friends or colleagues for your operations? If so why and
how do you find them useful?
Do you believe that the regulations imposed can become a threat to your company?
How do they affect you?
What about the competitors, the big players. How and why do they affect your
company?
Closing comments
Thank you for your time
Results will be sent as soon as they are analysed
Give contact details in case they have any questions/need help
Qualitative data analysis
QSR NUD. IST (1997) is a computer package designed to aid users in handling Non-
numerical and unstructured data in qualitative analysis, by supporting processes of
coding data in an index system, searching text or searching patterns of coding and
theorising about the data. NUD. IST stands for Non-numerical Unstructured Data
Indexing Searching and Theorising and the following figure explains the process by
which non-numerical unstructured data can become theory. There are four stages in
the process of analysis using this software.

219
The first stage starts by simultaneously asking the research questions and the
hypotheses to be tested, and undertaking the interviews, and collecting documents
relevant to the study.
The next step is to use the indexing system in order to put documents into some
taxonomy and order, depending on their content.
The third stage is the stage where searching of the index system and text, and
developing nodes, will lead to theory development.
The final step is concerned with putting the results into a workable theory and further
evaluation of the results, which then goes to the final project results or goes back to
the indexing stage.
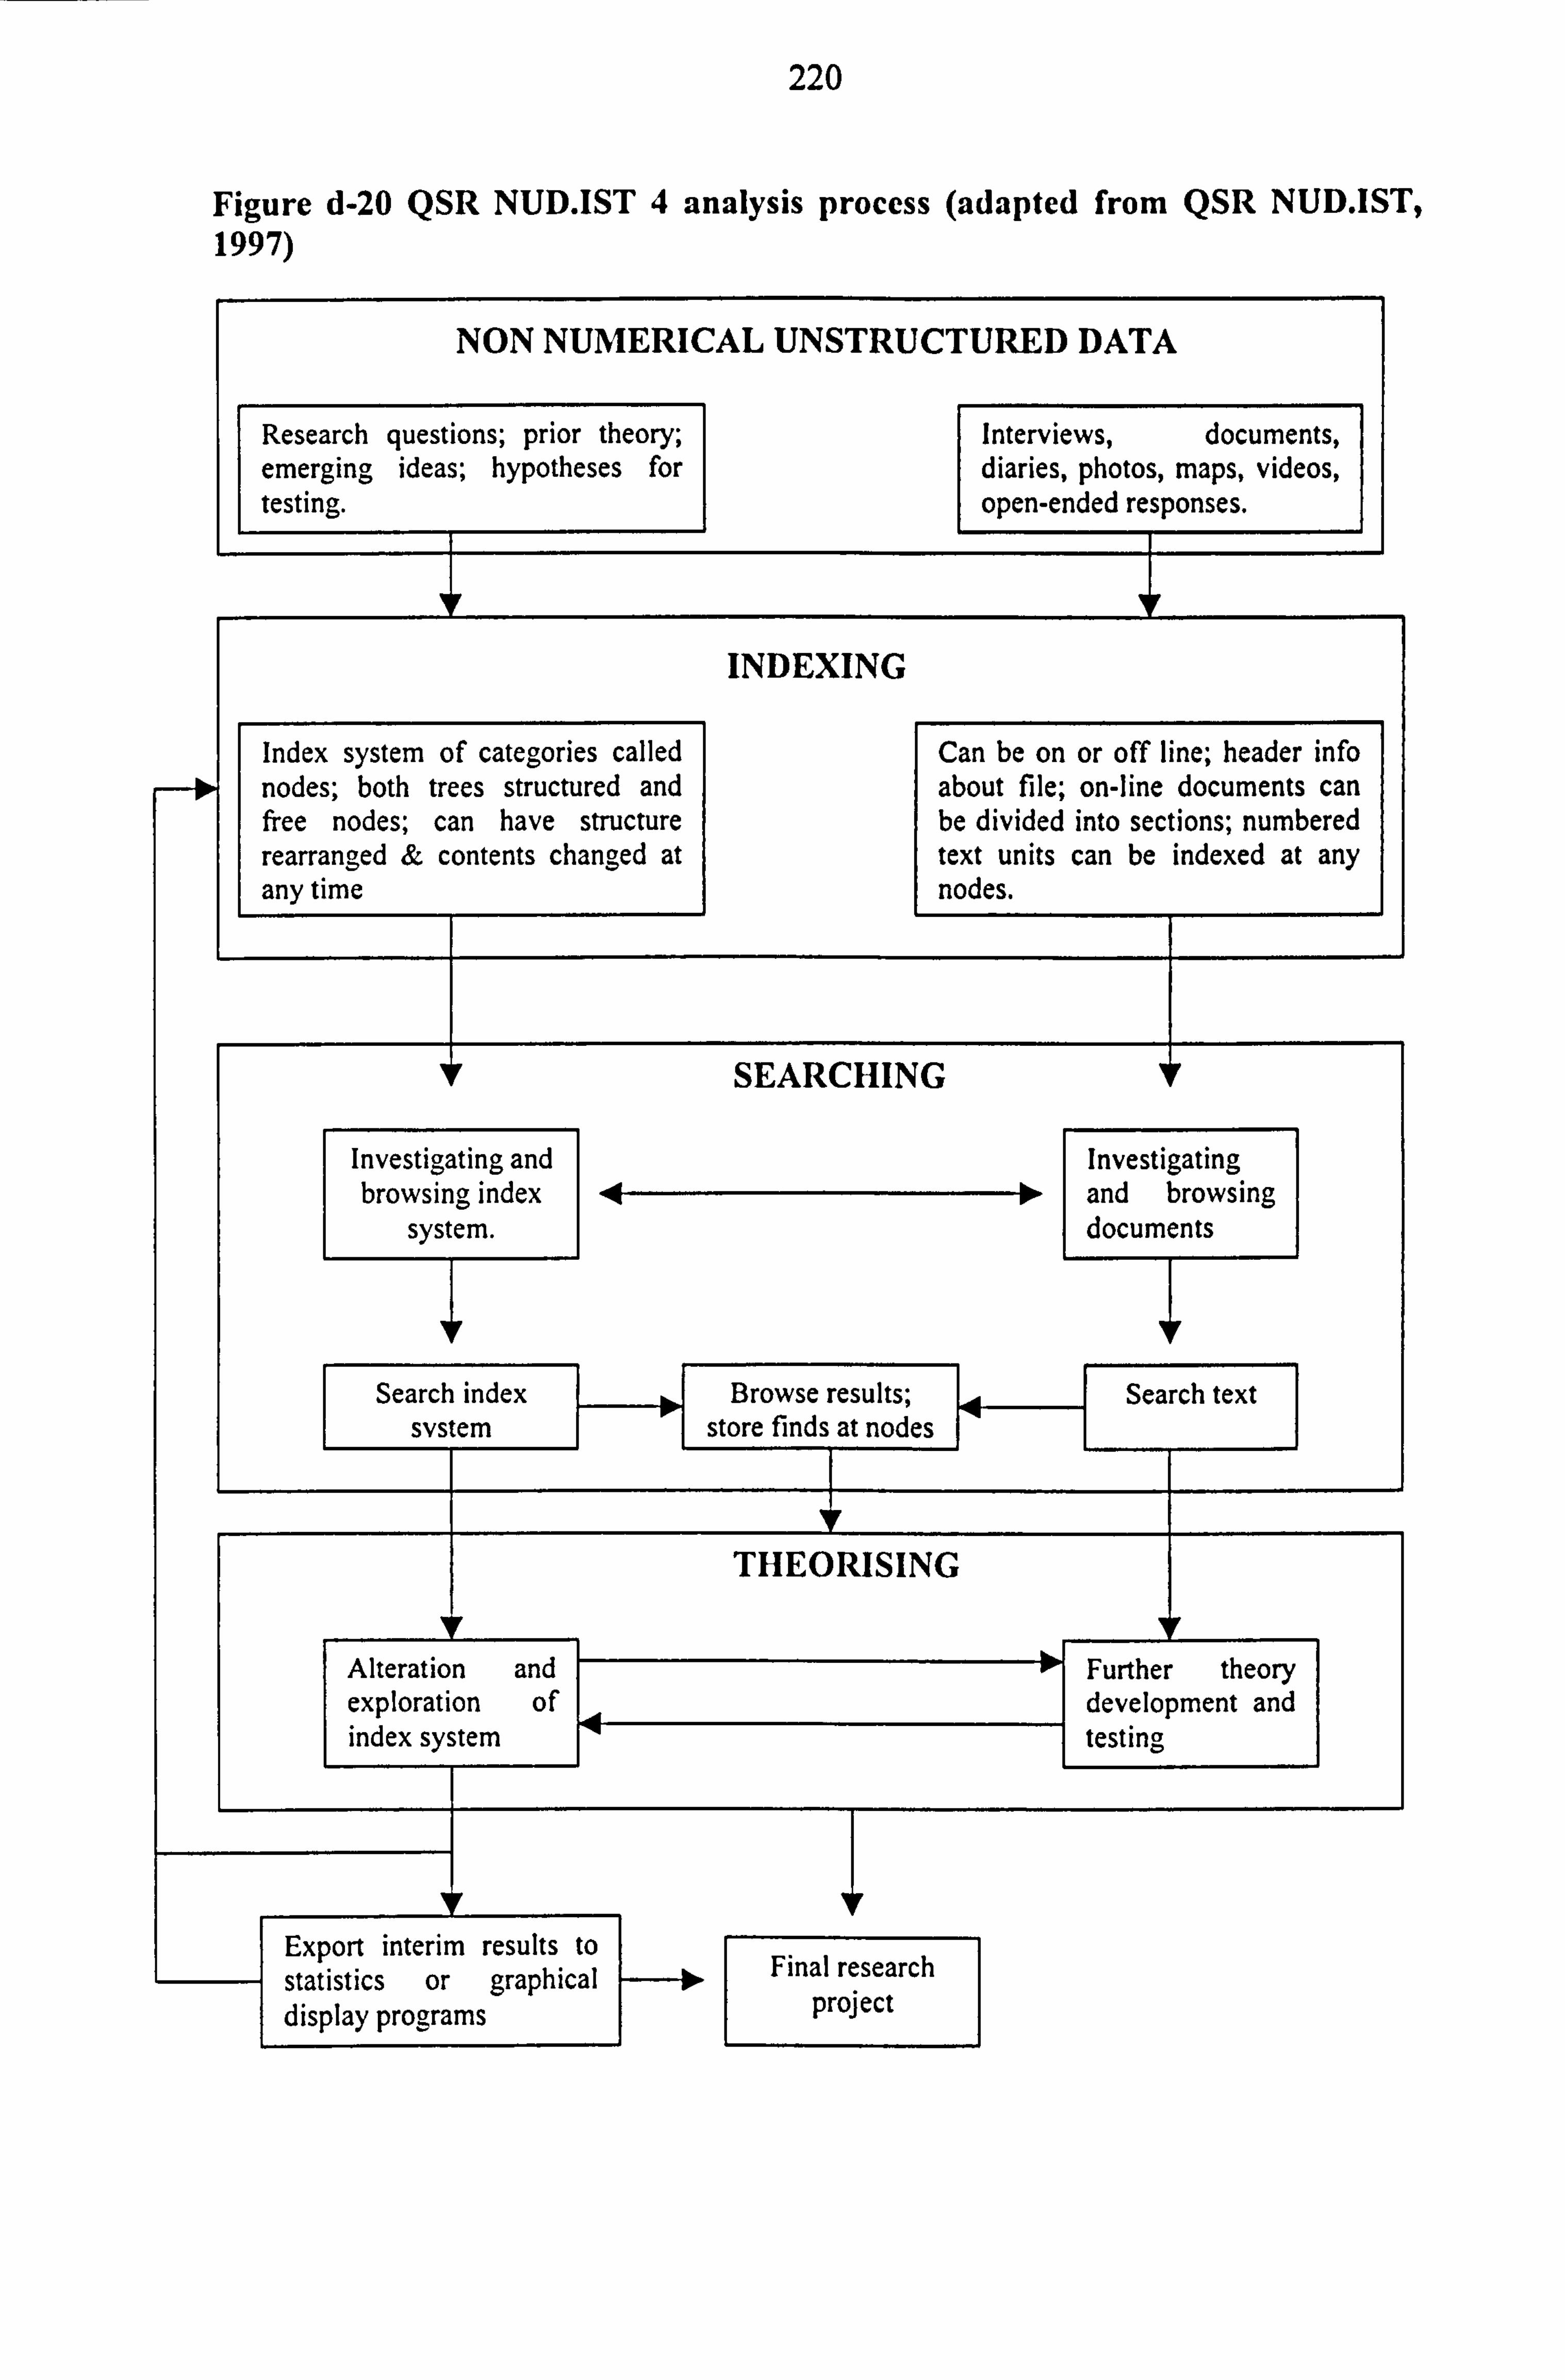
220
Figure d-20 QSR NUD. IST 4 analysis process (adapted from QSR NUD. IST, 1997)
NON NUMERICAL UNSTRUCTURED DATA
Research questions; prior theory; emerging ideas; hypotheses for testing.
Index system of categories called nodes; both trees structured and free nodes; can have structure rearranged & contents changed at any time
Interviews, documents, diaries, photos, maps, videos, open-ended responses.
INDEXING
Can be on or off line; header info about file; on-line documents can be divided into sections; numbered text units can be indexed at any nodes.
SEARCHING
Investigating and Investigating browsing index 4 P- and browsing
system. documents
Search index I .I Browse results; I, I Search text system I 'I store finds at nodes
THEORISING
Alteration and Further theory exploration of development and index system testing
Export interim results to statistics or graphical 10 Final research display programs project
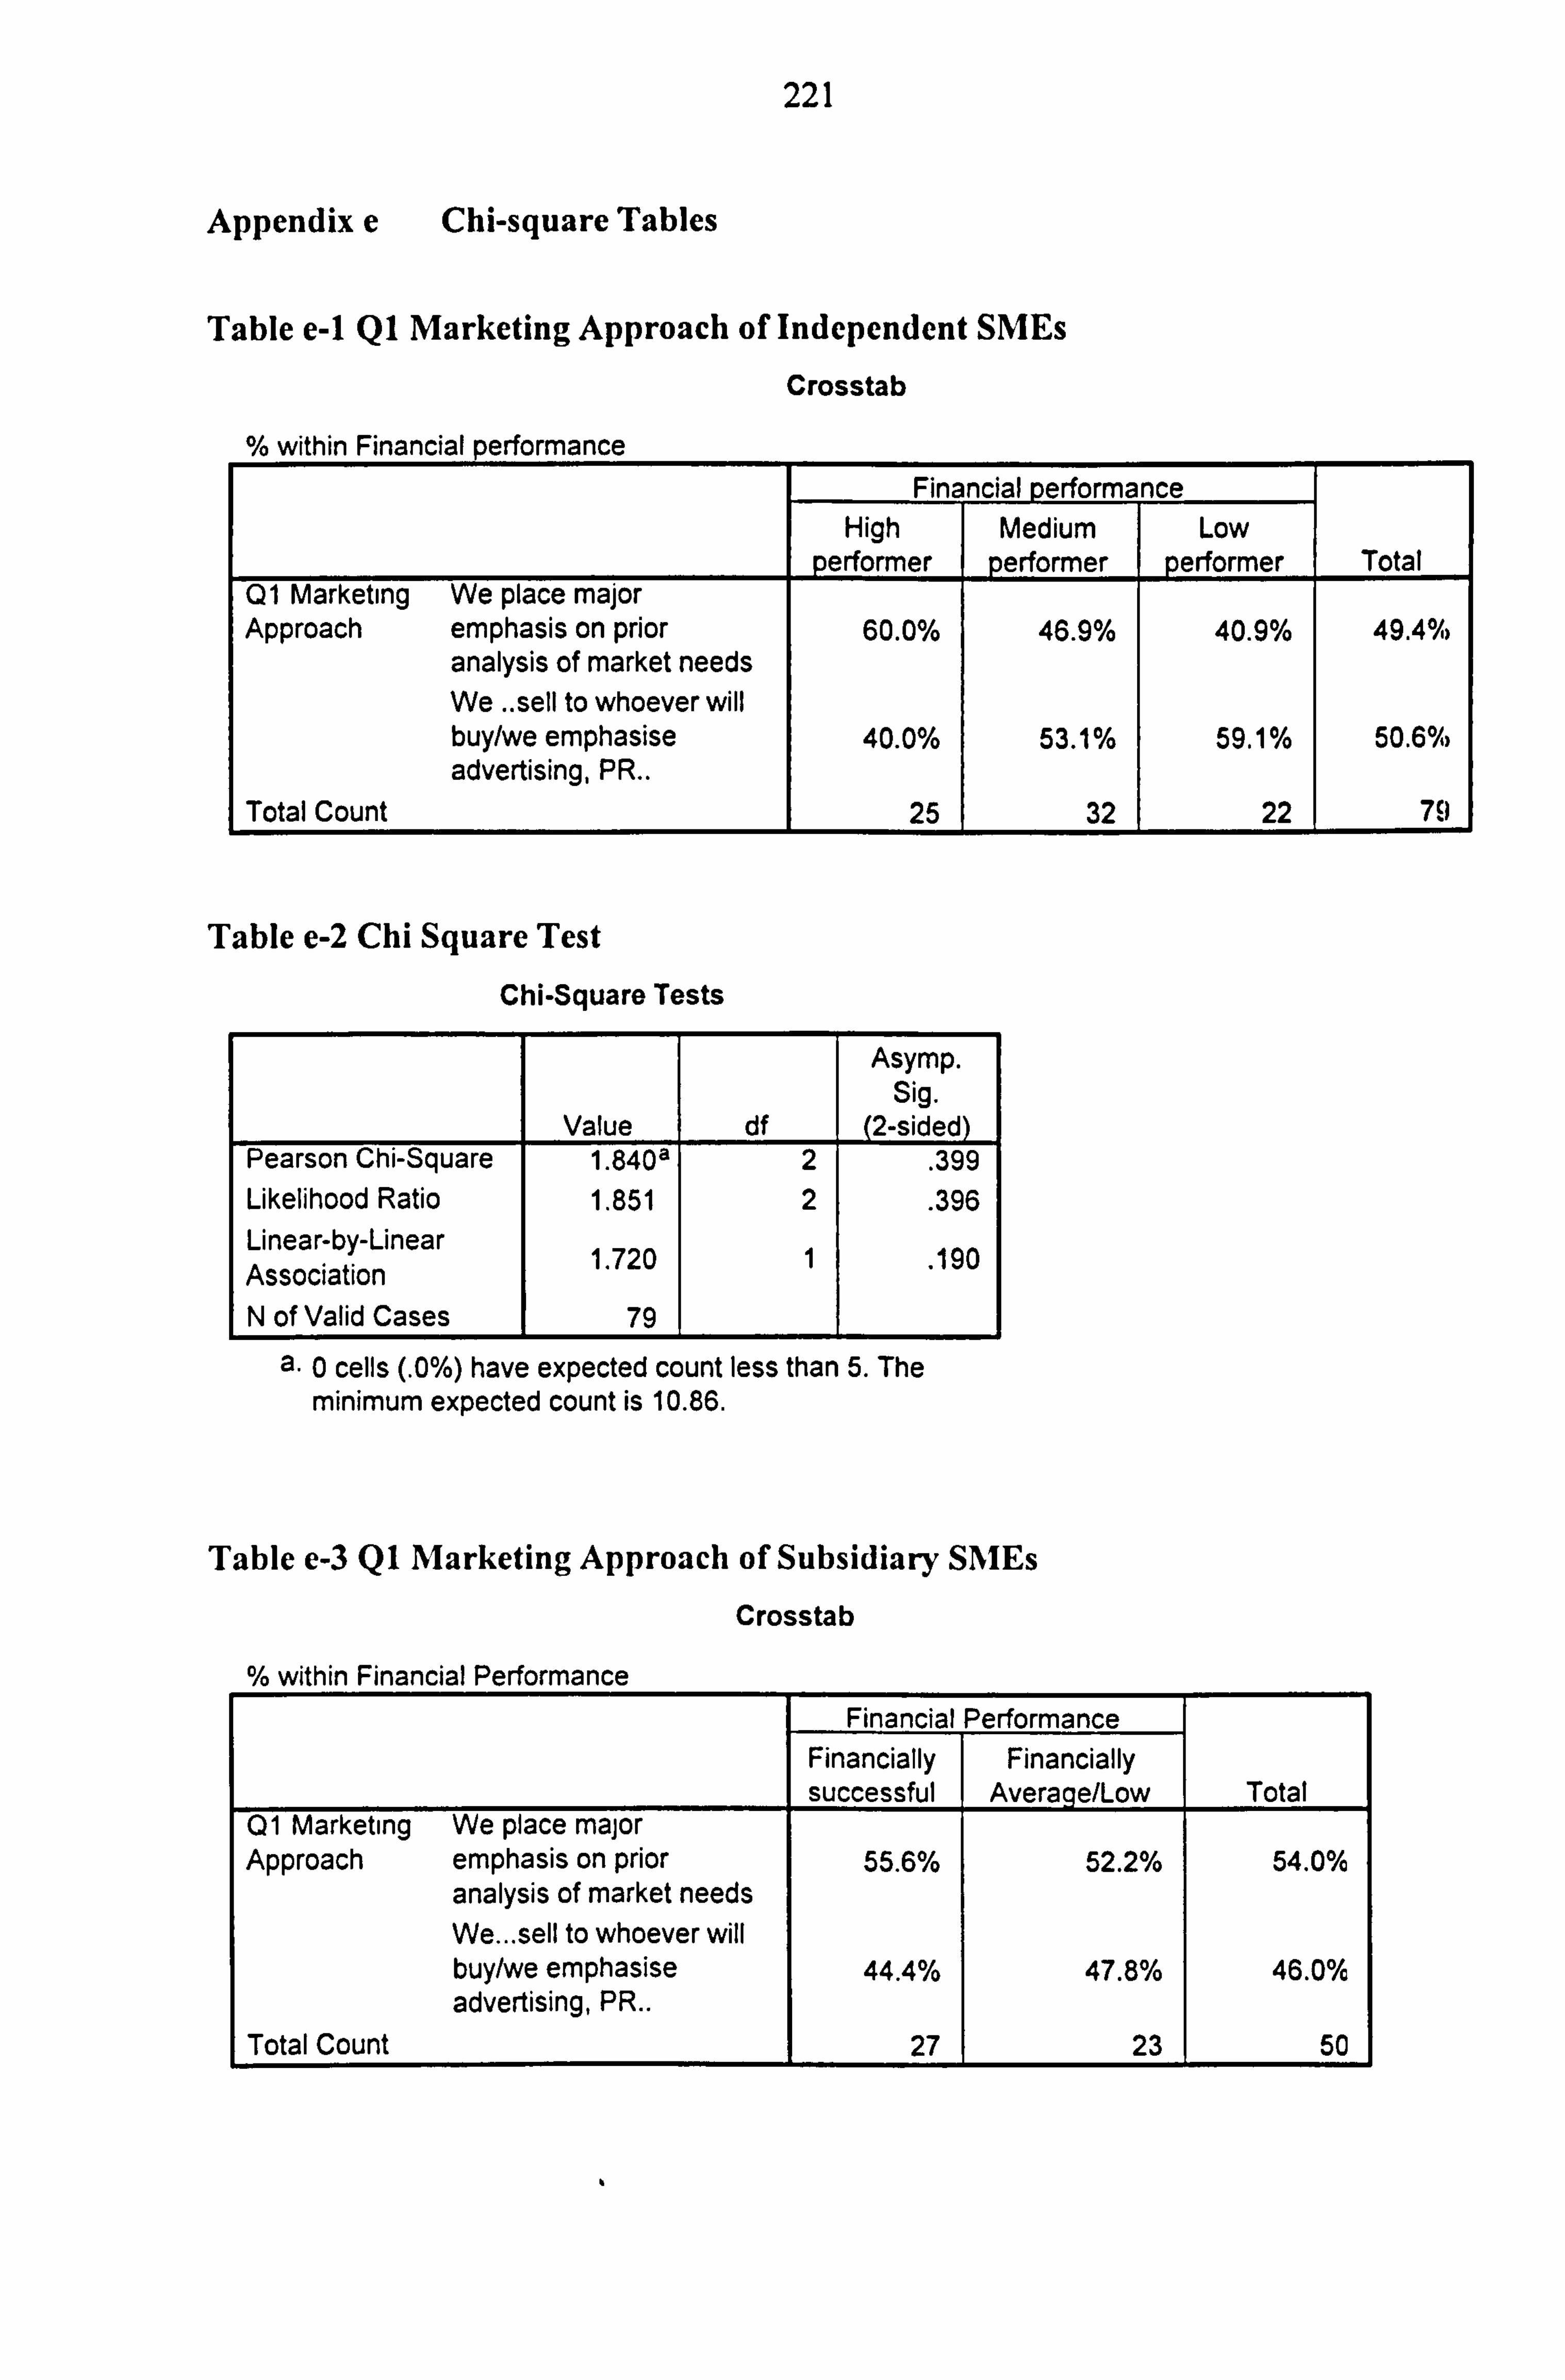
221
Appendix e Chi-square Tables
Table e-1 Q1 Marketing Approach of Independent SMEs
Crosstab
% within Financial performance Financial erformance
High Medium Low performer performer performer Total
Q1 Marketing We place major Approach emphasis on prior 60.0% 46.9% 40.9% 49.4%>
analysis of market needs We.. sell to whoever will buy/we emphasise 40.0% 53.1% 59.1% 50.6%% advertising, PR..
Total Count 25 32 22 79
Table e-2 Chi Square Test
Chi-Square Tests
Asymp. Sig.
Value df (2-sided) Pearson Chi-Square 1.840a 2 . 399 Likelihood Ratio 1.851 2
. 396 Linear-by-Linear Association 1.720 1 . 190
N of Valid Cases 79
a. 0 cells (. 0%) have expected count less than 5. The minimum expected count is 10.86.
Table e-3 Q1 Marketing Approach of Subsidiary SMEs
Crosstab
% within Financial Performance Financial Performance
Financially Financially successful Average/Low Total
Q1 Marketing We place major Approach emphasis on prior 55.6% 52.2% 54.0%
analysis of market needs We... sell to whoever will buy/we emphasise 44.4% 47.8% 46.0% advertising, PR..
Total Count 27 23 50
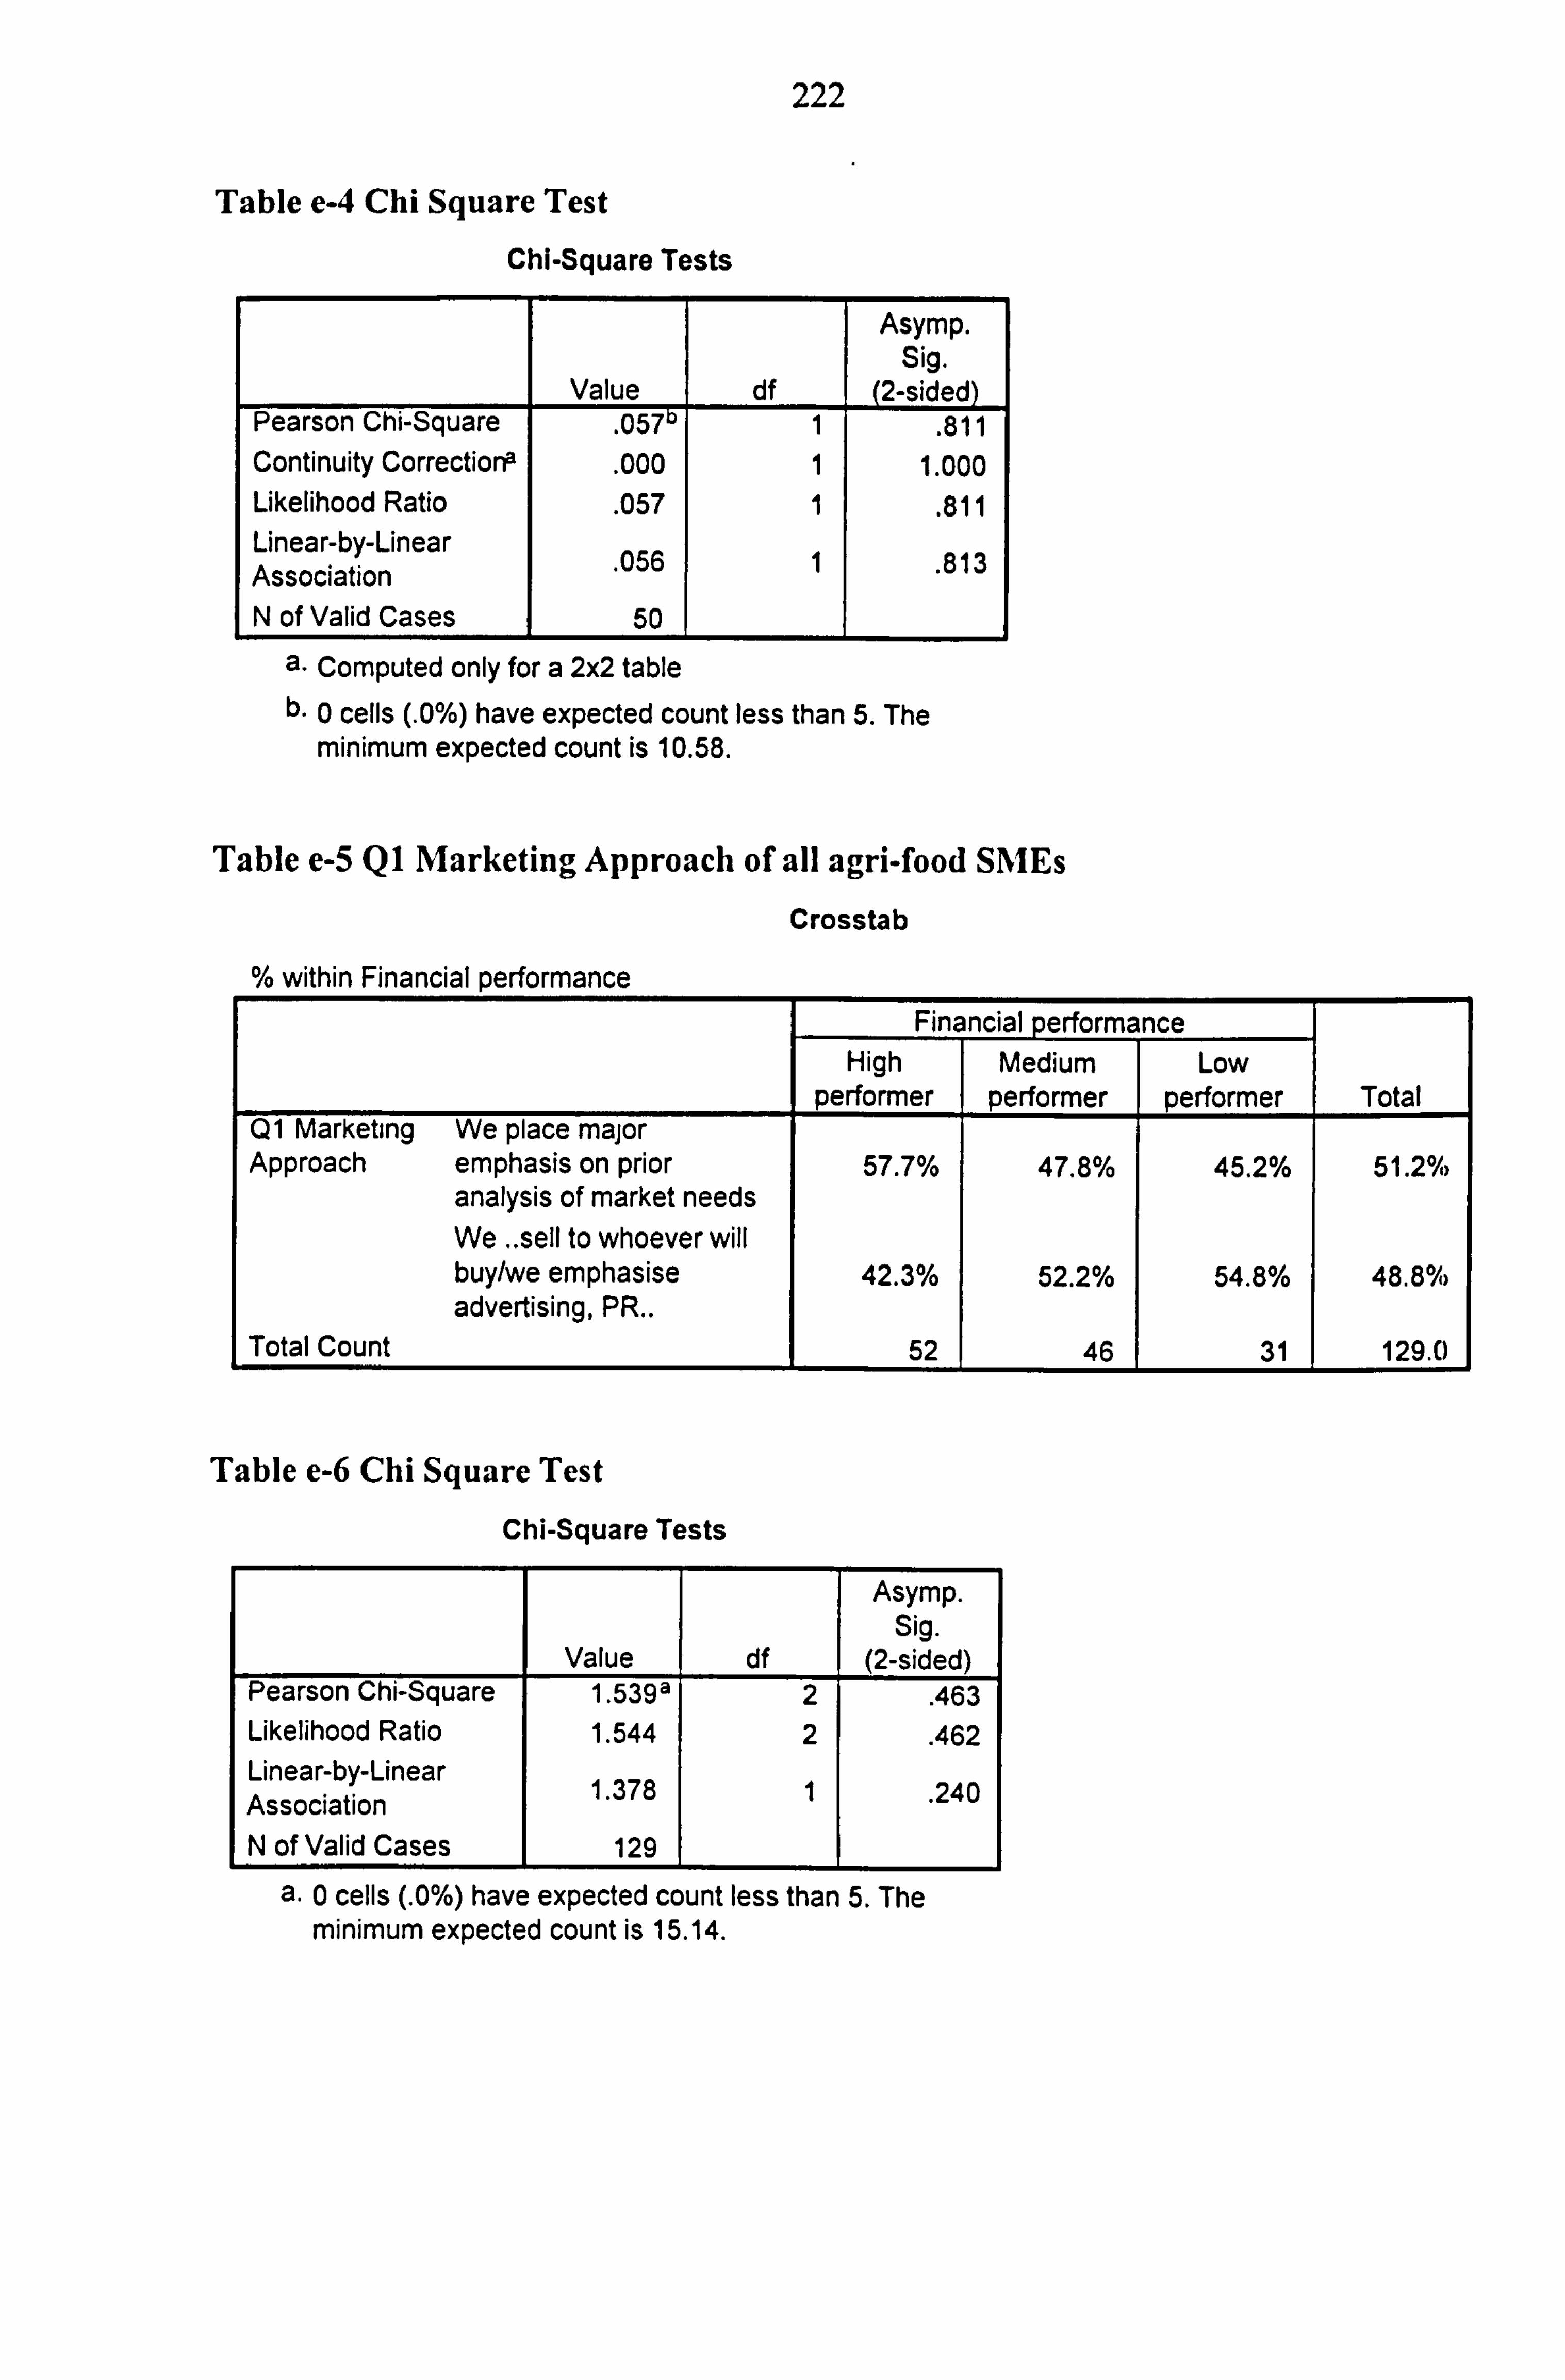
222
Table e-4 Chi Square Test
Chi-Square Tests
Value df
Asymp. Sig.
(2-sided) Pearson Chi-Square
. 057 1 . 811 Continuity Corrections
. 000 1 1.000 Likelihood Ratio
. 057 1 . 811 Linear-by-Linear Association . 056 1
. 813
N of Valid Cases 50
a. Computed only for a 2x2 table b. 0 cells (. 0%) have expected count less than 5. The
minimum expected count is 10.58.
Table e-5 Q1 Marketing Approach of all agri-food SMEs
Crosstab
within Financial performance Financial performance
High Medium Low performer performer performer Total
Q1 Marketing We place major Approach emphasis on prior 57.7% 47.8% 45.2% 51.2%
analysis of market needs We .. sell to whoever will buy/we emphasise 42.3% 52.2% 54.8% 48.8% advertising, PR..
Total Count 52 46 31 129.0
Table e-6 Chi Square Test
Chi-Square Tests
Asymp. Sig.
Value df (2-sided) Pearson Chi-Square 1.539a 2 . 463 Likelihood Ratio 1.544 2 . 462 Linear-by-Linear Association 1.378 1 . 240
N of Valid Cases 129
a. 0 cells (. 0%) have expected count less than 5. The minimum expected count is 15.14.
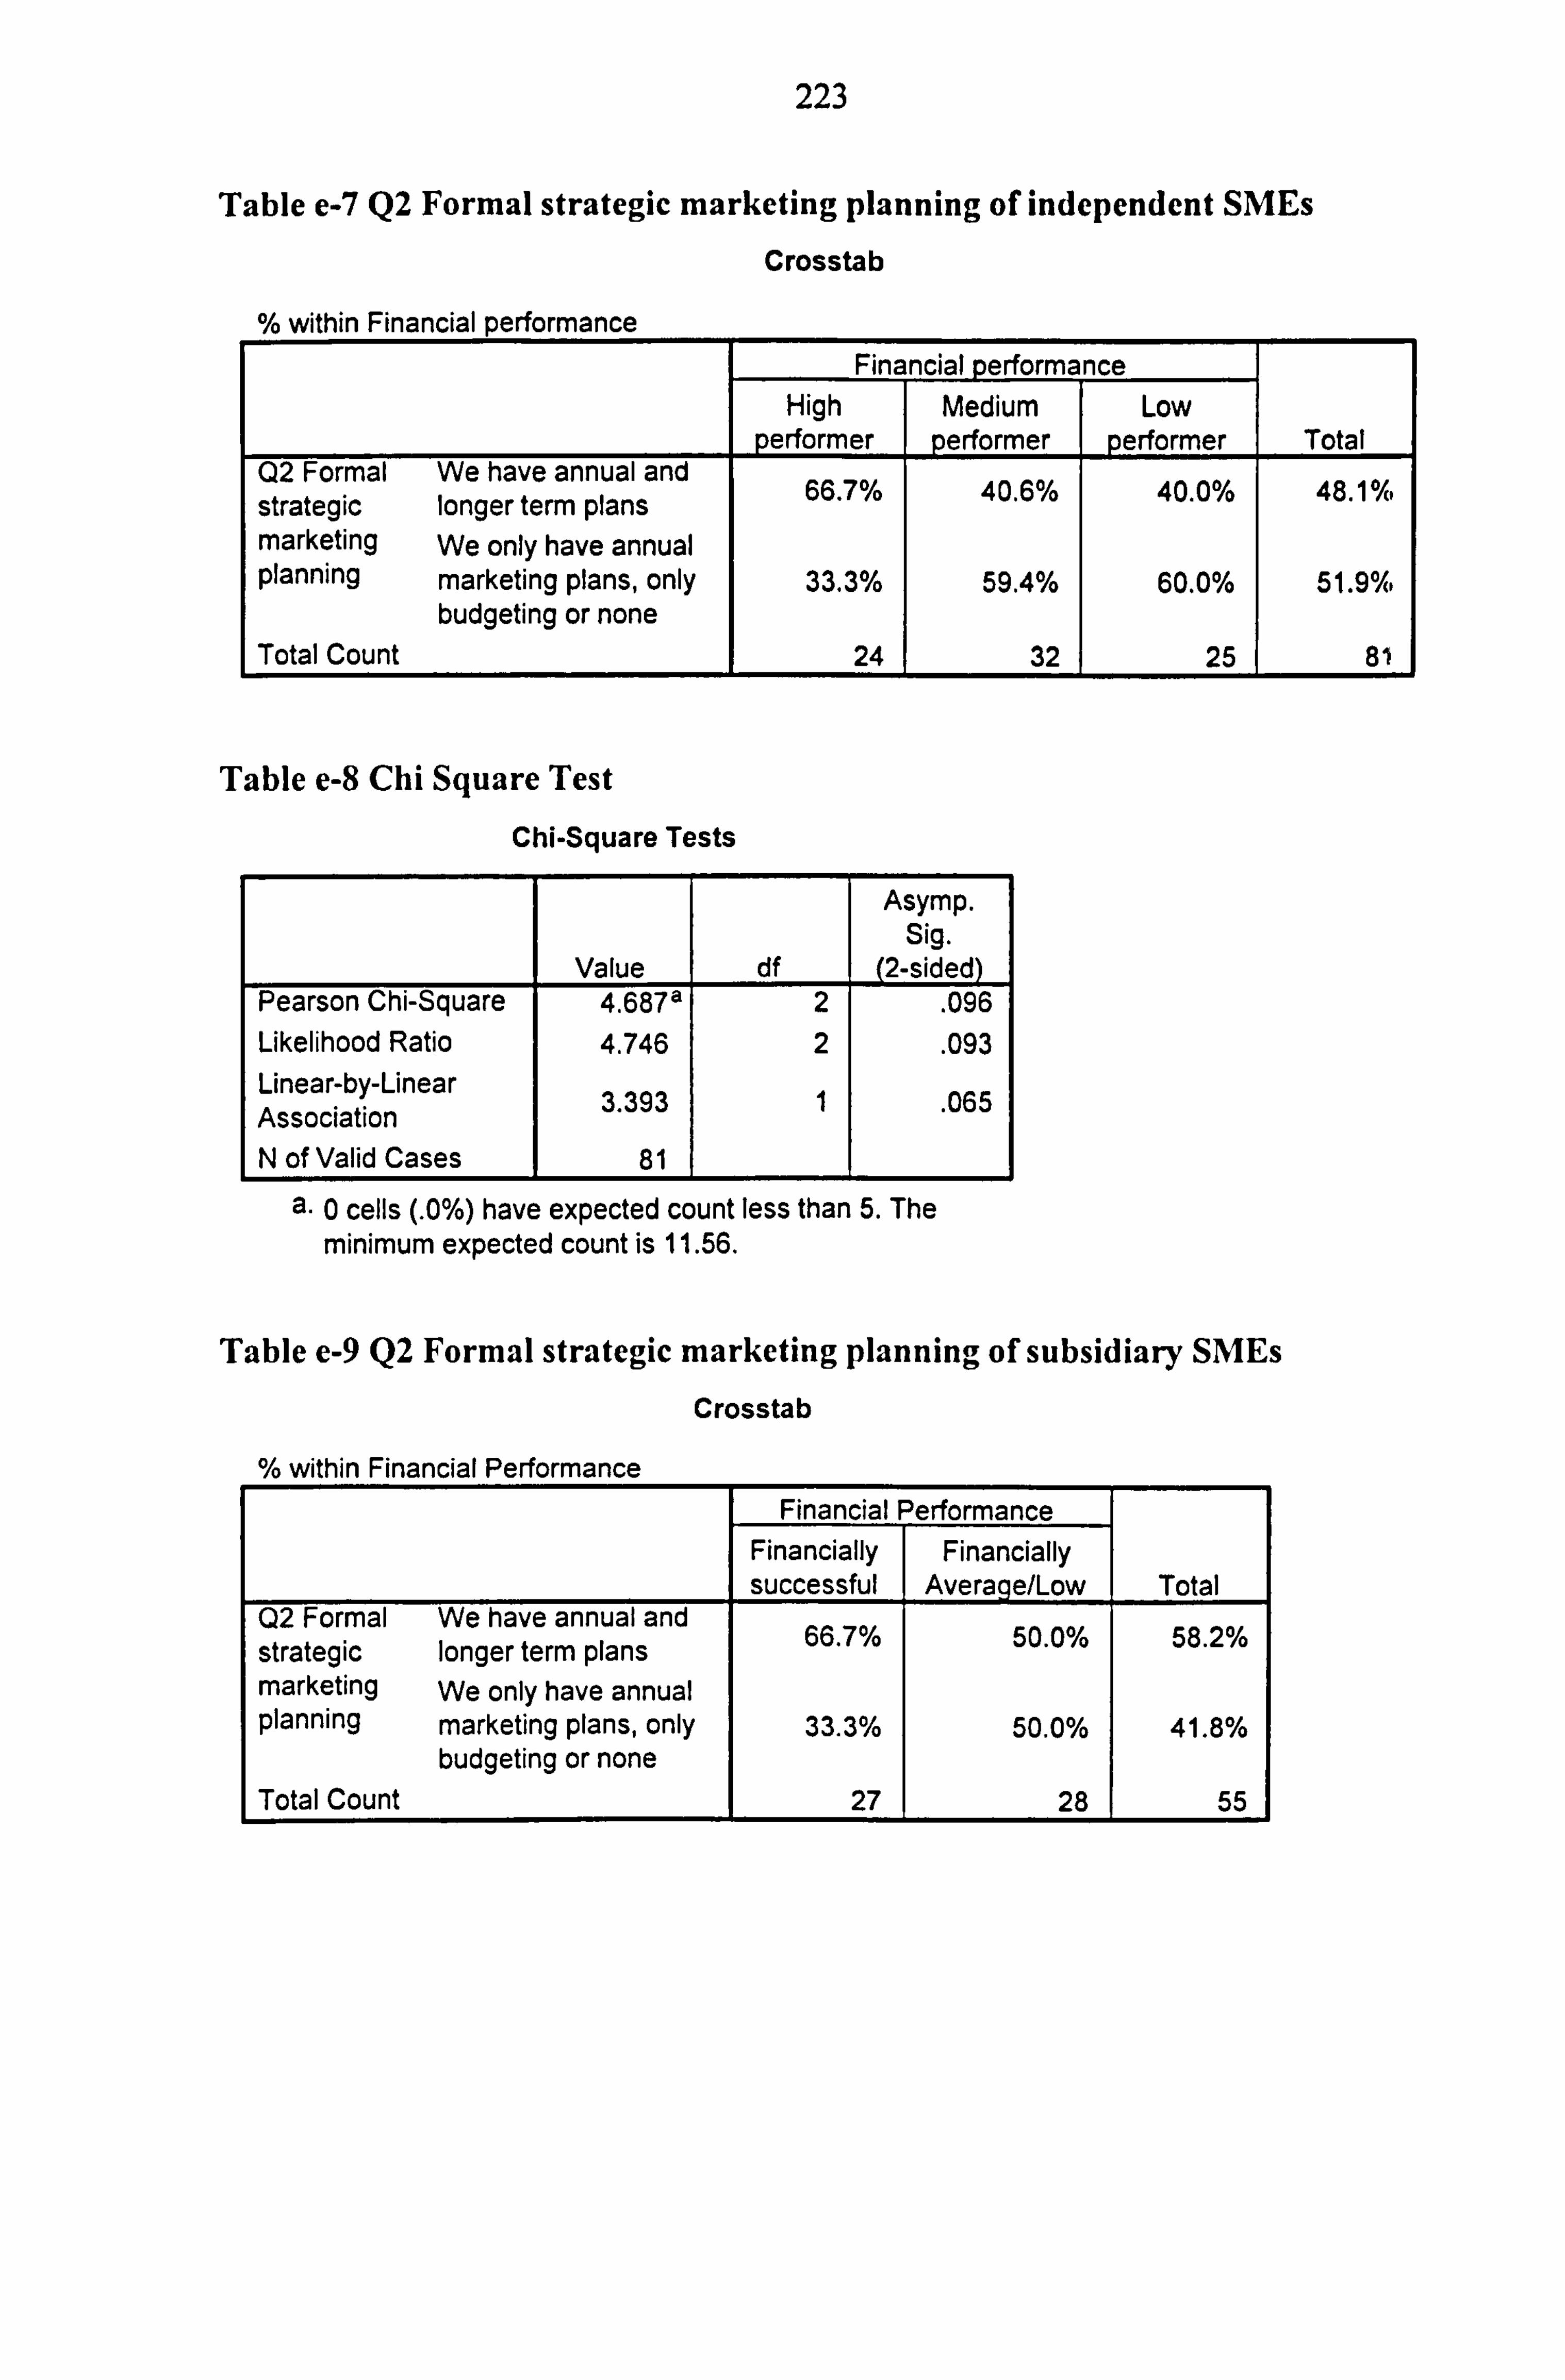
223
Table e-7 Q2 Formal strategic marketing planning of independent SMEs
Crosstab
within Financial performance Financial performance
High Medium Low performer performer performer Total
Q2 Formal We have annual and 7% 66 40 6% 40 0% 48 1%, strategic longer term plans . . . . marketing We only have annual planning marketing plans, only 33.3% 59.4% 60.0% 51.90%
budgeting or none Total Count 24 32 25 81
Table e-8 Chi Square Test
Chi-Square Tests
Asymp. Sig.
Value df (2-sided) Pearson Chi-Square 4.687a 2 . 096 Likelihood Ratio 4.746 2 . 093 Linear-by-Linear Association 3.393 1 . 065
N of Valid Cases 81
a0 cells (. 0%) have expected count less than 5. The minimum expected count is 11.56.
Table e-9 Q2 Formal strategic marketing planning of subsidiary SMEs
Crosstab
within Financial Performance Financial Performance
Financially Financially successful Avera e/Low Total
Q2 Formal We have annual and strategic longer term plans
66.7% 50.0% 58.2%
marketing We only have annual planning marketing plans, only 33.3% 50.0% 41.8%
budgeting or none Total Count 27 28 55
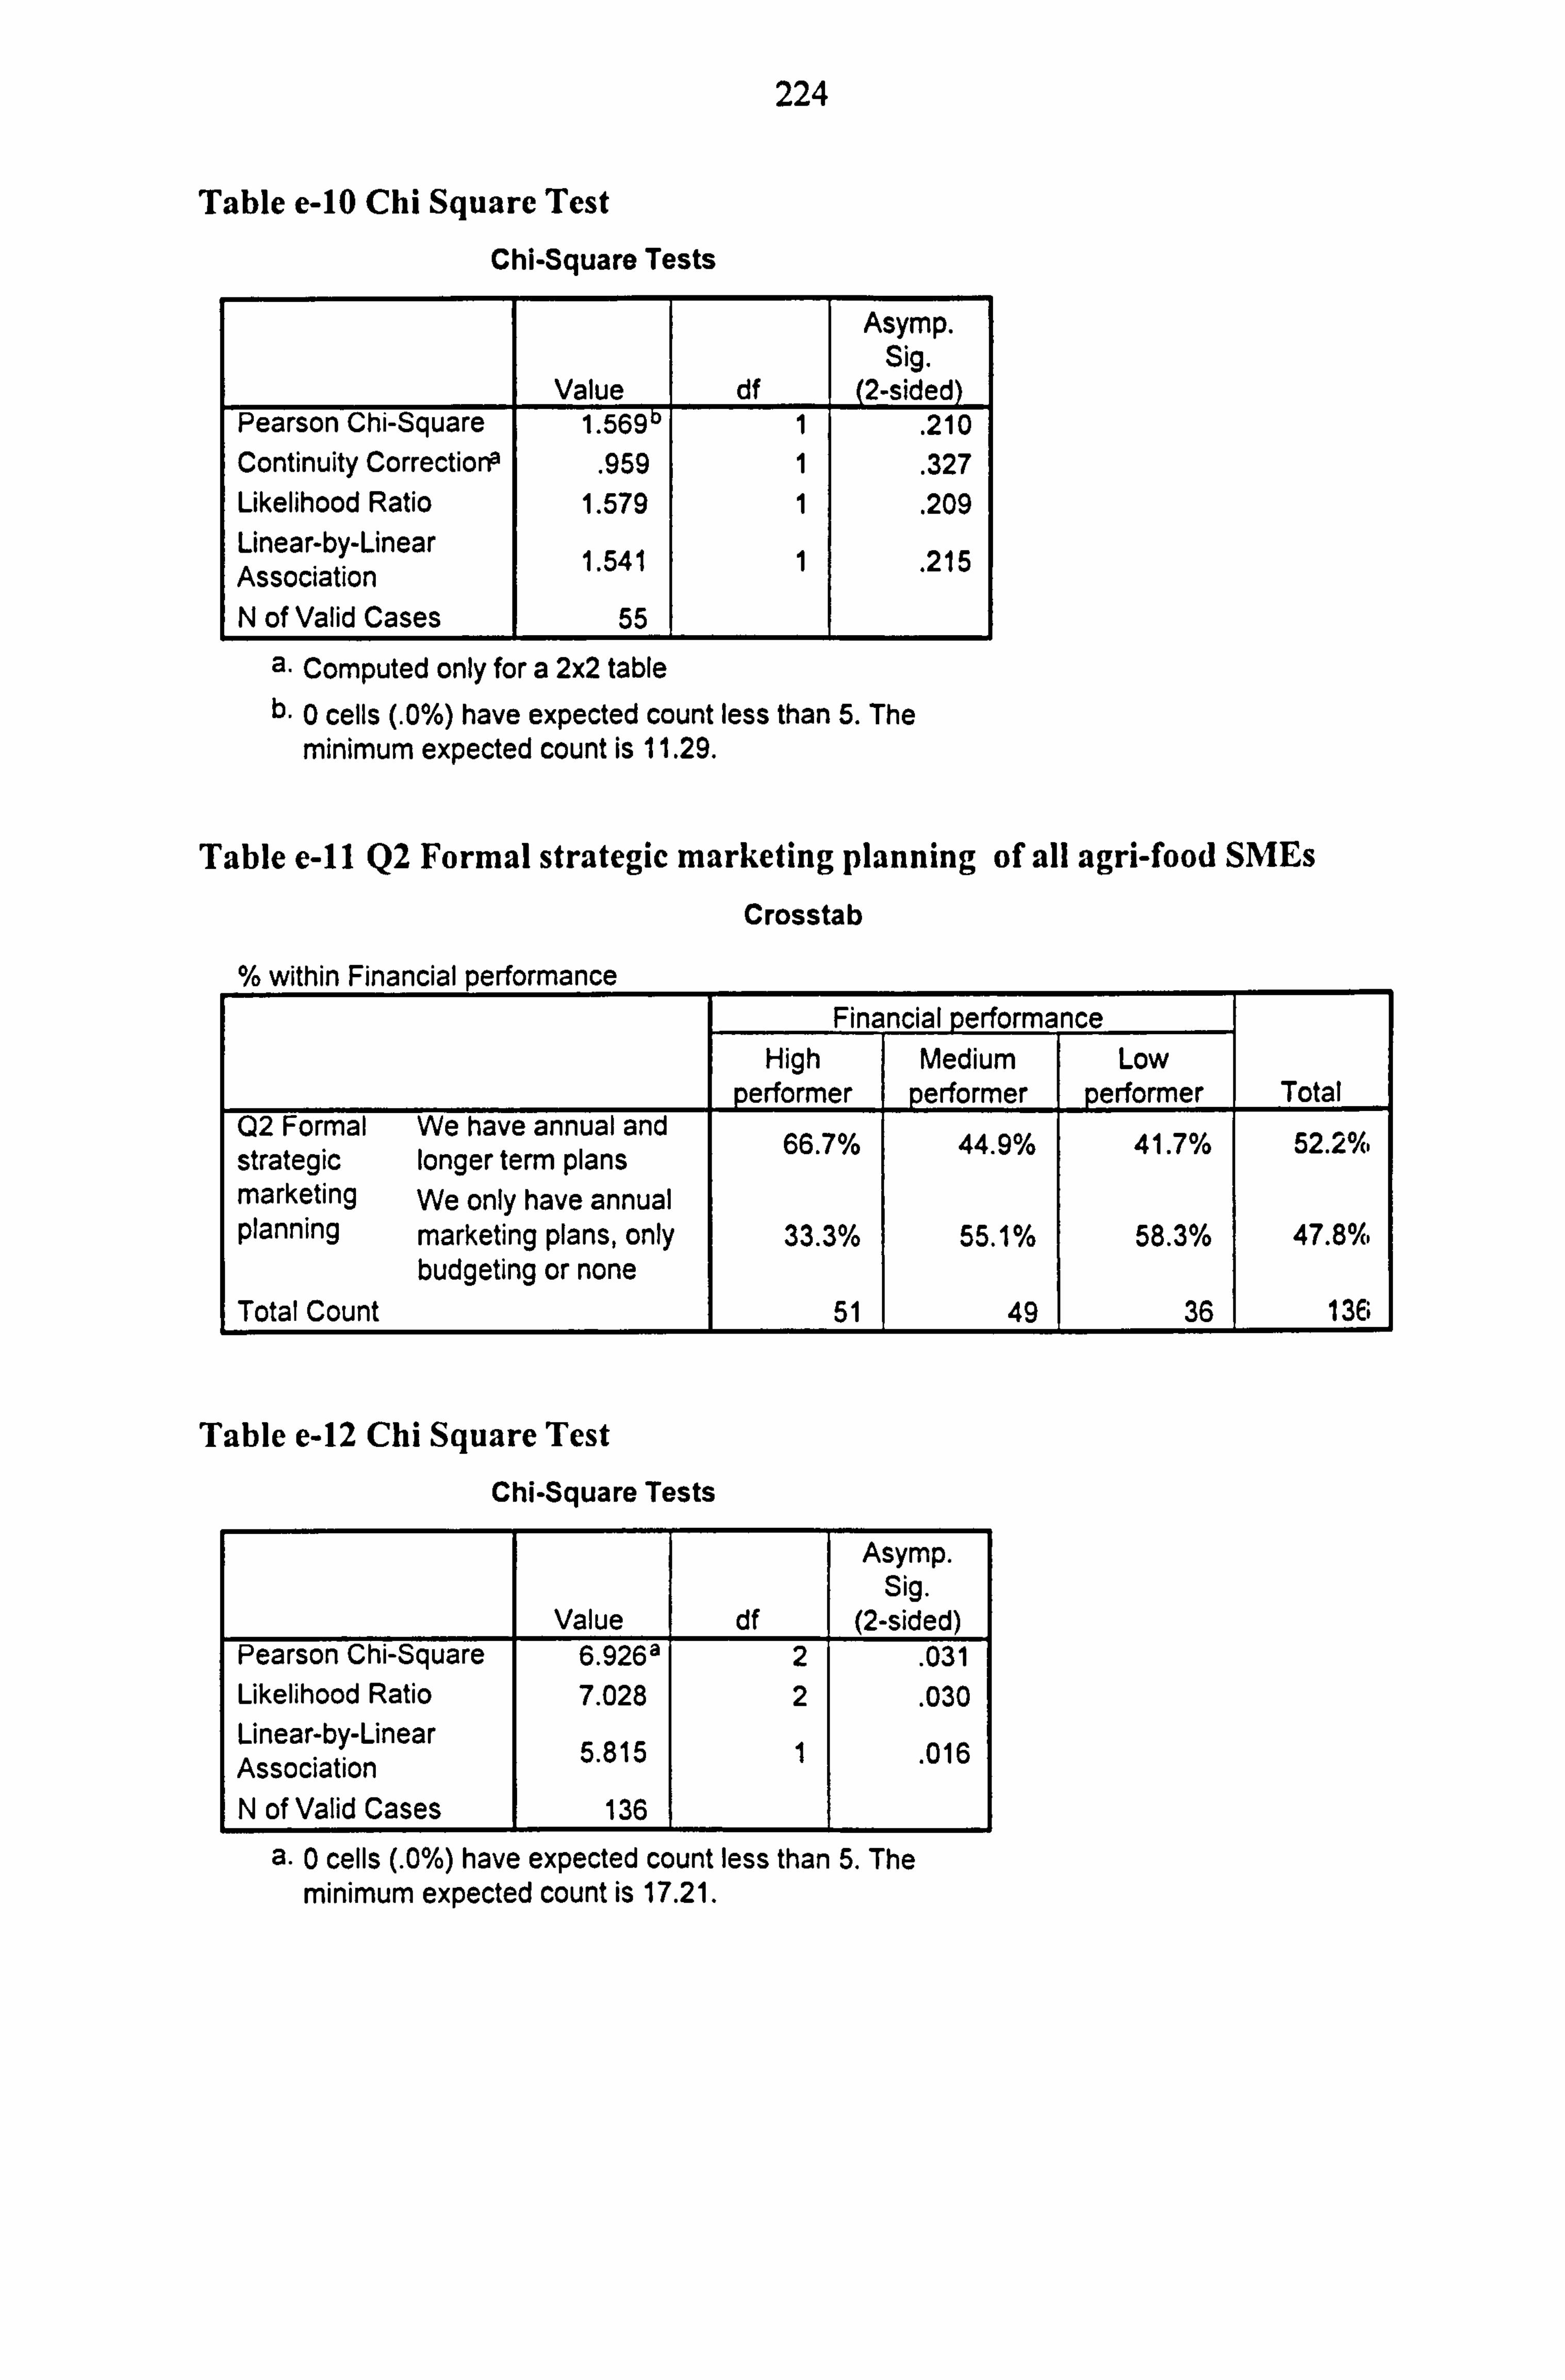
224
Table e-10 Chi Square Test
Chi-Square Tests
Value df
Asymp. Sig.
(2-sided) Pearson Chi-Square 1.569 1 . 210 Continuity Corrections
. 959 1 . 327 Likelihood Ratio 1.579 1 . 209 Linear-by-Linear Association 1.541 1 . 215
N of Valid Cases 55
a. Computed only for a 2x2 table
0 cells (. 0%) have expected count less than 5. The minimum expected count is 11.29.
Table e-11 Q2 Formal strategic marketing planning of all agri-food SMEs
Crosstab
within Financial performance Financial erformance
High Medium Low erformer performer performer Total
Q2 Formal We have annual and 66 7% 44 9% 41 7% 52.2%. strategic longer term plans . . . marketing We only have annual planning marketing plans, only 33.3% 55.1% 58.3% 47.80%
budgeting or none Total Count 51 49 36 136
Table e-12 Chi Square Test Chi-Square Tests
Asymp. Sig.
Value df (2-sided) Pearson Chi-Square 6.926a 2 . 031 Likelihood Ratio 7.028 2 . 030 Linear-by-Linear Association 5.815 1 . 016
N of Valid Cases 136
0 cells (. 0%) have expected count less than 5. The minimum expected count is 17.21.
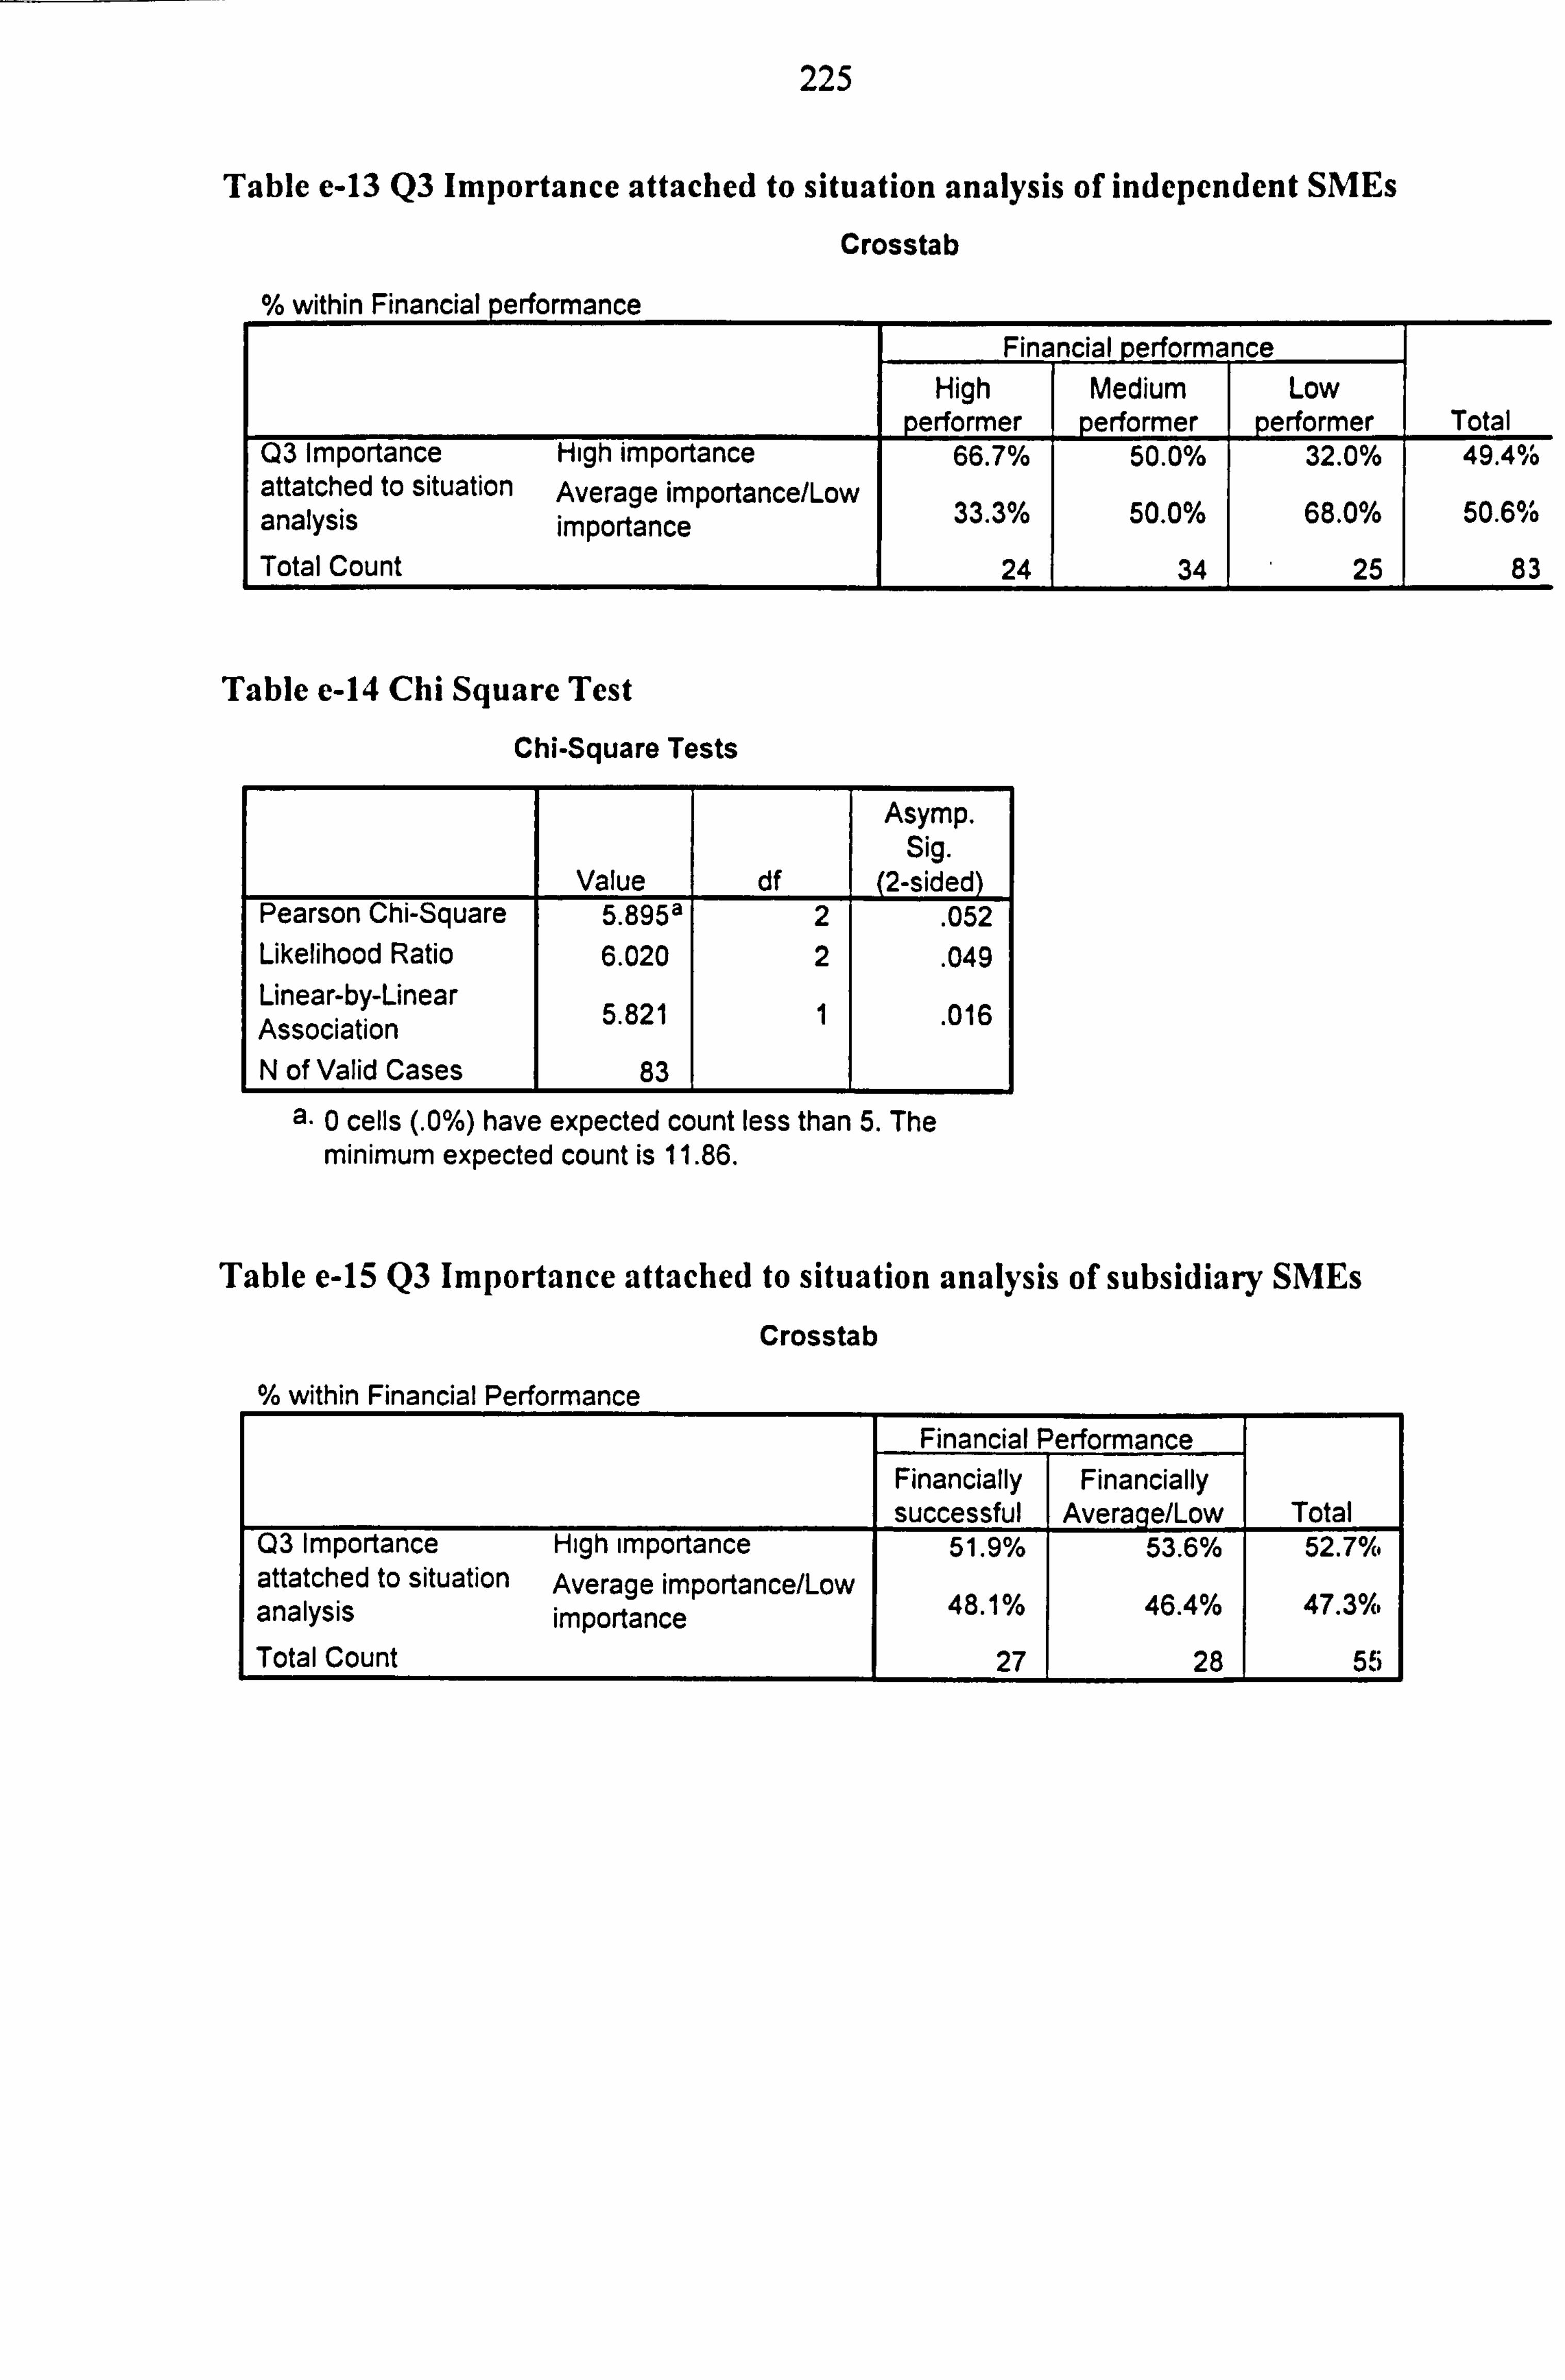
225
Table e-13 Q3 Importance attached to situation analysis of independent SMEs
Crosstab
within Financial performance Financial performance
High Medium Low performer performer performer Total
Q3 Importance High importance 66.7% 50.0% 32.0% 49.4% attatched to situation Average importance/Low
ý analysis importance o 33.3 /0 0 50.0 /0 0 68.0 /0 0 50.6 ýo Total Count 24 34 25 83
Table e-14 Chi Square Test
Chi-Square Tests
Asymp. Sig.
Value df (2-sided) Pearson Chi-Square 5.8955 2 . 052 Likelihood Ratio 6.020 2 . 049 Linear-by-Linear Association 5.821 1 . 016
N of Valid Cases 83
a. 0 cells (. 0%) have expected count less than 5. The minimum expected count is 11.86.
Table e-15 Q3 Importance attached to situation analysis of subsidiary SMEs
Crosstab
within Financial Performance Financial Performance
Financially Financially successful Average/Low Total
Q3 Importance High importance 51.9% 53.6% 52.70/6 attatched to situation Average importance/Low analysis importance 48.1% 46.4% 47.3%.
Total Count 27 28 55
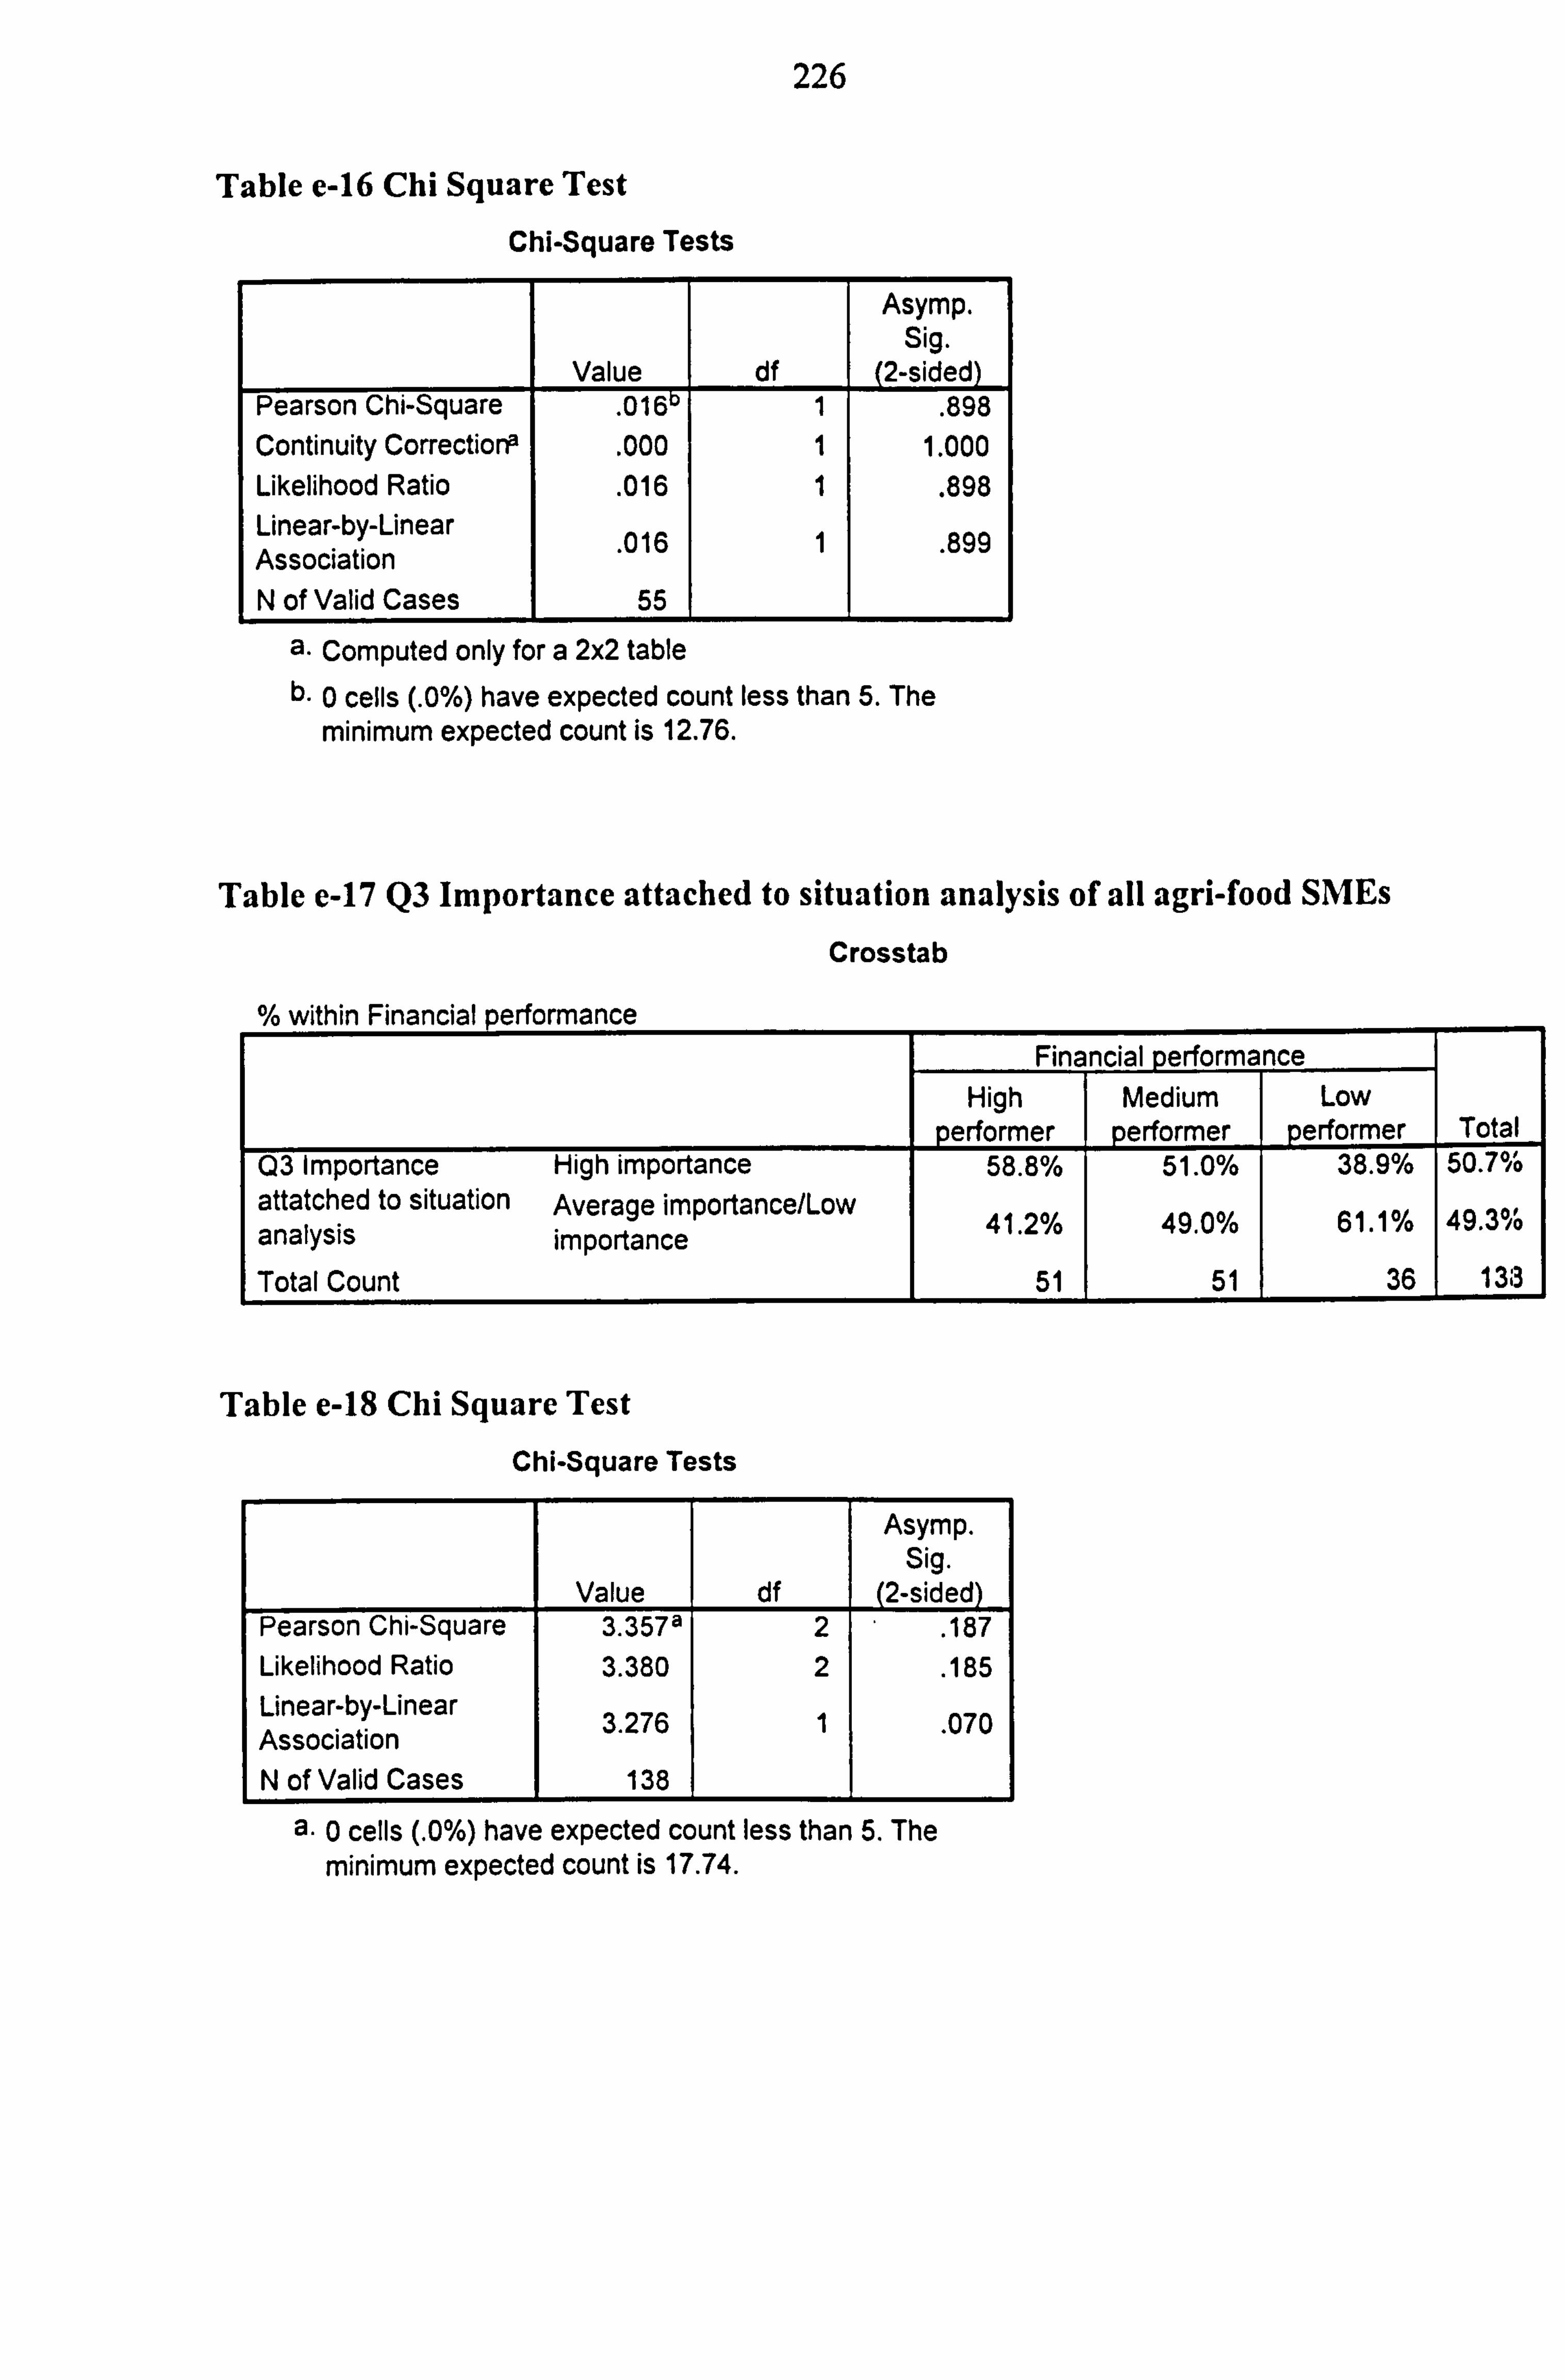
226
Table e-16 Chi Square Test
Chi-Square Tests
Value df
Asymp. Sig.
2-sided Pearson Chi-Square . 016 1 . 898 Continuity Correctior>a . 000 1 1.000 Likelihood Ratio . 016 1 . 898 Linear-by-Linear
. 016 1 . 899 Association N of Valid Cases 55
a. Computed only for a 2x2 table b. 0 cells (. 0%) have expected count less than 5. The
minimum expected count is 12.76.
Table e-17 Q3 Importance attached to situation analysis of all agri-food SMEs
Crosstab
within Financial performance Financial performance
High Medium Low performer performe performer Total
Q3 Importance High importance 58.8% 51.0% 38.9% 50.7% attatched to situation Average importance/Low
o 41 2 /0 0 49 0 /0 0 1 /0 61 0ý 49.3 ýo analysis importance . . . Total Count 51 51 36 133
Table e-18 Chi Square Test
Chi-Square Tests
Asymp. Sig.
Value df (2-sided) Pearson Chi-Square 3.357a 2 . 187 Likelihood Ratio 3.380 2 . 185 Linear-by-Linear Association 3.276 1 . 070
N of Valid Cases 138
a. 0 cells (. 0%) have expected count less than 5. The minimum expected count is 17.74.
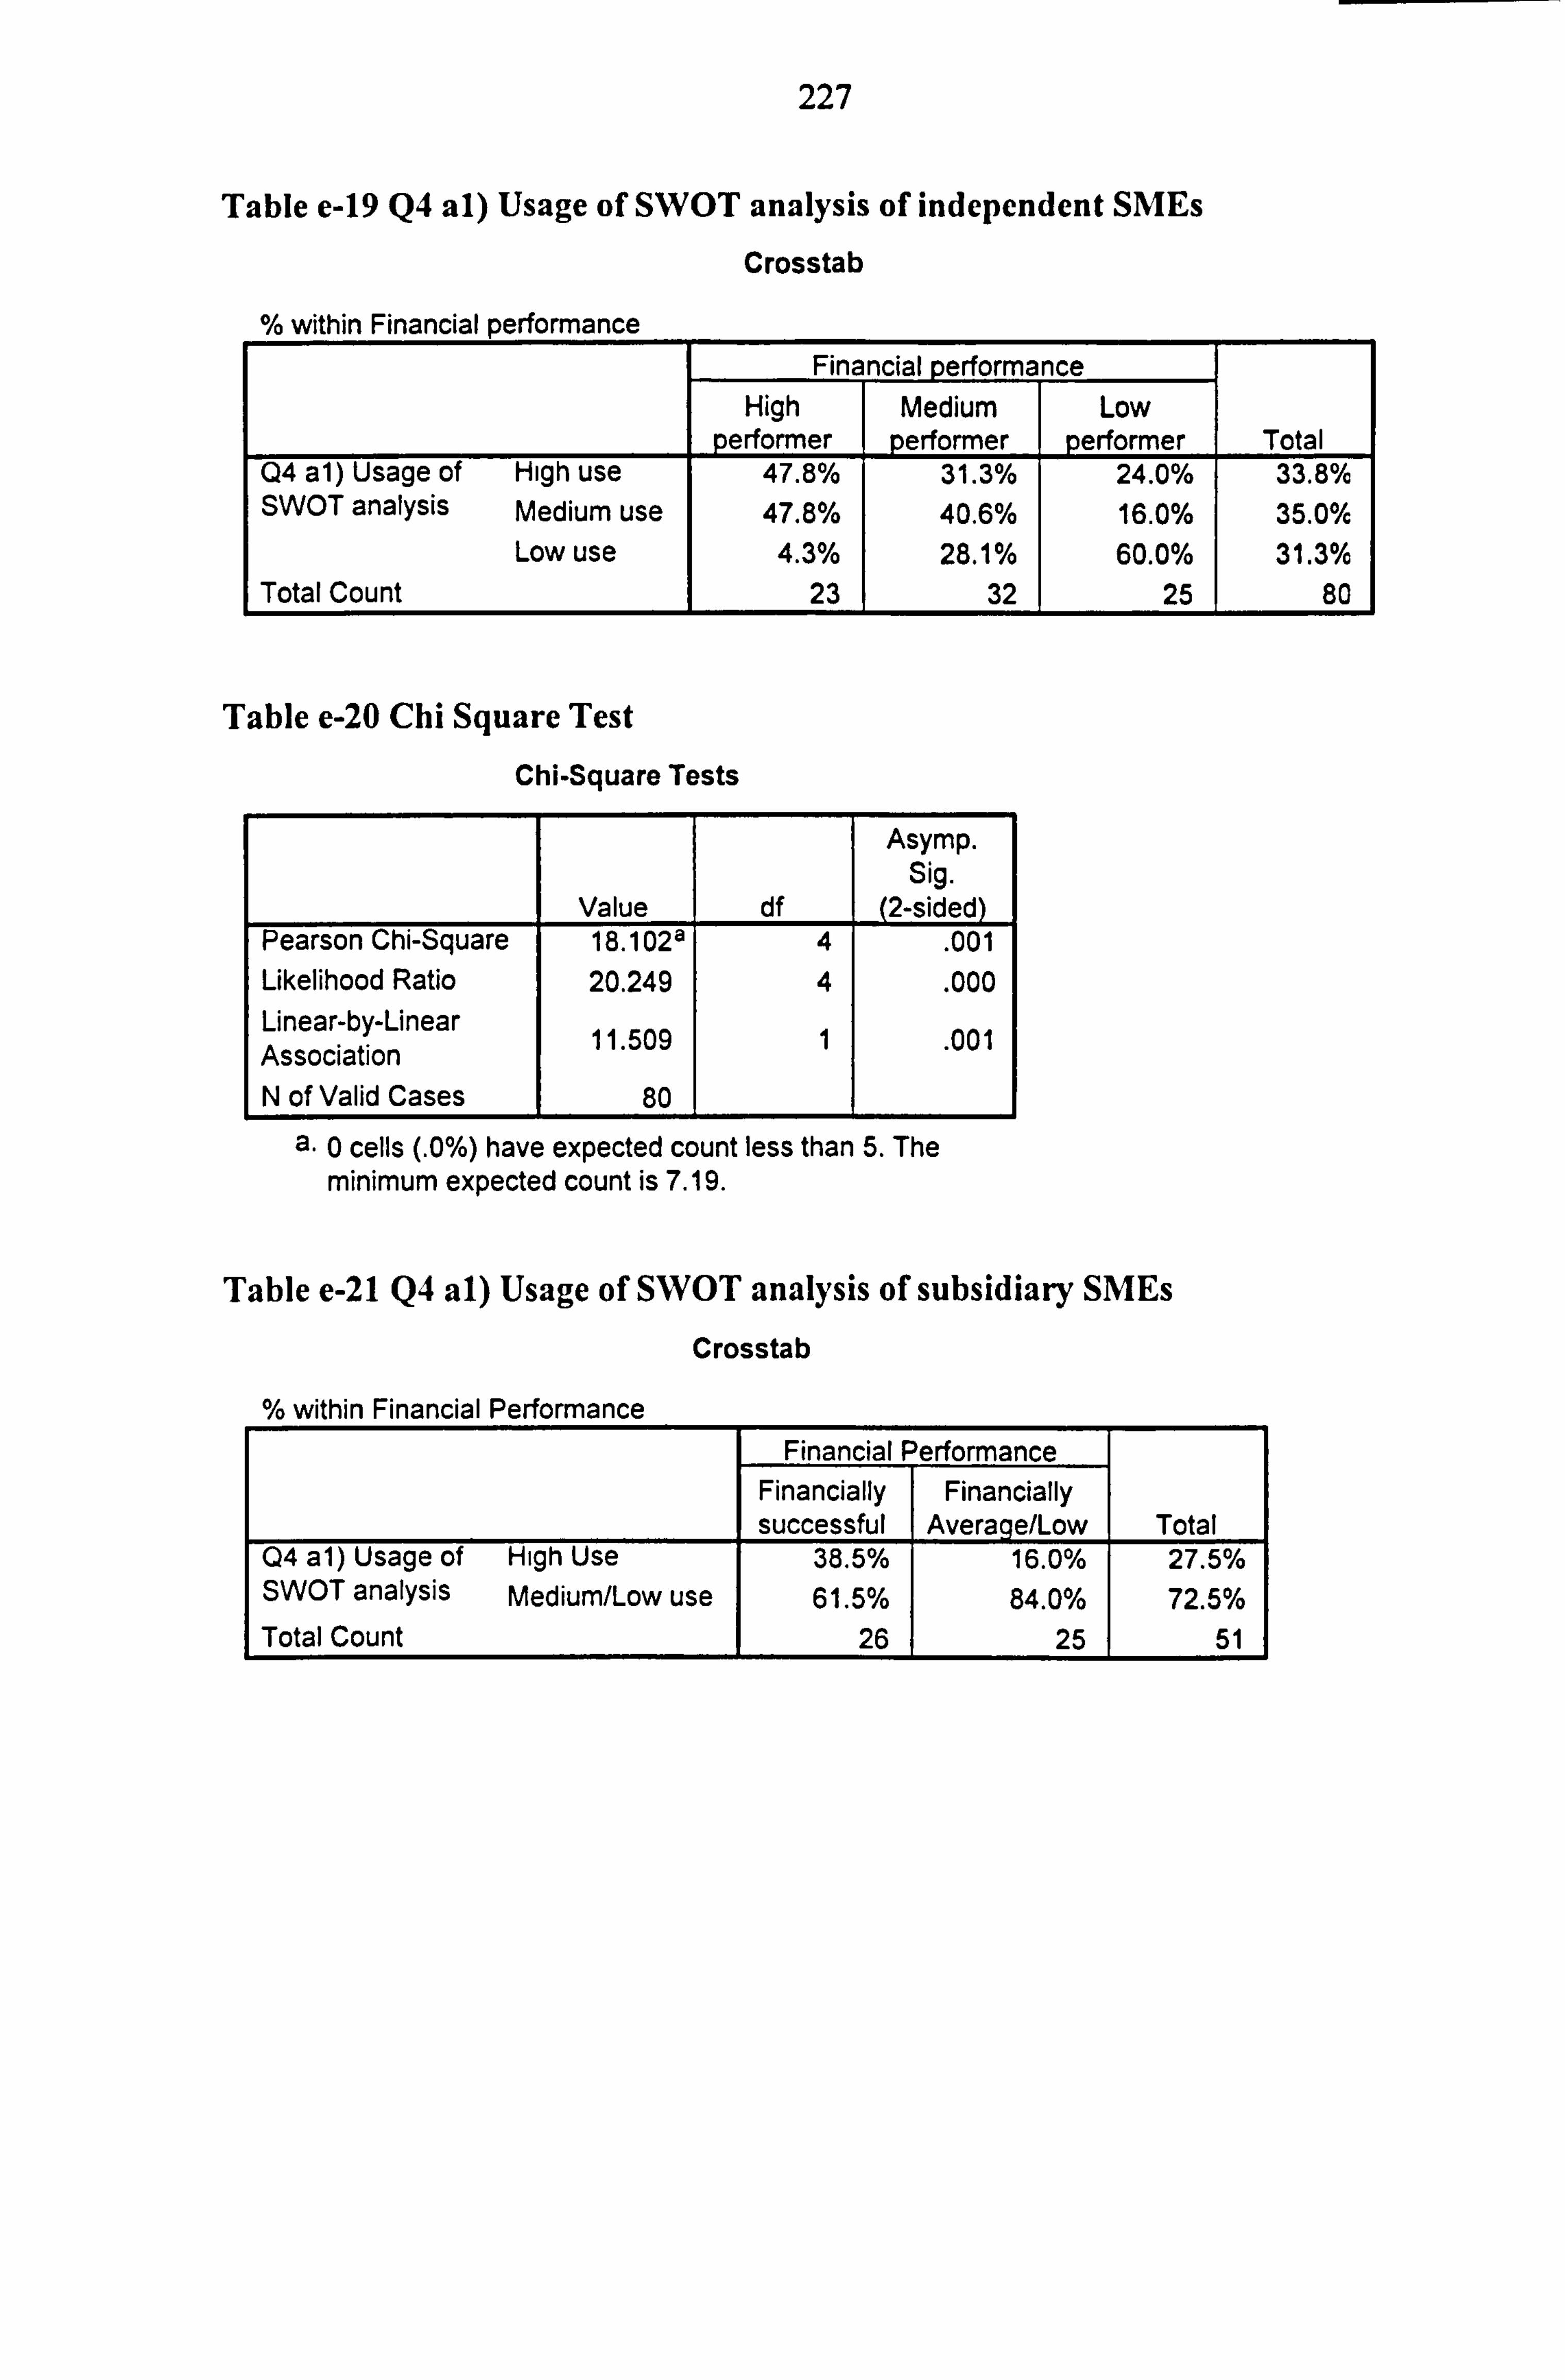
227
Table e-19 Q4 al) Usage of SWOT analysis of independent SMEs
Crosstab
% within Financial performance Financial perform nce
High Medium Low performer performer performer Total
Q4 al) Usage of High use 47.8% 31.3% 24.0% 33.8% SWOT analysis Medium use 47.8% 40.6% 16.0% 35.0%
Low use 4.3% 28.1% 60.0% 31.3% Total Count 23 32 25 80
Table e-20 Chi Square Test
Chi-Square Tests
Asymp. Sig.
Value df (2-sided) Pearson Chi-Square 18.102a 4 . 001 Likelihood Ratio 20.249 4 . 000 Linear-by-Linear Association 11.509 1 . 001
N of Valid Cases 80
a. 0 cells (. 0%) have expected count less than 5. The minimum expected count is 7.19.
Table e-21 Q4 al) Usage of SWOT analysis of subsidiary SMEs
Crosstab
% within Financial Performance Financial Performance
Financially Financially successful Avera e/Low Total
Q4 a1) Usage of High Use 38.5% 16.0% 27.5% SWOT analysis Medium/Low use 61.5% 84.0% 72.5% Total Count 26 25 51
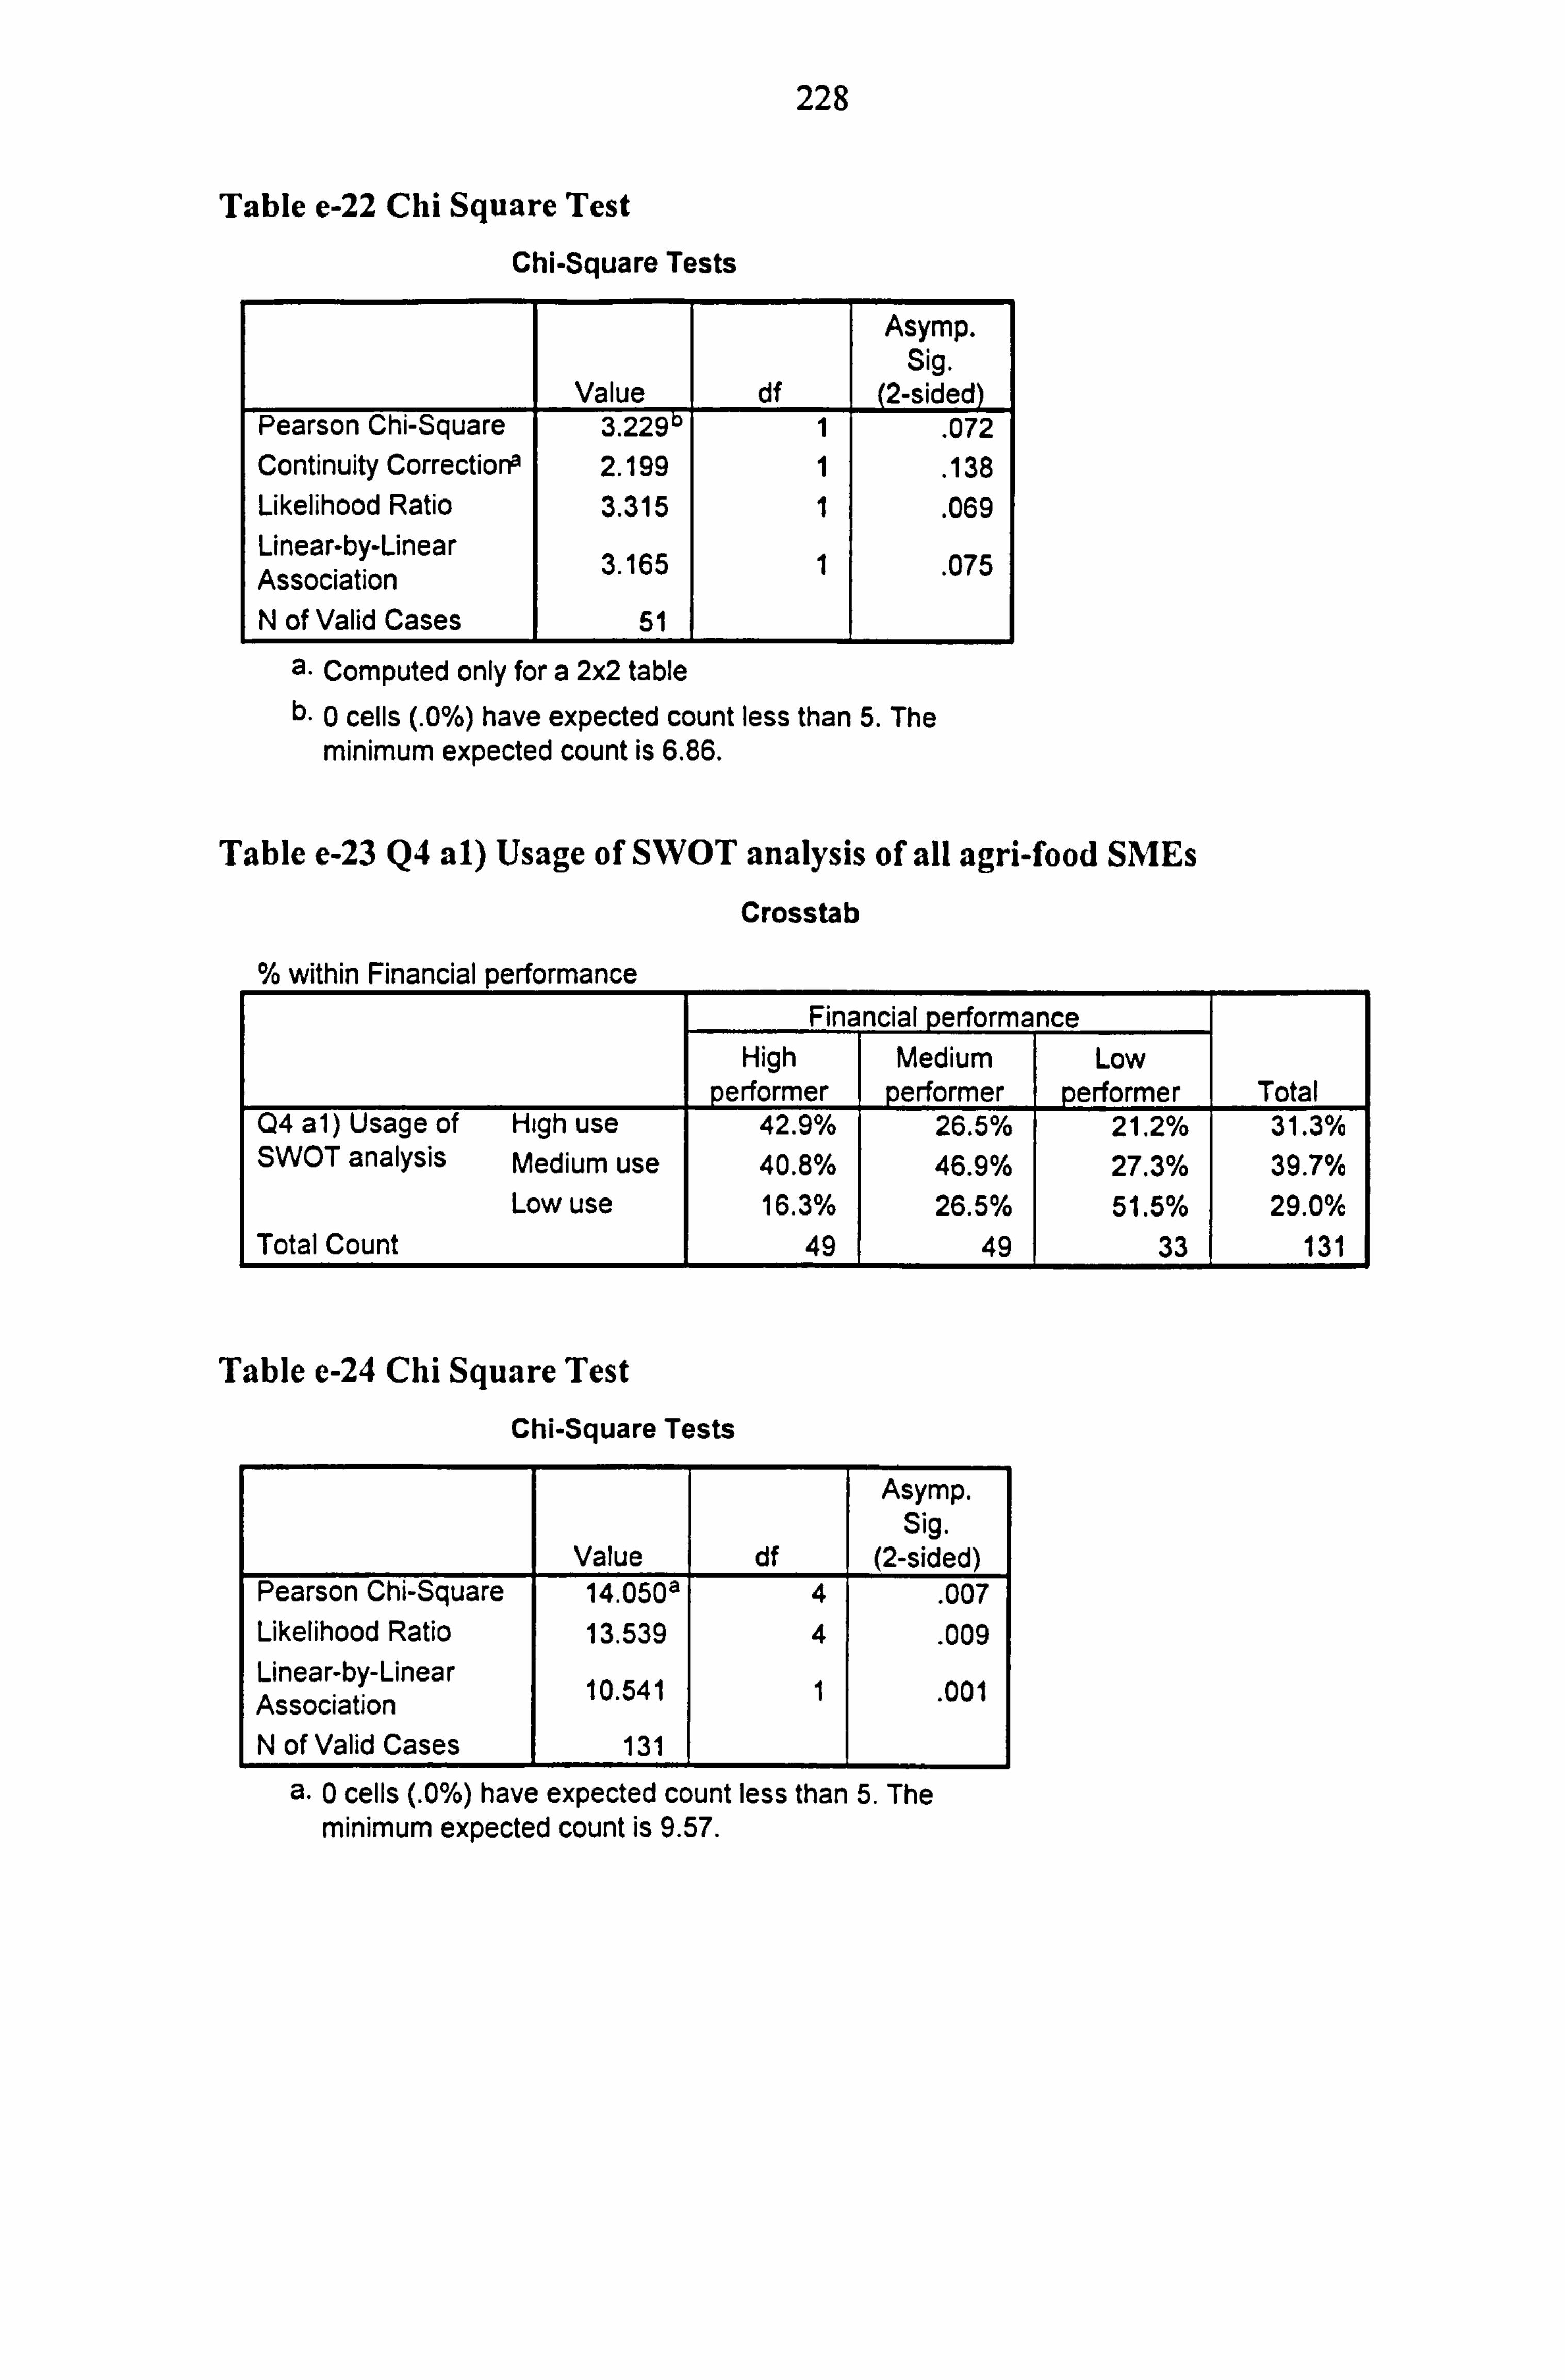
228
Table e-22 Chi Square Test
Chi-Square Tests
Value df
Asymp. Sig.
(2-sided) Pearson Chi-Square 3.229 1
. 072
Continuity Corrections 2.199 1 . 138
Likelihood Ratio 3.315 1 . 069 Linear-by-Linear Association 3.165 1 . 075
N of Valid Cases 51
a. Computed only for a 2x2 table b. 0 cells (. 0%) have expected count less than 5. The
minimum expected count is 6.86.
Table e-23 Q4 al) Usage of SWOT analysis of all agri-food SMEs
Crosstab
% within Financial performance Financial perform nce
High Medium Low performer performer performer Total
Q4 al) Usage of High use 42.9% 26.5% 21.2% 31.3°/a SWOT analysis Medium use 40.8% 46.9% 27.3% 39.70/c
Low use 16.3% 26.5% 51.5% 29.0% Total Count 49 49 33 131
Table e-24 Chi Square Test
Chi-Square Tests
Asymp. Sig.
Value df (2-sided) Pearson Chi-Square 14.050a 4 . 007 Likelihood Ratio 13.539 4 . 009 Linear-by-Linear Association 10.541 1 . 001
N of Valid Cases 131
a. 0 cells (. 0%) have expected count less than 5. The minimum expected count is 9.57.
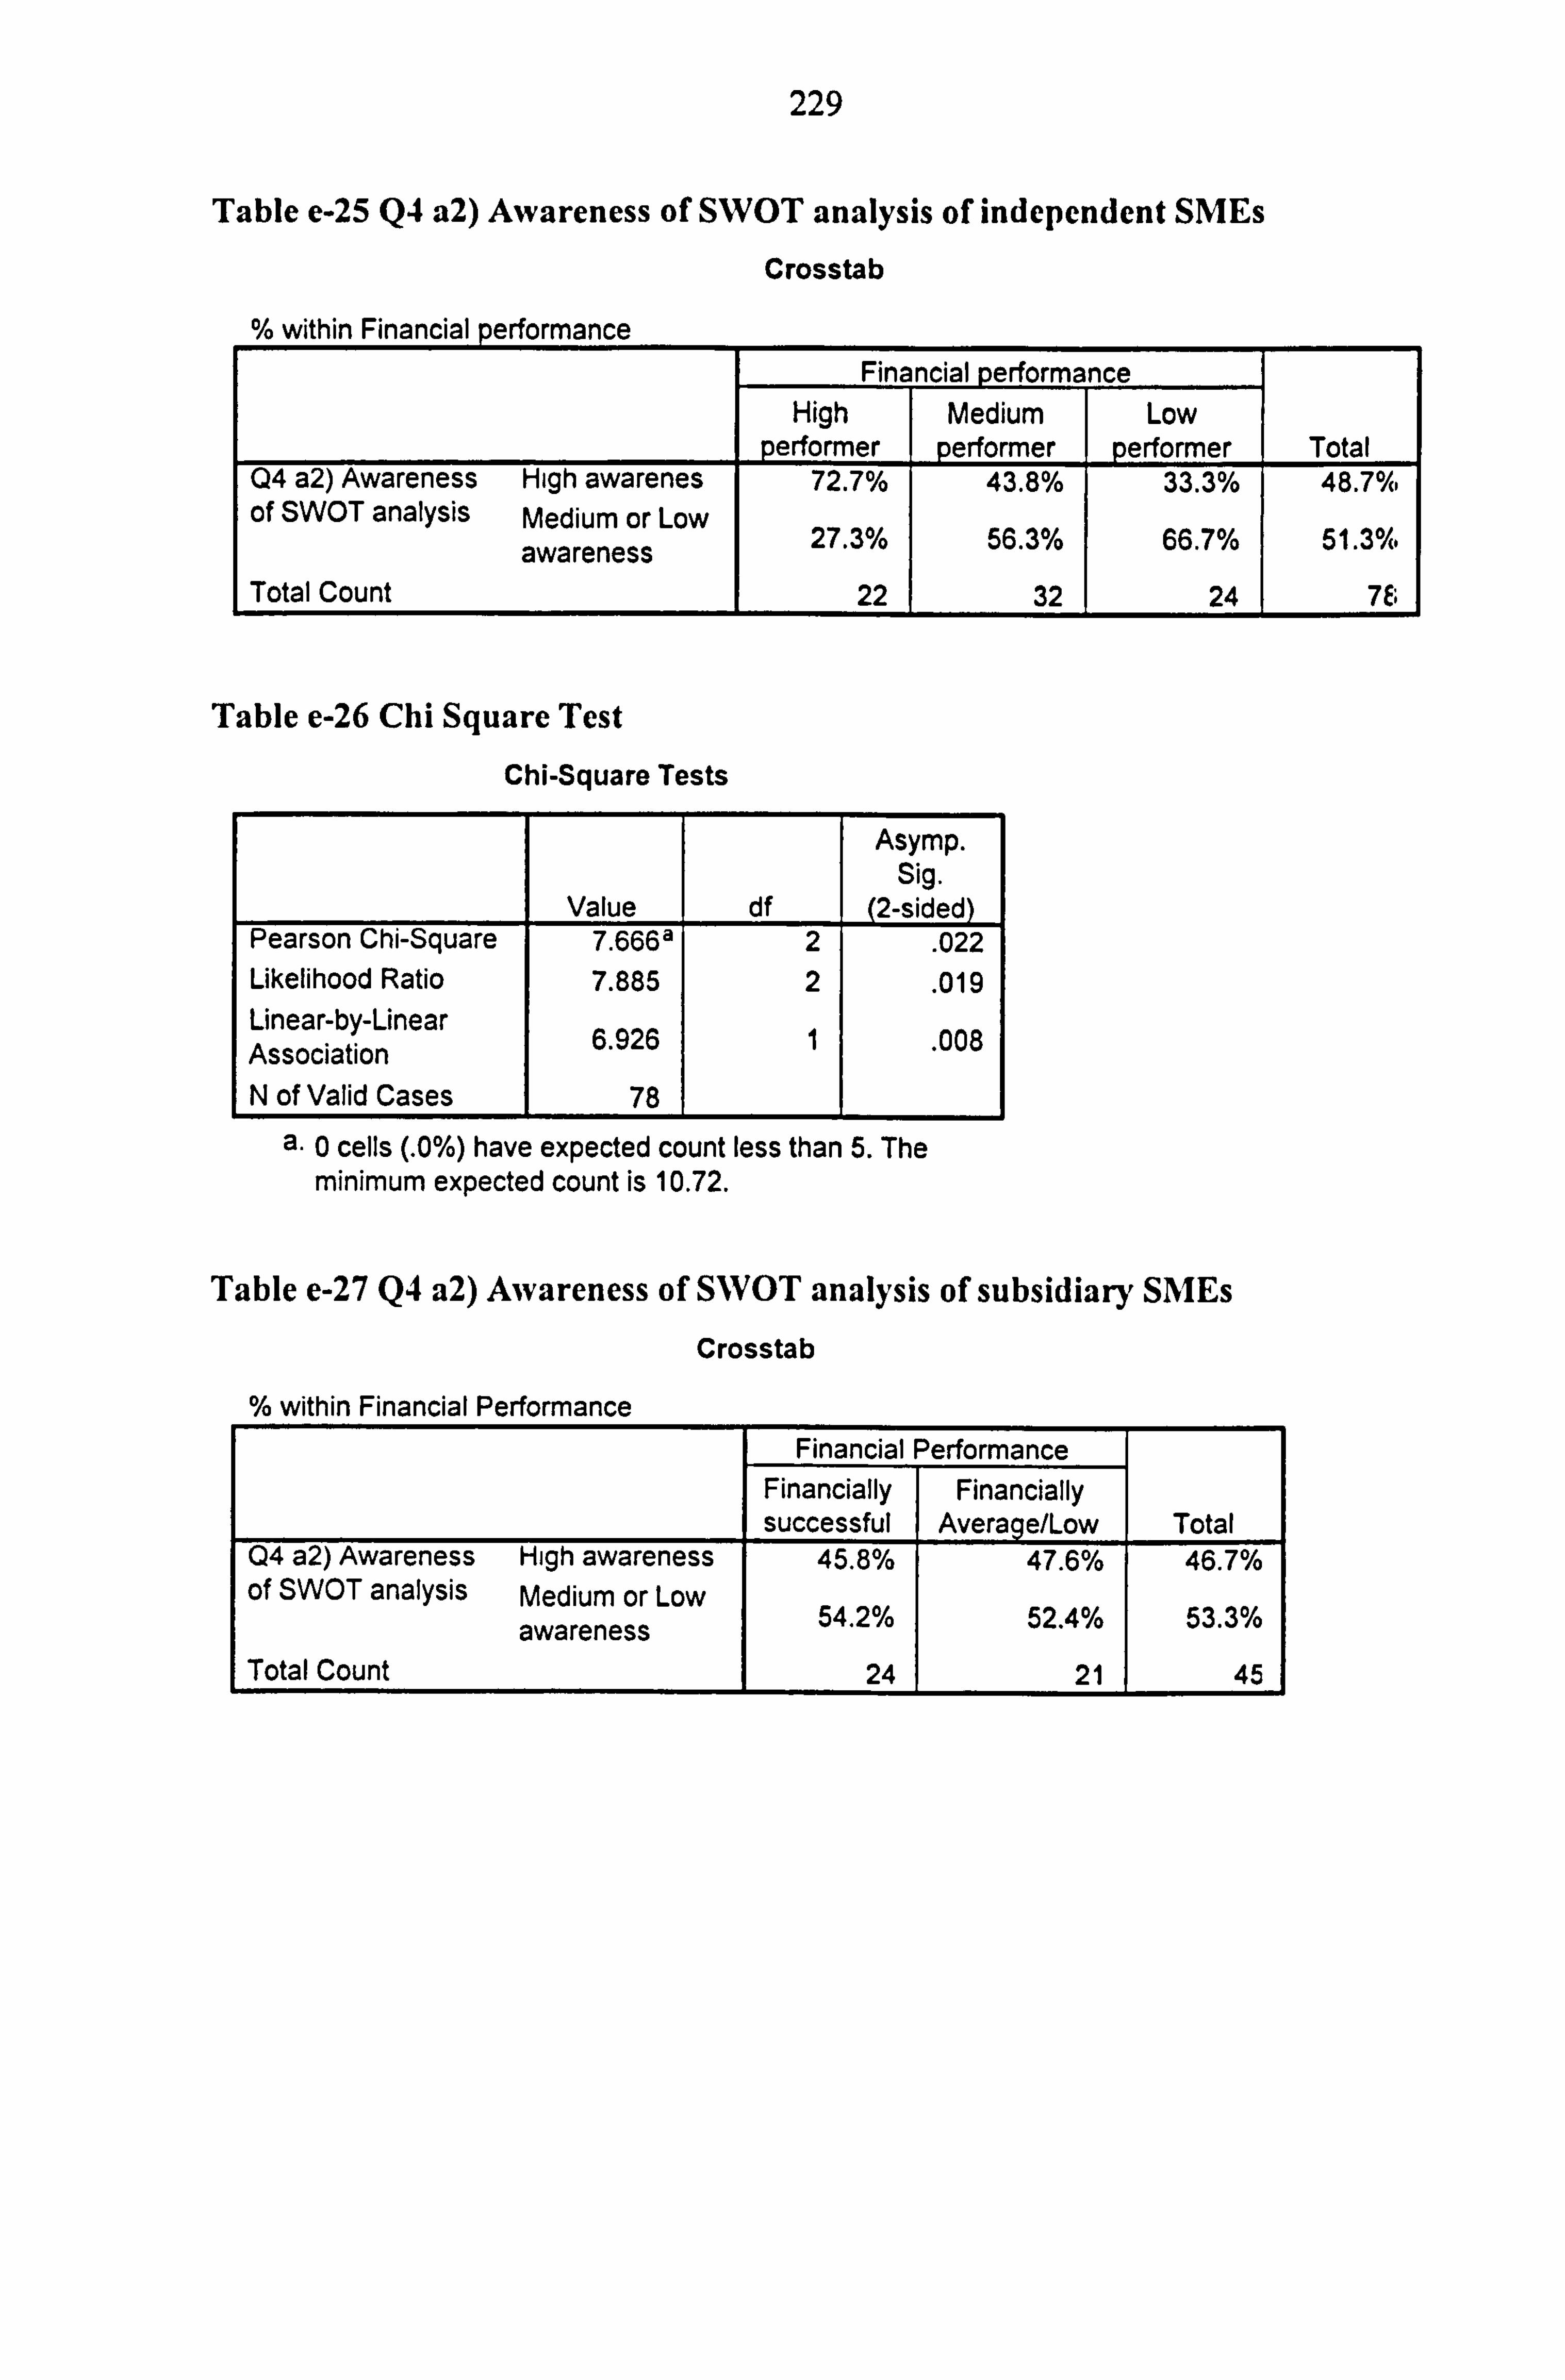
229
Table e-25 Q4 a2) Awareness of SWOT analysis of independent SMEs
Crosstab
% within Financial performance Financial erformance
High Medium Low erformer performer performer Total
Q4 a2) Awareness High awarenes 72.7% 43.8% 33.3% 48.70/c- of SWOT analysis Medium or Low
27.3% 56.3% 66.7% 51.30% awareness Total Count 22 32 24 76
Table e-26 Chi Square Test
Chi-Square Tests
Asymp. Sig.
Value df (2-sided) Pearson Chi-Square 7.6665 2 . 022 Likelihood Ratio 7.885 2
. 019 Linear-by-Linear Association 6.926 1
. 008
N of Valid Cases 78
a. 0 cells (. 0%) have expected count less than 5. The minimum expected count is 10.72.
Table e-27 Q4 a2) Awareness of SWOT analysis of subsidiary SMEs
Crosstab
within Financial Performance Financial Performance
Financially Financially successful Average/Low Total
Q4 a2) Awareness High awareness 45.8% 47.6% 46.7% of SWOT analysis Medium or Low
54.2% 52.4% 53.3% awareness Total Count 24 21 45
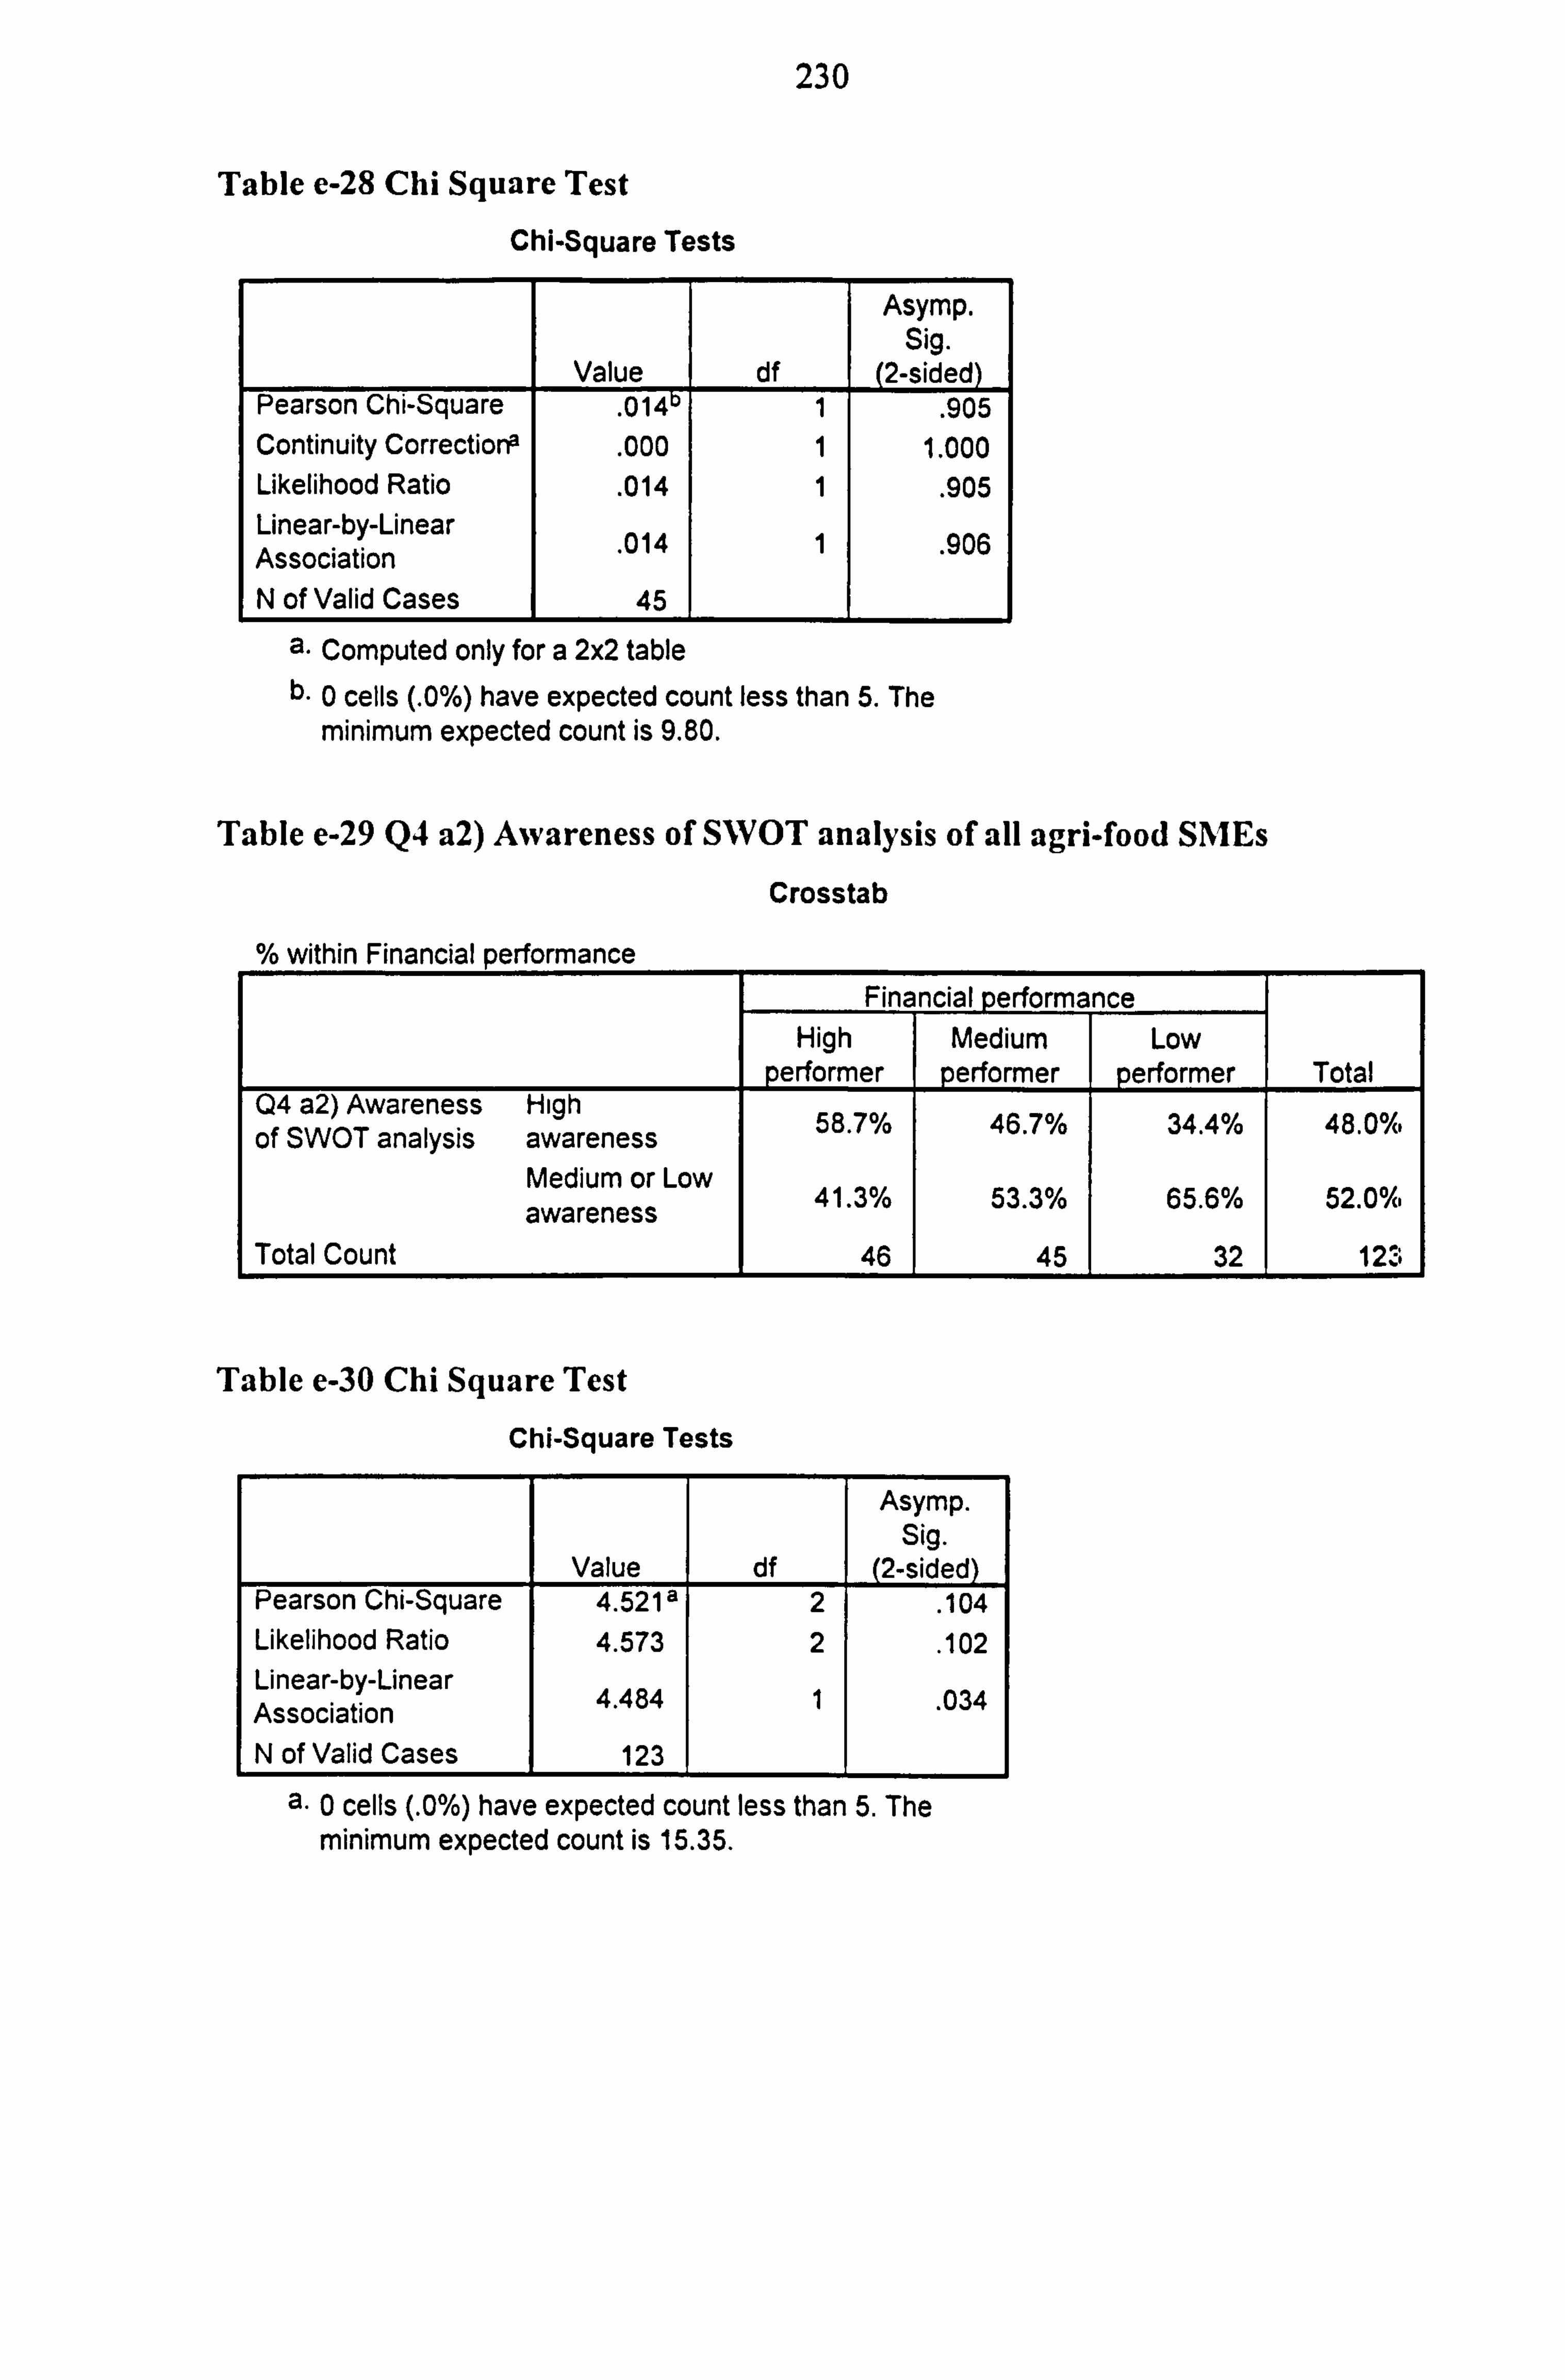
230
Table e-28 Chi Square Test
Chi-Square Tests
Value df
Asymp. Sig.
(2-sided) Pearson Chi-Square
. 014 1 . 905 Continuity Corrections
. 000 1 1.000 Likelihood Ratio
. 014 1 . 905 Linear-by-Linear Association . 014 1 . 906
N of Valid Cases 45
a. Computed only for a 2x2 table b. 0 cells (. 0%) have expected count less than 5. The
minimum expected count is 9.80.
Table e-29 Q4 a2) Awareness of SWOT analysis of all agri-food SMEs
Crosstab
% within Financial performance Financial erformance
High Medium Low erformer performer performer Total
Q4 a2) Awareness High of SWOT analysis awareness
o 58.7 /0 0 46.7 /0 0 34.4 /0 48.00/c.
Medium or Low 41.3% 53.3% 65.6% 52.004
awareness Total Count 46 45 32 123
Table e-30 Chi Square Test
Chi-Square Tests
Asymp. Sig.
Value df (2-sided) Pearson Chi-Square 4.521 a 2 . 104 Likelihood Ratio 4.573 2 . 102 Linear-by-Linear Association 4.484 1 . 034
N of Valid Cases 123
a. 0 cells (. 0%) have expected count less than 5. The minimum expected count is 15.35.
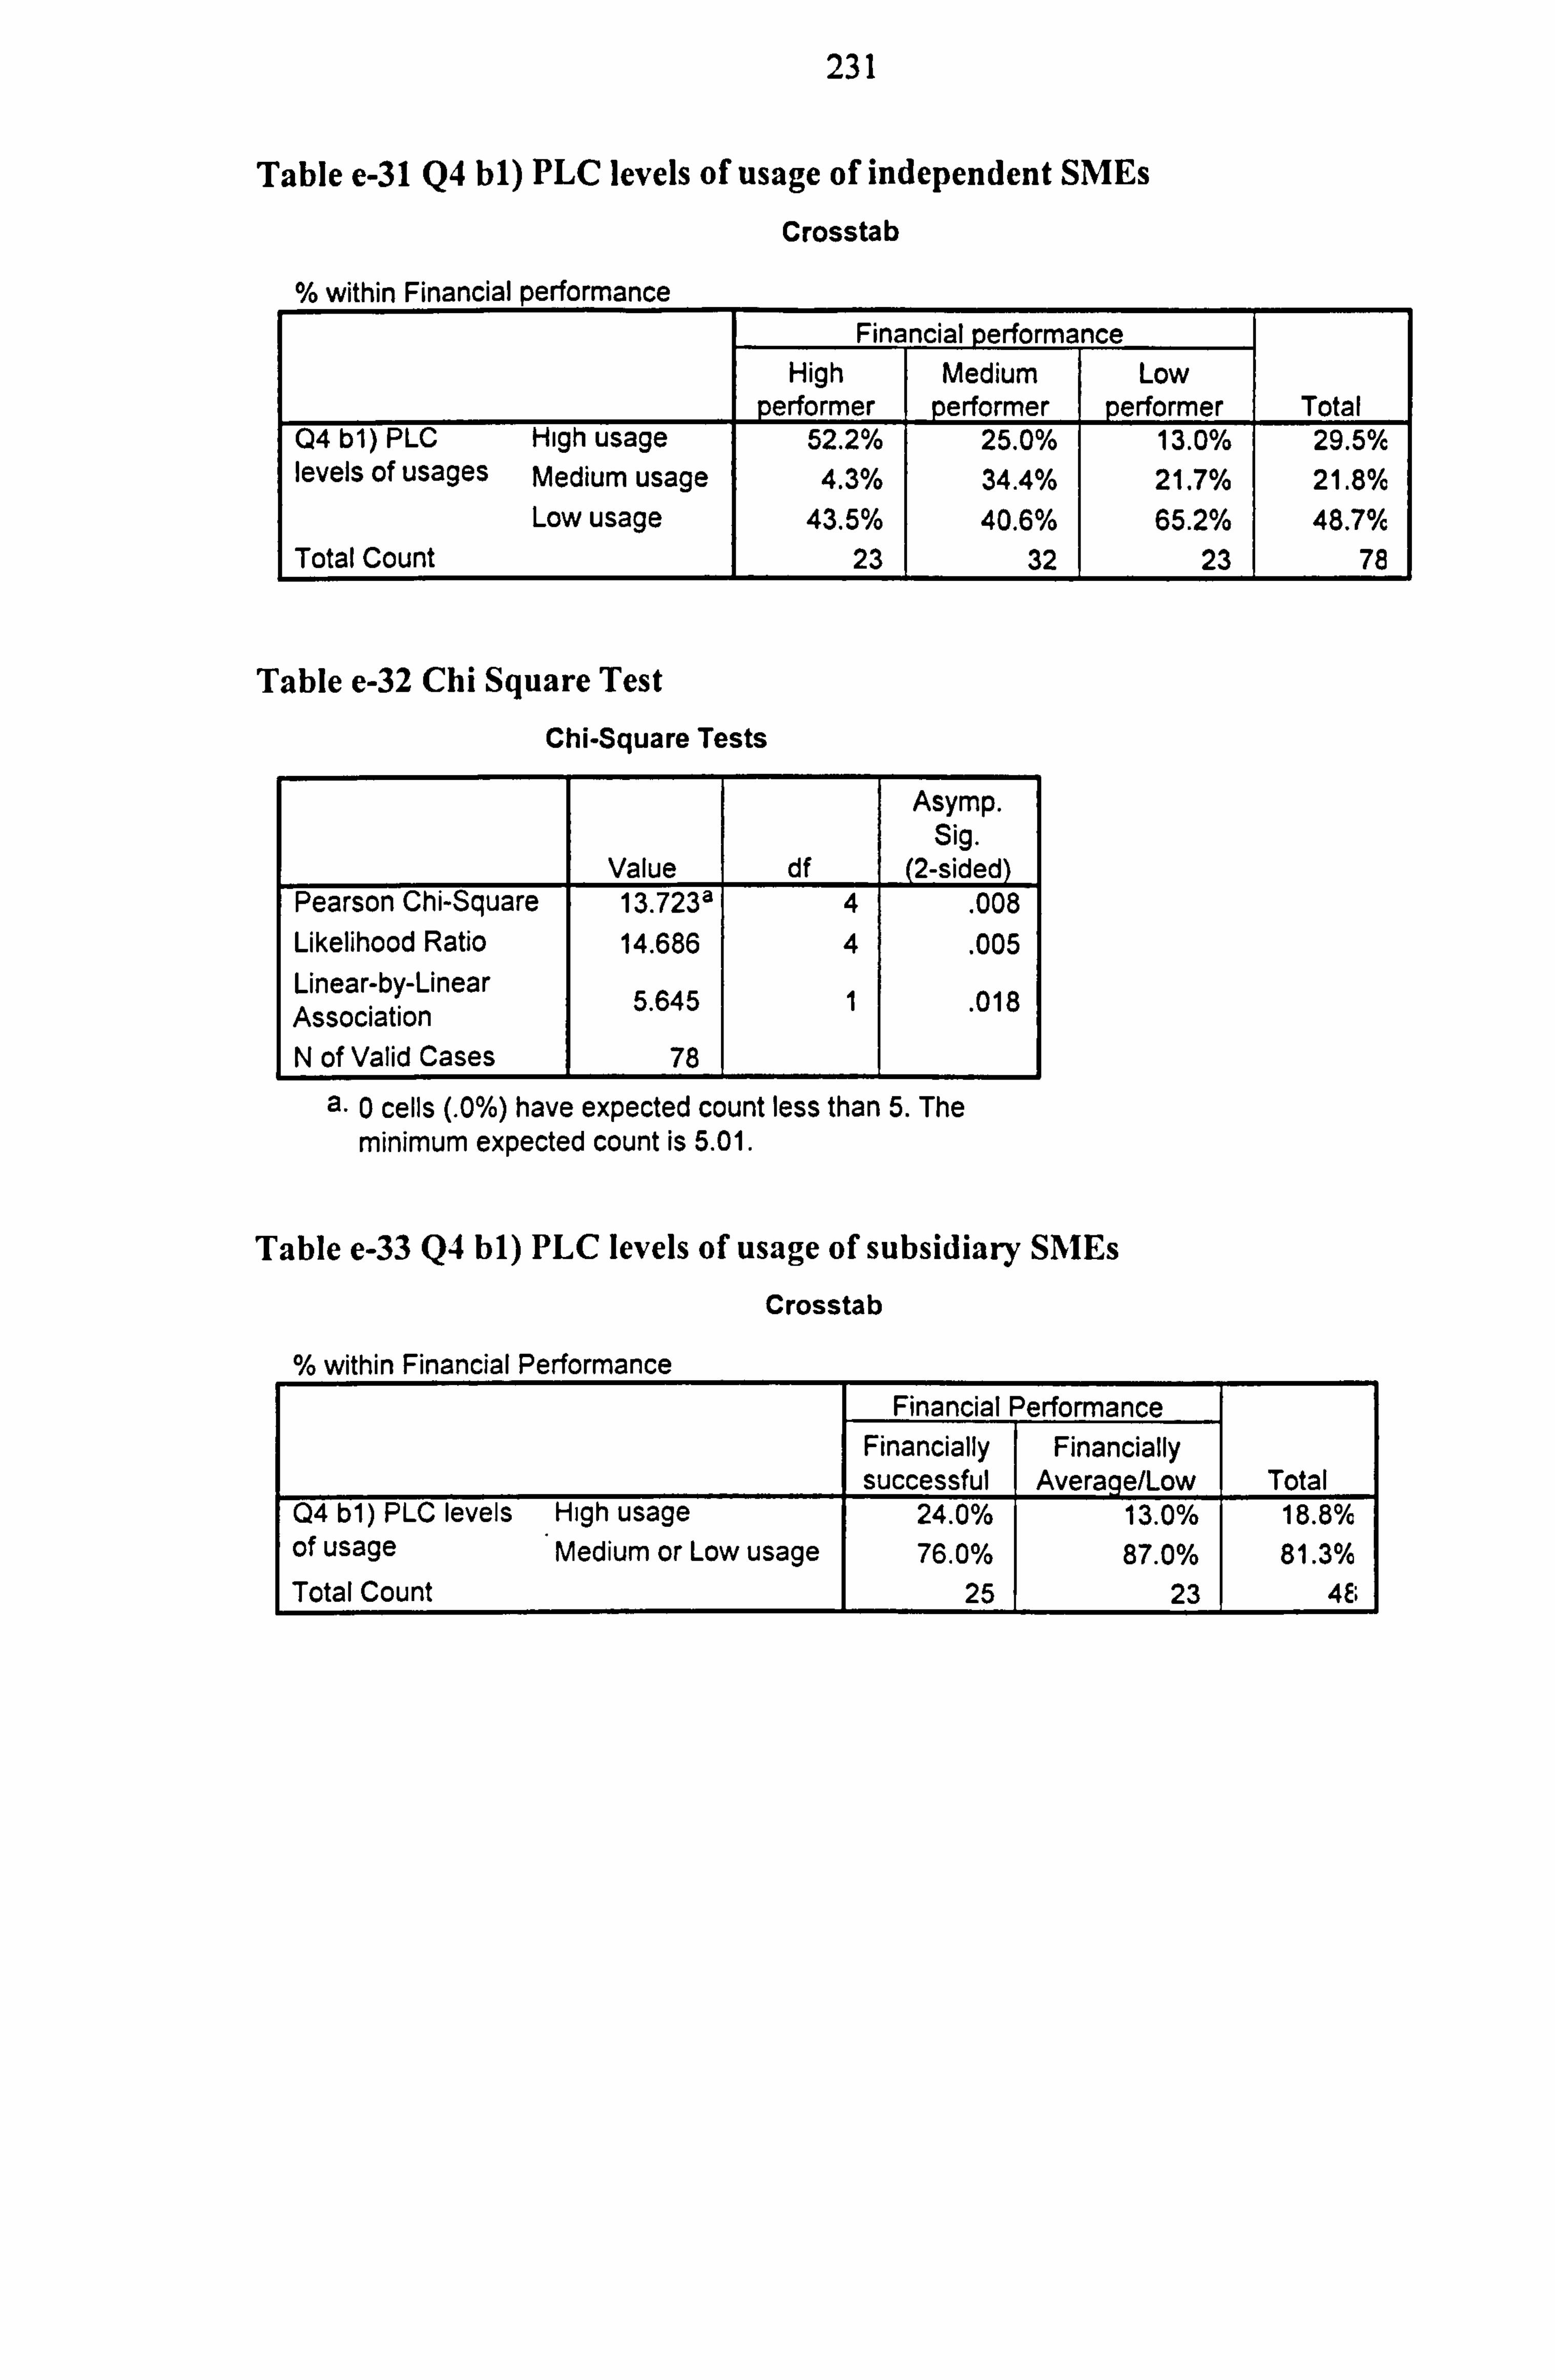
231
Table e-31 Q4 bl) PLC levels of usage of independent SMEs
Crosstab
% within Financial performance Financial erformance
High Medium Low erformer performer performer Total
Q4 b1) PLC High usage 52.2% 25.0% 13.0% 29.5% levels of usages Medium usage 4.3% 34.4% 21.7% 21.8%
Low usage 43.5% 40.6% 65.2% 48.7% Total Count 23 32 23 78
Table e-32 Chi Square Test
Chi-Square Tests
Asymp. Sig.
Value df 2-sided Pearson Chi-Square 13.723a 4 . 008 Likelihood Ratio 14.686 4 . 005 Linear-by-Linear Association 5.645 1 . 018
N of Valid Cases 78
a. 0 cells (. 0%) have expected count less than 5. The minimum expected count is 5.01.
Table e-33 Q4 bl) PLC levels of usage of subsidiary SMEs
Crosstab
% within Financial Performance Financial Performance
Financially Financially successful Average/Low Total
Q4 b1) PLC levels High usage 24.0% 13.0% 18.8% of usage Medium or Low usage 76.0% 87.0% 81.3% Total Count 25 23 48
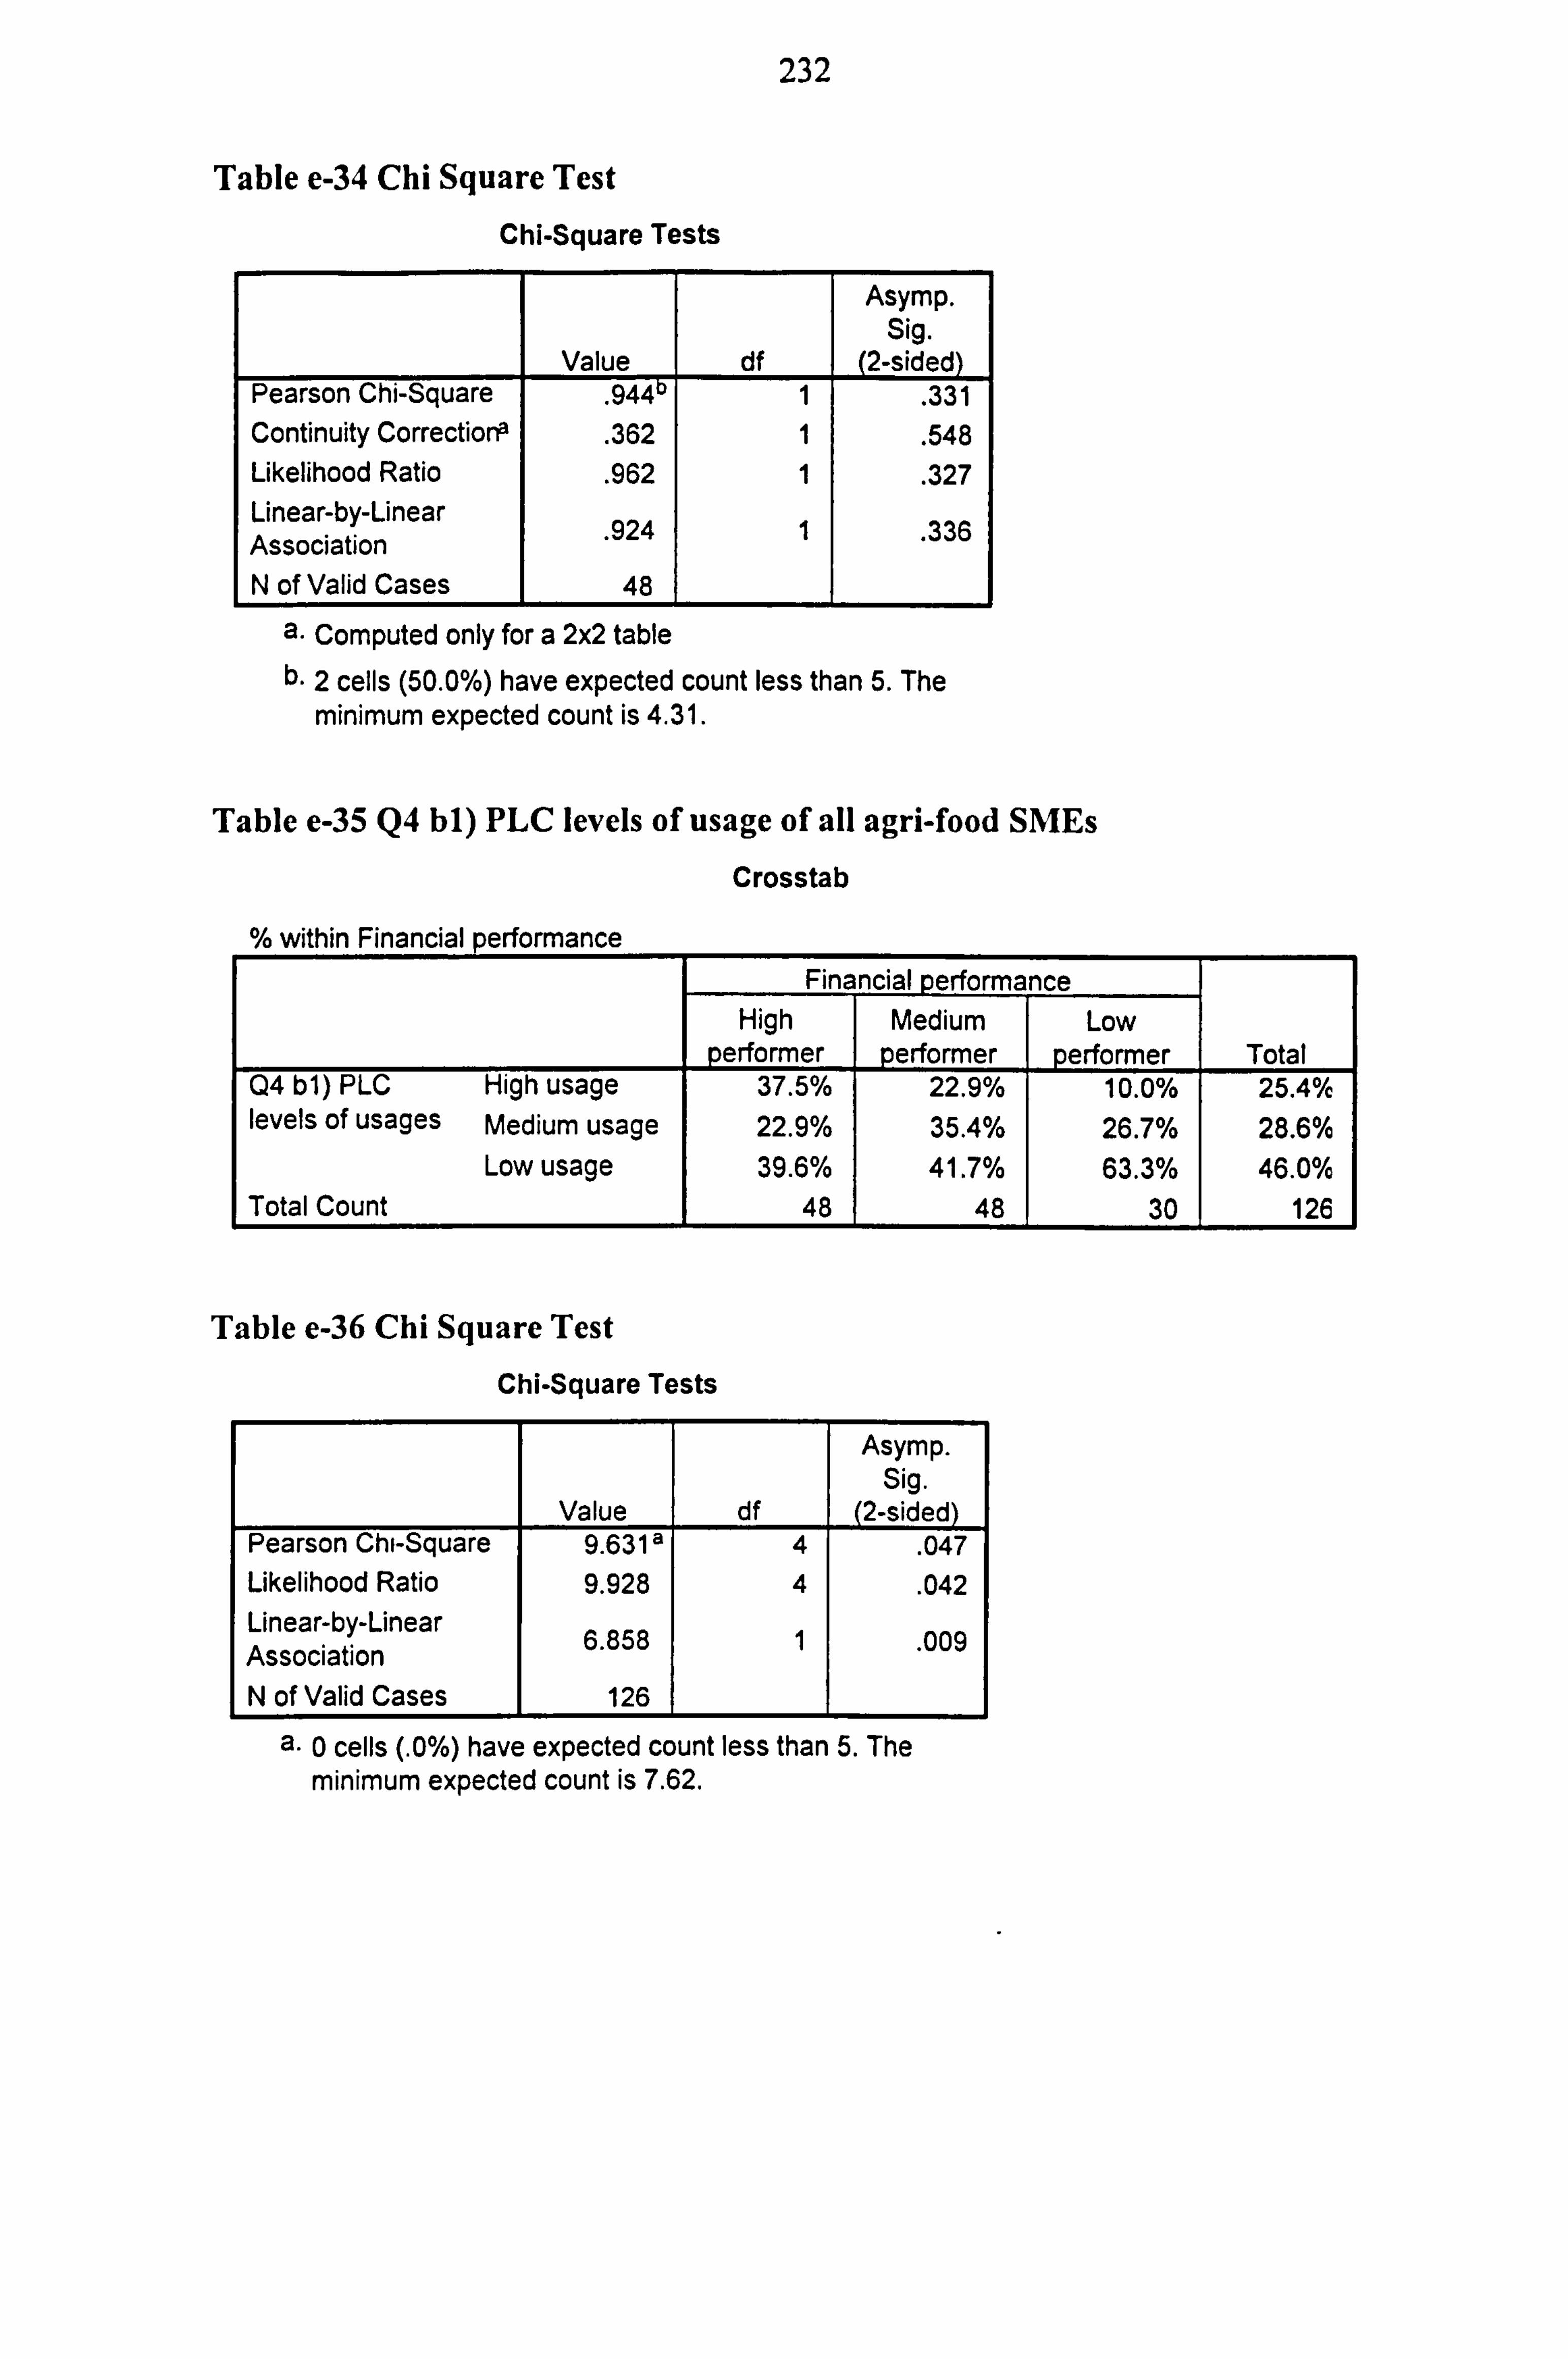
232
Table e-34 Chi Square Test Chi-Square Tests
Value df
Asymp. Sig.
(2-sided) Pearson Chi-Square
. 944 1 . 331 Continuity Corrections
. 362 1 . 548 Likelihood Ratio
. 962 1 . 327 Linear-by-Linear Association 924 1 . 336
N of Valid Cases 48
a. Computed only for a 2x2 table b. 2 cells (50.0%) have expected count less than 5. The
minimum expected count is 4.31.
Table e-35 Q4 bl) PLC levels of usage of all agri-food SMEs Crosstab
within Financial performance Financial perform nce
High Medium Low performer performer performer Total
Q4 b1) PLC High usage 37.5% 22.9% 10.0% 25.4% levels of usages Medium usage 22.9% 35.4% 26.7% 28.6%
Low usage 39.6% 41.7% 63.3% 46.0% Total Count 48 48 30 126
Table e-36 Chi Square Test
Chi-Square Tests
Asymp. Sig.
Value df (2-sided) Pearson Chi-Square 9.631 a 4 . 047 Likelihood Ratio 9.928 4 . 042 Linear-by-Linear Association 6.858 1 . 009
N of Valid Cases 126
0 cells (. 0%) have expected count less than 5. The minimum expected count is 7.62.
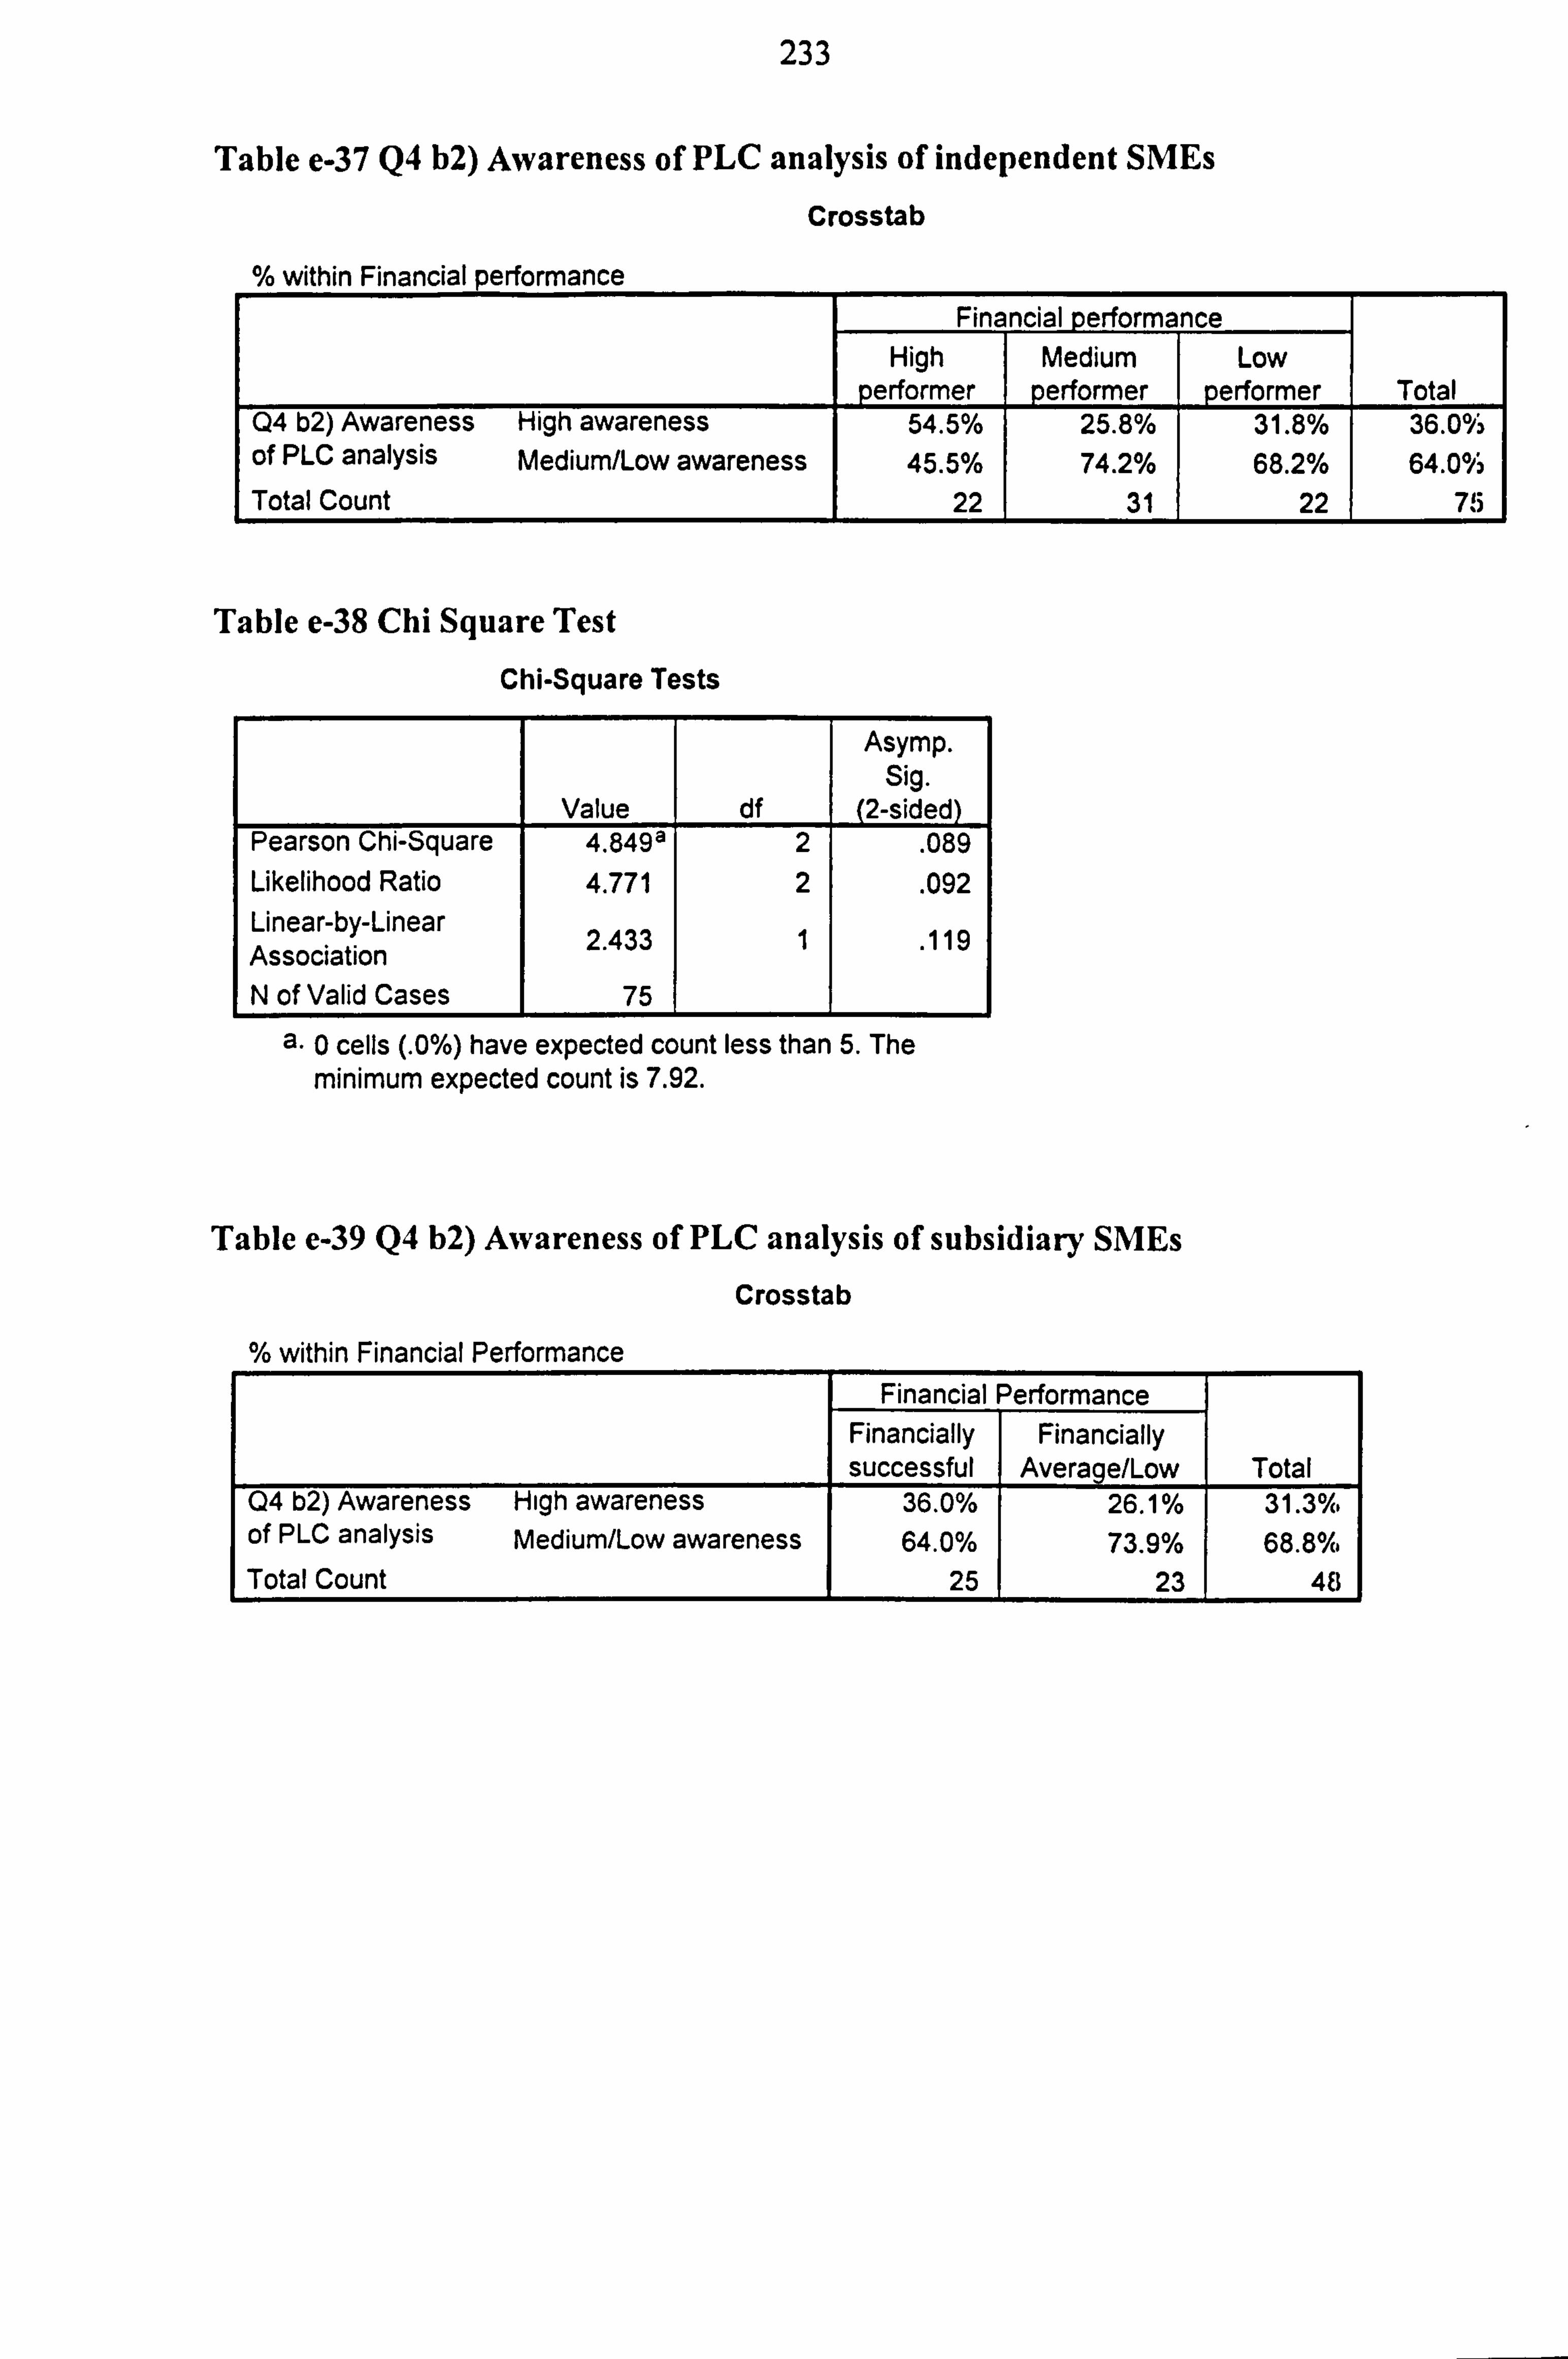
233
Table e-37 Q4 b2) Awareness of PLC analysis of independent SMEs
Crosstab
within Financial performance Financial verform nce
High Medium Low performer performer performer Total
Q4 b2) Awareness High awareness 54.5% 25.8% 31.8% 36.0°/3 of PLC analysis Medium/Low awareness 45.5% 74.2% 68.2% 64.0% Total Count 22 31 22 75
Table e-38 Chi Square Test
Chi-Square Tests
Asymp. Sig.
Value df (2-sided) Pearson Chi-Square 4.849a 2 . 089 Likelihood Ratio 4.771 2 . 092 Linear-by-Linear Association 2.433 1 . 119
N of Valid Cases 75
a. 0 cells (. 0%) have expected count less than 5. The minimum expected count is 7.92.
Table e-39 Q4 b2) Awareness of PLC analysis of subsidiary SMEs Crosstab
% within Financial Performance Financial Performance
Financially Financially successful Average/Low Total
Q4 b2) Awareness High awareness 36.0% 26.1% 31.3%7 of PLC analysis Medium/Low awareness 64.0% 73.9% 68.80/6 Total Count 25 23 48
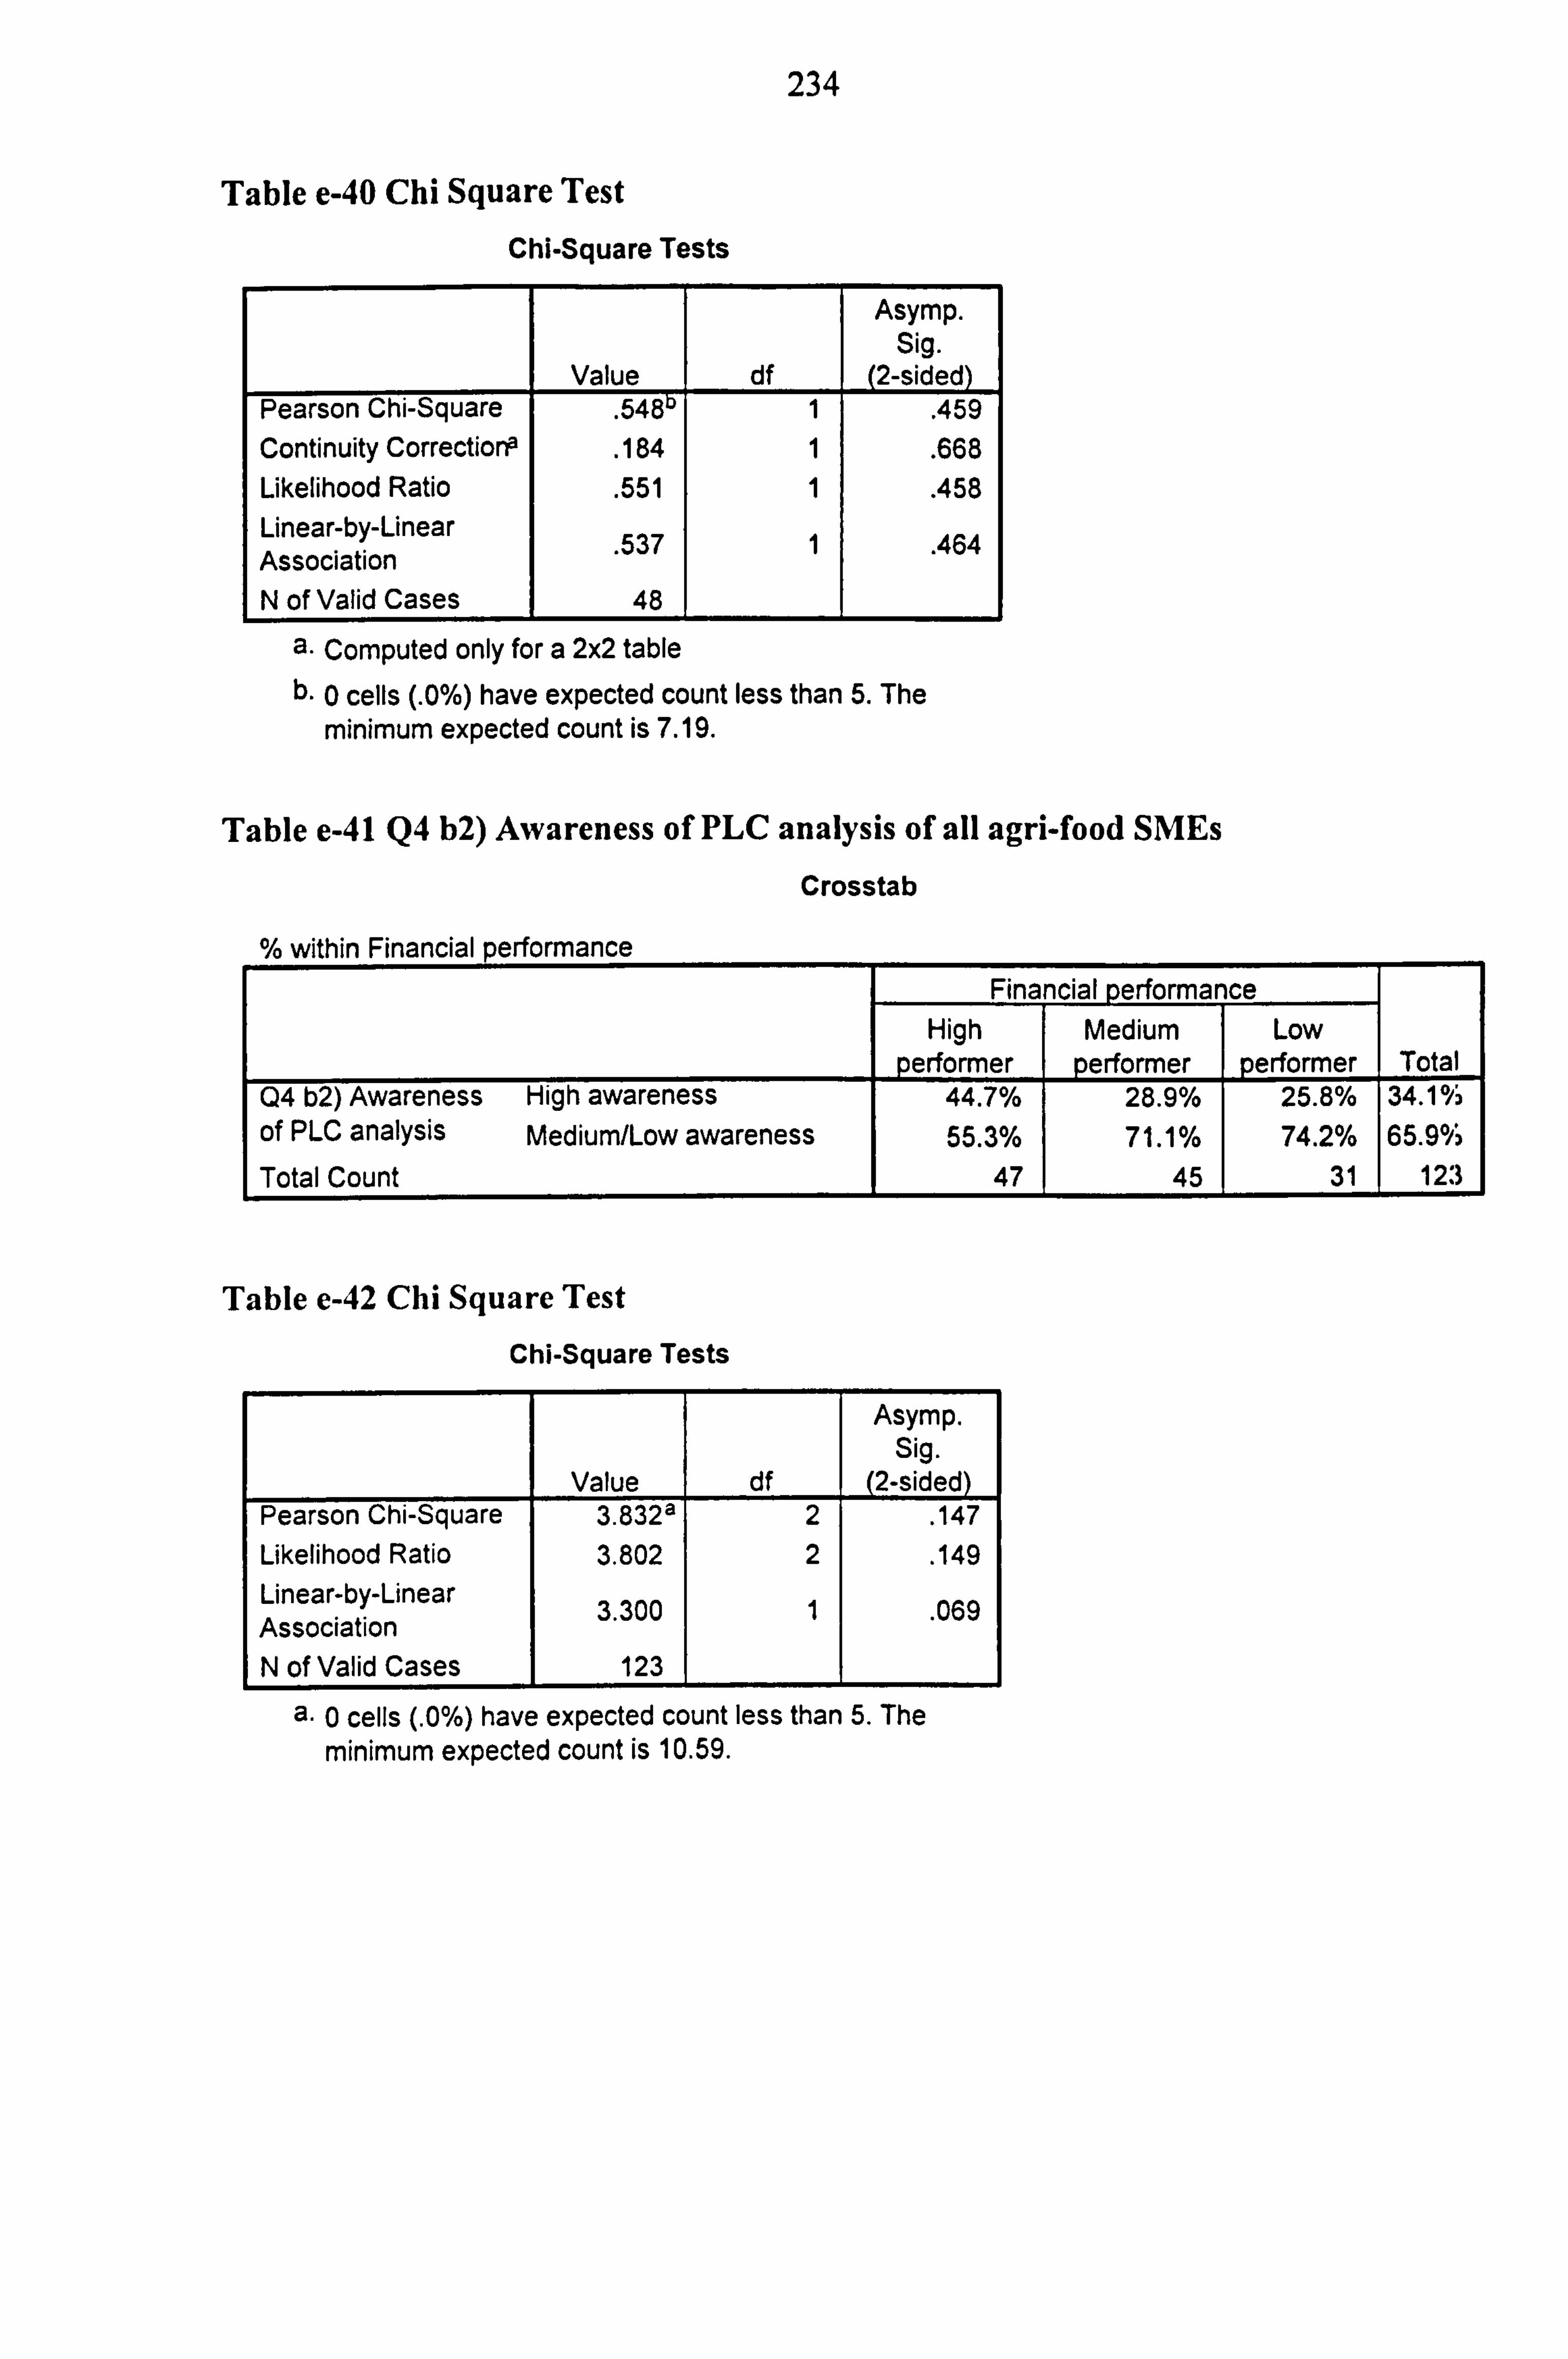
234
Table e-40 Chi Square Test
Chi-Square Tests
Value df
Asymp. Sig.
(2-sided) Pearson Chi-Square . 548 1 . 459 Continuity Corrections . 184 1 . 668 Likelihood Ratio
. 551 1 . 458 Linear-by-Linear Association . 537 1 . 464
N of Valid Cases 48
a. Computed only for a 2x2 table b. 0 cells (. 0%) have expected count less than 5. The
minimum expected count is 7.19.
Table e-41 Q4 b2) Awareness of PLC analysis of all agri-food SMEs
Crosstab
% within Financial performance Financial performance
High Medium Low erformer performer performer Total
Q4 b2) Awareness High awareness 44.7% 28.9% 25.8% 34.1% of PLC analysis Medium/Low awareness 55.3% 71.1% 74.2% 65.9% Total Count 47 45 31 12: 3
Table e-42 Chi Square Test
Chi-Square Tests
Asymp. Sig.
Value df (2-sided) Pearson Chi-Square 3.832a 2 . 147 Likelihood Ratio 3.802 2 . 149 Linear-by-Linear 3.300 1 . 069 Association N of Valid Cases 123
a. 0 cells (. 0%) have expected count less than 5. The minimum expected count is 10.59.
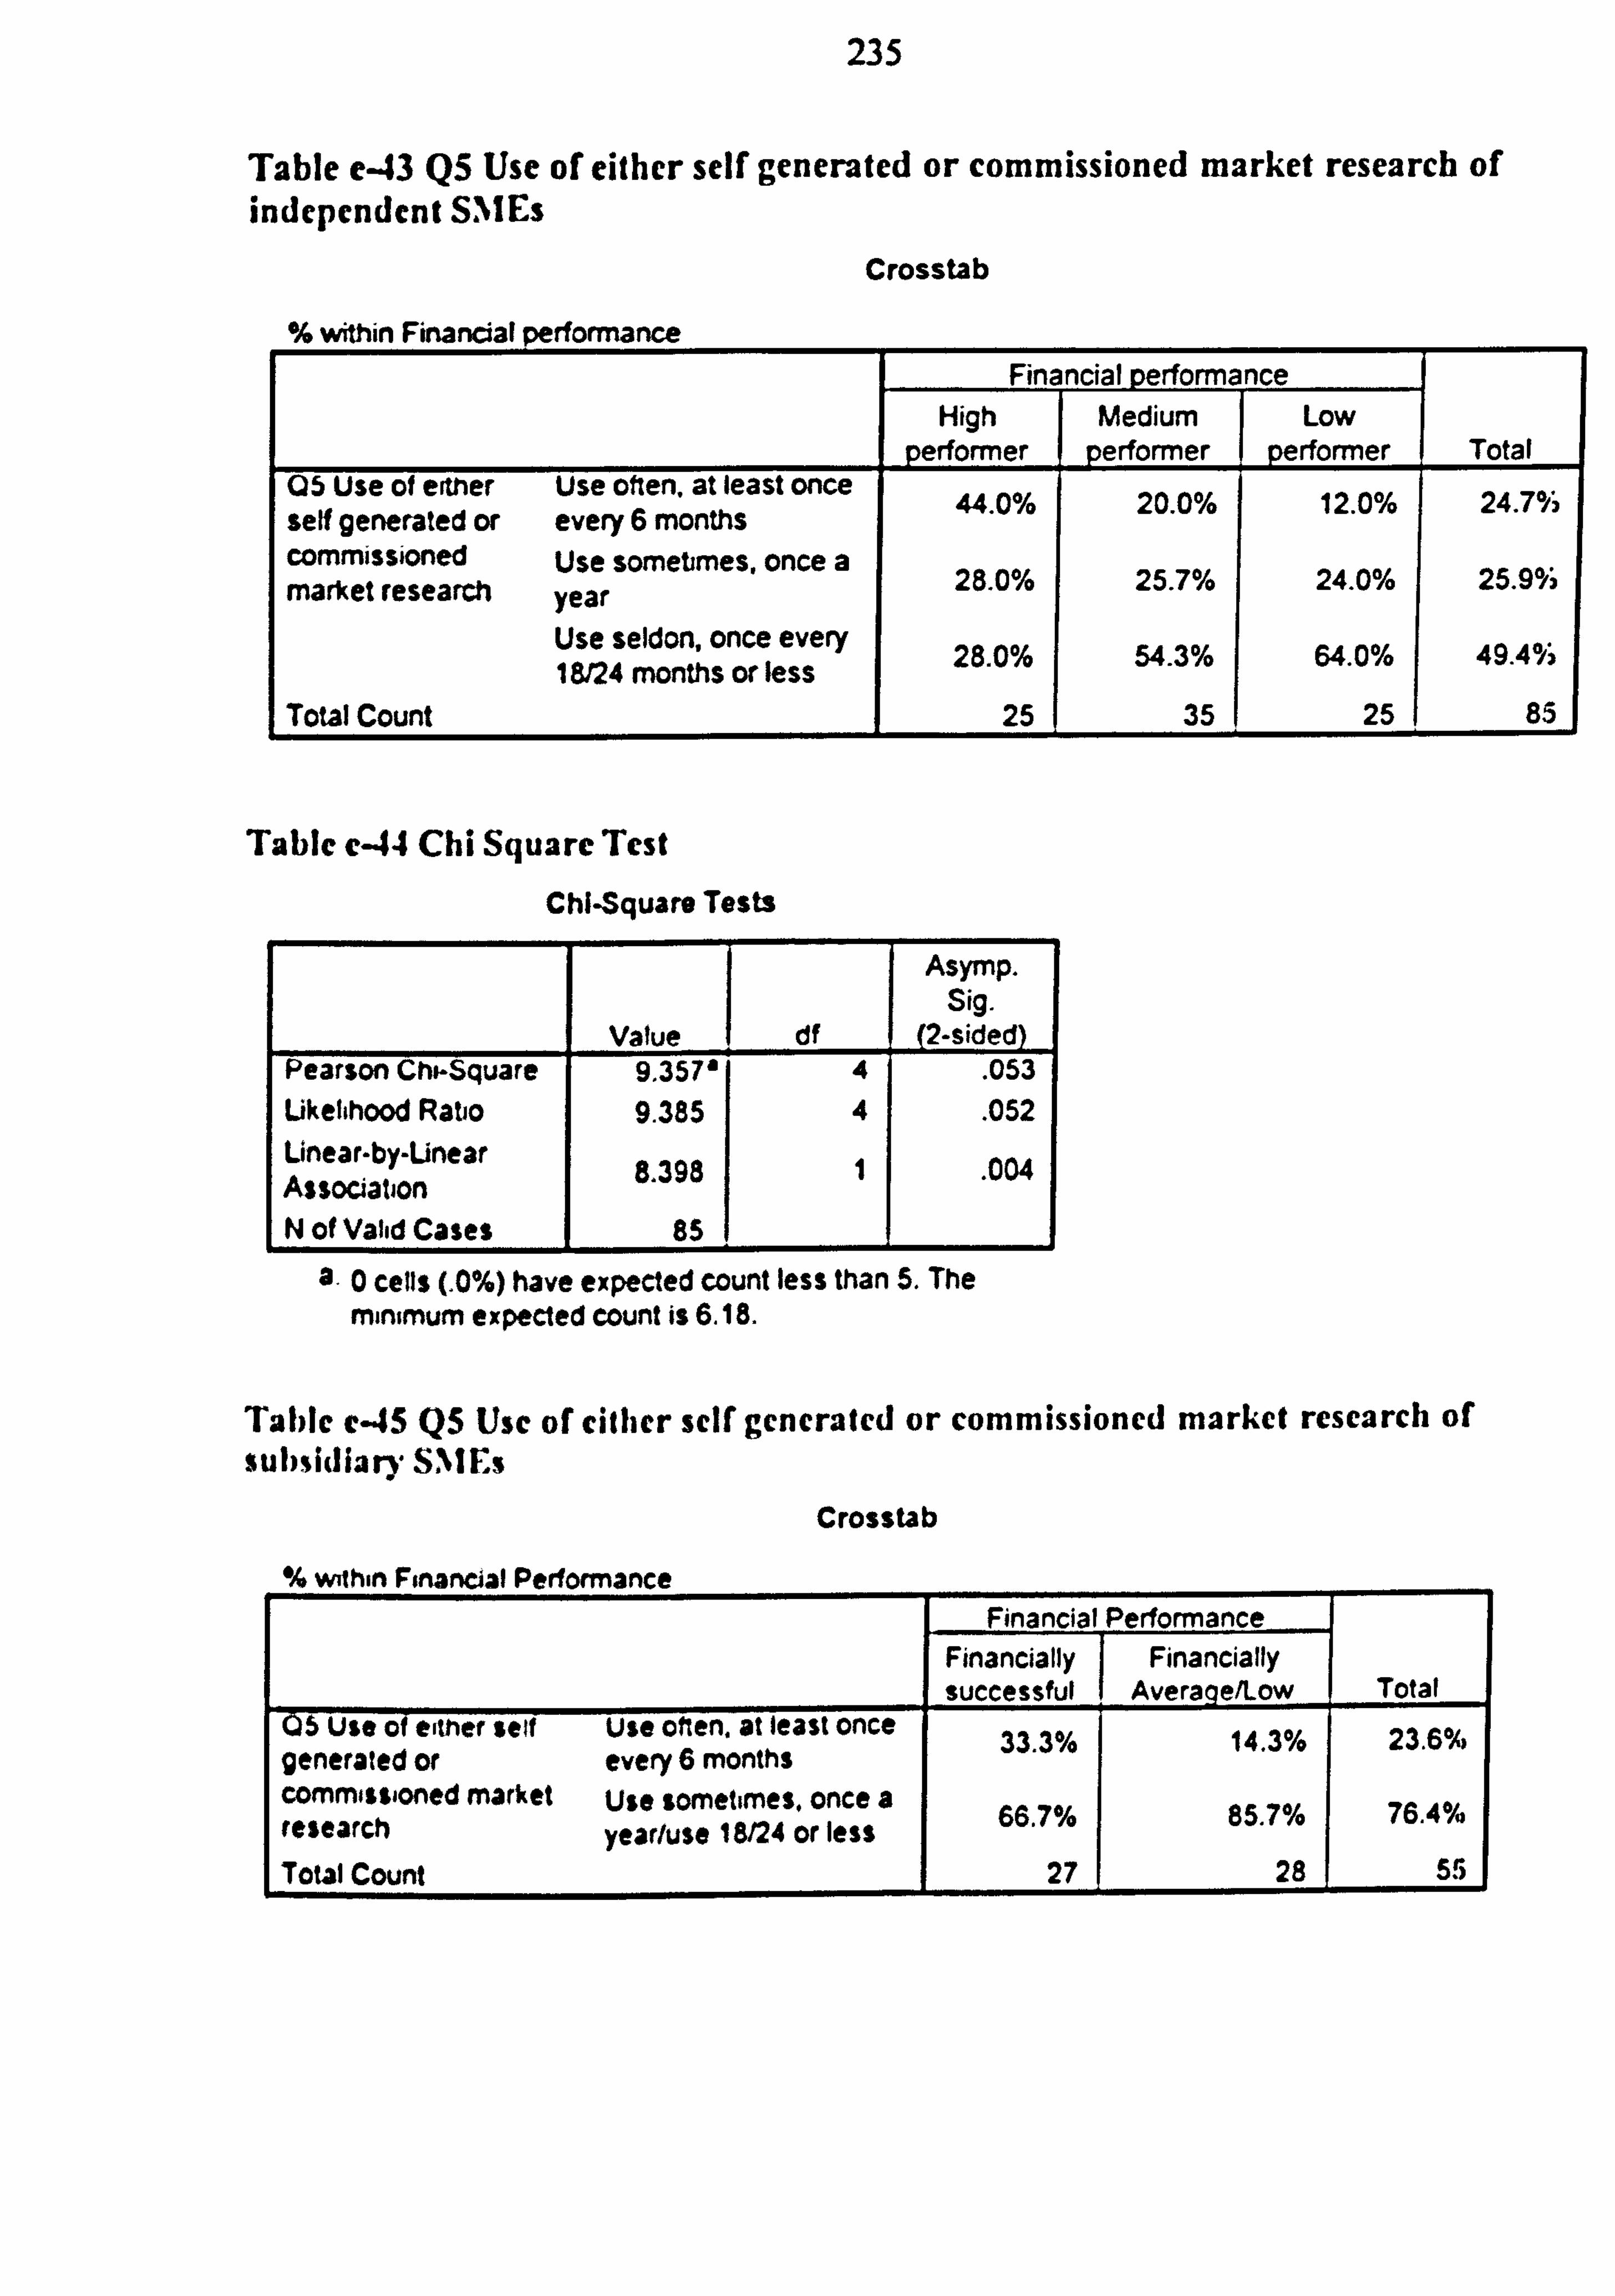
235
Table e-43 QS Use of either self generated or commissioned market research of independentSMMEs
Crosstab
°% within Financial performance Financial perform nce
High Medium Low erformer p performer performer Total
05 Use of either Use often, at least once 44 0% 20 0% 12 0% 24.7% self generated or every 6 months . . commissioned Use sometimes, once a market research year
28.0% 25.7% 24.0% 25.9%
Use seldon, once every 28 0% 54 3% 64.0% 49.4% 18124 months or less . . Total Count 25 35 25 85
Table c44 Chi Square Test
Chi-Square Tests
Asymp. Sig.
Value df (2-sided) Pearson Chi-Square 9.357' 4 . 053 Likelihood Ratio 9.385 4 . 052 Linear-by-Linear
398 8 1 . 004 Association . N of Valid Cases 85
a. 0 cells (. 0%) have expected count less than 5. The minimum expected count is 6.18.
Table c45 Q5 Use of either self generated or commissioned market research of subsidiary SM Es
Crosstab
"ý6 within Financial Performance Financial Performance
Financially Financially successful Avera e/Low Total
05 Use of either seif Use often, at least once 33.3% 14.3% 23.6°ýc, generated or every 6 months commissioned market Use sometimes, once a 66 7% 7% 85 76.4% research year/use 18/24 or less . . Total Count 27 28 55
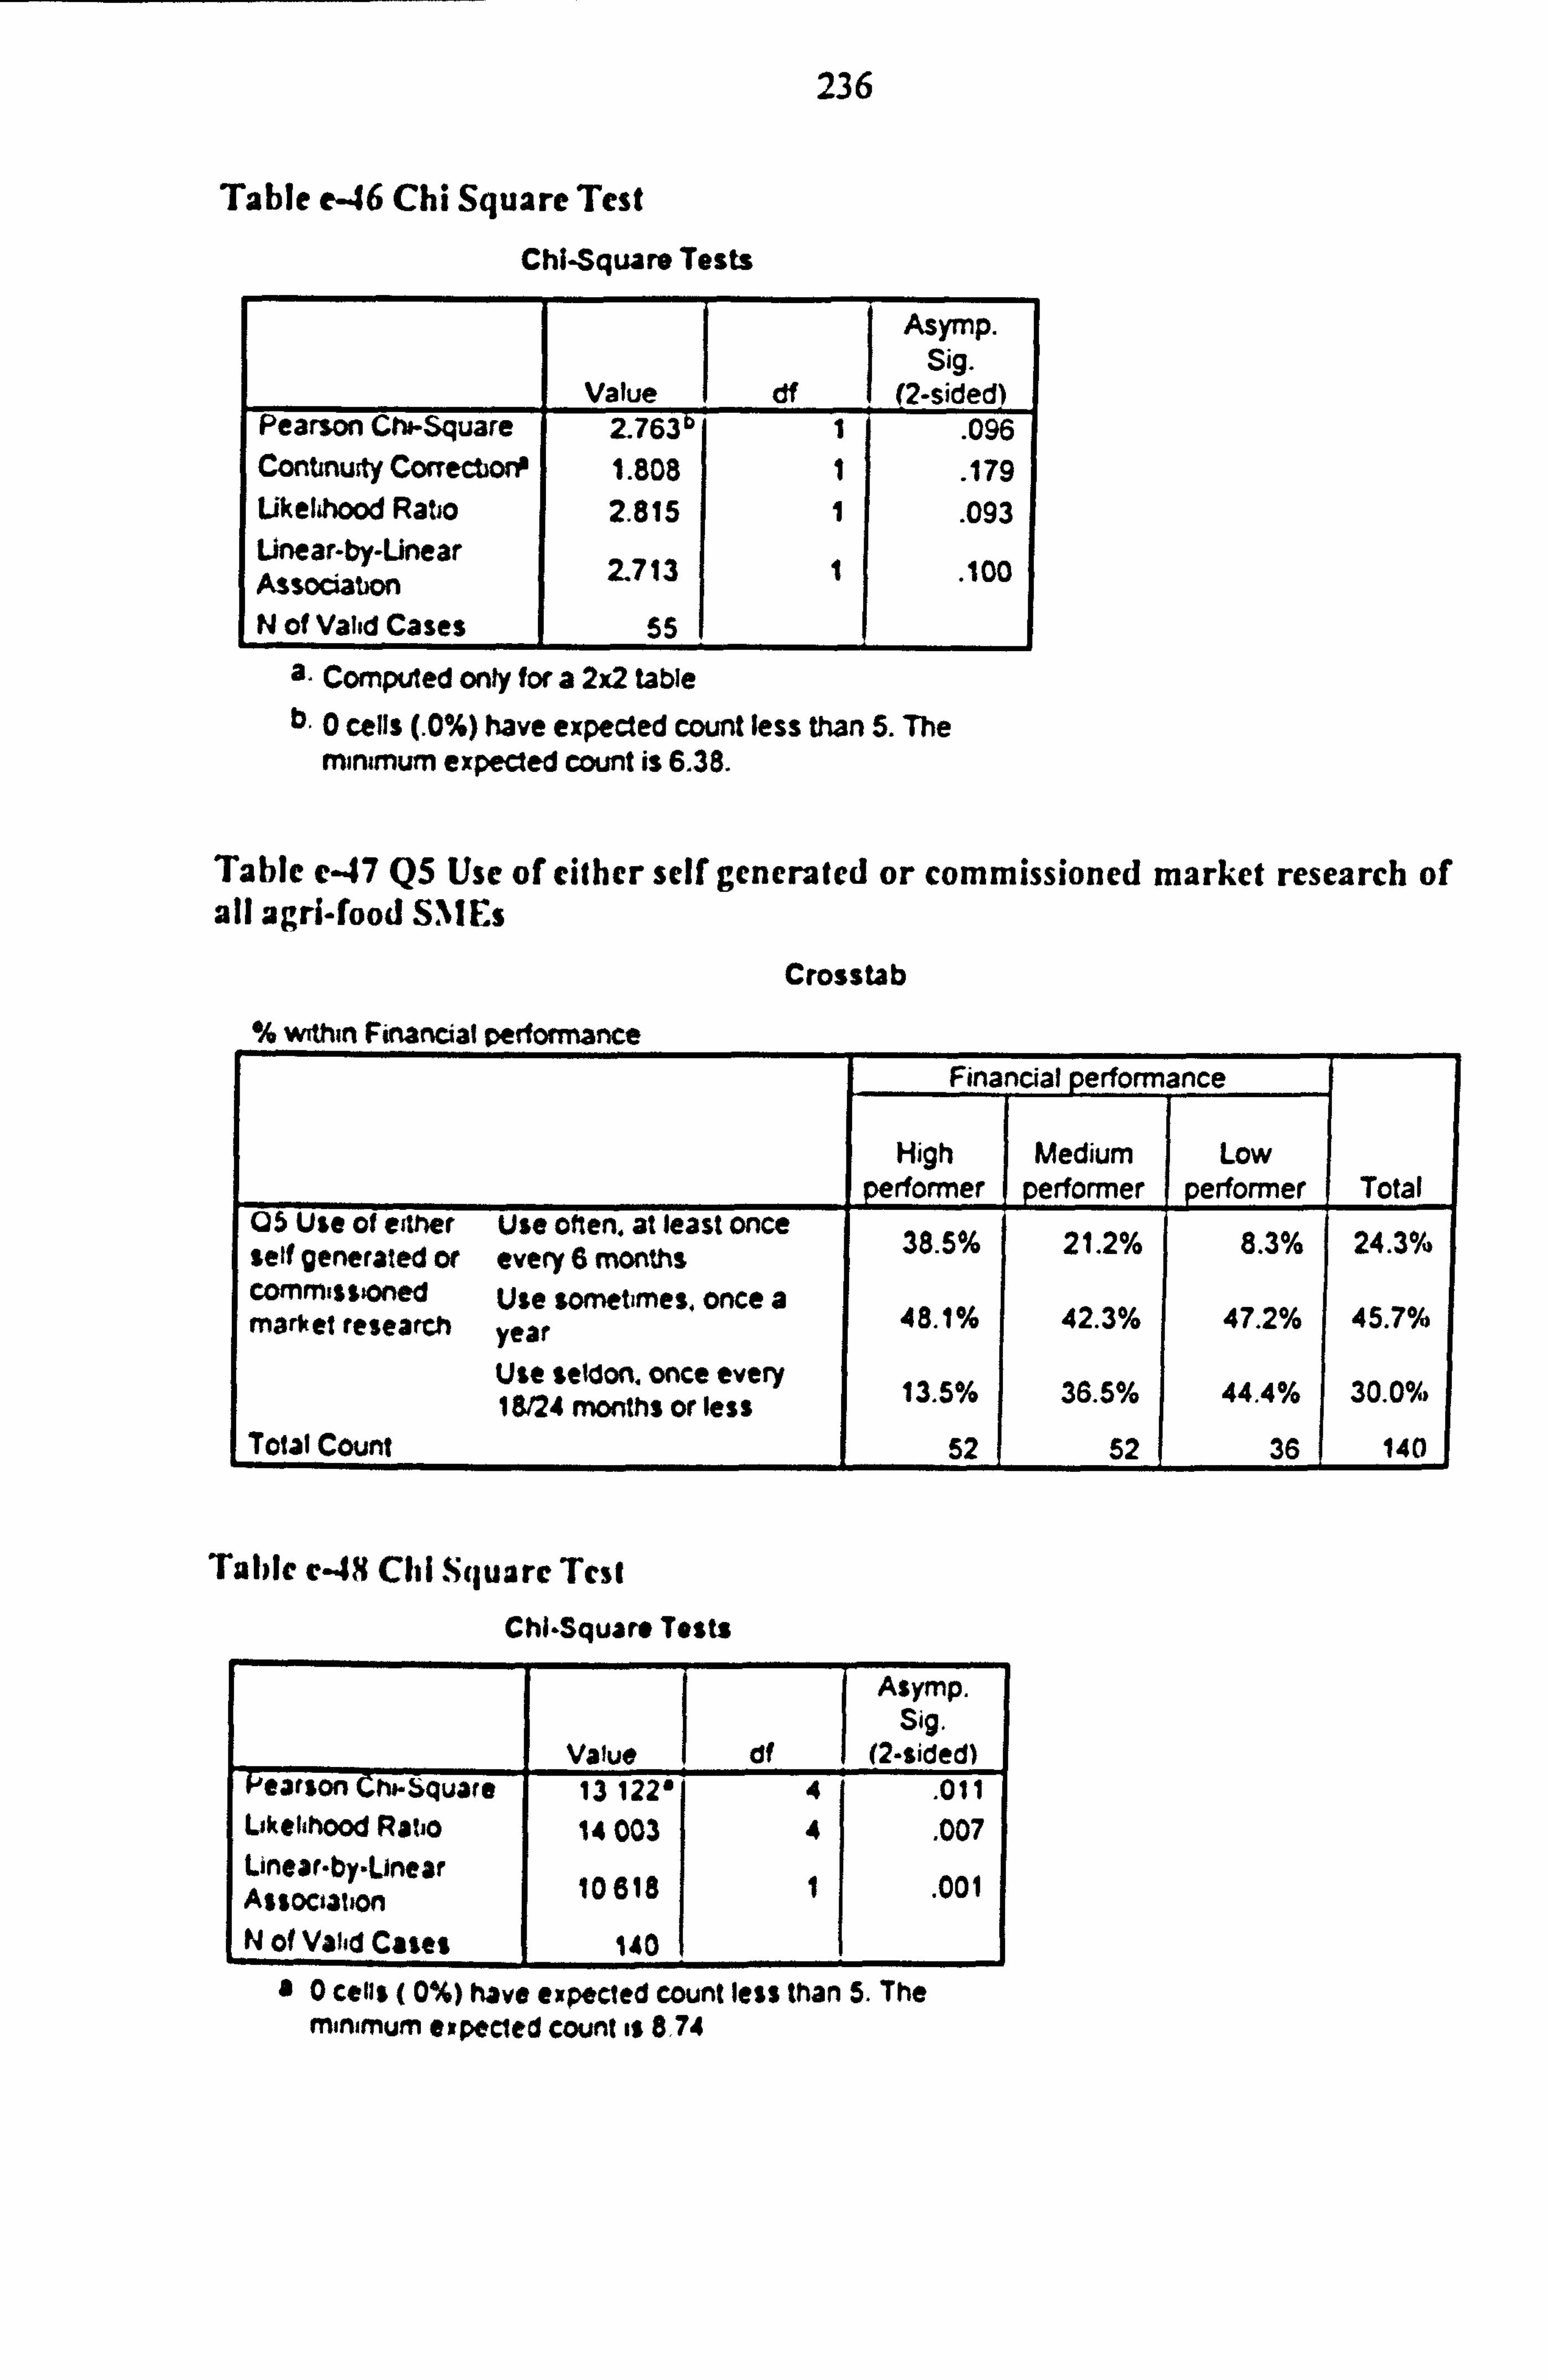
236
Table e-46 Chi Square Test Chi-Square Tests
Value df
Asymp. Sig.
(2-sided) Pearson Ctu-Square 2763 1 . 096 Continuity Correction' 1.808 1 . 179 Likelihood Ratio 2.815 1 . 093 Linear-by-Linear Association 2713 1 . 100
N of Valid Cases 55
a" Computed only for a 2x2 table b. 0 cells (. 0%) have expected count less than 5. The
minimum expected count is 6.38.
Table c-47 Q5 Use of either self generated or commissioned market research of all agri-food SMEs
Crosstab
°ý6 within Financial performance Financial performance
High Medium Low performer performer performer Total
05 Use of either Use often, at least once 38 5° 21 2% 8 3% 24 3% self generated or every 6 months . . . . commissioned Use sometimes, once a market research year
48.1°% 42.3% 47.2% 45.7%
Use seldon. once every 18/24 months or less 13.5% 36.5% 44.4% 30.0°%%
Total Count 52 52 36 140
Table c-48 Chi Square Test Chi-Square Tests
Asymp. Sig.
Value df (2-sided) Pearson hi-square 13122' 4 . 011 Likelihood Ratio 14 003 4 .
007 Linear"by-LUnear Association 10 618 1 . 001
N of Valid Cases 140 0 cell$ ( 0%) have expected count less than 5. The minimum expected count is 8.74
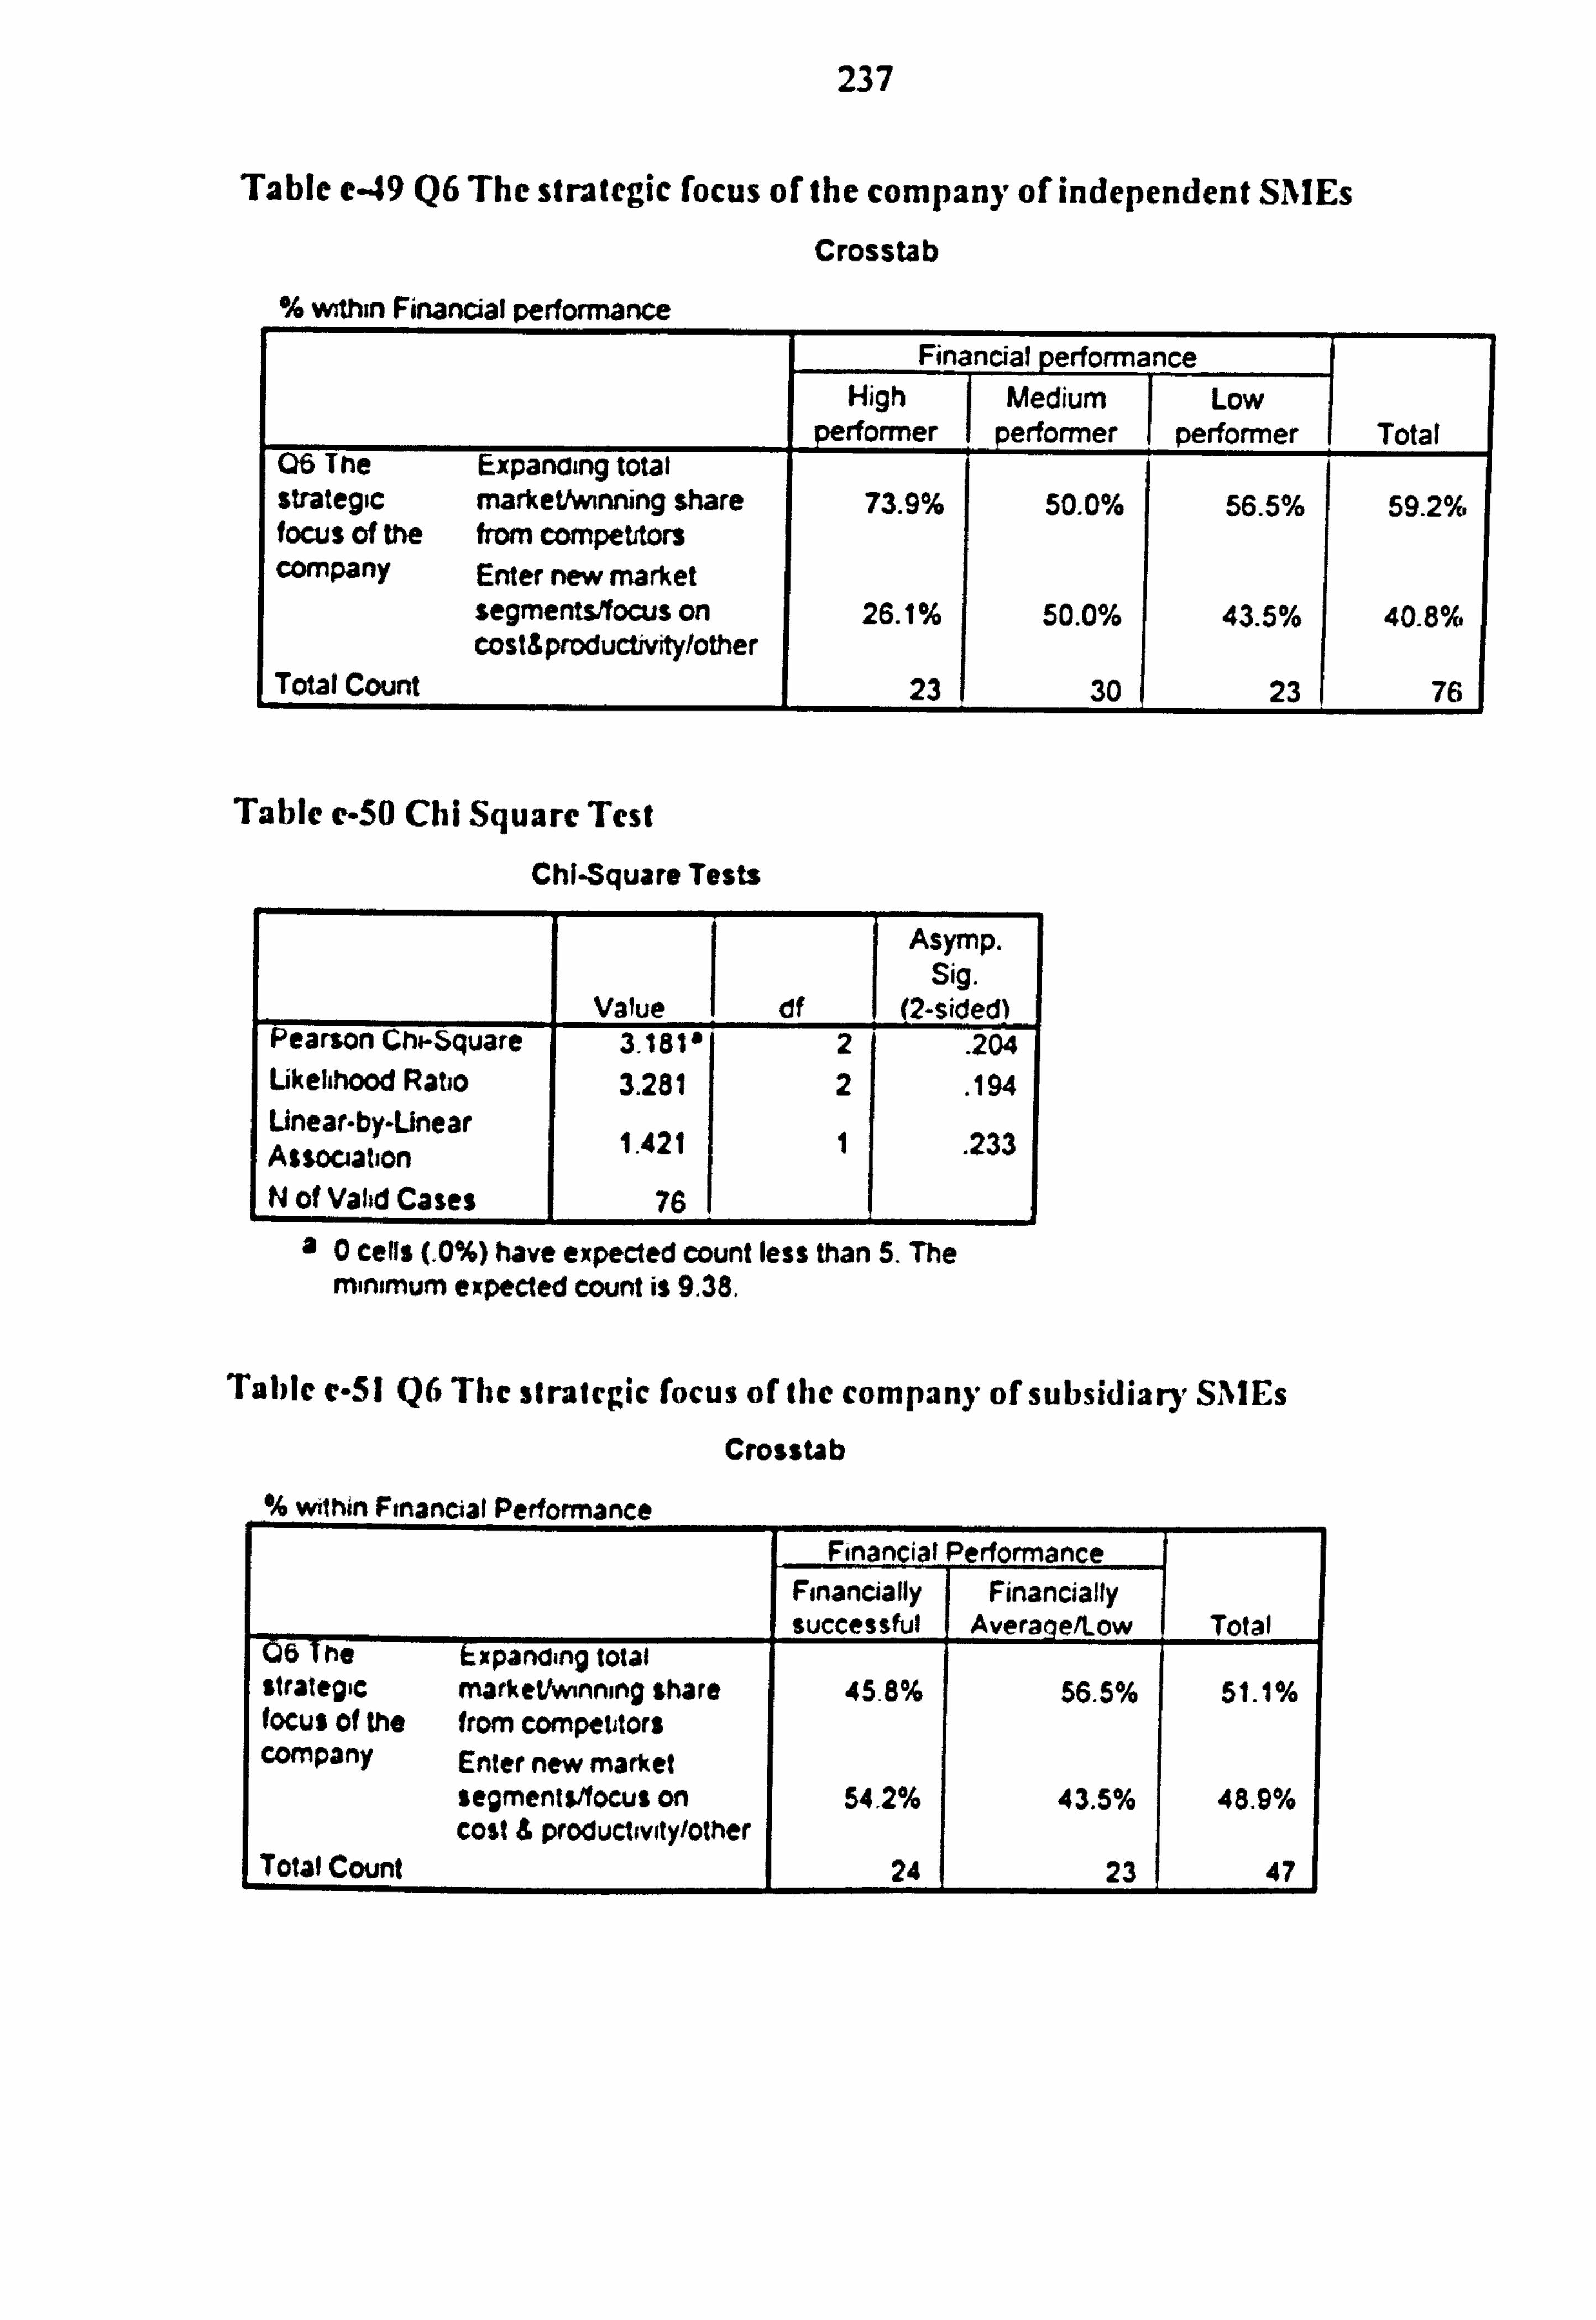
237
Table c49 Q6 The strategic focus of the company of independent SMEs
Crosstab
% within Financial performance Financial perform nce
High Medium Low performer performer performer Total
06 The Expanding total strategic market/winning share 73.9% 50.0% 56.5% 59.2% focus of the from competitors company Enter new market
segmentsrfocus on 26.1% 50.0% 43.5% 40.8% cost&productivity/other
Total Count 23 30 23 76
Table c"50 Chi Square Test Chi-Square Tests
Asymp. Sig.
Value df (2-sided) Pearson Chi-Square 3.181' 2
. 204 Likelihood Ratio 3.281 2 . 194 Linear-by-Linear Association 1.421 1 . 233
N of Valid Cases 76 a0 cells (. 0%) have expected count less than S. The
minimum expected count is 9.38.
Table c-S1 Q6 The strategic focus of the company of subsidiary S11Es Crosstab
°ýG within Financial Performance Financial Performance
Financially Financially successful Avera e/Low Total
8 he Expanding total strategic marketlwinning share 45.8% 56.5% 51.1% focus Of the from competitors company Enter new market
segments</focus on 54.2% 43.5% 48.9% Cost & productivity/other
Total Count 24 23 47
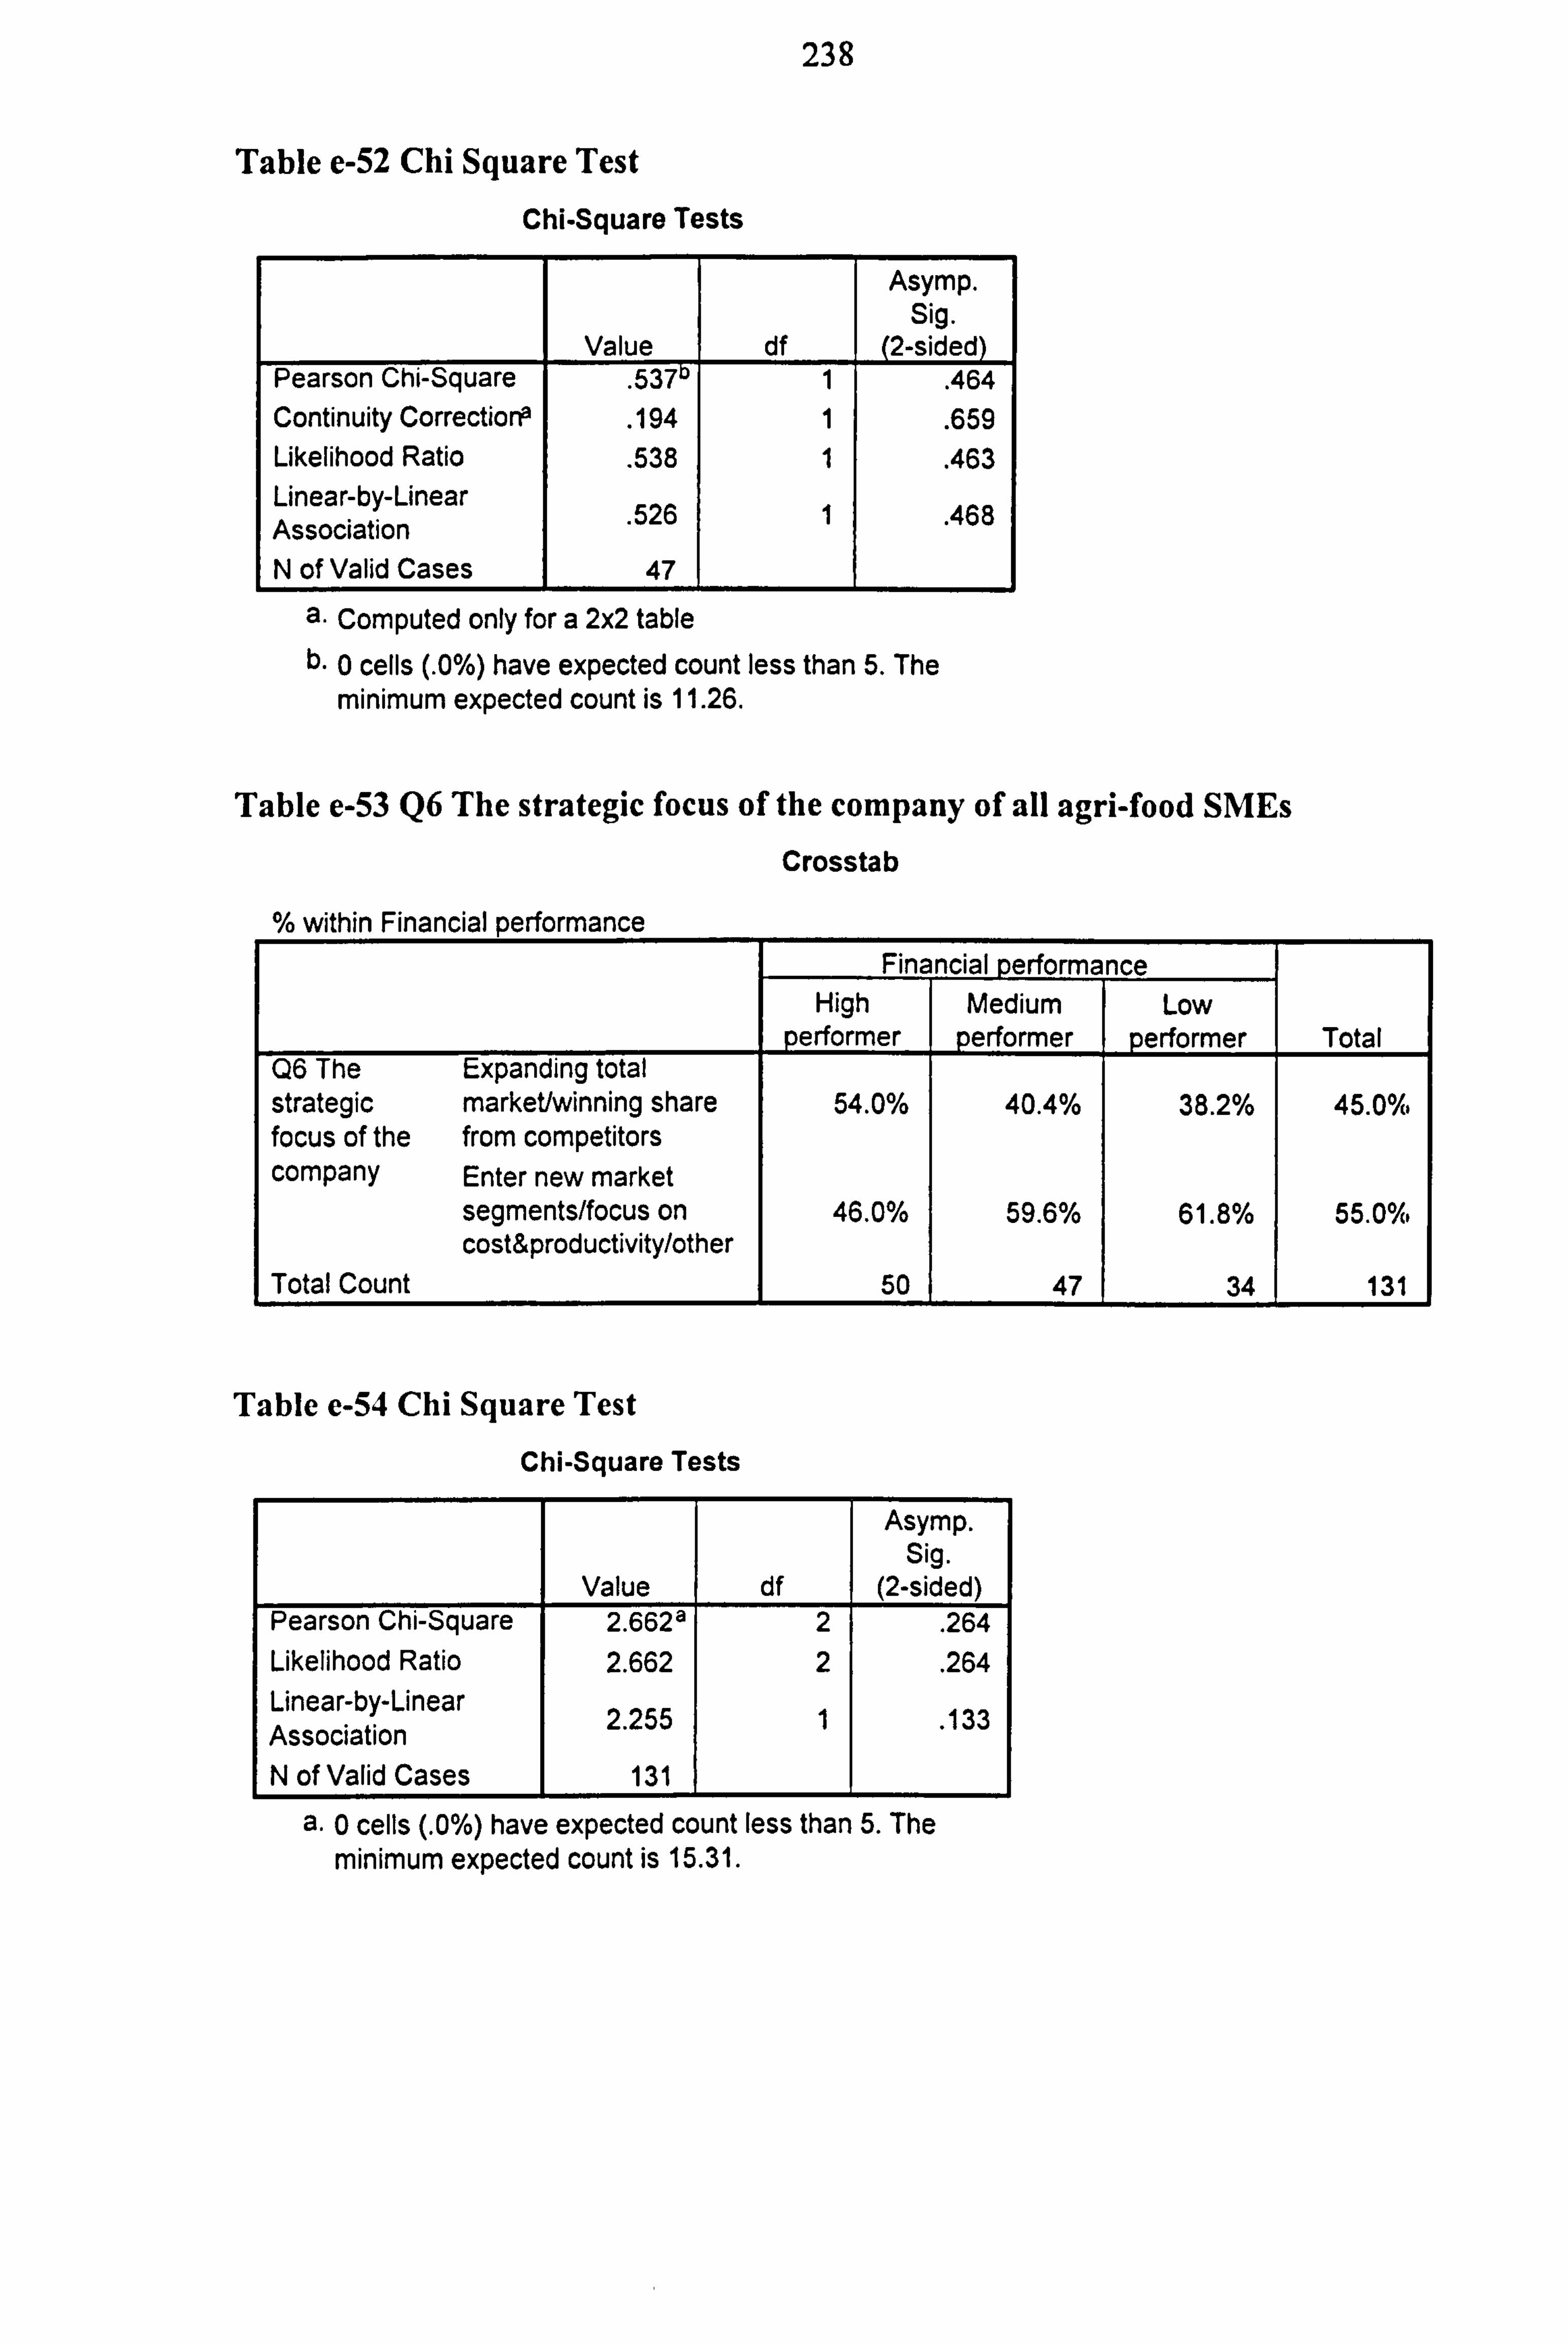
238
Table e-52 Chi Square Test
Chi-Square Tests
Value df
Asymp. Sig.
(2-sided) Pearson Chi-Square 7537 1 . 464 Continuity Corrections
. 194 1 . 659 Likelihood Ratio
. 538 1 . 463 Linear-by-Linear Association . 526 1 . 468
N of Valid Cases 47
a. Computed only for a 2x2 table b. 0 cells (. 0%) have expected count less than 5. The
minimum expected count is 11.26.
Table e-53 Q6 The strategic focus of the company of all agri-food SMEs Crosstab
within Financial performance Financial erformance
High Medium Low performer performer performer Total
Q6 The Expanding total strategic market/winning share 54.0% 40.4% 38.2% 45.00/c. focus of the from competitors company Enter new market
segments/focus on 46.0% 59.6% 61.8% 55.0% cost&productivity/other
Total Count 50 47 34 131
Table e-54 Chi Square Test
Chi-Square Tests
Asymp. Sig.
Value df (2-sided) Pearson Chi-Square 2.6625 2 . 264 Likelihood Ratio 2.662 2 . 264 Linear-by-Linear Association 2.255 1 . 133
N of Valid Cases 131
a. 0 cells (. 0%) have expected count less than 5. The minimum expected count is 15.31.
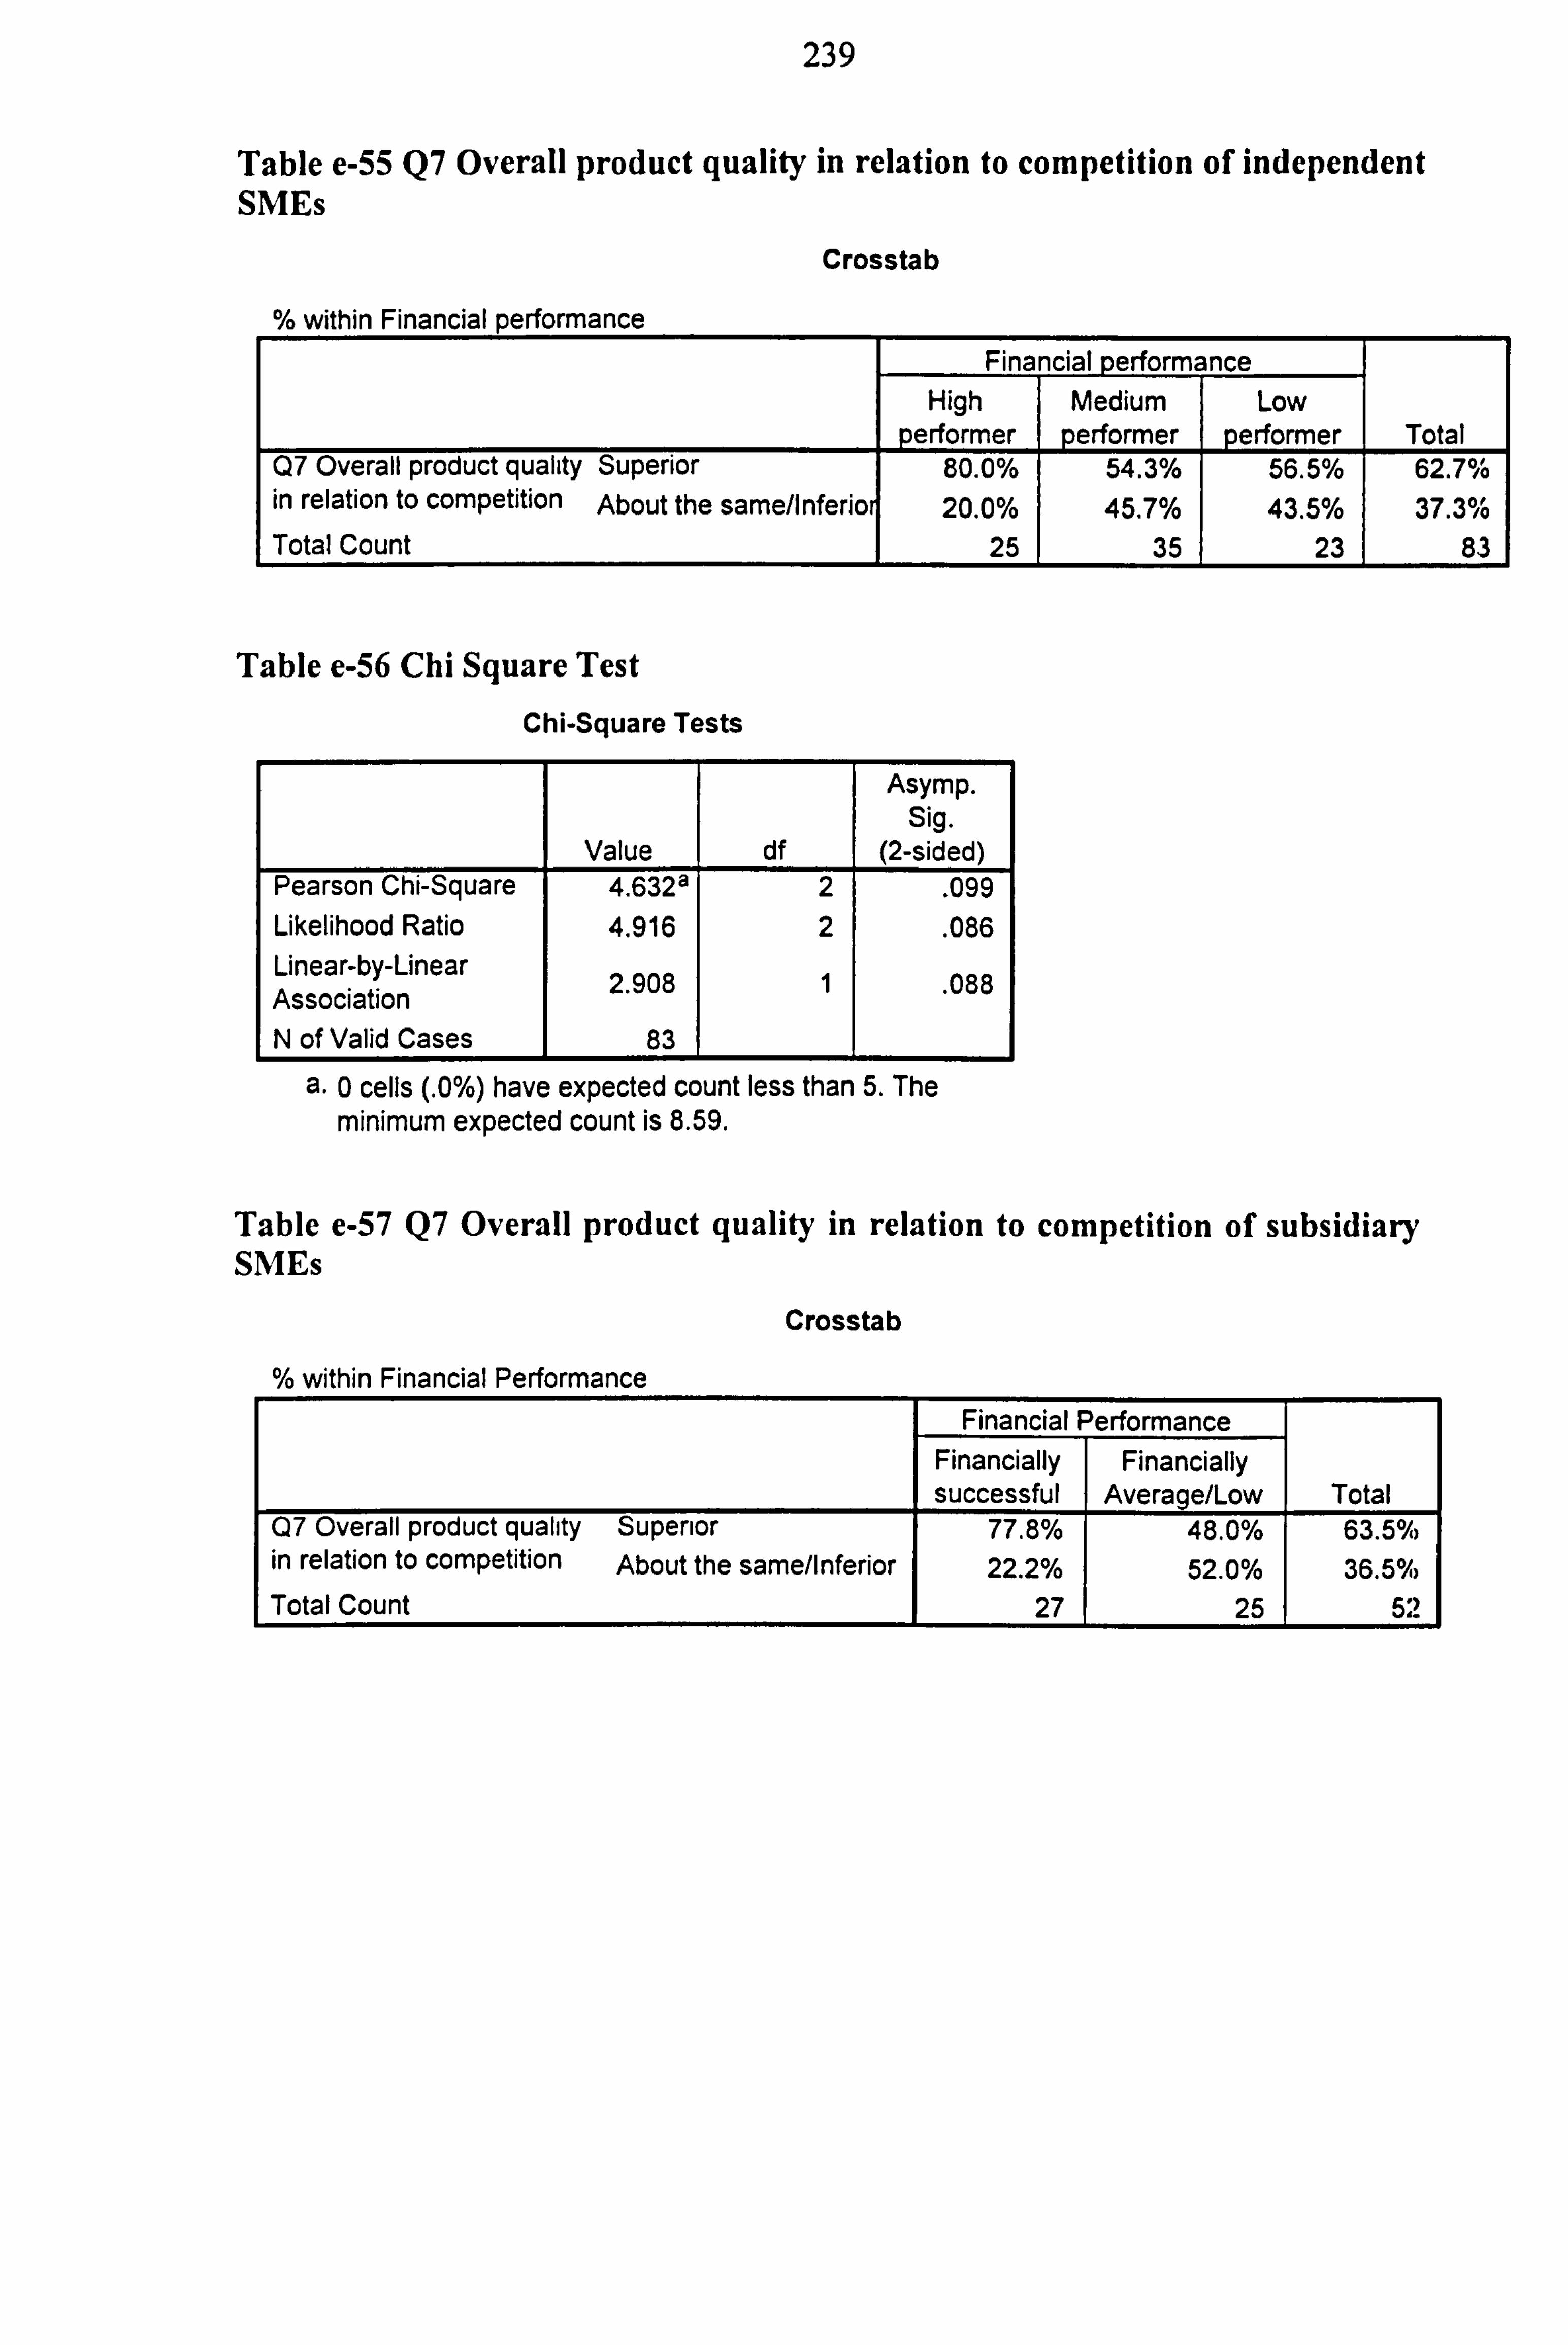
239
Table e-55 Q7 Overall product quality in relation to competition of independent SMEs
Crosstab
within Financial performance Financial performance
High Medium Low performer performer performer Total
Q7 Overall product quality Superior 80.0% 54.3% 56.5% 62.7% in relation to competition About the same/Inferio 20.0% 45.7% 43.5% 37.3% Total Count 25 35 23 83
Table e-56 Chi Square Test
Chi-Square Tests
Asymp. Sig.
Value df (2-sided) Pearson Chi-Square 4.632a 2 . 099 Likelihood Ratio 4.916 2 . 086 Linear-by-Linear Association 2.908 1 . 088
N of Valid Cases 83
a. 0 cells (. 0%) have expected count less than 5. The minimum expected count is 8.59.
Table e-57 Q7 Overall product quality in relation to competition of subsidiary SMEs
Crosstab
% within Financial Performance Financial Performance
Financially Financially successful Average/Low Total
07 Overall product quality Superior 77.8% 48.0% 63.5% in relation to competition About the same/Inferior 22.2% 52.0% 36.50% Total Count 27 25 52
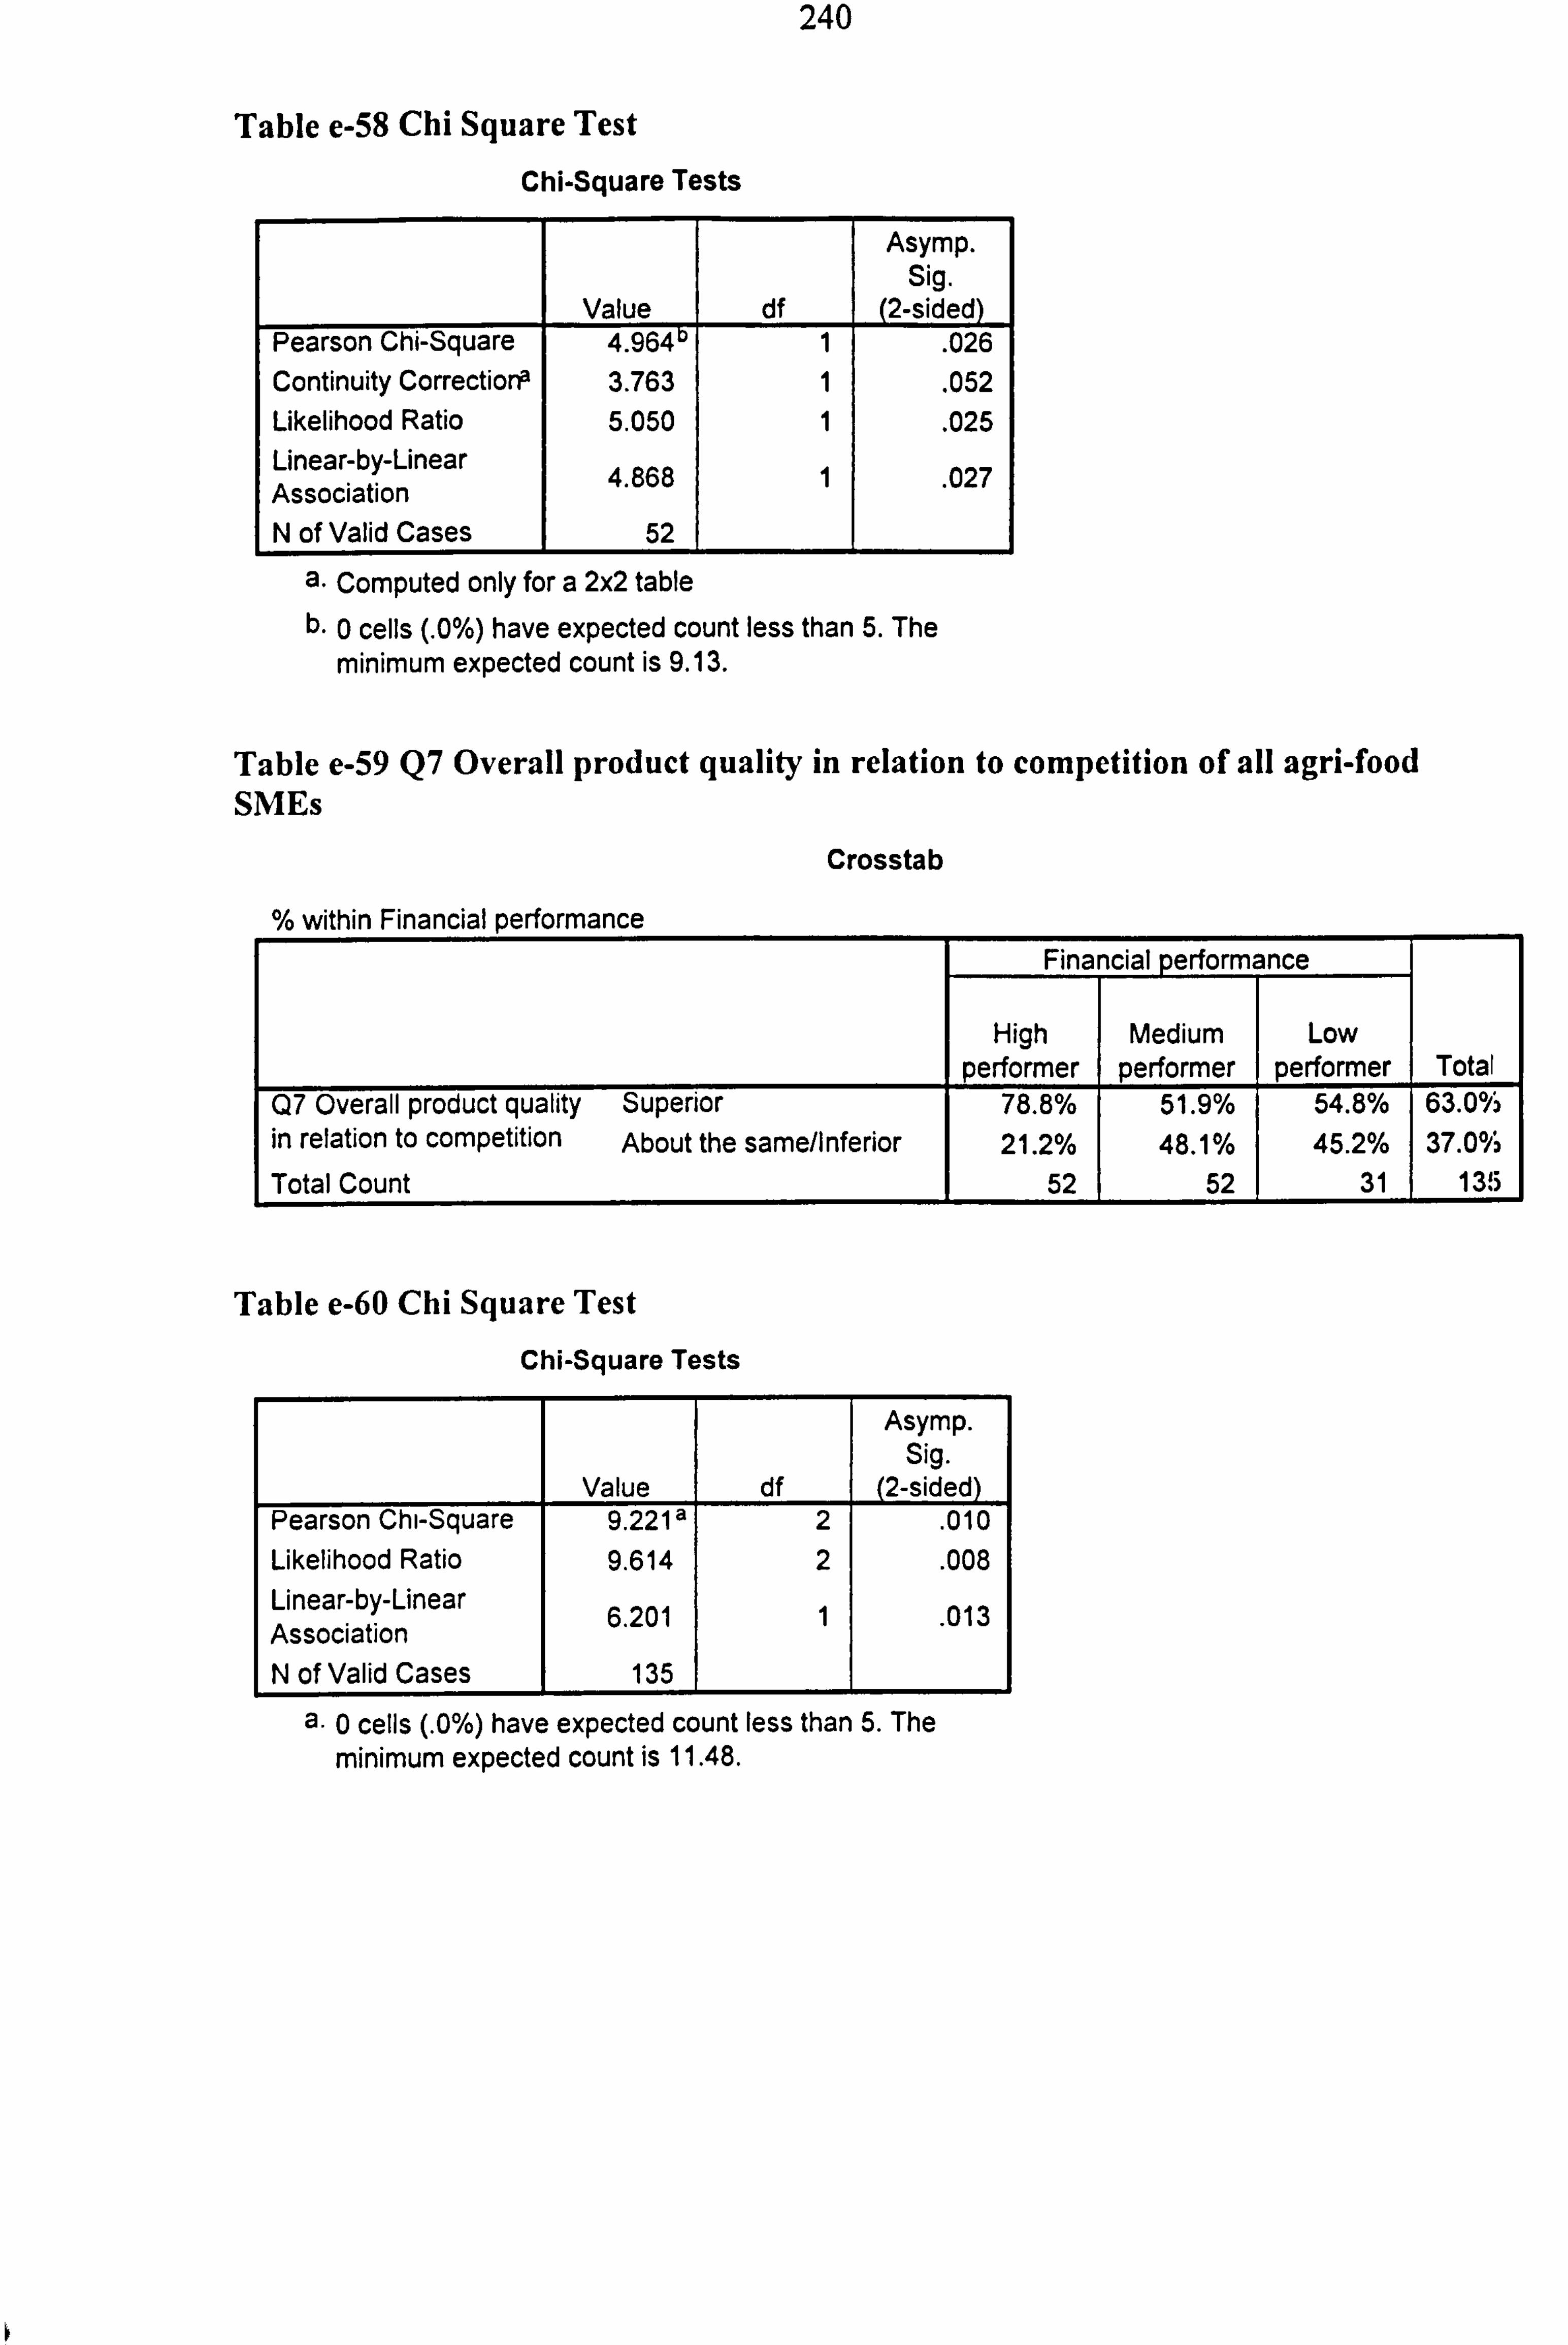
240
Table e-58 Chi Square Test
Chi-Square Tests
Value df
Asymp. Sig.
(2-sided) Pearson Chi-Square 4.96411 1 . 026 Continuity CorrectiorP 3.763 1 . 052 Likelihood Ratio 5.050 1 . 025 Linear-by-Linear Association 4.868 1 . 027
N of Valid Cases 52
a. Computed only for a 2x2 table b. 0 cells (. 0%) have expected count less than 5. The
minimum expected count is 9.13.
Table e-59 Q7 Overall product quality in relation to competition of all agri-food SMEs
Crosstab
% within Financial performance Financial performance
High Medium Low performer performer performer Total
Q7 Overall product quality Superior 78.8% 51.9% 54.8% 63.00h in relation to competition About the same/Inferior 21.2% 48.1% 45.2% 37.0% Total Count 52 52 31 13,15
Table e-60 Chi Square Test
Chi-Square Tests
Asymp. Sig.
Value df (2-sided) Pearson Chi-Square 9.221 a 2 . 010 Likelihood Ratio 9.614 2 . 008 Linear-by-Linear 6.201 1 . 013 Association N of Valid Cases 135
0 cells (. 0%) have expected count less than 5. The minimum expected count is 11.48.
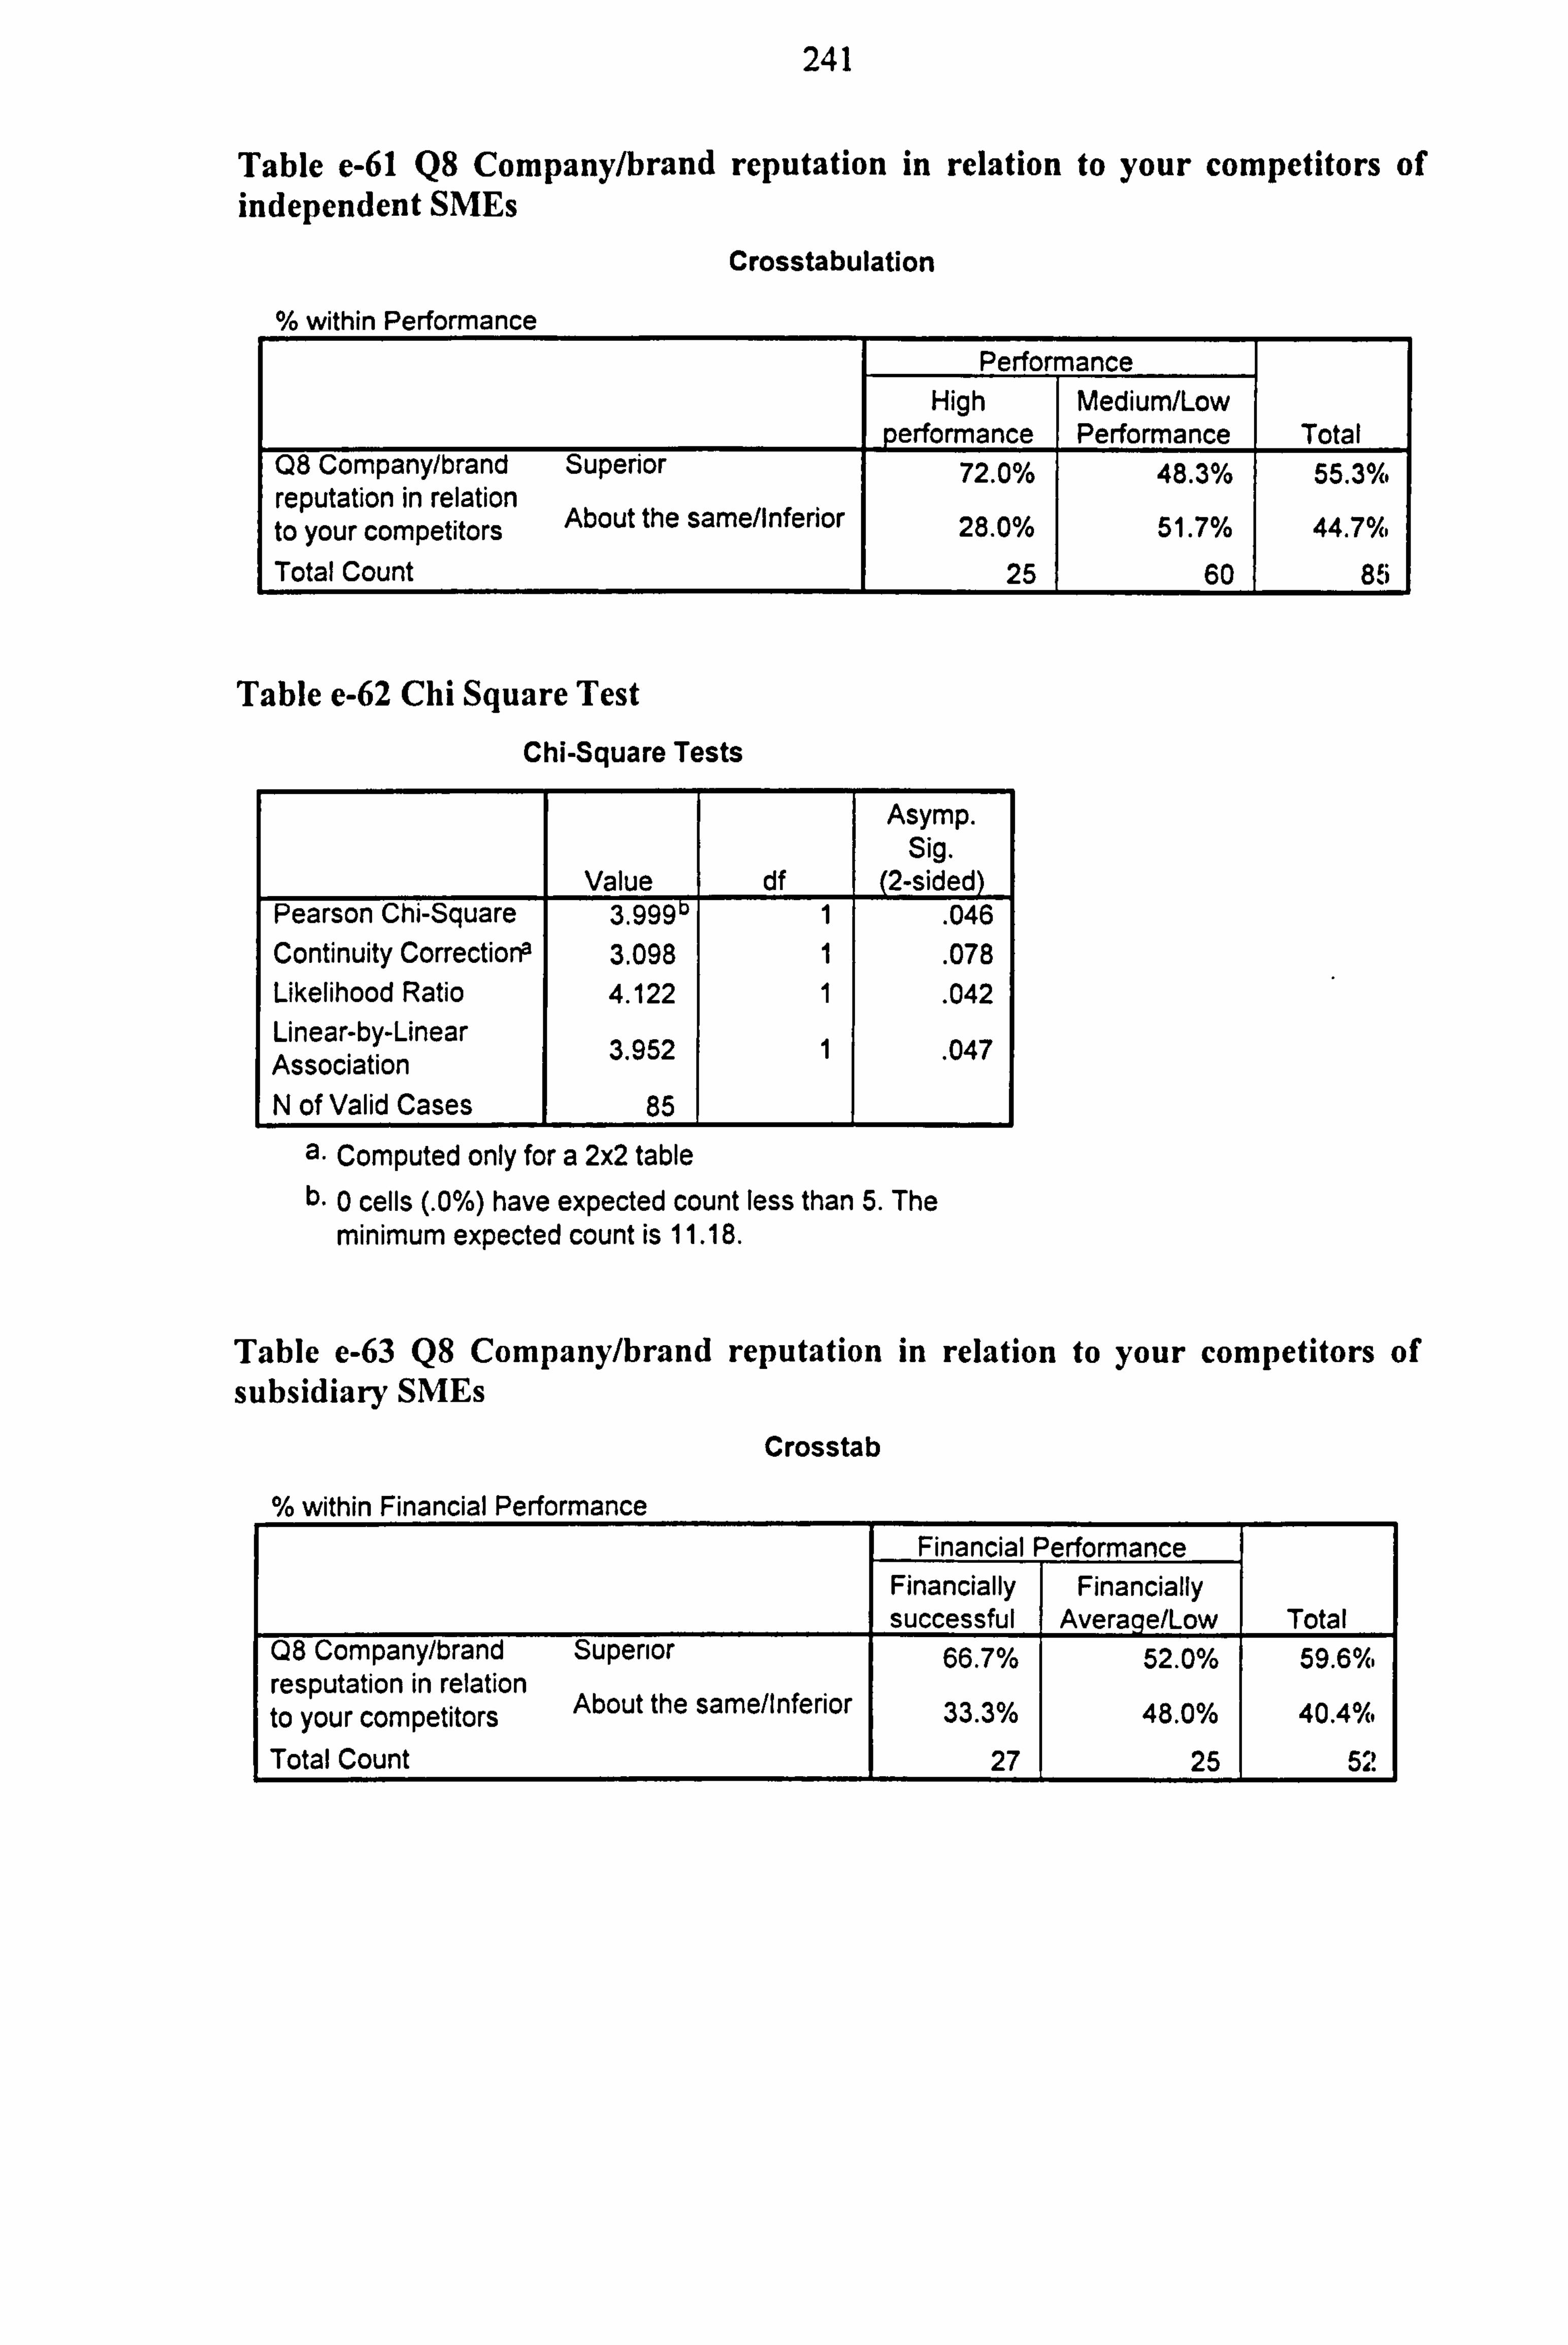
241
Table e-61 Q8 Company/brand reputation in relation to your competitors of independent SMEs
Crosstabulation
% within Performance
Performance High Medium/Low
performanc Performance Total Q8 Company/brand Superior 72.0% 48.3% 55.3%. reputation in relation to your competitors About the same/Inferior 28.0% 51.7% 44.7%. Total Count 25 60 85
Table e-62 Chi Square Test
Chi-Square Tests
Value df
Asymp. Sig.
(2-sided) Pearson Chi-Square 3.99911 1 . 046 Continuity Corrections 3.098 1 . 078 Likelihood Ratio 4.122 1 . 042 Linear-by-Linear Association 3.952 1 . 047
N of Valid Cases 85
a. Computed only for a 2x2 table b. 0 cells (. 0%) have expected count less than 5. The
minimum expected count is 11.18.
Table e-63 Q8 Company/brand reputation in relation to your competitors of subsidiary SMEs
Crosstab
within Financial Performance Financial Performance
Financially Financially successful Avera e/Low Total
Q8 Company/brand Superior 66.7% 52.0% 59.6%. resputation in relation to your competitors About the same/Inferior 33.3% 48.0% 40.4%,
Total Count 27 25 52
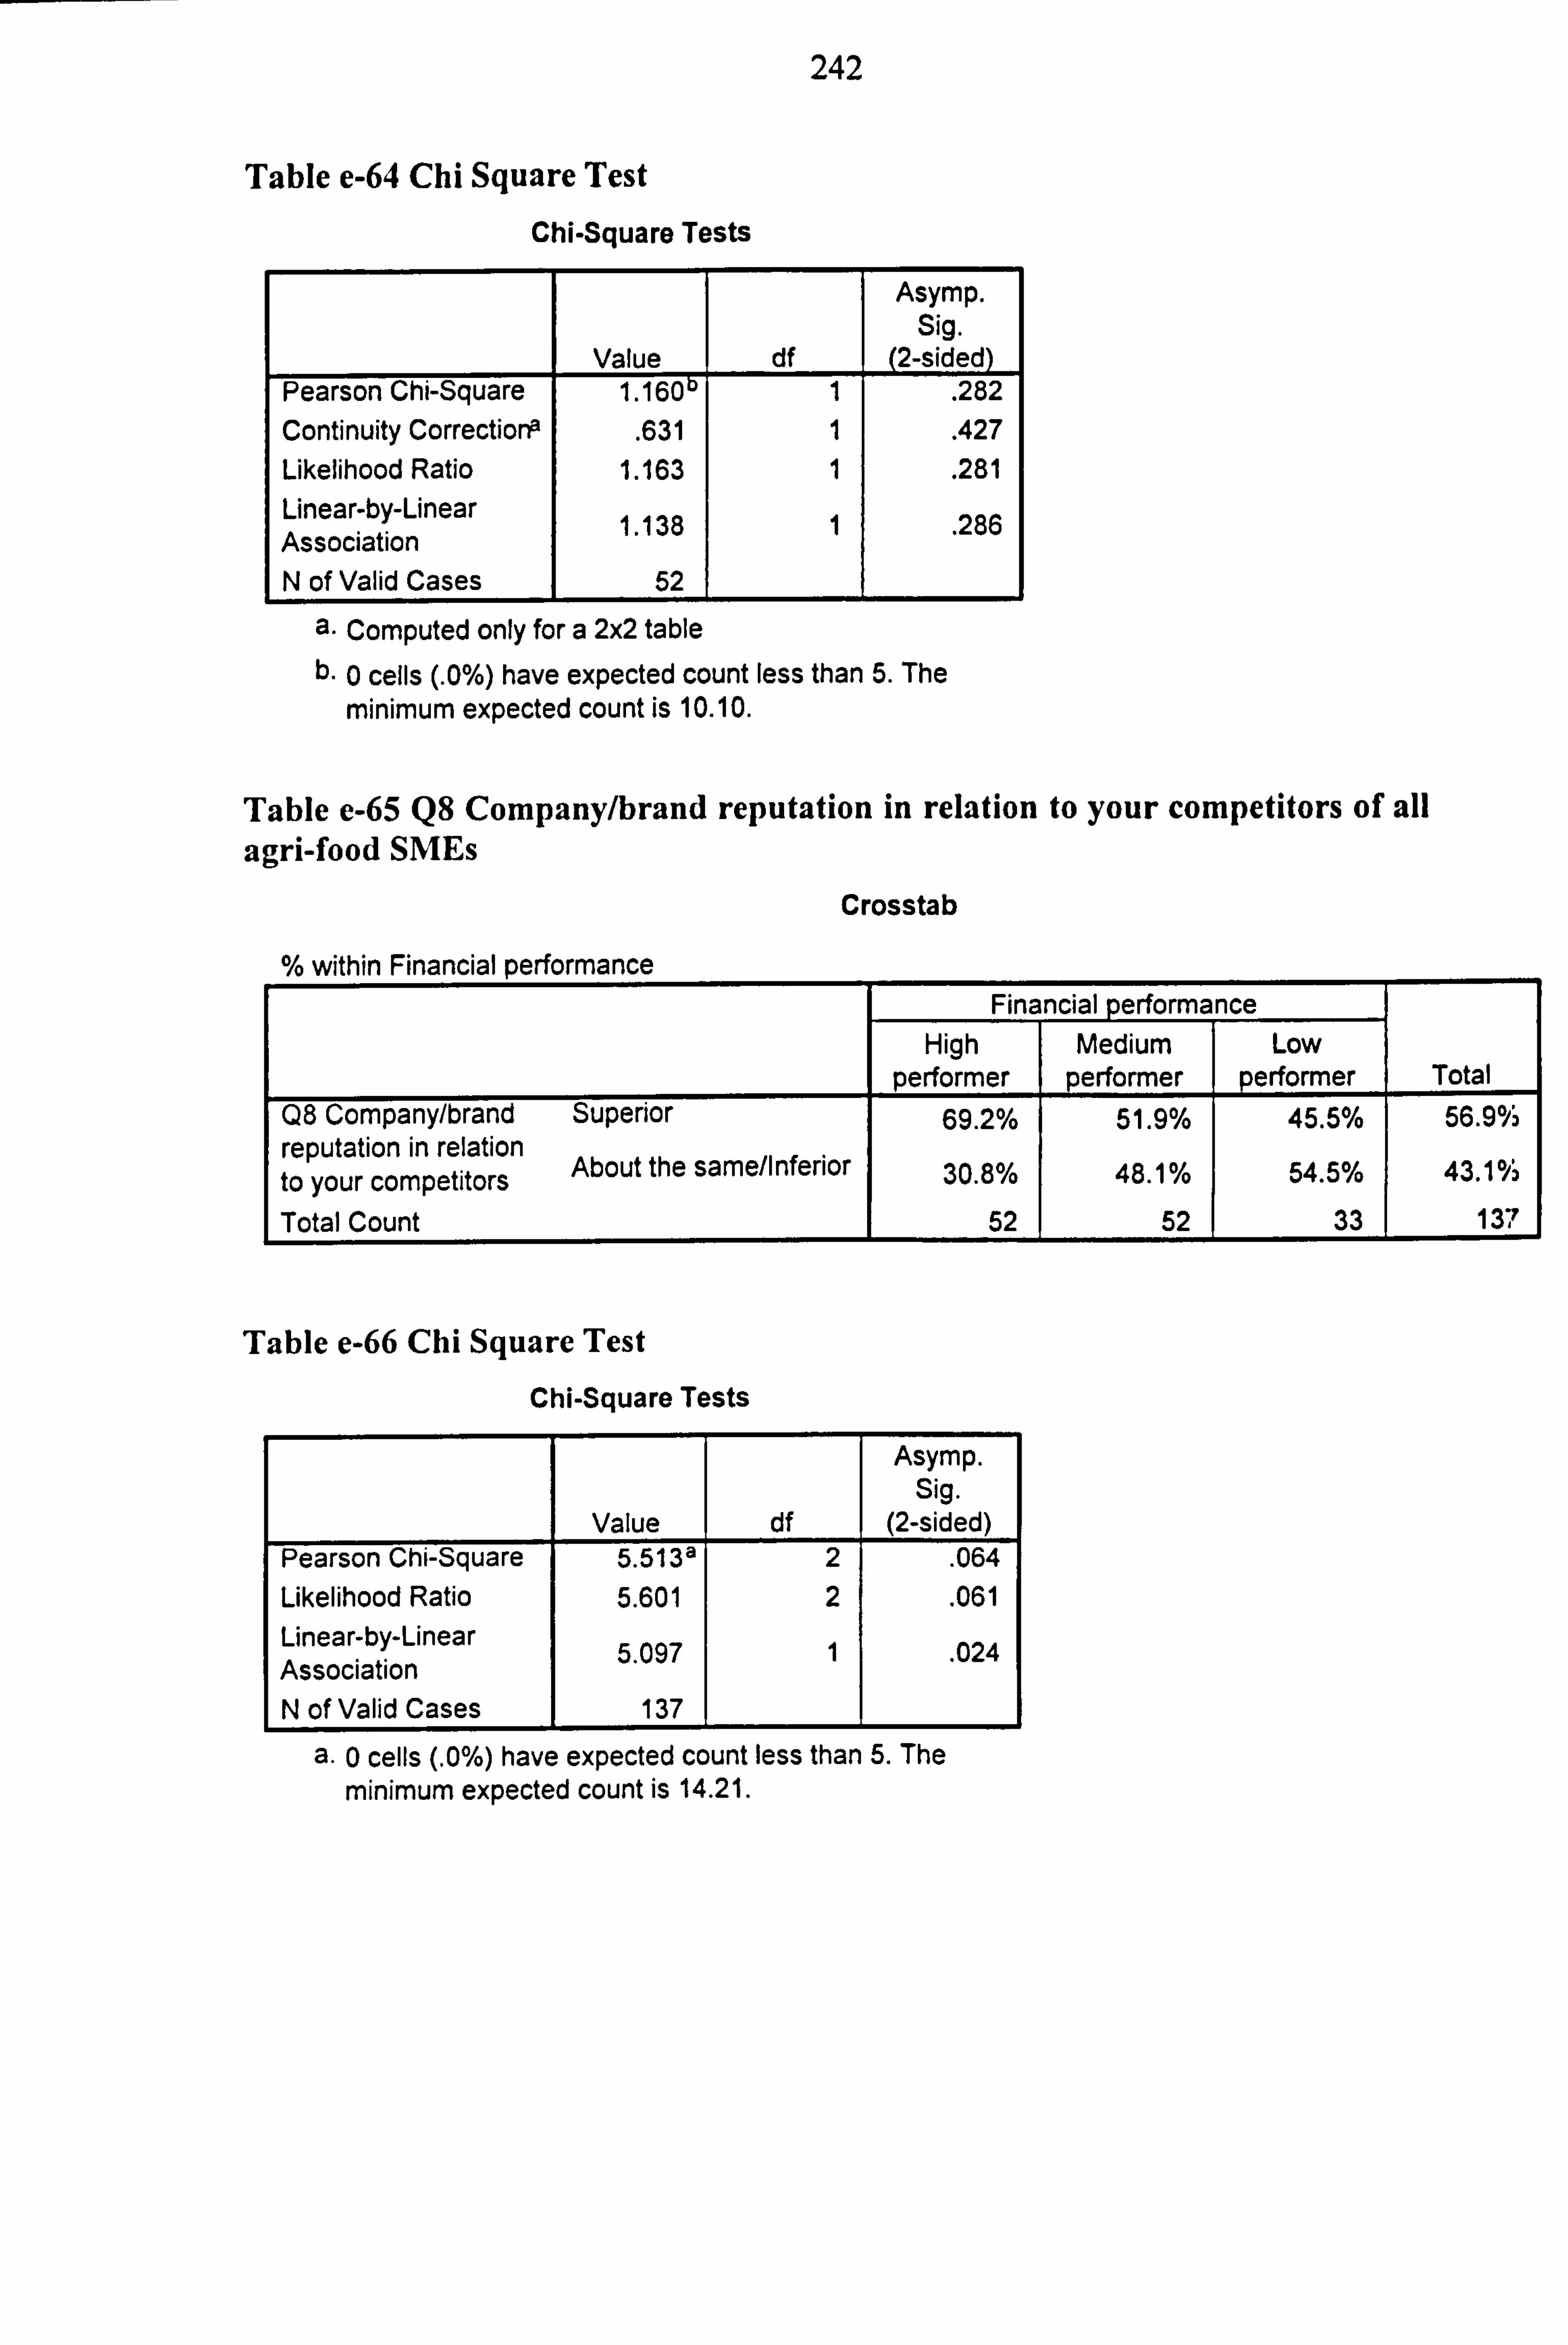
242
Table e-64 Chi Square Test
Chi-Square Tests
Value df
Asymp. Sig.
(2-sided) Pearson Chi-Square 1.160 1 . 282 Continuity Correctiona . 631 1 . 427 Likelihood Ratio 1.163 1 . 281 Linear-by-Linear 1 138 1 . 286 Association . N of Valid Cases 52
a. Computed only for a 2x2 table b. 0 cells (. 0%) have expected count less than 5. The
minimum expected count is 10.10.
Table e-65 Q8 Company/brand reputation in relation to your competitors of all agri-food SMEs
Crosstab
% within Financial performance Financial performance
High Medium Low performer performer performer Total
Q8 Company/brand Superior 69.2% 51.9% 45.5% 56.9% reputation in relation to your competitors
About the same/Inferior 30.8% 48.1% 54.5% 43.1 %
Total Count 52 52 33 137
Table e-66 Chi Square Test
Chi-Square Tests
Asymp. Sig.
Value df (2-sided) Pearson Chi-Square 5.513a 2
. 064
Likelihood Ratio 5.601 2 . 061 Linear-by-Linear 097 5 1 . 024 Association . N of Valid Cases 137
a. 0 cells (. 0%) have expected count less than 5. The minimum expected count is 14.21.
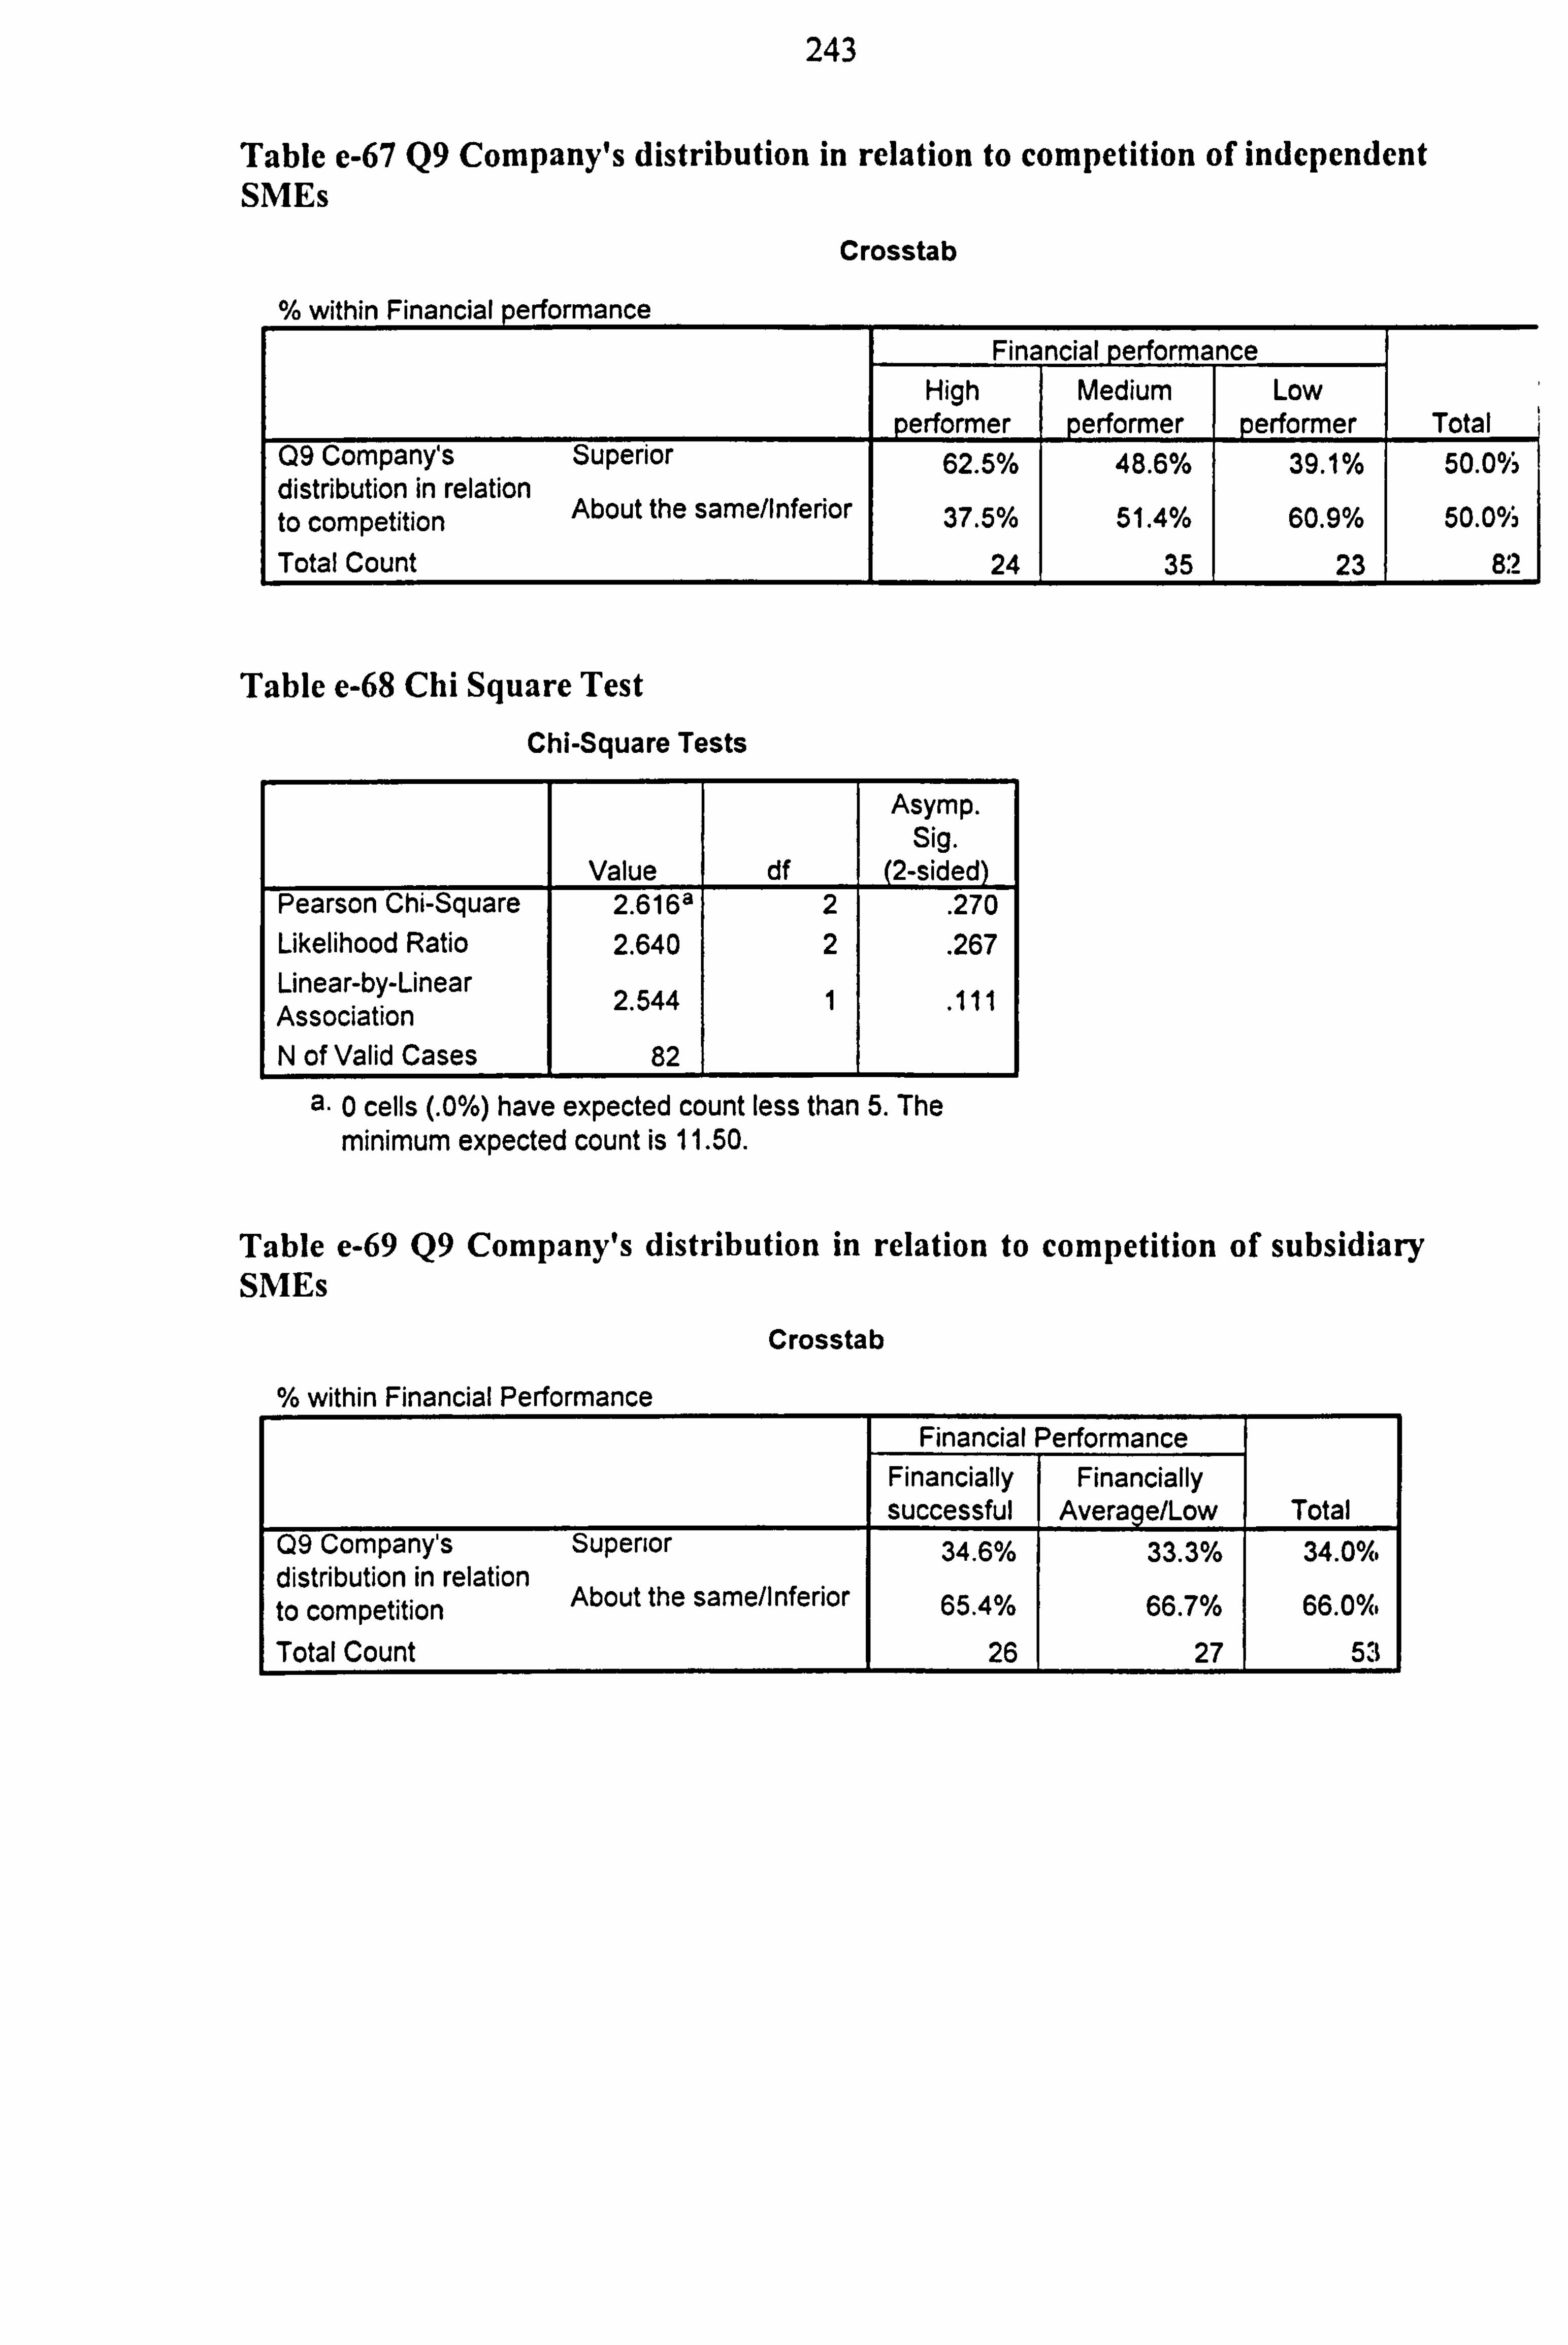
243
Table e-67 Q9 Company's distribution in relation to competition of independent SMEs
Crosstab
% within Financial performance Financial performance
High Medium Low performer performer performer Total
Q9 Company's Superior 62.5% 48.6% 39.1% 50.0°iß distribution in relation to competition About the same/Inferior 37.5% 51.4% 60.9% 50.00A
Total Count 24 35 23 82
Table e-68 Chi Square Test
Chi-Square Tests
Asymp. Sig.
Value df (2-sided) Pearson Chi-Square 2.616a 2 . 270 Likelihood Ratio 2.640 2 . 267 Linear-by-Linear Association 2.544 1 . 111
N of Valid Cases 82
0 cells (. 0%) have expected count less than 5. The minimum expected count is 11.50.
Table e-69 Q9 Company's distribution in relation to competition of subsidiary SMEs
Crosstab
within Financial Performance Financial Performance
Financially Financially successful Average/Low Total
Q9 Company's Superior 34.6% 33.3% 34.0%<. distribution in relation to competition
About the same/Inferior 65.4% 66.7% 66.0%,
Total Count 26 27 53
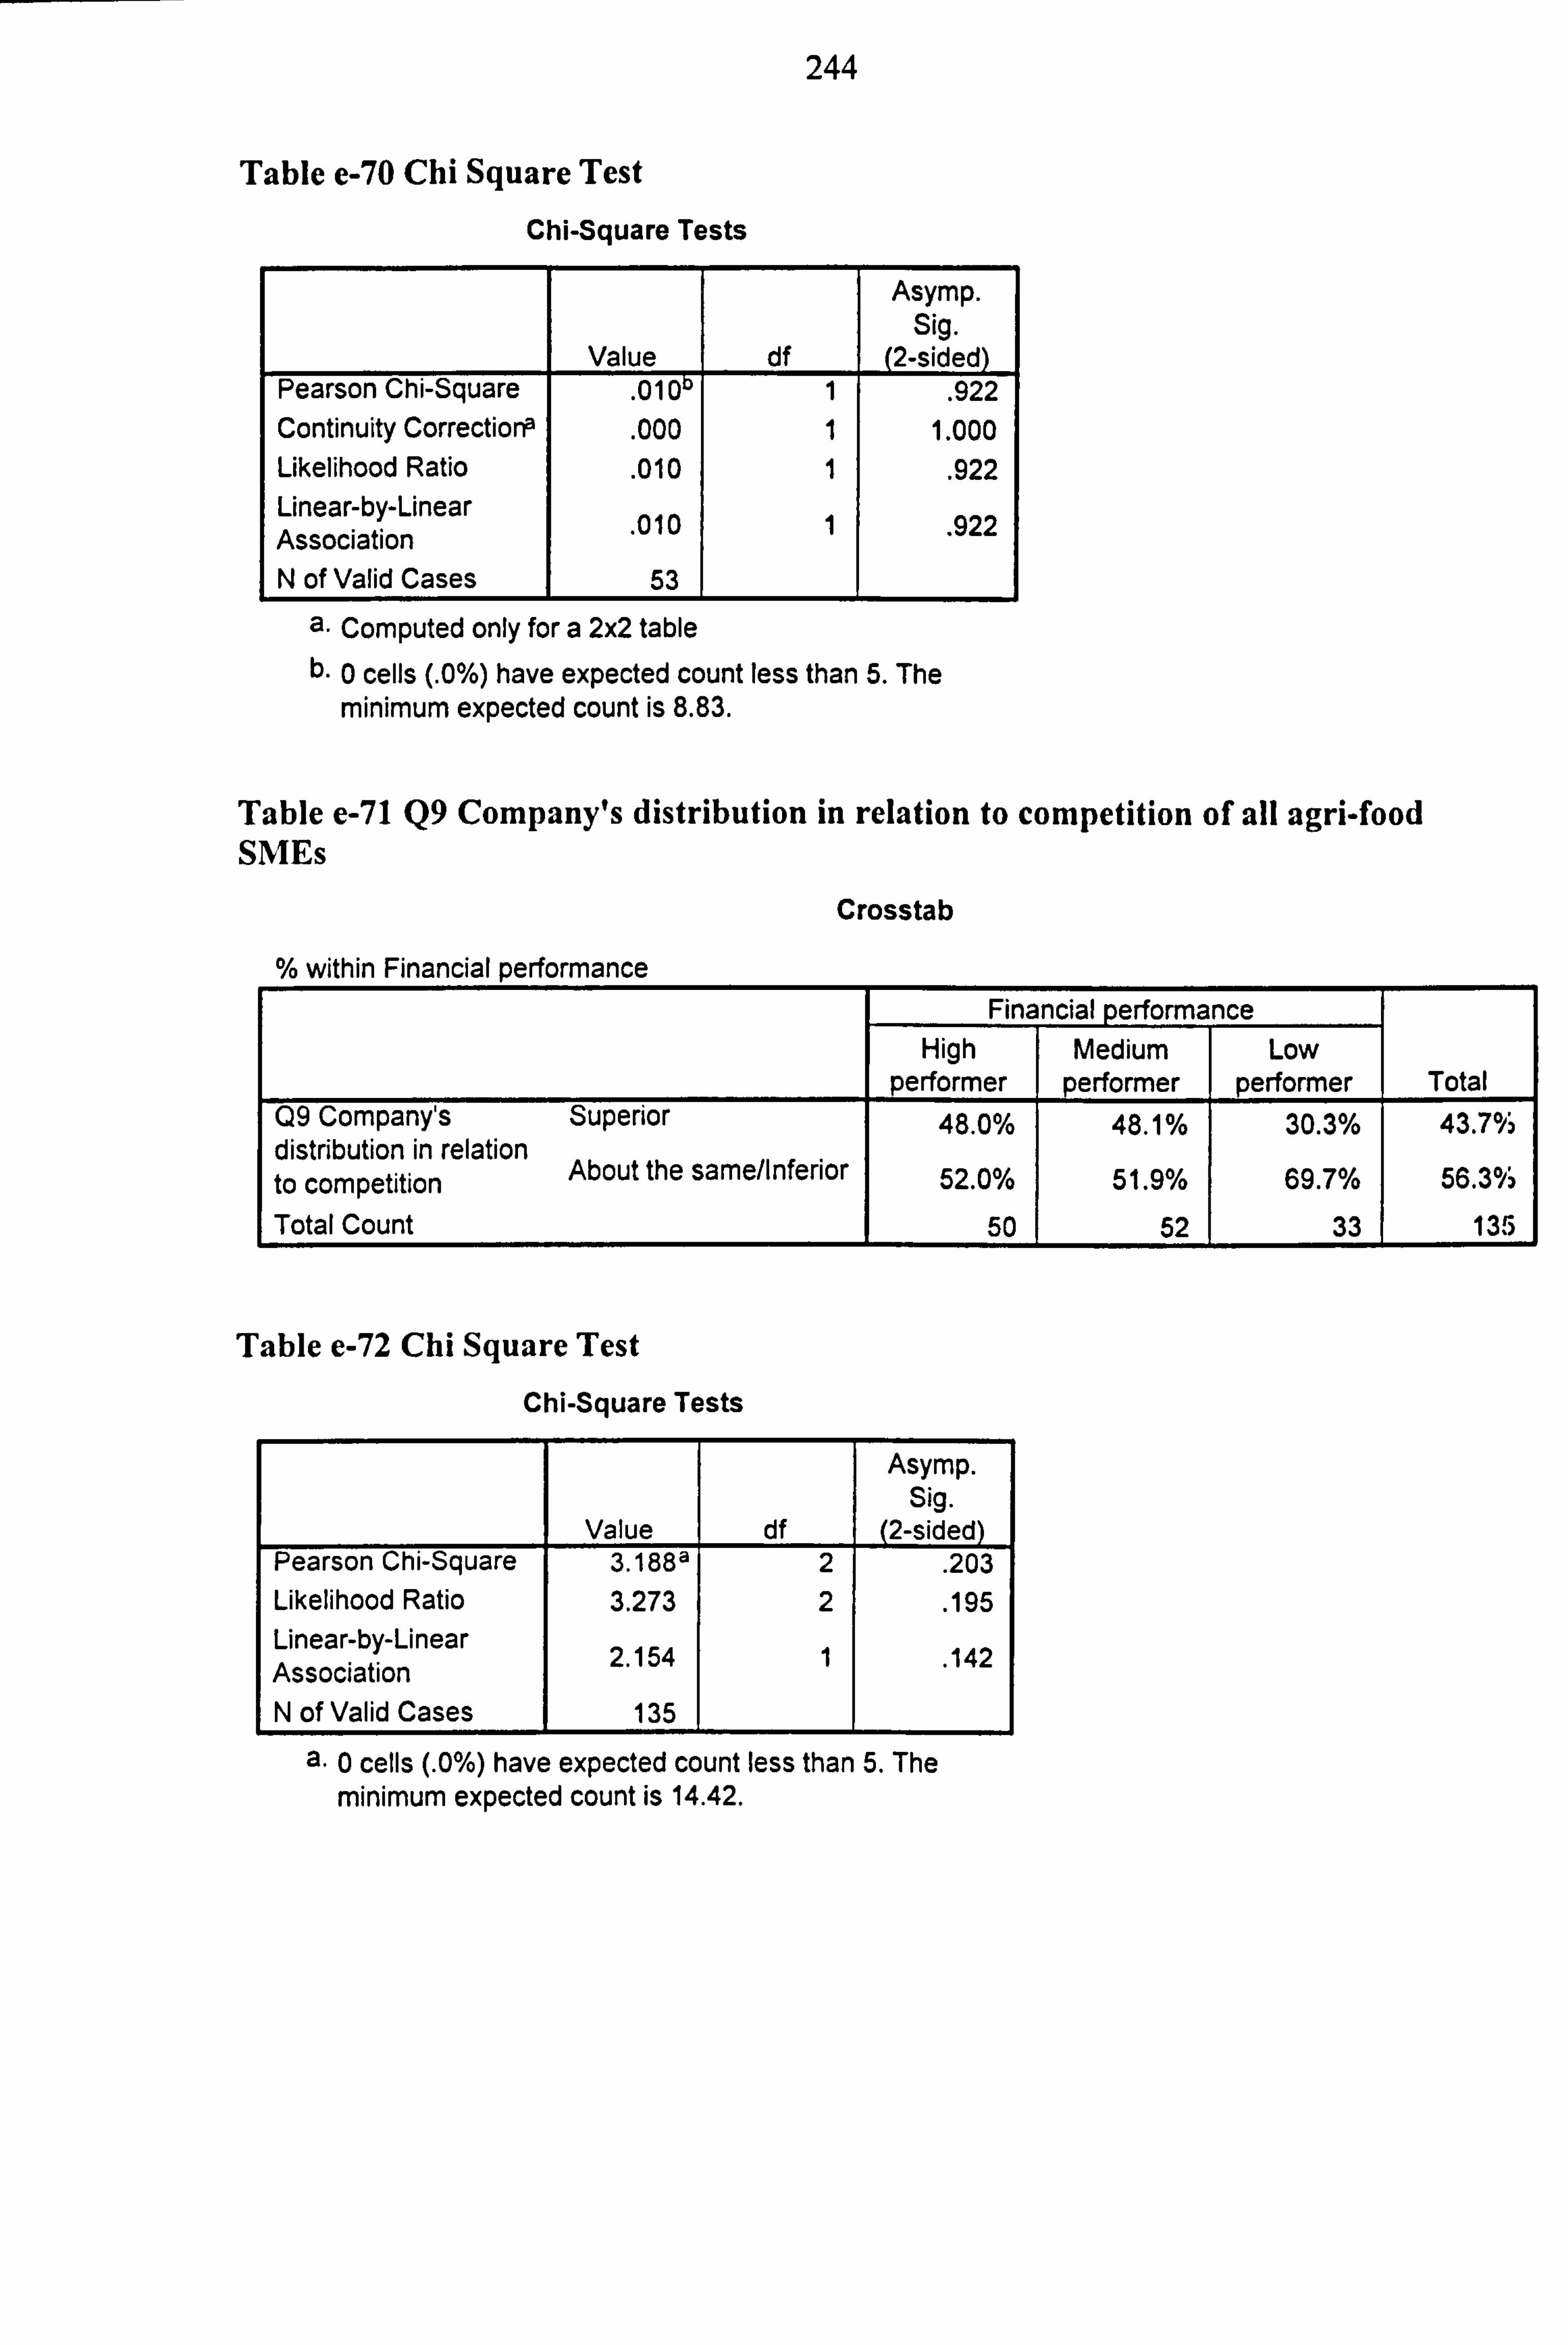
244
Table e-70 Chi Square Test
Chi-Square Tests
Value df
Asymp. Sig.
(2-sided) Pearson Chi-Square
. 01011 1 . 922 Continuity CorrectiorP
. 000 1 1.000 Likelihood Ratio
. 010 1 . 922 Linear-by-Linear Association . 010 1 . 922
N of Valid Cases 53
a. Computed only for a 2x2 table b. 0 cells (. 0%) have expected count less than 5. The
minimum expected count is 8.83.
Table e-71 Q9 Company's distribution in relation to competition of all agri-food SMEs
Crosstab
within Financial performance Financial performance
High Medium Low performer performer performer Total
Q9 Company's Superior 48.0% 48.1% 30.3% 43.7% distribution in relation to competition
About the same/Inferior 52.0% 51.9% 69.7% 56.3%
Total Count 50 52 33 135
Table e-72 Chi Square Test
Chi-Square Tests
Asymp. Sig.
Value df (2-sided) Pearson Chi-Square 3.188a 2
. 203
Likelihood Ratio 3.273 2 . 195 Linear-by-Linear Association 2.154 1 . 142
N of Valid Cases 135
a. 0 cells (. 0%) have expected count less than 5. The minimum expected count is 14.42.
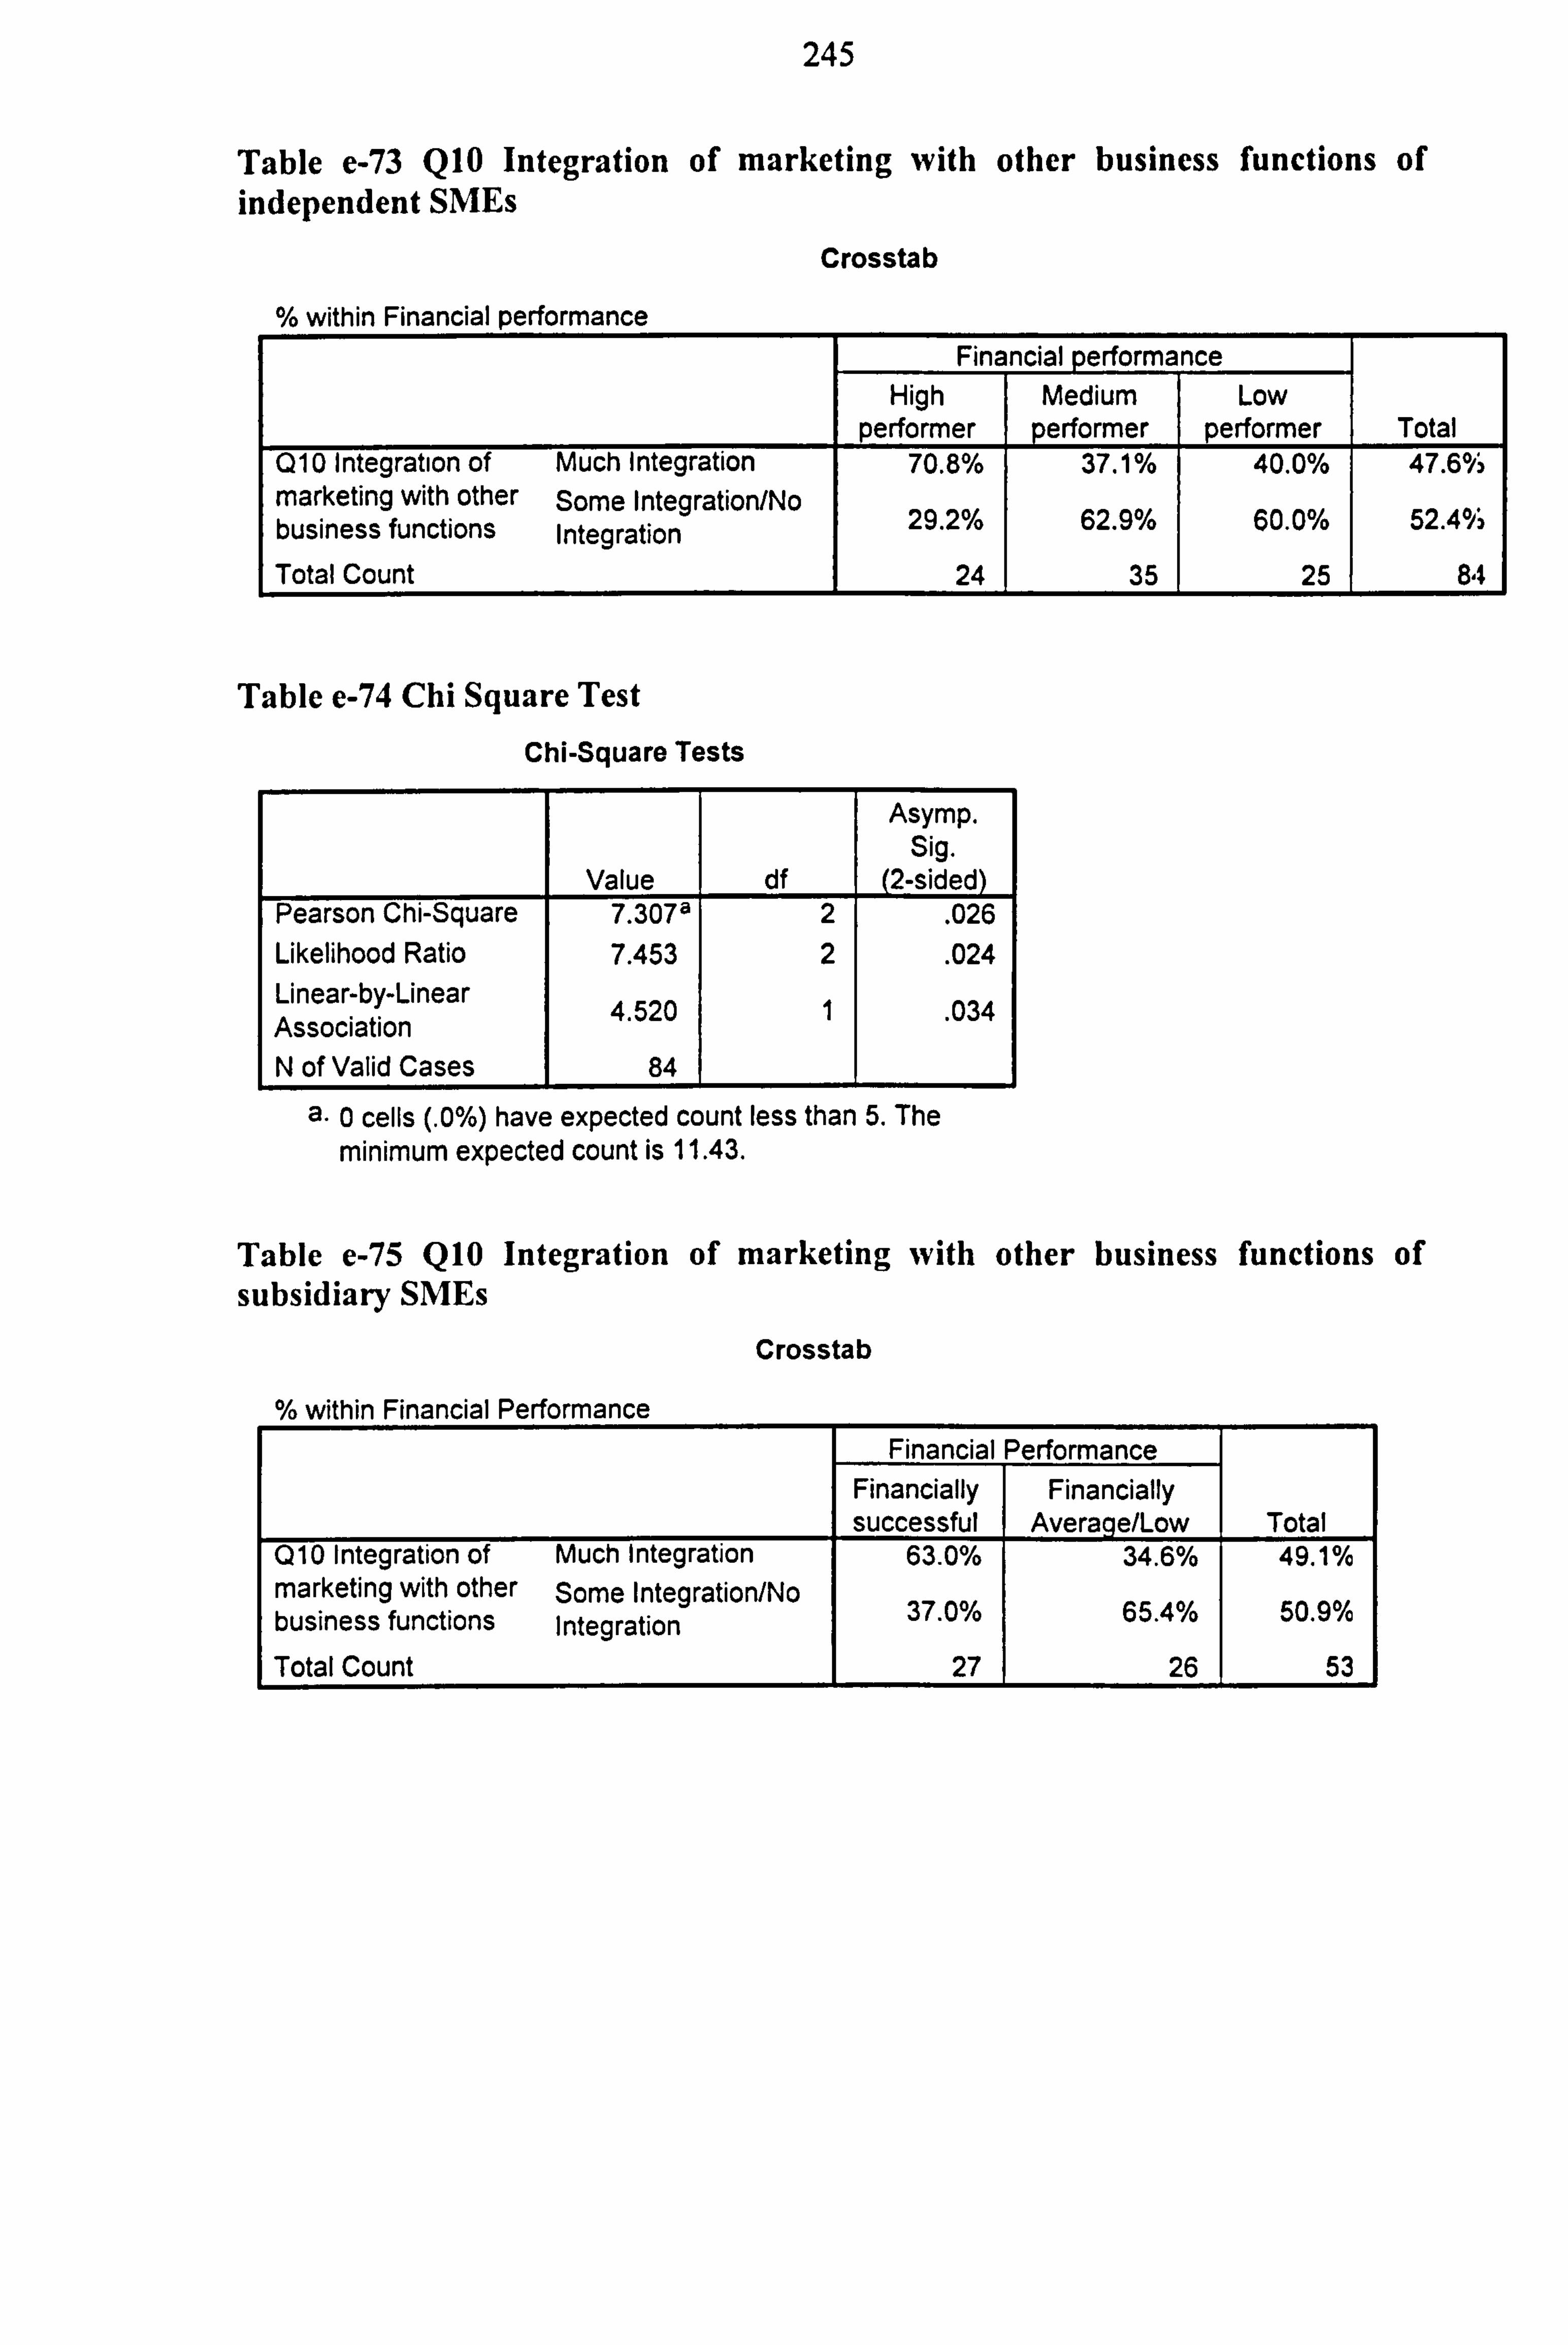
245
Table e-73 Q10 Integration of marketing with other business functions of independent SMEs
Crosstab
% within Financial performance Financial perform nce
High Medium Low performer performer performer Total
Q10 Integration of Much Integration 70.8% 37.1% 40.0% 47.6°h marketing with other Some Integration/No business functions Integration 0 29.2 /° 0 62.9 /0 0 60.0 /0 52.40);
Total Count 24 35 25 84
Table e-74 Chi Square Test
Chi-Square Tests
Asymp. Sig.
Value df (2-sided) Pearson Chi-Square 7.3078 2 . 026 Likelihood Ratio 7.453 2 . 024 Linear-by-Linear 4.520 1 . 034 Association N of Valid Cases 84
a. 0 cells (. 0%) have expected count less than 5. The minimum expected count is 11.43.
Table e-75 Q10 Integration of marketing with other business functions of subsidiary SMEs
Crosstab
% within Financial Performance
Financial Performance Financially Financially successful Average/Low Total
Q10 Integration of Much Integration 63.0% 34.6% 49.1% marketing with other Some Integration/No business functions Integration 0 37.0 /0 0 65.4 /0 0 50.9 /o
Total Count 27 26 53
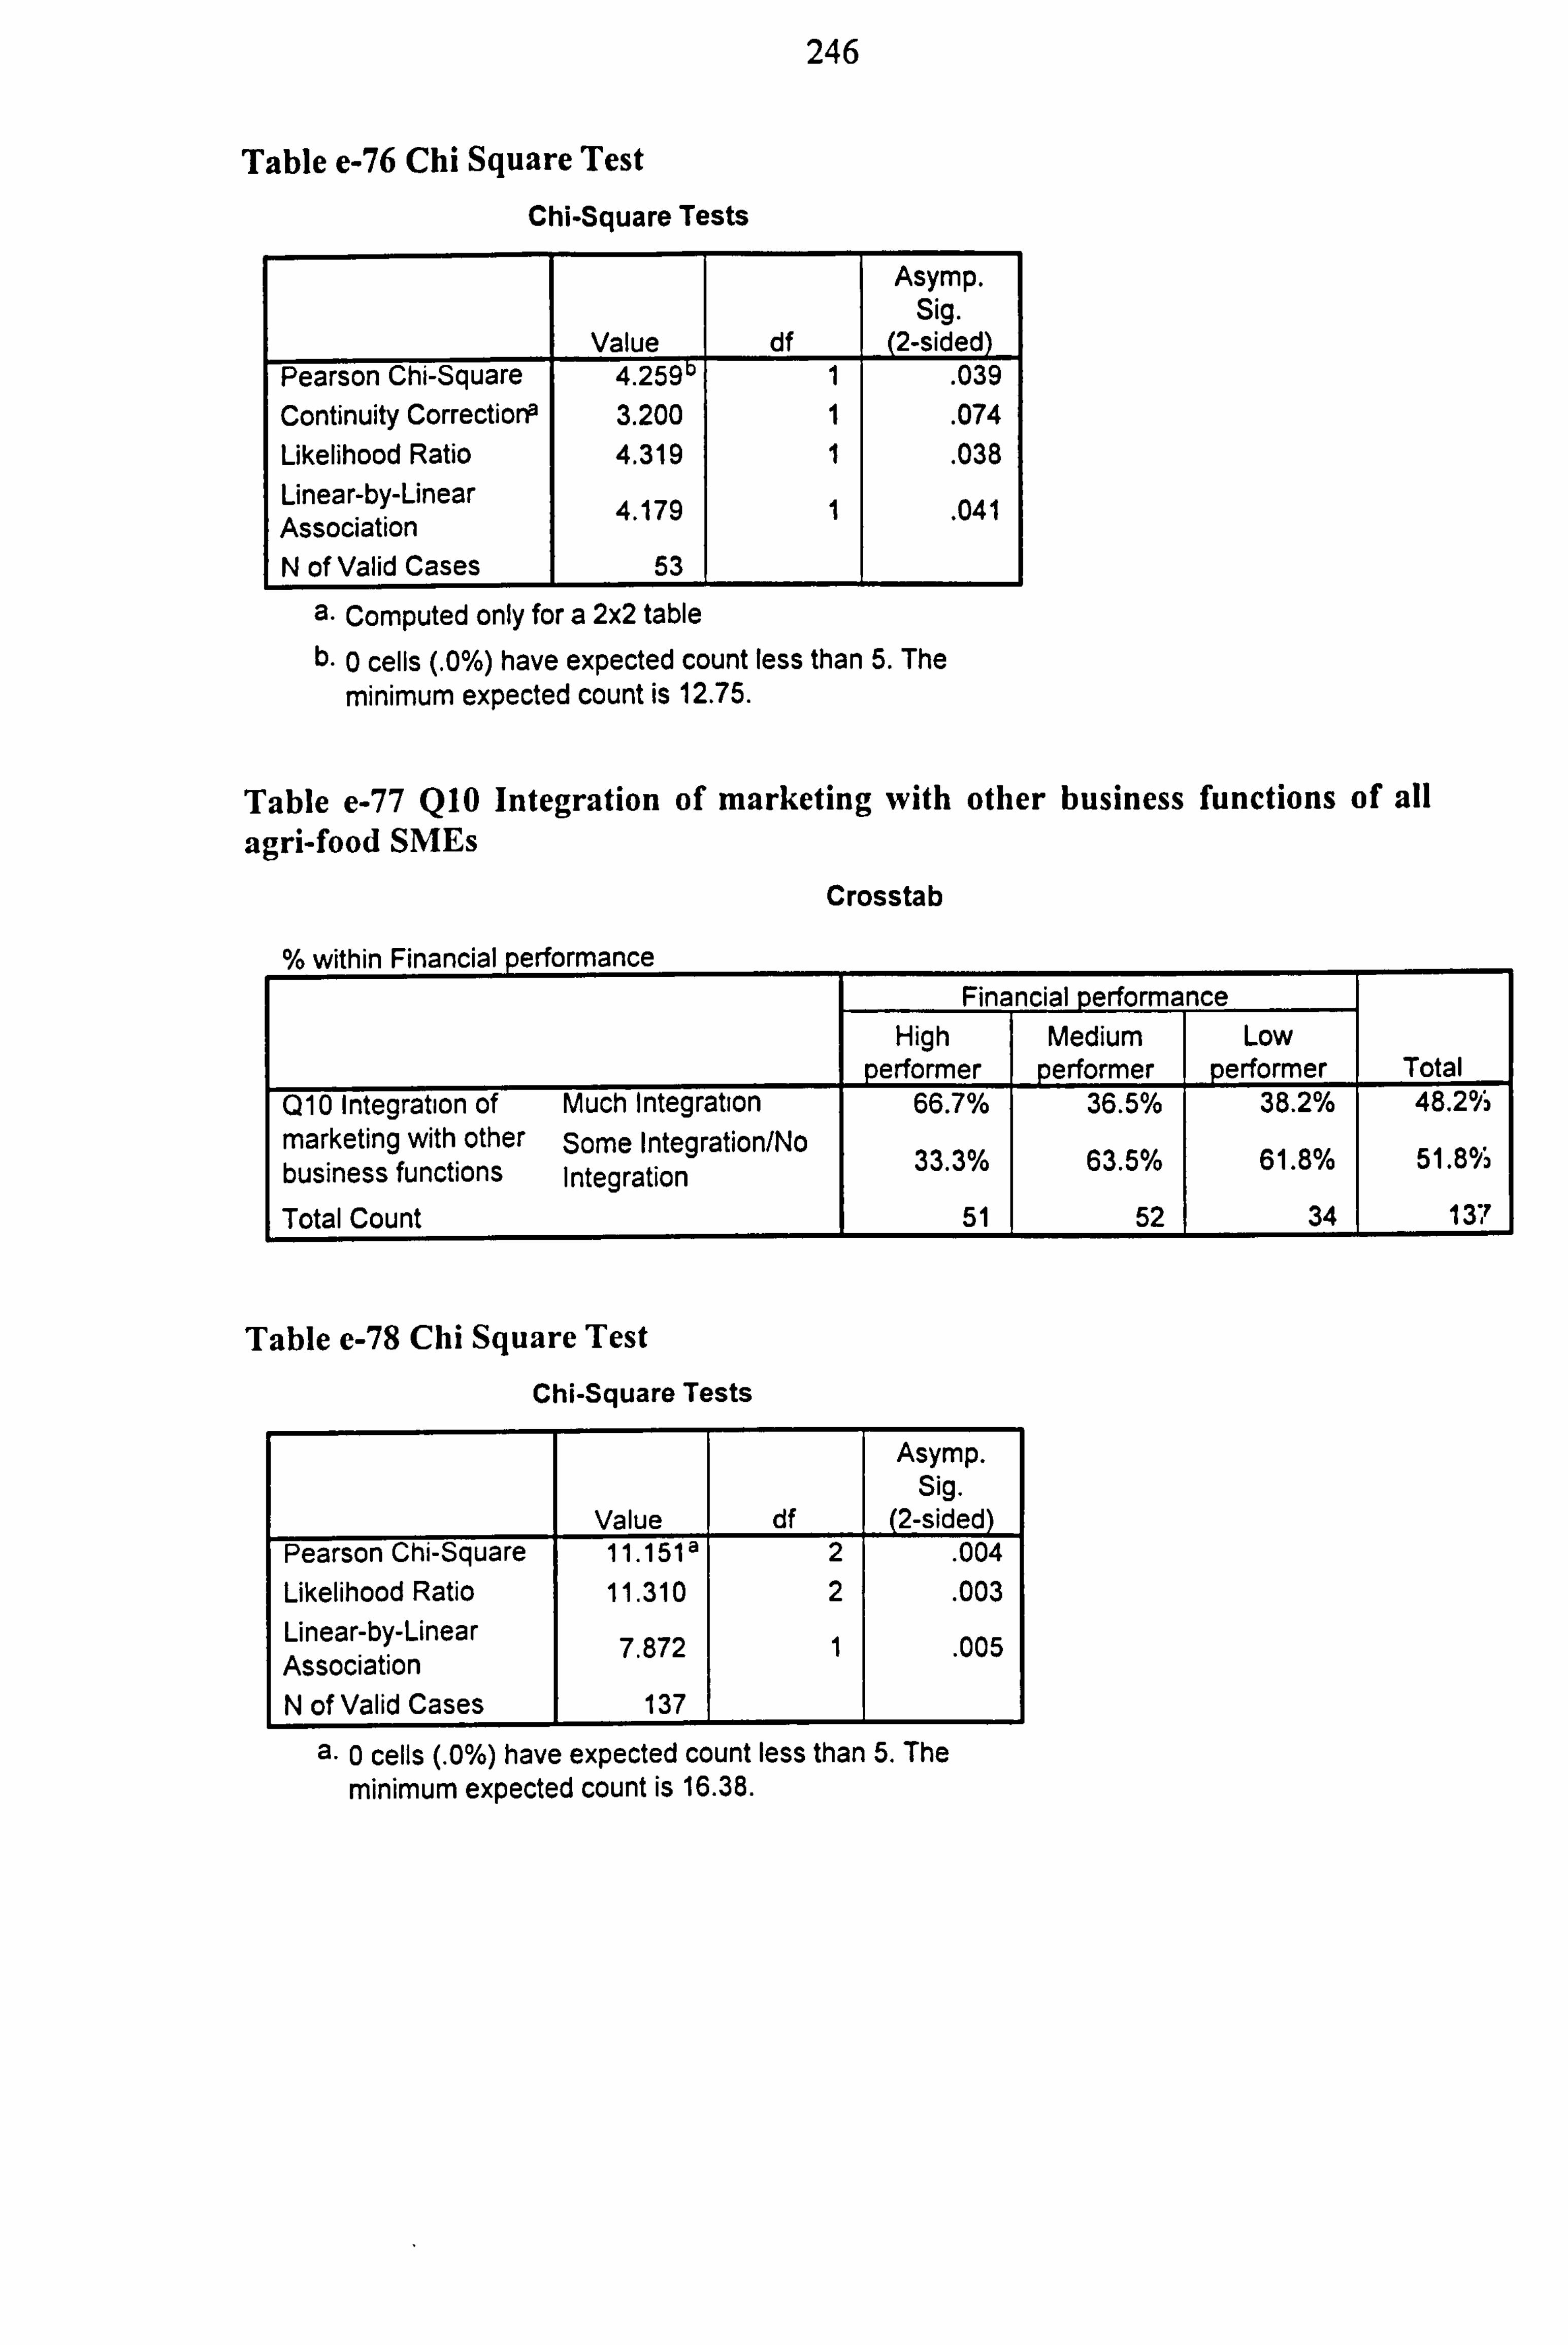
246
Table e-76 Chi Square Test
Chi-Square Tests
Value df
Asymp. Sig.
(2-sided) Pearson Chi-Square 4.259 1 . 039 Continuity Corrections 3.200 1 . 074 Likelihood Ratio 4.319 1 . 038 Linear-by-Linear 4.179 1 . 041 Association N of Valid Cases 53
a. Computed only for a 2x2 table b. 0 cells (. 0%) have expected count less than 5. The
minimum expected count is 12.75.
Table e-77 Q10 Integration of marketing with other business functions of all agri-food SMEs
Crosstab
within Financial Derformance Financial perform nce
High Medium Low performer performer performer Total
Q10 Integration of Much Integration 66.7% 36.5% 38.2% 48.2°/3 marketing with other Some Integration/No 0" business functions Integration 0 33.3 /0 0 63.5 /0 0 61.8 /0 51.8 iý
Total Count 51 52 34 137
Table e-78 Chi Square Test
Chi-Square Tests
Asymp. Sig.
Value df (2-sided) Pearson Chi-Square 11.151 a 2
. 004
Likelihood Ratio 11.310 2 . 003 Linear-by-Linear 7.872 1 . 005 Association N of Valid Cases 137
a. 0 cells (. 0%) have expected count less than 5. The minimum expected count is 16.38.
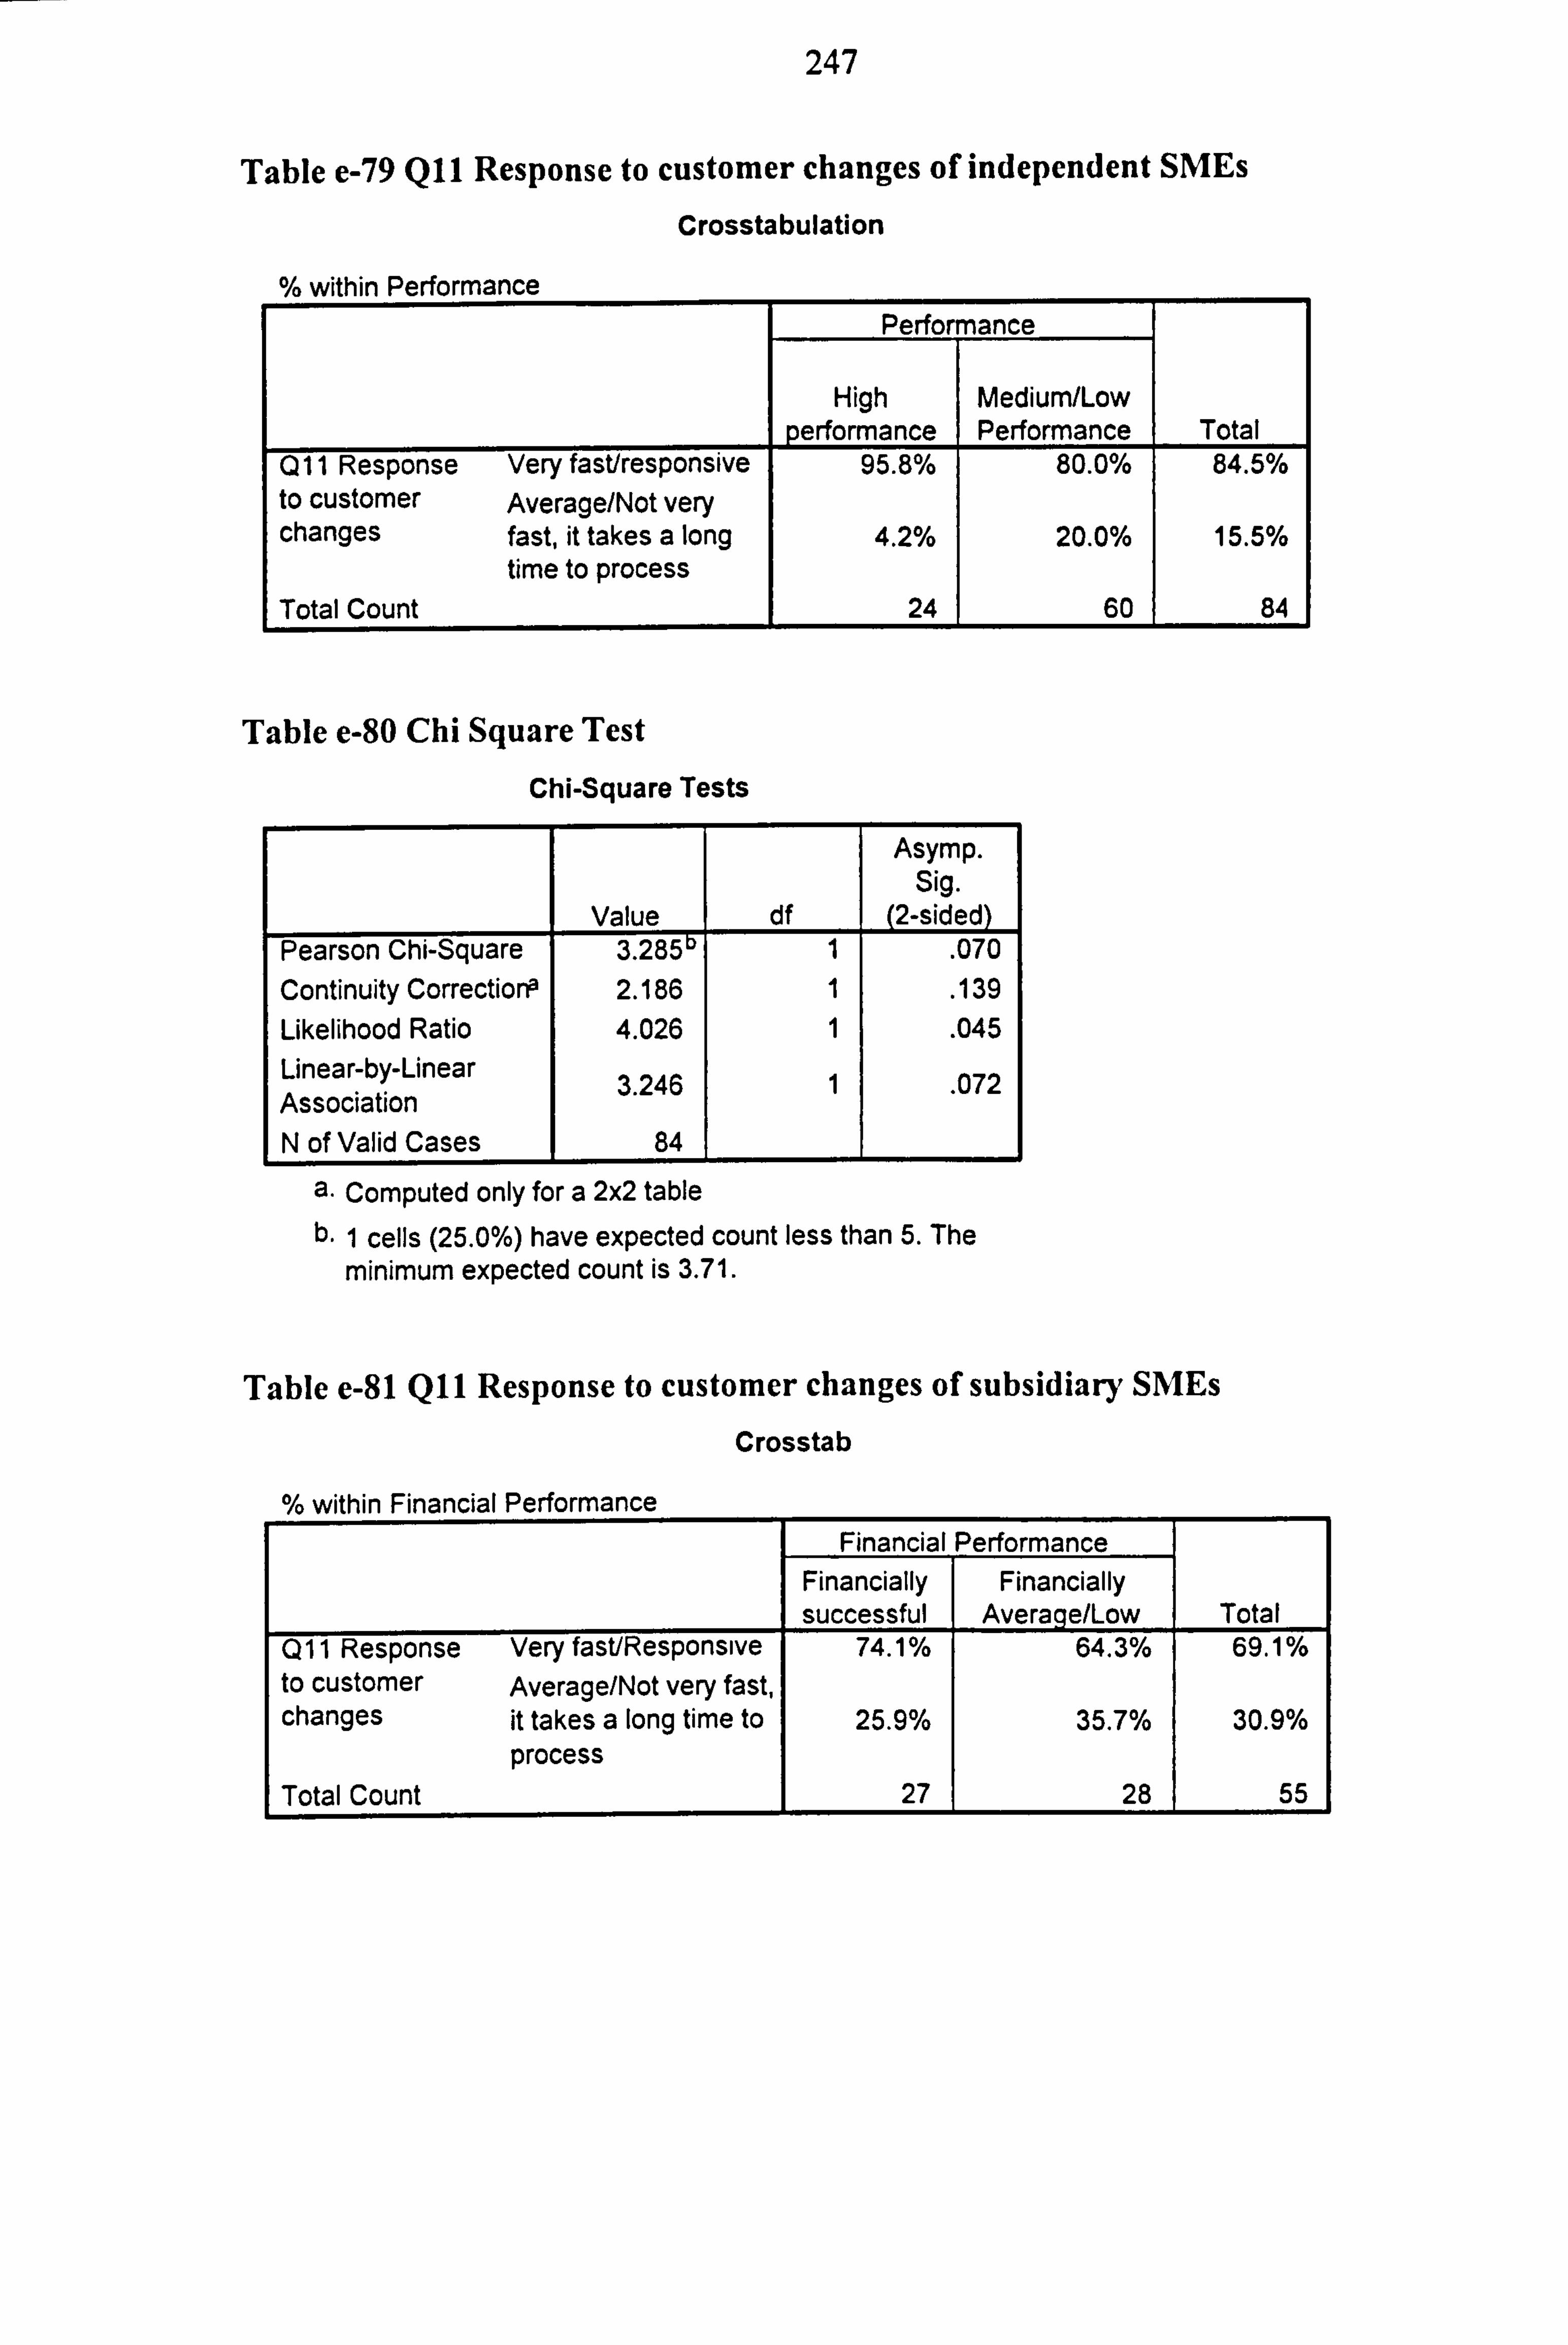
247
Table e-79 Q11 Response to customer changes of independent SMEs
Crosstabulation
within Performance Perfor mance
High Medium/Low performance Performance Total
7 Q11 Response Very fast/responsive 95.8% 80.0% 84.57/6 to customer Average/Not very changes fast, it takes a long 4.2% 20.0% 15.5%
time to process Total Count 24 60 84
Table e-80 Chi Square Test
Chi-Square Tests
Value df
Asymp. Sig.
(2-sided) Pearson Chi-Square 3.28511 1 . 070 Continuity Correctiona 2.186 1 . 139 Likelihood Ratio 4.026 1 . 045 Linear-by-Linear 3.246 1 . 072 Association N of Valid Cases 84
a. Computed only for a 2x2 table b. 1 cells (25.0%) have expected count less than 5. The
minimum expected count is 3.71.
Table e-81 Q11 Response to customer changes of subsidiary SMEs
Crosstab
within Financial Performance Financial Performance
Financially Financially
successful Average/Low Total Q11 Response Very fast/Responsive 74.1% 64.3% 69.1% to customer Average/Not very fast, changes it takes a long time to 25.9% 35.7% 30.9%
process Total Count 27 28 55
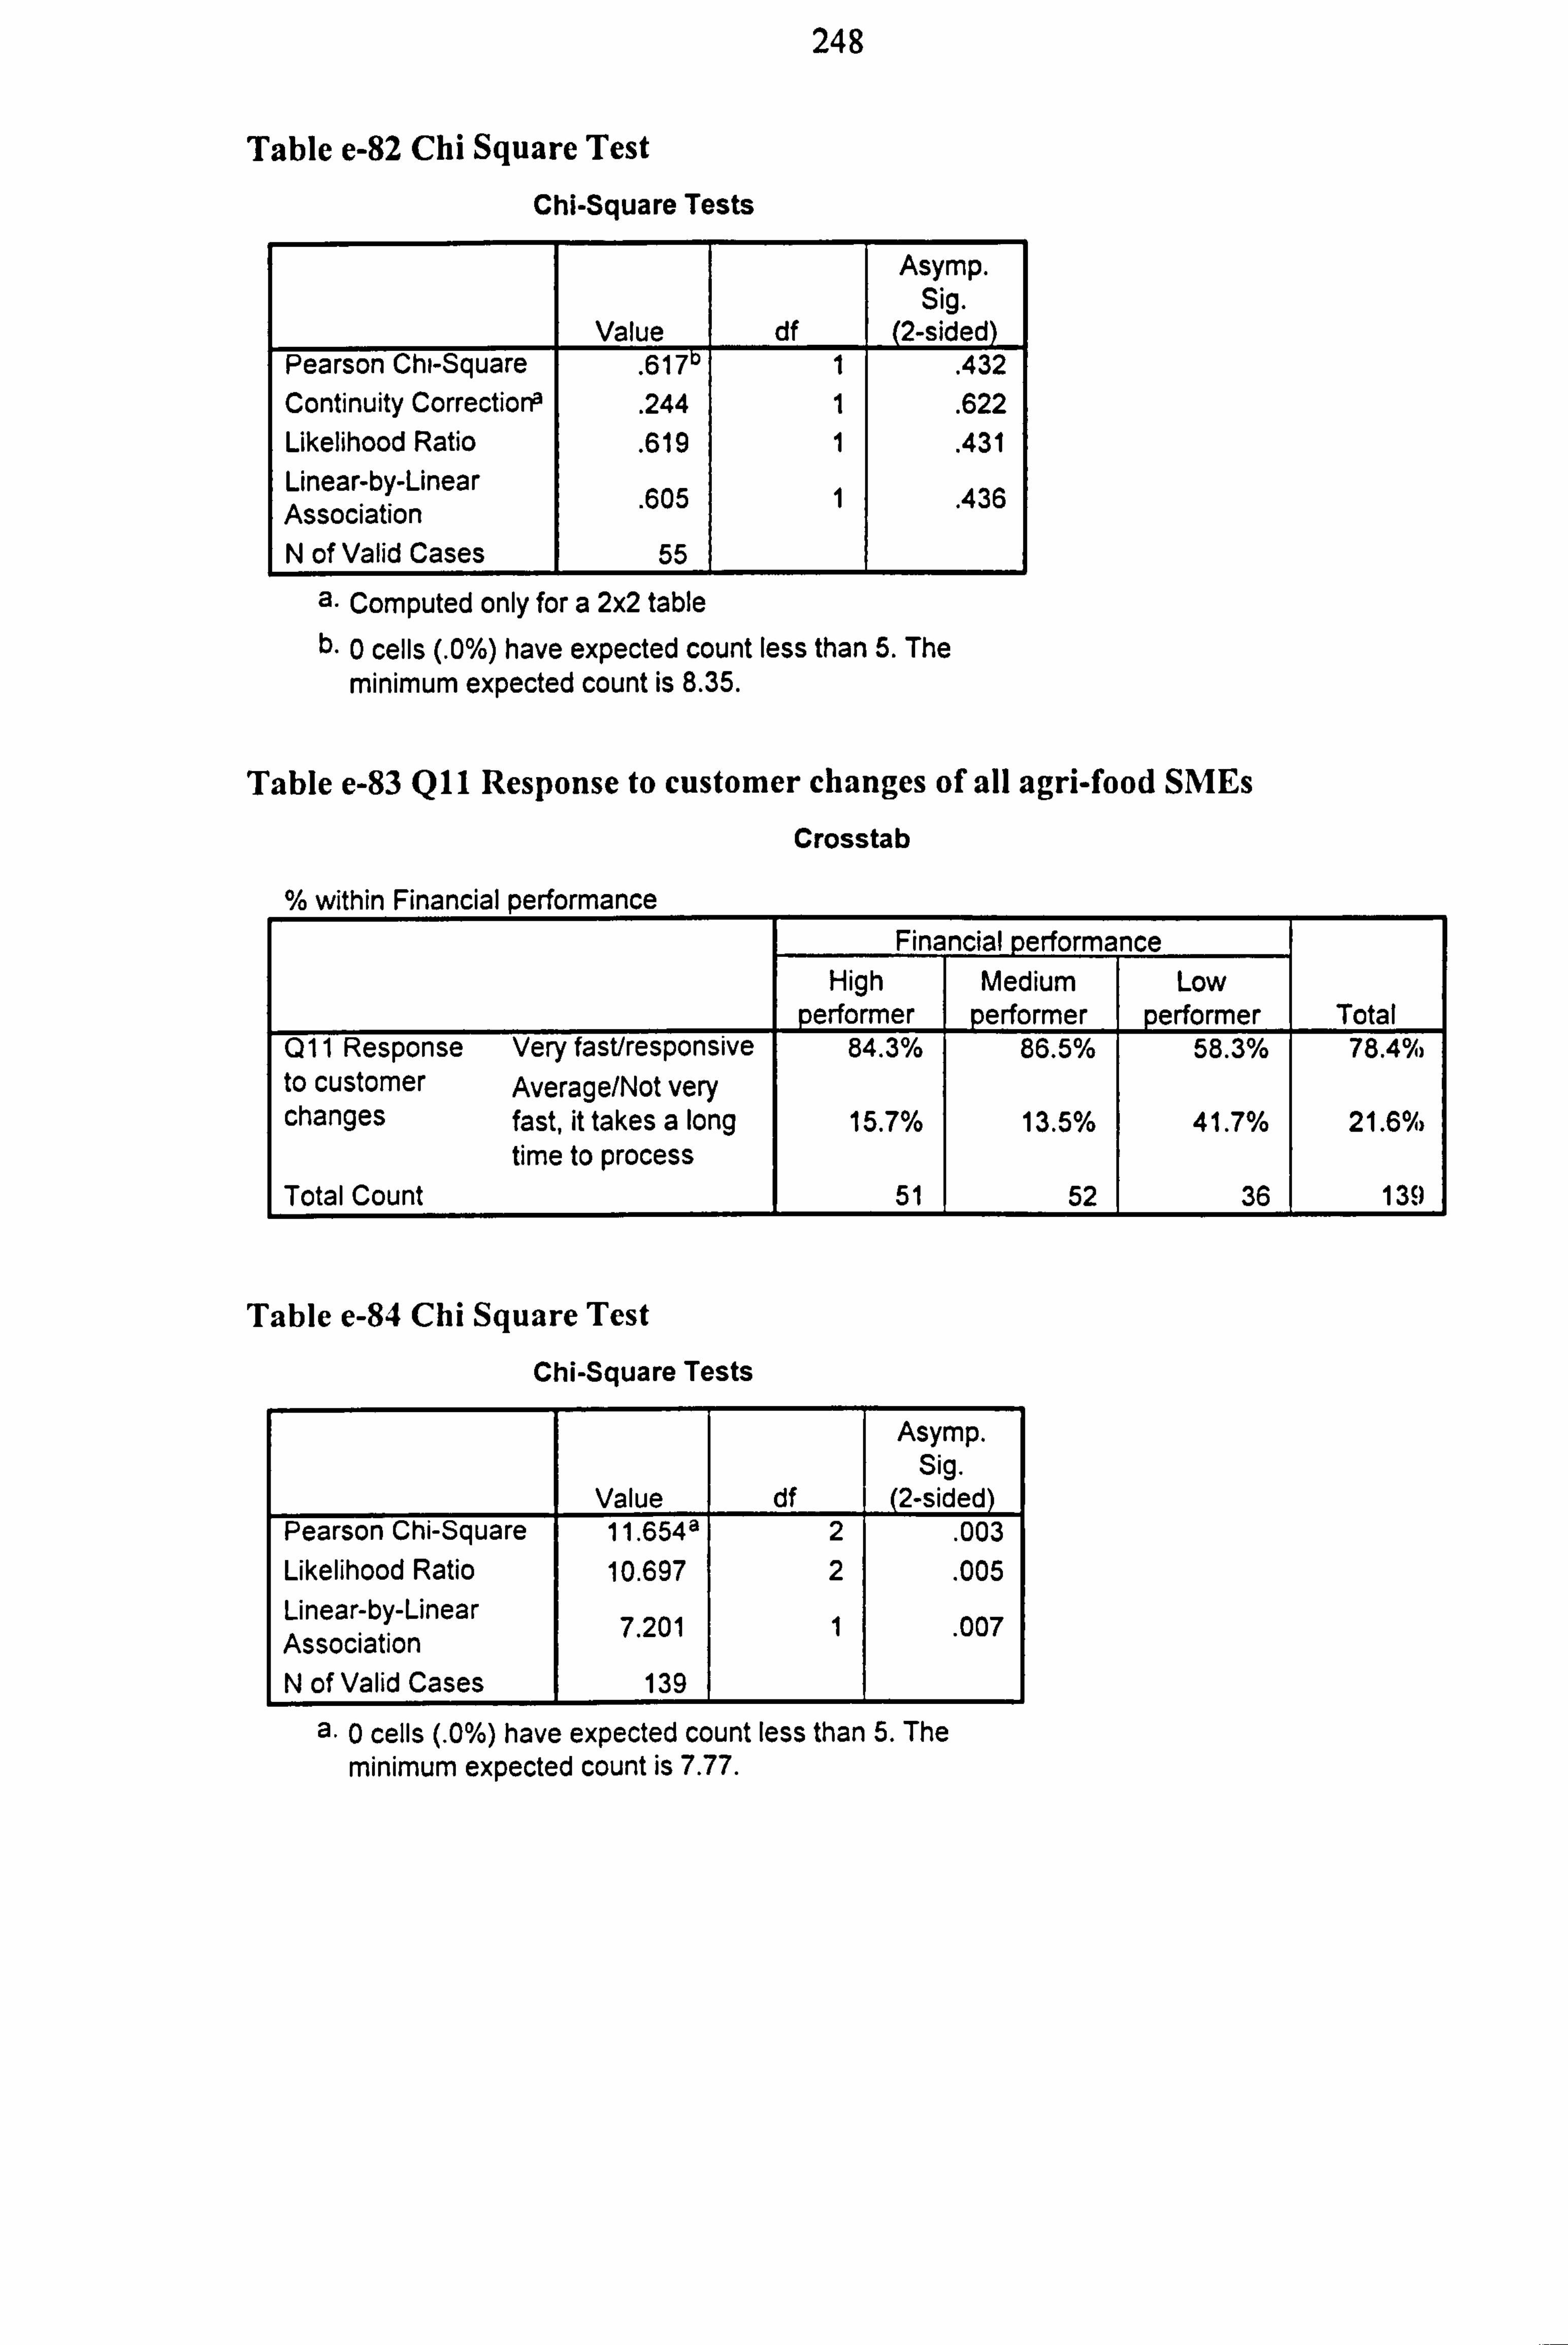
248
Table e-82 Chi Square Test
Chi-Square Tests
Value df
Asymp. Sig.
(2-sided) Pearson Chi-Square
. 61711 1 . 432 Continuity Corrections
. 244 1 . 622 Likelihood Ratio
. 619 1 . 431 Linear-by-Linear Association . 605 1 . 436
N of Valid Cases 55
a. Computed only for a 2x2 table b. 0 cells (. 0%) have expected count less than 5. The
minimum expected count is 8.35.
Table e-83 Q11 Response to customer changes of all agri-food SMEs
Crosstab
% within Financial performance Financial erformance
High Medium Low performer performer performer Total
Q11 Response Very fast/responsive 84.3% 86.5% 58.3% 78.4% to customer Average/Not very changes fast, it takes a long 15.7% 13.5% 41.7% 21.6%
time to process Total Count 51 52 36 139
Table e-84 Chi Square Test
Chi-Square Tests
Asymp. Sig.
Value df (2-sided) Pearson Chi-Square 11.6548 2
. 003
Likelihood Ratio 10.697 2 . 005 Linear-by-Linear Association 7.201 1 . 007
N of Valid Cases 139
a. 0 cells (. 0%) have expected count less than 5. The minimum expected count is 7.77.
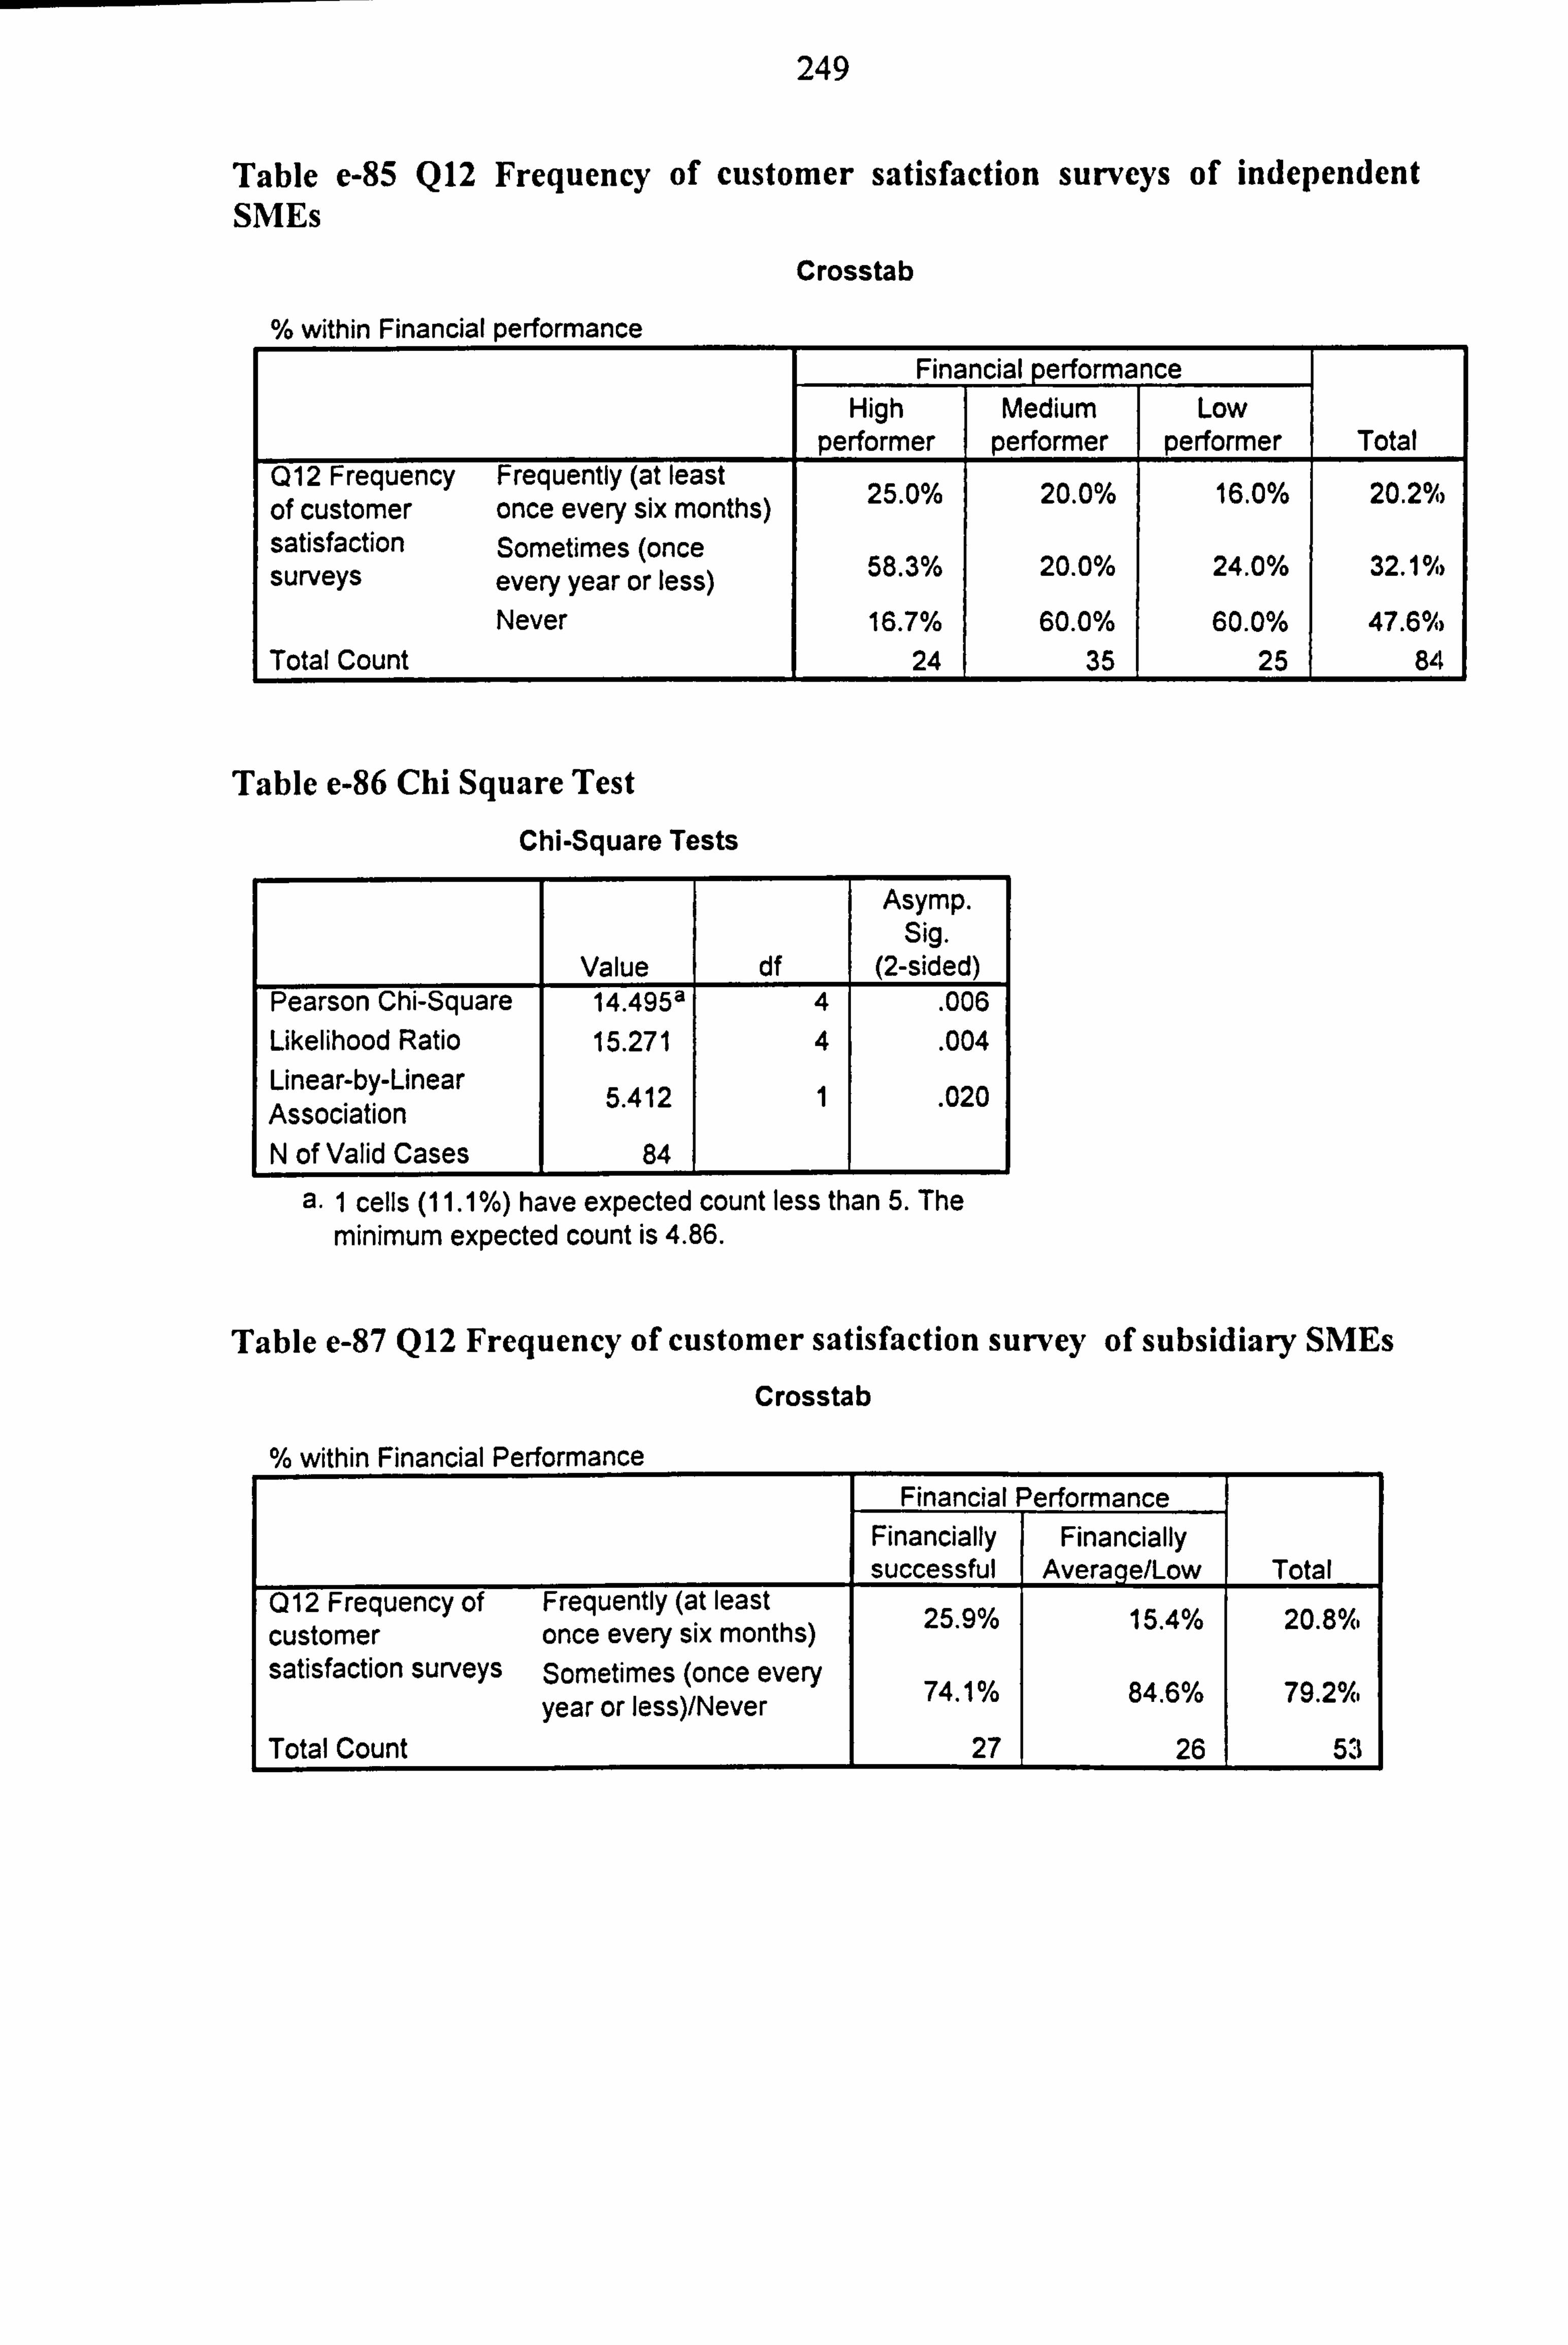
249
Table e-85 Q12 Frequency of customer satisfaction surveys of independent SMEs
Crosstab
within Financial performance Financial perform nce
High Medium Low performer performer performer Total
Q12 Frequency Frequently (at least 25 0% 20 0% 16 0% 20 2%
of customer once every six months) . . . . satisfaction Sometimes (once surveys every year or less) 58.3% 20.0% 24.0% 32.10%
Never 16.7% 60.0% 60.0% 47.60% Total Count 24 35 25 84
Table e-86 Chi Square Test
Chi-Square Tests
Asymp. Sig.
Value df (2-sided) Pearson Chi-Square 14.495a 4 . 006 Likelihood Ratio 15.271 4 . 004 Linear-by-Linear Association 5.412 1 . 020
N of Valid Cases 84
a. 1 cells (11.1%) have expected count less than 5. The minimum expected count is 4.86.
Table e-87 Q12 Frequency of customer satisfaction survey of subsidiary SMEs
Crosstab
% within Financial Performance Financial Performance
Financially Financially successful Average/Low Total
Q12 Frequency of Frequently (at least 25 9% 4% 15 20 8%. customer once every six months) . . . satisfaction surveys Sometimes (once every
year or less)/Never ° 74.1% o 84.6% °/. 79.2
Total Count 27 26 53
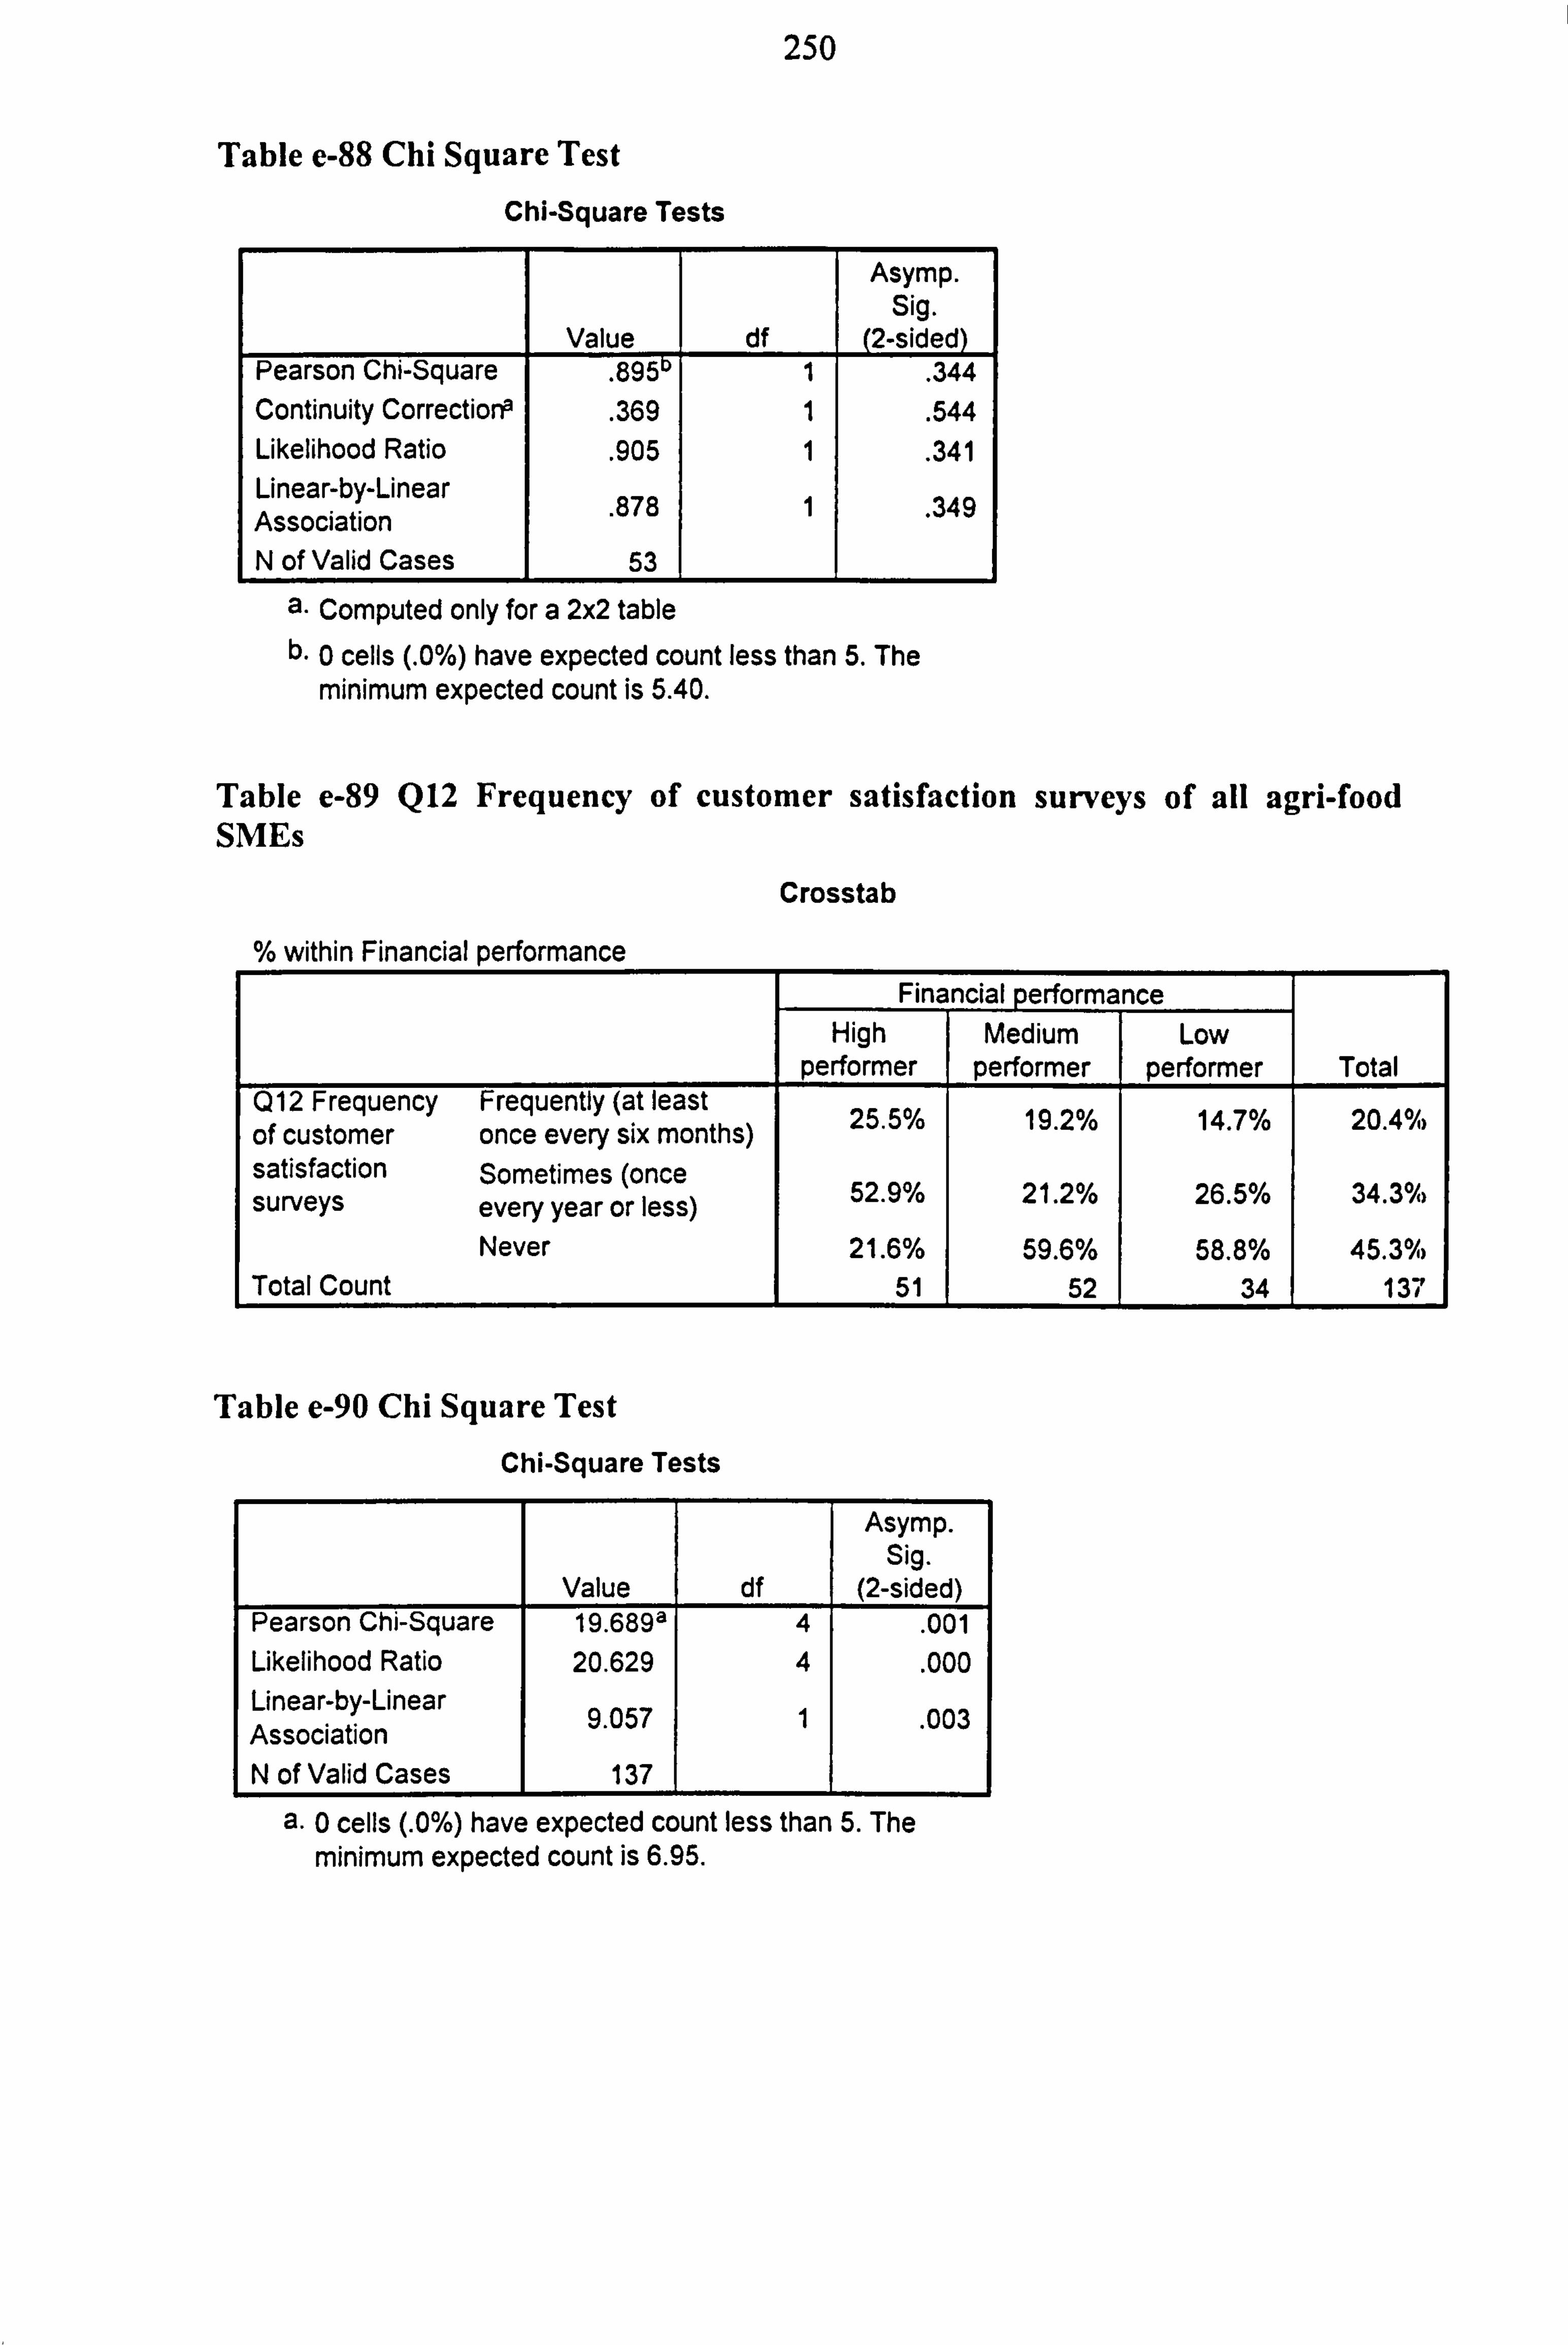
250
Table e-88 Chi Square Test
Chi-Square Tests
Value df
Asymp. Sig.
(2-sided) Pearson Chi-Square
. 895 1 . 344 Continuity Correctiorr
. 369 1 . 544 Likelihood Ratio
. 905 1 . 341 Linear-by-Linear Association 878 1 . 349
N of Valid Cases 53
a. Computed only for a 2x2 table b. 0 cells (. 0%) have expected count less than 5. The
minimum expected count is 5.40.
Table e-89 Q12 Frequency of customer satisfaction surveys of all agri-food SMEs
Crosstab
within Financial performance Financial performance
High Medium Low performer performer performer Total
Q12 Frequency Frequently (at least 25 5% 19 2% 14 7% 20 4°/ý
of customer once every six months) . . . . satisfaction Sometimes (once surveys every year or less) 52.9% 21.2% 26.5% 34.3%º
Never 21.6% 59.6% 58.8% 45.3 Total Count 51 52 34 137
Table e-90 Chi Square Test
Chi-Square Tests
Asymp. Sig.
Value df (2-sided) Pearson Chi-Square 19.689a 4
. 001
Likelihood Ratio 20.629 4 . 000 Linear-by-Linear Association 9.057 1 . 003
N of Valid Cases 137
a. 0 cells (. 0%) have expected count less than 5. The minimum expected count is 6.95.
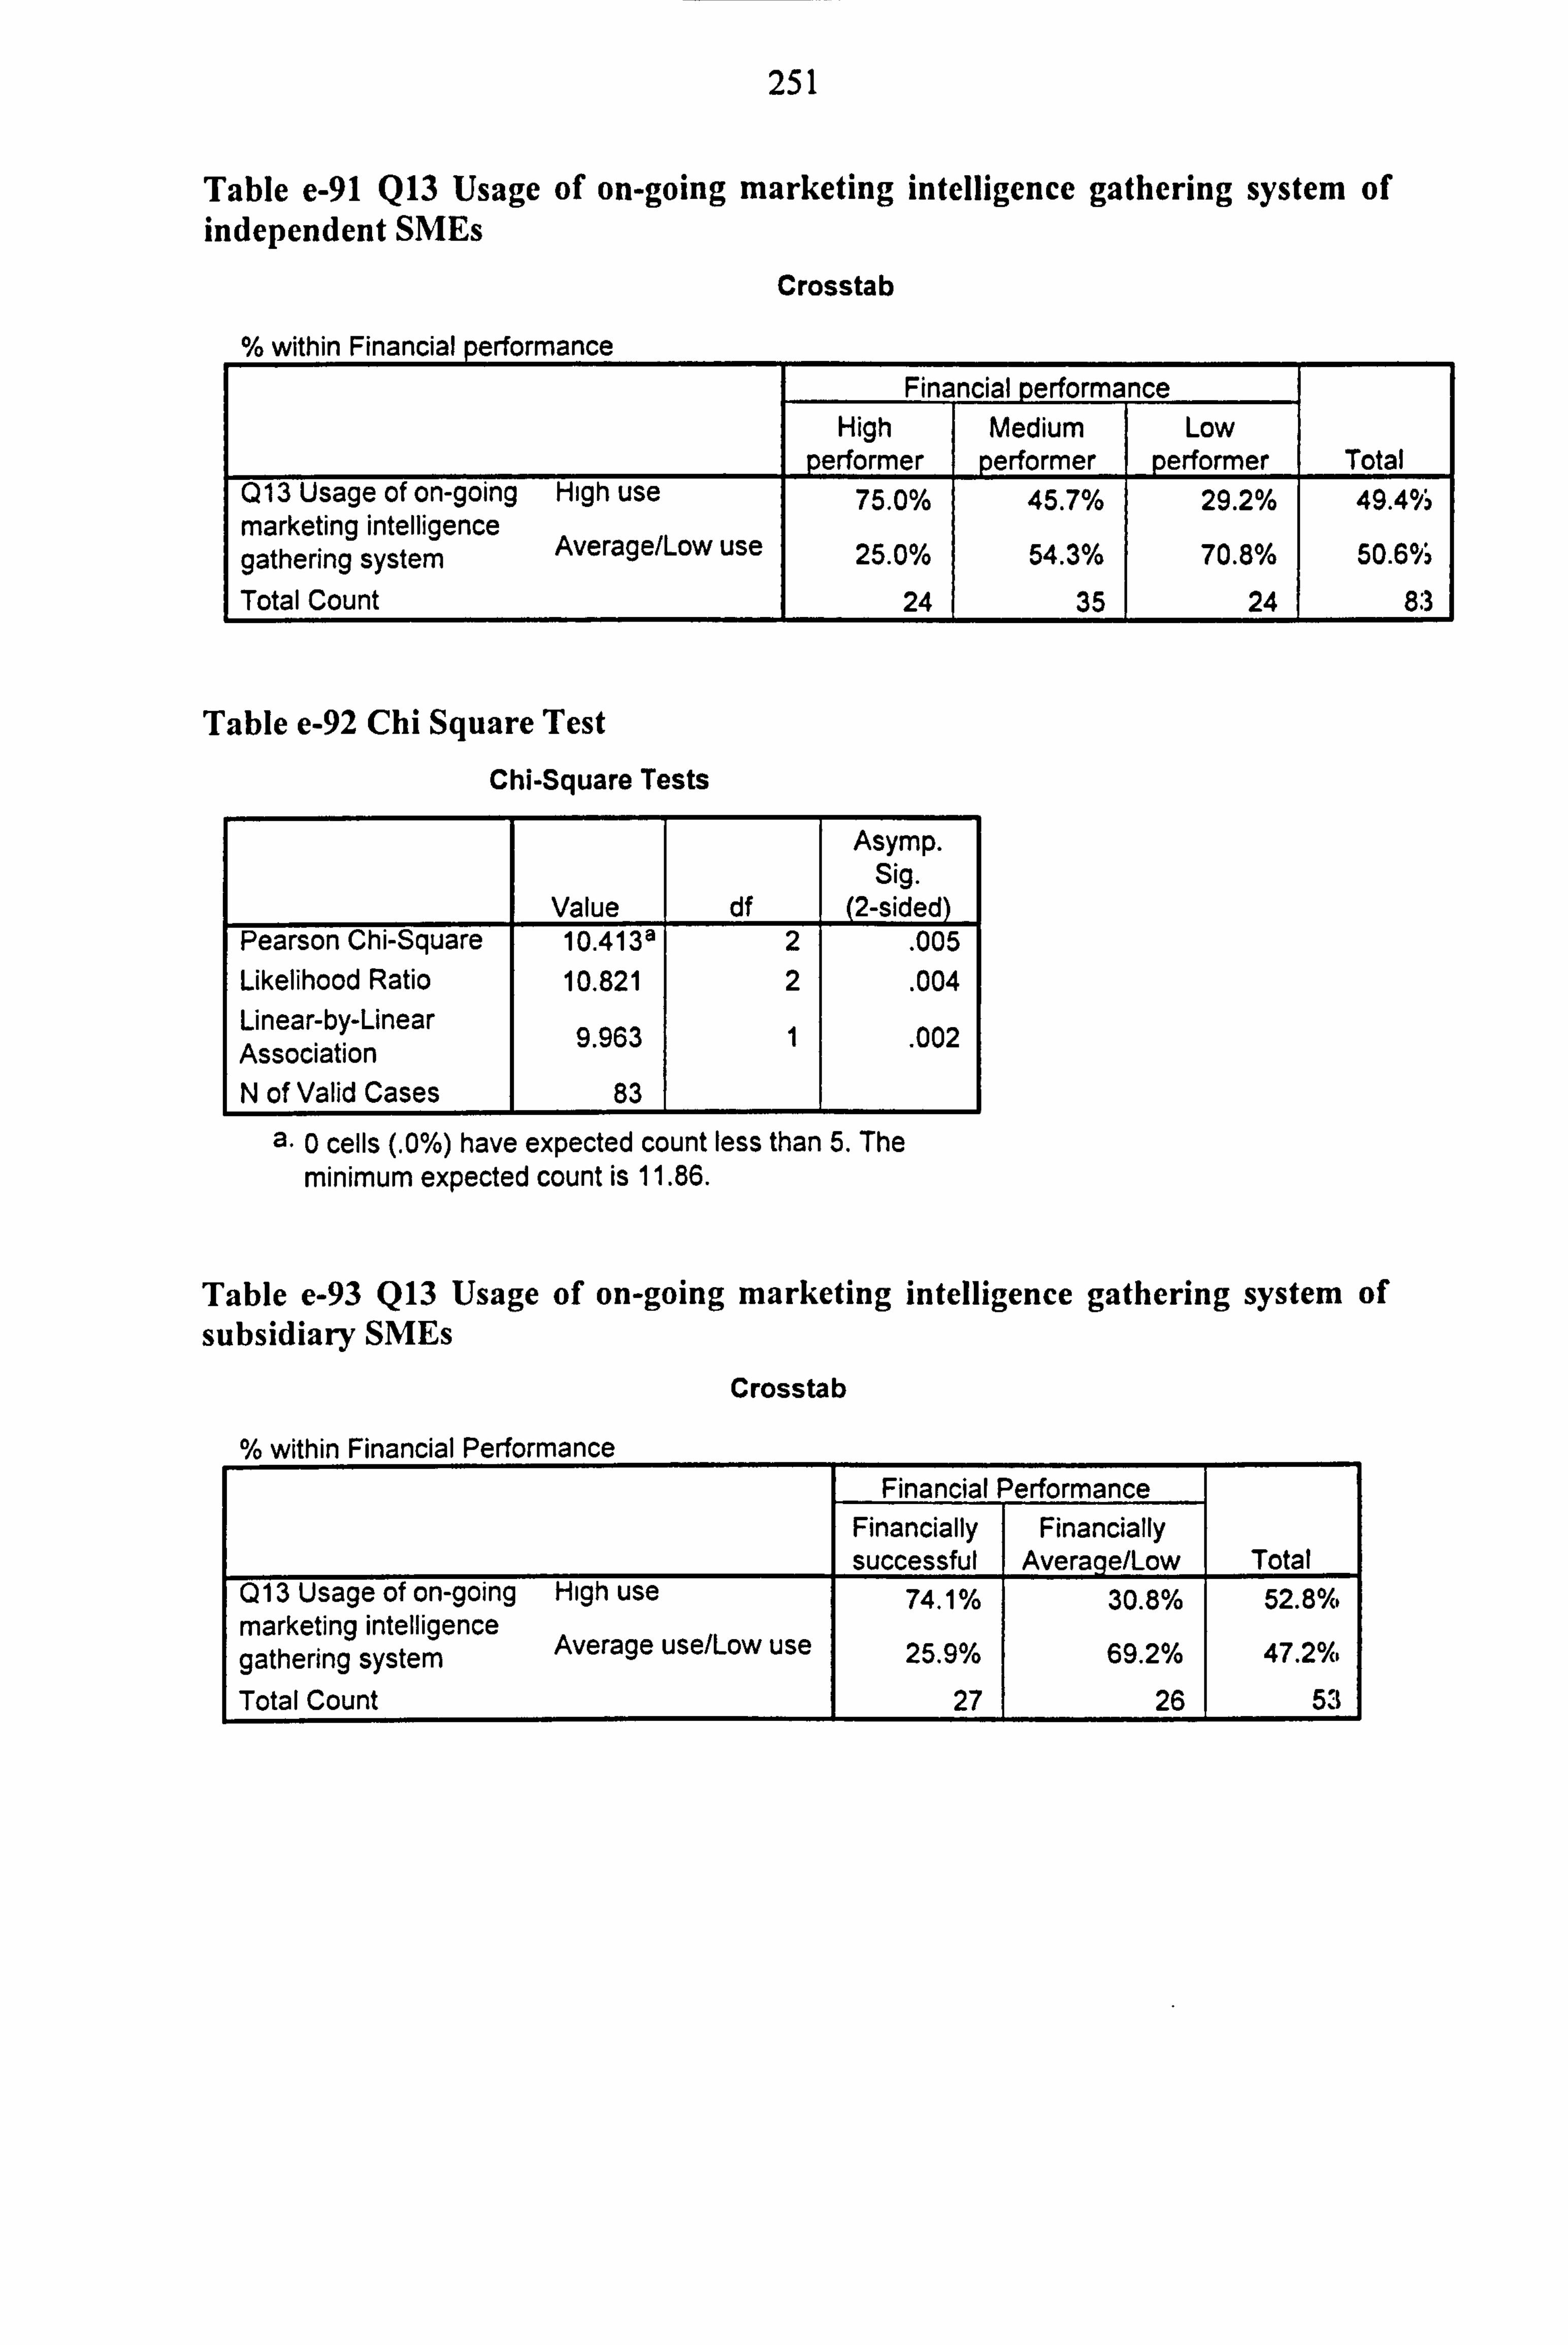
251
Table e-91 Q13 Usage of on-going marketing intelligence gathering system of independent SMEs
Crosstab
within Financial nerformance
Financial erformance High Medium Low
performer performer performer Total Q13 Usage of on-going High use 75.0% 45.7% 29.2% 49.4°, marketing intelligence
gathering system Average/Low use 25.0% 54.3% 70.8% 50.6°A
Total Count 24 35 24 8.3
Table e-92 Chi Square Test
Chi-Square Tests
Asymp. Sig.
Value df (2-sided) Pearson Chi-Square 10.413a 2 . 005 Likelihood Ratio 10.821 2 . 004 Linear-by-Linear Association 9.963 1 . 002
N of Valid Cases 83
a. 0 cells (. 0%) have expected count less than 5. The minimum expected count is 11.86.
Table e-93 Q13 Usage of on-going marketing intelligence gathering system of subsidiary SMEs
Crosstab
%, within Financial Performance
Financial Performance Financially Financially
successful Average/Low Total Q13 Usage of on-going High use 74.1% 30.8% 52.80/6 marketing intelligence
gathering system Average use/Low use 25.9% 69.2% 47.2%1
Total Count 27 26 53
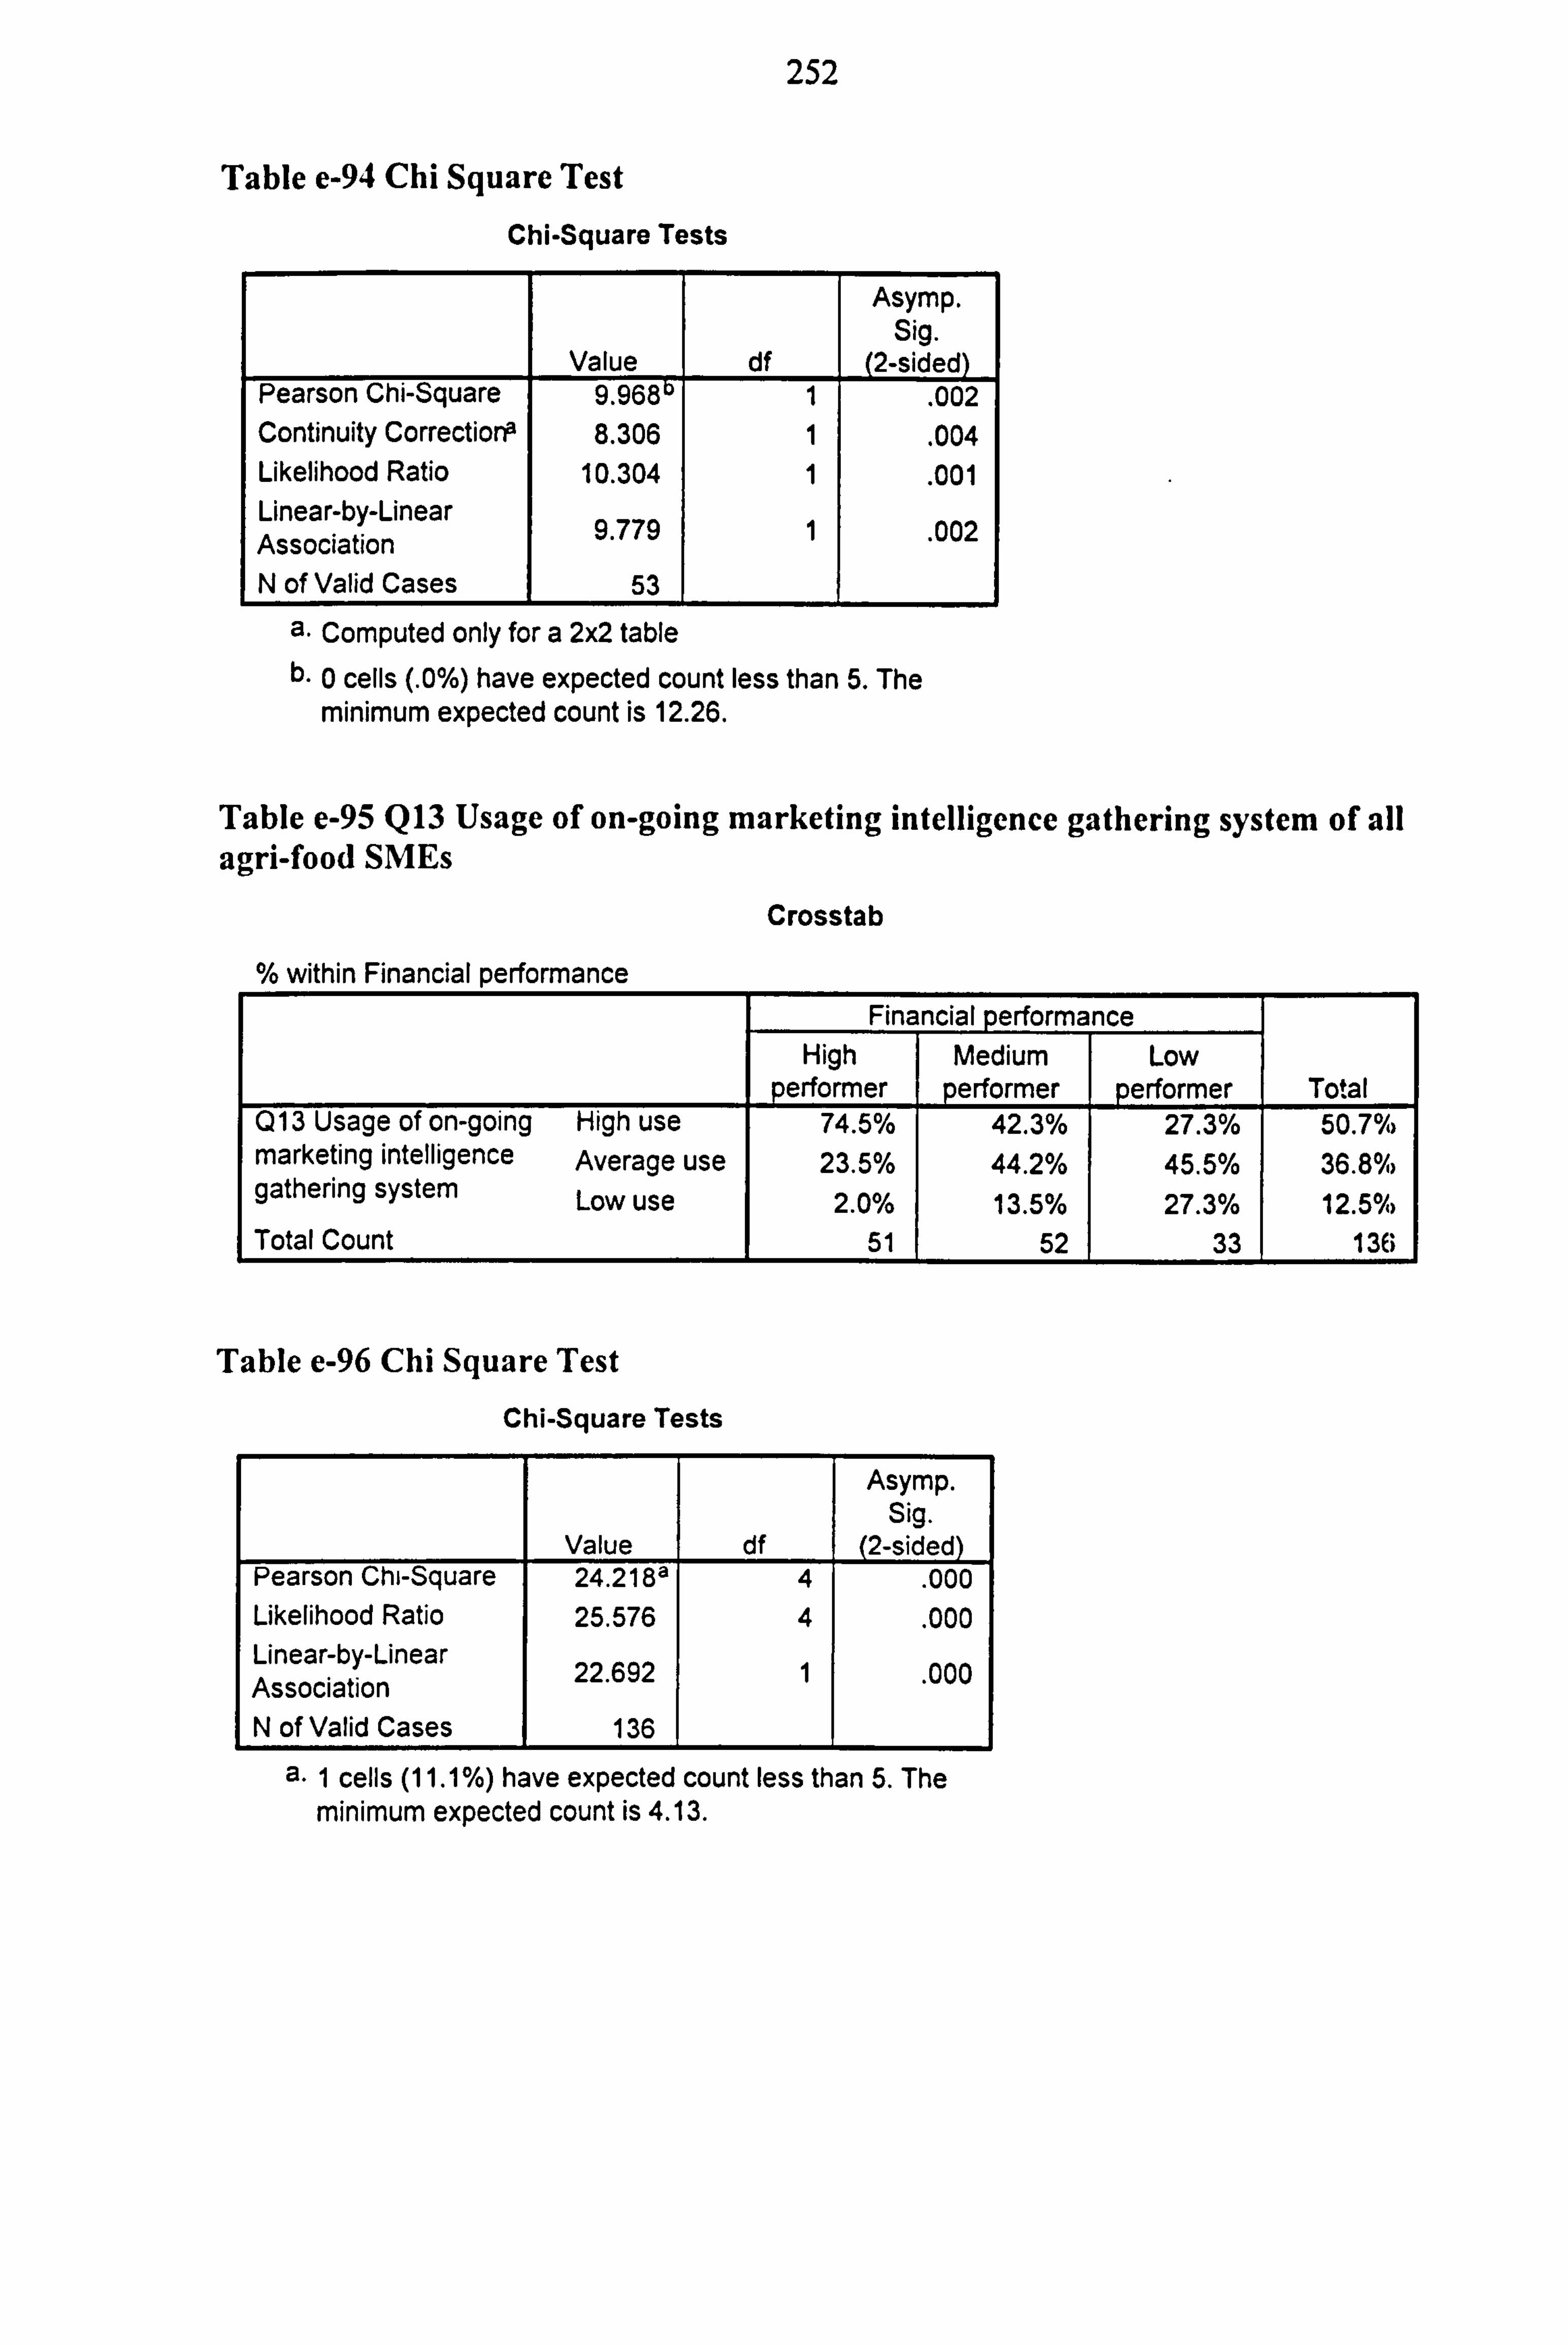
252
Table e-94 Chi Square Test
Chi-Square Tests
Value df
Asymp. Sig.
(2-sided) Pearson Chi-Square 9.96811 1 . 002 Continuity Correctiorr 8.306 1 . 004 Likelihood Ratio 10.304 1 . 001 Linear-by-Linear Association 9.779 1 . 002
N of Valid Cases 53
a. Computed only for a 2x2 table b. 0 cells (. 0%) have expected count less than 5. The
minimum expected count is 12.26.
Table e-95 Q13 Usage of on-going marketing intelligence gathering system of all agri-food SMEs
Crosstab
within Financial performance Financial performance
High Medium Low erformer performer performer Total
Q13 Usage of on-going High use 74.5% 42.3% 27.3% 50.7%6 marketing intelligence Average use 23.5% 44.2% 45.5% 36.80% gathering system Low use 2.0% 13.5% 27.3% 12.5%> Total Count 51 52 33 136
Table e-96 Chi Square Test
Chi-Square Tests
Asymp. Sig.
Value df (2-sided) Pearson Chi-Square 24.218a 4 . 000 Likelihood Ratio 25.576 4 . 000 Linear-by-Linear Association 22.692 1 . 000
N of Valid Cases 136
a. 1 cells (11.1%) have expected count less than 5. The minimum expected count is 4.13.
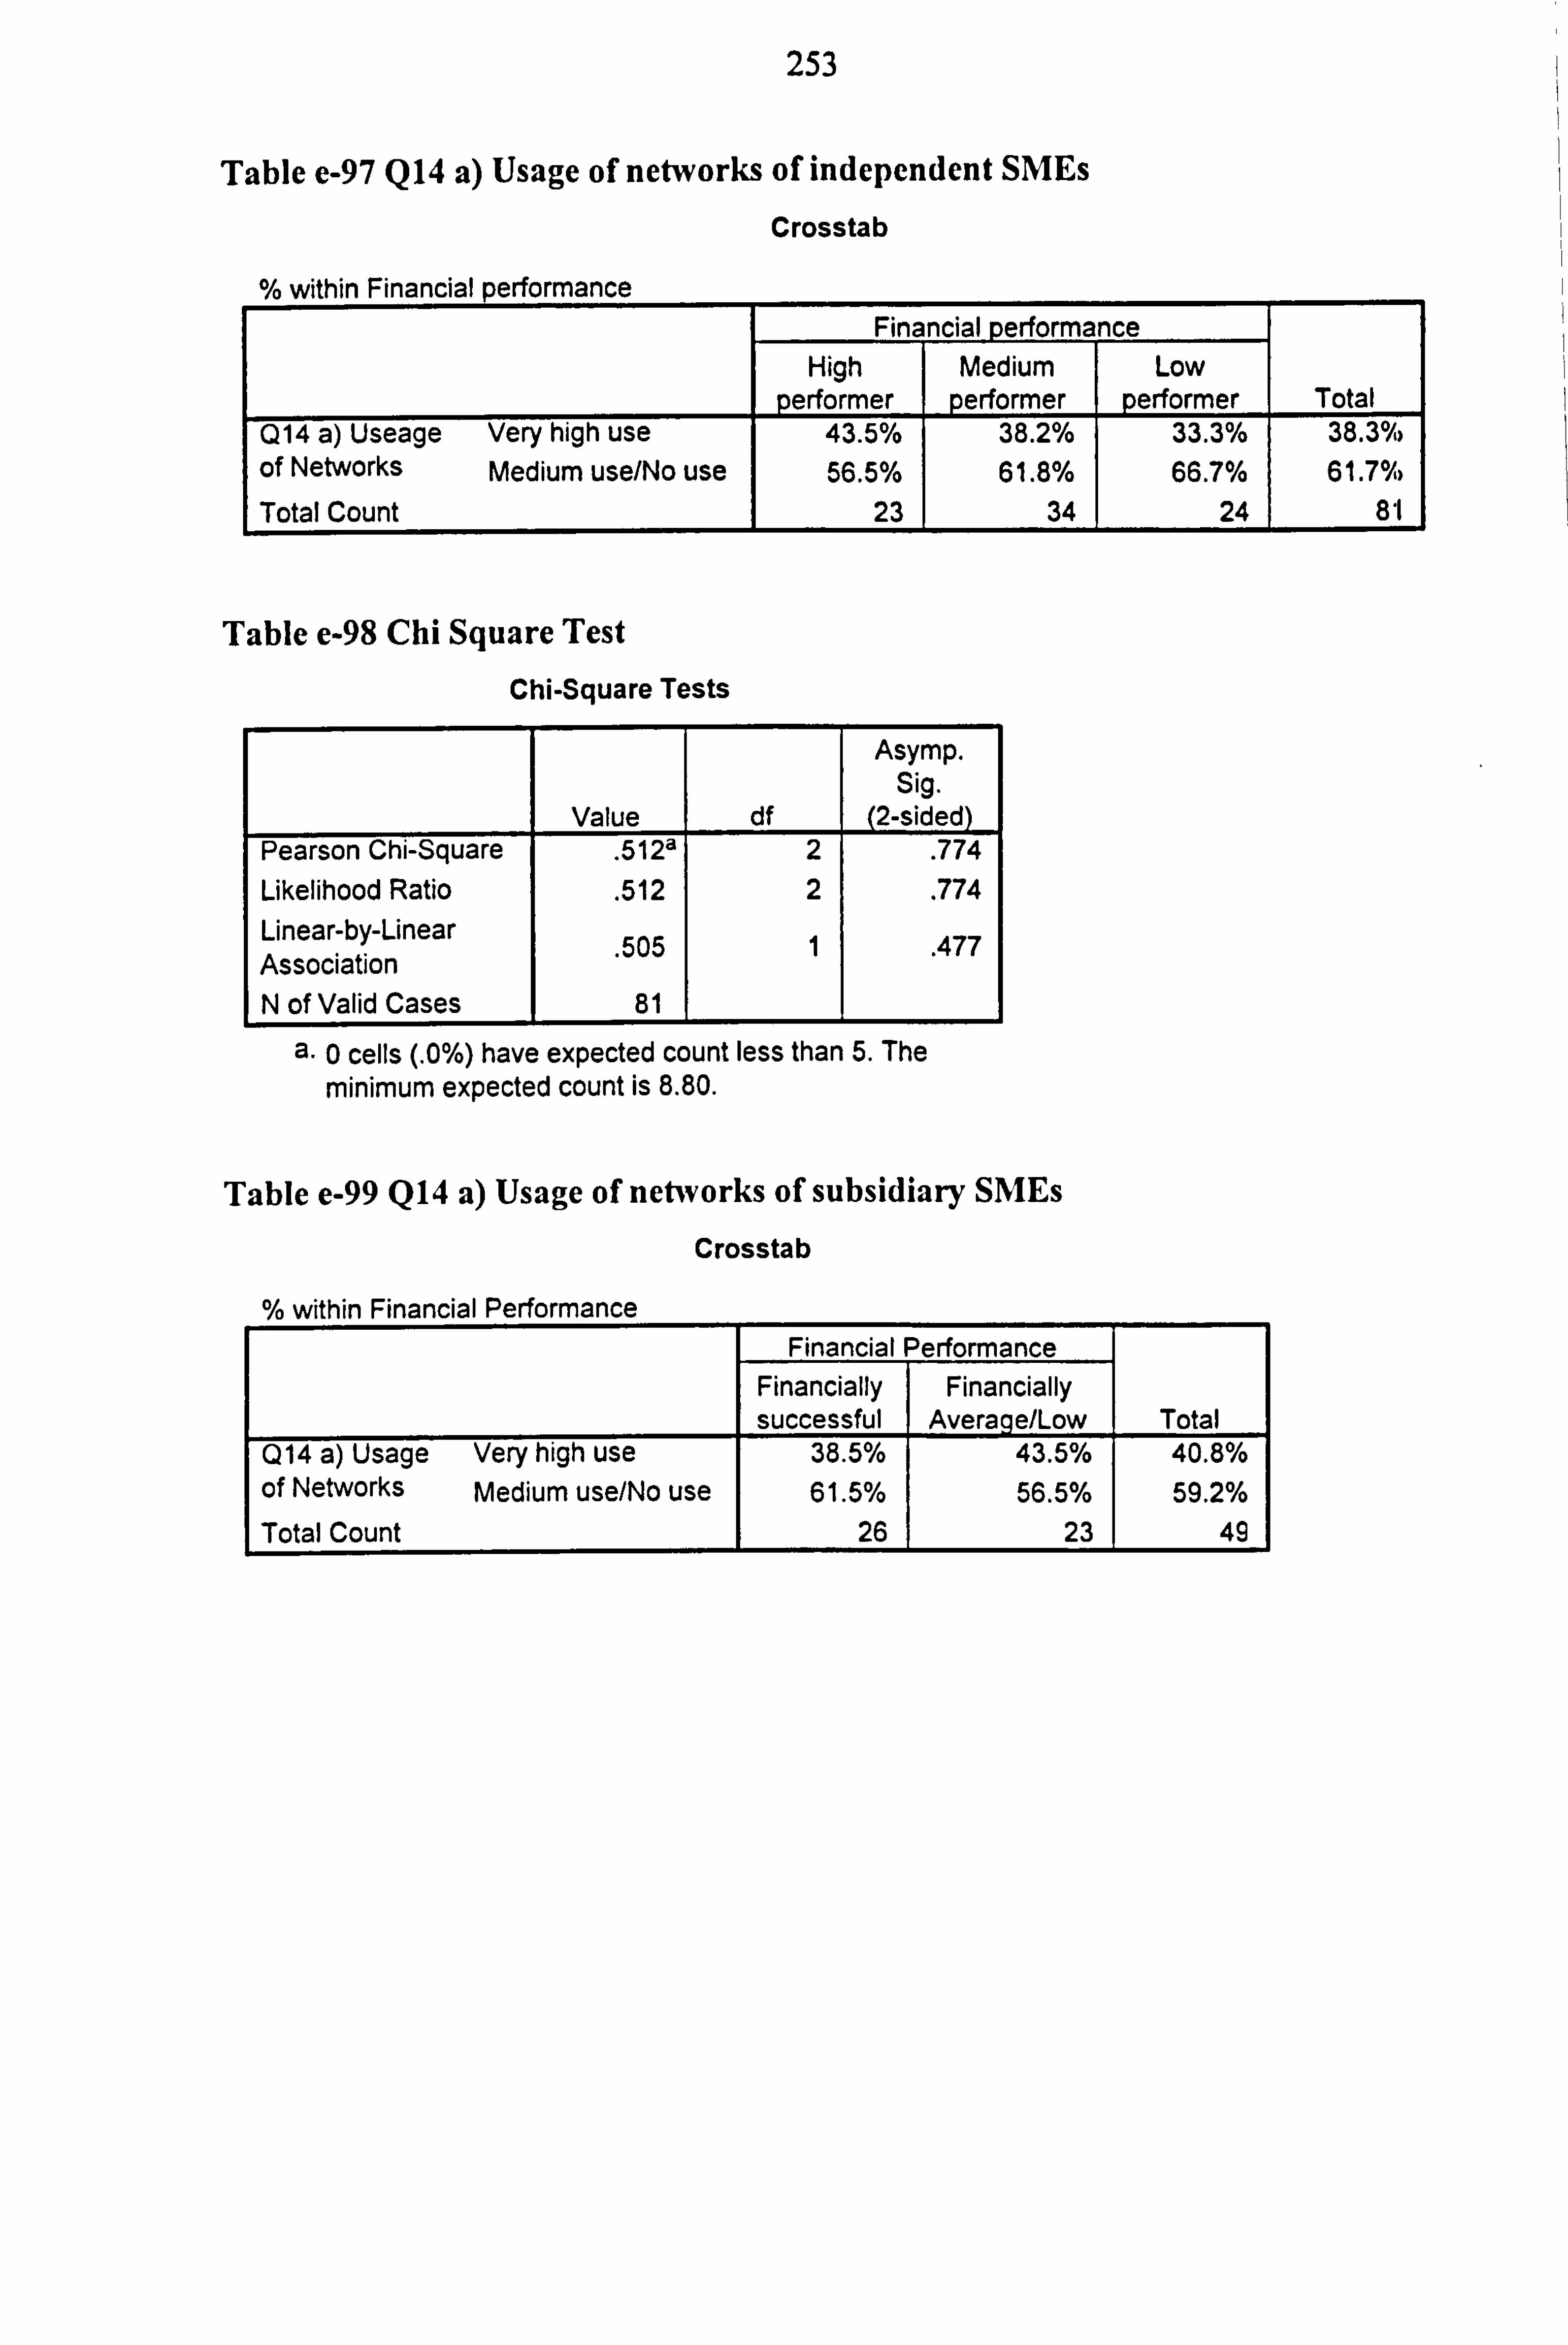
253
Table e-97 Q14 a) Usage of networks of independent SMEs
Crosstab
% within Financial performance Financial perform nce
High Medium Low performer performer performer Total
Q14 a) Useage Very high use 43.5% 38.2% 33.3% 38.3%> of Networks Medium use/No use 56.5% 61.8% 66.7% 61.7%% Total Count 23 34 24 81
Table e-98 Chi Square Test
Chi-Square Tests
Asymp. Sig.
Value df (2-sided) Pearson Chi-Square . 512a 2 . 774 Likelihood Ratio . 512 2 . 774 Linear-by-Linear 505 1 . 477 Association . N of Valid Cases 81
0 cells (. 0%) have expected count less than 5. The minimum expected count is 8.80.
Table e-99 Q14 a) Usage of networks of subsidiary SMEs
Crosstab
within Financial Performance Financial Performance
Financially Financially successful Average/Low Total
Q14 a) Usage Very high use 38.5% 43.5% 40.8% of Networks Medium use/No use 61.5% 56.5% 59.2% Total Count 26 23 49
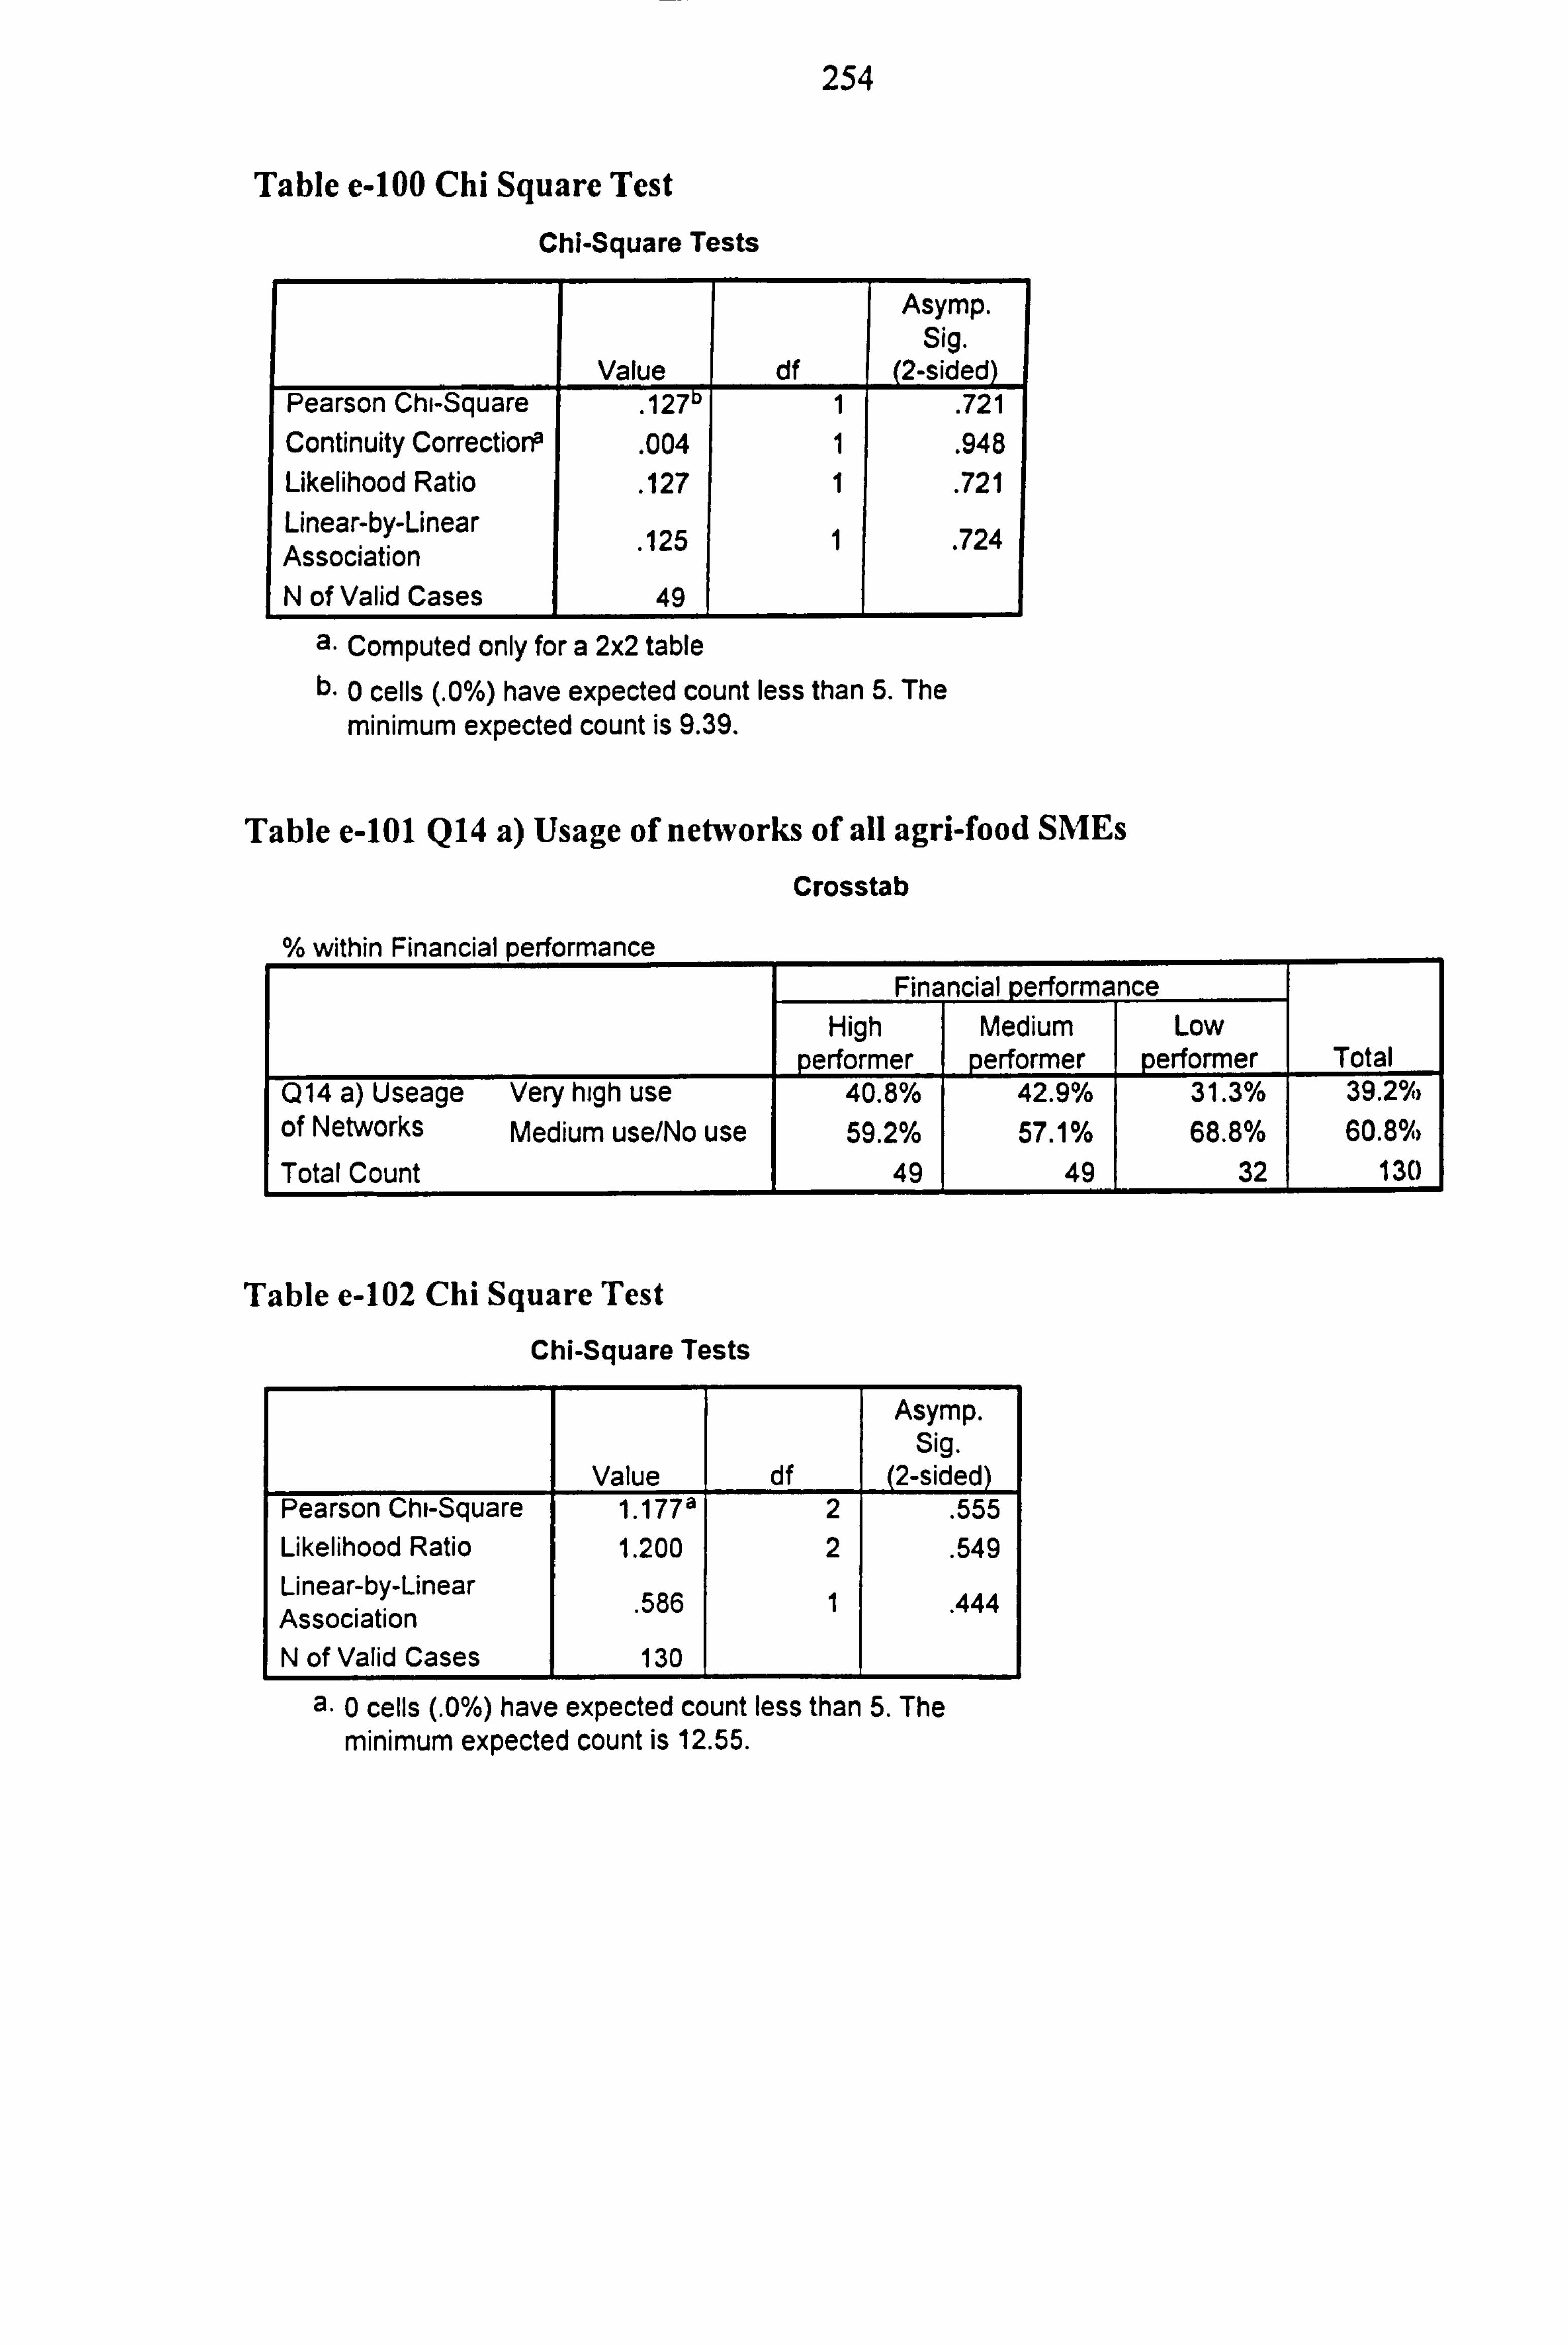
254
Table e-100 Chi Square Test
Chi-Square Tests
Value df
Asymp. Sig.
(2-sided) Pearson Chi-Square
. 127 1 . 721 Continuity Correction
. 004 1 . 948 Likelihood Ratio
. 127 1 . 721 Linear-by-Linear Association . 125 1 . 724
N of Valid Cases 49
a. Computed only for a 2x2 table b. 0 cells (. 0%) have expected count less than 5. The
minimum expected count is 9.39.
Table e-101 Q14 a) Usage of networks of all agri-food SMEs
Crosstab
% within Financial Derformance Financial performance
High Medium Low performer performer performer Total
Q14 a) Useage Very high use 40.8% 42.9% 31.3% 39.2 of Networks Medium use/No use 59.2% 57.1% 68.8% 60.8%> Total Count 49 49 32 130
Table e-102 Chi Square Test Chi-Square Tests
Asymp. Sig.
Value df (2-sided) Pearson Chi-Square 1.1771 2
. 555 Likelihood Ratio 1.200 2 . 549 Linear-by-Linear
. 586 1 . 444 Association N of Valid Cases 130
a. 0 cells (. 0%) have expected count less than 5. The minimum expected count is 12.55.
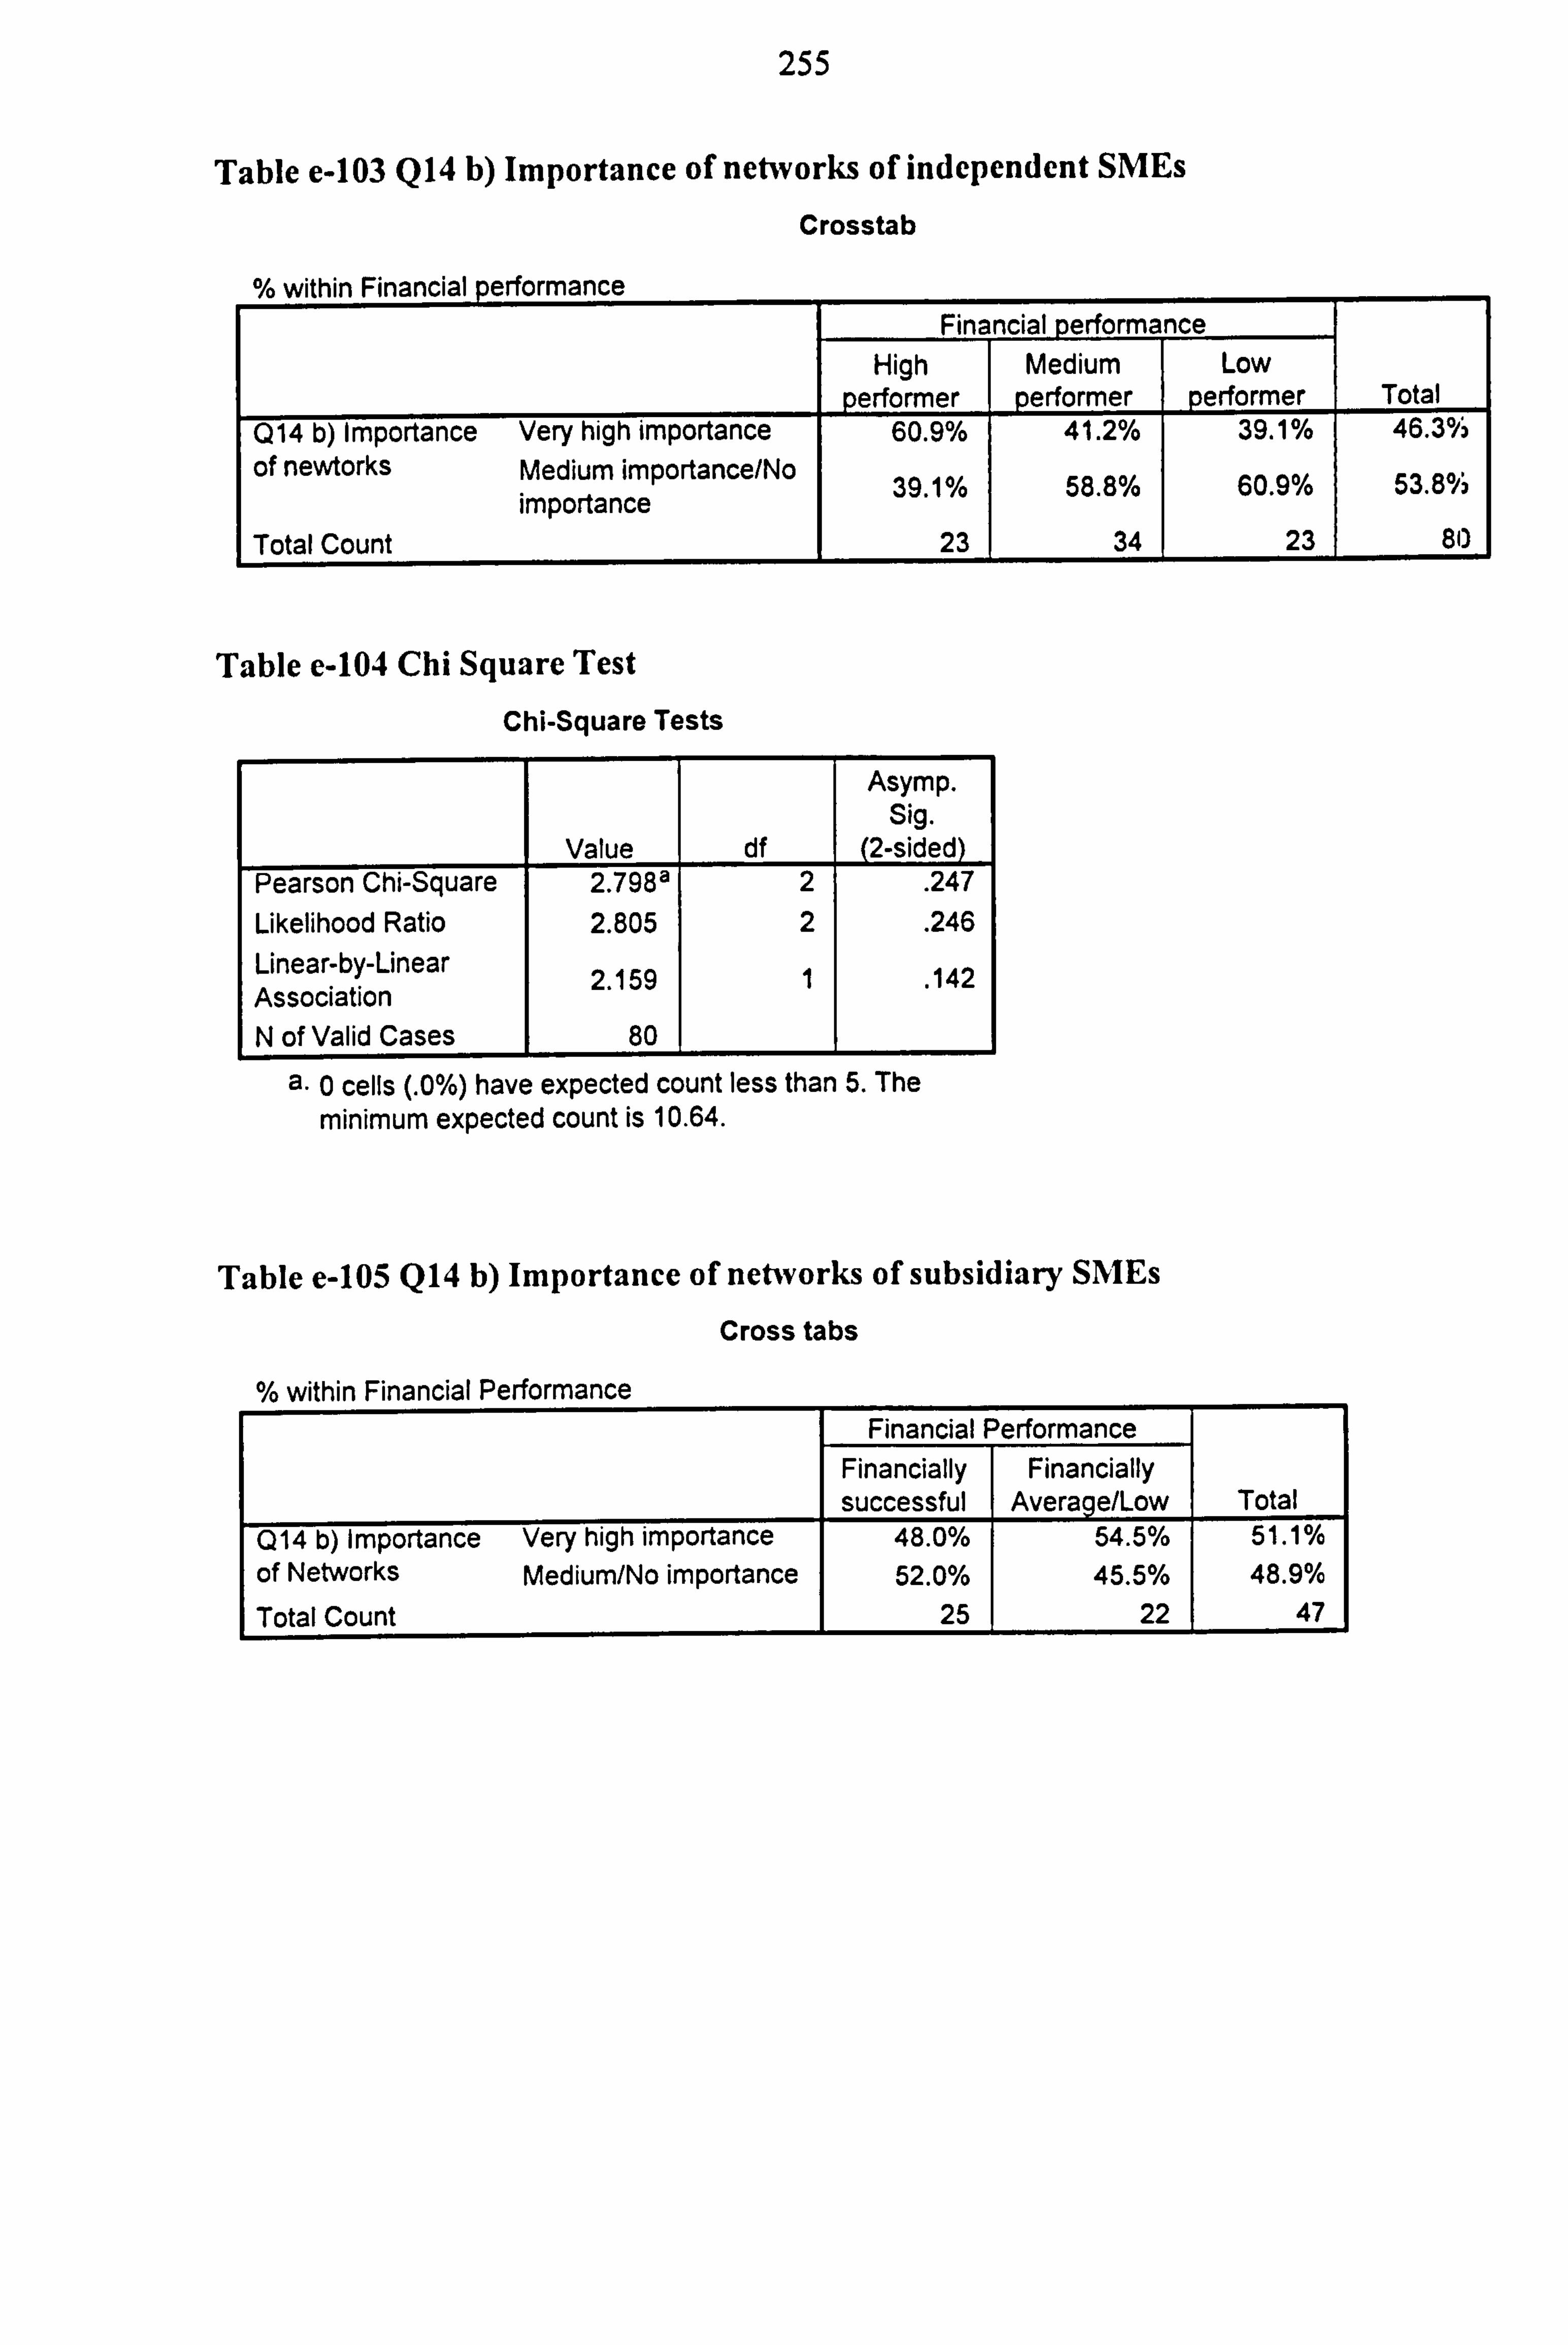
255
Table e-103 Q14 b) Importance of networks of independent SMEs
Crosstab
%/ within Financial performance Financial perform nc
High Medium Low performer performer performer Total
Q14 b) Importance Very high importance 60.9% 41.2% 39.1% 46.3°i3 of newtorks Medium importance/No ° 39 1 /0 o 58.8 /0 0 60.9 /0 0 53.8 iý importance . Total Count 23 34 23 81)
Table e-104 Chi Square Test
Chi-Square Tests
Asymp. Sig.
Value df (2-sided) Pearson Chi-Square 2.7985 2 . 247 Likelihood Ratio 2.805 2 . 246 Linear-by-Linear 2.159 1 . 142 Association N of Valid Cases 80
a. 0 cells (. 0%) have expected count less than 5. The minimum expected count is 10.64.
Table e-105 Q14 b) Importance of networks of subsidiary SMEs
Cross tabs
% within Financial Performance Financial Performance
Financially Financially successful Average/Low Total
Q14 b) Importance Very high importance 48.0% 54.5% 51.1%
of Networks Medium/No importance 52.0% 45.5% 48.9% Total Count 25 22 47
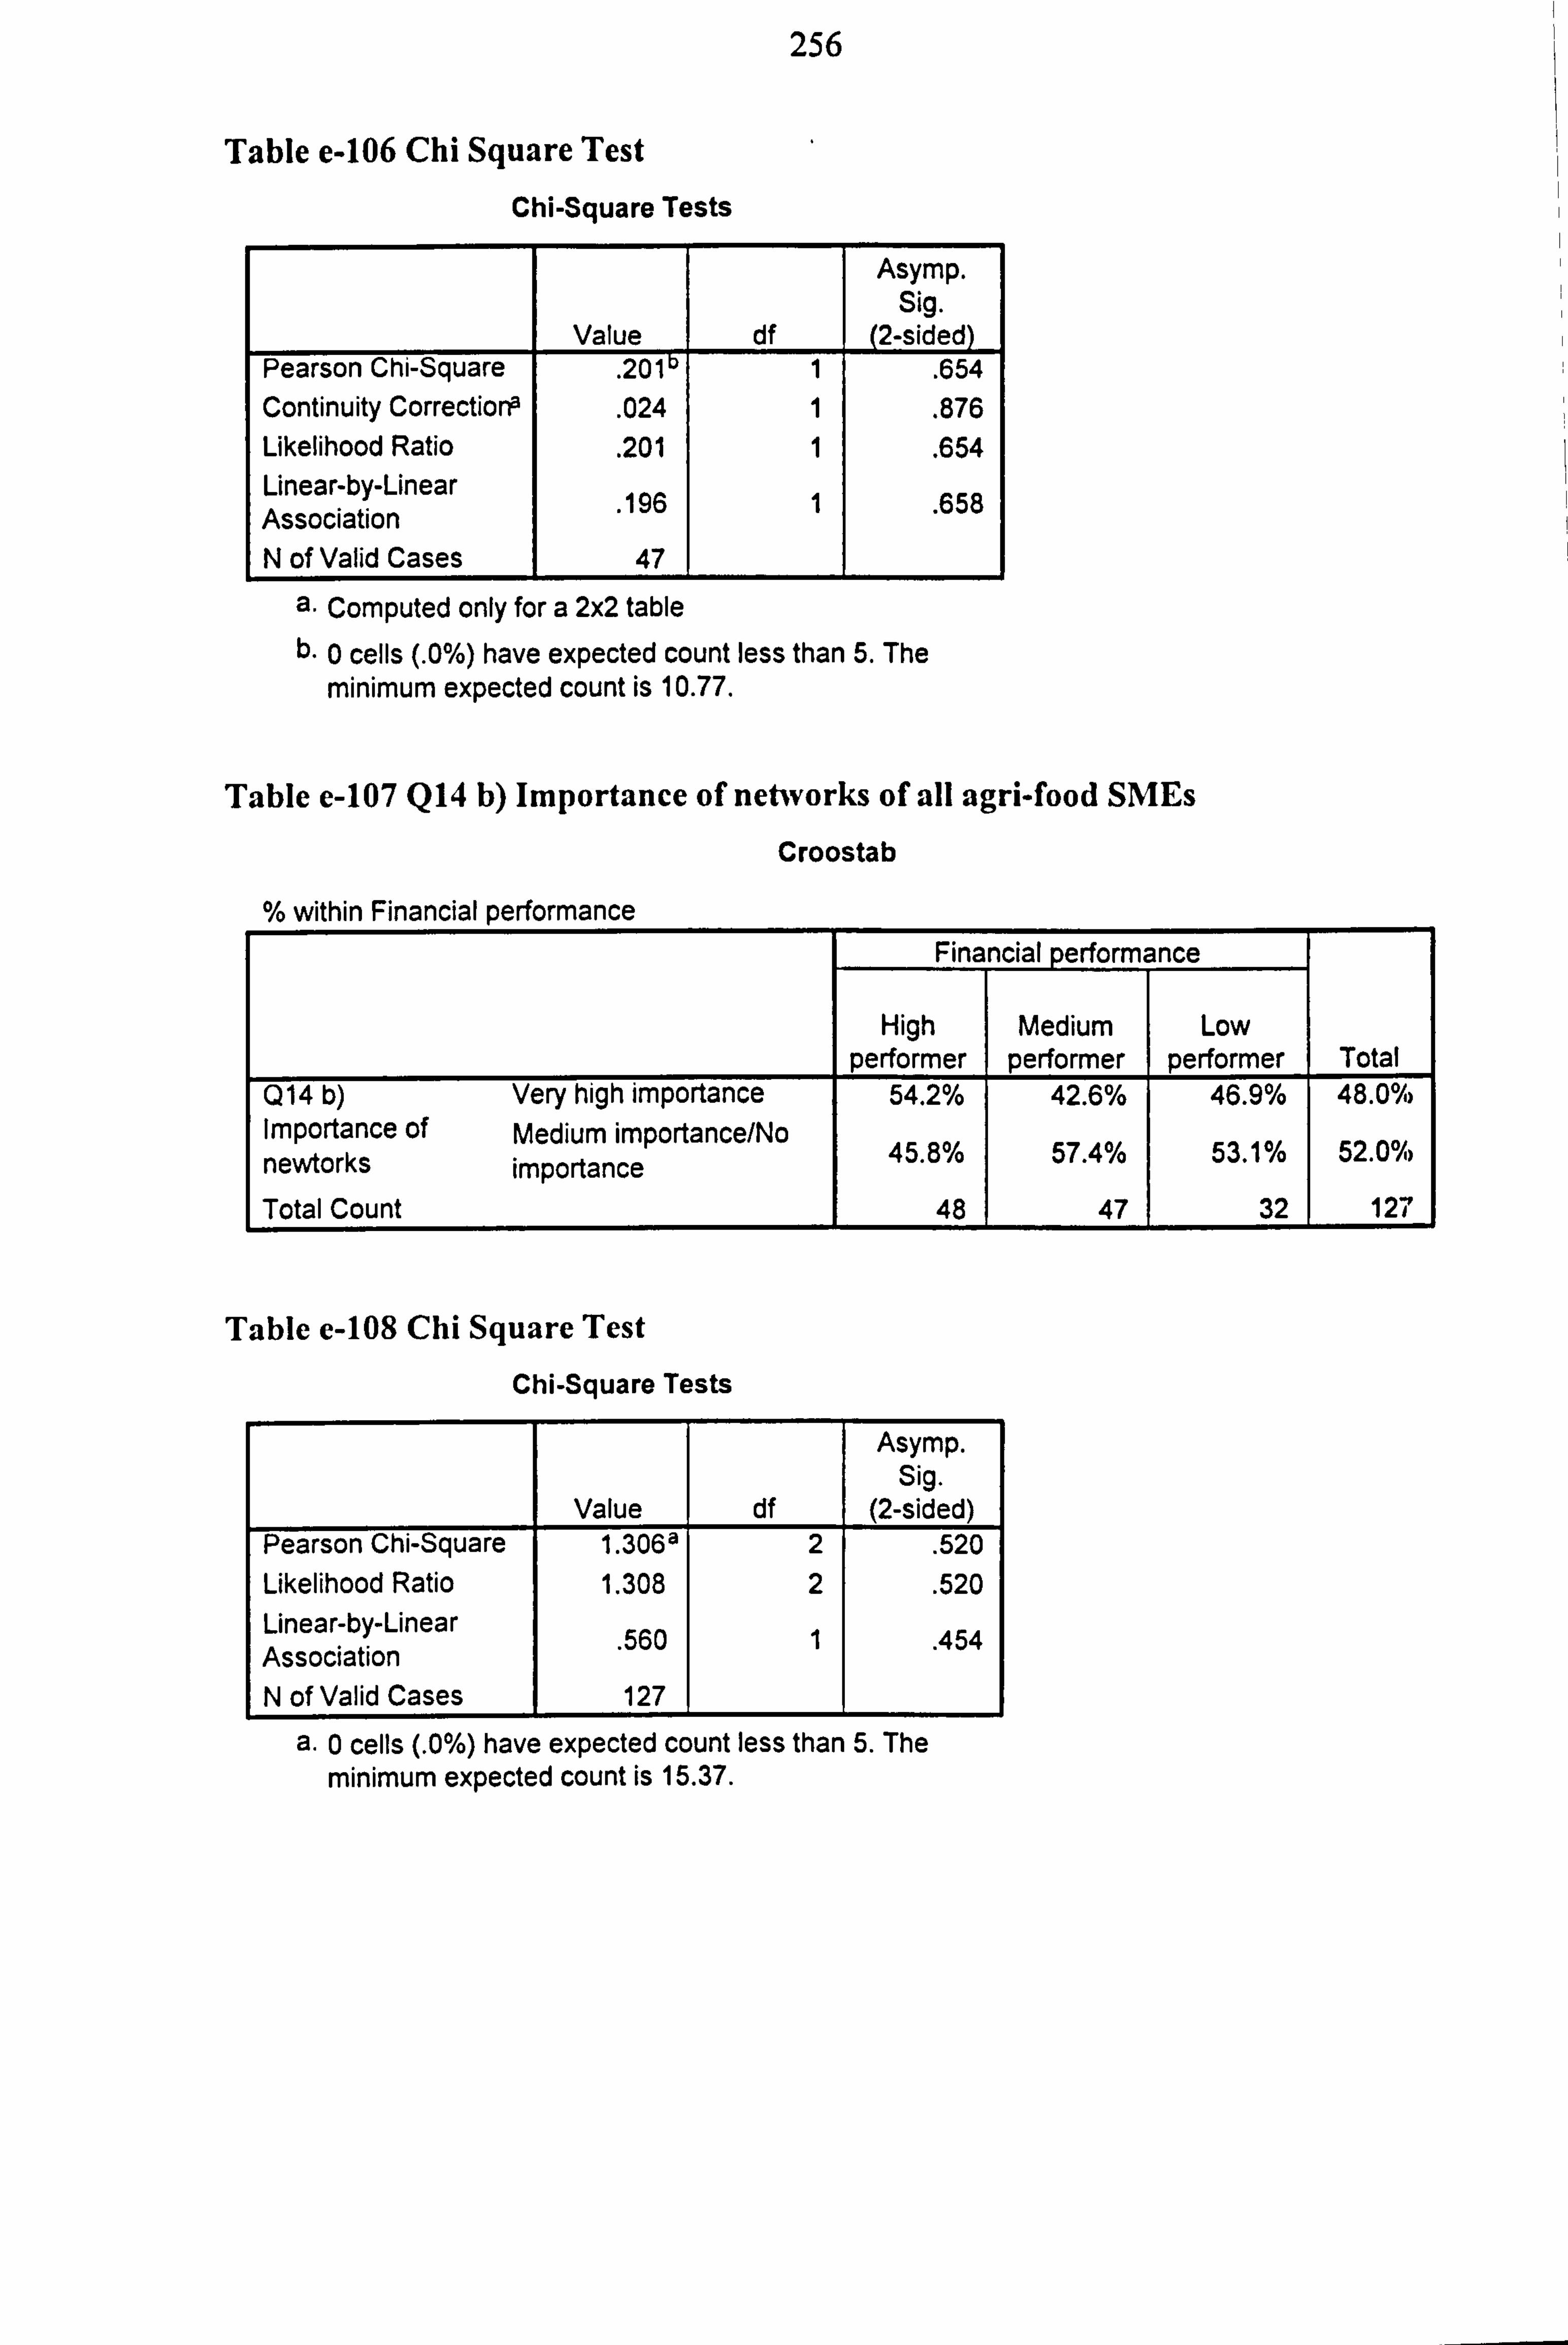
256
Table e-106 Chi Square Test
Chi-Square Tests
Value df
Asymp. Sig.
(2-sided) Pearson Chi-Square . 20111 1 . 654 Continuity Correction
. 024 1 . 876 Likelihood Ratio
. 201 1 . 654 Linear-by-Linear Association 196 1 . 658
N of Valid Cases 47
a. Computed only for a 2x2 table b. 0 cells (. 0%) have expected count less than 5. The
minimum expected count is 10.77.
Table e-107 Q14 b) Importance of networks of all agri-food SMEs
Croostab
% within Financial performance Financial perform nc
High Medium Low performer performer performer Total
Q14 b) Very high importance 54.2% 42.6% 46.9% 48.0%, Importance of Medium importance/No newtorks importance 0 45.8 /0 o 57.4 /0 a 53.1 /0 52.0%)
Total Count 48 47 32 127
Table e-108 Chi Square Test
Chi-Square Tests
Asymp. Sig.
Value df (2-sided) Pearson Chi-Square 1.3061 2 . 520 Likelihood Ratio 1.308 2 . 520 Linear-by-Linear
. 560 1 . 454 Association N of Valid Cases 127
a. 0 cells (. 0%) have expected count less than 5. The minimum expected count is 15.37.
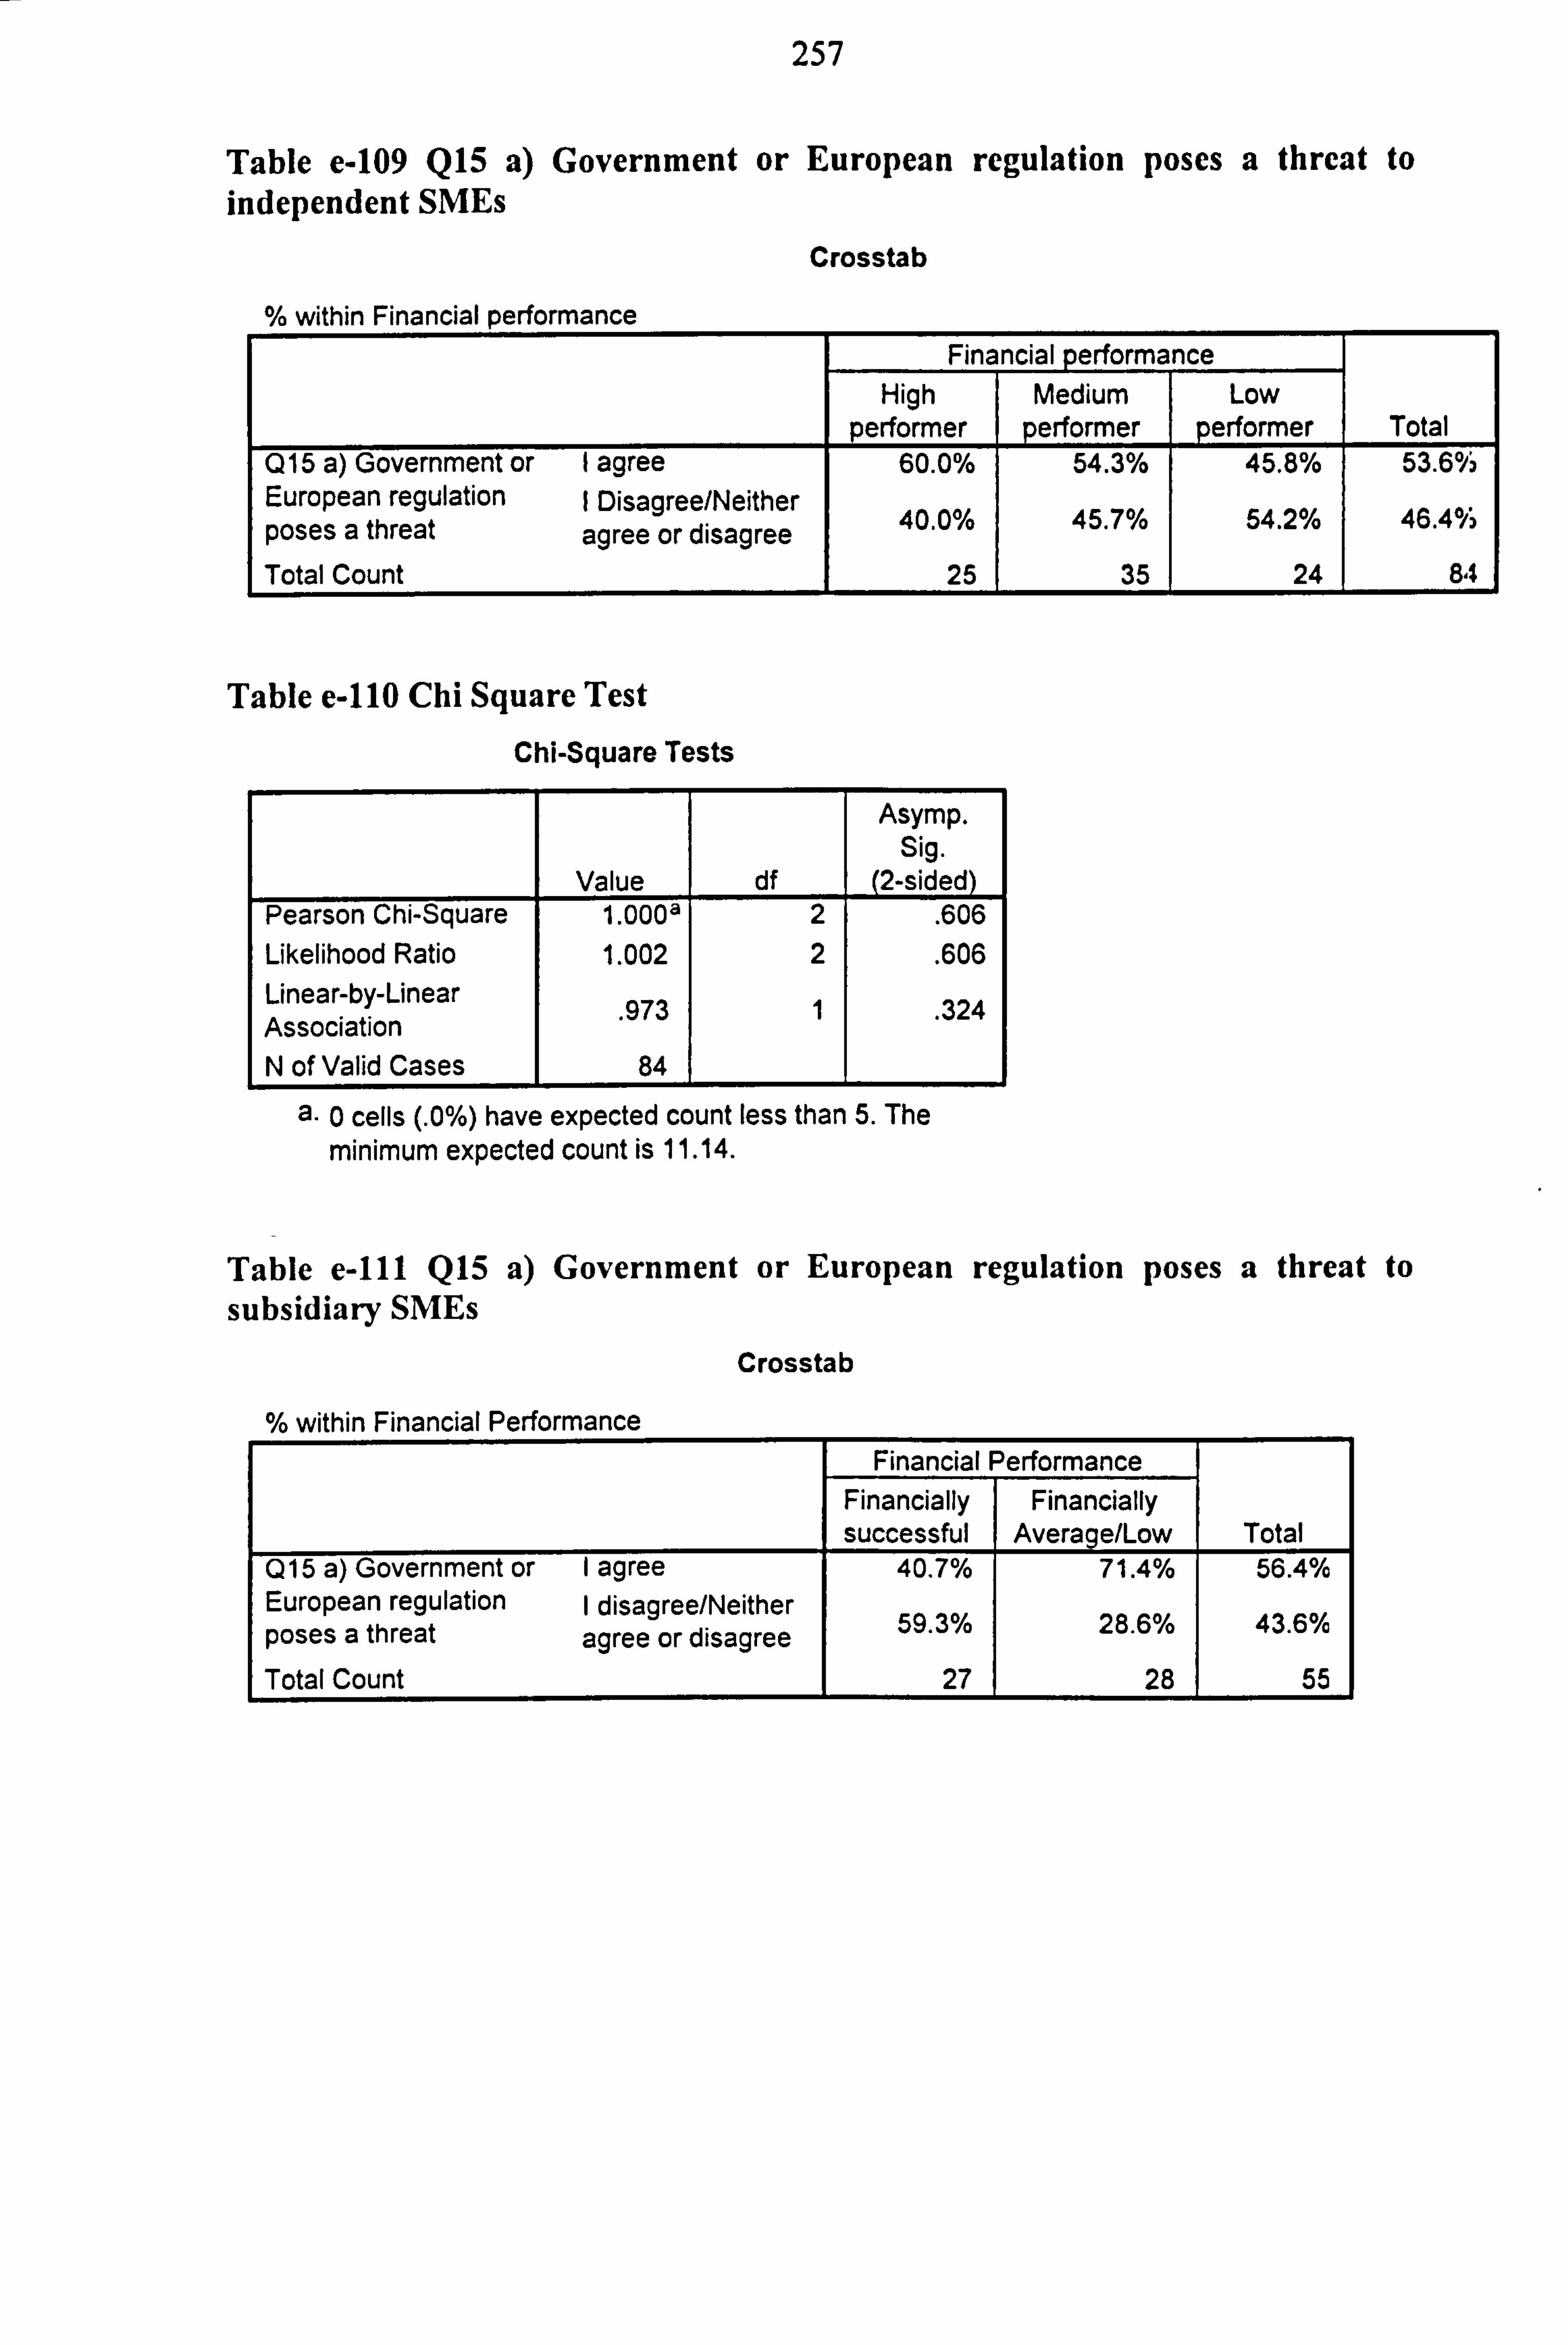
257
Table e-109 Q15 a) Government or European regulation poses a threat to independent SMEs
Crosstab
within Financial performance Financial perform nc
High Medium Low performer performer performer Total
Q15 a) Government or I agree 60.0% 54.3% 45.8% 53.6% European regulation I Disagree/Neither . poses a threat agree or disagree o 40.0% , 45.7% o 54.2% ar ý 46.4
Total Count 25 35 24 84
Table e-110 Chi Square Test
Chi-Square Tests
Asymp. Sig.
Value df (2-sided) Pearson Chi-Square 1.000a 2 . 606 Likelihood Ratio 1.002 2 . 606 Linear-by-Linear 973 1 . 324 Association N of Valid Cases 84
a. 0 cells (. 0%) have expected count less than 5. The minimum expected count is 11.14.
Table e-111 Q15 a) Government or European regulation poses a threat to subsidiary SMEs
Crosstab
0/ within Financial Performance
Financial Performance Financially Financially successful Average/Low Total
Q15 a) Government or I agree 40.7% 71.4% 56.4% European regulation I disagree/Neither poses a threat agree or disagree o 59.3 /a 0 28.6 /0 0 43.6 /a
Total Count 27 28 55
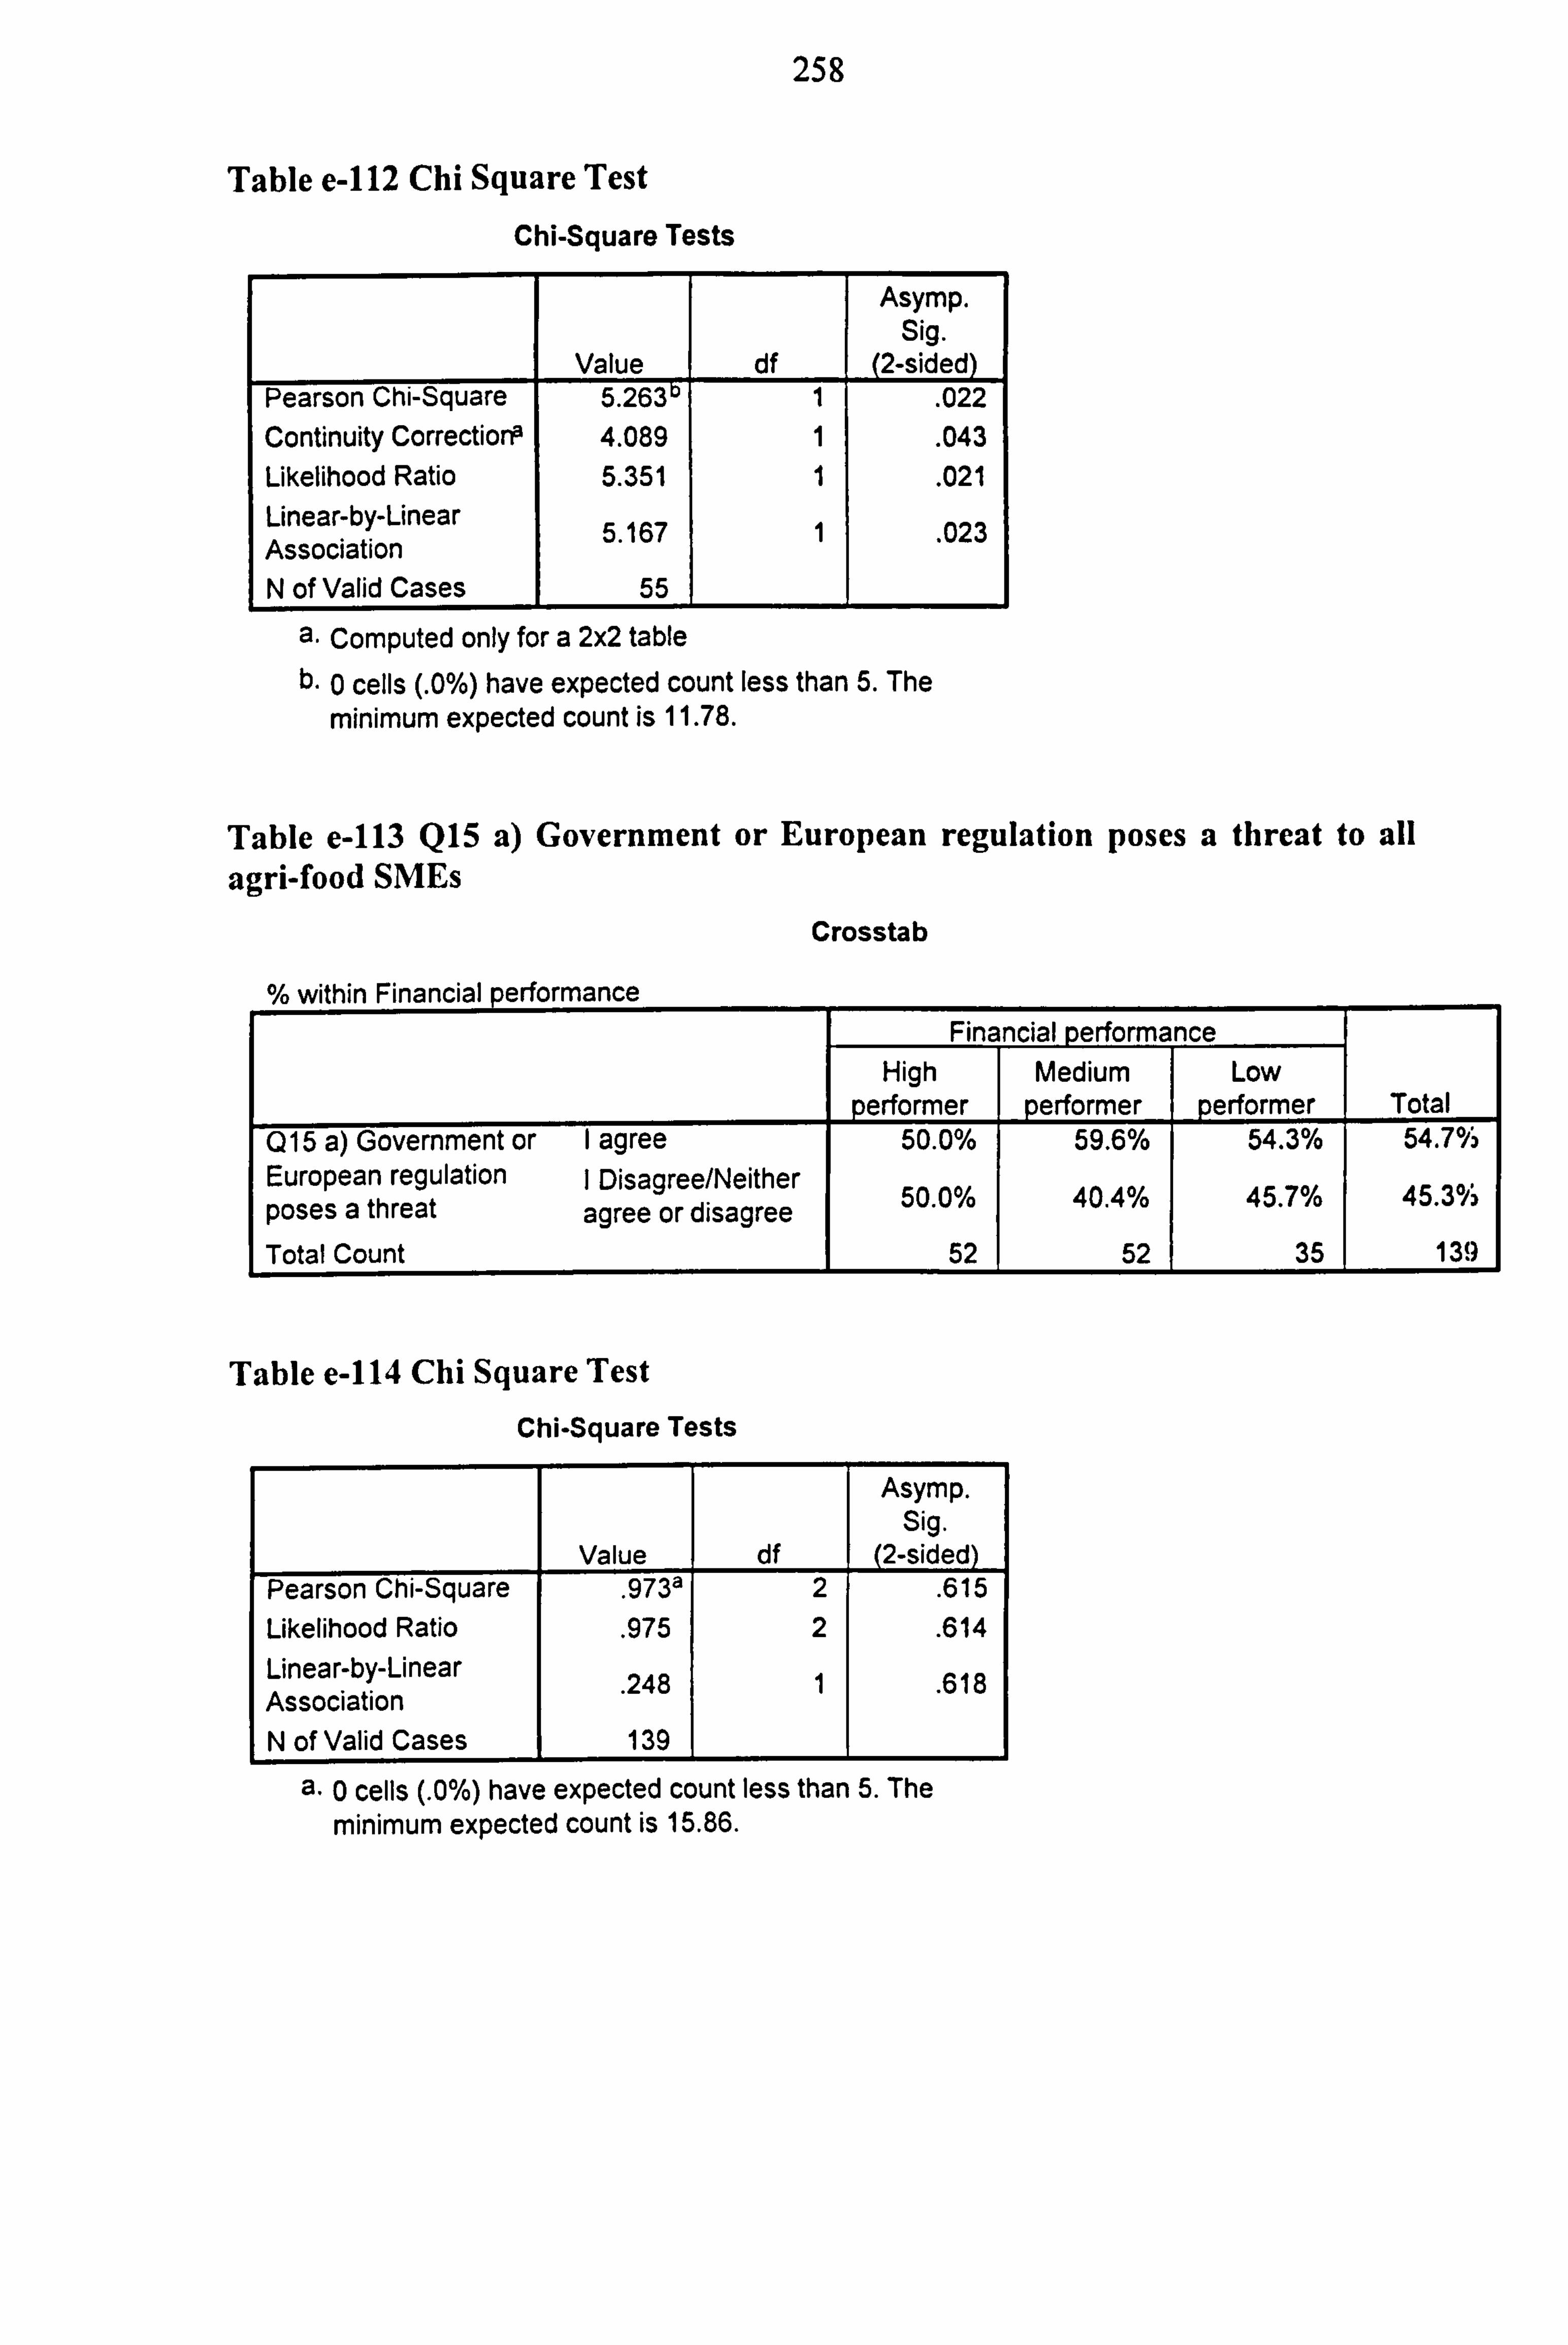
258
Table e-112 Chi Square Test
Chi-Square Tests
Value df
Asymp. Sig.
(2-sided) Pearson Chi-Square 5.263 1 . 022 Continuity CorrectiorP 4.089 1 . 043 Likelihood Ratio 5.351 1 . 021 Linear-by-Linear Association 5.167 1 . 023
N of Valid Cases 55
a. Computed only for a 2x2 table b. 0 cells (. 0%) have expected count less than 5. The
minimum expected count is 11.78.
Table e-113 Q15 a) Government or European regulation poses a threat to all agri-food SMEs
Crosstab
OL Gir nrinI norfnrmanca
Financial perform nce High Medium Low
performer performer performer Total Q15 a) Government or I agree 50.0% 59.6% 54.3% 54.7°i, European regulation I Disagree/Neither o 50 0 /° ° 40 4 /° ° 7 /0 45 °. 45 3 iý poses a threat agree or disagree . . . . Total Count 52 52 35 139
Table e-114 Chi Square Test
Chi-Square Tests
Asymp. Sig.
Value df (2-sided) Pearson Chi-Square . 973a 2 . 615 Likelihood Ratio . 975 2 . 614 Linear-by-Linear 248 1 . 618 Association N of Valid Cases 139
a. 0 cells (. 0%) have expected count less than 5. The minimum expected count is 15.86.
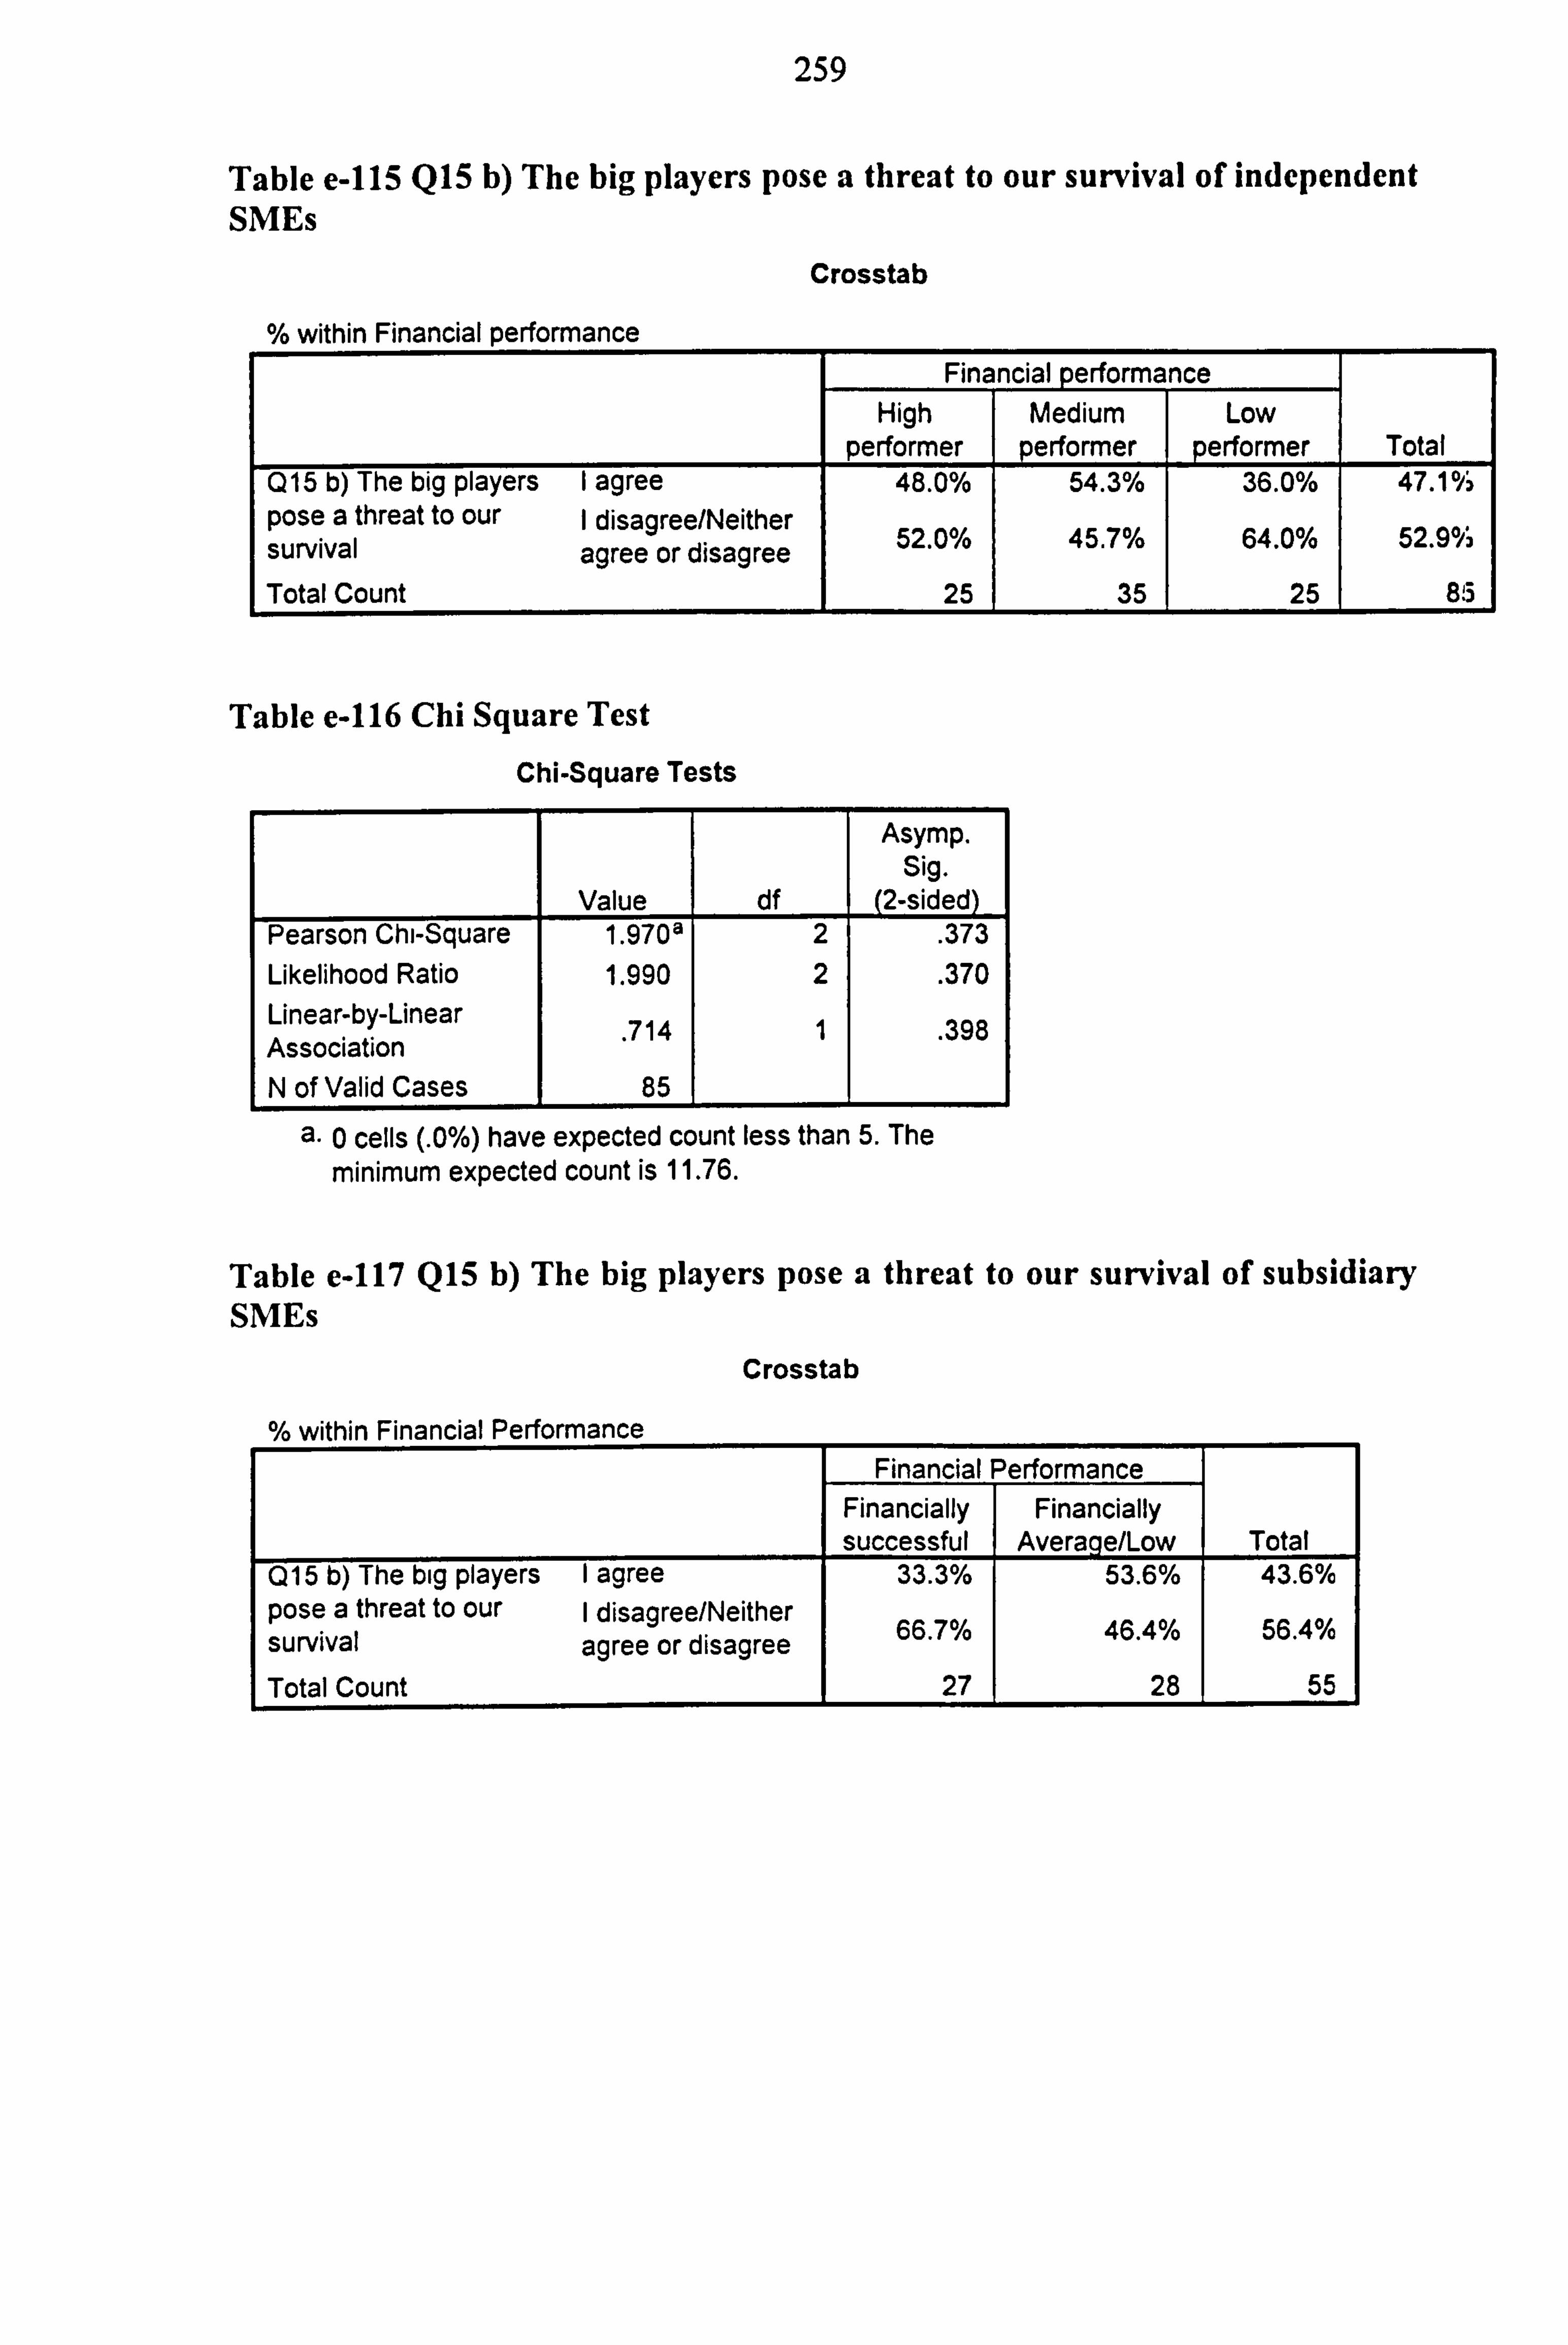
259
Table e-115 Q15 b) The big players pose a threat to our survival of independent SMEs
Crosstab
within Financial performance Financial perform nc
High Medium Low performer performer performer Total
Q15 b) The big players I agree 48.0% 54.3% 36.0% 47.1°/i pose a threat to our I disagree/Neither ; survival agree or disagree o 52.0% 0 45.7% 0 64.0% 0i 52.9 ý
Total Count 25 35 25 85
Table e-116 Chi Square Test
Chi-Square Tests
Asymp. Sig.
Value df (2-sided) Pearson Chi-Square 1.970a 2 . 373 Likelihood Ratio 1.990 2 . 370 Linear-by-Linear 714 1 . 398 Association N of Valid Cases 85
a. 0 cells (. 0%) have expected count less than 5. The minimum expected count is 11.76.
Table e-117 Q15 b) The big players pose a threat to our survival of subsidiary SMEs
Crosstab
% within Financial Performance Financial Performance
Financially Financially successful Average/Low Total
Q15 b) The big players I agree 33.3% 53.6% 43.6% pose a threat to our I disagree/Neither survival agree or disagree 66.7% 46.4% 56.4%
Total Count 27 28 55
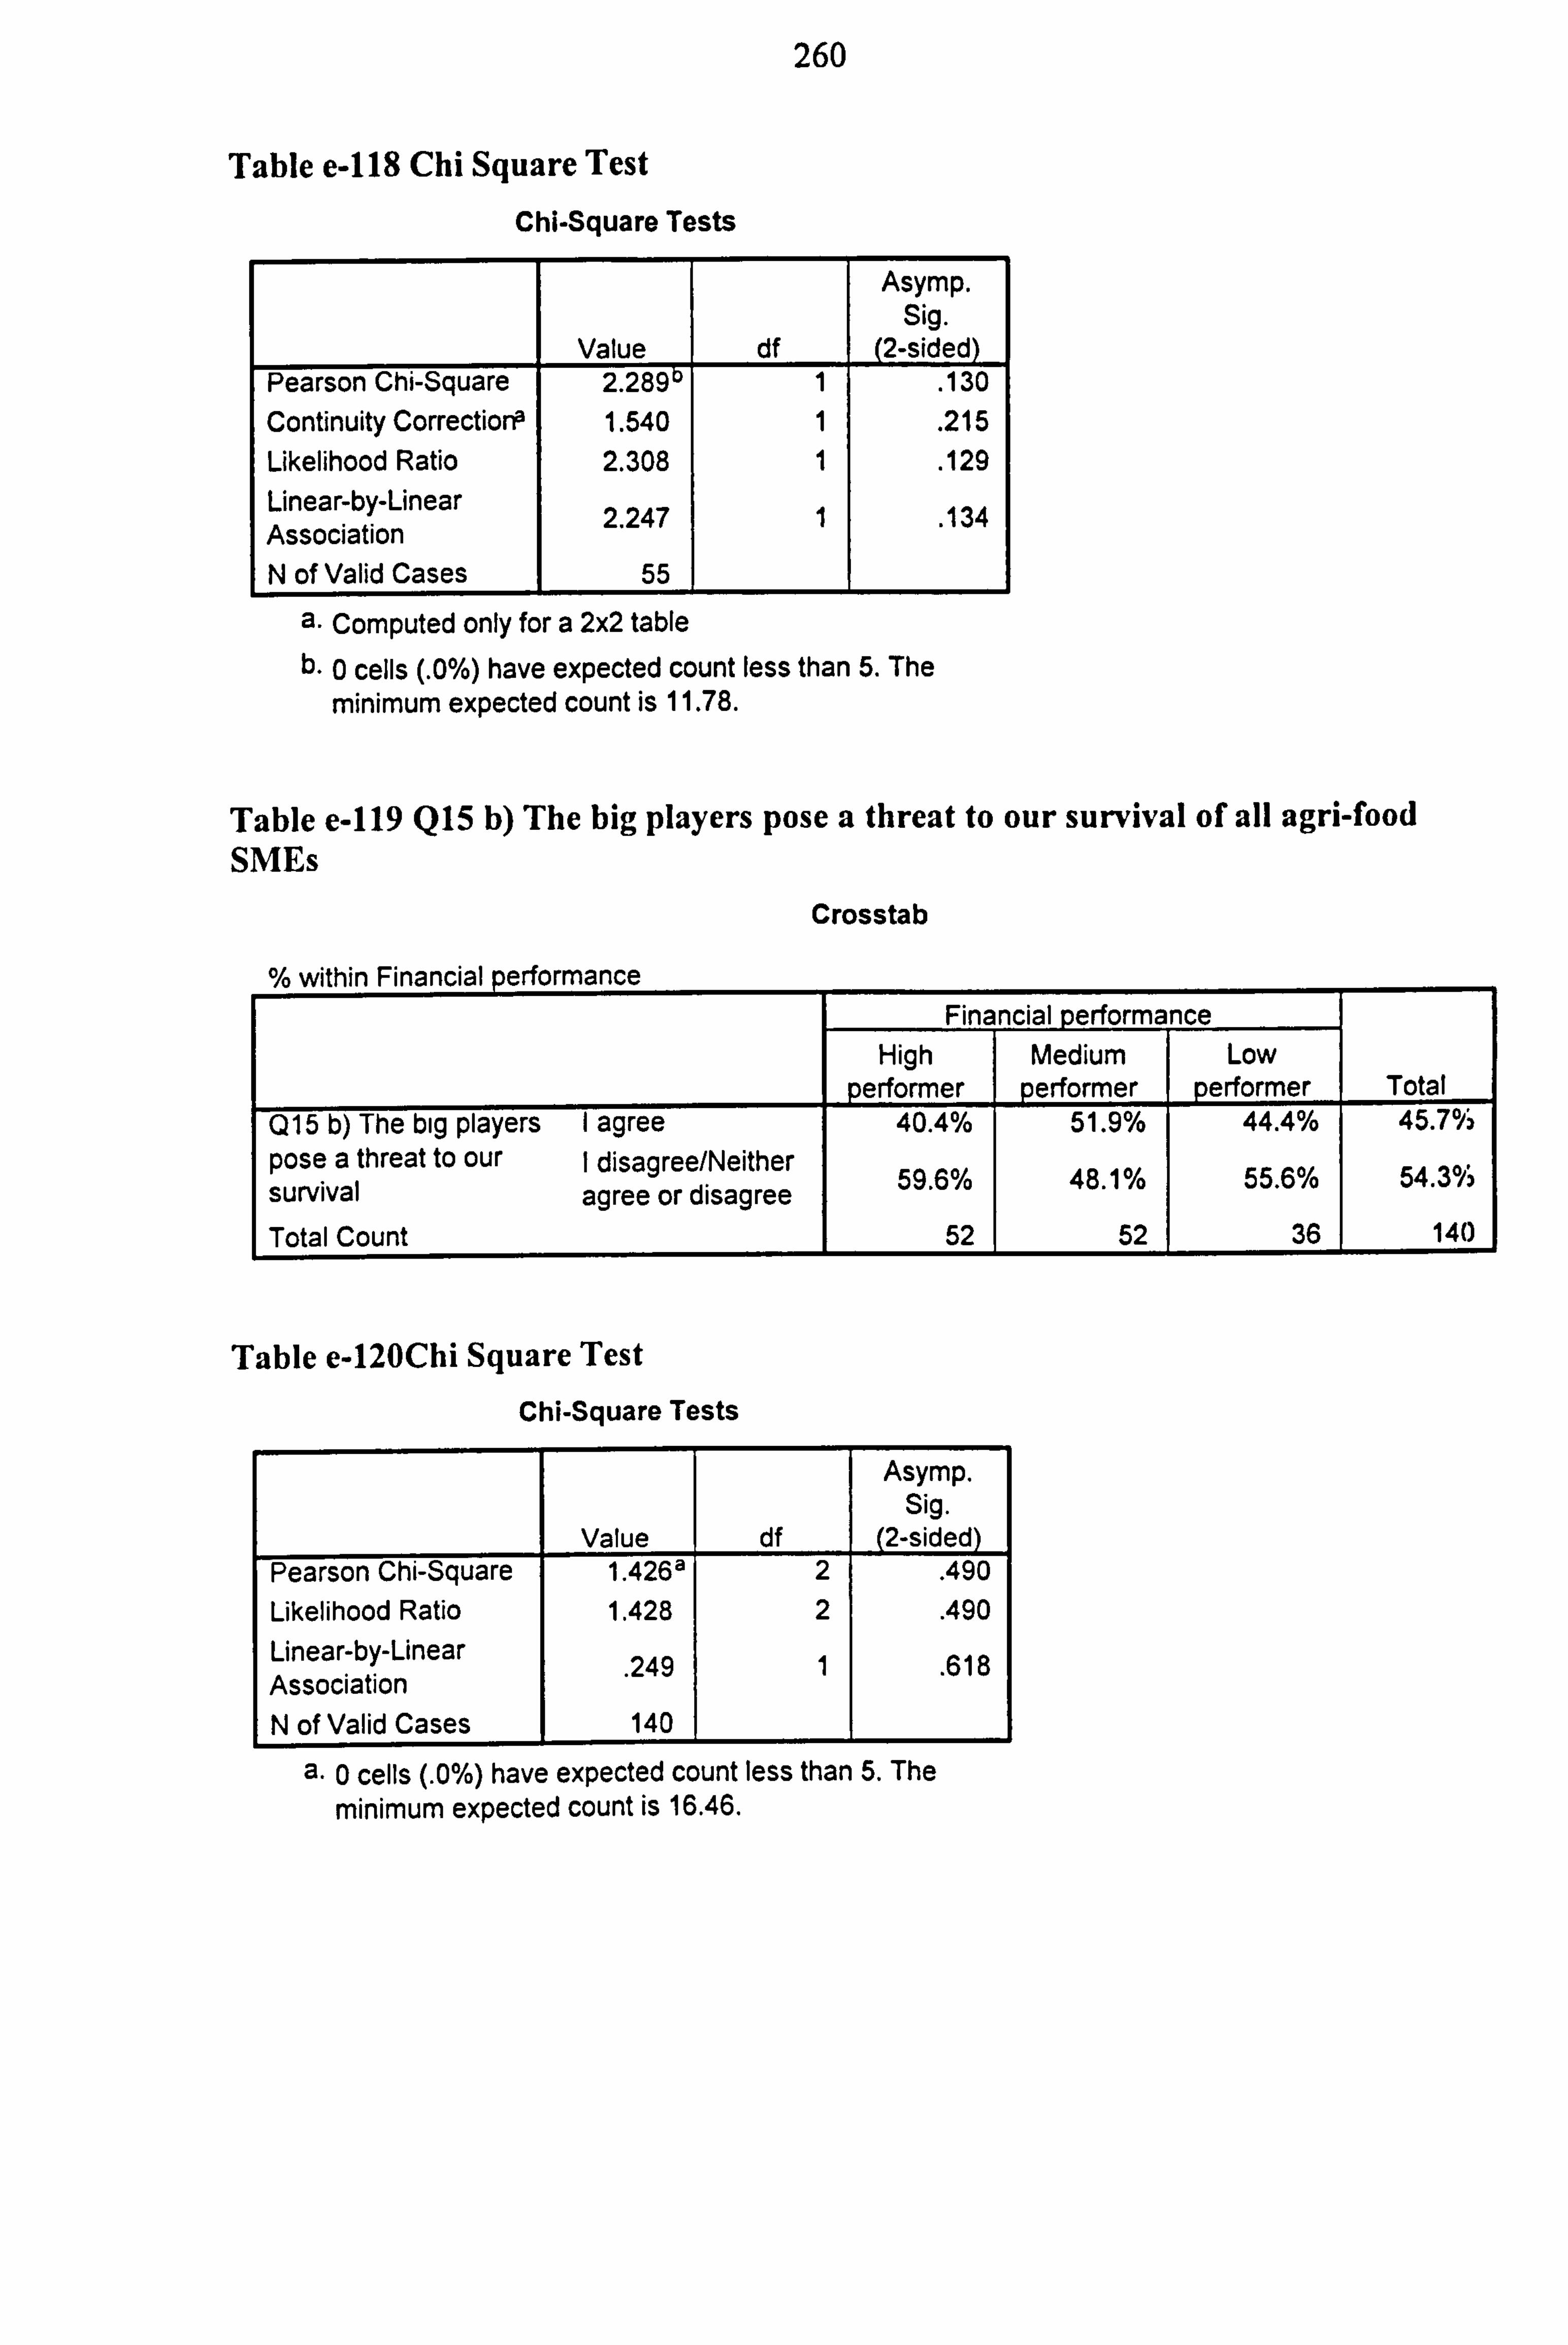
260
Table e-118 Chi Square Test
Chi-Square Tests
Value df
Asymp. Sig.
(2-sided) Pearson Chi-Square 2.289 1 . 130 Continuity Correctior-P 1.540 1 . 215 Likelihood Ratio 2.308 1 . 129 Linear-by-Linear 2 247 1 . 134 Association . N of Valid Cases 55
a. Computed only for a 2x2 table b. 0 cells (. 0%) have expected count less than 5. The
minimum expected count is 11.78.
Table e-119 Q15 b) The big players pose a threat to our survival of all agri-food SMEs
Crosstab
% within Financial performance Financial perform nc
High Medium Low performer performer performer Total
Q15 b) The big players I agree 40.4% 51.9% 44.4% 45.7°h pose a threat to our I disagree/Neither o 59 6 /0 0 48 1 /0 0 55 6 /0 0ý 54.3 ýý survival agree or disagree . . . Total Count 52 52 36 140
Table e-120Chi Square Test
Chi-Square Tests
Asymp. Sig.
Value df (2-sided) Pearson Chi-Square 1.426a 2 . 490 Likelihood Ratio 1.428 2 . 490 Linear-by-Linear
. 249 1 . 618 Association N of Valid Cases 140
a. 0 cells (. 0%) have expected count less than 5. The minimum expected count is 16.46.
261
Appendix f Two cases of independent and subsidiary agri-food SMEs
The following two cases are examples of the five companies involved in the case
studies of successful agri-food SMEs. The actual studies were done during the
summer of 1998, therefore some of the statistical tables reflect that time-period. The
first case was interviews with the owner managers who were the directors of the
company, and the second case was an interview with the marketing director of the
company.
Case 1: High performing independent agri-food SME
This company was founded in February 1990 and is now a small family owned
sandwich manufacturing company based in Cleveland-Middlesborough, in the North
East of the UK. It is a limited company, employing 80 to 110 full and part time
employees, depending on the season. Its turnover showed a significant increase the
last five years and the owners are a married couple who are also the Managing
Directors (MDs). The main distribution area is the North of England, from Newcastle
to Liverpool, although the company has some exporting activities in the European
Union.
The market
Mintel (1997) estimates the commercial UK sandwich sector to be worth an
estimated £2.2 billion at 1997 prices. During 1997, almost 1.7 billion sandwiches
were sold. Sales have benefited from the convenience, good value and relatively
healthy image of the sandwich. The sandwich sector remains extremely buoyant,
with growth of 45% at current prices registered between 1992 and 1997.

262
Nonetheless, annual growth rates across the industry have slowed despite the healthy
15% increase recorded by some multiple retailers in 1996-97.
Table f-l Total Sandwich Market
Index Q 1997 (est)
£m at1992 1996 prices Q 1995
Q 1994 Index 01993
Q 1992 £m
0 500 1,000 1,500 2,000 2,500
Source: Mintcl (1997)
In addition to the £22 million . north of sandwiches sold commercially, it has been
estimated that some £3 billion worth of sandwiches are made at home. The home-
made sandwich is probably a greater threat to the industry than many of the obvious
competitors. such as other savoury snacks and different types of fast food. However.
the convenience and diversity of sandwiches available pre-packed from the
supermarket high street multiple or freshly made at the bakery/sandwich bar will
continue to ensure that demand remains strong (Mintel 1997). Further steady growth
is forecast for the sandwich market. Mintel (1997) expects future developments will
he spearheaded by sandwich manufacturers and retailers with expertise in the
catering sector.
Main achievements
Case I has been awarded various accolades including the following:
0 Winner of the Teeside training and Enterprise Council Small Business of the
Year 1994.

263
" Finalist in the Northern Business of the year Awards Small Business section
1995.
" Winner of the Anglo-Dutch Award for Enterprise 1995.
" Finalist in the Teeside Small Business of the Year 1995 and 1996.
" Winner of the British Sandwich association as Exporter of the year 1996 and
1997.
Therefore, there is evidence of this company's commercial and international success.
Brief history
The company started as a coffee shop, which provided high quality sandwiches and
salads. The company also provided sandwiches for the local businesses and offices.
After this initial stage, the company decided to start producing sandwiches for the
wholesale market i. e. garage forecourts and local newsagents, from a small room
above the coffee shop. Production reached 1000 units per day. In order to increase
their market share and attract large customers, the company had to expand. An
investment of £100,000, together with a £20,000 Economic Development Grant was
used to convert two buildings adjoining the coffee shop into a sandwich production
unit. Daily production of 1500 units (sandwiches) began in 1993, and the full
capacity of the new production unit was 8000 units per day. In 1996/97 full capacity
had been reached. The next stage of the company was to invest £500,000 in a new
sandwich production facility in an industrial park nearby. This new unit started
operations in September 1997, and has a production capacity of 50,000 units per day.
Now the company produces about 14,000 units per day.
264
Business Philosophy
Case I produces a high quality sandwich, and offers a bigger variety than the average
sandwich manufacturer, at a reasonable price. It wants to expand its customer base,
and since it is in a stage of becoming a medium sized company, it seeks advice on
marketing issues. Its competitors do not have the capacity to produce the quantities
this company produces, and the closest real competitor is located at least 100 miles
away. The owners' perception of the main reason behind the company's success is
the product. Therefore, case 1 can be classed as a production marketer.. Word of
mouth was also found to have a significant importance to the company's success.
Strategic analysis
The company believes that although planning tools are important, it does not actively
use many of them.
" We do not do anything formally. We do not right down anything, and do not get to
great length to analyse anything. Everything is done so far on gut instinct. As we
have grown, we have become a bit more formal. We know where we are and what
we should do at any stage so there is not a need for sophisticated analysis tools. The
more we grow however, the more we will need to use formal sophisticated planning
tools. We know where we need to change to get where we want. "
The market research and information on competitors and the market comes from
friends and colleagues. Nevertheless the company employed a consultant for a
market research project, in order to investigate their customers' preferences, and how
they are performing (Larkinson et al, 1998).
265
As the owners said:
" We are in a stage where we desperately need to know what our customers thing
about our products. We produce new products because we like them. John likes
fillings that are more complicated but we really need to know what our customers
need. We have never had, apart from complaints, any feedback nor have we or know
any way of doing it. We perhaps never needed it before but we do know. I know if
we did some market research we would identify our star products and cut some from
our range which do not make much profit. "
The outcome of the consultation document was for the company to:
" Eliminate 5 loss making products and 13% of the product portfolio, which
increased profitability by 5%.
" Incorporate 3 new packaging designs to their existing line.
" Adopt the marketing research methodology for future use.
Marketing strategy
The owners want to be more aggressive with their market penetration, especially in
Europe. They seek new customers but do not have the time to expand in mainland
Europe, despite their success record in exporting activities. However, they claim that:
"Europe is our future. We would like to spend more time to expand the market there.
We have people calling us from abroad all the time, to help them out with their
sandwich operation ... we just do not have the time and energy, we are getting old... "
266
In terms of the marketing mix, they acknowledge the importance of the reputation
and product quality for their success. The also have their own vans for distribution,
but do not use the drivers to collect information.
Company reputation for a high quality product and good variety with a capacity to
produce large quantities were the three most important factors of customer
satisfaction in the market research undertaken for the company (Larkinson et al
1998).
Marketing organisation
The owners are in charge of most marketing activities within the company. They
make the decisions and they gather information for the market and their competitors,
predominantly from colleagues and friends, in order to analyse them and use in
pricing or variety of products. There is not a separate department.
The company has a problem in responding fast to customer change, however due to
the owners' peoples' skills, they find a way to retain their customer for a long time:
"... this is a small example but, when a particular customer would want to change to
put their own pricing on the label, and you say yes no problem, and then all of a
sudden you have created twenty five different types of labels and different types of
pricing... and because of bad management we sometimes have to call customers and
say, look we are going to give you an extra 2% discount if you do not have your label
and price on the sandwich, and then we pay them a visit to let them know that it will
267
not happen again. Actually we are addressing that issue at the moment and we know
we have to stop doing it. Otherwise we are going to loose all of our customers. "
Marketing control
The consultation document provided the company with a more structured way of
collecting marketing information and controlling the marketing function.
"We desperately needed that type of information... "
Nevertheless there are still issues of delegating responsibility, since they need to stop
being generalists but assign someone just for marketing.
"We do a bit of everything in order to control the business... maybe we need to give
more responsibility to our staff'
Networks and the agri-food environment
The company uses mainly friends and family as well as outside colleagues to benefit
the business. For example they knew an academic the University of Newcastle and
asked for his help with the marketing research consultation project. However, the
owners do not think it is enough to grow and succeed.
"Networks are important but not as important as product or service quality. However,
do not get me wrong, we use networks as much as possible"
268
Similarly for the European and government regulation was not an issue. However the
big players, although not regional, have some influence on them:
"Really now we are competing against the big companies, so we had to throw a lot of
money on business management issues like finance and some marketing, and we will
continue to do so, even more ... no they do not pose a threat they are competition,
since the lower end of the sandwich manufacturers have died out the last five year,
the remaining companies compete on equal terms... "
Case 2: High performing subsidiary agri-food SME
Company profile
The company was formed in 1995 in the North East region of the UK as a private
company, and is now a subsidiary company of a Canadian multinational, which
specialises in packaging of fresh fruit produce. It was acquired in February 1997, and
it is the fastest growing producer of prepared cut-fruit products in the UK. It
employees about 110-130 full and part time employees. Its sales showed significant
increase throughout the last three and a half years, and one of the previous two
owners is still the Managing Director of the company, whereas he second left the
company after the acquisition. Distribution of the products is only in the UK, with
plans for extension to other European countries.
The market
The sales of prepared salads have been on an upward trend since 1992. At current
prices the market grew by 38% between 1992 and 1996 to reach a value of £300
million.
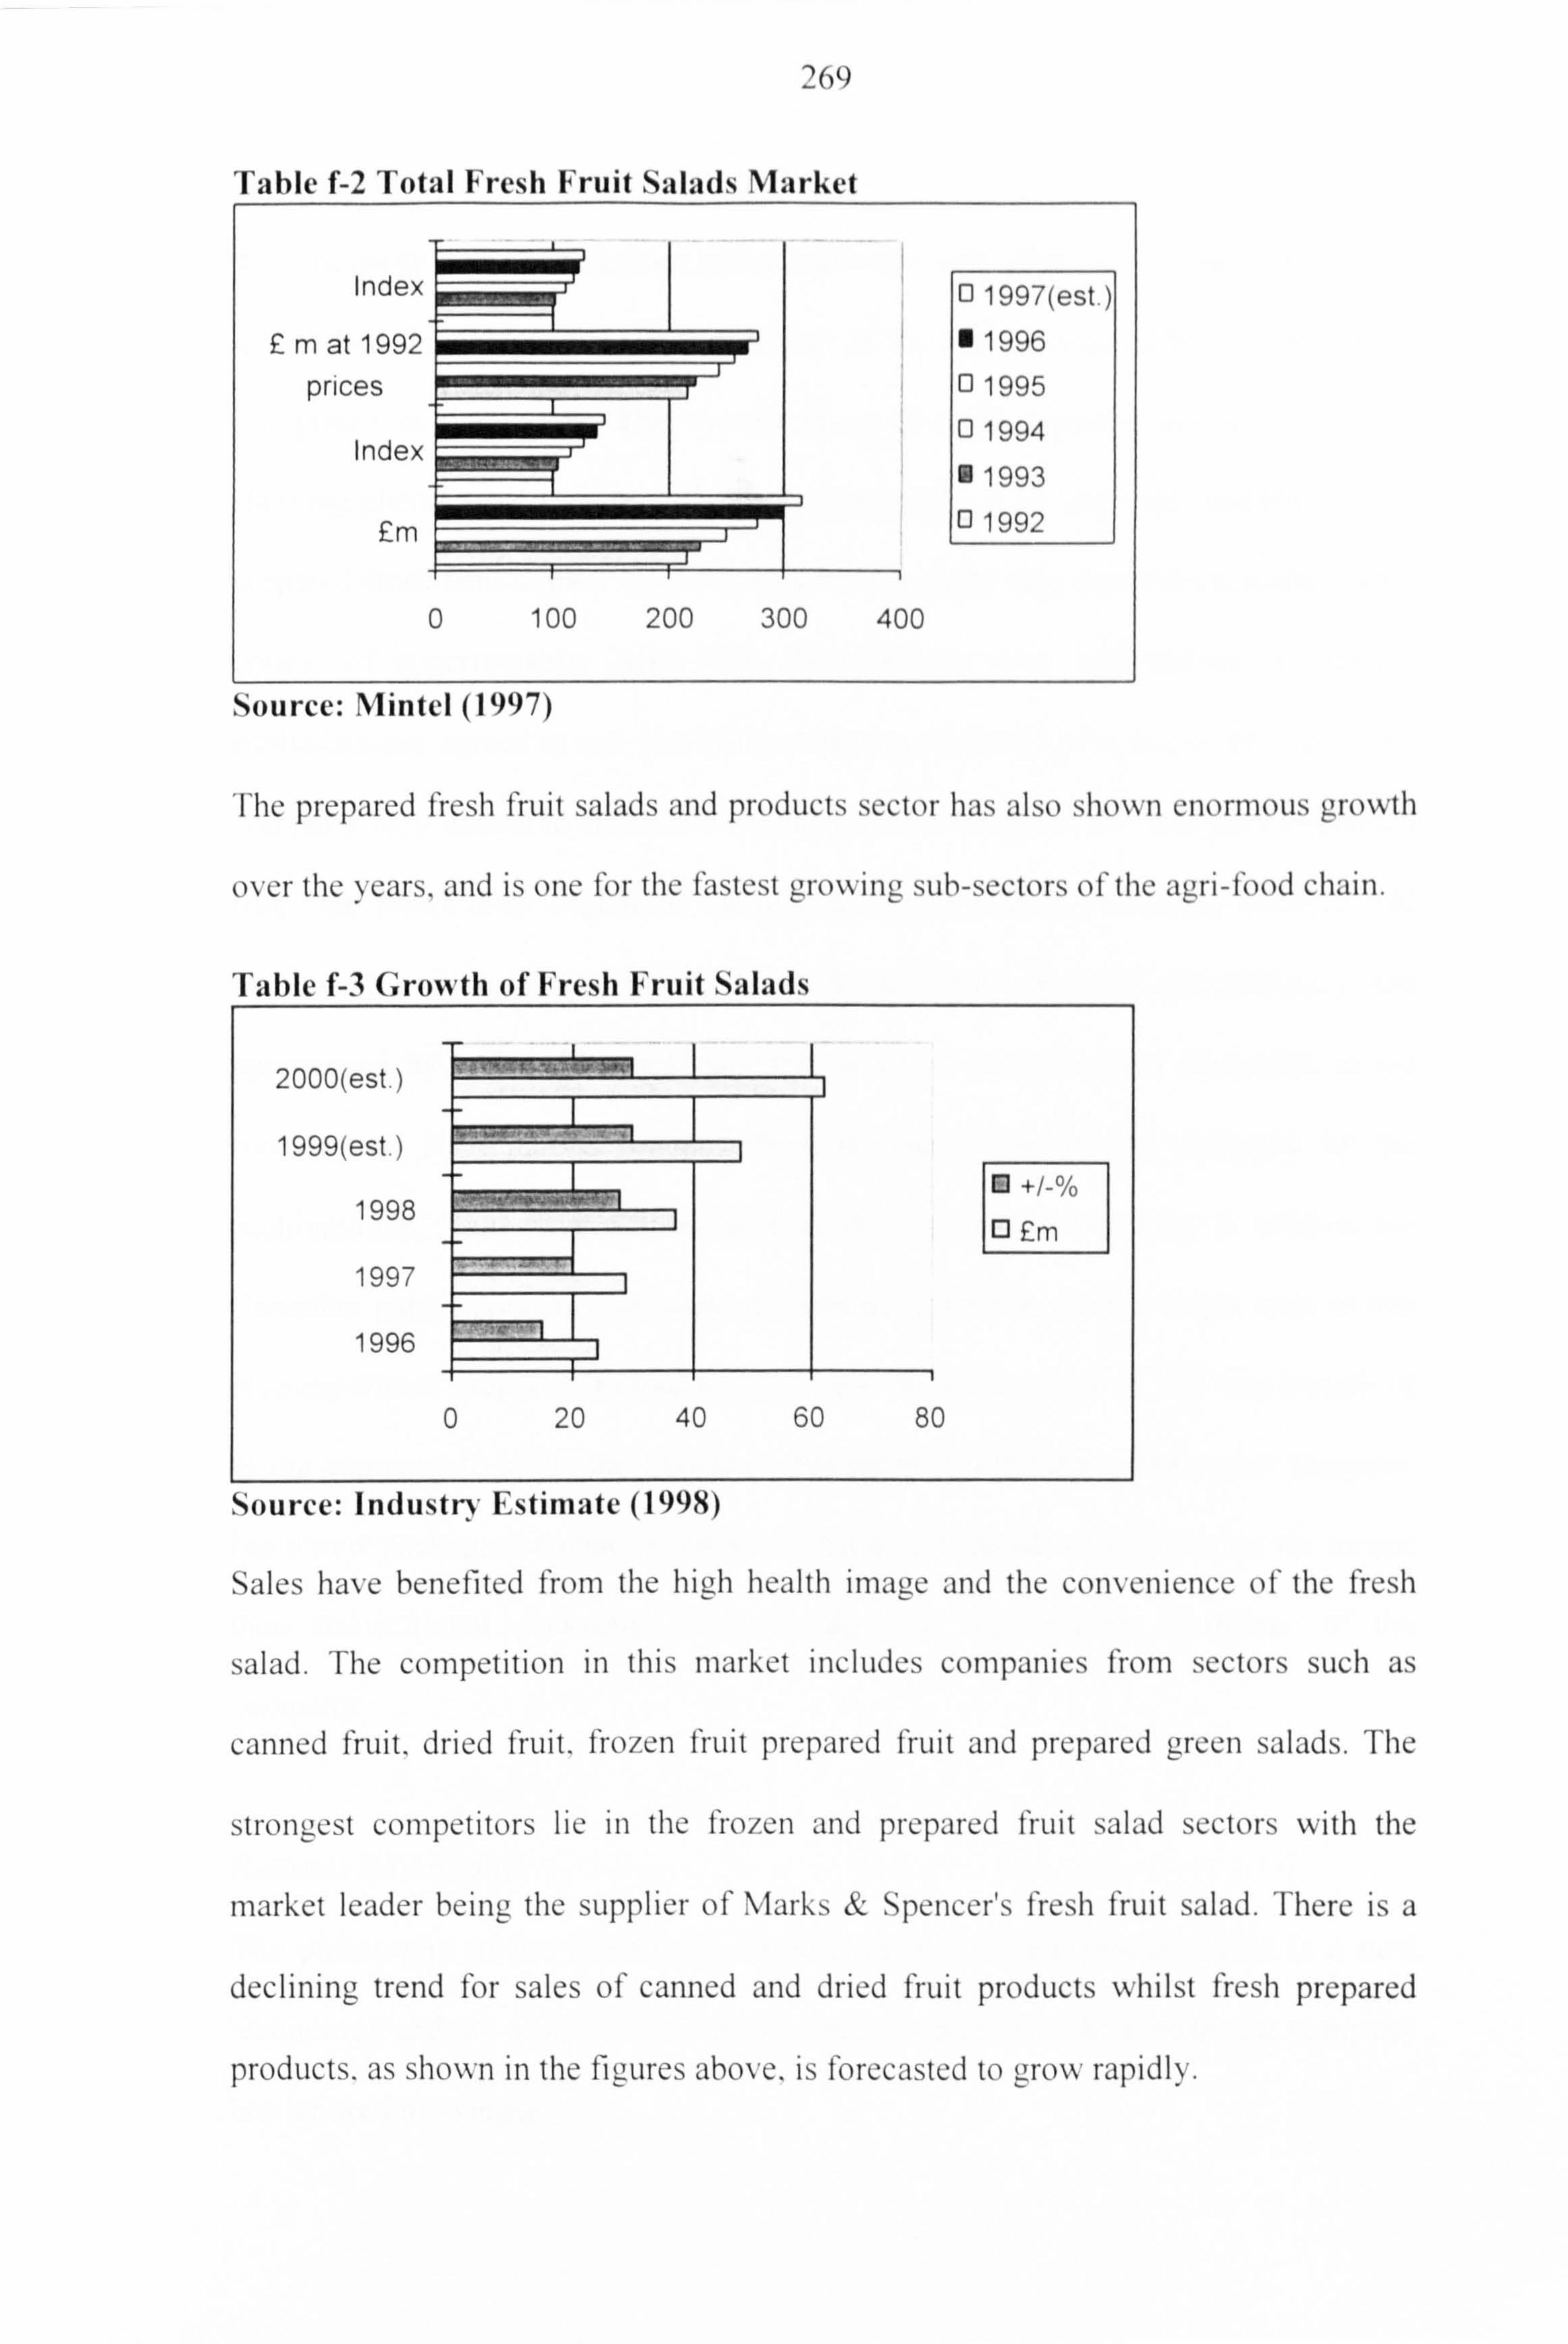
2 61)
Table f-2 Total Fresh Fruit Salads Market
Index Q 1997(est. )
£m at 1992 1996
prices Q 1995 01994
Index 01993
£m 01992
0 100 200 300 400
Source: Mintel (1997)
The prepared fresh fruit salads and products sector has also shown enormous growth
over the \ cars. and is one for the fastest growing sub-sectors o1 the agri-food chain.
Table f-3 Growth of Fresh Fruit Salads
2000(est. )
1999(est. )
1998 Q ým
1997
1996
0 20 40 60 80
Source: Industry Estimate (1998)
Sales have benefited from the high health image and the convenience of' the fresh
salad. The competition in this market includes companies from sectors such as
canned fruit. dried fruit. frozen fruit prepared fruit and prepared green salads. The
strongest competitors lie in the frozen and prepared fruit salad sectors with the
market leader being the supplier of Marks & Spencer's fresh fruit salad. There is a
declining trend for sales of canned and dried fruit products whilst fresh prepared
products. as shown in the figures above, is forecasted to grow rapidly.
270
Brief history
The company was formed three and a half years ago. The two owners formed and
established the company in the North East of the UK because of the availability of
EU grants in the region. The owners knew that the prepared salads sector was
showing phenomenal growth at the time (about 35% p. a. ), and they thought that the
prepared fresh fruit market would follow suit. Initially they secured contracts with a
couple of supermarkets. After this, the company was approached by venture
capitalists and agreed to sell part of the company to them (20% stake). This gave the
company easy access to finance. In terms of its distribution the company expanded
from the North East region to the whole of the country, securing retailers and
companies such as Tesco, British Airways and Boots. In 1997, the company was
approached by a Canadian multinational, which is specialising in packaging in the
food sector. Negotiations brought about the acquisition of the company by the
multinational. The main rational behind the acquisition was that it offered the
Canadian parent company an increased product portfolio, from a single fruit to one
offering fifteen prepared fruit salads and value-added products. It also was though of
as the company to aid to the European expansion. Furthermore, the parent company
has a new packaging technology that lets fresh fruit salads to stay fresher for longer
than conventional packaging. This is the main competitive advantage of the
company.
Business Philosophy
The philosophy of the business is heavily centred on the product. This is a new
technology and the product has high demand. Because of rapid growth, the company
has ignored marketing.
271
"Yes marketing has been ignored .... I mean as resources will become available and
we will focus on it much more but now I am on my own the marketing department,
as well as in charge of procurement as well as the packaging materials and
chemicals. "
Therefore, this is another case of a product-oriented company.
Strategic analysis
Because of a rapid change after the acquisition, in the production facilities to
incorporate the new packaging technology, strategic analysis has either been ignored
or reactive to changes. For example in 1997 years budget they had ASDA a major
multiple as a customer. Because of the change in their packaging, ASDA was not
interested in paying the premium for their new packaging and product. Therefore,
they lost the account.
"The budget for example was with ASDA last year, but then again we lost the
revenue through ASDA. However, we gained the lost revenue from Sainsbury new
account, the ASDA name comes out the Sainsbury name comes in. "
In terms of planning tools, the company has regular meetings and focus groups with
its customers in order to assess how they are performing and how they can improve
their performance. Marketing information comes from their big customers like
retailers, who charge them for the service. The parent company also conduct
marketing research on new products and existing products, and then distributes the
results to the subsidiary.
272
Marketing strategy
In terms of the strategic focus and the use of the mix, the company bases it on the
product itself. It is looking aggressively at Europe and the BeNeLux (Belgium,
Netherlands and Luxembourg) countries
"Once we move to the Benelux countries I think by taking the two major retailers in
these countries we are going to be able to secure over 70% of the consumers we are
targeting"
The marketing director also stressed the importance of the company and brand name:
"The product are is predominantly the are we are the strongest with a strong brand
name. It is in terms of quality of our product and the shelf-life which is a huge issue.
However we would still do own label where we believe there is a good account. "
Marketing organisation
The company has regular meetings with its customers for two reasons:
"To assess our customers' requirements and to check our performance. "
These meetings also give the company a very fast response rate to their customer's
requirements.
Since there is not a distinct marketing department, with the marketing and
commercial director being mainly responsible for data gathering and analysis, and
273
most of the marketing activities, there is not such thing as integration of marketing
with other functions.
Marketing control
The customer satisfaction surveys, as mentioned earlier, come from either some of
the customers or the parent company. Because of the growth rates, the company
identified the need for an on-going marketing intelligence system, and are now in the
process of establishing one.
"We are in the process of creating a database where it sill look at market trends,
customer preferences and so on... but it is a new thing still in process of developing
it. I know it is vital for the development of our business since we will make strategic
moves with more information in our hands. "
Networks and the agri-food environment
The company does not do any use of networks or does not thing that they are of any
importance. When asked, the marketing director claimed that they use colleagues and
their employees (internal network), but do not get any form of external help for the
development or operations off the business.
Similarly regulation does not pose a big threat and the company manages to use it for
its advantage, by, for example, getting assistance grants from the European Union.
Finally in terms of competition, there is only one bigger company in the UK in the
fresh fruit salad sector; hence, they are more like direct competitors.
274
REFERENCES
Alpar, P., and D. M. J. Jr Spitzer. 1989. "Response behaviour of entrepreneurs in a
mail survey. " Entrepreneurship: Theory and Practice 14: 31-44.
Ames, M. D., and N. L. Wellsfry. 1983. Small Business Management. St Paul MN:
West Publishing.
Anderson, Paul F. 1983. "Marketing, Scientific Progress, and Scientific Method. "
Journal of Marketing 47: 18-31.
Appiah-Adu, Kwaku. 1997. "Market Orientation and Performance: Do the Findings
Established in Large Firms Hold in the Small Business Sector? " Journal of
Euromarketing 6: 1-26.
Atuahene-Gima, Kwaku and Micheal Kamel. 1998. "A contingency analysis of the
impact of salesperson's effort on satisfaction and performance in selling new
products. " European Journal of Marketing 32: 904-921.
Araujo, Luis, and Geoffrey Easton. 1996. "Networks in Socio-economic Systems. A
Critical Review. " Pp. 63-107 in Networks in Marketing, edited by Dawn lacobucci:
SAGE Publications.
Arnould, Eric J., and Linda L. Price. 1993. "River Magic: Hedonic Consumption and
the Extended Service Encounter. " Journal of Consumer Research 20: 24-45.
275
Ashworth, S. W., G. Rahmann, J. P. Boutonnet, and G. Brunoti. 1998. "The potential
to use niche marketing to sustain farm businesses and manage the rural
environment. " in AES Conference. Reading.
Atuahene-Gima, Kwaku. 1995. "An exploratory analysis of the impact of market
orientation on new product performance: A contingency approach. " Journal of
Product Innovation Management 12: 275-293.
Bagozzi, Richard P. 1975. "Marketing as Exchange. " Journal of Marketing 39: 32-
39.
Baldauf, Artur, Heribert Reisinger, and William C. Moncrief. 1998. "Refusals in
Industrial Mail Surveys: An Exploratory Study. " Pp. 166-167 in Enhancing
Knowledge Development in Marketing, edited by Ronald C. Goodstein and Scott B.
MacKenzie: AMA.
Bass, Frank M. 1993. "The Future of Research in Marketing: Marketing Science. "
Journal of Marketing Research XXX: 1-6.
BBC News, Business. 10/04/2000. "North-south divide 'widens'. " Robert Huggins
Centre of Advanced Studies University of Cardiff.
Beal, Reginald M. 2000. "Competing Effectively: Environmental Scanning,
Competitive Strategy, and Organisational Performance in Small Manufacturing
Firms. " Journal of Small Business Management: 27-46.
276
Berry, L. L. 1983. "Relationship marketing. " Pp. 25-28 in Emerging Perspectives on
Services Marketing, edited by L. L. Berry, G. Lynn Shostack and G. D. Upah.
Chicago: American Marketing Association.
Blake, J. D. 1989. The Concise Guide to Interpreting Accounts: Van Nostrand
Reinhold (International).
Bolton, J. 1971. "Small Firms Report of the Commission of Inquiry on Small Firms,
Cmnd 4811. " . London: HMSO.
Bove, Karsten, Hanne Harmsen, and Klaus g. Grunert. 1996. "Marketing problems
and levels of marketing orientation: An invstigation of managers' perception. " in
Proceedings of the 25th EMAC Conference, edited by Joszef Beracs, Andras Bauer
and Judit Simon. Budapest: Budapest University of Economic Sciences.
Bove, Karsten, Harmsen Hanne, and Klaus g. Grunert. 1996. "Marketing problems
and levels of market orientation: An investigation of managers' perceptions. " in 25th
EMAC Conference, edited by Jöszef Beräcs, Andras Bauer and Judit Simon.
Budapest: Budapest University of Economic Sciences.
Brinberg, David, and Elizabeth C. Hirschman. 1986. "Multiple Orientations for the
Conduct of Marketing Research: An Analysis of the Academic/Practitioner
Distinction. " Journal of Mlarketing 50: 161-173.
277
Brooksbank, R. 1990a. "Defining the small business: a new classification of
company size. " Entrepreneurship and Regional Development 3: 17-32.
Brooksbank, R. 1990b. "The theory and practice of marketing planning in the smaller
business. " Marketing Intelligence & Planning 17: 78-90.
Brooksbank, R. 1990c. This is Successful Marketing. Bradford: Horton Publishing.
Brooksbank, R., D. A. Kirby, D. Taylor, and D. Jones-Evans. 1999. "Marketing in
medium-sized manufacturing firms. The state-of-the-art in Britain, 1987-1992. "
European Journal of Marketing 33.
Brooksbank, Roger, David A. Kirby, and Gillian Wright. 1992. "Marketing and
Company Performance: An Examination of Medium Sized Manufacturing Firms in
Britain. " Small Business Economics 4: 221-236.
Brooksbank, Roger W. 1991. "Successful Marketing Practice: A Literature Review
and Checklist for Marketing Practitioners. " European Journal of Marketing
Illustrative Issue 1994/95: 28-37.
Brown, Robert B., John E. Butler, Gary S. Hansen, and Phillip Phan. 1990. "The
Role Of Interorganizational Relationships in Entrepreneurial Success. " Pp. 104-121
in Symposium on Marketing and Entrepreneurship, edited by Gerald E. Hills,
Raymond W. LaForge and Harold P. Welsh: The University of Illinois at Chicago.
278
Brown, Stephen. 1995. Post-modern Marketing: Routledge.
Brown, Stephen. 1996. "Art or Science? Fifty Years of Marketing Debate. " Journal
of Marketing Management 12: 243-267.
Brown, Steven. 1998a. Post-modern Marketing Two: Telling Tales: International
Thomson Business Press.
Brown, Stephen. 1998b. "Romancing the Market: Sex, Shopping and Subjective
Personal Introspection. " Journal of Marketing Management 14: 783-798.
Brown, Stephen, Jim Bell, and David Carson. 1998. "Apocaholics Anonymous:
Looking Back on the End of Marketing. " Pp. 291 in Marketing Apocalypse.
Eschatology, Escapology and the Illusion of the End, edited by Stephen Brown, Jim
Bell and David Carson: Routledge.
Brownlie, D. 1985. "The anatomy of strategic marketing planning. " Journal of
Marketing Management 1: 3 5-63.
Brownlie, Douglas. 1997. "Beyond Ethnography. Towards accounts of organising in
marketing. " European Journal of Marketing 31: 264-284.
Bull, Ivan, and Gary Willard. 1995. "Towards a Theory of Entrepreneurship. " Pp. 1-
16 in Entrepreneurship. Perspectives on theory Building, edited by Ivan Bull,
Howard Thomas and Gary Willard: Pergamon.
279
Burgelman, R., and L. Sayles. 1986. Inside Corporate Innovation. New York: The
Free Press.
Burke, M. C. 1984. "Strategic Choice and Marketing Managers: An Examination of
Business Level Marketing Objectives. " Journal of Marketing Research 21: 345-359.
Buttle, Francis 1998. "Word of mouth: understanding and managing referral
marketing. " Journal of Strategic Marketing 6: 24-254.
Cadogan, John W., and Adamantions Diamantopoulos. 1995. "Narver and Slater,
Kohli and Jaworski and the market orientation construct: integration and
internationalisation. " Journal of Strategic Marketing 3: 41-60.
Campbell, Andrew, Michael Goold, and Marcus Alexander. 1995. "The Value of the
Parent Company. " California Management Review 38: 79-97.
Cannon, Tom. 1991. "Marketing for small businesses. " Pp. 467-484 in The
Marketing Book, edited by M. J. Baker. London: Butterworth-Heinemann.
Carson, David. 1990. "Some Exploratory Models for Assessing Small Firms'
Marketing Performance (a qualitative approach). " European Journal of Marketing
24: 2-51.
Carson, David, and Nicole Coviello. 1996. "Qualitative research issues at the
marketing/entrepreneurship interface. " Marketing Intelligence & Planning 14: 51-58.
280
Carson, David, and Stanley Cromie. 1989. "Marketing Planning in Small
Enterprises: A Model and Some Empirical Evidence. " Journal of Marketing
Management 5: 33-49.
Carson, David, Stanley Cromie, Pauric McGowan, and Jimmy Hill. 1995. Marketing
and Entrepreneurship in SMEs. An Innovative Approach: Prentice Hall.
Carson, David, Audrey Gilmore, and Pauline Maclaran. 1998. "Customer focus or
profit focus: an alternative perspective. " Journal of Marketing Practice: Applied
Marketing Science 4: 26-3 9.
Carson, D. J. 1985. "The evolution of marketing in small firms. " European Journal of
Marketing 19: 7-16.
Carson, D. J. 1998 "Marketing for small-to-medium enterprises" in The Marketing
Book edited by Baker, 4th Edition Butterworth-Heinemann.
Caves, R. E., and M. E. Porter. 1977. "From entry barriers to mobility barriers:
Conjectural decisions and continued deterrence to new competition. " Quarterly
Journal of Economics 91: 241-261.
Chander, Gaylen N., and Steven H. Hanks. 1993. "Measuring the performance of
emerging businesses: A validation study. " Journal of Business Venturing 8: 391-408.
281
Charles H. Davis, and Michael L. Klassen. 1991. "What Entrepreneurs need to know:
Are we researching it? " Pp. 107-118 in UIC Symposium on Marketing and
Entrepreneurship, edited by Gerald E. Hills and Raymond W. LaForge: Office for
Entrepreneurial Studies The university of Illinois at Chicago.
Chaston, Ian, Beryl Badger, and Eugene Sadler Smith. 1998. "Implanting
organisational learning in small firms: CUCOL, an example of process. " Pp. 571-584
in ISBA, Celebrating the Small Business. Durham.
Churchill, Neil C. 1995. "Analysis, Overview, and Application to Pedagogy. " in
Entrepreneurship: Perspectives on Theory Building., edited by Ivan Bull, Howard
Thomas and Gary Willard: Pergamon.
Churchill, N. C., and V. L. Lewis. 1983. "The five stages of small business growth. "
Harvard Business Review May-June: 30-49.
Churchill, Neil C., and Daniel F. Muzyka. 1991. "Animalens, Inc. : The Pioneering
of a New Product and Process. " Pp. 239-255 in UIC/AMA Symposium on Marketing
and Entrepreneurship, edited by Gerarld E. Hills and Raymond W. LaForge: The
University of Illinois at Chicago.
Clifford, J. 1988. The predicament of culture Cambridge, MA: Harvard University
Press.
282
Cohen R. J. 1999 "Qualitative Research in Marketing Mysteries: An Introduction to
the special Issue" Psychology & Marketing 16,4: 287-291.
Colleran, J. F. 1985. "Strategic marketing consideration for the small firm. " European
Journal of Marketing 19: 17-31.
Converse, P. D. 1945. "The Development of the Science of Marketing-An
Exploratory Survey. " Journal of Marketing 10: 14-23.
Cook, V. J. 1983. "Marketing strategy and differential advantage. " Journal of
Marketing 47: 68-75.
Cooper, A. C. 1993 "Challenges in predicting new firm performance. " Journal of
Business Venturing 8: 241-253.
Cousins, John, Kevin Connelly, Ian McCall, and Peter Mudie. 1988.
"Implementation of Marketing Strategy: Some Content and Learning Dimensions. "
Pp. 358-377 in The Marketing Education Group, edited by Terry Robinson and Colin
Clarke-Hill. Huddersfield Polytechnic Yorkshire.
Coviello, Nicole E., and Roderick J. Brodie. 1998. "From transaction to relationship
marketing: an investigation of managerial perceptions and practices. " Journal of
Strategic Marketing 6: 171-186.
283
Cowles, Deborah L., and Pamela Kiecker. 1998. "Reconceptualizing the promotional
mix: The challenge of a changing marketing communications environment. " Pp. 15-
24 in AMA Educators' Proceedings, edited by Reonald C. Goodstein and Scott B.
MacKenzie: American Marketing Association.
Cox, Tony, Graham J. Hooley, and James E. Lynch. 1994. "Marketing in small and
medium sized companies. " Pp. 305-370 in The Marketing Initiative, edited by John
Saunders. Hemel Hempstead Hertfordshire: Prentice Hall International.
Dana, L. P. 1999 "Narula & Rsquo's small business" British Food Journal 101,
5/6: 500
Deliza, R., A. Rosenthal, D. Hedderley, and H. J. H. MacFie. 1999. "The Importance
of Brand, Product Information and Manufacturing Process in the Development of
Novel Environmentally Friendly Vegetable Oils. " Journal of International Food &
Agribusiness 10: 67-77.
Doyle, Peter. 1994. Marketing Management & Strategy: London: Prentice Hall
International.
Doyle, Peter, and Veronica Wong. 1998. "Marketing and competitive performance. "
European Journal of Marketing 32: 514-535.
DTI. 1999a. "SME statistics. ". (www. dti. gov. uk)
284
DTI 1999b "Consultation paper: The Small Business Service" (www. dti. gov. uk)
DTI 1998. "Competitiveness our partnership with business UK" (www. dti. gov. uk)
DTI 2000 "Consultation on the small business service. Summary of replies and
government's responses" (www. dti. gov. uk)
Donckels, R. and Johan Lambrecht 1995. "Networks and small business growth: An
explanatory model" Small Business Economics 7: 273-289..
Eisenhardt, Kathleen M. 1989. "Building Theories from Case Study Research. "
Academy of Management Review 14: 532-550.
Elliott, Gregory R. "The Marketing Concept-Necessary, but Sufficient? " European
Journal of Marketing: 20-30.
Erdos, P. L. 1970. Professional Mail Survey. New York NY.: McGraw-Hill.
Ettlinger, Nancy, and Michelle Tufford. 1996. "Evaluating Small Firm Performance
in Local Context: A Case Study of Manufacturers in Columbus, Ohio. " Small
Business Economics 8: 139-157.
EUROPA. 1998. Food & Drink Statistics 1998 EUROPA.
Fast, N. D. 1981. "Pitfalls of corporate venturing. " Research Management 24: 21-24.
285
Ferrell, O. C., and L. G. Gresham. 1985. "A Contingency Framework for
Understanding Ethical Decision Making in Marketing. " Journal of Marketing 49: 87-
96.
Fielding, Nigel G., and Raymond M. Lee, eds. 1991. Using Computers in Qualitative
Research. London: SAGE Publications.
Firat, A. Fuat, Nikhilesh Dholakia, and Alladi Venkatesh. 1994. "Marketing in a
postmodern world. " European Journal of Marketing 29: 40-56.
Flamholtz, E. G. 1986. How to make the transition from an Entrepreneurship to a
Professionally Managed Firm. San Francisco, CA: Jossey-Bass.
Fletcher, Denise. 1998. "Investigating Work Place Values in the Small, Family
Organisation Through Ethnographic Inquiry. " Pp. 1264-1282 in ISBA, Celebrating
the Small Business. Durham.
Forsaith, David, and Don Fuller. 1995. "Defining Enterprises by Size: Australian
Empirical Evidence on the Interchangeability of Alternative Definitions at the
Industry level. " in ICSB 40TH World Conference, edited by W. Dunlop and B.
Gibson. Sydney: Institute of Industrial Economics.
Forsgren, R. A. 1989. "Increase mail survey response rates: methods for small
business researchers. " Journal of Small Business Research 27: 61-66.
286
Foxall, Gordon. 1989. "Marketing's Domain. " European Journal of Marketing 23: 7-
22.
Foxall, Gordon R. 1995. "Science and interpretation in consumer research: a radical
behaviourist perspective. " European Journal of Marketing 29: 3-99.
Foxall, Gordon R. 1989. 'Marketing's domain. " European Journal of Marketing 23:
7-22.
Frantz, F. H. 1978. Successful Small Business Management. Englewood Cliffs NJ:
Prentice-Hall.
Fuller, Peter B. 1994. "Assessing Marketing in Small and Medium-sized
Enterprises. " European Journal of Marketing 28: 34-49.
Gallagher, Colin, and Geoffrey Robson. 1995. "Small Business and Job Creation
Myths-An Even Further Dissection of the Davis, Haltiwanger and Schuh Working
Paper. " International Small Business Journal 13: 64-67.
Gallagher, Collin, Geoff Robson, and John Kerr. 1993. "Regional Variations in the
Population of Small and Medium-Sized Enterprises in Britain. " Pp. 77-93 in Small
Firms Recession and Recovery, edited by Francis Chittenden, Martyn Robertson and
David Watkins. Southampton: Paul Chapman Publishing on behalf of ISBA.
287
Gardner, David M. 1991. "Exploring the Marketing/Entrepreneurship Interface. " Pp.
3-21 in UIC Symposium on Marketing and Entrepreneurship, edited by Gerald E.
Hills and Raymond W. LaForge: Office for Entrepreneurial Studies The University
of Illinois at Chicago.
Gardner, D. M., and H. Thomas. 1985. "Strategic marketing: History, issues and
emergent themes. " in Strategic Marketing and Management, edited by H. Thomas
and D. Gardner. New York: John Wiley.
Geursen, Gus M. 1998. "Marketing, Small Business and Entrepreneurship: Some
Issues for the future. " in UIC/AMA Symposium on Marketing and Entrepreneurship,
edited by Gerald E. Hills. Hong Kong: The University of Illinois at Chicago.
Gibb, A., 1992 "Can academe achieve quality in small firms policy research. "
Entrepreneurship & Regional Development 4: 127-144.
Glaser, B., and A. Strauss. 1967. The discovery of grounded theory. Chicago: Aldine.
Glautier, M. W. E., and B. Underdown. 1997. Accounting Theory and Practice:
Pitman Publishing.
Goodenough, W. H. 1981. Culture, language, and society. Menlo Park, CA:
Benjamin/Cummings.
288
Gorton, Matthew. 1999. "Use of Financial Management Techniques in the UK-Based
Small and Medium Sized Enterprises: Empirical Research Findings. " Journal of
Financial Management and Analysis 12: 56-64.
Gray, Colin. 1992. "Growth Orientation and the Small Firm. " Pp. 59-71 in Small
Enterprise Development. Policy and Practice in Action., edited by Kevin Caley,
Gray, Colin. 1992. "Growth-orientation and the small firm. " in Small Enterprise
Development. Policy and Practice in Action, edited by Kevin Caley, Elizabeth Chell,
Francis Chittenden and Colin Mason: PaulChapman Publishing.
Gray, Colin. 1993. "Stages of Growth and Entrepreneurial Career Motivation. " Pp.
149-159 in Small Firms Recession and Recovery, edited by Francis Chittenden,
Martyn Robertson and David Watkins. Southampton: Paul Chapman Publishing on
behalf of ISBA.
Gray, Colin. 1995. "SME Success as a Function of Human Capital Development. "
Pp. 155-167 in ICSB 40th World Conference, edited by W. Dunlop and B. Gibson.
Sydney: Institute of Industrial Economics.
Greenley, Gordon E., 1983 "Effectiveness in Marketing Planning" Strategic
Management Journal 4: 1-10.
Greenley, Gordon E., 1986. The Strategic and Operational Planning of Marketing.
McGraw Hill.
289
Greenley, Gordon E. 1995. "Market Orientation and Company Performance:
Empirical Evidence From UK Companies. " British Journal of Management 6: 1-13.
Greenley, Gordon E., and Nils-Erik Aaby. 1992. "Strategic Concepts and
Marketing. " Pp. 3-24 in Perspectives on Marketing Management, edited by M. J.
Baker: John Wiley & Sons.
Gregory, Kathleen L. 1983. "Native-View Paradigms: Multiple Cultures and Culture
Conflicts in Organisations. " Administrative Science Quarterly 28: 359-376.
Griener, L. E. 1972. "Evolution and revolution as organisations grow. " Harvard
Business Review July-August: 37-46.
Grönroos, Christian. 1989. "Defining Marketing: A Market-Oriented Approach. "
European Journal of Marketing 23: 52-60.
Grönroos, Christian. 1997. "Keynote Paper. From marketing mix to relationship
marketing-towards a paradigm shift in marketing. " Management Decision 35: 322-
339.
Grönroos, Christian. 1996. "The rise and fall of modem marketing-and its rebirth. "
Pp. 14-35 in Marketing in Evolution: Essays in Honour of Michael J. Baker, edited
by S. A. Shaw and N. Hood. London: Macmillan Press.

290
Grunert, Klaus G., Allan Baadsgaard, Hanne Hartvig Larsen, and Tage Koed
Madsen. 1996. Market Orientation in Food and Agriculture: Kluwer Academic
Publishers.
Grunert, Klaus G., Hanne Hartvig Larsen, Elin Sorensen, and Soren Bisp. 1997.
"New Areas in Agricultural and Food Marketing. " Pp. 3-30 in Agricultural
Marketing and Consumer Behaviour in a Changing World, edited by Berend
Wierenga, Aad van Tilburg, Klaus Grunert, Jan-Benedict E. M. Steenkamp and
Michel Wedel: Kluwer Academic Publishers.
Gummesson, Evert. 1997. "Relationship marketing as a paradigm shift: some
conclusions from the 30R approach. " Management Decision 35: 267-272.
Hair, J. F., R. E. Anderson, R. L. Tatham, and W. C. Black. 1998. Multivariate Data
Analysis with Readings: Prentice-Hall Inc.
Hair, J. F., R. E. Anderson, R. L. Tatham, and W. C. Black. 1995. Multivariate Data
Analysis with Readings: Prentice-Hall Inc.
Hambrick, D. C. 1983a. "An Empirical Typology of Mature Industrial-Product
Environments. " Academy of Management Journal 26: 213-230.
Hambrick, D. C. 1983b. "High Profit Strategies in Mature Industrial-Product
Industries: A Contingency Approach. " Academy of Management Journal 26: 687-
707.
291
Hambrick, Donald C., and David Lei. 1985. "Toward an empirical prioritisation of
contingency variables for business strategy. " Academy of Management Journal 28:
763-788.
Hanks, Steven H., Collin J. Watson, and Erik Jansen. 1991. "Toward a
Configurational Taxonomy of the Organisation Life Cycle. " Pp. 256-270 in
UIC/AMA Symposium on Marketing and Entrepreneurship, edited by Gerald E. Hills
and Raymond W. LaForge: The University of Illinois at Chicago.
Harris, Lloyd C., and Nigel F. Piercy. 1999. "A Contingency Approach to Market
Orientation: Distinguishing Behaviours, Systems, Structures, Strategies and
Performance Characteristics. " Journal of Marketing Management 15: 617-646.
Heasman, Michael, and Spencer Henson. 1997. "Costs of compliance with food
regulation in the UK: the response of food and drink manufacturers. " British Food
Journal 99-113.
Heflebower, R. B. 1951. "Economics of size. " Journal of Business of the University
of Chicago 24: 258-273.
Helms, Marilyn M., and Troy W. Renfrow. 1994. "Expansionary Processes of the
Small Business: A Life Cycle Profile. " Management Decision 32: 43-45.
292
Hill, Jimmy and Pauric McGowan. 1999 "A qualitative approach to developing small
firm marketing planning competencies" Qualitative Market Research: An
International Journal 2,3: 167-175.
Hill, Jimmy, Pauric McGowan, and Pauline Maclaran. 1998. "Developing marketing
planning skills: combining theory and practice. " Journal of Marketing Practice:
Applied Marketing Science 4: 69-84.
Hill, Ronald Paul. 1993. "Ethnograpgy and Marketing Research: A Post-modern
Perspective. " Pp. 257-261 in Enhancing Knowledge Development in Marketing.
Boston: American Marketing Association.
Hills, Gerald E., and Raymond W. LaForge. 1992. "Marketing and Entrepreneurship:
The State of the Art. " Pp. 164-190 in The State of the Art of Entrepreneurship, edited
by Donald L. Sexton and John D. Kasarda: PWS-KENT Publishing Company.
Hines, H. H. 1957. "Effectiveness of "entry" by already established firms. " Quarterly
Journal of Economics 75: 132-150.
Hirschman, Elizabeth C., and Holbrook Morris B. 1992. Postmodern Consumer
Research. The Study of Consumption as Text: SAGE Publications.
293
Hisrich, Robert D. 1990. "Towards a Contingency Theory of Product/Service
Development in New/Growing Firm. " Pp. 331-345 in UIC/AMA Symposium on
Marketing and Entrepreneurship, edited by Gerarld E. Hills, Raymond W. LaForge
and Harorld P. Welsch: The University of Illinois at Chicago.
Hofer, C. W. 1975. "Toward a Contingency Theory of Business Strategy. " Academy
of Management Journal 18: 784-810.
Hofer, C. W., and W. D. Bygrave. 1992. "Researching entrepreneurship. "
Entrepreneurship: Theory and Practice Spring: 91-100.
Hogarth-Scott, Sandra, Kathryn Watson, and Nicholas Wilson. 1996. "Do small
businesses have to practise marketing to survive and grow? " Marketing Intelligence
& Planning 14: 6-18.
Holbrook, M. B. 1995. Consumer Research: Introspective Essays on the Study of
Consumption: Thousand Oaks, Sage.
Holbrook, Morris B. 1998. "On Eschatology, onanist scatology, or honest catology?
Sats Swinging, Scat Singing, and Cat Slinging as Riffs, Rifts, and Writs in a
Catalytic Catechism for the Cataclysm. " Pp. 237-259 in Marketing Apocalypse.
Eschatology, Escapology and the illusion of the end, edited by Stephen Brown, Jim
Bell and David Carson. London and New York: Routledge.
294
Holbrook, M. B., S. Bell, and M. W. Grayson. 1989. "The Role of Humanities in
Consumer research: Close Encounters and Coastal Disturbances. " Pp. 29-47 in
Interpretative Consumer Research, edited by E. C. Hirschman: Association for
Consumer Research, Provo, UT.
Holmes, Scott, and Des Nichols. 1989. "Modelling the Accounting Information
Requirements of Small Business. " Accounting and Business research 19: 143-150.
Hooley, Graham J., and James Lynch. 1991. "The effectiveness of British
Marketing. " Pp. 20-41 in The Marketing Initiative, edited by John Saunders. Hemel
Hempstead Hertfordshire: Prentice Hall International.
Hooley, G. J., and J. E. Lynch. 1985. "Marketing Lessons from the UK's High-Flying
Companies. " Journal of Marketing Management 1: 65-74.
Houston, Franklin S. 1986. "The Marketing Concept: What It Is and What It Is Not. "
Journal of Marketing 50: 81-87.
Howard, Wayne H., and Robb MacMillan. 1991. "In Search of Excellence on the
Farm: An Example of Case Research. " Agribusiness 7: 1-10.
Howe, Steward. 1982. "Competition and Performance in Food Manufacturing. " Pp.
101-126 in The Food Industry.
295
Hunt, Shelby D. 1976. "The Nature and Scope of Marketing. " Journal of Marketing
40: 17-28.
Hunt, Shelby D. 1992. "For Reason and Realism in Marketing. " Journal of
Marketing 56: 89-102.
Hunt, Shelby D. 1993. "Objectivity in Marketing Theory and Research. " Journal of
Marketing 57: 76-91.
Hunt, Shelby D. 1994. "On Rethinking Marketing: Our Discipline, Our Practice, Our
Methods. " European Journal of Marketing 28: 13-25.
Hunt, Shelby D., and Steven Edison. 1995. "On the Marketing of Marketing
Knowledge. " Journal of Marketing Management 11: 635-639.
Jaworski, Bernard J., and Ajay K. Kohli. 1993. "Market Orientation: Antecedents
and Consequences. " Journal of Marketing 57: 53-70.
Jobber, D. 1989. "An examination of the effects of questionnaire factors on response
to an industrial mail survey. " International Journal of Research in Marketing 6: 91-
100.
Jones, D., and D. Monieson. 1990. "Early Development of the philosophy of
marketing thought. " Journal of Marketing 54: 102-113.
296
Katz, Jeffrey P. 1997. "Managerial Behaviour and Strategy Choices in Agribusiness
Co-operatives. " Agribusiness 13: 483-495.
Kavanagh, Donncha. 1994. "Hunt versus Anderson: Round 16. " European Journal
of Marketing 28: 26-41.
Kazanjian, R. K. 1984. "Operationilizing stage of growth: an empirical assessment of
dominant problems. " Pp. 144-158 in Frontier of Entrepreneurship Research, edited
by J. A. Hornadey, F. Tarpley, J. A. Simmons and K. H. Vesper. Wellesley, MA:
Babson College.
Kazmier, Leonard J., and Norval F. Pohl. 1984. Basic Statistics for Business and
Economics: McGraw-Hill.
Keynote. 1998 "The state of the food market". (www. keynote. co. uk)
Kirchhhoff, Bruce A. 1995. "Twenty Years of Job Creation Research: What Have
We Learned. " Pp. 195-219 in ICSB 40th World Conference, edited by W. Dunlop
and B. Gibson. Sydney: Institute of Industrial Economics.
Kleinman, Sheryryl, and Marthe A. Copp. 1993. Emotions and Fieldwork: Sage
Publications.
297
Knight, R. M. 1989. "Technological innovation in Canada: A comparison
independent entrepreneurs and corporate innovators. " Journal of Business Venturing
4: 323-340.
Kohli, Ajay K., and Bernard J. Jaworski. 1990. "Market Orientation: The Construct,
Research Propositions, and Managerial Implications. " Journal of Marketing 54: 1-
18.
Kotler, Philip. 1994. Marketing Management: Analysis, Planning Implementation
and Control: Prentice Hall International.
Kotler, Philip, and Sidney J. Levy. 1969. "Broadening the Concept of Marketing. "
Journal of Marketing 33: 10-15.
Kuhn, Thomas S. 1973. The Structure of Scientific Revolutions: The University of
Chicago Press.
Lancaster, Geoff, and Ian Waddelow. 1998. "An Empirical Investigation into the
Process of Strategic Marketing Planning in SMEs: Its Attendant Problems, and
Proposals Towards a New Practical Paradigm. " Journal of Marketing Management
14: 853-878.
Larkinson, M, Tsorbatzoglou, K. and Karl Christensen. 1998 Brambles Project
Consultation Document.
298
Larson, A. 1992. "Network dyads in entrepreneurial settings: A study of the
governance of exchange relationships. " Administrative Science Quarterly 37: 761-
774.
Leatherhead, Food RA. March 1999. "UK Food and Drinks Report".
Lee, M., I. Lee, and F. M. Ulgado. 1993. "Marketing strategies for mature products in
a rapidly developing country: a contingency approach. " International Marketing
Review 10: 56-72.
Leone, P. R., and R. L. Schultz. 1980. "°A Study of Marketing Generalisations. "
Journal of Marketing 44: 10-18.
Leppard, John, and Malcolm McDonald. 1987. "A Re-appraisal of the Role of
Marketing Planning. " Journal of Marketing Management 3: 159-171.
Levenhagen, Michael, and Howard Thomas. 1993. "Entrepreneurs' competitive
definitions: Evidence from computer-software start-ups. " Pp. 67-83 in
Entrepreneurship and Business Development, edited by Heinz Klandt: Avebury.
Levitt, Theodore. 1960. "Marketing Myopia. " Harvard Business Review 38: 45-56.
Levy, S. J. 1976. "Marcology 101 Or the Domain of Marketing. " Pp. 577-581 in
Marketing: ] 776-1976 and Beyond, edited by K. L Bernhardt. Chicago, IL: American
Marketing Association.
299
Lincoln, Y. S. and Guba E. G. 1986. Naturalistic Enquiry SAGE Publications.
Liu, Hong. 1995. "Market orientation and firm size: an empirical examination in UK
firms. " European Journal of Marketing 29: 57-71.
Lochridge, R. K. 1981. "Strategies in the Eighties. " in Annual Perspective. Boston:
Boston Consulting Group.
Maanen, John Van. 1995. "An End to Innocence: The ethnography of Ethnography. "
Pp. 1-35 in Representation in Ethnography, edited by John Van Maanen: SAGE
Publications.
MAFF. 1999. "Working Together For The Food Chain. Views From The Food Chain
Group".
Mair, Lucy. 1972. An Introduction to Social Anthropology: Oxford University Press.
Malinowski, B. 1922. Argonauts of the Western Pacific: London Routledge & Kegan
Paul.
Mann, Robin, Oludotun Adebanjo, and Dennis Kehoe. 1999. "An assessment of
management systems and business performance in the UK food and drinks industry. "
British Food Journal 10: 5-21.
300
Mann, Robin, Oludotun Adebanjo, and Dennis Kehoe. 1999. "Best practice in the
food and drinks industry. " British Food Journal 10: 238-253.
Manning, Peter K. 1995. "The Challenges of Postmodernism. " in REpresentation in
Ethnography, edited by John Van Maanen: SAGE Publications.
Marcus, George, and M. M. J. Fischer. 1986. Anthropology as cultural critique.
Chicago: University of Chicago Press.
May, Li-Wei 1997 "Direct Marketing: An analysis of consumers' characteristics and
their perceptions of, and attitudes to mail-order speciality food in the UK" Doctorate
thesis, University of Newcastle
Marketing Week 2000 (April 14th)
McAuley, Andrew. 1998. "The Mirror and the Lamp: Representing the
Entrepreneur. " Journal of Marketing Management 14: 721-731.
McCracken G. 1988. The Long Interview SAGE Publications.
McDaniel, W., and A. Parasuraman. 1986. "Practical Guidelines for Small Business
Marketing Research. " Journal of Small Business Management January: 1-9.
McDonald, M. 1984. Marketing Plans; How to Prepare Them; How to Use Them.
London: Heinemann.
301
McDonald, M. H. B. 1989. "Ten Barriers to Marketing Planning. " Journal of
Marketing Management 5: 1-18.
McGrath, Marry Ann, Jr. John F. Sherry, and Deborah D. Heisley. 1993. "An
Ethnographic Study of an Urban Periodic Marketplace: Lessons from the Midville
Farmers' Market. " Journal of Retailing 69: 280-319.
McKiernan, Peter, and Clare Morris. 1994. "Strategic Planning and Financial
Performance in UK SMEs: Does Formality Matter? " British Journal of Management
5: 31-41.
McMahon, R. G. P., and L. G. Davies. 1991. "Financial reporting and analysis in
smaller growth enterprises: evidence on practice in the north-east of England. " .
Accounting and Finance Research Paper 4/91: The Flinders University of South
Australia.
Meulenberg, M. T. G. 1986. "The evolution of agricultural marketing theory; towards
better co-ordination with general marketing theory. " Netherlands Journal of
Agricultural Science 34: 301-315.
Miles, Morgan P., and Danny R. Arnold. 1991. "The Relationship Between
Marketing Orientation and Entrepreneurial Orientation. " Entrepreneurship: Theory
and Practice Summer: 49-65.
302
Miller, Danny, and Jean-Marie Toulouse. 1986. "Strategy, Structure, CEO
Personality and Performance in Small Firms. " American Journal of Small Business
10: 47-62.
MINTEL 1998 "The state of the UK food sector" (www. mintel. co. uk)
MINTEL 1997 "The state of the UK Sandwich sector" (www. mintel. co. uk)
MINTEL 1997 "The state of the UK Fresh-fruit salads sector" (www. mintel. co. uk)
Mintzberg, Henry. 1994. "The Fall and Rise of Strategic Planning. " Harvard
Business Review January-February: 107-114.
Moller, K., and M. Anttila. 1987. "Marketing capability-a key success factor in small
business. " Journal of Marketing Management 3: 185-203.
Morgan, Robert E. 1996. "Conceptual foundations of marketing and marketing
theory. " Management Decision 34: 19-26.
Morgan, Robert M., and Shelby D. Hunt. 1994. "The Commitment-Trust Theory of
Relationship Marketing. " Journal of Marketing 58: 20-38.
303
Morris, Linda J., and Laurie Stenberg. 1991. "Entrepreneurship research:
Methodological Issues in Marketing Strategy Studies. " Pp. 185-201 in UIC/AMA
Symposium on Marketing and Entrepreneurship, edited by Gerarld E. Hills and
Raymond W. LaForge: The University of Illinois at Chicago.
Morris, Michael H., and Pamela S. Lewis. 1995. "The determinants of
entrepreneurial activity. " European Journal of Marketing 29: 31-48.
Morris, M. H., and G. W. Paul. 1987. "The relationship between entrepreneurship and
marketing in established firms. " Journal of Business Venturing 2: 246-259.
Murray, John A., and Aidan O'Driscoll. 1997. "Messianic eschatology. Some
redemptive reflections on marketing and the benefits of a process approach. "
European Journal of Marketing 31: 706-719.
Narver, John C., and Stanley F. Slater. 1990. "The Effect of a Market Orientation on
Business Profitability. " Journal of Marketing 54: 20-35.
Noblit, George W., and R. Dwight Hare. 1988. Meta-Ethnography: Synthesising
Qualitative Studies: Sage Publications.
Nonaka, I., and F. M. Nicosia. 1979. "Marketing Management, Its Environment and
Information Processing: A Problem of Organisational Design. " Journal of Business
Research 4: 277-300.
QSR NUDIST 4 1997. "User Guide. " Qualitative Solutions and Research Pty Ltd.

304
Papoutsis, Christos. 1998. "Commission Recommendation of 3 April 1996
concerning the definition of small and medium-sized enterprises. " Brussels: The
Commission of the European Communities.
Patton, M. J. 1987. How to use Qualitative Methods in Evaluation. London: SAGE
Publications.
Pelham, Alfred M. 2000. "Market Orientation and other Potential Influences on
Performance in Small and Medium-Sized Manufacturing Firms. " Journal of Small
Business Management 3 8: 48-67.
Pennings, J. 1975. "The Relevance of the Structural-Contingency Model for
Organisational Effectiveness. " Administrative Science Quarterly 20: 393-410.
Perry, Chad. 1998. "Processes of a case study methodology for postgraduate research
in marketing. " European Journal of Marketing 32: 785-802.
Peter, J. Paul, and Jerry C. Olson. 1983. "Is Science Marketing? " Journal of
Marketing 47: 111-125.
Peters, T. J., and R. H. Waterman. 1982. In Search of Excellence. New York: Harper
and Row.
Peterson, R. T., and D. J. Lill. 1981. "An Examination of Marketing Factors Related
to Small Business Success. " Journal of Small Business 19: 64-66.
305
Piercy, Nigel. 1989. "Marketing Concepts and Actions: Implementing Marketing-led
Strategic Change. " European Journal of Marketing 24: 24-42.
Piercy, Nigel F. 1998. "Barriers to implementing relationship marketing: analysing
the internal market-place. " Journal of Strategic Marketing 6: 209-222.
Piercy, Nigel F., and Neil A. Morgan. 1990. "Organisational Context and
Behavioural Problems as Determinants of the Effectiveness of the Strategic
Marketing Planning Process. " Journal of Marketing Management 6: 127-143.
Porter, Michael. 1980. Competitive Strategy. New York: Free Press.
Porter, M. E. 1991. The Competitive Advantage of Nations: The MacMillan Press
Ltd.
Porter, Thomas W., and Daniel C. Smith. 1998. "Implementation and Murphy's Law:
Factors Affecting Unanticipated Problems in the Execution of Marketing Projects. "
Pp. 328-334 in AMA Winter Educator's Conference, edited by Dhruv
Grewa; and Connie Pechmann. Austin: American Marketing Association.
Prus, Robert C. 1989. Pursuing Customers: An Ethnography of Marketing Activities.
Newbury Park, California: SAGE Publications.
306
Prothero Andrea, 1996 "NUDIST-Aiding or Abetting Qualitative Marketing
Research? " Paper presented at the Marketing Education Group Conference' "2021- A
vision for the next 25 years" The University of Strathclyde, Glasgow.
Raley M., and Andrew. Moxey 2000 "Rural micro-businesses in the North East of
England" presented in Agricultural Economics Society Conference, University of
Manchester, 14`h_16`h of April.
Ragin, Charles c. 1992. "Introduction: Cases of "What is a case? ". " Pp. 1-17 in What
is a Case? Exploring the Foundations of Social inquiry, edited by Charles C.
Ragin and Howard S. Becker: Cambridge University Press.
Ram, S., and Sandra J. Forbes. 1990. "Marketing Variables That Affect
Entrepreneurial Success: An Empirical Investigation. " Pp. 99-103 in Symposium on
Marketing and Entrepreneurship, edited by Gerald E. Hills, Raymond W. LaForge
and Harold P. Welsch: The University of Illinois at Chicago.
Ramanujan, Vasu, and N. Venkatraman. 1984. "An Inventory and Critique of
Strategy Research Using the PIMS Database. " Academy of Management Review 9:
138-151.
307
Reilly, Michael D., Linda Wyckoff, and James L. Brock. 1990. "Marketing
assistance Needs of Rural Entrepreneurs: Comparison of Professionals and
Entrepreneurs. " Pp. 265-274 in Symposium on Marketing and Entrepreneurship,
edited by Gerald E. Hills, Raymond W. LaForge and Harold P. Welsch: The
University of Illinois at Chicago.
Richards, Thomas J., and Lyn Richards. 1994. "Using Computers in Qualitative
Research. " Pp. 445-462 in Handbook of Qualitative Research, edited by Norman K.
Denzin and Yvonna S. Lincoln. London: SAGE Publications.
Richardson, Bob. 1986. "Some current issues in the marketing of agricultural
products. " The Australian Journal ofAgricultural Economics 30: 89-102.
Ritson, Chris. 1986. Marketing and Agriculture: An Essay on the Scope of the
Subject Matter of Agricultural Marketing: Discussion Paper. University of Newcastle
upon Tyne.
Ritson, C. 1997. "Food Marketing and Agricultural Marketing: The Scope of the
Subject of Agro-food Marketing. " Pp. 11-27 in Agri food marketing, edited by D. I.
Padberg, C. Ritson and L. M. Albisu: CAB International 1997.
Rogers, Richard T., and Julie A. Caswell. 1988. "Strategic Management and the
Internal Organisation of Food Marketing Firms. " Agribusiness 4: 3-10.
Romano, Claudio, and Jenek Ratnatunga. 1995. "The role of marketing. Its impact on
small enterprise research. " European Journal of Marketing 29: 9-30.
308
Rosa, Peter, and Alison Bowes. 1993. "Entrepreneurship: Some lessons of social
anthropology. " Pp. 87-99 in Entrepreneurship and Business Development, edited by
Heinz Klandt: Avebury.
Rosaldo, R. 1989. Culture and truth: Boston: Beacon.
Ruekert, Robert W., Jr. Orville C. Walker, and Kenneth J. Roering. 1985. "The
Organisation of Marketing Activities: A Contingency Theory of Structure and
Performance. " Journal of Marketing 49: 13-25.
Said, E. W. 1989. "Representing the colonised. " Critical Inquiry 15: 205-225.
Saren, Michael J., and Nikolaos X. Tzokas. 1998. "Some dangerous axioms of
relationship marketing. " Journal of Strategic Marketing 6: 187-196.
Sashittal, Hemant C., and Clint Tankersley. 1997. "The strategic market planning-
implementation interface in small and midsize industrial firms: An exploratory
study. " Journal of Marketing theory & Practice 5: 77-92.
Sashittal, Hemant C., and David Wilemon. 1996. "Marketing Implementation in
Small and Midsized Industrial Firms. " Industrial Marketing Management 25: 67-78.
Saunders, John, and Veronica Wong. 1985. "In Search of Excellence in the UK. "
Journal of Marketing Management 1: 119-137.
309
Scase, R., and R. Goffee. 1980. The Real World of Small Business Owner. London:
Croom Helm.
Schellhase R., Hardock P. and Martin Ohlwein 2000. "Customer satisfaction in
business-to-business marketing: The case of retail organisations and their suppliers"
The Journal of Business & Industrial Marketing 15,2/3: 106-121.
Schwartz, Robert G. 1998. "Entrepreneurship Research: A Practical Theoretical
Perspective. " in UIC/AMA Annual Research Symposium On Marketing and
Entrepreneurship. Hong Kong: The University of Illinois at Chicago.
Scott, Michael, and Peter Rosa. 1996/97. "Opinion: Has Firm Level Analysis
Reached its Limits? Time for a Rethink. " International Small Business Journal 14:
81-89.
Selkirk, Keith. 1980. Chi-Squared and Contingency Tables: Nottingham University
School of Education.
Selkirk, K. E. 1980. Significance Testing: Nottingham University School of
Education.
Shaw, Eleanor. 1998. "The Research Spiral: An Effective Guide To The Inductive
Analysis Of Qualitative Data-Evidence From A Small Firm Study. "
310
Sherry, John F. 1990. "A Sociocultural Analysis of a Midwestern American Flea
Market. " Journal of Consumer Research 17: 13-30.
Sherry, John F. 1991. "Post-modern Alternatives: The Interpritive Turn in Consumer
Research. " Pp. 548-591 in Handbook of Consumer Behaviour, edited by Thomas
Robertson and Harold Kassarjian. Englewood Cliffs, NJ: Prentice Hall.
Sheth, Jagdish N., and Gary L. Frazier. 1983. "A Margin-Return Model for Strategic
Market Planning. " Journal of Marketing 47: 100-109.
Sheth, J. N., and A. Prvatiyar. 1995. "The evolution of relationship marketing. "
International Business Review 4: 397-418.
Shiner, D. V. 1988. "Marketing's role in strategic and technical planning. " European
Journal of Marketing 22: 24-31.
Shrader, Rodney C., and Mark Simon. 1997. "Corporate Versus Independent New
Ventures: Resource, Strategy, and Performance Differences. " Journal of Business
Venturing 12: 47-66.
Siu, Wai-sum 1997 "Small Firm Marketing; an analysis of small firm marketing
approaches in Hong-Kong" Doctorate thesis, University of Durham.
Siu, Wai-sum, and David Kirby. 1998a. "Small Firm Marketing: A Comparison of
Eastern and Western Marketing Practices. ".
311
Siu, Wai-sum, and David A. Kirby. 1998b. "Approaches to small firm marketing: A
critique. " European Journal of Marketing 32.
Siu, Wai-sum, and David A. Kirby. 1998c. "Personal Connection Network,
Marketing Information Solicitation and Marketing Performance: The Case of
Chinese Owner Managers. " in UIC/AMA Symposium on Entrepreneurship and
Marketing. Hong Kong: University of Illinois at Chicago.
Siu, Wai-sum, and David A. Kirby. 1999. "Research into small firm marketing: a
contextual stepwise approach. " Qualitative Market Research: An International
Journal2: 135-146.
Slater, Stanley F. 1995. "Issues in conducting marketing strategy research. " Journal
of Strategic Marketing 3: 257-270.
Smallbone, David, Andrew Cumbers, and Roger Leigh. 1995. "The Single Market
Process and SMEs in the UK Food Processing Sector. " International Small Business
Journal 14: 55-71.
Smart, Denise T., and Jeffrey S. Conant. 1994. "Entrepreneurial Orientation,
Distinctive Marketing Competencies and Organisational Performance. " Journal of
Applied Business Research 10: 28-38.
312
Souder, William E Sherman, and Rachel J Daniel Davies-Cooper. 1998.
"Environmental uncertainty, organisational integration, and new product
development effectiveness: A test of contingency theory. " Journal of Product
Innovation Management 15: 520-533.
Souza, M. 1996 "Qualitative marketing research: A new tailored approach to
fashion" Marketing and research today: the journal of the European Society for
Opinion and Marketing research 24,2: 117-124.
Speed, Richard. 1993. "Using Strategic Typologies in Research: Methodological
Problems and Approaches. " Pp. 169-188 in Perspectives on Marketing Management,
edited by M. J. Baker: John Wiley & Sons.
Stash, Stanley F. 1990. "Identifying and Evaluating New-Venture ideas: What we
Know and Don't know. " Pp. 325-330 in UIC/AMA Symposium on Marketing and
Entrepreneurship, edited by Gerald E. Hills, Raymond W. LaForge and Harold P.
Welsch: The University of Illinois at Chicago.
Steinhoff, D., and J. F. Burgess. 1989. Small Business Management Fundamentals.
New York NY: McGraw-Hill.
Stern, Louis W. 1996. "Relationships, Networks, and the Three cs. " Pp. 3-7 in
Networks in Marketing, edited by Dawn lacobucci: SAGE Publications.
313
Stockport, Gary, and Andrew Kakabadse. 1992. "Using Ethnography in Small Firms
Research. " Pp. 179-191 in Small Enterprise Development. Policy and Practice in
Action, edited by Kevin Caley, Elizabeth Chell, Francis Chittemden and Colin
Mason: Paul Chapman Publishing Ltd on behalf of U. K. Enterprise Management and
Research Association.
Stokes, David, and Steward Fitchew. 1997. "Marketing In Small Firms: Towards A
Conceptual Understanding. " Academy of Marketing Conference, University of
Manchester Pp. 227-231 .
Stokes, D. R. 1998. Small business management; a case study approach. London:
Letts Educational.
Stokes, Maura E., Charles S. Davis, and Gary G. Koch. 1995. Categorical Data
Analysis Using the SAS System: Books by Users.
Stone, S. F. amd Jeon Bang Nam. 1999. "Gravity-model specification for foreign
direct investment: A case of the Asia-Pacific economies" Journal of Business &
Economic Sudies 5/1: 33-42
Storey, D. 1982. Entrepreneurship and the New Firm. London: Croom Helm.
Strauss, Anselm, and Juliet Corbin. 1990. Basics of Qualitative Research Grounded
Theory Procedures and Techniques: SAGE Publications.
314
Sutton, Robert, and Anat Rafaeli. 1988. "Untangling the Relationship Between
Displayed Emotions and Organisational Sales: The Case of Convenience Stores. "
Academy of Management Journal 31: 461-487.
Teach, Richard D. 1990. "Entrepreneurship and Marketing: The Pricing and
Distribution Link to Success. " Pp. 351-356 in UIC/AMA Symposium on Marketing
and Entrepreneurship, edited by Gerald E. Hills, Raymond W. LaForge and Harold
P. Welsch: The University of Illinois at Chicago.
Teach, Richard D., and Robert G. Schwartz. 1998. "Methodology to study
entrepreneurial strategies over time. " in UIC/AMA Symposium On Marketing and
Entrepreneurship. Hong Kong.
Teach, Richard D., Robert G. Schwartz, and Fred A. Tarpley. 1990. "Firm
Maturation and Marketing Changes in the Computer Software Industry. " Pp. 17-31
in Symposium on Marketing and Entrepreneurship, edited by Gerald E. Hills,
Raymond W. LaForge and Harold P. Welsch: The University of Illinois at Chicago.
Thomas, Howard, and Gary Willard. 1995. "Conclusions and Reflections. " in
Entrepreneurship. Perspectives on theory Building, edited by Ian Bull, Howard
Thomas and Gary Willard: Pergamon.
Thomas, Jim. 1993. Doing Critical Ethnography: SAGE Publications.
315
Thomas, Joseph, and Robert V. Evanson. 1987. "An Empirical Investigation of
Association Between Financial Ratio Use and Small Business Success. " Journal of
Business Finance & Accounting 14: 555-572.
Thomas, Michael J. 1994. "Marketing-in Chaos or Transition? " European Journal of
Marketing 28: 55-62.
Thompson, J. D. 1967. Organisations in Action. New York: McGraw-Hill.
Timmons, J. 1994. New Venture Creation: Irwin, Homewood, IL.
Trustrum, Leslie Bernard. 1989. "Marketing: Concept and Function. " European
Journal of Marketing 23: 48-56.
Tyebjee, T. T., A. V. Bruno, and S. H. McIntyre. 1983. "Growing ventures can
anticipate marketing stages. " Harvard Business Review January-February: 64-66.
Tzokas, N., and M. Sharen. 1996. "Relationship marketing in consumer markets:
from the privateto the communal. " Pp. 1-15 in The 1996 EIASM Seminar on
Relationship Marketing in an Era of Hypercompetition, edited by W. Verbecke and
B. Weitz. Rotterdam: EIASM.
316
Volery, Thierry. 1995. "Critical Success Factors in Interim Co-operation: The Case
of Swiss Small and Medium-Sized Enterprises (SMEs). " Pp. 319-330 in ICSB 40th
World Conference, edited by W. Dunlop and B. Gibson. Sydney: Institute of
Industrial Economics.
Walker, Orville C., and Robert W. Ruekert. 1987. "Marketing's Role in the
Implementation of Business Strategies: A Critical Review and Conceptual
Framework. " Journal of Marketing 51: 15-33.
Warren, L. and W. E. Hutchinson "Success factors for high technology SMEs: A case
study from Australia" Journal of Small Business Management 38,3: 86-91
Waterworth, D. 1987. Marketing for the Small Business. London: Macmillan.
Watkins, T., and R. Blackburn. 1986. "The role of marketing in the smaller firm;
evidence from a regional survey. " Marketing Intelligence and Planning 4: 26-38.
Watson, A. S. 1983. "Marketing Policy in Relation to Agricultural Development. " in
Proceedings of 18th International Conference of Agricultural Economists.
Watson, John, and Jim Everett. 1995. "Do Small Businesses Have a Higher Failure
Rate? " Pp. 331-345 in ICSB 40th World Conference, edited by W. Dunlop and B.
Gibson. Sydney: Institute of Industrial economics.
317
Webster, Frederick E. 1991. Industrial Marketing Strategy 3 ̀d Edition John Wiley &
Sons
Webster, Frederick E. 1992. "The Changing Role of Marketing in the Corporation. "
Journal of Marketing 56: 1-17.
Weiss, C. A. 1981. "Start up businesses: A comparison of performance. " Sloan
Management Review 23: 37-53.
Weitz, B., and E. Anderson. 1981. "Organising and Controlling the Marketing
Function. " Pp. 134-142 in op. cit., edited by B. M. Enis and K. J. Roering.
Weitz, B. A. 1981. "Effectiveness in Sales Interactions: A Contingency Framework. "
Journal of Marketing 45: 85-103.
Westhead, Paul, and Sue Birley. 1995. "Employment Growth in New Independent
Owner-managed Firms in Great Britain. " International Small Business Journal 13:
11-34.
Wilson, Richard M. S., and Colin Gilligan. 1997. Strategic Marketing Management:
Planning, implementation and control: Butterworth-Heinemann.
Wood, Kathy, and Tim Broadbent. 1998. "'Functional foods: the need for social
meaning. " Admap March: 39-40.
318
Wright, Len Tiu. 1996. "Exploring the in-depth interview as a qualitative research
technique with American and Japanese firms. " Marketing Intelligence and Planning
14: 59-64.
Wright, Malcolm, and Nicholas Ashil. 1998. "A contingency model of marketing
information. " European Journal of Marketing 32: 125-144.
Wringley Neil, 2000 "Strategic market behaviour in the internationalisation of food
retailing-Interpreting the third wave of Sainsbur& Ersquo's US diversification"
European Journal of Marketing 34,8: 891-919.
Yeoh, Poh-Liu and Insik Jeong. 1995. "Contingency relationships between
entrepreneurship, export channel structure and environment. A proposed conceptual
model of export performance. " European Journal of Marketing 29: 95-115.
Yin, Robert K. 1993. Applications of Case Study Research: SAGE Publications.
Yin, Robert K. 1994. Case Study Research: Design and Methods: SAGE
Publications Ltd.
Yu, J., and H. Cooper. 1983. "A quantitative review of research design effects on
response rates to questionnaire. " Journal of Marketing Research 20: 36-44.
319
Yusof, Sha riMohd and Elaine Aspinwall "Critical success factors for total quality
management implementation in small and medium enterprises" Total Quality
Management 10,4/5.
Zaltman, Gerarld. 1997. "Rethinking Market Research: Putting People Back In. "
Journal of Marketing Research XXXIV: 424-437.
Zeithaml, Valarie A., P. "Rajan" Varadarajan, and Carl P. Zeithaml. 1988. "The
Contingency Approach: Its foundations and Relevance to Theory Building and
Research in Marketing. " European Journal of Marketing 22: 37-64.
Zerrillo, Philip C., and Ravi Raina. 1996. "Marketing Networks. A New Entrant's
Approach to Network Equity. " Pp. 205-220 in Networks in Marketing, edited by
Dawn Iacobucci: SAGE Publications.
Related Documents