Market Structure & Performance Of Downstream Oil Industry: A Case Study Of Indian National Oil Companies Authors: Deepak Sharma & Haripriya Gundimeda Presented by Deepak Sharma, MPhil + PhD Dual Degree Student Department of Humanities & Social Sciences IIT Bombay 40 th IAEE Conference, 2017

Welcome message from author
This document is posted to help you gain knowledge. Please leave a comment to let me know what you think about it! Share it to your friends and learn new things together.
Transcript
Market Structure & Performance Of Downstream Oil Industry: A Case Study
Of Indian National Oil Companies
Authors: Deepak Sharma & Haripriya Gundimeda
Presented by
Deepak Sharma,
MPhil + PhD Dual Degree Student
Department of Humanities & Social Sciences
IIT Bombay
40th IAEE Conference, 2017
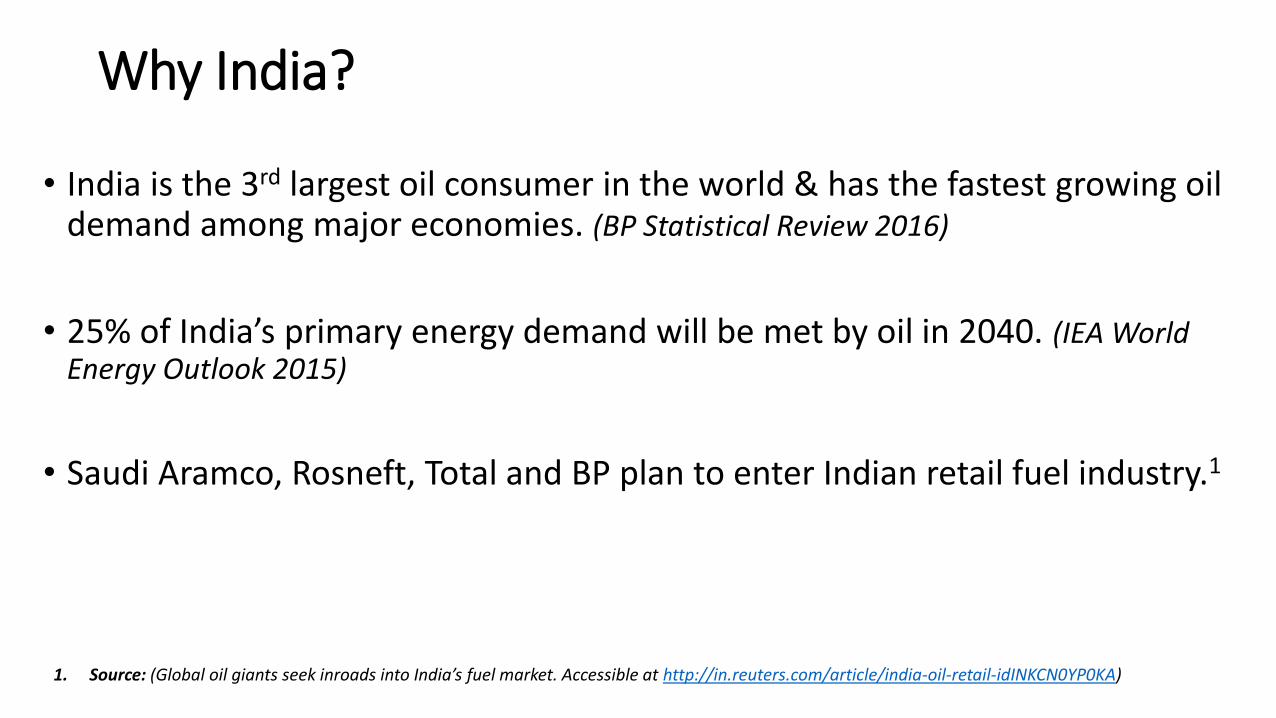
Why India?
• India is the 3rd largest oil consumer in the world & has the fastest growing oil demand among major economies. (BP Statistical Review 2016)
• 25% of India’s primary energy demand will be met by oil in 2040. (IEA World Energy Outlook 2015)
• Saudi Aramco, Rosneft, Total and BP plan to enter Indian retail fuel industry.1
1. Source: (Global oil giants seek inroads into India’s fuel market. Accessible at http://in.reuters.com/article/india-oil-retail-idINKCN0YP0KA)
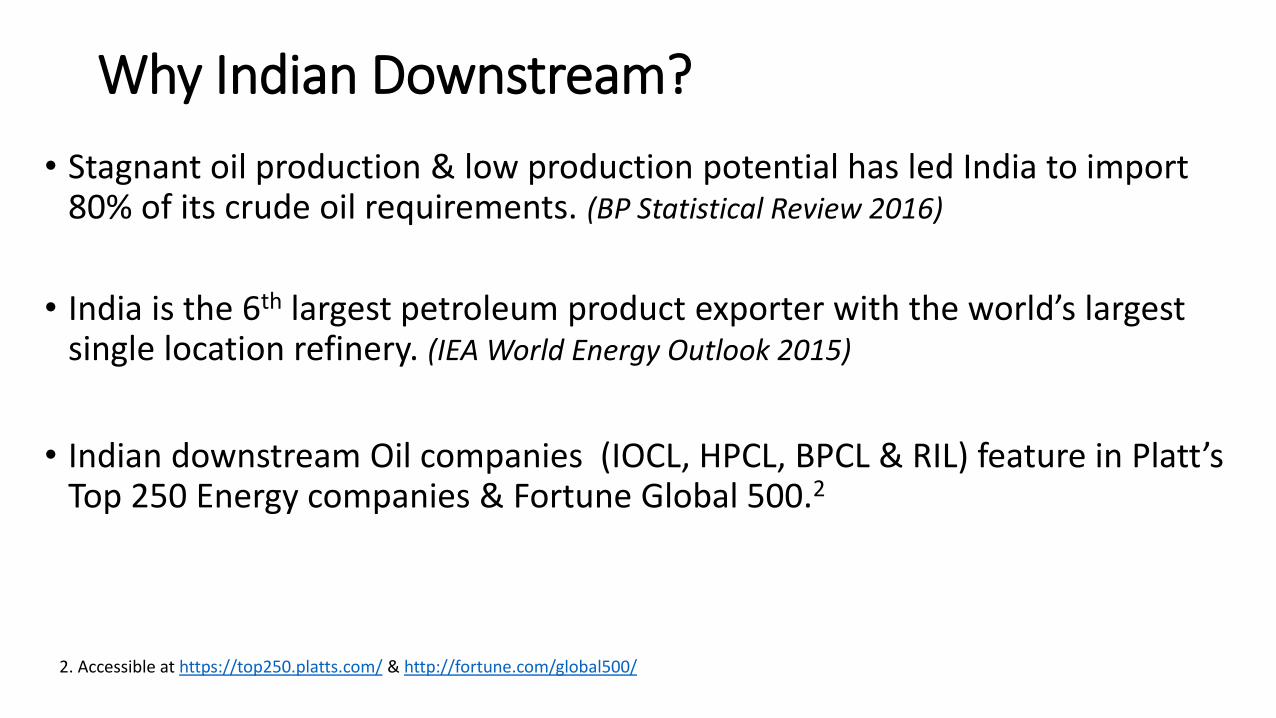
Why Indian Downstream?
• Stagnant oil production & low production potential has led India to import 80% of its crude oil requirements. (BP Statistical Review 2016)
• India is the 6th largest petroleum product exporter with the world’s largest single location refinery. (IEA World Energy Outlook 2015)
• Indian downstream Oil companies (IOCL, HPCL, BPCL & RIL) feature in Platt’s Top 250 Energy companies & Fortune Global 500.2
2. Accessible at https://top250.platts.com/ & http://fortune.com/global500/
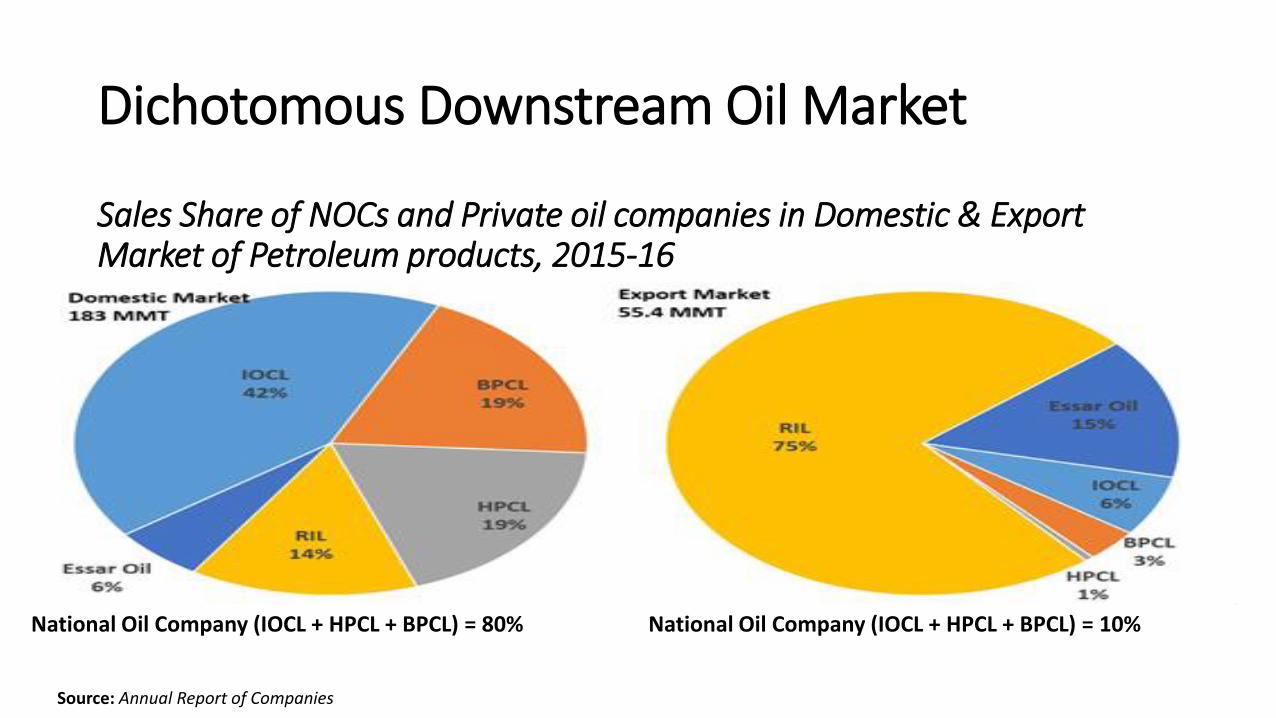
Dichotomous Downstream Oil Market
Sales Share of NOCs and Private oil companies in Domestic & Export Market of Petroleum products, 2015-16
National Oil Company (IOCL + HPCL + BPCL) = 80% National Oil Company (IOCL + HPCL + BPCL) = 10%
Source: Annual Report of Companies
Why Indian Downstream National Oil Companies?
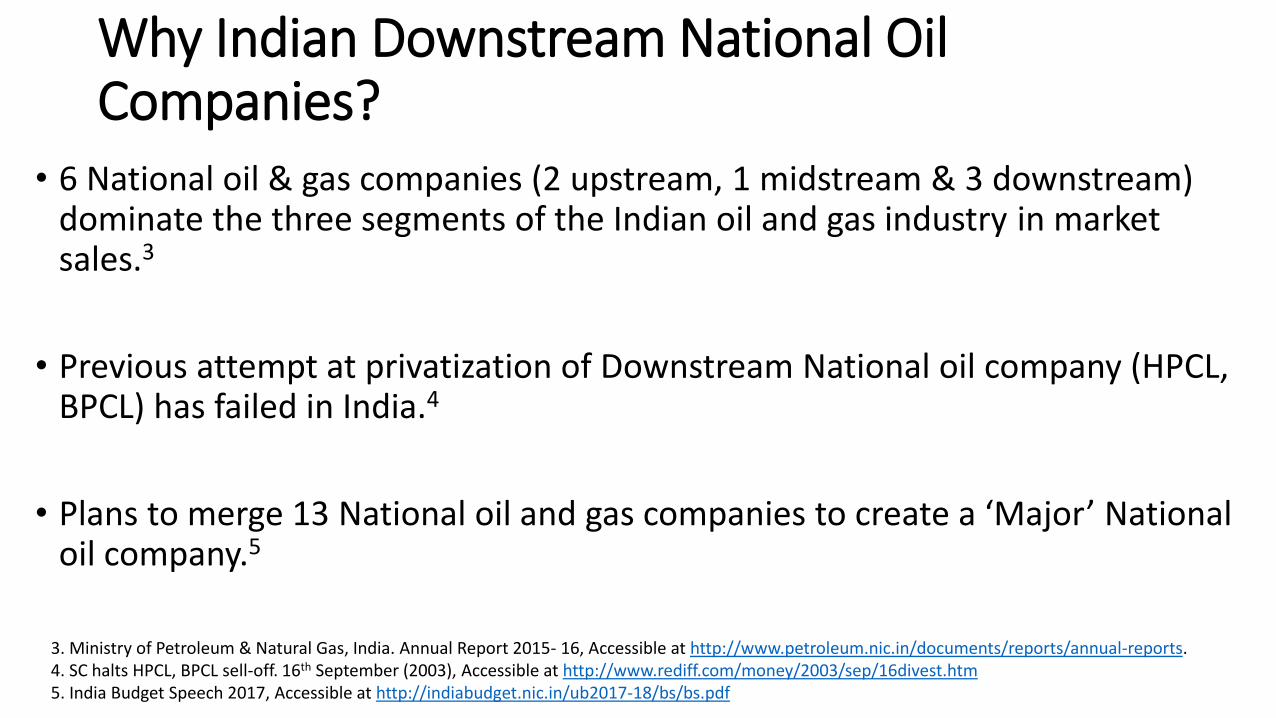
• 6 National oil & gas companies (2 upstream, 1 midstream & 3 downstream) dominate the three segments of the Indian oil and gas industry in market sales.3
• Previous attempt at privatization of Downstream National oil company (HPCL, BPCL) has failed in India.4
• Plans to merge 13 National oil and gas companies to create a ‘Major’ National oil company.5
3. Ministry of Petroleum & Natural Gas, India. Annual Report 2015- 16, Accessible at http://www.petroleum.nic.in/documents/reports/annual-reports.4. SC halts HPCL, BPCL sell-off. 16th September (2003), Accessible at http://www.rediff.com/money/2003/sep/16divest.htm5. India Budget Speech 2017, Accessible at http://indiabudget.nic.in/ub2017-18/bs/bs.pdf
Local context necessary to evaluate performance of downstream national oil company
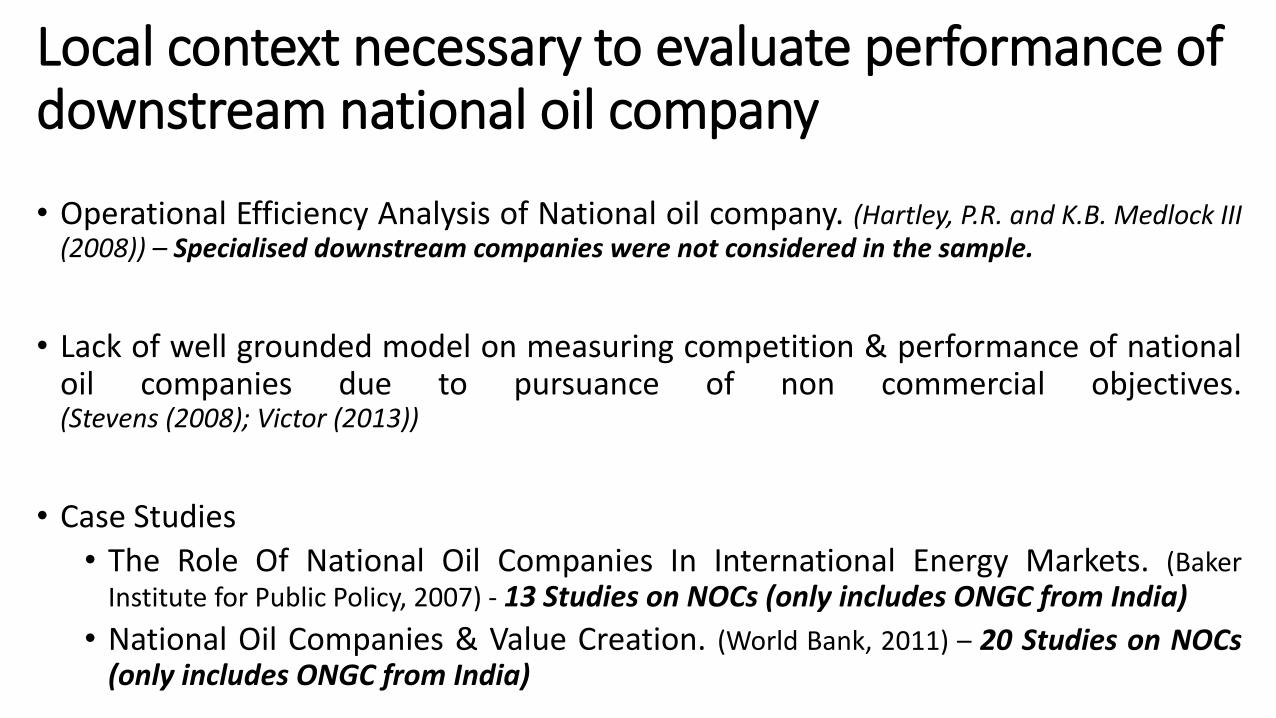
• Operational Efficiency Analysis of National oil company. (Hartley, P.R. and K.B. Medlock III(2008)) – Specialised downstream companies were not considered in the sample.
• Lack of well grounded model on measuring competition & performance of nationaloil companies due to pursuance of non commercial objectives.(Stevens (2008); Victor (2013))
• Case Studies
• The Role Of National Oil Companies In International Energy Markets. (BakerInstitute for Public Policy, 2007) - 13 Studies on NOCs (only includes ONGC from India)
• National Oil Companies & Value Creation. (World Bank, 2011) – 20 Studies on NOCs(only includes ONGC from India)
Research Question
• What is the Market Structure in different product markets of Indian Downstream oil industry?
• Which company out of the three NOCs is better able to perform in meeting commercial and non-commercial objectives?
Methods
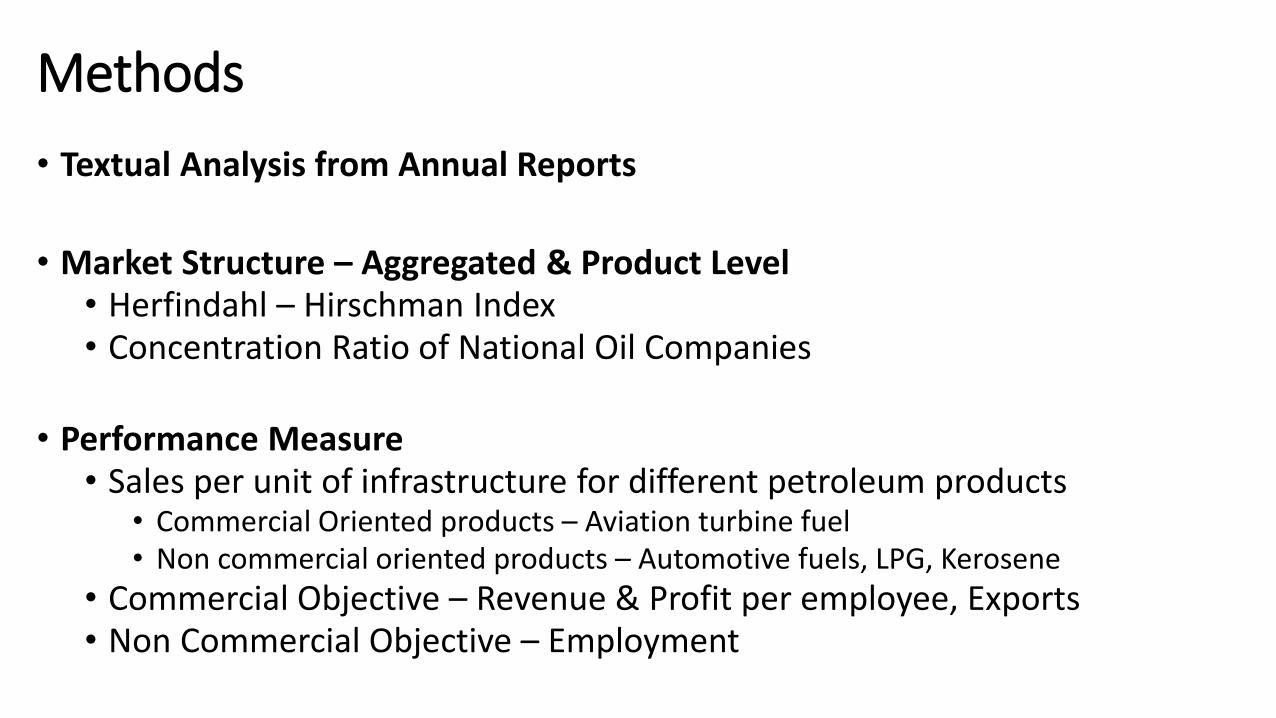
• Textual Analysis from Annual Reports
• Market Structure – Aggregated & Product Level• Herfindahl – Hirschman Index• Concentration Ratio of National Oil Companies
• Performance Measure• Sales per unit of infrastructure for different petroleum products
• Commercial Oriented products – Aviation turbine fuel• Non commercial oriented products – Automotive fuels, LPG, Kerosene
• Commercial Objective – Revenue & Profit per employee, Exports• Non Commercial Objective – Employment
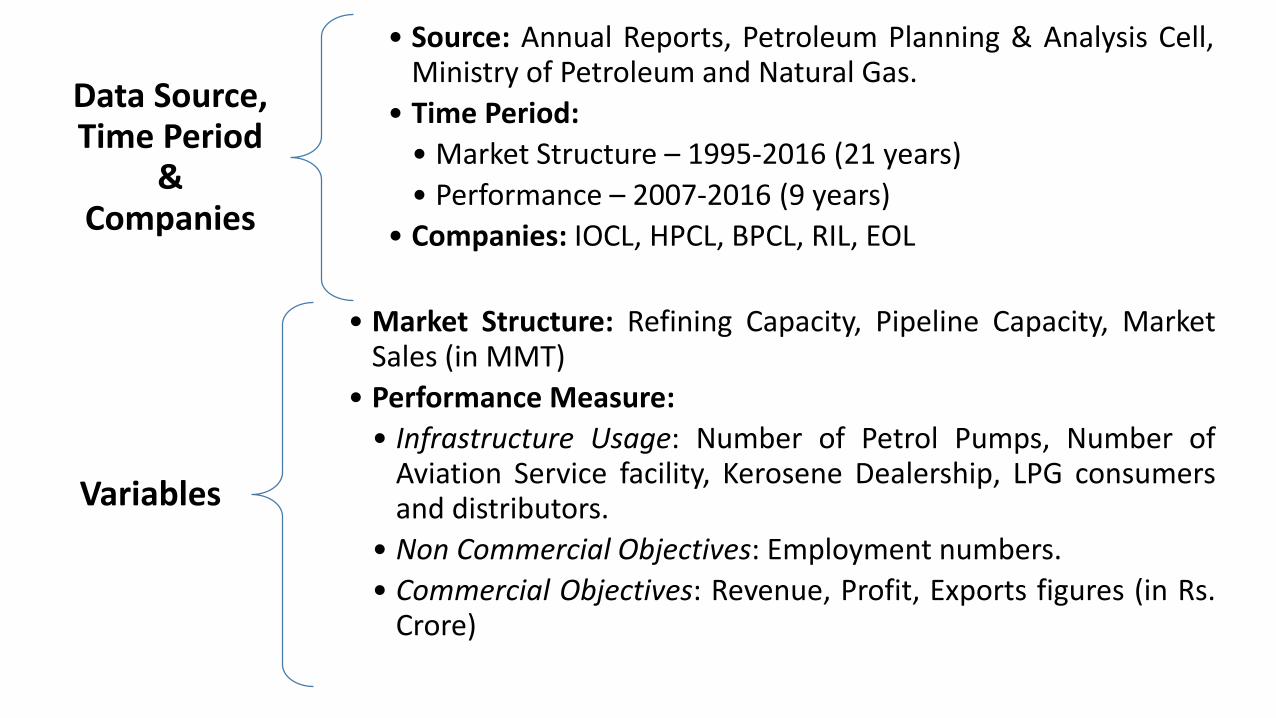
Data Source, Time Period
& Companies
• Source: Annual Reports, Petroleum Planning & Analysis Cell,Ministry of Petroleum and Natural Gas.
• Time Period:
• Market Structure – 1995-2016 (21 years)
• Performance – 2007-2016 (9 years)
• Companies: IOCL, HPCL, BPCL, RIL, EOL
Variables
• Market Structure: Refining Capacity, Pipeline Capacity, MarketSales (in MMT)
• Performance Measure:
• Infrastructure Usage: Number of Petrol Pumps, Number ofAviation Service facility, Kerosene Dealership, LPG consumersand distributors.
• Non Commercial Objectives: Employment numbers.
• Commercial Objectives: Revenue, Profit, Exports figures (in Rs.Crore)
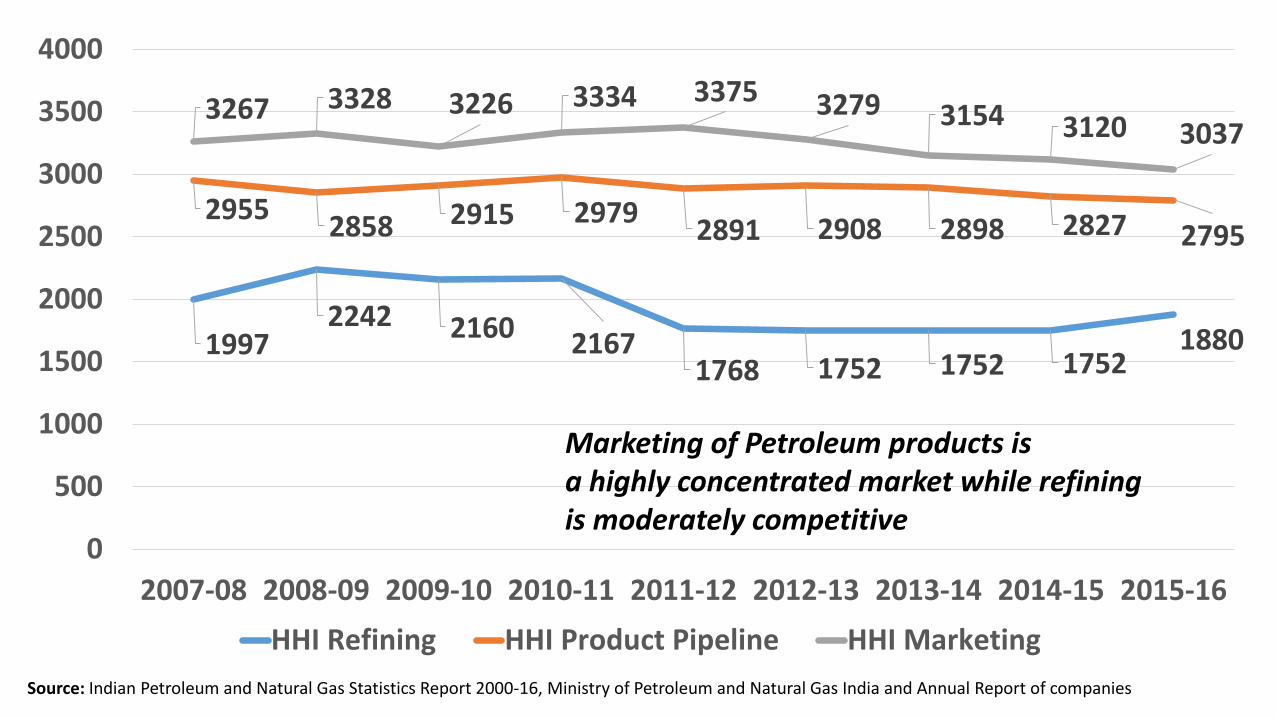
19972242 2160 2167
1768 1752 1752 17521880
29552858 2915 2979
2891 2908 2898 2827 2795
3267 3328 3226 3334 3375 3279 3154 3120 3037
0
500
1000
1500
2000
2500
3000
3500
4000
2007-08 2008-09 2009-10 2010-11 2011-12 2012-13 2013-14 2014-15 2015-16
HHI Refining HHI Product Pipeline HHI Marketing
Source: Indian Petroleum and Natural Gas Statistics Report 2000-16, Ministry of Petroleum and Natural Gas India and Annual Report of companies
Marketing of Petroleum products isa highly concentrated market while refiningis moderately competitive
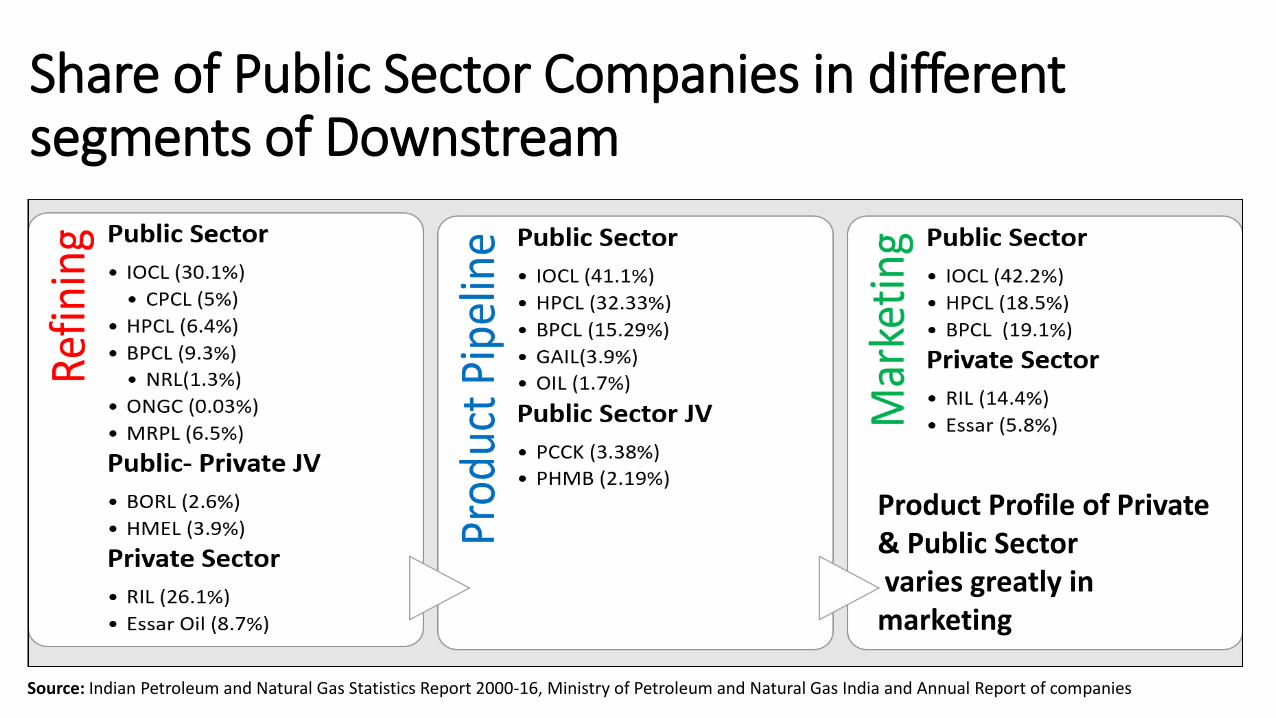
Share of Public Sector Companies in different segments of Downstream
Source: Indian Petroleum and Natural Gas Statistics Report 2000-16, Ministry of Petroleum and Natural Gas India and Annual Report of companies
Product Profile of Private & Public Sectorvaries greatly in marketing
0
50
100
150
200
250
300
0
1000
2000
3000
4000
5000
6000
19
95
-96
19
96
-97
19
97
-98
19
98
-99
19
99
-00
20
00
-01
20
01
-02
20
02
-03
20
03
-04
20
04
-05
20
05
-06
20
06
-07
20
07
-08
20
08
-09
20
09
-10
20
10
-11
20
11
-12
20
12
-13
20
13
-14
20
14
-15
20
15
-16
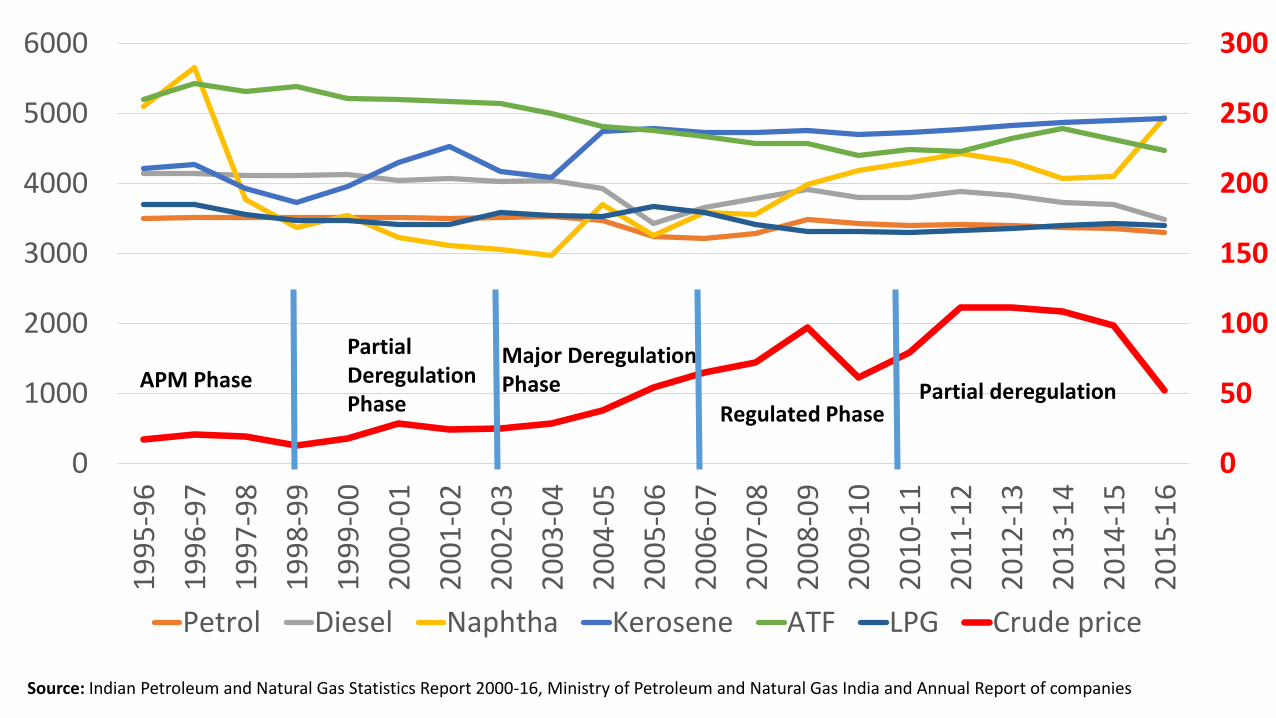
Petrol Diesel Naphtha Kerosene ATF LPG Crude price
Partial Deregulation Phase
Major DeregulationPhase
Regulated PhasePartial deregulationAPM Phase
Source: Indian Petroleum and Natural Gas Statistics Report 2000-16, Ministry of Petroleum and Natural Gas India and Annual Report of companies
0%
20%
40%
60%
80%
100%
120%
50%
55%
60%
65%
70%
75%
80%
85%
90%
95%
100%
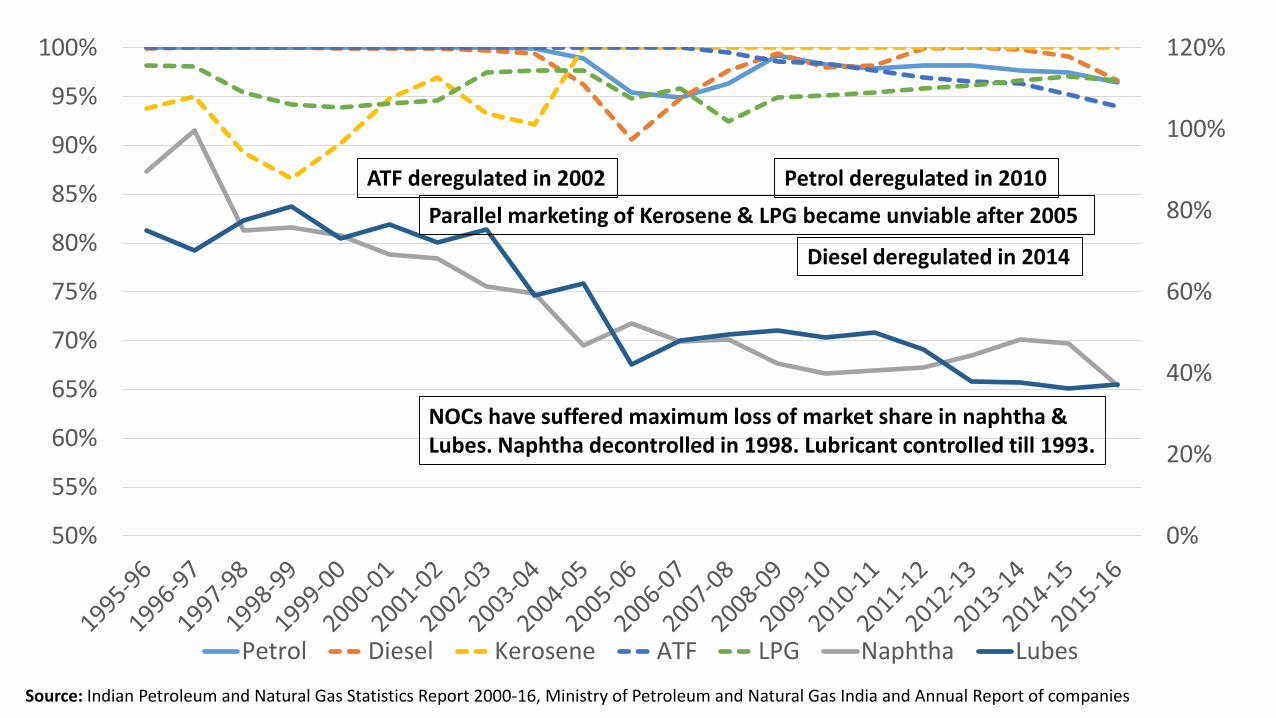
Petrol Diesel Kerosene ATF LPG Naphtha Lubes
Petrol deregulated in 2010
Diesel deregulated in 2014
ATF deregulated in 2002
Parallel marketing of Kerosene & LPG became unviable after 2005
NOCs have suffered maximum loss of market share in naphtha &Lubes. Naphtha decontrolled in 1998. Lubricant controlled till 1993.
Source: Indian Petroleum and Natural Gas Statistics Report 2000-16, Ministry of Petroleum and Natural Gas India and Annual Report of companies
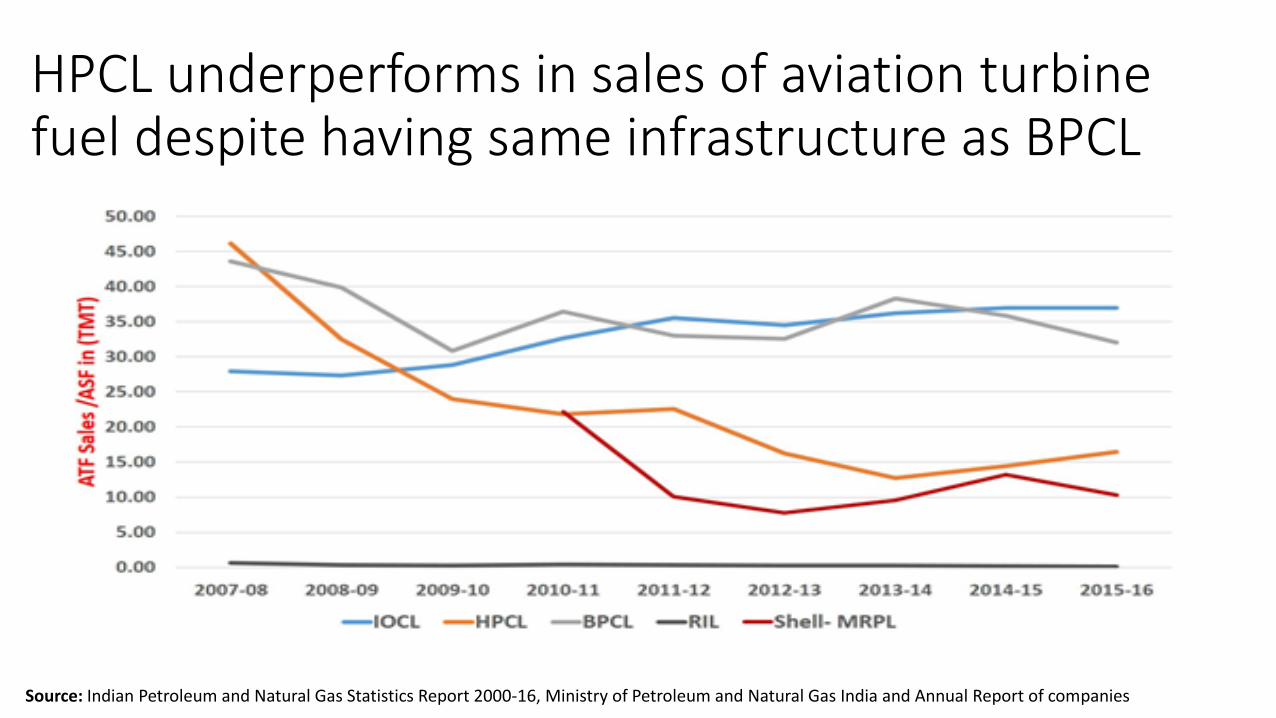
HPCL underperforms in sales of aviation turbine fuel despite having same infrastructure as BPCL
Source: Indian Petroleum and Natural Gas Statistics Report 2000-16, Ministry of Petroleum and Natural Gas India and Annual Report of companies
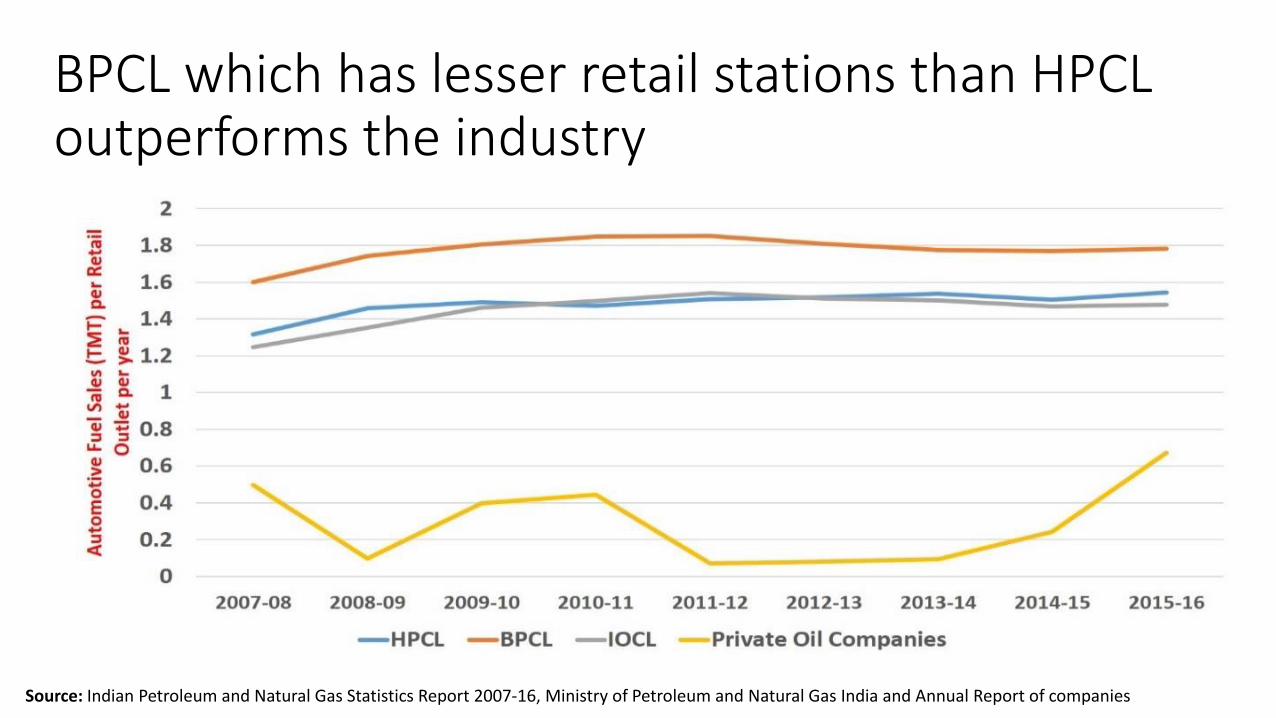
BPCL which has lesser retail stations than HPCL outperforms the industry
Source: Indian Petroleum and Natural Gas Statistics Report 2007-16, Ministry of Petroleum and Natural Gas India and Annual Report of companies
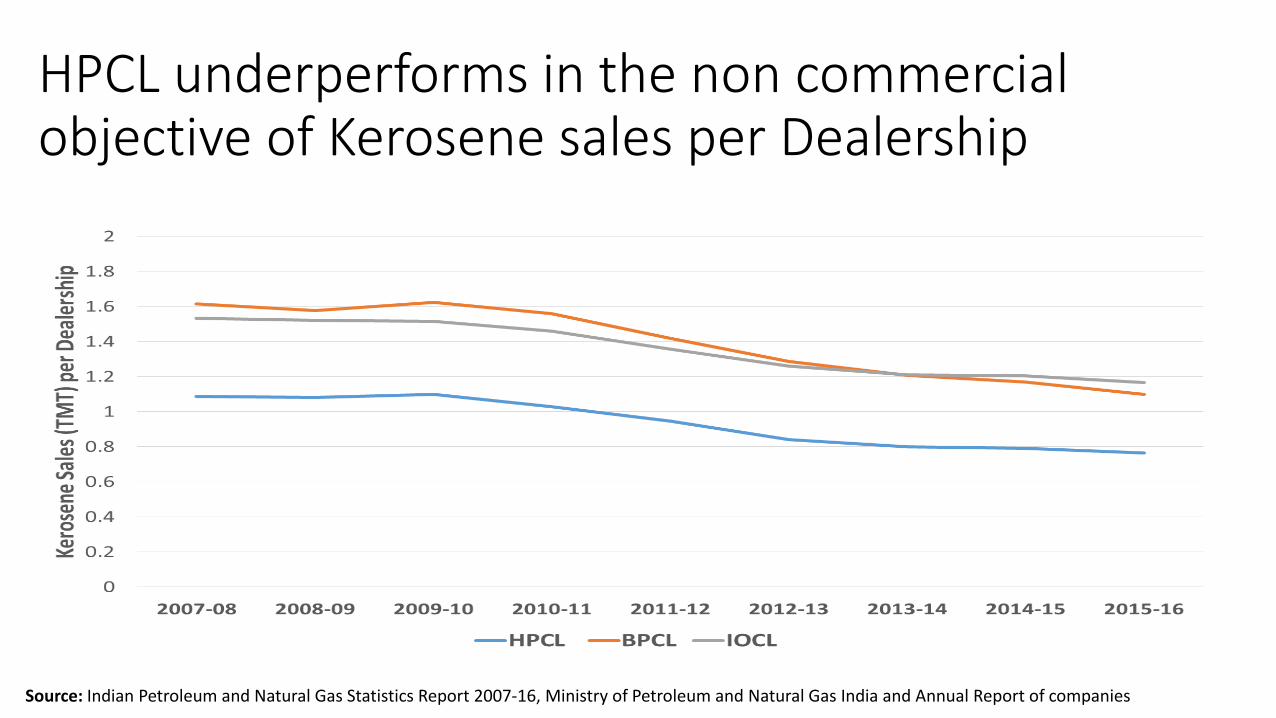
HPCL underperforms in the non commercial objective of Kerosene sales per Dealership
Source: Indian Petroleum and Natural Gas Statistics Report 2007-16, Ministry of Petroleum and Natural Gas India and Annual Report of companies
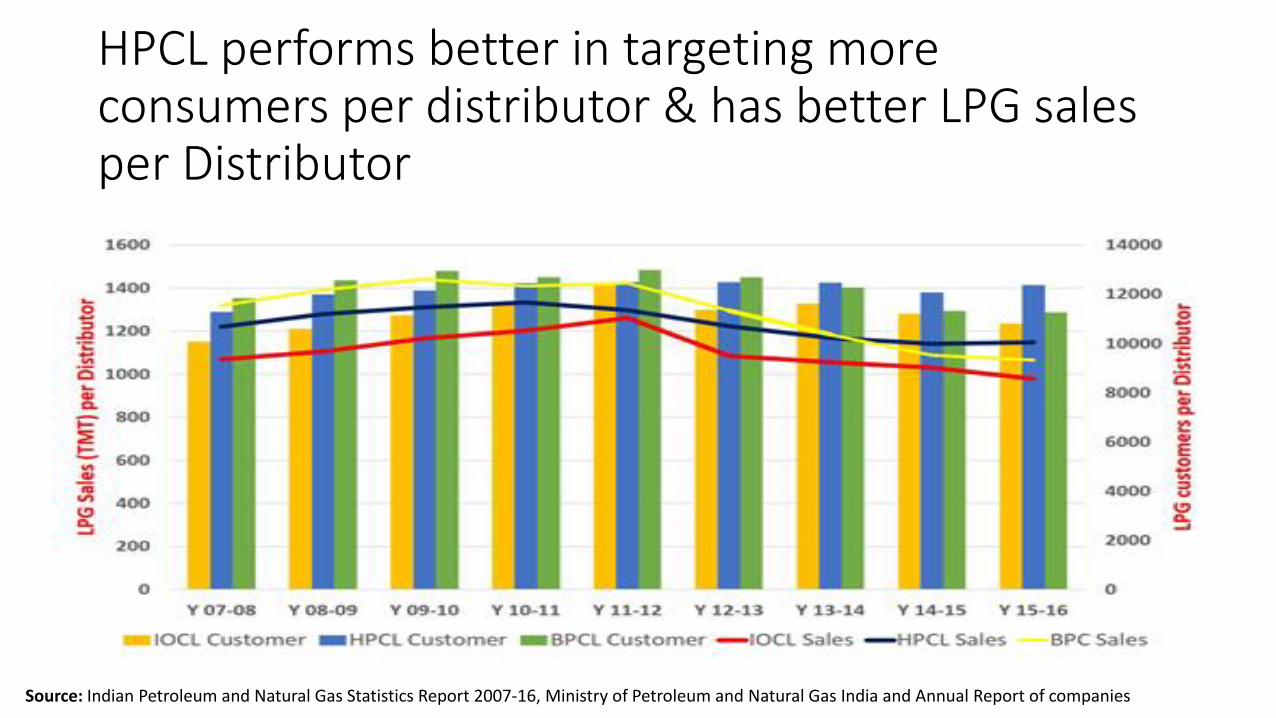
HPCL performs better in targeting more consumers per distributor & has better LPG sales per Distributor
Source: Indian Petroleum and Natural Gas Statistics Report 2007-16, Ministry of Petroleum and Natural Gas India and Annual Report of companies
Performance in fulfilling commercial & non commercial objectives
• Private Downstream Companies have dominant export share, higher profit per employee, higher CSR and R & D expenditure as compared to NOCs.
• Employment growth is more in Private oil companies as compared to NOCs.
• HPCL has less revenue & profit per employee as compared to BPCL and IOCL despite having the same market share as BPCL.
Results
• NOCs maintain stable market shares among themselves during regulated period indicating low competition among themselves.
• NOCs inevitably lose market share in products which have been deregulated.
• HPCL performs poorly in the usage of infrastructure for aviation turbine fuel, automotive fuels & Kerosene and has lower revenue & profit per employee as compared to IOCL & BPCL.
Conclusion
Performance measures indicate pursuance of commercial and non commercial objectives by national oil companies and BPCL is better able to balance commercial objectives with non commercial objectives as compared to HPCL.
Expansion of downstream national oil companies separately can compromise economies of scale while merging these national oil companies without benchmarking performance and analysing efficiency can lead to negative synergies.
What is the economic rationale of having three downstream national oil companies in the Downstream industry?

Thank you
Related Documents