Market Strategies for a Tobacco Bio-Pharming Application: The Case of Gaucher’s Disease Treatment Genti Kostandini and Bradford F. Mills * Virginia Polytechnic Institute and State University Department of Agricultural and Applied Economics Virginia Tech Blacksburg, VA 24061-0401 Phone: (540) 231-6461 Fax: (540) 231-3318 Email: [email protected] [email protected] *Graduate research assistant, and associate professor, respectively, Virginia Polytechnic Institute and State University, Blacksburg, Virginia 24061. Selected Paper prepared for presentation at the American Agricultural Economics Association Annual Meeting, Providence, Rhode Island, July 24-27, 2005. Copyright 2005 by Genti Kostandini and Bradford F. Mills. All rights reserved. Readers may make verbatim copies of this document for non-commercial purposes by any means, provided that this copyright notice appears on all such copies.

Welcome message from author
This document is posted to help you gain knowledge. Please leave a comment to let me know what you think about it! Share it to your friends and learn new things together.
Transcript

Market Strategies for a Tobacco Bio-Pharming Application: The Case of Gaucher’s Disease Treatment
Genti Kostandini and Bradford F. Mills*
Virginia Polytechnic Institute and State University
Department of Agricultural and Applied Economics
Virginia Tech
Blacksburg, VA 24061-0401
Phone: (540) 231-6461
Fax: (540) 231-3318
Email: [email protected]
*Graduate research assistant, and associate professor, respectively, Virginia Polytechnic Institute and State University, Blacksburg, Virginia 24061.
Selected Paper prepared for presentation at the American Agricultural Economics Association Annual Meeting, Providence, Rhode Island, July 24-27, 2005.
Copyright 2005 by Genti Kostandini and Bradford F. Mills. All rights reserved. Readers may make verbatim copies of this document for non-commercial purposes by any means, provided that this copyright notice appears on all such copies.

Market Strategies for a Tobacco Bio-Pharming Application: The Case of Gaucher’s
Disease Treatment
Abstract
Small firms developing biotechnology applications often focus on establishing intellectual
property rights, which can then be sold to more established firms with existing market chains.
This paper explores the expected ‘Buyout’ price and economic surplus changes for an emerging
bio-pharming application with transgenic tobacco. The results suggest a ‘Buyout’ price of about
$1.75 billion. Yet despite this potentially large payout to the innovating firm, consumers also see
significant surplus gains.
Keywords: Buyout, bio-pharming, transgenic tobacco, imperfect competition, economic surplus.
1

Market Strategies for a Tobacco Bio-Pharming Application: The Case of Gaucher’s
Disease Treatment
Genetic engineering of plants and animals holds the promise to produce therapeutic proteins at
significant lower costs than current pharmaceutical drugs production methods1. For example,
empirical studies of bio-pharming show 10-100 times lower production costs compared to cell
culture systems (Misson and Curling, 2000: Kusnadi, Nikolov and Howard, 1997)2. Further,
transgenic plants are generally preferred to transgenic animals for bio-pharming3. Plants are
better able to express complex proteins, and they do not serve as hosts for mammalian
pathogens, which reduces the risk of contamination (Cramer et al., 1996). Research on plant-
produced proteins is conducted on a variety of agricultural crops such as corn, tobacco, potato,
alfalfa, rice, and canola. Tobacco appears to be among the most preferred because of safety
issues, and prior knowledge of the plant’s genome. Compared to other agricultural crops, tobacco
is not used as feed or food supply. Tobacco also has an advantage from the standpoint of
containment, as transgenic tobacco is either harvested before reaching maturity or tops are cut so
that the tobacco does not flower4. Thus, gene flow can be minimized.
Research on tobacco has already achieved remarkable results and therapeutic proteins
from transgenic tobacco are expected to be among the first marketed plant-produced medicines.
Many biotech firms have utilized this novelty and are far beyond the laboratory experimental
stage, conducting successful clinical trials towards commercialization. Successful human trials 1 The term drug here indicates the final product sold in the market, whereas protein refers to the material from which the drug is made. 2 Cell culture systems refer to bacterial or mammalian cells genetically modified to express a desired protein. Examples are Chinese Hamster Ovary and Escherica Coli. The term drug here indicates the final product sold in the market, whereas protein refers to the material from which the drug is made. 3 Transgenic plants refer to genetically modified plants. 4 Tobacco has the disadvantage that its biomass must be processed immediately after harvest.
2

have been conducted on several proteins of plant origin indicating that commercialization time is
not far. CaroRX, for example, is a treatment for dental caries which has already received
approval for production in Europe and it is now on stage II of clinical trials in the US. The
company that invented the treatment plans to launch it on the market by 2005.
These innovations will be covered by Intellectual Property Rights (IPR) laws, allowing
patent holders exert market power to recover their Research and Development (R & D) costs and
extract profits. Some small biotech firms adopt bio-pharming applications to produce drugs with
lower cost for markets that are currently served by just a few (or only one) firms. These markets
are characterized by high market power and a lower cost drug offers better profit opportunities
compared to markets with more competitive firms. Often the strategy of small biotech firms is to
establish IPRs, and then, be bought out by a larger competitor. For example, in the year 2004,
Pfizer, a large pharmaceutical company paid $1.3 billion in cash for Esperion Therapeutics, a
small firm with a drug that boosts levels of “good” cholesterol (Alpert, 2004). In the year 2001,
Amgen Inc., a big biotech company agreed to buy Immunex Corp. with its very successful drug
Enbrel for about $16 billion, achieving thus fur the largest biotech buyout (Gillis, 2002). A total
of 2.7 billion was paid by pharmaceutical companies for seven biotech acquisitions in the year
2000 and in the year 2003, companies paid over 5 billion for six firms (Alpert, 2004).
The purpose of this paper is to determine an expected ‘Buyout’ price and potential
economic surplus benefits that bio-pharming may introduce through a lower cost method for
therapeutic proteins production with transgenic tobacco. Specifically, the study estimates the
‘Buyout’ price and surplus benefits for a small biotech firm that produces Glucocerebrosidase
Enzyme out of transgenic tobacco. Glucocerebrosidase Enzyme is the main treatment for
Gaucher’s disease. The first section of the paper provides a general description of Gaucher’s
3
disease and the market for the drug. The model used to determine the ‘Buyout’ price and
economic surplus benefits is presented in the second section. The therapeutic protein production
process, unit cost reductions and other data used in the model are presented in the third section
and the results are provided in the fourth section. The last section discusses the implications of
the findings for the emerging bio-pharming industry.
Gaucher’s Disease
Gaucher’s disease is part of some thirty family-genetic (inherited) diseases that are
identified as lysosomal storage disorders (Rader, 2003). Persons that suffer from the disease lack
the lysosomal enzyme Glucocerebrosidase. Glucocerebrosidase Enzyme is necessary for
breaking down lipids and its absence results in a lipid storage disorder. Lipids build up in the
liver and spleen and result in lung, bone, kidney problems and anemia (Goozner, 2000).
Gaucher’s disease is very rare, affecting around 20,000 people worldwide5. There are three types
of Gaucher’s disease: type I – chronic, non – neuropathic form ; type II – infantile neuropathic ;
and type III – juvenile neuropathic (Rader, 2003). Type I is the most common of the three and
1,700 patients with type I Gaucher disease are currently receiving treatment in the US.
Genetic defects causing Gaucher’s disease were discovered in 1964, and the purified
Glucocerebrosidase Enzyme was first produced in 1974 (Goozner, 2000). The enzyme was
purified from human placentas and the process was very expensive. The drug (Ceredase) was
finally approved from FDA in 1991 and Genzyme patented it. Genzyme continued to produce
Ceredase from human placentas until 1995 when it licensed a recombinant version of the enzyme
5 This figure includes people that are taking treatment for Gaucher’s disease and people that have not started the treatment yet (because the disease is in its very first stages) but are positively diagnosed.
4

(Cerezyme) produced in Chinese Hampster Ovaries (Goozner, 2000)6. Cerezyme was found to
be a more effective treatment than Ceredase because of a slight genetic modification on the
recombinant enzyme (Rader, 2003). Cerezyme is still the most effective treatment for Gaucher’s
disease and larger quantities can be produced, because the production of the enzyme does not
depend on the availability of human placentas. However, production is still very costly.
Depending on the severity of the disease, patients inject different dosages of Cerezyme
directly into the blood stream. A patient can take between 0.25 and 3 grams of Cerezyme for a
one-year period (Rader, 2003). Persons that suffer from Gaucher disease receive the medicine
throughout their life. The average cost per patient is $175,000 annually. Almost half of the global
sales of Cerezyme are in the US, where Genzyme has reached 3,600 out of 5,000-10,000 patients
with Gaucher’s Disease (Rader, 2003).
Cerezyme market
Genzyme is currently the only provider of a treatment for Gaucher’s disease in the US.
There is another product that is approved in Europe, Zavesca which is produced by Oxford
Glycosciences plc., but it is used for patients with mild to moderate disease conditions for which
Cerezyme is unsuitable (Rader, 2003). The Cerezyme patent expired in 2001 but its
manufacturing method is patented until 2011 and its composition until 2013 (Genzyme Corp.,
2003). The market for Gaucher’s disease treatment has always been a lucrative market, and other
companies have tried to develop effective treatments but so far with unsuccessful results.
Vevesca, an alternative Gauscher’s disease treatment by Oxford Glycosciences went through all
clinical trials and showed promising results but failed to gain approval in the US and Europe
because 11 percent of the patients developed nervous system complications. Ceredase, the other
(human-derived) glucocerebrosidase product from Genzyme is being disrupted (patients 6 Recombinant proteins are proteins produced in the cells of genetically modified organisms.
5

switched to Cerezyme) and sales of Ceredase are very small compared to the sales of Cerezyme
(Rader, 2003). Thus, Genzyme maintains substantial market power, suggesting it can act as a
monopolist. The price of Cerezyme has not changed during the last ten years and this might be
an additional indication of substantial market power.
The Model
An ex-ante analysis is conducted since Glucocerebrosidase Enzyme from transgenic
tobacco is not currently in the market. To determine an optimal ‘Buyout’ price we need to know
the potential marketing strategies of the biotech firm (the innovator) with the bio-pharming
application and potential profits for each strategy if he/she decides to enter the market. Genzyme
is assumed to be a perfect monopoly in the current market for Cerezyme because it is the only
firm (the incumbent) in the market. Although Glucocerebrosidase Enzyme is produced in
transgenic tobacco, the acreage involved in the production of this particular protein is very small
(one acre)7. Further, it is assumed that the transgenic tobacco product is of the same quality as
Cerezyme. Thus, if the innovator decides to enter, the market becomes a duopoly. The successful
developer of the patented transgenic production process may follow several potential strategies
to enter the market. The present study explores the two most common market strategies for
entrance with an existing monopoly: Cournot and Stackelberg.
Exact specifications of demand and marginal cost curve are needed in order to calculate
the profits of the innovator, the change in incumbent’ profits and the economic surplus generated
from the bio-pharming application under each strategy. The derivations of demand and marginal
cost curve are discussed below, followed by a detailed description of the Cournot and
Stackelberg models leading to the optimal ‘Buyout’ price calculation. For simplicity, the 7 The study assumes that transgenic tobacco will be contracted at marginal cost.
6

Cerezyme market is characterized by linear supply and demand functions derived from
information on prices, quantities and elasticities of demand and supply.
Under these assumptions the demand for Cerezyme in price dependent form is
dQP λµ −= (1)
where P is the price of one unit of Cerezyme, is the quantity demanded and µ and λ are the
intercept and slope terms, respectively. Thus the marginal revenue curve is
dQ
dQMR λµ 2−= (2)
Similarly, a linear marginal cost curve of Cerezyme (in price dependent form) can be specified as
SQP ηψ += (3)
where is the quantity of Cerezyme produced and SQ ψ and η are the intercept and slope terms
respectively.
Several studies including Alston, Norton and Pardey (1995) have examined the errors due
to assumptions about elasticities and functional forms of supply and demand equations when
modeling the size and distribution of research benefits. Generally, functional forms and
elasticities are relatively unimportant in determining the size of total benefits compared with the
nature of the supply shift, while functional forms are relatively unimportant compared with the
sizes of elasticities and the nature of supply shift in determining the distribution of benefits8. In
the absence of information on the specific nature of the supply shift, a parallel shift is usually
employed, with a pivotal shift providing a distinct contrast in sensitivity analysis.
In this case the parallel outward marginal cost curve shift is represented as
8 Concerns have also been expressed about inelastic linear supply functions, which when extrapolated back to the origin may result in a negative intercept (implying that positive quantities will be supplied at negative prices) (Alston, Norton and Pardey, 1995). Rose (1980) suggests that kinking the supply curve can avert the negative intercept. Further, the economic surplus calculations after kinking the supply curve at the original quantity are the same as the surplus calculations without the kink, demonstrating that the use of an inelastic supply curve does not alter the results (Alston, Norton and Pardey, 1995).
7

( ) SQkP ηψ +−= (4)
Where k is the size of the unit cost reduction expressed as cost savings for each gram of
Glucocerebrosidase Enzyme produced from transgenic tobacco compared to CHO.
For comparison a pivotal supply shift for the same unit is also employed and is represented as
SQP 1ηψ += (5)
where 0
0c
1P
Qk
c
ψη −−= and cP0 and cQ0 are equilibrium price and quantity if the incumbent
behaves as a perfect competitor.
Being a perfect monopoly, the company charges a price mark-up above the marginal cost
curve. The magnitude of the price mark-up is
PEDPMCP 1
=− (6)
The price markup depends on the price elasticity of demand (PED) and the marginal cost curve
of the monopolist. The point where the MC curve and the MR curve meet is derived from (6) and
it is used to obtain the slope and intercept of the marginal cost curves in (4) and (5).
Cournot model
Under the Cournot model both incumbent and entrant choose the quantities produced based on
the quantity of the other firm. In equilibrium, both firms maximize profits based on consistent
beliefs about each other’s output. Denote the incumbent’s output level as q1, the innovator’s
output level as q2, and the aggregate output as Q = q1+ q2. Firm 1 has a cost function given by
c1(q1) and firm 2 has a cost function given by c2(q2). The maximization problem of firm 1 is
)()(),( max 111212111 qcqqqpqqq −+=Π (7)
8

Similarly, the maximization problem of firm 2 is
)()(),( max 222212122 qcqqqpqqq −+=Π (8)
To determine each firm’s choice of output we take the first order conditions with respect to
output. The optimal choice of output for each firm (q1* for firm 1 and q2* for firm 2) is derived
solving simultaneously the first order conditions. The unit cost reductions in case of a parallel
and a pivotal shift are introduced as specified in (4) and (5), respectively. The solutions to the
simultaneous equations from the first order conditions are
2112
12211 )223(
)()2(*ηηηηλλψµηψψµλ
+++−++−
=q (9)
2112
21122 )223(
)()2(*ηηηηλλψµηψψµλ
+++−++−
=q (10)
Based on equilibrium quantities, profits for each firm, the equilibrium market price and also the
change in consumer surplus generated from the entrance of firm 2 can be calculated.
Stackelberg model
The Stackelberg model is a model of quantity leadership. This is a two-stage model where one
firm moves first, and then, the other firm follows after observing the first firm’s output and then
choosing its own output. Again, the optimal output for the leader depends on consistent beliefs
on how the follower responds to the output the leader chooses. In the present study the
incumbent is the follower and the innovating firm is the leader due to its lower marginal cost. To
solve for equilibrium outputs we start from stage two and maximize firm 1 profit which is
9
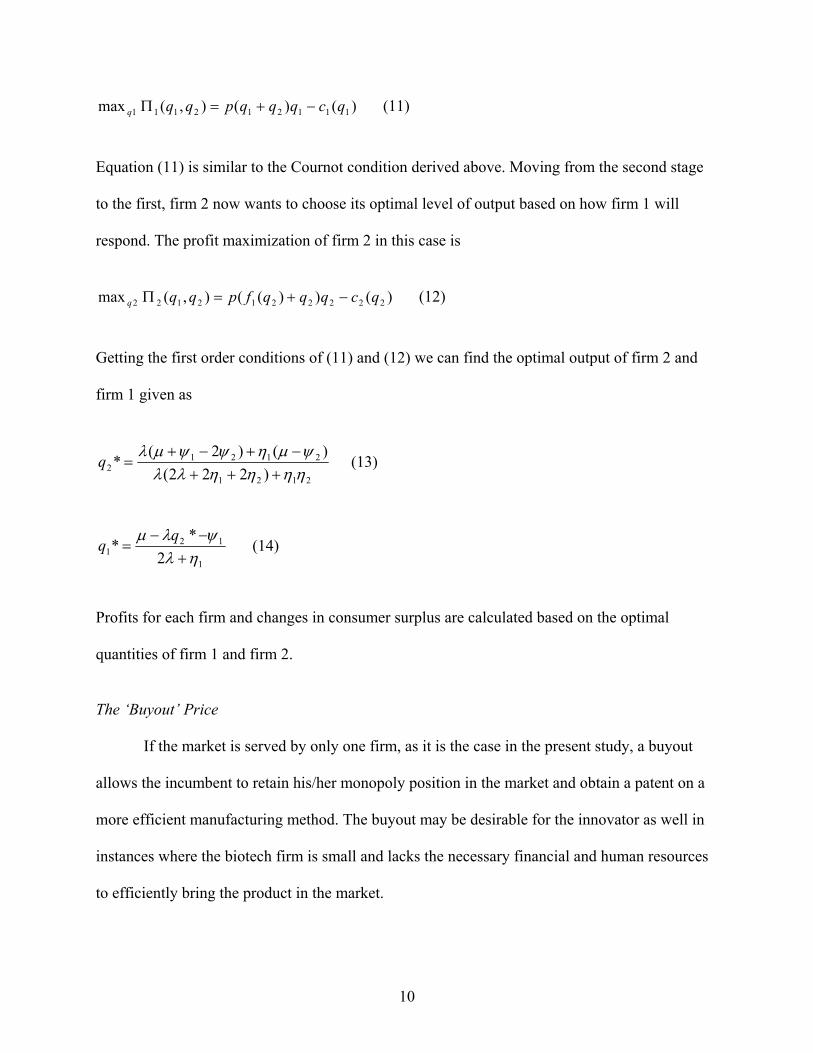
)()(),( max 111212111 qcqqqpqqq −+=Π (11)
Equation (11) is similar to the Cournot condition derived above. Moving from the second stage
to the first, firm 2 now wants to choose its optimal level of output based on how firm 1 will
respond. The profit maximization of firm 2 in this case is
)())((),( max 2222212122 qcqqqfpqqq −+=Π (12)
Getting the first order conditions of (11) and (12) we can find the optimal output of firm 2 and
firm 1 given as
2121
21212 )222(
)()2(*ηηηηλλψµηψψµλ
+++−+−+
=q (13)
1
121 2
**ηλψλµ
+−−
=qq (14)
Profits for each firm and changes in consumer surplus are calculated based on the optimal
quantities of firm 1 and firm 2.
The ‘Buyout’ Price
If the market is served by only one firm, as it is the case in the present study, a buyout
allows the incumbent to retain his/her monopoly position in the market and obtain a patent on a
more efficient manufacturing method. The buyout may be desirable for the innovator as well in
instances where the biotech firm is small and lacks the necessary financial and human resources
to efficiently bring the product in the market.
10

Both firms are assumed to know the outcomes if they pursue Cournot and Stackelberg
strategies. These outcomes are considered by the incumbent in computing the ‘Buyout’ price
offer, and by the innovator in his/her decision on whether to accept or reject the offer. The
incumbent knows that if the innovator rejects the buyout price, he/she enters the market as a
Cournot or Stackelberg competitor. Moreover, based on current patents it is assumed that the
incumbent’s current manufacturing method is patent protected for six more years and after that
period he/she may face generic competition in the market. As soon as generic competition is
present, both incumbent’s and innovator’s profits are affected, with the incumbent’s profits
driven to zero because the generics are produced using the incumbent’s production method9. But,
the innovator still retains a cost advantage in his/her production method for the remaining life of
his/her patent. Thus, we also calculate the expected profits of the innovator over remaining life
of the patent after he/she faces generic competition in the market. To simplify the analysis, it is
assumed that the innovator can drive out the competition in the market through limit pricing.
Assuming that there will be a large number of potential generic entrants in the market (with no
market power) the innovator will price the product slightly lower than these generic firms’
marginal cost, but higher than the innovator’s marginal cost. At the limit price, the innovator
faces an elastic demand because it gains the whole market with a small price decrease.
During the limit price period, the expected present value (PV) at time 0 of the corresponding
innovator’s profits is
tt
c
tg r
k)1()Q*( 012
7 +=Π ∑
=
(15)
Where denotes the expected PV of potential annual profits of the innovator from the time
generics may enter the market until innovator’s patent expires (from the beginning of the 7
gΠ
th year 9 It is assumed that generics have the same qualities as the original product.
11
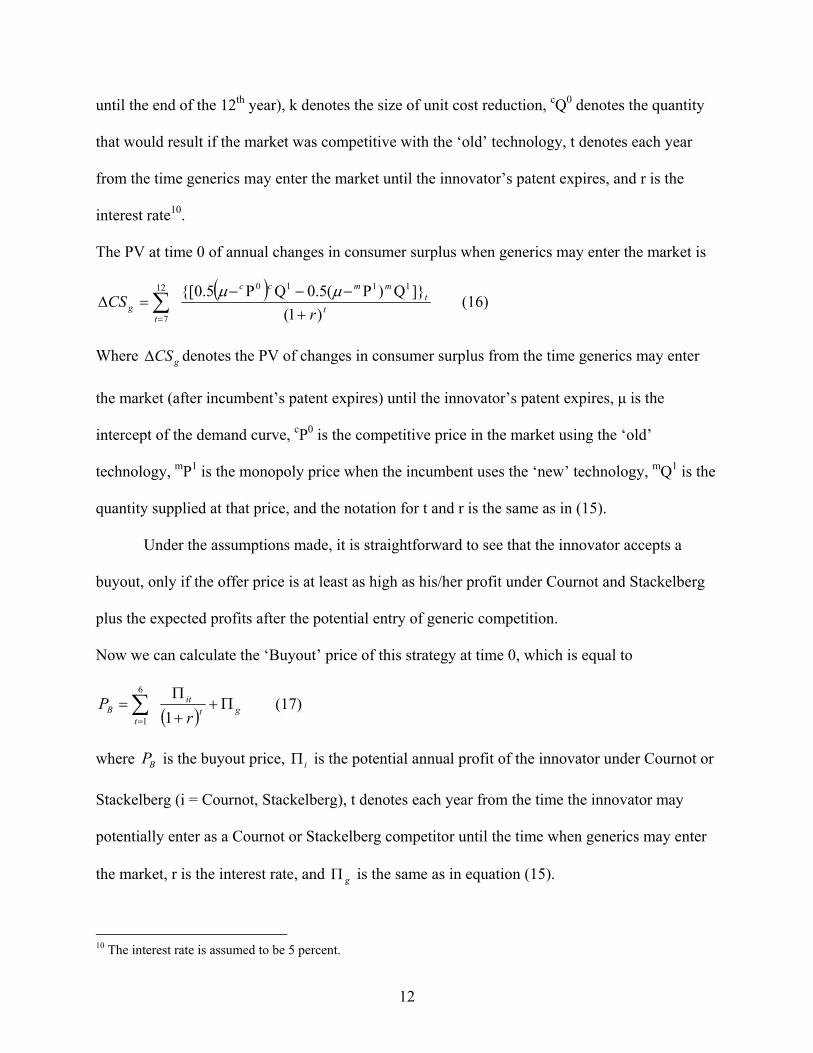
until the end of the 12th year), k denotes the size of unit cost reduction, cQ0 denotes the quantity
that would result if the market was competitive with the ‘old’ technology, t denotes each year
from the time generics may enter the market until the innovator’s patent expires, and r is the
interest rate10.
The PV at time 0 of annual changes in consumer surplus when generics may enter the market is
( )t
tmmcc
tg r
CS)1(
]}Q)P(5.0QP5.0{[ 111012
7 +−−−
=∆ ∑=
µµ (16)
Where denotes the PV of changes in consumer surplus from the time generics may enter
the market (after incumbent’s patent expires) until the innovator’s patent expires, µ is the
intercept of the demand curve,
gCS∆
cP0 is the competitive price in the market using the ‘old’
technology, mP1 is the monopoly price when the incumbent uses the ‘new’ technology, mQ1 is the
quantity supplied at that price, and the notation for t and r is the same as in (15).
Under the assumptions made, it is straightforward to see that the innovator accepts a
buyout, only if the offer price is at least as high as his/her profit under Cournot and Stackelberg
plus the expected profits after the potential entry of generic competition.
Now we can calculate the ‘Buyout’ price of this strategy at time 0, which is equal to
( ) gtit
tB r
P Π++
Π=∑
= 1
6
1 (17)
where is the buyout price, is the potential annual profit of the innovator under Cournot or
Stackelberg (i = Cournot, Stackelberg), t denotes each year from the time the innovator may
potentially enter as a Cournot or Stackelberg competitor until the time when generics may enter
the market, r is the interest rate, and
BP iΠ
gΠ is the same as in equation (15).
10 The interest rate is assumed to be 5 percent.
12
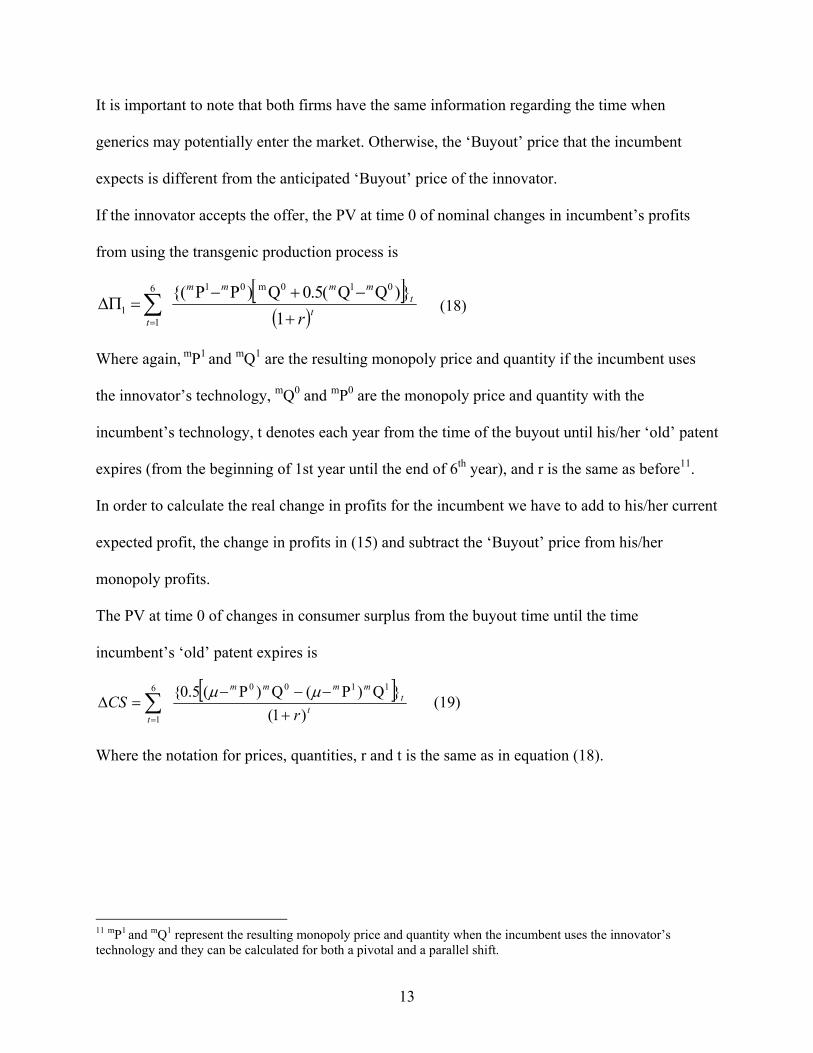
It is important to note that both firms have the same information regarding the time when
generics may potentially enter the market. Otherwise, the ‘Buyout’ price that the incumbent
expects is different from the anticipated ‘Buyout’ price of the innovator.
If the innovator accepts the offer, the PV at time 0 of nominal changes in incumbent’s profits
from using the transgenic production process is
[ ]( )t
tmmmm
t r+−+−
=∆Π ∑= 1
})QQ(5.0Q)PP{( 010m016
11 (18)
Where again, mP1 and mQ1 are the resulting monopoly price and quantity if the incumbent uses
the innovator’s technology, mQ0 and mP0 are the monopoly price and quantity with the
incumbent’s technology, t denotes each year from the time of the buyout until his/her ‘old’ patent
expires (from the beginning of 1st year until the end of 6th year), and r is the same as before11.
In order to calculate the real change in profits for the incumbent we have to add to his/her current
expected profit, the change in profits in (15) and subtract the ‘Buyout’ price from his/her
monopoly profits.
The PV at time 0 of changes in consumer surplus from the buyout time until the time
incumbent’s ‘old’ patent expires is
[ ]t
tmmmm
t rCS
)1(}Q)P(Q)P(5.0{ 11006
1 +−−−
=∆ ∑=
µµ (19)
Where the notation for prices, quantities, r and t is the same as in equation (18).
11 mP1 and mQ1 represent the resulting monopoly price and quantity when the incumbent uses the innovator’s technology and they can be calculated for both a pivotal and a parallel shift.
13

Protein Production Process, Unit Cost Reductions and Other Model Data
Comparison of the unit cost of Glucocerebrosidase Enzyme from CHO and
Glucocerebrosidase Enzyme from transgenic tobacco provide a typical example of the relative
costs of cell culture and transgenic plants as systems for protein production. Production of
proteins from transgenic plants is similar to the production of proteins from bioreactors using cell
cultures. The later is a well-established method of protein production in the
biotechnology/pharmaceutical industry. The process of protein production from cells consists of
two parts, upstream and downstream processing. During upstream processing the proteins are
produced in genetically engineered cells that express the desired proteins. Downstream
processing isolates and purifies the proteins.
Upstream cell culture processing methods use bioreactors and suspension cells.
Bioreactors are large containers made of stainless steel, glass or plastic and suspension cells are
grown in them (Wallman, 1997). These cells are genetically engineered to express the human
proteins and they produce numerous copies of themselves in bioreactors. When the cells in
bioreactors reproduce enough copies and reach maturity, they are removed from the bioreactors
and they undergo centrifugation and/or filtration to separate the cells from the media (Wallman,
1997). Centrifugation and filtration can be considered as parts of upstream processing. So far,
bacterial, animal and fungal cells are grown in bioreactors.
Transgenic plants aim to replace the upstream process by containing the desired proteins
in their cells. The economic advantage that transgenic plants can offer is that the expression of
proteins in their cells requires less capital than building bioreactors for cell cultures and also the
supply can be very flexible. In some cases, the demand for proteins coming from bioreactors can
not fulfill the demand in the market. Such is the case of EnbrelR a biotech drug manufactured by
14

Immunex. The drug was produced in bioreactors but the company did not have enough
production capacity in its facilities to meet the market demand in 2002 (Biotech.org, 2004).
Increasing production capacity requires a considerable amount of investment (more than $50
million for a bioreactor plant) and time (at least 5 years). Using transgenic plants for protein
production on the other hand is less expensive and production capacity can be extended by
simply planting more acres.
Downstream processing includes further filtration and purification using
chromatography. As Millan et al. (2003) note, traditional purification of pharmaceuticals using
chromatography accounts for 30% of the production costs (Millan et al., 2003). In general, the
downstream process of purifying proteins from bioreactors and cell cultures and purifying
proteins from transgenic plants are basically the same. However, minor differences occur as a
result of the storage place of protein in the cell and also the actual form of the protein.
Transgenic plant systems production costs are greatly influenced by expression levels and
protein recovery12. Glucocerebrosidase Enzyme was successfully produced in transgenic tobacco
by CropTech (Blacksburg, VA) and it was enzymatically active (Cramer et al., 1999). CropTech,
however did not manage to continue research and enter clinical trials because it went out of
business in 2003, after facing financial difficulties. Crop Tech’s estimates indicated that 1 mg of
crude Glucocerebrosidase Enzyme can be produced from 1 g of fresh weight of tobacco leaf
tissue (Cramer et al, 1999). Assuming a 40 percent recovery in order to achieve a pure product,
and 40 metric tons of tobacco per acre (based on multiple cuttings), less than one acre of
transgenic tobacco will be sufficient to produce the amount of the Glucocerebrosidase Enzyme
that Genzyme is producing.
12 Expression level refers to the amount of desired protein in a cell. Protein recovery refers to the amount of the desired protein in pure form obtained at the end of purification compared to the initial amount of the protein in the cell (as there are significant losses during the purification process).
15

Unit Cost Reductions
Economic analysis on the production of therapeutic proteins from transgenic plants has
been limited to date, largely because there is no drug of transgenic plant origin currently in the
market. Consequently, there is no commercial size processing of transgenic plants to generate
accurate data on the economic benefits of bio-pharming. Nevertheless, scientific techniques have
been used to estimate production costs of proteins from transgenic plants. Kusnadi, Howard, and
Nikolov (1997) followed by Evangelista et al. (1998) were the first to calculate large scale
production costs of proteins from transgenic plants compared to cell culture systems. Other
studies followed, with Misson and Curling (2000) examining the major steps in the production
system that have the most significant impact on differential production costs. The results lead to
some important conclusions. First, the cost savings with transgenic plant systems are realized
during the upstream process, while costs during the downstream process are similar because the
same techniques are used. Second, the unit cost reduction in the upstream process is primarily
due to capital cost savings. In transgenic plants, capital costs can be more than 95 percent lower
than those in cell culture systems. Capital costs for cell culture systems can constitute 20 to 30
percent or more of protein production costs, but they depend on the size of the operation. For
outputs of more than 10 tons of protein per year for example, production costs from transgenic
plants compared to cell culture systems can be up to 10 times cheaper. Based on these factors,
for output levels of 50 kg/year unit cost reductions can range from 25 to 28 percent (Glacken,
2000) and 20 to 40 percent (Watler, 2002).
Since annual production of Glucocerebrosidase Enzyme is 6 kg per year, and the plant-
derived product is not produced commercially, there is some uncertainty about the exact unit cost
reduction. But, being under the 50 kg/year range, the unit cost reductions simulated in this study
16

are assumed to range from a minimum of 10 percent up to a maximum of 40 percent with a most
likely value of 25 percent of the original production cost.
Market Data
Estimates of the elasticity of supply of Cerezyme or similar products could not be found
in the literature. Nevertheless, considering that Genzyme is currently the only provider of a
treatment for Gaucher’s disease, information on prices and quantities for a period of time may
help to shed some light on the nature of the supply curve. Cerezyme prices, quantities, and
changes in price and quantity for the last five years are shown in table 3 below. The initial price
(mP0) of Cerezyme in the analysis was considered $740 per 200 unit vial since the price has not
changed for the last decade. The initial quantity (mQ0) was considered to be equal to the quantity
for the year 2003. Because the quantity has been constantly increasing, taking an average for
recent years would likely underestimate the ex-ante benefits of the transgenic product13.
Table 3. Cerezyme Price and Quantity sold for the period 1999 -2003.
Year
Sales of Cerezyme (millions)
Quantity of Cerezyme
(number of 200 unit vials sold)
Percentage change in quantity
Price of Cerezyme
($/200 unit vial)
Percentage change in
price 1999 479 647,297 - 740 0 2000 537 725,676 12 740 0 2001 570 770,270 6 740 0 2002 620 837,838 9 740 0 2003 734 991,892 18 740 0 Note: Prices represent the direct prices charged from the company for the 200 unit vial and sales of Cerezyme are the revenues of Genzyme for each year from charging the direct price.
The upward trend in the quantity of Cerezyme produced also suggests that Genzyme has the
necessary production capacity to meet demand. Further, the direct price that Genzyme charges
13 Our analysis on the 12 year period may still underestimate the ‘Buyout’ price because we are assuming constant number of cases of Gaucher’s Disease.
17
for Cerezyme has not changed for a period of ten years, from 1994 to 2004. The flexibility of
supply and excess capacity suggests that the supply of Cerezyme is elastic and for the purpose of
the study, the elasticity of supply is considered to be in the range of 1.5 to 2.5, with a most likely
value of 2.0.
Demand on the other hand seems to be inelastic since a very limited number of people are
carriers of the Gaucher’s disease and only a few persons are diagnosed each year. Regular
Cerezyme treatment for patients that are already diagnosed can successfully control and reverse
severe conditions from the disease (spleen and liver enlargement, bone disease, anemia).
However, microeconomic theory suggests that a monopolist maximizing his/her profits will
never operate in the inelastic portion of the demand curve. Consequently, elasticities of total
demand between -1.001 and -1.5 are considered in the analysis, with -1.25 considered the most
likely value.
Results
Changes in incumbent’s profits (∆Π), changes in innovator’s profits and the change in
consumer surplus under Cournot and Stackelberg are reported in table 4 assuming a minimum
(10 percent), most likely (25 percent) and maximum (40 percent) unit cost reduction and most
likely values of elasticity of demand (-1.25) and supply (2.0). For consistency, all the results are
presented as present values for a period of 12 years for both parallel and pivotal marginal cost
shifts. The estimated ‘Buyout’ price along with the changes in incumbent’s profits (∆Π), and
consumer surplus changes for each unit cost reduction are reported in table 5.
The primary purpose of including the Cournot and Stackelberg models is to calculate a
‘Buyout’ price for the innovator. In fact, changes in innovator’s profits under the duopoly models
18
in table 4 are the same as the ‘Buyout’ price reported in table 5. But the results are interesting on
their own, as potential market conditions if the innovator decides to enter the market and
compete. Under this scenario consumers gain the most from the innovation regardless of the
strategy of imperfect competition. A 25 percent unit cost reduction with a parallel shift generates
an increase in consumer surplus of $4.2 and $4.8 billion under Cournot and Stackelberg,
respectively. Changes in consumer surplus are larger under Stackelberg compared to Cournot for
both types of shifts, and slightly larger under a pivotal shift compared to a parallel shift. Results
also indicate that innovator’s profits increase and incumbent’s profits decrease as the unit cost
reduction increases for both a parallel and a pivotal marginal cost shift14. Due to the first mover’s
advantage of the innovator under Stackelberg, his/her profits (‘Buyout’ price) are slightly larger
under Stackelberg compared to the profits under Cournot for both a parallel and a pivotal shift.
Consequently, incumbent’s profits decrease by more under Stackelberg compared to Cournot.
For example, a 25 percent unit cost reduction with a parallel shift generates a profit of $1.77
billion for the innovator under Stackelberg and $1.72 billion under Cournot. Incumbent’s profits
decrease by $2.1 billion and $1.64 billion under Stackelberg and Cournot, respectively. A pivotal
shift results in slightly larger profits for the innovator and slightly larger decreases in
incumbent’s profits when compared to a parallel shift.
14 The incumbent still makes profits but these profits are less than the profits when he/she was a monopoly in the Cerezyme market. Base level of incumbent with no innovator is the monopoly profit of $2.980 billion.
19

Table 4. Estimated surplus changes from minimum, most likely and maximum expected unit
cost reduction under Cournot and Stackelberg (PV, in thousand U.S.D)
Parallel Shift Unit cost reduction (%MC) 10 25 40 Cournot ∆Π Incumbent (1,616,664) (1,638,083) (1,659,335) ∆Π Innovator (Buyout Price) 1,513,986 1,718,357 1,923,490 ∆ CS 4,137,922 4,162,372 4,186,923 Stackelberg ∆Π Incumbent (2,085,977) (2,110,153) (2,133,999) ∆Π Innovator (Buyout Price) 1,561,840 1,767,800 1,974,556 ∆ CS 4,757,355 4,795,163 4,833,185
Pivotal Shift Cournot ∆Π Incumbent (1,617,410) (1,640,606) (1,664,431) ∆Π Innovator (Buyout Price) 1,515,601 1,723,946 1,935,078 ∆ CS 4,138,770 4,165,265 4,192,856 Stackelberg ∆Π Incumbent (2,093,708) (2,130,623) (2,168,600)
∆Π Innovator (Buyout Price) 1,577,164 1,809,959 2,048,682 ∆ CS 4,769,364 4,827,759 4,889,713
Note: Results in parenthesis indicate negative changes in profits.
Since the ‘Buyout’ price in table 5 under Cournot and Stackelberg is the same as the
innovator’s profits in table 4, the main focus of table 5 is on the changes of incumbent’s profits
and consumer surplus. Again, consumers are the main beneficiaries from the innovation, but
consumers gain significantly less from the buyout compared to the gains generated if the
innovator enters the market (table 4). For example a 25 unit cost reduction with a parallel shift
generates $2.94 billion in consumer surplus in the buyout case and $4.16 and $4.80 billion in
consumer surplus if the innovator enters as a Cournot and Stackelberg competitor, respectively.
With a buyout, the incumbent keeps his monopoly position in the market and charges the profit
maximizing price using the innovator’s technology. As a result, incumbent’s profits decrease by
less with a buyout than in the case when the innovator enters the market and competes (table 4).
The buyout, with a 25 percent unit cost reduction and a parallel shift now generates reductions of
only $1.28 and $1.33 billion in incumbent’s profits under Cournot and Stackelberg, respectively.
20
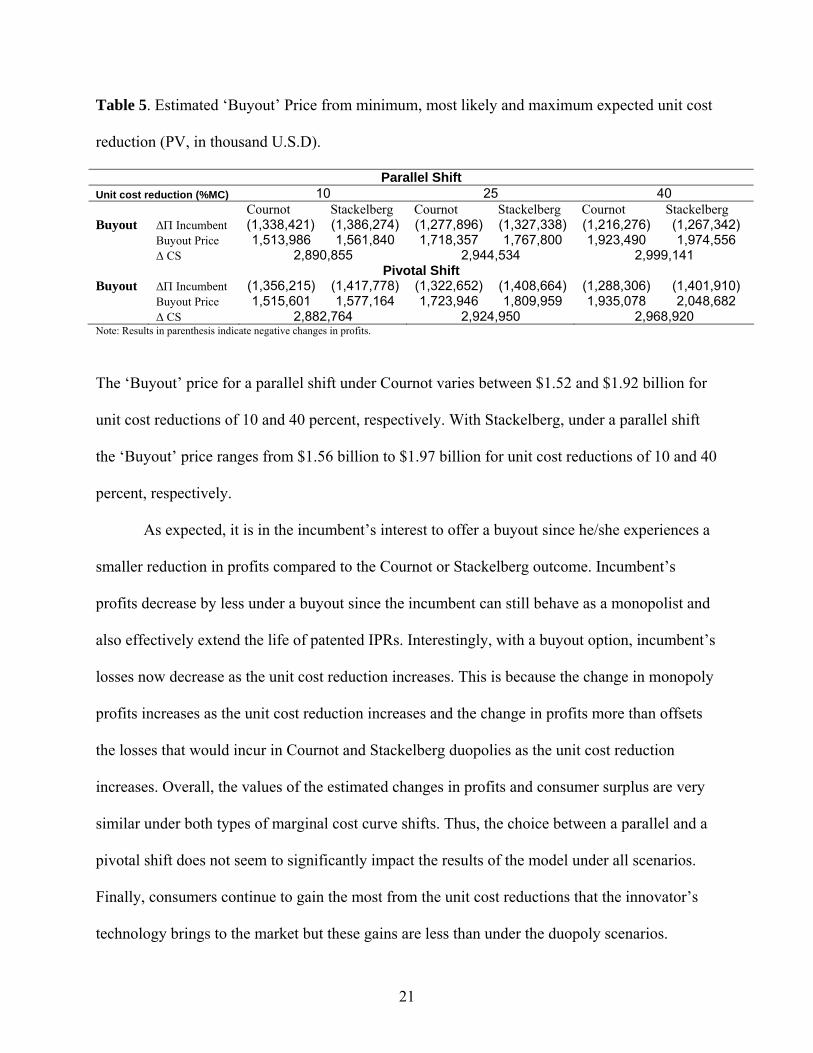
Table 5. Estimated ‘Buyout’ Price from minimum, most likely and maximum expected unit cost
reduction (PV, in thousand U.S.D).
Parallel Shift Unit cost reduction (%MC) 10 25 40 Cournot Stackelberg Cournot Stackelberg Cournot Stackelberg Buyout ∆Π Incumbent (1,338,421) (1,386,274) (1,277,896) (1,327,338) (1,216,276) (1,267,342) Buyout Price 1,513,986 1,561,840 1,718,357 1,767,800 1,923,490 1,974,556 ∆ CS 2,890,855 2,944,534 2,999,141
Pivotal Shift Buyout ∆Π Incumbent (1,356,215) (1,417,778) (1,322,652) (1,408,664) (1,288,306) (1,401,910) Buyout Price 1,515,601 1,577,164 1,723,946 1,809,959 1,935,078 2,048,682 ∆ CS 2,882,764 2,924,950 2,968,920 Note: Results in parenthesis indicate negative changes in profits.
The ‘Buyout’ price for a parallel shift under Cournot varies between $1.52 and $1.92 billion for
unit cost reductions of 10 and 40 percent, respectively. With Stackelberg, under a parallel shift
the ‘Buyout’ price ranges from $1.56 billion to $1.97 billion for unit cost reductions of 10 and 40
percent, respectively.
As expected, it is in the incumbent’s interest to offer a buyout since he/she experiences a
smaller reduction in profits compared to the Cournot or Stackelberg outcome. Incumbent’s
profits decrease by less under a buyout since the incumbent can still behave as a monopolist and
also effectively extend the life of patented IPRs. Interestingly, with a buyout option, incumbent’s
losses now decrease as the unit cost reduction increases. This is because the change in monopoly
profits increases as the unit cost reduction increases and the change in profits more than offsets
the losses that would incur in Cournot and Stackelberg duopolies as the unit cost reduction
increases. Overall, the values of the estimated changes in profits and consumer surplus are very
similar under both types of marginal cost curve shifts. Thus, the choice between a parallel and a
pivotal shift does not seem to significantly impact the results of the model under all scenarios.
Finally, consumers continue to gain the most from the unit cost reductions that the innovator’s
technology brings to the market but these gains are less than under the duopoly scenarios.
21

Summary and Conclusion
This study analyzes the potential distribution of economic gains from a buyout, which is
the most common market strategy of small biotech firms with innovations protected by IPR laws.
The economics of a buyout strategy are explored for the specific case of a small biotech firm
successfully adopting bio-pharming methods to produce Glucocerebrosidase Enzyme from
transgenic tobacco. Results confirm economic benefits to both innovating and incumbent firms
from consolidation rather than competing. However, consumers lose from consolidation of
market power through a buyout. Results suggest that the optimal ‘Buyout’ price will be about
$1.75 billion, indicating that potential profits are very large and capable of spurring significant
innovations in bio-pharming for therapeutic protein production. Unfortunately, despite large
profits and consumer gains, the innovation is unlikely to impact tobacco farmers since one acre
of transgenic tobacco can fulfill all the demand for the product.
22

References
Alpert, B. “Ripe for the Picking- Little Biotech Firms are Catching the Eye of Big Pharma. Juicy
Stocks?” Baron’s Online. April 14, 2004. http://online.barrons.com/ (Accessed May
2005).
Alston, J.M., G. W. Norton, and PG. Pardey, Science Under Scarcity: Principles and Practice
for Agricultural Research Evaluation and Priority Setting. Ithaca, NY: Cornell
University Press, 1995.
Alston, J.M., R.J. Sexton, and M. Zhang, “The Effects of Imperfect Competition on the Size and
Distribution of Research Benefits.” American Journal of Agricultural Economics
79(November1997): 1252-1265.
Bungay, H. R., BASIC Biochemical Engineering, BiLine Associates, Troy, NY, 1993
Cramer, C. L., D. L. Weissenborn, K. K. Oishi, E. A. Grabau, S. Bennett, E. Ponce, G. A.
Grabowski, D. A. Radin. “Bioproduction of Human Enzymes in Transgenic Tobacco”.
Annals of the New York Academy of Sciences, 792. New York Academy of Sciences., pp.
62 - 72. New York, 1996.
Davis, M. and O. Chambers. “Molecular Farming: Using Biotechnology in Agriculture for
the Sustainable Production of New Materials”. BREI-5. The Tobacco and Health
Research Institute. University of Kentucky. 2000.
Evangelista R. L., A. R. Kusnadi, J. A. Howard and Z. L. Nikolov. “ Process and
Economic Evaluation of the Extraction and Purification of Recombinant
β-glucuronidase from Transgenic Corn”. Biotechnology Progress. 14(1998):
607-614.
23

Falk-Zepeda, J.B., G. Traxler, and R.G. Nelson, “Surplus Distribution from the Introduction of
Biotechnology Innovation.” American Journal of Agricultural Economics 82 (May
2000): 360-369.
Giddings, G., G. Allison, D. Brooks and A. Carter. “Trangenic Plants as Factories for
Biopharmaceuticals. Nature Biotechnology 18(November 2000):1151-1155.
Gillis, J. “Ernst & Young Release Global Biotech Report at BIO 2002”. Pharmahorizons.com.
2002. http://www.pharmahorizons.com/ErnstYoung.asp. (Accessed May 2005).
Genzyme Corporation. Annual Report 2003. Genzyme.com.
Glacken, M. W. “Plant Transgenics vs. Animal Transgenics vs. CHO Bioreactor Culture:
An Objective Comparison for Monoclonal Antibody Production”. Presentation in San
Diego, California at the IBC’s 8th Conference Antibody Production and Downstream
Processing. February 2002.
Goozner, Merill. “The Price Isn’t Right”. The American Prospect 11 (September 2000).
Hiatt A., R. Cafferkey and K. Bowdish. “Production of Antibodies in Transgenic Plants.”
Nature 342(1989):76-78.
Kostandini, G., G. W. Norton and B. F. Mills. Potential Impacts of Pharmaceutical Uses of
Transgenic Tobacco: The Case of Human Serum Albumin”. Paper presented at the
Annual Meeting of the American Agricultural Economics Association, Denver, Colorado,
August 1-4, 2004.
Kusnadi, A., Z. L. Nikolov and J. A. Howard. “Production of Recombinant Proteins in
Transgenic Plants: Practical Considerations”. Biotechnology & Bioengineering 56 (1997)
: 473-484.
Marketing Research Bureau, Inc. Orange, Connecticut, USA. 2004. Personal Communication.
McGrath, P. “Molecular Pharming-Tobacco’s Future”. Feature article for Tobacco Journal
24

International (2002)l. http://www.molecularfarming.com/tobacco.html. (Accessed July
2004).
Millan, F. A, A. Mingo-Castel, M. Michael and H. Daniell “A Chloroplast Transgenic Approach
to Hyper-express and Purify Human Serum Albumin, a Protein Highly Susceptible to
Proteolytic Degradation.” Plant Biotechnology Journal 1(2003): 71-79.
Mison, D., J. Curling. “The Industrial Production Costs of Recombinant Therapeutic
Proteins Expressed in Transgenic Corn”. BioPharm 13 (2000): 48-54.
Moschini, G., and H. Lapan, “Intellectual Property Rights and the Welfare Effects of
Agricultural R&D” American Journal of Agricultural Economics, 79 (1997):
1229-42.
Nevitt, J., G. Norton, B. Mills, M. E. Jones, M. Ellerbrock, D. Reaves, K. Tiller and
G. Bullen. “Participatory Assesment of Social and Economic Effects of Using
Transgenic Tobacco to Produce Pharmaceuticals”. Working Paper. Department
of Agricultural and Applied Economics. Virginia Tech, Blacksburg. April 2003.
Qaim, M. “Bt Cotton in India: Field Trial Results and Economic Projections”. World
Development 31 (2003): 2115-27.
Rader, R. A. “Biopharma: Biopharmaceutical Products in the US Market”. 2nd edition.
Biotechnology Information Institute, Rockville, Maryland. July 2003.
Rose, R. N. “ Supply shifts and Research Benefits: A Comment.” American Journal of
Agricultural Economic, 4 (1980):834-44.
San Mateo County Times, California. “Cultivating Cures – The biotech Industry Turns to
Plant-Bred Drugs”. San Mateo County Times, California, April 24, 2004.
http://www.thecampaign.org/News/april04p.php. (Accessed July 2004).
25

Smith, M. D., B. R. Glick. “The Production of Antibodies in Plants: An Idea Whose Time
has Come?”. Biotechnology Advances 18(2000): 85-89.
Stoger, E., M. Sack, R. Fischer and P. Christou. “Plantibodies: Applications, Advantages and Bottlenecks”. Current Opinion in Biotechnology 13 (2002):161-166. Staub, J.M., B. Garcia, J. Graves, P. T. J. Hajukiewicz, P. Hunter, N. Nehra, V. Paradkar,
M. Schlittler, J. A. Caroll, L. Spatola, D. Ward, G. Ye and D. A. Russell. “High-yield
Production of a Human Therapeutic Protein in Tobacco Chloroplasts”. Nature
Biotechnology 18(March 2000); 333-38.
Varian, H. R. “Microeconomic Analysis”. 3rd edition. W.W. Norton & Company, Inc., New
York, 1992.
Wallman, S. “Principles of upstream processing”.
http://biotech.nhctc.edu/BT220/Section_1_6_0.html. (Accessed July 2004).
Wallman, S. “ Principles of downstream processing”.
http://biotech.nhctc.edu/BT220/Section_1_7_0.html. (Accessed July 2004).
Walter, P. K. “Processing Design & Economics for Large Scale Monoclonal Antibody
Manufacturing”. Presentation in San Diego, California at the IBC’s 8th Conference
Antibody Production and Downstream Processing. February 2002.
Wohlgenant, M. K. and C. M. Lemieux. “Ex Ante Evalutaion of the Economic Impact of
Agricultural Biotechnology: The Case of Porcine Sematrophin.” American Journal of
Agricultural Economics 74(1989): 903-14.
26
Related Documents