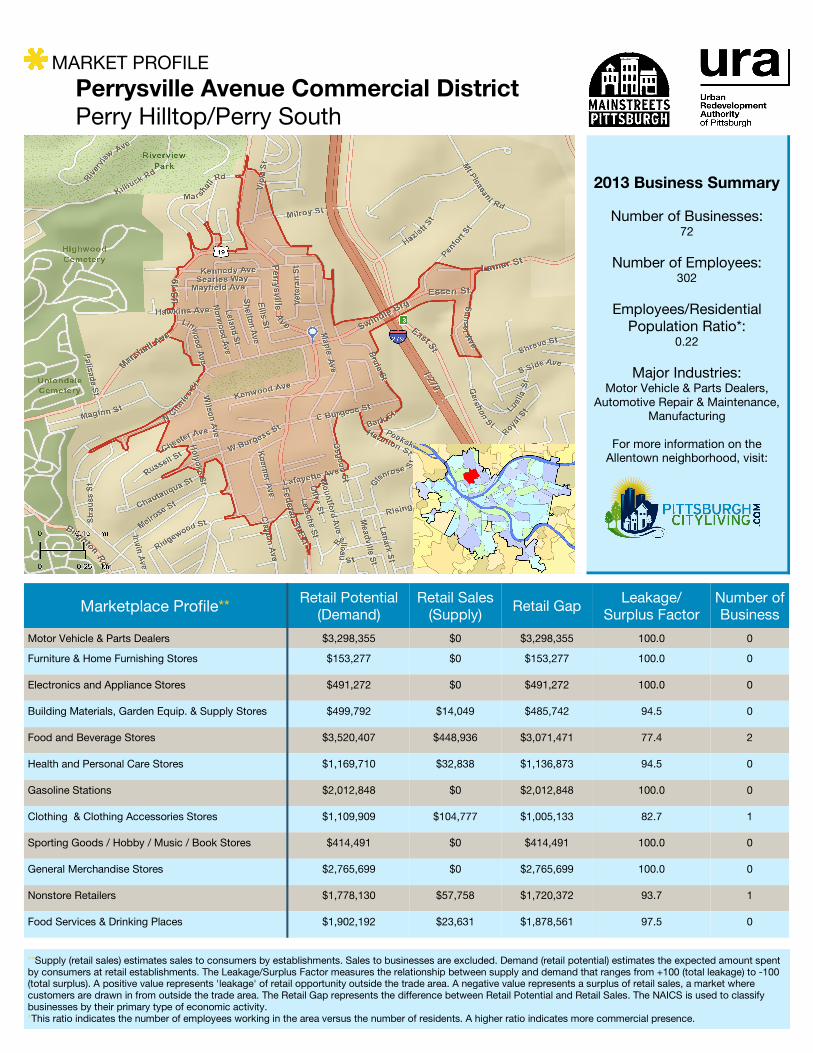
MARKET PROFILE Perrysville Avenue Commercial District Perry Hilltop/Perry South 2013 Business Summary Number of Businesses: 72 Number of Employees: 302 Employees/Residential Population Ratio*: 0.22 Major Industries: Motor Vehicle & Parts Dealers, Automotive Repair & Maintenance, Manufacturing For more information on the Allentown neighborhood, visit: Marketplace Profile** Retail Potential (Demand) Retail Sales (Supply) Retail Gap Leakage/ Surplus Factor Number of Business Motor Vehicle & Parts Dealers $3,298,355 $0 $3,298,355 100.0 0 Furniture & Home Furnishing Stores $153,277 $0 $153,277 100.0 0 Electronics and Appliance Stores $491,272 $0 $491,272 100.0 0 Building Materials, Garden Equip. & Supply Stores $499,792 $14,049 $485,742 94.5 0 Food and Beverage Stores $3,520,407 $448,936 $3,071,471 77.4 2 Health and Personal Care Stores $1,169,710 $32,838 $1,136,873 94.5 0 Gasoline Stations $2,012,848 $0 $2,012,848 100.0 0 Clothing & Clothing Accessories Stores $1,109,909 $104,777 $1,005,133 82.7 1 Sporting Goods / Hobby / Music / Book Stores $414,491 $0 $414,491 100.0 0 General Merchandise Stores $2,765,699 $0 $2,765,699 100.0 0 Nonstore Retailers $1,778,130 $57,758 $1,720,372 93.7 1 Food Services & Drinking Places $1,902,192 $23,631 $1,878,561 97.5 0 **Supply (retail sales) estimates sales to consumers by establishments. Sales to businesses are excluded. Demand (retail potential) estimates the expected amount spent by consumers at retail establishments. The Leakage/Surplus Factor measures the relationship between supply and demand that ranges from +100 (total leakage) to -100 (total surplus). A positive value represents 'leakage' of retail opportunity outside the trade area. A negative value represents a surplus of retail sales, a market where customers are drawn in from outside the trade area. The Retail Gap represents the difference between Retail Potential and Retail Sales. The NAICS is used to classify businesses by their primary type of economic activity. *This ratio indicates the number of employees working in the area versus the number of residents. A higher ratio indicates more commercial presence.

Welcome message from author
This document is posted to help you gain knowledge. Please leave a comment to let me know what you think about it! Share it to your friends and learn new things together.
Transcript
MARKET PROFILE
Perrysville Avenue Commercial District
Perry Hilltop/Perry South
2013 Business Summary
Number of Businesses: 72
Number of Employees: 302
Employees/Residential Population Ratio*:
0.22
Major Industries: Motor Vehicle & Parts Dealers,
Automotive Repair & Maintenance, Manufacturing
For more information on the Allentown neighborhood, visit:
Marketplace Profile** Retail Potential
(Demand) Retail Sales (Supply)
Retail Gap Leakage/
Surplus Factor Number of Business
Motor Vehicle & Parts Dealers $3,298,355 $0 $3,298,355 100.0 0
Furniture & Home Furnishing Stores $153,277 $0 $153,277 100.0 0
Electronics and Appliance Stores $491,272 $0 $491,272 100.0 0
Building Materials, Garden Equip. & Supply Stores $499,792 $14,049 $485,742 94.5 0
Food and Beverage Stores $3,520,407 $448,936 $3,071,471 77.4 2
Health and Personal Care Stores $1,169,710 $32,838 $1,136,873 94.5 0
Gasoline Stations $2,012,848 $0 $2,012,848 100.0 0
Clothing & Clothing Accessories Stores $1,109,909 $104,777 $1,005,133 82.7 1
Sporting Goods / Hobby / Music / Book Stores $414,491 $0 $414,491 100.0 0
General Merchandise Stores $2,765,699 $0 $2,765,699 100.0 0
Nonstore Retailers $1,778,130 $57,758 $1,720,372 93.7 1
Food Services & Drinking Places $1,902,192 $23,631 $1,878,561 97.5 0
**Supply (retail sales) estimates sales to consumers by establishments. Sales to businesses are excluded. Demand (retail potential) estimates the expected amount spent by consumers at retail establishments. The Leakage/Surplus Factor measures the relationship between supply and demand that ranges from +100 (total leakage) to -100 (total surplus). A positive value represents 'leakage' of retail opportunity outside the trade area. A negative value represents a surplus of retail sales, a market where customers are drawn in from outside the trade area. The Retail Gap represents the difference between Retail Potential and Retail Sales. The NAICS is used to classify businesses by their primary type of economic activity. *This ratio indicates the number of employees working in the area versus the number of residents. A higher ratio indicates more commercial presence.

Demographic Data 2010 2013 2017
(Projected)
Annual Rate of Change (2013-2017)
Population 2,680 2,675 2,670 -0.04%
Households 1,160 1,148 1,152 0.07%
Median Age 40.1 40.5 41.3 0.40%
Median Household Income $31,939 $27,294 $31145 2.82%
Average Household Income $43,877 $41,433 $49203 3.75%
Per Capita Income $17,585 $19,253 $22,892 3.78%
Total Housing Units 1,516 1,492 1,460 -0.43%
% Owner Occupied Units 34.8% 32.9% 34.5% 0.97%
% Renter Occupied Units 41.7% 44.0% 44.3% 0.14%
% Vacant Housing Units 23.5% 23.1% 21.1% -1.73%
Median Home Value $70,952 $82,138 $90,194 1.96%
% 0-9 12.2% 12.1% 12.0% -0.17%
% 10-14 7.1% 7.0% 7.0% 0.00%
% 15-24 14.1% 13.9% 12.9% -1.44%
% 45-54 14.7% 14.1% 12.9% -1.70%
% 35-44 10.4% 10.1% 9.9% -0.40%
% 25-34 11.4% 11.6% 11.6% 0.00%
% 55-64 13.1% 13.8% 14.4% 0.87%
% 65+ 16.9% 17.4% 19.2% 2.07%
Apparel and Services 43
Computers and Accessories 62
Education 65
Entertainment / Recreation 62
Spending Potential Index
Food at Home 66
Food away from Home 63
Health Care 62
Household Furnishing and Equipment 53
Investment 38
Miscellaneous 62
Shelter 62
Transportation 63
Travel 56
Total Expenditures 61
<$15,000 31.6%
$15,000—$24,999 19.7%
$25,000—$34,999 16.2%
$35,000—$49,999 12.0%
$50,000—$74,999 12.1%
$75,000—$99,999 4.2%
$100,000—$149,999 3.4%
$150,000+ 0.8%
Median Disposable Income $24,024
2013 Households by Disposable Income
No High School Diploma 17.6%
High School Diploma or Some College 63%
Associates Degree 5.4%
Bachelor’s Degree 9.4%
2013 Educational Attainment (Ages 25+)
Graduate or Professional Degree 4.7%
Note: Disposable income is after-tax household income.
Note: The Spending Potential Index is household-based, and
represents the asset value or amount spent for a product or
service relative to the national average of 100. Values higher
than 100 indicate spending above the national average, and
values lower than 100 indicate lower spending than the national
average.
Traffic Count Profile
Closest Cross-Street
Count
Perrysville Ave N Charles St 4,020
Swindell Brg Hackney St 3,859
Hazlett St Vantassel St 115,713
Swindell Brg Magurie St 2,319
Marshall Ave Danbury St 5,864
I-279 Rostock St 114,740
I-279 Creek St 115,713
East St Creek St 5,562
N Charles St Cross St 2,912
Williams Rd Spring Garden Ave
439
Note: This profile measures the number of vehicles which travel through streets nearest to commercial corridor epicenter on a daily basis. All counts from 2009 unless otherwise noted. *Year of count: 2009
Perrysville Avenue Commercial District

The lifestyle of these residents is reflected by their ages; younger people go to nightclubs and play musical instruments; seniors refinish furni-ture and go saltwater fishing. Community activities are also important to the latter; they join fraternal orders and veterans’ clubs. Simple Living households spend wisely on a restricted budget. They buy the essentials at discount stores and occasionally treat themselves to dinner out and a movie. Cable TV is a must for these frequent viewers of family programs, news programs, and game shows. They are big fans of day-time TV. Owning a personal computer, cell phone, or DVD player isn’t important.
Social Security Set (26.5%)
Limited resources somewhat restrict the activities and purchases of residents in Social Security Set neighborhoods. They shop at discount stores but prefer grocery stores close to home. Many depend on Medicare or Medicaid to pay their health care costs. They bank in person and pay cash when they shop. Many purchase renter’s insurance. Most households subscribe to cable television; residents enjoy their day-time and prime time TV. They watch game shows, a variety of sports, and entertainment news shows. This high viewership provides an easy way to reach these residents. Avid newspaper readers, many will read two or more to stay current on sports and the news.
Simple Living (31.5%)
Metro City Edge (15.7%)
Metro City Edge residents must spend their money wisely to ensure the welfare of their children. They tend to shop for groceries at Piggly Wiggly, Kroger, and Aldi but will go to superstores and wholesalers for bulk purchases of household and children’s items. Some will have their vehicles serviced at auto parts chains. They eat at fast-food or family-style restaurants such as Old Country Buffet or Ryan’s. They watch sitcoms, movies, news programs, courtroom shows, and sports such as pro-wrestling on TV. Accessing the Internet at home isn’t important. They go to the movies and professional football games and play basketball. They read music and baby magazines and listen to urban and contemporary hit radio.
Great Expectations (10.6%)
Great Expectations homeowners are not afraid to tackle smaller maintenance and remodeling projects, but they also enjoy a young and active lifestyle. They go out to dinner and to the movies. They do most of their grocery shopping at Wal-Mart Supercenters, Aldi, and Shop ’n Save. They throw Frisbees; play softball and pool; go canoeing; watch horror, science fiction, and drama films on DVD; and listen to country music, classic rock, and sports on the radio. They watch dramas, auto racing, and the evening news on TV. They occasionally eat at Arby’s and Dairy Queen. They shop at major discount and department stores. They rarely travel. Focused on starting their careers, they’re not investing for their retirement years.
Note: ESRI is an independent geographic information systems (GIS) corporation and is not affiliated with the Urban Redevelopment Author-ity of Pittsburgh. This analysis utilizes socioeconomic and marketing data to identify distinct segments of the population, map where they reside, and describe their socioeconomic qualities and consumer preferences. More information on tapestry segments and segment descriptions can be found at: http://www.esri.com/library/whitepapers/pdfs/community
ESRI Tapestry
Segmentation Area Profile
TAPESTRY SEGMENT DESCRIPTIONS
Neighborhood Quick Facts*
• 21st largest neighborhood in Pittsburgh
by area • 9th highest median HH income by
neighborhood • 3rd highest acreage of parks per capita
by neighborhood (55.4 acres per person)
* The Walk Score is a measure between 0 and 100 that measures the ease of accessing amenities and running errands by walking. For more information, see http://www.walkscore.com/
Perrysville Avenue Commercial District

Mural in Allentown
Photo Credit: John Altdorfer
Contacts
Urban Redevelopment Authority of Pittsburgh:
www.ura.org
All data from ESRI Business Analyst 2013 unless otherwise noted.
¹Data applies to neighborhood boundary and not study area. Source: PGHSNAP, Dept. of City Planning
For More Information:
For additional market value analysis data, contact Josette Fitzgibbons at [email protected]
Department of City Planning SNAP Neighborhood Data: http://www.pittsburghpa.gov/dcp/snap/
Pittsburgh Neighborhood Community Indicator Systems (PNCIS) ACS 2005-2009 Neighborhood Profiles:
http://www.ucsur.pitt.edu/neighborhood_reports_acs.php
Business District Programs
Perrysville Avenue Commercial District
The Pittsburgh Biz Buzz Small Grant Program
This program is designed to spur neighborhood business district revitalization using the 48x48x48 strategy of short and medium term achievable projects, determining what you can do in 48 hours, 48 days and 48 weeks. The program aims to bring newcomers into your neighborhood business district and create a “buzz” about your business district through media and word of mouth. For more information about applications and eligibility, visit: http://www.ura.org/business_owners/mainstreets.php
Façade Improvement Programs
Restored storefronts improve the pedestrian environment, attract more customers, and encourage economic development and investment. The URA offers several different façade improvement programs designed for commercial building owners and tenants to improve their storefronts. Your location determines your building’s façade improvement program eligibility. For more information about applications and eligibility, contact Quianna Wasler, a URA Mainstreets Development Specialist, at (412) 255-6550 or visit: http://www.ura.org/business_owners/facade_program.php
Mainstreets Program
This program strives to ensure the health of the City’s traditional neighborhood commercial districts using the National Main Street Center’s Four Point Approach which considers: economic restructuring, promotion, design and sustainability. Every $1 invested by Mainstreets Pittsburgh produces $31 in private investment for Pittsburgh neighborhoods. To learn more about this program, contact Josette Fitzgibbons at (412) 255-6686 or visit: http://www.ura.org/business_owners/mainstreets.php
Related Documents