ALTECH Environmental Consulting Ltd. Marbek Resource Consultlants 12 Banigan Drive, Toronto, M4H 1E9 300-222 Somerset St. W., Ottawa, ON K2P 2G3 Tel: (416) 467-5555 www.altech-group.com Tel: (613) 523-0784 www.marbek.ca Market Profile and Conservation Opportunity Assessment for Small and Medium-Sized Industry in Ontario Prepared for: Conservation Bureau (Ontario Power Authority) Prepared by: Altech Environmental Consulting In association with: Marbek Resource Consultants FINAL REPORT September 2006

Welcome message from author
This document is posted to help you gain knowledge. Please leave a comment to let me know what you think about it! Share it to your friends and learn new things together.
Transcript
ALTECH Environmental Consulting Ltd. Marbek Resource Consultlants 12 Banigan Drive, Toronto, M4H 1E9 300-222 Somerset St. W., Ottawa, ON K2P 2G3 Tel: (416) 467-5555 www.altech-group.com Tel: (613) 523-0784 www.marbek.ca
Market Profile and Conservation Opportunity Assessment
for Small and Medium-Sized Industry in Ontario
Prepared for: Conservation Bureau (Ontario Power Authority)
Prepared by: Altech Environmental Consulting
In association with:
Marbek Resource Consultants
FINAL REPORT
September 2006
TABLE OF CONTENTS
1. INTRODUCTION..............................................................................................................3 1.1 Study Context and Outcomes...................................................................................3 1.2 Report Presentation..................................................................................................3
2. STUDY SCOPE, APPROACH AND MODELLING PLATFORM .............................4 2.1 Study Scope .............................................................................................................4 2.2 Industrial Model Description ...................................................................................6
3. BASE YEAR PROFILE AND REFERENCE CASE.....................................................9 3.1 Basre Year Profile....................................................................................................9 3.2 Reference Case Forecast ........................................................................................13
4. ECONOMIC ASSESSMENT OF CDM MEASURES.................................................14 4.1 Methodology..........................................................................................................14 4.2 CDM Measures ......................................................................................................17 4.3 Results....................................................................................................................19
5. ECONOMIC POTENTIAL SCENARIO......................................................................21 5.1 Methodology..........................................................................................................21 5.2 Summary of Economic Potential Forecast – Energy Efficiency ...........................22 5.3 Sector Results.........................................................................................................25
6. ONTARIO SM INDUSTRY SITUATION ASSESSMENT AND PROGRAM CONCEPTS......................................................................................................................28 6.1 CDM Programming Targeted to the SM Industyr Sectors ....................................28
7. BEST PRACTICE CDM PROGRAMMING ...............................................................35 7.1 Underlying Strategic Elements ..............................................................................36 7.2 Keys to successful portfolio management .............................................................37 7.3 Other Programs ......................................................................................................38
8. AN ASSESSMENT OF BARRIERS IMPEDING CDM TAKE-UP...........................42 8.1 Some General Observations About Market Barriers .............................................42 8.2 LDC Managers Survey Results..............................................................................45
9. PROGRAM CONCEPTS................................................................................................47 9.1 Enabling Conditions for CDM in the SM Industry Markets..................................47 9.2 Program Concepts: LDC Survey ...........................................................................47 9.3 Program Concepts: Ontario SM Industry ..............................................................49
10. ACHIEVABLE POTENTIAL FORECAST .................................................................51 10.1 The Concept ...........................................................................................................51 10.2 The Achievable Potential Program Concepts ........................................................51 10.3 The Achievable Potential Assumptions .................................................................53 10.4 Results....................................................................................................................55 10.5 Observation, Uncertainties and Implications.........................................................62

APPENDIXES
APPENDIX A: ALLIANCES OF LOCAL DISTRIBUTION COMPANIES APPENDIX B: CALIFORNIA CDM PROGRAMS APPENDIX C: PROGRAM CONCEPTS FOR ONTARIO SM INDUSTRY

Market Profile &Conservation Opportunity Assessment for SMs –Final Report –
Altech Environmental Consulting/ Marbek Resource Consultants Page 3
1. INTRODUCTION 1.1 STUDY CONTEXT AND OUTCOMES Ontario is facing a significant electrical supply challenge over the next several years. The OPA reports 25,000 MW of supply is going out of service by 2025 and needs upgrading. Such an investment will likely require an estimated $70 billion. Looking ahead, Conservation and Demand Management (CDM) will play an important role in the province’s electricity supply mix. It is important, therefore, for the OPA to have a clear picture of where and how electricity is being used in the various sectors of the economy, as well as where the CDM opportunities lie. Small and medium sized industry (hereafter referred to as SM industry) is a key target market for CDM in Ontario. Consequently, the OPA Conservation Bureau identified the need for a market scan of this sector to profile how electricity is used, where the CDM opportunities are and what types of program concepts might help overcome market barriers and achieve significant CDM performance. The key study outcomes are: A baseline profile of SM industry electricity consumption by sub-sector and energy end-
use. An analysis of the economic performance of CDM technical measures suitable to the SM
industry sectors. A profile of current CDM program activities directed to the SM industry sector.
An assessment of the barriers that impede take-up of cost-effective CDM measures in SM
industry. Characterization of CDM program concepts suitable to the SM industry sectors.
An estimate of the economic and achievable potential for CDM in SM industry.
1.2 REPORT PRESENTATION Section 1 of the report provides the context and background of the project, while Section 2 defines the scope, approach and modeling platform used in the study. A baseline profile and a reference case were developed for the SM industry and are presented in Section 3. The economic assessment of CDM measures and economic potential are respectively analyses in Sections 4 and 5. An assessment of CDM program concepts currently implemented by utilities, including best practices and barriers are discussed in Sections 6, 7 and 8. Program concepts applicable to the SM industry in Ontario and the achievable potential forecast are presented in Sections 9 and 10.
Market Profile &Conservation Opportunity Assessment for SMs –Final Report –
Altech Environmental Consulting/ Marbek Resource Consultants Page 4
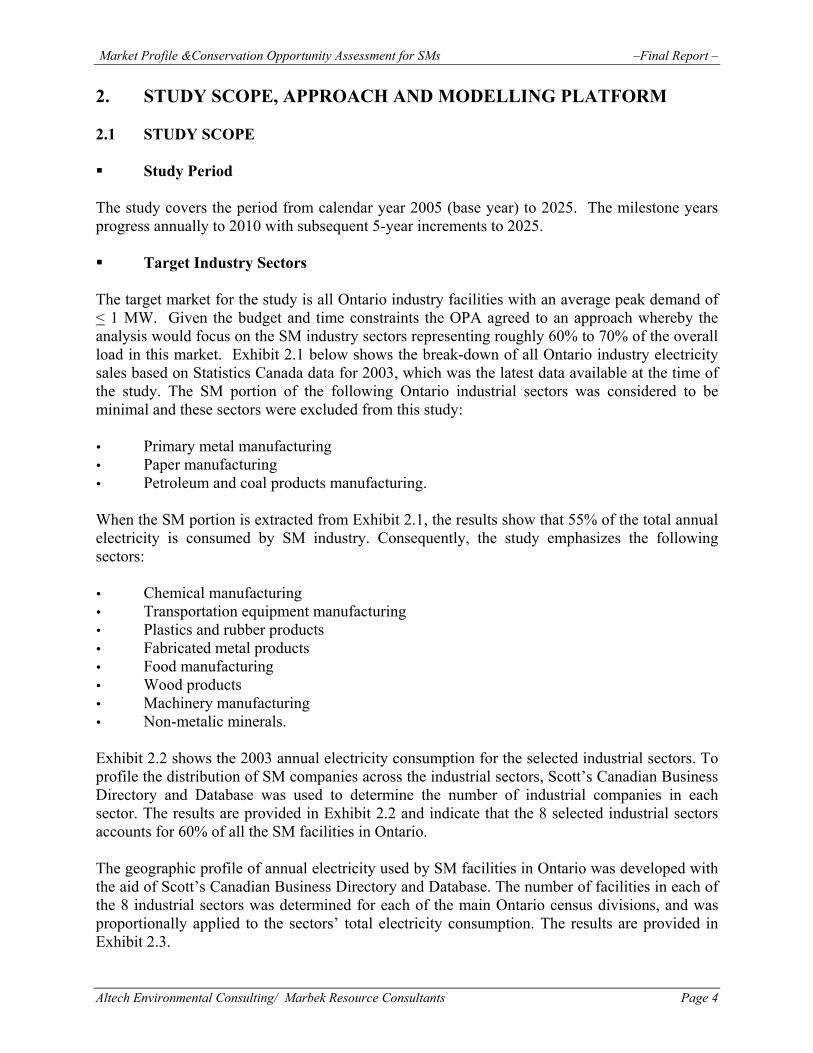
2. STUDY SCOPE, APPROACH AND MODELLING PLATFORM 2.1 STUDY SCOPE Study Period
The study covers the period from calendar year 2005 (base year) to 2025. The milestone years progress annually to 2010 with subsequent 5-year increments to 2025. Target Industry Sectors
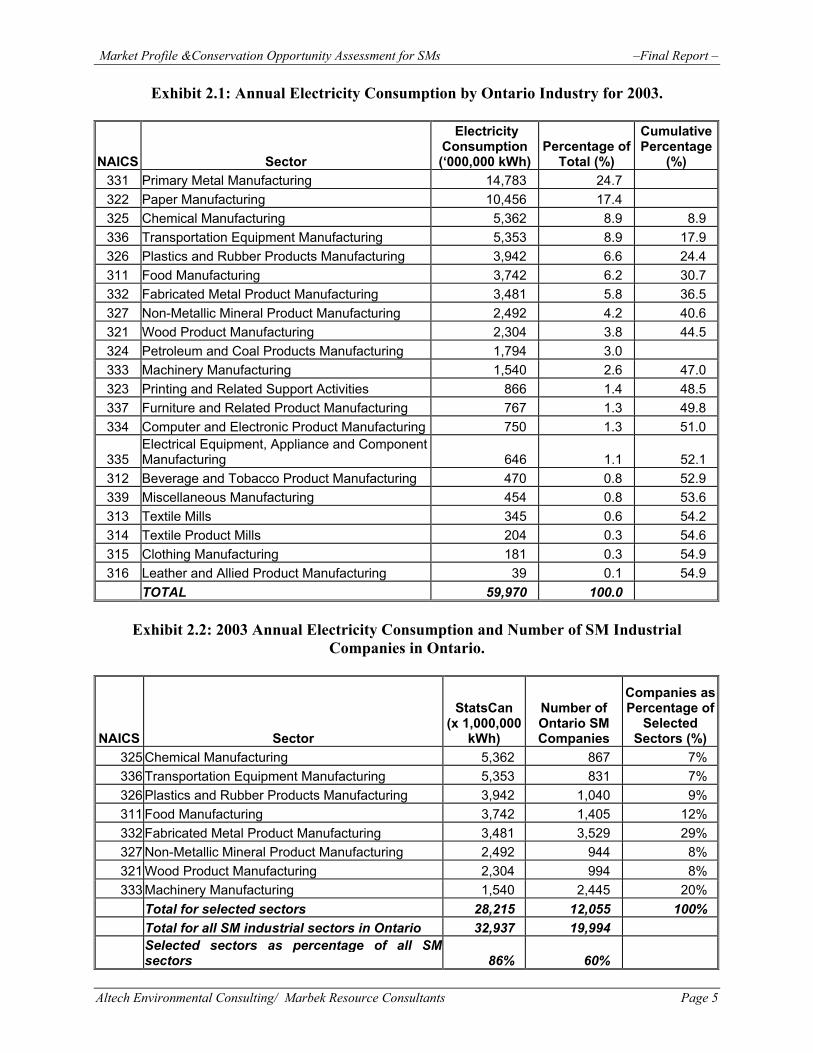
The target market for the study is all Ontario industry facilities with an average peak demand of < 1 MW. Given the budget and time constraints the OPA agreed to an approach whereby the analysis would focus on the SM industry sectors representing roughly 60% to 70% of the overall load in this market. Exhibit 2.1 below shows the break-down of all Ontario industry electricity sales based on Statistics Canada data for 2003, which was the latest data available at the time of the study. The SM portion of the following Ontario industrial sectors was considered to be minimal and these sectors were excluded from this study: Primary metal manufacturing Paper manufacturing Petroleum and coal products manufacturing.
When the SM portion is extracted from Exhibit 2.1, the results show that 55% of the total annual electricity is consumed by SM industry. Consequently, the study emphasizes the following sectors: Chemical manufacturing Transportation equipment manufacturing Plastics and rubber products Fabricated metal products Food manufacturing Wood products Machinery manufacturing Non-metalic minerals.
Exhibit 2.2 shows the 2003 annual electricity consumption for the selected industrial sectors. To profile the distribution of SM companies across the industrial sectors, Scott’s Canadian Business Directory and Database was used to determine the number of industrial companies in each sector. The results are provided in Exhibit 2.2 and indicate that the 8 selected industrial sectors accounts for 60% of all the SM facilities in Ontario. The geographic profile of annual electricity used by SM facilities in Ontario was developed with the aid of Scott’s Canadian Business Directory and Database. The number of facilities in each of the 8 industrial sectors was determined for each of the main Ontario census divisions, and was proportionally applied to the sectors’ total electricity consumption. The results are provided in Exhibit 2.3.
Market Profile &Conservation Opportunity Assessment for SMs –Final Report –
Altech Environmental Consulting/ Marbek Resource Consultants Page 5
Exhibit 2.1: Annual Electricity Consumption by Ontario Industry for 2003.
NAICS Sector
Electricity Consumption (‘000,000 kWh)
Percentage of Total (%)
Cumulative Percentage
(%) 331 Primary Metal Manufacturing 14,783 24.7 322 Paper Manufacturing 10,456 17.4 325 Chemical Manufacturing 5,362 8.9 8.9 336 Transportation Equipment Manufacturing 5,353 8.9 17.9 326 Plastics and Rubber Products Manufacturing 3,942 6.6 24.4 311 Food Manufacturing 3,742 6.2 30.7 332 Fabricated Metal Product Manufacturing 3,481 5.8 36.5 327 Non-Metallic Mineral Product Manufacturing 2,492 4.2 40.6 321 Wood Product Manufacturing 2,304 3.8 44.5 324 Petroleum and Coal Products Manufacturing 1,794 3.0 333 Machinery Manufacturing 1,540 2.6 47.0 323 Printing and Related Support Activities 866 1.4 48.5 337 Furniture and Related Product Manufacturing 767 1.3 49.8 334 Computer and Electronic Product Manufacturing 750 1.3 51.0
335 Electrical Equipment, Appliance and Component Manufacturing 646 1.1 52.1
312 Beverage and Tobacco Product Manufacturing 470 0.8 52.9 339 Miscellaneous Manufacturing 454 0.8 53.6 313 Textile Mills 345 0.6 54.2 314 Textile Product Mills 204 0.3 54.6 315 Clothing Manufacturing 181 0.3 54.9 316 Leather and Allied Product Manufacturing 39 0.1 54.9
TOTAL 59,970 100.0
Exhibit 2.2: 2003 Annual Electricity Consumption and Number of SM Industrial Companies in Ontario.
NAICS Sector
StatsCan (x 1,000,000
kWh)
Number of Ontario SM Companies
Companies asPercentage of
Selected Sectors (%)
325 Chemical Manufacturing 5,362 867 7% 336 Transportation Equipment Manufacturing 5,353 831 7% 326 Plastics and Rubber Products Manufacturing 3,942 1,040 9% 311 Food Manufacturing 3,742 1,405 12% 332 Fabricated Metal Product Manufacturing 3,481 3,529 29% 327 Non-Metallic Mineral Product Manufacturing 2,492 944 8% 321 Wood Product Manufacturing 2,304 994 8% 333 Machinery Manufacturing 1,540 2,445 20%
Total for selected sectors 28,215 12,055 100% Total for all SM industrial sectors in Ontario 32,937 19,994
Selected sectors as percentage of all SM sectors 86% 60%

Market Profile &Conservation Opportunity Assessment for SMs –Final Report –
Altech Environmental Consulting/ Marbek Resource Consultants Page 6
Exhibit 2.3: Geographic Profile of Annual Electricity Consumption SM Industrial
Companies in Ontario.
CDM Measures
The CDM measures assessed in the study refer to technical and operation and maintenance measures to improve energy efficiency and reduce peak demand for the major electricity end-uses in the SM industry sectors. CDM Program Concepts
The study examines the possible impacts of a suite of program concepts directed to the SM industry market. The program concepts are indicative only as the study scope does not include program design. 2.2 INDUSTRIAL MODEL DESCRIPTION Marbek’s customized spreadsheet model is the modelling platform for this study. The Industrial Energy Management Model (IEMM) enables clients to answer a wide variety of questions concerning the economic and market potentials for energy efficiency and fuel substitution in the industrial sector. The IEMM is capable of generating the following outputs: Economic and financial assessment of energy management measures, both operational
and capital, using various criteria: Total Resource Cost Test, simple and discounted
GTA58%
Central24%
East3%
Southwest13%
Northeast1%
Northwest1%
Market Profile &Conservation Opportunity Assessment for SMs –Final Report –
Altech Environmental Consulting/ Marbek Resource Consultants Page 7
payback and IRR. Baseline profile of energy use and electricity demand by sub-sector and energy end-use.
Reference Case (Business as Usual) Forecast of energy use.
Technical and economic potentials for energy management (energy efficiency, peak load
management, fuel substitution and cogeneration). Market, or achievable potential, based on policy instruments and program concepts.
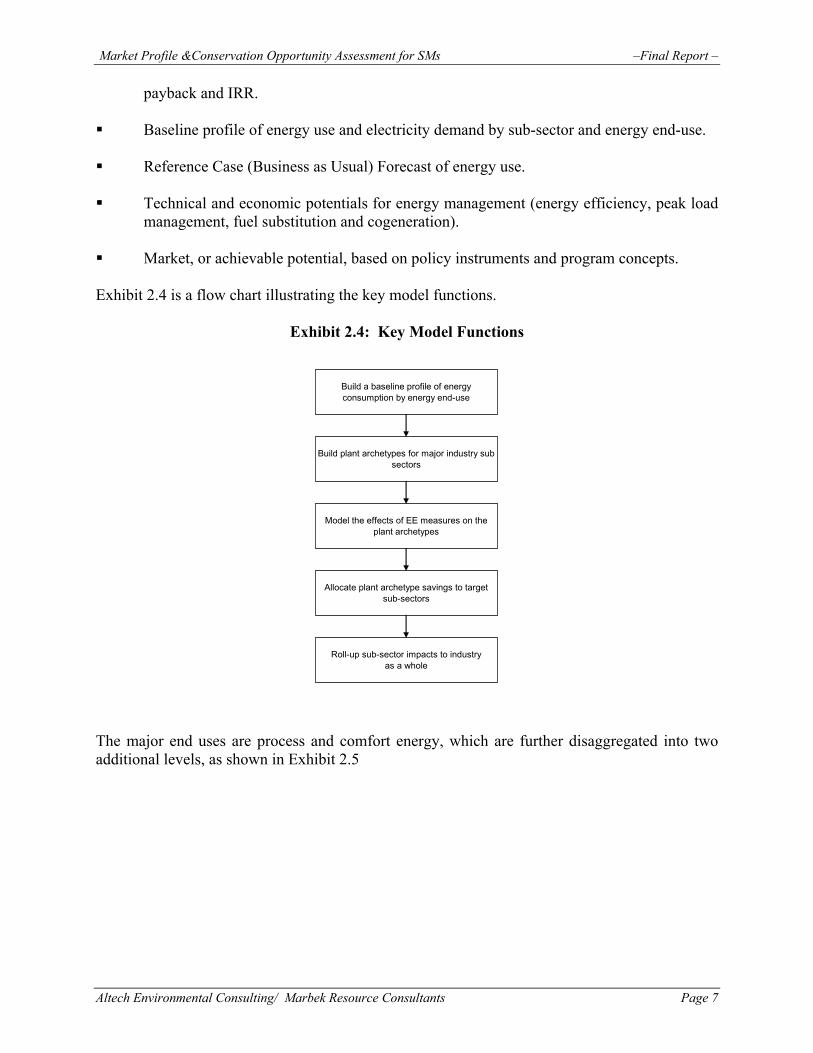
Exhibit 2.4 is a flow chart illustrating the key model functions.
Exhibit 2.4: Key Model Functions
Build a baseline profile of energy consumption by energy end-use
Build plant archetypes for major industry sub-sectors
Model the effects of EE measures on the plant archetypes
Allocate plant archetype savings to target sub-sectors
Roll-up sub-sector impacts to industry as a whole
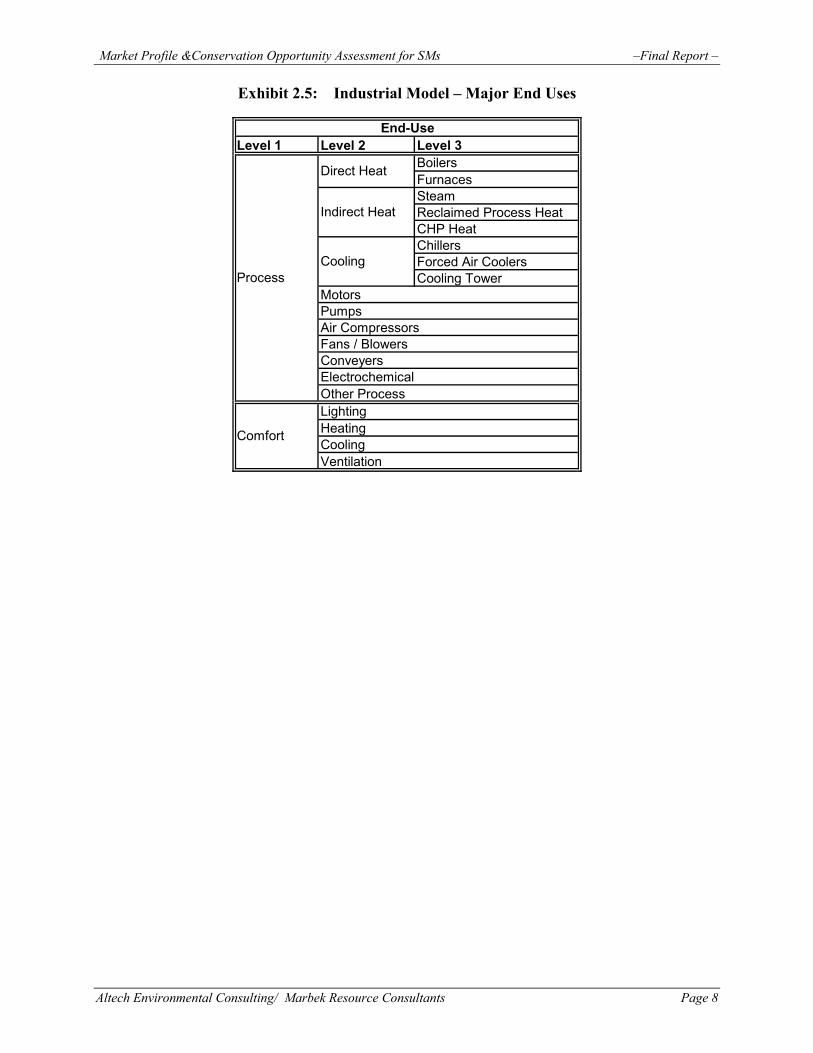
The major end uses are process and comfort energy, which are further disaggregated into two additional levels, as shown in Exhibit 2.5
Market Profile &Conservation Opportunity Assessment for SMs –Final Report –
Altech Environmental Consulting/ Marbek Resource Consultants Page 8
Exhibit 2.5: Industrial Model – Major End Uses
Level 1 Level 2 Level 3BoilersFurnacesSteamReclaimed Process HeatCHP HeatChillersForced Air CoolersCooling Tower
MotorsPumpsAir CompressorsFans / BlowersConveyersElectrochemicalOther ProcessLightingHeatingCoolingVentilation
Comfort
End-Use
Process
Direct Heat
Indirect Heat
Cooling
Market Profile &Conservation Opportunity Assessment for SMs –Final Report –
Altech Environmental Consulting/ Marbek Resource Consultants Page 9
3. BASE YEAR PROFILE AND REFERENCE CASE This section presents two main outputs: A profile of energy consumption in Ontario’s SM industrial sector in the base year of
2005. The Reference Case forecast of SM Industry electricity consumption to 2025.
3.1 BASE YEAR PROFILE The Base Year is the starting point for the analysis and, for this study, is calendar year 2005. The base year profile provides a detailed description of “where” and “how” energy is currently used in the Ontario SM industrial sector. The base year derivation comprises the following tasks. Build Plant Archetypes for EM Measure Application
In order to build a robust, defensible platform for the CDM potentials analysis it is necessary to establish a bottom-up, energy end-use profile of electricity use in the key SM industry sectors. The end-use profiles are established according to sector specific plant “archetypes”. The archetypical plant is a composite of energy use patterns, energy intensities and consumption levels within the particular target sub-sector (or a specific type of plant within a given sub-sector if there are substantial process differences).
Plant archetypes were developed for each of the 8 target sectors in SM industry. The archetypes were derived on the basis of two major information sources: i) consulting team in-house data and files and ii) secondary literature review. Compile actual base year utility data for electricity consumption
The energy end-use profile has to be calibrated to actual base year electricity consumption in the SM industry sectors. The preferred method is to obtain NAICS coded sales data from the utilities that can be sorted to the target SM industry sectors. A request for data structured in this way was sent to the Local Distribution Companies (LDCs). However, we learned that most of the LDCs do not have robust databases of this nature. In most cases they archive data according to rate class only. NAICS coding of customers is not frequently done, or when it is done, not maintained and updated. Consequently, the fall-back option used for the study was the Statistics Canada 2003 data. Allocate plant archetype end-use profiles to target sub-sectors
The plant archetype energy end-use profiles are allocated to the target sectors to which they pertain. We were able to establish a profile of the number of SM industry plants, by location, in Ontario. From this an average plant consumption was derived and the archetype end-use allocation was applied to the “average” plant size. This enabled a roll-up to the SM industry sector and then to all of the SM industry market as a whole.
Market Profile &Conservation Opportunity Assessment for SMs –Final Report –
Altech Environmental Consulting/ Marbek Resource Consultants Page 10
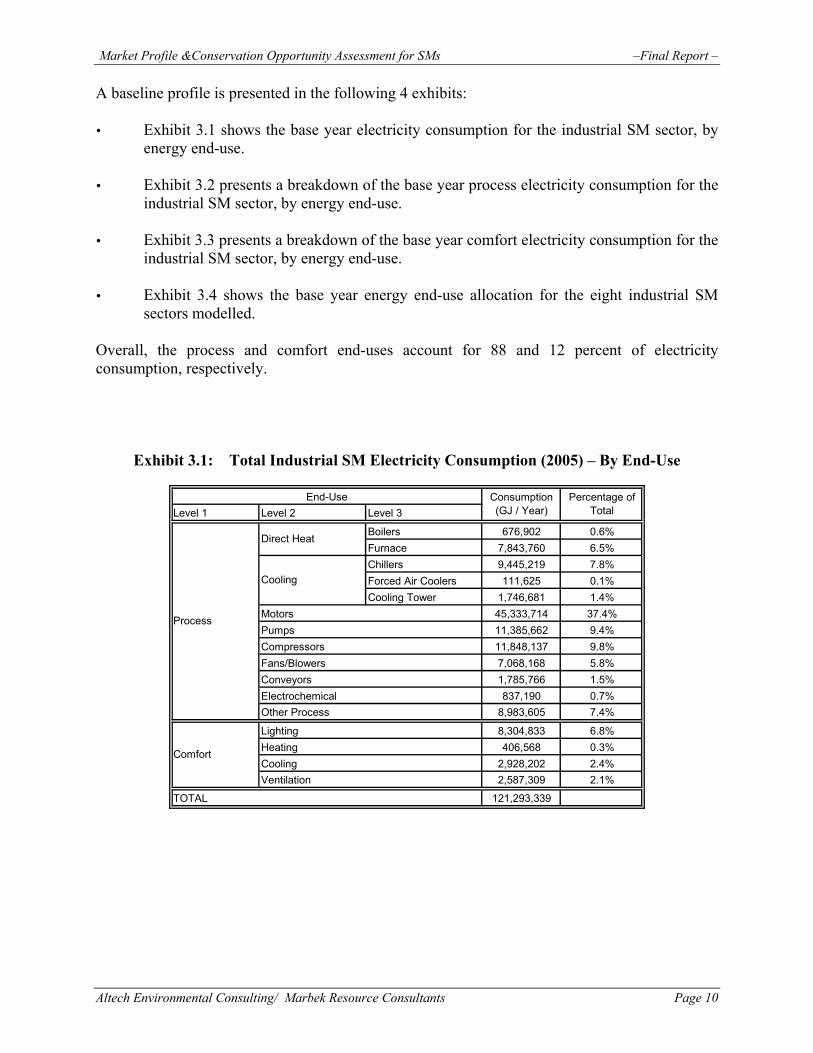
A baseline profile is presented in the following 4 exhibits: Exhibit 3.1 shows the base year electricity consumption for the industrial SM sector, by
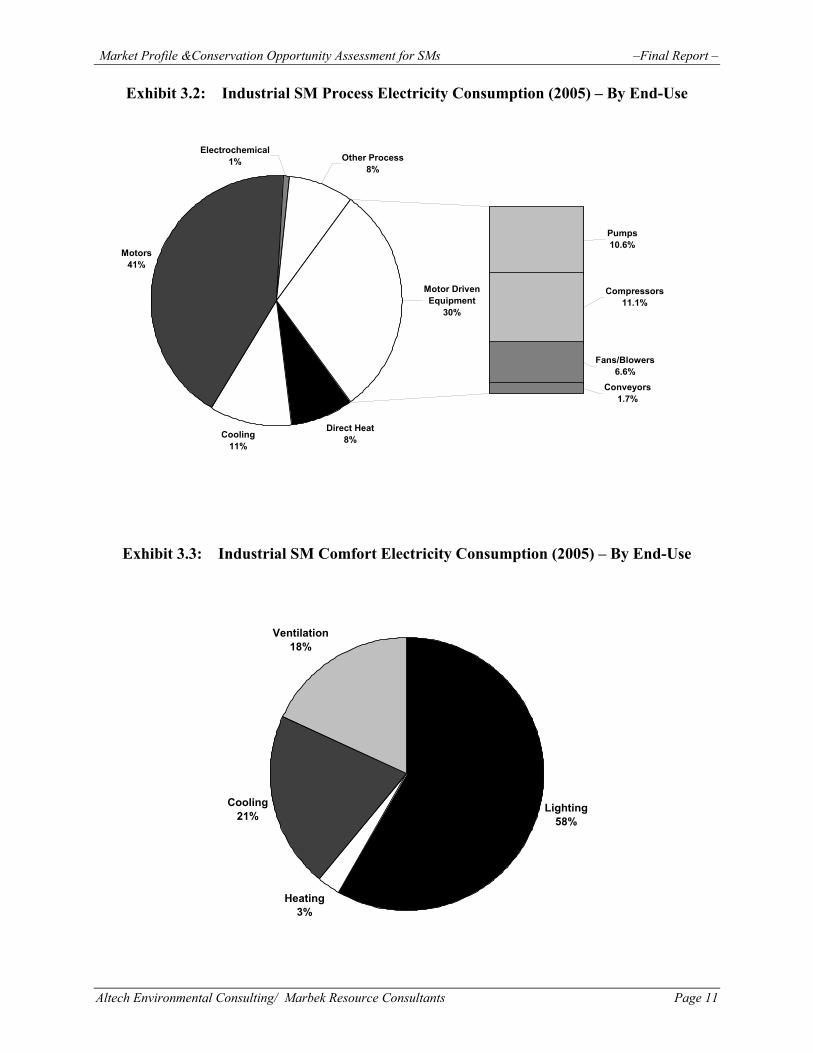
energy end-use. Exhibit 3.2 presents a breakdown of the base year process electricity consumption for the
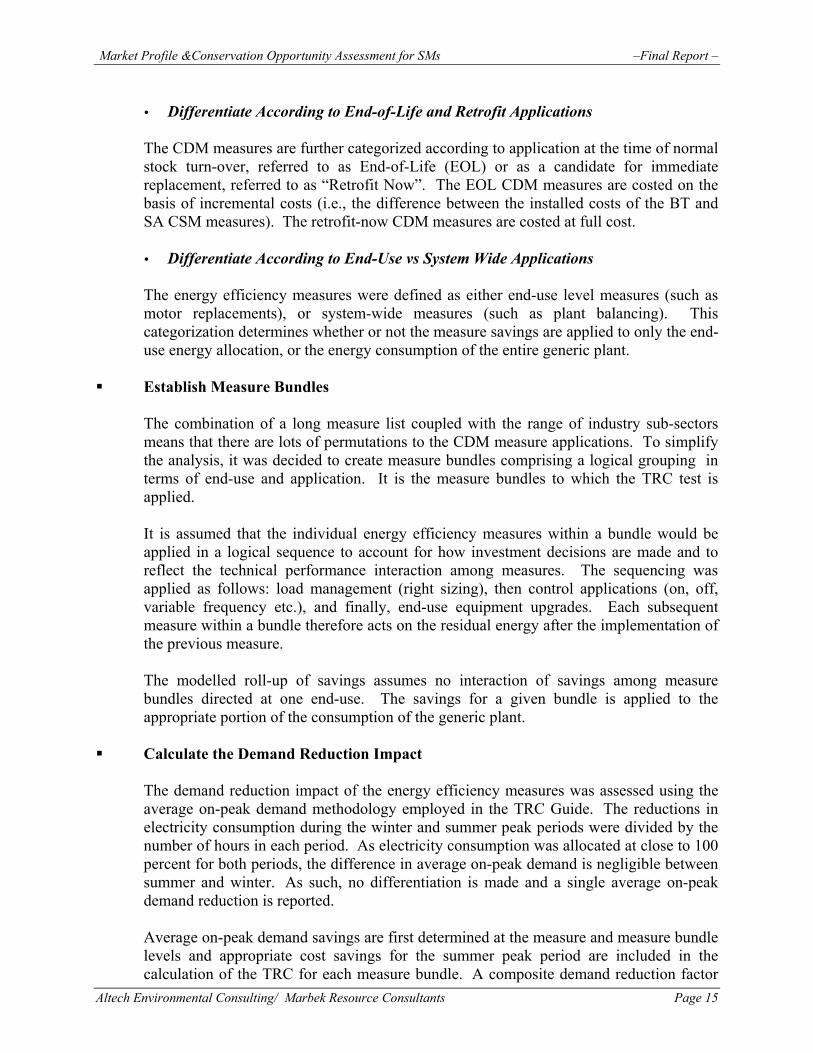
industrial SM sector, by energy end-use. Exhibit 3.3 presents a breakdown of the base year comfort electricity consumption for the
industrial SM sector, by energy end-use. Exhibit 3.4 shows the base year energy end-use allocation for the eight industrial SM
sectors modelled. Overall, the process and comfort end-uses account for 88 and 12 percent of electricity consumption, respectively.
Exhibit 3.1: Total Industrial SM Electricity Consumption (2005) – By End-Use
Level 1 Level 2 Level 3
Boilers 676,902 0.6%Furnace 7,843,760 6.5%Chillers 9,445,219 7.8%Forced Air Coolers 111,625 0.1%Cooling Tower 1,746,681 1.4%
Motors 45,333,714 37.4%Pumps 11,385,662 9.4%Compressors 11,848,137 9.8%Fans/Blowers 7,068,168 5.8%Conveyors 1,785,766 1.5%Electrochemical 837,190 0.7%Other Process 8,983,605 7.4%
Lighting 8,304,833 6.8%Heating 406,568 0.3%Cooling 2,928,202 2.4%Ventilation 2,587,309 2.1%
TOTAL 121,293,339
Cooling
Direct Heat
Process
Comfort
End-Use Consumption (GJ / Year)
Percentage of Total
Market Profile &Conservation Opportunity Assessment for SMs –Final Report –
Altech Environmental Consulting/ Marbek Resource Consultants Page 11
Exhibit 3.2: Industrial SM Process Electricity Consumption (2005) – By End-Use
Direct Heat8%Cooling
11%
Motors41%
Pumps10.6%
Conveyors1.7%
Fans/Blowers6.6%
Compressors11.1%
Electrochemical1% Other Process
8%
Motor DrivenEquipment
30%
Exhibit 3.3: Industrial SM Comfort Electricity Consumption (2005) – By End-Use
Lighting58%
Heating3%
Cooling21%
Ventilation18%

Market Profile &Conservation Opportunity Assessment for SMs –Final Report –
Altech Environmental Consulting/ Marbek Resource Consultants Page 12
Exhibit 3.4: Industrial SM Electricity Consumption (2005) – By Sector and End-Use
Level 1 Level 2 Level 3 Chemical Mfg.
Fabricated Metal Mfg.
Food Mfg.
Machinery Mfg.
Non-Metallic Mineral
Product Mfg.
Plastics & Rubber
Products Mfg.
Transportation Equipment Mfg.
Wood Product Mfg.
Boilers 0.5% 0.4% 0.6% 0.3% 0.5% 0.8% 0.5% 0.9%Furnace and Ovens 0.7% 4.5% 1.3% 3.5% 38.5% 6.0% 6.1% 0.0%Refrigeration / Chillers 0.2% 0.4% 41.7% 3.0% 2.1% 6.8% 4.5% 0.0%Cooling Tower 3.9% 0.9% 1.5% 0.5% 0.5% 0.8% 0.7% 0.9%
45.5% 40.5% 21.9% 34.0% 40.7% 61.2% 27.4% 20.1%27.4% 1.5% 5.4% 3.9% 0.9% 0.8% 10.3% 11.3%4.8% 9.6% 11.7% 14.6% 4.6% 6.2% 16.3% 11.7%3.9% 2.4% 2.0% 3.2% 2.1% 1.6% 7.1% 31.7%1.0% 0.2% 0.6% 0.3% 0.9% 0.8% 0.6% 10.5%3.6% 0.0% 0.0% 0.0% 0.0% 0.0% 0.0% 0.0%2.9% 14.4% 7.0% 21.4% 1.6% 4.8% 9.9% 3.5%2.9% 19.0% 3.3% 9.1% 4.3% 4.8% 8.4% 4.6%0.0% 0.0% 0.2% 0.5% 0.0% 0.0% 1.5% 0.0%1.0% 4.1% 0.3% 2.6% 1.1% 4.0% 2.7% 4.7%1.2% 2.2% 2.5% 3.1% 2.1% 1.2% 4.0% 0.1%
CoolingVentilation
Comfort
MotorsPumpsAir CompressorsFans/BlowersConveyorsElectrochemicalOther ProcessLightingHeating
Electricity Consumption Profile (%)
Process
Direct Heat
Cooling
Electricity End-Use

Market Profile &Conservation Opportunity Assessment for SMs –Final Report –
Altech Environmental Consulting/ Marbek Resource Consultants Page 13
3.2 REFERENCE CASE FORECAST The reference case is a forecast of the expected level of electricity consumption that would occur over the study period in the absence of new or incremental CDM market interventions by utilities and government in the SM industry sectors. The reference case is the point of comparison for the subsequent calculation of “economic” and “achievable” savings potentials in the industrial market.
The reference case forecast assumes that some level of “natural conservation” will occur over the study period. The scope and rate of natural conservation is driven by such factors as industrial plant growth and productivity improvements, energy prices and the availability and performance of energy management measures. Unfortunately, there is insufficient evidence to determine how each of these factors come into play in Ontario industry.
Utility and government forecasts generally assume some degree of a natural conservation effect in their forecasts. Consequently, it was decided to use the IESO forecast, specifically, the Medium growth rate scenario, which assumes some accountability of the natural conservation phenomenon. The Ontario SM industrial reference case is tuned to the IESO forecast.
In the absence of specific data on future industry output levels and type, it was further assumed that future output levels increased in approximate proportion to the increased levels of energy demand. Where data permitted, known future plant closures were taken into account. Hence, the base year market shares for each technology and fuel type within the model were, in effect, frozen for the study period.
Exhibit 3.5: Reference Case Forecast
REFERENCE CASE
0
20,000,000
40,000,000
60,000,000
80,000,000
100,000,000
120,000,000
140,000,000
160,000,000
2000 2005 2010 2015 2020 2025 2030
Year
Ener
gy C
onsu
mpt
ion
(GJ)
Reference Case
Average Growth Rate = 1% per annum

Market Profile &Conservation Opportunity Assessment for SMs –Final Report –
Altech Environmental Consulting/ Marbek Resource Consultants Page 14
4. ECONOMIC ASSESSMENT OF CDM MEASURES This section presents the findings of the CDM measure economic performance for the Ontario SM industrial sector. In total, 52 CDM measures were assessed as a set of 17 CDM measure bundles, targeted to 9 electricity end-uses in each of 8 industrial sectors. 4.1 METHODOLOGY The method employed comprises the following steps: Identify Candidate Energy Efficiency Measures
An initial set of candidate measures were identified for inclusion in the study based on an extensive literature search, the consultants’ in-house database, and the experience of the project team.
Select Priority Measures by Energy End-Use
Given the large number of CDM measure options possible, only technologies applicable to energy end-uses with high potential for energy reductions were selected. The priority end-uses were selected with the aid of the following criteria:
Energy usage: How frequent, for what duration and in what quantity is energy used?
This consideration was based on the actual energy end-use allocation from plant data.
Potential for Efficiency Improvement: Does the currently installed technology represent a strong potential for improvement? For example, if a given end-use in the sector is largely represented by older stock, the opportunity may be greater than one in which newer technologies may already be in place.
Technology development: How active is the development of new technology for this end-use leading to energy performance improvements?
Profile the Technical Performance of Measures
In this step, the technical performance of the final candidate set of energy efficiency measures was established. The modelling construct used to analyse the measures established embodies four key dimensions: Differentiate According to Baseline and State-of-the-Art Technologies
Baseline Technology (BT): The baseline technology represents the baseline performance against which the CDM measure performance is calculated. The BT refers to the most common choice for equipment replacement. In other words, it is the predominant standard efficiency option in the marketplace.
State of the Art (SA): This category refers to the CDM measures that are more energy efficient than BT, are currently commercially available, but have low market penetration.
Market Profile &Conservation Opportunity Assessment for SMs –Final Report –
Altech Environmental Consulting/ Marbek Resource Consultants Page 15
Differentiate According to End-of-Life and Retrofit Applications
The CDM measures are further categorized according to application at the time of normal stock turn-over, referred to as End-of-Life (EOL) or as a candidate for immediate replacement, referred to as “Retrofit Now”. The EOL CDM measures are costed on the basis of incremental costs (i.e., the difference between the installed costs of the BT and SA CSM measures). The retrofit-now CDM measures are costed at full cost.
Differentiate According to End-Use vs System Wide Applications
The energy efficiency measures were defined as either end-use level measures (such as motor replacements), or system-wide measures (such as plant balancing). This categorization determines whether or not the measure savings are applied to only the end-use energy allocation, or the energy consumption of the entire generic plant.
Establish Measure Bundles
The combination of a long measure list coupled with the range of industry sub-sectors means that there are lots of permutations to the CDM measure applications. To simplify the analysis, it was decided to create measure bundles comprising a logical grouping in terms of end-use and application. It is the measure bundles to which the TRC test is applied. It is assumed that the individual energy efficiency measures within a bundle would be applied in a logical sequence to account for how investment decisions are made and to reflect the technical performance interaction among measures. The sequencing was applied as follows: load management (right sizing), then control applications (on, off, variable frequency etc.), and finally, end-use equipment upgrades. Each subsequent measure within a bundle therefore acts on the residual energy after the implementation of the previous measure. The modelled roll-up of savings assumes no interaction of savings among measure bundles directed at one end-use. The savings for a given bundle is applied to the appropriate portion of the consumption of the generic plant.
Calculate the Demand Reduction Impact
The demand reduction impact of the energy efficiency measures was assessed using the average on-peak demand methodology employed in the TRC Guide. The reductions in electricity consumption during the winter and summer peak periods were divided by the number of hours in each period. As electricity consumption was allocated at close to 100 percent for both periods, the difference in average on-peak demand is negligible between summer and winter. As such, no differentiation is made and a single average on-peak demand reduction is reported. Average on-peak demand savings are first determined at the measure and measure bundle levels and appropriate cost savings for the summer peak period are included in the calculation of the TRC for each measure bundle. A composite demand reduction factor
Market Profile &Conservation Opportunity Assessment for SMs –Final Report –
Altech Environmental Consulting/ Marbek Resource Consultants Page 16
that translates the consumption savings, equipment operating hours, and coincidence factor into the average on-peak demand savings is developed for each bundle. These factors are weighted and combined at the end-use level to derive the average on-peak demand savings by energy end-use. As with the consumption savings, the modelled roll-up of savings assumes no interaction of savings among measure bundles directed at one end-use.
Estimate Capital and Operating Cost of Measures The consulting team in-house data, supported by secondary research, was used to estimate the cost of implementing each CDM measure bundle. All cost information is in constant (2004) dollars.
Calculate the Total Resource Cost (TRC)
The key economic performance metric generated in the technology profiles is the Total Resource Cost (TRC). The Total Resource Cost is the net present value of the total of savings and costs accrued over the life of the energy management measure. An energy management measure passes the economic test and becomes a candidate for the economic potential scenario when the NPV is positive. The TRC method as described in the OEB Guide was used, with the following specific assumptions:
Discount rate is 6% real; The useful life of the measure bundle and all its component measures is assumed to
be the useful life of the longest-lived component measure; If a measure bundle passes the TRC test at full cost, it is implemented as an
immediate retrofit; and, Distribution and transmission losses are not accounted for in the savings component
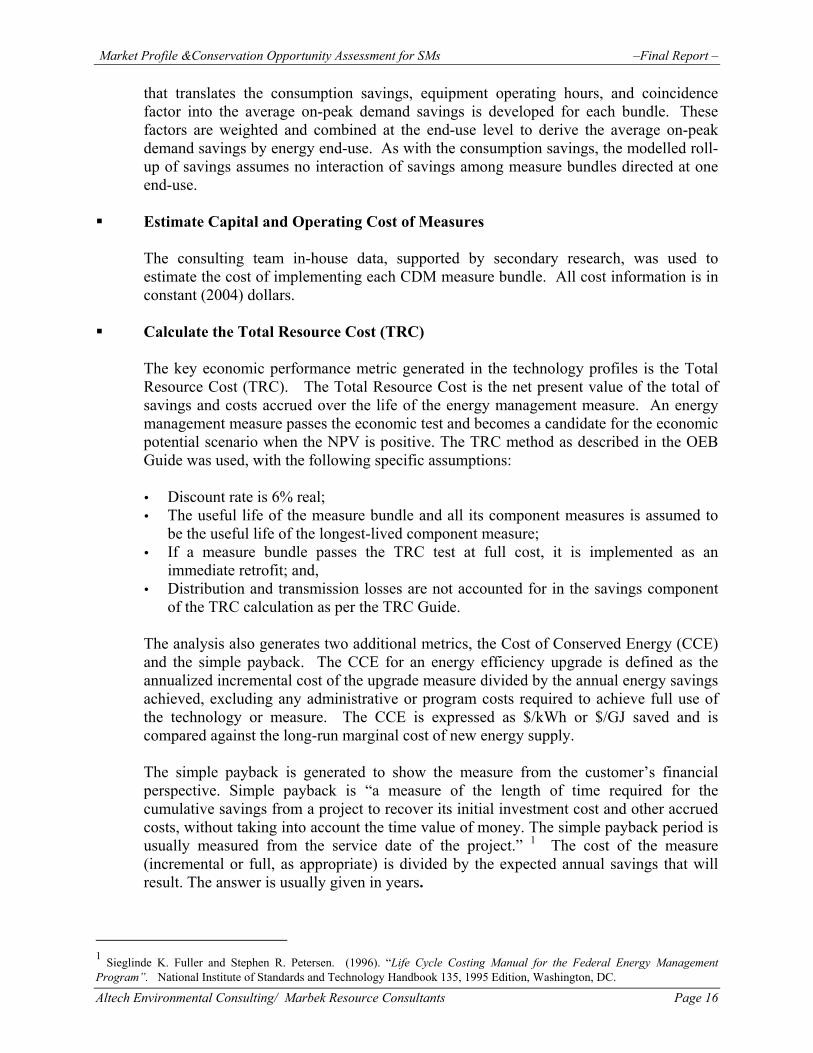
of the TRC calculation as per the TRC Guide.
The analysis also generates two additional metrics, the Cost of Conserved Energy (CCE) and the simple payback. The CCE for an energy efficiency upgrade is defined as the annualized incremental cost of the upgrade measure divided by the annual energy savings achieved, excluding any administrative or program costs required to achieve full use of the technology or measure. The CCE is expressed as $/kWh or $/GJ saved and is compared against the long-run marginal cost of new energy supply. The simple payback is generated to show the measure from the customer’s financial perspective. Simple payback is “a measure of the length of time required for the cumulative savings from a project to recover its initial investment cost and other accrued costs, without taking into account the time value of money. The simple payback period is usually measured from the service date of the project.” 1 The cost of the measure (incremental or full, as appropriate) is divided by the expected annual savings that will result. The answer is usually given in years.
1 Sieglinde K. Fuller and Stephen R. Petersen. (1996). “Life Cycle Costing Manual for the Federal Energy Management Program”. National Institute of Standards and Technology Handbook 135, 1995 Edition, Washington, DC.
Market Profile &Conservation Opportunity Assessment for SMs –Final Report –
Altech Environmental Consulting/ Marbek Resource Consultants Page 17
The following equation illustrates how this calculation is done, for a situation where an upgrade has a higher upfront cost than the baseline technology, but lower ongoing operating costs:
SPB = (CostUpgr – CostBase)/(AnnBase – AnnUpgr)
where: SPB = simple payback period of choosing the upgrade (years) CostUpgr = initial capital cost of the upgrade ($) CostBase = initial capital cost of the baseline technology ($) AnnUpgr = ongoing operating cost of the upgrade ($/year) AnnUpgr = ongoing operating cost of the upgrade ($/year)
4.2 CDM MEASURES Two sets of CDM bundles were included in this study: end-use measures, and system level measures. An overview of each set is presented below. 4.2.1 End-Use Measure Bundles
End-use measure bundles are measure applied directly to a given energy end-use such as motors, pumps, compressed air systems, etc. Note that although common measure bundles were defined (as presented below), each measure bundle was modified as appropriate in term of savings, operating times, implementation costs etc. to suite the generic plant type to which it was applied. The following end-use measure bundles were developed for this study: Motor Upgrade, Small, Medium & Large, both End-of-Life and Retrofit Now –
Depending on size, this measure bundle typically contains:
− Optimized premium efficient motor sizing − Synchronous belts − Variable speed drives
Pump Upgrade, Small, Medium & Large, both End-of-Life and Retrofit Now –
Depending on size, this measure bundle typically contains:
− Optimized, high efficient pump sizing − Synchronous belts − Variable speed drives
Fan/Blower Upgrade, Small, Medium & Large, both End-of-Life and Retrofit
Now – Depending on size, this measure bundle typically contains:
− Optimized, high efficient fan/blower sizing − Synchronous belts − Variable speed drives

Market Profile &Conservation Opportunity Assessment for SMs –Final Report –
Altech Environmental Consulting/ Marbek Resource Consultants Page 18
Conveyor Upgrade, both End-of-Life and Retrofit Now – Depending on size, this
measure bundle typically contains:
− Optimized premium efficient motor sizing − Synchronous belts
Air Compressor Upgrade, both End-of-Life and Retrofit Now – Depending on size, this measure bundle typically contains: − Optimally sized, high efficient compressor − Air leaks and condensate traps repaired − Optimally sized and designed systems, including air receiver tanks − Variable speed drives
Refrigeration/Cooling Upgrade, both End-of-Life and Retrofit Now – Depending on size, this measure bundle typically contains: − Optimally sized, high efficient refrigeration/chiller systems − Lowering condensing temperature − Heat recovery − Optimized defrost cycle − Energy demand and supply balance
Furnace/oven Upgrade, both End-of-Life and Retrofit Now – Depending on size, this measure bundle typically contains: − Insulation − Heat recovery
Lighting System Upgrade, Retrofit Now – This measure bundle typically contains: − High efficiency lighting system with optimum lumens − Occupancy sensors and/or timed control system
HVAC System Upgrade, Retrofit Now – This measure bundle typically contains: − Optimally designed, high efficiency HVAC system
4.2.2 System Level Measure Bundles
System-level measure bundles are efficiency upgrade options that span several energy end-uses, and are therefore applied against the entire generic plant’s energy consumption. Each measure bundle was modified as appropriate in term of savings, operating times, implementation costs etc. to suite the generic plant type to which it was applied. Indeed, process improvement upgrades were defined specifically for the generic plant in question. The following system-level measure bundles were included in this study.
Market Profile &Conservation Opportunity Assessment for SMs –Final Report –
Altech Environmental Consulting/ Marbek Resource Consultants Page 19
Control System Upgrade – Control system upgrades include digital controllers aimed at informing energy management and providing real-time demand management. They include:
− Sub-metering and interval metering − DMS system upgrades − Artificial intelligent based control
Energy and Mass Balancing – This bundle aims to apply advanced modelling and
analysis methods to improve productivity and throughput. This bundle typically includes:
− Vibration analysis of motors − Energy and mass balance modeling of process flows. − Process integration and/or Pinch analysis
Maintenance and Operating Improvements – Operating and maintenance
improvements were developed for each generic plant type in the study. These measure bundles includes training and strategies to create a corporate culture of energy conservation.
4.3 RESULTS The TRC and CCE tests are highly sensitive to several of the key assumptions in the analysis. In some cases, marginal measures might change from passing the TRC test to failing (or vice versa) based on a slight change in one of the assumptions. Sensitivity analysis was conducted to test the sensitivity of the analysis against key variables. In order to ensure that such marginal measures were identified, the following assumptions were varied: Avoided cost of electricity (5% lower, 5% higher, and 10% higher) Implementation cost of the measures (10% lower, 25% lower) Measure life (years).
Avoided cost and implementation cost were varied by the percentages specified above. CCE provided a useful guide to which measures required sensitivity testing: changes were observed only when the measure’s initial CCE was relatively close to the avoided cost of electricity. The results are shown in Exhibit 4.1.

Market Profile &Conservation Opportunity Assessment for SMs –Final Report –
Altech Environmental Consulting/ Marbek Resource Consultants Page 20
Exhibit 4.1: TRC Summary
Level 1 Level 2 Level 3 Full Cost Incremental
CostTRC Net Benefit
TRC Pass / Fail Avoided Cost Discount Rate
Furnace/Oven Upgrade (Now) Chemical, Nonmetallic 140,000$ 679,361$ Pass Pass Pass 2.4 8$
Furnace/Oven Upgrade (Now) Fabricated, Machinery, Plastics, Transportation 100,000$ 194,559$ Pass Pass Pass 3.5 13$
Refrigeration/Cooling Upgrade (Now)Chemical, Fabricated, Machinery, Nonmetallic, Plastics, Transportation
79,000$ 108,323$ Pass Pass Pass 5.1 19$
Refrigeration/Cooling Upgrade (Now) Food 260,000$ 84,325$ Pass Pass Pass 9.9 20$ Small Motor Upgrade (Now) All sectors 2,733$ 2,509$ Pass Pass Pass 6.1 23$ Medium Motor Upgrade (Now) All sectors 24,150$ 246,903$ Pass Pass Pass 1.3 3$ Large Motor Upgrade (Now) All sectors 71,000$ 716,953$ Pass Pass Pass 1.4 4$ Small Pump Upgrade 1 (Now) All sectors 1,000$ 155-$ Fail Pass Fail 6.2 38$ Small Pump Upgrade 2 (Now) All sectors 400$ 671$ Pass Pass Pass 3.6 22$ Small Pump Upgrade (EOL) All sectors 1,200$ 3,686$ Pass Pass Pass 3.7 9$ Medium Pump Upgrade 1 (Now) All sectors 20,200$ 227,400$ Pass Pass Pass 1.2 3$ Medium Pump Upgrade 2 (Now) All sectors 23,500$ 244,996$ Pass Pass Pass 1.3 4$ Compressor Upgrade 1 (Now) All sectors 35,000$ 2,245$ Pass Pass Fail 9.9 34$ Compressor Upgrade 2 (Now) All sectors 12,000$ 14,259-$ Fail Fail Fail 24.9 105$ Small Fan/Blower Upgrade 1 (Now) All sectors 1,650$ 212$ Pass Pass Pass 10.0 33$ Small Fan/Blower Upgrade 2 (Now) All sectors 800$ 1,357-$ Fail Fail Fail 12.4 85$ Medium Fan/Blower Upgrade 1 (Now) All sectors 13,700$ 234,540$ Pass Pass Pass 0.8 2$ Medium Fan/Blower Upgrade 2 (Now) All sectors 17,000$ 252,774$ Pass Pass Pass 0.9 3$ Large Fan/Blower Upgrade (Now) All sectors 66,000$ 710,891$ Pass Pass Pass 1.3 4$ Conveyor Upgrade (Now) All sectors 1,300$ 654$ Pass Pass Pass 10.1 24$ Lighting Upgrades (Now) All sectors 120$ 11$ Pass Pass Pass 8.7 27$ HVAC (Now) All sectors 52,000$ 39,438-$ Fail Fail Fail 42.2 121$ HVAC (Now) All sectors 52,000$ 39,438-$ Fail Fail Fail 42.2 121$
ComfortLighting
Process
Furnaces
Chillers
Motors
Cooling
Pumps
Air Compressors
End-Use
Conveyers
Fans / Blowers
Direct Heat
Cooling Ventilation
CCE ($/GJ)Measure Bundle
TRC Sensitivity (Pass / Fail) Simple Payback (Years)
Core AnalysisApplicationSector Applicability

Market Profile &Conservation Opportunity Assessment for SMs –Final Report –
Altech Environmental Consulting/ Marbek Resource Consultants Page 21
5. ECONOMIC POTENTIAL SCENARIO This section presents the economic potential forecast for the Ontario SM industrial sector over the study period (2005-2025). The economic potential forecast is the level of energy consumption that would occur if all industrial processes, equipment and buildings were upgraded with energy management measures that pass the TRC test. In other words, this is a scenario which reflects circumstances where a “rational” economic decision-maker is making energy management investments unimpeded by market barriers. Given the preponderance of market barriers, the boundary established by the economic potential forecast is an upset level that helps to frame the discussion on achievable potential. The discussion in this section is organized according to the following subsections: Methodology Summary of results Interpretation of results.
5.1 METHODOLOGY To develop the economic potential scenario, the following steps were undertaken:
The CDM measure TRC results for each of the energy management measures presented
previously were reviewed. Measures that had positive TRC results were selected for inclusion in the economic potential scenario, either on a “full cost” or “incremental” basis.
CDM measures passing the TRC test on a “full cost” basis were implemented in the first
forecast year. Those upgrades that only passed the TRC test on an “incremental” basis were introduced as the existing stock approached the end of its useful life (EOL).
Calculate energy consumption for the study milestone years when the efficiency
measures are employed. Compare the economic potential energy consumption levels with the reference case consumption levels and calculate the energy savings.
Market Profile &Conservation Opportunity Assessment for SMs –Final Report –
Altech Environmental Consulting/ Marbek Resource Consultants Page 22
5.2 SUMMARY OF ECONOMIC POTENTIAL FORECAST – ENERGY EFFICIENCY
5.2.1 High Level Results
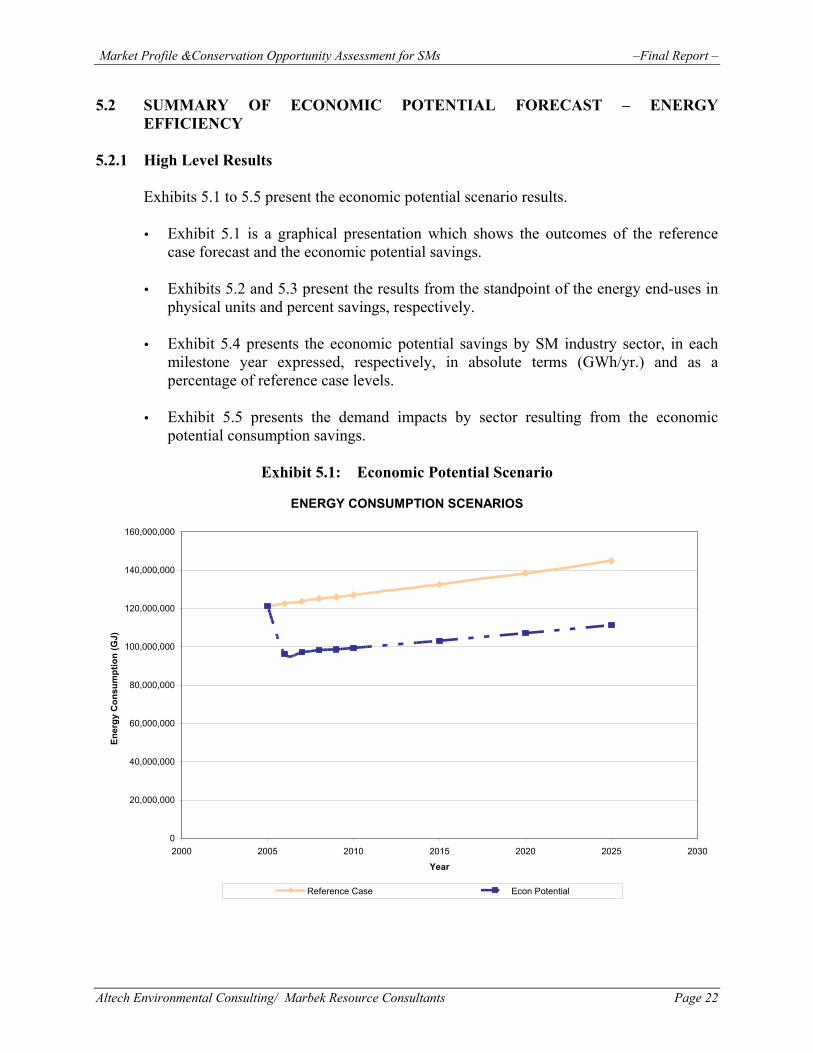
Exhibits 5.1 to 5.5 present the economic potential scenario results.
Exhibit 5.1 is a graphical presentation which shows the outcomes of the reference case forecast and the economic potential savings.
Exhibits 5.2 and 5.3 present the results from the standpoint of the energy end-uses in
physical units and percent savings, respectively.
Exhibit 5.4 presents the economic potential savings by SM industry sector, in each milestone year expressed, respectively, in absolute terms (GWh/yr.) and as a percentage of reference case levels.
Exhibit 5.5 presents the demand impacts by sector resulting from the economic
potential consumption savings.
Exhibit 5.1: Economic Potential Scenario
ENERGY CONSUMPTION SCENARIOS
0
20,000,000
40,000,000
60,000,000
80,000,000
100,000,000
120,000,000
140,000,000
160,000,000
2000 2005 2010 2015 2020 2025 2030
Year
Ener
gy C
onsu
mpt
ion
(GJ)
Reference Case Econ Potential

Market Profile &Conservation Opportunity Assessment for SMs –Final Report –
Altech Environmental Consulting/ Marbek Resource Consultants Page 23
Exhibit 5.2: Economic Potential Savings by End-Use (GWh)
Level 1 Level 2 Level 3 2005 2006 2007 2008 2009 2010 2015 2020 2025Boilers 0 26 26 26 26 27 28 29 30Furnaces 0 525 530 537 540 545 568 594 621Chillers 0 692 698 707 711 717 748 782 817Forced Air Coolers 0 4 4 4 4 4 5 5 5Cooling Tower 0 66 67 68 68 69 72 75 78
0 2,464 2,505 2,554 2,585 2,625 2,831 3,053 3,2900 447 466 487 504 524 626 737 8560 1,165 1,177 1,191 1,198 1,209 1,261 1,318 1,3770 439 443 448 451 455 475 496 5180 130 131 133 134 135 141 148 1550 32 32 32 33 33 34 36 370 340 344 348 350 353 368 385 4020 717 724 733 737 743 776 811 8470 15 16 16 16 16 17 17 18
Cooling 0 111 112 113 114 115 120 125 1310 98 99 100 101 102 106 111 1160 7,271 7,373 7,498 7,572 7,671 8,176 8,722 9,300
ConveyersElectrochemicalOther Process
Comfort
TOTAL:
LightingHeating
Ventilation
End-Use Annual Energy Savings by Milestone Year (GWh)
Process
Direct Heat
Cooling
MotorsPumpsCompressorsFans/Blowers
Exhibit 5.3: Economic Potential Savings by End-Use (%)
Level 1 Level 2 Level 3 2005 2006 2007 2008 2009 2010 2015 2020 2025Boilers - 0.4% 0.4% 0.3% 0.3% 0.3% 0.3% 0.3% 0.3%Furnaces - 7% 7% 7% 7% 7% 7% 7% 7%Chillers - 10% 9% 9% 9% 9% 9% 9% 9%Forced Air Coolers - 0.1% 0.1% 0.1% 0.1% 0.1% 0.1% 0.1% 0.1%Cooling Tower - 1% 1% 1% 1% 1% 1% 1% 1%
- 34% 34% 34% 34% 34% 35% 35% 35%- 6% 6% 6% 7% 7% 8% 8% 9%- 16% 16% 16% 16% 16% 15% 15% 15%- 6% 6% 6% 6% 6% 6% 6% 6%- 2% 2% 2% 2% 2% 2% 2% 2%- 0.4% 0.4% 0.4% 0.4% 0.4% 0.4% 0.4% 0.4%- 5% 5% 5% 5% 5% 5% 4% 4%- 10% 10% 10% 10% 10% 9% 9% 9%- 0.2% 0.2% 0.2% 0.2% 0.2% 0.2% 0.2% 0.2%- 2% 2% 2% 2% 1% 1% 1% 1%- 1% 1% 1% 1% 1% 1% 1% 1%
100% 100% 100% 100% 100% 100% 100% 100%
CompressorsFans/Blowers
Comfort
VentilationTOTAL:
Other ProcessLightingHeatingCooling
MotorsProcess
Direct Heat
Cooling
Pumps
End-Use
ConveyersElectrochemical
Percentage Annual Energy Savings by End-Use

Market Profile &Conservation Opportunity Assessment for SMs –Final Report –
Altech Environmental Consulting/ Marbek Resource Consultants Page 24
Exhibit 5.4: Economic Potential Savings (GWh)
Year Base Year Consumption (GWh)
Reference Case Consumption (GWh)
Economic Potential Scenario Consumption (GWh) Savings (GWh) Savings as Percentage
of Reference Case
2005 33,693 33,693 33,693 0 0%2006 34,040 26,769 7,271 21%2007 34,366 26,993 7,373 21%2008 34,800 27,302 7,498 22%2009 34,995 27,423 7,572 22%2010 35,299 27,628 7,671 22%2015 36,840 28,664 8,176 22%2020 38,498 29,776 8,722 23%2025 40,231 30,930 9,300 23%
Exhibit 5.5: Demand Impacts of Economic Potential Savings (MW)
On-Peak Demand Savings by 2025 (MW)
0
500
1000
1500
2000
2500
Chemical Mfg. FabricatedMetal Mfg.
Food Mfg. MachineryMfg.
Non-MetallicMineral Prod.
Mfg.
Plastics &Rubber Mfg.
TransportationEquipment
Mfg.
Wood ProductMfg.
Total
Sectors
On-
Peak
Dem
and
(MW
The results show that, under the economic potential scenario, electricity consumption in 2025 would decline by about 23% relative to the Reference Case forecast. In absolute terms, this is a reduction in 2025 from 40,231 GWh to 30,930 GWH and a reduction of 2,084 MW. As shown, the savings are relatively flat from 2007 to the end of the study period. This is because most of the energy efficiency measures passed the TRC test at full cost and, consequently, were modelled to achieve full market penetration early in the forecast
The results also show which energy end-uses have the largest potential for savings.
Market Profile &Conservation Opportunity Assessment for SMs –Final Report –
Altech Environmental Consulting/ Marbek Resource Consultants Page 25
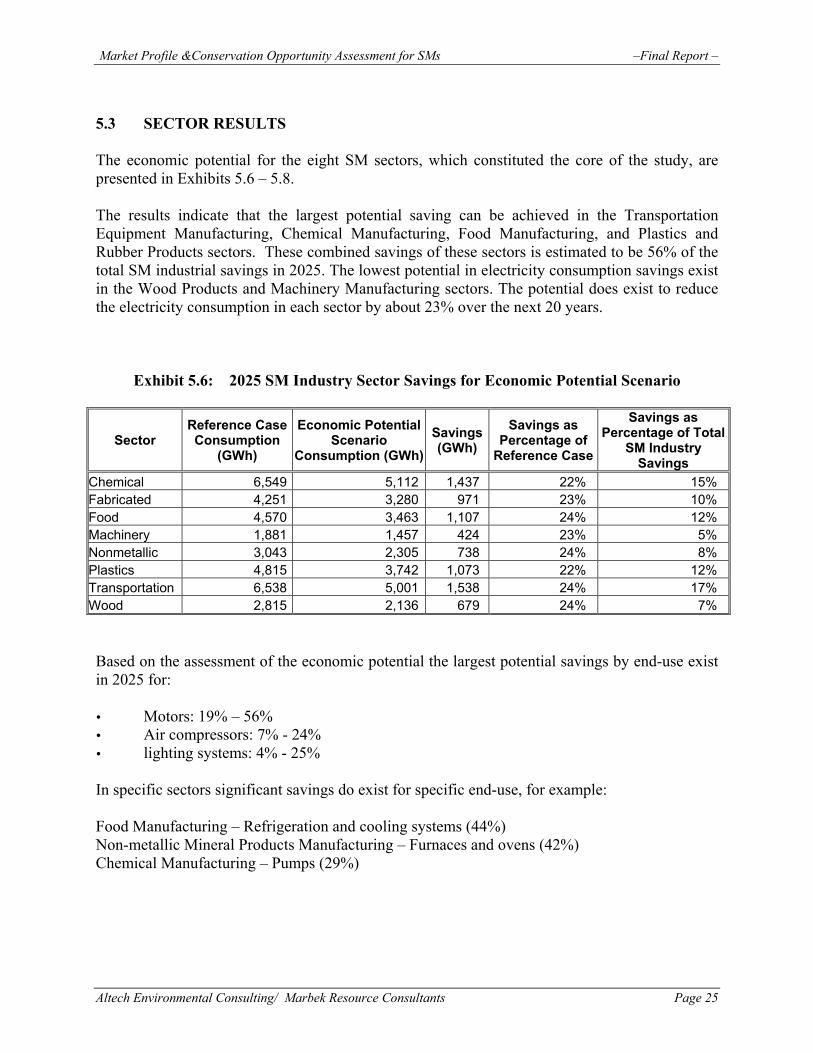
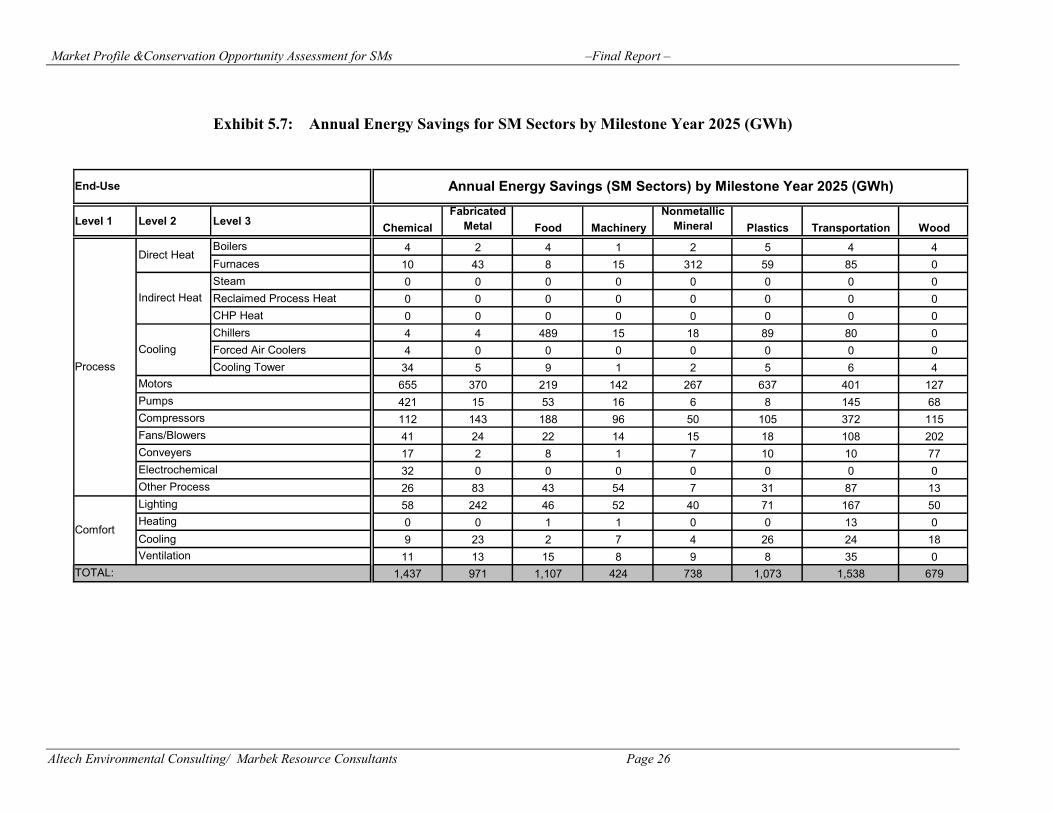
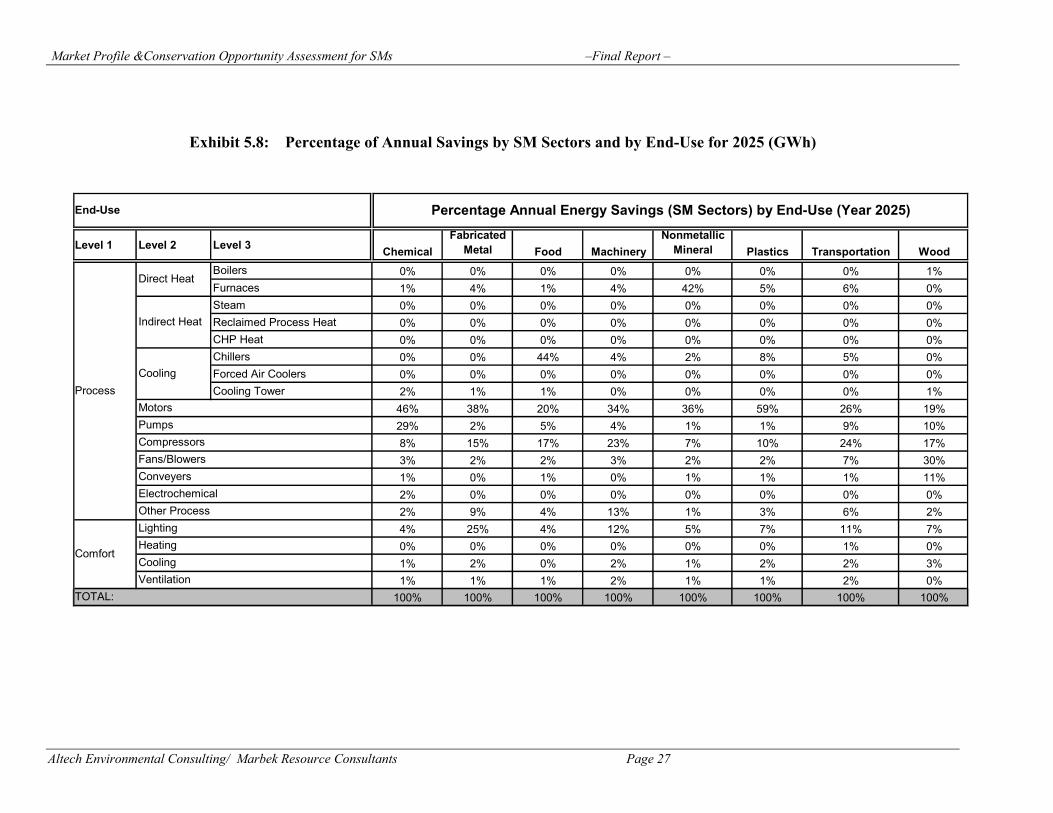
5.3 SECTOR RESULTS The economic potential for the eight SM sectors, which constituted the core of the study, are presented in Exhibits 5.6 – 5.8. The results indicate that the largest potential saving can be achieved in the Transportation Equipment Manufacturing, Chemical Manufacturing, Food Manufacturing, and Plastics and Rubber Products sectors. These combined savings of these sectors is estimated to be 56% of the total SM industrial savings in 2025. The lowest potential in electricity consumption savings exist in the Wood Products and Machinery Manufacturing sectors. The potential does exist to reduce the electricity consumption in each sector by about 23% over the next 20 years.
Exhibit 5.6: 2025 SM Industry Sector Savings for Economic Potential Scenario
Sector Reference Case Consumption
(GWh)
Economic Potential Scenario
Consumption (GWh)Savings (GWh)
Savings as Percentage of
Reference Case
Savings as Percentage of Total
SM Industry Savings
Chemical 6,549 5,112 1,437 22% 15% Fabricated 4,251 3,280 971 23% 10% Food 4,570 3,463 1,107 24% 12% Machinery 1,881 1,457 424 23% 5% Nonmetallic 3,043 2,305 738 24% 8% Plastics 4,815 3,742 1,073 22% 12% Transportation 6,538 5,001 1,538 24% 17% Wood 2,815 2,136 679 24% 7% Based on the assessment of the economic potential the largest potential savings by end-use exist in 2025 for: Motors: 19% – 56% Air compressors: 7% - 24% lighting systems: 4% - 25%
In specific sectors significant savings do exist for specific end-use, for example: Food Manufacturing – Refrigeration and cooling systems (44%) Non-metallic Mineral Products Manufacturing – Furnaces and ovens (42%) Chemical Manufacturing – Pumps (29%)
Market Profile &Conservation Opportunity Assessment for SMs –Final Report –
Altech Environmental Consulting/ Marbek Resource Consultants Page 26
Exhibit 5.7: Annual Energy Savings for SM Sectors by Milestone Year 2025 (GWh)
Level 1 Level 2 Level 3 ChemicalFabricated
Metal Food MachineryNonmetallic
Mineral Plastics Transportation WoodBoilers 4 2 4 1 2 5 4 4Furnaces 10 43 8 15 312 59 85 0Steam 0 0 0 0 0 0 0 0Reclaimed Process Heat 0 0 0 0 0 0 0 0CHP Heat 0 0 0 0 0 0 0 0Chillers 4 4 489 15 18 89 80 0Forced Air Coolers 4 0 0 0 0 0 0 0Cooling Tower 34 5 9 1 2 5 6 4
655 370 219 142 267 637 401 127421 15 53 16 6 8 145 68112 143 188 96 50 105 372 11541 24 22 14 15 18 108 20217 2 8 1 7 10 10 7732 0 0 0 0 0 0 026 83 43 54 7 31 87 1358 242 46 52 40 71 167 500 0 1 1 0 0 13 0
Cooling 9 23 2 7 4 26 24 1811 13 15 8 9 8 35 0
1,437 971 1,107 424 738 1,073 1,538 679TOTAL:
ConveyersElectrochemicalOther Process
Comfort
LightingHeating
Ventilation
End-Use Annual Energy Savings (SM Sectors) by Milestone Year 2025 (GWh)
Process
Direct Heat
Indirect Heat
Cooling
MotorsPumpsCompressorsFans/Blowers
Market Profile &Conservation Opportunity Assessment for SMs –Final Report –
Altech Environmental Consulting/ Marbek Resource Consultants Page 27
Exhibit 5.8: Percentage of Annual Savings by SM Sectors and by End-Use for 2025 (GWh)
Level 1 Level 2 Level 3 ChemicalFabricated
Metal Food MachineryNonmetallic
Mineral Plastics Transportation WoodBoilers 0% 0% 0% 0% 0% 0% 0% 1%Furnaces 1% 4% 1% 4% 42% 5% 6% 0%Steam 0% 0% 0% 0% 0% 0% 0% 0%Reclaimed Process Heat 0% 0% 0% 0% 0% 0% 0% 0%CHP Heat 0% 0% 0% 0% 0% 0% 0% 0%Chillers 0% 0% 44% 4% 2% 8% 5% 0%Forced Air Coolers 0% 0% 0% 0% 0% 0% 0% 0%Cooling Tower 2% 1% 1% 0% 0% 0% 0% 1%
46% 38% 20% 34% 36% 59% 26% 19%29% 2% 5% 4% 1% 1% 9% 10%8% 15% 17% 23% 7% 10% 24% 17%3% 2% 2% 3% 2% 2% 7% 30%1% 0% 1% 0% 1% 1% 1% 11%2% 0% 0% 0% 0% 0% 0% 0%2% 9% 4% 13% 1% 3% 6% 2%4% 25% 4% 12% 5% 7% 11% 7%0% 0% 0% 0% 0% 0% 1% 0%1% 2% 0% 2% 1% 2% 2% 3%1% 1% 1% 2% 1% 1% 2% 0%
100% 100% 100% 100% 100% 100% 100% 100%TOTAL:
Comfort
LightingHeatingCoolingVentilation
Fans/BlowersConveyersElectrochemicalOther Process
End-Use Percentage Annual Energy Savings (SM Sectors) by End-Use (Year 2025)
Process
Direct Heat
Indirect Heat
Cooling
MotorsPumpsCompressors
Market Profile &Conservation Opportunity Assessment for SMs –Final Report –
Altech Environmental Consulting/ Marbek Resource Consultants Page 28
6. ONTARIO SM INDUSTRY SITUATION ASSESSMENT AND
PROGRAM CONCEPTS This section presents the results of the Ontario SM Industry Situation Assessment and also presents a preliminary suite of program concepts for consideration to achieve CDM take-up in this market. The method employed to generate these outputs comprised the following elements: Literature review LDC interviews California Utility Interviews
6.1 CDM PROGAMMING TARGETED TO THE SM INDUSTRY SECTORS This sub-section summarizes the current CDM programming targeted to the Ontario SM Industry sectors. The profile focuses primarily on the activities of the Local Distribution Companies (LDCs) that supply power in Ontario, supplemented by some information on activities by the provincial and federal governments. The LDC program review is based on their CDM plans and reports submitted to the OEB, as well as the interviews conducted for this assignment. The current LDC program suites are operating under the auspices of approval from the OEB to invest $ 163 million in CDM initiatives over a three-year period from March 1, 2005 to September 2007. The key findings are organized under the following topics: Overview of current LDC programming Program types Program development Program delivery Assessment and funding of programs Program deployment
6.1.1 Overview of Current LDC programming
At the present time, it’s evident that LDC programming is largely targeted to the residential and commercial sectors, and far less directed to industry. To understand this situation, it’s important to consider how the LDCs are segmented as far as SM industry reach as well as how some of the LDCs have coalesced under various alliances. There are 87 LDCs in Ontario, including Hydro One. However, a total of 37 LDCs service 97% of the SM industry market, making this group the focus for planned and potential programming. Moreover, 31 LDCs have come together under the auspices of three coalitions to design and deliver some CDM programs on a collaborative basis: the Coalition of Large Distributors, Cornerstone Hydro Electric Concepts, and Niagara Erie Public Power Alliance.

Market Profile &Conservation Opportunity Assessment for SMs –Final Report –
Altech Environmental Consulting/ Marbek Resource Consultants Page 29
Exhibit 6.1 provides a summary of the planned and active CDM program activities under the auspices of the largest LDC alliances and LDCs servicing a significant portion of SM industrial sector. The first year of activity, 2005, was mainly used to develop and deploy programs, and consequently, CDM impact in SM industry in 2005 will not yield significant energy or demand savings.
Exhibit 6.1: LDC Conservation and Demand Management Programming 2005 – 2007
Program Description LDC Financial Incentives
Voluntary demand response Burlington Hydro CHED
Incentive to reduce peak demand CLD Load displacement (promotes alternative/renewable energy) CLD
CHED GHWED NEPPA
Load control program CLD GHWED Hydro One
Energy audits and projects CHED NEPPA
Co-generation pilot programs GHWED Training and Information
Energy efficiency showcase Burlington Hydro Education, outreach and promotions Burlington Hydro
CLD CHED GHWED Hydro One
Interval metering CLD CHED Hydro One NEPPA
Building design advisory program CLD Support – e.g. conference, website, newsletter, staff training. CLD
CHED Billing practice CHED Customer survey and market research CHED Technology and program research and demonstration GHWED
Hydro One Delivery Infrastructure
Leveraging energy conservation and/or load management programs delivered by government or gas utilities
CLD CHED NEPPA
On-the-bill financing (pilot program) CLD Rate Design
Time-of-use rate (pilot program) Hydro One CLD: Coalition of Large Distributors CHEC: Cornerstone Hydro Electric Concepts GHWED: Guelph Hydro and Wellington Electric Distribution Hydro One: Hydro One Networks and Hydro One Brampton NEPPA: Niagara Erie Public Power Alliance

Market Profile &Conservation Opportunity Assessment for SMs –Final Report –
Altech Environmental Consulting/ Marbek Resource Consultants Page 30
See Appendix A for a list of LDCs in each alliance/coalition Based on the program reviews and the LDC interviews, the following observations emerge: 6.1.2 Program Types:
Incentive Based Prescriptive and Custom Based Programs With a few exceptions, the business model exemplified by the “powerWISE Business Incentives Program (PBIP), is currently the most common suite of incentive based programming targeted to SM industry. PBIP has two streams: prescriptive and performance. The prescriptive stream offers incentives for specific end-use products, most commonly: High and Premium Efficiency Fluorescent T8 Lighting Fixtures and ENERGY
STAR® LED Exit Signs 3-phase Premium Efficiency Motors up to 200 hp ENERGY STAR® compliant 3-phase Transformers ENERGY STAR® compliant Unitary Air-Conditioning up to 20 tons in size
The custom stream offers an incentive for a given unit of energy saving (kWh) or demand reduction (kW reduction). Most incentive based activities in Ontario are structured on this basis. Given the energy use and economic potential profile for the SM industry sectors, the targeting of 3-phase premium efficiency motors is a good fit. The other products are more suited to the comfort, non-process end-uses in SM industry, particularly, lighting and air conditioning. The custom incentive stream allows for process based CDM measures but apparently, there has been little take-up among SM industry of these types of investments. Information and Training
Within the category of information and training, there are 8 program types in action at the moment and the 3 most widely used are discussed below. Energy audits as a platform for inducing customer CDM investments Some of the other LDCs have funded energy audits, on an ad hoc basis, if a particular situation arises where they will help to induce CDM investments. On the other hand, Hydro ONE has piloted an energy audit program using the Envinta “ONE-TO-FIVE” concept. Although the pilot is targeted to customers with load of 2 MW and up, the concept, in one form or another, could be designed for smaller industry customers. The difference between the Hydro ONE and powerWISE model is that it is more focused to market transformation, inducing corporate culture changes in a step-wise approach. Hence, to date Hydro ONE has completed 1 initial audits and 3 of the 11 customers are moving forward to the next stage of energy management planning and project development.

Market Profile &Conservation Opportunity Assessment for SMs –Final Report –
Altech Environmental Consulting/ Marbek Resource Consultants Page 31
On-Line Information Services Utilities are offering diverse data management services to SM industry customers online to which typically fall into the following categories: Access to consumption data: A number of standard reporting templates are
available, for cost management enabling comparisons of energy consumption at individual or multiple sites. The data can be supplied at different intervals.
Advisory services: utilities offer automated advisory services or have technical
staff available to help customers optimize their energy usage and manage the costs more effectively. The service offerings vary and can include: i) troubleshooting, referred to as “exception and performance” reports that help identify and manage any potential energy management issues, ii) solutions, whereby energy reports are interpreted at varying levels of sophistication leading to proposed O&M and capital improvements.
Toronto Hydro Energy Services offers an Energy Profiling service which, among other things, enables staff to access utility data and reports to identify costly consumption trends or problems with equipment and project utility costs. The service offers “Energy and Cost” alarms to alert the customer when energy consumption, demand or the next hour's electricity price is projected to go above a set threshold so that steps can be taken to contain costs. Interval Metering The Coalition of Large Distributors are supporting the Minister of Energy’s commitment to increase the installation of SMART meters in the province by 2007 by supporting the installation of interval metering in commercial, institutional and industrial facilities. Support mechanisms include the mandatory installation of interval meters for all customers with a peak demand of greater than 200kW (e.g., Veridian), pilot installations of interval meters (e.g., PowerStream, Toronto Hydro, Hamilton Utilities) and testing of various SMART metering communication technologies (e.g., Hydro Ottawa). The SMART meters provide customers with the option of tracking load profiles and consumption to better manage energy usage and demand. Coalition members plan to facilitate wider penetration of interval metering in all sectors, including industry, and to move beyond the pilot phase in the near future.
6.1.3 Program Delivery – Delivery Channels, Roles and Responsibilities
Partnerships and alliances play and important role in developing and deploying programs. Although multi-party programs are viewed as highly desirable they are also much more complex and time consuming in terms of legal issues, administration and verification of results. There are a number of partnerships and alliances that can be beneficial:

Market Profile &Conservation Opportunity Assessment for SMs –Final Report –
Altech Environmental Consulting/ Marbek Resource Consultants Page 32
Alliances between LDCs are deemed invaluable. Especially smaller LDCs lack resources to develop and implement CDM programs. These LDCs have to balance the cost of developing skills internally versus contracting outside sources, and managing time of human resources to provide operational services versus developing and implementing CDM programs. The main advantages of LDC alliances are reported to be sharing of knowledge and resources, efficiency, cost effectiveness and leveraging market reach and market penetration.
Partnerships with organization, contractors, manufacturers and retailers that
have experience with targeted technologies and/or targeted customers incorporate existing skills, knowledge and delivery channels.
Using expertise in the energy field, e.g. universities and consultants, can help
to develop specific initiatives and assessment tools that provide a basis for sound decisions.
To ensure program delivery is efficient, readily available and understood by all
customers it is important that the there is coordination amongst the many organizations in the energy industry. The main goal should be a rapid program deployment through the LDCs’ direct channel to the market. Most customers do not understand the relationship amongst the various organizations in the hydro industry, and an attempt to deliver programs to the end customer by different groups confuses customers and creates the impression of an uncoordinated energy industry. It would be beneficial to clearly define the roles of the LDCs, Conservation Bureau (OPA), IESO, EDA, etc.
Government and the OPA should address the areas that utilities cannot address,
for example codes, standards and broader policies. In defining the role of the Conservation Bureau (CB) and the LDCs, programs with direct interaction with customers should be the role of LDCs and the CB (OPA) should not duplicate the efforts of the LDCs, which is currently the case in the residential sector with, for example, the coupon program.
LDCs believe they are well positioned to deliver programs to the communities
they represent and have resources and expertise in conservation and demand management measures. However, typical concerns by LDCs include efficacy of measures, consistency of conservation message, communication, value for investment and economies of scale. Many utilities have not increased internal resources to address the CDM portfolio. Recognition of the impact of continued CDM programming has on resources is required in both the funding and reporting requirements.
6.1.4 Program Development
CDM program development and capacity building takes time. To ensure long-term sustainable conservation success it is necessary to thoroughly address legal and environmental issues up front. Developing programs too fast and in an uncoordinated fashion may jeopardize the success of the programs.

Market Profile &Conservation Opportunity Assessment for SMs –Final Report –
Altech Environmental Consulting/ Marbek Resource Consultants Page 33
It is recommended to give greater priority to programs designed to reduce both
base load and peak load consumption, and programs that improve the load shape, i.e. programs that flatten the load shape and improve the load factor. These programs are capable of delivering energy reduction and demand reduction benefits year round and not necessarily in a season, and provide system operators with enhanced operational flexibility.
To enhance the efficiency of programs it is recommended that administrative
reporting efforts should be streamlined where possible. If, for example, certain conservation programs have already proven to be effective, then the verification efforts required to substantiate these programs at their conclusions should be minimized.
Many customers do not consider electricity a significant factor input cost, and
industrial customer timelines for conservation projects are often longer and appear to have a lower sense of urgency then what the LDCs expected. To encourage and speed up conservation projects incentives have to be very meaningful and demonstrate a reasonably short payback period arising from a program that does not conflict with or disrupt their core business.
Some utilities reported that incentives for energy audits and feasibility studies
created an opportunity for customers to recognize the potential energy savings and advance plans for implementing solutions or measures. Other utilities reported a low success rate with energy audits and feasibility studies due to no measurable kW/kWh savings, and plan to discontinue the programs.
6.1.5 Assessment and Funding of Programs
The TRC model is seen to encourage “quick return” programs and does not provide any measure of foundation or education programs, which are critical in developing a “conservation culture”. Without savings results recognized for these activities it effectively penalizes utilities for participating in these initiatives. Recommendations made by LDCs relevant to the TRC model include:
The TRC tool needs to be expanded to take into account education and
foundation type programs. For education programs mechanisms for obtaining feedback from customers is required.
For cost effective evaluations the OEB needs to continue to refine and add to
the list of assumptions, and reflect new and emerging technologies.
Measures of programs need to be understood and clearly defined at the program design stage.
Environmental benefits, like reduction in greenhouse gas emissions, should be
added to the model.

Market Profile &Conservation Opportunity Assessment for SMs –Final Report –
Altech Environmental Consulting/ Marbek Resource Consultants Page 34
LDCs require additional clarifications on the topics of LDC cost recovery, lost revenues and criteria for assessing prudence of CDM spending. These clarifications will lead to more aggressive applications for second generation funding.
Measuring the effectiveness of a program is challenging. It requires follow up
with the client to ensure implementation, and in most instances monitoring and tracking capabilities are not in place.
A clearly defined, practical funding framework needs to be developed and
implemented, to ensure the progress in developing and implementing CDM programs are sustained past 2007. The framework should be simplistic with minimal administrative and regulatory burdens.
6.1.6 Program Deployment
Conservation opportunities exist with small industrial customers, but the marketing channel faces many challenges. These customers lack the appropriate tools or models to accurately assess their options to implement solutions, and are overwhelmed by market information.
With the emergence of new technologies and many new service providers it is
important to offer industrial customers access to information through convenient forums such as trade shows or workshops. There is a need for customers to understand the new technologies, and the impact and value these technologies can have on their specific operations. A better understanding will potentially increase participation and adoption of new energy efficient technologies.
Pilot programs or staged rollouts of new and emerging technologies, or new and
high risk applications in the marketplace, are an important step in deploying programs.
To allow the implementation of commercial programs across jurisdictions and
beyond individual stores, the needs of customers, manufacturers and retailers must be address at the corporate, municipal, provincial and national level. Effective and efficient coordination is required to allow corporations to make programs available at all store locations regardless of location by city. Large areas with low population density are a difficult and less attractive market for retailers, suppliers and other partners.
Market Profile &Conservation Opportunity Assessment for SMs –Final Report –
Altech Environmental Consulting/ Marbek Resource Consultants Page 35
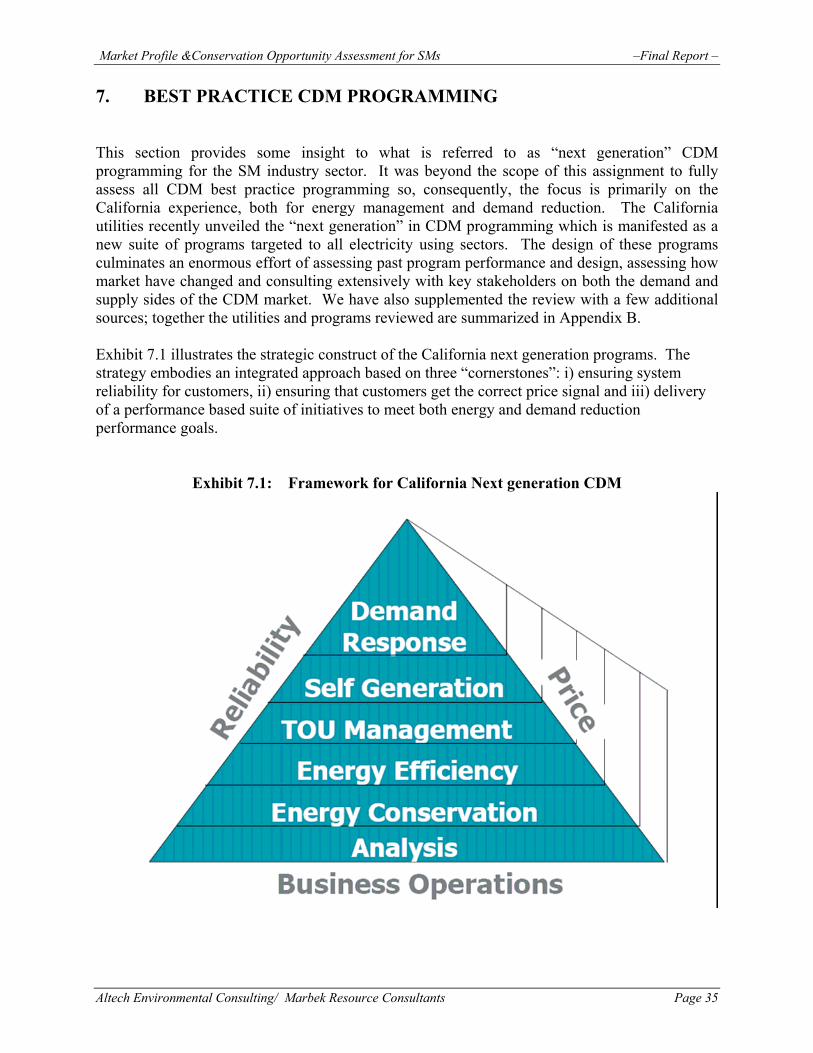
7. BEST PRACTICE CDM PROGRAMMING This section provides some insight to what is referred to as “next generation” CDM programming for the SM industry sector. It was beyond the scope of this assignment to fully assess all CDM best practice programming so, consequently, the focus is primarily on the California experience, both for energy management and demand reduction. The California utilities recently unveiled the “next generation” in CDM programming which is manifested as a new suite of programs targeted to all electricity using sectors. The design of these programs culminates an enormous effort of assessing past program performance and design, assessing how market have changed and consulting extensively with key stakeholders on both the demand and supply sides of the CDM market. We have also supplemented the review with a few additional sources; together the utilities and programs reviewed are summarized in Appendix B. Exhibit 7.1 illustrates the strategic construct of the California next generation programs. The strategy embodies an integrated approach based on three “cornerstones”: i) ensuring system reliability for customers, ii) ensuring that customers get the correct price signal and iii) delivery of a performance based suite of initiatives to meet both energy and demand reduction performance goals.
Exhibit 7.1: Framework for California Next generation CDM
Market Profile &Conservation Opportunity Assessment for SMs –Final Report –
Altech Environmental Consulting/ Marbek Resource Consultants Page 36
SM industry managers in some of the leading California utilities were asked to discuss the strategic thinking behind the formulation of the new portfolios for the SM Industry sectors and to comment on how previous program experience had led them to the program suite being offered at the present time. The key findings are summarized below. 7.1 UNDERLYING STRATEGIC ELEMENTS The key strategic approaches noted by the Californian utilities which are currently being used are summarized below. These approaches are largely based on the lessons learned from past programs, as well as the energy reduction goals imposed on the utilities by the Californian Public Utilities Commission. As elaborated below, the strategies being considered are not radical in comparison to the past CDM experience, but rather, represent further refinements and tuning of approaches that, to date, have achieved considerable success. Focus on selling the high level concept – This a philosophical adjustment from previous approaches, in that the primary emphasis is placed on selling the concept of energy efficiency to the customer first, i.e., making the business case for CDM investment. Upon this platform, the various program rebates/incentives are made available to suit the target markets and products. A focus on selling the idea that customers can help California in minimizing power outages by committing to being more energy efficient has resulted in a better reception and participation in programs from industry, than simply selling the rebate. This is akin to the efforts in Ontario to foster the “Conservation Culture”. Shift to upstream/midstream players – In the past, a strong focus was placed primarily on paying rebates and incentives to downstream customers. While the current suite of programs still contains some incentives based initiatives for customers, so-called upstream and midstream players (manufacturer and distributor) have also been included in the mix. A strategic shift to provide incentives to the upstream/midstream market is aimed at a change in the equipment stocking situation, where higher efficiency equipment will be more readily available for customers “off the shelf”. Previously, this equipment would have been a “specialty” order, creating a barrier to the uptake of more efficient equipment. This strategic shift has already been initiated with the result, in some cases, that some distributors now only carry 100% premium efficiency equipment. In addition, by providing the incentives to the distributor/contractor, the utility is able to capture the planned equipment upgrades as well as the emergency situation upgrades. Previously, if there was an emergency equipment replacement needed, a customer would typically only have access to standard equipment available off the shelf. It was noted that the shift to upstream/midstream players can result in some customer complaints because the subsidy might not be passed on to the customer. This situation could be alleviated either through a mandated requirement or as competition increases and other distributors provide rebates and customers start to shop around for competitive pricing. Third-party implementers – The use of third-party specialists who can “talk the talk” of specific industrial sectors, is strategically used to achieve credibility with industrial customers. This allows the utility to offer a more customized benefit to customers, rather than relying solely on internal utility account executives who may not have the in-depth knowledge of a particular industry. Through a Request for Proposal process, specialists are screened by the utility to ensure they have the necessary industry specific expertise and understanding of energy
Market Profile &Conservation Opportunity Assessment for SMs –Final Report –
Altech Environmental Consulting/ Marbek Resource Consultants Page 37
efficiency, and then the specialists are advised on which customers to approach. For example, one specialist may be assigned to one or more sub-sectors of the food industry, another to the wood products industry. Overall Mandate Flexibility – the utilities have worked to achieve a “cooperative” oversight with the California Public Utilities Commission (CPUC). Today, the utilities have the flexibility to make changes to programs mid-stream. Rather than having to obtain permission for each program change, they are now required to only advise the CPUC of the changes made (within certain guidelines). For example, if one program is not achieving the anticipated impact, the utility has the flexibility to transfer funds between programs, and transfer the energy targets of the program to the more successful programs. In addition, changes can be made to the types of equipment eligible for rebates, as newer generation equipment is rolled out. Previously, the acceptable types of equipment were specified (e.g. T8 lamps at 32 watts), even if a newer generation, more energy efficient model was made available after the program started. Keeping Abreast of the Market – The utilities have placed a strong strategic emphasis on ensuring that they are up to date on new developments in the market. They are continually talking to manufacturers about the next generation of technologies in development and when these technologies will be available to customers. In the pre-commercial market, utilities may participate in small scale demonstration pilots. In the commercialized market, the utilities would focus more on the gathering of empirical data on performance which they can then relay to customers. The goals set by the CPUC for the 2006 – 2008 period are much higher than in previous periods, and thus, the utilities recognize that they must be strategic in demonstrating and deploying best practices, and support innovation and new technologies. 7.2 KEYS TO SUCCESSFUL PORTFOLIO MANAGEMENT The following are some key factors in successful CDM portfolio management, based on discussions with the Californian utilities. Financial Incentives – financial incentives, for all players in the market chain, are key to achieving market transformation and changing the “status-quo”. Keep in mind the long history of CDM, in which incentives played a key part to induce market take-up of CDM measures. The utilities still maintain that financial incentives and rebates can encourage manufacturers/distributors to produce and stock premium efficiency equipment, which in turn also benefits the downstream customer in terms of operating savings and upfront capital cost savings (if the rebate/incentive is passed on to the customer). Know when the Market is Truly Transformed and Incentives can be Removed – there is a need to leave incentives in place for an adequate amount of time to achieve true market transformation. An incentive removed too soon may result in the collapse of a particular end-use or technology driven industry (e.g. the solar industry in California). However, an incentive left in place for too long may result in a high level of “free-ridership”. The key is to know what changes are being impacted by the portfolio. Flexibility – the ability to adapt to changes in the market-place and allow for adjustments based on responses to programs and technological innovations, is a key factor to portfolio management and achievement of targets.
Market Profile &Conservation Opportunity Assessment for SMs –Final Report –
Altech Environmental Consulting/ Marbek Resource Consultants Page 38
Holistic Systems Approach – a more holistic approach is being taken, i.e., a process or building systems approach versus only the specific equipment piece. For example, performance improvements for HVAC systems encompass proper sizing, equipment efficiency, proper ducting and installation, finally, commissioning. In keeping with this holistic approach, the California utilities are working with ENERGY STAR to standardize the definitions for “quality installation” and “quality contractor” as a platform to ensure the sustainability of performance of the CDM measures. Keep the Program Simple for Customers and Easy to Administer – for example, distributors can interface with a web- based system to receive rebates, resulting in a 4 x reduction in time involved to receive financial incentives. Training and Education – Training and education for both the demand- and supply-side of the CDM market is key to establishing the foundation for market transformation; it is key to sustainability of the market transformations after the programs and incentives are removed. As noted, efforts to make the business case for CDM is important, both for customers and the supply chain. Distributors are a critical part of the promotion chain, as they have more frequent contact with customers, compared to the utility. Selling the idea of energy efficiency and the benefits of higher performance equipment to design professionals (i.e. architects/engineers) is also a key factor in achieving sustainable results after the incentives programs are completed. 7.3 OTHER PROGRAMS 7.3.1 The California 20-20 Program These observations stem from a consulting review to examine the characteristics of a demand response (DR) program used during California’s energy crises of 2001 termed the 20/20 program, to see if there are lessons learned that might be relevant for Ontario.2 The California 20/20 Program was targeted at both mass-market (residential and small commercial with loads under 200 kW) and large customers (loads above 200 kW) to generate load reductions. Customers with time-of-use meters received a 20% rebate off their summer on-peak demand and energy charges if they reduced their on-peak electricity use by 20% or more. Although the residential sector was seen as a key market to generate load reductions, large customers also were a significant component of the program. The consulting review concluded that the original design of 20/20 might not be suitable to the Ontario context because of the possible incidence of high free-ridership but offered some variation to the concept for consideration. As a DR program, the 20/20 program concept was seen as an easy to deliver, easy to understand initiative that channeled the incentive through the utility bill, rather than being geared to an end-use or product. The program evaluations suggest that the 20/20 program did elicit some response in 2001 during the height of the energy crisis in California but dropped off in 2002 when the crisis abated somewhat. Unfortunately, it was difficult to generate empirical evidence regarding impacts, due, in part, from implementing the program during a crisis period which resulted in little if any planning for evaluation.
2 Summit Blue Consulting, Quick Hit DR Programs: A Study of California’s 20-20 Program, undertaken for the OPA Conservation Bureau, 2005
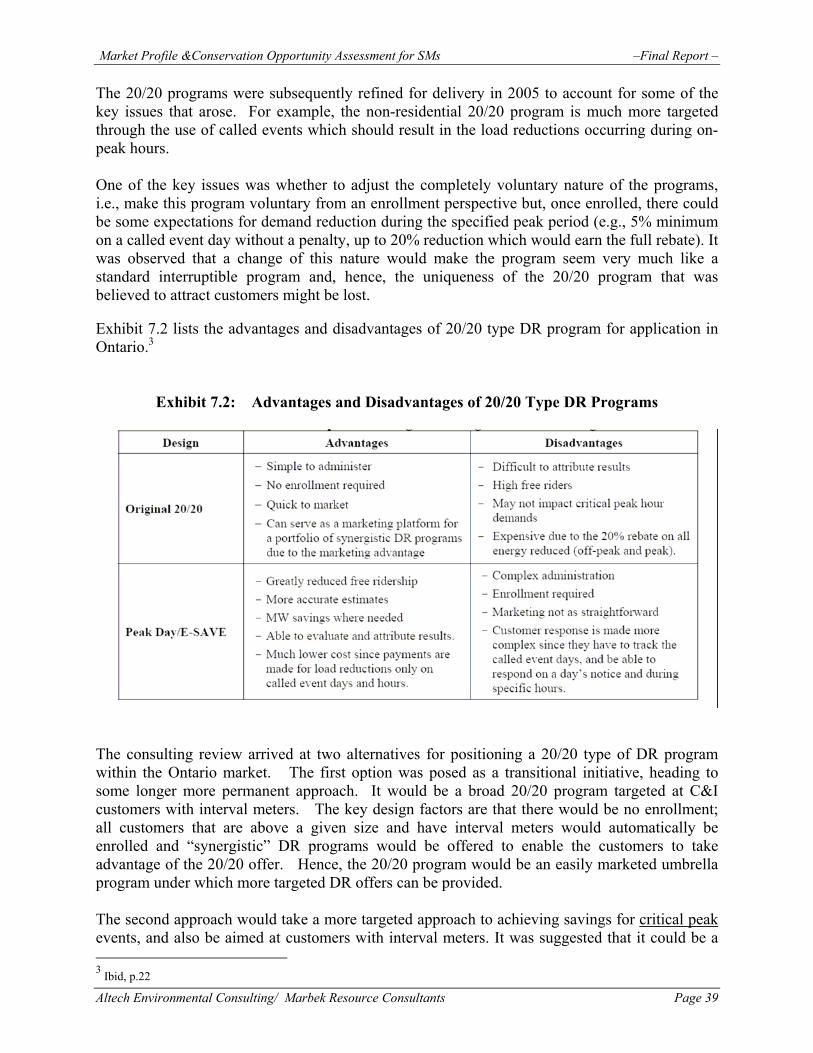
Market Profile &Conservation Opportunity Assessment for SMs –Final Report –
Altech Environmental Consulting/ Marbek Resource Consultants Page 39
The 20/20 programs were subsequently refined for delivery in 2005 to account for some of the key issues that arose. For example, the non-residential 20/20 program is much more targeted through the use of called events which should result in the load reductions occurring during on-peak hours. One of the key issues was whether to adjust the completely voluntary nature of the programs, i.e., make this program voluntary from an enrollment perspective but, once enrolled, there could be some expectations for demand reduction during the specified peak period (e.g., 5% minimum on a called event day without a penalty, up to 20% reduction which would earn the full rebate). It was observed that a change of this nature would make the program seem very much like a standard interruptible program and, hence, the uniqueness of the 20/20 program that was believed to attract customers might be lost. Exhibit 7.2 lists the advantages and disadvantages of 20/20 type DR program for application in Ontario.3
Exhibit 7.2: Advantages and Disadvantages of 20/20 Type DR Programs
The consulting review arrived at two alternatives for positioning a 20/20 type of DR program within the Ontario market. The first option was posed as a transitional initiative, heading to some longer more permanent approach. It would be a broad 20/20 program targeted at C&I customers with interval meters. The key design factors are that there would be no enrollment; all customers that are above a given size and have interval meters would automatically be enrolled and “synergistic” DR programs would be offered to enable the customers to take advantage of the 20/20 offer. Hence, the 20/20 program would be an easily marketed umbrella program under which more targeted DR offers can be provided. The second approach would take a more targeted approach to achieving savings for critical peak events, and also be aimed at customers with interval meters. It was suggested that it could be a 3 Ibid, p.22
Market Profile &Conservation Opportunity Assessment for SMs –Final Report –
Altech Environmental Consulting/ Marbek Resource Consultants Page 40
more long lasting program in that the 20% reduction required is event day specific and the baseline calculation uses data from the 10 preceding work days. As a result, the customer can build this capability as part of a long lasting program. 7.3.2 Vermont Industry CDM Efficiency Vermont is an organization that has the mandate to deliver DSM to industry in Vermont. The business model employed some of the strategic elements discussed in the California programs, particularly moving away from a “program-centric” to a more holistic markets approach in which energy efficiency services are delivered to an entire market, consolidating energy assessment and financial services within the market, rather than via separate, constrained delivery vehicles. Rather than a solely prescriptive approach, a custom approach encompasses flexible financial incentives, “on call” technical assistance, third party verification, and project financing to assist customers in incorporating energy saving measures into their planning and decision process. The key has been to establish effective working relationships with industrial customers with a focus on reducing operating costs and aligning the investments with corporate level goals. This is especially important when equipment choices are continually changing and customers continue to find creative ways to save energy and reduce costs. The traditional prescriptive approaches to efficiency overlook significant energy efficiency opportunities, both in interactive effects as well as non-electric benefits. For more complex industrial projects, a project manager is typically assigned to address requests for technical energy efficiency services. The project manager determines the scope of the proposed project, the timeline and whether proposed equipment meets high efficiency standards. A project manager can perform a site visit to verify the savings potential of the proposed installation and make additional recommendations based on information gathered from that visit. 7.3.3 Industrial Process and Equipment Efficiency in Oregon The Energy Trust of Oregon, Inc. has been delivering the “Production Efficiency Program” for more than two years to acquire large volumes of energy savings from industrial facilities. While this program is more suited to larger industrial facilities it does encompass some features suitable to the SM industry sectors. As with the other programs reviewed above, it builds on existing market relationships and offers both technical and financial support for efficiency. Among other reasons, the program success to date is due to its simplicity, its effective use of technical analysis, and to the relationships formed between program implementers and facility staff. Foremost among the program strengths is its simplicity from the perspective of the participant. The incentive is fixed to achieve a project payback to 18 months (capped at 50% of project cost). This approach contrasts favorably with those taken by programs that negotiate with participants to determine project-specific incentives or tie project incentives to savings measured after installation. It was noted that in programs without fixed incentives, it was not unusual to have secured management approval for a project only to have the incentive change, necessitating re-approaching management for project approval at the revised costs. Such changes can make facility staff hesitant to even propose a project to management.

Market Profile &Conservation Opportunity Assessment for SMs –Final Report –
Altech Environmental Consulting/ Marbek Resource Consultants Page 41
A second program strength is its use of established market actors for delivery, specifically, the engineering consulting firms and vendors that have served the industrial firms and potentially will continue to offer their products and services to industrial firms long after the program is terminated. The program includes a network of “allied technical analysis contractors” (ATACs) who conduct technical analysis studies of potential projects.
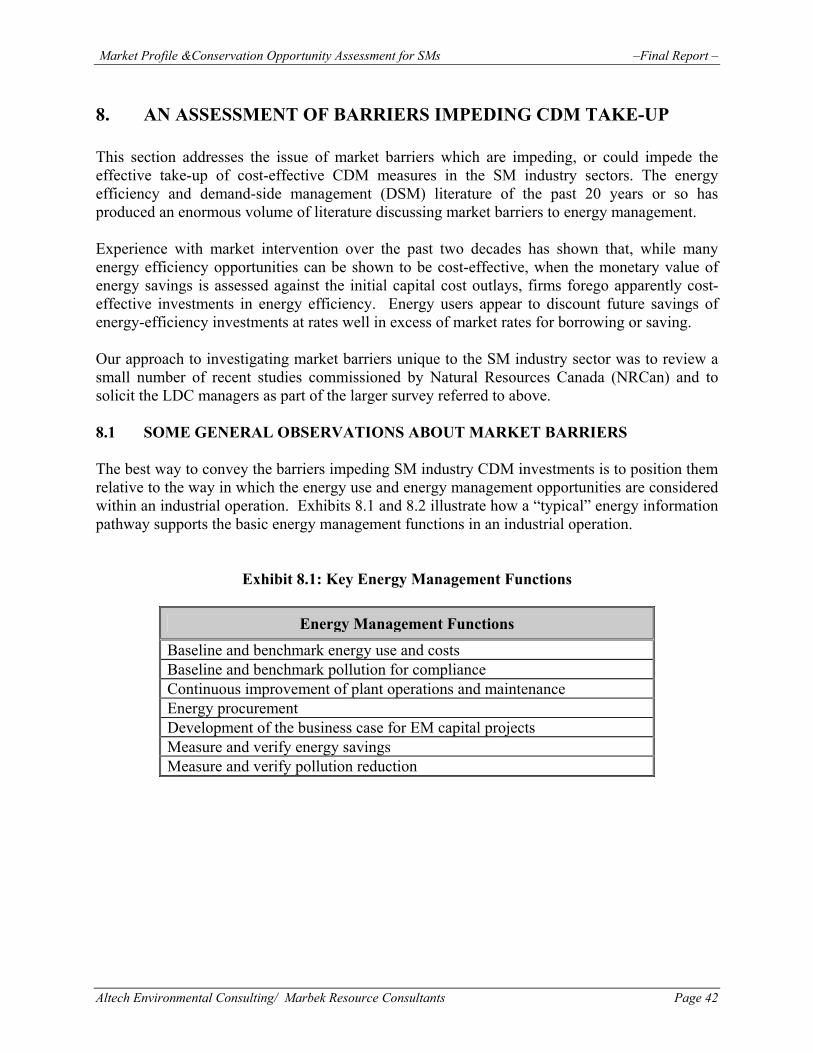
Market Profile &Conservation Opportunity Assessment for SMs –Final Report –
Altech Environmental Consulting/ Marbek Resource Consultants Page 42
8. AN ASSESSMENT OF BARRIERS IMPEDING CDM TAKE-UP This section addresses the issue of market barriers which are impeding, or could impede the effective take-up of cost-effective CDM measures in the SM industry sectors. The energy efficiency and demand-side management (DSM) literature of the past 20 years or so has produced an enormous volume of literature discussing market barriers to energy management. Experience with market intervention over the past two decades has shown that, while many energy efficiency opportunities can be shown to be cost-effective, when the monetary value of energy savings is assessed against the initial capital cost outlays, firms forego apparently cost-effective investments in energy efficiency. Energy users appear to discount future savings of energy-efficiency investments at rates well in excess of market rates for borrowing or saving. Our approach to investigating market barriers unique to the SM industry sector was to review a small number of recent studies commissioned by Natural Resources Canada (NRCan) and to solicit the LDC managers as part of the larger survey referred to above. 8.1 SOME GENERAL OBSERVATIONS ABOUT MARKET BARRIERS The best way to convey the barriers impeding SM industry CDM investments is to position them relative to the way in which the energy use and energy management opportunities are considered within an industrial operation. Exhibits 8.1 and 8.2 illustrate how a “typical” energy information pathway supports the basic energy management functions in an industrial operation.
Exhibit 8.1: Key Energy Management Functions
Energy Management Functions
Baseline and benchmark energy use and costs Baseline and benchmark pollution for compliance Continuous improvement of plant operations and maintenance Energy procurement Development of the business case for EM capital projects Measure and verify energy savings Measure and verify pollution reduction

Market Profile &Conservation Opportunity Assessment for SMs –Final Report –
Altech Environmental Consulting/ Marbek Resource Consultants Page 43
Exhibit 8.2: Energy Information Pathways
As shown, an operation starts with the baselining of energy use and costs, collecting the data and assessing what the date means in terms of energy use patterns. The baseline data is also potentially a key input to the company’s efforts to advance continuous improvement of plant operations and maintenance and procurement of energy supply. The literature indicates that industry generally does a poor job at baselining and assessing energy use and costs, particularly beyond the revenue meter, to the level of key energy end-uses. This situation is exacerbated by the another key finding from the literature, namely, that many plants do not have staff dedicated to the management of energy, or if they do, they are considerably under capacity in terms of time availability and having attained key competencies to effectively do the job. Beyond the baseline stages, the flow of the energy management functions is to advance to the identification of capital project opportunities. This is all about making and selling the business case for the CDM measures. The literature reveals all sorts of barriers relating to achieving a successfully developed and financed energy management project. They relate to project hurdle rates being too high, lack of project financing available, and, again, the lack of competencies among staff to successfully win the internal capital budgeting competition. When one brings together these various barriers, they are, in effect, manifestations of one overall issue, namely, a corporate culture paradigm shift in SM industry that has yet to take place, a paradigm where the management of energy is treated as a strategic corporate issue, not simply an operational issue. A real shift in corporate culture would be characterized by the development and implementation of an energy management system that embodies the key energy management functions identified above. Of course, as previously noted, in the SM industry market, energy costs as a percentage of operating costs, is less than what is often found in the large energy intensive industries and consequently, is less of a driver to influence a desired change in corporate culture. This makes the challenge more difficult. Exhibit 8.3 shows how these various barriers were conveyed for the LDC survey.
Energy Use Measurement
Analysis
Regular Reporting
O&M/Continuous Improvement
Benchmarking & Best Practice
Opportunities Identification
Selling the Business Case
Project Implementation
Monitoring & Verification
Energy Procurement
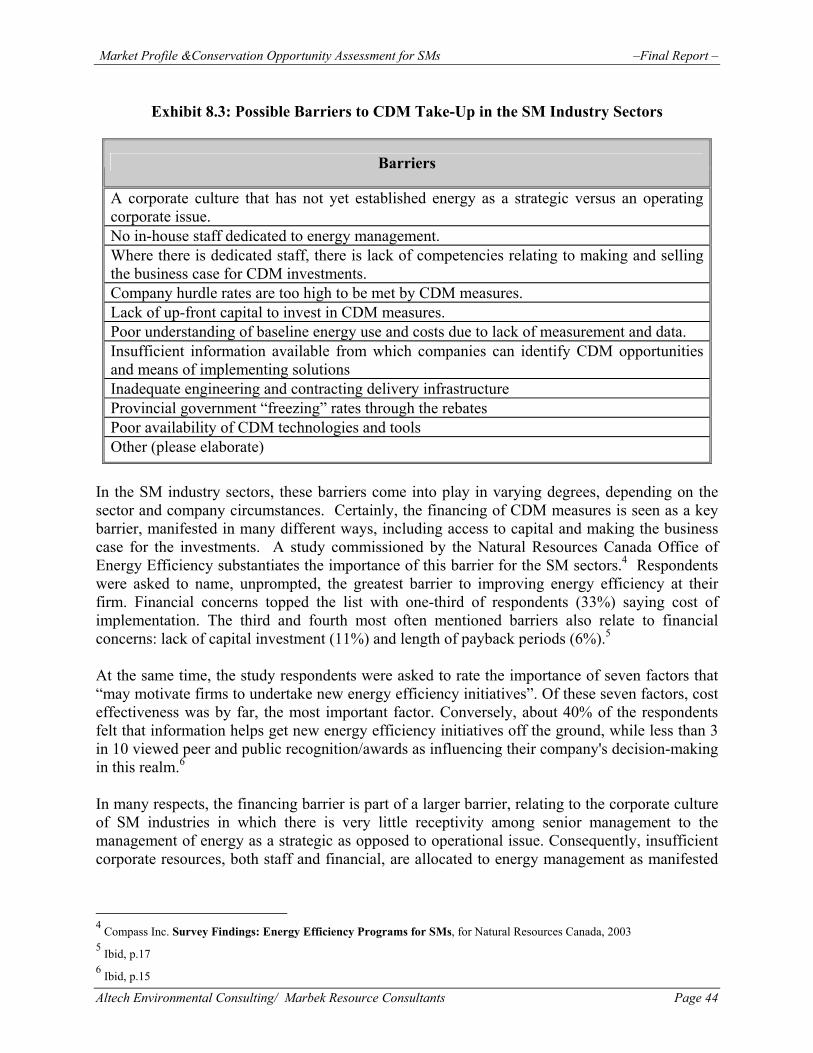
Market Profile &Conservation Opportunity Assessment for SMs –Final Report –
Altech Environmental Consulting/ Marbek Resource Consultants Page 44
Exhibit 8.3: Possible Barriers to CDM Take-Up in the SM Industry Sectors
Barriers
A corporate culture that has not yet established energy as a strategic versus an operating corporate issue. No in-house staff dedicated to energy management. Where there is dedicated staff, there is lack of competencies relating to making and selling the business case for CDM investments. Company hurdle rates are too high to be met by CDM measures. Lack of up-front capital to invest in CDM measures. Poor understanding of baseline energy use and costs due to lack of measurement and data. Insufficient information available from which companies can identify CDM opportunities and means of implementing solutions Inadequate engineering and contracting delivery infrastructure Provincial government “freezing” rates through the rebates Poor availability of CDM technologies and tools Other (please elaborate)
In the SM industry sectors, these barriers come into play in varying degrees, depending on the sector and company circumstances. Certainly, the financing of CDM measures is seen as a key barrier, manifested in many different ways, including access to capital and making the business case for the investments. A study commissioned by the Natural Resources Canada Office of Energy Efficiency substantiates the importance of this barrier for the SM sectors.4 Respondents were asked to name, unprompted, the greatest barrier to improving energy efficiency at their firm. Financial concerns topped the list with one-third of respondents (33%) saying cost of implementation. The third and fourth most often mentioned barriers also relate to financial concerns: lack of capital investment (11%) and length of payback periods (6%).5 At the same time, the study respondents were asked to rate the importance of seven factors that “may motivate firms to undertake new energy efficiency initiatives”. Of these seven factors, cost effectiveness was by far, the most important factor. Conversely, about 40% of the respondents felt that information helps get new energy efficiency initiatives off the ground, while less than 3 in 10 viewed peer and public recognition/awards as influencing their company's decision-making in this realm.6 In many respects, the financing barrier is part of a larger barrier, relating to the corporate culture of SM industries in which there is very little receptivity among senior management to the management of energy as a strategic as opposed to operational issue. Consequently, insufficient corporate resources, both staff and financial, are allocated to energy management as manifested
4 Compass Inc. Survey Findings: Energy Efficiency Programs for SMs, for Natural Resources Canada, 2003 5 Ibid, p.17 6 Ibid, p.15
Market Profile &Conservation Opportunity Assessment for SMs –Final Report –
Altech Environmental Consulting/ Marbek Resource Consultants Page 45
by the lack of trained, dedicated staff to manage energy. In turn, this makes it all the more difficult to making and selling the business case for the CDM investment. 8.2 LDC MANAGERS SURVEY RESULTS The LDC managers were asked to explore the main barriers to the effective take-up of CDM measures. They were asked to rate a prompted list of barriers, as shown in Exhibit 8.3 and asked to add additional barriers not found on the list. The LDC managers were asked to consider the significance of the barriers from two perspectives: i) short- to mid-term market take-up and ii) mid-to long-term change towards a conservation culture in industry? In the short term, the emphasis is on how the barriers would impede CDM measure take-up. In the longer term, the emphasis on how the barriers would impede the corporate culture shift discussed above. For both of these perspectives, the LDC managers were asked to rate the barriers using the scale: 1= very significant barrier, 2= somewhat significant barrier, 3= not significant at all. The results are presented in Exhibit 8.4 below. As shown, most of the identified barriers are rated in the range of between very and somewhat significant barrier. There isn’t an enormous variance between the results from the perspectives of CDM performance in the short term and changing corporate culture in the longer term. From the standpoint of CDM performance in the short-term, the three main barriers are, in order of decreasing significance: i) no in-house staff dedicated to energy management, ii) company hurdle rates are too high to be met by CDM measures, iii) a corporate culture that has not yet established energy as a strategic versus an operating corporate issue. From the standpoint of changing corporate culture in the longer term, the main barriers are similar, with the exception that rated third in importance are two impediments: i) a poor understanding of baseline energy use and costs due to lack of measurement and data and ii) provincial government “freezing” rates through the rebates.

Market Profile &Conservation Opportunity Assessment for SMs –Final Report –
Altech Environmental Consulting/ Marbek Resource Consultants Page 46
Exhibit 8.4: CDM Barriers Reported By LDC Respondents
Rating
Barriers CDM Measure Take-up
Long Term Change in Conservation
Culture A corporate culture that has not yet established energy as a strategic versus an operating corporate issue.
1.3 1.7
No in-house staff dedicated to energy management. 1.0 1.1 Where there is dedicated staff, there is lack of competencies relating to making and selling the business case for CDM investments.
1.7 1.8
Company hurdle rates are too high to be met by CDM measures.
1.2 1.2
Lack of up-front capital to invest in CDM measures. 1.5 1.8 Poor understanding of baseline energy use and costs due to lack of measurement and data.
1.6 1.6
Insufficient information available from which companies can identify CDM opportunities and means of implementing solutions
2.0 1.8
Inadequate engineering and contracting delivery infrastructure 2.0 1.9 Provincial government “freezing” rates through the rebates 1.6 1.6 Poor availability of CDM technologies and tools 2.1 2.3

Market Profile &Conservation Opportunity Assessment for SMs –Final Report –
Altech Environmental Consulting/ Marbek Resource Consultants Page 47
9. PROGRAM CONCEPTS This section presents a suite of CDM program concepts for consideration to advance take-up of CDM measures in the SM industry sectors. The section is organized under the following headings: Enabling conditions fro CDM in the SM industry market Program concepts: LDC survey Program concepts for SM industry in Ontario
9.1 ENABLING CONDITIONS FOR CDM IN THE SM INDUSTRY MARKETS As part of the LDC survey, respondents were asked to comment on the enabling conditions that need to be in place in order to achieve significant CDM in the SM industry sector. Their recommendations fall into two categories: i) policy and strategic conditions, and ii) program design conditions; both are elaborated below. Strategic Strategically, the LDCs emphasize that effective CDM programming in the SM sectors requires that certain fundamental conditions are in place to ensure clarity and consistency with respect to CDM delivery role and jurisdictions and CDM funding. There must be market clarity with regard to pricing, rules and, in particular, the LDCs need a long-term, stable funding base for CDM delivery. There is a desire to see that the regulatory oversight on CDM not become cumbersome and intrusive, to the point where the “transaction costs” of doing CDM are too high to justify to shareholders a business case for doing so. There is also a consistent view that electricity should not be subsidized in any form so that customers receive the correct market signal. Some of the LDCs also recognize that they need better baseline data with which to segment and target their markets for CDM programs and measures. Customer data for most LDCs does not have sufficient parameters to enable sorting and classification of data. For example, customer data generally does not indicate the customer’s NAICS classification or any other description to indicate its industrial classification. Existing data is generally classified by rate class, consumption volume, customer name and account number. Program Design Respondents noted that, for the SM sectors, simplicity of design is very important. The other important theme is that information and financial incentives have to be complementary as a package delivered to SM industry customers. Respondents noted that information has to be designed to help sell the business case for CDM measures while incentives are necessary to induce investments. 9.2 PROGRAM CONCEPTS: LDC SURVEY The LDC respondents were asked to rate a set of program concepts identified as being suitable to address the listed barriers identified above. The program concepts were categorized in 4 areas:
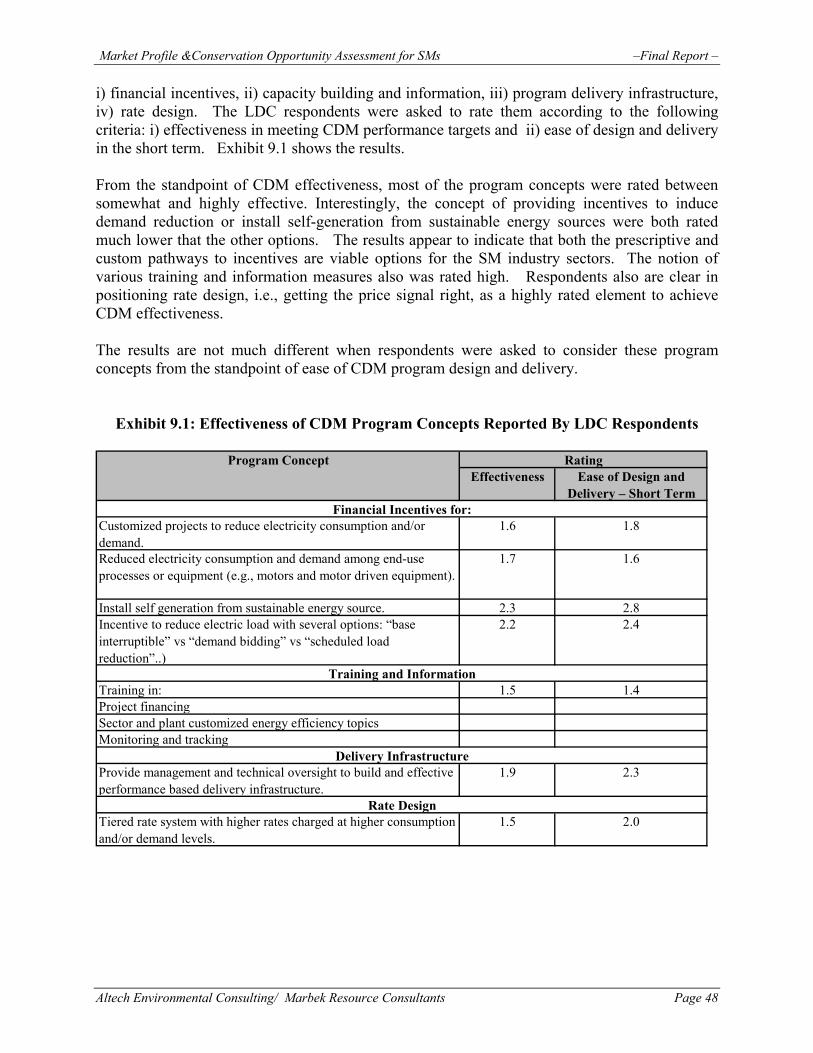
Market Profile &Conservation Opportunity Assessment for SMs –Final Report –
Altech Environmental Consulting/ Marbek Resource Consultants Page 48
i) financial incentives, ii) capacity building and information, iii) program delivery infrastructure, iv) rate design. The LDC respondents were asked to rate them according to the following criteria: i) effectiveness in meeting CDM performance targets and ii) ease of design and delivery in the short term. Exhibit 9.1 shows the results. From the standpoint of CDM effectiveness, most of the program concepts were rated between somewhat and highly effective. Interestingly, the concept of providing incentives to induce demand reduction or install self-generation from sustainable energy sources were both rated much lower that the other options. The results appear to indicate that both the prescriptive and custom pathways to incentives are viable options for the SM industry sectors. The notion of various training and information measures also was rated high. Respondents also are clear in positioning rate design, i.e., getting the price signal right, as a highly rated element to achieve CDM effectiveness. The results are not much different when respondents were asked to consider these program concepts from the standpoint of ease of CDM program design and delivery.
Exhibit 9.1: Effectiveness of CDM Program Concepts Reported By LDC Respondents
Effectiveness Ease of Design and Delivery – Short Term
Customized projects to reduce electricity consumption and/or demand.
1.6 1.8
Reduced electricity consumption and demand among end-use processes or equipment (e.g., motors and motor driven equipment).
1.7 1.6
Install self generation from sustainable energy source. 2.3 2.8Incentive to reduce electric load with several options: “base interruptible” vs “demand bidding” vs “scheduled load reduction”..)
2.2 2.4
Training in: 1.5 1.4Project financingSector and plant customized energy efficiency topicsMonitoring and tracking
Provide management and technical oversight to build and effective performance based delivery infrastructure.
1.9 2.3
Tiered rate system with higher rates charged at higher consumption and/or demand levels.
1.5 2.0Rate Design
Training and Information
Delivery Infrastructure
Program Concept Rating
Financial Incentives for:
Market Profile &Conservation Opportunity Assessment for SMs –Final Report –
Altech Environmental Consulting/ Marbek Resource Consultants Page 49
9.3 PROGRAM CONCEPTS: ONTARIO SM INDUSTRY This section presents program concepts with which to deliver conservation and demand management (CDM) energy to SM industry in Ontario and achieve real, verifiable and sustainable energy and demand reductions. It provides a summary of the program concepts, barriers to be addressed, and a more detailed outline of each program concept. The development of the program concepts is based on the following key assumptions: Change corporate culture: energy as strategic rather than operational priority. Geared to productivity and competitiveness. Programs to be comprehensive and solutions based, which includes all energy end-uses.
In developing successful programs the following principles should be taken into consideration: Delivery channels correspond to market actors and every link in the delivery channel is
addressed. Streamlined, easy to participate in and easy to administer. Customers are reached based on their needs. Dedicated staff for each market segment. Comprehensive approach. Need to include other players, e.g. third parties and partnerships
Programs concepts are summarized in four categories: Category 1: Financial Incentives 1) Incentive for customized project to reduce electricity consumption and/or demand. 2) Incentive for projects that improve productivity, with the benefit of reducing electricity
consumption. 3) Incentives to reduce electricity consumption and demand by end-use processes or
equipment, including: Air displacement or ventilation systems Compressed air system Pumps Conveyance equipment Refrigeration and cooling systems Motors Lighting system
4) Incentive to monitor and track electricity usage. 5) Incentive to install self generation from sustainable energy source. 6) Financial or credit based incentive in recognition of reducing electricity consumption
and/or demand.
Market Profile &Conservation Opportunity Assessment for SMs –Final Report –
Altech Environmental Consulting/ Marbek Resource Consultants Page 50
7) Demand response specific program concepts:
Incentive to participate in mandatory program requiring predetermined load reduction when requested. (Generally referred to as a “base interruptible” program.)
Incentive to participate in a program to voluntary reduce electric load, in response
to a request submitted in advance of the period when the load reduction is required. (Generally referred to as a “demand bidding” program.)
Incentive to reduce electric load during predetermined time periods. (Generally
referred to as a “scheduled load reduction” program.) Incentive to install monitoring equipment that will enable customer to participate
in programs. Category 2: Capacity Building and Information 1) Fund training in:
Project financing Sector and plant customized energy efficiency topics Monitoring and tracking
2) Certification in recognition of electricity conservation facilities/customers. 3) Provide a reference source of energy efficiency information and tools. 4) Fund or provide data management service. Category 3: Delivery Infrastructure 1) Provide management and technical oversight to build and effective performance based
delivery infrastructure. Category 4: Rate Design 1) Tiered rate system with higher rates charged at higher consumption and/or demand
levels. These program concepts are presented in more detail in Appendix C.

Market Profile &Conservation Opportunity Assessment for SMs –Final Report –
Altech Environmental Consulting/ Marbek Resource Consultants Page 51
10. ACHIEVABLE POTENTIAL FORECAST This section presents the industrial sector achievable potential analysis, for the study period (2005 to 2025) and is organized under the following topics: The concept of achievable potential Definition of the achievable potential program concepts The achievable potential scenario assumptions Results Observations, uncertainties and implications.
10.1 THE CONCEPT The achievable potential (also often referred to as the market potential), is a measure of how a target market may respond to one or more market interventions designed to expand and accelerate market take-up of CDM measures. The rationale for market interventions is to address one or more barriers and failures which impede market take-up of these measures to the level of what is economically viable, today and in the future, when market circumstances are expected to change. The achievable potential is calculated relative to the SM Industry Reference Case forecast. The economic CDM potential, as reported in section 5, provides a boundary of how much economic CDM can be achieved during the study period, assuming circumstances where “rational” economic decision-makers are making CDM investments unimpeded by market barriers. We know that these ideal circumstances rarely exist, most CDM investment decisions are sub-optimal cutting across all the sectors of the economy. Market barriers continue to impede optimal investments and this situation has been elaborated in section 8 of the report. 10.2 THE ACHIEVABLE POTENTIAL PROGRAM CONCEPTS We have considered a variety of programs concepts to help advance the market take-up of cost-effective CDM measures and, in doing so, have examined the landscape of CDM programming in other jurisdictions. The program concepts fall into four categories: i) financial incentives, ii) market transformation, iii) energy performance standards and iv) electricity pricing. With the exception of standards, the receptivity of the other program concepts was tested in a brief survey of LDC managers and the results reported in section 9. Three program concepts, relating to financial incentives, pricing and market transformation activities, were rated between somewhat and highly effective options by the LDC respondents. The survey results indicate that both the prescriptive and custom pathways to incentives are viable options for the SM industry sectors. The package of activities that support market transformation, and various training and information measures, also was rated high. Finally, respondents also are clear in positioning rate design, i.e., getting the price signal right, as a highly rated element to achieve CDM effectiveness.
Market Profile &Conservation Opportunity Assessment for SMs –Final Report –
Altech Environmental Consulting/ Marbek Resource Consultants Page 52
These results, together with a brief scan of industry program evaluations and other pertinent literature, have led to formulation of two achievable potential scenarios: i) financial incentive package and ii) market transformation, elaborated below. Financial Incentives
Financial subsidy is a policy instrument designed to reduce the energy management investment cost to a level commensurate to the business and consumer hurdle rates. Subsidies for energy management continue to be a prevalent means of delivering CDM in Canada and elsewhere. There is a considerable gap between the social and private discount rates for CDM and so CDM investments are sub-optimal. Hence, the argument is that if a particular CDM measure passes a societal cost test, then it is legitimate to use subsidies to induce market take-up of the measure.7 It is important to note that the financial incentives package will include the market transformation activities elaborated below. The survey findings and other literature review findings confirm that, over the long run, it is highly critical to establish the enabling conditions with which CDM investments and performance can be sustained. Together, these types of activities have been referred to market transformation measures and, consequently, they are assumed to be part of the financial incentives package. The incentives part of the program concept will, in effect, be a hybrid of both custom and performance based incentives as described in section 9.
Market Transformation
This category comprises all of the measures necessary to create in the target market the enabling conditions for sustainable energy performance improvements across all of the major energy end-uses. The package includes building competencies for plant staff, management and service providers across a variety of non-technical and technical topics, providing tools and techniques, supporting energy audits and so on.
The achievable potential analysis, for both of these program concepts implicitly assumes that the SM industry market will be affected by both of the other program concept categories discussed in section 9, energy performance standards and pricing. The analysis assumes that: The federal and provincial governments will continue to advance the application of
minimum energy performance standards for equipment, some of which may affect equipment used in the SM industry sectors (e.g., motors, HVAC equipment).
That some form of real time pricing will take shape to send SM industry customers the
correct price signal. The on-going efforts of the LDCs to support the installation of interval meters are a first step in this direction.
7 Another way of looking at this is that, if the cost of delivering the energy management measure is less than the social cost of the displaced energy form, then it is an economically legitimate investment from the standpoint of society.

Market Profile &Conservation Opportunity Assessment for SMs –Final Report –
Altech Environmental Consulting/ Marbek Resource Consultants Page 53
10.3 THE ACHIEVABLE POTENTIAL ASSUMPTIONS Two achievable potential scenarios have been analyzed. The financial incentives package is referred to as the upper bound scenario and the market transformation scenario is referred to as the lower bound scenario. The construct for the scenarios is illustrated in Exhibit 10.1 below. In this construct the electricity consumption in the SM industry sectors is driven by the saturation of the CDM technologies that, for the purpose of this study, have been grouped as CDM technology bundles. As shown in Exhibit 10.1, five such bundles have been identified for the achievable potential analysis. The system level CDM measures are assumed to be modeled at the same rate as the process measures shown in the table and so were not explicitly referred to in the consultations discussed below. So for instance, a 15% base year saturation of the HE motor-motor driven equipment bundle means that 85% of the market at that time was still using the standard efficiency package of equipment. Conversely, the economic potential analysis showed that most of the CDM candidate measures passed the TRC test on a full cost basis and therefore, the economic potential shows 100% saturation of these bundles by 2015. The achievable potential scenarios were expected to fall somewhere in between.
Exhibit 10.1 Program Construct for Achievable Potential Scenarios
CDM technology bundle
2005 Base Year
% Saturation
2015 Economic Potential Absolute
Saturation
2015 Achievable %
Change Saturation or
Absolute Saturation HE Motors-motor driven equipment (pumps, fans)
15 100
HE Air compressors 20 100 HE Process cooling (e.g. refrigeration, chillers)
10 100
HE Process heating (e.g. furnaces) 10 100 HE HVAC 20 100 HE Lighting 15 100 A small group of industrial energy engineering service companies were consulted for suggestions on how each of the proposed program concepts would affect the market, in terms of changing the market saturations of the CDM measure bundles. They were given the option of presenting a percentage change in 2015, relative to the base year or an absolute value in 2015. They were asked to walk through the two proposed program concepts and given the opportunity to introduce new concepts, although none did. The consultations with this group led to a well defined set of metrics for the financial incentive package, but less so for the market transformation program concept. Given the narrow range of
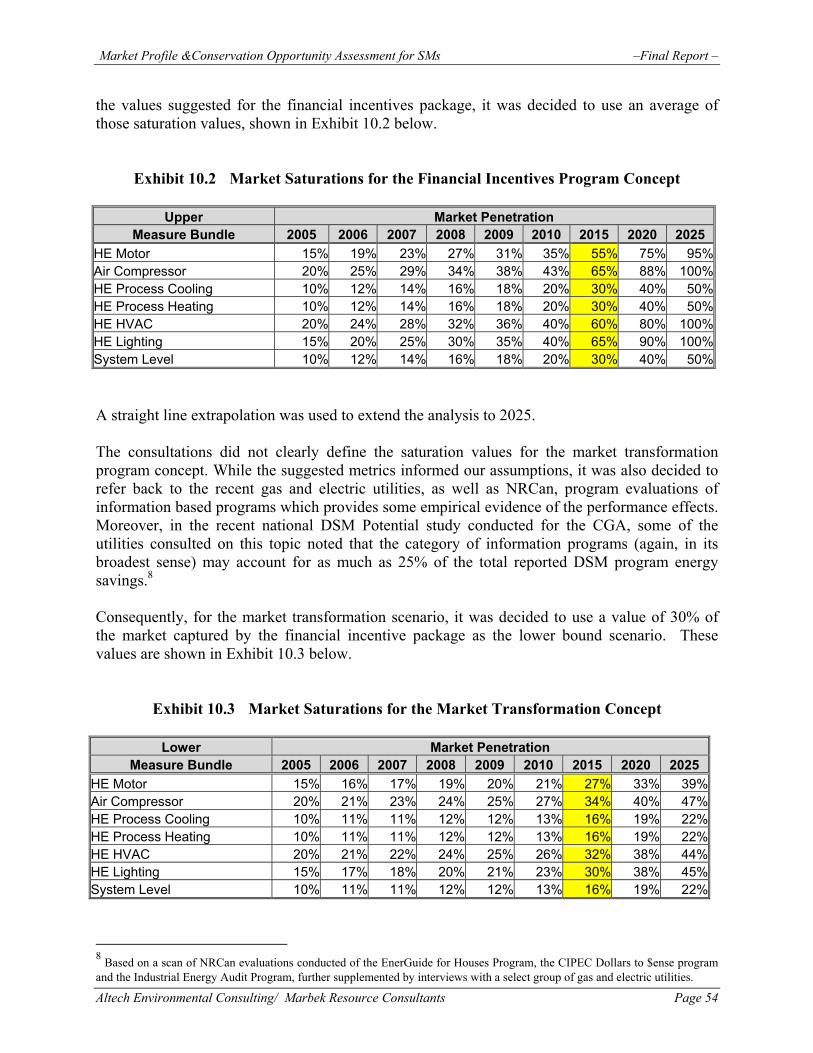
Market Profile &Conservation Opportunity Assessment for SMs –Final Report –
Altech Environmental Consulting/ Marbek Resource Consultants Page 54
the values suggested for the financial incentives package, it was decided to use an average of those saturation values, shown in Exhibit 10.2 below.
Exhibit 10.2 Market Saturations for the Financial Incentives Program Concept
Upper Market Penetration Measure Bundle 2005 2006 2007 2008 2009 2010 2015 2020 2025
HE Motor 15% 19% 23% 27% 31% 35% 55% 75% 95%Air Compressor 20% 25% 29% 34% 38% 43% 65% 88% 100%HE Process Cooling 10% 12% 14% 16% 18% 20% 30% 40% 50%HE Process Heating 10% 12% 14% 16% 18% 20% 30% 40% 50%HE HVAC 20% 24% 28% 32% 36% 40% 60% 80% 100%HE Lighting 15% 20% 25% 30% 35% 40% 65% 90% 100%System Level 10% 12% 14% 16% 18% 20% 30% 40% 50% A straight line extrapolation was used to extend the analysis to 2025. The consultations did not clearly define the saturation values for the market transformation program concept. While the suggested metrics informed our assumptions, it was also decided to refer back to the recent gas and electric utilities, as well as NRCan, program evaluations of information based programs which provides some empirical evidence of the performance effects. Moreover, in the recent national DSM Potential study conducted for the CGA, some of the utilities consulted on this topic noted that the category of information programs (again, in its broadest sense) may account for as much as 25% of the total reported DSM program energy savings.8 Consequently, for the market transformation scenario, it was decided to use a value of 30% of the market captured by the financial incentive package as the lower bound scenario. These values are shown in Exhibit 10.3 below.
Exhibit 10.3 Market Saturations for the Market Transformation Concept
Lower Market Penetration Measure Bundle 2005 2006 2007 2008 2009 2010 2015 2020 2025
HE Motor 15% 16% 17% 19% 20% 21% 27% 33% 39%Air Compressor 20% 21% 23% 24% 25% 27% 34% 40% 47%HE Process Cooling 10% 11% 11% 12% 12% 13% 16% 19% 22%HE Process Heating 10% 11% 11% 12% 12% 13% 16% 19% 22%HE HVAC 20% 21% 22% 24% 25% 26% 32% 38% 44%HE Lighting 15% 17% 18% 20% 21% 23% 30% 38% 45%System Level 10% 11% 11% 12% 12% 13% 16% 19% 22%
8 Based on a scan of NRCan evaluations conducted of the EnerGuide for Houses Program, the CIPEC Dollars to $ense program and the Industrial Energy Audit Program, further supplemented by interviews with a select group of gas and electric utilities.
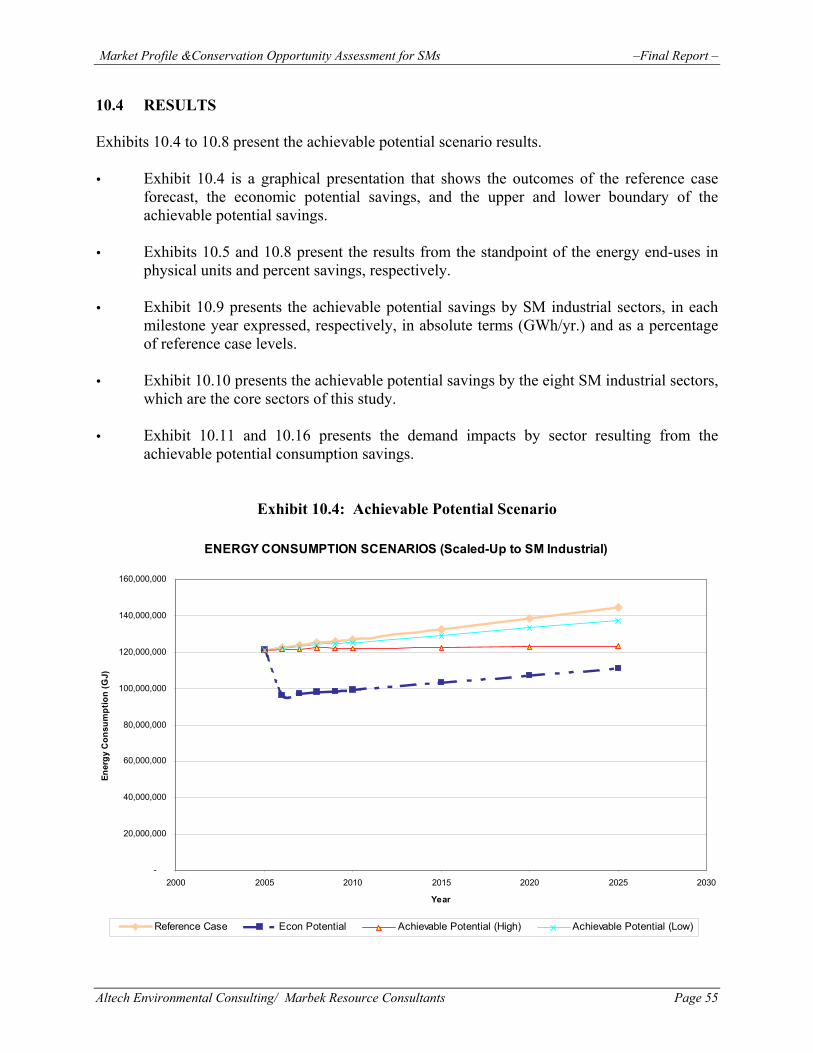
Market Profile &Conservation Opportunity Assessment for SMs –Final Report –
Altech Environmental Consulting/ Marbek Resource Consultants Page 55
10.4 RESULTS Exhibits 10.4 to 10.8 present the achievable potential scenario results. Exhibit 10.4 is a graphical presentation that shows the outcomes of the reference case
forecast, the economic potential savings, and the upper and lower boundary of the achievable potential savings.
Exhibits 10.5 and 10.8 present the results from the standpoint of the energy end-uses in
physical units and percent savings, respectively. Exhibit 10.9 presents the achievable potential savings by SM industrial sectors, in each
milestone year expressed, respectively, in absolute terms (GWh/yr.) and as a percentage of reference case levels.
Exhibit 10.10 presents the achievable potential savings by the eight SM industrial sectors,
which are the core sectors of this study. Exhibit 10.11 and 10.16 presents the demand impacts by sector resulting from the
achievable potential consumption savings.
Exhibit 10.4: Achievable Potential Scenario ENERGY CONSUMPTION SCENARIOS (Scaled-Up to SM Industrial)
-
20,000,000
40,000,000
60,000,000
80,000,000
100,000,000
120,000,000
140,000,000
160,000,000
2000 2005 2010 2015 2020 2025 2030
Year
Ener
gy C
onsu
mpt
ion
(GJ)
Reference Case Econ Potential Achievable Potential (High) Achievable Potential (Low)

Market Profile &Conservation Opportunity Assessment for SMs –Final Report –
Altech Environmental Consulting/ Marbek Resource Consultants Page 56
Exhibit 10.5: Achievable Potential Savings by End-Use (GWh) – Upper Bound
Exhibit 10.6: Achievable Potential Savings by End-Use (%) – Upper Bound
Level 1 Level 2 Level 3 2005 2006 2007 2008 2009 2010 2015 2020 2025Boilers 0 1 1 2 3 3 6 10 14Furnaces 0 12 24 36 49 61 127 198 276Chillers 0 31 46 62 78 94 180 273 373Forced Air Coolers 0 0 0 0 0 0 1 2 2Cooling Tower 0 2 4 5 7 8 16 25 35
0 104 198 294 391 489 1,008 1,574 2,1880 24 46 69 91 114 237 370 5140 55 107 160 213 267 553 865 1,0950 15 29 44 59 74 154 241 3350 5 9 14 19 24 49 76 1060 1 1 2 3 4 8 12 170 10 18 26 34 42 84 130 1810 32 64 96 128 161 336 525 6460 0 1 1 1 2 4 6 8
Cooling 0 3 5 8 10 13 27 42 580 3 5 8 10 12 24 38 520 298 559 828 1,095 1,370 2,814 4,387 5,902
End-Use Annual Energy Savings by Milestone Year (GWh)
Process
Direct Heat
Cooling
MotorsPumpsCompressorsFans/Blowers
LightingHeating
Ventilation
Comfort
TOTAL:
ConveyersElectrochemicalOther Process
Level 1 Level 2 Level 3 2005 2006 2007 2008 2009 2010 2015 2020 2025Boilers - 0.3% 0.2% 0.2% 0.2% 0.2% 0.2% 0.2% 0.2%Furnaces - 4% 4% 4% 4% 4% 5% 5% 5%Chillers - 10% 8% 8% 7% 7% 6% 6% 6%Forced Air Coolers - 0.0% 0.0% 0.0% 0.0% 0.0% 0.0% 0.0% 0.0%Cooling Tower - 1% 1% 1% 1% 1% 1% 1% 1%
- 35% 35% 36% 36% 36% 36% 36% 37%- 8% 8% 8% 8% 8% 8% 8% 9%- 19% 19% 19% 19% 20% 20% 20% 19%- 5% 5% 5% 5% 5% 5% 5% 6%- 2% 2% 2% 2% 2% 2% 2% 2%- 0.2% 0.3% 0.3% 0.3% 0.3% 0.3% 0.3% 0.3%- 3% 3% 3% 3% 3% 3% 3% 3%- 11% 11% 12% 12% 12% 12% 12% 11%- 0.1% 0.1% 0.1% 0.1% 0.1% 0.1% 0.1% 0.1%- 1% 1% 1% 1% 1% 1% 1% 1%- 1% 1% 1% 1% 1% 1% 1% 1%
100% 100% 100% 100% 100% 100% 100% 100%
Percentage Annual Energy Savings by End-Use
Process
Direct Heat
Cooling
Pumps
End-Use
ConveyersElectrochemical
Motors
TOTAL:
Other ProcessLightingHeatingCooling
CompressorsFans/Blowers
Comfort
Ventilation
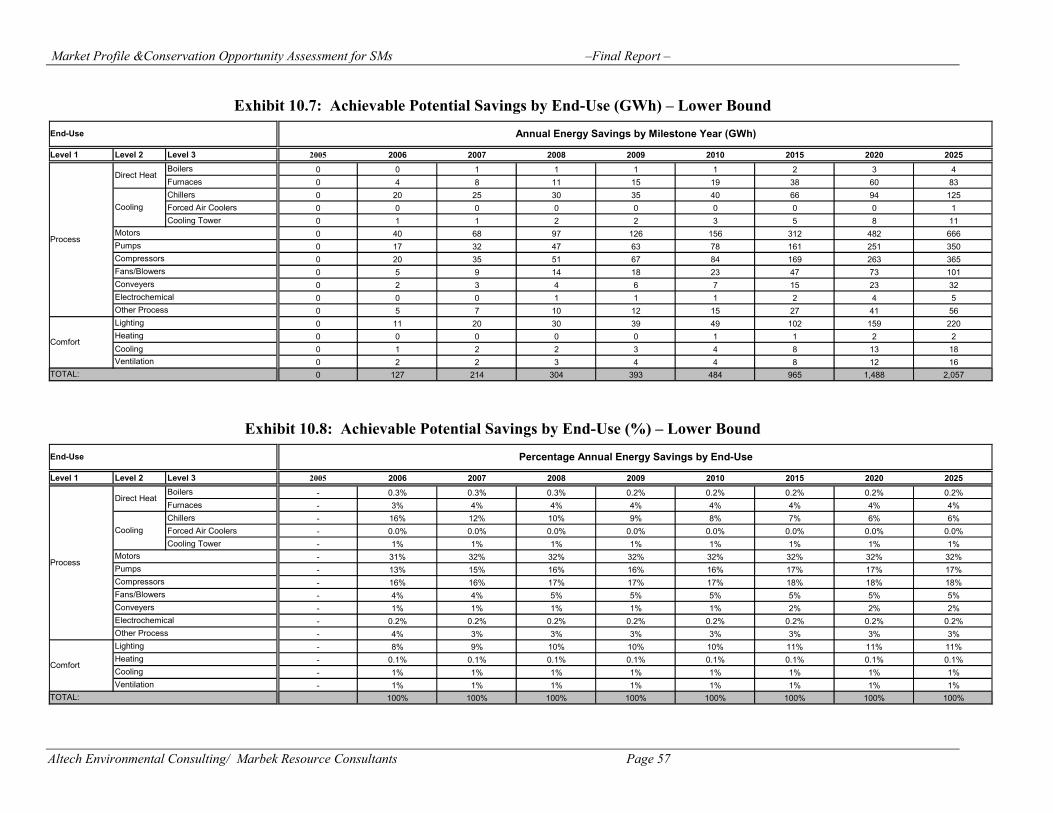
Market Profile &Conservation Opportunity Assessment for SMs –Final Report –
Altech Environmental Consulting/ Marbek Resource Consultants Page 57
Exhibit 10.7: Achievable Potential Savings by End-Use (GWh) – Lower Bound
Exhibit 10.8: Achievable Potential Savings by End-Use (%) – Lower Bound
Level 1 Level 2 Level 3 2005 2006 2007 2008 2009 2010 2015 2020 2025Boilers 0 0 1 1 1 1 2 3 4Furnaces 0 4 8 11 15 19 38 60 83Chillers 0 20 25 30 35 40 66 94 125Forced Air Coolers 0 0 0 0 0 0 0 0 1Cooling Tower 0 1 1 2 2 3 5 8 11
0 40 68 97 126 156 312 482 6660 17 32 47 63 78 161 251 3500 20 35 51 67 84 169 263 3650 5 9 14 18 23 47 73 1010 2 3 4 6 7 15 23 320 0 0 1 1 1 2 4 50 5 7 10 12 15 27 41 560 11 20 30 39 49 102 159 2200 0 0 0 0 1 1 2 2
Cooling 0 1 2 2 3 4 8 13 180 2 2 3 4 4 8 12 160 127 214 304 393 484 965 1,488 2,057
ConveyersElectrochemicalOther Process
Comfort
TOTAL:
LightingHeating
Ventilation
End-Use Annual Energy Savings by Milestone Year (GWh)
Process
Direct Heat
Cooling
MotorsPumpsCompressorsFans/Blowers
Level 1 Level 2 Level 3 2005 2006 2007 2008 2009 2010 2015 2020 2025Boilers - 0.3% 0.3% 0.3% 0.2% 0.2% 0.2% 0.2% 0.2%Furnaces - 3% 4% 4% 4% 4% 4% 4% 4%Chillers - 16% 12% 10% 9% 8% 7% 6% 6%Forced Air Coolers - 0.0% 0.0% 0.0% 0.0% 0.0% 0.0% 0.0% 0.0%Cooling Tower - 1% 1% 1% 1% 1% 1% 1% 1%
- 31% 32% 32% 32% 32% 32% 32% 32%- 13% 15% 16% 16% 16% 17% 17% 17%- 16% 16% 17% 17% 17% 18% 18% 18%- 4% 4% 5% 5% 5% 5% 5% 5%- 1% 1% 1% 1% 1% 2% 2% 2%- 0.2% 0.2% 0.2% 0.2% 0.2% 0.2% 0.2% 0.2%- 4% 3% 3% 3% 3% 3% 3% 3%- 8% 9% 10% 10% 10% 11% 11% 11%- 0.1% 0.1% 0.1% 0.1% 0.1% 0.1% 0.1% 0.1%- 1% 1% 1% 1% 1% 1% 1% 1%- 1% 1% 1% 1% 1% 1% 1% 1%
100% 100% 100% 100% 100% 100% 100% 100%
CompressorsFans/Blowers
Comfort
VentilationTOTAL:
Other ProcessLightingHeatingCooling
MotorsProcess
Direct Heat
Cooling
Pumps
End-Use
ConveyersElectrochemical
Percentage Annual Energy Savings by End-Use

Market Profile &Conservation Opportunity Assessment for SMs –Final Report –
Altech Environmental Consulting/ Marbek Resource Consultants Page 58
Exhibit 10.9: Achievable Potential Savings SM Industrial Sector (GWh)
Exhibit 10.10: 2025 SM Industry Sector Savings for Achievable Potential Scenario
Year Base Year Consumption (GWh)
Reference Case Consumption (GWh)
Economic Achievable (Upper)
Achievable (Lower) Economic Achievable
(Upper)Achievable
(Lower) Economic Achievable (Upper)
Achievable (Lower)
2005 33,693 33,693 33,693 33,693 33,693 0 0 0 0% 0% 0%2006 34,040 26,769 33,742 33,913 7,271 298 127 21% 1% 0%2007 34,366 26,993 33,806 34,151 7,373 559 214 21% 2% 1%2008 34,800 27,302 33,972 34,496 7,498 828 304 22% 2% 1%2009 34,995 27,423 33,900 34,602 7,572 1,095 393 22% 3% 1%2010 35,299 27,628 33,929 34,815 7,671 1,370 484 22% 4% 1%2015 36,840 28,664 34,027 35,876 8,176 2,814 965 22% 8% 3%2020 38,498 29,776 34,112 37,010 8,722 4,387 1,488 23% 11% 4%2025 40,231 30,930 34,329 38,174 9,300 5,902 2,057 23% 15% 5%
Potential Consumption (GWh) Savings (GWh) Savings as Percentage of Reference Case
Year Reference Case Consumption (GWh)
Economic Achievable (Upper)
Achievable (Lower) Economic Achievable
(Upper)Achievable
(Lower) Economic Achievable (Upper)
Achievable (Lower) Economic Achievable
(Upper)Achievable
(Lower)Chemical 6,549 5,112 5,636 6,168 1,437 913 381 22% 14% 6% 15% 15% 19%Fabricated 4,251 3,271 3,600 4,041 980 651 210 23% 15% 5% 11% 11% 10%
Food 4,570 3,463 3,914 4,329 1,107 657 241 24% 14% 5% 12% 11% 12%Machinery 1,881 1,457 1,607 1,791 424 274 89 23% 15% 5% 5% 5% 4%
Nonmetallic 3,043 2,299 2,619 2,912 744 425 131 24% 14% 4% 8% 7% 6%Plastics 4,815 3,742 4,133 4,604 1,073 682 212 22% 14% 4% 12% 12% 10%
Transportation 6,538 5,001 5,543 6,197 1,538 996 342 24% 15% 5% 17% 17% 17%Wood 2,815 2,136 2,356 2,659 679 459 156 24% 16% 6% 7% 8% 8%
Savings as Percentage of Total SM Industry SavingsPotential Consumption (GWh) Savings (GWh) Savings as Percentage of Reference
Case
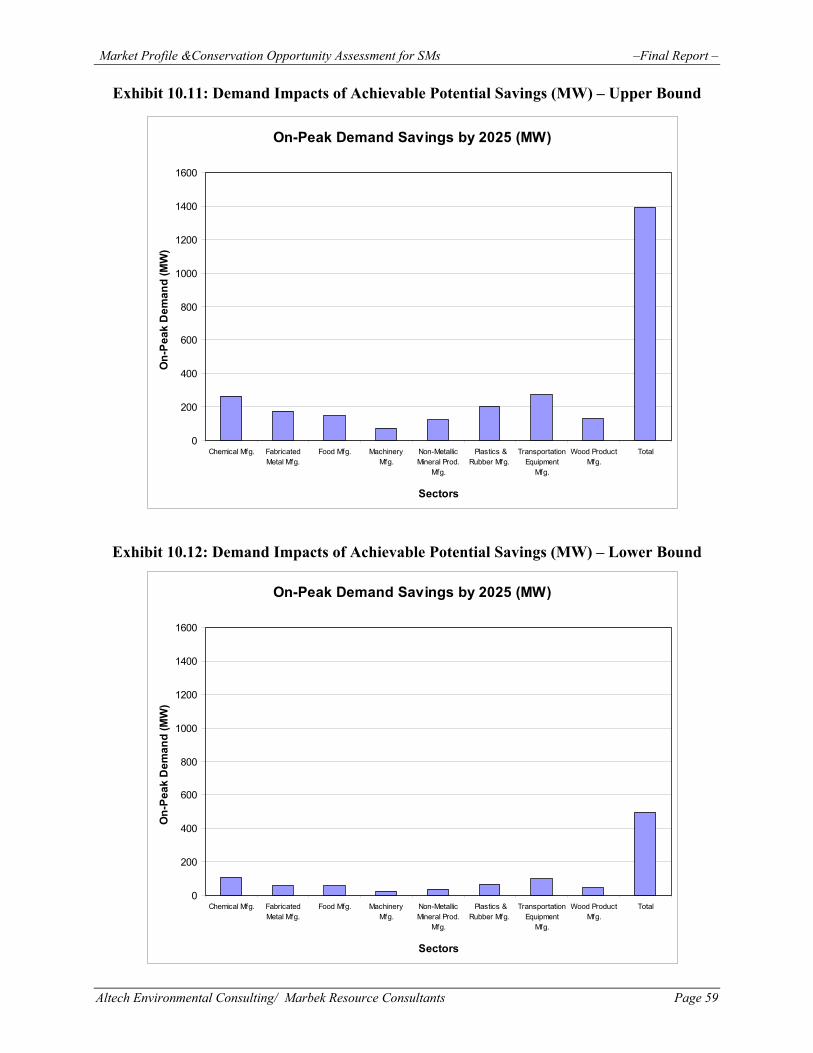
Market Profile &Conservation Opportunity Assessment for SMs –Final Report –
Altech Environmental Consulting/ Marbek Resource Consultants Page 59
Exhibit 10.11: Demand Impacts of Achievable Potential Savings (MW) – Upper Bound
Exhibit 10.12: Demand Impacts of Achievable Potential Savings (MW) – Lower Bound
On-Peak Demand Savings by 2025 (MW)
0
200
400
600
800
1000
1200
1400
1600
Chemical Mfg. FabricatedMetal Mfg.
Food Mfg. MachineryMfg.
Non-MetallicMineral Prod.
Mfg.
Plastics &Rubber Mfg.
TransportationEquipment
Mfg.
Wood ProductMfg.
Total
Sectors
On-
Peak
Dem
and
(MW
)
On-Peak Demand Savings by 2025 (MW)
0
200
400
600
800
1000
1200
1400
1600
Chemical Mfg. FabricatedMetal Mfg.
Food Mfg. MachineryMfg.
Non-MetallicMineral Prod.
Mfg.
Plastics &Rubber Mfg.
TransportationEquipment
Mfg.
Wood ProductMfg.
Total
Sectors
On-
Peak
Dem
and
(MW
)

Market Profile &Conservation Opportunity Assessment for SMs –Final Report –
Altech Environmental Consulting/ Marbek Resource Consultants Page 60
Exhibit 10.13: Achievable Potential On-Peak Demand Savings by End-Use (MW) – Upper Bound
Exhibit 10.14: Achievable Potential On-Peak Demand Savings by End-Use (% of Total) – Upper Bound
Level 1 Level 2 Level 3 2005 2006 2007 2008 2009 2010 2015 2020 2025Boilers 0 0 0 0 1 1 2 2 3Furnaces 0 3 6 9 12 15 32 50 69Chillers 0 4 7 9 12 14 28 43 59Forced Air Coolers 0 0 0 0 0 0 0 0 1Cooling Tower 0 1 1 1 2 2 4 6 9
0 50 81 112 144 176 344 527 7270 7 14 21 27 35 71 112 1560 14 27 40 53 67 138 216 2740 5 9 14 19 23 49 76 1060 1 2 4 5 6 12 19 270 0 0 1 1 1 2 3 40 3 4 6 8 10 21 33 450 6 12 17 23 29 61 95 1170 0 0 0 0 0 1 1 2
Cooling 0 1 1 2 3 3 7 10 150 1 1 2 2 3 6 9 130 95 166 239 312 386 778 1,205 1,626
ConveyersElectrochemicalOther Process
Comfort
TOTAL:
LightingHeating
Ventilation
End-Use On-peak Demand Savings by Milestone Year (MW)
Process
Direct Heat
Cooling
MotorsPumpsCompressorsFans/Blowers
Level 1 Level 2 Level 3 2005 2006 2007 2008 2009 2010 2015 2020 2025Boilers - 0.2% 0.2% 0.2% 0.2% 0.2% 0.2% 0.2% 0.2%Furnaces - 3% 4% 4% 4% 4% 4% 4% 4%Chillers - 4% 4% 4% 4% 4% 4% 4% 4%Forced Air Coolers - 0.0% 0.0% 0.0% 0.0% 0.0% 0.0% 0.0% 0.0%Cooling Tower - 1% 1% 1% 1% 1% 1% 1% 1%
- 53% 49% 47% 46% 45% 44% 44% 45%- 7% 8% 9% 9% 9% 9% 9% 10%- 14% 16% 17% 17% 17% 18% 18% 17%- 5% 6% 6% 6% 6% 6% 6% 7%- 1% 1% 1% 2% 2% 2% 2% 2%- 0.2% 0.2% 0.2% 0.2% 0.2% 0.2% 0.2% 0.3%- 3% 3% 3% 3% 3% 3% 3% 3%- 6% 7% 7% 7% 8% 8% 8% 7%- 0.1% 0.1% 0.1% 0.1% 0.1% 0.1% 0.1% 0.1%- 1% 1% 1% 1% 1% 1% 1% 1%- 1% 1% 1% 1% 1% 1% 1% 1%
100% 100% 100% 100% 100% 100% 100% 100%
CompressorsFans/Blowers
Comfort
VentilationTOTAL:
Other ProcessLightingHeatingCooling
MotorsProcess
Direct Heat
Cooling
Pumps
End-Use
ConveyersElectrochemical
Percentage Demand Savings by End-Use
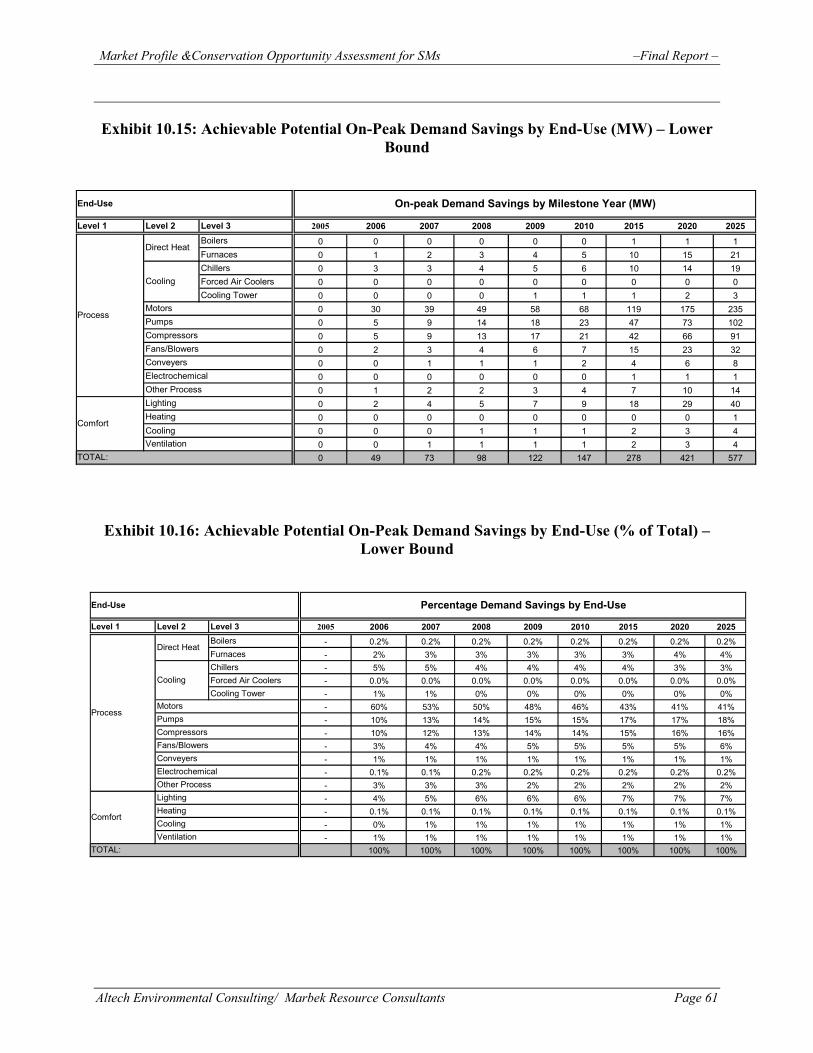
Market Profile &Conservation Opportunity Assessment for SMs –Final Report –
Altech Environmental Consulting/ Marbek Resource Consultants Page 61
Exhibit 10.15: Achievable Potential On-Peak Demand Savings by End-Use (MW) – Lower
Bound
Exhibit 10.16: Achievable Potential On-Peak Demand Savings by End-Use (% of Total) – Lower Bound
Level 1 Level 2 Level 3 2005 2006 2007 2008 2009 2010 2015 2020 2025Boilers 0 0 0 0 0 0 1 1 1Furnaces 0 1 2 3 4 5 10 15 21Chillers 0 3 3 4 5 6 10 14 19Forced Air Coolers 0 0 0 0 0 0 0 0 0Cooling Tower 0 0 0 0 1 1 1 2 3
0 30 39 49 58 68 119 175 2350 5 9 14 18 23 47 73 1020 5 9 13 17 21 42 66 910 2 3 4 6 7 15 23 320 0 1 1 1 2 4 6 80 0 0 0 0 0 1 1 10 1 2 2 3 4 7 10 140 2 4 5 7 9 18 29 400 0 0 0 0 0 0 0 1
Cooling 0 0 0 1 1 1 2 3 40 0 1 1 1 1 2 3 40 49 73 98 122 147 278 421 577
End-Use On-peak Demand Savings by Milestone Year (MW)
Process
Direct Heat
Cooling
MotorsPumpsCompressorsFans/Blowers
LightingHeating
Ventilation
Comfort
TOTAL:
ConveyersElectrochemicalOther Process
Level 1 Level 2 Level 3 2005 2006 2007 2008 2009 2010 2015 2020 2025Boilers - 0.2% 0.2% 0.2% 0.2% 0.2% 0.2% 0.2% 0.2%Furnaces - 2% 3% 3% 3% 3% 3% 4% 4%Chillers - 5% 5% 4% 4% 4% 4% 3% 3%Forced Air Coolers - 0.0% 0.0% 0.0% 0.0% 0.0% 0.0% 0.0% 0.0%Cooling Tower - 1% 1% 0% 0% 0% 0% 0% 0%
- 60% 53% 50% 48% 46% 43% 41% 41%- 10% 13% 14% 15% 15% 17% 17% 18%- 10% 12% 13% 14% 14% 15% 16% 16%- 3% 4% 4% 5% 5% 5% 5% 6%- 1% 1% 1% 1% 1% 1% 1% 1%- 0.1% 0.1% 0.2% 0.2% 0.2% 0.2% 0.2% 0.2%- 3% 3% 3% 2% 2% 2% 2% 2%- 4% 5% 6% 6% 6% 7% 7% 7%- 0.1% 0.1% 0.1% 0.1% 0.1% 0.1% 0.1% 0.1%- 0% 1% 1% 1% 1% 1% 1% 1%- 1% 1% 1% 1% 1% 1% 1% 1%
100% 100% 100% 100% 100% 100% 100% 100%
Percentage Demand Savings by End-Use
Process
Direct Heat
Cooling
Pumps
End-Use
ConveyersElectrochemical
Motors
TOTAL:
Other ProcessLightingHeatingCooling
CompressorsFans/Blowers
Comfort
Ventilation
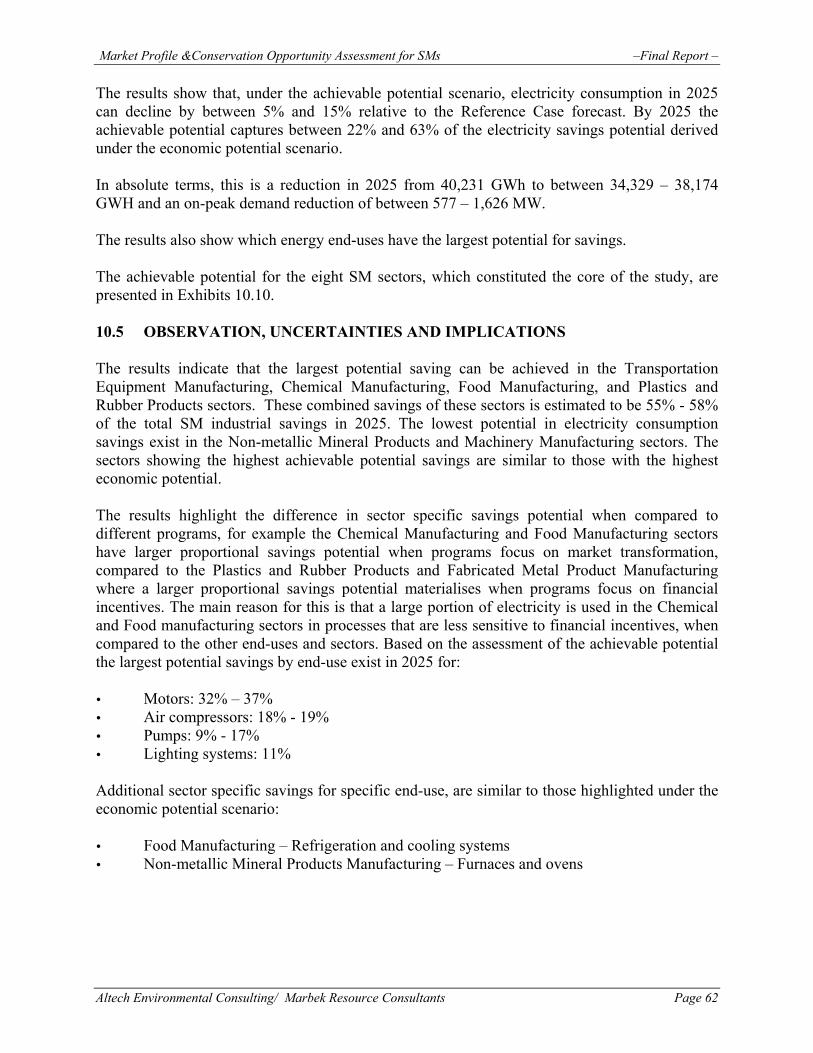
Market Profile &Conservation Opportunity Assessment for SMs –Final Report –
Altech Environmental Consulting/ Marbek Resource Consultants Page 62
The results show that, under the achievable potential scenario, electricity consumption in 2025 can decline by between 5% and 15% relative to the Reference Case forecast. By 2025 the achievable potential captures between 22% and 63% of the electricity savings potential derived under the economic potential scenario. In absolute terms, this is a reduction in 2025 from 40,231 GWh to between 34,329 – 38,174 GWH and an on-peak demand reduction of between 577 – 1,626 MW. The results also show which energy end-uses have the largest potential for savings. The achievable potential for the eight SM sectors, which constituted the core of the study, are presented in Exhibits 10.10. 10.5 OBSERVATION, UNCERTAINTIES AND IMPLICATIONS The results indicate that the largest potential saving can be achieved in the Transportation Equipment Manufacturing, Chemical Manufacturing, Food Manufacturing, and Plastics and Rubber Products sectors. These combined savings of these sectors is estimated to be 55% - 58% of the total SM industrial savings in 2025. The lowest potential in electricity consumption savings exist in the Non-metallic Mineral Products and Machinery Manufacturing sectors. The sectors showing the highest achievable potential savings are similar to those with the highest economic potential. The results highlight the difference in sector specific savings potential when compared to different programs, for example the Chemical Manufacturing and Food Manufacturing sectors have larger proportional savings potential when programs focus on market transformation, compared to the Plastics and Rubber Products and Fabricated Metal Product Manufacturing where a larger proportional savings potential materialises when programs focus on financial incentives. The main reason for this is that a large portion of electricity is used in the Chemical and Food manufacturing sectors in processes that are less sensitive to financial incentives, when compared to the other end-uses and sectors. Based on the assessment of the achievable potential the largest potential savings by end-use exist in 2025 for: Motors: 32% – 37% Air compressors: 18% - 19% Pumps: 9% - 17% Lighting systems: 11%
Additional sector specific savings for specific end-use, are similar to those highlighted under the economic potential scenario: Food Manufacturing – Refrigeration and cooling systems Non-metallic Mineral Products Manufacturing – Furnaces and ovens
Market Profile &Conservation Opportunity Assessment for SMs –Final Report –
Altech Environmental Consulting/ Marbek Resource Consultants Page 63
APPENDIX A: ALLIANCES OF LOCAL DSITRIBUTION COMPANIES

Market Profile &Conservation Opportunity Assessment for SMs –Final Report –
Altech Environmental Consulting/ Marbek Resource Consultants Page 64
1) Coalition of Large Distributors:
Enersource Hydro Mississauga Hamilton Hydro Hydro Ottawa PowerStream Toronto Hydro Veridian Corporation
2) Cornerstone Hydro Electric Concepts:
Centre Wellington Hydro Ltd. Collus Power Corp. Grand Valley Energy Inc. Innisfil Hydro Lakefront Utilities Inc. Lakeland Power Distribution Ltd. Midland Power Utility Corp. Orangeville Hydro Ltd. Orillia Power Distribution Corp. Parry Sound Power Corp. Rideau St. Lawrence Wasaga Distribution Inc. Wellington North Power Inc. West Coast Huron Energy Inc. Wetario Power Inc. Woodstock Hydro Services
3) Niagara Erie Public Power Alliance
Canadian Niagara Power Inc. Grimsby Power Inc. Haldimand County Hydro Inc. Niagara Falls Hydro Inc. Niagara-on-the-Lake Hydro Inc. Norfolk Power Distribution Inc. Peninsula West Utilities Ltd. St. Catharines Hydro Utility Services Welland Hydro-Electric System Corp.

Market Profile &Conservation Opportunity Assessment for SMs –Final Report –
Altech Environmental Consulting/ Marbek Resource Consultants Page 65
APPENDIX B: CALIFORNIA CDM PROGRAMS

Market Profile &Conservation Opportunity Assessment for SMs –Final Report –
Altech Environmental Consulting/ Marbek Resource Consultants Page 66
California Programs and Other Documents
Utility Contact Programs Covered Pacific Gas and Electric Company
Keith Reed Manager – Customer Energy Efficiency Tel: 415-973-4705 [email protected] Dave Manoguerra Supervisor – Mass Market Terry Pang Supervisor – Mass Market (Upstream)
On-site and Integrated Energy Analysis
Rebates, incentives, Design Assistance (for equipment and processes – e.g. boilers and water heating, HVAC)
Workshops and Training
Demand Response Programs
Base Interruptible Program (E-BIP) - pays industry to reduce its load to a pre-determined level during a load curtailment event called by the California Independent System Operator (CAISO).
Demand Bidding Program (E-DBP) - allows industry to bid a level of load reduction at an offered price for each curtailment event.
Critical Peak Pricing (E-CPP) - allows industry to lower its business' electric bills by shifting or reducing electricity during critical each summer afternoons.
Optional Binding Mandatory Curtailment Plan (E-OBMC) - lets industry avoid curtailments altogether by implementing load reductions on its entire circuit or dedicated substation during rotating outages.
Pilot Optional Binding Mandatory Curtailment Plan (E-POBMC) - grants exemption from rotating outages for customers in Santa Clara, San Mateo and Alameda counties.
Scheduled Load Reduction Program (E-SLRP) - pays industry an incentive to reduce your electric load for a pre-determined time period during the week.
Technical Assistance Program - offers industry engineering assistance to help it determine how, and by how much, it may be able to reduce demand under a PG&E’s demand response or reliability program.
Technical Incentive Program - offers industry an incentive totalling $100 per kilowatt of verified load reduction capability associated with the installation of recommended enabling technologies.
California Power Authority’s New Demand Reserves Partnership Program - pays customers year-round in addition to incentives on days when the program is activated. Customers must go through approved aggregators.
Self-Generation Incentive Program - businesses can also receive incentives for generating their own power in parallel with the electric system grid (not back-up generation). Energy Watch Partnerships – based on unique local needs. Partnerships formed with cities, counties and agencies to extend the reach and effectiveness of energy efficiency, demand response, renewable energy and self-generation programs.
Southern California Edison
Grant Hjelsand Manager – Standard Offer Programs, Non-residential Tel: 626-302-8131 [email protected]
Rebate (Express Efficiency) and Incentives (Standard Performance Contracts) - for retrofitting older equipment with newer high-efficiency equipment. Demand Response Programs - provide incentives and recognition for reducing power when energy supplies are low.
Time-of-Use Base Interruptible Program (TOU-BIP) - interruptible rate designed for customers who have monthly demands greater than 200 kW in any three months during the preceding 12 months. Customers must commit to reducing at least 15 percent of their maximum demand, which cannot be less than 100 kW. Customers receive a monthly credit based on the difference
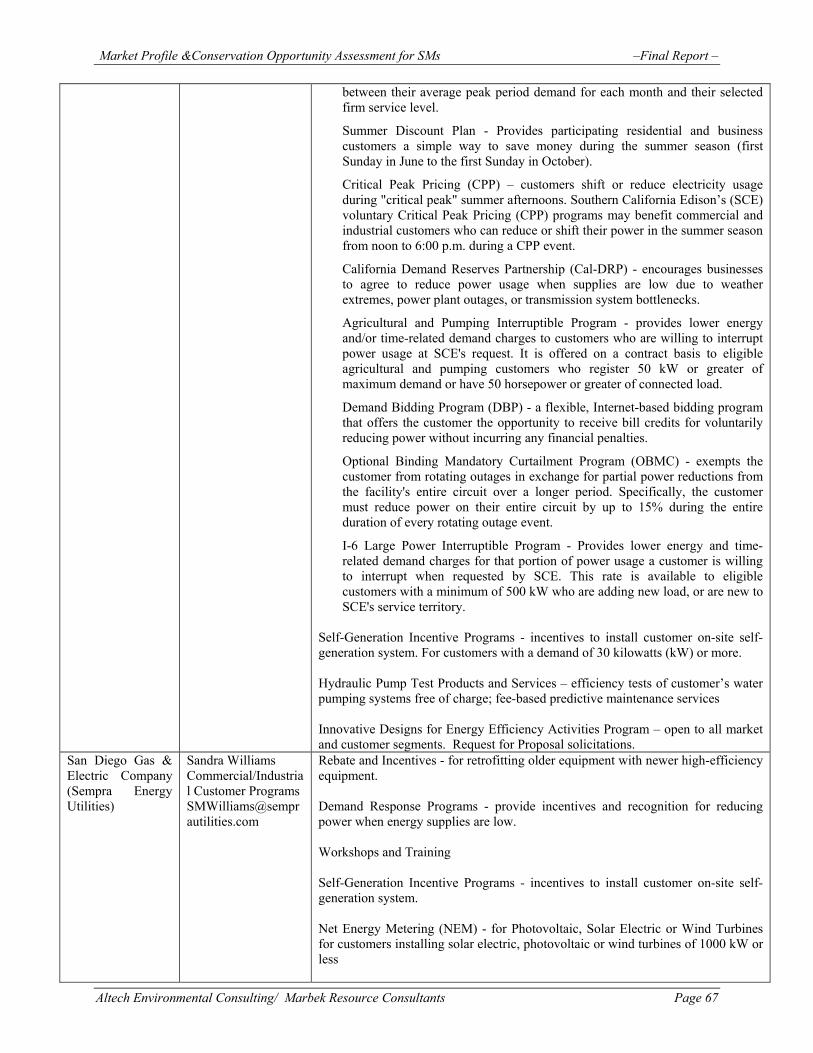
Market Profile &Conservation Opportunity Assessment for SMs –Final Report –
Altech Environmental Consulting/ Marbek Resource Consultants Page 67
between their average peak period demand for each month and their selected firm service level.
Summer Discount Plan - Provides participating residential and business customers a simple way to save money during the summer season (first Sunday in June to the first Sunday in October).
Critical Peak Pricing (CPP) – customers shift or reduce electricity usage during "critical peak" summer afternoons. Southern California Edison’s (SCE) voluntary Critical Peak Pricing (CPP) programs may benefit commercial and industrial customers who can reduce or shift their power in the summer season from noon to 6:00 p.m. during a CPP event.
California Demand Reserves Partnership (Cal-DRP) - encourages businesses to agree to reduce power usage when supplies are low due to weather extremes, power plant outages, or transmission system bottlenecks.
Agricultural and Pumping Interruptible Program - provides lower energy and/or time-related demand charges to customers who are willing to interrupt power usage at SCE's request. It is offered on a contract basis to eligible agricultural and pumping customers who register 50 kW or greater of maximum demand or have 50 horsepower or greater of connected load.
Demand Bidding Program (DBP) - a flexible, Internet-based bidding program that offers the customer the opportunity to receive bill credits for voluntarily reducing power without incurring any financial penalties.
Optional Binding Mandatory Curtailment Program (OBMC) - exempts the customer from rotating outages in exchange for partial power reductions from the facility's entire circuit over a longer period. Specifically, the customer must reduce power on their entire circuit by up to 15% during the entire duration of every rotating outage event.
I-6 Large Power Interruptible Program - Provides lower energy and time-related demand charges for that portion of power usage a customer is willing to interrupt when requested by SCE. This rate is available to eligible customers with a minimum of 500 kW who are adding new load, or are new to SCE's service territory.
Self-Generation Incentive Programs - incentives to install customer on-site self-generation system. For customers with a demand of 30 kilowatts (kW) or more. Hydraulic Pump Test Products and Services – efficiency tests of customer’s water pumping systems free of charge; fee-based predictive maintenance services Innovative Designs for Energy Efficiency Activities Program – open to all market and customer segments. Request for Proposal solicitations.
San Diego Gas & Electric Company (Sempra Energy Utilities)
Sandra Williams Commercial/Industrial Customer Programs [email protected]
Rebate and Incentives - for retrofitting older equipment with newer high-efficiency equipment. Demand Response Programs - provide incentives and recognition for reducing power when energy supplies are low. Workshops and Training Self-Generation Incentive Programs - incentives to install customer on-site self-generation system. Net Energy Metering (NEM) - for Photovoltaic, Solar Electric or Wind Turbines for customers installing solar electric, photovoltaic or wind turbines of 1000 kW or less

Market Profile &Conservation Opportunity Assessment for SMs –Final Report –
Altech Environmental Consulting/ Marbek Resource Consultants Page 68
Demand Response Programs
Day-Ahead Notification Options
Peak Day 20/20 - pays an incentive to reduce electric load by a minimum of 20 percent on selected days throughout the summer.
Demand Bidding Program - allows industry to bid a level of load reduction at an offered price for each curtailment event.
Critical Peak Pricing - offers lower rates to business customers that agree to reduce electricity during critical peak periods during the summer season only.
Day-Of Notification Options
Critical Peak Pricing-Emergency - offers lower rates to business customers that can reduce electricity on short notice during emergency critical peak periods.
Emergency Demand Bidding Program - voluntary load reduction program that provides financial incentives to customers who can reduce load on a day-of basis.
Base Interruptible Program - pays customers to reduce your load to a pre-determined level during a load curtailment event called by the California Independent System Operator (CAISO).
Stand by Generator Programs - provides incentives if industry volunteers at SDG&E’s request to have its electric generator operate during temporary critical times
Optional Binding Mandatory Curtailment – allows industry to avoid curtailments altogether by implementing load reductions on your entire circuit or dedicated substation during rotating outages.
Scheduled Load Reduction Program - pays customers an incentive to reduce their electric load for a pre-determined time period during the week.
Other Programs
California Power Authority’s New Demand Reserves Partnership Program
Celerity Energy Generator Program - provides generator owners with real cost savings and equipment upgrades by allowing access to your underutilized standby electric generators for a few hours a year.
Other Documents Reviewed Industry in Vermont: Making It Successful for All of Us Greg Baker, Vermont Energy Investment Corporation Dan Gaherty, Vermont Energy Investment Corporation DeWayne Howell, Husky Injection Molding Systems, Inc. (2005) Efficiency Vermont. Industrial Process and Equipment Efficiency in Oregon:An Evaluation of the Energy Trust’s Production Efficiency Program Marjorie McRae and Jane S. Peters, Research Into Action, Inc.Steven Scott, MetaResource Group Ben Bronfman, Energy Trust of Oregon, Inc. (2005).

Market Profile &Conservation Opportunity Assessment for SMs –Final Report –
Altech Environmental Consulting/ Marbek Resource Consultants Page 69
APPENDIX C: PROGRAM CONCEPTS FOR ONTARIO SM INDUSTRY

Market Profile &Conservation Opportunity Assessment for SMs –Final Report –
Altech Environmental Consulting/ Marbek Resource Consultants Page 70
PROGRAM CONCEPTS FOR ONTARIO SM INDUSTRY The program concepts are presented in a format containing the following parameters, if applicable: Program name Program number Program target market Program description Market barriers/needs addressed by the program Program delivery channels CDM measures affected Example(s) of similar, successful program delivered elsewhere
Category 1: Financial Incentives Program Name: Custom Incentive Program #: 1.1 Program Target Market:
• All industry but most likely, geared to larger companies. Program Description:
• A financial incentive is provided for customized project to reduce electricity consumption and/or demand.
• This is conceived as an open program whereby any customer can submit a proposal for any of the three categories of CDM measure. It is reviewed by the utility technical department and incented based on calculated savings, either for energy or demand reduction.
Market barriers/needs addressed by the program: • Financial hurdle rate is attained for project to win internal capital budgeting
competition. CDM Measures Affected:
• All end-use and system wide measures. Example(s) of similar, successful program delivered elsewhere:
• Among electric utilities in North America, this is the most common form of subsidy driven program.
Program Name: Industrial Productivity Program Program #: 1.2 Program Description:
• An incentive is provided for projects that improve productivity, with the benefit of reducing electricity consumption.

Market Profile &Conservation Opportunity Assessment for SMs –Final Report –
Altech Environmental Consulting/ Marbek Resource Consultants Page 71
• This program will effectively link energy performance to the larger goals of productivity enhancement and stabilization of specific industry sectors. As such, it is a program concept involving government (Economic Development) and the utilities.
• Total assessment audits will be undertaken in which plant productivity improvements will be identified. The CDM component will be incented by the utility.
Program Name: End-use Specific Incentive Program #: 1.3 Program Description:
• Provide incentives to reduce electricity consumption and demand by end-use processes or equipment, for example: Air displacement or ventilation systems Compressed air system Pumps Conveyance equipment Refrigeration and cooling systems Motors Lighting system
• The program will help advance overall performance and efficiency of end-use systems, processes and equipment while reducing operating costs and extending the life of the equipment.
• Separate concept programs can be developed for each of the end-uses. • Proponents submit proposal outlining CDM measures, cost and measuring and
verification (M&V) plan. • Utility does assessment and then provides incentive relative to the projected savings,
or as percentage of the installed cost. Note that the end-use specific programs can be tied to a large inventory of tools and materials that are end-use specific, e.g., see the suite of tools available through NRCan and DOE. Program Name: Industrial Metering Incentive Program #: 1.4 Program Description:
• Provide an incentive to monitor and track electricity usage. • The program would use incentives to assist industry to design and implement effective
energy metering. • Initial metering scoping audit to determine needs and develop metering plan. • Incentive to deliver the energy metering plan. • Conditional upon site verification and audited company commitment to and
implementation of corporate energy management program, with EMIS. • Could be stand-alone or as an explicit element of the customized incentive program.
Market barriers/needs addressed by the program: • Marbek just completed a study for the OEE which determined that energy metering is not
being affectively used in industry for all energy management functions. CDM Measures Affected:
• Sub-metering
Market Profile &Conservation Opportunity Assessment for SMs –Final Report –
Altech Environmental Consulting/ Marbek Resource Consultants Page 72
• EMIS Program Name: Sustainable Energy Incentive Program #: 1.5 Program Description:
• Provide an incentive to install self generation from sustainable energy source. • The program would use incentives to promote the implementation of sustainable energy
sources. • Proponents submit proposal outlining project to install a sustainable energy source for
self generation, including cost and measuring and verification (M&V) plan. • Utility does assessment and then provides incentive relative to the projected savings, or
as percentage of the installed cost. Program Name: Energy Conservation Incentive Program #: 1.6 Program Description:
• Provide an incentive in recognition of reducing electricity consumption and/or demand. • Without obtaining incentives from other programs, a reduction in electricity consumption
or demand by XX% or more is rewarded with a financial credit or credit points. Credit points can be converted into the dollar equivalent to be used for the implementation of CDM projects.
Program Name: Demand Response Specific Incentives Program #: 1.7 Program Description:
• Provide an incentive to participate in mandatory program requiring predetermined load reduction when requested. (Generally referred to as a “base interruptible” program.)
• The Base Interruptible Program, or E-BIP, is a mandatory program that pays a monthly incentive to reduce load to a pre-determined amount when the IESO calls day-of load curtailment notice
• New participants must elect one of two available options.
Option A: Gives the customer an XX minute notification and $XX.00 per kilowatt (kW) per month incentive for the monthly load reduction amount. Failure to reduce loads during an event will result in a $XX.00 charge per kilowatt hour for energy.
Option B: Gives the customer a three hour notification and $XX.00 per kw per month incentive for the monthly load reduction amount. Failure to reduce loads during an event will result in a $XX.00 charge per kilowatt hour for energy use over the firm service level.
• Provides an incentive to participate in a program to voluntary reduce electric load, in
response to a request submitted in advance of the period when the load reduction is required. (Generally referred to as a “demand bidding” program.) The Demand Bidding Program pays an incentive to reduce electric load according to a voluntary bid made for

Market Profile &Conservation Opportunity Assessment for SMs –Final Report –
Altech Environmental Consulting/ Marbek Resource Consultants Page 73
a scheduled load reduction on the following non-holiday weekday. Under this program, the customer receives a credit equal to the product of the qualified kilowatt (kw) energy reduction for each hour a bid was accepted and the sum of the forecasted hourly market price for energy, plus a participation bonus if applicable.
• Incentive to reduce electric load during predetermined time periods. (Generally referred
to as a “scheduled load reduction” program.) Scheduled Load Reduction Program pays to reduce the plant’s electric load during a pre-determined time period that is specified in advance. The company picks the time period, day of the week and minimum load reduction and then meets that reduction level during that period each week throughout the summer in order to receive the incentive.
• Incentive to install monitoring equipment that will enable customer to participate in
programs. This concept program consists of cash incentive payments for investments in hardware and software that enable the company to participate in demand response programs.
Category 2: Capacity Building and Information Program Name: Project Financing Training Program #: 2.1 Program Target Market: Industry managers Program Description:
• A training course designed to advance competencies relating to making and selling the business case for energy management projects.
Market barriers/needs addressed by the program: • Energy management champions have problems winning the internal capital budgeting
competition for their projects. • Energy managers and other key company decision-makers do not know how to use
external financing, in the form of performance contracting or other modes. Program Delivery Channels:
• NRCan-OEE Dollars to Sense training workshops- a pilot has been developed and tested and is ready for roll-out.
CDM Measures Affected: All. Program Name: Customized Training Workshops Program #: 2.2 Program Description:
• Use the OEE “Dollars to Sense” platform as the basis for delivery of sector and plant customized training.
Program Name: Energy Monitoring and Tracking Training Program #: 2.3 Program Description:

Market Profile &Conservation Opportunity Assessment for SMs –Final Report –
Altech Environmental Consulting/ Marbek Resource Consultants Page 74
• Training to advance the effective application by industry of energy metering to monitor and track energy usage.
• A study conduced by Marbek for the OEE identified a considerable need for training to support energy monitoring and tracking, and identified specific training topics.
Program Name: Recognition of Energy Conservationists Program #: 2.4 Program Description:
• Implement a certification system to certify electricity conservation facilities/customers. • Customers that fulfill specific criteria, e.g. developed and implemented an energy
management plan, which includes a M&V plan, reduce energy usage/demand by a specific percentage over a specified period of time and practice continuous improvement, are certified as an “energy conservationists”.
• Program can be used to raise the profile of customers that are certified. Program Name: One Stop Shopping for Information and Tools Program #: 2.5 Program Description:
• Program would act as a clearing house on all current suites of information tools and materials. For example, the US DOE industry tools and the Energy Star Industry Energy Efficiency Library.
Program Name: E-metering Program #: 2.6 Program Description:
• The program would consider offering diverse data management services online to customer desktops, falling into two main categories:
o Access to consumption data. A number of standard reporting templates are made available for cost management enabling comparisons of energy consumption at individual or multiple sites. The data can be supplied at different intervals.
o Advisory services. Utilities offer automated advisory services or have technical staff available to help customers optimize their energy usage and manage the costs more effectively.
• The service offerings vary and can include: o Troubleshooting. Referred to as “exception and performance” reports that help
identify and manage any potential energy management issues. o Solutions. Energy reports are interpreted at varying levels of sophistication
leading to proposed O&M and capital improvements.
Market Profile &Conservation Opportunity Assessment for SMs –Final Report –
Altech Environmental Consulting/ Marbek Resource Consultants Page 75
Category 3: Delivery Infrastructure Program Name: Performance Contracting Program #: 3.1 Program Description:
• Prove the management and technical oversight to build an effective performance based delivery infrastructure. This requires getting engineering service providers in Ontario to re-profile their business model towards the performance based concept, rather than the cost plus construction type contracts we see in the market today.
• Program would initially need to pilot the concept, which might emerge as some hybrid form of what we commonly see in the buildings sector.
• Requires transactional infrastructure, e.g., contracts, performance schedules, M&V protocols.
Market barriers/needs addressed by the program: • Energy managers and other key company decision-makers do not know how to use
external financing, in the form of performance contracting or other modes. • There is a desire among energy managers and other key company decision-makers to
consider performance contracting as an alternative route to delivery of turn-key energy management services. However, there has been little market penetration of this approach in Canadian industry (Dupont, Ford and General Motors).
Program Delivery Channels: • Engineering companies operating as ESCOs • Collaboration with OEE and electricity utilities.
Category 4: Rate Design Program Name: Two-Tier Rate Program #: 4.1 Program Description:
• Tiered rate system with higher rates charged at higher consumption and/or demand levels.
• Industry electricity customers at a certain level of service (e.g., those receiving XX kWh or more of which there are about XX customers) will go on to a two tier rate. The first 90% of their 2005 total consumption will be charged at $XX/kWh, with the remaining 10% and any additional consumption being charged at $YY/kWh. Thus these customers are incented to save at least 10% compared to last year.
Market barriers/needs addressed by the program: • Price signal and incentive
Program Delivery Channels: • Utility
CDM Measures Affected: • All
Example(s) of similar, successful program delivered elsewhere: • BCH transmission network customers step up rate.

Market Profile &Conservation Opportunity Assessment for SMs –Final Report –
Altech Environmental Consulting/ Marbek Resource Consultants Page 76
Related Documents