Market Opportunities for New Diagnostics to Support Malaria Elimination Project DIAMETER (Diagnostics for Malaria Elimination Toward Eradication) Submitted to: The Bill & Melinda Gates Foundation March 26, 2014 MAILING ADDRESS PO Box 900922 Seattle, WA 98109 USA ADDRESS 2201 Westlake Avenue Suite 200 Seattle, WA 98121 USA TEL: 206.285.3500 FAX: 206.285.6619 www.path.org

Welcome message from author
This document is posted to help you gain knowledge. Please leave a comment to let me know what you think about it! Share it to your friends and learn new things together.
Transcript
Market Opportunities for New Diagnostics to Support Malaria Elimination Project DIAMETER (Diagnostics for Malaria Elimination Toward Eradication) Submitted to: The Bill & Melinda Gates Foundation
March 26, 2014 MAIL ING ADDRESS PO Box 900922 Seattle, WA 98109 USA ADDRESS 2201 Westlake Avenue Suite 200 Seattle, WA 98121 USA TEL: 206.285.3500 FAX: 206.285.6619 www.path.org

Table of contents
Acronyms and abbreviations ...................................................................................................................... iii
Introduction .................................................................................................................................................. 1
Malaria elimination and diagnostics use ...................................................................................................... 2
The current malaria diagnostics market ....................................................................................................... 7
Country use of diagnostics for elimination and active use scenarios ......................................................... 21
The potential market for a new rapid infection detection test .................................................................... 30
Promoting investment and development of a healthy market .................................................................... 40
References .................................................................................................................................................. 47
Annex I: Passive case detection and active infection detection testing volumes by country ..................... 49
Annex II: Market-sizing exercise ............................................................................................................... 61
Annex III: Role of the retail private sector in elimination countries ......................................................... 69
Annex IV: Financial background: Malaria-eliminating countries ............................................................. 70
Annex V: Experts interviewed ................................................................................................................... 71
ii
Acronyms and abbreviations
ACT artemisinin-based combination therapy AIDS Acquired Immune Deficiency Syndrome CDC US Centers for Disease Control and Prevention CHAI Clinton Health Access Initiative DIAMETER Diagnostics for Malaria Elimination Toward Eradication FDA US Food and Drug Administration FIND Foundation for Innovative New Diagnostics FTAT focused testing and treatment G6PD glucose-6-phosphate dehydrogenase deficiency Global Fund Global Fund to Fight AIDS, Tuberculosis and Malaria GPS Global Positioning System HIV human immunodeficiency virus HRP-II histidine-rich protein 2 ID infection detection IDT infection detection test IRS indoor residual spraying LAMP loop-mediated isothermal amplification MEG UCSF Malaria Elimination Group MOP Malaria Operational Plan MTAT mass testing and treatment PCD passive case detection PCR polymerase chain reaction PCW Positive Control Wells Pf Plasmodium falciparum pLDH Plasmodium lactate dehydrogenase PMI US President’s Malaria Initiative PQ prequalification Pv Plasmodium vivax QA quality assurance QC quality control LOD limit of detection R&D research and development RBM Roll Back Malaria RDT rapid diagnostic test SD Standard Diagnostics TDR WHO Special Programme for Research and Training in Tropical Diseases TPP target product profile UCSF University of California, San Francisco WHO World Health Organization
iii
Introduction
This report presents findings from a review of the market landscape conducted from December 2013 to February 2014 as part of PATH’s Project DIAMETER (Diagnostics for Malaria Elimination Toward Eradication). To date, evaluation of malaria diagnostics markets has been relatively limited, and where it is available, it is largely focused on passive case detection and on higher-burden countries.i This report aims to build on existing malaria diagnostics market work and to complement it by delving deeper into elimination and active use scenarios for malaria diagnostics. The report is structured as follows:
• Malaria elimination and diagnostics use: This section provides information on elimination countries and the role of diagnostics, including a review of current World Health Organization (WHO) guidance and trends shaping the research agenda.
• The current malaria diagnostics market: This section summarizes relevant aspects of the current microscopy and rapid diagnostic test (RDT) markets, drawing on existing work about the malaria diagnostics market.
• Country use of diagnostics for elimination and active use scenarios: This section considers use of and demand for diagnostics in elimination settings, with a focus on active use scenarios. It includes both qualitative and quantitative analyses.
• The potential market for a new rapid infection detection test: This section describes a market-sizing exercise that was undertaken for a new rapid infection detection test (IDT).
• Promoting investment and development of a healthy market: This section describes challenges and risks along the product development and market access pathway and describes some potential interventions to promote investment and development of a healthy market.
• Several annexes provide additional detail of the analyses conducted for this report and a list of experts interviewed.
The methodology undertaken is described at the start of each section. Generally, given the limited data available on malaria diagnostics markets, the methods for this report included identifying potential sources of data for analysis, desk review, and expert interviews. The available data on malaria diagnostics are limited (relative to other product categories, such as medicines), and even more limited for
i For example: • UNITAID. Malaria Diagnostics Technology and Market Landscape Updates. Geneva: World Health Organization; 2013. Available at:
http://www.unitaid.eu/en/resources/publications/technical-reports. • Wafula F, Agweyu A, Macintyre K. Regional and temporal trends in malaria commodity costs: an analysis of Global Fund data for 79
countries. Malaria Journal. 2013;12:466. • Zhao J, Lama M, Korenromp E, et al. Adoption of rapid diagnostic tests for the diagnosis of malaria: a preliminary analysis of the Global
Fund program data, 2005 to 2010. PLOS ONE. 2012;7(8):e43549. • USAID | DELIVER PROJECT. Price Analysis of Malaria Rapid Diagnostic Test Kits. Washington, DC: USAID | DELIVER PROJECT
Task Order 7; 2012. Available at: http://deliver.jsi.com/dlvr_content/resources/allpubs/logisticsbriefs/RDTPricAnal.pdf. • Frost LJ, Reich MR. Chapter 5: Malaria rapid diagnostic tests: access to diagnostics. In: Access: How do Good Health Technologies Get to
Poor People in Poor Countries? Cambridge: Harvard University Press; 2008.
1
eliminating countries.ii Therefore, for this report, we primarily relied on national malaria control program reporting to the WHO (published and unpublished information). Although many national programs do not completely or reliably report to the WHO, the assumption was made that, by definition, surveillance systems in countries pursuing elimination should be robust enough to produce reliable data. Given the time frame for this report, validation of the data and analyses with countries and experts was not possible. When reviewing the analyses and data in this report, it is important to keep in mind that many of the analyses presented are for a subset of countries, and therefore may not be completely representative of the global markets. Attempts were also made to identify analogous products and markets; however, none were identified. From an operational research perspective, malaria elimination is a rapidly evolving area, and currently many unanswered questions about optimal strategies are being explored. Likewise, WHO guidance on elimination is expected to be updated in 2014. The lack of consensus and guidance on optimal approaches makes analyzing the market and making predictions about the market size for a new diagnostic challenging. Evidence gaps and research questions that would impact the market have been highlighted in this report. Lastly, a note about defining elimination countries: The WHO characterizes all countries by program phase using a combination of epidemiological and operational criteria. In 2013, the WHO classified 19 countries as in the elimination or pre-elimination phase,iii with an additional seven countries in the prevention of reintroduction phase. The Malaria Elimination Group (MEG) at the University of California, San Francisco (UCSF) has a broader definition of “malaria-eliminating countries,” which is based on whether a country has adopted a strategy for elimination.1 Currently, this is a set of 38 countries. For this report, the UCSF MEG definition and set of countries is used, unless otherwise noted.
Malaria elimination and diagnostics use
Malaria-eliminating countries An estimated 3.4 billion people, across 97 countries, were at risk of malaria in 2012.2 Since 2000, scale-up of malaria control efforts has contributed to tremendous reductions in the burden of malaria, and, as a result, has put malaria elimination within reach for many countries that have reduced transmission to low levels. Historically, there was a major effort to eliminate malaria during the Global Malaria Eradication Program beginning in the mid-1950s through the late 1970s. During this period, 68 countries became malaria free. In contrast, during the 30 years from 1979 to 2009, only ten countries became malaria free.3 Most recently, Armenia (2011), Morocco (2010), Turkmenistan (2010), and the United Arab Emirates (2007) were certified by the WHO as malaria free.
ii For example, the RDT Procurement Data Set analyzed by the Clinton Health Access Initiative (CHAI) and UNITAID includes about 388 million RDTs over several years and represents an estimated 50 percent of the global RDT market. The 34 malaria-eliminating countries (as defined by the UCSF MEG) represent about 1 percent of this data set. iii World Health Organization (WHO). World Malaria Report 2013. Geneva: WHO; 2013. WHO classifications by program phase are not entirely consistent (Table 8.2 is consistent with the country profiles). Table 8.2: 97 countries with ongoing transmission in 2013, 12 are in pre-elimination phase, 7 are in elimination phase. A further 7 are classified as being in the prevention of reintroduction phase. WHO pre-elimination countries: Argentina, Belize, Bhutan, Cabo Verde, Costa Rica, Democratic People’s Republic of Korea, Ecuador, El Salvador, Malaysia, Mexico, Paraguay, Republic of Korea. Elimination countries: Algeria, Azerbaijan, Iran, Saudi Arabia, Sri Lanka, Tajikistan, Turkey. Prevention of reintroduction countries: Egypt, Georgia, Iraq, Kyrgyzstan, Oman, Syrian Arab Republic, Uzbekistan. Recently certified malaria free: Armenia (2011), Morocco (2010), Turkmenistan (2010), and the United Arab Emirates (2007).
2
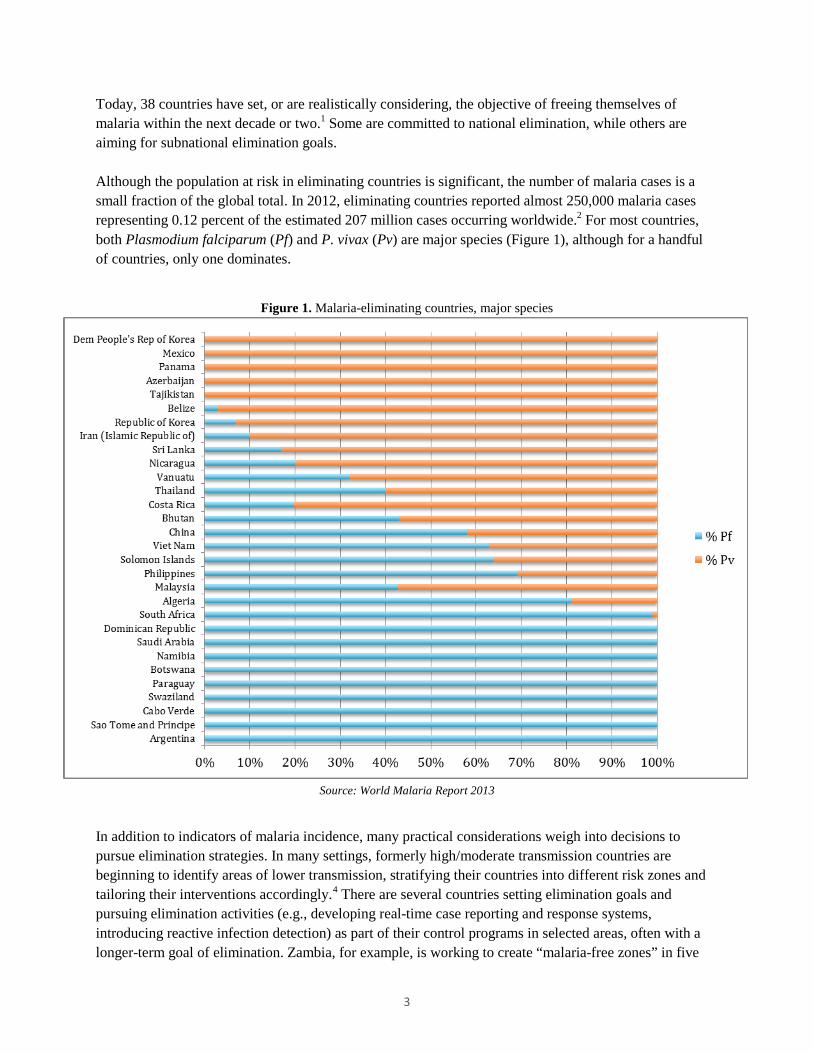
Today, 38 countries have set, or are realistically considering, the objective of freeing themselves of malaria within the next decade or two.1 Some are committed to national elimination, while others are aiming for subnational elimination goals. Although the population at risk in eliminating countries is significant, the number of malaria cases is a small fraction of the global total. In 2012, eliminating countries reported almost 250,000 malaria cases representing 0.12 percent of the estimated 207 million cases occurring worldwide.2 For most countries, both Plasmodium falciparum (Pf) and P. vivax (Pv) are major species (Figure 1), although for a handful of countries, only one dominates.
Figure 1. Malaria-eliminating countries, major species
Source: World Malaria Report 2013 In addition to indicators of malaria incidence, many practical considerations weigh into decisions to pursue elimination strategies. In many settings, formerly high/moderate transmission countries are beginning to identify areas of lower transmission, stratifying their countries into different risk zones and tailoring their interventions accordingly.4 There are several countries setting elimination goals and pursuing elimination activities (e.g., developing real-time case reporting and response systems, introducing reactive infection detection) as part of their control programs in selected areas, often with a longer-term goal of elimination. Zambia, for example, is working to create “malaria-free zones” in five
3
regions of the country by 2015. Likewise, the Tanzanian island of Zanzibar has strengthened reporting systems and is introducing active infection detection.
Diagnostics uses: passive detection, active detection, and laboratory testing There are three broad categories of diagnostics use scenarios in malaria: passive case detection, active infection detection, and laboratory testing. Within each of these categories, there are multiple use scenarios, which are described in a forthcoming publication by the DIAMETER team.5 The following is a brief summary of these uses. Passive case detection (PCD): All malaria programs rely on PCD, whereby the patient seeks care at a health facility or from a community health worker for symptoms of malaria. Microscopy and RDTs are primarily used for PCD testing, and, if these are of sufficiently high quality, they are considered adequate for detecting symptomatic cases of malaria. Active infection detection (ID): As countries move along the continuum from control to elimination, there is a shift in emphasis from detecting only clinical cases to actively seeking out and treating infections in order to reduce the malaria reservoir in the community, thereby driving down transmission. Within the active ID category, there are myriad approaches, many of which are focused on detecting malaria infection in asymptomatic individuals. Laboratory testing: Centralized laboratory testing complements PCD and active ID activities. A main role of centralized laboratory testing is to provide quality assurance (QA) and quality control (QC) of the diagnostics used for PCD and active ID. In addition, laboratory testing may support PCD by providing confirmation of questionable results or through monitoring response to treatment. Genotyping also becomes important, as countries need to determine whether a case is locally acquired or imported. Often, central laboratories employ microscopy and molecular methods.
WHO guidance The WHO provides normative guidance on malaria diagnosis and surveillance for elimination settings in several documents, including the Guidelines for the Treatment of Malaria (second edition; 2010), the Malaria Elimination Field Manual for Low and Moderate Endemic Countries (2007), and the Disease Surveillance for Malaria Elimination: Operational Manual (2012).iv A brief summary of WHO guidance pertaining to diagnostics is below.
Passive case detection
• WHO guidance for PCD is very clear: prompt diagnosis is recommended for all patients with suspected malaria. Before proceeding to the elimination phase, 100 percent of suspected cases should be confirmed, including those in the private sector.
iv Community-Based Reduction of Malaria Transmission was not reviewed, as it is no longer considered to be a relevant document. According to Andrea Bosman (February 2014), the WHO is considering an evidence review group for late 2014 to reconsider this document and the 2007 Elimination Manual, as well as to review research in this area and map priority areas for more work.
4
• Microscopy is the WHO’s preferred technology for diagnosing malaria from the start of the pre-elimination program. Microscopy is preferred to RDTs for its ability to speciate and provide information on density and gametocytes, and due to the limitations of RDTs (persistent antigenemia, limit of detection [LOD] for P. vivax). The WHO recommends that when an RDT is used to guide treatment, a slide is also made and read as soon as possible.
• Access to free testing and treatment in both the public and private sectors is recommended.
Active infection detection
• There is no guidance on when to begin active ID activities, although they are an expected element of elimination programs. Reactive ID would likely begin during the pre-elimination phase as part of case investigations. During the elimination phase, 100 percent of cases are investigated.
Laboratory testing
• An operational QA system for microscopy is a precondition to proceeding to the elimination phase. It is expected that all positive and a proportion of negative slides (usually 10 percent) are re-checked. In addition, laboratories should participate in a national external QA network.
• Genotyping is recommended from the start of a pre-elimination program onward. In general, while WHO guidance is available, a one-size-fits-all approach is not possible in malaria elimination, and many decisions are left to the discretion of the national program, based on local conditions and local expertise. In addition, providing definitive guidance is challenging due to the limited evidence base on the effectiveness of many elimination activities, as well as a lack of evidence on optimal strategies for implementation.
Unanswered research questions and implications for diagnostics markets There is much to be learned about optimizing elimination strategies; as best practices are defined, the demand for malaria diagnostics could vary widely. Among the unanswered questions are several related to the use of diagnostics in malaria elimination settings, as well as questions around targeting hotspots and the potential of mass campaign strategies for reducing the burden of malaria more generally. Important trends in program implementation and research priorities include:
• Understanding the dynamics of sub-patent, asymptomatic infections in transmission. Understanding the role of sub-patent, asymptomatic infections and their contribution to ongoing malaria transmission is a priority for diagnostics and malaria elimination. In theory, the systematic identification and treatment of asymptomatic individuals should reduce disease transmission by reducing the parasite reservoir in the community. However, the relationship between parasitemia and transmission is not well understood; and, therefore, the optimal LOD for a test aimed at detection of infections is uncertain.
• Optimizing active infection detection strategies. Although active ID strategies, in particular reactive ID, are widely used, implementation varies widely, both in policy and in practice, and there is little evidence on the effectiveness of these interventions.6,7,8 In particular, there is a need for
5

operational research on the optimal implementation protocols (e.g., number of households to screen, events that trigger reactive ID) that would efficiently and effectively identify infections. Given new evidence suggesting that asymptomatic, sub-patent parasitemia may contribute significantly to transmission, there is likely to be a trend toward screening all individuals, regardless of symptoms. However, there are practical limitations associated with this, both with respect to the LOD of current field-deployable diagnostics and in terms of the capacity of programs to test large numbers of people.
• Targeting interventions to achieve higher impact and improve resource utilization. Evidence suggests that increased targeting of hotspots may have a more dramatic impact on transmission than broadly applied efforts.9 Therefore, diagnostics combined with new technologies (Global Positioning System [GPS], mapping programs, communications technologies) should allow for rapid production of finer-resolution maps that can be used to target interventions, thereby improving resource utilization. These new technologies are already being leveraged to support targeting of interventions,10 and the continued adoption of these technologies and improvements in their application are anticipated in the coming years. With respect to diagnostics markets, the impact is twofold. First, the identification of foci of transmission and, at a finer resolution, hotspotsv and hotpops,vi will require broad use of highly sensitive diagnostics, linked to strong surveillance and mapping systems. Second, in elimination settings, a more targeted approach implies that activities may be undertaken in a targeted manner and on a smaller scale as opposed to routine use of mass campaigns. Such an approach would be consistent with the general pressure on resources (both human and financial) that often constrains malaria programs.
• Improving the evidence base for malaria transmission and incidence. Although there has been substantial progress in reducing incidence and transmission of malaria in many areas, the evidence base is imprecise and incomplete in many areas, in particular for many African countries.2,11 In most countries, surveillance systems are not strong enough to develop stratified malaria maps of the country that would allow for tailoring of approaches.2 One of the near-term research and programmatic goals therefore is to improve the available information on malaria through strengthening surveillance, use of new GPS/mapping and communication technologies, and through modeling. Having a better evidence base would in turn inform country decision-making around timelines for elimination (these may be very long term in some countries, while others may decide to pursue spatially targeted elimination) and around adoption of new tactics.
• Strategies for reducing transmission to very low levels in endemic countries, thereby accelerating elimination. With malaria eradication on the global agenda again, there is increasing interest in the possibility of accelerating elimination of malaria in more moderate transmission countries. Unconventional tactics are being explored, including revisiting the role of approaches such as mass testing and treatment (MTAT) and mass drug administration for burden reduction.12,13,14,15,16 At the same time, an evidence gap exists for endemic countries that have significantly lowered transmission levels through high coverage of vector control and case management interventions, but have not yet reached the very low levels of transmission required to seriously consider elimination. While there are many unanswered questions around elimination more generally, countries that have rapidly reduced transmission will likely face a unique set of challenges given the potential for
v Hotspots, also referred to as foci, are large or small geographically clustered populations identified as having comparatively higher levels of transmission. Hotspots occur at every level of transmission and therefore are fractal in nature.5 vi Hotpops are demographically clustered populations of malaria incidence. Within an elimination context, hotpops are often associated with travel history and occupation.5
6
resurgence, and the road map for these countries is uncertain. Current research, such as that led by the Malaria Control and Elimination Partnership in Africa in Zambia and Senegal and the national program in Zanzibar, includes testing approaches like reactive ID and MTAT in these settings.
The current malaria diagnostics market
This section of the report focuses on the malaria diagnostics market broadly, with the aim to present relevant highlights as context for further understanding of the potential market for a new rapid IDT. It is not specific to eliminating-country markets unless otherwise noted.
Access to malaria diagnosticsvii
There has been a steady increase in the number of diagnostic tests performed globally in recent years, as indicated by the growth in public-sector testing rates (Figure 2) and in the growth in the malaria RDT market (Figure 5). While testing rates in the public sector have grown steadily, to 64 percent globally in 2012, the African (61 percent of suspected cases tested), Southeast Asian (56 percent, excluding India, where testing rates are high), and Eastern Mediterranean (63 percent) regions lag behind. In many countries, the private sector plays an important role in care of fevers and provision of malaria drugs, yet diagnostic testing in this sector is minimal in the majority of countries. Much of the recent growth in testing is driven by the release in 2010 of the revised WHO Guidelines for the Treatment of Malaria,17 which for the first time recommended that all suspected cases of malaria receive a diagnostic test before treatment.
vii This section draws on World Malaria Report 2013 unless otherwise noted.
7
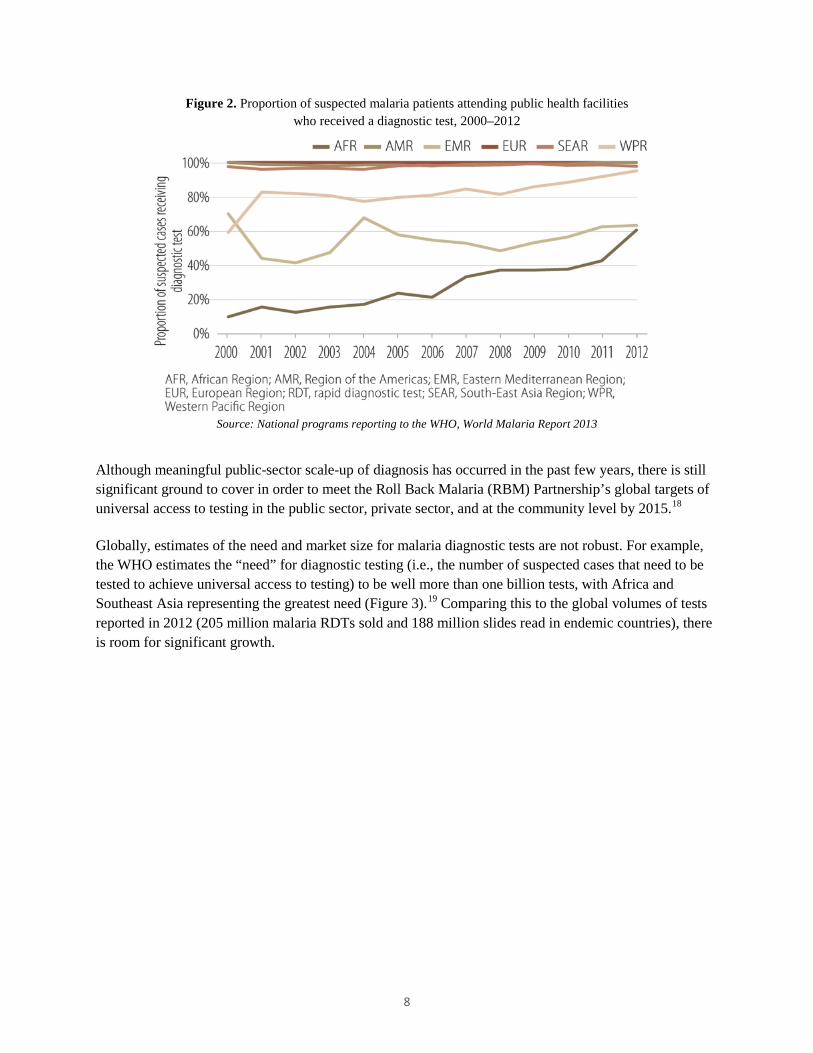
Figure 2. Proportion of suspected malaria patients attending public health facilities who received a diagnostic test, 2000–2012
Source: National programs reporting to the WHO, World Malaria Report 2013
Although meaningful public-sector scale-up of diagnosis has occurred in the past few years, there is still significant ground to cover in order to meet the Roll Back Malaria (RBM) Partnership’s global targets of universal access to testing in the public sector, private sector, and at the community level by 2015.18 Globally, estimates of the need and market size for malaria diagnostic tests are not robust. For example, the WHO estimates the “need” for diagnostic testing (i.e., the number of suspected cases that need to be tested to achieve universal access to testing) to be well more than one billion tests, with Africa and Southeast Asia representing the greatest need (Figure 3).19 Comparing this to the global volumes of tests reported in 2012 (205 million malaria RDTs sold and 188 million slides read in endemic countries), there is room for significant growth.
8
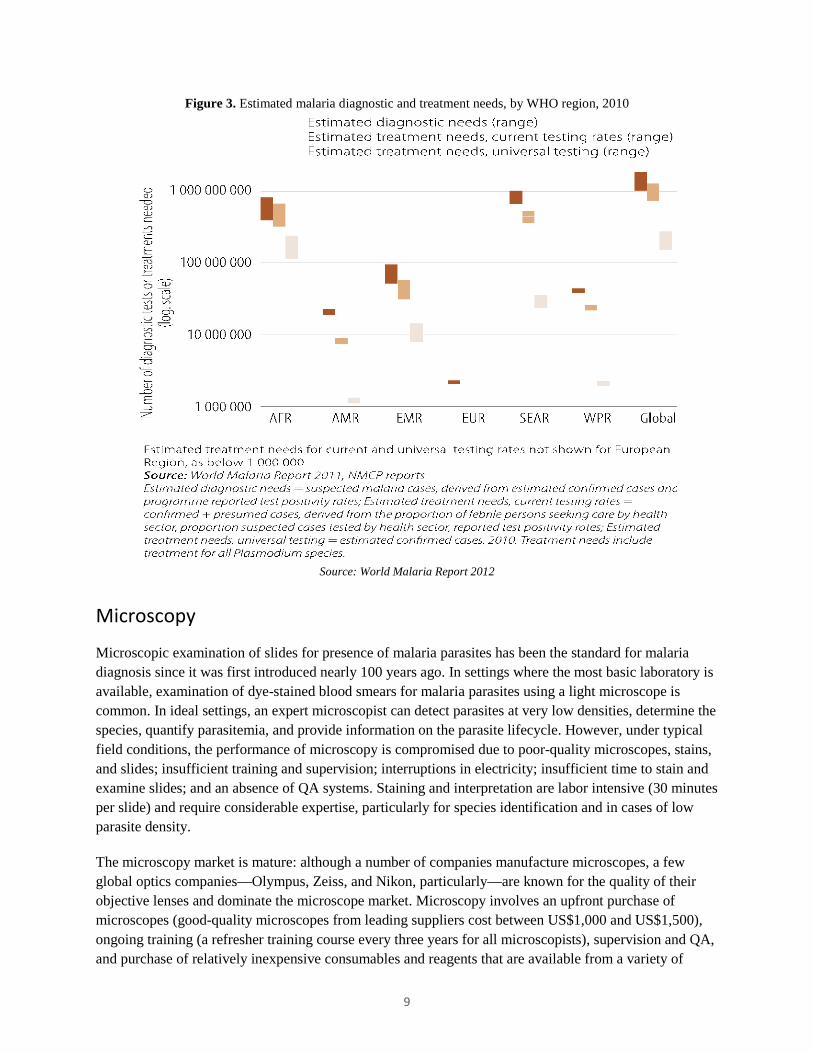
Figure 3. Estimated malaria diagnostic and treatment needs, by WHO region, 2010
Source: World Malaria Report 2012
Microscopy
Microscopic examination of slides for presence of malaria parasites has been the standard for malaria diagnosis since it was first introduced nearly 100 years ago. In settings where the most basic laboratory is available, examination of dye-stained blood smears for malaria parasites using a light microscope is common. In ideal settings, an expert microscopist can detect parasites at very low densities, determine the species, quantify parasitemia, and provide information on the parasite lifecycle. However, under typical field conditions, the performance of microscopy is compromised due to poor-quality microscopes, stains, and slides; insufficient training and supervision; interruptions in electricity; insufficient time to stain and examine slides; and an absence of QA systems. Staining and interpretation are labor intensive (30 minutes per slide) and require considerable expertise, particularly for species identification and in cases of low parasite density.
The microscopy market is mature: although a number of companies manufacture microscopes, a few global optics companies—Olympus, Zeiss, and Nikon, particularly—are known for the quality of their objective lenses and dominate the microscope market. Microscopy involves an upfront purchase of microscopes (good-quality microscopes from leading suppliers cost between US$1,000 and US$1,500), ongoing training (a refresher training course every three years for all microscopists), supervision and QA, and purchase of relatively inexpensive consumables and reagents that are available from a variety of
9
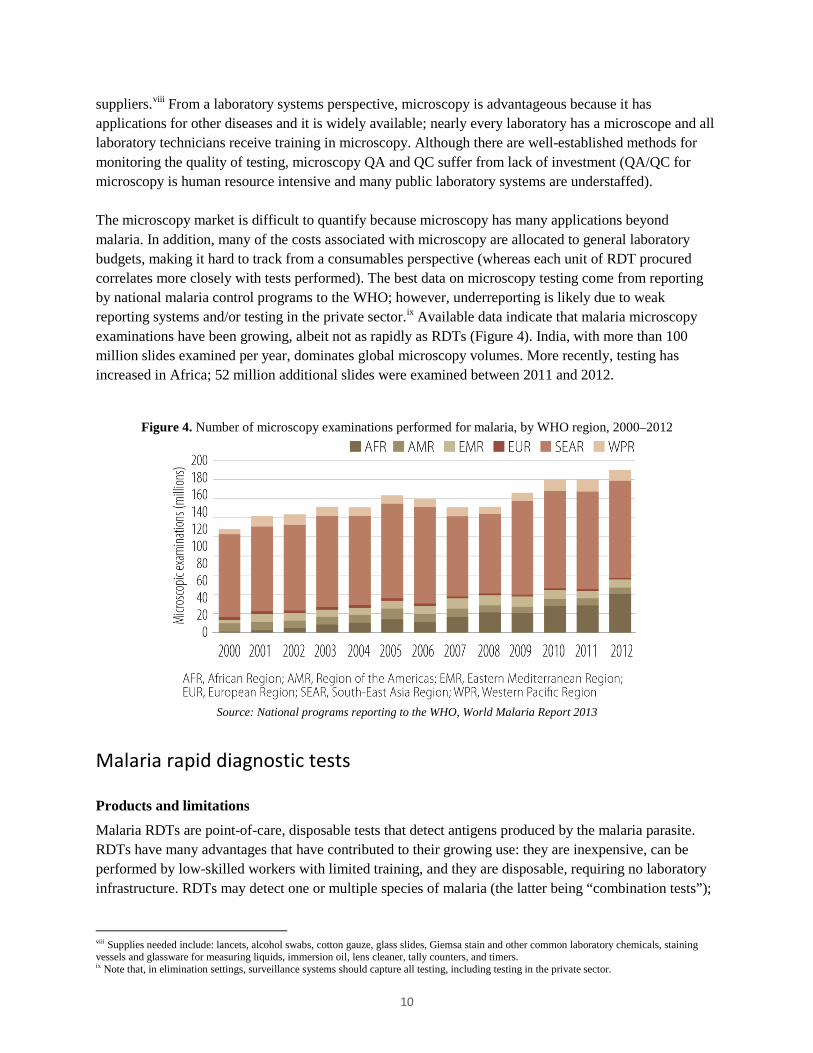
suppliers.viii From a laboratory systems perspective, microscopy is advantageous because it has applications for other diseases and it is widely available; nearly every laboratory has a microscope and all laboratory technicians receive training in microscopy. Although there are well-established methods for monitoring the quality of testing, microscopy QA and QC suffer from lack of investment (QA/QC for microscopy is human resource intensive and many public laboratory systems are understaffed). The microscopy market is difficult to quantify because microscopy has many applications beyond malaria. In addition, many of the costs associated with microscopy are allocated to general laboratory budgets, making it hard to track from a consumables perspective (whereas each unit of RDT procured correlates more closely with tests performed). The best data on microscopy testing come from reporting by national malaria control programs to the WHO; however, underreporting is likely due to weak reporting systems and/or testing in the private sector.ix Available data indicate that malaria microscopy examinations have been growing, albeit not as rapidly as RDTs (Figure 4). India, with more than 100 million slides examined per year, dominates global microscopy volumes. More recently, testing has increased in Africa; 52 million additional slides were examined between 2011 and 2012.
Figure 4. Number of microscopy examinations performed for malaria, by WHO region, 2000–2012
Source: National programs reporting to the WHO, World Malaria Report 2013
Malaria rapid diagnostic tests
Products and limitations
Malaria RDTs are point-of-care, disposable tests that detect antigens produced by the malaria parasite. RDTs have many advantages that have contributed to their growing use: they are inexpensive, can be performed by low-skilled workers with limited training, and they are disposable, requiring no laboratory infrastructure. RDTs may detect one or multiple species of malaria (the latter being “combination tests”);
viii Supplies needed include: lancets, alcohol swabs, cotton gauze, glass slides, Giemsa stain and other common laboratory chemicals, staining vessels and glassware for measuring liquids, immersion oil, lens cleaner, tally counters, and timers. ix Note that, in elimination settings, surveillance systems should capture all testing, including testing in the private sector.
10
however, only performance for P. falciparum has been extensively evaluated.x While the LODxi for RDTs is thought to be adequate for clinical case management, they do not reliably detect asymptomatic infections. With respect to performance, prior to 2009, it was difficult to determine the performance of RDTs: hundreds of small studies (manufacturer and independent) had been conducted; however, poor study design and reporting made it difficult to appreciate RDT performance. In 2009, the WHO completed the first round of product testing for malaria RDTs. This evaluation, a landmark for the market, directly compared the performance of dozens of tests and concluded that, while the quality of products on the market varies, there are many commercially available RDTs that perform as well as, if not better than, operational microscopy.xii Subsequently, three additional rounds of testing have been completed and a fifth is underway. Malaria RDTs have many limitations, including:
• Availability. For common use scenarios, a variety of high-performing products are available; however, in some categories, product selection is limited or improvements are needed (e.g., for P. falciparum, Plasmodium lactate dehydrogenase [pLDH]-based tests for regions where histidine-rich protein 2 [HRP-II] deletion is common; improvement in the LOD for P. vivax).
• Switching between different brands. Between manufacturers, there are differences in the format of the RDT, labeling, components included in the test kit, and in the test procedures. Although the extent of operator error caused by these differences has not been systematically documented, these differences present challenges to operators and to national programs. Given the decentralized nature of testing and the need to train and supervise thousands of operators, there is scope for improving RDTs so as to make them more user friendly and to reduce the programmatic burden of switching tests. The RBM Partnership is currently supporting a task force composed of implementers, policymakers, and manufacturers that is considering opportunities to ease switching and to improve the quality of test kits overall.
• Quality control. Practical technologies for RDT QC do not exist and are inadequate where they do exist. Suitable replacements for human-derived specimens (i.e., heat-stable recombinant antigens) are in development but have yet to come to market. For example, heat-stable quality controls for use at the point of service are not available. Controls in developmentxiii have yet to come to market and/or be extensively evaluated.
• Heat stability. Based largely on anecdotal evidence, experts suggest that heat stability is not an issue for high-performing RDTs. However, there is significant concern among users in the field about heat stability, especially since field conditions exceed manufacturer storage recommendations. Large-scale
x For example, the panels used in the WHO product evaluation are primarily P. falciparum panels, with limited P. vivax testing; P. ovale and P. malariae are not evaluated. Similarly, the 2011 Cochrane review of RDTs looked only at P. falciparum trials. xi Typical evaluation thresholds are 100 to 200 parasites/µl and considered adequate for symptomatic cases. xii The WHO Product Testing Programme is co-sponsored by the Foundation for Innovative New Diagnostics (FIND), the WHO Special Programme for Research and Training in Tropical Diseases (TDR), and the WHO Global Malaria Programme. Testing is performed at the US Centers for Disease Control and Prevention (CDC). Reports from the WHO product testing of malaria RDTs include: Malaria Rapid Diagnostic Test Performance: Results of WHO Product Testing of Malaria RDTs: Round 1 (2008); Round 2 (2009); Round 3 (2010-11); Round 4 (2012). Geneva: WHO. xiii FIND has been working to develop recombinant-based Positive Control Wells (PCWs) for several years, and trials in Uganda and Laos were just completed. The WHO is expected to review data from the PCW trials in 2014 and make recommendations about their use. Some RDT manufacturers are developing/have controls, but these have not been extensively evaluated.
11
studies of heat stability in conditions of use have not been conducted. In addition, heat stability testing by manufacturers during the design phase of product development was often minimal. If/when quality controls for RDTs come to market, they might alleviate concerns about heat stability.
• Issues with the HRP-II antigen. There are two issues related to the HRP-II antigen, the most commonly used detection method in RDTs. First, HRP-II antigens can persist in the blood for several weeks after successful treatment. In practice, this complicates the diagnosis of fever and should be part of provider training on RDTs. Second, HRP-II polymorphisms may affect the performance of RDTs. To date, deletion of HRP-II has been extensively documented in the Amazon region of South America, and in these areas, HRP-II-based tests are not recommended.
RDT market size and growthxiv
The malaria RDT market has been growing rapidly, from 45 million tests sold in 2008 to 205 million in 2012 (Figure 5). Although the total volume of tests has increased, the market value has not grown as rapidly due to declining unit prices. Currently, the market value is estimated to be in the $70 to $80 million range. While RDTs are sold globally, growth of demand is driven by increasingly larger orders from the African public sector, where it is not uncommon to see 5 to 10 million tests per year procured by high-volume countries. While some countries have scaled up use of diagnostics nationally, most have a ways to go. Donors, primarily the Global Fund to Fight AIDS, Tuberculosis and Malaria (Global Fund) and the US President’s Malaria Initiative (PMI), have enabled recent growth in the RDT market, and continued growth is largely contingent upon the availability of funding. However, recent changes to the grant-making process and fundraising challenges at the Global Fund may negatively impact malaria diagnostics budgets in the coming years. (A review of the donor landscape is included later in this report.)
xiv Unless otherwise noted, this section draws on UNITAID’s 2013 Malaria Diagnostics Technology and Market Landscape Updates.
12
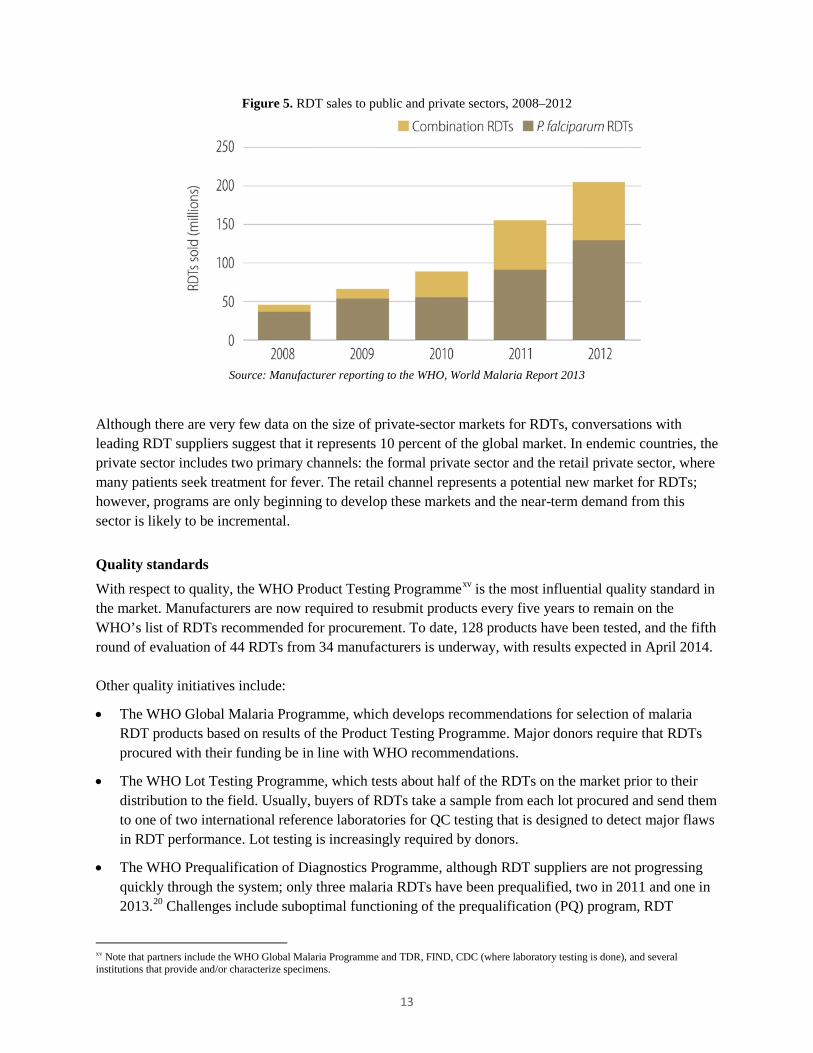
Figure 5. RDT sales to public and private sectors, 2008–2012
Source: Manufacturer reporting to the WHO, World Malaria Report 2013
Although there are very few data on the size of private-sector markets for RDTs, conversations with leading RDT suppliers suggest that it represents 10 percent of the global market. In endemic countries, the private sector includes two primary channels: the formal private sector and the retail private sector, where many patients seek treatment for fever. The retail channel represents a potential new market for RDTs; however, programs are only beginning to develop these markets and the near-term demand from this sector is likely to be incremental.
Quality standards
With respect to quality, the WHO Product Testing Programmexv is the most influential quality standard in the market. Manufacturers are now required to resubmit products every five years to remain on the WHO’s list of RDTs recommended for procurement. To date, 128 products have been tested, and the fifth round of evaluation of 44 RDTs from 34 manufacturers is underway, with results expected in April 2014. Other quality initiatives include:
• The WHO Global Malaria Programme, which develops recommendations for selection of malaria RDT products based on results of the Product Testing Programme. Major donors require that RDTs procured with their funding be in line with WHO recommendations.
• The WHO Lot Testing Programme, which tests about half of the RDTs on the market prior to their distribution to the field. Usually, buyers of RDTs take a sample from each lot procured and send them to one of two international reference laboratories for QC testing that is designed to detect major flaws in RDT performance. Lot testing is increasingly required by donors.
• The WHO Prequalification of Diagnostics Programme, although RDT suppliers are not progressing quickly through the system; only three malaria RDTs have been prequalified, two in 2011 and one in 2013.20 Challenges include suboptimal functioning of the prequalification (PQ) program, RDT
xv Note that partners include the WHO Global Malaria Programme and TDR, FIND, CDC (where laboratory testing is done), and several institutions that provide and/or characterize specimens.
13
supplier inexperience with stringent regulatory systems, and weaknesses in manufacturing quality systems. It is notable that PQ status has no impact on procurement, and that of the three tests that have been prequalified, two are from one of the leading RDT market suppliers while the other has essentially no market share.
The current WHO Product Testing and Lot Testing Programmes for malaria RDT QC are expensive and complex due primarily to their reliance on human-derived specimens. In the near term, these programs will continue to operate normally; however, several changes to streamline operations and reduce costs are anticipated. The major change is a transition to recombinant antigen testing panels, which depends on successful research and development (R&D) that has been underway for several years. It is expected that these recombinant antigen panels will be available for manufacturer purchase and to country programs for lot testing at national reference laboratories.
Demand
Product selection in the public sector is generally conducted through a formalized process involving a committee of local experts and stakeholders established by the national malaria control program that develops a set of specifications and a short list of RDTs eligible for procurement. The main drivers of product selection are price, a product’s ability to meet minimum performance thresholds as demonstrated by the WHO Product Testing Programme, ease of use (including differences from the currently used RDT), and lead time. Generally, this process occurs every few years, as once an RDT has been selected and rolled out, programs prefer to continue using it for a couple of years to avoid the programmatic costs of switching RDTs. Procurement is typically conducted through a tender process that is run by the country or outsourced to agents. The most commonly used RDT, by volume, is the P. falciparum-only test; however, combination tests are also common and more countries reported procuring a combination test in 2012 than a P. falciparum-only test. Among the combination tests, procurement data analysis suggests that the P. falciparum/pan tests are most common.xvi Competitive procurement practices may lead to frequent switching of RDTs to obtain the lowest price, although this is often in conflict with the programmatic desire to stay with the same RDT due to the costs and effort associated with switching RDTs (e.g., retraining of health care workers, publication of new job aids). Analysis of procurement data suggests that the majority of countries have experience with multiple RDTs: half of countries switched test types between 2010 and 2013 (mostly from a P. falciparum-only test to a combination test), and 72 percent switched brands since 2010, often resulting in lower pricing.xvi
Donor landscape
The Global Fund and US PMI have been the primary funders of malaria diagnostic test procurement, and, as such, their policies have significant influence on demand for RDTs. Other important stakeholders affecting the malaria diagnostics market include the donors: the Bill & Melinda Gates Foundation, World Bank, UK Department for International Development, and UNITAID. These donors intervene at various
xvi In Q4 2013, malaria RDT procurement data analysis was conducted by CHAI in collaboration with the author of this report. The data set analyzed includes Global Fund and PMI procurement data. In total, 656 transactions representing more than 388 million RDTs were analyzed, representing 41 percent to 58 percent of the global RDT market in 2010–2013. The analysis is unpublished; however, some of it, referenced in this report, is included in the forthcoming 2013 UNITAID Malaria Diagnostics Market Landscape Update report.
14
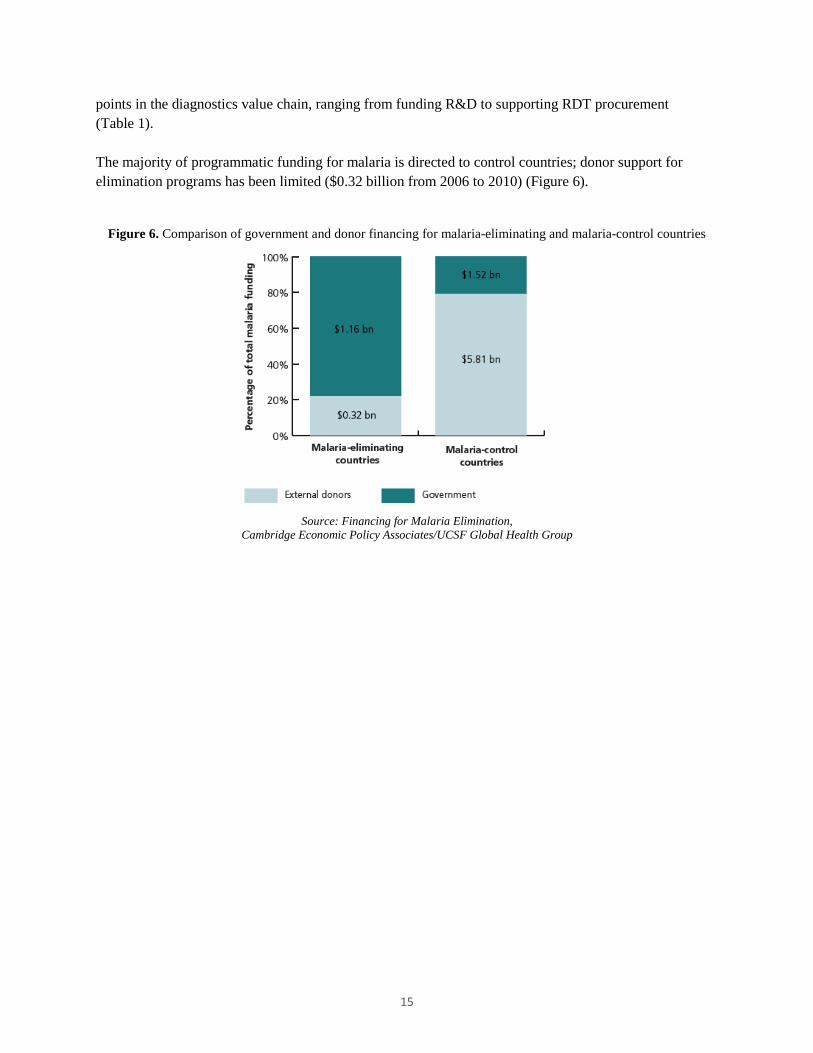
points in the diagnostics value chain, ranging from funding R&D to supporting RDT procurement (Table 1). The majority of programmatic funding for malaria is directed to control countries; donor support for elimination programs has been limited ($0.32 billion from 2006 to 2010) (Figure 6).
Figure 6. Comparison of government and donor financing for malaria-eliminating and malaria-control countries
Source: Financing for Malaria Elimination,
Cambridge Economic Policy Associates/UCSF Global Health Group
15
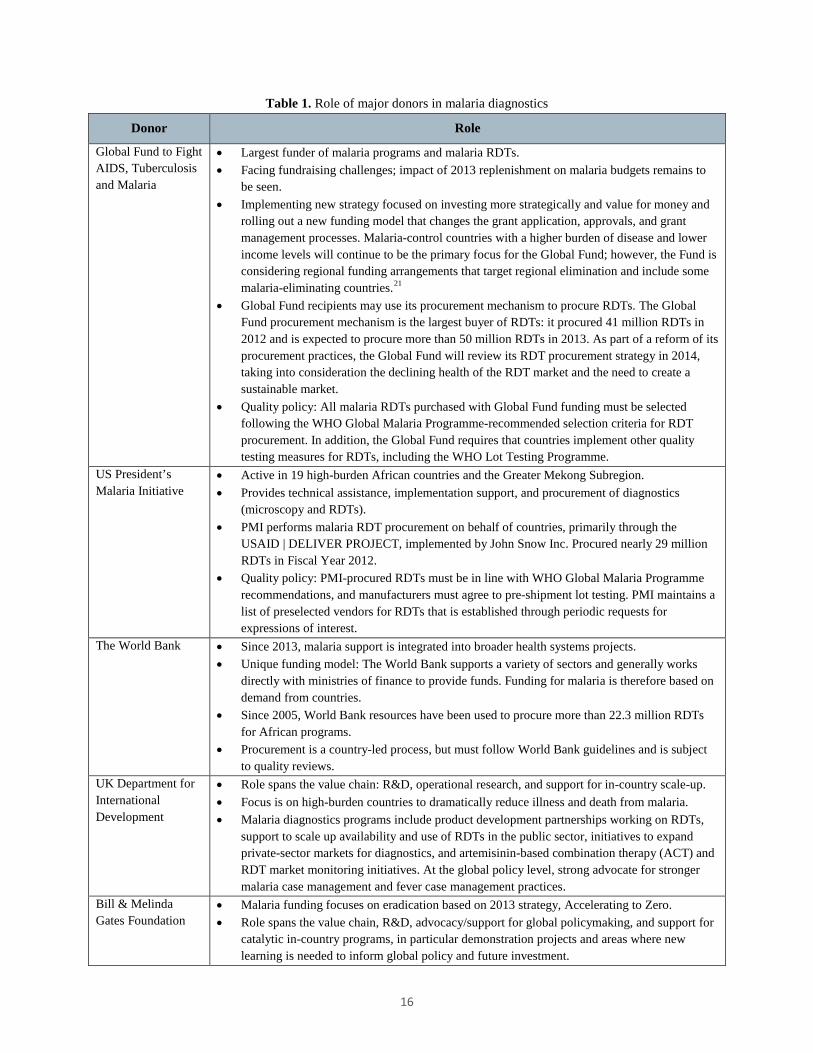
Table 1. Role of major donors in malaria diagnostics
Donor Role
Global Fund to Fight AIDS, Tuberculosis and Malaria
• Largest funder of malaria programs and malaria RDTs. • Facing fundraising challenges; impact of 2013 replenishment on malaria budgets remains to
be seen. • Implementing new strategy focused on investing more strategically and value for money and
rolling out a new funding model that changes the grant application, approvals, and grant management processes. Malaria-control countries with a higher burden of disease and lower income levels will continue to be the primary focus for the Global Fund; however, the Fund is considering regional funding arrangements that target regional elimination and include some malaria-eliminating countries.21
• Global Fund recipients may use its procurement mechanism to procure RDTs. The Global Fund procurement mechanism is the largest buyer of RDTs: it procured 41 million RDTs in 2012 and is expected to procure more than 50 million RDTs in 2013. As part of a reform of its procurement practices, the Global Fund will review its RDT procurement strategy in 2014, taking into consideration the declining health of the RDT market and the need to create a sustainable market.
• Quality policy: All malaria RDTs purchased with Global Fund funding must be selected following the WHO Global Malaria Programme-recommended selection criteria for RDT procurement. In addition, the Global Fund requires that countries implement other quality testing measures for RDTs, including the WHO Lot Testing Programme.
US President’s Malaria Initiative
• Active in 19 high-burden African countries and the Greater Mekong Subregion. • Provides technical assistance, implementation support, and procurement of diagnostics
(microscopy and RDTs). • PMI performs malaria RDT procurement on behalf of countries, primarily through the
USAID | DELIVER PROJECT, implemented by John Snow Inc. Procured nearly 29 million RDTs in Fiscal Year 2012.
• Quality policy: PMI-procured RDTs must be in line with WHO Global Malaria Programme recommendations, and manufacturers must agree to pre-shipment lot testing. PMI maintains a list of preselected vendors for RDTs that is established through periodic requests for expressions of interest.
The World Bank • Since 2013, malaria support is integrated into broader health systems projects. • Unique funding model: The World Bank supports a variety of sectors and generally works
directly with ministries of finance to provide funds. Funding for malaria is therefore based on demand from countries.
• Since 2005, World Bank resources have been used to procure more than 22.3 million RDTs for African programs.
• Procurement is a country-led process, but must follow World Bank guidelines and is subject to quality reviews.
UK Department for International Development
• Role spans the value chain: R&D, operational research, and support for in-country scale-up. • Focus is on high-burden countries to dramatically reduce illness and death from malaria. • Malaria diagnostics programs include product development partnerships working on RDTs,
support to scale up availability and use of RDTs in the public sector, initiatives to expand private-sector markets for diagnostics, and artemisinin-based combination therapy (ACT) and RDT market monitoring initiatives. At the global policy level, strong advocate for stronger malaria case management and fever case management practices.
Bill & Melinda Gates Foundation
• Malaria funding focuses on eradication based on 2013 strategy, Accelerating to Zero. • Role spans the value chain, R&D, advocacy/support for global policymaking, and support for
catalytic in-country programs, in particular demonstration projects and areas where new learning is needed to inform global policy and future investment.
16

Donor Role
UNITAID • Funds market-based approaches to increasing access to health products. • Malaria programs include support for ACT and long-lasting insecticide-treated net scale-up
and to the Affordable Medicines Facility - malaria; $10 million to the Foundation for Innovative New Diagnostics to support the WHO Product and Lot Testing Programmes; more than $30 million to Population Services International to support the development of private-sector markets for RDTs in five endemic countries.
• Market intelligence projects include ACT, RDT, and raw materials forecasting, support for ACT watch, and work to better understand the supply of raw materials for ACTs and RDTs.
RDT pricing
With respect to prices, malaria RDTs are relatively inexpensive tests, and intense competition has led to pricing declines (Figure 7). For example, in 2010, the weighted average public-sector price was $0.49 for P. falciparum RDTs and $0.68 for P. falciparum/pan tests. In 2013, average prices were $0.32 for P. falciparum RDTs and $0.38 for P. falciparum/pan tests. Wide variation in pricing is common, with competitive bids usually resulting in lower pricing.
Figure 7. Weighted average test prices by year for P. falciparum-only and combination RDTs
Source: Procurement Data Analysis 2009–2013, UNITAID/Clinton Health Access Initiative (forthcoming)
While suppliers continue to drive prices lower through competitive bidding, the sustainability of low prices is concerning. Low prices represent strategic attempts by RDT suppliers to capture and penetrate new markets, as well as efforts to use inventory and ensure capacity utilization (e.g., avoid costs associated with shutting down production). However, current pricing appears to be approaching the cost of goods and contributes to the declining attractiveness of the market.
Market share
Analysis of procurement data suggests that market share has been shifting significantly in the past five years; in 2010 and 2011, shifts toward products with higher performance in the WHO Product Testing
17
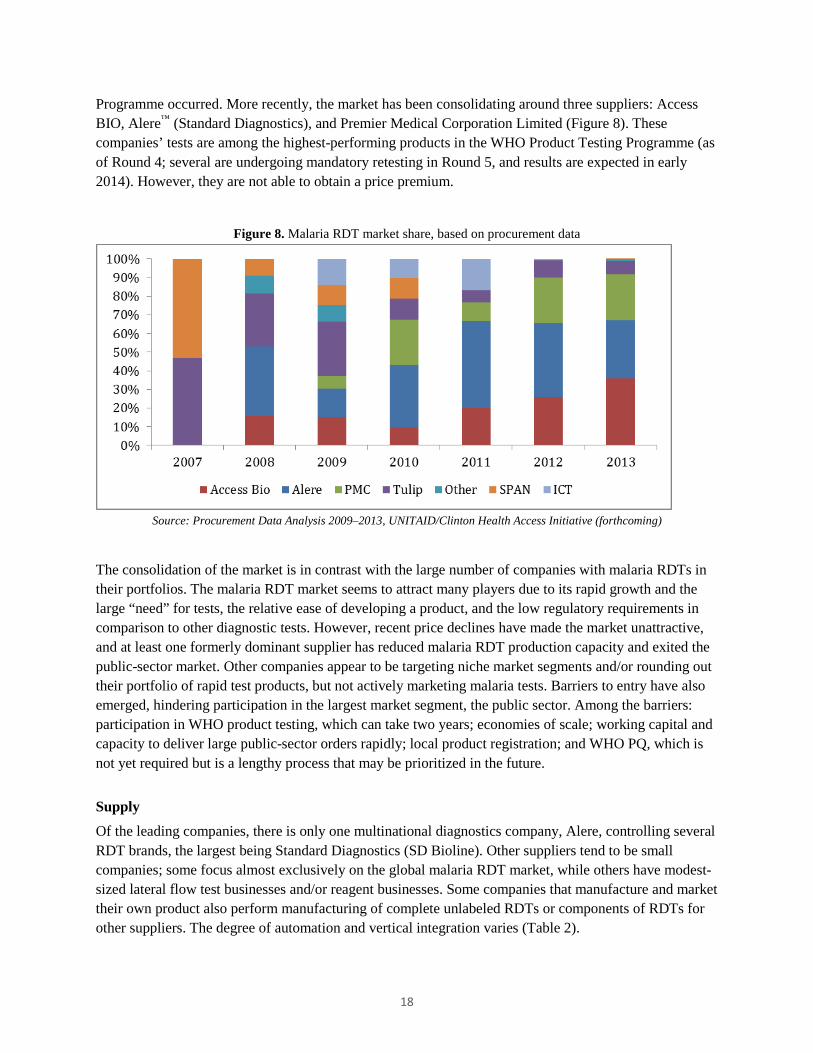
Programme occurred. More recently, the market has been consolidating around three suppliers: Access BIO, Alere™ (Standard Diagnostics), and Premier Medical Corporation Limited (Figure 8). These companies’ tests are among the highest-performing products in the WHO Product Testing Programme (as of Round 4; several are undergoing mandatory retesting in Round 5, and results are expected in early 2014). However, they are not able to obtain a price premium.
Figure 8. Malaria RDT market share, based on procurement data
Source: Procurement Data Analysis 2009–2013, UNITAID/Clinton Health Access Initiative (forthcoming)
The consolidation of the market is in contrast with the large number of companies with malaria RDTs in their portfolios. The malaria RDT market seems to attract many players due to its rapid growth and the large “need” for tests, the relative ease of developing a product, and the low regulatory requirements in comparison to other diagnostic tests. However, recent price declines have made the market unattractive, and at least one formerly dominant supplier has reduced malaria RDT production capacity and exited the public-sector market. Other companies appear to be targeting niche market segments and/or rounding out their portfolio of rapid test products, but not actively marketing malaria tests. Barriers to entry have also emerged, hindering participation in the largest market segment, the public sector. Among the barriers: participation in WHO product testing, which can take two years; economies of scale; working capital and capacity to deliver large public-sector orders rapidly; local product registration; and WHO PQ, which is not yet required but is a lengthy process that may be prioritized in the future.
Supply
Of the leading companies, there is only one multinational diagnostics company, Alere, controlling several RDT brands, the largest being Standard Diagnostics (SD Bioline). Other suppliers tend to be small companies; some focus almost exclusively on the global malaria RDT market, while others have modest-sized lateral flow test businesses and/or reagent businesses. Some companies that manufacture and market their own product also perform manufacturing of complete unlabeled RDTs or components of RDTs for other suppliers. The degree of automation and vertical integration varies (Table 2).
18

Table 2. Characteristics of leading malaria RDT suppliers
Company Location Notes
Access BIO Headquarters: New Jersey Manufacturing: primarily New Jersey, new facility in Ethiopia; however, problems meeting WHO requirements have delayed scale-up of production. (Possible contract manufacturing in Korea.)
• Small business, primary focus on malaria RDTs; recently became listed on the Korean stock exchange.
• HRP-II sourced from National Bioproducts Institute (South Africa); pLDH business acquired from Flow in 2011.
• Moderately automated facility (New Jersey). • R&D: Active in G6PD test development;
fluorescent RDT in development is currently on hold.
• Supplies Premier Medical Corporation Limited with raw materials for tests.
Alere – Standard Diagnostics (SD)
Headquarters: Korea Manufacturing: for leading brand, primarily Korea (WHO-prequalified facility); also has facility in India. Other brands have facilities worldwide.
• Multinational public company focused on point-of-care testing.
• Alere controls many malaria RDT brands, including Binax (USA), Orgenics (Israel), Vision/Clearview (South Africa), Abon (China); SD (Korea) is the vast majority of volumes. After many years of acquisitions and hands-off management, Alere is increasingly focused on integration of disparate businesses.
• SD has highly automated production facility in Korea and in-house monoclonal production.
• R&D: QC for RDTs is in development. • Only major WHO PQ supplier, although had
Notice of Concern issued in 2012 (mainly due to issues with HIV RDTs). Company has addressed WHO concerns.
Premier Medical Corporation Limited
Headquarters: New Jersey, India Manufacturing: India
• Has several RDTs in their portfolio. • Assembly-only operation; sources strips from
Access BIO (possibly other companies since 2013). In terms of manufacturing, malaria RDTs are made to order, and suppliers generally do not maintain significant inventories of finished goods. Although production capacity is generally not considered to be a limiting factor in this market, managing logistics to meet tight delivery time frames requires significant effort on the part of manufacturers. The major components of test kits are commodities, largely sourced from Asia and costing $0.005 to $0.03 each, with the plastic cassette and foil pouch generally costing the most. With the exception of nitrocellulose, other membranes, and monoclonal antibodies, there are several suppliers of components. Quality nitrocellulose and membranes are available from a limited number of suppliers; RDT manufacturers typically work with one primary supplier. Currently, monoclonal antibodies are available from a limited number of commercial sources or are produced in house by a few RDT manufacturers. Estimates of the cost of monoclonal antibody per test vary, as manufacturers use different quantities and combinations of antibodies depending on the product. Assuming a commercial source of antibody is used,
19

the antibody cost for RDTs ranges from $0.02 to $0.09 per test, with the multi-line combination tests and smaller production runs having a higher cost per test. In addition to the components, labor is a major cost. Demand growth, decreasing RDT prices, and rising labor costs have contributed to increasing levels of automation, although the degree of automation varies.
Summary and implications for innovation
Although the pricing declines have enabled greater access to testing, in light of current market conditions, the malaria diagnostics market is increasingly unhealthy. The market is characterized by competition on price, the ability to deliver rapidly, and meeting minimum quality standards. While demand is likely to continue to increase as malaria-control countries continue to scale diagnostic testing in the public sector, other market segments, such as the private sector, will take time to mature. These dynamics have important implications for RDT quality and for innovation. With respect to quality, market conditions put RDT quality at risk. The market conditions also limit the business incentives for new product development at a time when improvements to existing RDTs as well as development of new technologies to address unmet needs are needed. The current downward trend in pricing for malaria RDTs generally contrasts with the business principles of introducing a new product, as the malaria market may be unwilling to pay a premium for new products, unless their value is perceived to be substantially better than today’s RDTs, and companies are therefore unlikely to recapture their R&D investment through price premiums. While there are a number of products in the pipeline for malaria, many have stalled due to lack of pull from the market and a general lack of R&D funding for malaria diagnostics.
20

Country use of diagnostics for elimination and active use scenarios
Use of diagnostics for malaria elimination
As a starting point for evaluating the opportunity for new diagnostics to support elimination, an understanding of current and future diagnostics policies and uses in malaria-eliminating countries is necessary. Additionally, existing work on malaria diagnostics markets has largely focused on PCD markets; in this report, active uses are also investigated. This section is structured in two parts: the first summarizes qualitative analysis of policy and diagnostic test use across a range of countries, and the second summarizes analysis of diagnostic testing volume data reported by national programs to the WHO.
Qualitative analysis: trends in diagnostics use
To gain a better appreciation for current use of malaria diagnostics, we undertook a desk review, supplemented by reports from field visits and interviews.
xviii
xvii The focus of the review was malaria-eliminating countries (ten countries), although a handful of other endemic countries where malaria elimination strategies might be considered in the medium term were also included (six countries). A summary of key themes and findings is below.
Passive case detection
• There is room for improvement in PCD. Testing rates are generally high; however, many countries have included plans to strengthen case confirmation. Several report that clinical diagnosis (approximately 20 percent; in some instances, higher) is still practiced, particularly in remote communities and/or at the periphery. In part, a reliance on microscopy, especially outside of Africa, means that diagnostic coverage is insufficient at the lower levels of the system. In some instances, treatment is given empirically and a smear is taken and transported to another facility for results. In Africa, where RDTs are more commonly used, stockouts are reported.
• Across most countries, diagnostic coverage in the more remote communities and at the lower levels of the health system is a challenge. In some places, community health worker and village health worker programs using RDTs have been/are being scaled up.
• In general, RDTs are more commonly used for routine diagnosis in settings where malaria diagnosis has only recently been scaled up (primarily in African countries). In the majority of malaria-eliminating countries, microscopy is the primary mode of diagnosis and RDT use is minimal. Outside of Africa, RDTs are often considered to be a “back-up for emergency use,” for “outbreak response,” and for use in “remote areas.” In these settings, when an RDT is performed, it is used to guide patient management and often a slide is made and sent to the laboratory for confirmation.
xvii See Annex V for a list of experts interviewed. Sources consulted include: the Asia Pacific Malaria Elimination Network Country Partner Strategy and Intervention Matrices, PATH DIAMETER Country Trip Reports, PMI Malaria Operational Plans (MOPs), UCSF Global Health Group and World Health Organization Case Studies, and other limited publications from the literature. xviii Malaria-eliminating countries reviewed include: Bhutan, China, Namibia, North Korea, Philippines, Solomon Islands, Sri Lanka, Swaziland, Thailand, and Vietnam (Greater Mekong Subregion multi-country PMI MOP only). Malaria-control countries include: Angola, Ethiopia, Indonesia, Myanmar (Greater Mekong Subregion multi-country PMI MOP only), Zambia, and Zanzibar.
21
• In the countries reviewed, RDTs were frequently purchased with funds from the Global Fund or PMI, as opposed to government budgets. Constraints cited by end-users include poor speciation and inability to quantify parasite density. Although this may not be critical for initial patient management, it is relevant when monitoring response to treatment, which is commonly done in programs concerned about drug resistance.
• Parallel systems, whereby the national malaria control program sets up dedicated clinics (sometimes called “enhanced” or “activated” PCD), are not common, but are in place in a few countries. Often, these clinics yield the most positive cases (compared to other passive and active systems).
• Overall, there is little mention of the private sector and its role in PCD. In some countries, given poor treatment-seeking behavior, this sector is likely to play an important role in malaria case management.
• Follow-up of patients who test positive at regular intervals to ensure response to treatment is common in Asian countries, particularly in areas where drug resistance is a concern.
Active infection detection
• Use of periodic (every two to three years), nationally representative surveys was reported for about half of the countries reviewed, while others rely on reporting through the PCD systems, complemented by smaller-scale surveys of high-risk areas (focused testing and treatment, or FTAT). Surveys are conducted using a variety of technologies (often a combination), including RDT, microscopy, and molecular methods (primarily polymerase chain reaction [PCR] and piloting of loop-mediated isothermal amplification [LAMP]). A few countries are using serology or are planning to use serology to identify foci and hotspots/hotpops.
• Most of the malaria-eliminating countries reviewed, and a few others (e.g., Indonesia, Zambia, and Zanzibar), are performing some form of active ID targeting high-risk areas and/or populations. Among the more commonly reported activities are reactive ID (usually community index case as opposed to mobile); FTAT; border screening (often mentioned as planned, not yet implemented); and time-location screening of mobile populations, including migrant workers, military, and returning workers. Mobile clinics and “mass blood surveys” are commonly reported. In general, given the lack of standardization in the language used to describe active ID activities, it is difficult to categorize the activities reported.
• Reactive ID is common and reported by most elimination countries; however, there is a large variety in how it is implemented. This is consistent with a recent paper summarizing survey results from active ID in Asia Pacific countries.7 Variation occurs in the triggers for active ID (e.g., all cases, or just those that originated locally), whether only febrile individuals are tested or if all individuals are tested, and in the number of households screened around each index case (e.g., only members of the index household, five to ten homes surrounding the index home, an entire village, or a 100-m to 1-km radius around a household). In some instances, travel companions are also followed up and screened. In practice, experts suggest that the number of tests performed for each index case is likely to be 10 to 100.
• Many programs are focused on limiting imported malaria. Strategies reported include use of mobile clinics in border areas and in areas where migrant workers reside. It is also common to require screening of foreign workers in order to receive a work permit. Island nations that are eliminating
22
malaria (e.g., Sri Lanka, Solomon Islands) screen at airports and ports or are planning to establish screening in these locations. Mauritius, which is malaria free, relied on an intensive passenger screening program at airports and ports to eliminate malaria and continues to screen tens of thousands of passengers each year as part of its program to prevent reintroduction.22
• MTAT was mentioned by only two countries (Solomon Islands and Zambia). FTAT is more common.
• In general, available resources limit the magnitude of active ID operations. The cost of the diagnostic test is often minimal compared to the other costs involved in these activities, such as salaries and per diems, maintenance of vehicles and boats, and fuel. Dealing with seasonality can also be challenging from a resource perspective: staff are fully occupied during the malaria season, but may be idle or reallocated to other areas of the health system during the rest of the year.
• The technologies employed include a mix of microscopy, RDTs, and molecular methods. Outside of Africa, microscopy is often the primary diagnostic. For example, among the Asia Pacific countries responding to a survey, all used microscopy for reactive ID and many used it in combination with RDTs and PCR.7 It is not uncommon (although it may not be policy) for health workers to transport a microscope to the community being screened to avoid loss to follow-up.
• Several programs that have access to molecular methods have an appreciation for the large reservoir of asymptomatic infections and are recognizing the limitations of microscopy and RDTs for detecting such infections.
• There is scope for refining and optimizing active ID programs, especially in light of practical realities and resources. PATH field teams and experts report that implementation frequently deviates from policy, largely due to resource constraints (e.g., human resources, availability of transport, supplies, weather) resulting in low coverage or compromised sampling. Often, decision-making is delegated to the local level (e.g., in which village to implement FTAT, what radius to cover in reactive ID); however, it is not always clear that the necessary expertise is available at this level, and again decisions are often based on operational constraints.
Large-scale proactive infection detection operations
To improve the understanding of active ID, we reviewed Aggressive Active Case Detection: A Malaria Control Strategy Based on the Brazilian Model,23 a publication describing proactive ID strategies. The publication includes an in-depth discussion of Brazil’s malaria program, whereby the Ministry of Health has been using a model of “aggressive active case detection” in which most members of a community are tested and treated for malaria on a monthly basis. Brazil uses RDTs and microscopy for this work, and it continues to report exceptionally high volumes of active ID today (nearly 1.5 million tests per year). Other examples of large-scale active ID often include periodic (e.g., monthly) visits to communities where residual transmission occurs, often called “mass blood surveys.” Historically, these activities have been conducted largely using microscopy. The scale is generally in the tens of thousands, and these are undertaken at the district level (Table 3). Not all of these examples were successful; success was associated with simultaneous vector control work, and with populations whose movement is relatively limited (or well tracked) and that were amenable to routine screening. Mauritius, Morocco, Turkey, and Southern China have also undertaken proactive screening on a large scale.22,23,24,25
23
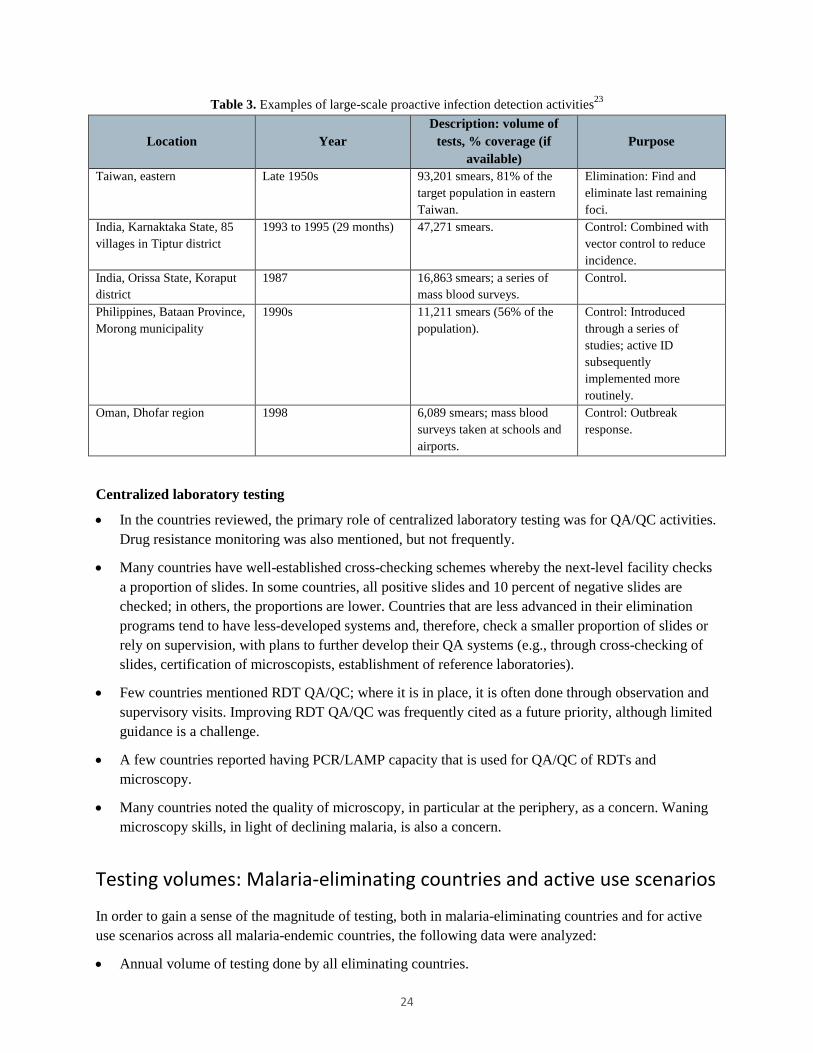
Table 3. Examples of large-scale proactive infection detection activities23
Location Year Description: volume of
tests, % coverage (if available)
Purpose
Taiwan, eastern Late 1950s 93,201 smears, 81% of the target population in eastern Taiwan.
Elimination: Find and eliminate last remaining foci.
India, Karnaktaka State, 85 villages in Tiptur district
1993 to 1995 (29 months) 47,271 smears. Control: Combined with vector control to reduce incidence.
India, Orissa State, Koraput district
1987 16,863 smears; a series of mass blood surveys.
Control.
Philippines, Bataan Province, Morong municipality
1990s 11,211 smears (56% of the population).
Control: Introduced through a series of studies; active ID subsequently implemented more routinely.
Oman, Dhofar region 1998 6,089 smears; mass blood surveys taken at schools and airports.
Control: Outbreak response.
Centralized laboratory testing
• In the countries reviewed, the primary role of centralized laboratory testing was for QA/QC activities. Drug resistance monitoring was also mentioned, but not frequently.
• Many countries have well-established cross-checking schemes whereby the next-level facility checks a proportion of slides. In some countries, all positive slides and 10 percent of negative slides are checked; in others, the proportions are lower. Countries that are less advanced in their elimination programs tend to have less-developed systems and, therefore, check a smaller proportion of slides or rely on supervision, with plans to further develop their QA systems (e.g., through cross-checking of slides, certification of microscopists, establishment of reference laboratories).
• Few countries mentioned RDT QA/QC; where it is in place, it is often done through observation and supervisory visits. Improving RDT QA/QC was frequently cited as a future priority, although limited guidance is a challenge.
• A few countries reported having PCR/LAMP capacity that is used for QA/QC of RDTs and microscopy.
• Many countries noted the quality of microscopy, in particular at the periphery, as a concern. Waning microscopy skills, in light of declining malaria, is also a concern.
Testing volumes: Malaria-eliminating countries and active use scenarios
In order to gain a sense of the magnitude of testing, both in malaria-eliminating countries and for active use scenarios across all malaria-endemic countries, the following data were analyzed:
• Annual volume of testing done by all eliminating countries.
24
• Number of malaria-endemic countries with policies for active use.
• Breakdown in test volumes between PCD and active ID. The data sets analyzed are described below; all are derived from national reporting to the WHO. It is possible that countries did not follow reporting guidance; however, it would be impractical to validate all of the data provided. Selected validation of the data (e.g., high-volume countries) might, however, lend more confidence to the analysis, but was not performed given the timelines for this project.
2012 testing volumes in malaria-eliminating countries
Data reported by national programs to the WHO on diagnostic testing volumes in 2012 were analyzed (specifically, Annex 6A of the 2013 World Malaria Report). While this data set is not reliable for high-burden countries due to weak reporting, countries considering elimination, by definition, have stronger reporting systems in place; and, therefore, the reported testing volumes should be reasonably accurate.xix In 2012, malaria-eliminating countries performed 20.9 million diagnostic tests (both PCD and active ID) (Table 4). Overall, the eliminating countries represented an estimated 5 percent of the global diagnostics market in 2012.xx
xix Of 103 countries that submitted data to the WHO, 62 countries representing 15 percent of the global burden are considered to have adequate reporting systems. The 34 malaria-eliminating countries are among these countries. The reported data for 41 higher-incidence countries, representing the remaining 85 percent of the global burden, are not sufficiently complete or consistent.2 xx Eliminating countries are 8.6 percent of the total volume of tests reported by endemic countries globally using data from Annex 6a of World Malaria Report 2013. However, while the total volume of tests performed in eliminating countries is likely accurate, the contribution of eliminating countries to the global total is over-represented due to poor reporting of testing in high-volume countries. Using a more accurate estimate for the denominator of 393 million tests (205 million RDTs + 188 million slides) performed globally suggests that 5 percent is a more reasonable estimate.
25
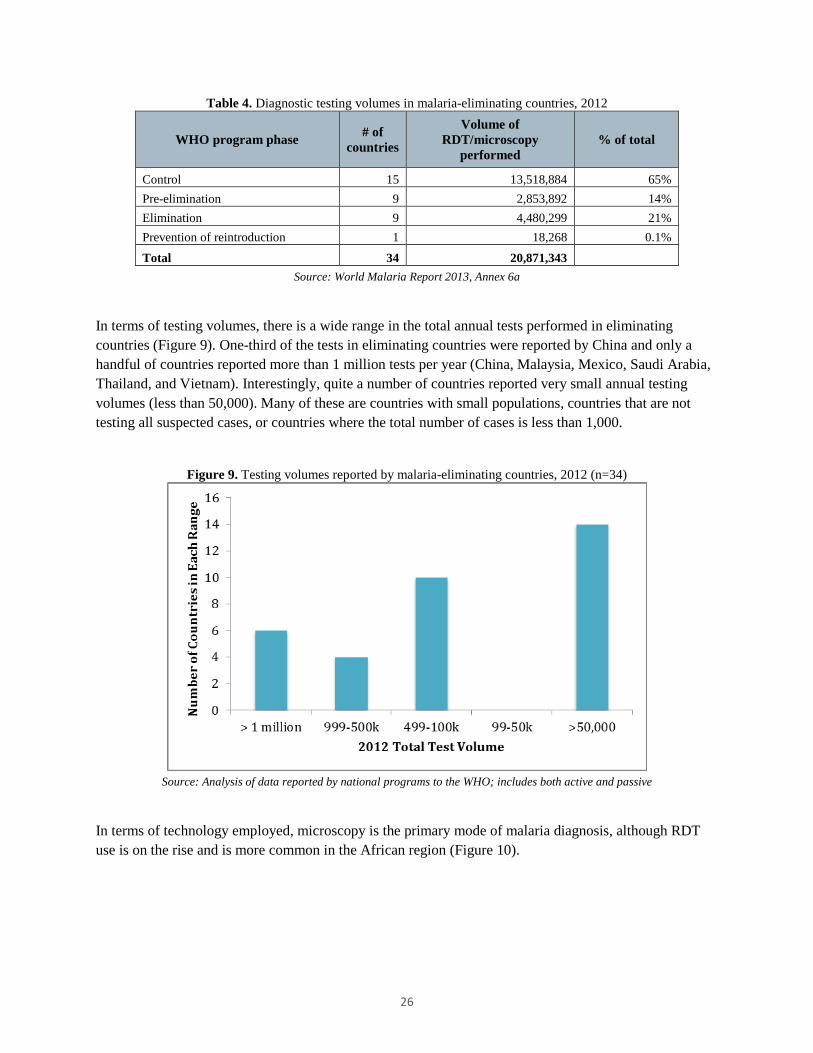
Table 4. Diagnostic testing volumes in malaria-eliminating countries, 2012
WHO program phase # of countries
Volume of RDT/microscopy
performed % of total
Control 15 13,518,884 65% Pre-elimination 9 2,853,892 14% Elimination 9 4,480,299 21% Prevention of reintroduction 1 18,268 0.1%
Total 34 20,871,343 Source: World Malaria Report 2013, Annex 6a
In terms of testing volumes, there is a wide range in the total annual tests performed in eliminating countries (Figure 9). One-third of the tests in eliminating countries were reported by China and only a handful of countries reported more than 1 million tests per year (China, Malaysia, Mexico, Saudi Arabia, Thailand, and Vietnam). Interestingly, quite a number of countries reported very small annual testing volumes (less than 50,000). Many of these are countries with small populations, countries that are not testing all suspected cases, or countries where the total number of cases is less than 1,000.
Figure 9. Testing volumes reported by malaria-eliminating countries, 2012 (n=34)
Source: Analysis of data reported by national programs to the WHO; includes both active and passive
In terms of technology employed, microscopy is the primary mode of malaria diagnosis, although RDT use is on the rise and is more common in the African region (Figure 10).
26

Figure 10. Proportion of RDTs versus microscopy, 2010 and 2012, by WHO region
EMRO = Eastern Mediterranean Regional Office; SEARO = South-East Asia Regional Office; WPRO = Western Pacific Regional Office
Source: Analysis of unpublished data reported by national programs to the WHO;xxi includes both active and passive
Policies for active use scenarios (all malaria-endemic countries)
Figure 11 and Table 5 summarize data on active use scenarios reported by countries and published in the 2013 World Malaria Report. Given the magnitude of countries, these data were not validated and it is possible that countries did not interpret WHO reporting guidelines correctly. In summary, many countries have policies for reactive ID (42) and proactive ID (38), as well as for MTAT (30). Additionally, many countries in the control phase have adopted strategies that are generally considered to be elimination tactics. The data also indicate that even among eliminating countries, there is variety in the tactics employed.
xxi Analysis based on unpublished data reported by national programs to the WHO (data set described below in the section comparing active ID and PCD volumes), supplemented by additional information where available (e.g., WHO data were compared to Global Fund RDT procurement data available for 14 eliminating countries and RDT volumes adjusted upward where relevant).
27

Figure 11. Countries reporting active use scenarios to the WHO
*ACD = active case detection (referred to as “active infection detection” in this report)
Source: Analysis of policy reporting by national programs to the WHO, published in World Malaria Report 2013 (Country Profiles)
Table 5. Percentage of countries reporting active use scenarios to the WHO, by program phase
Control Pre-elimination Elimination Prevention of reintroduction
Active ID for case investigation (reactive) 33% 82% 67% 100% Active ID at the community level of febrile cases (proactive) 32% 55% 78% 0%
Mass screening is undertaken 28% 45% 22% 100% Source: Analysis of policy reporting by national programs to the WHO,
published in World Malaria Report 2013 (Country Profiles)
Comparing passive and active infection detection volumes (subset of malaria-endemic countries)
In order to gain a sense of the magnitude of passive and active diagnostic test volumes, and how these change as programs progress toward elimination, an unpublished data set of 648 entries, covering 2007 through 2012 for 108 countries (provided by the WHO), was analyzed. As part of annual reporting to the WHO, national programs from endemic countries report the total volumes of diagnostic tests performed, breaking out volumes according to PCD and active ID. In order to create a subset of countries that reported both active and passive volumes, the data were cleaned as follows: (1) countries that did not report any active ID volumes were excluded (62 percent of the total data entries); and (2) testing volumes for the remaining countries were reviewed for consistency and anomalies that may have resulted from misinterpretation of the reporting guidelines (excluding an additional 14 percent of data entries). The final set of data analyzed comprised 24 percent of the original set, representing 32 countries (157 entries). For the countries included in this data set, the data have been treated in the way countries are asked to report; however, it is possible that some countries do not follow reporting guidance. Additional validation of the data with countries and experts might be informative, although this was not possible given the timelines for this project. For example, some countries did not report active ID volumes every year, and it would be interesting to know if this was an oversight in reporting or if there was indeed a gap in active ID.
28
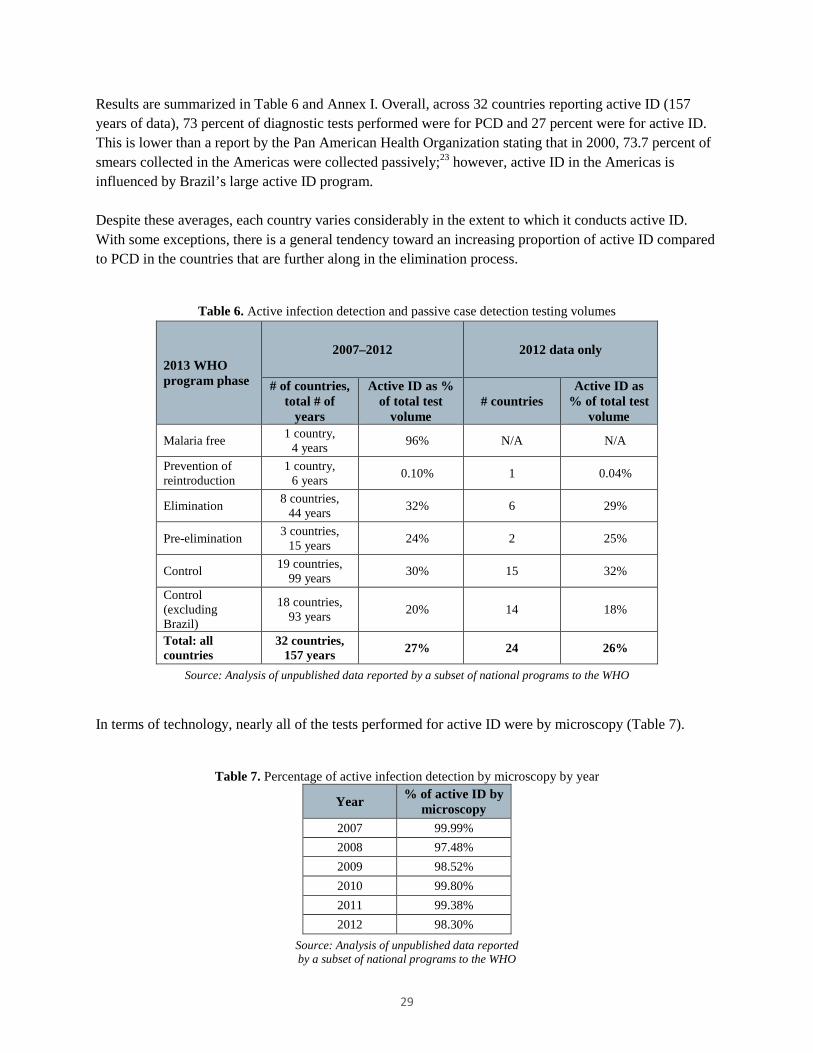
Results are summarized in Table 6 and Annex I. Overall, across 32 countries reporting active ID (157 years of data), 73 percent of diagnostic tests performed were for PCD and 27 percent were for active ID. This is lower than a report by the Pan American Health Organization stating that in 2000, 73.7 percent of smears collected in the Americas were collected passively;23 however, active ID in the Americas is influenced by Brazil’s large active ID program. Despite these averages, each country varies considerably in the extent to which it conducts active ID. With some exceptions, there is a general tendency toward an increasing proportion of active ID compared to PCD in the countries that are further along in the elimination process.
Table 6. Active infection detection and passive case detection testing volumes
2013 WHO program phase
2007–2012 2012 data only
# of countries, total # of
years
Active ID as % of total test
volume # countries
Active ID as % of total test
volume
Malaria free 1 country, 4 years 96% N/A N/A
Prevention of reintroduction
1 country, 6 years 0.10% 1 0.04%
Elimination 8 countries, 44 years 32% 6 29%
Pre-elimination 3 countries, 15 years 24% 2 25%
Control 19 countries, 99 years 30% 15 32%
Control (excluding Brazil)
18 countries, 93 years 20% 14 18%
Total: all countries
32 countries, 157 years 27% 24 26%
Source: Analysis of unpublished data reported by a subset of national programs to the WHO In terms of technology, nearly all of the tests performed for active ID were by microscopy (Table 7).
Table 7. Percentage of active infection detection by microscopy by year
Year % of active ID by microscopy
2007 99.99% 2008 97.48% 2009 98.52% 2010 99.80% 2011 99.38% 2012 98.30%
Source: Analysis of unpublished data reported by a subset of national programs to the WHO
29
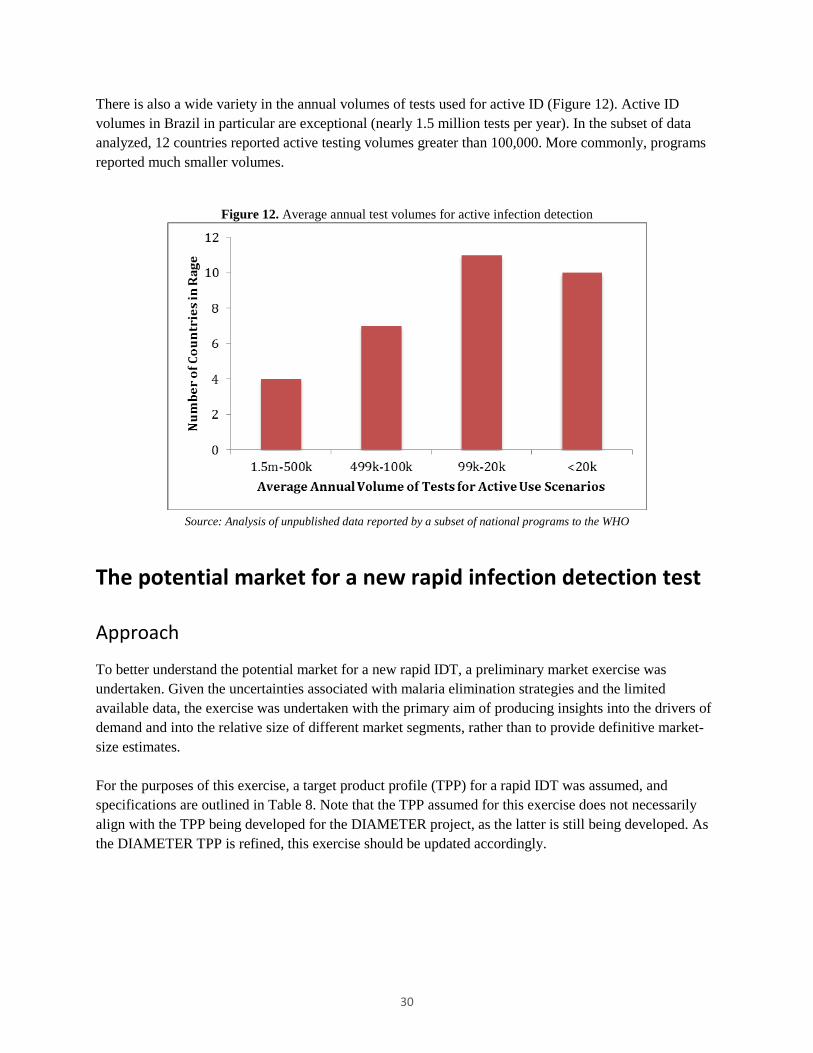
There is also a wide variety in the annual volumes of tests used for active ID (Figure 12). Active ID volumes in Brazil in particular are exceptional (nearly 1.5 million tests per year). In the subset of data analyzed, 12 countries reported active testing volumes greater than 100,000. More commonly, programs reported much smaller volumes.
Figure 12. Average annual test volumes for active infection detection
Source: Analysis of unpublished data reported by a subset of national programs to the WHO
The potential market for a new rapid infection detection test
Approach
To better understand the potential market for a new rapid IDT, a preliminary market exercise was undertaken. Given the uncertainties associated with malaria elimination strategies and the limited available data, the exercise was undertaken with the primary aim of producing insights into the drivers of demand and into the relative size of different market segments, rather than to provide definitive market-size estimates. For the purposes of this exercise, a target product profile (TPP) for a rapid IDT was assumed, and specifications are outlined in Table 8. Note that the TPP assumed for this exercise does not necessarily align with the TPP being developed for the DIAMETER project, as the latter is still being developed. As the DIAMETER TPP is refined, this exercise should be updated accordingly.
30
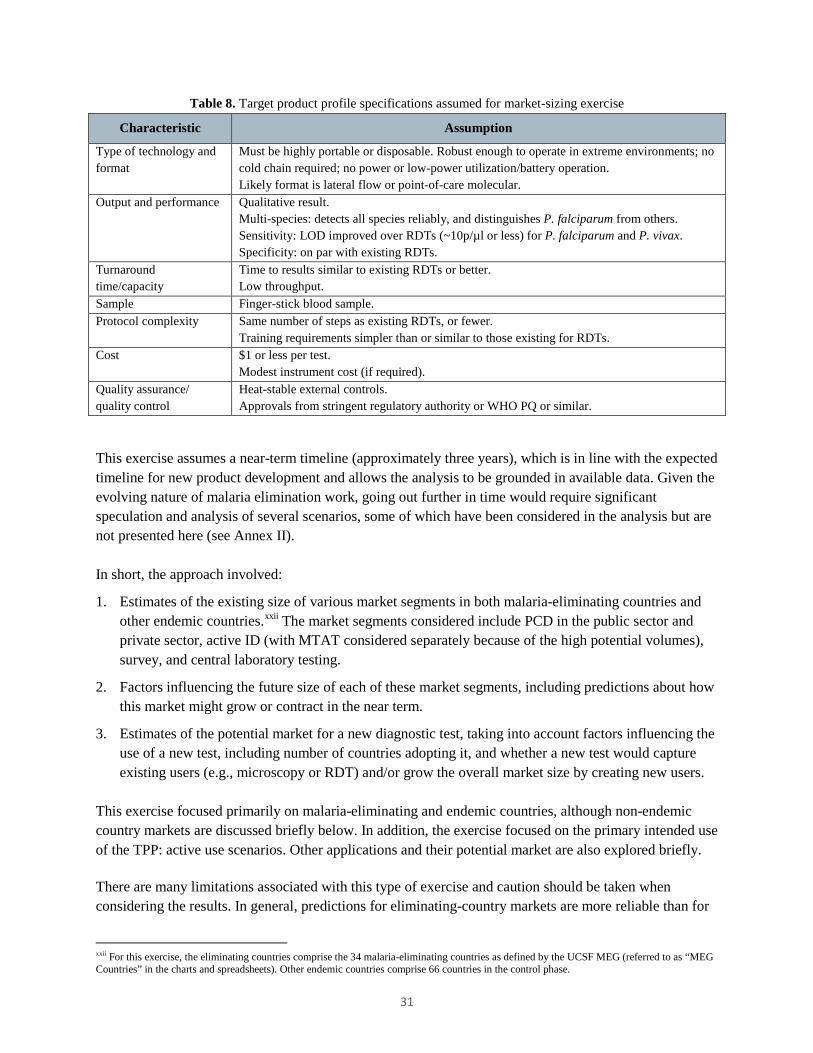
Table 8. Target product profile specifications assumed for market-sizing exercise
Characteristic Assumption
Type of technology and format
Must be highly portable or disposable. Robust enough to operate in extreme environments; no cold chain required; no power or low-power utilization/battery operation. Likely format is lateral flow or point-of-care molecular.
Output and performance Qualitative result. Multi-species: detects all species reliably, and distinguishes P. falciparum from others. Sensitivity: LOD improved over RDTs (~10p/µl or less) for P. falciparum and P. vivax. Specificity: on par with existing RDTs.
Turnaround time/capacity
Time to results similar to existing RDTs or better. Low throughput.
Sample Finger-stick blood sample. Protocol complexity Same number of steps as existing RDTs, or fewer.
Training requirements simpler than or similar to those existing for RDTs. Cost $1 or less per test.
Modest instrument cost (if required). Quality assurance/ quality control
Heat-stable external controls. Approvals from stringent regulatory authority or WHO PQ or similar.
This exercise assumes a near-term timeline (approximately three years), which is in line with the expected timeline for new product development and allows the analysis to be grounded in available data. Given the evolving nature of malaria elimination work, going out further in time would require significant speculation and analysis of several scenarios, some of which have been considered in the analysis but are not presented here (see Annex II). In short, the approach involved:
1. Estimates of the existing size of various market segments in both malaria-eliminating countries and other endemic countries.xxii The market segments considered include PCD in the public sector and private sector, active ID (with MTAT considered separately because of the high potential volumes), survey, and central laboratory testing.
2. Factors influencing the future size of each of these market segments, including predictions about how this market might grow or contract in the near term.
3. Estimates of the potential market for a new diagnostic test, taking into account factors influencing the use of a new test, including number of countries adopting it, and whether a new test would capture existing users (e.g., microscopy or RDT) and/or grow the overall market size by creating new users.
This exercise focused primarily on malaria-eliminating and endemic countries, although non-endemic country markets are discussed briefly below. In addition, the exercise focused on the primary intended use of the TPP: active use scenarios. Other applications and their potential market are also explored briefly. There are many limitations associated with this type of exercise and caution should be taken when considering the results. In general, predictions for eliminating-country markets are more reliable than for
xxii For this exercise, the eliminating countries comprise the 34 malaria-eliminating countries as defined by the UCSF MEG (referred to as “MEG Countries” in the charts and spreadsheets). Other endemic countries comprise 66 countries in the control phase.
31

control countries, because reporting on current diagnostic uses and volumes, which are the starting point for this analysis, are much more reliable for eliminating countries. Several assumptions were made about adoption rates and how the market might change in the coming years. Additional details about the approach taken for each segment, assumptions made, and sensitivity analyses are outlined in the market-sizing spreadsheets (Annex II). Given the evolving nature of malaria elimination research and guidance, as well as the limited availability of data on current markets, many scenarios are possible. Only one is presented here; however, the effect of changing various assumptions was considered during the analysis, and this is presented in the spreadsheets. As more evidence becomes available, additional refinements and scenarios should be undertaken. Given the timelines for this project, extensive validation and review of the assumptions was not possible, although additional validation might increase confidence in the results.
Findings
The potential market for a new rapid IDT is estimated to be in the range of 9.4 to 10.8 million tests (Figure 13). Assuming a price of $1 per test, the market value is approximately $10 million. The primary markets for the new test are active ID and PCD in eliminating countries, followed by active ID in control countries. MTAT is currently not a recommended practice for reducing transmission in control countries; however, operational research is underway to assess its potential role in reducing transmission. Because it has potential to contribute significantly to the overall market for a new test, it is considered here (the dotted line in Figure 13).
Figure 13. Potential market for a new rapid infection detection test
The tables below summarize the data and assumptions that went into the exercise.
32
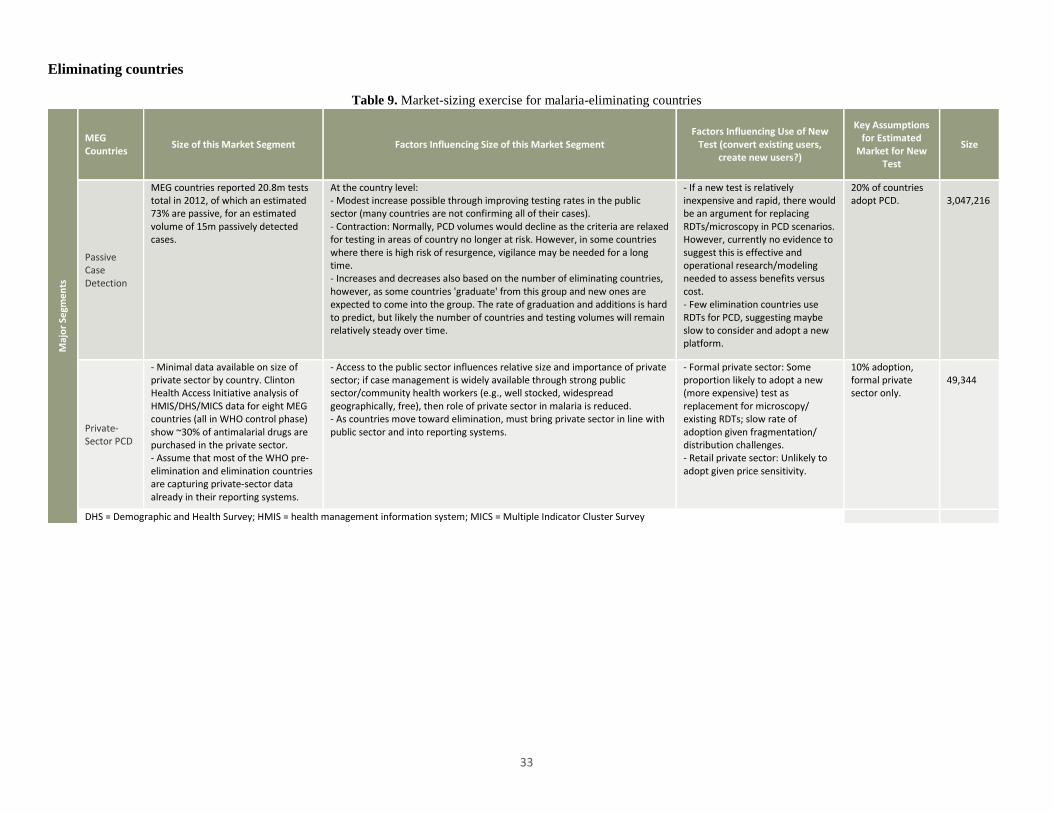
Eliminating countries
Table 9. Market-sizing exercise for malaria-eliminating countries
Maj
or S
egm
ents
MEG Countries Size of this Market Segment Factors Influencing Size of this Market Segment
Factors Influencing Use of New Test (convert existing users,
create new users?)
Key Assumptions for Estimated
Market for New Test
Size
Passive Case Detection
MEG countries reported 20.8m tests total in 2012, of which an estimated 73% are passive, for an estimated volume of 15m passively detected cases.
At the country level: - Modest increase possible through improving testing rates in the public sector (many countries are not confirming all of their cases). - Contraction: Normally, PCD volumes would decline as the criteria are relaxed for testing in areas of country no longer at risk. However, in some countries where there is high risk of resurgence, vigilance may be needed for a long time. - Increases and decreases also based on the number of eliminating countries, however, as some countries 'graduate' from this group and new ones are expected to come into the group. The rate of graduation and additions is hard to predict, but likely the number of countries and testing volumes will remain relatively steady over time.
- If a new test is relatively inexpensive and rapid, there would be an argument for replacing RDTs/microscopy in PCD scenarios. However, currently no evidence to suggest this is effective and operational research/modeling needed to assess benefits versus cost. - Few elimination countries use RDTs for PCD, suggesting maybe slow to consider and adopt a new platform.
20% of countries adopt PCD.
3,047,216
Private-Sector PCD
- Minimal data available on size of private sector by country. Clinton Health Access Initiative analysis of HMIS/DHS/MICS data for eight MEG countries (all in WHO control phase) show ~30% of antimalarial drugs are purchased in the private sector. - Assume that most of the WHO pre-elimination and elimination countries are capturing private-sector data already in their reporting systems.
- Access to the public sector influences relative size and importance of private sector; if case management is widely available through strong public sector/community health workers (e.g., well stocked, widespread geographically, free), then role of private sector in malaria is reduced. - As countries move toward elimination, must bring private sector in line with public sector and into reporting systems.
- Formal private sector: Some proportion likely to adopt a new (more expensive) test as replacement for microscopy/ existing RDTs; slow rate of adoption given fragmentation/ distribution challenges. - Retail private sector: Unlikely to adopt given price sensitivity.
10% adoption, formal private sector only.
49,344
DHS = Demographic and Health Survey; HMIS = health management information system; MICS = Multiple Indicator Cluster Survey
33

Maj
or
Segm
ents
MEG Countries Size of this Market Segment Factors Influencing Size of this Market Segment
Factors Influencing Use of New Test (convert existing users,
create new users?)
Key Assumptions for Estimated
Market for New Test
Size
Active Infection Detection
- In 2012, MEG countries reported 20.8m tests, of which 27% were active, for an estimated 5.6m tests used for active ID purposes. - No data available on the breakdown of testing by active use scenario; for example, the volumes for reactive versus proactive. Qualitative data suggest that reactive ID is the most common form of active ID. Proactive includes MTAT, FTAT, border screening, and time-location screening. Currently, qualitative analysis suggests that these activities are performed in several MEG countries; however, no evidence suggests that they are undertaken at large scale. MTAT is considered separately below.
Factors influencing size of reactive activities: - Number of countries with a policy for reactive ID, and whether this policy covers the entire country or specific areas. - Number of positive cases detected through PCD, as these are the index cases. - Policy regarding which positive cases are eligible for reactive ID (e.g., only cases thought to have originated in country versus all cases). - Criteria for who is tested around the index case (e.g., only febrile individuals versus all individuals, all individuals within the index case household, neighbors within a defined radius). - Difference between policy and implementation: coverage rates, ability of health workers to return to follow up missing individuals, other implementation constraints/capacity. Proactive ID can be undertaken in response to outbreaks or implemented routinely in high-risk populations/geographies. The latter is more common in countries that are further along in elimination. The scale varies widely, from a village (hundreds) to tens of thousands. Proactive ID methods may be used more frequently when programs approach elimination, to maintain a high annual blood examination rate and to attack a few remaining foci, and if the PCD system is not considered to be sufficiently strong in particular locations/ populations. In general, although commonly used, there is a lack of evidence on the effectiveness of active ID activities. Given the resources required to undertake active ID, there is operational research underway to identify the most cost-effective strategies. Therefore, although more countries might adopt this policy or might expand coverage to additional regions of the country, improved targeting might limit the number of tests needed overall.
- Active ID activities represent the most compelling need for a new malaria diagnostic test. Assuming robust validation and demonstration studies, would expect many countries to consider a new test. - Relatively quick adoption likely in places that use RDTs for reactive ID; countries relying on microscopy may be slower to consider a new platform. - Overall, would expect a new test to make active ID more effective and contribute to expanding the number of active ID programs; however, improved targeting may mean that the overall volumes of tests needed might not increase commensurately. In addition, substantial budgets and capacity for these activities (human resources, transport) would continue to constrain magnitude of activities.
- 10% increase in active ID volumes attributed to availability of new test. - 75% of countries adopt a new rapid ID test.
4,339,152
Mass Screening and Treatment
- No data available on current use. - Qualitative research suggests very minimal use by MEG countries; currently when used, it is mostly in connection with operational research.
Size of market for MTAT in elimination settings depends on: - Number of countries implementing MTAT. - Target population and coverage targets. - Frequency of program (once/year), number of years. - Policy (screen only febrile, or screen everyone). - Actual coverage achieved (timing/when performed, ability to return to follow up, cooperation of population).
The effectiveness of MTAT is an area of ongoing research. If it were found to be effective, MTAT is a compelling need for a new test. If a new test became available, it would likely be adopted by most programs implementing MTAT, and it would expand this market.
Two countries adopt MTAT with new test.
76,500
Surveys
- No data available on the size/frequency of surveys. - Nationally representative surveys are done infrequently in elimination countries. - Smaller-scale surveys aimed at identifying foci of infections are more common.
- Surveys are done to complement reporting by PCD systems. If PCD system weak, may need to conduct surveys more frequently. - Nationally representative prevalence surveys are less useful as prevalence declines and are generally not performed. Smaller-scale surveys with molecular and serology tests are more common to identify foci.
A new point-of-care test might be used, but it would likely replace existing tests (microscopy and RDT), rather than be used to conduct more surveys.
- A handful of countries conduct national and small surveys. - 50% adopt new test.
14,000
34

Maj
or
Segm
ents
MEG Countries Size of this Market Segment Factors Influencing Size of this Market Segment
Factors Influencing Use of New Test (convert existing users,
create new users?)
Key Assumptions for Estimated
Market for New Test
Size
Laboratory: QA/QC
- No data available on the size of QA/QC test volumes. - 10% of negatives and all positives should be reconfirmed in some way. For microscopy, there are existing methods; for RDTs, the confirmation strategies are less defined and/or are not practical to implement at scale (e.g., compared to PCR). - Most eliminating countries have established microscopy cross-checking systems in place; less QA/QC for RDTs.
- The size of the QA/QC market is driven by the overall volume of tests performed in a country and by the effectiveness of implementation of QA/QC activities. - As countries strengthen their QA/QC systems generally, this market will expand.
A new test is unlikely to be used widely for QA/QC purposes.
None. -
35

Other endemic countries (non-Malaria Elimination Group [MEG], control phase)
Table 10. Market-sizing exercise for other endemic countries
Maj
or S
egm
ents
Other Endemic Countries (non-MEG, control phase)
Size of this Market Segment Factors Influencing Size of this Market Segment Factors Influencing Use of New Test (convert existing users, create new
users?)
Key Assumptions for Estimated
Market for New Test
Size
Passive Case Detection (Public)
- Reliable data not available (volumes reported to WHO for control countries are not reliable). - Estimated market: ~370m tests/year (200m RDTs + 188m slides - 21m for MEG countries).
- Rapidly growing market, as control countries aim to scale up testing and to confirm all cases of malaria. Growth driven largely by RDTs, some microscopy increases.
- Currently, no evidence to support use of a more sensitive test for PCD; RDT and microscopy are considered sufficient for detecting clinical cases of malaria. - Countries are very price sensitive. - Countries rely on external donor funding; donors look to WHO for normative guidance; WHO unlikely to recommend more expensive test for PCD without evidence.
0% of countries adopt PCD.
-
Private-Sector Case Detection
- Currently, 10% of global RDT market is private; no data on size of private-sector microscopy market. - Within the private sector, there are two channels: formal (private hospitals, clinics) and retail. Formal is most of the market today; retail is minimal. - In some countries, significant proportion of people seek care for fever in the retail private sector; however, testing in this sector is minimal.
- Access to the public sector influences relative importance and size of private sector in malaria care. - Efforts underway to develop this market, in particular retail channels in countries where many people access private sector.
- Minimal adoption of new test by the formal private sector (e.g., clinics targeting travelers and the highest-income populations). - Retail private sector is very price sensitive and would not use a new test.
Minimal. -
Active Infection Detection
- Because reporting by control countries is not very reliable, few data available on current market size of active ID in control countries. - Estimated market size: 2.4m tests/year; Brazil represents 1.5m. Activities in other countries much smaller scale (100s or 10s of thousands); many countries very small scale (<10k). - Common in the Americas and among some Asian countries; minimal in Africa. MTAT considered separately below.
- Given progress in decreasing malaria burdens, there are a handful of countries that might begin active ID activities, as better investments in strengthening surveillance systems allow these countries to identify areas of very low transmission where active ID might be a reasonable next step in further reducing transmission. Initially, scale is likely to be small. - Outside of operational research, pressure on budgets and staff will likely result in limited testing volumes, especially in the lower-income control countries that rely on external donor funding.
- As with elimination countries, active ID is a compelling need for a new test. - A new test would replace existing RDTs and microscopy. However, control countries may be more price sensitive than elimination countries. - Availability of a new test is not likely to contribute substantially to the creation of new users.
75% of countries adopt (assumes Brazil at 1.5m tests/ year + ~11 more countries) and 5% increase in active ID activities.
1,864,406
36
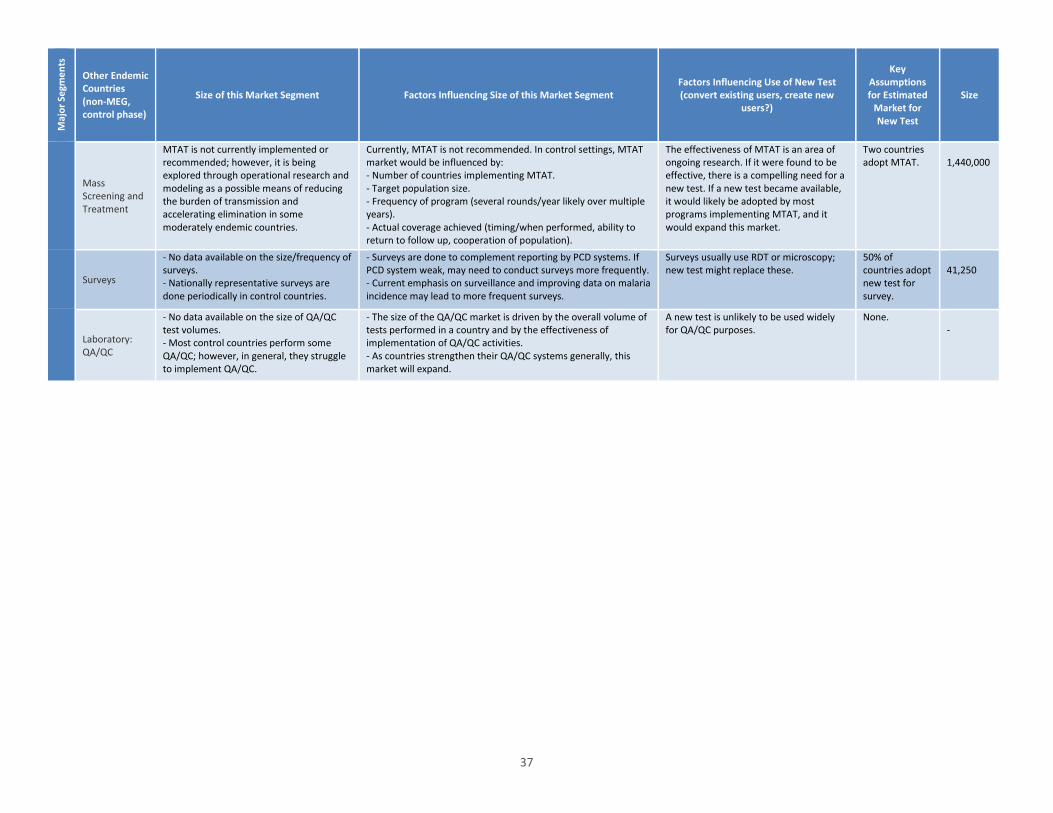
Maj
or S
egm
ents
Other Endemic Countries (non-MEG, control phase)
Size of this Market Segment Factors Influencing Size of this Market Segment Factors Influencing Use of New Test (convert existing users, create new
users?)
Key Assumptions for Estimated
Market for New Test
Size
Mass Screening and Treatment
MTAT is not currently implemented or recommended; however, it is being explored through operational research and modeling as a possible means of reducing the burden of transmission and accelerating elimination in some moderately endemic countries.
Currently, MTAT is not recommended. In control settings, MTAT market would be influenced by: - Number of countries implementing MTAT. - Target population size. - Frequency of program (several rounds/year likely over multiple years). - Actual coverage achieved (timing/when performed, ability to return to follow up, cooperation of population).
The effectiveness of MTAT is an area of ongoing research. If it were found to be effective, there is a compelling need for a new test. If a new test became available, it would likely be adopted by most programs implementing MTAT, and it would expand this market.
Two countries adopt MTAT.
1,440,000
Surveys
- No data available on the size/frequency of surveys. - Nationally representative surveys are done periodically in control countries.
- Surveys are done to complement reporting by PCD systems. If PCD system weak, may need to conduct surveys more frequently. - Current emphasis on surveillance and improving data on malaria incidence may lead to more frequent surveys.
Surveys usually use RDT or microscopy; new test might replace these.
50% of countries adopt new test for survey.
41,250
Laboratory: QA/QC
- No data available on the size of QA/QC test volumes. - Most control countries perform some QA/QC; however, in general, they struggle to implement QA/QC.
- The size of the QA/QC market is driven by the overall volume of tests performed in a country and by the effectiveness of implementation of QA/QC activities. - As countries strengthen their QA/QC systems generally, this market will expand.
A new test is unlikely to be used widely for QA/QC purposes.
None. -
37
Other potential markets
Given the relatively small and uncertain size of the market for a new rapid IDT in malaria-endemic countries, it would be worthwhile to explore other potential markets, including the applicability of a new rapid IDT to screen pregnant women in endemic countries and for screening in malaria-free countries/populations. These potential markets were not analyzed in depth; however, some preliminary thoughts are summarized below.
Non-endemic country markets
Non-endemic country markets represent a potential opportunity for a new rapid IDT. These markets can be segmented into two areas: screening of travelers in malaria-free countries, and proactive testing operations in countries that have eliminated malaria. Travelers market. International travel is increasing rapidly, including trips to developing countries. An estimated 80 to 90 million travelers visit areas where malaria is endemic annually.26 More than half of international travelers to developing countries become ill during their trip, and approximately 8 percent seek medical care for travel-associated illness either during or after travel.27 Currently, due to waning microscopy skills, it is not uncommon to treat suspected malaria empirically or to use RDTs as a preliminary screening tool, followed by confirmatory testing using microscopy and PCR. Currently, one malaria RDT, BinaxNOW® by Alere, has been cleared by the US Food and Drug Administration (FDA) and is marketed primarily to the returning-traveler market and to the military. This test performed reasonably in the WHO product evaluation, but is not among the top-performing tests, despite FDA approval. As such, there may be a market for a new rapid diagnostic with improved performance and stringent regulatory approval. Proactive testing in countries that have eliminated malaria. In many malaria-free countries, active ID activities cease once malaria has been eliminated. However, the high intrinsic transmission potential of many countries that have recently eliminated malaria requires strategies to address the continuing threat of importation of malaria (Table 11). For example, both Mauritius and Singapore are malaria free but maintain active screening operations. Ten years after its last indigenous case of malaria, Mauritius continued to perform 36,000 slides in connection with its passenger screening program.22 In light of waning microscopy skills and the simplicity offered by a new test, these countries might adopt a new rapid IDT for their proactive testing programs.
38
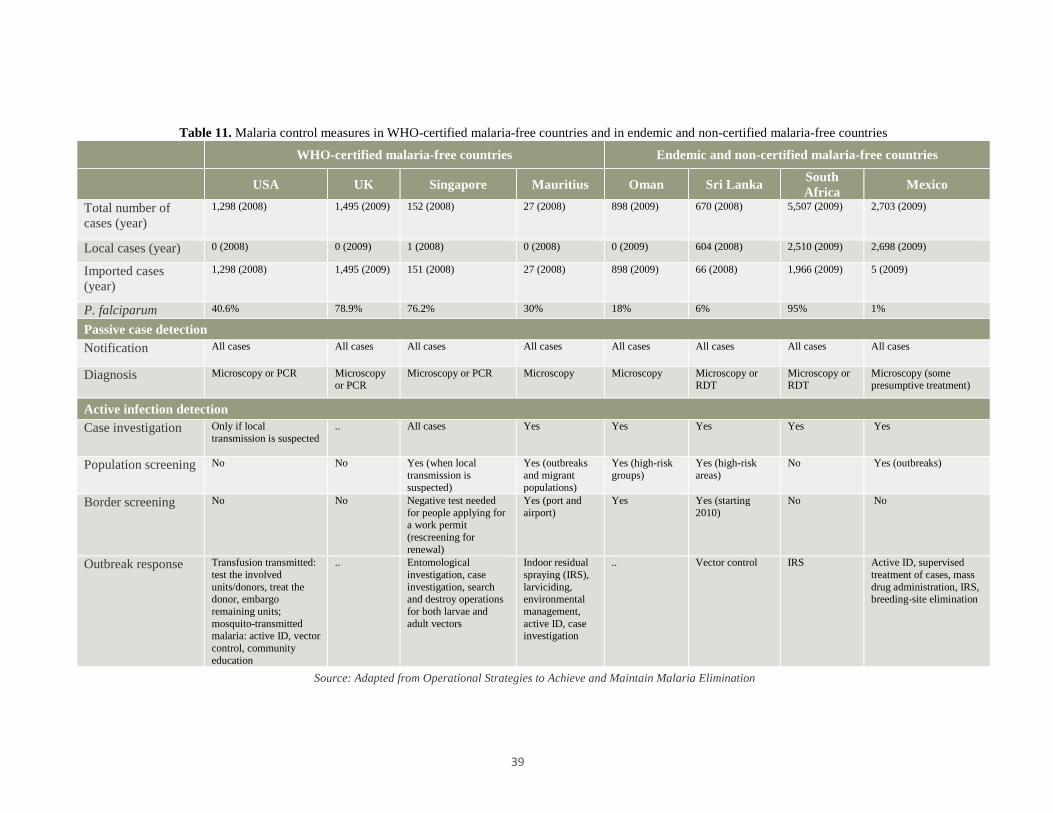
Table 11. Malaria control measures in WHO-certified malaria-free countries and in endemic and non-certified malaria-free countries
WHO-certified malaria-free countries Endemic and non-certified malaria-free countries
USA UK Singapore Mauritius Oman Sri Lanka South Africa Mexico
Total number of cases (year)
1,298 (2008) 1,495 (2009) 152 (2008) 27 (2008) 898 (2009) 670 (2008) 5,507 (2009) 2,703 (2009)
Local cases (year) 0 (2008) 0 (2009) 1 (2008) 0 (2008) 0 (2009) 604 (2008) 2,510 (2009) 2,698 (2009)
Imported cases (year)
1,298 (2008) 1,495 (2009) 151 (2008) 27 (2008) 898 (2009) 66 (2008) 1,966 (2009) 5 (2009)
P. falciparum 40.6% 78.9% 76.2% 30% 18% 6% 95% 1%
Passive case detection Notification All cases All cases All cases All cases All cases All cases All cases All cases
Diagnosis Microscopy or PCR Microscopy or PCR
Microscopy or PCR Microscopy Microscopy Microscopy or RDT
Microscopy or RDT
Microscopy (some presumptive treatment)
Active infection detection Case investigation Only if local
transmission is suspected .. All cases Yes Yes Yes Yes Yes
Population screening No No Yes (when local transmission is suspected)
Yes (outbreaks and migrant populations)
Yes (high-risk groups)
Yes (high-risk areas)
No Yes (outbreaks)
Border screening No No Negative test needed for people applying for a work permit (rescreening for renewal)
Yes (port and airport)
Yes Yes (starting 2010)
No No
Outbreak response Transfusion transmitted: test the involved units/donors, treat the donor, embargo remaining units; mosquito-transmitted malaria: active ID, vector control, community education
.. Entomological investigation, case investigation, search and destroy operations for both larvae and adult vectors
Indoor residual spraying (IRS), larviciding, environmental management, active ID, case investigation
.. Vector control IRS Active ID, supervised treatment of cases, mass drug administration, IRS, breeding-site elimination
Source: Adapted from Operational Strategies to Achieve and Maintain Malaria Elimination
39

Promoting investment and development of a healthy market
Approach
Figure 14. Product development pathway
As with any product development initiative, there are many potential risks and obstacles along the development pathway through to market access that may impede investment in and development of a healthy market for a new product. In this section, the potential business- and market-related challenges for a new malaria diagnostic are considered and potential interventions suggested. The approach involved considering risks and obstacles at each stage of the development pathway that might impede investment in this market or result in slower timelines, unaffordable prices, poor acceptance, and limited scale-up of the new test once available (Figure 14). In general, the current RDT market dynamics, combined with the small market potential for a new rapid IDT, limit incentives for commercial development of a new malaria diagnostic to support elimination. The market size and dispersed, uncertain nature of demand would typically result in a high-price, low-volume business model, and may also limit incentives for manufacturers to promote and produce the test. The interventions suggested below aim to address these shortcomings, and take into consideration functions that are critical to investment, product development, and market development, but that might best be undertaken (all or in part) by the public/philanthropic sector as opposed to private diagnostics companies. The risks and obstacles identified are not all of equal significance; therefore, the extent and type of support recommended varies. The interventions span the spectrum, from direct investment in companies to information-gathering interventions. While some require considerable resources, others are “low-hanging fruit” in nature. Given the extent of knowledge regarding this market and the assumptions made about the TPP (outlined in the previous section), this exercise should be considered to be a “first cut”; many of the suggested interventions warrant further exploration and vetting. This exercise should be revisited as the TPP is refined and as the development process evolves, as it is likely that new risks and obstacles will emerge, while others become less important.
40
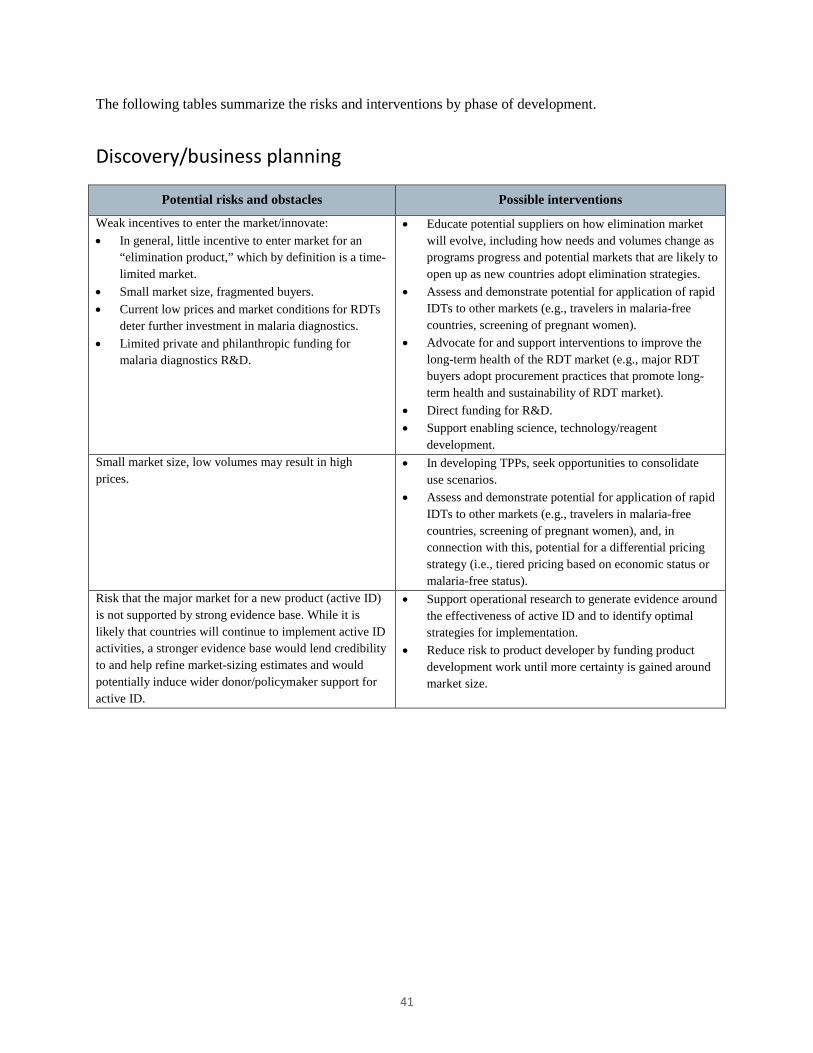
The following tables summarize the risks and interventions by phase of development.
Discovery/business planning
Potential risks and obstacles Possible interventions
Weak incentives to enter the market/innovate: • In general, little incentive to enter market for an
“elimination product,” which by definition is a time-limited market.
• Small market size, fragmented buyers. • Current low prices and market conditions for RDTs
deter further investment in malaria diagnostics. • Limited private and philanthropic funding for
malaria diagnostics R&D.
• Educate potential suppliers on how elimination market will evolve, including how needs and volumes change as programs progress and potential markets that are likely to open up as new countries adopt elimination strategies.
• Assess and demonstrate potential for application of rapid IDTs to other markets (e.g., travelers in malaria-free countries, screening of pregnant women).
• Advocate for and support interventions to improve the long-term health of the RDT market (e.g., major RDT buyers adopt procurement practices that promote long-term health and sustainability of RDT market).
• Direct funding for R&D. • Support enabling science, technology/reagent
development. Small market size, low volumes may result in high prices.
• In developing TPPs, seek opportunities to consolidate use scenarios.
• Assess and demonstrate potential for application of rapid IDTs to other markets (e.g., travelers in malaria-free countries, screening of pregnant women), and, in connection with this, potential for a differential pricing strategy (i.e., tiered pricing based on economic status or malaria-free status).
Risk that the major market for a new product (active ID) is not supported by strong evidence base. While it is likely that countries will continue to implement active ID activities, a stronger evidence base would lend credibility to and help refine market-sizing estimates and would potentially induce wider donor/policymaker support for active ID.
• Support operational research to generate evidence around the effectiveness of active ID and to identify optimal strategies for implementation.
• Reduce risk to product developer by funding product development work until more certainty is gained around market size.
41
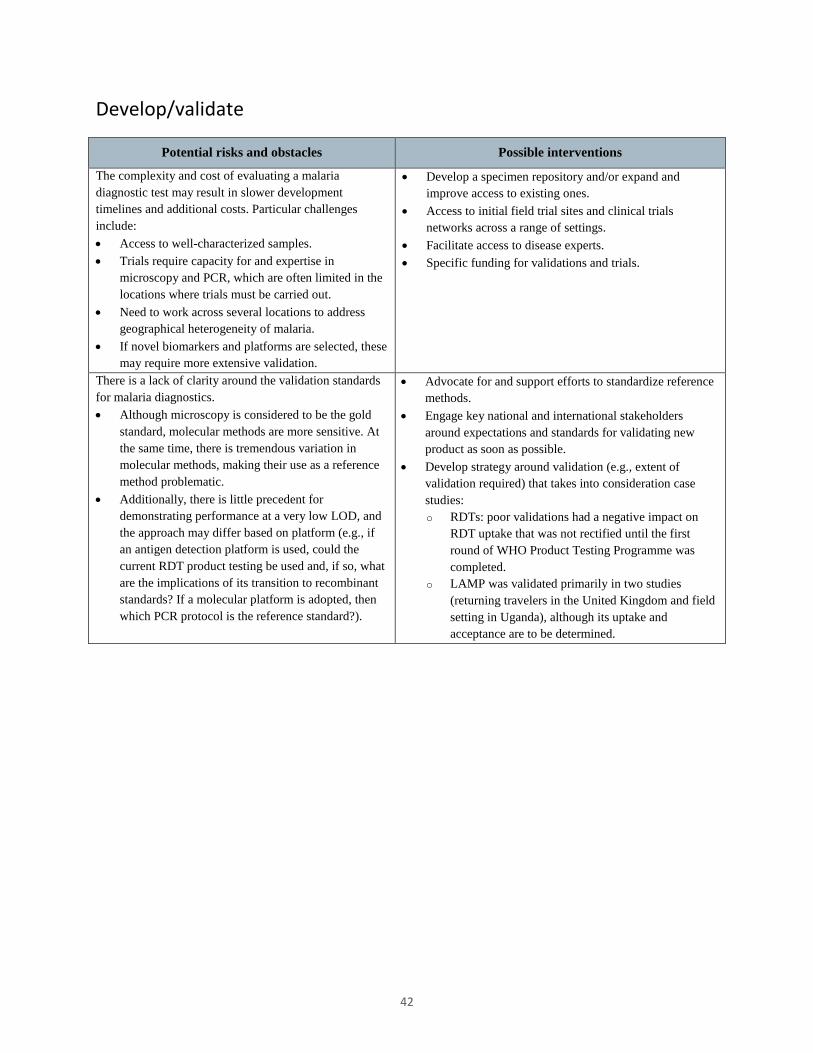
Develop/validate
Potential risks and obstacles Possible interventions
The complexity and cost of evaluating a malaria diagnostic test may result in slower development timelines and additional costs. Particular challenges include: • Access to well-characterized samples. • Trials require capacity for and expertise in
microscopy and PCR, which are often limited in the locations where trials must be carried out.
• Need to work across several locations to address geographical heterogeneity of malaria.
• If novel biomarkers and platforms are selected, these may require more extensive validation.
• Develop a specimen repository and/or expand and improve access to existing ones.
• Access to initial field trial sites and clinical trials networks across a range of settings.
• Facilitate access to disease experts. • Specific funding for validations and trials.
There is a lack of clarity around the validation standards for malaria diagnostics. • Although microscopy is considered to be the gold
standard, molecular methods are more sensitive. At the same time, there is tremendous variation in molecular methods, making their use as a reference method problematic.
• Additionally, there is little precedent for demonstrating performance at a very low LOD, and the approach may differ based on platform (e.g., if an antigen detection platform is used, could the current RDT product testing be used and, if so, what are the implications of its transition to recombinant standards? If a molecular platform is adopted, then which PCR protocol is the reference standard?).
• Advocate for and support efforts to standardize reference methods.
• Engage key national and international stakeholders around expectations and standards for validating new product as soon as possible.
• Develop strategy around validation (e.g., extent of validation required) that takes into consideration case studies: o RDTs: poor validations had a negative impact on
RDT uptake that was not rectified until the first round of WHO Product Testing Programme was completed.
o LAMP was validated primarily in two studies (returning travelers in the United Kingdom and field setting in Uganda), although its uptake and acceptance are to be determined.
42

Regulatory/policy
Potential risks and obstacles Possible interventions
The regulatory situation for malaria diagnostics varies from country to country. In many malaria-endemic countries, regulations around diagnostics are relatively limited, but local validations and registration are increasingly required. Eliminating countries, however, are likely to have more formal processes and more stringent requirements (e.g., China). Depending on the major markets, meeting regulatory requirements for a new diagnostic could be time consuming and expensive, especially in comparison to the anticipated return on investment. Uncertainty around regulatory requirements also contributes to risk associated with investing in this market.
Reduce risk and support development of a regulatory strategy/ build-up of appropriate dossier by: • Providing information on malaria diagnostics regulations
and requirements in the major markets. • Exploring cost/benefit of approvals in developed-country
markets. Examples include: FDA clearance, CE marking (for malaria, CE marking is currently an administrative process; in coming years, new risk classification systems will increase requirements for malaria), and WHO PQ (currently not an effective program).
Normative guidance from the WHO Global Malaria Programme influences the market for new diagnostics to support elimination. The WHO’s role includes: • Influencing the products that major donors (Global
Fund, PMI) support. Although malaria-eliminating countries rely heavily on domestic budgets to fund elimination,21 16 of 34 malaria-eliminating countries are likely to require external assistance.xxiii,3
• The WHO certifies elimination based on review of epidemiological data, as well as a review of the systems in place to generate these data. The diagnostic strategies, technologies used, and QA systems are all considered during this assessment.
Current WHO guidelines are not very prescriptive about diagnostics strategies; however, they do emphasize the importance of microscopy. The WHO plans to review and update its guidance on elimination in 2014. In connection with this, there is some risk that WHO guidance is not supportive of active ID activities. In addition, if the emphasis on microscopy remains, the development of a market for new tests could be limited. On the other hand, WHO endorsement of active ID strategies and of a new product could drive market expansion and support uptake.
• Monitor the development of new WHO guidance and its potential impact on the market for a new diagnostic test.
• Engage with the WHO and key stakeholders to understand what evidence might be needed to change current guidance.
• Support research to address evidence gaps that would inform policy.
• Conduct market research to understand the extent to which the lack of RDT use in elimination countries is related to WHO guidance.
xxiii The Malaria Elimination Group estimated “the annual amounts involved in eliminating malaria to be on the order of $.25 to $25 per person in the population at risk.... For middle income and upper income countries, domestic public financing can suffice. For the low income and lower middle income countries, external assistance will be required.” Based on this, 16 of the 34 eliminating countries are currently classified as low income or lower middle income and will require assistance.
43
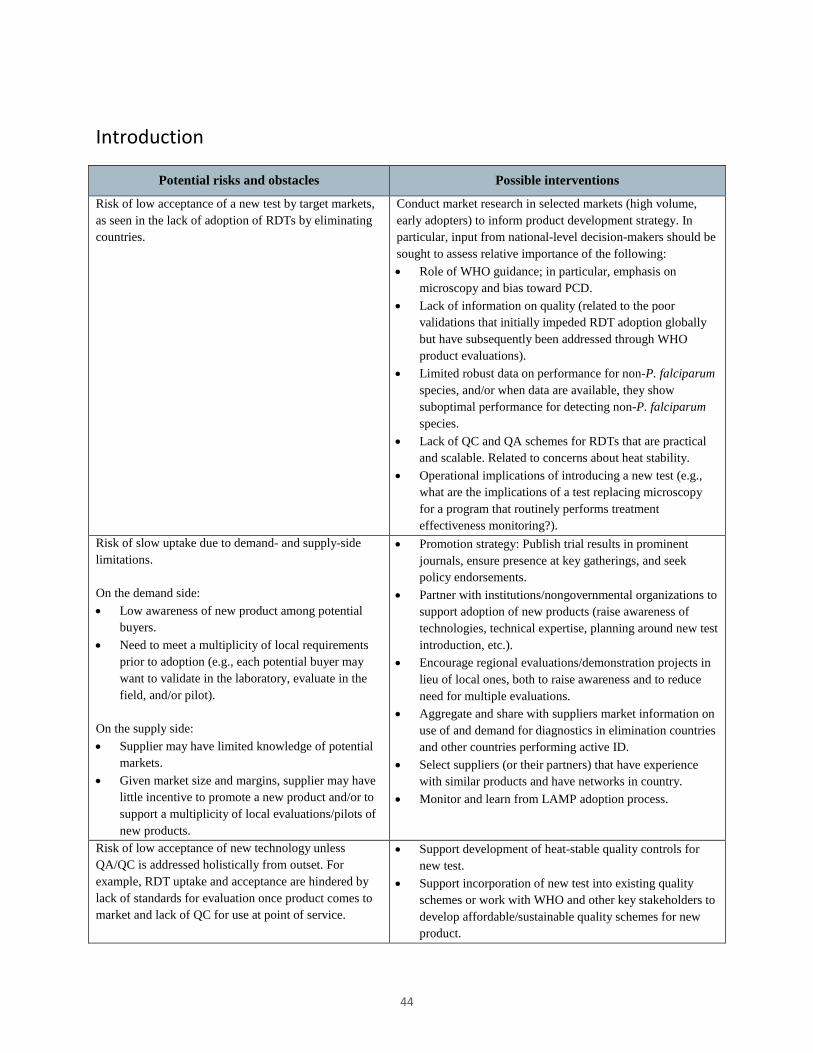
Introduction
Potential risks and obstacles Possible interventions
Risk of low acceptance of a new test by target markets, as seen in the lack of adoption of RDTs by eliminating countries.
Conduct market research in selected markets (high volume, early adopters) to inform product development strategy. In particular, input from national-level decision-makers should be sought to assess relative importance of the following: • Role of WHO guidance; in particular, emphasis on
microscopy and bias toward PCD. • Lack of information on quality (related to the poor
validations that initially impeded RDT adoption globally but have subsequently been addressed through WHO product evaluations).
• Limited robust data on performance for non-P. falciparum species, and/or when data are available, they show suboptimal performance for detecting non-P. falciparum species.
• Lack of QC and QA schemes for RDTs that are practical and scalable. Related to concerns about heat stability.
• Operational implications of introducing a new test (e.g., what are the implications of a test replacing microscopy for a program that routinely performs treatment effectiveness monitoring?).
Risk of slow uptake due to demand- and supply-side limitations. On the demand side: • Low awareness of new product among potential
buyers. • Need to meet a multiplicity of local requirements
prior to adoption (e.g., each potential buyer may want to validate in the laboratory, evaluate in the field, and/or pilot).
On the supply side: • Supplier may have limited knowledge of potential
markets. • Given market size and margins, supplier may have
little incentive to promote a new product and/or to support a multiplicity of local evaluations/pilots of new products.
• Promotion strategy: Publish trial results in prominent journals, ensure presence at key gatherings, and seek policy endorsements.
• Partner with institutions/nongovernmental organizations to support adoption of new products (raise awareness of technologies, technical expertise, planning around new test introduction, etc.).
• Encourage regional evaluations/demonstration projects in lieu of local ones, both to raise awareness and to reduce need for multiple evaluations.
• Aggregate and share with suppliers market information on use of and demand for diagnostics in elimination countries and other countries performing active ID.
• Select suppliers (or their partners) that have experience with similar products and have networks in country.
• Monitor and learn from LAMP adoption process.
Risk of low acceptance of new technology unless QA/QC is addressed holistically from outset. For example, RDT uptake and acceptance are hindered by lack of standards for evaluation once product comes to market and lack of QC for use at point of service.
• Support development of heat-stable quality controls for new test.
• Support incorporation of new test into existing quality schemes or work with WHO and other key stakeholders to develop affordable/sustainable quality schemes for new product.
44
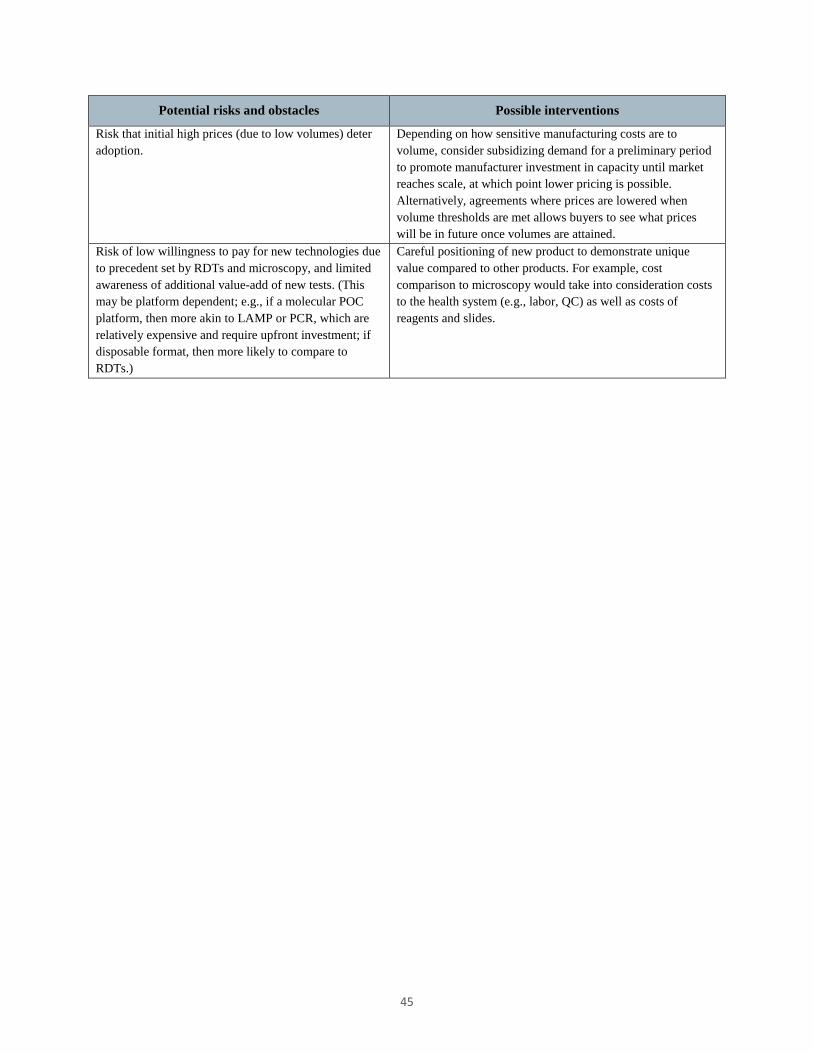
Potential risks and obstacles Possible interventions
Risk that initial high prices (due to low volumes) deter adoption.
Depending on how sensitive manufacturing costs are to volume, consider subsidizing demand for a preliminary period to promote manufacturer investment in capacity until market reaches scale, at which point lower pricing is possible. Alternatively, agreements where prices are lowered when volume thresholds are met allows buyers to see what prices will be in future once volumes are attained.
Risk of low willingness to pay for new technologies due to precedent set by RDTs and microscopy, and limited awareness of additional value-add of new tests. (This may be platform dependent; e.g., if a molecular POC platform, then more akin to LAMP or PCR, which are relatively expensive and require upfront investment; if disposable format, then more likely to compare to RDTs.)
Careful positioning of new product to demonstrate unique value compared to other products. For example, cost comparison to microscopy would take into consideration costs to the health system (e.g., labor, QC) as well as costs of reagents and slides.
45
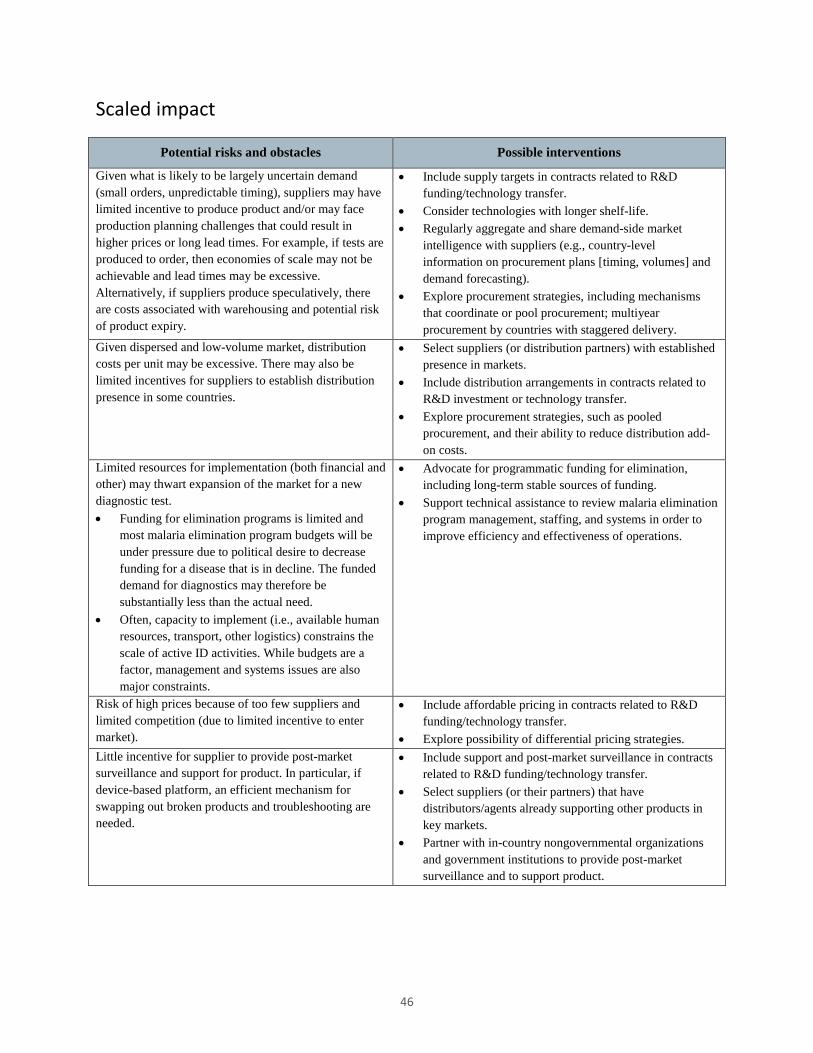
Scaled impact
Potential risks and obstacles Possible interventions
Given what is likely to be largely uncertain demand (small orders, unpredictable timing), suppliers may have limited incentive to produce product and/or may face production planning challenges that could result in higher prices or long lead times. For example, if tests are produced to order, then economies of scale may not be achievable and lead times may be excessive. Alternatively, if suppliers produce speculatively, there are costs associated with warehousing and potential risk of product expiry.
• Include supply targets in contracts related to R&D funding/technology transfer.
• Consider technologies with longer shelf-life. • Regularly aggregate and share demand-side market
intelligence with suppliers (e.g., country-level information on procurement plans [timing, volumes] and demand forecasting).
• Explore procurement strategies, including mechanisms that coordinate or pool procurement; multiyear procurement by countries with staggered delivery.
Given dispersed and low-volume market, distribution costs per unit may be excessive. There may also be limited incentives for suppliers to establish distribution presence in some countries.
• Select suppliers (or distribution partners) with established presence in markets.
• Include distribution arrangements in contracts related to R&D investment or technology transfer.
• Explore procurement strategies, such as pooled procurement, and their ability to reduce distribution add-on costs.
Limited resources for implementation (both financial and other) may thwart expansion of the market for a new diagnostic test. • Funding for elimination programs is limited and
most malaria elimination program budgets will be under pressure due to political desire to decrease funding for a disease that is in decline. The funded demand for diagnostics may therefore be substantially less than the actual need.
• Often, capacity to implement (i.e., available human resources, transport, other logistics) constrains the scale of active ID activities. While budgets are a factor, management and systems issues are also major constraints.
• Advocate for programmatic funding for elimination, including long-term stable sources of funding.
• Support technical assistance to review malaria elimination program management, staffing, and systems in order to improve efficiency and effectiveness of operations.
Risk of high prices because of too few suppliers and limited competition (due to limited incentive to enter market).
• Include affordable pricing in contracts related to R&D funding/technology transfer.
• Explore possibility of differential pricing strategies. Little incentive for supplier to provide post-market surveillance and support for product. In particular, if device-based platform, an efficient mechanism for swapping out broken products and troubleshooting are needed.
• Include support and post-market surveillance in contracts related to R&D funding/technology transfer.
• Select suppliers (or their partners) that have distributors/agents already supporting other products in key markets.
• Partner with in-country nongovernmental organizations and government institutions to provide post-market surveillance and to support product.
46
References
1 Page on Malaria-Eliminating Countries. University of California, San Francisco (UCSF) Global Health Group, Malaria Elimination Group website. Available at: http://www.malariaeliminationgroup.org/resources/elimination-countries. Accessed February 16, 2014. 2 World Health Organization (WHO). World Malaria Report 2013. Geneva: WHO; 2013. Available at: http://www.who.int/malaria/publications/world_malaria_report_2013/report/en/. 3 Feachem RGA, Phillips AA, Targett GA, eds. Shrinking the Malaria Map: A Prospectus on Malaria Elimination. San Francisco: UCSF Global Health Group, Global Health Sciences; April 2009. Available at: http://www.malariaeliminationgroup.org/publications/shrinking-malaria-map-prospectus-malaria-elimination. 4 Slutsker L, Kachur SP. It is time to rethink tactics in the fight against malaria. Malaria Journal. 2013;12:140. 5 Tieje K, Hawkins K, Clerk C, et al. The essential role of infection detection technologies for malaria elimination and eradication. Trends in Parasitology. In press. 6 Sturrock HJ, Hsiang MS, Cohen JM, et al. Targeting asymptomatic malaria infections: active surveillance in control and elimination. PLOS Medicine. 2013;10(6):e1001467. 7 Smith Gueye C, Sanders KC, Galappaththy GN, et al. Active case detection for malaria elimination: a survey among Asia Pacific countries. Malaria Journal. 2013;12:358. 8 Littrell M, Sow GD, Ngom A, et al. Case investigation and reactive case detection for malaria elimination in northern Senegal. Malaria Journal. 2013;12:331. 9 Bousema T, Griffin JT, Sauerwein RW, et al. Hitting hotspots: spatial targeting of malaria for control and elimination. PLOS Medicine. 2012;9(1):e1001165. 10 Sturrock HJ, Novotny JM, Kunene S, et al. Reactive case detection for malaria elimination: real-life experience from an ongoing program in Swaziland. PLOS ONE. 2013;8(5):e63830. 11 Gething PW, Battle KE, Bhatt S, et al. Declining malaria in Africa: improving the measurement of progress. Malaria Journal. 2014;13:39. 12 Mosha JF, Sturrock HJ, Greenhouse B, et al. Epidemiology of subpatent Plasmodium falciparum infection: implications for detection of hotspots with imperfect diagnostics. Malaria Journal. 2013;12:221. 13 Crowell V, Briët OJ, Hardy D, et al. Modelling the cost-effectiveness of mass screening and treatment for reducing Plasmodium falciparum malaria burden. Malaria Journal. 2013;12:4. 14 Tiono AB, Ouédraogo A, Ogutu B, et al. A controlled, parallel, cluster-randomized trial of community-wide screening and treatment of asymptomatic carriers of Plasmodium falciparum in Burkina Faso. Malaria Journal. 2013;12:79.
47
15 Okell LC, Griffin JT, Kleinschmidt I, et al. The potential contribution of mass treatment to the control of Plasmodium falciparum malaria. PLOS ONE. 2011;6(5):e20179. 16 Poirot E, Skarbinski J, Sinclair D, Kachur SP, Slutsker L, Hwang J. Mass drug administration for malaria. Cochrane Database of Systematic Reviews. 2013;12:CD008846. 17 WHO. Guidelines for the Treatment of Malaria, Second Edition. Geneva: WHO; 2010. Available at: http://whqlibdoc.who.int/publications/2010/9789241547925_eng.pdf?ua=1. 18 Roll Back Malaria (RBM) Partnership. Refined/Updated GMAP Objectives, Targets, Milestones and Priorities Beyond 2011. Geneva: RBM Partnership; 2011. Available at: http://www.rollbackmalaria.org/gmap/gmap2011update.pdf. 19 WHO. World Malaria Report 2012. Geneva: WHO; 2012. Available at: http://www.who.int/malaria/publications/world_malaria_report_2012/en/. 20 WHO Prequalification of Diagnostics Program website. Available at: http://www.who.int/diagnostics_laboratory/evaluations/en/. Accessed March 25, 2014. 21 Kumar K, Pigazzini A, Stenson B. Financing for Malaria Elimination. London: Cambridge Economic Policy Associates; 2013. Available at: http://globalhealthsciences.ucsf.edu/sites/default/files/content/ghg/mei-financing-malaria-elimination.pdf. 22 Ministry of Health and Quality of Life (Mauritius), WHO, and UCSF. Eliminating Malaria: Case Study 4. Preventing Reintroduction in Mauritius. Geneva: WHO; 2012. Available at: http://www.who.int/malaria/publications/atoz/9789241504461/en/. 23 Macauley C. Aggressive active case detection: a malaria control strategy based on the Brazilian model. Social Science & Medicine. 2005;60(3):563. 24 Moonen B, Cohen JM, Snow RW, et al. Operational strategies to achieve and maintain malaria elimination. The Lancet. 2010;376(9752):1592. 25 Ministry of Health (Republic of Turkey), WHO, and UCSF. Eliminating Malaria: Case Study 5. The Long Road to Malaria Elimination in Turkey. Geneva: WHO; 2013. Available at: http://www.who.int/malaria/publications/atoz/9789241506403/en/. 26 Schlagenhauf P, Petersen E. Malaria chemoprophylaxis: strategies for risk groups. Clinical Microbiology Reviews. 2008;21(3):466. 27 Leder K, Torresi J, Brownstein JS, et al. Travel-associated illness trends and clusters, 2000–2010. Emerging Infectious Diseases. 2013;19(7):1049.
48
Annex I: Passive case detection and active infection detection testing volumes by country
3/26/14 49
Note about data sources: PCD and ACD provided by WHO, as reported by National Programs to the WHO; API provided by UCSF based on World Malaria Reports
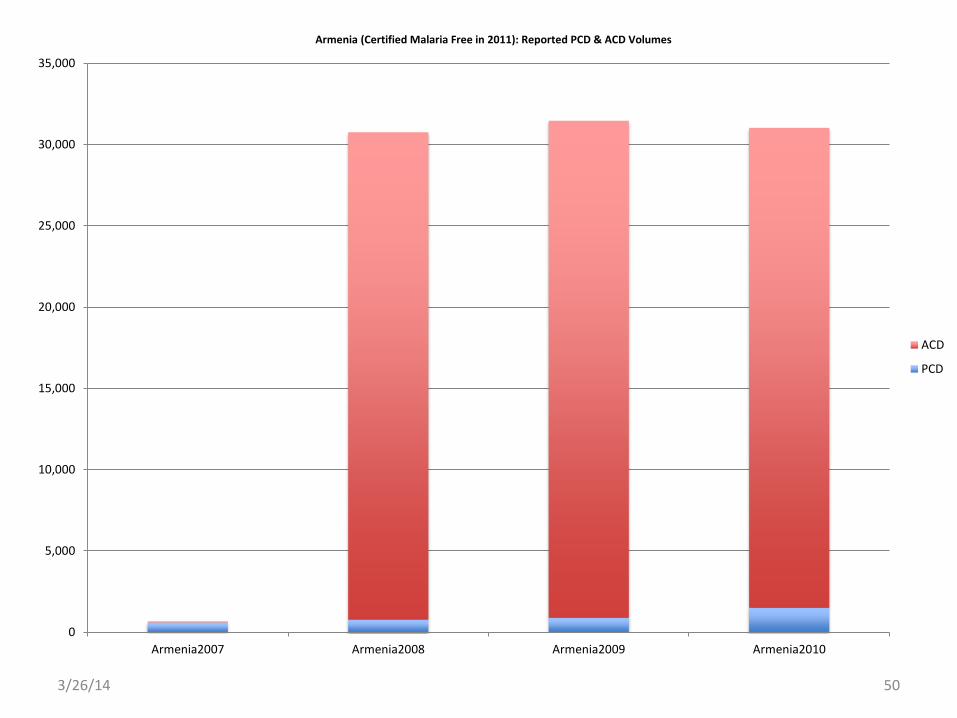
3/26/14 50
0
5,000
10,000
15,000
20,000
25,000
30,000
35,000
Armenia2007 Armenia2008 Armenia2009 Armenia2010
Armenia (Certified Malaria Free in 2011): Reported PCD & ACD Volumes
ACD
PCD
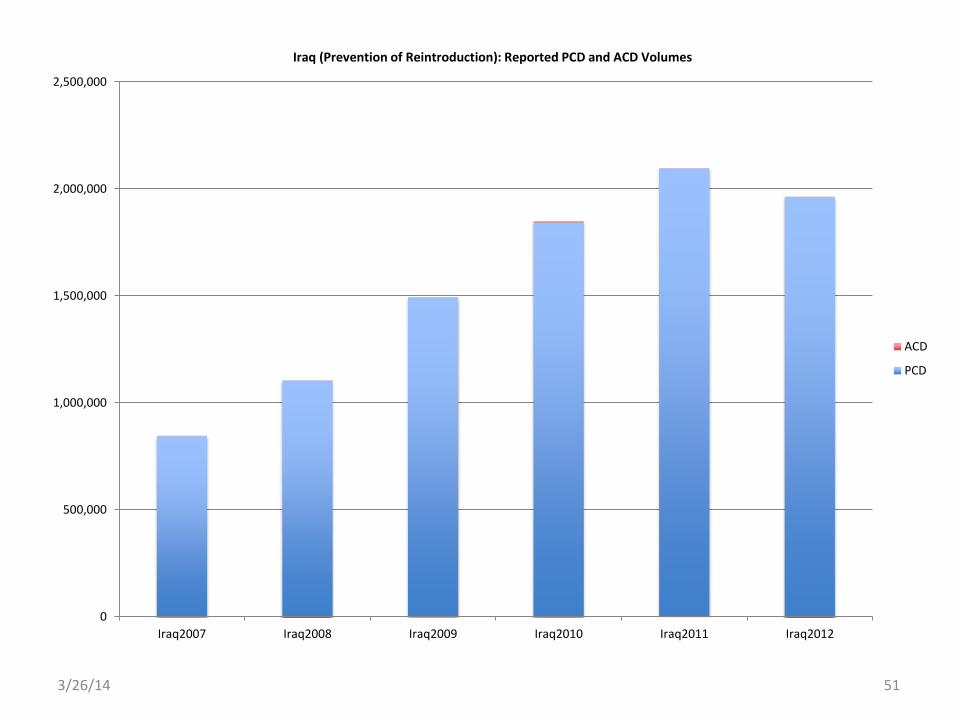
3/26/14 51
0
500,000
1,000,000
1,500,000
2,000,000
2,500,000
Iraq2007 Iraq2008 Iraq2009 Iraq2010 Iraq2011 Iraq2012
Iraq (Prevention of Reintroduction): Reported PCD and ACD Volumes
ACD
PCD
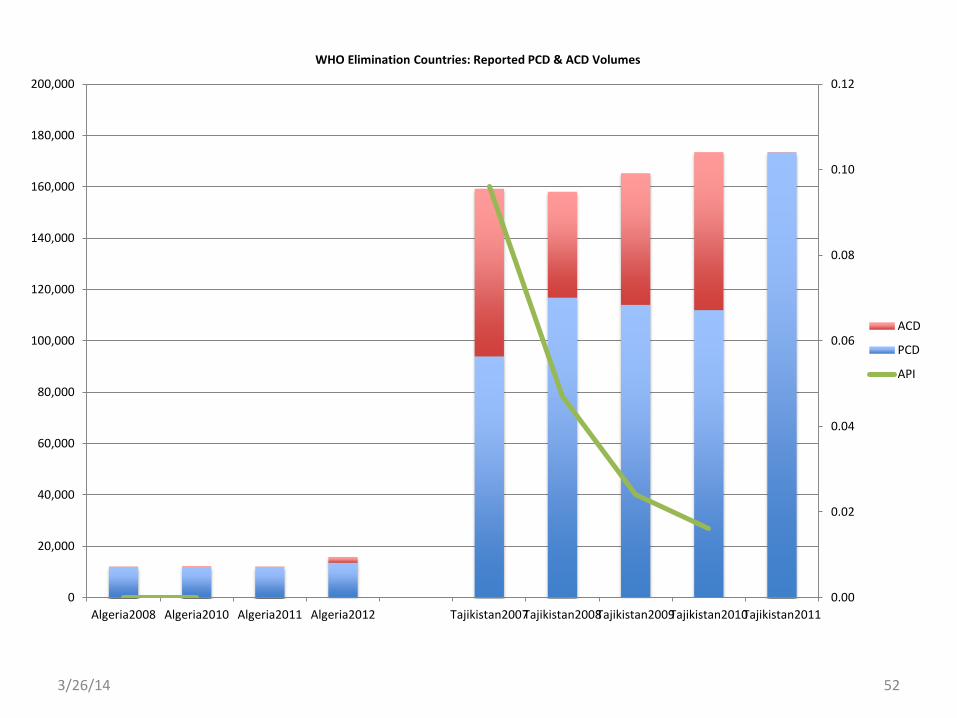
3/26/14 52
0.00
0.02
0.04
0.06
0.08
0.10
0.12
0
20,000
40,000
60,000
80,000
100,000
120,000
140,000
160,000
180,000
200,000
Algeria2008 Algeria2010 Algeria2011 Algeria2012 Tajikistan2007Tajikistan2008Tajikistan2009Tajikistan2010Tajikistan2011
WHO Elimination Countries: Reported PCD & ACD Volumes
ACD
PCD
API
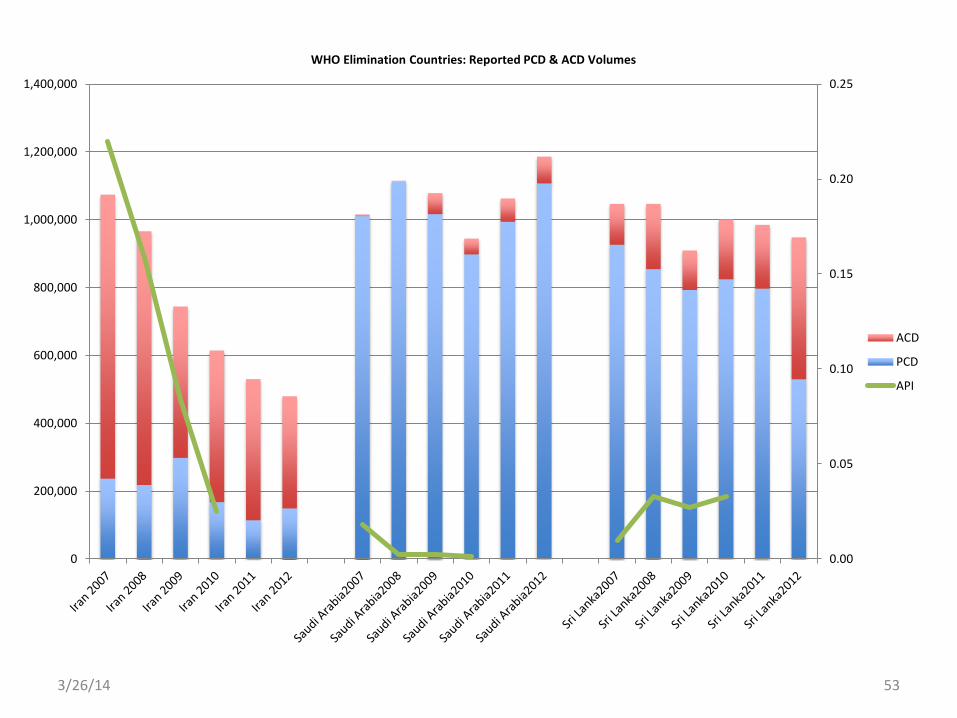
3/26/14 53
0.00
0.05
0.10
0.15
0.20
0.25
0
200,000
400,000
600,000
800,000
1,000,000
1,200,000
1,400,000
WHO Elimination Countries: Reported PCD & ACD Volumes
ACD
PCD
API
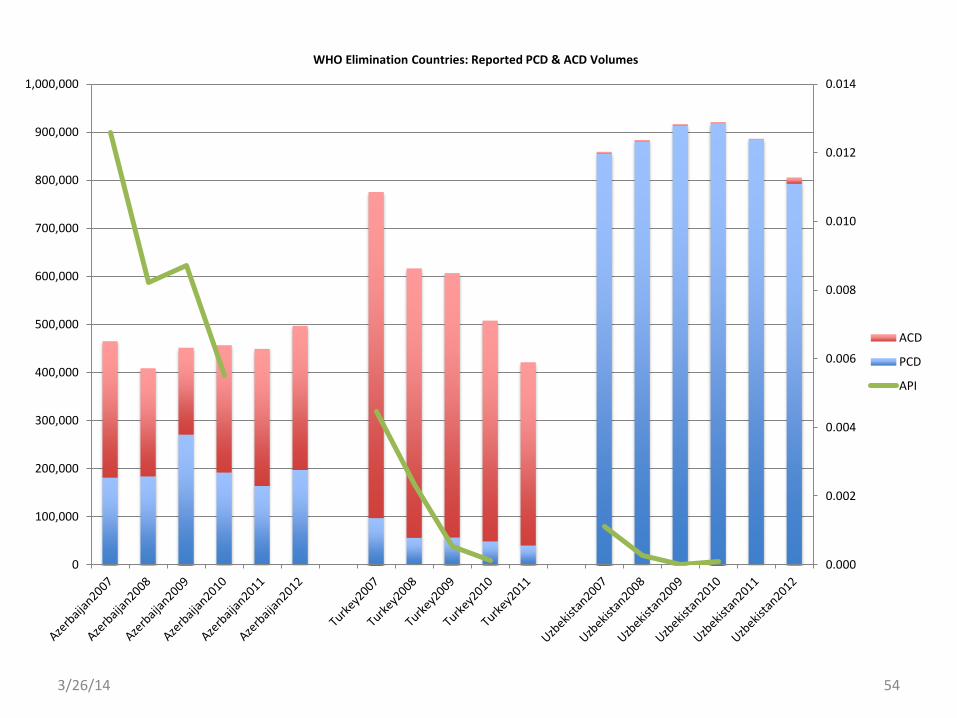
3/26/14 54
0.000
0.002
0.004
0.006
0.008
0.010
0.012
0.014
0
100,000
200,000
300,000
400,000
500,000
600,000
700,000
800,000
900,000
1,000,000
WHO Elimination Countries: Reported PCD & ACD Volumes
ACD
PCD
API
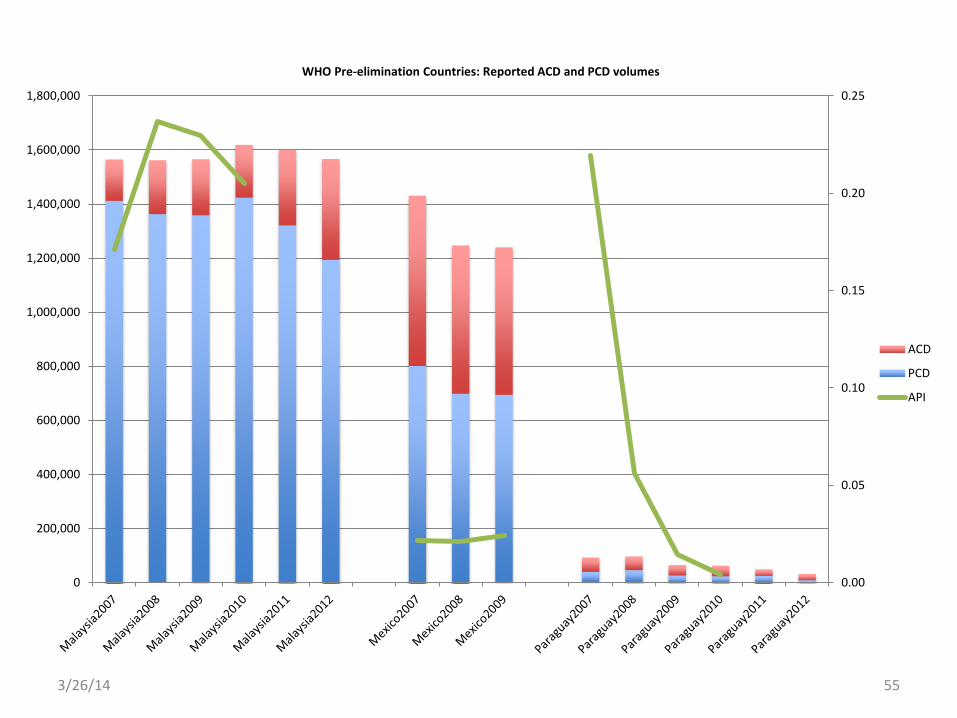
3/26/14 55
0.00
0.05
0.10
0.15
0.20
0.25
0
200,000
400,000
600,000
800,000
1,000,000
1,200,000
1,400,000
1,600,000
1,800,000
WHO Pre-elimination Countries: Reported ACD and PCD volumes
ACD
PCD
API
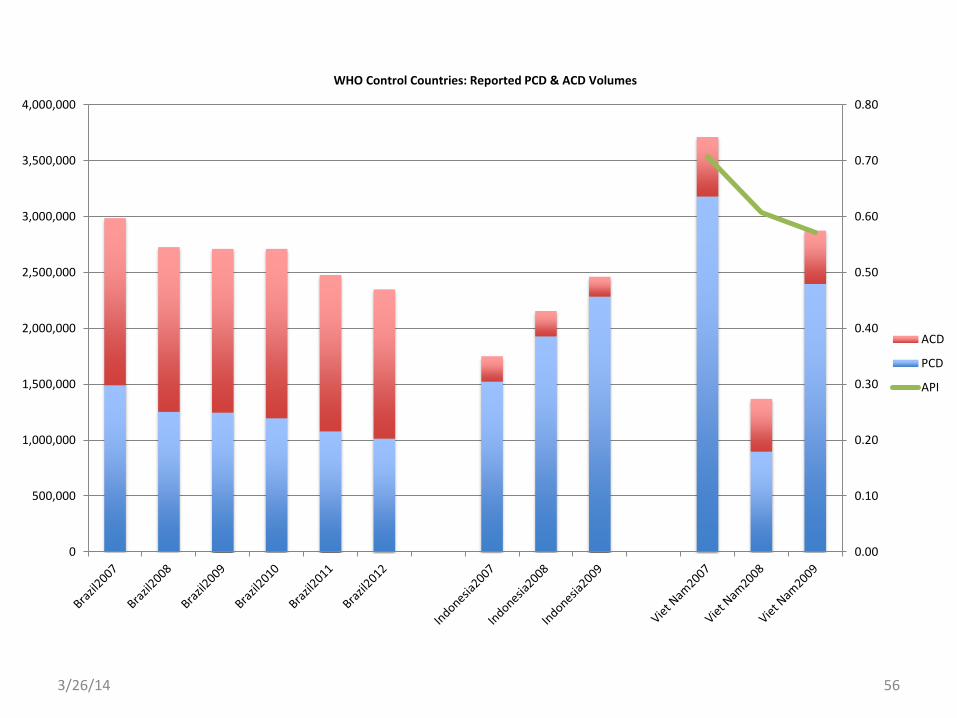
3/26/14 56
0.00
0.10
0.20
0.30
0.40
0.50
0.60
0.70
0.80
0
500,000
1,000,000
1,500,000
2,000,000
2,500,000
3,000,000
3,500,000
4,000,000
WHO Control Countries: Reported PCD & ACD Volumes
ACD
PCD
API

3/26/14 57
0.00
0.05
0.10
0.15
0.20
0.25
0.30
0.35
0.40
0
100,000
200,000
300,000
400,000
500,000
600,000
700,000
800,000
900,000
WHO Control Countries: Reported PCD & ACD Volumes
ACD
PCD
API
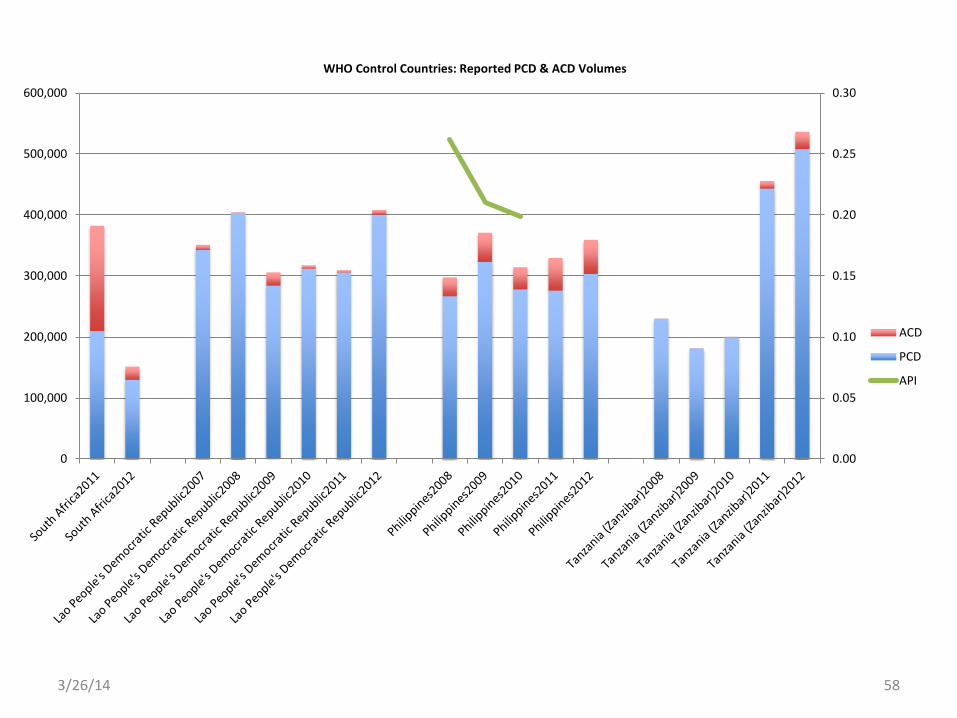
3/26/14 58
0.00
0.05
0.10
0.15
0.20
0.25
0.30
0
100,000
200,000
300,000
400,000
500,000
600,000
WHO Control Countries: Reported PCD & ACD Volumes
ACD
PCD
API
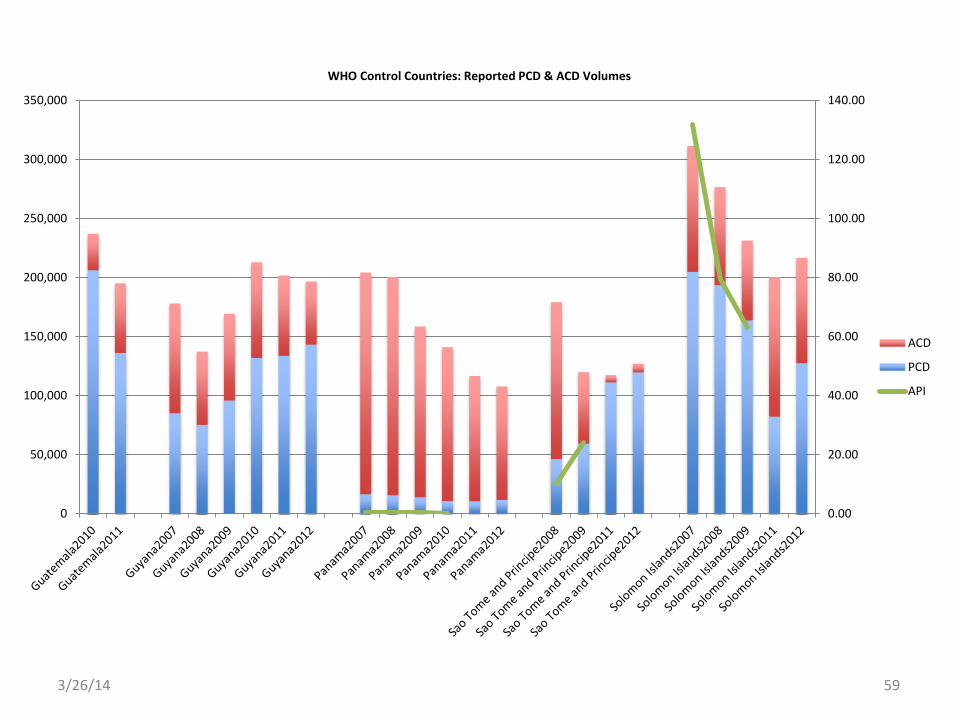
3/26/14 59
0.00
20.00
40.00
60.00
80.00
100.00
120.00
140.00
0
50,000
100,000
150,000
200,000
250,000
300,000
350,000
WHO Control Countries: Reported PCD & ACD Volumes
ACD
PCD
API
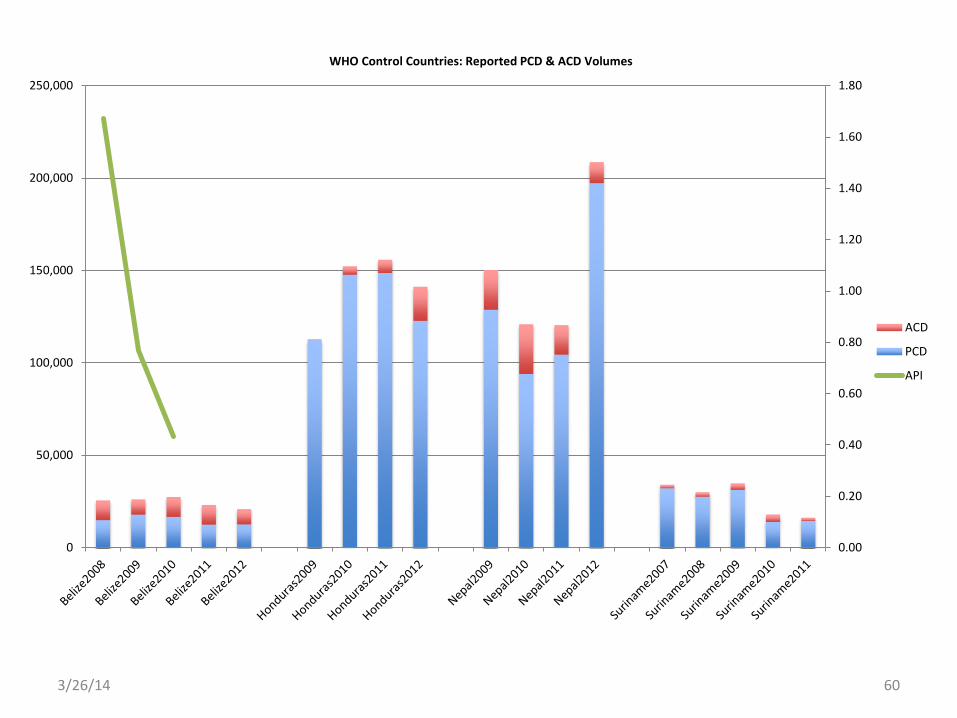
3/26/14 60
0.00
0.20
0.40
0.60
0.80
1.00
1.20
1.40
1.60
1.80
0
50,000
100,000
150,000
200,000
250,000
WHO Control Countries: Reported PCD & ACD Volumes
ACD
PCD
API
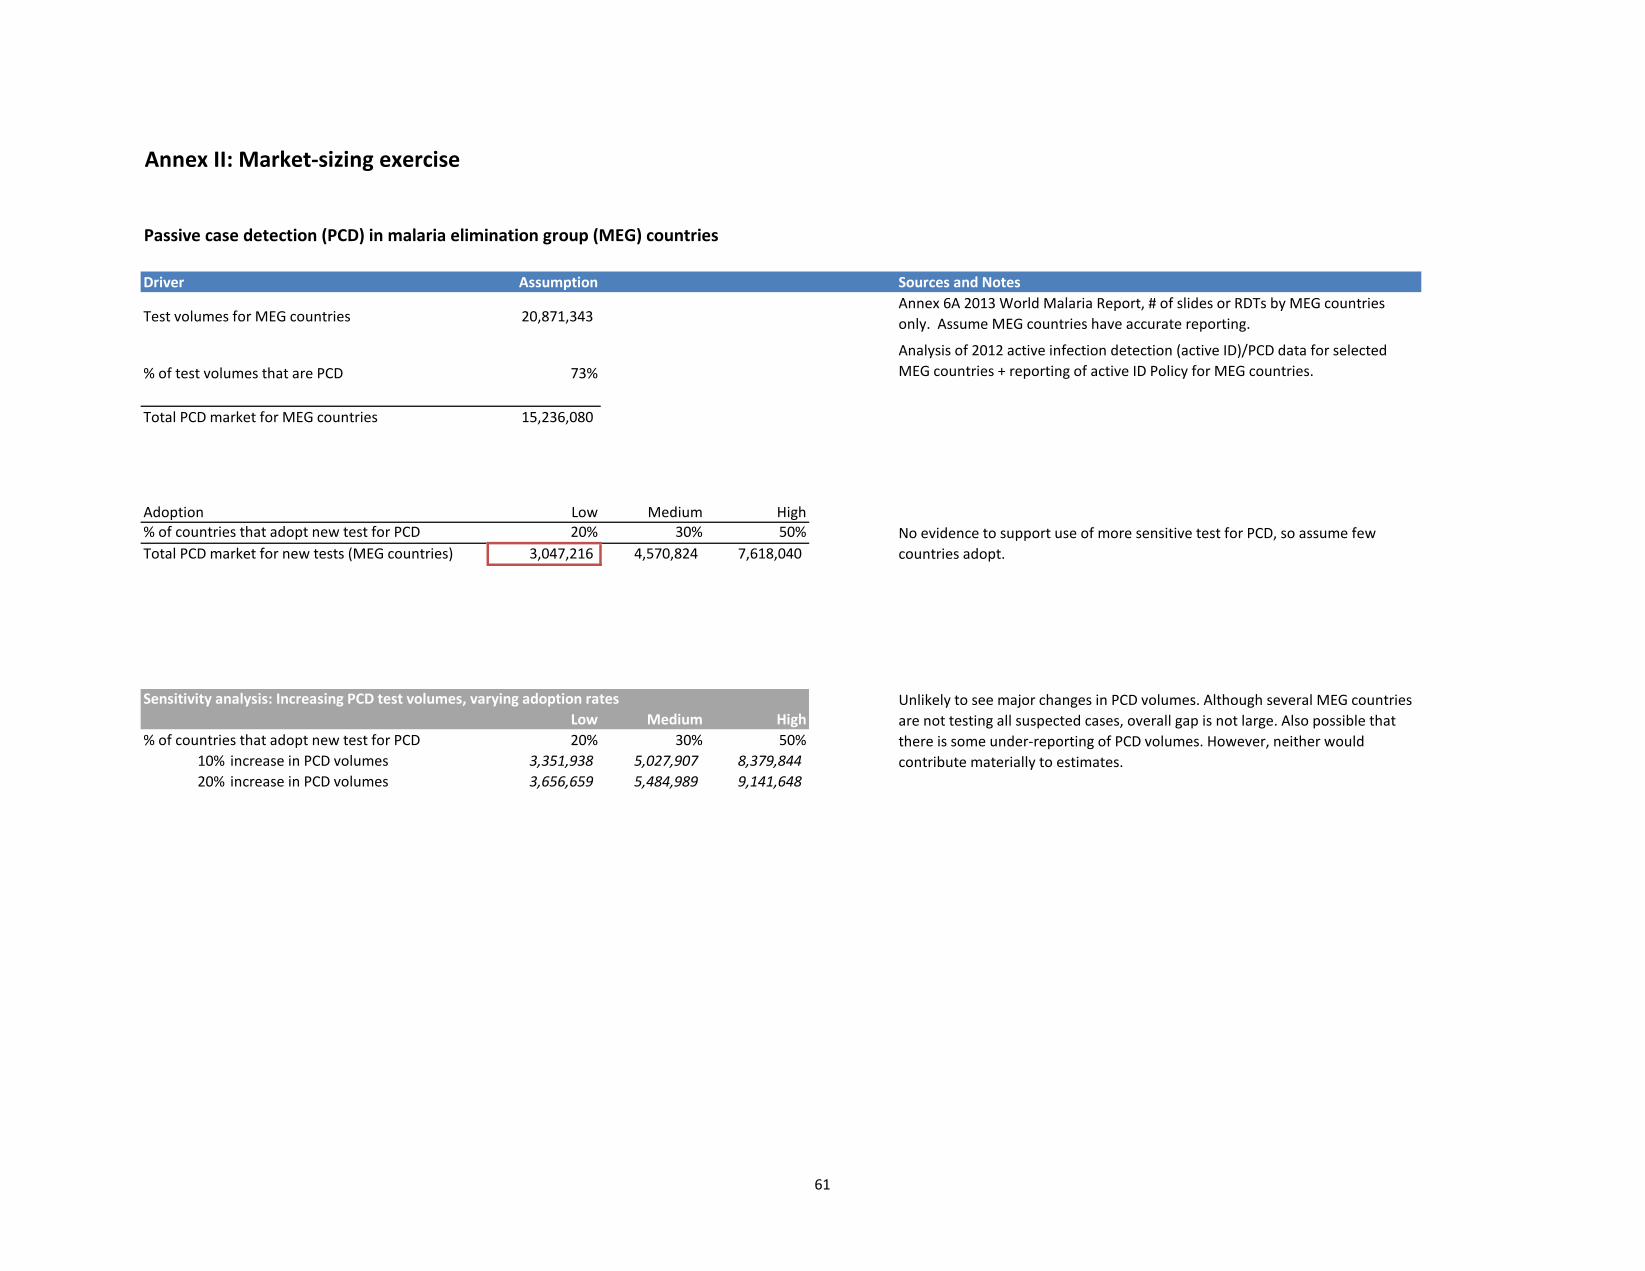
61
Annex II: Market-sizing exercise
Passive case detection (PCD) in malaria elimination group (MEG) countries
Driver Assumption Sources and Notes
Test volumes for MEG countries 20,871,343
% of test volumes that are PCD 73%
Total PCD market for MEG countries 15,236,080
Adoption Low Medium High% of countries that adopt new test for PCD 20% 30% 50%Total PCD market for new tests (MEG countries) 3,047,216 4,570,824 7,618,040
Sensitivity analysis: Increasing PCD test volumes, varying adoption ratesLow Medium High
% of countries that adopt new test for PCD 20% 30% 50%10% increase in PCD volumes 3,351,938 5,027,907 8,379,844 20% increase in PCD volumes 3,656,659 5,484,989 9,141,648
Annex 6A 2013 World Malaria Report, # of slides or RDTs by MEG countries only. Assume MEG countries have accurate reporting.
Analysis of 2012 active infection detection (active ID)/PCD data for selected MEG countries + reporting of active ID Policy for MEG countries.
Unlikely to see major changes in PCD volumes. Although several MEG countries are not testing all suspected cases, overall gap is not large. Also possible that there is some under-reporting of PCD volumes. However, neither would contribute materially to estimates.
No evidence to support use of more sensitive test for PCD, so assume few countries adopt.
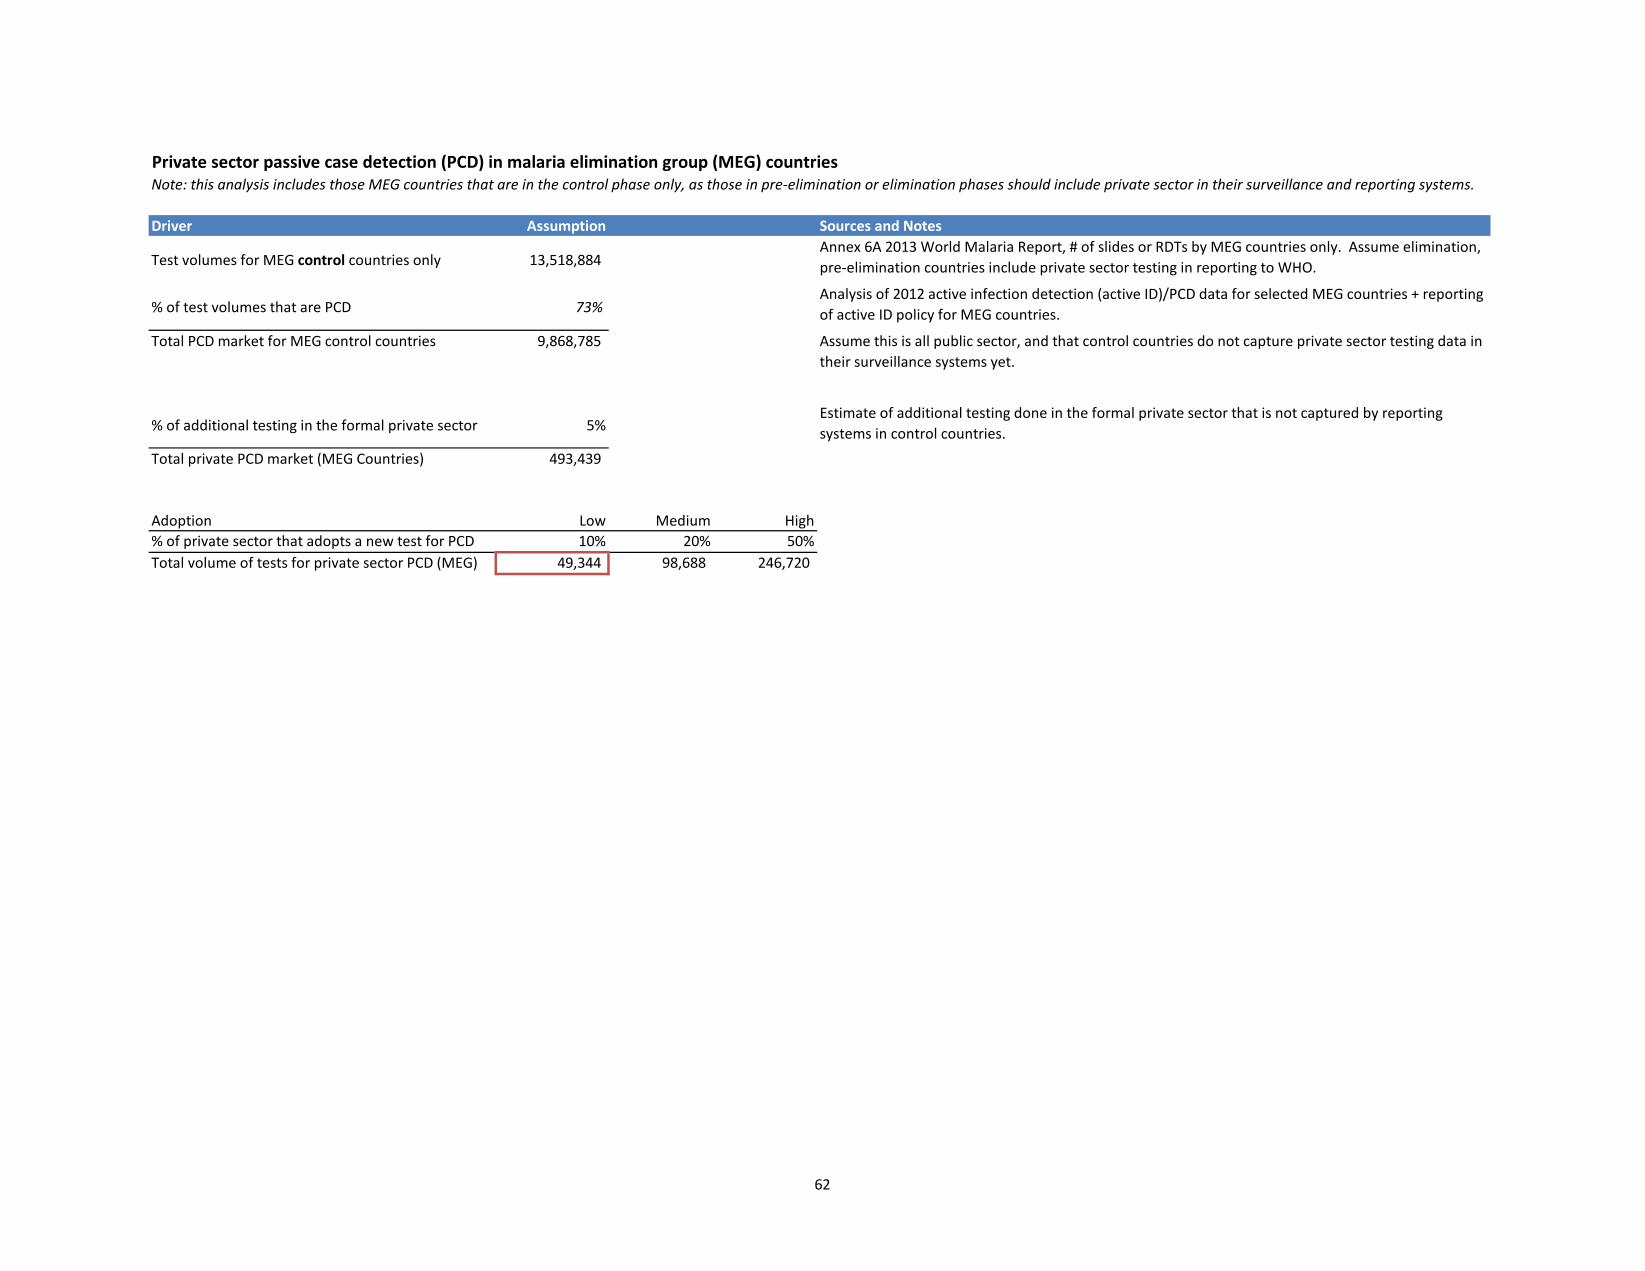
62
Private sector passive case detection (PCD) in malaria elimination group (MEG) countries Note: this analysis includes those MEG countries that are in the control phase only, as those in pre-elimination or elimination phases should include private sector in their surveillance and reporting systems.
Driver Assumption Sources and Notes
Test volumes for MEG control countries only 13,518,884
% of test volumes that are PCD 73%
Total PCD market for MEG control countries 9,868,785
% of additional testing in the formal private sector 5%
Total private PCD market (MEG Countries) 493,439
Adoption Low Medium High% of private sector that adopts a new test for PCD 10% 20% 50%Total volume of tests for private sector PCD (MEG) 49,344 98,688 246,720
Annex 6A 2013 World Malaria Report, # of slides or RDTs by MEG countries only. Assume elimination, pre-elimination countries include private sector testing in reporting to WHO.
Analysis of 2012 active infection detection (active ID)/PCD data for selected MEG countries + reporting of active ID policy for MEG countries.
Assume this is all public sector, and that control countries do not capture private sector testing data in their surveillance systems yet.
Estimate of additional testing done in the formal private sector that is not captured by reporting systems in control countries.

63
Active infection detection (active ID) in malaria elimination group (MEG) countries
Driver Assumption Sources and NotesTest volumes for MEG countries 20,871,343 % of test volumes that are active 27%
Total active ID market for MEG countries 5,635,263
Sensitivity Analysis: increasing active test volumes, varying adoption ratesLow Medium High
% of countries that adopt new test for active ID 25% 50% 70%0 increase in active ID volumes 1,408,816 2,817,631 3,944,684
10% increase in active ID volumes 1,549,697 3,099,394 4,339,152 20% increase in active ID volumes 1,690,579 3,381,158 4,733,621 30% increase in active ID volumes 1,831,460 3,662,921 5,128,089
Assume an increase in active volumes as a result of a new test being avaialble. Near term, half of countries adopt new test, longer term would expect this to increase signficantly.
Annex 6A 2013 World Malaria Report, # of slides or rapid diagnostic tests by MEG countries only. Assume MEG countries have Analysis of 2012 active ID/PCD data for selected MEG countries + reporting of active ID policy for MEG countries.
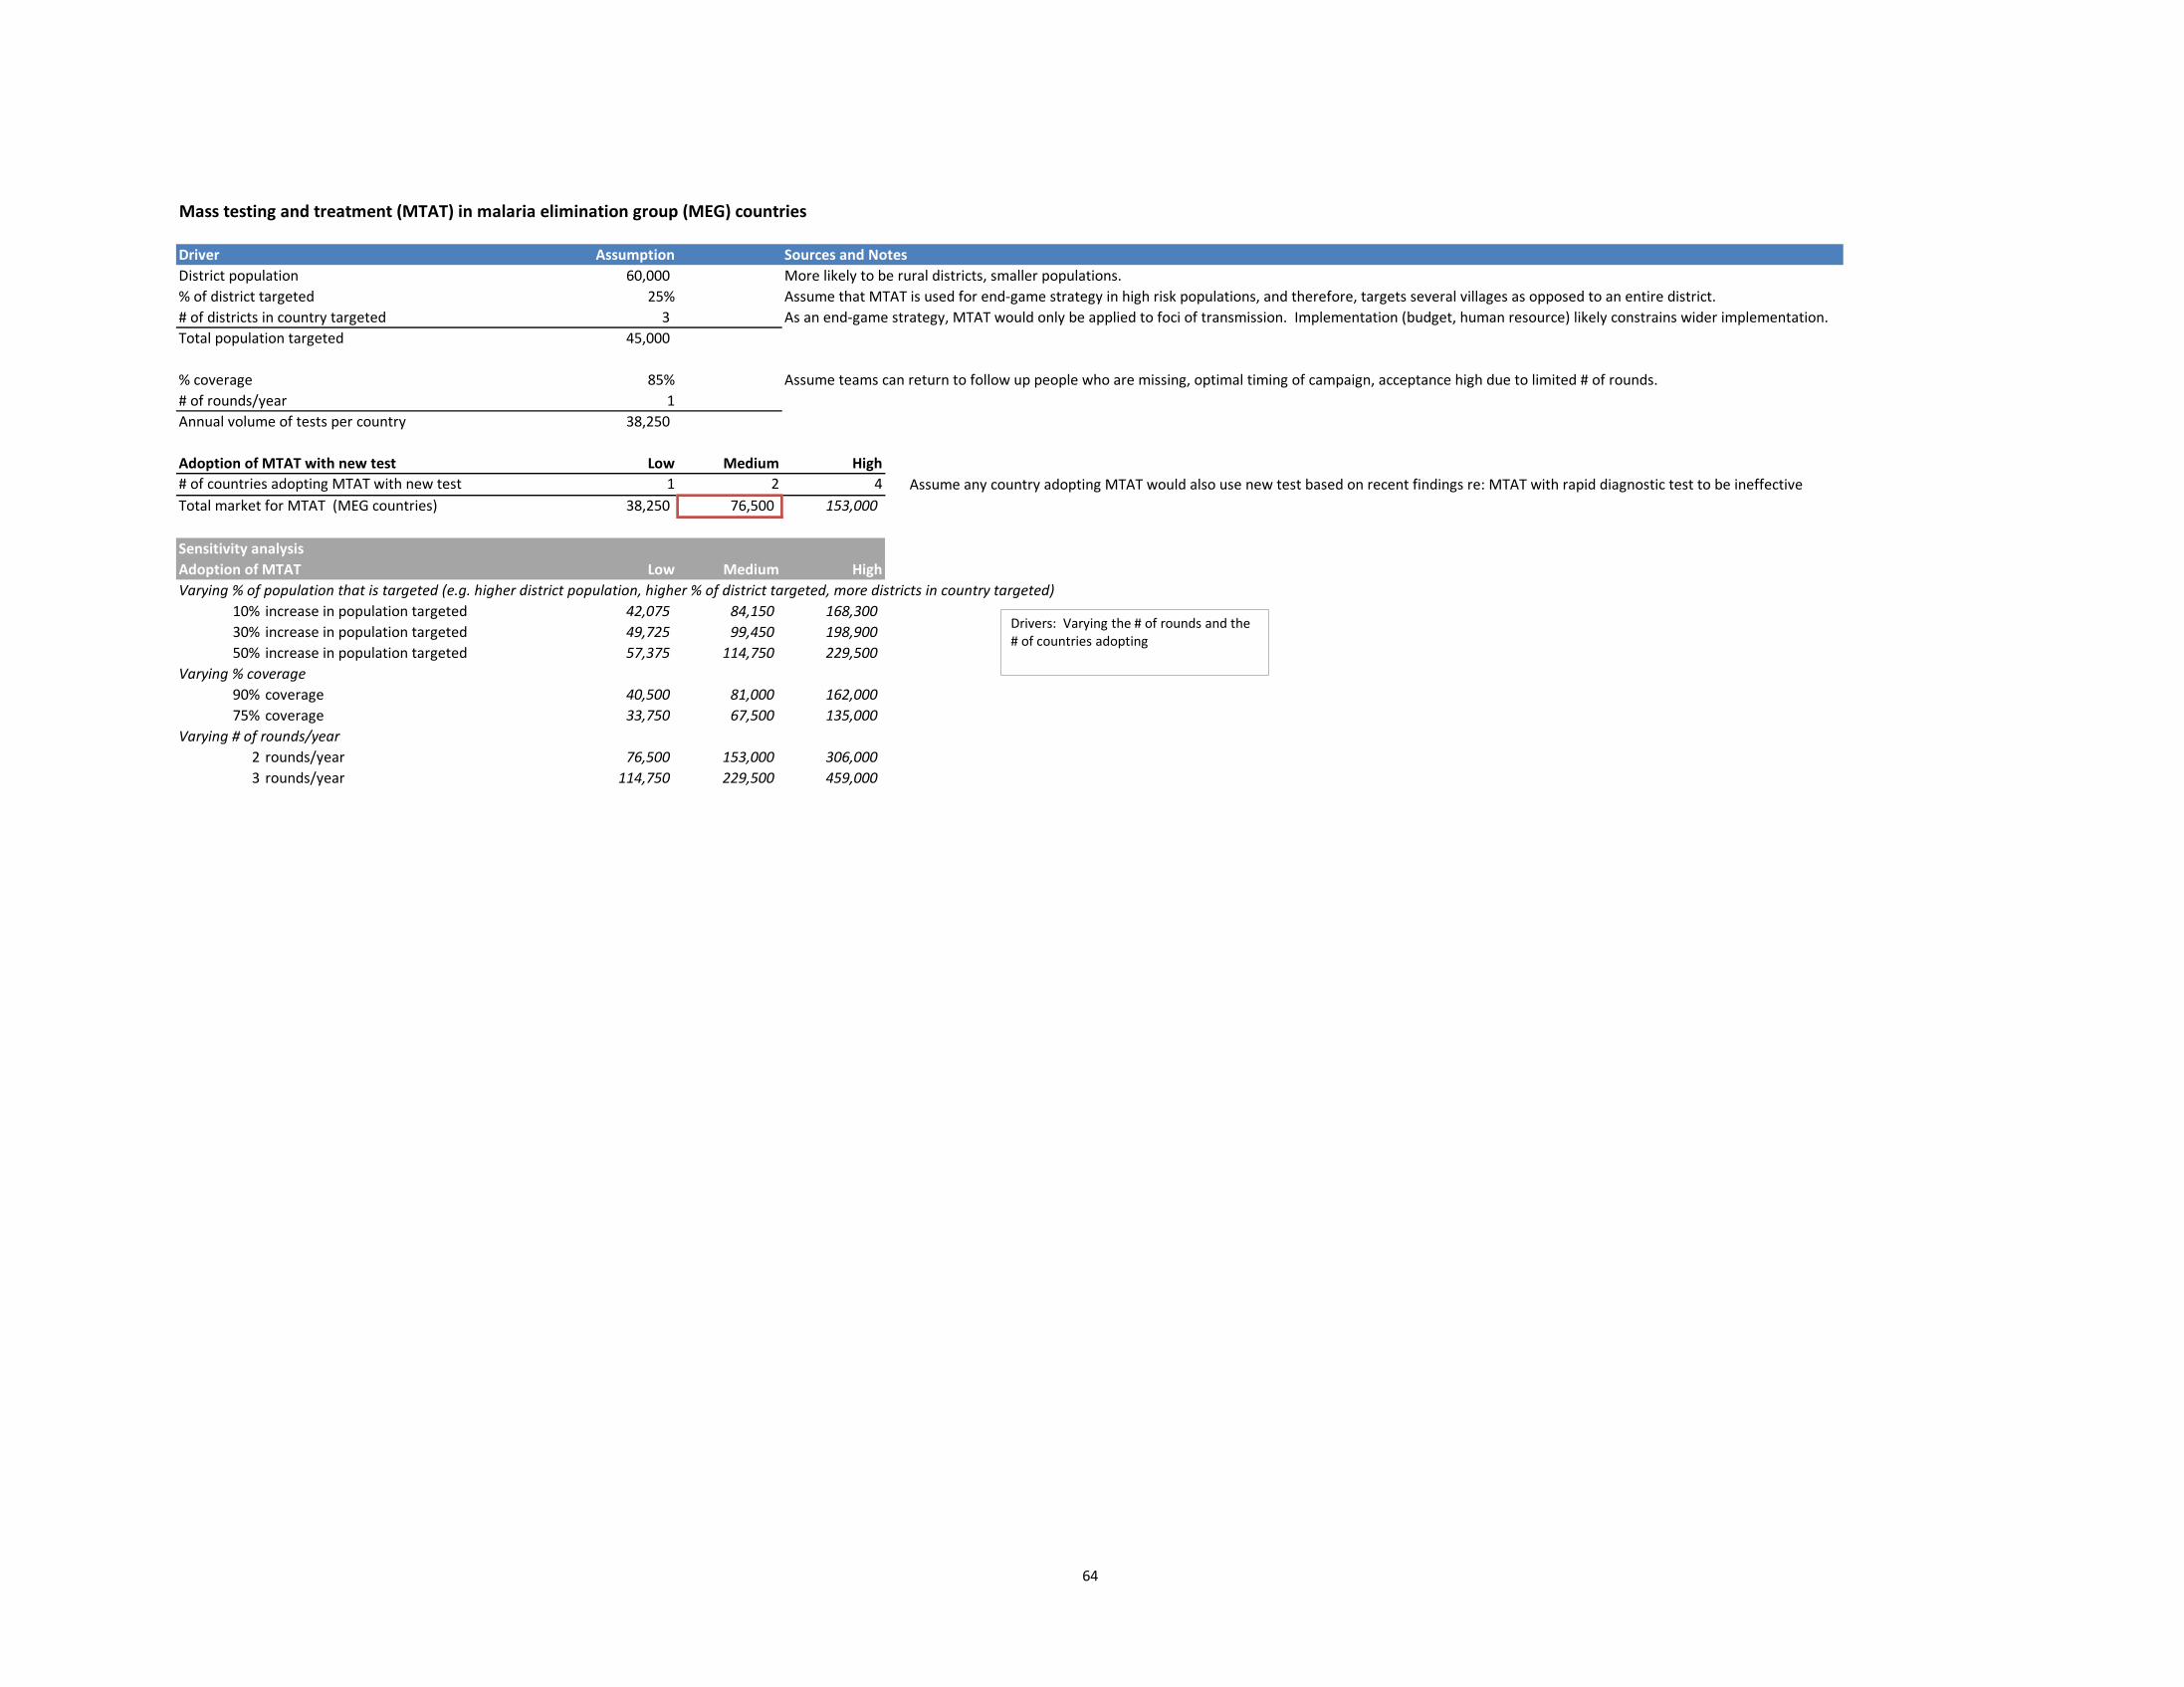
64
Mass testing and treatment (MTAT) in malaria elimination group (MEG) countries
Driver Assumption Sources and NotesDistrict population 60,000 More likely to be rural districts, smaller populations.% of district targeted 25% Assume that MTAT is used for end-game strategy in high risk populations, and therefore, targets several villages as opposed to an entire district.# of districts in country targeted 3 As an end-game strategy, MTAT would only be applied to foci of transmission. Implementation (budget, human resource) likely constrains wider implementation.Total population targeted 45,000
% coverage 85% Assume teams can return to follow up people who are missing, optimal timing of campaign, acceptance high due to limited # of rounds.# of rounds/year 1Annual volume of tests per country 38,250
Adoption of MTAT with new test Low Medium High# of countries adopting MTAT with new test 1 2 4 Assume any country adopting MTAT would also use new test based on recent findings re: MTAT with rapid diagnostic test to be ineffectiveTotal market for MTAT (MEG countries) 38,250 76,500 153,000
Sensitivity analysisAdoption of MTAT Low Medium HighVarying % of population that is targeted (e.g. higher district population, higher % of district targeted, more districts in country targeted)
10% increase in population targeted 42,075 84,150 168,300 30% increase in population targeted 49,725 99,450 198,900 50% increase in population targeted 57,375 114,750 229,500
Varying % coverage90% coverage 40,500 81,000 162,000 75% coverage 33,750 67,500 135,000
Varying # of rounds/year2 rounds/year 76,500 153,000 306,000 3 rounds/year 114,750 229,500 459,000
Drivers: Varying the # of rounds and the # of countries adopting
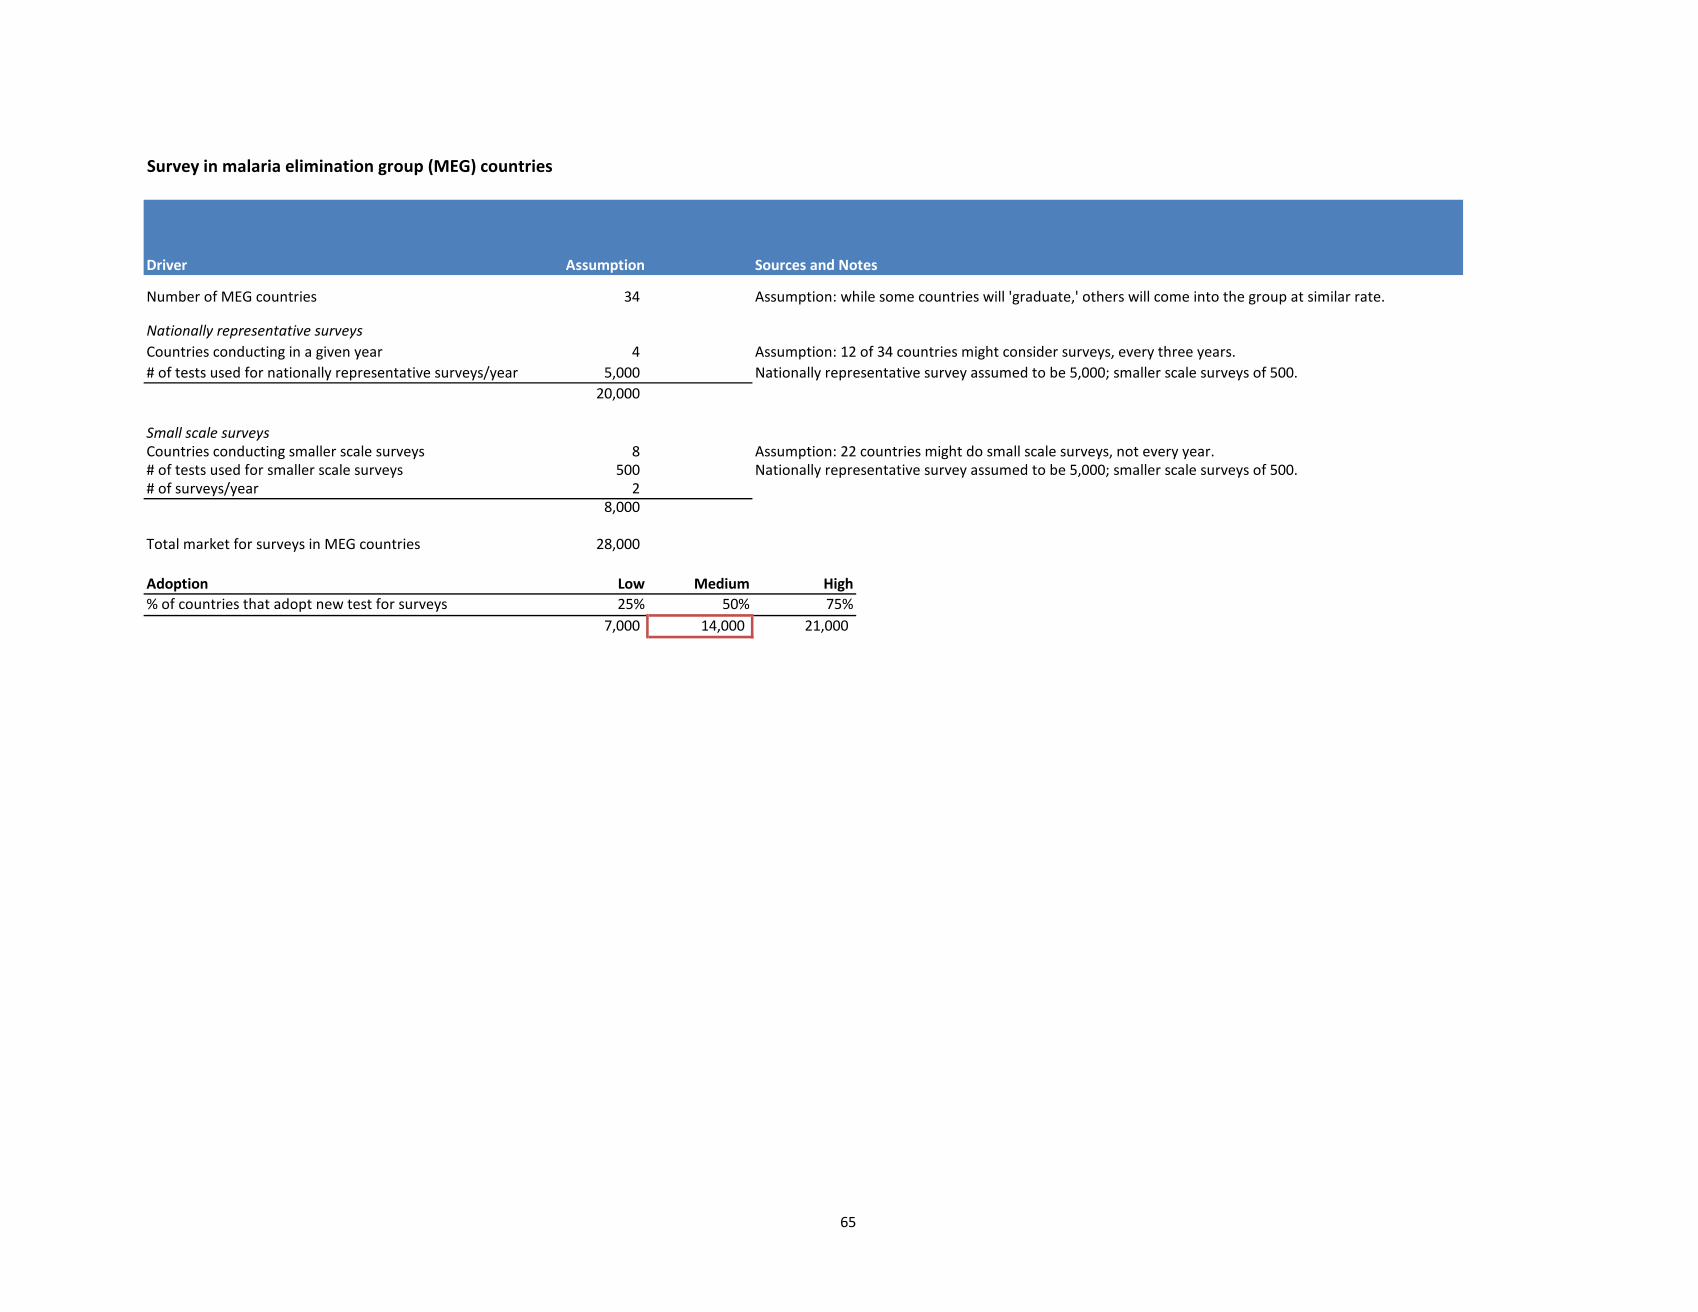
65
Survey in malaria elimination group (MEG) countries
Driver Assumption Sources and Notes
Number of MEG countries 34 Assumption: while some countries will 'graduate,' others will come into the group at similar rate.
Nationally representative surveysCountries conducting in a given year 4 Assumption: 12 of 34 countries might consider surveys, every three years.# of tests used for nationally representative surveys/year 5,000 Nationally representative survey assumed to be 5,000; smaller scale surveys of 500.
20,000
Small scale surveysCountries conducting smaller scale surveys 8 Assumption: 22 countries might do small scale surveys, not every year.# of tests used for smaller scale surveys 500 Nationally representative survey assumed to be 5,000; smaller scale surveys of 500.# of surveys/year 2
8,000
Total market for surveys in MEG countries 28,000
Adoption Low Medium High% of countries that adopt new test for surveys 25% 50% 75%
7,000 14,000 21,000
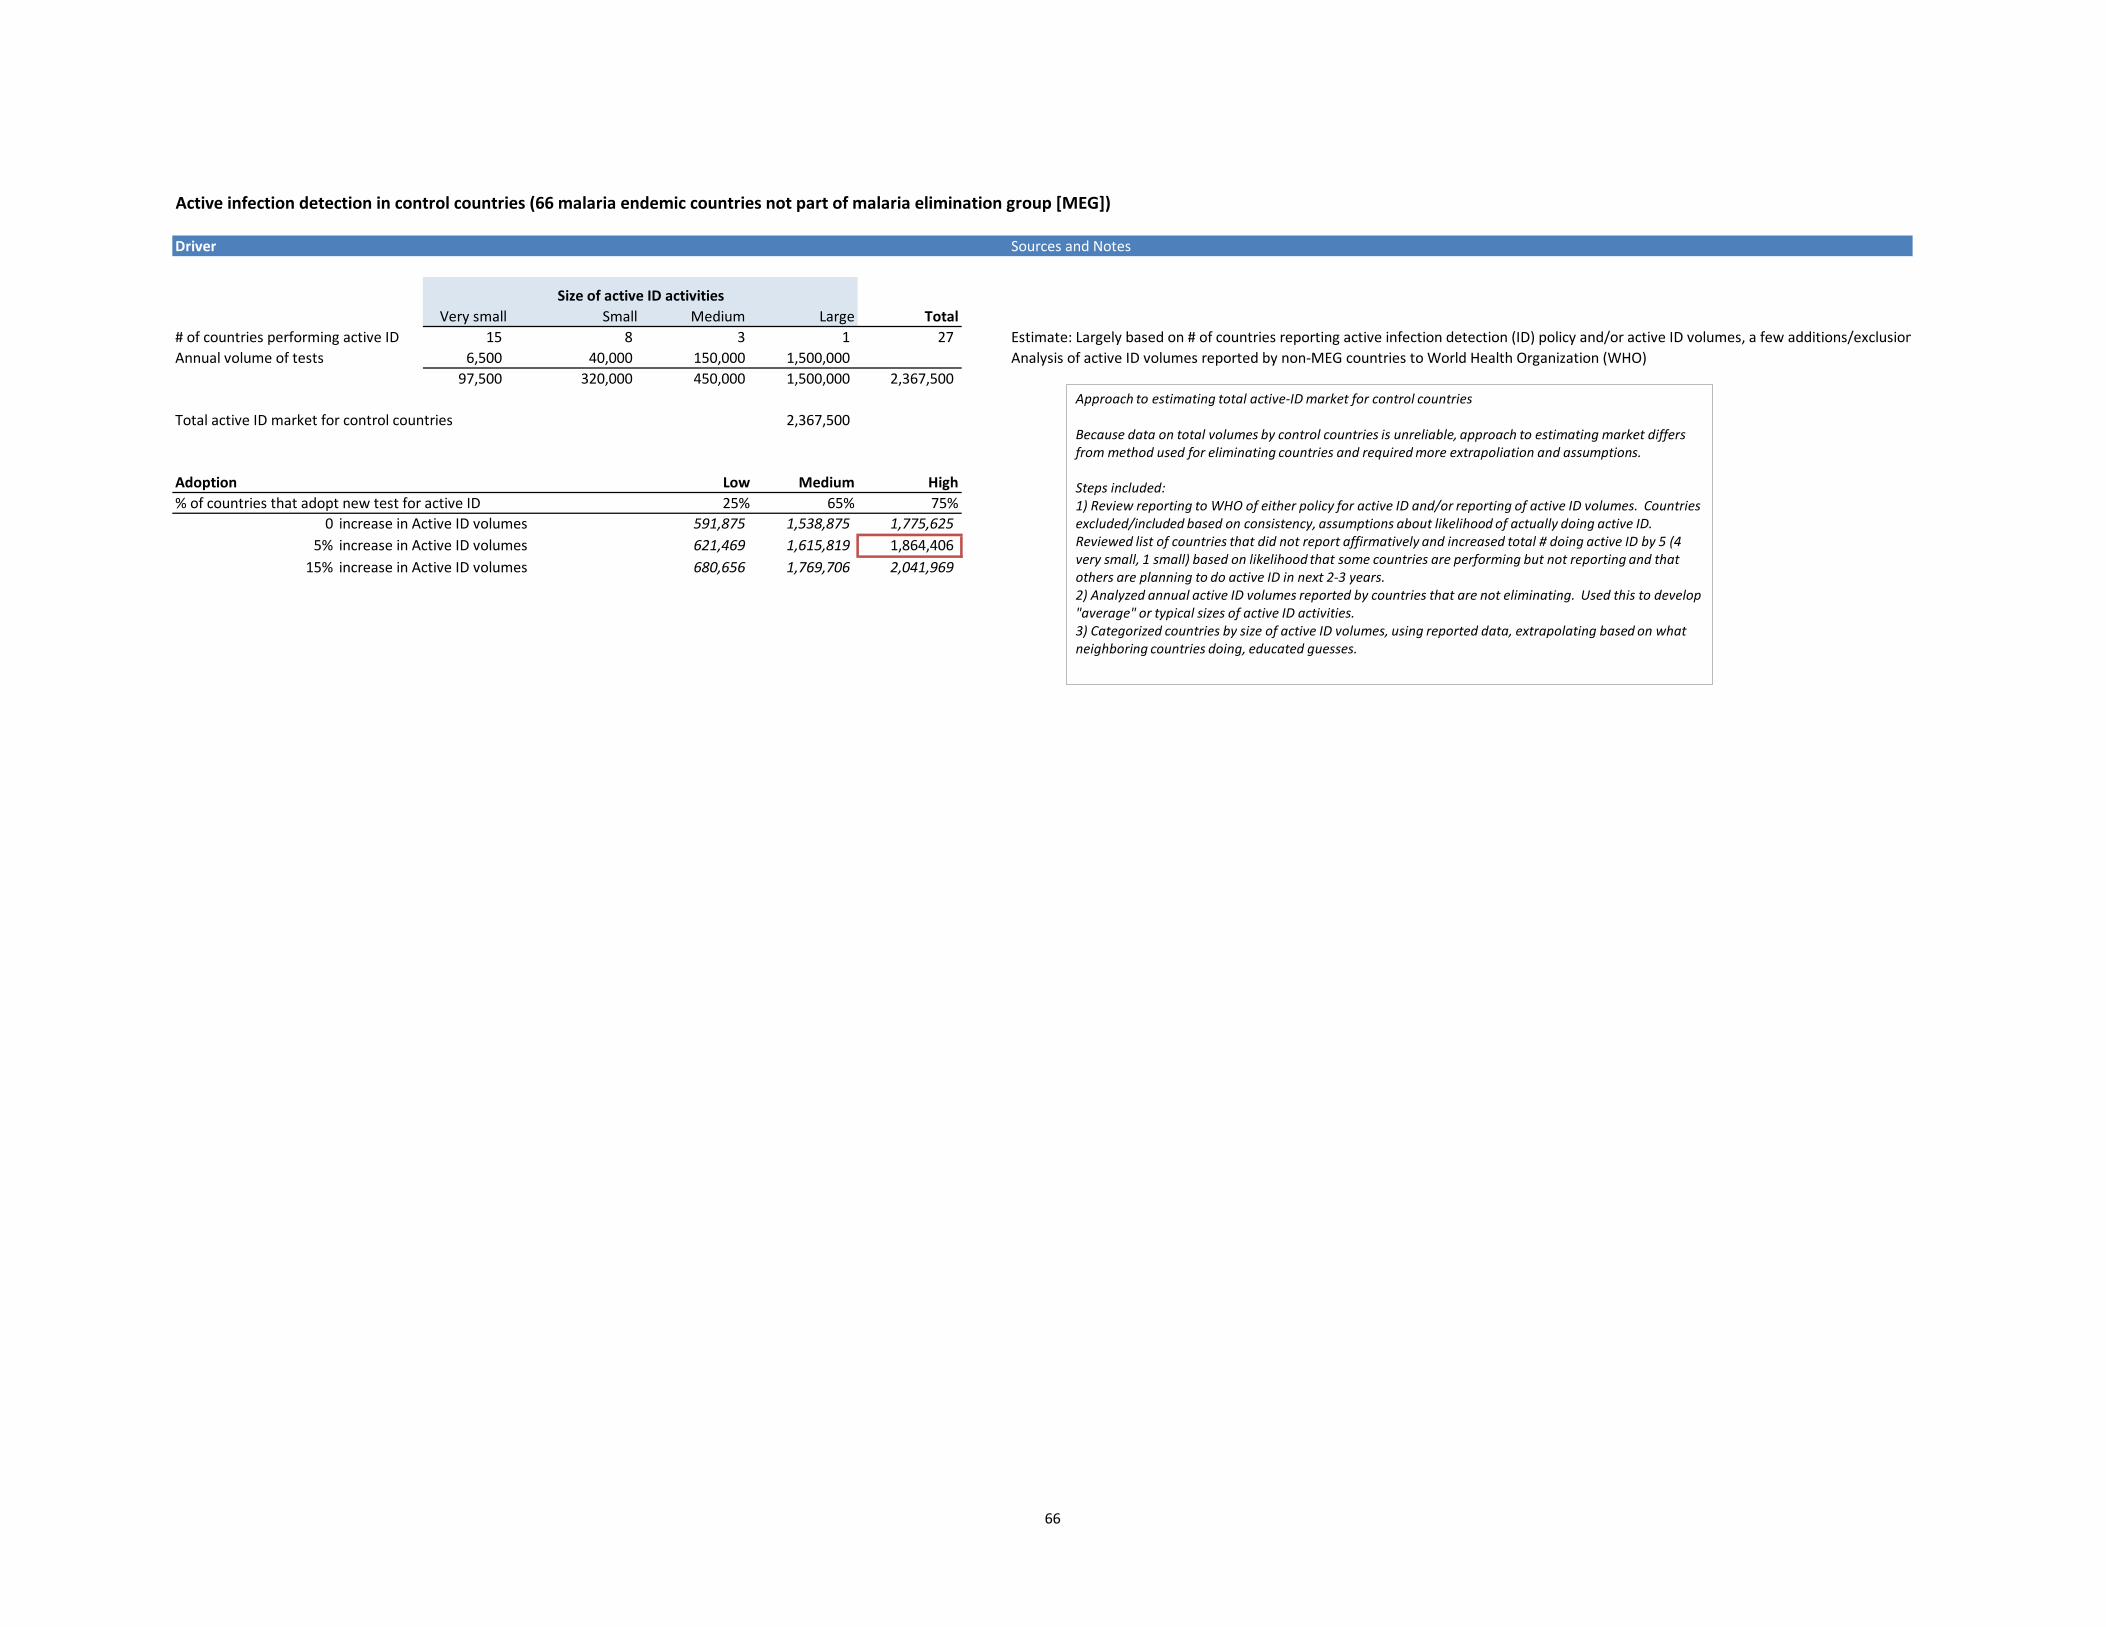
66
Active infection detection in control countries (66 malaria endemic countries not part of malaria elimination group [MEG])
Driver Sources and Notes
Very small Small Medium Large Total# of countries performing active ID 15 8 3 1 27 Estimate: Largely based on # of countries reporting active infection detection (ID) policy and/or active ID volumes, a few additions/exclusionAnnual volume of tests 6,500 40,000 150,000 1,500,000 Analysis of active ID volumes reported by non-MEG countries to World Health Organization (WHO)
97,500 320,000 450,000 1,500,000 2,367,500
Total active ID market for control countries 2,367,500
Adoption Low Medium High% of countries that adopt new test for active ID 25% 65% 75%
0 increase in Active ID volumes 591,875 1,538,875 1,775,625 5% increase in Active ID volumes 621,469 1,615,819 1,864,406
15% increase in Active ID volumes 680,656 1,769,706 2,041,969
Size of active ID activities
Approach to estimating total active-ID market for control countries Because data on total volumes by control countries is unreliable, approach to estimating market differs from method used for eliminating countries and required more extrapoliation and assumptions. Steps included: 1) Review reporting to WHO of either policy for active ID and/or reporting of active ID volumes. Countries excluded/included based on consistency, assumptions about likelihood of actually doing active ID. Reviewed list of countries that did not report affirmatively and increased total # doing active ID by 5 (4 very small, 1 small) based on likelihood that some countries are performing but not reporting and that others are planning to do active ID in next 2-3 years. 2) Analyzed annual active ID volumes reported by countries that are not eliminating. Used this to develop "average" or typical sizes of active ID activities. 3) Categorized countries by size of active ID volumes, using reported data, extrapolating based on what neighboring countries doing, educated guesses.
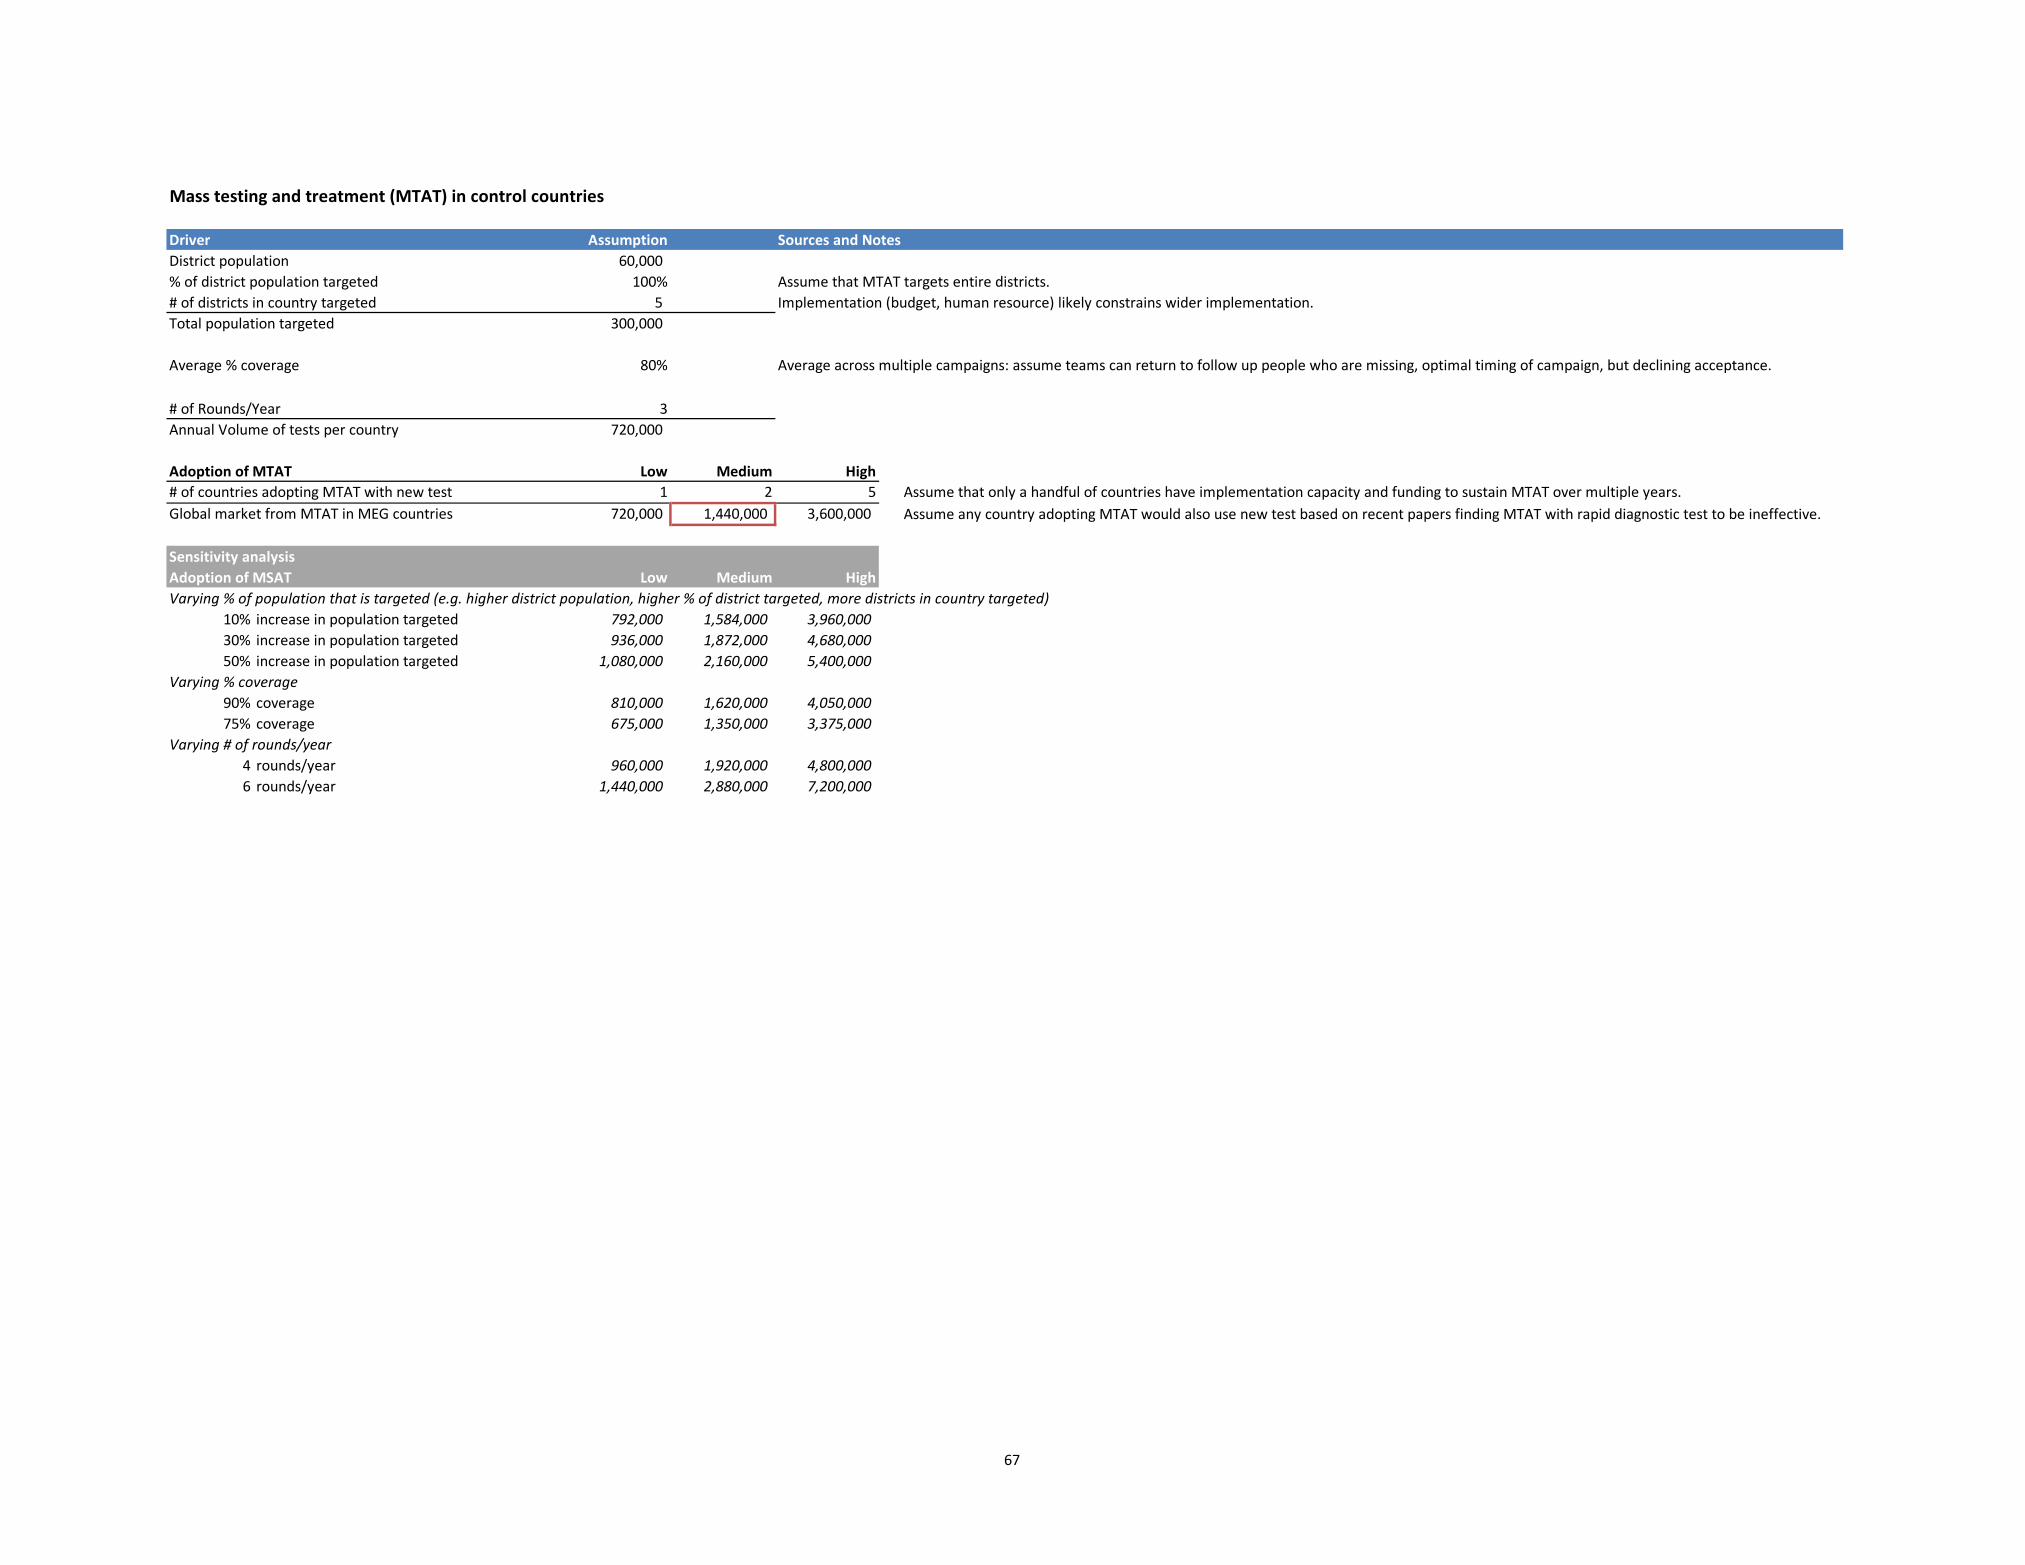
67
Mass testing and treatment (MTAT) in control countries
Driver Assumption Sources and NotesDistrict population 60,000 % of district population targeted 100% Assume that MTAT targets entire districts.# of districts in country targeted 5 Implementation (budget, human resource) likely constrains wider implementation.Total population targeted 300,000
Average % coverage 80%
# of Rounds/Year 3Annual Volume of tests per country 720,000
Adoption of MTAT Low Medium High# of countries adopting MTAT with new test 1 2 5 Assume that only a handful of countries have implementation capacity and funding to sustain MTAT over multiple years. Global market from MTAT in MEG countries 720,000 1,440,000 3,600,000 Assume any country adopting MTAT would also use new test based on recent papers finding MTAT with rapid diagnostic test to be ineffective.
Sensitivity analysisAdoption of MSAT Low Medium HighVarying % of population that is targeted (e.g. higher district population, higher % of district targeted, more districts in country targeted)
10% increase in population targeted 792,000 1,584,000 3,960,000 30% increase in population targeted 936,000 1,872,000 4,680,000 50% increase in population targeted 1,080,000 2,160,000 5,400,000
Varying % coverage90% coverage 810,000 1,620,000 4,050,000 75% coverage 675,000 1,350,000 3,375,000
Varying # of rounds/year4 rounds/year 960,000 1,920,000 4,800,000 6 rounds/year 1,440,000 2,880,000 7,200,000
Average across multiple campaigns: assume teams can return to follow up people who are missing, optimal timing of campaign, but declining acceptance.
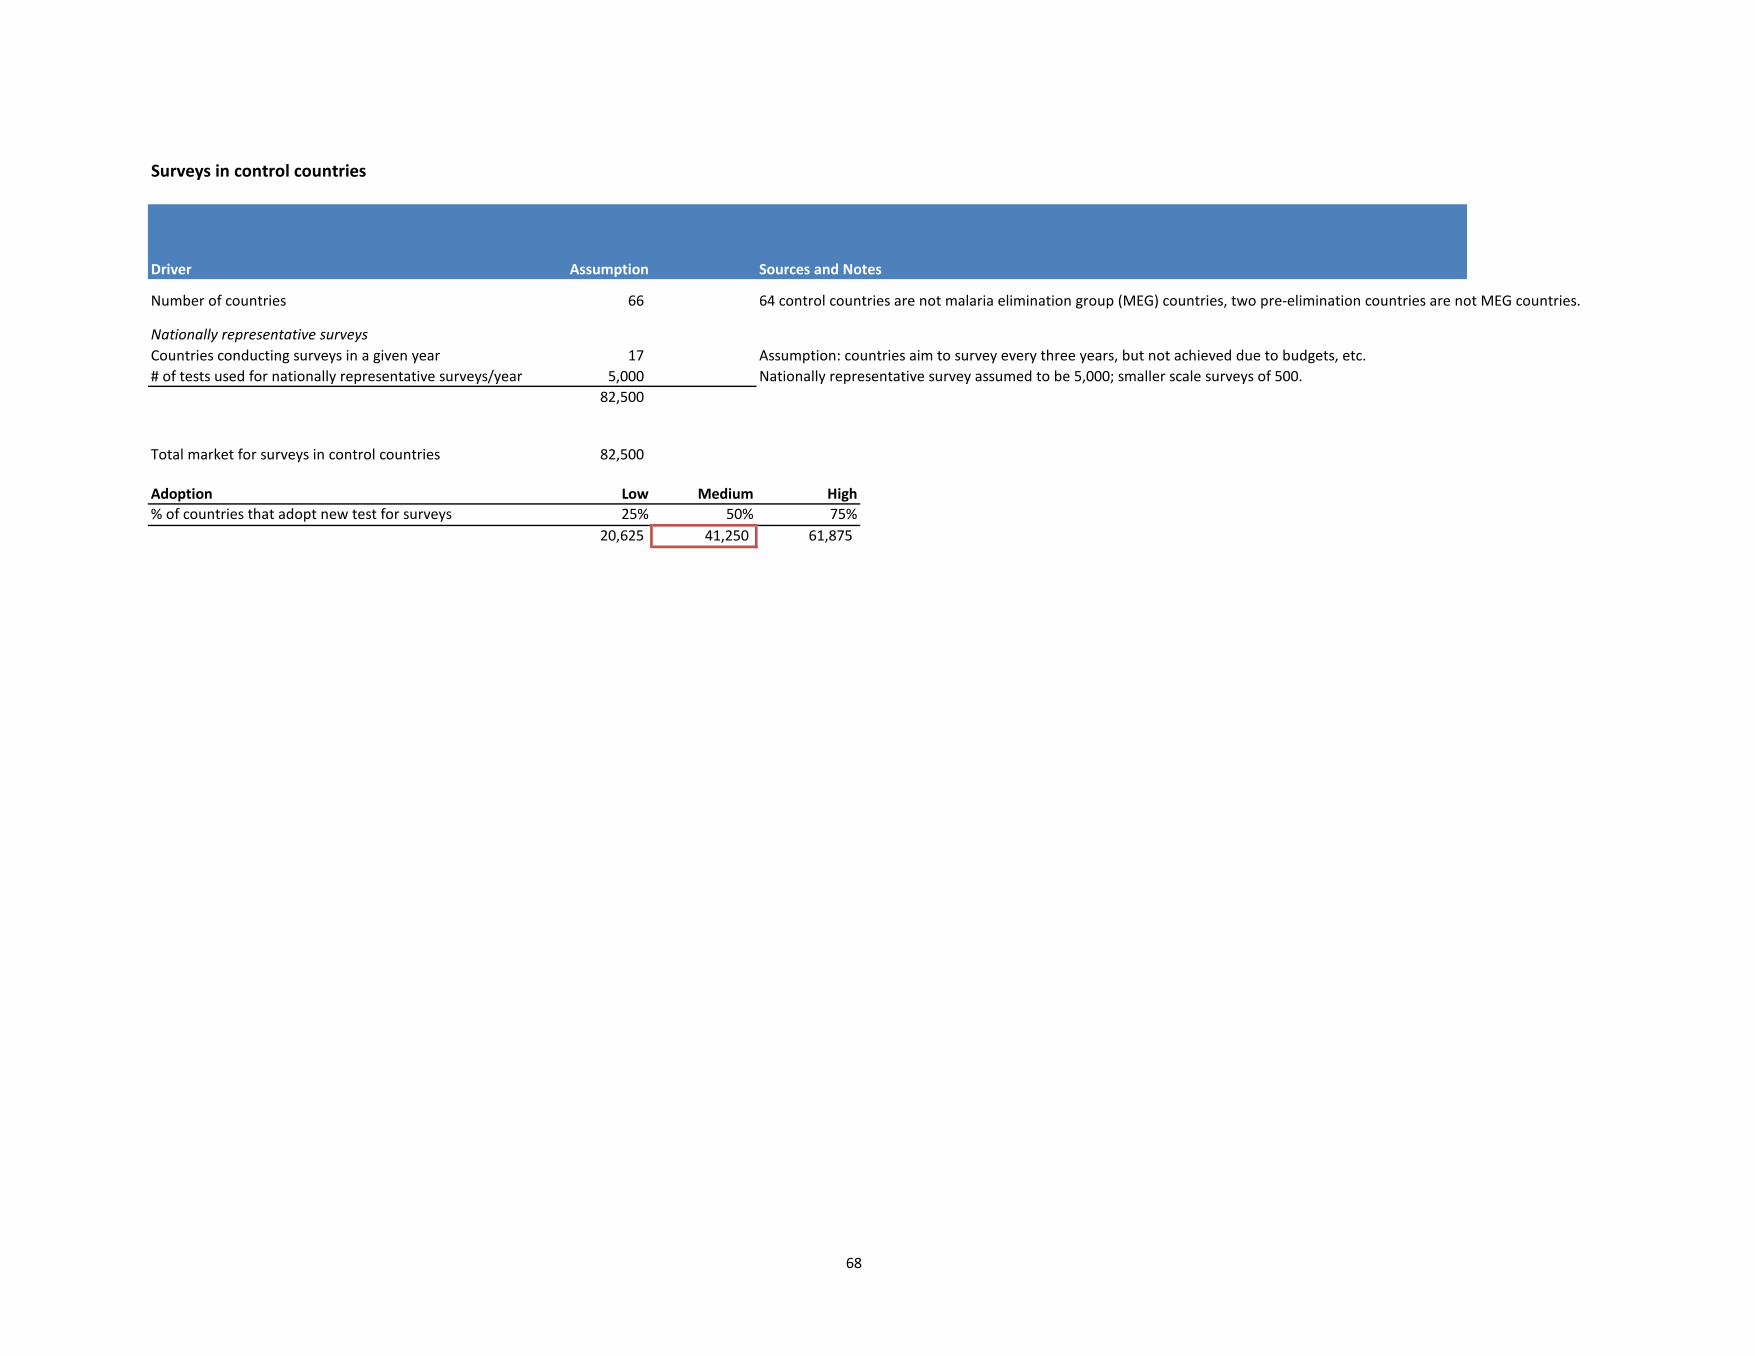
68
Surveys in control countries
Driver Assumption Sources and Notes
Number of countries 66 64 control countries are not malaria elimination group (MEG) countries, two pre-elimination countries are not MEG countries.
Nationally representative surveysCountries conducting surveys in a given year 17 Assumption: countries aim to survey every three years, but not achieved due to budgets, etc.# of tests used for nationally representative surveys/year 5,000 Nationally representative survey assumed to be 5,000; smaller scale surveys of 500.
82,500
Total market for surveys in control countries 82,500
Adoption Low Medium High% of countries that adopt new test for surveys 25% 50% 75%
20,625 41,250 61,875
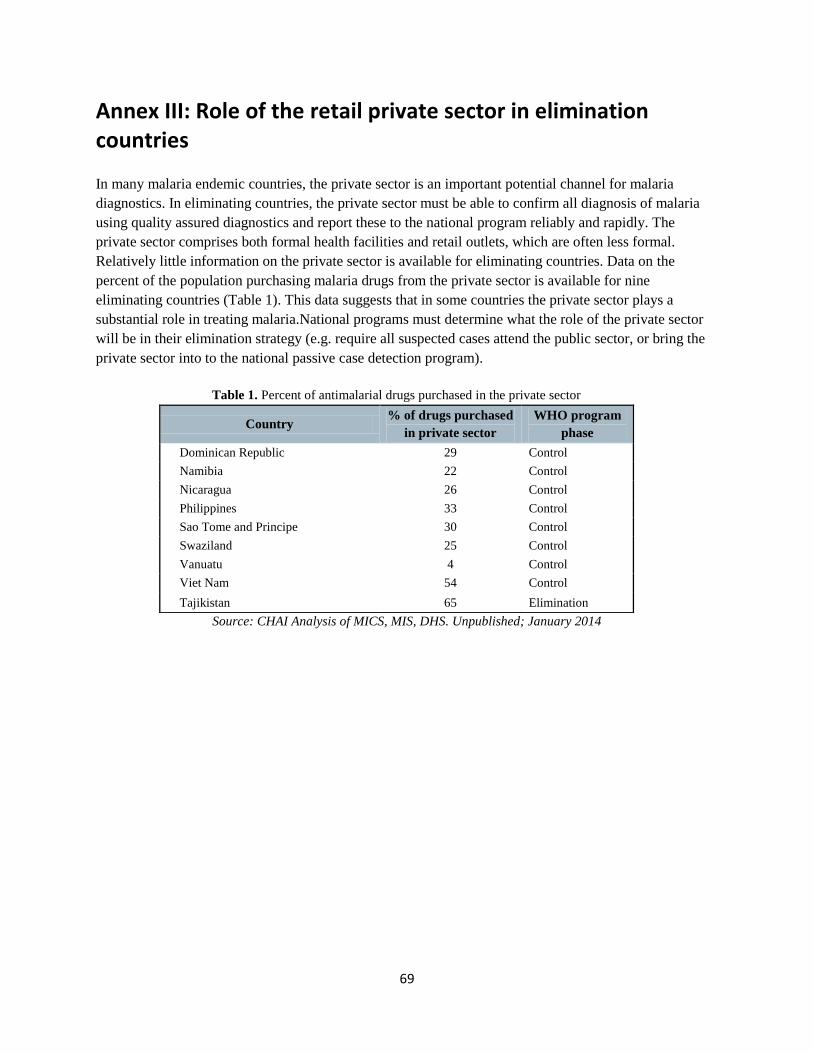
69
Annex III: Role of the retail private sector in elimination countries
In many malaria endemic countries, the private sector is an important potential channel for malaria
diagnostics. In eliminating countries, the private sector must be able to confirm all diagnosis of malaria
using quality assured diagnostics and report these to the national program reliably and rapidly. The
private sector comprises both formal health facilities and retail outlets, which are often less formal.
Relatively little information on the private sector is available for eliminating countries. Data on the
percent of the population purchasing malaria drugs from the private sector is available for nine
eliminating countries (Table 1). This data suggests that in some countries the private sector plays a
substantial role in treating malaria.National programs must determine what the role of the private sector
will be in their elimination strategy (e.g. require all suspected cases attend the public sector, or bring the
private sector into to the national passive case detection program).
Table 1. Percent of antimalarial drugs purchased in the private sector
Country % of drugs purchased
in private sector
WHO program
phase
Dominican Republic 29 Control
Namibia 22 Control
Nicaragua 26 Control
Philippines 33 Control
Sao Tome and Principe 30 Control
Swaziland 25 Control
Vanuatu 4 Control
Viet Nam 54 Control
Tajikistan 65 Elimination
Source: CHAI Analysis of MICS, MIS, DHS. Unpublished; January 2014
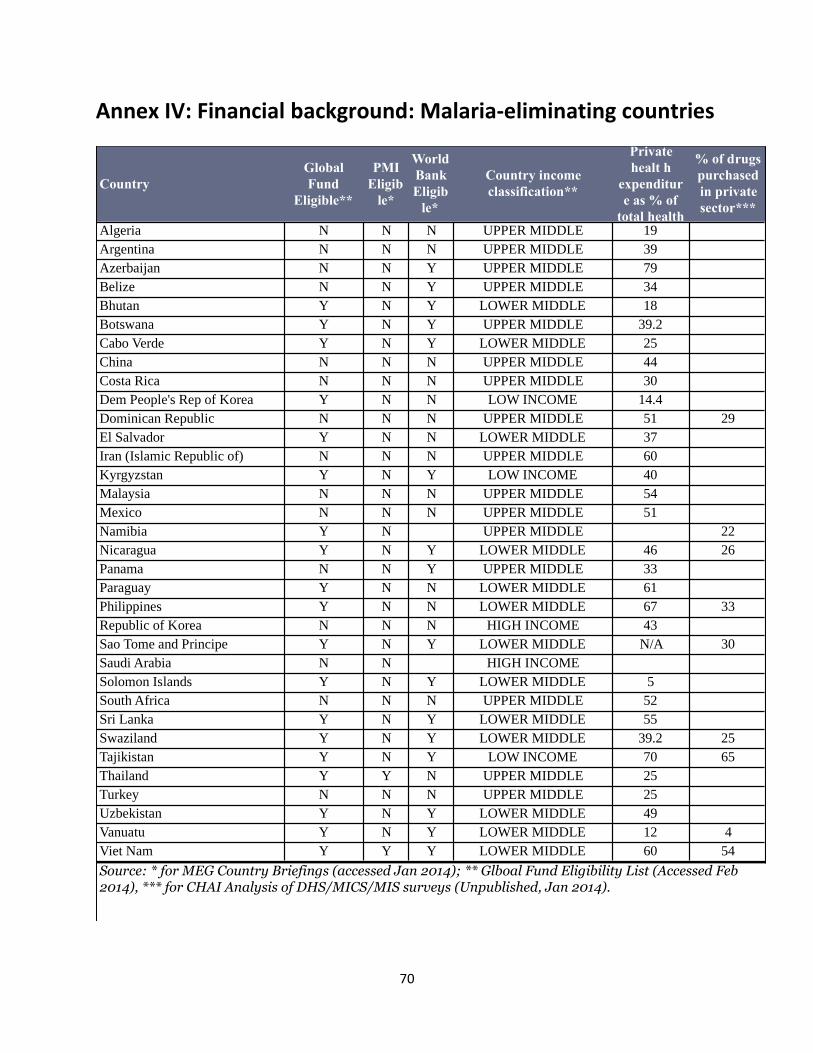
70
Annex IV: Financial background: Malaria-eliminating countries
Country
Global
Fund
Eligible**
PMI
Eligib
le*
World
Bank
Eligib
le*
Country income
classification**
Private
healt h
expenditur
e as % of
total health
% of drugs
purchased
in private
sector***
Algeria N N N UPPER MIDDLE 19
Argentina N N N UPPER MIDDLE 39
Azerbaijan N N Y UPPER MIDDLE 79
Belize N N Y UPPER MIDDLE 34
Bhutan Y N Y LOWER MIDDLE 18
Botswana Y N Y UPPER MIDDLE 39.2
Cabo Verde Y N Y LOWER MIDDLE 25
China N N N UPPER MIDDLE 44
Costa Rica N N N UPPER MIDDLE 30
Dem People's Rep of Korea Y N N LOW INCOME 14.4
Dominican Republic N N N UPPER MIDDLE 51 29
El Salvador Y N N LOWER MIDDLE 37
Iran (Islamic Republic of) N N N UPPER MIDDLE 60
Kyrgyzstan Y N Y LOW INCOME 40
Malaysia N N N UPPER MIDDLE 54
Mexico N N N UPPER MIDDLE 51
Namibia Y N UPPER MIDDLE 22
Nicaragua Y N Y LOWER MIDDLE 46 26
Panama N N Y UPPER MIDDLE 33
Paraguay Y N N LOWER MIDDLE 61
Philippines Y N N LOWER MIDDLE 67 33
Republic of Korea N N N HIGH INCOME 43
Sao Tome and Principe Y N Y LOWER MIDDLE N/A 30
Saudi Arabia N N HIGH INCOME
Solomon Islands Y N Y LOWER MIDDLE 5
South Africa N N N UPPER MIDDLE 52
Sri Lanka Y N Y LOWER MIDDLE 55
Swaziland Y N Y LOWER MIDDLE 39.2 25
Tajikistan Y N Y LOW INCOME 70 65
Thailand Y Y N UPPER MIDDLE 25
Turkey N N N UPPER MIDDLE 25
Uzbekistan Y N Y LOWER MIDDLE 49
Vanuatu Y N Y LOWER MIDDLE 12 4
Viet Nam Y Y Y LOWER MIDDLE 60 54
Source: * for MEG Country Briefings (accessed Jan 2014); ** Glboal Fund Eligibility List (Accessed Feb 2014), *** for CHAI Analysis of DHS/MICS/MIS surveys (Unpublished, Jan 2014).
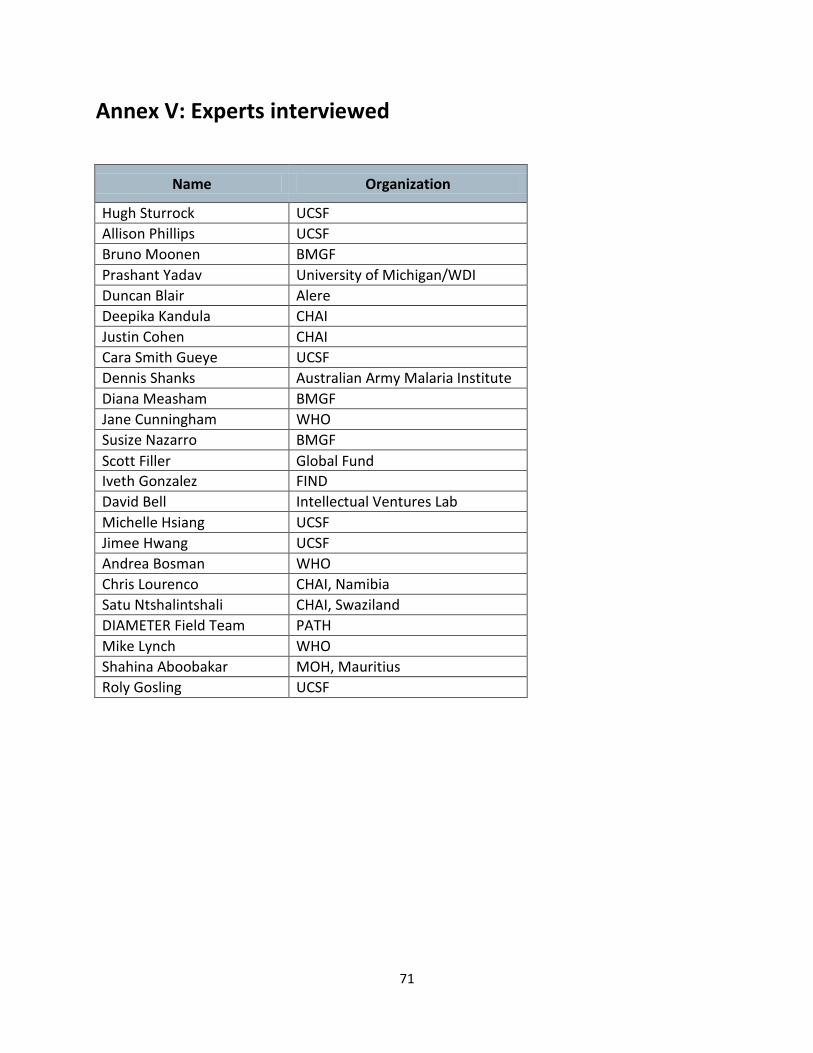
71
Annex V: Experts interviewed
Name Organization
Hugh Sturrock UCSF
Allison Phillips UCSF
Bruno Moonen BMGF
Prashant Yadav University of Michigan/WDI
Duncan Blair Alere
Deepika Kandula CHAI
Justin Cohen CHAI
Cara Smith Gueye UCSF
Dennis Shanks Australian Army Malaria Institute
Diana Measham BMGF
Jane Cunningham WHO
Susize Nazarro BMGF
Scott Filler Global Fund
Iveth Gonzalez FIND
David Bell Intellectual Ventures Lab
Michelle Hsiang UCSF
Jimee Hwang UCSF
Andrea Bosman WHO
Chris Lourenco CHAI, Namibia
Satu Ntshalintshali CHAI, Swaziland
DIAMETER Field Team PATH
Mike Lynch WHO
Shahina Aboobakar MOH, Mauritius
Roly Gosling UCSF
Related Documents