Market Monitor No. 100 July 2022 Contents Feature article: WTO MC12 charts a new way forward 2 World supply-demand outlook 3 Crop monitor 5 Policy developments 8 International prices 10 Futures markets 12 Market indicators 13 Fertilizer outlook 15 Ocean freight markets 16 Explanatory notes 17 WHEAT MAIZE RICE SOYBEANS Markets at a glance Easing Neutral Tightening FROM PREVIOUS FORECASTS FROM PREVIOUS SEASON The wheat harvest is underway in the north- ern hemisphere, with hot and dry conditions impeding winter wheat yields in several major producing regions, which further confirm an expected decline in global wheat production in 2022. While maize production prospects improved this month, global maize output is also forecast to fall below last year's level. Against this background, and with exports from Ukraine still largely constrained, inter- national wheat and maize markets are ex- pected to stay tight. This means prices will remain volatile and continue to be highly sen- sitive to daily news on crop development, weather conditions and policy changes. By contrast, global rice production prospects appear strong despite high input prices while soybean output could hit a new record. The Market Monitor is a product of the Agricultural Market Information System (AMIS). It covers international markets for wheat, maize, rice and soybeans, giving a synopsis of major market developments and the policy and other market drivers behind them. The analysis is a collective assessment of the market situation and outlook by the ten international organizations and entities that form the AMIS Secretariat.

Welcome message from author
This document is posted to help you gain knowledge. Please leave a comment to let me know what you think about it! Share it to your friends and learn new things together.
Transcript
MarketMonitor
No. 100 July 2022
ContentsFeature article:WTO MC12 charts a new wayforward 2
World supply-demand outlook 3
Crop monitor 5
Policy developments 8
International prices 10
Futures markets 12
Market indicators 13
Fertilizer outlook 15
Ocean freight markets 16
Explanatory notes 17
WHEAT
MAIZE
RICE
SOYBEANS
Markets at a glanceEasingNeutralTightening
FROMPREVIOUS
FORECASTS
FROMPREVIOUSSEASON
The wheat harvest is underway in the north-
ern hemisphere, with hot and dry conditions
impeding winter wheat yields in several major
producing regions, which further confirm an
expected decline in global wheat production
in 2022. While maize production prospects
improved this month, global maize output is
also forecast to fall below last year's level.
Against this background, and with exports
from Ukraine still largely constrained, inter-
national wheat and maize markets are ex-
pected to stay tight. This means prices will
remain volatile and continue to be highly sen-
sitive to daily news on crop development,
weather conditions and policy changes. By
contrast, global rice production prospects
appear strong despite high input prices while
soybean output could hit a new record.
The Market Monitor is a product of the Agricultural Market Information System (AMIS). It covers international markets for wheat, maize, riceand soybeans, giving a synopsis of major market developments and the policy and other market drivers behind them. The analysis is a collectiveassessment of the market situation and outlook by the ten international organizations and entities that form the AMIS Secretariat.
2 AMIS Market Monitor No. 100 July 2022
Feature article
WTO MC12 charts a new way forward
At the Twelfth WTO Ministerial Conference (MC12 -Geneva, 12-17 June 2022), trade ministers delivered aconcrete package of results, demonstrating the capacityof the multilateral trading system to accommodate tai-lored responses and build resilience to enduring globalchallenges and to firmly engage in institutional reform.Risks on various fronts, including economic, geopoliti-cal, health, environmental sustainability, and food secu-rity, have underpinned significant trade disruptions, infla-tionary pressures, and excessive food price volatility, allof which have unduly affected developing countries.
For example, targeting the global health crisis that par-alyzed global supply chains and triggered consumerpanic, protectionism, and unpredictable cross-bordersupply of essential goods, a Response to the COVID-19Pandemic and Preparedness for Future Pandemics andaMinisterial Decision on the Agreement on Trade-relatedAspects of Intellectual Property Rights will ensure thatcurrent rules support the scaling-up of manufacturingcapacity and exports of COVID-19 vaccines worldwide,while preserving incentives for investment, research andtechnology transfer.
Considering the many dimensions of food security, how-ever, two ministerial outcomes stand out as being of spe-cific relevance to the AMIS community.
The first one is WTO Members' pledge to exempt WFPhumanitarian operations from export restrictions and pro-hibitions. Should countries face critical domestic foodshortages, temporary export restrictions may still be im-posed in accordance with existing disciplines. This deci-sion represents a pivotal step by WTO Members in sup-porting the Sustainable Development Goal 2 on "ZeroHunger" and a firm commitment to ensure food supplychains are functioning properly for critical relief to reachthose in need.
Recognizing the challenges faced by vulnerable foodimporting developing countries, trade ministers under-
scored the importance of open, transparent, and well-functioning food, fertilizer and energy markets in a Dec-laration on the Emergency Response to Food Insecurity.The Declaration requires emergency policies that are in-troduced to fulfill food security objectives to be notifiedand imposed with due regard to any possible impactson other Members. At the same time, WTO-consistentreleases of available surplus stocks on international mar-kets are encouraged. A dedicated work programme willbe established to initiate a more comprehensive debateon the concrete steps needed to facilitate trade and buildresilient agri-food systems in Net Food-Importing Devel-oping Countries (NFIDCs), which according to the list es-tablished by the WTO Committee on Agriculture, specif-ically includes all Least-developed Countries. Trade min-isters stressed the positive role of AMIS in enhancingmarket transparency for food security crops and foster-ing the coordination of policy responses.
The scope and systemic significance of the WTO pack-age is an important milestone. There is, however, muchunfinished business. Coming on the heels of the pan-demic and geopolitical tensions, export restrictions andprohibitions are imposed without prior notice nor con-sultation on seeds, food and fertilizers, heighteningprice volatility and fuelling inflation. Unpredictable ac-cess to such essential inputs disproportionately im-pacts NFIDCs. Constructive and sustained engagementis needed to bridge divergences on those issues that aretopping a much broader trade reform portfolio, includingexport restrictions and prohibitions; market access facili-tation; the surge of increasingly complex production- andtrade-distorting subsidies; the release of stocks in a waythat does not displace trade, particularly South-Southtrade, nor affects the food security concerns of recipientcountries; better targeted and coordinated bilateral, re-gional and multilateral financial and technical assistancemechanisms as advocated by the WTO Marrakesh De-cision on NFIDCs; as well as strengthened transparency,notification, and policy monitoring.

AMIS Market Monitor No. 100 July 2022 3
World supply-demand outlook
Whe
at
FAO-AMIS USDA IGC2021/22
est2022/23f'cast
2021/22est
2022/23f'cast
2021/22est
2022/23f'cast
2 Jun 7 Jul 10 Jun 23 Jun
Prod
. 778.3641.4
770.8634.0
770.3633.4
779.0642.1
773.4638.4
781.0643.9
769.3634.3
Supp
ly 1070.3803.0
1067.4796.7
1069.9798.0
1070.6789.5
1052.8775.9
1059.5795.2
1051.7784.6
Utiliz. 773.2
630.4
768.6630.9
770.6631.9
791.2643.2
786.0642.0
777.1636.3
778.8637.8
Trad
e 193.2183.7
188.9181.1
190.6182.8
201.2191.5
205.4195.9
194.1184.4
193.5184.1
Stoc
ks 299.6164.6
297.8157.2
299.3158.5
279.4137.5
266.8125.3
282.4149.2
272.9137.4 I
NM
ILLION
TONNES
Maize
FAO-AMIS USDA IGC2021/22
est2022/23f'cast
2021/22est
2022/23f'cast
2021/22est
2022/23f'cast
2 Jun 7 Jul 10 Jun 23 Jun
Prod
. 1210.0937.4
1187.8914.8
1195.3920.3
1216.1943.5
1185.8914.8
1218.6946.0
1189.8916.8
Supp
ly 1496.71069.9
1491.51062.7
1503.21069.3
1509.31031.1
1496.71015.5
1497.21030.3
1475.01013.9
Utiliz. 1197.1
905.2
1189.7893.3
1193.1894.7
1198.4907.4
1186.3891.3
1212.0911.9
1203.6898.4
Trad
e 182.8157.3
174.2154.2
177.3156.3
189.1166.1
183.2165.2
175.3153.8
168.3149.3
Stoc
ks 307.9149.1
300.3147.9
308.0151.6
310.9100.7
310.4106.2
285.297.0
271.496.5 I
NM
ILLION
TONNES
Rice
FAO-AMIS USDA IGC2021/22
est2022/23f'cast
2021/22est
2022/23f'cast
2021/22est
2022/23f'cast
2 Jun 7 Jul 10 Jun 23 Jun
Prod
. 522.5376.7
519.5373.4
520.5374.4
513.7364.7
515.3366.3
514.6365.6
518.1369.1
Supp
ly 714.2465.3
711.8465.1
713.2466.5
701.7436.2
702.7440.7
696.5440.3
699.2445.2
Utiliz. 522.0
370.5
522.0374.3
523.1375.4
514.4358.5
519.2362.6
515.4361.5
518.2364.8
Trad
e 53.448.5
53.949.4
54.249.7
52.947.3
54.348.3
51.146.1
51.146.1
Stoc
ks 192.792.1
191.690.4
191.790.5
187.374.3
183.474.4
181.173.8
181.075.4 I
NM
ILLION
TONNES
Soyb
ean FAO-AMIS USDA IGC
2021/22est
2022/23f'cast
2021/22est
2022/23f'cast
2021/22est
2022/23f'cast
2 Jun 7 Jul 10 Jun 23 Jun
Prod
. 350.3333.9
390.4371.0
387.5368.0
352.0335.6
395.4377.9
350.6334.2
389.8370.3
Supp
ly 401.1361.2
430.2391.7
426.5388.0
451.9404.3
481.5433.3
405.3357.6
432.9383.5
Utiliz. 367.3
254.5
377.8261.3
377.3261.1
364.6255.9
377.9262.3
362.2252.4
376.5261.4
Trad
e 155.063.0
166.767.5
166.868.3
155.963.9
170.371.3
154.262.2
166.068.5
Stoc
ks 39.020.0
51.030.0
48.327.6
86.155.4
100.568.9
43.113.2
56.524.6 I
NM
ILLION
TONNES
WHEAT production forecast for 2022 trimmed m/m with lowerproduction prospects in the EU and, to a lesser extent, Argentina andIraq outweighing upward revisions for Australia, Canada, and Russia.
Utilization in 2022/23 raised m/m but still expected to decline from the2021/22 estimated level given a likely contraction in demand for bothfeed and industrial use.
Trade 2022/23 (July/June) forecast lifted mostly on greater demand fromAsia, and larger shipments expected from Australia and Russia, but stillpointing to a slight contraction from 2021/22.
Stocks (ending in 2023) adjusted upwards m/m and forecast to remainnear opening levels as anticipated build-ups in Canada, China, Russia,and Ukraine counter drawdowns in Australia, the EU, India, andMorocco.
MAIZE 2022 production forecast raised on improved prospects inChina, India, Russia, and Ukraine, but still 1.2 percent lower than lastyear's output.Utilization in 2022/23 lifted m/m by stronger than anticipated feeddemand, but still set to decrease by 0.3 percent from 2021/22.Trade in 2022/23 (July/June) forecast to contract from the 2021/22estimated volume by 3.0 percent despite an upward revision this monthlargely driven by higher than expected demand by the EU, and largershipments from Brazil.Stocks (ending in 2023) now forecast to remain near opening levelsfollowing an upward revision this month mostly in China, stemming fromproduction revisions, but also Ukraine and the US.
RICE production in 2022 raised, mostly reflecting upward revisionsto Indian production in 2021 and 2022. By contrast, 2022 prospectswere downgraded namely for Viet Nam.
Utilization in 2022/23 forecast to exceed its year-earlier record by 1.1million tonnes, with global per caput food use seen largely steady y/yand still above pre-pandemic levels.
Trade in 2022 and 2023 marginally changed m/m, with India predictedto remain the world's largest exporter in both years, accounting fornearly 40 percent of all volumes shipped across the globe.
Stocks (2022/23 carry-out) still seen at their second highest on record,as slight downward adjustments to carry-outs in Cambodia and VietNam are compensated by an upgrade to Indian reserves.
SOYBEAN 2022/23 production lowered marginally m/m with adownward revision in the US more than offsetting a higher projection forBrazil, while global output is still forecast to rebound sharply y/y to arecord high.
Utilization in 2022/23 trimmed on lower forecasts for the US and China,entailing a 2.7 percent y/y recovery following an exceptional contractionin 2021/22.
Trade in 2022/23 (Oct/Sep) left unchanged m/m, with reduced exportprospects from the US compensated by higher shipments from Brazil.
Stocks (2022/23 carry-out) scaled down moderately, mainly reflectingreductions in the US. Although global ending stocks are seenrebounding by more than 20 percent y/y, the stocks-to-use ratio wouldremain below the 5-year average.
+i World BalancesData shown in the second rows refer to world aggregates without China; world trade data refer to exports; and world trade without China excludes exports to China.To review and compare data, by country and commodity, across three main sources, go to https://app.amis-outlook.org/#/market-database/compare-sourcesEstimates and forecasts may differ across sources for many reasons, including different methodologies. For more information see Explanatory notes on the lastpage of this report.

4 AMIS Market Monitor No. 100 July 2022
World supply-demand outlook
Revisions (FAO-AMIS) to 2021/22 forecasts since the previous reportProd
uctio
n
Impo
rts
Utilization
Expo
rts
Stoc
ks
Prod
uctio
n
Impo
rts
Utilization
Expo
rts
Stoc
ks
Prod
uctio
n
Impo
rts
Utilization
Expo
rts
Stoc
ks
Prod
uctio
n
Impo
rts
Utilization
Expo
rts
Stoc
ks
-513 1708 2028 1700 1529 7473 3087 3416 3087 7723 1018 325 1075 300 102 -2950 67 -516 48 -2613
641 402 2353 1790 -896 7815 3600 3655 3037 7152 1015 320 1073 300 232 -2950 67 -514 48 -2613
-1500 - -200 -500 -1800 - - - - - - - - - - - 200 - 70 -100
2354 - 110 1500 627 19 - 19 - - -6 - -6 - - 13 - 13 - -
221 - 21 200 - 635 - -1365 2000 -1000 -65 - 5 - - 1000 100 200 1100 100
1934 - 984 500 300 710 - 10 250 150 - - - - - - - - - -
- - 1000 - 310 2000 1000 2000 - 4000 - - - - - - -700 -400 - -300
385 - - - 385 169 - 169 - - - - - - - - 200 120 - 80
-5720 - -993 -1000 -1681 -965 3000 1798 287 750 -3 - -3 - - 67 - 38 28 -
910 2 409 -500 1000 1000 - 800 - -1 1531 - 1131 300 400 100 50 150 - 50
- 700 675 70 800 - - 300 - -100 - - - - - -50 250 -10 - 210
- - - - - - - - - - - - - - - - - - - -
-300 -300 - - -1200 - - - - 7 - - - - - - - - - -
145 - 145 - - -480 - -480 - - - - - - - - - - - -
- - - - - - - - - - - - - - - - - - - -
- 100 80 20 - 100 -100 50 - -150 - - - - - - - - - -
- - 100 - - - - - - -300 - - - - - - - - - -
1500 - - 1500 - 1000 - 300 500 200 - - - - - - - - - -
- - - - - - - - - - - - - - - - - - - -
- - - - - -54 - -54 - - - - - - - - - - - -
- - - - - - - - - - - 20 - - - - - - - -
500 - - - 500 681 -300 -19 - 400 - - - - - - - - - -
- - - - - 3000 - - - 2000 - - - - - 200 - 200 - -
- -100 23 - -400 - - - - 180 - - - - - - - - - -
212 - -1 - 213 - - 127 - 1016 - - -32 - 32 -4280 - -790 -1150 -2630
- - - - 50 - - - - - -442 300 -22 - -200 - -33 -35 - -23
WHEAT MAIZE RICE SOYBEANS
WORLD
Total AMIS
Argentina
Australia
Brazil
Canada
China Mainland
Egypt
EU
India
Indonesia
Japan
Kazakhstan
Mexico
Nigeria
Philippines
Rep. of Korea
Russian Fed.
Saudi Arabia
South Africa
Thailand
Turkey
Ukraine
UK
US
Viet Nam
In thousand tonnes
+i NoteOnly significant changes (of more than 1 000 tonnes) are displayed in the table.
AMIS Market Monitor No. 100 July 2022 5
Crop monitor
Crop conditions in AMIS countries
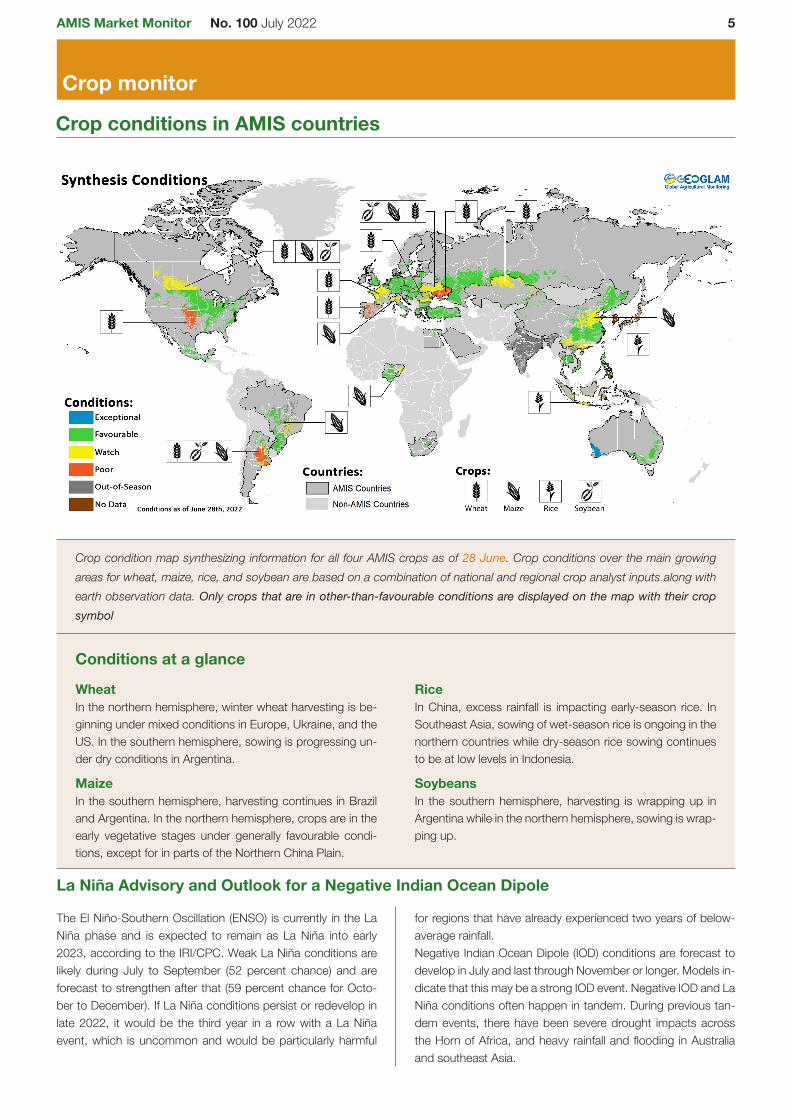
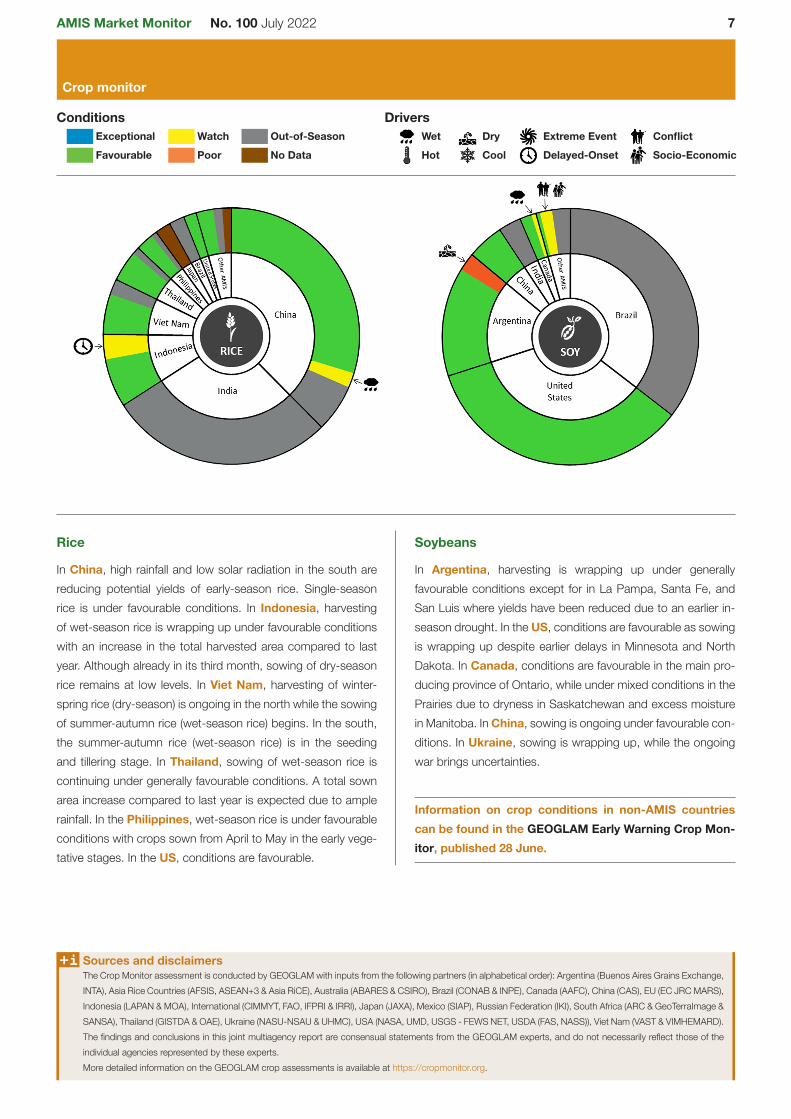
Crop condition map synthesizing information for all four AMIS crops as of 28 June. Crop conditions over the main growingareas for wheat, maize, rice, and soybean are based on a combination of national and regional crop analyst inputs along withearth observation data. Only crops that are in other-than-favourable conditions are displayed on the map with their cropsymbol
Conditions at a glance
WheatIn the northern hemisphere, winter wheat harvesting is be-ginning under mixed conditions in Europe, Ukraine, and theUS. In the southern hemisphere, sowing is progressing un-der dry conditions in Argentina.
MaizeIn the southern hemisphere, harvesting continues in Braziland Argentina. In the northern hemisphere, crops are in theearly vegetative stages under generally favourable condi-tions, except for in parts of the Northern China Plain.
RiceIn China, excess rainfall is impacting early-season rice. InSoutheast Asia, sowing of wet-season rice is ongoing in thenorthern countries while dry-season rice sowing continuesto be at low levels in Indonesia.
SoybeansIn the southern hemisphere, harvesting is wrapping up inArgentina while in the northern hemisphere, sowing is wrap-ping up.
La Niña Advisory and Outlook for a Negative Indian Ocean Dipole
The El Niño-Southern Oscillation (ENSO) is currently in the LaNiña phase and is expected to remain as La Niña into early2023, according to the IRI/CPC. Weak La Niña conditions arelikely during July to September (52 percent chance) and areforecast to strengthen after that (59 percent chance for Octo-ber to December). If La Niña conditions persist or redevelop inlate 2022, it would be the third year in a row with a La Niñaevent, which is uncommon and would be particularly harmful
for regions that have already experienced two years of below-average rainfall.Negative Indian Ocean Dipole (IOD) conditions are forecast todevelop in July and last through November or longer. Models in-dicate that this may be a strong IOD event. Negative IOD and LaNiña conditions often happen in tandem. During previous tan-dem events, there have been severe drought impacts acrossthe Horn of Africa, and heavy rainfall and flooding in Australiaand southeast Asia.

6 AMIS Market Monitor No. 100 July 2022
Crop monitor
Summaries by crop
Wheat
In the EU, hot and dry weather is impacting France, Spain,Portugal, and Romania, while the rest of Europe remains underfavourable conditions. In the United Kingdom, conditions arefavourable. In Ukraine, hot and dry conditions have acceler-ated grain ripening and brought about harvesting in the south.However, the ongoing war has reduced the area that can beharvested in and near the conflict zones. In the Russian Fed-eration, conditions remain favourable for winter wheat goinginto harvest. Spring wheat conditions have been supported byrecent rainfall. In Turkey, conditions are favourable. In China,harvesting has begun for winter wheat, while spring wheat de-velopment continues. In the US, harvesting of winter wheatis ongoing under mixed conditions as prolonged dryness inthe central and southern Great Plains has impacted yields.Spring wheat conditions are favourable, albeit developmentallydelayed. In Canada, spring and winter wheat conditions aremixed in the Prairies due to excess rainfall in the east and drycondition across the rest of the region. In Australia, conditionsare favourable; however, extremely wet conditions across partsof northern New South Wales and southern Queensland aredelaying sowing activities. In Argentina, sowing is being ham-pered by dry conditions throughout the country.
Maize
In Argentina, harvesting of the early-planted crop (larger sea-son) and the late-planted crop (smaller season) is continuingunder mixed conditions as drought from December to Januaryhas reduced the yields of the early-planted crop. In Brazil, har-vesting of the summer-planted crop (larger season) is beginningunder mixed conditions due to a lack of rain, particularly in theSoutheast regions. In the US, conditions are favourable acrossthe country, despite earlier sowing delays in the northern CornBelt. InCanada, conditions are favourable in the east andmixedin the Prairies. In Mexico, conditions are favourable for boththe harvesting of the autumn-winter crop (smaller season) andthe continued sowing of the spring-summer season (larger sea-son). In the EU, conditions are generally favourable, except forhot and dry conditions in northern Italy. In Ukraine, conditionsfor working in the fields remain mixed due to the uncertaintiesof the ongoing war. There is a reduction in the total sown areacompared to last year. In the Russian Federation, conditionsare favourable. In China, spring-planted maize is maturing inthe south, while hot and dry conditions in parts of the NorthernChina Plain are slowing development. Summer-planted maizeis sowing.
Exceptional Watch Out-of-Season
Favourable Poor No Data
Wet Dry Extreme Event Conflict
Hot Cool Delayed-Onset Socio-Economic
Conditions Drivers
+i Pie chart descriptionEach slice represents a country's share of total AMIS production (5-year average), with the main producing countries (95 percent of production) shown individuallyand the remaining 5 percent grouped into the "Other AMIS Countries" category. Sections within each country are weighted by the sub-national production statistics(5-year average) of the respective country and account for multiple cropping seasons (i.e. spring and winter wheat). The late vegetative to reproductive crop growthstages are generally the most sensitive periods for crop development.
AMIS Market Monitor No. 100 July 2022 7
Crop monitor
Rice
In China, high rainfall and low solar radiation in the south arereducing potential yields of early-season rice. Single-seasonrice is under favourable conditions. In Indonesia, harvestingof wet-season rice is wrapping up under favourable conditionswith an increase in the total harvested area compared to lastyear. Although already in its third month, sowing of dry-seasonrice remains at low levels. In Viet Nam, harvesting of winter-spring rice (dry-season) is ongoing in the north while the sowingof summer-autumn rice (wet-season rice) begins. In the south,the summer-autumn rice (wet-season rice) is in the seedingand tillering stage. In Thailand, sowing of wet-season rice iscontinuing under generally favourable conditions. A total sownarea increase compared to last year is expected due to amplerainfall. In the Philippines, wet-season rice is under favourableconditions with crops sown from April to May in the early vege-tative stages. In the US, conditions are favourable.
Soybeans
In Argentina, harvesting is wrapping up under generallyfavourable conditions except for in La Pampa, Santa Fe, andSan Luis where yields have been reduced due to an earlier in-season drought. In the US, conditions are favourable as sowingis wrapping up despite earlier delays in Minnesota and NorthDakota. In Canada, conditions are favourable in the main pro-ducing province of Ontario, while under mixed conditions in thePrairies due to dryness in Saskatchewan and excess moisturein Manitoba. InChina, sowing is ongoing under favourable con-ditions. In Ukraine, sowing is wrapping up, while the ongoingwar brings uncertainties.
Information on crop conditions in non-AMIS countriescan be found in the GEOGLAM Early Warning Crop Mon-itor, published 28 June.
Exceptional Watch Out-of-Season
Favourable Poor No Data
Wet Dry Extreme Event Conflict
Hot Cool Delayed-Onset Socio-Economic
Conditions Drivers
+i Sources and disclaimersThe Crop Monitor assessment is conducted by GEOGLAM with inputs from the following partners (in alphabetical order): Argentina (Buenos Aires Grains Exchange,INTA), Asia Rice Countries (AFSIS, ASEAN+3 & Asia RiCE), Australia (ABARES & CSIRO), Brazil (CONAB & INPE), Canada (AAFC), China (CAS), EU (EC JRCMARS),Indonesia (LAPAN & MOA), International (CIMMYT, FAO, IFPRI & IRRI), Japan (JAXA), Mexico (SIAP), Russian Federation (IKI), South Africa (ARC & GeoTerraImage &SANSA), Thailand (GISTDA & OAE), Ukraine (NASU-NSAU & UHMC), USA (NASA, UMD, USGS - FEWS NET, USDA (FAS, NASS)), Viet Nam (VAST & VIMHEMARD).The findings and conclusions in this joint multiagency report are consensual statements from the GEOGLAM experts, and do not necessarily reflect those of theindividual agencies represented by these experts.More detailed information on the GEOGLAM crop assessments is available at https://cropmonitor.org.
8 AMIS Market Monitor No. 100 July 2022
Policy developments
Wheat
In a context of soaring prices, Egypt allowed the importa-tion of wheat with a moisture level of up to 14 percent as of1 June for a one-year period. To facilitate supply conditions,on 24 May the International Islamic Trade Finance Corpora-tion had also doubled the credit limit for wheat imports toUSD 6 billion.
After banning exports of several agricultural products inMarch (Decree No. 141/2022) and excluding spaghetti pastafrom this export restriction in May, on 1 June Egypt excludeddurum wheat semolina flour from the measure, provided thatsuch exports are solely carried out by three designated fac-tories. On 8 June, the revised export ban was extended bythree months while the exportation of staples was made sub-ject to approval by the Ministry of Supply.
On 15 June, Kazakhstan extended the two export quotasfor wheat and wheat flour, which were initially set to expire on15 June, until 30 September. Furthermore, export quota vol-umes were expanded by 55 000 metric tonnes to 1 550 000metric tonnes for wheat; and by 370 000 metric tonnes to670 000 metric tonnes for wheat flour.
On 30 June, the Ministry of Economy of the Russian Fed-eration changed its formula for calculating export taxes ongrains and sunflower by-products by using base prices ex-pressed in roubles: RUB 15 000 (USD 273) per tonne forwheat, RUB 13 875 (252 USD) per tonne for barley andmaize, RUB 82500 (USD 1500) per tonne for sunflower andRUB 13875 (USD 252) per tonne for sunflower meal. USDwill be converted to RUB based on the 5 business day av-erage of the exchange rate determined by the Central Bankof the Russian Federation. The Ministry indicated that the re-vision of the formula is aimed at reducing the impact of therouble-dollar exchange rate on the size of the export taxesand supporting exports while ensuring the stability of domes-tic prices.
Rice
On 8 June, India increased the minimum support prices of14 kharif crops for the 2022-23 crop year. Support pricesfor the common grade variety of paddy increased from INR1940 per quintal (USD 249 per tonne) to INR 2040 per quin-tal (USD 265 per tonne). In the case of 'A' grade variety ofpaddy, support prices were increased from INR 1960 perquintal (USD 252 per tonne) to INR 2060 per quintal (USD265 per tonne).
Biofuels
With growing domestic demand for diesel, on 21 June Ar-gentina increased the biodiesel blending requirement to 7.5percent for a 60-day duration, up from 5 percent previously.The mandatory status and the effective date of this new re-quirement are not specified in the regulation.
On 7 June, the EU Parliament's Environment Committeevoted to limit crop-based biofuels to no more than half theshare of total biofuel use in transport; phase out palm andsoya-based biofuels by 2023; and exclude primary woodybiomass from the calculation of renewable energy targets.
On 13 June, the EU Commission approved ImplementingDecision 2022/602 instituting the International Sustainabilityand Carbon Certification scheme to guarantee that biocom-ponents used in liquid fuel by all supply chain stakeholdersconform to relevant sustainability criteria.
As part of broader efforts to advance the use of bioenergyand reach a net zero-carbon economy by 2050, on 1 JunetheUS announced a USD 59 million scheme designed to ac-celerate the production of biofuels and bioproducts throughapplied research and cost efficiency improvements, includingthrough industry partnerships.
On 3 June, the US announced an allocation of USD 700 mil-lion under the Biofuel Producer Program to support produc-ers who faced unexpected market losses due to the COVID-19 pandemic. The investments are intended to improve thestrength and resilience of sustainable fuel markets and in-clude more than USD 486 million to assist eligible agriculturalproducers of maize, soybean or biomass.
On 16 June, the House of Representatives in the US votedin favour of the Lower Food and Fuel Costs Act, a legisla-tive package that includes funding for biofuel infrastructureand a provision to allow year-round sales of E15 (H.R. 7606).The bill authorizes USD 200 million for fiscal years 2022 and2023 to support biofuel infrastructure upgrades to increasethe distribution of fuel blends containing more than 10 per-cent ethanol or more than 20 percent biodiesel.
Across the board
Trade facilitation
To reduce inflationary pressure, Brazil announced a 10 per-cent cut in import duties for goods representing approxi-mately 87 percent of merchandise imports. The cut will re-main in effect between 1 June 2022 and 31 December 2023.
On 1 June, India slashed the base import prices of crudeand refined palm oil, while raising the price of crude soybeanoil. Base import prices of edible oils are revised every two
Policy developments
AMIS Market Monitor No. 100 July 2022 9
Policy developments
weeks and used as reference parameters to calculate thelevel of applicable import duties.
On 7 June, Indonesia reduced the export tax and levy rateson crude palm oil from USD 575 per tonne to USD 488 pertonne with immediate effect. An export acceleration schemewas launched to ship at least 1 million tonnes of crude palmoil and derivatives until 31 July. Circular Number 16 of 2022makes provision for setting up a larger export quota if re-quired. On 10 June, Indonesia relaxed rules to allow morecompanies to export palm oil. This last policy change willease bottlenecks and reduce high palm oil inventories thathave prevented refiners from buying more palm fruits fromfarmers.
On 3 June, through Executive Order 171/Series of 2022,the Philippines reduced MFN tariffs for products like maize(from 35-50 percent to 5-15 percent) and rice imported fromoutside Southeast Asia (from 40-50 percent to 35 percent).The cuts will remain in effect until 31 December 2022.
On 22 June, members of the Eurasian Economic Union (in-cluding Kazakhstan and the Russian Federation) agreedon the free circulation of a number of sensitive productswithin the union borders until 30 September 2024. Prod-uct coverage includes wheat and meslin, barley, maize, sun-flower seeds, sunflower oil, and sugar. Exports to third coun-tries outside the EAEU will continue complying with estab-lished export control requirements.
In efforts to curb shipping costs and consumer price inflation,the US enacted the Ocean Shipping Reform Act of 2022 on16 June (Public Law 117-146). The new law enhances theinvestigatory authority of the US Federal Maritime Commis-sion to improve the oversight, monitoring and transparencyof ocean shipping and business practices by cargo vessels.As part of the new regulations, the law prohibits ocean car-riers, marine terminal operators, or ocean transportation in-termediaries from unreasonably refusing cargo space whenavailable or resorting to other unfair or unjustly discriminatorymethods. This is expected to gradually clear the export back-logs which have been disrupting maritime supply chains.
Climate change
On 22 June, the EU supported the amendments to the EU'sEmissions Trading System (ETS). Notably, free CO2 permitsfor industries are to be phased out by 2032 and the scope ofEU's carbon markets will be expanded to cover all emissionsfrom international shipping to and from the EU from 2027.
On 22 June, the EU overhauled existing rules on the sus-tainable use of pesticides (Directive 2009/128/EC). EU mem-ber States are expected to adopt binding targets within EU's
overall target to halve the use of hazardous pesticides by2030 in accordance with a specific calculation methodology.The measure is expected to provide long term food securityby helping farmers produce quality crops in harmony with na-ture whilst relying on scientific knowledge as well as haltingthe decline of bees and other pollinators.
Support to food systems
To enhance food security, strengthen economic resilience,and support efforts aimed at building secure wheat stocksand alleviating the adverse impacts of the Russian-Ukrainianwar, on 23 June Egypt announced the receipt of devel-opment funds USD 500 million granted by the World BankGroup.
On 1 June, the US announced USD 2.1 billion in funding tosupport food supply systems exposed during the COVID-19pandemic and the aftermath of Black Sea conflict. The in-vestments, drawn from the American Rescue Plan Act andother relief legislation, include USD 900 million for food pro-cessing workforce training and supply chain infrastructure,USD 550 million for small food businesses and reducingfood waste, USD 375 million for organic and urban agricul-ture projects, and USD 370 million to boost public accessto healthy food. USDA will use USD 400 million to establishregional food business centres that will provide technical as-sistance to small and midsize food and farm businesses.
Stop press
On 17 May, Mexico implemented a series of measures tohelp soften the impact of inflation on its economy, includ-ing a one-year suspension of import tariffs for 66 tariff lines,among which paddy rice. Additionally, the government an-nounced plans to control basic food basket prices througha voluntary agreement with the private sector to refrain fromprice manipulation and to offer goods, such as rice, at fairconsumer prices.
On 14 May, the Philippines launched the Fuel DiscountVoucher Program for maize. Fuel discount cash cards con-taining PHP 3000 (USD 56) were distributed to the RegistrySystem for Basic Sectors in Agriculture-listed maize farmers.A total of PHP 500 million (USD 9.3 million) was allocated tomaize producers who own and operate agricultural machin-ery either individually or through a farm organization, cooper-ative or association. This subsidy must only be used to buygasoline or diesel from the participating or accredited gaso-line stations.
+i NoteOnly AMIS participants are marked in bold.
10 AMIS Market Monitor No. 100 July 2022
International prices
M/M Y/Y
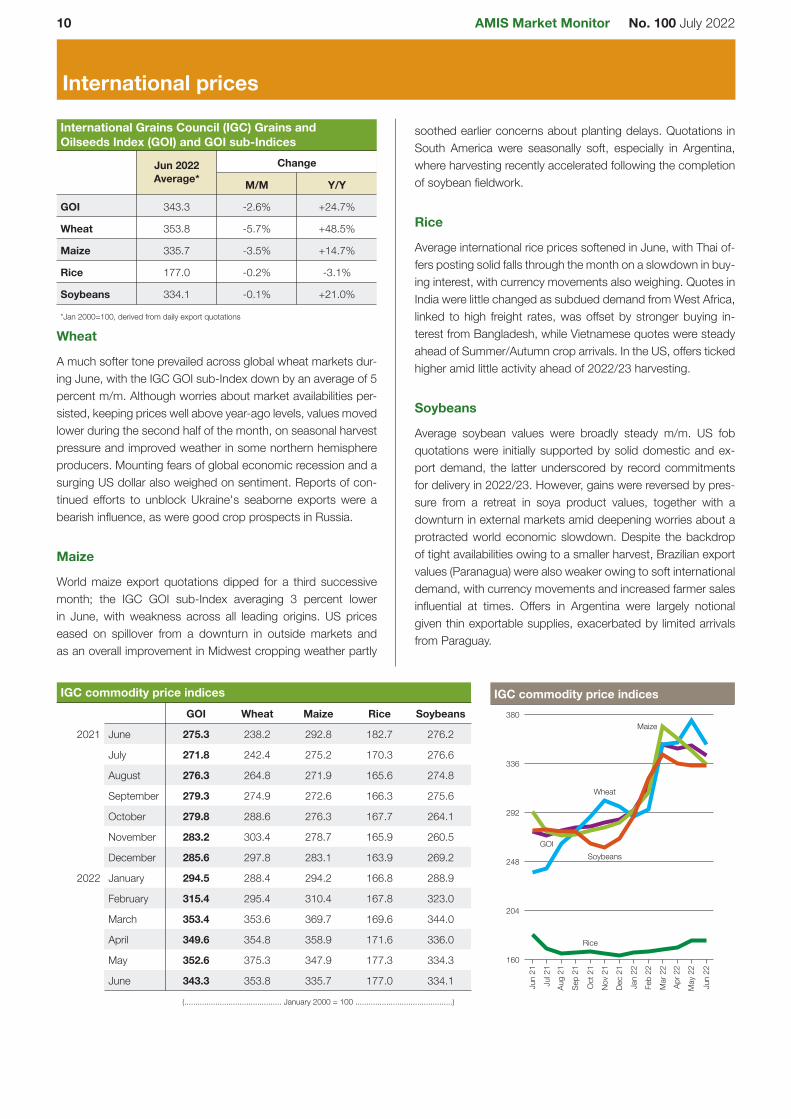
GOI 343.3 -2.6% +24.7%
Wheat 353.8 -5.7% +48.5%
Maize 335.7 -3.5% +14.7%
Rice 177.0 -0.2% -3.1%
Soybeans 334.1 -0.1% +21.0%
International Grains Council (IGC) Grains andOilseeds Index (GOI) and GOI sub-Indices
Jun 2022Average*
Change
*Jan 2000=100, derived from daily export quotations
Wheat
A much softer tone prevailed across global wheat markets dur-ing June, with the IGC GOI sub-Index down by an average of 5percent m/m. Although worries about market availabilities per-sisted, keeping prices well above year-ago levels, values movedlower during the second half of the month, on seasonal harvestpressure and improved weather in some northern hemisphereproducers. Mounting fears of global economic recession and asurging US dollar also weighed on sentiment. Reports of con-tinued efforts to unblock Ukraine's seaborne exports were abearish influence, as were good crop prospects in Russia.
Maize
World maize export quotations dipped for a third successivemonth; the IGC GOI sub-Index averaging 3 percent lowerin June, with weakness across all leading origins. US priceseased on spillover from a downturn in outside markets andas an overall improvement in Midwest cropping weather partly
soothed earlier concerns about planting delays. Quotations inSouth America were seasonally soft, especially in Argentina,where harvesting recently accelerated following the completionof soybean fieldwork.
Rice
Average international rice prices softened in June, with Thai of-fers posting solid falls through the month on a slowdown in buy-ing interest, with currency movements also weighing. Quotes inIndia were little changed as subdued demand from West Africa,linked to high freight rates, was offset by stronger buying in-terest from Bangladesh, while Vietnamese quotes were steadyahead of Summer/Autumn crop arrivals. In the US, offers tickedhigher amid little activity ahead of 2022/23 harvesting.
Soybeans
Average soybean values were broadly steady m/m. US fobquotations were initially supported by solid domestic and ex-port demand, the latter underscored by record commitmentsfor delivery in 2022/23. However, gains were reversed by pres-sure from a retreat in soya product values, together with adownturn in external markets amid deepening worries about aprotracted world economic slowdown. Despite the backdropof tight availabilities owing to a smaller harvest, Brazilian exportvalues (Paranagua) were also weaker owing to soft internationaldemand, with currency movements and increased farmer salesinfluential at times. Offers in Argentina were largely notionalgiven thin exportable supplies, exacerbated by limited arrivalsfrom Paraguay.
GOI Wheat Maize Rice Soybeans
2021 June 275.3 238.2 292.8 182.7 276.2
July 271.8 242.4 275.2 170.3 276.6
August 276.3 264.8 271.9 165.6 274.8
September 279.3 274.9 272.6 166.3 275.6
October 279.8 288.6 276.3 167.7 264.1
November 283.2 303.4 278.7 165.9 260.5
December 285.6 297.8 283.1 163.9 269.2
2022 January 294.5 288.4 294.2 166.8 288.9
February 315.4 295.4 310.4 167.8 323.0
March 353.4 353.6 369.7 169.6 344.0
April 349.6 354.8 358.9 171.6 336.0
May 352.6 375.3 347.9 177.3 334.3
June 343.3 353.8 335.7 177.0 334.1
IGC commodity price indices
(............................................ January 2000 = 100 ............................................)
Jun21
Jul21
Aug21
Sep21
Oct21
Nov21
Dec21
Jan22
Feb22
Mar
22Ap
r22
May
22
Jun22
160
204
248
292
336
380
GOI
Wheat
Maize
Rice
Soybeans
IGC commodity price indices
AMIS Market Monitor No. 100 July 2022 11
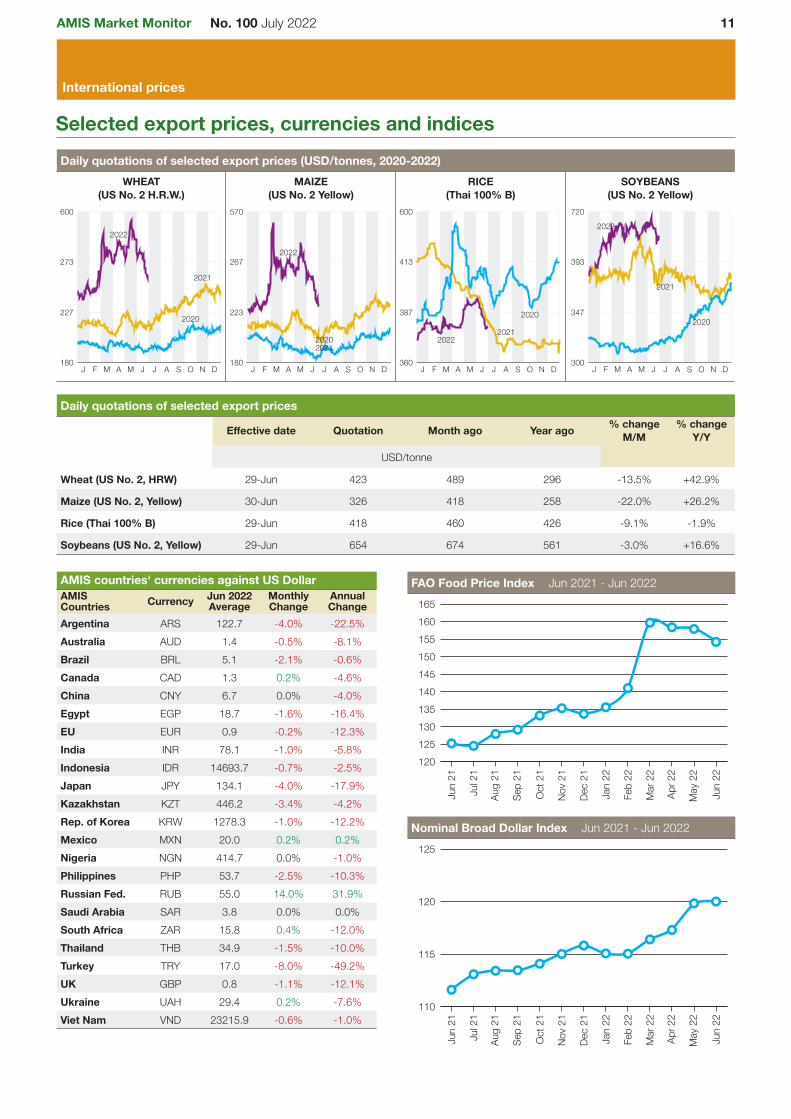
International prices
Selected export prices, currencies and indices
J F M A M J J A S O N D180
227
273
600
2022
2020
2021
J F M A M J J A S O N D180
223
267
570
2022
20202021
J F M A M J J A S O N D360
387
413
600
2022
2020
2021
J F M A M J J A S O N D300
347
393
7202022
2020
2021
Daily quotations of selected export prices (USD/tonnes, 2020-2022)WHEAT
(US No. 2 H.R.W.)MAIZE
(US No. 2 Yellow)RICE
(Thai 100% B)SOYBEANS
(US No. 2 Yellow)
Wheat (US No. 2, HRW) 29-Jun 423 489 296 -13.5% +42.9%
Maize (US No. 2, Yellow) 30-Jun 326 418 258 -22.0% +26.2%
Rice (Thai 100% B) 29-Jun 418 460 426 -9.1% -1.9%
Soybeans (US No. 2, Yellow) 29-Jun 654 674 561 -3.0% +16.6%
Daily quotations of selected export prices
Effective date Quotation Month ago Year ago % changeM/M
% changeY/Y
USD/tonne
Argentina ARS 122.7 -4.0% -22.5%Australia AUD 1.4 -0.5% -8.1%Brazil BRL 5.1 -2.1% -0.6%Canada CAD 1.3 0.2% -4.6%China CNY 6.7 0.0% -4.0%Egypt EGP 18.7 -1.6% -16.4%EU EUR 0.9 -0.2% -12.3%India INR 78.1 -1.0% -5.8%Indonesia IDR 14693.7 -0.7% -2.5%Japan JPY 134.1 -4.0% -17.9%Kazakhstan KZT 446.2 -3.4% -4.2%Rep. of Korea KRW 1278.3 -1.0% -12.2%Mexico MXN 20.0 0.2% 0.2%Nigeria NGN 414.7 0.0% -1.0%Philippines PHP 53.7 -2.5% -10.3%Russian Fed. RUB 55.0 14.0% 31.9%Saudi Arabia SAR 3.8 0.0% 0.0%South Africa ZAR 15.8 0.4% -12.0%Thailand THB 34.9 -1.5% -10.0%Turkey TRY 17.0 -8.0% -49.2%UK GBP 0.8 -1.1% -12.1%Ukraine UAH 29.4 0.2% -7.6%Viet Nam VND 23215.9 -0.6% -1.0%
AMIS countries' currencies against US DollarAMISCountries Currency Jun 2022
AverageMonthlyChange
AnnualChange
FAO Food Price Index Jun 2021 - Jun 2022
Jun21
Jul21
Aug21
Sep21
Oct21
Nov21
Dec21
Jan22
Feb22
Mar
22
Apr2
2
May
22
Jun22
120125130135140145150155160165
Nominal Broad Dollar Index Jun 2021 - Jun 2022
Jun21
Jul21
Aug21
Sep21
Oct21
Nov21
Dec21
Jan22
Feb22
Mar
22
Apr2
2
May
22
Jun22
110
115
120
125
12 AMIS Market Monitor No. 100 July 2022
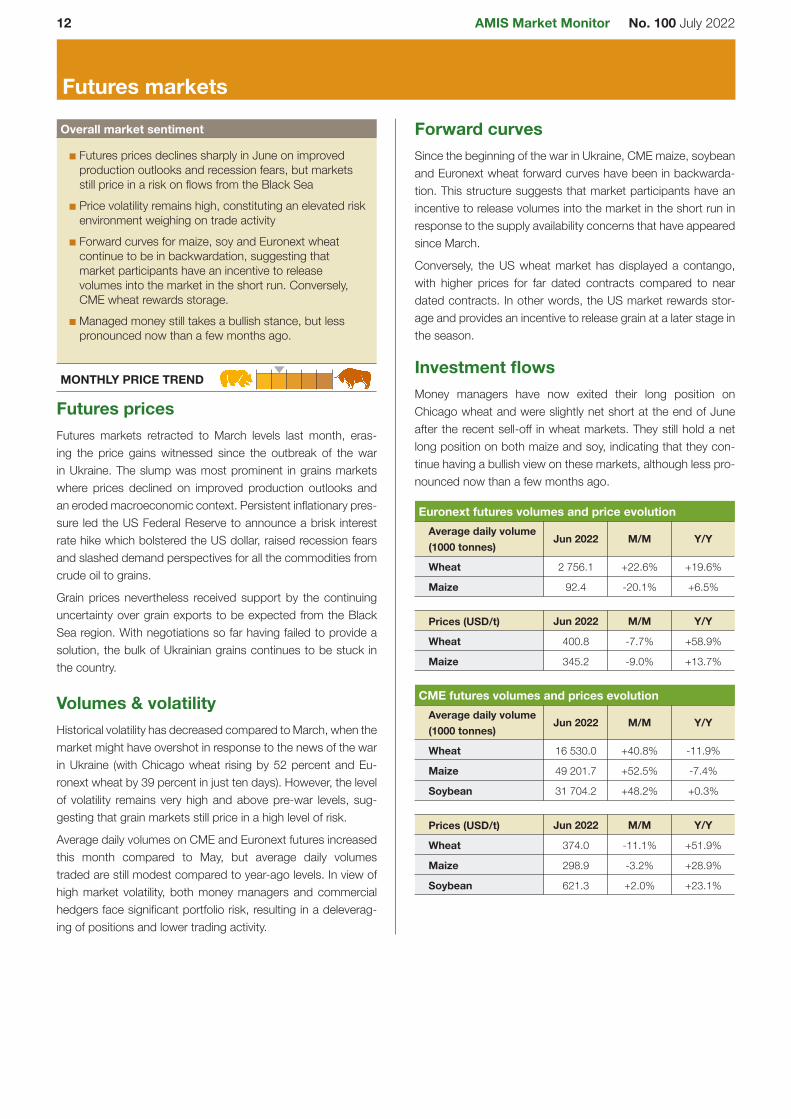
Futures markets
Futures prices declines sharply in June on improvedproduction outlooks and recession fears, but marketsstill price in a risk on flows from the Black SeaPrice volatility remains high, constituting an elevated riskenvironment weighing on trade activityForward curves for maize, soy and Euronext wheatcontinue to be in backwardation, suggesting thatmarket participants have an incentive to releasevolumes into the market in the short run. Conversely,CME wheat rewards storage.Managed money still takes a bullish stance, but lesspronounced now than a few months ago.
MONTHLY PRICE TREND
Overall market sentiment
Futures pricesFutures markets retracted to March levels last month, eras-ing the price gains witnessed since the outbreak of the warin Ukraine. The slump was most prominent in grains marketswhere prices declined on improved production outlooks andan eroded macroeconomic context. Persistent inflationary pres-sure led the US Federal Reserve to announce a brisk interestrate hike which bolstered the US dollar, raised recession fearsand slashed demand perspectives for all the commodities fromcrude oil to grains.
Grain prices nevertheless received support by the continuinguncertainty over grain exports to be expected from the BlackSea region. With negotiations so far having failed to provide asolution, the bulk of Ukrainian grains continues to be stuck inthe country.
Volumes & volatilityHistorical volatility has decreased compared to March, when themarket might have overshot in response to the news of the warin Ukraine (with Chicago wheat rising by 52 percent and Eu-ronext wheat by 39 percent in just ten days). However, the levelof volatility remains very high and above pre-war levels, sug-gesting that grain markets still price in a high level of risk.
Average daily volumes on CME and Euronext futures increasedthis month compared to May, but average daily volumestraded are still modest compared to year-ago levels. In view ofhigh market volatility, both money managers and commercialhedgers face significant portfolio risk, resulting in a deleverag-ing of positions and lower trading activity.
Forward curvesSince the beginning of the war in Ukraine, CME maize, soybeanand Euronext wheat forward curves have been in backwarda-tion. This structure suggests that market participants have anincentive to release volumes into the market in the short run inresponse to the supply availability concerns that have appearedsince March.
Conversely, the US wheat market has displayed a contango,with higher prices for far dated contracts compared to neardated contracts. In other words, the US market rewards stor-age and provides an incentive to release grain at a later stage inthe season.
Investment flowsMoney managers have now exited their long position onChicago wheat and were slightly net short at the end of Juneafter the recent sell-off in wheat markets. They still hold a netlong position on both maize and soy, indicating that they con-tinue having a bullish view on these markets, although less pro-nounced now than a few months ago.
Jun 2022 M/M Y/Y
Wheat 2 756.1 +22.6% +19.6%
Maize 92.4 -20.1% +6.5%
Euronext futures volumes and price evolutionAverage daily volume(1000 tonnes)
Jun 2022 M/M Y/Y
Wheat 400.8 -7.7% +58.9%
Maize 345.2 -9.0% +13.7%
Prices (USD/t)
Jun 2022 M/M Y/Y
Wheat 16 530.0 +40.8% -11.9%
Maize 49 201.7 +52.5% -7.4%
Soybean 31 704.2 +48.2% +0.3%
CME futures volumes and prices evolutionAverage daily volume(1000 tonnes)
Jun 2022 M/M Y/Y
Wheat 374.0 -11.1% +51.9%
Maize 298.9 -3.2% +28.9%
Soybean 621.3 +2.0% +23.1%
Prices (USD/t)
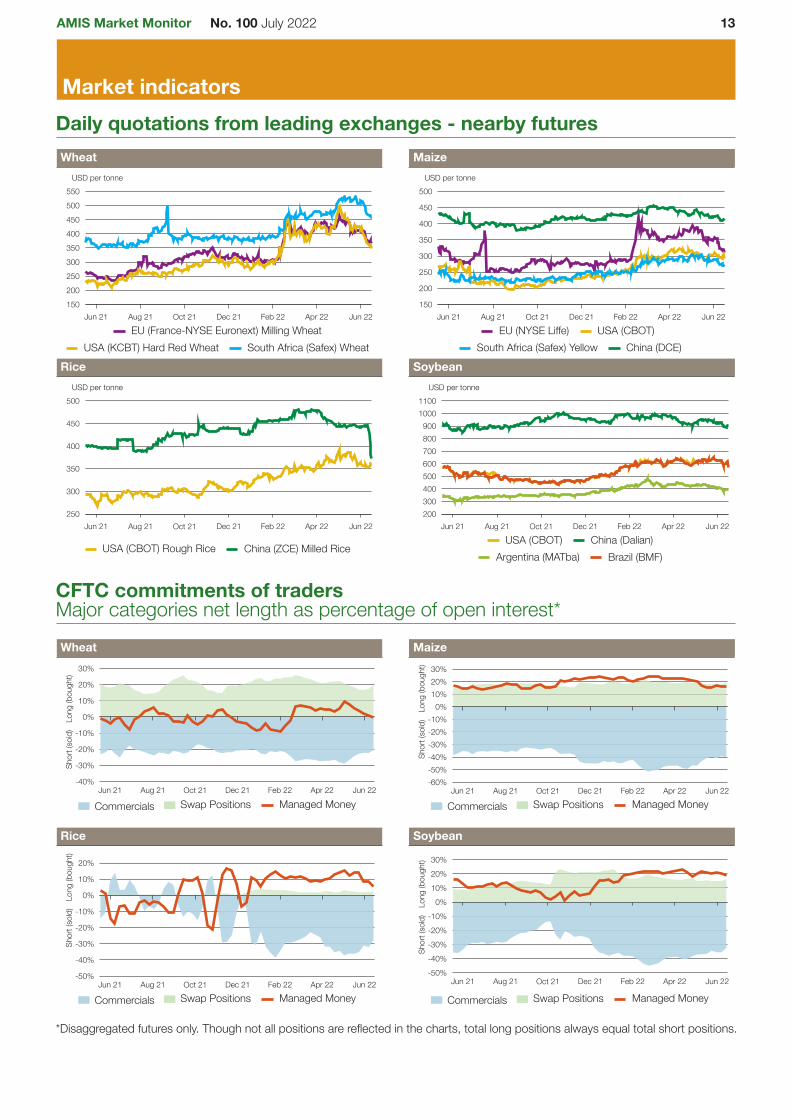
AMIS Market Monitor No. 100 July 2022 13
Market indicatorsDaily quotations from leading exchanges - nearby futures
Jun 21 Aug 21 Oct 21 Dec 21 Feb 22 Apr 22 Jun 22150200250300350400450500550USD per tonne
Jun 21 Aug 21 Oct 21 Dec 21 Feb 22 Apr 22 Jun 22150
200
250
300
350
400
450
500USD per tonne
Jun 21 Aug 21 Oct 21 Dec 21 Feb 22 Apr 22 Jun 22250
300
350
400
450
500USD per tonne
Jun 21 Aug 21 Oct 21 Dec 21 Feb 22 Apr 22 Jun 22200300400500600700800900
10001100
USD per tonne
Wheat Maize
EU (France-NYSE Euronext) Milling WheatUSA (KCBT) Hard Red Wheat South Africa (Safex) Wheat
EU (NYSE Liffe) USA (CBOT)South Africa (Safex) Yellow China (DCE)
Rice Soybean
USA (CBOT) Rough Rice China (ZCE) Milled RiceUSA (CBOT) China (Dalian)
Argentina (MATba) Brazil (BMF)
CFTC commitments of tradersMajor categories net length as percentage of open interest*
Jun 21 Aug 21 Oct 21 Dec 21 Feb 22 Apr 22 Jun 22-40%
-30%
-20%
-10%
0%
10%
20%
30%
Long
(bought)
Short(sold)
Jun 21 Aug 21 Oct 21 Dec 21 Feb 22 Apr 22 Jun 22-60%-50%-40%-30%-20%-10%0%
10%20%30%
Long
(bought)
Short(sold)
Wheat Maize
Commercials Swap Positions Managed Money Commercials Swap Positions Managed Money
Jun 21 Aug 21 Oct 21 Dec 21 Feb 22 Apr 22 Jun 22-50%
-40%
-30%
-20%
-10%
0%
10%
20%
Long
(bought)
Short(sold)
Jun 21 Aug 21 Oct 21 Dec 21 Feb 22 Apr 22 Jun 22-50%-40%-30%-20%-10%0%
10%20%30%
Long
(bought)
Short(sold)
Rice Soybean
Commercials Swap Positions Managed Money Commercials Swap Positions Managed Money
*Disaggregated futures only. Though not all positions are reflected in the charts, total long positions always equal total short positions.

14 AMIS Market Monitor No. 100 July 2022
Market indicators
Forward curves
260280300320340360380400420EUR per tonne
Sep22
Oct22
Nov22
Dec22
Jan23
Feb23
Mar
23
Apr2
3
May
23
Jun23
Jul23
Aug23
Sep23
Oct23
Nov23
Dec23
220240260280300320340360380EUR per tonne
Jun22
Jul22
Aug22
Sep22
Oct22
Nov22
Dec22
Jan23
Feb23
Mar
23
Apr2
3
May
23
Jun23
Jul23
Aug23
Sep23
Oct23
Nov23
29-Mar-22 29-Apr-22 30-May-22 29-Mar-22 29-Apr-22 30-May-22
850
900
950
1000
1050
1100
1150
1200USD cent per bushel
Jul22
Aug22
Sep22
Oct22
Nov22
Dec22
Jan23
Feb23
Mar
23
Apr2
3
May
23
Jun23
Jul23
Aug23
Sep23
Oct23
Nov23
Dec23
600
640
680
720
760
800
840USD cent per bushel
Jul22
Aug22
Sep22
Oct22
Nov22
Dec22
Jan23
Feb23
Mar
23
Apr2
3
May
23
Jun23
Jul23
Aug23
Sep23
Oct23
Nov23
Dec23
29-Mar-22 29-Apr-22 30-May-22 29-Mar-22 29-Apr-22 30-May-22
14
16
18
20USD per hundredweight
Jul22
Aug22
Sep22
Oct22
Nov22
Dec22
Jan23
1300135014001450150015501600165017001750
USD cent per bushel
Jul22
Aug22
Sep22
Oct22
Nov22
Dec22
Jan23
Feb23
Mar
23
Apr2
3
May
23
Jun23
Jul23
Aug23
Sep23
Oct23
Nov23
29-Mar-22 29-Apr-22 30-May-22 29-Mar-22 29-Apr-22 30-May-22
Euronext wheat (EBM) Euronext maize (EMA)
CBOT wheat CBOT maize
CBOT rice CBOT soybean
Historical and implied volatilities
Jun 21 Aug 21 Oct 21 Dec 21 Feb 22 Apr 22 Jun 220
20
40
60
80
100
120
Jun 21 Aug 21 Oct 21 Dec 21 Feb 22 Apr 22 Jun 220
102030405060708090
100
Historical Volatility (30 days) Implied Volatility (Daily)
Wheat Maize Rough rice Soybeans Wheat Maize Rough rice Soybeans
+i AMIS market indicatorsSeveral of the indicators covered in this report are updated regularly on the AMIS website. These, as well as other market indicators, can be found at:http://www.amis-outlook.org/amis-monitoring/indicators/For more information about forward curves see the feature article in No. 75 February AMIS Market Monitor 2020.

AMIS Market Monitor No. 100 July 2022 15
Fertilizer outlook
0200400600800
10001200140016001800
USD per tonne
Jun20
Aug20
Oct20
Dec20
Feb21
Apr2
1
Jun21
Aug21
Oct21
Dec21
Feb22
Apr2
2
Jun22
Ammonia-US Gulf NOLA Ammonia-Western EuropeUrea-US Gulf NOLA Urea-Black Sea Prill
Ammonia and urea (spot prices)
0200400600800
1000120014001600
USD per tonne
1.12.23.34.45.56.67.78.89.9
USD per MMBtu
Jun20
Aug20
Oct20
Dec20
Feb21
Apr2
1
Jun21
Aug21
Oct21
Dec21
Feb22
Apr2
2
Jun22
Ammonia average Urea averageNatural gas (right axis)
Ammonia average, urea average and natural gas(spot prices)
100200300400500600700800900
10001100
USD per tonne
Jun20
Aug20
Oct20
Dec20
Feb21
Apr2
1
Jun21
Aug21
Oct21
Dec21
Feb22
Apr2
2
Jun22
DAP-US Gulf NOLA DAP-BalticPotash-US Gulf NOLA Potash-Baltic
Potash and phosphate (spot prices)
Fertilizer prices declined in June from the multi-year highs seenearlier this year, providing some indication that the supply situa-tionmay be improving. Fertilizer inventories have grown asmanyfarmers have chosen to wait out the record high prices. Whilethis month's fertilizer price decreases provide some respite, un-certainties remain due to the Black Sea conflict and persistentlyhigh natural gas prices
Natural gas prices were relatively steady in June, despitehigh demand for cooling and ongoing supply constraints -especially in Europe.Urea prices decreased in June due to low seasonal demand,but prices remain higher than year ago levels. Chinese ex-port restrictions and high natural gas prices may continue toimpact urea prices in the future.Ammonia prices continued to decrease in June as industrialdemand lowered, but the decrease in Europe was much lesspronounced due to the impact of high natural gas prices onammonia production in that region.DAP prices decreased in June, particularly in the US, due tolow seasonal demand.Potash prices in the United States decreased slightly in Junebut remain 78 percent higher than year ago levels as globalsupply concerns continue.
Ammonia-US Gulf NOLA 907.0 - -24.2 +66.4 1402.2 552.6Ammonia-Western Europe 1237.5 188.7 -4.8 +133.5 1620.0 610.6Ammonia avg. across regions 1043.2 61.8 -13.3 +91.8 1422.4 587.0Urea-US Gulf 512.5 32.8 -19.1 +15.2 868.8 425.0Urea-Black Sea 530.0 46.9 -19.7 +34.5 930.0 445.0Urea avg. across regions 604.5 20.0 -14.2 +37.7 908.0 461.2DAP-US Gulf 798.8 14.4 -6.6 +31.3 974.0 608.8DAP-Baltic 900.0 - +0.0 +47.8 900.0 630.0Potash-Baltic - - - - 230.0 220.0Potash-US Gulf NOLA 770.0 - -4.2 +78.0 824.0 526.0Natural gas 8.0 1.1 -2.0 +146.6 8.1 3.7
Jun-22
averag
e
Jun-22
std.
dev.
%ch
ange
last
mon
th*
%ch
ange
last
year*
12mon
thhigh
12-m
onth
low
All prices shown are in US dollarsSource: Own elaboration based on Bloomberg*Estimated using available weekly data to date.
+i Chart and tables descriptionAmmonia and urea: Overview of nitrogen-based fertilizer prices in the US Gulf, Western Europe and Black Sea. Prices are weekly prices averaged by month.Potash and phosphate: Overview of phosphate and potassium-based fertilizer prices in the US Gulf, Baltic and Vancouver. Prices are weekly prices averaged bymonth.Ammonia average and urea average: Monthly average prices from ammonia's US Gulf NOLA, Middle East, Black Sea and Western Europe were averaged toobtain ammonia average prices; monthly average prices from urea's US Gulf NOLA, US Gulf Prill, Middle East Prill, Black Sea Prill and Mediterranean were averagedto obtain Urea Average prices.Natural gas: Henry Hub Natural Gas Spot Price from ICE up to December 2017 and from Bloomberg (BGAP) from January 2018 onwards. Prices are intradayprices averaged by month. Natural gas is used as major input to produce nitrogen-based fertilizers.DAP: Diammonium Phosphat

16 AMIS Market Monitor No. 100 July 2022
Ocean freight marketsDry bulk freight market developments
Baltic Dry Index (BDI) 2458.8 -15.8% -16.1%sub-indices:Capesize 2629.4 -23.8% -23.6%Panamax 2770.5 -13.1% -17.5%Supramax 2542.2 -8.1% -5.1%Baltic Handysize Index (BHSI) 1440.5 -12.6% +2.7%
Jun-22average
ChangeM/M Y/Y
Source: Baltic Exchange, IGC. Base period for BDI: 4 January 1985 = 1000;for BHSI: 23 May 2006 = 1000; for GOFI: 1 January 2013 = 100
IGC Grains and Oilseeds FreightIndex (GOFI) 220.3 -7.1% +4.6%
sub-Indices:Argentina 279.2 -5.5% +6.6%Australia 177.5 +1.6% +14.4%Brazil 294.2 -5.0% +4.1%Black Sea 215.9 -9.6% -4.1%Canada 161.2 -12.7% +5.0%Europe 179.3 -15.3% +5.3%US 176.2 -7.5% +7.3%
Jun-22average
ChangeM/M Y/Y
Jun21
Jul21
Aug21
Sep21
Oct21
Nov21
Dec21
Jan22
Feb22
Mar
22
Apr2
2
May
22
Jun22
-100
-50
0
50
100
GOFIBDI
BDI and IGC GOFI
Jun21
Jul21
Aug21
Sep21
Oct21
Nov21
Dec21
Jan22
Feb22
Mar
22
Apr2
2
May
22
Jun22
0
30
60
Australia Canada Europe
Selected IGC GOFI sub-indices
After a solid rise in the prior month, the dry bulk freight com-plex posted sizable losses during June as market sentimentcame under pressure from fears of a looming global reces-sion. Declines in timecharter rates across all main vessel seg-ments contributed to a 16 percent monthly drop in averageBaltic Dry Index (BDI) values. The Index was down by 16percent year-on-year, including a 7 percent annual declinein average timecharter rates across the grains and oilseedscarrying segments.Nonetheless, freight markets were supported by the ongo-ing increase in dry bulk journey lengths and times, stemmingfrom re-directed trade flows for some commodities owingto the ongoing Black Sea conflict and associated difficultiessourcing supplies from the region. Reflecting this, there wastalk of growing cargo handlings at Great Lake ports in theUS, which were expected to be increasingly involved in rel-atively small cargo deliveries (compared to shipments fromthe Gulf) to EU countries and other destinations, to replacedisrupted supplies from Ukraine.
Recent declines in timecharter rates were led by the Cape-size sector, with the corresponding Baltic sub-Index nearlyone-quarter lower compared to May, on average. While sus-tained activity on the Brazil to China iron ore route, cou-pled with larger coal deliveries to India, provided initial sup-port, worries about global economic growth, climbing fuelcosts and a build-up of tonnage in South Africa pressuredtimecharter prices more recently.
Largely linked to limited cargo supplies in the Atlantic, freightrates in the grains and oilseeds carrying segments alsoeased, led by the Panamax market. Bearish influence alsostemmed from news of India's move to raise export taxeson iron ore pellets and some steel products, following earlierbans on wheat and sugar shipments.
The IGC Grains and Oilseeds Freight Index (GOFI) av-eraged 7 percent lower compared to last month, but wasslightly higher year-on-year on a sharp annual rise in bunkercosts.
+i Source: International Grains CouncilBaltic Dry Index (BDI): A benchmark indicator issued daily by the Baltic Exchange, providing assessed costs of moving raw materials on ocean going vessels.Comprises sub-Indices for three segments: Capesize, Panamax and Supramax. The Baltic Handysize Index excluded from the BDI from 1 March 2018.IGC Grains and Oilseeds Freight Index (GOFI): A trade-weighted composite measure of ocean freight costs for grains and oilseeds, issued daily by theInternational Grains Council. Includes sub-Indices for seven main origins (Argentina, Australia, Brazil, Black Sea, Canada, the EU and the USA). Constructed basedon nominal HSS (heavy grains, soybeans, sorghum) voyage rates on selected major routes.Capesize: Vessels with deadweight tonnage (DWT) above 80,000 DWT, primarily transporting coal, iron ore and other heavy raw materials on long-haul routes.Panamax: Carriers with capacity of 60,000-80,000 DWT, mostly geared to transporting coal, grains, oilseeds and other bulks, including sugar and cement.Supramax/Handysize: Ships with capacity below 60,000 DWT, accounting for the majority of the world's ocean-going vessels and able to transport a wide varietyof cargos, including grains and oilseeds.
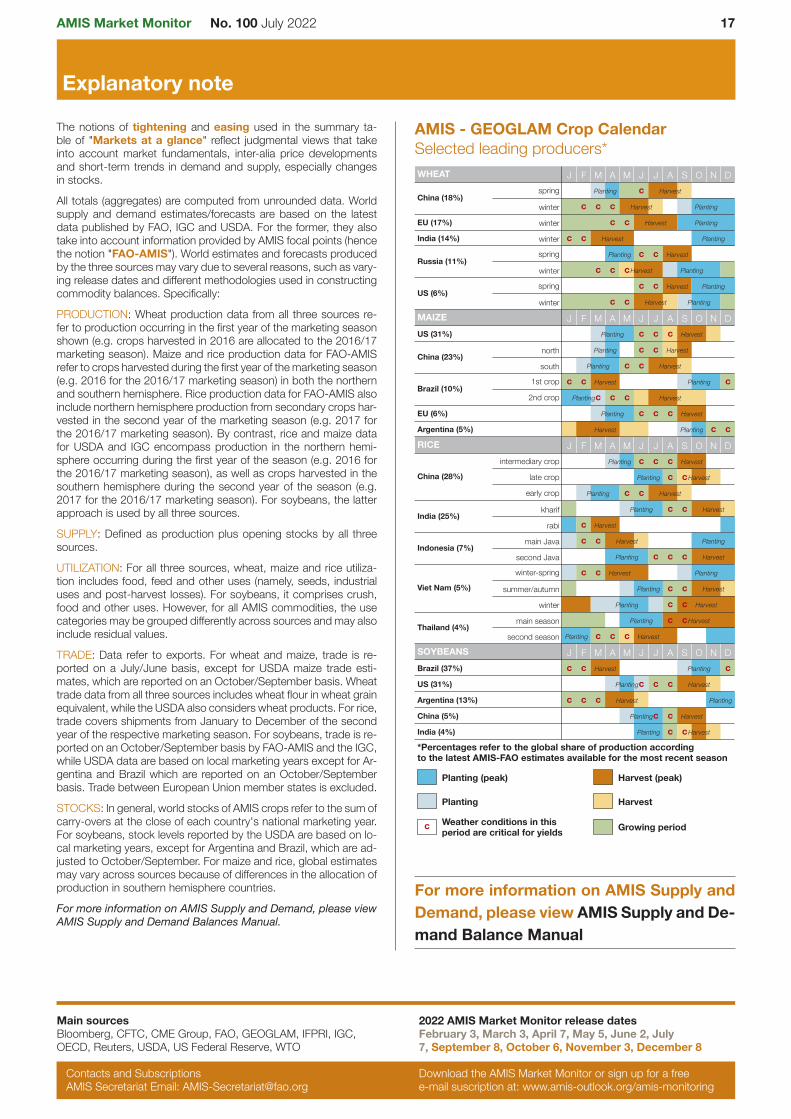
AMIS Market Monitor No. 100 July 2022 17
Explanatory note
The notions of tightening and easing used in the summary ta-ble of "Markets at a glance" reflect judgmental views that takeinto account market fundamentals, inter-alia price developmentsand short-term trends in demand and supply, especially changesin stocks.
All totals (aggregates) are computed from unrounded data. Worldsupply and demand estimates/forecasts are based on the latestdata published by FAO, IGC and USDA. For the former, they alsotake into account information provided by AMIS focal points (hencethe notion "FAO-AMIS"). World estimates and forecasts producedby the three sources may vary due to several reasons, such as vary-ing release dates and different methodologies used in constructingcommodity balances. Specifically:
PRODUCTION: Wheat production data from all three sources re-fer to production occurring in the first year of the marketing seasonshown (e.g. crops harvested in 2016 are allocated to the 2016/17marketing season). Maize and rice production data for FAO-AMISrefer to crops harvested during the first year of themarketing season(e.g. 2016 for the 2016/17 marketing season) in both the northernand southern hemisphere. Rice production data for FAO-AMIS alsoinclude northern hemisphere production from secondary crops har-vested in the second year of the marketing season (e.g. 2017 forthe 2016/17 marketing season). By contrast, rice and maize datafor USDA and IGC encompass production in the northern hemi-sphere occurring during the first year of the season (e.g. 2016 forthe 2016/17 marketing season), as well as crops harvested in thesouthern hemisphere during the second year of the season (e.g.2017 for the 2016/17 marketing season). For soybeans, the latterapproach is used by all three sources.
SUPPLY: Defined as production plus opening stocks by all threesources.
UTILIZATION: For all three sources, wheat, maize and rice utiliza-tion includes food, feed and other uses (namely, seeds, industrialuses and post-harvest losses). For soybeans, it comprises crush,food and other uses. However, for all AMIS commodities, the usecategories may be grouped differently across sources and may alsoinclude residual values.
TRADE: Data refer to exports. For wheat and maize, trade is re-ported on a July/June basis, except for USDA maize trade esti-mates, which are reported on an October/September basis. Wheattrade data from all three sources includes wheat flour in wheat grainequivalent, while the USDA also considers wheat products. For rice,trade covers shipments from January to December of the secondyear of the respective marketing season. For soybeans, trade is re-ported on an October/September basis by FAO-AMIS and the IGC,while USDA data are based on local marketing years except for Ar-gentina and Brazil which are reported on an October/Septemberbasis. Trade between European Union member states is excluded.
STOCKS: In general, world stocks of AMIS crops refer to the sum ofcarry-overs at the close of each country's national marketing year.For soybeans, stock levels reported by the USDA are based on lo-cal marketing years, except for Argentina and Brazil, which are ad-justed to October/September. For maize and rice, global estimatesmay vary across sources because of differences in the allocation ofproduction in southern hemisphere countries.
For more information on AMIS Supply and Demand, please viewAMIS Supply and Demand Balances Manual.
AMIS - GEOGLAM Crop CalendarSelected leading producers*WHEAT J F M A M J J A S O N D
China (18%)spring Planting c Harvest
winter c c c Harvest Planting
EU (17%) winter c c Harvest Planting
India (14%) winter c c Harvest Planting
Russia (11%)spring Planting c c Harvest
winter c c cHarvest Planting
US (6%)spring c c Harvest Planting
winter c c Harvest Planting
MAIZE J F M A M J J A S O N DUS (31%) Planting c c c Harvest
China (23%)north Planting c c Harvest
south Planting c c Harvest
Brazil (10%)1st crop c c Harvest Planting c2nd crop Plantingc c c Harvest
EU (6%) Planting c c c Harvest
Argentina (5%) Harvest Planting c cRICE J F M A M J J A S O N D
China (28%)
intermediary crop Planting c c c Harvest
late crop Planting c cHarvest
early crop Planting c c Harvest
India (25%)kharif Planting c c Harvest
rabi c Harvest
Indonesia (7%)main Java c c Harvest Planting
second Java Planting c c c Harvest
Viet Nam (5%)
winter-spring c c Harvest Planting
summer/autumn Planting c c Harvest
winter Planting c c Harvest
Thailand (4%)main season Planting c Harvestc
second season Planting c c c Harvest
SOYBEANS J F M A M J J A S O N DBrazil (37%) c c Harvest Planting cUS (31%) Plantingc c c Harvest
Argentina (13%) c c c Harvest Planting
China (5%) Plantingc c Harvest
India (4%) Planting c cHarvest
*Percentages refer to the global share of production accordingto the latest AMIS-FAO estimates available for the most recent season
Planting (peak) Harvest (peak)
Planting Harvest
c Weather conditions in thisperiod are critical for yields Growing period
For more information on AMIS Supply andDemand, please view AMIS Supply and De-mand Balance Manual
Main sourcesBloomberg, CFTC, CME Group, FAO, GEOGLAM, IFPRI, IGC,OECD, Reuters, USDA, US Federal Reserve, WTO
2022 AMIS Market Monitor release datesFebruary 3, March 3, April 7, May 5, June 2, July7, September 8, October 6, November 3, December 8
Contacts and SubscriptionsAMIS Secretariat Email: [email protected]
Download the AMIS Market Monitor or sign up for a freee-mail suscription at: www.amis-outlook.org/amis-monitoring
Related Documents