Market Intelligence Session 11 Perceptual Maps II Simulated Test Markets

Market Intelligence Session 11 Perceptual Maps II Simulated Test Markets.
Dec 22, 2015
Welcome message from author
This document is posted to help you gain knowledge. Please leave a comment to let me know what you think about it! Share it to your friends and learn new things together.
Transcript

Market Intelligence Session 11
Perceptual Maps IISimulated Test Markets

Perceptual Mapping: Chicago Beer Example
• Generate list of relevant beer brands• Generate list of attributes
2

3
Chicago Beer
Beers• Old Milwaukee• Budweiser• Beck’s• Heineken• Miller• Meister Brau• Stroh’s• Coors• Michelob• Coors light• Miller light• Old Milwaukee Light
Attributes• Heavy• Popular with men• Special occasions• Dining out• Popular with women• Less filling• Light• Pale color• On a budget• Blue collar• Full bodied

Perceptual Mapping: Chicago Beer Example
• Generate list of relevant beer brands• Generate list of attributes • Consumers rate each brand on each attribute
(e.g., mild flavor, malty, etc.)• Factor analyze matrix of attribute ratings (use
a separate row for each brand for each respondent)
4

5
For each beer, ask consumers to rate to what extent each attribute describes the brand
Budweiser
Strongly StronglyDisagree Agree
1 2 3 4 5 6 7 8 9 10Mild flavor ____ ____ ____ ____ ____ ____ ____ ____ ____ ____Sporty ____ ____ ____ ____ ____ ____ ____ ____ ____ ____

Perceptual Mapping: Chicago Beer Example
• Generate list of relevant beer brands• Generate list of attributes • Consumers rate each brand on each attribute
(e.g., mild flavor, malty, etc.)• Factor analyze matrix of attribute ratings (use
a separate row for each brand for each respondent)
6

7

8
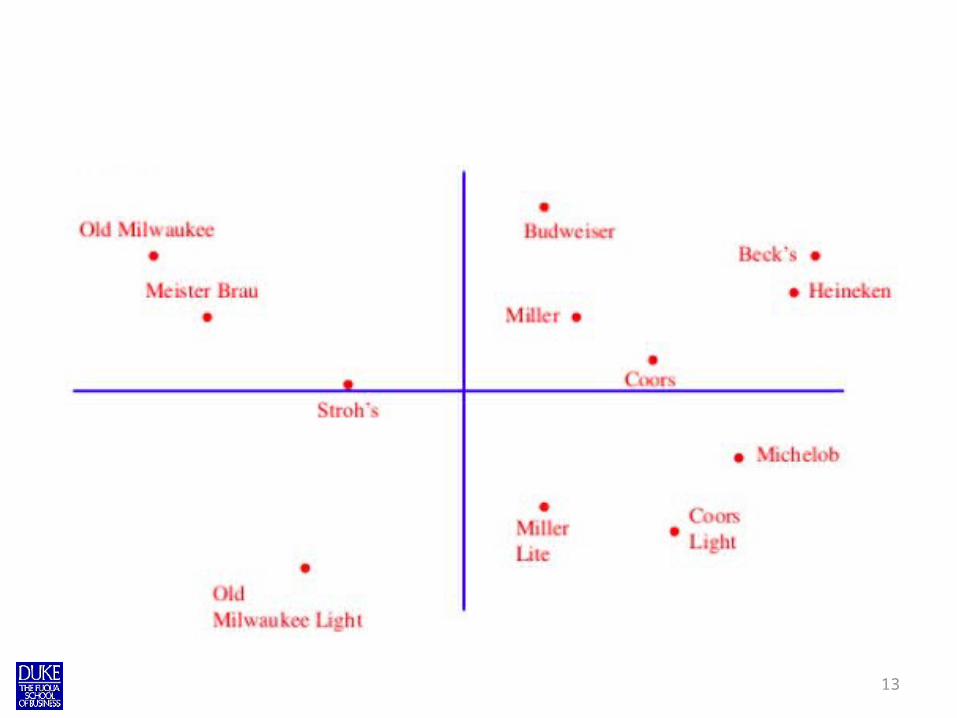
Guidelines for interpreting maps
• The arrow indicates the direction in which that attribute is increasing
• Length of the line from origin to arrow indicates the variance of that attribute explained by 2D map. Longer the line, greater importance of that attribute in explaining variance
• Attributes that are relatively important (long vector) and close to 1 of the axes help interpret the meaning of axis

9
Questions:1. How would you label horizontal and vertical axes?2. Which 2 attributes are most important to describe horizontal axis?

10

11
Some questions
• Which beer is most popular with men?• In what way(s) does Budweiser differ from
Miller and Coors?

12
Some questions
• Which beer is most popular with men?– Answer: Beck’s
• In what way(s) does Budweiser differ from Miller and Coors?– More popular with men– Heavier– Less preferred for special occasion
13

Adding Customer Ideal Points
• Introduce an “ideal” brand as an additional stimulus rated (on attributes) by consumers
• Plot location of ideal brand for each consumer• Cluster analysis to get segments• Represent size of segment by size of circle
around ideal point• Use brand and segment info to forecast
shares. 14

Ideal Points – Hypothetical Individuals

16
PremiumBudget
Heavy
Light
1
5
2
43

Chicago Beer Market Base Shares
• Positioning and Segmentation can yield market share estimates– For illustrative simplicity, give 100% of each segment to
brand closest to its center.– Exact ties split 50-50– Commercial uses -> fancier share models. Probabalistic
allocation of share.
• Forecast preference for each segment
• Forecast brand shares by adding up brand shares at segment level
17

18

19

20

21

22

23

Chicago Beer Market Repositioning
• Reposition by reformulating product or advertising. What-if share calculations.
• Expense = f (distance moved). • Sustainability - who else can do it cheaper?• Repositioning Questions
– How should you reposition if you were Miller? Who is hurt, would there be a countermove?
– If you were Beck’s?
24

25
PremiumBudget
Heavy
Light
1
5
2
43

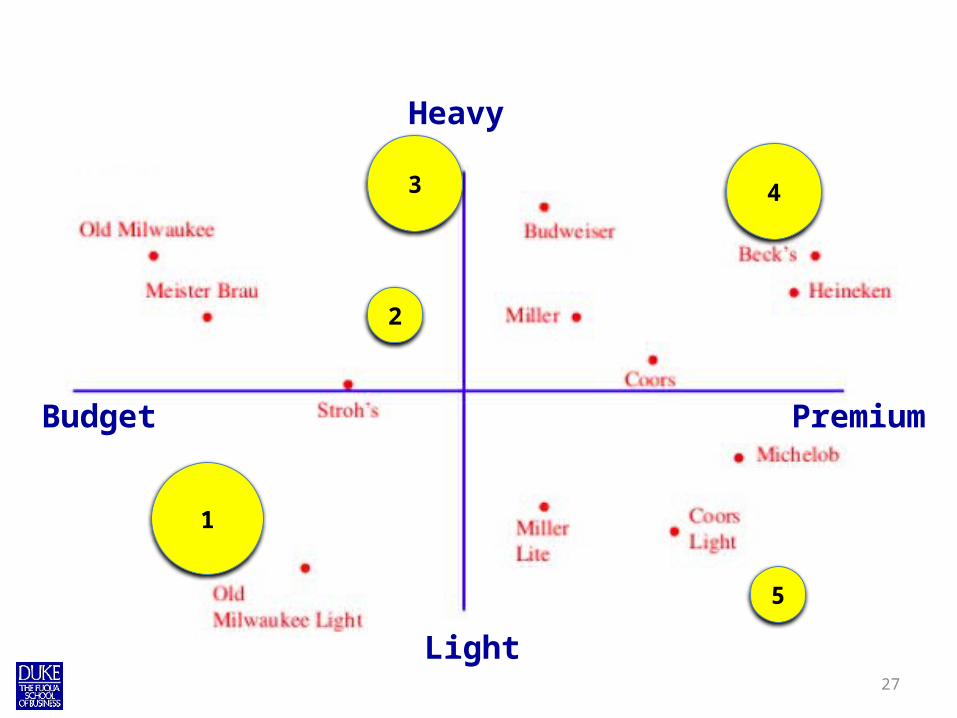
Chicago Beer New Product Intro
• Where are gaps? Badly served segments?
• If I introduce, who is hurt?
• Can they respond by repositioning without losing other, more valuable business?
• As market matures, more brands. Viability of straddling segments?
26
27
PremiumBudget
Heavy
Light
1
5
2
43

28
Questions to ask when you are presented with a perceptual map
• What were data inputs used to generate map? (similarity vs. attribute)
• If similarity-based, how were brands chosen? How did you generate labels for axes? Was MDS used for analysis? What was s-stress?
• If attribute-based, what were attributes? How were dimensions labeled? Was factor analysis/PCA used? What was goodness of fit?

29
Agenda
• Simulated Test Markets
30
Simulated Test Market
• Relevant for new product development• Comes at a relatively late stage of process
– Have developed the product and the positioning – Want to know how much $ you will make from
this product. Estimate comes from 2 pieces• Sales from Initial Trial of product (do they like the
concept?)• Sales from repeat purchase (once they try, does it
deliver on promise?)

TWO KINDS OF STMS
• True STM (e.g., ASSESSOR, LITMUS)– Trial Rate: Consumers come to laboratory store. Exposed to half
hour sitcom with finished ads for new product, competition. Then led to mini-store where new product, competitors available for purchase w/ own $.
• Concept Test STM (Nielson BASES). Cheaper.– Trial Rate: Consumers exposed to 2-paragraph concept, not final
ads. Adjusted “Top Box” (Definitely Would Buy…), usually using web panels
• Concept Tests more popular b/c accuracy not that different
31

Why do a BASES concept test?
• Fast and Cheap – about $100 K for full STM with projections for 3
alternative marketing plans• Secret from Competitors; no sabotage• Accurate -- when assumptions implemented
– Close to 1000 validations of BASES forecasting accuracy; average forecast falls within 9% of actual sales; 91% fall within 20% of actual sales.
• For high risk, can follow with true test market
32

33
Part 1: Trial
Step 1: ________ Trial rate (%) – use deflators for likelihood ratings Step 2: ________ Adjusted trial rate: multiply by awareness (%) and availability/(ACV%) Step 3: ________ Trial households: Multiply by number of households Step 4: ________ Trial unit sales: Multiply by transaction size (how many units bought at trial) Step 5: ________ Trial dollar sales: multiply by unit price (and by factory price adjustment)

34
Part 1: Trial
Step 1: ________ Trial rate (%) – use deflators for likelihood ratings Step 2: ________ Adjusted trial rate: multiply by awareness (%) and availability/(ACV%) Step 3: ________ Trial households: Multiply by number of households Step 4: ________ Trial unit sales: Multiply by transaction size (how many units bought at trial) Step 5: ________ Trial dollar sales: multiply by unit price (and by factory price adjustment)
80% of Definitely Buy
30% of Probably Buy

35
Part 1: Trial *Note: If brand extension, do steps 1-4 below separately for current users and non-users of brands Step 1: ________ Trial rate (%) – use deflators for likelihood ratings Step 2: ________ Adjusted trial rate: multiply by awareness (%) and availability/(ACV%) Step 3: ________ Trial households: Multiply by number of households Step 4: ________ Trial unit sales: Multiply by transaction size (how many units bought at trial) _______________ *If brand extension, add trial units for users and non-users now Step 5: ________ Trial dollar sales: multiply by unit price (and by factory price adjustment)

36
Part 2: RepeatStep 6: ________ Repeat rate (%) Step 7: ________ Repeat households: multiply by # of trial households Step 8: ________ Repeat unit sales: multiply by repeat purchases per household and repeat transaction size Step 9: ________ Repeat dollar sales: multiply by unit price (and by factory adjusted
price) --------------------------------------------------------------------------------------------------------Total sales in units: ________________ Add Step 4 and Step 8 Total sales in dollars: ________________ Add Step 5 and Step 9

Example
• Assume:– Trial Rate = 31% (note: already deflated)– Awareness = 60%– ACV = 60%– Target Population = 20 million households (HH)– Trial Units = 1– Repeat Rate = 10%– Repeat Units = 2– Repeat Occasions = 4
Related Documents