1 UK Power Networks Market Intelligence Report - Public August 2021

Welcome message from author
This document is posted to help you gain knowledge. Please leave a comment to let me know what you think about it! Share it to your friends and learn new things together.
Transcript

1
UK Power Networks Market Intelligence Report - Public August 2021

2
Contents 1. Purpose ................................................................................................................................... 4
2. Executive Summary .................................................................................................................. 4
Electric Vehicles ............................................................................................................................................. 4
Generation, Flexibility, and Storage ............................................................................................................... 5
Economic Indicators ....................................................................................................................................... 5
Net Zero Policies and Pathways ..................................................................................................................... 5
Decarbonising Heat ........................................................................................................................................ 6
2.1. List of Acronyms and Initialisations.............................................................................................. 7
3. Electric Vehicles ....................................................................................................................... 8
3.1. UK Charging Infrastructure .......................................................................................................... 8
DNO Charge Point Activity ............................................................................................................................. 9
3.2. UK Electric Vehicle Update ......................................................................................................... 12
Behavioural Science – Make Your Next Car Electric .................................................................................... 13
Battery Manufacturing ................................................................................................................................. 16
Electric Vehicles and Battery Investment .................................................................................................... 19
Electric Vehicle Models ................................................................................................................................ 20
Regional Disparity in EV Charging ................................................................................................................ 22
3.3. European Public Charging Infrastructure ................................................................................... 22
3.4. Transport Decarbonisation Plan ................................................................................................ 24
Transport Decarbonisation Plan .................................................................................................................. 24
Highlights – EVs ............................................................................................................................................ 27
Highlights – Other Transport ....................................................................................................................... 28
Electric Vehicle Smart Charging Consultation Response ............................................................................. 28
4. Generation, Flexibility, and Storage ........................................................................................ 30
4.1. UK Generation Mix ..................................................................................................................... 30
4.2. UK Storage ................................................................................................................................. 33
4.3. Distributed Generation in UK Power Network’s Area ................................................................ 35
4.4. Storage Connected in UK Power Network’s Area ....................................................................... 36
4.5. Distributed Energy Resources across DNOs ............................................................................... 37
4.6. Power Potential Project – world-first regional reactive power market ..................................... 39
5. Economic Indicators ............................................................................................................... 40
5.1. Price of Fuels .............................................................................................................................. 40
5.2. Interconnectors with other countries ......................................................................................... 42
North Sea Link – A corridor for renewables between the UK and Norway ................................................. 43
Neuconnect – First interconnector between two of the Europe’s largest energy markets ........................ 43
Future Interconnectors with Regulatory Approval ...................................................................................... 44

3
5.3. Housing Activity ......................................................................................................................... 45
6. Net Zero Policies and Pathways .............................................................................................. 47
6.1. Overview .................................................................................................................................... 47
6.2. Net Zero Policies Tracker ............................................................................................................ 48
6.3. Climate Change Committee (CCC) Progress Reports to Parliament ........................................... 49
Impacts of COVID-19 on emissions .............................................................................................................. 49
Comparing CCC Balanced Pathway to Government Ambition ..................................................................... 51
CCC’s Recommendations on Next Step Priorities ........................................................................................ 51
6.4. Policy update on smart systems and flexibility .......................................................................... 53
The Smart Systems and Flexibility Plan ........................................................................................................ 53
The Energy Digitalisation Strategy ............................................................................................................... 56
6.5 Public Awareness ........................................................................................................................ 62
Government research showed a high awareness of net zero across the UK public .................................... 62
Ofgem identified key barriers in low-carbon technologies adoptions......................................................... 64
6.6. Ofgem’s Role in Net Zero ........................................................................................................... 67
6.7. National Grid Future Energy Scenarios ...................................................................................... 67
The FES 2021 scenario framework ............................................................................................................... 67
Four FES 2021 key messages........................................................................................................................ 70
Sector deep-dive and key insights ............................................................................................................... 71
Total energy demand by scenarios and way forward .................................................................................. 76
7. Decarbonising Heat ................................................................................................................ 77
7.1. Green Homes Grant and Clean Heat Grant ................................................................................ 77
7.2. Renewable Heat Incentive Update ............................................................................................. 80
7.3. HyNet North West ...................................................................................................................... 83
7.4. Heat Networks Update............................................................................................................... 85
Renewable Energy Planning Database ......................................................................................................... 85
Low-carbon Heat in the City of London ....................................................................................................... 86
Cadent Green Print Hydrogen Document .......................................................................................... 87
Annex A. Detailed breakdown of the Transport Decarbonisation Plan. ........................................... 88

4
1. Purpose This document presents a range of empirical insights and industry developments that will help inform UK Power Networks’ strategic decision making in relation to the operation and management of our networks. We believe some of the key factors that will influence our decision making are the storage, generation, electric vehicle charging assets, and electrified heating installations connecting to our networks.
The findings presented in this report provide a view of the current landscape in relation to the above factors. Quarterly updates allow us to actively monitor current trends and maintain an up-to-date, empirically based view of the future.
Considering the immediate and future implications of the latest developments will enable us to take decisive action as appropriate and will ultimately help us to fulfil our vision of being the best performing Distribution Network Operator (DNO) group.
Some of the datasets used in the report are available on the Market Intelligence page on our website - https://innovation.ukpowernetworks.co.uk/market-intelligence/
2. Executive Summary Electric Vehicles
• The first quarter of 2021 saw 2,000 individual charge points installed in the UK, bringing the UK total up to almost 25,000. If this rate continues, we project that over 8,000 charge points will be installed over the course of the year.
• Of the six DNO groups within Great Britain, UK Power Networks has the largest share of charge points, containing 40% of all charge points within Great Britain – almost double that of the next largest DNO group.
• Data from the Society of Motor Manufactures and Traders (SMMT) shows that there were almost 32,000 EV registrations in June 2021, the highest number of monthly registrations since March 2021. This corresponded to a 17.2% market share, meaning that approximately one in six vehicles sold in June were electric – the highest market share since December (23.4%).
• The new registrations take the UK total to approximately 594,000 EVs, with an estimated 154,000 in UK Power Networks’ licence area.
• A report by the SMMT found that the UK is currently at risk of falling behind other countries with regards to EV manufacturing competitiveness. It proposes a roadmap to make the UK an attractive place to build EVs.
• Nissan has announced a £1bn investment with their Chinese partner Envision AESC to create a 9GWh battery manufacturing plant in Sunderland, with a potential £1.8bn additional investment to increase capacity to 25GWh by 2030.
• The Tesla model 3 was the best-selling EV in 2020, with over 22,000 registrations, of all cars, including petrol and diesel vehicles, only five models out sold it.
• The latest data from the European Alternative Fuels Observatory (EAFO) shows that as of July 2021, there are over 320,000 charge points across Europe serving an EV stock of 3.6 million. This gives an EV to charge point ratio of 11, an increase of 0.1 since the end of 2020.
• The transport decarbonisation plan has been released, with ambitious targets to make all UK transport net zero by 2050.

5
• The government has published its response to the smart charging consultation. In Autumn 2021, it will mandate that all private charge points sold in Great Britain must been smart and meet minimum device-level requirements.
Generation, Flexibility, and Storage • Renewables accounted for 26TWh (37%) of the electricity generated by major power
producers in 2021 Q1. This is 14% less than in 2020 Q1, as wind generation was down by 4TWh (from 23TWh to 19TWh) due to calmer weather.
• According to Solar Media Market Research, as of May 2021, there is 1.3GW of operational battery storage in the UK, of which 130MW were commissioned within the year. There are 686 projects in the pipeline, totalling a capacity of over 16GW. Approximately 80% of these projects (546 sites) have a planned capacity greater than 5MW.
• As of June 2021, the Embedded Capacity Register (ECR) show that there is 8GW of large (>1MW) scale distributed generation connected to our networks, with an additional 7.4GW of accepted capacity in the pipeline. Solar (36%), battery storage (31%) and other renewables (18%) are the technologies with most accepted capacity. This totals to over 6.2GW and accounts for 85% of the overall accepted capacity.
• UK Power Networks and National Grid ESO showcased the Power Potential Project, the world’s first trial to provide dynamic voltage control to the transmission system with distributed energy resources (DER) in distribution networks. This project is expected to save energy consumers over £400m and allow an additional 3.7GW of generation to be connected in the South East area by 2050.
Economic Indicators • The wholesale prices of gas and electricity decreased in 2021 Q1, after seeing a continual rise
since the second quarter of 2020. Supply concerns with respect to gas have yet to be eased as the UK storage level remains very low. The retail prices of petrol and diesel continued to increase due to the significant surge in the oil price.
• At the moment there is 6GW of interconnector capacity connecting Great Britain with neighbouring countries at transmission level. Construction work of the North Sea Link interconnector between the UK and Norway was completed in June 2021. With a capacity of 1.4GW, it is expected to begin its trial operations in October this year.
• Housing starts in 2021 Q1 recorded a significant increase when compared to the previous quarter with over 45,000 starts across England. Housing completions decreased slightly between 2020 Q4 and 2021 Q1. In 2021 Q1 there were 44,000 housing completions across England, which is 16% less than the previous quarter but still 22% more than in 2020 Q1.
Net Zero Policies and Pathways • All six DNOs across Great Britain have now submitted their draft business plans for the RIIO-
ED2 price control, which runs from 2023 to 2028, to Ofgem. The total spend requested by the six DNOs amounts to £23.2 billion, a 25% increase on the previous price control RIIO-ED1.
• As part of the RIIO-ED2 business plan submission, every DNO had to give evidence of the number of LCTs they were preparing to facilitate connecting to their networks.
• The Climate Change Committee (CCC) published two reports, Progress in reducing emissions and Progress in adapting to climate change, along with over 200 policy recommendations to the Parliament on 24 June 2021.
• The Government and Ofgem conducted research to explore views of the public in decarbonising the UK. Research report from the Government showed there is a high awareness of net zero across the UK public with 78% of the respondents saying they either
6
‘strongly’ or ‘somewhat’ support the target, a significant increase from a similar survey in March 2020. Meanwhile, Ofgem’s 2020 Consumer Survey aimed to understand consumer attitudes towards adopting energy saving behaviours, as well as key barriers in the adoption of low-carbon technologies.
Decarbonising Heat • The Green Homes Grant (GHG) is the primary scheme for improving the energy efficiency
performance of domestic households in the UK. Due to the poor engagement with this scheme, it has now been scrapped. The scheme closed to new applicants at the end of March 2021.
• As of June 2021, there have been 112,000 accreditations through the Renewable Heat Incentive (RHI) scheme, with an aggregate capacity of 6.4GW. Of these installations, 19% were installed through the non-domestic scheme, with the remaining 81% installed through the domestic scheme.
• On 9 July, HyNet North West launched its cross-party coalition to secure backing from the UK Government for its plans to transform the North West of England and North Wales into one of the world’s first low-carbon industrial clusters. The project aims to reduce carbon dioxide emissions in the area by 10 million tonnes every year by 2030 and could deliver 80% of the UK’s clean hydrogen target for transport, industry, and homes for 2030 and 50% of the UK’s 2050 hydrogen target.

7
2.1. List of Acronyms and Initialisations
· ASHP: Air Source Heat Pump · BECCS: Bioenergy with Carbon Capture and Storage · BEIS: Department for Business, Energy & Industrial Strategy · BEV: Battery Electric Vehicle · CCC: Climate Change Committee · CCuS: Carbon Capture use and Storage · CHG: Clean Heat Grant · DER: Distributed Energy Resource · DFES: Distribution Future Energy Scenarios · DNO: Distribution Network Operator · DRHI: Domestic Renewable Heat Incentive · DSO: Distribution System Operator · DUoS: Distribution use of System · ESO: Electricity System Operator · ETS: Emission Trading Scheme · EV: Electric Vehicle · FES: Future Energy Scenarios · GHG: Greenhouse Gas · GLA: Greater London Authority · GSHP: Ground Source Heat Pump · HDV/HGV: Heavy Duty/Goods Vehicle · HNDU: Heat Network Delivery Unit · ICE: Internal Combustion Engine · LCT: Low-carbon Technology · NDRHI: Non-domestic Renewable Heat Incentive · Ofgem: Office of Gas and Electricity Markets · PHEV: Plug-in Hybrid Electric Vehicle · PV: Photovolatic · RHI: Renewable Heat Incentive · TOUT: Time of Use Tariff · ULEZ: Ultra Low Emission Zone · VED: Vehicle Excise Duty

8
3. Electric Vehicles
3.1. UK Charging Infrastructure
The first quarter of 2021 saw 2,000 individual charge points installed in the UK, bringing the UK total up to almost 25,000. If this rate continues, we project that over 8,000 charge points will be installed over the course of the year. This would be almost double the number installed in 2020, and over 30% more than the previous record for most charge points installed in a year (2019 – 6,200).
Figure 1: Charge point activity
Source: https://www.gov.uk/government/statistics/electric-vehicle-charging-device-statistics-april-2021
The installation of rapid charge points has been following a similar trajectory, with 1,500 individual rapid charge points projected to be installed in 2021. This is over 44% higher than in 2020, which held the previous record of annual installations at 1,050.
1,4392,100
3,098
6,196
4,270
8,060
2016 2017 2018 2019 2020 2021(projected)
The first quarter of 2021 saw 2,000 individual charge points installed in the UK, bringing the UK total up to almost 25,000. Of the six DNO groups within Great Britain, UK Power Networks has the largest share of charge points, containing 40% of all charge points within Great Britain – almost double that of the next largest DNO group.
There were 32,000 EV registrations in June 2021, corresponding to a 17% market share – meaning approximately one in six vehicles sold in June were electric. The new registrations take the UK total to approximately 594,000 EVs, with an estimated 154,000 in UK Power Networks’ licence area.

9
Figure 2: Rapid charge point installations
Source: https://www.gov.uk/government/statistics/electric-vehicle-charging-device-statistics-april-2021
DNO Charge Point Activity The latest government public charge point statistics show that there were 22,463 individual charge points in Great Britain as of April 2021. Of the six DNO groups within Great Britain, UK Power Networks has the largest share of charge points, containing 40% of all charge points within Great Britain – almost double that of the next largest DNO group.
Figure 3: Distribution of GB charge points by DNO group, April 2021
Source: https://www.gov.uk/government/statistics/electric-vehicle-charging-device-statistics-april-2021
The large UKPN share is mostly down to UKPN servicing the majority of London, with our London network containing 24% of all charge points within Great Britain alone.
210276
693
9571,051
379
1,516
0
200
400
600
800
1,000
1,200
1,400
1,600
2016 2017 2018 2019 2020 2021 (April) 2021(projected)
SSE, 16%
SP, 9%
NPG, 9%
WPD, 21%
ENW, 5%
UKPN, 40%

10
Additionally, UKPN in general, and LPN in particular, are experiencing charge point growth in excess of that seen in any other DNO area. In the 12-month period between April-20 and April-21, the number of individual charge points in UKPN grew by 42%, over 10% more than any other DNO group.
Table 1: Charge point activity by DNO
DNO Group DNO Total charge points (Apr-21)
12-month increase
12-month growth
quarter increase
quarter growth
SSE SSEH 967 110 13% 50 5% SP SPD 1,396 202 17% 110 9% NPG NPGN 1,042 95 10% 40 4% WPD SWEST 1,010 137 16% 53 6% SSE SSES 2,533 342 16% 119 5% WPD SWALES 586 176 43% 27 5% SP SPMW 723 121 20% 71 11% WPD WMID 1,106 226 26% 64 6% NPG NPGY 953 204 27% 63 7% ENW ENWL 1,091 48 5% 55 5% UKPN EPN 2,093 492 31% 198 10% WPD EMID 2,019 483 31% 180 10% UKPN SPN 1,629 402 33% 100 7% UKPN LPN 5,317 1,784 50% 879 20%
Source: https://www.gov.uk/government/statistics/electric-vehicle-charging-device-statistics-april-2021
Outside of London, but still within UK Power Networks’ licence area, the unitary authorities of Brighton and Buckinghamshire also see higher than average deployment of EV charge points. Although, they still lag behind many of the London boroughs in terms of the total number of charge points.

11
Figure 4: Charge points by local/unitary authority within UK Power Networks' licence area
However, this lead in charge point volumes, especially within London, is not uniform across the different charger speeds. LPN has just 8% of all GB rapid charge points compared to 24% of total charge points.
This would indicate that London’s charging infrastructure, while widespread, is lacking in rapid charge points. This was reported in the September-2020 edition of the UK Power Networks Market Intelligence Report, available on our website.
Source: https://www.gov.uk/government/statistics/electric-vehicle-charging-device-statistics-april-2021
Figure 5: Distribution of GB charge points by DNO and speed, April 2021
Source: https://www.gov.uk/government/statistics/electric-vehicle-charging-device-statistics-april-2021
0%
5%
10%
15%
20%
25%
% of total % of rapid total

12
3.2. UK Electric Vehicle Update
Data from the Society of Motor Manufactures and Traders (SMMT) shows that there were almost 32,000 EV registrations in June 2021, the highest number of monthly registrations since March 2021. This corresponded to a 17.2% market share, meaning that over one in six vehicles sold in June were electric – the highest market share since December (23.4%)1.
Figure 6: Monthly EV registrations over the past year
Source: https://www.smmt.co.uk/vehicle-data/car-registrations/
Of the 32,000 EV registrations in June 2021, 62% were battery electric vehicles – the highest BEV proportion since December (71%). This is in keeping with the general trend witnessed since 2018, with BEV registrations making a resurgence after falling year on year since 2012.
Figure 7: Annual BEV v PHEV registrations percentage
Source: https://www.smmt.co.uk/vehicle-data/car-registrations/
1 https://www.smmt.co.uk/vehicle-data/car-registrations/
0.0%
5.0%
10.0%
15.0%
20.0%
25.0%
30.0%
35.0%
-
5,000
10,000
15,000
20,000
25,000
30,000
35,000
40,000
Mar
ket s
hare
Vehi
cles
regi
ster
ed
BEV PHEV Monthly EV Market share
0%
10%
20%
30%
40%
50%
60%
70%
80%
90%
100%
2012 2013 2014 2015 2016 2017 2018 2019 2020 2021 (todate)
BEV PHEV

13
The new registrations take the UK total to approximately 594,000 EVs, with an estimated 154,000 in UK Power Networks’ licence area.
Figure 8: UK and UKPN cumulative EV registrations
Source: https://www.smmt.co.uk/vehicle-data/car-registrations/ and DfT registrations data
Behavioural Science – Make Your Next Car Electric The Department for Transport (DfT) worked with the Driver and Vehicle Licensing Agency (DVLA) and the Cabinet Office to run a behavioural trial to investigate messaging to best encourage electric vehicle uptake, supporting the government’s net-zero ambitions. The trial commenced on 6 March 2020 and ran for 130 days, taking place during the government’s consultation on bringing forward the phase-out date for the sale of new petrol, diesel and hybrid cars and vans (February to July 2020)2.
Eight messages (seven messages and a control) were compared and targeted people who had renewed their car tax online by encouraging them to click through the Go Ultra Low website, which encourages EV purchases.
2 https://www.gov.uk/government/publications/behavioural-science-messaging-trial-make-your-next-car-electric/make-your-next-car-electric-a-behavioural-science-messaging-trial
593,572
153,547
UK UKPN

14
The eight messages, and the triggers they targeted were as follows:
Table 2: Messages trialled on DVLA website
Message Trigger Shorthand “The Government are consulting on ending the sale of new petrol, diesel, and hybrid cars and vans by 2035 or earlier. Are you ready? Make your next car electric.”
Ending sale of internal combustion engine (ICE) vehicles
Are you ready?
“Join the 6,000 new drivers every month who make the switch to an electric vehicle. Make your next car electric.”
Appealing to social norms 6,000 new drivers
“Between 28,000 and 36,000 people die every year as a result of air pollution. What you drive makes a difference. Make your next car electric.”
Deaths relating to air pollution 28,000 to 36,000 deaths
(Control message) “Information is available on electric vehicles. Make your next car electric.”
General information Control
“Rapid charge points for electric vehicles are available at almost all motorway service stations in the UK. Make your next car electric.”
Charge point availability Charge point availability
“Road traffic is the biggest single contributor to carbon emissions in the UK. What you drive makes a difference. Make your next car electric”
Traffic and carbon emissions Traffic and carbon emissions
“Charging your electric vehicle at home can be as easy as charging your phone overnight. Make your next car electric.”
Ease of charging Ease of charge
“Fully electric vehicles could cost as little as 1p per mile to run, less than a quarter of the cost of the most fuel-efficient petrol or diesel vehicles. Make your next car electric”
Cost per mile of using an EV 1p per mile
Source: Make your next car electric: a behavioural science messaging trial - https://www.gov.uk/government/publications/behavioural-science-messaging-trial-make-your-next-car-electric/make-
your-next-car-electric-a-behavioural-science-messaging-trial
Click through rates were compared to identify which message produced the highest clock through rate overall and which performed significantly better than the control and other messages. Comparisons were made using data over 130 days (6 March to 14 July 2020). In total, there were 4,272,526 tracked users of the government website for paying vehicle tax. On average, there were 534,066 users per condition/message.

15
Figure 9: Click through rate of different messages
Source: Make your next car electric: a behavioural science messaging trial - https://www.gov.uk/government/publications/behavioural-science-messaging-trial-make-your-next-car-electric/make-
your-next-car-electric-a-behavioural-science-messaging-trial
The chart above shows the click through rate of the trialled messages, and compares them to the control message. A double ** indicates that the message produced a significant result at the 1% significance level, and a triple *** indicates that the message produced a significant result at the 0.1% significance level. The results show that the “Are you ready”, “6,000 new drivers”, and “28,000 to 36,000 deaths” improved the click through rate of users on the DVLA website. Meanwhile the “Charge point availability”, “Ease of charge” and “1p per mile” reduced the click through rate, and the “Traffic and carbon emissions” had no significant effect.
As the trial ran through the first COVID-19 lockdown, it is important to understand how, if at all, the lockdown impacted public attitudes and click through behaviour. To do this, the click through rates of the messages were compared pre lockdown (6-23 March – 17 days) and post lockdown (24 March to 14 July – 113 days).
2.00% 2.20% 2.40% 2.60% 2.80% 3.00% 3.20% 3.40% 3.60%
Are you ready?***
6,000 new drivers***
28,000 to 36,000 deaths***
Traffic and carbon emissions
Control
1p per mile**
Ease of charge***
Charge point availability***
Click through rate %
16
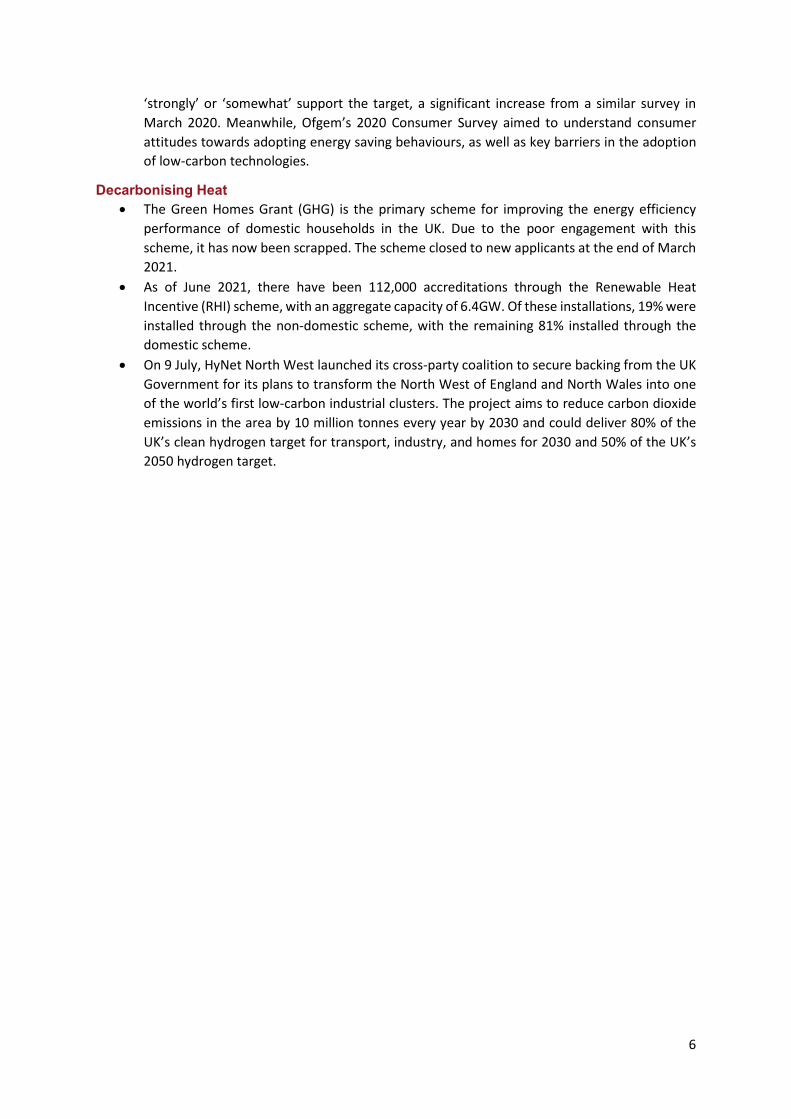
Figure 10: Comparison of click through rates pre and post lockdown for each message
Source: Make your next car electric: a behavioural science messaging trial - https://www.gov.uk/government/publications/behavioural-science-messaging-trial-make-your-next-car-electric/make-
your-next-car-electric-a-behavioural-science-messaging-trial
Overall, lockdown reduced the click-through rate of all messages by an average raw percentage point of 0.47%. This is an average proportional decrease of 14% and was significant for all messages. ‘Are you ready?’ decreased the most from pre- to post-lockdown (4.06% to 3.40%), and ‘6,000 new drivers’ the least (3.64% to 3.35%). However, these two messages remained the most successful both pre and post lockdown.
The fact that the “Are you ready?” message was the most persuasive message in getting people to go to the Go Ultra Low website indicates that the fear of not being prepared for the ICE ban was a better trigger than appealing to people’s carbon consciousness.
Battery Manufacturing The UK’s target of achieving net zero emissions by 2050 is a challenging one, and one that will require significant investment in the electric vehicle sector. The current target of ending sales of internal combustion engine cars by 2030 looks to be achievable due to the falling costs of building EVs. However, this is not happening quickly enough for the industry to hit the 2030 target while retaining its global share and volume of production – according to a report3 by the Society of Motor Manufactures and Traders. The report draws attention to the fact that the UK has yet to back its ambition with a matching level of investment in battery production incentives, charging networks and affordable clean energy. Independent analysts predict that by 2025, the UK will have just 12 GWh of lithium-ion battery capacity production, compared to 164 GWh in Germany, 91 GWh in the US or 32 GWh in France.
The UK automotive industry is facing significant short-term pressures and costly challenges, including adapting to Brexit, a significant fall in demand from COVID-19, and a pressing bottleneck from the global semiconductor shortage. The report highlights three further challenges associated with future changes.
3Full Throttle – Driving UK Automotive Competitiveness https://smmt.publicfirst.co.uk/
1.00% 1.50% 2.00% 2.50% 3.00% 3.50% 4.00% 4.50%
Are you ready?
6,000 new drivers
28,000 to 36,000 deaths
Traffic and carbon emissions
Control
1p per mile
Ease of charge
Charge point availability
Click through rate (%) post lockdown Click through rate (%) pre lockdown

17
• The transition from ICE vehicles to EVs – Wide ranging effects, from energy demand to how motor taxation is administered. For the motor industry, it will reduce the influence of the UK’s strength in traditional powertrain designs
• Rise of increasingly connected and automated vehicles - While it is difficult to predict the timeline for fully self-driving vehicles, there is much less doubt that the industry will continue to become increasingly digitalised. By 2030, embedded software could make up to 30% of total vehicle value
• Changing trade patterns, along with the wider rise of Asian markets - Measured on a volume basis, the majority of vehicles exported from the UK are headed to the EU. The evolving UK-EU relationship, geographic proximity, market strength and regulatory influence, and integrated pan-European supply chain remain critical to UK Automotive success. However, even before Brexit, exports to non-EU markets were already growing significantly faster than to the EU itself - and future trade deals offer the potential to further catalyse UK exports, particularly among premium and small volume manufacturers, and open new opportunities
In order to assess how well placed the UK is to adapt to these changes, an Automotive Competitive Index was created, based around the three pillars of Technology & Innovation, Manufacturing Competitiveness, and Consumer, Market and Trade. The Index was applied to the UK and a number of other vehicle manufacturing countries.
Figure 11: Automotive Competitiveness Index scores (1 = best, 0 = worst)
Source: Full Throttle – Driving UK Automotive Competitiveness https://smmt.publicfirst.co.uk/
The Index found that the UK maintained many of its traditional strengths, a strong science, engineering and innovation base; a flexible and highly productive workforce; and a strong domestic market. However, we are increasingly falling behind in other indicators due to high levels of business rates, few tax incentives for investment, and a lack of frictionless trade access to a large regional trading block such as the EU or USMCA.
Based on the shortcomings identified in the Index, the SMMT has laid out a proposed roadmap to preserve and grow the UK automotive industry.
0.73
0.470.43
0.39 0.36 0.35 0.340.29 0.28 0.27 0.26 0.24
0.2 0.19

18
Figure 12: SMMT Roadmap
Source: Full Throttle – Driving UK Automotive Competitiveness https://smmt.publicfirst.co.uk/ *EII schemes: scheme whereby Energy Intensive Industries are exempt from environmental subsidies to help them compete with EU counterparts

19
In order to assess the potential impacts of the coming challenges within the automotive industry, the SMMT created four scenarios for the future of the industry, and looked at the resulting implications for growth and jobs.
• Central - The UK builds 60 GWh of gigafactory supply by 2030, ensuring that we have ample battery supply to maintain our current production volume, and offers significantly more generous incentives for business investment. Under this scenario, GVA and jobs return to a trajectory of steady growth.
• Optimistic - The UK builds 80 GWh, undertakes an ambitious programme of trade deals and significantly improves its attractiveness for business investment. This sees GVA grow by around a third faster than in the central scenario, and sees the sector as a whole gain around 40,000 jobs.
• Pessimistic - The UK only builds out 30 GWh of gigafactory supply, while non-tariff barriers with the EU moderately increase from the middle of the decade. Under this scenario, GVA recovers from COVID-19 and then largely stagnates, with a substantial number of jobs lost over time.
• Stranded - The UK only builds one additional gigafactory, leaving total supply under 15 GWh and so fails to make the transition away from ICEs. As a result, around 90,000 jobs are lost, with the majority of these concentrated outside of London and the South East, further increasing regional inequality.
The potential impacts of inadequate preparation suggest that it may be beneficial for the Government to review recommendations made in the report.
Electric Vehicles and Battery Investment As part of the drive to increase the UK’s battery production capacity, Nissan has announced a £1bn investment with their Chinese partner Envision AESC to create a 9GWh plant in Sunderland, with a potential £1.8bn additional investment to increase capacity to 25GWh by 20304. The factory will power 100,000 vehicles a year and is expected to create 6,200 jobs. Part of the incentive for Nissan is due to rules of origin included in the post Brexit trade deal with the EU. The deal allows the free trade of cars providing at least 40% of the car is produced in the UK or EU, crucially the requirement increases to 55% from 2027. This means that an imported battery, which can make up half the vehicle’s price, would close off the European market to British based car factories.
The ability to manufacture EVs in the UK is also supported by the recent news that Vauxhall plan to build electric vans at its Ellesmere Port plant5. The £100m investment, which the UK government will contribute to, will safeguard over 1,000 factory jobs and aims to commence production of an all-electric van by the start of 2022.
4 https://www.reuters.com/business/retail-consumer/nissan-bets-big-uk-with-ev-battery-plant-new-crossover-2021-07-01/ 5 https://www.bbc.co.uk/news/business-57726818

20
Electric Vehicle Models Of the 425,000 EV6s registered in the UK as of 2020 Q4, 71% are one of the 20 best-selling EV models. The Mitsubishi Outlander PHEV remains the most popular EV model in the UK, with almost 44,000 vehicles registered, followed by the Nissan Leaf (36,000 vehicles), and Tesla Model 3 (32,000 vehicles). These three models alone account of over 25% of all EVs in the UK.
Figure 13: Top selling electric vehicle models in the UK
Source: Gov table veh0133 - https://assets.publishing.service.gov.uk/government/uploads/system/uploads/attachment_data/file/985632/veh0133.ods
PHEVs highlighted in yellow, models that include a PHEV and BEV options are marked with an *
Despite being the bestselling EV in the UK, the Outlander PHEV had fewer than 4,000 registrations over 2020 – significantly lower than some of the newer EV models. Conversely, the Tesla Model 3 saw over 22,000 registrations in 2020 – 69% of the total number of Model 3’s registered in the UK.
6 Refers to Battery Electric, Plug-in Hybrid Electric, and Range-extended Electric vehicles
- 5,000 10,000 15,000 20,000 25,000 30,000 35,000 40,000 45,000
MITSUBISHI OUTLANDERNISSAN LEAF
TESLA MODEL 3BMW 3 SERIES
BMW I3VOLKSWAGEN GOLF*
RENAULT ZOEJAGUAR I-PACEBMW 5 SERIES
KIA NIRO*TESLA MODEL S
MERCEDES C CLASSMINI COUNTRYMAN
LAND ROVER RANGE ROVERNISSAN E-NV200
VOLVO XC90AUDI E-TRON
HYUNDAI IONIQ*MERCEDES A CLASS

21
Figure 14: Top selling electric vehicle models over 2020 in the UK
Source: Gov table veh0171 - https://assets.publishing.service.gov.uk/government/uploads/system/uploads/attachment_data/file/985640/veh0171.ods
In fact, the Tesla Model 3 has been one of the best-selling cars of any fuel type, with only five car models out selling it over 2020.
Figure 15: Top six best selling cars over 2020
Source: Gov table veh:0128 https://assets.publishing.service.gov.uk/government/uploads/system/uploads/attachment_data/file/985627/veh0128.ods
- 5,000 10,000 15,000 20,000 25,000
TESLA MODEL 3BMW 3 SERIES
KIA NIRO*JAGUAR I-PACE
NISSAN LEAFMERCEDES A CLASS
RENAULT ZOEAUDI E-TRON
MG ZSVOLKSWAGEN ID3
BMW I3HYUNDAI KONA
VOLKSWAGEN GOLF*MITSUBISHI OUTLANDER
HYUNDAI IONIQ*VOLVO XC40
MINI COOPERPORSCHE TAYCAN
MERCEDES EQC CLASSVAUXHALL CORSA
20,000 21,000 22,000 23,000 24,000 25,000 26,000 27,000
LAND ROVER RANGE ROVER
FORD PUMA
VOLVO XC40
VOLKSWAGEN TIGUAN
MERCEDES A CLASS
TESLA MODEL 3

22
Regional Disparity in EV Charging EV drivers have told Ofgem that the charging experience is significantly different between Scotland and other areas of Great Britain. Specifically, there is a greater variety of charge point operators and processes outside of Scotland – leading to a number of associated issues7. For example, ChargePlace Scotland is a government owned network in which users pay a £20 annual fee for free charging at the majority of its 1,800 charge points. Whereas, in England there are many more operators - leading to drivers having to sign up to several different networks and use multiple Radio-Frequency Identification (RFID) cards.
However, while the Scottish approach currently results in a more convenient experience, in order to meet the growing demand private networks will need to be encouraged to invest too.
3.3. European Public Charging Infrastructure
The latest data from the European Alternative Fuels Observatory (EAFO) shows that as of July 2021, there are over 320,000 charge points across Europe8 serving an EV stock of 3.6 million. This gives an EV to charge point ratio of 11, an increase of 0.1 since the end of 2020.
Table 3: Breakdown of public charging infrastructure in Europe
Country Public charge points
% of European charge points
Electric vehicles
% of European EVs
2021 EV market share9
EVs per charge point
Spain 8,020 2.5% 99,192 2.8% 5.7% 12.4 Switzerland 8,042 2.5% 93,853 2.6% 16.4% 11.7 Austria 8,480 2.6% 69,534 2.0% 16.3% 8.2 Belgium 11,222 3.5% 126,121 3.5% 14.9% 11.2 Sweden 13,854 4.3% 223,064 6.3% 37.0% 16.1 Italy 17,397 5.4% 129,471 3.6% 7.1% 7.4 Norway 19,119 5.9% 483,532 13.6% 81.5% 25.3 United Kingdom
33,832 10.5% 505,68610 14.2% 13.7% 14.9
France 45,990 14.2% 471,260 13.2% 14.2% 10.2 Germany 47,076 14.6% 737,063 20.7% 21.6% 15.7 Netherlands 82,263 25.5% 287,790 8.1% 16.3% 3.5 Europe Total 322,783 100.0% 3,560,233 100.0% 14.1% 11.0
Source: EAFO - https://www.eafo.eu/alternative-fuels/electricity/charging-infra-stats
European charging infrastructure is dominated by the Netherlands, Germany, France, the UK, and Norway, which contain 71% of all European chargers. However, other countries such as Italy, Sweden, and Belgium are installing charge points at faster rates than the five leading countries.
7 https://utilityweek.co.uk/ev-drivers-highlight-disparity-between-scotland-and-england/ 8 Refers to EU + European Free Trade Association + Turkey + UK 9 Refers to the % of vehicles registered in 2021 to date that are electrically powered 10 EAFO figures for EV count and charge points are believed to be a few months out of date, and do not reflect the UKs actual current total. EAFO figures have been used for consistency between countries.

23
Figure 16: Charger growth over 2021 to date
Source: EAFO - https://www.eafo.eu/alternative-fuels/electricity/charging-infra-stats
Despite the five leading countries containing the majority of European charge points, only France (10.2) and the Netherlands (3.5) have an EV to charge point ratio below the European average of 11. Furthermore, only the Netherlands has actually improved their ratio from since the end of 2020. This would indicate that EV registrations are increasing at a faster rate than charge point infrastructure, meaning that charge point installations will have to speed up to meet EV demand.
Figure 17: European EV to charge point ratios
Source: EAFO - https://www.eafo.eu/alternative-fuels/electricity/charging-infra-stats
0%
5%
10%
15%
20%
25%
30%
35%
Belgium Sweden Italy Norway UnitedKingdom
France Germany Netherlands
Europe Average
-
5.0
10.0
15.0
20.0
25.0
30.0
2020 ratio 2021 ratio 2021 European average

24
3.4. Transport Decarbonisation Plan
On 14 July 2021, the Government released its Transport Decarbonisation Plan. The plan, originally set for release in late 2020 but delayed due to COVID-19, sets out the Governments approach for decarbonising all domestic forms of transport, including road, rail, shipping, and flights – however international shipping and aviation are not covered. The transport decarbonisation plan is published alongside consultations, consultation responses, delivery plans, and policy statements for specific industries. The full suite of documents is as follows:
• Transport Decarbonisation Plan, setting out the government’s commitments and the actions needed to decarbonise the entire transport system in the UK11.
• Consultation on Heavy Goods Vehicles, seeking views on when to end the sale of new non-zero emission HGVs and whether to increase the maximum permissible weights for zero emission and alternatively fuelled HGVs completing domestic journeys12.
• Green Paper for a CO2 Regulatory Framework, proposes options for a carbon dioxide (CO2) regulatory framework for all new road vehicles in the UK13.
• 2035 Delivery Plan, brings together all of the committed funding streams and measures for decarbonising cars and vans into a single document14.
• Smart Charging Consultation Response, commits to laying legislation later this year to ensure that all private EV chargepoints meet smart charging standards15.
• Jet Zero Consultation, sets out the proposed approach and principles to reach net zero aviation by 205016.
• Rail Electrification Policy Statement, sets the direction for the rail industry on environment issues and inform the forthcoming sustainable rail strategy17.
Key commitments and policy directions from transport decarbonisation plan and smart charging consultation response are summarised below.
Transport Decarbonisation Plan In order to set out a plan to decarbonise the UK’s transport system, the scope of emissions considered must first be defined. This plan considers greenhouse gas (GHG) emissions produced by use of the UK’s transport system, with low-carbon fuel considered zero-emission (unless there is a fossil element), this is in line with carbon budget accounting rules. GHG emissions from associated infrastructure such as stations, ports, and airports are not included in the modelling, but are covered in other sections of the document.
11 Transport Decarbonisation Plan - https://assets.publishing.service.gov.uk/government/uploads/system/uploads/attachment_data/file/1002285/decarbonising-transport-a-better-greener-britain.pdf 12 HGV consultation https://www.gov.uk/government/consultations/heavy-goods-vehicles-ending-the-sale-of-new-non-zero-emission-models 13 Green Paper on CO2 framework https://www.gov.uk/government/consultations/co2-emissions-regulatory-framework-for-all-newly-sold-road-vehicles-in-the-uk 14 2035 Delivery Plan https://assets.publishing.service.gov.uk/government/uploads/system/uploads/attachment_data/file/1001999/transitioning-to-zero-emission-cars-and-vans-2035-delivery-plan.pdf 15 Smart Charging Response https://www.gov.uk/government/consultations/electric-vehicle-smart-charging 16 Jet Zero https://www.gov.uk/government/consultations/achieving-net-zero-aviation-by-2050 17 Rail Electrification https://www.gov.uk/government/publications/environmental-sustainability-on-the-railway-stating-our-priorities

25
Emissions associated with transport construction are out of scope of this document but are considered elsewhere. GHG emissions associated with power generation and distribution for transport are considered in the Energy White Paper.
The paper sets out six strategic priorities which reflect the themes and view of the future that the government aims to pursue.
Figure 18: Transport decarbonisation strategic priorities
Source: Transport decarbonisation plan - https://www.gov.uk/government/publications/transport-decarbonisation-plan
Based on these six strategic priorities, the plan identifies 12 commitment areas and 78 specific commitments that aim to outline how the UK is going to achieve net zero transport. The first six commitment areas relate to direct decarbonisation, covering active transport, buses and coaches, railways, personal vehicles, maritime, and aviation. Transport is the largest contributor to UK domestic GHG emissions, responsible for 27% in 2019. Of these six areas, personal vehicles represent the largest source of carbon emissions

26
Figure 19: Baseline emissions as a percentage of total transport emissions
Source: Transport decarbonisation plan - https://www.gov.uk/government/publications/transport-decarbonisation-plan
As personal vehicles represent the largest source of emissions, they also have the largest potential emissions savings by 2050. If the transport decarbonisation plan is successful in achieving its goals, 1,341 MtCO2e will be saved by 2050, with 55% of those savings coming from the decarbonisation of personal vehicles.
Figure 20: GHG emissions saved by 2050 (MtCO2e)
Source: Transport decarbonisation plan - https://www.gov.uk/government/publications/transport-decarbonisation-plan
The second six areas cover enablers such as logistics, the allocation of decarbonisation measures to various regional authorities, and maximising the benefit of low-carbon fuels. These are the wider issues that need to be considered to obtain a fully zero carbon transport system.
3%
2%
88%
6%
1%
Buses and coaches
Railways
Personal vehicles
Maritime
Aviation
3.536
21.5
735205
340
Walking andcycling
Buses andcoaches
Railways
Personalvehicles
Maritime
Aviation

27
This section of the report will summarise the key commitments and analyse their potential impact for UK Power Networks and the country as a whole. A further, more detailed breakdown of the individual commitments and their impacts is available in Appendix B, at the end of this report.
Highlights – EVs
• 100% of the Government fleet of cars and vans to be zero emission by 2027. Same target for the 9,550 vehicles in the Network Rail fleet. Network Rail to establish 10 pilot sites as charging centres. In London all new cars and vans across the GLA group (includes TfL, Fire Service, Mayor’s office for Policing) to be “zero emission capable” by 2025.
• All new buildings with parking spaces must include Charge Points.
• Target for minimum 6 high-power charge points at every motorway service area (MSA) by 2023.
• Local authorities to have new powers to manage local public transport and duties to ensure charging infrastructure meets local needs. Government will make quantifiable carbon reductions a fundamental part of local transport planning and funding and will embed transport decarbonisation principles in spatial planning guidance. Government will also supply an EV Infrastructure guide and toolkit for them, a £90m new Local EV Infrastructure Fund from summer 2022 to support larger on-street charging schemes, more cash for improving air quality and support for 4,000 new zero-emission buses and the infrastructure which supports them, in addition to the £170m for 800 green buses already committed for the current year.
• The EV Home Charge Scheme and the Workplace Charging Scheme will be retained at least until March 2025 but the former will be focused on leaseholders, renters and those in flats from April 2022.
• Plug in grants for cars and vans will be kept until at least March 2023. Company car EV tax incentives are safe until March 2025.
• Ofgem has just published (20 July) a second phase of the Smart Systems and Flexibility Plan (SSFP) to identify what it can do to maximise opportunities to use smart EVs for greater flexibility in electricity markets. This is combined with an Energy Digitalisation Strategy and two consultations on V2X and on energy storage.

28
Highlights – Other Transport
• Railway stations to be managed in future by Great British Railways (Railtrack successor) rather than the transport service operators. Targets will be set for generation and use of renewable energy at stations. Research also into lineside renewables to help power the trains.
• Consultation in winter 2021/22 on shore power18 for vessels in port and for ports themselves. In 2022 a strategy will be set out for zero carbon maritime transport by 2050.
• All diesel-only trains gone by 2040. Electrification is likely to be the main way of decarbonising the majority of the network. However, hydrogen and battery trains will also be explored, with the most appropriate technology being used for each route. The first priority for electrification will be to infill gaps to key ports and terminals for freight.
• Proposal that from 2035 no new carbon-emitting HGVs below 26 tonnes, five years longer transition for larger trucks.
• Consultations to follow on mandatory zero-emission coaches, motorbikes, quad bikes, 3-wheelers, and all other vehicles.
Electric Vehicle Smart Charging Consultation Response The time of day at which an EV charges can have significant implications for the electricity system, if all EV owners charge their car during peak hours, it would necessitate significant network investment with the cost being passed onto customers. Smart charging, where EV owners shift their charging times outside of peak hours, can alleviate the impact of widespread EV uptake on the electricity network. The government has powers to mandate that all EV charge points have smart functionality, and consulted on whether this would be of benefit during the second half of 2019.
In the consultation, the government outlined its aim to increase the use of smart charging technologies, and proposed four objectives to underpin any smart charging policy: Consumer uptake, Innovation, Grid protection, and Consumer protection. They stated that these aims and objectives are unlikely to be met without regulatory intervention. The desired outcome of the consultation was to implement policy that will increase smart charging uptake, while meeting seven requirements:
• Smart chargepoint functionality • Cyber and data security • Interoperability • Default smart charging • Grid stability • Safety • Monitoring and metering of energy consumption
Based on positive feedback from the consultation, a two phased approach for smart charging policy was proposed. The first phase will deal with the charging device itself, however issues relating to interoperability, cyber security, and grid stability cannot be fully addressed through policy relating to the individual device, and so a second phase was required.
18 Also known as cold-ironing or alternative marine power, is the process of providing electrical power from the shore to a ship while it's docked, thereby allowing a ships's auxiliary engines to be turned off and the burning of diesel fuel to cease. https://clearseas.org/en/blog/shore-power-why-does-it-matter/#:~:text=Shore%20power%2C%20also%20known%20as,of%20diesel%20fuel%20to%20cease.

29
Table 4: Key phase one policy positions by requirement
Requirement Policy position Smart charging functionality
Government will mandate that all private chargepoints must be smart
Cyber and data security Government will mandate requirements in line with an existing cyber security standard
Interoperability Government will require that chargepoints must not be designed so as to prevent compatibility with any energy supplier
Default smart charging Government will mandate that, during set-up, chargepoints must require EV drivers to set charging preferences and schedules. In addition, these schedules must be pre-set to not charge at peak times
Grid stability Government will mandate a randomised delay function, to help address grid stability concerns arising from smart charging
Safety Government will mandate that chargepoints should operate in a way that prioritises chargepoint safety.
Monitoring and metering of energy consumption
Government will mandate that the chargepoint must measure or calculate the electricity consumed and/or exported, the time the charging event lasts, and provide a method for the consumer to view this information Source: Electric vehicle smart charging: final outcome -
https://assets.publishing.service.gov.uk/government/uploads/system/uploads/attachment_data/file/1001895/electric-vehicle-smart-charging-final-outcome.pdf
As a result of the consultation, the government will notify the World Trade Organisation of the phase one smart charging legislation in Summer 2021, ahead of laying the legislation in Autumn 2021. Most requirements within the legislation will be enforceable 6 months after the laying date, from Spring 2022. As they may require more extensive hardware and software changes, the cyber security requirements will be enforced from Autumn 2022.
The second phase is currently undergoing a call for evidence, which will inform the phase two policy when it is legislated. Since the publication of the Phase Two call for evidence, Government has increased the scope of policy development in this area to take a more holistic approach across a broad range of smart devices and systems, beyond EV smart chargepoints alone. Future policy development will consider all organisations performing a “load controlling” role, including electricity aggregators and chargepoint operators.

30
4. Generation, Flexibility, and Storage
4.1. UK Generation Mix
Electricity generated by Major Power Producers (MPPs) totalled 71TWh in 2021 Q1, which is almost the same as the generation in 2020 Q4 (quarterly increase of 0.3%). Renewables accounted for 26TWh (37%) of the generation, representing a slight 2% increase from the previous quarter. However, it is worth noting that the amount of renewable generation in 2021 Q1 is 14% less than in 2020 Q1, as wind generation was down by 4TWh (from 23TWh to 19TWh) due to calmer weather19. As the total electricity generated between these two quarters only differs by 2% (71TWh in 2021 Q1 and 72TWh in 2020 Q2), gas generation has been increased to meet this supply gap.
Figure 21: Annual UK generation mix - long term trend
Source: UK Government statistics - https://www.gov.uk/government/statistics/electricity-section-5-energy-trends
Looking at the UK generation mix in 12 months to March 2021, renewables made up 36% (offshore wind 16%, onshore wind 10%, bioenergy 8% and solar 2%) of the total, which is 1% lower than last reported due to a drop in offshore wind output. Coal generation remains at the low level of 2%. Following the recent Government’s announcement of advancing the phase out of coal from the energy mix to October 202420, it is foreseeable that the amount of coal generation will decrease further in the decarbonised energy system.
19https://assets.publishing.service.gov.uk/government/uploads/system/uploads/attachment_data/file/997347/Energy_Trends_June_2021.pdf 20 https://www.gov.uk/government/news/end-to-coal-power-brought-forward-to-october-2024
- 50.00 100.00 150.00 200.00 250.00 300.00 350.00 400.00
- 20.00 40.00 60.00 80.00
100.00 120.00 140.00 160.00
Tota
l Gen
erat
ion
Capa
city
(TW
h)
Capa
city
(TW
h)
All Renewables Coal Nuclear Gas Wind Total Generation
Renewables accounted for 26TWh (37%) of the electricity generated by major power producers in 2021 Q1. This is 14% less than in 2020 Q1, as wind generation was down by 4TWh (from 23TWh to 19TWh) due to stiller weather.
According to Solar Media Market Research, as of May 2021, there is 1.3GW of operational battery storage in the UK, of which 130MW was commissioned within the year.

31
Figure 22: UK generation mix - 12 months to March 2021
Source: UK Government statistics - https://www.gov.uk/government/statistics/electricity-section-5-energy-trends
Considering the change in generation mix between 12 months to March 2021 and 12 months to March 2020, energy generated from renewables remains almost the same with a slight increase of 0.3%. Gas, nuclear and coal saw a collective drop in generation of 14TWh, while there is a collective 0.5TWh increase in wind, bioenergy and solar generation.
Figure 23: UK Generation mix – variation between 12 months to March 2021 and the 12 months to March 2020
Note: Renewables highlighted in red
Source: UK Government statistics - https://www.gov.uk/government/statistics/electricity-section-5-energy-trends
Coal2%
Oil0%
Gas42%
Nuclear18%
Hydro2%
Offshore Wind16%
Solar2%
Bioenergy8%
Other fuels0%
Onshore Wind10%
-5%
-12%
-37%
-11%
-6%
6%
-9%
1%
-21%
9% 9%
0%
-5%
-40%
-30%
-20%
-10%
0%
10%
20%
Renewables (36%)

32
Total electricity generated in 2021 Q1 and 2020 Q4 was both 71TWh. Only two sources, nuclear and offshore wind, saw reduced generation during the period because of the delayed maintenance schedule and low wind speed21.
On the other hand, solar generation has recorded a quarterly increase of 54%. This positive trend is expected to continue as there are longer daylight hours as it moves into spring and there is an additional of 175MW solar capacity installed during the first quarter of the year22.
Table 5: UK generation- quarterly trend
Technology 2021 Q1 (TWh)
2020 Q4 (TWh)
2020 Q1 (TWh)
Quarterly increase Annual increase
Gas 29 27 24 5% 23% Nuclear 10 13 12 -20% -12% Solar 1 0 1 54% -8% Offshore wind 11 12 13 -7% -15% Onshore wind 7 7 9 14% -21% Bioenergy 6 5 5 13% 6% Total Electricity Generated 71 71 72 0% -2% Total Renewables 26 26 30 2% -14%
Source: UK Government statistics - https://www.gov.uk/government/statistics/electricity-section-5-energy-trends
21https://assets.publishing.service.gov.uk/government/uploads/system/uploads/attachment_data/file/997347/Energy_Trends_June_2021.pdf 22 https://www.powerengineeringint.com/renewables/the-uk-expands-solar-pv-capacity-to-14-gw-in-the-first-quarter-of-2021/

33
4.2. UK Storage
According to Solar Media Market Research23, as of May 2021, there is 1.3GW of operational battery storage in the UK, of which 130MW was commissioned within the year. There are 686 projects in the pipeline, totalling a capacity of over 16GW. Approximately 80% of these projects (546 sites) have a planned capacity greater than 5MW. The next steps are to see if the remaining pipeline projects have been approved and their commissioning dates. 9.2GW across 325 sites have obtained planning approvals, with 3.2GW across 100 sites is expected to be deployed within the next 12-18 months.
Regarding the capacity of theses 100 sites, 48 of them are large capacity sites with ratings over 30MW, 21 sites between 20MW and 30MW, 16 sites between 10MW to 20MW and only 15 sites are between 5MW and 10MW. As large capacity sites are usually stand-alone projects rather than co-located, this implies that the majority of projects to be commissioned within the next 12-18 months will be stand-alone. Depending on the projects’ progress, the study further identified a capacity of 298MW across 10 sites that have the potential to be commissioned either within this year or in early 2022.
Figure 24: Analysis of UK energy storage projects in pipeline
Source: Solar Media- https://marketresearch.solarmedia.co.uk/products/uk-battery-storage-project-database-report
Out of these 10 sites, 80% of the capacity will be built in the south of the UK, with almost 140MW and 100MW located in the South East and South West respectively. Almost all sites will be stand-alone, except one 25MW project which will be co-located with solar and wind. Furthermore, one of the sites will provide power for ultra-rapid electric vehicle charging.
23 https://go.pardot.com/l/83602/2021-05-20/h5bmkq/83602/1621530533KdbSNsUR/Top_ten_UK_battery_storage_projects_forecast_for_2021_completion.pdf
Total Pipeline
>5MW Sites
Full Application
Approved
Deployed within next 12-18 months
Potential for 2021 deployment
• 686 projects (16.5GW)
• 546 sites (16.2GW)
• 373 sites (10.6GW)
• 325 sites (9.2GW)
• 100 sites (3.2GW)
• 10 sites (298MW)

34
Figure 25: UK energy storage – planned capacity sites greater than 5MW for deployment in 2021 by region
Source: Solar Media- https://go.pardot.com/l/83602/2021-05-20/h5bmkq/83602/1621530533KdbSNsUR/Top_ten_UK_battery_storage_projects_forecast_for_2021_completion.pdf
South West
South East
North West
North Eest
Eastern
0 20 40 60 80 100 120 140 160
Capacity in MW

35
4.3. Distributed Generation in UK Power Network’s Area
As of June 2021, the Embedded Capacity Register (ECR) shows that there is 8GW of large (>1MW) scale distributed generation connected to our networks, with an additional 7.4GW of accepted capacity in the pipeline. Between March and June 2021, the newly connected capacity was mainly fossil, battery storage and biomass. This is quite different from the accepted capacity, in which solar and battery storage are the most popular technologies.
Figure 26: UK Power Networks large scale generation assets
Source: Embedded Capacity Register – June 2021
Looking at the register, solar (36%), battery storage (31%) and other renewables (18%) are the technologies with most accepted capacity. This totals to over 6.2GW and accounts for 85% of the overall accepted capacity.
Figure 27: Accepted and connected capacity by technologies
Source: Embedded Capacity Register – June 2021
Solar23%
Wind onshore8%
Wind offshore
11%
Battery storage4%
Fossil33%
Other7%
Other renewable
10%
CHP0%
Biomass4%
-
500
1,000
1,500
2,000
2,500
3,000
Solar Windonshore
Windoffshore
Batterystorage
Fossil Other Otherrenewable
Biomass
Capa
city
(MW
)
Connected Accepted

36
4.4. Storage Connected in UK Power Network’s Area
There is approximately 296MW of battery storage capacity connected to UK Power Networks as of June 2021, with the majority in EPN. The accepted battery storage capacity in the pipeline is approximately 2.3GW, which is more than 7 times the connected capacity.
Table 6: UK Power Networks storage summary
Area Connected capacity (MW) Accepted capacity (MW) EPN 194 1,299 LPN 3 1 SPN 99 961 UKPN 296 2,261
Source: Embedded Capacity Register – June 2021
Regarding the year totals in accepted counts and capacity, the year to date figure for 2021 is 12 applications for an aggregate capacity of 528MW. This is almost double of the last reported capacity (300MW) and over 80% of last year’s total. Out of these 12 sites, 10 of them (83%) are large capacity sites rated over 30MW.
Figure 28: UK Power Networks' storage applications – up to June 2021
Source: Embedded Capacity Register – June 2021
0
5
10
15
20
25
-
100
200
300
400
500
600
700
800
900
2016 2017 2018 2019 2020 2021
Acce
pted
cou
nt
Acce
pted
cap
acity
in M
W
Number of applications Capacity of applications

37
4.5. Distributed Energy Resources across DNOs
Besides our own ECR, we also analysed the connected distributed energy resources of other DNO groups. Focusing on the six major technologies, namely solar, battery storage, wind, other renewable (including bioenergy), other, and fossil gas, the top three DNO groups are WPD, UKPN and SSE with capacities of 8.2GW, 7.7GW and 4.9GW respectively. Solar is the most popular form of distributed energy resources in both WPD and SSE, with 2.9GW and 2.2GW of capacity already connected. Although UKPN has 2.6GW of solar projects in pipeline, the connected capacity is currently at about 1.8GW, leaving fossil gas (2.4GW) to be the primary form of generation resources.
Regarding battery storage and wind, the DNO groups which have the most connected capacities are UKPN and SPEN respectively. UKPN has nearly 300MW of battery storage at the moment, which translates to almost one third capacity of Great Britain; while WPD is at the second with 215MW (23% of the overall). SPEN has about 2.3GW of wind capacity (29% of the overall), with UKPN following at the second with 1.5GW (19%) and WPD at the third place with 1.3GW.
Figure 29: Connected distributed energy resources by DNO groups
Source: Embedded Capacity Register from DNOs – June 2021
Looking at individual DNOs, EPN has the most connected distributed energy resources across Great Britain at slightly over 5GW. Followed by EMID with 3GW and SSES with 2.8GW. In line with the observation for UKPN and WPD within the DNO groups, solar and fossil gas are currently the most popular types of generation resources within EPN and EMID, totalling 59% and 62% of the total capacity. As for SSES, they have approximately 2GW of solar generation which contributes 70% of their portfolio.
-
1,000
2,000
3,000
4,000
5,000
6,000
7,000
8,000
9,000
UKPN WPD SPEN NPG ENWL SSE
Capa
city
(MW
)
Solar Battery storage Wind Other renewable Other Fossil Gas

38
Figure 30: Connected distributed energy resources across DNOs
Source: Embedded Capacity Register from DNOs – June 2021
Taking a broader view of the distributed energy resources technologies across Great Britain, renewables account for 68% of the total connected capacity (31GW), in which wind and solar have totalled 15.5GW. Situating in Scotland, SPD and SHEPD unsurprisingly have the most wind capacity connected among the DNOs with 1.6GW and 1.1GW respectively. On the other hand, EPN comes first within England (and third overall) at 1GW. When looking at solar capacity, those in the South or South East, namely SSES (2GW), EPN (1.4GW) and SWEST (1GW), already represent almost 59% of the total in Great Britain.
Table 7: Breakdown of connected distributed energy resources in Great Britain
Area Solar (MW)
Battery storage (MW)
Wind (MW)
Other renewable (MW)
Other (MW)
Fossil Gas (MW)
EPN 1,416 193 999 599 315 1,566 EMID 990 43 537 346 255 909 LPN 3 3 - 252 85 239 SPM 271 59 709 338 415 562 WMID 416 93 43 335 273 320 NPgN 91 53 577 633 16 452 ENWL 124 145 513 117 91 591 SHEPD 193 - 1,055 372 485 - SPN 366 99 523 179 305 574 SWALES 507 - 483 163 307 238 SWEST 1,015 79 259 273 202 124 NPgY 112 121 687 504 53 943 SPD 23 40 1,604 396 166 49 SSES 1,971 19 73 289 410 52 Total 7,500 947 8,062 4,796 3,377 6,619
Source: Embedded Capacity Register from DNOs – June 2021
-
1,000
2,000
3,000
4,000
5,000
Capa
city
in M
W
Solar Battery storage Wind Other renewable Other Fossil Gas

39
4.6. Power Potential Project – world-first regional reactive power market
The increasing uptake of renewables in the electricity network comes with challenges to system supply management. These include high voltage in periods of low demand, low voltage under certain fault conditions and thermal constraints during the outage season24. To tackle these challenges, UK Power Networks and National Grid ESO showcased the world’s first trial to provide dynamic voltage control to the transmission system via distributed energy resources (DER) on distribution networks25 – the Power Potential project.
By creating a regional reactive power market and a Distribution System Operator (DSO) platform, namely the Distributed Energy Resources Management System (DERMS), this project enables dynamic voltage control from wind, solar and batteries across Kent and Sussex26 and provides active power support for constraint management and system balancing. In other words, while reactive power from DER provides voltage support, this permits more active power to be transmitted through the lines. This project is expected to save energy consumers over £400m and allow an additional 3.7GW of generation to be connected in the South East area by 2050.
24 https://www.nationalgrideso.com/power-potential 25 https://www.nationalgrideso.com/document/195911/download 26 https://www.energyglobal.com/special-reports/22062021/power-potential-project-carries-out-renewable-energy-trials/
40
5. Economic Indicators
5.1. Price of Fuels
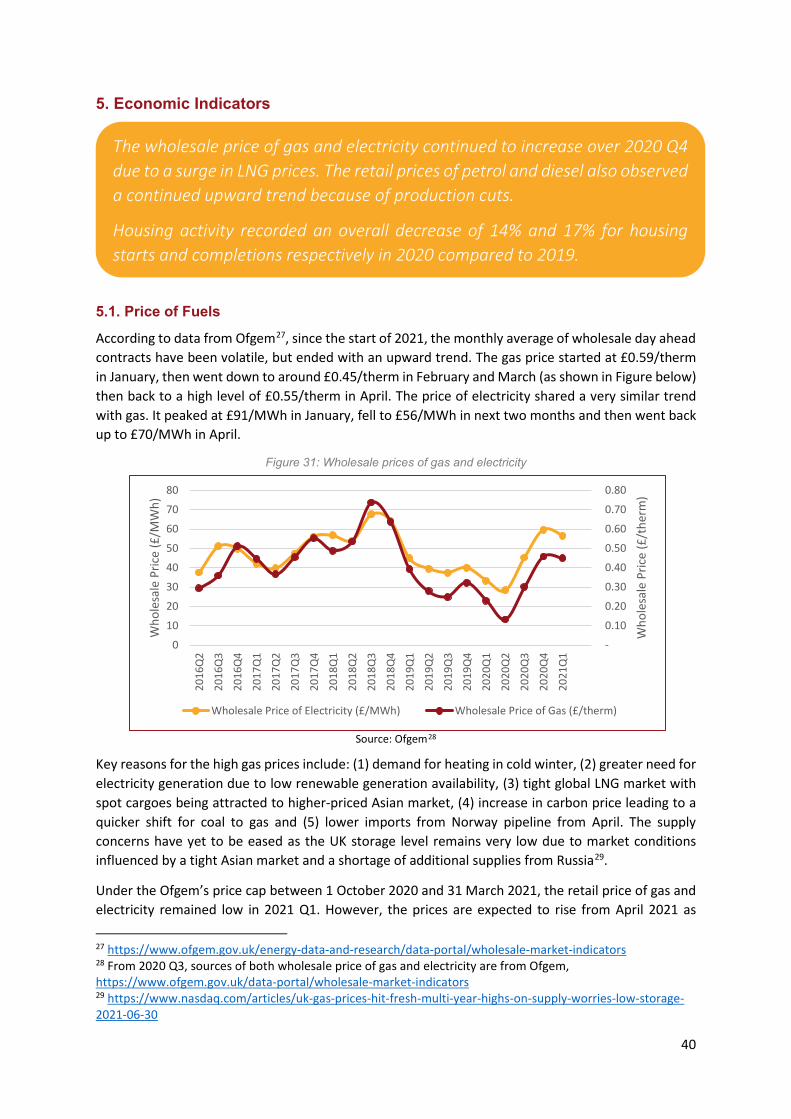
According to data from Ofgem27, since the start of 2021, the monthly average of wholesale day ahead contracts have been volatile, but ended with an upward trend. The gas price started at £0.59/therm in January, then went down to around £0.45/therm in February and March (as shown in Figure below) then back to a high level of £0.55/therm in April. The price of electricity shared a very similar trend with gas. It peaked at £91/MWh in January, fell to £56/MWh in next two months and then went back up to £70/MWh in April.
Figure 31: Wholesale prices of gas and electricity
Source: Ofgem28
Key reasons for the high gas prices include: (1) demand for heating in cold winter, (2) greater need for electricity generation due to low renewable generation availability, (3) tight global LNG market with spot cargoes being attracted to higher-priced Asian market, (4) increase in carbon price leading to a quicker shift for coal to gas and (5) lower imports from Norway pipeline from April. The supply concerns have yet to be eased as the UK storage level remains very low due to market conditions influenced by a tight Asian market and a shortage of additional supplies from Russia29.
Under the Ofgem’s price cap between 1 October 2020 and 31 March 2021, the retail price of gas and electricity remained low in 2021 Q1. However, the prices are expected to rise from April 2021 as 27 https://www.ofgem.gov.uk/energy-data-and-research/data-portal/wholesale-market-indicators 28 From 2020 Q3, sources of both wholesale price of gas and electricity are from Ofgem, https://www.ofgem.gov.uk/data-portal/wholesale-market-indicators 29 https://www.nasdaq.com/articles/uk-gas-prices-hit-fresh-multi-year-highs-on-supply-worries-low-storage-2021-06-30
The wholesale price of gas and electricity continued to increase over 2020 Q4 due to a surge in LNG prices. The retail prices of petrol and diesel also observed a continued upward trend because of production cuts.
Housing activity recorded an overall decrease of 14% and 17% for housing starts and completions respectively in 2020 compared to 2019.
-
0.10
0.20
0.30
0.40
0.50
0.60
0.70
0.80
0
10
20
30
40
50
60
70
80
2016
Q2
2016
Q3
2016
Q4
2017
Q1
2017
Q2
2017
Q3
2017
Q4
2018
Q1
2018
Q2
2018
Q3
2018
Q4
2019
Q1
2019
Q2
2019
Q3
2019
Q4
2020
Q1
2020
Q2
2020
Q3
2020
Q4
2021
Q1
Who
lesa
le P
rice
(£/t
herm
)
Who
lesa
le P
rice
(£/M
Wh)
Wholesale Price of Electricity (£/MWh) Wholesale Price of Gas (£/therm)
41
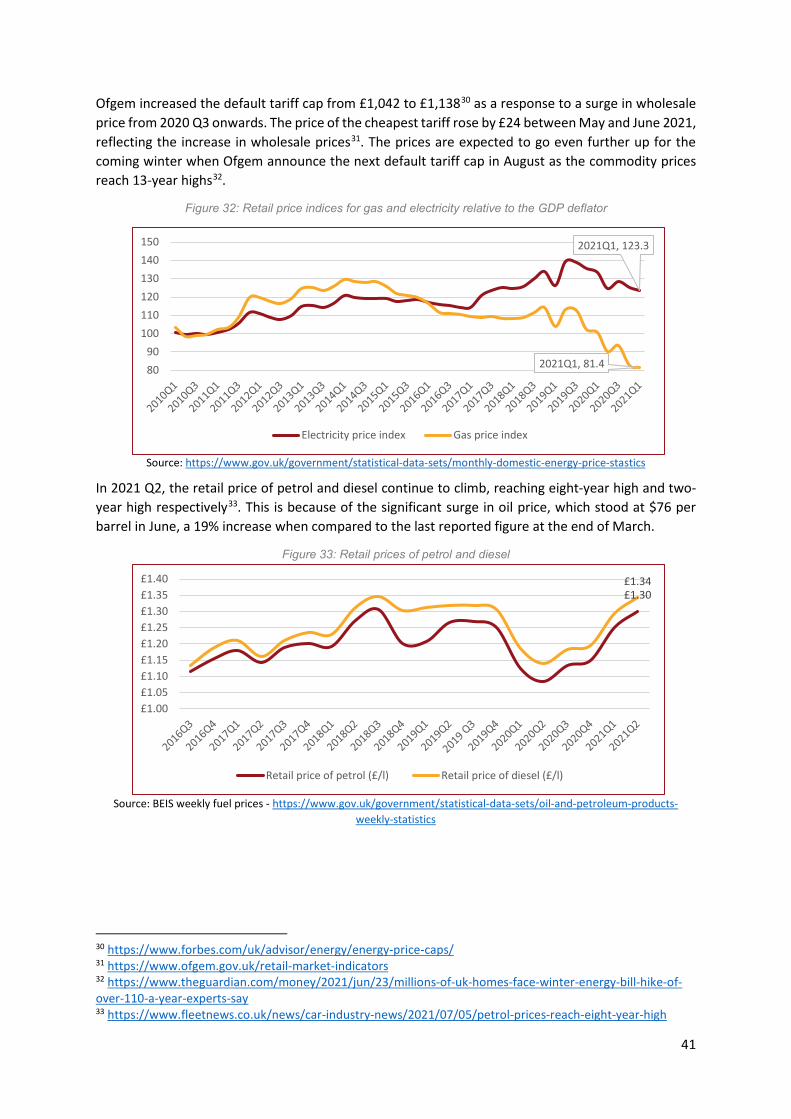
Ofgem increased the default tariff cap from £1,042 to £1,13830 as a response to a surge in wholesale price from 2020 Q3 onwards. The price of the cheapest tariff rose by £24 between May and June 2021, reflecting the increase in wholesale prices31. The prices are expected to go even further up for the coming winter when Ofgem announce the next default tariff cap in August as the commodity prices reach 13-year highs32.
Figure 32: Retail price indices for gas and electricity relative to the GDP deflator
Source: https://www.gov.uk/government/statistical-data-sets/monthly-domestic-energy-price-stastics
In 2021 Q2, the retail price of petrol and diesel continue to climb, reaching eight-year high and two-year high respectively33. This is because of the significant surge in oil price, which stood at $76 per barrel in June, a 19% increase when compared to the last reported figure at the end of March.
Figure 33: Retail prices of petrol and diesel
Source: BEIS weekly fuel prices - https://www.gov.uk/government/statistical-data-sets/oil-and-petroleum-products-weekly-statistics
30 https://www.forbes.com/uk/advisor/energy/energy-price-caps/ 31 https://www.ofgem.gov.uk/retail-market-indicators 32 https://www.theguardian.com/money/2021/jun/23/millions-of-uk-homes-face-winter-energy-bill-hike-of-over-110-a-year-experts-say 33 https://www.fleetnews.co.uk/news/car-industry-news/2021/07/05/petrol-prices-reach-eight-year-high
2021Q1, 123.3
2021Q1, 81.48090
100110120130140150
Electricity price index Gas price index
£1.30£1.34
£1.00£1.05£1.10£1.15£1.20£1.25£1.30£1.35£1.40
Retail price of petrol (£/l) Retail price of diesel (£/l)

42
5.2. Interconnectors with other countries
Interconnectors in Great Britain are high-voltage under-sea cables that allow electricity to be exchanged with neighbouring countries at transmission level. Other than ensuring the security of supply at times of rapid changes in supply and demand, interconnectors also help in decarbonising our generation mix while keeping the consumers’ bills low by providing an alternative means to import power from cheaper generation sources abroad. At the moment there is 6GW of interconnector capacity connected to Great Britain, including the latest IFA2 project which just started operating at full capacity (1GW) at start of this year34.
Table 8: Great Britain’s existing electricity interconnector capacity
Project Name Connecting Country Capacity IFA and IFA2 France 3GW BritNed Netherlands 1GW Nemo Link Belgium 1GW Moyle Northern Ireland 500MW East West Republic of Ireland 500MW
Source: Ofgem - https://www.ofgem.gov.uk/energy-policy-and-regulation/policy-and-regulatory-programmes/interconnectors
Figure 34: Map of Great Britain’s Interconnectors
Source: https://www.ft.com/content/399c1c37-3f7a-4770-af13-66741df01135
34 https://www.current-news.co.uk/news/uks-second-interconnector-with-france-starts-flowing-at-full-capacity-in-latest-feat-of-world-class-engineering

43
North Sea Link – A corridor for renewables between the UK and Norway Construction work of North Sea Link (NSL), the world’s longest subsea cable interconnector (at 720km) linking between the UK and Norway, was completed in June 202135. This project has a capacity of 1.4GW and aims to maximise the use of renewables at both ends. As the primary renewable sources for the two countries are both subject to weather conditions (wind for the UK and hydropower for Norway), the NSL enables the energy systems to complement and manage fluctuations in supply and demand. For example when demand in the UK is high and the wind generation is low, up to 1.4GW of power can flow from Norway to ensure the system is balanced36. The NSL is now under testing and will begin its trial operations in October this year37.
Figure 35: North Sea Link connecting the UK (at Blyth) and Norway (at Kvilldal)
Source: https://northsealink.com/en/the-project/what-is-an-interconnector/
Neuconnect – First interconnector between two of the Europe’s largest energy markets Neuconnect, a 1.4GW interconnector project under planning between the UK and Germany, has reached two important milestones in June: (1) obtained an updated UK interconnector licence from Ofgem and (2) new energy legislation passed in Germany under which Neuconnect will operate38. This £1.4bn project received support from both governments as well as commitments from global investors. Targeting a financial close in September, the construction work is scheduled to start in 2022.
35 https://northsealink.com/en/news/final-cable-laid-for-world-s-longest-subsea-electricity-link/ 36 https://northsealink.com/en/the-project/why-connect-norway-and-the-uk/ 37 https://www.reuters.com/article/us-norway-britain-powertrading-idUSKCN2DL1K2 38 https://neuconnect-interconnector.com/boris-johnson-and-angela-merkel-outline-support-for-first-ever-uk-german-energy-link-as-global-investors-commit-to-deliver-1-4bn-neuconnect-project/

44
Future Interconnectors with Regulatory Approval According to National Grid, the UK Government has an ambition to bring up the interconnector capacity to 18GW, realising £20bn of cost savings for homes and businesses between 2020 and 204539. As of June 2021, the approved future projects have reached 9.9GW (details in table below).
Table 9: Great Britain’s planned electricity interconnector capacity with regulatory approval
Project Name Connecting Country Capacity Estimated Delivery Date North Sea Link (NSL) Norway 1400MW 2021 ElecLink France 1000MW 2022 Viking Link Denmark 1400MW 2023 Greenlink Ireland 500MW 2023 GridLink France 1400MW 2024 NeuConnect Germany 1400MW 2024 NorthConnect Norway 1400MW 2025 FAB Link France 1400MW 2025
Source: Ofgem - https://www.ofgem.gov.uk/energy-policy-and-regulation/policy-and-regulatory-programmes/interconnectors
39 https://www.nationalgrid.com/stories/engineering-innovation-stories/why-interconnectors-play-essential-role-our-net-zero-future

45
5.3. Housing Activity
Housing starts in 2021 Q1 have recorded a significant increase when compared to the previous quarter. There were over 45,000 housing starts across England in the first three months of 2021, representing a 23% increase from the 2020 Q4 and 36% increase from 2020 Q1.
Figure 36: Housing starts in England
Source: Housing livetable 253a
The UKPN licence area has recorded a greater quarterly increase (38%) than England overall (23%) in housing starts between 2021 Q1 and 2020 Q4. This is mainly contributed by the huge increase from SPN at 68% and EPN at 42%. A similar pattern is observed between the 2021 Q1 and 2020 Q1 figures, in particular there was an 88% annual increase for SPN region.
Table 10: Housing starts
Area 2021 Q1 2020 Q4 2020 Q1 Quarterly increase (%)
Quarterly increase
Annual increase (%)
Annual increase
EPN 8,286 5,855 6,757 42% 2,430 23% 1,528 LPN 2,526 2,616 1,952 (3%) (90) 29% 575 SPN 5,148 3,058 2,731 68% 2,090 88% 2,417 UKPN 15,960 11,530 11,440 38% 4,430 40% 4,520 England 45,410 36,770 33,360 23% 8,640 36% 12,050
Source: Housing livetable 253a
8,286
2,526
5,148
15,960
45,410
-
5,000
10,000
15,000
20,000
25,000
30,000
35,000
40,000
45,000
50,000
-
2,000
4,000
6,000
8,000
10,000
12,000
14,000
16,000
18,000
EPN LPN SPN UKPN England

46
Housing completions decreased slightly between 2021 Q1 and 2020 Q4. In 2021 Q1 there were 44,000 housing completions across England, which is 16% less than the previous quarter but 22% more than 2020 Q1.
Figure 37: Housing completions in England
Source: Housing livetable 253a
The trend in housing completions within UKPN’s licence area (-14%) is similar to that of England (-16%), with SPN, EPN and LPN recording a decrease of 1%, 13% and 27% respectively. Despite the quarterly decrease, the three areas have achieved a collective increase of 23% when compared to figures in 2020 Q1.
Table 11: Housing completions
Area 2021 Q1 2020 Q4 2020 Q1 Quarterly increase (%)
Quarterly increase
Annual increase (%)
Annual increase
EPN 7,339 8,440 6,633 (13%) (1,101) 11% 707 LPN 4,052 5,538 2,950 (27%) (1,486) 37% 1,102 SPN 4,248 4,292 3,117 (1%) (43) 36% 1,132 UKPN 15,460 18,270 12,700 (14%) (2,630) 23% 2,940 England 44,430 53,180 36,500 (16%) (8,750) 22% 7,930
Source: Housing livetable 253a
7,339
4,052
4,248
15,640
44,430
0
10,000
20,000
30,000
40,000
50,000
60,000
0
5,000
10,000
15,000
20,000
25,000
EnglandUKPN
EPN LPN SPN UKPN England

47
6. Net Zero Policies and Pathways
6.1. Overview
This Market Intelligence Report will summarise the following documents and reports:
Figure 38: Overview of Net Zero Polices and Pathways chapter
Source: Contents of this chapter
•Policy Tracker•Climate Change Committee Progress Report•Transport Decarbonisation Plan•Policy update on smart systems and flexibility
Net Zero Policies
•Government research on public preceptions•Ofgem Consumer Survey 2020Public Awareness
•RIIO-ED2 Business Plan•National Grid Future Energy Scenarios 2021Net Zero Pathways
All six DNOs across Great Britain have now submitted their draft business plans for the RIIO-ED2 price control, which runs from 2023 to 2028, to Ofgem. The total spend requested by the six DNOs amounts to £23.2 billion, a 25% increase on the previous price control RIIO-ED1.
The Climate Change Committee (CCC) published two reports, “Progress in reducing emissions” and “Progress in adapting to climate change”, along with over 200 policy recommendations to the Parliament on 24 June 2021.
National Grid ESO launched their latest annual Future Energy Scenarios (FES 2021) on 12 July 2021. FES outlines the four different, credible pathways for the future of energy between now and 2050. In this update, FES 2021 reflects recent policy publications, including the Energy White Paper and the Ten Point Plan, as well as introducing three new dedicated sections on COVID-19, Net Zero, and Flexibility.

48
6.2. Net Zero Policies Tracker
The progress update for the Government’s scheduled activities on net zero policies are as follows:
Table 12: Net Zero Policies Tracker
Scheduled Activities Progress as of mid- July 2021 Q1 2021 Publish Heat and Buildings Strategy Pending. The government has announced £44 million of
funding for low-carbon energy buildings40 (of which £30 million will fund three heat network projects in south-east London, Manchester and Cambridgeshire) on 28 May 2021.
Q1 2021 Consult on new regulations in phasing out fossil fuels in off-grid buildings and policy approaches for development of heat pump market
Pending. Consultation will be carried out with the publication of the upcoming Heat and Buildings Strategy41.
Q1 2021 Publish Hydrogen Strategy Pending. Expected to be published this summer42 Q1 2021 Department for Transport to respond to consultation
on EV chargepoints in homes/businesses Announced Electric Vehicle Homecharge Scheme (EVHS) and Workplace Changing Scheme (WCS) worth up to £50million43.
Q2 2021 Publish Greening Government Commitments Pending. Q2 2021 Publish Energy Data Strategy with Ofgem Energy Data Taskforce is succeeded by Energy
Digitalisation Taskforce (EDiT)44. The Government and Ofgem published a new Smart Systems and Flexibility Plan45 and Energy Digitalisation Strategy46 on 20 July 2021.
Q2 2021 Publish a new Smart Systems Plan on grid flexibility with Ofgem
Q2 2021 Launch competition for longer duration energy storage and flexibility challenges
“Longer Duration Energy Storage Demonstration Innovation Competition” with up to £68 million funding is now under application stage47.
Q2 2021 Publish Transport Decarbonisation Plan Published on 14 July 202148. Q2 2021 Publish Industrial Decarbonisation Strategy Published on 17 March 202149. Q2 2021 Consultation on Heat Networks and Local Authorities 8-week consultation on proposals to improve the latest
Standard Assessment Procedure (SAP) to assessing homes connected to heat networks50.
Q2 2021 Publish Green Jobs Taskforce’s Action Plan Published on 14 July 202151.
Source: UK Government
40 https://www.gov.uk/government/news/44-million-cash-boost-to-cut-emissions-from-buildings-and-help-households-save-on-energy-bills 41 https://questions-statements.parliament.uk/written-questions/detail/2021-05-25/7075/ 42 https://www.spglobal.com/platts/en/market-insights/latest-news/electric-power/072321-uk-government-misses-latest-hydrogen-strategy-deadline 43 https://www.gov.uk/government/news/support-for-small-businesses-landlords-and-leaseholders-government-charges-up-the-electric-vehicle-revolution-with-50-million-boost 44 https://es.catapult.org.uk/news/energy-digitalisation-taskforce-launches/ 45 https://www.gov.uk/government/publications/transitioning-to-a-net-zero-energy-system-smart-systems-and-flexibility-plan-2021 46 https://www.gov.uk/government/publications/digitalising-our-energy-system-for-net-zero-strategy-and-action-plan 47 https://www.gov.uk/government/publications/longer-duration-energy-storage-demonstration/proposal-for-the-longer-duration-energy-storage-demonstration-innovation-competition 48 https://www.gov.uk/government/publications/transport-decarbonisation-plan 49 https://www.gov.uk/government/publications/industrial-decarbonisation-strategy 50 https://www.gov.uk/government/consultations/standard-assessment-procedure-sap-102-proposals-for-updates-for-heat-networks 51 https://www.gov.uk/government/publications/green-jobs-taskforce-report

49
6.3. Climate Change Committee (CCC) Progress Reports to Parliament
On 24 June 2021, the Climate Change Committee (CCC) published two reports, Progress in reducing emissions52 and Progress in adapting to climate change53, along with over 200 policy recommendations to Parliament54. Despite the Government adopting the new Sixth Carbon Budget in April55, the CCC has urged to the UK to turn ambition into policy and real-world delivery, particularly in plans to decarbonise buildings.
This section of the Market Intelligence Report focuses on the “Progress in reducing emissions” report. Starting with an overview of emissions in 2020, there is a discussion on the impact of COVID-19 on potential consumer behaviour change, which leads to the underlying progress on decarbonisation. After this we review whether the Government’s ambitions are in line with the CCC’s recommended pathway (the Balanced Pathway) to net zero. Finally, we highlight some of the CCC’s recommendations to Government on next step priorities for three sectors – surface transport, buildings and electricity supply.
Impacts of COVID-19 on emissions The CCC provisionally estimates the UK emissions fell by around 13% in 2020. This is a record decrease due to the COVID-19 pandemic lockdown, with the largest falls in aviation (-60%), shipping (-24%) and surface transport (-18%). However, the CCC views most of the falls in sectoral emissions as transient and are likely to rebound in 2021 as lockdown is eased. The CCC state this is because the emission reductions do not reflect structural changes in the underlying economic, social, energy, transportation or land systems. Having said that, the CCC also recognises there is a potential for some longer-lasting impacts of the pandemic from the changes in working and transport behaviour. We can start by comparing the annual emissions change between 2018-19 and 2019-20 in selected sectors below.
Figure 39: Potential impacts of COVID-19 - emissions change in 2018-19 and 2019-20 by sector
Source: CCC Progress in reducing emissions 2021 report (N.B. Figures on buildings in 2018-19 and 2019-20 based on temperature-adjusted emissions)
52 https://www.theccc.org.uk/wp-content/uploads/2021/06/Progress-in-reducing-emissions-2021-Report-to-Parliament.pdf 53 https://www.theccc.org.uk/wp-content/uploads/2021/06/Progress-in-adapting-to-climate-change-2021-Report-to-Parliament.pdf 54 https://www.theccc.org.uk/publication/2021-progress-report-to-parliament/ 55 https://www.gov.uk/government/news/uk-enshrines-new-target-in-law-to-slash-emissions-by-78-by-2035
SurfaceTransport
ResidentialBuildings
Non-ResidentialBuildings
ElectricitySupply
Average annual change requiredfor the Sixth Carbon Budget -5% -3% -3% -6%
Emissions change 2018-19 -2% -1% -1% -14%Emissions change 2019-20 -18% 7% -4% -15%
-20%
-15%
-10%
-5%
0%
5%
10%
Chan
ge in
ann
ual e
miss
ions

50
• Surface transport: Emissions reduced by 18% during 2019-20, which is significantly more than the 2% reduction recorded between 2018 and 2019. This is primarily because of the drop of travel demand during the pandemic. The CCC commented that the reduced use in public transport may endure due to safety concerns and the continuation of home-working, which could potentially lead to less frequent but longer commutes as people are likely to move out of cities. On another note, it is expected that the increase in walking and cycling can be sustained if the support for necessary infrastructure is maintained and enhanced.
• Residential and non-residential buildings: Direct emissions from residential buildings is the only sector that recorded an increase during 2019-20 because of home-working. As many people can continue to work from home effectively and may prefer it to some degree, it is expected this change in working pattern is likely to be sustained for longer-term and would lead to impact for occupancy of workplaces and energy use in residential and non-residential buildings. However the CCC stated that the net impact on emissions is complex and far from certain.
• Electricity supply: Reduction in non-domestic energy use is the main reason for the drop in energy consumption, and hence a further drop in emissions during 2019-20. The CCC suggested possible changes in this sector will be on the demand profile that depends on extent of structural shifts including more flexible working patterns.
To sustain the progress in reducing emissions, the CCC emphasised that underlying, structural changes to sectors are required. Home working and travel choices are potentially the behavioural changes that will bring lasting impacts. The CCC also made a point that lockdown is not a blueprint for decarbonisation, as Net Zero should be sustainable and aim to bring improvements to quality of life.

51
Comparing CCC Balanced Pathway to Government Ambition The Government announced ambitions in many areas over the past year. The figure below compares government commitments (based on the Ten Point Plan, Energy White Paper as well as the Industrial Decarbonisation Strategy) and the Balanced Pathway in CCC’s the Sixth Carbon Budget.
Figure 40: Comparing Government commitment and CCC Balanced pathway on selected sectors between 2025 and 2035
Source: CCC Progress in reducing emissions 2021 report
Commitments for electric cars and vans, offshore wind and low-carbon hydrogen production is broadly in line with CCC’s Balanced Pathway. However, there are clear gaps in some sectors, particularly on demand side, for example in low-carbon heating, where companies are already voicing out support for increased ambition. The CCC also proposed clarifications on some announced ambitions, namely definitions on which cars can be sold after 2030, in order to meet the Balanced Pathway when all cars sold beyond 2032 should be fully zero-emission. It is expected that the forthcoming Net Zero Strategy will fill the remaining gaps and ensure a credible approach to meeting the Sixth Carbon Budget and Net Zero target.
CCC’s Recommendations on Next Step Priorities By reviewing key progress made across Government on Net Zero over the past year, the CCC has highlighted several cross-cutting issues which must be addressed to enable strategies and plans to be rolled out effectively in various sectors. These are centred around (1) a comprehensive Net Zero strategy, (2) a plan for achieving a just transition, (3) public engagement, (4) a framework for local delivery of the climate objectives at different scales across devolved administrations, regions and local authorities and (5) plans must make climate adaption an integrated part of the transition to Net Zero.
Government Commitment
Phase-out of new fossil fueled vehicle sales by 2030, with allowance for some hybrids
out to 2035.
600,000 heat pump installations / year by 2028.
2TWh of low-carbon heat networks by 2030.
5GW (up to 42TWh) hydrogen by 2030.
40GW offshore wind by 2030.
CCC pathway
Phase-out of all new fossil-fuelled vehicles sales by 2032.
900,000 heat pump installations / year by 2028.
1.1 million installations / year by 2030.
25TWh of low-carbon heat networks by 2030.
30TWh hydrogen by 2030.
40GW offshore wind by 2030.

52
Table 13: Sectoral progress and CCC’s recommendations on next step priorities for selected sectors
Sector Key progress in the past year Next step priorities Surface Transport
- Commitment to a 2030 phase-out date for new petrol and diesel cars and vans in Ten Point Plan - The Gear Change strategy has set out vision for increasing active travel and using modal shift. - The Bus Back Better strategy includes funding for UK production and purchase of zero-emission buses. - The Ten Point Plan committed £20 million initial funding for trials of zero-emission heavy-goods vehicles (HGVs) through two innovation competitions (one battery-electric and the other on hydrogen fuel-cell).
- To restore confidence in public transport. - To prioritise funding away from car use. - To encourage behaviours that reduce travel demand such as working from home – prioritisation of investment in improved digital connectivity. - To encourage behaviours which improve efficiency of travel such as increased car sharing.
Buildings - The Energy White Paper announced a commitment to consult on regulatory measures to improve the energy performance of owner-occupied homes. - Government proposed to legislate in 2024 for the Future Homes Standard to be introduced in 2025. - Government announced an ambition to deliver 600,000 heat pump installations per year by 2028, alongside plans for hydrogen trials from 2023. - BEIS is finalising proposals for the £270 million Green Heat Network Fund.
- Require a long-term trajectory of standards in place to deliver the efficiency upgrades and fossil fuel phase-out. - Plan for how price signals will be reformed to drive low-carbon choices. - Need to ensure householders have access to high quality information and can have confidence that work will be delivered to high standards. - Recognition is needed of the importance of a geographically planned approach to heat decarbonisation, with plans to deliver.
Electricity Supply
- Increase the level of offshore wind capacity four-fold to 40GW by 2030. - Onshore wind and solar now included in low-carbon auctions. - Commitments to publish a new Smart Systems Plan and a new Energy Data Strategy to unlock more of the potential for demand-side flexibility. - Call for evidence on new market design.
- Government to commit phase-out the use of unabated gas for generation by 2035. - Government should set out a schedule and clear pathway of volumes to be procures to provide visibility to the supply chain. - Government to work with Ofgem to deliver the strategic investments for electricity networks. - Develop market design for fully decarbonised electricity system in the 2030s and onwards.
Source: CCC Progress in reducing emissions 2021 report

53
6.4. Policy update on smart systems and flexibility
On 20 July 2021, Department for Business, Energy & Industrial Strategy (BEIS) announced two policy papers and four open consultations (two on technology enablers and two on regulatory models) on enabling a smart, flexible and decarbonised system on the path to net zero.
1. The Smart Systems and Flexibility Plan56 – policy paper with Ofgem. 2. The Energy Digitalisation Strategy57 – policy paper with Ofgem and Innovate UK58. 3. Facilitating the deployment of large-scale and long-duration electricity storage: call for
evidence59 – consultation due on 28 September 2021. 4. Role of vehicle-to-X energy technologies in a net zero energy system: call for evidence60 –
consultation due on 12 October 2021. 5. Proposals for a Future System Operator role61 – consultation with Ofgem due on 28
September 2021. 6. Energy code reform: governance framework62 – consultation with Ofgem due on 28
September 2021.
This section will give a summary on each of these documents.
The Smart Systems and Flexibility Plan A smart and flexible system is one that uses digitalised, or smart, devices with an ability to respond to system signals in real time. This is in order to provide flexibility (the ability to shift consumption or generation of energy in time or location) for balancing supply and demand, as well as managing constraints on the network. With various decarbonisation commitments from the government, it is anticipated that the demand of low-carbon flexibility would increase to 30GW in 2030, and further up to 60GW in 2050 from the 10GW that we have on the system today63. On the economic front, a smart and flexible energy system will reduce the need to build generation and network to meet peak demand, hence saving costs of the system by up to £10bn per year (2012 prices, undiscounted) by 2050.
To speed up the transition to a smarter and more flexible energy system, in coordination with the energy sector, the government and Ofgem developed the Smart Systems and Flexibility Plan 2021 to set out a vision, analysis and suite of policies to drive a net zero energy system64. The paper began with defining low-carbon flexibility to be provided by four means: (1) electricity storage, (2) flexible demand, (3) flexible generation and (4) smart grids and interconnection with other countries, followed by an analysis on the role of flexibility in future. By 2050, the 60GW of flexible capacity in the lowest
56 https://www.gov.uk/government/publications/transitioning-to-a-net-zero-energy-system-smart-systems-and-flexibility-plan-2021 57 https://www.gov.uk/government/publications/digitalising-our-energy-system-for-net-zero-strategy-and-action-plan 58 Innovate UK is part of UK Research and Innovation, a non-departmental public body funded by a grant-in-aid from the UK Government. (https://www.gov.uk/government/organisations/innovate-uk/about) 59https://www.gov.uk/government/consultations/facilitating-the-deployment-of-large-scale-and-long-duration-electricity-storage-call-for-evidence 60 https://www.gov.uk/government/consultations/role-of-vehicle-to-x-technologies-in-a-net-zero-energy-system-call-for-evidence 61 https://www.gov.uk/government/consultations/proposals-for-a-future-system-operator-role 62 https://www.gov.uk/government/consultations/energy-code-reform-governance-framework 63https://assets.publishing.service.gov.uk/government/uploads/system/uploads/attachment_data/file/1003778/smart-systems-and-flexibility-plan-2021.pdf 64 https://www.gov.uk/government/publications/transitioning-to-a-net-zero-energy-system-smart-systems-and-flexibility-plan-2021

54
system cost scenario would be composed of 15GW of storage, 15GW of demand side response and 27GW of interconnection.
The core of this paper outlines the approach to driving flexibility and future thinking on the electricity market including actions on the cross-cutting areas of skills and innovation. Actions for the next phase in smart systems policy are categorised into four areas and summarised below.
1. Overarching actions Innovations and skills are to be developed at pace to deliver a smart and flexible system in line with net zero ambitions, at the same time with significant benefits to the UK economy. The government, Ofgem and industry can monitor and adapt flexibility to a changing policy landscape.
• The government will drive forward innovation through £1bn Net Zero Innovation Portfolio to provide funding for low-carbon technologies and systems, including at least £100 million funding for energy storage and flexibility innovation programmes.
• To support the outcomes of recommendations from the Green Jobs Taskforce, the government and Ofgem will undertake a smart skills gap analysis in 2021.
• The government to identify new indicators and data sources for the flexibility monitoring framework with stakeholders.
2. Facilitating flexibility from consumers
Supported by the right infrastructure and regulatory framework, the vision in the mid-2020s is that consumers of all sizes will be able to provide flexibility to the system. By 2030 and beyond, it will be the norm for EV drivers to use smart charging, and consumers will be able to potentially provide around 13GW in combination with intraday storage. Focus of actions include:
• Smart energy technology – Smart meters are installed in homes and small business, and the government will take powers to regulate energy smart appliances when parliamentary time allows. This include legislating all private electric vehicle charge points must have smart functionality and meet minimum device-level requirements later in 2021. (This has now been implemented – see EV Smart charging response, section 3.4.)
• Flexibility providers – The government to consult an appropriate regulatory approach for flexibility service providers in 2022, and Ofgem will review the baseline transition plan to implement market-wide half hourly settlement in October 2021.
• Cyber security – The government will commission further work to set an enduring approach to monitoring and mitigating cyber security risks across a smart and flexible energy system.
• Consumer protection – Protect consumers who participate in smart tariffs and services, and help build and sustain confidence in engaging with these smart energy offers. The government and Ofgem will help consumers that would otherwise struggle to participate in smart energy, for example by incorporating in fuel poverty strategy and policies.
• Enabling smart buildings – Ensure flexibility is considered across the full range of energy efficiency and heat policies with regulations, assessment methodologies and subsidy schemes and market mechanisms. This include investigating the role of

55
energy storage and smart technologies as part of the Future Homes and Future Buildings Standards. Flexibility will be considered across subsidy schemes such as the Home Upgrade Grant, Performance Based Policy Framework for large commercial and industrial buildings, Public Sector Decarbonisation Scheme, Social Housing Decarbonisation Fund, Heat Network Transformation Programme and Clean Heat Grant.
• Enabling smart electric vehicles – Ofgem to publish a regulatory strategy to support the electric vehicle rollout and maximise consumer benefits later in 2021, and jointly develop a policy statement with the government on maximising the contribution of EV flexibility while protecting the grid in 2022. The government and Ofgem will also work together to progress policy development to ensure network operators have appropriate access to charge point data in summer 2021.
• Enabling smart local energy solutions – The government will continue to work with the Local Energy Hubs to support tailored projects meeting local needs. The government will consider the key strategic decisions that need to be taken on delivering the most suitable and affordable low-carbon heating.
3. Removing barriers to flexibility on the grid: electricity storage and interconnection
Best-in-class regulatory framework for electricity storage at all scales is to be ready in the mid-2020s to increase investors’ confidence and trigger a significant increase in the deployment of storage. By 2030 and beyond, storage will provide significant flexibility to the system, potentially around 13GW when combined with flexible demand. Long duration storage is starting to provide key services to the grid in maximising the use of 40GW of offshore wind and other low-carbon generation. At least 18GW of interconnection capacity should have realised by then. This can be achieved by actions including:
• Electricity storage – Government will use primary legislation, when parliamentary time allows, to define storage as a distinct subset of generation. Through the Net Zero Innovation Portfolio, the government will deliver a competition worth up to £68m support commercialisation of first-of-a-kind longer duration energy storage, for which winners will be announced by end of 2021. The government is conducting a formal review of business rates, including how the system could support the decarbonisation of buildings, which will conclude in autumn 2021.
• Interconnection – The government and Ofgem will look to increase the level of GB interconnector capacity. Ofgem will review its interconnector policy with recommendations to be published in autumn 2021.
4. Reforming markets to reward flexibility
In the mid-2020s, incentivised by new network access and charging arrangements, there will be more efficient and flexible network use. Coordination between electricity distribution and transmission systems will ensure benefits are delivered to the whole system. From 2030 and beyond, ‘full chain’ flexibility will be unlocked, with dynamic, close-to-real-time markets to play an important role in ensuring the most efficient assets are dispatched. Actions relating to distribution flexibility services include:
• Distribution networks to deliver and adopt a standardised approach to procuring flexibility and managing connections across all GB distribution networks by 2023.

56
• Through ENA Open Networks project, networks and the system operator to develop and implement a set of primacy rules to resolve service conflicts between ESO-procured and DSO-procured flexibility by 2023. ESOs to coordinate with DNOs to ensure ESO dispatch of distributed energy resources and distribution network management actions do not conflict, in order to deliver whole electricity system benefits.
• Ofgem intends to consult on distribution network charges (DUoS), including charges that better reflect the value of flexibility in different locations at different times in the distribution network. Decision will be made by Ofgem by the end of this year.
A dedicated monitoring framework65 has been developed to provide a systematic approach for identifying the expected outcomes in this paper.
The Energy Digitalisation Strategy Published alongside with the Smart Systems and Flexibility Plan, with the aim to spur innovation and competition, facilitate new consumer offers and reduce the cost of decarbonising the system, the Energy Digitalisation Strategy sets out a vision and suite of policies to digitalise the energy system66. Digitalisation is crucial in creating a more efficient ‘whole system approach’ as it enables all parts of the energy system, including millions of low-carbon assets such as EVs, heat pumps, solar PV and batteries, to operate flexibly and efficiently.
The strategy67 started with explaining the benefits to digitalise the energy system, the journey so far, the key barriers to system digitalisation and actions required to tackle the barriers. To tackle the three barriers, namely (1) scale of change, (2) culture and incentives, as well as (3) shared infrastructure, nine actions are proposed to reach collective agreement on data sharing practices and standards, hence enabling the data sets to be visible, accessible, high quality and interoperable. These are expected to achieve the benefits of decarbonising at least cost, stimulating economic growth and ensuring fairness across consumers.
65https://assets.publishing.service.gov.uk/government/uploads/system/uploads/attachment_data/file/1003793/smart-systems-appendix-ii-smart-systems-and-flexibility-plan-monitoring-framework.pdf 66 https://www.gov.uk/government/publications/digitalising-our-energy-system-for-net-zero-strategy-and-action-plan 67https://assets.publishing.service.gov.uk/government/uploads/system/uploads/attachment_data/file/1004011/energy-digitalisation-strategy.pdf

57
Figure 41: Barriers and actions to achieve digitalisation in the energy sector
Source: Energy Digitalisation Strategy
The nine actions (key words in bold) are designed to overcome the three barriers, with three actions for each barrier. The government and Ofgem recognised the significant scale of change in digitalisation, therefore they will lead by example by examining the data and digitalisation processed in their own organisations. They will coordinate change by providing tools to facilitate industry collaboration and build momentum through funding a new Energy Digitalisation taskforce, which will be responsible for delivering recommendations for the next phase of energy digitalisation. The first step in leadership and coordination is actually launching this document, UK’s first Energy Digitalisation Strategy, which aims to align visions within the energy sector so all participants can digitalise together in a transparent and efficient way.
To ensure all companies’ digital services work in harmony with each other and across sectors, the government and Ofgem will adhere to an agile regulatory environment by including digitalisation into incentive frameworks such as RIIO-ED2. Digitalisation opportunities will be made available to all through a review of the data practices of networks and other regulated monopolies. Network companies will also need to work with other industries to simplify data collection at the point of asset registration in order to ensure better visibility of small-scale energy assets on the networks.
Data needs to be treated as an asset and that it, and associated digital services, should be transparent and accessible to all. The government and Ofgem will build foundational capabilities through innovative solutions to ensure appropriate tools are available for the sector to leverage data and digitalisation. The government and Ofgem will also stimulate the market to develop new business models and services. To address the current issues which hamper asset registration, there is a plan to transform asset visibility through automation.

58
Table 14: Nine actions in the Energy Digitalisation Strategy
Focus Issue and expected outcome Actions Leadership and coordination
Issue: Significant change required to digitalise the energy system with perceived potential first mover disadvantages. Expected Outcome: Sector has clearly aligned goals and transparent governance to provide businesses with confidence to invest in digitalisation.
1. BEIS, Ofgem and Innovate UK to lead by example, including to comply with Energy Data Best Practice and Ofgem to develop its Data and Digitalisation Strategic Change programme. 2. The government and Ofgem will coordinate change. EnergyREV, Energy Systems Catapult and BEIS will develop a Catalogue of Projects on Energy Data prototype by summer 2021. 3. The government and Ofgem will build momentum by funding and supporting the Energy Digitalisation Taskforce to identify next steps with recommendations by winter 2021/22.
Incentivising change
Issue: Benefits of sharing data are regularly overlooked and lack of incentives means barriers to invest still exists. Expected Outcome: Necessary incentives and regulatory expectations are in place.
4. Ofgem to implement agile regulatory environment regarding data, digitalisation and its market design. This include relevant expectations are included as part of RIIO-ED2 price control, with the intention of requiring network operators to comply with Energy Data Best Practice and Digitalisation Strategy and Action Plan guidance. 5. Ofgem will work with industry to enable market participants and stakeholders to take advantage of digitalisation opportunities by conduct a holistic review in winter 2021/22. 6. The government will work with industry to simplify data collection. Options to achieve will be developed over the second half of 2021, including for a single asset register.
Development of digital solutions
Issue: Current energy system does not have the digital tools, services and standards needed to facilitate data exchange. No investor gain full value from investing in digital infrastructure, nor can they be confident about adoption of their shared infrastructure solution. Outcome: The sector has standards and tools to support data and asset visibility, system maps and architecture that will underpin a future digitalised energy system.
7. The government and Ofgem will build foundational capabilities that enable sector-wide visibility of and access to data. This includes delivering an Energy Data Visibility Project (alpha-phase tool delivered by summer 2021), Energy Networks Association to procure a National Energy System Map (with a proof of concept delivered by Q4 2021) and design the Strategic Innovation Fund for networks by autumn 2021. 8. The government and Ofgem will stimulate the market and deliver real-world solutions, for example Innovate UK’s Modernising Energy Data Applications competition winners will prototyping by summer 2021. 9. The government will look to transform asset visibility by working with industry to identify a long-term, enduring solution to asset registration.
Source: Energy Digitalisation Strategy
Other than delivering the nine actions, it is expected that more actions will be developed as the system digitalises and decarbonises over the coming years, which will be identified by a new Energy Digitalisation Taskforce and the Energy Systems Catapult. This strategy, together with the action plan, provides the sector with a clear vision, direction and shared approach to accelerate the transition to a fully digitalised, net zero energy system.
Facilitating the deployment of large-scale and long-duration electricity storage: call for evidence
As we are transitioning to a net zero world, the increasing use of intermittent renewables in electricity generation means we will need greater amount of flexibility in balancing the demand and supply of the energy system. To replace the high emission unabated gas peaking plants, the industry and government have a growing interest in large-scale and long-duration electricity storage for storing excess renewable energy and discharging it when generation is low.

59
This call for evidence, which closes on 28 September 2021, is looking to understand the following topics of the technology in more detail: the barriers within the current market, how these might be addressed, and the risk that may be associated with potential interventions to support the deployment of large-scale and long-duration electricity storage68.
Role of vehicle-to-X energy technologies in a net zero energy system: call for evidence
EVs present a range of potentials in a flexible energy system69. Not only it can they offer savings for consumers and shift demand peaks with smart charging, the EV battery can also export electricity back to the system in response to signals with vehicle-to-x (V2X). In V2X, “X” can stand for any medium which applies to this technology, for example home (V2H), building (V2B) and electricity grid (V2G). This technology enables the system to have additional flexibility while creating a potential revenue source for users. While its concept have been proven for years, this call for evidence (due on 12 October 2021) is to explore the role of V2X technologies in the energy system, the barriers that might be preventing its mass deployment and the role of government70.
Proposals for a Future System Operator role
In Ofgem’s “Review of GB energy system operation”71 report published earlier this year, there is a proposal to make the system operator fully independent from the transmission network owner, and that there could also be a case for separating key gas network planning functions from the gas transmission owner72. Building on this recommendation, Ofgem and BEIS have jointly launched a consultation on a proposed expert, an impartial Future System Operator (FSO) to oversee both the electricity and gas systems. The aims of establishing the FSO include driving process towards net zero, maintaining security and minimising costs for consumers73. This consultation74 due on 28 September 2021 covers proposals for the independent FSO in three key areas.
1. Proposed roles and functions The FSO will take up all current roles and functions to be carried out by National Grid Electricity System Operator (NGESO) in the electricity system and strategic network planning, long-term forecasting and market strategy functions in the gas system. Furthermore, the FSO is expected to provide targeted advice based on its expertise to support decisions by the Government, Ofgem and other organisations.
68 https://www.gov.uk/government/consultations/facilitating-the-deployment-of-large-scale-and-long-duration-electricity-storage-call-for-evidence 69https://assets.publishing.service.gov.uk/government/uploads/system/uploads/attachment_data/file/1003871/role-of-vehicle-to-x-energy-technologies-in-net-zero-energy-system-cfe.pdf 70 https://www.gov.uk/government/consultations/role-of-vehicle-to-x-technologies-in-a-net-zero-energy-system-call-for-evidence#:~:text=Vehicle%2Dto%2Dx%20(%20V2X,source%20for%20businesses%20and%20consumers. 71 https://www.ofgem.gov.uk/publications/review-gb-energy-system-operation 72 https://www.ofgem.gov.uk/publications/consultation-proposals-future-system-operator-role 73 https://www.gov.uk/government/consultations/proposals-for-a-future-system-operator-role 74https://assets.publishing.service.gov.uk/government/uploads/system/uploads/attachment_data/file/1004044/energy-future-system-operator-condoc.pdf
60
Proposed roles and functions of the FSO include activities in:
• System planning and network development; • Driving competition in energy networks; • Energy market design; • Coordination with distribution networks; • Heat and transport decarbonisation; • Energy data; • Engineering standards and energy code development; • Hydrogen and; • Carbon capture, utilisation and storage (CCUS).
2. Options for organisational models
Basing on the need for the FSO to be free from perceived or potential conflicts of interest within the energy sector and short-term operational influence from central government, two organisation models were proposed:
• A standalone privately owned model, independent of energy sector interests; and • A highly independent corporate body model classified within the public sector, but
with operational independence from government.
Both models are expected to have similar fundamental elements of the FSO’s regulatory framework and to incorporate legislation, any designated Strategy and Policy Statement, licences and codes, and funding through network charges. The models would be differ in particular for incentives, where a privately owned FSO would be incentive through its profit to drive performance whereas the non-private FSO would not be driven by shareholder or profit interest.
3. Implementation BEIS and Ofgem proposed a phased implementation of the ESO. This means founding on the existing capabilities (including the people, processes, systems and assets) of NGESO, and where appropriate National Grid Gas (NGG), then followed by phased introduction of FSO future roles. As NGESO and NGG are currently owned by National Grid plc, any change in ownership of any capabilities of these organisations will require a sale process. BEIS and Ofgem will have a role to play in the overarching governance of the implementation.
Energy code reform: governance framework
Following the consultation on “Reforming the energy industry codes”75 in 2019, BEIS and Ofgem have further developed details for the two proposed frameworks for energy code governance and launched a new consultation76 to invite views from all, in particular from existing code parties, wider industry players, consumer groups, academics and existing code administrators77. Aiming to establish a
75 https://www.gov.uk/government/consultations/reforming-the-energy-industry-codes 76https://assets.publishing.service.gov.uk/government/uploads/system/uploads/attachment_data/file/1004005/energy-code-reform-consultation.pdf 77 https://www.gov.uk/government/consultations/energy-code-reform-governance-framework

61
framework that is forward-looking, agile, easy to understand, and able to accommodate a growing number of participants, the two potential models identified are:
1. Model 1 – A code manager function and a strategic function performed by a separate ‘strategic body’ This is the preferred option by BEIS and Ofgem. In this model, Ofgem is designated as the ‘strategic body’. Its responsibilities would include developing and annually publishing a strategic direction for codes, ensuring it is delivered by code managers, and deciding the approval of material code changes and in occasions even lead code change itself. It would also select code managers and hold them to account via licence. On the other hand, code managers, which are designed to replace the existing code administrators after a suitable transition period, would be selected through a competitive tender process. Proposed responsibilities include developing an annual delivery plan based on the strategic direction issued by the strategic body, managing the code change process, deciding the approval of non-material code changes, making recommendations on martial code changes to the strategic body, and monitoring and reporting on code change outcomes. As industry stakeholder would remain the key to the code change process, a new stakeholder advisory forum will also be formed.
2. Model 2 – An ‘integrated rule making body’ (a combined code manager function and strategic function, or ‘IRMB’) An alternative model is to have an IRMB within the proposed FSO, as the whole systems thinking of FSO would complement the strategic function’s main responsibility to provide strategic direction across codes. There will be no separate code managers and the FSO would hold most of the responsibilities outlined above. Nevertheless, Ofgem is going to retain some oversight and decision-making roles under this option, for example the ability to approve material code changes, in line with its duties as the regulator in order to protect against potential conflicts of interest.
The consultation assessed the two options against a range of criteria. It is believed that Model 1 can build on the expertise of Ofgem and hence provide a greater net benefit and quicker to implement. Preliminary timeline is that the delivery of codes consolidation could begin in 2024 with Model 1 or in 2026 with Model 2. This consultation closes on 28 September 2021 (same day as the one for FSO) and a government response will be produced to cover both this and the 2019 consultation in due course.

62
6.5 Public Awareness
As consumer choice is crucial in decarbonising the UK, the Government and Ofgem have both conducted research to explore the views of the public. The researches have slightly different focuses, the Government’s report aims to find out public perceptions of climate change and net zero78; while Ofgem’s 2020 Consumer Survey79 measures their intention to change their behaviour. This section will go through key findings from the two studies and discuss the mismatch between the consumer’s awareness and attitudes in decarbonisation and adopting future energy solutions.
Government research showed a high awareness of net zero across the UK public BEIS carried out an online survey of around 7,000 members of the UK public between September and October 2020 (i.e. prior to the announcement of the Ten Point Plan) regarding climate change and net zero. 83% of the respondents concerned about climate change, while 50% felt their local area had been affected to “at least some extent”.
On the other hand, 87% of the participants were aware of net zero, in which 39% either have ‘a lot’ or ‘a fair amount’ of knowledge. This shows a significant increase from the BEIS quarterly public attitudes tracker back in March 2020, where 52% of the public indicated that they were aware of net zero and 13% had ‘a lot’ or ‘a fair amount’ of knowledge on the topic80. The survey further provided information on net zero and asked if the respondents supported or opposed the target. 78% of the respondents said they either ‘strongly’ or ‘somewhat’ support the target. For those who opposed, the top three reasons were: climate change or net zero is not an important issue, net zero is not possible to achieve and the target would be too damaging or costly.
Figure 42: To what extend does the public support or oppose the UK’s net zero target
Source: UK Government81
78 https://www.gov.uk/government/publications/climate-change-and-net-zero-public-awareness-and-perceptions 79 https://www.ofgem.gov.uk/publications/consumer-survey-2020-decarbonisation-insights 80 https://utilityweek.co.uk/beis-data-shows-spike-in-public-awareness-of-net-zero/ 81https://assets.publishing.service.gov.uk/government/uploads/system/uploads/attachment_data/file/996578/Annex_1_Data_Tables.ods
Strongly support45%
Somewhat support33%
Neither support nor oppose
14%
Somewhat oppose3%
Strongly oppose1%
I don't know4%

63
Regarding perceptions of the future, 76%, 74% and 50% of the respondents think that achieving net zero will lead to better health, better well-bring and better economy respectively. When asked about how to reduce UK carbon emissions, 50% of the participants believe that the country should pursue an equal mix of technological and lifestyle changes. Although 49% of the participants perceived transport as contributing ‘a great deal’ to emissions, only 45% of them think people may stop using petrol or diesel cars over the next few decades. Instead, 66% think it is either ‘extremely likely’ or ‘somewhat likely’ for energy efficiency measures to be adopted for decarbonisation.
Figure 43: Views on how likely would the decarbonisation actions to happen over the next few decades
Source: UK Government82
82https://assets.publishing.service.gov.uk/government/uploads/system/uploads/attachment_data/file/996578/Annex_1_Data_Tables.ods
15%
30%
20% 20%
10%
4%
13%
35%
24%
18%
6%4%
20%
46%
18%
9%
3% 3%
0%
5%
10%
15%
20%
25%
30%
35%
40%
45%
50%
Extremely likely Somewhat likely Neither likely norunlikely
Somewhat unlikely Extremely unlikely I don't know
Travel: People no longer use petrol or diesel cars
Heat: Almost all homes in the UK use low carbon heating rather than gas or oil boilers.
Energy efficiency: People make their homes more energy efficient (e.g. installing insulation in the loft, inwalls, and under the floor).

64
Ofgem identified key barriers in low-carbon technologies adoptions Ofgem conducted more than 4,600 online interviews83 during June to September 2020 to understand consumer’s attitudes towards decarbonisation and find out how many of them are open to changing their energy use behaviour. The study report consists of four sections which reveals their understanding and engagement with decarbonisation, their intention to exercise behaviour change in transportation (particularly with EVs), heating and when energy is consumed with flexibility products and services.
Consumer understanding and engagement with decarbonisation
One of the key messages from the report is that “there is a mismatch between what consumers think they need to do to reduce the impacts of climate change and the actual behavioural changes needed”. 56% of the respondents said they feel they are already doing enough to tackle climate change, in particular for the adopters of low emission technologies such as EV owners and those who have solar panels. There is a relatively low awareness on how heating and cooling our homes (60%) contribute to climate change, when compared with other activities such as burning fuel in power stations (74%) and vehicle exhaust emissions (72%).
While 85% and 72% of the respondents have heard of ‘greenhouse gas emissions’ and ‘net zero carbon emissions’ respectively, only 56% had any understanding of the term ‘decarbonisation’. Awareness and understanding of all these three terms were generally higher among ABs, higher income households and those engaged in the energy market.
Electric Vehicles
Looking at transportation, in particular EVs, 73% of the respondents indicated that they have the awareness on future sales ban of petrol and diesel cars, in which people with vehicles, especially the EV owners, are more likely to be aware. Only 3% of the respondents own a pure EV, and most of them are within age of 16 to 34 (43%) with AB social grades (56%). There are also another 2% and 5% of respondents who own plug-in hybrid and non plug-in hybrid respectively. About 70% of the plug in vehicle charging is done at home, and 66% of the EV users are open to using smart charging.
83https://www.ofgem.gov.uk/sites/default/files/docs/2021/05/consumer_survey_2020_update_on_decarbonisation_v1.0_1.pdf

65
In general, 24% of the respondents are either ‘very likely’ or ‘quite likely’ to get an electric vehicle in the next five years. For those who indicated they are unlikely to get an EV, the main barriers include the perceived high up-front costs and range anxiety.
Figure 44: Awareness of EV policy and intention of getting an EV
Source: Ofgem84 (N.B. Policy has been moved forward to 2030 after the launch of survey.)
Low-carbon heating
At the time of the survey, 77% of the respondents were using gas central heating as the main heating source in their homes. 76%, 44%, 36% and 24% of the respondents were aware of electric storage heaters, ground source heat pumps, air source heat pumps and district heat networks respectively. While 24% of the respondents had intentions to upgrade insulation, only 14% are interested in installing low-carbon heating. Barriers to both upgrading insulation and installing low-carbon heating are broadly similar including cost, uncertainty in monetary benefits and hassle.
84https://www.ofgem.gov.uk/sites/default/files/docs/2021/05/consumer_survey_2020_update_on_decarbonisation_v1.0_1.pdf

66
Figure 45: Awareness of low-carbon heating policy and intention of installing low-carbon heating
Source: Ofgem85
Smart meter adoption and flexibly energy use
Smart meters are a key enabler of flexibility energy products and services to shift demands away from the system peaks. Although COVID-19 restrictions slowed the installation pace, about 59% of those who don’t already have a smart meter said they would like one within the next two years. Despite about 77% of the consumers using appliances (including washing machine, dishwasher and EV charging) at peak times said it might be easy to switch to off-peak use, the key barriers are the off-peak times don’t fit with their lifestyles (such as working or school patterns) or difficulties in planning. It is also worth noting that the appetite for smart appliances or smart heating controls remains low at 34%, with 66% of EV owners being open to smart vehicle charging.
This research from Ofgem have highlighted areas where consumers are more open to low-carbon solutions and the key barriers to overcome before a wide-scale changes in consumer behaviour. Other than raising the consumers’ awareness of low-carbon solutions, it is also important to ensure the solutions are affordable and convenient to adopt or else they are unlikely to gain popularity within the energy users.
85https://www.ofgem.gov.uk/sites/default/files/docs/2021/05/consumer_survey_2020_update_on_decarbonisation_v1.0_1.pdf

67
6.6. Ofgem’s Role in Net Zero
The House of Lords Industry and Regulators committee is inviting evidence for its new inquiry into Ofgem and net zero86. This inquiry intends to consider Ofgem’s role in the transition to net zero and whether any changes are needed to its objectives, powers or role in the wider energy system. It will also examine how net zero relates to Ofgem’s other responsibilities such as affordability and the security of the UK’s energy supply, how Ofgem considers the interests the consumers, and Ofgem’s relationship to Government and Parliament. There are four oral evidence sessions with witnesses from different backgrounds so far and the committee is inviting for written evidence from individuals until 22 August 2021.
6.7. National Grid Future Energy Scenarios
National Grid ESO launched their latest annual Future Energy Scenarios (FES 2021)87 on 12 July 2021. FES outlines the four different, while credible, pathways for the future of energy between now and 2050 and can be used to inform network planning, investment decisions and government policy. In this update, FES 2021 reflects recent policy publications, including the Energy White Paper and the Ten Point Plan, as well as introducing three new dedicated sections on (1) the impact of the COVID-19 pandemic (which currently suggests long term impact is likely to be small), (2) Net Zero (which examines the greenhouse gas emissions relating to each FES 2021 scenario) and (3) Flexibility (how supply and demand can be balanced over different timescales to ensure security of supply).
The FES 2021 scenario framework In response for stakeholder’s requests for consistency, FES 2021 adopts the same scenario framework as last year, with four distinct scenarios – Consumer Transformation (CT), System Transformation (ST), Leading the Way (LW) and Steady Progression (SP). All scenarios have lower emissions by 2030 compared to FES 2020. Three scenarios are expected to reach the net zero target either by or before 2050 (CT and ST by 2050 and LW by 2047), however only LW and CT are able to meet the CCC’s 6th Carbon Budget for 2033 to 2037. This is because the relatively quick transition from natural gas to hydrogen for residential heating and negative emissions from hydrogen production will not happen until the mid to late 2030s.
86 https://committees.parliament.uk/work/1320/ofgem-and-net-zero/news/156063/call-for-evidence-launched-on-ofgem-and-net-zero/ 87 https://www.nationalgrideso.com/future-energy/future-energy-scenarios/fes-2021

68
Figure 46: The Scenario Framework for FES 2021
Source: FES 202188
Considering the rate of decarbonisation by sectors, road transport and heat will reach zero or almost zero emissions by 2050 in all net zero scenarios. The power generation sector will get down to negative emissions by 2032 in Leading the Way and Consumer Transformation, and by 2034 in System Transformation. The scenario assumptions of the four scenarios are presented in the table on the following page.
88 https://www.nationalgrideso.com/future-energy/future-energy-scenarios/fes-2021/scenarios-net-zero

69
Table 15: FES 2021 scenario assumptions for selected sectors
Sector Consumer Transformation System Transformation Leading the Way Steady Progression Transport -Met government target to
ban sales of petrol & diesel cars and vans by 2030. Significant uptake of BEV buses and suitable HGVs. -New PHEV sales banned in 2035. -Early transition to BEV limits number of hydrogen vehicles. -Emphasis on home chargers and taking advantage of consumer engagement levels in flexibility.
-Sales ban of petrol & diesel cars and vans pushed back to 2032 and 2035 respectively due to lack of market confidence. -Sales ban of PHEV in 2035. -Significant uptake of hydrogen bus and HGV fleets. -Emphasis on public rollout of fast chargers to allow rapid charging.
-Met government target to ban sales of petrol & diesel cars and vans by 2030. Significant uptake of BEVs in the bus sector. -New PHEV sales banned in 2035. -Significant uptake of hydrogen HGV fleets. - Accelerated rollout of charging infrastructure at home and in public places.
- Slow BEV adoption. Sales ban of petrol & diesel cars and vans in 2035 and 2040 respectively. Low BEV uptake of buses and HGVs. -Sales ban of PHEV in 2040. - Limited hydrogen vehicle uptake. - Lack of solutions to residential charging.
Heat - Medium disposable income with behavioural change to adopt new heating technologies. - High levels of district heat uptake in cities and hydrogen for building heating around industrial clusters. - Mostly electrified heat. -Low to moderate levels of policy support for hydrogen and a number of local hydrogen clusters developed. - No fossil boilers in new builds from 2025. - No fossil fuel boiler sales from 2035.
-Medium disposable income and preference is to minimise disruption to existing technologies. -Moderate levels of district heating in cities. -High levels of policy support for hydrogen and a national hydrogen transportation network is developed. - Mostly hydrogen heating. - Hydrogen ready boilers from 2025. - No new fossil fuel boiler sales from 2035.
-High disposable income with behavioural change. - High levels of district heat uptake in cities and hydrogen for building heating around industrial clusters. -Moderate to high levels of policy support for hydrogen and a national hydrogen transportation network is developed. - No fossil boilers in new builds from 2025. - No fossil fuel boiler sales from 2035. - Future Homes Standards compliant.
-Low disposable income and low willingness to change lifestyle. -Low levels of decarbonisation and most homes still use gas boilers for heating. -Low levels of policy support for hydrogen and adoption is limited to local private networks.
Generation and Flexibility
- Very high growth in small solar and strong growth in large solar. - High installed capacity of onshore wind and moderate capacity of offshore wind. - High level of V2G at peak times because of high consumer engagement. - High deployment of storage technologies, especially for those less than 2 hours and more than 4 hours.
-Support large scale renewable technologies. -Strong growth in both small and large solar. -Supports production of hydrogen by electrolysis. -Ambition to decarbonise with focus on centralised technologies leads to a deployment of large nuclear generation. -Low consumer engagement limits V2G. - Moderate level of batteries with a duration more than 2 hours.
- Prioritising renewables that are available at lowest cost today (i.e. solar and wind). - High installed capacity of onshore and offshore wind, as well as both small and large solar. - Earlier consumer adoption of flexibility including high level of V2G. - Highest levels of flexibility requirements encourage storage batteries at all levels.
-Lower growth in renewables and flexible technologies result in a market for gas CCuS as a low-carbon generation form. -V2G remains a niche technology with low uptake. - Moderate level of batteries with a duration less than 2 hours.
Source: FES 2021 Scenario Framework Assumptions and webinars89
89 https://www.nationalgrideso.com/future-energy/future-energy-scenarios/fes-2021/documents

70
As mentioned earlier, this year’s FES has incorporated some of the latest policy commitments, including those from the Energy White Paper and the Ten Point Plan, at the time of publication. The comparison of the Government’s ambitions against FES scenarios is shown in table below.
Table 16: Comparison on whether FES scenarios meeting Government announced ambitions
Year Recent Government Policy Consumer Transformation
System Transformation
Leading the Way
Steady Progression
2025
Proposal to end gas grid connection for new homes ✔ ✖ ✔ ✖
Two CCuS industrial clusters deployed ✖ ✖ ✖ ✖ Future Homes Standard – All new homes to be ‘zero carbon ready’ ✖ ✖ ✔ ✖
2028 600,000 heat pumps installed per year ✔ ✖ ✔✔ ✖
2030
Two more CCUs industrial clusters ✖ ✔ ✔ ✖ Ban on new petrol and diesel cars and vans ✔ ✖ ✔ ✖ First Hydrogen Town ✖ ✔ ✔ ✖ Scotland: 1 million zero emission homes ✖ ✖ ✔ ✖
2035 Sale of Plug-in-Hybrid cars and bans banned ✔ ✔ ✔✔ ✖ 78% emissions reduction compared to 1990 levels ✔ ✖ ✔ ✖
2040 One fully net zero industrial cluster ✔ ✔ ✔ ✖
Source: FES 2021 - Interactive Copy90 (Key: ✖ Misses, ✔ Meets, ✔✔ Surpasses)
It is worth noting although it seems no scenario is able to meet the ambition for having two CCuS industrial clusters in 2025, LW and ST just narrowly missed the target and will have the clusters deployed in 2026. With the two ambitions surpassed by LW, 600,000 heat pumps installed per year and the ban of new PHEV cars sales can be reached in 2024 and 2032 respectively. Moreover, National Grid also made a note that they expect additional announcements from the UK Government ahead of the international climate summit COP26 in November 2021.
Four FES 2021 key messages Before going into details with the sectors, in particular transport, heat and generation, it would be helpful to gain an overview of the analysis on what is required to reach the net zero target by 2050. The four key interlinked messages, with Consumer & Digitalisation at the core, are as follow.
• Key Message 1: Policy and delivery - Achieving net zero requires detailed policies and clear accountabilities, coupled with an immediate and sustained focus on delivery, to maintain the momentum provided by the Energy White Paper.
• Key Message 2: Consumer and digitalisation - Consumer behaviour is pivotal to decarbonisation – how we all react to market and policy changes, and embrace smart technology, will be vital to meeting net zero.
• Key Message 3: Markets and flexibility - Holistic energy market reform is needed to drive the investment and behaviour changes needed to deliver net zero and ensure security of supply at a fair and reasonable cost for all consumers.
• Key Message 4: Infrastructure and whole energy system - Significant investment in whole energy system infrastructure will be required over the coming decade – this should be optimised to ensure timely delivery and value for consumers.
90 https://www.nationalgrideso.com/future-energy/future-energy-scenarios/fes-2021/documents

71
Sector deep-dive and key insights
Transport
In the FES, analysis on energy demand for transport includes cars, vans, buses and Heavy Goods Vehicles (HGVs). To decarbonise by 2050, the transport sector will need to (1) reduce its demand, (2) adopt low-carbon technologies, (3) introduce flexibility services such as vehicle-to-grid (V2G) technology to manage renewable supply in a power system, as well as (4) offsetting emissions in some areas such as aviation. The key differences between FES 2021 and FES 2020 for this sector are the updated targets the ICE vehicles ban, increased BEV uptake across all scenarios based on real-world data and stakeholder feedback, as well as the reduced EV efficiency assumptions which leads to 15%-22% increase in road transport electricity demand in 2050.
All scenarios will have banned the sales of new internal combustion engines (ICE) vehicles before 2040, including PHEVs. In particular, the government’s 2030 target to ban ICE cars and vans can be met in Consumer Transformation and Leading the Way worlds. As the uptake of BEVs increases, smart charging and V2G will become more popular as consumers are incentivised to change their charging pattern through appropriate Time of Use Tariffs. In Leading the Way over 80% and 45% of the consumers will engage in smart charging and V2G services respectively; and flexibility services will enable a Consumer Transformation world to exercise up to 32GW of peak shaving by 2050.
Figure 47: Total annual demand for road transport and number of BEVs on road across Great Britain by year
Source: FES 2021
The following table illustrates scenario overview on the route to 2050 in road transport sector.

72
Table 17: Scenario overview in road transport sector
Consumer Transformation System Transformation Leading the Way Steady Progression The route to 2050
Mid 2020s – higher consumer engagement results in higher use of public transport 2030 – sales ban for petrol and diesel cars and vans 2035 – sales ban for PHEV Mid 2030s – increase uptake of hydrogen lorries (similar increase in electric lorries) 2040s – widespread smart charging of BEVs
2032 – sales ban for petrol and diesel cars and vans Mid 2030s – increase uptake of hydrogen fuel cell vehicles with development of hydrogen infrastructure 2040s – National refuelling network develops, majority HGVs switching to hydrogen.
Mid 2020s – increase use of public transport or active travel 2030 – sales ban for petrol and diesel cars and vans 2032 – sales ban for PHEV Mid 2030s – HGVs begin to use hydrogen with some using electric batteries
2020s – natural gas becomes fuel for buses and HGVs 2035 - sales ban for petrol and diesel cars 2040 – sales ban for PHEV and ICE vans 2040s – some buses electrified
What does 2050 look like
-Total demand for road transport: 133TWh (lowest) -Hydrogen mainly for HGVs, which rely on a regional refuelling infrastructure. -25% of household providing flexibility via V2G services.
-Total demand for road transport: 153TWh (as hydrogen vehicles are less efficient) -Consumers not actively encouraged to ride share, walk or cycle.
-Total demand for road transport: 139TWh - Lowest number of BEV cars and vans - Smart charging of BEVs often paired with solar PV and batteries.
-Total demand for road transport: 163TWh - Highest number of BEV and PHEV cars and vans on road (38M). - 5% of household take part in V2G and over 50% using smart chargers.
Source: FES 202191
Heat
Heat is one of the most difficult sectors to decarbonise and will require a tailored, regional92 approach across different areas in Great Britain. This year National Grid modelled the sector with a regional heat model93 for the first time. With the new model and more conservative insulation assumptions across scenarios, FES 2021 resulted in a higher uptake of heat pumps of all types, which has led to increases annual and peak electricity demands as well as greater importance of domestic heat flexibility.
For domestic heat, the net zero scenarios will employ a range of low-carbon heating technology options including heat pumps, district heating and hydrogen boilers depending on infrastructure availability and consumer choice. Besides technology and thermal efficiency choices, consumers’ behaviour can also lead to signification reductions in heat demand and will be helpful in managing an electricity system that is dominated by renewable sources. This includes turning the thermostats down, having energy efficiency measures and installing thermal storage devices. When thermal storage is installed with heat pumps, electricity demand from heating can be reduced by up to 35% in a Leading the Way world.
91 https://www.nationalgrideso.com/future-energy/future-energy-scenarios/fes-2021/consumer-view/transport 92 In FES 2021, regional factors include building stock, housing density, proximity to hydrogen production and renewable electricity installations that affect ow homes and buildings are heated. 93 Features of the regional heat model are: improved spatial resolution down to Lower Layer Super Output Areas (LSOA), detailed modelling of hydrogen infrastructure, district heating infrastructure, over 7,000 building types, thermal storage and heat demand

73
Figure 48: Low-carbon technology mix, underlying heat savings and number of heat pumps across Great Britain
Source: FES 2021
Table 18: Scenario overview in residential heat sector
Consumer Transformation System Transformation Leading the Way Steady Progression The route to 2050
-From early 2020s to 2035: retrofitted with energy efficient measures and low-carbon heating under government initiatives. -2025: all new build homes have heat pumps in line with the Future Homes Standard. -2035: sales ban of natural gas boilers.
-Mid 2020s: extensive retrofitting schemes to improve thermal efficiency. -2025: new build homes include hydrogen ready boilers and appliance. -2030: switching natural gas network to hydrogen.
-2025: 2.6M homes have heat pumps. -Mid 2020s: retrofitting energy efficiency measures (highest rate). -2028: increase in hydrogen boiler and hybrid hydrogen heat pump installations. -2035: sales ban of natural has boilers.
- Some government policy to encourage consumer investment in thermal efficiency. - Future Homes Standard in 2025 is not met, but some new builds install heat pumps where it is seen to be cost effective.
What does 2050 look like
-Widespread use of air source and ground source heat pumps. -Around 10M homes with thermal storage. -District heat networks are used in some areas.
- 69% of homes use hydrogen boilers for heating. - Up to 11 million consumers use electric or hybrid heat pumps.
-Over 80% of homes have heat pumps (including hybrids). - 21% homes have hydrogen boilers.
-Most homes still use natural gas boilers. - No hydrogen boiler systems. - Some consumers install heat pumps with little to no insulation or thermal storage measures.
Source: FES 202194
94 https://www.nationalgrideso.com/future-energy/future-energy-scenarios/fes-2021/consumer-view/residential

74
Moving away from domestic heat, it would be easier to decarbonise the commercial sector, such as catering and hotels, than the industrial one. The heating option for the commercial sectors are chosen based on cost, infrastructure availability and building type. Electrification is going to be the most cost-effective option for decarbonising heat in commercial sector, even in a System Transformation world. However, it is more difficult and costly to decarbonise industrial sector as it usually involves high-grade heat for industrial processes.
Electricity Supply
Electricity becomes ever more important in a net zero world as it enables decarbonisation of sectors such as transport and heat through electrification. When compared to FES 2020, the electricity demand in this year’s FES is higher across all scenarios for the following reasons:
1. Changes in fuel switching and thermal or appliance efficiency assumptions in industrial and commercial sectors.
2. Change to residential thermal efficiency assumptions accompanied by increases in the use of heat pumps of all types.
3. Changes to the use of thermal storage devices at times of peak demand in homes and businesses.
4. Reduction in BEV efficiency assumptions.
These also lead to higher electricity peak demands. This means we will need more generation capacity as we rely more on the weather-dependent, intermittent renewables with lower load factor than that of fossil fuels. Flexible resources and demand side response are also crucial in maintaining system security, especially when unabated gas generation is phased out post 2030s.
Table 19: Scenario overview in electricity supply
Consumer Transformation System Transformation Leading the Way Steady Progression The route to 2050
-Rapid uptake of renewables, particularly offshore wind and solar. -2030: 40GW offshore wind. - Storage and interconnection also play an important role, providing flexibility as fossil fuel capacity reduces.
-2031: 40GW offshore wind target met. -Limited growth in decentralised renewables. - Greatest increase in hydrogen generation from 2030.
-2029: 40GW offshore wind target met. - High level of onshore and offshore wind growth. - BECCS generation is developed ahead of 2030.
-2030: 30GW offshore wind installed. -More limited growth of onshore and solar. -Post-2035: limited phase-out of gas generation plant. -2040: large-scale new nuclear.
What does 2050 look like
-Total generation capacity: 290GW, plus a further 68GW of electricity storage and interconnection capacity. -Wind, solar, nuclear and BECCS provide 97% of electricity.
-Total generation capacity: 258GW, plus a further 47GW of electricity storage and interconnection capacity. -Wind, solar, nuclear and BECCS provide 95% of electricity.
-Total generation capacity: 248GW, plus a further 71GW of electricity storage and interconnection capacity. -Wind, solar, nuclear and BECCS provide 96% of electricity.
-Total generation capacity: 201GW, plus a further 37GW of electricity storage and interconnection capacity. -Wind, solar, nuclear and BECCS provide 92% of electricity.
Source: FES 202195
Other than the three areas covered, National Grid held a series of webinars to go through the FES 2021 in detail. The key insights of different topics are summarised in the following figure.
95 https://www.nationalgrideso.com/future-energy/future-energy-scenarios/fes-2021/system-view/electricity

75
Figure 49: FES 2021 Key Insights
Source: FES 2021 webinars
Net Zero Leading the Way reaches net zero by 2047.
A whole system approach is needed for net zero.
New technologies, smart appliances and digitalisation can help.
Negative emissions from CCUS are required in all net zero scenarios.
Transport The government's target to ban petrol & diesel sales by 2030 is achieved in two scenarios (CT and LW).
Reduced electric car efficiency assumptions contribute to an increase in electricity demand.
60% of electric vehicle demand at peak could shaved by smart charging.
HeatHomeowners' behaviour can lead to significant reductions in heat demand.
Higher building fabric standards in New Builds needed.
All low-carbon technologies would be needed.
Wide geographical variation in technology adoption.
Overall Demand Industrial & Commercial - Industrial sector is more difficult to decarbonise. Electrification could be more cost-effective than hydrogen for decarbonising heating in commercial.
Residential - Appliance demand is reduced by about 40% in Leading the Way by 2050.
Flexibility In future the electricity system will be more supply led.
Flexibility will reduce the need for additional generation.
Our scenarios need significantly, more flexibility from consumers.
Large-scale inter seasonal energy storage is essiential to meeting net zero.
Hydrogen The production of hydrogen via electrolysis helps to maximise the use of renewables.
Storage capacity is as important as production facilitites.
Government intervention is requried to deliver production faciltities & grow demand for hydrogen.
Biomass gasification, combined with CCUS, is a useful, additional source of negative emission.
Electricity Supply Increased peak demands compared to FES2020 means we need more generation and flexible capacity.
Demand side response will play a central role in flexibility.
Maintaining security of supply requires accelerated uptake of CCUS and zero carbon technologies.
Rapid decarbonisation of electricity supply is essential to and enable decarbonisation in other sectors.
Whole System Joined up policy needed across the whole energy system (e.g. EVs and offshore wind).
Energy markets will have to be cognisant of each other to allow for whole system flexibility.
Consumer behaviour across all sectors of the economy will the speed of decarbonisation.
Energy networks will have to grow and adapt to facilite net zero.

76
Total energy demand by scenarios and way forward To summarise the end consumer demand by 2050, the figure below shows that all scenarios, particularly the three net zero ones, have significantly lower energy demands than that of 2020. This is mainly due to the energy efficiency improvements in residential, transport and industrial & commercial sectors.
Looking at the net zero scenarios, a Consumer Transformation world is the one with home heating, transport and industry largely electrified, along with hydrogen production using electrolysis in the UK. This results in the highest annual electricity demand but at the same time the lowest end user demand out of all scenarios, as consumers are highly engaged in behaviour change.
System Transformation is a scenario with the highest use of hydrogen, which is produced in the UK mainly through methane reforming, with widespread use in home heating, industry and HGVs. Hydrogen boilers are likely to be around three times less efficient than heat pumps and consumers in this world are assumed to change their behaviour less, this explains why the annual consumer demand is the highest of the net zero scenarios.
Leading the Way, reaching net zero in 2047, uses a combination of hydrogen and electricity to decarbonise and is the only scenario to include non-networked electricity generation and hydrogen imports.
Figure 50: Annual end consumer demand by fuel
Source: FES 2021
Following the launch of FES 2021, with the aim of looking at what should happen and drawing feedback into the FES cycle, National Grid is going to organise a series of “Bridging the Gap” workshops with stakeholders for a more detailed look at 2030 and snapshots of possible system peaks and troughs. Furthermore, National Grid will also work with other gas and electricity network companies to drive for regionalisation in FES in order to support the understanding of scenario projections at a local level.
0
200
400
600
800
1000
1200
1400
1600
2020 2050 ConsumerTransformation
2050 SystemTransformation
2050 Leading theWay
2050 SteadyProgression
TWh
Electricity Natural Gas Blended Gas Hydrogen Oil/Petroleum Biofuels

77
7. Decarbonising Heat
7.1. Green Homes Grant and Clean Heat Grant
The Green Homes Grant (GHG) is the primary scheme for improving the energy efficiency performance of domestic households in the UK. It supports efficiency improvements by allowing homeowners and landlords to apply for funding for two-thirds of the cost of energy saving measures – up to a limit of £5,000 (or £10,00096 for lower income households). However due to the poor engagement with this scheme, it has now been scrapped. The scheme closed to new applicants at the end of March 2021, however vouchers applied for before this date are still being processed. The scheme ran from September 2020 to March 2021 and received over 113,700 applications. Due to the announcement of the schemes closure, March 2021 saw record levels of applicants, with nearly 31,000 applications.
Figure 51: Monthly GHG applications
Source: June GHG statistics - https://assets.publishing.service.gov.uk/government/uploads/system/uploads/attachment_data/file/996025/GHG_Vouch
ers_Release_-_June_2021_-_FINAL.xlsx
96 https://www.gov.uk/guidance/apply-for-the-green-homes-grant-scheme
4,353
26,683
16,621
10,454 11,03013,662
30,929
Sep-20 Oct-20 Nov-20 Dec-20 Jan-21 Feb-21 Mar-21
As of June 2021, there have been 112,000 accreditations through the Renewable Heat Incentive (RHI) scheme, with a total capacity of 6.4GW. Of these installations, 19% were installed through the non-domestic scheme, with the remaining 81% installed through the domestic scheme.
HyNet North West launched its cross-party coalition to secure backing from Government for its plans to transform the North West of England and North Wales into one of the world’s first low-carbon industrial clusters. The project aims to reduce carbon dioxide emissions in the area by 10 million tonnes every year by 2030 and could deliver 80% of the UK’s clean hydrogen target for transport, industry, and homes for 2030 and 50% of the UK’s 2050 hydrogen target.

78
Of all applications, 32% were withdrawn or rejected, resulting in 77,000 live applications. Of these, 84% were approved, with nearly 19,200 households having at least one measure installed. In total there were 20,600 measures installed, with 77% being for insulation measures, and the remaining measures being low-carbon heating.
Figure 52: Breakdown of measures installed under the GHG scheme
Source: June GHG statistics - https://assets.publishing.service.gov.uk/government/uploads/system/uploads/attachment_data/file/996025/GHG_Vouch
ers_Release_-_June_2021_-_FINAL.xlsx
There has been a degree of regional variation in terms of applications and installations, with applications per 1,000 people varying between 2.1 in London, and 4.4. in the West Midlands. In fact, the three regions roughly equivalent to UK Power Networks’ three licence areas have seen some of the lowest application rates.
Figure 53: Application rates per 1,000 people by region
Source: June GHG statistics - https://assets.publishing.service.gov.uk/government/uploads/system/uploads/attachment_data/file/996025/GHG_Vouch
ers_Release_-_June_2021_-_FINAL.xlsx
0% 5% 10% 15% 20% 25%
Loft Insulation
Pitched Roof Insulation
Cavity Wall Insulation
External Solid Wall Insulation
Solar Thermal
Air Source Heat Pump
Suspended Floor Insulation
Other
Internal Solid Wall Insulation
Hybrid Heat Pump
3.13.8
4.2 44.4
3.6
2.1
2.7
3.3
North East NorthWest
Yorkshireand TheHumber
EastMidlands
WestMidlands
East London South East SouthWest
England average (3.4)

79
The success of applications also varies by region, with the North West seeing just 23% of vouchers issued resulting in installations, compared to 44% in the South East and 34% for England as a whole.
Table 20: GHG statistics by region
Region Applications per 1,000 people
Vouchers issued
Measures Installed
Installation rate
North East 3.1 3,091 1,256 41% North West 3.8 10,383 2,396 23% Yorkshire and The Humber 4.2 6,905 2,164 31% East Midlands 4 5,977 2,257 38% West Midlands 4.4 7,777 2,452 32% East 3.6 6,779 2,651 39% London 2.1 5,596 1,699 30% South East 2.7 7,471 3,320 44% South West 3.3 5,725 2,362 41% England 3.4 59,704 20,557 34%
Source: June GHG statistics - https://assets.publishing.service.gov.uk/government/uploads/system/uploads/attachment_data/file/996025/GHG_Vouch
ers_Release_-_June_2021_-_FINAL.xlsx

80
7.2. Renewable Heat Incentive Update
As of June 2021, there have been 112,000 accreditations through the Renewable Heat Incentive (RHI) scheme, with an aggregate capacity of 6.4GW. Of these installations, 19% were installed through the non-domestic scheme, with the remaining 81% installed through the domestic scheme. However, due to non-domestic installations typically being of a much larger capacity, despite having only 19% of the installations, non-domestic RHI installations make up 83% of the total capacity.
Table 21: Key RHI statistics
Non-domestic scheme Domestic scheme Total RHI Accreditations 21,258 90,517 111,775 Installed capacity (MW) 5,364 1,079 6,443 Average capacity (kW) 252.3 11.9 57.6
Source: June RHI deployment data - https://www.gov.uk/government/statistics/rhi-monthly-deployment-data-june-2021-quarterly-edition
March 2021 was the last month in which applications could be made to the non-domestic RHI, although existing applications will continue to be processed. This means that over time the number of applications will reduce, but accreditations will increase as existing applications continue to pass through the process. The domestic scheme has had is length extended, it is now due to close at the end of March 2022.
There were 1,404 new applications to the domestic scheme in June, which is higher than in May, and also higher than the 12-month average of 1,083.
Figure 54: Monthly applications to the RHI scheme
Source: June RHI deployment data - https://www.gov.uk/government/statistics/rhi-monthly-deployment-data-june-2021-quarterly-edition
The massive spike in non-domestic applications in March 2021 is to be expected, as it was the last month in which applications could be made. Overall, the number of applications show a general upward trend which has recovered well after seeing applications fall during the COVID-19 lockdown.
In fact, if the current rate of domestic applications were to continue, 2021 would see 27% more applications than in 2020, resulting in 2021 being the most successful year for domestic applications since 2015.
0
500
1,000
1,500
2,000
2,500
3,000
Domestic Non domestic Total

81
Figure 55: Annual RHI applications97
Source: June RHI deployment data - https://www.gov.uk/government/statistics/rhi-monthly-deployment-data-june-2021-quarterly-edition
The breakdown of the different technologies applied for in the RHI remains fairly constant, with most domestic users opting for air source heat pumps (ASHP), and most non-domestic users opting for biomass.
Figure 56: Technology breakdown of RHI applications
Source: June RHI deployment data - https://www.gov.uk/government/statistics/rhi-monthly-deployment-data-june-2021-quarterly-edition
The domestic scheme has seen a continual rise in the number of applications of ASHPs, and there is no indication of this changing over the coming months.
97 2021 projection not included for the non-domestic scheme as applications are no longer being taken
7,191
3,511 2,288 1,856 797 677 903 1,480
17,530
21,705
7,480 7,832 7,188
10,696 11,568
7,484
14,968
Non-Domestic Domestic

82
Figure 57: Quarterly domestic RHI applications by technology
Source: June RHI deployment data - https://www.gov.uk/government/statistics/rhi-monthly-deployment-data-june-2021-quarterly-edition
Meanwhile, in the non-domestic scheme, the increase in applications seen in March actually bucked the trend of most applications being for biomass, with applications for ASHP, ground source heat pumps (GSHP), and solar PV all seeing a larger quarterly increase than that of biomass.
Figure 58: Quarterly non-domestic RHI applications by technology
Source: June RHI deployment data - https://www.gov.uk/government/statistics/rhi-monthly-deployment-data-june-2021-quarterly-edition
-
1,000
2,000
3,000
4,000
5,000
6,000
7,000
2014
Q3
2014
Q4
2015
Q1
2015
Q2
2015
Q3
2015
Q4
2016
Q1
2016
Q2
2016
Q3
2016
Q4
2017
Q1
2017
Q2
2017
Q3
2017
Q4
2018
Q1
2018
Q2
2018
Q3
2018
Q4
2019
Q1
2019
Q2
2019
Q3
2019
Q4
2020
Q1
2020
Q2
2020
Q3
2020
Q4
2021
Q1
2021
Q2
ASHP GSHP Biomass Solar Thermal
-
500
1,000
1,500
2,000
2,500
Biomass ASHP G/WSHP Solar PV

83
7.3. HyNet North West
On 9 July, HyNet North West launched its cross-party coalition to secure backing from the UK Government for its plans to transform the North West of England and North Wales into one of the world’s first low-carbon industrial clusters98. Justin Madders, Labour MP for Ellesmere Port, and Andy Carter, Conservative MP for Warrington South, have joined HyNet North West as Co-Chairs of the cross-party coalition group that is urging the Government to select HyNet in the first phase of approvals and avoid delays that could hit businesses across the region. The project aims to reduce carbon dioxide emissions in the area by 10 million tonnes every year by 2030 and could deliver 80% of the UK’s clean hydrogen target for transport, industry, and homes for 2030 and 50% of the UK’s 2050 hydrogen target. Nationwide, HyNet will support up to 75,000 jobs by 2035 and generate up to £31 billion gross value added by 2050.
Figure 59: HyNet project timeline
Source: https://hynet.co.uk/
The project has support from a number of businesses that are ready to cut emissions, avoid carbon costs, and invest in green growth. The businesses range from manufactures such as Encirc, who manufacture glass bottles, to energy companies such as Progressive Energy. This is in addition to local governmental support, with the two Metro Mayors of Manchester and Liverpool, and the three Local Enterprise Partnerships for Manchester, Liverpool, and Cheshire pledging their support.
98 https://www.renewableenergymagazine.com/hydrogen/uk-cross-party-coalition-launched-to-secure-20210712

84
Figure 69, below, shows a map of what the region could look like once the project is completed:
Figure 60: Map of the industry in the North West once the project is completed
Source: https://hynet.co.uk/

85
7.4. Heat Networks Update Renewable Energy Planning Database The Renewable Energy Planning Database (REPD) was published in 2014, and has been updated regularly ever since. It is a useful resource for tracking the progress of renewable energy projects such as solar farms, from inception to decommissioning. As of March 2021, a new database has been added – tracking heat networks. As this is the first time heat networks have been added to the REPD, it only captures new applications made between October 2020 and March 2021, as well as updates to previously submitted applications, and projects in the planning stage which did not receive government funding99.
There are 160 heat networks in the REPD, only three of which are operational, however a further 96 are either under construction or are awaiting construction.
Figure 61: Development status of heat networks in the REPD
Source: Renewable Energy Planning Database - https://www.gov.uk/government/publications/renewable-energy-planning-database-monthly-extract
Of the 160 heat networks in the REPD, over three quarters (76%) are powered by either air source heat pumps or gas fired CHP.
99 https://www.gov.uk/government/publications/renewable-energy-planning-database-monthly-extract
56
3
2
54
42
3
Application Submitted
Application Refused
Application Withdrawn
Awaiting Construction
Under Construction
Operational

86
Figure 62: Primary technologies of heat networks in the REPD (non-renewables highlighted in orange)
Source: Renewable Energy Planning Database - https://www.gov.uk/government/publications/renewable-energy-planning-database-monthly-extract
Overall, the balance of renewable vs. non-renewable heat networks in the REPD is slightly in favour of renewables, with 51% being powered by renewable sources compared to 49% by non-renewables.
Low-carbon Heat in the City of London One of the UKs largest low-carbon heating systems will soon be heating buildings in the City of London, using a combination of a ground source heat pump, and an existing underground heat and power station100. The project will cost £4m and will provide the same amount of heat as used by 2,300 homes with 50% less carbon emissions101.
100 https://www.energylivenews.com/2021/06/24/earth-to-heat-up-londons-square-mile/ 101 https://www.theguardian.com/business/2021/jun/23/low-carbon-heating-system-to-warm-up-londons-square-mile
66
55
13
9
6
6
4
1
Gas Fired CHP
Air Source Heat Pumps
Gas Boiler
Biomass (dedicated)
Ground Source Heat Pumps
Water Source Heat Pumps
EfW Incineration
Solar Thermal
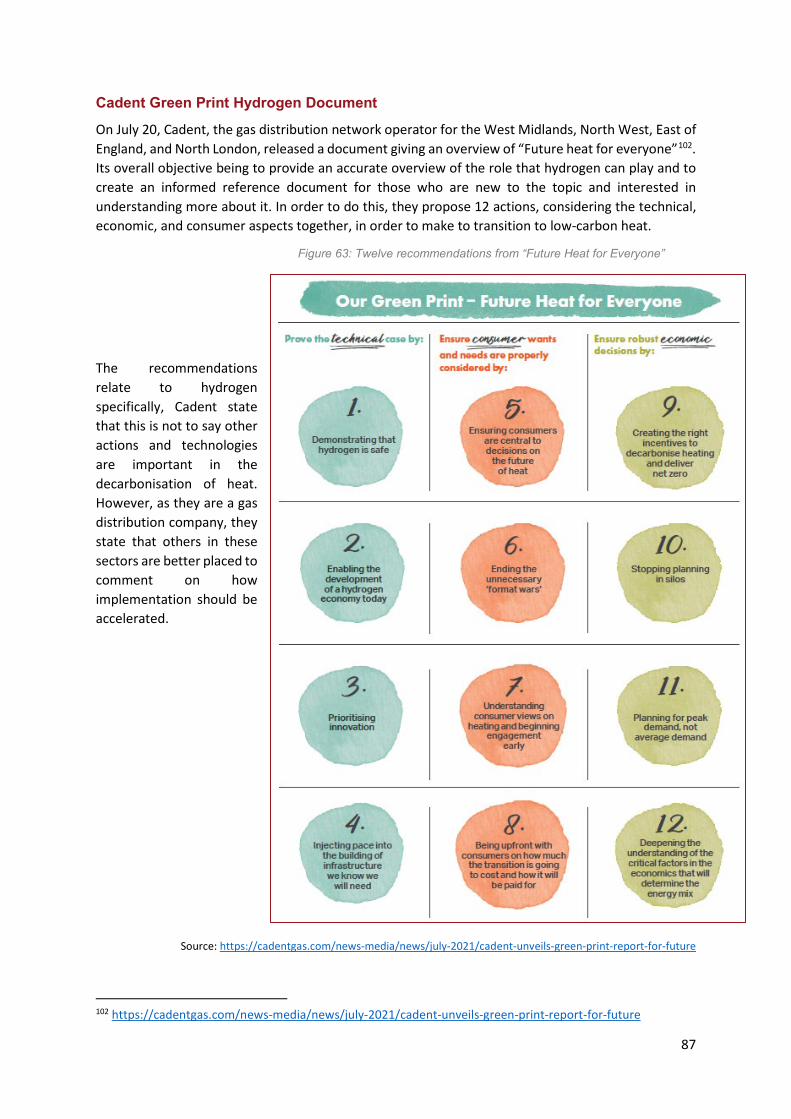
87
Cadent Green Print Hydrogen Document
On July 20, Cadent, the gas distribution network operator for the West Midlands, North West, East of England, and North London, released a document giving an overview of “Future heat for everyone”102. Its overall objective being to provide an accurate overview of the role that hydrogen can play and to create an informed reference document for those who are new to the topic and interested in understanding more about it. In order to do this, they propose 12 actions, considering the technical, economic, and consumer aspects together, in order to make to transition to low-carbon heat.
Figure 63: Twelve recommendations from “Future Heat for Everyone”
The recommendations relate to hydrogen specifically, Cadent state that this is not to say other actions and technologies are important in the decarbonisation of heat. However, as they are a gas distribution company, they state that others in these sectors are better placed to comment on how implementation should be accelerated.
Source: https://cadentgas.com/news-media/news/july-2021/cadent-unveils-green-print-report-for-future
102 https://cadentgas.com/news-media/news/july-2021/cadent-unveils-green-print-report-for-future

88
Annex A. Detailed breakdown of the Transport Decarbonisation Plan.
As outlined in the overview of the Transport Decarbonisation Plan in section 3.4. the plan outlines 12 commitment areas and 78 specific commitments that aim to outline how the UK is going to achieve net zero transport. The first six commitment areas relate to direct decarbonisation, covering active transport, buses and coaches, railways, personal vehicles, maritime, and aviation. The second six areas cover enablers such as logistics, allocation of measures, and maximising the benefit of low-carbon fuels. These are the wider issues that need to be considered to obtain a fully zero carbon transport system.
Commitment Area One: Increasing cycling and walking
• Invest £2bn over five years with the aim that half of all journeys in towns and cities will be cycled or walked by 2030
• Deliver a world class cycling and walking network in England by 2040
The plan estimates that achieving these goals will add between £1bn and £4bn in GVA by 2050 from manufacture, distribution, sales, and repairs of bikes, as well as supporting between 40 and 100 thousand jobs by 2050. In terms of carbon emissions and air quality, it is estimated that between one and six MtCO2e will be saved between 2020 and 2040, bringing with it between £20m and £100m of air quality benefits.
Increasing the number of journeys that are walked or cycled will significantly reduce the impact of zero-emission transport on the electricity network as these journeys would otherwise be taken in a personal EV or electric public transport. This reduces the electrical demand on the network and allows a more gradual and strategic network investment strategy.
Commitment Area Two: Zero emission buses and coaches
• Deliver the National Bus Strategy’s vision of a transformed bus industry and a green bus revolution
• Consult on modernising the Bus Service Operators’ grant in 2021 • Support the delivery of 4,000 new zero emission buses and the infrastructure needed to
support them • Deliver the first all-electric bus town or city • Consult on a phase out date for the sale of new non-zero emission buses • Consult on a phase out date for the sale of new non-zero emission coaches
The plan estimates that achieving these goals will add up to £1bn in GVA and will support up to 7,000 jobs by 2050. In terms of carbon emissions and air quality, it is estimated that between 35 and 37 MtCO2e will be saved between 2020 and 2050, bringing with it up to £160m of air quality benefits.
The plan does not specify if the 4,000 new zero emission buses will be electric or hydrogen. It will likely be a combination of both depending business case for each location. The impact of this on UK Power Networks depends on the fuel source chosen for buses in our area. More electric buses will likely require smart solutions such as flexible connections, as well as network reinforcement.

89
Commitment Area Three: Decarbonising our railways
• Deliver a net zero carbon railway network by 2050, with sustained carbon reductions in rail along the way. The ambition is to remove all diesel only trains (passenger and freight) by 2040
• Deliver an ambitious, sustainable, and cost effective programme of electrification guided by Network Rail’s Traction Decarbonisation Network Strategy
• Support the development of battery and hydrogen trains and deploy them on the network as it decarbonises. Technology will be used to clean up diesel trains until they can be removed altogether
• Build extra capacity on the rail network to meet growing passenger and freight demand and support significant shifts from road and air to rail
• Work with industry to modernise fares ticketing and retail to encourage a shift to rail and cleaner and greener transport journeys
• Improve rail journey connectivity with walking, cycling, and other modes of transport • Introduce a rail freight growth target • Incentivise the early take up of a low-carbon traction for rail freight
The plan estimates that achieving these goals will add up to £11m in GDP supported in 2035 and will support up to 3,000 specialised jobs. In terms of carbon emissions and air quality, it is estimated that between 21 and 22 MtCO2e will be saved between 2020 and 2050, bringing with it up to £1bn of air quality benefits.
The plan reiterates, as was originally stated in the recent rail whitepaper, that rail electrification will likely be the main way of decarbonising the majority of the network. However, hydrogen and battery trains will also be explored, with the most appropriate technology being used for each route. This will have a significant impact for network companies as electrified trains in the UK predominantly use either a third rail103 or 25kV overhead lines104, both of which are distribution connected. Additionally, there will be little scope for smart solutions for electrified rail as the electricity will be needed continuously whenever the train is in operation.
103 Third rail takes 33kV AC and transforms it into 750V DC, it is carried via a third rail which makes contact with the bottom of the train and conducts the current 104 https://www.networkrail.co.uk/communities/living-by-the-railway/electrification/overhead-line-equipment/
90
Commitment Area Four: A zero emission fleet of cars, vans, motorcycles, and scooters
• Consult on regulatory options, including zero emission vehicle mandates, to deliver petrol and diesel phase out dates for new vehicles
• Zero emission cars and vans delivery plan already published • Continue to support demand for zero emission vehicles through a package of financial and
non-financial incentives • Consult this year on a phase out date of 2035, or earlier if a faster transition appears feasible,
for the sale of new non-zero emission powered two and three wheelers • Deliver an action plan this year to build new UK opportunities for zero emission light powered
vehicles • Lead by example with 25% of the government car fleet ultra-low emission by December 2022
and 100% of the government van fleet zero emission by 2027 • Ensure the UK’s charging infrastructure network meets the demands of its users • Support and nurture innovation in the UK automotive sector • Invest £15m in 2021/22 to help address the backlog in traffic signal maintenance to improve
traffic flow and reduce emissions • Review the National Networks National Policy Statement
The plan estimates that achieving these goals will add up to £8bn in GVA supported in 2050 and will support up to 60,000 jobs. In terms of carbon emissions and air quality, it is estimated that between 620 and 850 MtCO2e will be saved between 2020 and 2050, bringing with it up to £8bn of air quality benefits. Another key piece of investment outlined in the plan is the £330m Faraday Battery Challenge, which tackles the technical challenges of reusing and recycling batteries, with the aim of making 95% recyclable by 2035. This is crucial as batteries are made using rare earth metals and so finding a way to reuse the metal already in batteries will make the UK more self-sufficient and will reduce emissions from shipping the metals to the UK.
The government understands the impact this will have on the energy system, estimating that electrifying the UK car and van fleet would increase electricity demand by 20%. The Energy White Paper sets out the policy framework to ensure that there is sufficient investment to power the EV transition, and robust and proven market mechanisms are in place to ensure that supply will meet demand.

91
Commitment Area Five: Accelerating maritime decarbonisation
• Plot a course to net zero for the UK domestic maritime sector, with indicative targets from 2030 and net zero as early as is feasible
• Consult on the potential for a planned phase out date for the sale of new non-zero emission vessels
• Asses how economic instruments could be used to accelerate the decarbonisation of the domestic maritime sector
• Accelerate the development of zero emission technology and infrastructure in the UK • Consult this year on the appropriate steps to support and, if needed, mandate the uptake of
shore power in the UK • Extend the Renewable Transport Fuel Obligation to support renewable fuels of non-biological
origin used in shipping • Internationally, the UK will press for greater ambition during the 2023 review of the
International Maritime Organisation (IMO) Initial Greenhouse Gas Strategy and urge accelerated decarbonisation
• Ensure the UK has the right information to regulate emissions, and to judge the effectiveness of the steps we are taking in the UK and the IMO
The plan estimates that achieving these goals will add up to £17bn in GVA supported and will support up to 220,000 jobs. In terms of carbon emissions and air quality, it is estimated that between 180 and 230 MtCO2e will be saved between 2020 and 2050, and has the potential to significantly reduce emissions of NOx, SO2, and PM2.5.
The plan for net zero maritime is in its early stages. The government will establish, following public consultation in 2022, an ambitious ‘Course to Zero’. This consultation will explore the technical, operational and policy options available for Government to accelerate decarbonisation in this sector to achieve net zero by no later than 2050 or earlier if possible. This will be embedded in in the upcoming Clean Maritime Plan (CMP), as part of a planned review and refresh – due to start in 2022. Within the CMP the long term interventions needed to achieve full decarbonisation will be outlined.
The decarbonisation of maritime could impact on our network, depending on the specifics of the plan. If zero emission vessels are battery powered and charge from the distribution network, then it would result in significant additional load on the network. However, if they are hydrogen powered, or charge from onsite generation (for example an offshore windfarm) then the impact will be substantially less.

92
Commitment Area Six: Accelerating aviation decarbonisation
• Consult on the Jet Zero strategy, which will set out the steps taken to reach net zero aviation emissions by 2050
• Consult on a target for UK domestic aviation to reach net zero by 2040 • Consult on a target for decarbonisation emissions from airport operations in England from
2040 • Supporting the development of new and zero carbon UK aircraft technology through the
Aerospace Technology Institute (ATI) • Fund zero emission flight infrastructure R&D at UK airports • Kick start commercialisation of UK sustainable aviation fuels • Consult on a UK sustainable fuels mandate • Support UK airspace modernisation • Further develop the UK emissions trading scheme to help accelerate aviation decarbonisation • Work with industry to accelerate the adoption of innovative zero emission aircraft and
aviation technology in General Aviation • Aim to agree ambitious long-term global emissions reduction goal in the International Civil
Aviation Organisation by 2022
Overall, if the actions relating to the six direct decarbonisation areas are completed, it will result in £113bn in GVA, over one million jobs supported, and £9.2bn in air quality benefits by 2050.
Figure 64: GVA added by 2050 (£bn)
Source: Transport decarbonisation plan - https://www.gov.uk/government/publications/transport-decarbonisation-plan
2.5
1
8 17 85
0 20 40 60 80 100 120
Walking and cycling Buses and coaches Railways
Personal vehicles Maritime Aviation

93
Figure 65: Air quality benefits by 2050 (£m)
Source: Transport decarbonisation plan - https://www.gov.uk/government/publications/transport-decarbonisation-plan
These six commitment areas cover the decarbonisation plans of the key transport methods in the UK. The next six areas relate to enablers that allow these decarbonisation plans to be used to full effect.
Commitment Area Seven: Delivering a zero emission freight and logistics centre
• Consult on phase out dates for all new non-emission HGVs • Demonstrate zero emission HGV technology on UK roads this year • Support and encourage model shift of freight from road to more sustainable alternatives such
as rail, cargo bike, and inland waterways • Take forward measures to transform “last mile” deliveries
The plan estimates that achieving these goals will add up to £700m in GVA supported in 2050 and will support up to 5,000 jobs. In terms of carbon emissions and air quality, it is estimated that between 200 and 220 MtCO2e will be saved between 2020 and 2050, bringing with it up to £600m of air quality benefits.
As decarbonising HGVs is known to bring with it more complications than the decarbonisation of personal vehicles, the support of a modal shift away from road freight could prove a key enabler for decarbonising this sector. For example, Tesco have invested in their rail network to move freight from road to rail. They have a number of new services aimed at giving further coverage, Tesco estimate this service will remove 72,000 HGV journeys off the road and save around 24,000 tonnes of CO2 emissions. One of the ways the government plan on demonstrating the viability of zero emission HGVs is by developing cost-effective, zero emission HGVs and refuelling infrastructure across the UK. This includes designing electric road system and hydrogen fuel cell trials, developing technology and UK supply chains, and providing funding to demonstrate and prove real world applications of emerging battery electric trucks.
60
160
1000 8000
0 2000 4000 6000 8000 10000
Walking and cycling Buses and coaches Railways Personal vehicles

94
Commitment Area Eight: Delivering decarbonisation through places
• Support decarbonisation by investing more than £12bn in local transport systems over the current Parliament, enabling local authorities to invest in local priorities – including those related to decarbonisation such as reducing congestion and improving air quality
• Drive decarbonisation and transport improvements at a local level by making quantifiable carbon reductions a fundamental part of local transport planning and funding
• Publish a local authority toolkit in 2021, providing guidance to support local areas to deliver more sustainable transport measures
• Embed transport decarbonisation principles in spatial planning and across transport policymaking
• Create at least one zero emission transport city and four industrial “SuperPlaces” • Complete the review of how to best represent decarbonisation measures in transport
business cases and appraisals
This area of the plan is critical in enabling regional authorities to enact their climate plans. Many local authorities have climate ambitions of reaching net zero by 2050, and some to reach net zero before the national 2050 target. However, most do not have the funds or staff to make this happen so giving them the resources to enable carbon reductions in their area could prove critical in enabling the UK as a whole to reach net zero by 2050.
Commitment Area Nine: Maximising the benefits of sustainable low-carbon fuels
• Increase the main Renewable Transport Fuels Obligation (RTFO) target • Introduce petrol with up to 10% ethanol as standard petrol in September 2021 • In cooperation with stakeholders, review the role of fuels with higher biocontent starting this
year and explore potential measures to remove existing market barriers for use in certain compatible vehicles
• Seek to maximise the use of low-carbon fuel in aviation and maritime as detailed in other relevant commitments in this plan
• Develop a strategy for low-carbon fuels, from now until 2050, to set out a clear signal about the government’s vision for the sector
If these targets are achieved, the plan estimates they will contribute up to £900m GVA and up to 5,100 jobs in 2040. The proposed change to the RTFO will see the obligation of low-carbon fuel supply as a percentage of total fuel provided by suppliers rise by 5 percentage points, increasing from 9.6% in 2021 to 14.6% in 2032. This is estimated to save 20.8MtCO2e over the period.

95
Commitment Area Ten: Hydrogen’s role in a decarbonised transport system
• The government will publish an overarching hydrogen strategy in summer 2021, which will focus on the increased production of hydrogen and use across the economy, including for transport
• Invest £3m in 2021 to establish the UK’s first multi-modal hydrogen hub in Tees Valley
Hydrogen could prove to be critically important in enabling the UK to achieve net zero by 2050, as it can aid decarbonisation of both transport and heating.
Commitment Area Eleven: Future transport – more choice, better efficiency
• Take action to increase average road vehicle occupancy by 2030 • Publish guidance for local authorities on support for shared car ownership and shared
occupancy schemes and services • Support car clubs to go fully zero emission • Consult on a mobility as a service code of practice • Use national e-scooter trials to understand their environmental impact, safety, and mode shift
potential to evaluate whether they should be legalised • Reduce barriers to data sharing across the transport sector • Launch a new annual statistical release and guidance about transport’s impact on the
environment and support its use by third parties • Explore the introduction of a new sustainable travel reward scheme supported by businesses,
community organisations, and charities • Support transport providers to develop communications campaigns and encourage mode-
switch and sustainable transport behaviours • Encourage and support UK businesses to lead the way in taking action to reduce emissions
from their employee’s travel journeys through “Commute Zero” • Identify specific opportunities for decarbonisation through innovation in rural areas in the
upcoming “Future of Transport: Rural Strategy” • Help build a skilled workforce for the future of transport
Due to the changes in transport driven by technology and demand, it is critical to stay ahead of the curve and encourage changes in behaviour to increase the pace of decarbonisation even further. Utilising shared access and/or ownership of vehicles, or utilising autonomous vehicles can allow one vehicle to serve more people, therefore reducing overall emissions. One commitments relates to data sharing, and a specific example given is opening up chargepoint data to help consumers locate chargepoints, understand whether they are in use and promote greater choice when deciding where to charge. Accessibility and availability of this data will not only provide consumers with better information to encourage the shift to zero emission vehicles but will also support local authorities and DNOs to identify where installation is required.

96
Commitment Area Twelve: Supporting UK research and development as a decarbonisation enabler
• Coordinate transport’s investment in R&D, collaborating with key stakeholders through the Transport Research and Innovation Board (TRIB).
• Update the Areas of Research Interest and publish new DfT science plan by summer 2021.
These twelve commitment areas and the specific commitments they contain make up the transport decarbonisation plan. It is interesting to note that the value of the commitments isn’t just measured in GVA and MtCO2e saved, but also in real terms health benefits, for example the air quality benefits. The plan estimates that the overall benefit to health could be significant, poor air quality could cost health and social care services in England £5.3bn by 2035, and negative health impacts associated with increased noise levels cost between £7bn and £10bn per annum. The transport decarbonisation plan, if successful in its deployment, could do much to alleviate this.
Related Documents