Market Forces in European Soccer 1 Marco Haan 2 Ruud H. Koning 3 Arjen van Witteloostuijn 4 10th March 2002 1 An earlier version of this paper was prepared for the Dutch conference on ‘market regulation’, 20 October 2000. We thank Bart Los and Tom Wansbeek for comments. 2 Dept. of Economics, P.O. Box 800, 9700 AV Groningen, The Netherlands, email [email protected]. 3 Dept. of Econometrics, P.O. Box 800, 9700 AV Groningen, The Netherlands, email [email protected]. 4 Dept. of International Economics and Business, P.O. Box 800, 9700 AV Groningen, The Netherlands, email [email protected].

Welcome message from author
This document is posted to help you gain knowledge. Please leave a comment to let me know what you think about it! Share it to your friends and learn new things together.
Transcript

Market Forces in European Soccer1
Marco Haan2 Ruud H. Koning3 Arjen van Witteloostuijn4
10th March 2002
1An earlier version of this paper was prepared for the Dutch conference on ‘marketregulation’, 20 October 2000. We thank Bart Los and Tom Wansbeek for comments.
2Dept. of Economics, P.O. Box 800, 9700 AV Groningen, The Netherlands, [email protected].
3Dept. of Econometrics, P.O. Box 800, 9700 AV Groningen, The Netherlands, [email protected].
4Dept. of International Economics and Business, P.O. Box 800, 9700 AV Groningen,The Netherlands, email [email protected].

Abstract
Recent decades have witnessed major changes in the market for European soc-cer. The most profound were the Bosman ruling, which lifted restrictions in theEuropean labor market for soccer talent, and the introduction of the Champi-ons’ League, a high-profile international competition that generates high rev-enues for participating clubs. This paper studies the effects of these changeson the closeness of national and international competitions, from both a the-oretical and an empirical perspective. We show that competitive balance innational competitions has not been affected. International quality differencesdid increase, mainly as a result of the Bosman ruling.
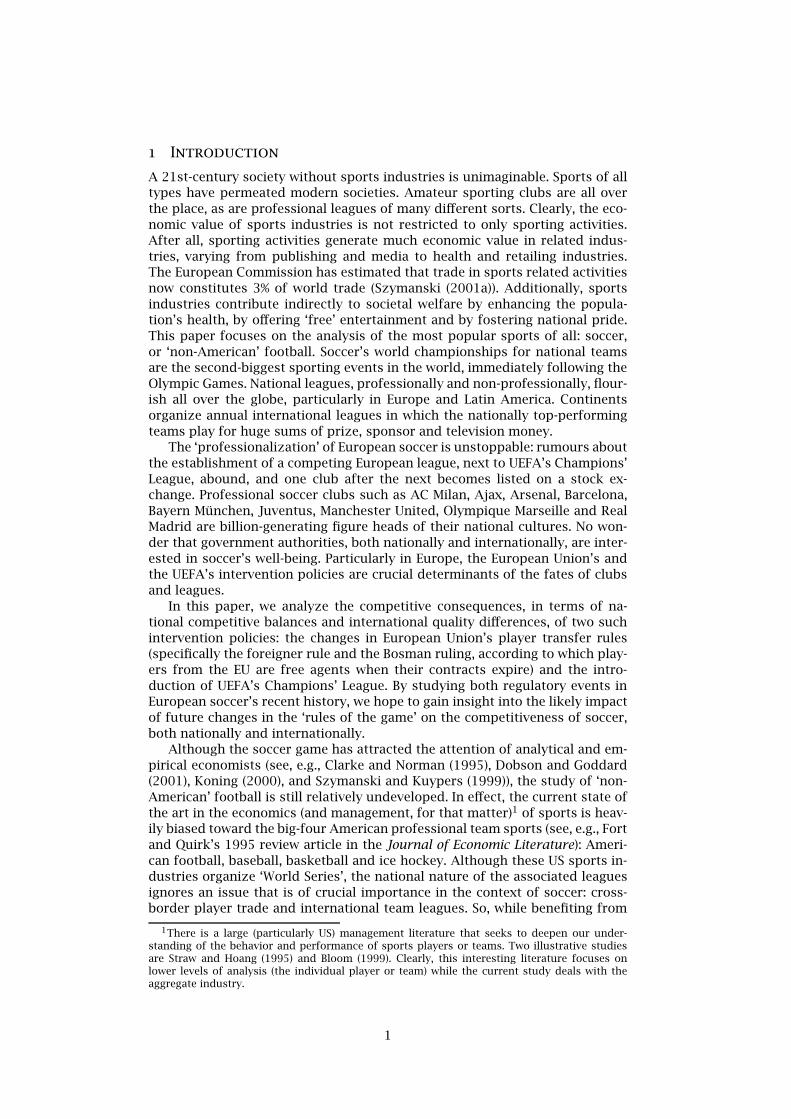
1 Introduction
A 21st-century society without sports industries is unimaginable. Sports of alltypes have permeated modern societies. Amateur sporting clubs are all overthe place, as are professional leagues of many different sorts. Clearly, the eco-nomic value of sports industries is not restricted to only sporting activities.After all, sporting activities generate much economic value in related indus-tries, varying from publishing and media to health and retailing industries.The European Commission has estimated that trade in sports related activitiesnow constitutes 3% of world trade (Szymanski (2001a)). Additionally, sportsindustries contribute indirectly to societal welfare by enhancing the popula-tion’s health, by offering ‘free’ entertainment and by fostering national pride.This paper focuses on the analysis of the most popular sports of all: soccer,or ‘non-American’ football. Soccer’s world championships for national teamsare the second-biggest sporting events in the world, immediately following theOlympic Games. National leagues, professionally and non-professionally, flour-ish all over the globe, particularly in Europe and Latin America. Continentsorganize annual international leagues in which the nationally top-performingteams play for huge sums of prize, sponsor and television money.
The ‘professionalization’ of European soccer is unstoppable: rumours aboutthe establishment of a competing European league, next to UEFA’s Champions’League, abound, and one club after the next becomes listed on a stock ex-change. Professional soccer clubs such as AC Milan, Ajax, Arsenal, Barcelona,Bayern Munchen, Juventus, Manchester United, Olympique Marseille and RealMadrid are billion-generating figure heads of their national cultures. No won-der that government authorities, both nationally and internationally, are inter-ested in soccer’s well-being. Particularly in Europe, the European Union’s andthe UEFA’s intervention policies are crucial determinants of the fates of clubsand leagues.
In this paper, we analyze the competitive consequences, in terms of na-tional competitive balances and international quality differences, of two suchintervention policies: the changes in European Union’s player transfer rules(specifically the foreigner rule and the Bosman ruling, according to which play-ers from the EU are free agents when their contracts expire) and the intro-duction of UEFA’s Champions’ League. By studying both regulatory events inEuropean soccer’s recent history, we hope to gain insight into the likely impactof future changes in the ‘rules of the game’ on the competitiveness of soccer,both nationally and internationally.
Although the soccer game has attracted the attention of analytical and em-pirical economists (see, e.g., Clarke and Norman (1995), Dobson and Goddard(2001), Koning (2000), and Szymanski and Kuypers (1999)), the study of ‘non-American’ football is still relatively undeveloped. In effect, the current state ofthe art in the economics (and management, for that matter)1 of sports is heav-ily biased toward the big-four American professional team sports (see, e.g., Fortand Quirk’s 1995 review article in the Journal of Economic Literature): Ameri-can football, baseball, basketball and ice hockey. Although these US sports in-dustries organize ‘World Series’, the national nature of the associated leaguesignores an issue that is of crucial importance in the context of soccer: cross-border player trade and international team leagues. So, while benefiting from
1There is a large (particularly US) management literature that seeks to deepen our under-standing of the behavior and performance of sports players or teams. Two illustrative studiesare Straw and Hoang (1995) and Bloom (1999). Clearly, this interesting literature focuses onlower levels of analysis (the individual player or team) while the current study deals with theaggregate industry.
1

the ‘autarkic’ US literature, we develop an empirical and theoretical analysis ofinternational sports economics in the setting of European soccer. In this con-text, as said, this paper focuses on issues of competition. The reason for thisis twofold.
First, the peculiar feature of sports industries in general and soccer leaguesin particular is that competition is their very product. Sports leagues need toproduce ‘competitive excitement’ to survive. Without competitive excitement,a sports league would be dull: after all, then there is not much that is attrac-tive to customers (i.e., fans). This is in contrast with non-sports industries. Thesports industries’ uniqueness in the business world as a producer and seller ofcompetition makes them particularly interesting from an antitrust perspective.The production of competitive excitement is unlikely to be a sustainable activ-ity without any cartel-like arrangement at the industry (i.e., league) level. Theindustry’s cartel function is to organize a competitive league and to stimulatecompetitive balance.
Second, and related to the above, sports industries tend to be associatedwith a conflict of interest at the policy level. Again, European soccer is an illu-minating case in point. On the one hand, as explained above, the very ‘prod-uct’ of soccer is bound up with cartel-like arrangements, implying that theantitrust authorities must tolerate tailor-made anti-competitive soccer prac-tices (such as the industry-level sharing rules as to television rights). On theother hand, much of European soccer’s attractiveness derives from interna-tional competition among national club teams in UEFA leagues. However, suchEuropean leagues, like their national counterparts, must produce competitiveexcitement. This requires establishing and maintaining industry-level mecha-nisms that help to avoid the emergence of large international quality differ-ences. In this context, many soccer experts argue that an international playertransfer system that promotes the free movement of soccer players, whichwould be in line with the European Union’s integration philosophy, is a deathpenalty for many European and national leagues. Hoehn and Szymanski (1999)argue that “single-league competition for the top clubs is the most plausibleequilibrium for European football.” Moving from the current European systemto a more American structure, they argue, should be beneficial for clubs.
So, issues of national competitive balances and international quality differ-ences in European soccer are at the very heart of key policy debates in theEuropean Union and its member states. This paper’s aim is to contribute tothis debate by offering an in-depth analysis of the competitive consequencesof earlier changes in the ‘rules of the game’ in European soccer, which maybe instrumental in understanding what might be the impact of future policyinterventions. Section 2 develops a model of national and international soccercompetition that analyzes the competitive effects of promoting free interna-tional player trade and introducing a Champions’ League for nationally top-performing teams. Subsequently, Section 3 explores these issues empirically bycalculating proxies for national competitive balances and international qualitydifferences for a number of European countries in the post-war period. Finally,Section 4 discusses our findings in relation to the current policy debate.
2 A Theoretical Model
2.1 The European Soccer Market
Sports leagues differ from regular industries. The demand for the product pro-duced by a sports league industry depends not only on the absolute qualitiesprovided by the different producers, but also on the difference between those
2
qualities. An exciting league, in which qualities of the teams are comparable,leads to greater fan interest. Fans favor competitive balance, which is asso-ciated with a not-too-uneven distribution of qualities of teams in a competi-tion. Discussions about institutional features of international soccer suggestthat fans, teams and policy makers also care about the overall quality levelin a given national league. Therefore, people care not only about intra-leaguecompetitive balance, but also about inter-league competitive balance, or inter-national quality differences.2 When international quality differences increase,fans in countries with low-quality leagues are (even) worse off, as their leaguesbecome less attractive, while fans in high-quality leagues are better off as theirleagues become more attractive. International competitions, however, becomeless exciting.
The European soccer market differs fundamentally from sports marketsin the US. While in the US leagues are (almost) always monopolists, nationalleagues compete in the European soccer market. They do so in two ways. First,the most successful teams in a national league play each other in internationalplay-offs, such as the Champions’ League or the UEFA cup. Second, nationalleagues, or rather teams within national leagues, compete for talent. In manyUS leagues, players effectively do not have the possibility to market their talentoutside their own professional monopolistic sports league. European soccerplayers do have that possibility: they often move to competing foreign leagues.This limits the scope for collusion within a national league. Arrangements suchas a salary cap, used in American professional basketball, are hardly viable ina national soccer league. The model we develop in this section captures thesefeatures of European soccer: the existence of international competitions, andthe possibility for talent to move freely between national competitions.
Our model focuses on two issues: the introduction of the Bosman rulingand the Champions’ League. First, in the past, clubs have tried to restrict thepossibility of players moving across borders. Yet, with the Bosman ruling in1995, these barriers have been lowered. Before this ruling, teams could askfor a transfer fee if a player left the club when his contract expired. After theruling, a soccer player from the European Union (EU) is a free agent within theEU after his contract expires. Moreover, in this ruling it was also determinedthat teams within the EU are not subject to any restrictions on the number ofEU-players they can field. For more information on the background and impli-cations of the Bosman ruling we refer to Antonioni and Cubbin (2000). Second,the UEFA launched a prestigious international competition in 1990. For sure,international competitions already existed before 1990. However, the interna-tional prestige and, especially, the amount of money at stake were substantiallylower then.
2.2 The Benchmark Model
Consider a single country that has a soccer league that operates in isolation.For future reference, we will denote this country as country a.3 Players cannotbe transferred to leagues in other countries. For simplicity, we assume thatthere are only two clubs. It is easy to extent the analysis to more clubs, butfor our purposes two clubs suffice. We assume that clubs maximize profits.They will thus hire talent up to the point where the marginal revenues of do-
2For ease of discussion, in the remainder of this paper we will talk about national competitivebalance if we mean intra-league competitive balance, and about international quality differenceswhen we refer to inter-league competitive balance.
3Note that, for this subsection, we do not need the country index. We prefer to use it however,in order to have a consistent notation throughout this section.
3

ing so equal the marginal costs. The amount of talent in club j in country ais denoted taj. As a normalization, the total amount of talent in this countryequals 1, thus ta1 + ta2 = 1. Revenues of a club consist of three components.The first is related to the club’s own supporters. These sources of income in-clude gate receipts, merchandising profit, local television contracts, et cetera.For simplicity, we refer to these as gate receipts, and denote them Gaj for clubj. We assume
Gaj =(Daj − ktaj
)taj.
Here, Daj is a constant that differs among clubs, giving the exogenous drawingpotential of a club. A club’s drawing potential reflects the amount of revenuesit can generate with a given amount of talent. This depends, for example, onthe size of the city where a club is located, the popularity of soccer in thatparticular city, and the extent to which a club is successful in marketing itself.Weak-drawing clubs have low D, whereas strong-drawing clubs have high D.For the purposes of our paper, drawing potential is exogenously given. Theparameter k is some exogenous constant, and does not qualitatively affect theanalysis. We assume k < 2Dij ∀i, j, i.e., gate receipts are globally increasingin the amount of talent a club has. Note that the above specification impliesa linear downward-sloping marginal revenue curve, which is also assumed in,e.g., Fort and Quirk (1995). Admittedly, our specification is highly simplified.Yet, this specification allows for simple analytical solutions, and further com-plicating the function above will not affect the gist of the analysis.
The second component of a club’s revenues is the prize money it receiveswhen winning the league. This amount is exogenously given and equal to Fa.The third and final component is a lump sum based on, e.g., national televisioncontracts. We do not take this into account in the further analysis. For simplic-ity, the only costs we consider are the costs of hiring talent. For team j, theseare equal to ctaj, with c the constant per-unit cost of talent, that is, the wagerate of talent. We assume that the probability that team j wins the league isgiven by
paj = 12+ 12
(taj − ta−j
)(1)
with j = 1,2 and where −j denotes the team other than j. With this speci-fication, when both teams have the same amount of talent, they both have aprobability 1
2 of winning. Also, the higher the amount of talent in a team, thehigher its probability of winning the league. If a club has all the talent, then itwins with certainty. Finally, this specification satisfies the condition that prob-abilities should sum to one.
From the above analysis, total revenues of team j follow from
Raj =(Daj − ktaj
)taj + pajFa
=(Daj − ktaj
)taj + 1
2
(1+ taj − ta−j
)Fa.
Since any club realizes that adding talent implies that the other club will haveless talent, and since ta1 + ta2 = 1, this implies
Raj =(Daj − ktaj
)taj + tajFa.
With the price per unit of talent given by c, profits are maximized by settingmarginal revenue equal to c. Therefore, in equilibrium, marginal revenues ofclubs are equal. Hence,
Da1 − 2kta1 + Fa = Da2 − 2kta2 + Fa. (2)
4

From the above equality, and using ta1 + ta2 = 1, the equilibrium has4
taj = 12+ 14
(Daj −Da−j
)/k. (3)
Thus, in equilibrium, the club with higher drawing power attracts more talent.Without loss of generality, assume that this is club 1, soDa1 ≥ Da2. If we definecompetitive balance as the difference in winning probabilities, we have
cba = pa1 − pa2 = ta1 − ta2 = 14Da1 −Da2
2k. (4)
With a competitive labor market, wages will be bid up to the point where clubs’profits are zero. Thus
c = 12(Da1 +Da2)+ Fa − k. (5)
2.3 Introducing International Trade
Now suppose that international trade in players is possible. We assume thatthere are two countries, a and b, which are both endowed with an amount oftalent equal to 1. This may seem at odds with differences in population size,but we look at top soccer players, and the distribution of maximum talentvaries slowly with the population size. Initially, there is no trade, so the marketequilibrium is given by (3) through (5). Now markets open up, so talent canmove freely from one country to the other. In Europe, international player tradehas been allowed for a long time, but teams were severely restricted in thenumber and type of foreign players they could field. Since the Bosman-ruling,players from the European Union can be fielded with any team from a memberstate without restrictions.
Denote the total amount of talent that will end up in country a in equilib-rium as ta, and that in country b as tb. Thus, ti ≡ ti1 + ti2, with i = a,b. Also,Di ≡ Di1+Di2, with i = a,b. Total revenues of, for example, team 1 in countrya are now given by
Ra1 = (Da1 − kta1) ta1 + 12(1+ ta1 − ta2) Fa.
Again, teams realize that the amount of talent their competitor hires, is depen-dent on the amount of talent they hire: ta2 = 2− tb − ta1. Therefore,
Ra1 = (Da1 − kta1) ta1 + 12(2ta1 + tb − 1) Fa.
Expressions for the other three clubs are similar. Marginal revenues for club jin country i now equal
∂Rij∂tij
= Dij − 2ktij + Fi, (6)
with i = a,b and j = 1,2. In equilibrium, marginal revenues are necessarilyequal for every club, since we now have a single international price for talent.Equating the sum of marginal revenues for clubs in country a with that forclubs in country b, we then have
Da − 2kta + 2Fa = Db − 2ktb + 2Fb. (7)
4Note that, for this solution to make sense, we need k > |Da1 −Da2|.
5
Moreover, ta + tb = 2. Thus,
ti = 1+ (Di −D−i)+ 2 (Fi − F−i)4k
, (8)
where −i denotes the country different from i. It seems natural to assume thatthe country with the higher drawing power also has the higher prize money:sgn(Di −D−i) = sgn(Fi − F−i) . The analysis then implies that, if internationaltrade in players is allowed, talent will move from the weakest to the highestdrawing country.
To determine equilibrium wages, we first need the distribution of talentwithin a given country. From (6), equating ∂Ri1/∂ti1 with ∂Ri2/∂ti2 implies
Di1 − 2kti1 = Di2 − 2kti2.
Using (8) and ti1 + ti2 = 1, we have
tij = 12+ 3Dij −Di−j −D−i + 2 (Fi − F−i)
8k. (9)
With Di1 ≥ Di2, competitive balance in country i then equals
cbi = Di1 −Di22k
. (10)
Comparing this with (4), we see that competitive balance within a country doesnot change when international trade in players is allowed. That balance onlydepends on the relative drawing powers of domestic clubs, and is not affectedby the extent to which talent flows to or from a particular country.
With a competitive labor market, wages are
c = Da1 − 2kta1 + Fa= Da +Db + 2 (Fa + Fb)
4− k. (11)
From (5), this is equal to the average wage in the two countries before interna-tional trade was allowed. Allowing clubs to freely field foreigners will thereforenot affect total wages. Wages in the weak-drawing country will go up, whilewages in the strong-drawing league will go down, relative to a situation of au-tarky. Also, from the discussion of (8), teams in the strong-drawing countrywill now be stronger, and teams in the weak-drawing countries will be weaker.Thus, international quality differences increase. Yet, as said, competitive bal-ance within a national competition is not affected.
2.4 Introducing a Champions’ League
We now study the effects of the introduction in the benchmark model of aChampions’ League: an international competition that fields the best teams ofboth national competitions against each other. A full analysis would requirea two-period model: first, teams have some probability of reaching the Cham-pions’ League and, second, given that they do, they have some probability ofwinning it. We simplify by collapsing this into one stage by assuming that eachteam has some probability of winning the Champions’ League that directly de-pends on the amount of talent the particular team has. We choose a specifica-tion that has the same properties as (1). That is, we require that the probabilityof winning the Champions’ League increases in the amount of talent a teamhas; that the probabilities of winning are equal when clubs have equal talent;
6
and that a club that owns all talent wins with certainty. This implies that forteam j in country i, the probability of winning the Champions’ League is
pij = 14+ 38
(tij − t−ij
)(12)
where t−ij denotes the average amount of talent of the other three teams.We assume that winning the Champions’ League yields prize money FC.5
The extra matches played also yield extra gate receipts. We assume that theseequal
Gi = γ (Di − kti) ti,with γ ≥ 0. This is a flexible specification: if all the receipts of the Champions’League go to the organizing body, we have γ = 0. If the team can keep all thereceipts to itself, we probably have that gate receipts from Champions’ Leaguematches outweigh those of regular competition matches, implying γ > 1. Totalreceipts of, say, team 1 in country a are
Ra1 = (1+ γ) (Da1 − kta1) ta1 + 12(1+ ta1 − ta2) Fa
+18(2+ 3ta1 − ta2 − tb1 − tb2) FC. (13)
Without international trade, total talent in each country equals 1. Thus
Ra1 = (1+ γ) (Da1 − kta1) ta1 + ta1Fa + 12ta1FC.
Marginal revenues thus equal
∂Ra1∂ta1
= (1+ γ) (Da1 − 2kta1)+ Fa + 12FC,
with similar expressions for the other teams.Within each country, marginal revenues are equal. Hence,
Da1 − 2kta1 = Da2 − 2kta2,
and we are back to the same case as in (2). The equilibrium distribution oftalent is therefore given by (3). With a competitive labor market,
c = (1+ γ) (Da1 − 2kta1)+ Fa + 12FC
= 12(1+ γ) (Da − 2k)+ Fa + 1
2FC.
Comparing this to (5), it is obvious that wages have increased. Thus, the estab-lishment of an international competition in the absence of cross-border tradein talent will not affect competitive balance within a national competition. Obvi-ously, international quality differences are also unaffected, since talent cannotmove between countries.
2.5 Introducing a Champions’ League and International Trade
Now suppose there is a Champions’ League, and international trade in playersis allowed. Again, total revenues for club 1 in country a are given by (13). Yet,
5In practice, reaching the Champions’ League but failing to win it, still implies substantialrevenues. In our simplified model, we also abstract from that.
7

now the only restriction on the distribution of talent is that the total amount ofinternational talent equals the available stock of talent: ta1+ta2+tb1+tb2 = 2.Thus,
Ra1 = (1+ γ) (Da1 − kta1) ta1 + 12(2ta1 + tb − 1) Fa + 1
8(1+ 4ta1) FC.
Marginal revenues for this team now are
∂Ra1∂ta1
= (1+ γ) (Da1 − 2kta1)+ Fa + 12FC,
with similar expressions for the other teams. In equilibrium, marginal revenuesare necessarily equal for each club. Equating the sum of marginal revenues forclubs in country a with that for clubs in country b then implies
(1+ γ) (Da − 2kta)+ 2Fa + FC = (1+ γ) (Db − 2ktb)+ 2Fb + FC.
With ta + tb = 2, this yields
ti = 1+ Di −D−i4k
+ Fi − F−i2k (1+ γ). (14)
Note that, compared to (8), the Champions’ League reduces the amount of tal-ent that will end up in the strong-drawing country. The intuition behind this re-sult is the following. By reaching the Champions’ League, teams can earn moremoney, due to the fact that gate receipts will increase (as may prize money).Yet, these higher receipts are relatively more important for teams from weak-drawing countries, since their revenues from the national league are lower.As the incentives of teams have become more aligned, their quality differ-ences will decrease. This is a general mechanism, also noted by Szymanski(2001b: F71/F72), albeit in a different context. Therefore, with the introductionof a Champions’ League, the incentive of these teams to attract more talentincreases more.
To see what happens to national competitive balance, equating ∂Ri1/∂ti1with ∂Ri2/∂ti2 yields
Di1 − 2kti1 = Di2 − 2kti2.
Using (14), this implies
tij = 12+ 3Dij −Di,−j −D−i
8k+ (Fi − F−i)(1+ γ)4k.
Hence, retaining the assumption that Di1 ≥ Di2,
cbi = ti1 − ti2 = Di1 −Di22k
.
Again, competitive balance within a competition has not changed.
2.6 Empirical predictions
In Europe, we virtually had a situation with no Champions’ League and noBosman ruling. Then, the Champions’ League was established in 1990. Afterthat, in 1995, the Bosman ruling came into effect. In terms of our model we thusstarted with the situation described in subsection 2.2, and then moved to thesituation described in subsection 2.4. Now, we have the situation described insubsection 2.5. Comparing the expressions for international quality differences
8

Strong-drawing Weak-drawing Nationalcountries countries competition
Champions’ League No effect No effect No effect
Bosman-ruling Quality increases Quality decreases No effect
Table 1: Empirical predictions from the theoretical analysis
and domestic competitive balance, yields the testable implications listed inTable 1.
The theoretical model suggests five hypotheses which indicate that (1) theintroduction of the Champions’ League has no effect on international qualitydifferences (Hypothesis 1) and no effect on national competitive balances (Hy-pothesis 2) and (2) the free movement of soccer players increases the qualityof clubs from strong-drawing countries (Hypothesis 3), decreases the qualityof teams from weak-drawing countries (Hypothesis 4) and leaves the nationalcompetitive balances unaffected (Hypothesis 5).
The model is informative about two additional issues. First, the model pro-duces clear predictions about the impact of both types of measures uponplayer wages, too. However, regrettably, lack of data implies that we cannot testthis part of the model’s predictions. Second, a remark must be made about theorder of institutional events in European soccer of the 1990s. Our hypothesesin Table 1 focus on the main effect of either the establishment of the Champi-ons’ League or the introduction of the Bosman ruling. However, as the Champi-ons’ League was introduced in 1990 and as the Bosman ruling came into effectin 1995, our natural experiment cannot reveal the model condition where onlythe free transfer of talent applies. The model in subsection 2.5–with a freemovement of talent and the establishment of a Champions’ League–suggeststhat international quality differences may decrease as the marginal revenuefrom both institutional changes in interaction is larger for clubs from weak-drawing countries than for their counterparts from strong-drawing leagues.We return to this issue below when introducing our econometric model speci-fication.
3 Empirical Evidence
3.1 Data, Measures, and Methodologies
The empirical analysis of this paper is based on a dataset of soccer results inseven major competitions in Belgium, England, France, Germany (West-Germanybefore the unification), Italy, The Netherlands, and Spain, as summarized inTable 2. Professional soccer started at different dates in these countries. Forthe empirical analysis we only used data for seasons after 1945/46. Besidesdata on national competitions, we have also collected data on the results inall European tournaments (European Cup I, European Cup II, UEFA Cup, andChampions’ League) from 1980/81 to 1999/00. This dataset comprises 2847encounters. Most encounters consist of two games, one home game for eitherteam. During this time period, teams from 51 different countries participatedin these European tournaments.
National competitive balance is measured as the distribution of qualities ofsoccer teams in a competition. A competition is in perfect balance if the prob-ability that a team wins from an opponent is independent of that opponent
9
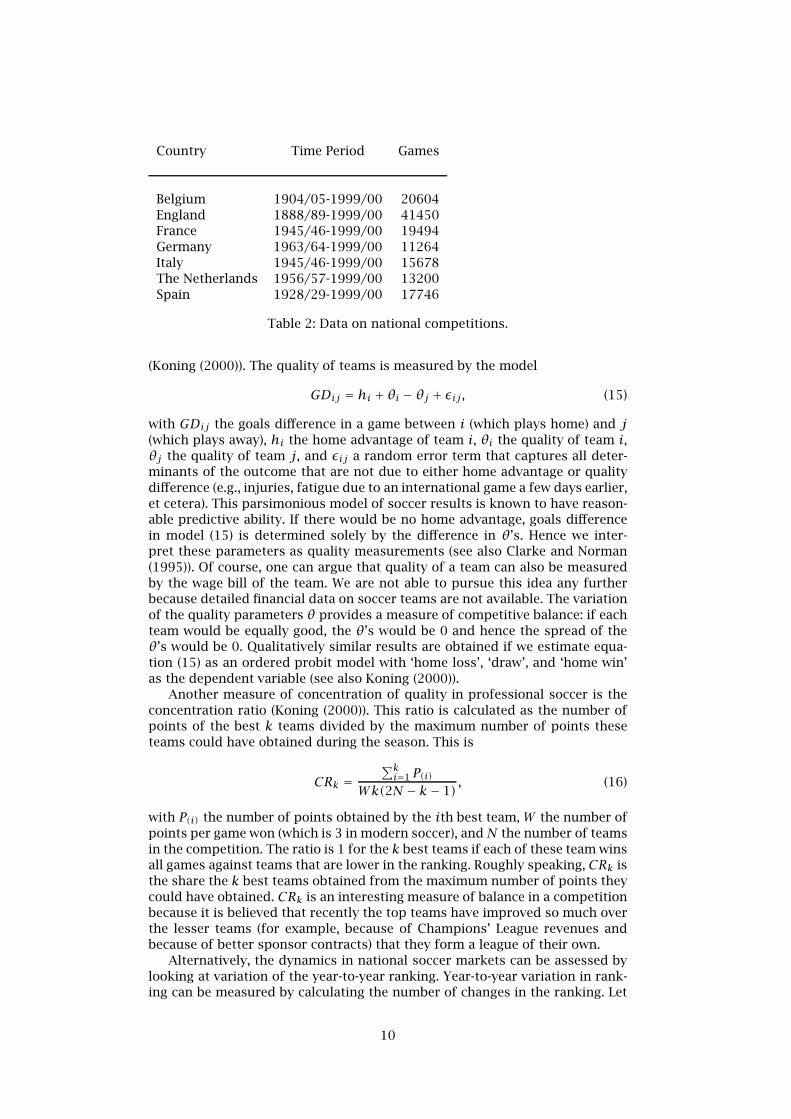
Country Time Period Games
Belgium 1904/05-1999/00 20604England 1888/89-1999/00 41450France 1945/46-1999/00 19494Germany 1963/64-1999/00 11264Italy 1945/46-1999/00 15678The Netherlands 1956/57-1999/00 13200Spain 1928/29-1999/00 17746
Table 2: Data on national competitions.
(Koning (2000)). The quality of teams is measured by the model
GDij = hi + θi − θj + εij, (15)
with GDij the goals difference in a game between i (which plays home) and j(which plays away), hi the home advantage of team i, θi the quality of team i,θj the quality of team j, and εij a random error term that captures all deter-minants of the outcome that are not due to either home advantage or qualitydifference (e.g., injuries, fatigue due to an international game a few days earlier,et cetera). This parsimonious model of soccer results is known to have reason-able predictive ability. If there would be no home advantage, goals differencein model (15) is determined solely by the difference in θ’s. Hence we inter-pret these parameters as quality measurements (see also Clarke and Norman(1995)). Of course, one can argue that quality of a team can also be measuredby the wage bill of the team. We are not able to pursue this idea any furtherbecause detailed financial data on soccer teams are not available. The variationof the quality parameters θ provides a measure of competitive balance: if eachteam would be equally good, the θ’s would be 0 and hence the spread of theθ’s would be 0. Qualitatively similar results are obtained if we estimate equa-tion (15) as an ordered probit model with ‘home loss’, ‘draw’, and ‘home win’as the dependent variable (see also Koning (2000)).
Another measure of concentration of quality in professional soccer is theconcentration ratio (Koning (2000)). This ratio is calculated as the number ofpoints of the best k teams divided by the maximum number of points theseteams could have obtained during the season. This is
CRk =∑ki=1 P(i)
Wk(2N − k− 1), (16)
with P(i) the number of points obtained by the ith best team, W the number ofpoints per game won (which is 3 in modern soccer), and N the number of teamsin the competition. The ratio is 1 for the k best teams if each of these team winsall games against teams that are lower in the ranking. Roughly speaking, CRk isthe share the k best teams obtained from the maximum number of points theycould have obtained. CRk is an interesting measure of balance in a competitionbecause it is believed that recently the top teams have improved so much overthe lesser teams (for example, because of Champions’ League revenues andbecause of better sponsor contracts) that they form a league of their own.
Alternatively, the dynamics in national soccer markets can be assessed bylooking at variation of the year-to-year ranking. Year-to-year variation in rank-ing can be measured by calculating the number of changes in the ranking. Let
10

rkt be the ranking of team k in year t, so that rkt = 1 for the team winning thecompetition, et cetera. A measure of change between two seasons is then
DNt =∑
k|rkt − rkt−1|. (17)
Note that this measure treats moves up and down identically. Of course, DNtdepends on the number of teams in a competition. If a league consists of twoteams, DNt is either 0 or 2, in a league of three teams DNt is either 0, 2, or4, et cetera. If a league has an even number of teams, the maximum of DNtis 1
2n2, with n the number of teams. A normalized measure of dynamics in a
league is now
DN∗t =2n2
∑
k|rkt − rkt−1|. (18)
It is more difficult to measure team quality and developments in team qual-ity in an international context (like European competitions) than in a nationalsetting. More than 600 teams have participated in the European tournamentsduring the last 20 seasons, which makes estimation of a model similar tomodel (15) infeasible. However, many soccer fans associate themselves withteams from their country, and hence the performance of individual teams inEuropean soccer tournaments is not the only interesting measure of interna-tional success. Because of these considerations, we measure performance ininternational tournaments countrywise. More specifically, we define a measureψc as the number of games played by all teams from country c divided bytwice the total number of games played in all European tournaments. Thismeasure can be interpreted as the share of the pie that consists of all teamslots in games in European competitions during a season occupied by teamsof country c. For example, during the 1999/2000 season, Dutch teams played38 games in European tournaments. Since in total 362 games were played thatseason, the international quality measure of Dutch soccer is 0.0525.
3.2 National Competitive Balance
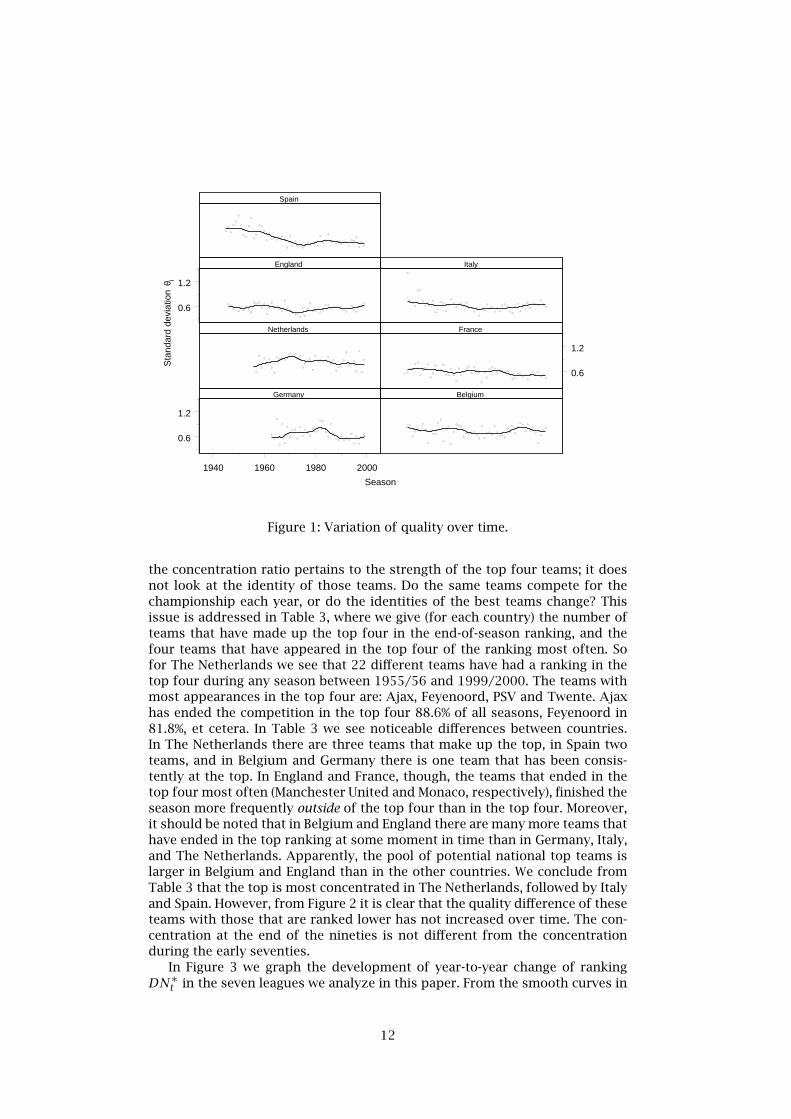
The development of the variance of the estimated θ’s over time for our sevendifferent countries is graphically depicted in Figure 1. If quality differencesbetween teams in a national competition would have increased over time, thelines in Figure 1 should be sloping upward. If anything, the long-term trends inFigure 1 are sloping downward, suggesting an increase of national competitivebalances over time. In Figure 1 and later figures we aid the interpretation bydrawing a line which is a non-parametric regression of the variable graphed ontime.
The development of the coefficient of determination of model (15) over timeis found in Figure 6 in the Appendix. From the standard F -test on significanceof a regression for each country, we find that R2 deviates significantly from0 for all countries for all seasons. Hence, the parameters θi and hi jointlydiffer significantly from 0. In Germany and Spain the competition has becomeless predictable over time as judged by the decrease of R2 over time in thesecountries. Still, typical values of R2 in recent seasons for these countries arein the 0.28− 0.32 range. The average value of R2 for The Netherlands is 0.40.So 40% of the variation in goal difference in the Dutch soccer league can beexplained by a model as simple as (15).
It appears from Figure 2 that the concentration ratio (16) has not changedmuch over time in the countries we examine. The variation of CR4 from yearto year is of much larger magnitude than any trend that can be discerned. But
11
1940 1960 1980 2000
Season
0.6
1.2
0.6
1.2
0.6
1.2
Sta
ndar
d de
viat
ion
θ i
Germany Belgium
Netherlands France
England Italy
Spain
Figure 1: Variation of quality over time.
the concentration ratio pertains to the strength of the top four teams; it doesnot look at the identity of those teams. Do the same teams compete for thechampionship each year, or do the identities of the best teams change? Thisissue is addressed in Table 3, where we give (for each country) the number ofteams that have made up the top four in the end-of-season ranking, and thefour teams that have appeared in the top four of the ranking most often. Sofor The Netherlands we see that 22 different teams have had a ranking in thetop four during any season between 1955/56 and 1999/2000. The teams withmost appearances in the top four are: Ajax, Feyenoord, PSV and Twente. Ajaxhas ended the competition in the top four 88.6% of all seasons, Feyenoord in81.8%, et cetera. In Table 3 we see noticeable differences between countries.In The Netherlands there are three teams that make up the top, in Spain twoteams, and in Belgium and Germany there is one team that has been consis-tently at the top. In England and France, though, the teams that ended in thetop four most often (Manchester United and Monaco, respectively), finished theseason more frequently outside of the top four than in the top four. Moreover,it should be noted that in Belgium and England there are many more teams thathave ended in the top ranking at some moment in time than in Germany, Italy,and The Netherlands. Apparently, the pool of potential national top teams islarger in Belgium and England than in the other countries. We conclude fromTable 3 that the top is most concentrated in The Netherlands, followed by Italyand Spain. However, from Figure 2 it is clear that the quality difference of theseteams with those that are ranked lower has not increased over time. The con-centration at the end of the nineties is not different from the concentrationduring the early seventies.
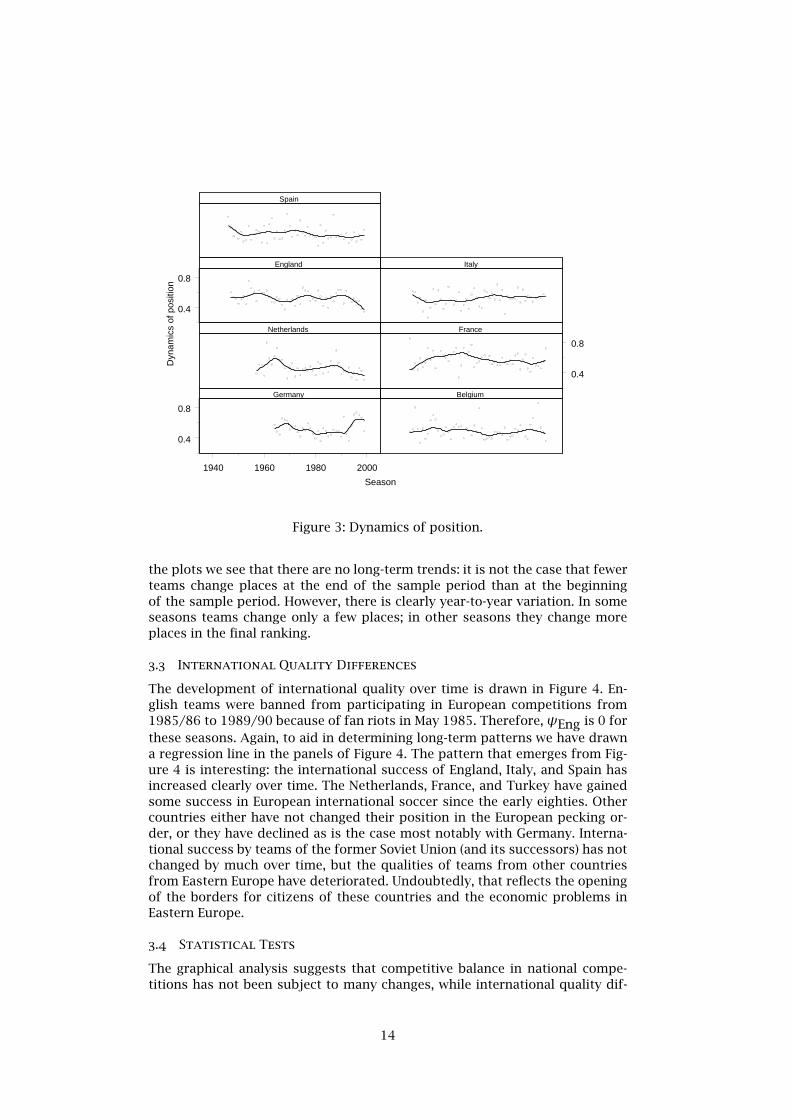
In Figure 3 we graph the development of year-to-year change of rankingDN∗t in the seven leagues we analyze in this paper. From the smooth curves in
12

1940 1960 1980 2000
Season
0.65
0.80
0.65
0.80
0.65
0.80
CR
4
Germany Belgium
Netherlands France
England Italy
Spain
Figure 2: Concentration ratio CR4 over time.
Country Number Best four teamsof teams
Belgium 34 Anderlecht (90.9%), Standard Luik (56.4%)Club Brugge (50.9%), FC Antwerp (25.5%)
England 34 Manchester United (45.5%), Liverpool (45.5%)Arsenal (30.3%), WolverhamptonWanderers (24.2%)
France 27 Monaco (41.8%), St. Etienne (38.2%)Bordeaux (38.2%), Olympique Marseille (36.4%)
Germany 21 Bayern Munchen (75.7%)Borussia Monchengladbach (37.8%)Werder Bremen (35.1%), Vfb Stuttgart (32.4%)
Italy 20 Juventus (78.2%), AC Milan (69.0%)Internazionale (67.3%), Fiorentina (34.5%)
Netherlands 22 Ajax (88.6%), Feyenoord (81.8%)PSV (77.3%), Twente (27.3%)
Spain 19 FC Barcelona (89.1%), Real Madrid (83.6%)Atletico Madrid (54.5%), Valencia (41.8%)
Table 3: Teams with most rankings in the top four (1945/46-1999/2000).
13
1940 1960 1980 2000
Season
0.4
0.8
0.4
0.8
0.4
0.8
Dyn
amic
s of
pos
ition
Germany Belgium
Netherlands France
England Italy
Spain
Figure 3: Dynamics of position.
the plots we see that there are no long-term trends: it is not the case that fewerteams change places at the end of the sample period than at the beginningof the sample period. However, there is clearly year-to-year variation. In someseasons teams change only a few places; in other seasons they change moreplaces in the final ranking.
3.3 International Quality Differences
The development of international quality over time is drawn in Figure 4. En-glish teams were banned from participating in European competitions from1985/86 to 1989/90 because of fan riots in May 1985. Therefore,ψEng is 0 forthese seasons. Again, to aid in determining long-term patterns we have drawna regression line in the panels of Figure 4. The pattern that emerges from Fig-ure 4 is interesting: the international success of England, Italy, and Spain hasincreased clearly over time. The Netherlands, France, and Turkey have gainedsome success in European international soccer since the early eighties. Othercountries either have not changed their position in the European pecking or-der, or they have declined as is the case most notably with Germany. Interna-tional success by teams of the former Soviet Union (and its successors) has notchanged by much over time, but the qualities of teams from other countriesfrom Eastern Europe have deteriorated. Undoubtedly, that reflects the openingof the borders for citizens of these countries and the economic problems inEastern Europe.
3.4 Statistical Tests
The graphical analysis suggests that competitive balance in national compe-titions has not been subject to many changes, while international quality dif-
14

1981 1987 1993 1999
1981 1987 1993 1999
Season
0.01
0.12
0.01
0.12
0.01
0.12
0.01
0.12
Inte
rnat
iona
l qua
lity
Austria Belgium
Eastern Europe England
France Germany
Greece Italy
Figure 4: International quality over time (continued).
1981 1987 1993 1999
Season
0.01
0.12
0.01
0.12
0.01
0.12
Inte
rnat
iona
l qua
lity
Netherlands Norway
Portugal Spain
Sweden Turkey
USSR
Figure 4: International quality over time.
15

ferences may have changed over time. In this subsection we will test thesehypotheses formally, with reference to the introduction of the Champions’League and the Bosman ruling (cf. Table 1), so that we distinguish betweendifferences in means of our variables of interest and sample variation.
First, we consider the effect of the introduction of the Champions’ Leagueand the Bosman-ruling on national competitive balance. We let yit be the de-pendent variable in country i in year t. According to our theoretical discussion,we need to distinguish between weak-drawing and strong-drawing countries.Therefore, let Di be an indicator of drawing power (1 for strong-drawing coun-tries and 0 for weak-drawing countries). The time dummies CLt and Bt indicatewhether or not an observation is from after the introduction of the Champions’League or the Bosman-ruling, respectively. The model we estimate is
yit = αi + β1DiCLt + β2(1−Di)CLt + γ1DiBt + γ2(1−Di)Bt + εit. (19)
This model assigns a different mean level of national competitive balance toeach country, and that mean level may have changed after the introductionof the Champions’ League or the Bosman-ruling. The fixed effects αi mea-sure the structure of the soccer market in each country, its competitiveness,the size of the market in a country, and all other factors that vary betweencountries and determine national competitive balance. The effect of the intro-duction of the Champions’ League (CL-effect) on competitive balance is β1 forstrong-drawing countries and β2 for weak-drawing countries. The effect of theBosman-ruling for strong-drawing countries is γ1, and the effect on nationalcompetitive balance in weak-drawing countries is γ2. Note that our model spec-ification model (19), together with the order of intervention events, is associ-ated with an identification problem. That is, the main effect of the introductionof the Bosman ruling (introduced in 1995, as reflected in γ1 an γ2) cannot beestimated without the interaction with the co-existing Champions’ League (es-tablished in 1990, its main effect being associated with β1 and β2). Adding aCLt · Bt interaction term would not help at all, as then the main effect can-not be distinguished properly from the interaction one. Given this unsolvableidentification problem, we decided to concentrate on the main effects only.
We estimate model (19) for each of the seven countries, for the period1980/81 to 1999/2000. England, France, Germany, Italy, and Spain are consid-ered to be strong-drawing countries because of the size of the market in thesecountries, whereas Belgium and The Netherlands are coded as weak-drawingcountries.6 This division corresponds to the size of the population in thesecountries. According to the theoretical model discussed earlier (cf. Table 1),national competitive balance is expected to be unaffected by the introductionof the Champions’ League and the Bosman-ruling, so we do not expect that thecoefficients β1, β2, γ1, and γ2 differ significantly from 0.
In Table 4 we see that the effects of the introduction of the Champions’League and the Bosman ruling on the static measure of national competitivebalance (σθ) is marginally significant. The hypothesis of no effect is rejectedat a level of significance of 5%, but not at a level of significance of 1%. Thedynamic measure of national competitive balance (DN) has not been affectedby the introduction of the Champions’ League. Similar results are found if theconcentration ratio is used as the dependend variable in regression (19).
According to our theoretical model, we expect that international quality dif-ferences (ψ) do not depend on the introduction of the Champions’ League butare affected by the Bosman-ruling. This is confirmed in Table 4: the Bosman
6Similar results are found when France and/or Germany are considered to be weak-drawingcountries, so the results presented in Table 4 are robust to the implied alternative groupings.
16
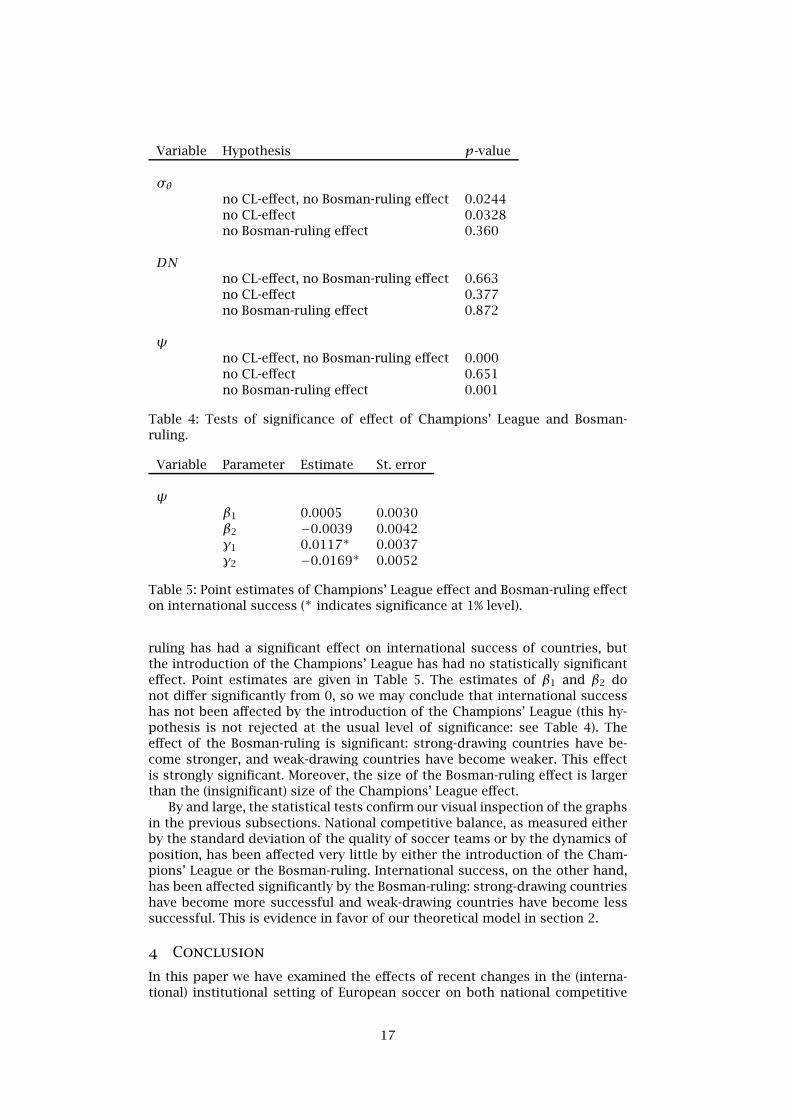
Variable Hypothesis p-value
σθno CL-effect, no Bosman-ruling effect 0.0244no CL-effect 0.0328no Bosman-ruling effect 0.360
DNno CL-effect, no Bosman-ruling effect 0.663no CL-effect 0.377no Bosman-ruling effect 0.872
ψno CL-effect, no Bosman-ruling effect 0.000no CL-effect 0.651no Bosman-ruling effect 0.001
Table 4: Tests of significance of effect of Champions’ League and Bosman-ruling.
Variable Parameter Estimate St. error
ψβ1 0.0005 0.0030β2 −0.0039 0.0042γ1 0.0117∗ 0.0037γ2 −0.0169∗ 0.0052
Table 5: Point estimates of Champions’ League effect and Bosman-ruling effecton international success (∗ indicates significance at 1% level).
ruling has had a significant effect on international success of countries, butthe introduction of the Champions’ League has had no statistically significanteffect. Point estimates are given in Table 5. The estimates of β1 and β2 donot differ significantly from 0, so we may conclude that international successhas not been affected by the introduction of the Champions’ League (this hy-pothesis is not rejected at the usual level of significance: see Table 4). Theeffect of the Bosman-ruling is significant: strong-drawing countries have be-come stronger, and weak-drawing countries have become weaker. This effectis strongly significant. Moreover, the size of the Bosman-ruling effect is largerthan the (insignificant) size of the Champions’ League effect.
By and large, the statistical tests confirm our visual inspection of the graphsin the previous subsections. National competitive balance, as measured eitherby the standard deviation of the quality of soccer teams or by the dynamics ofposition, has been affected very little by either the introduction of the Cham-pions’ League or the Bosman-ruling. International success, on the other hand,has been affected significantly by the Bosman-ruling: strong-drawing countrieshave become more successful and weak-drawing countries have become lesssuccessful. This is evidence in favor of our theoretical model in section 2.
4 Conclusion
In this paper we have examined the effects of recent changes in the (interna-tional) institutional setting of European soccer on both national competitive
17

balances and international quality differences. Our main conclusions are thatnational competitive balances have not changed over time, despite the intro-duction of the Champions’ League and the Bosman-ruling, whereas interna-tional quality differences have increased, particularly as a result of the Bosmanruling. These results have been derived in a theoretical model and have, by andlarge, been confirmed by the empirical evidence. From this overall pattern ofresults, by way of appraisal, we may speculate about the likely consequencesof future changes in European soccer’s institutional setting, which helps toidentify a number of interesting avenues for future research.
First, in the autum of 2001, after long negotiations, the European Union hasannounced to agree with UEFA plans to reform the player transfer system suchthat fees for young players are permitted. The argument is that this is a fairway to compensate for the clubs’ investment in the education and training ofyouth players. Clearly, the proposed transfer system reform implies a partialde-liberalization of the labor market for soccer talent. From the perspective ofthis paper’s model and evidence, after reversing the argument, we can predictthat this is likely to decrease international quality differences (reversed Hy-potheses 3 and 4), to the benefit of weak-drawing countries, without affectingnational competitive balance (Hypothesis 5). Empirically, we may estimate theconsequences of the transfer system reform later in this decade. Theoretically,future research may be directed at finetuning our model of international soc-cer competition by introducing a dual labor market, distinguishing segmentsfor young versus not-so-young players.
Second, there are talks about the establishment of a new international league—the Euro League—among top clubs from weak-drawing countries such as Aus-tria, Belgium, Greece, The Netherlands, Norway, Portugal, and Sweden as aresponse to the claimed increase in international quality differences in thenineties. As yet, the response from the UEFA to this idea has not been fa-vorable. However, this paper’s model and evidence (i.e., Hypotheses 1 and 2)suggest that the introduction of such an Euro League per se is unlikely to affectthe participating clubs’ average international quality. In interaction with theBosman ruling, though, the establishment of such an Euro League may well re-duce international quality differences (cf. the model in subsection 2.5), so clos-ing (part of) the gap with the current strong-drawing countries, without havingany effect on national competitive balance (Hypothesis 5). The reason for thisis that by joining forces the top-performing clubs from the weak-drawing coun-tries may prove to be able to create a strong-drawing league of their own. This,in turn, improves their position on the market for soccer talent. This is clearlyin the interest of the UEFA. After all, international soccer leagues will loosemuch of their appeal as a result of the erosion of the competitive excitementthat comes with increasing international quality differences. Future researchmay focus on answering the question as to what happens if, in line with theircurrent intentions, the top clubs do leave their national leagues by developinga model that includes entry into and exit from competing leagues.
The results in our paper can be extended to other European sports markets,like the ones for basketball, rugby, and volleyball. The defining characteristicof a sports market is that it ‘sells’ competition. Fans identify themselves witha team, which is less so in other markets with rare talents (like art or mu-sic). Moreover, in European soccer, teams compete in two markets: a nationalmarket and an international market. Hence, the consequences of any measureto enhance competition need to be assessed in both markets. Our theoreticaland empirical analyses indicate that national competitive balances have beenremarkably robust over time, despite the institutional changes. On the otherhand, we found that international balance has changed over time: the stronger
18
countries have become more successful in European tournaments at the ex-pense of weaker countries. Two recent initiatives—the proposed transfer sys-tem reform and the Euro League establishment—may help to counteract thehistorical trend toward divergence in the European soccer arena.
References
Antonioni, P. and J. Cubbin (2000). The Bosman ruling and the emergenceof a single market in soccer talent. European Journal of Law and Eco-nomics 9(2), 157–173.
Bloom, M. (1999). The performance effects of pay dispersion on individualsand organizations. Academy of Management Journal 42(1), 25–40.
Clarke, S.R. and J.M. Norman (1995). Home ground advantage of individualclubs in English soccer. The Statistician 44(4), 509–521.
Dobson, S. and J. Goddard (2001). The Economics of Football. Cambridge:Cambridge University Press.
Fort, R.D. and J. Quirk (1995). Cross-subsidization, incentives, and outcomesin professional team sports leagues. Journal of Economic Literature 33(3),1265–1299.
Hoehn, T. and S. Szymanski (1999). The americanization of European foot-ball. Economic Policy 14(28), 205–240.
Koning, R.H. (2000). Balance in competition in Dutch soccer. The Statisti-cian 49(3), 419–431.
Straw, B.M. and H. Hoang (1995). Sunk costs in the NBA: Why draft order af-fects playing time and survival in professional basketball. AdministrativeScience Quarterly 40(3), 474–495.
Szymanski, S. (2001a). Economics of sport: Introduction. Economic Jour-nal 111(469), 1–3.
Szymanski, S. (2001b). Income inequality, competitive balance and the attrac-tiveness of team sports: Some evidence and a natural experiment fromEnglish soccer. Economic Journal 111(469), 69–84.
Szymanski, S. and T. Kuypers (1999). Winners & Losers, The Business Strategyof Football. London: Viking.
Appendix
In this appendix we provide additional figures on the estimation results ofmodel (15). In Figure 5 we graph the variance of home advantage for differentcountries, and in Figure 6 we show the how the coefficient of determinationvaries over time.
19

1940 1960 1980 2000
Season
0.5
1.0
0.5
1.0
0.5
1.0
Sta
ndar
d de
viat
ion
hi
Germany Belgium
Netherlands France
England Italy
Spain
Figure 5: Variation of home advantage over time.
1940 1960 1980 2000
Season
0.2
0.4
0.2
0.4
0.2
0.4
R2
Germany Belgium
Netherlands France
England Italy
Spain
Figure 6: R2 of model (15) over time.
20
Related Documents