Market Factors and Trends: “Why do markets move?” Or, “How do I get filthy rich in stocks?” John Copeland Managing Director Lehman Brothers smartwomansecuritie s © 2006 Smart Woman Securities. All materials are for SWS members’ use only November 15, 2006

Welcome message from author
This document is posted to help you gain knowledge. Please leave a comment to let me know what you think about it! Share it to your friends and learn new things together.
Transcript

Market Factors and Trends: “Why do markets move?” Or,
“How do I get filthy rich in stocks?”
John CopelandManaging DirectorLehman Brothers
smartwomansecurities
© 2006 Smart Woman Securities. All materials are for SWS
members’ use only
November 15, 2006
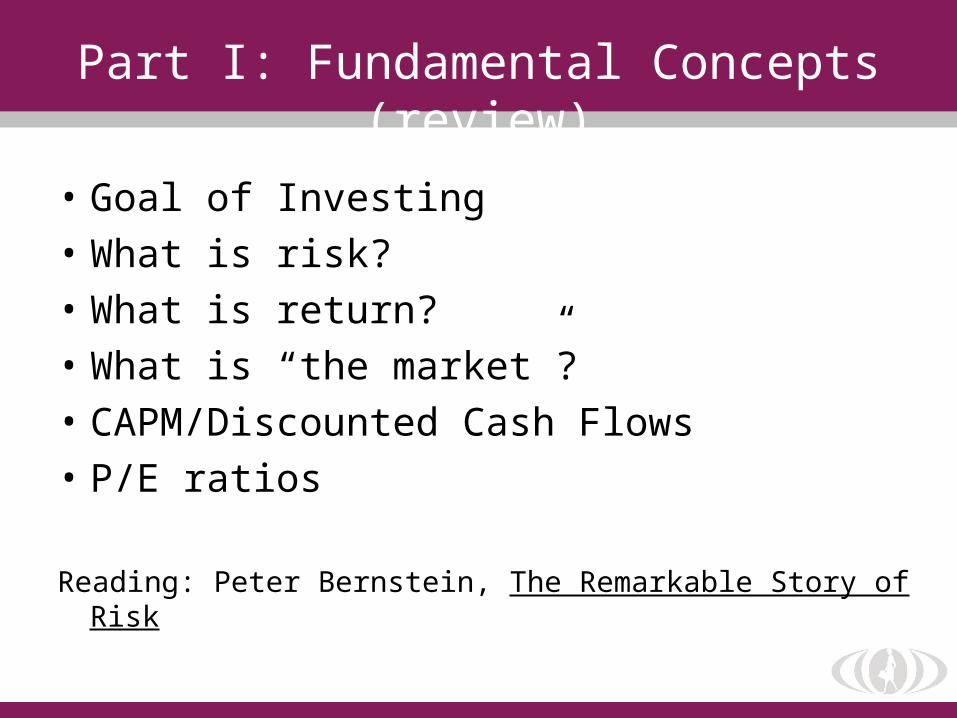
Part I: Fundamental Concepts (review)
• Goal of Investing• What is risk?• What is return?• What is “the market”?• CAPM/Discounted Cash Flows• P/E ratios
Reading: Peter Bernstein, The Remarkable Story of Risk
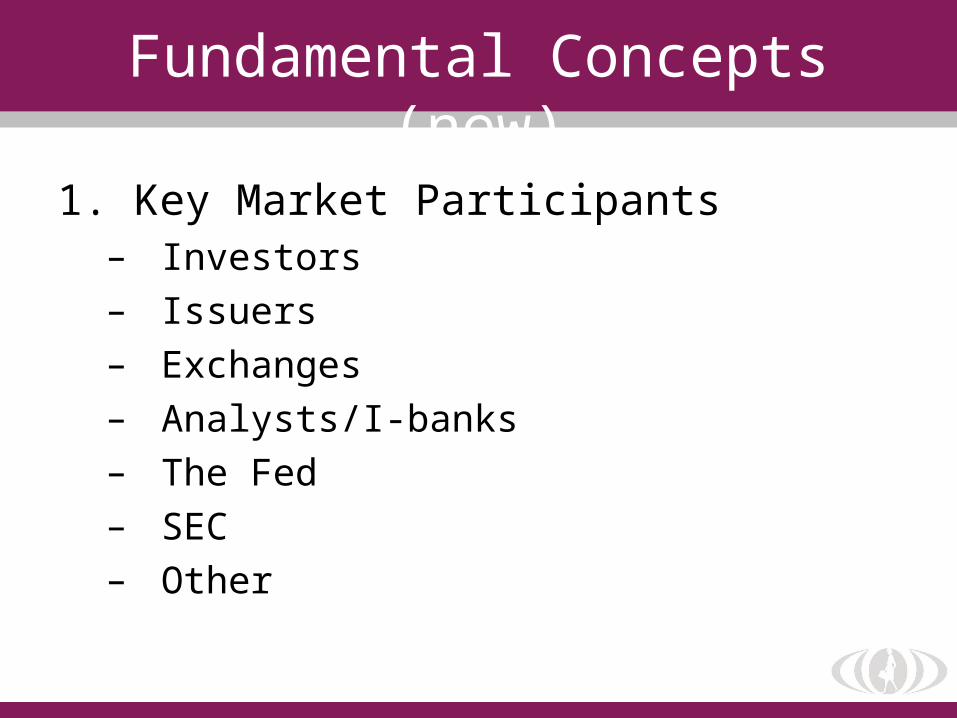
Fundamental Concepts (new)
1. Key Market Participants– Investors– Issuers– Exchanges– Analysts/I-banks– The Fed– SEC– Other

Fundamental Concepts (new)
2. What is a bull market?(And by the way, what is a bear
market?)

Fundamental Concepts (new)
3. Leading vs. Lagging indicators– Employment Situation– Consumer Confidence– Inflation (CPI/PPI)– Home Sales– Trade deficit– Other

Fundamental Concepts (new)
4. The role of the Federal Reserve and interest rates
“the fed writes the market letter”
5. The role of foreign exchange and the dollar
6. Other market factors

Part II: Can you beat the market?
It’s all about market efficiency

Theories of market efficiency
• EMH: weak, semi-strong, strong• Random walk• Analysis of market efficiencies• SEC: focus on
disclosure/transparency-“sunlight is the best
disinfectant”

Can you beat the market?
Answer: NoResponse: Index investingThoughts: •What does “no” mean?
•Asset class is important, risk is important, security selection is not
•Implications for investment strategy

Asset class performance may vary widely from year to year. An optimal asset allocation can help reduce your portfolio risk and help increase your potential returns
Unpredictable Asset Class Pattern
__________________________________Source: Lehman Brothers and Bloomberg
YTD1987 1988 1989 1990 1991 1992 1993 1994 1995 1996 1997 1998 1999 2000 2001 2002 2003 2004 2005 2006
MSCI MSCI MSCI Lehm. MSCI Russell MSCI MSCI Russell NAREIT Russell Russell MSCI NAREIT NAREIT Lehm. MSCI NAREIT MSCI NAREIT
EAFE EMF EMF Bros. EMF 2000 EMF EAFE 1000 1000 1000 EMF Bros. EMF EMF
Agg. Value Value Value Growth Agg.
24.9% 40.4% 65.0% 9.0% 59.9% 29.1% 78.8% 8.1% 38.4% 35.8% 35.2% 38.7% 66.4% 25.9% 15.5% 10.3% 56.3% 30.4% 29.0% 23.4%Russell Russell Russell Russell Russell Russell MSCI NAREIT Russell Russell Russell Russell Russell Russell Russell NAREIT Russell MSCI MSCI
1000 2000 1000 1000 2000 Midcap EAFE 1000 1000 Midcap 1000 Midcap 2000 2000 2000 MSCI EAFE EAFE
Growth Value Growth Growth Growth Value Growth Value Growth Value Value Growth EMF
5.3% 29.5% 35.9% -0.3% 51.2% 21.7% 33.0% 3.2% 37.8% 23.1% 34.4% 27.0% 51.3% 22.8% 14.0% 5.2% 48.5% 26.0% 14.0% 14.9%LEH MSCI Russell Russell Russell LEH Russell Russell Russell Russell Russell MSCI Russell Russell Lehm. LEH Russell Russell Russell Russell
HY EAFE Midcap 1000 Midcap HY 2000 1000 1000 1000 1000 EAFE 2000 Midcap Bros. HY 2000 Midcap Midcap 2000
Growth Growth Value Growth Growth Growth Value Agg. Value Value Value Value
5.0% 28.6% 31.5% -4.2% 47.0% 15.7% 23.8% 2.7% 37.2% 22.4% 32.9% 20.3% 43.1% 19.2% 8.4% -1.4% 46.0% 23.7% 12.7% 13.3%Russell Russell Russell Russell LEH NAREIT NAREIT Russell Russell Russell Russell Russell Russell Lehm. LEH MSCI Russell Russell Russell Russell
1000 Midcap 1000 Midcap HY 1000 Midcap 1000 2000 Midcap 1000 Bros. HY EMF Midcap 2000 Midcap 1000
Value Growth Value Value Value Growth Growth Agg. Growth Value Growth Value
2.9% 24.6% 30.4% -5.1% 46.2% 14.6% 20.1% 0.4% 34.9% 21.6% 31.8% 17.9% 33.2% 11.6% 5.3% -6.0% 42.7% 22.3% 12.1% 13.2%Russell Russell Russell Russell Russell Russell Russell LEH Russell Russell Russell Russell MSCI Russell Russell Russell MSCI MSCI NAREIT Russell
Midcap 1000 1000 1000 2000 1000 1000 HY Midcap 2000 1000 1000 EAFE 1000 Midcap Midcap EAFE EAFE Midcap
Growth Value Value Value Value Value Value Growth Value Growth Value Value Value Value Value
2.8% 23.2% 25.2% -8.1% 41.7% 13.8% 18.1% -1.0% 34.0% 21.4% 30.5% 15.6% 27.3% 7.0% 2.3% -9.6% 39.2% 20.7% 8.3% 10.8%Lehm. Russell Russell LEH Russell MSCI LEH Russell Russell Russell Russell Lehm. Russell LEH MSCI Russell Russell Russell Russell MSCI
Bros. 2000 Midcap HY 1000 EMF HY 2000 2000 Midcap Midcap Bros. 1000 HY EMF 2000 Midcap 1000 1000 EMF
Agg. Growth Value Growth Value Growth Value Growth Agg. Value Value Value Value
2.8% 20.4% 22.7% -9.6% 41.2% 11.4% 17.1% -1.6% 31.0% 20.3% 22.5% 8.7% 20.9% -5.9% -2.4% -11.4% 38.1% 16.5% 7.1% 10.1%Russell Russell Russell MSCI Russell Russell Russell Russell Russell Russell NAREIT Russell Russell Russell Russell Russell NAREIT Russell Russell Russell
1000 1000 2000 EMF Midcap 1000 Midcap 1000 2000 Midcap Midcap 1000 1000 1000 1000 Midcap 1000 1000
Value Growth Value Value Value Value Growth Value Value Value Value Growth
0.5% 17.3% 20.2% -10.6% 37.9% 8.9% 15.6% -2.0% 25.8% 17.5% 18.9% 5.1% 7.4% -7.8% -5.6% -15.5% 38.5% 15.5% 6.3% 8.0%Russell NAREIT Lehm. NAREIT NAREIT Russell Russell Russell LEH LEH Russell LEH LEH Russell Russell MSCI Russell Russell Russell LEH
Midcap Bros. Midcap 2000 Midcap HY HY 2000 HY HY Midcap 2000 EAFE 1000 2000 1000 HY
Value Agg. Growth Growth Value Growth Growth Growth Value Growth Growth
-2.2% 13.5% 14.6% -15.4% 35.7% 8.7% 13.4% -2.1% 19.2% 11.4% 13.0% 1.9% 2.4% -11.7% -9.2% -15.7% 30.0% 14.3% 5.3% 7.4%NAREIT Russell Russell Russell Russell Russell Russell Russell Lehm. Russell LEH Russell Russell MSCI Russell Russell Russell Russell Russell Russell
Midcap 2000 Midcap 1000 2000 Midcap Midcap Bros. 2000 HY 2000 Midcap EAFE 1000 1000 1000 1000 2000 2000
Growth Value Value Growth Growth Growth Agg. Growth Growth Value Value Growth
-3.6% 12.9% 12.4% -16.1% 33.0% 7.8% 11.2% -2.2% 18.5% 11.3% 12.8% 1.2% -0.1% -14.0% -12.4% -21.7% 29.9% 11.4% 4.7% 4.2%Russell LEH MSCI Russell Russell Lehm. Russell Russell NAREIT MSCI Lehm. Russell Lehm. Russell Russell Russell Russell LEH Russell Russell
2000 HY EAFE 2000 1000 Bros. 1000 2000 EAFE Bros. 2000 Bros. 1000 Midcap Midcap 1000 HY 2000 Midcap
Value Growth Value Agg. Growth Agg. Value Agg. Growth Growth Growth Growth Growth Growth
-7.1% 12.5% 10.8% -17.4% 24.6% 7.4% 10.2% -2.4% 18.3% 6.4% 9.7% -6.5% -0.8% -22.4% -20.2% -27.4% 29.7% 11.1% 4.2% 3.5%
Russell Russell NAREIT Russell Lehm. Russell Lehm. Lehm. MSCI MSCI MSCI NAREIT Russell Russell Russell Russell LEH Russell LEH Lehm.
2000 1000 2000 Bros. 1000 Bros. Bros. EAFE EMF EAFE 2000 2000 1000 1000 HY 1000 HY Bros.
Growth Growth Value Agg. Growth Agg. Agg. Value Growth Growth Growth Growth Agg.
-10.5% 11.3% 8.8% -21.8% 16.0% 5.0% 9.8% -2.9% 11.6% 6.0% 2.1% -18.8% -1.5% -22.4% -20.4% -27.9% 29.0% 6.3% 2.7% 3.1%Lehm. LEH MSCI MSCI MSCI Russell MSCI MSCI Lehm. MSCI MSCI NAREIT MSCI MSCI Russell Lehm. Lehm. Lehm. Russell
Bros. HY EAFE EAFE EAFE 1000 EMF EMF Bros. EMF EMF EMF EAFE 2000 Bros. Bros. Bros. 1000
Agg. Growth Agg. Growth Agg. Agg. Agg. Growth
7.9% 0.8% -23.2% 12.5% -11.9% 2.9% -7.3% -5.2% 3.6% -11.6% -25.3% -6.5% -30.6% -21.2% -30.3% 4.1% 4.3% 2.4% 3.0%
Unpredictable Asset Class Pattern
Asset class performance may vary widely from year to year. An optimal asset allocation can help reduce your portfolio risk and help increase your potential returns

Can you beat the market?
Answer: YesResponse:
Thoughts:
Do your homework• Technical analysis• Fundamental analysis• Other
• What does “yes” mean?• There are market inefficiencies• Implications for investment
strategy

Basic tenets of technical analysis
• Historical charts/data• Quantitative analysis• Hybrid
Reading: Frank McGee, Technical Analysis

Basic tenets of fundamental analysis
• Micro• Macro
Reading: Graham & Dodd, Intelligent Investor

Types of Investing
• Growth/value/GARP/other• Market cap segmentation• US vs. US/international/global• Volatility/risk• Tax efficient• Other

For informational purposes only, performance reflected gross of fees. Past performance is not indicative of future results.
GROWTH OF AN INVESTMENT
SEPTEMBER 30, 2001 TO SEPTEMBER 30, 2006
9/2001 9/2002 9/2003 9/2004 9/2005 9/20069,000
10,000
11,000
12,000
13,000
14,000
15,000
16,000
17,000
18,000
DO
LLA
RS
($)
Elliot_Proposed
2%TBill/38%Agg/60%SP
6/2006-9/2006 9/2005-9/2006 9/2004-9/2006 9/2003-9/2006 9/2001-9/2006
2.18 8.72 13.10 14.65 11.98
4.87 7.93 8.19 8.68 6.26
Manager Performance and Risk Analytics

Manager Performance and Risk Analytics
For informational purposes only, performance reflected gross of fees. Past performance is not indicative of future results.
TOTAL RISK REWARD
SEPTEMBER 30, 2001 TO SEPTEMBER 30, 2006
-4 1 6 11 16STANDARD DEVIATION
6
11
RA
TE
OF
RE
TU
RN
S&P 500
More ReturnLess Risk
Less ReturnLess Risk
More ReturnMore Risk
Less ReturnMore Risk
Elliot_Proposed
2%TBill/38%Agg/60%SP
ROR STD DEV ALPHA BETA R-SQUARED BEST 4 QTRS WORST 4 QTRS
11.98 8.63 6.53 0.53 0.87 32.48 -7.39
6.26 8.73 0.98 0.57 0.98 22.60 -11.49

MULTIPLE STATISTIC BARSEPTEMBER 30, 2001 TO SEPTEMBER 30, 2006
ROR
0
2
4
6
8
10
12
STD DEV
0.00
1.80
3.60
5.40
7.20
9.00
CORR COEF
0.00
0.15
0.30
0.45
0.60
0.75
0.90
1.05
BAT AVG
0.00
0.15
0.30
0.45
0.60
ALPHA
0
2
4
6
8
INFO RATIO
-0.30
-0.15
0.00
0.15
0.30
0.45
0.60
Elliot_Proposed2%TBill/38%Agg/60%SP
ROR STD DEV CORR COEF BAT AVG ALPHA INFO RATIO11.98 8.63 0.93 0.60 6.53 0.466.26 8.73 0.99 0.40 0.98 -0.25
For informational purposes only, performance reflected gross of fees. Past performance is not indicative of future results.
Manager Performance and Risk Analytics

MARKET CAPTURE
SEPTEMBER 30, 2001 TO SEPTEMBER 30, 2006
-25 0 25 50 75 100 125DOWNSIDE CAPTURE RATIO
-25
0
25
50
75
100
125
UP
SID
E C
AP
TU
RE
RA
TIO
S&P 500
Outperforms inPos. & Neg. Qtrs.
Underperforms in Pos. Qtrs.Outperforms in Neg. Qtrs.
Underperforms in Neg. Qtrs.Outperforms in Pos. Qtrs.
Underperforms inPos. & Neg. Qtrs.
Elliot_Proposed
2%TBill/38%Agg/60%SP
UPSIDE CAP ROR UPSIDE CAP RATIO DWN CAP ROR DWN CAP RATIO R-SQUARED
20.36 84.26 -5.39 22.02 0.87
15.41 63.75 -12.37 50.58 0.98
Manager Performance and Risk Analytics
For informational purposes only. Past performance is not indicative of future results.

Part III: What drives markets up and down?
Question: Why is the market up today?
Answer: “More buyers than sellers”

Basic rules of all markets, anywhere/anytime:
• Supply/Demand• Investor anticipation: prisoner’s
dilemma• Liquidity• Reality

Earlier topics revisited
• Bull and Bear markets• Economic indicators revisited• The Fed revisited• Consumer sentiment revisited

The Most Influential U.S. Economic Indicators
Indicator Why it’s important Market Sensitivity
Frequency
Employment Situation
The most eagerly awaited news on the economy. Are jobs being created ? Forecasts the well-being of American workers and can help forecast future economic activity
High Monthly
Retail Sales First report of the month on consumer spending. Consumer spending makes up 70% of all economic activity and retail sales account for about 1/3 of this. Provides insight into mood and behavior of shoppers
High Monthly
Consumer Confidence Index
Examines how consumers feel about jobs, the economy, and spending. Consumer expenditures account for well over half of the economy's total demand.
Medium (high at turning points in economy)
Monthly
Gross Domestic Product
The foremost report on the health of the economy, GDP measures how fast or slow the economy is growing. Most important statistic to come out in any given quarter.
Medium to High
Quarterly

Market and stock specific examples

S&P 500 – 10 Year Performance

S&P 500 – Price vs. EPS

S&P 500 – Price vs. P/E

Merck – 3 Year Performance

Starbucks – 1 Year Performance

Four Seasons – 3 Month Performance

UPS – 1 Year Performance

Final Thoughts
The four C’s – most powerful concepts in investing
1. Compounding2. Concentration3. Counterintuitive4. ___________
Other books: • Burrough & Helyer, Barbarians at the Gate• Michael Lewis, Liar’s Poker• James Stewart, Den of Thieves

The Rule of 72: The Power of Compounding
0.75% 96 years2.00% 36 years4.00% 18 years6.00% 12 years8.00% 9 years
10.00% 7 years12.00% 6 years
Investment Doubles Every…
Rate of Return
___________________________Source: Zweig Consulting LLC

Q&A
Related Documents