Market Cycles Presented by: Mike Trager

Welcome message from author
This document is posted to help you gain knowledge. Please leave a comment to let me know what you think about it! Share it to your friends and learn new things together.
Transcript

Market CyclesPresented by: Mike Trager
Disclaimer
U.S. Government Required Disclaimer – Commodity Futures Trading Commission Futuresand Options trading has large potential rewards, but also large potential risk. You must be aware of the risks and be willing to accept them in order to invest in the futures and options markets. Don’t trade with money you can’t afford to lose. This is neither a solicitation nor an offer to Buy/Sell futures or options. No representation is being made that any account will or is likely to achieve profits or losses similar to those discussed in this training. The past performance of any trading system or methodology is not necessarily indicative of future results.
CFTC RULE 4.41 – HYPOTHETICAL OR SIMULATED PERFORMANCE RESULTS HAVE CERTAINLIMITATIONS. UNLIKE AN ACTUAL PERFORMANCE RECORD, SIMULATED RESULTS DO NOTREPRESENT ACTUAL TRADING. ALSO, SINCE THE TRADES HAVE NOT BEEN EXECUTED, THERESULTS MAY HAVE UNDER-OR-OVER COMPENSATED FOR THE IMPACT, IF ANY, OF CERTAINMARKET FACTORS, SUCH AS LACK OF LIQUIDITY. SIMULATED TRADING PROGRAMS INGENERAL ARE ALSO SUBJECT TO THE FACT THAT THEY ARE DESIGNED WITH THE BENEFIT OF HINDSIGHT. NO REPRESENTATION IS BEING MADE THAT ANY ACCOUNT WILL OR IS LIKELY TO ACHIEVE PROFIT OR LOSSES SIMILAR TO THOSE SHOWN.
All Materials presented are for training purposes only. Traders should paper trade any new method prior to risk of personal capital.
Why Study Market Cycles? They Repeat!
Why study stock market history and cycles?
1. Because the market often repeats itself, or at least rhymes with itself, and those who are unaware of history are often doomed to be affected by its' repetition
2. Knowing when to look for something to happen can make it easier to see what it is you're looking for
3. Having a macro perspective of the market's environment can provide an edge in terms of trading and investing in harmony with that environment.
3
Why Study Market Cycles? They Repeat!
• Why study stock market history and cycles?
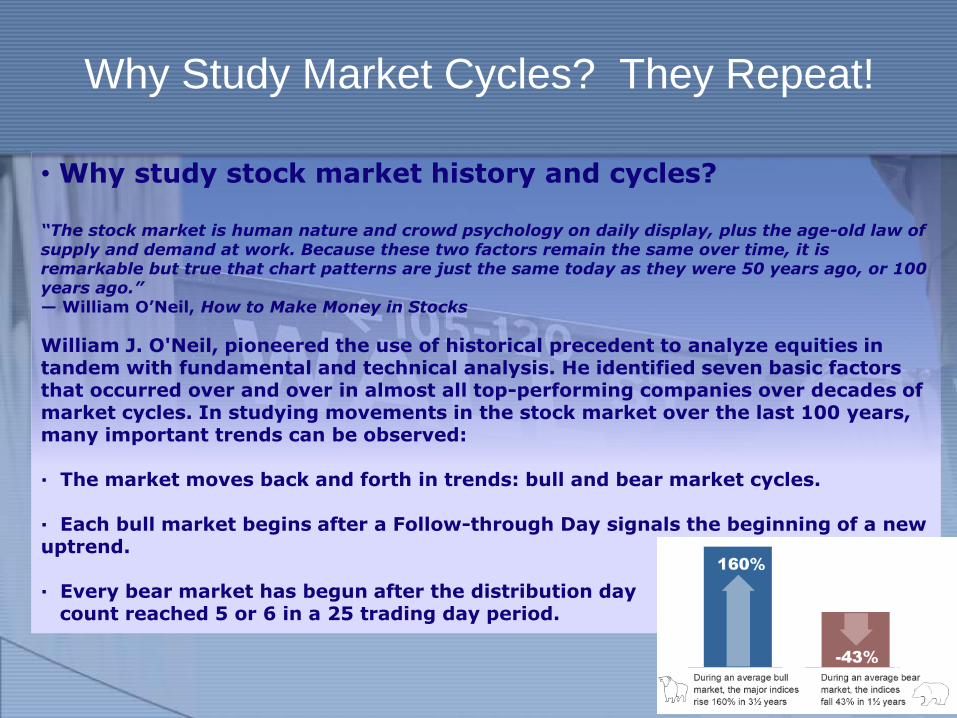
“The stock market is human nature and crowd psychology on daily display, plus the age-old law of supply and demand at work. Because these two factors remain the same over time, it is remarkable but true that chart patterns are just the same today as they were 50 years ago, or 100 years ago.”— William O’Neil, How to Make Money in Stocks
William J. O'Neil, pioneered the use of historical precedent to analyze equities in tandem with fundamental and technical analysis. He identified seven basic factors that occurred over and over in almost all top-performing companies over decades of market cycles. In studying movements in the stock market over the last 100 years, many important trends can be observed:
· The market moves back and forth in trends: bull and bear market cycles.
· Each bull market begins after a Follow-through Day signals the beginning of a new uptrend.
· Every bear market has begun after the distribution day count reached 5 or 6 in a 25 trading day period.
4
Types of Cycles
• Shorter term cycles - weeks to months - for example, seasonality ("sell in May and go away")
• Intermediate term cycles - months to years - for example, cyclical bull and bear markets (example: WON); presidential election cycle: decennial cycle
• Longer term cycles - years to decades - secular bull and bear markets (average duration, causative and correlated factors and metrics)
5

Types of Cycles: Short Term Cycles
1) Shorter term cycles - weeks to monthsA) Daily and weekly charts
B) Seasonality - Santa Claus effect early to mid-December through early to mid-January is often a bullish time
C) "Sell in May and go away" - November through April is when the bulk of stock market gains occur, there is much historical and statistical evidence for this
6
Types of Cycles: Short Term Cycles
1) Shorter term cycles - weeks to months
D) Pertinent macro indicators: McClellan oscillator; percentage of NYSE stocks below 10 and 20 day moving averages
E) Small caps (Russell 2000) - 90% of historical gains occur between November 1 - January 31. One study covering 33 years 1974-2006 shows that the gains for RUT during this time period were more than 8 times greater than those for larger cap indexes like SPX and Dow
F) Suggestion - "Halloween trade" - buy RUT etf (IWM or leveraged etf like TNA) at the close on October 31 and hold until January 31. 15% initial stop loss IWM
1974-2006: 33/33 profitable trades, no losing years (SPX 25/33 profitable trades; worst losing year for SPX during same time period was 29% loss); profit factor of 10.6
7
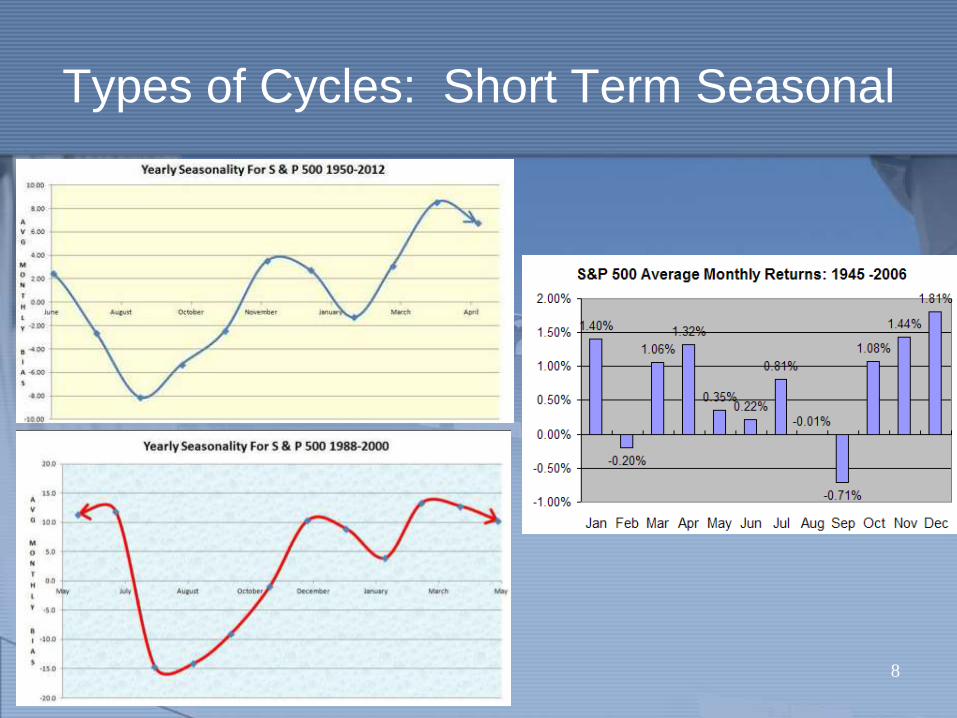
Types of Cycles: Short Term Seasonal
8
Types of Cycles: Intermediate
2) Intermediate term cycles - months to years
A) Weekly and monthly charts; daily charts for timing of entries and exits
B) Cyclical bull and bear markets - example, WON. Ratio of duration approximates 3:1 (i.e. bull market following a bear market tends to last about 3 times longer than the preceding bear market and a bear market after a bull will tend to last about 1/3 as long as the preceding bull market).
Cyclical bull markets tend to gain more than cyclical bear markets lose, hence the very long term uptrend in equity markets overall. These will behave differently in the greater context of longer term secular markets
9
Types of Cycles: Intermediate
2) Intermediate term cycles - months to yearsC) Presidential 4 year election cycle - all of the major stock market declines
occurred during the first or second years of the four-year U.S. presidential cycle.
- No major declines occurred during the third or fourth years. More specifically, from 1950 to 2004 (using the Standard and Poor’s 500 Index), the most favorable period (MFP) for investing was from October 1 of the second year of a presidential term to December 31 of the fourth year.
- The remaining period—from January 1 of the first year of the presidential term to September 30 of the second year—was the least favorable period (LFP) for stock market investors.
Summary - the first two years of a new presidential term are less favorable than the second two years, and the second year is less favorable than the first year; both the pre-election year (2015 in this case) and the election year (2016) tend to be the best periods of the Presidential Cycle.
10
Types of Cycles: Intermediate
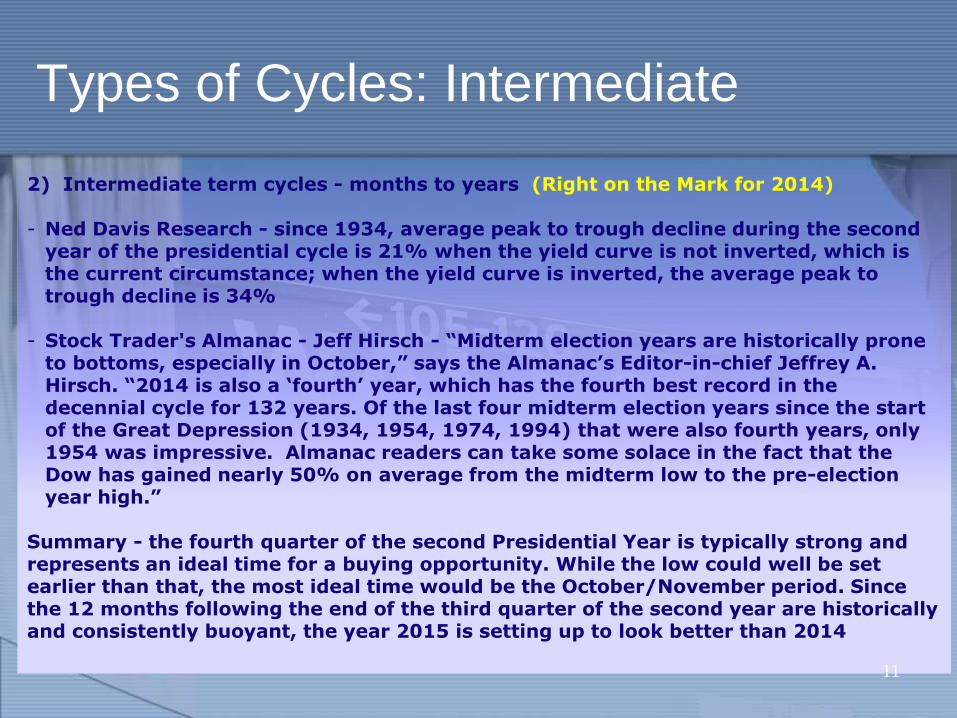
2) Intermediate term cycles - months to years (Right on the Mark for 2014)
- Ned Davis Research - since 1934, average peak to trough decline during the second year of the presidential cycle is 21% when the yield curve is not inverted, which is the current circumstance; when the yield curve is inverted, the average peak to trough decline is 34%
- Stock Trader's Almanac - Jeff Hirsch - “Midterm election years are historically prone to bottoms, especially in October,” says the Almanac’s Editor-in-chief Jeffrey A. Hirsch. “2014 is also a ‘fourth’ year, which has the fourth best record in the decennial cycle for 132 years. Of the last four midterm election years since the start of the Great Depression (1934, 1954, 1974, 1994) that were also fourth years, only 1954 was impressive. Almanac readers can take some solace in the fact that the Dow has gained nearly 50% on average from the midterm low to the pre-election year high.”
Summary - the fourth quarter of the second Presidential Year is typically strong and represents an ideal time for a buying opportunity. While the low could well be set earlier than that, the most ideal time would be the October/November period. Since the 12 months following the end of the third quarter of the second year are historically and consistently buoyant, the year 2015 is setting up to look better than 2014
11
Types of Cycles: Secular
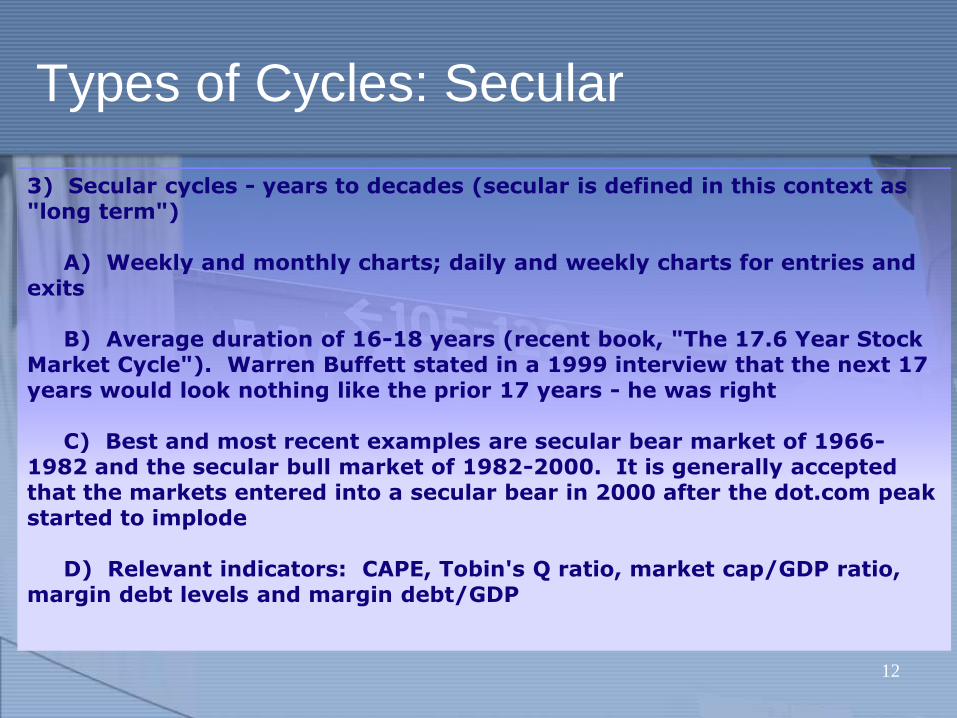
3) Secular cycles - years to decades (secular is defined in this context as "long term")
A) Weekly and monthly charts; daily and weekly charts for entries and exits
B) Average duration of 16-18 years (recent book, "The 17.6 Year Stock Market Cycle"). Warren Buffett stated in a 1999 interview that the next 17 years would look nothing like the prior 17 years - he was right
C) Best and most recent examples are secular bear market of 1966-1982 and the secular bull market of 1982-2000. It is generally accepted that the markets entered into a secular bear in 2000 after the dot.com peak started to implode
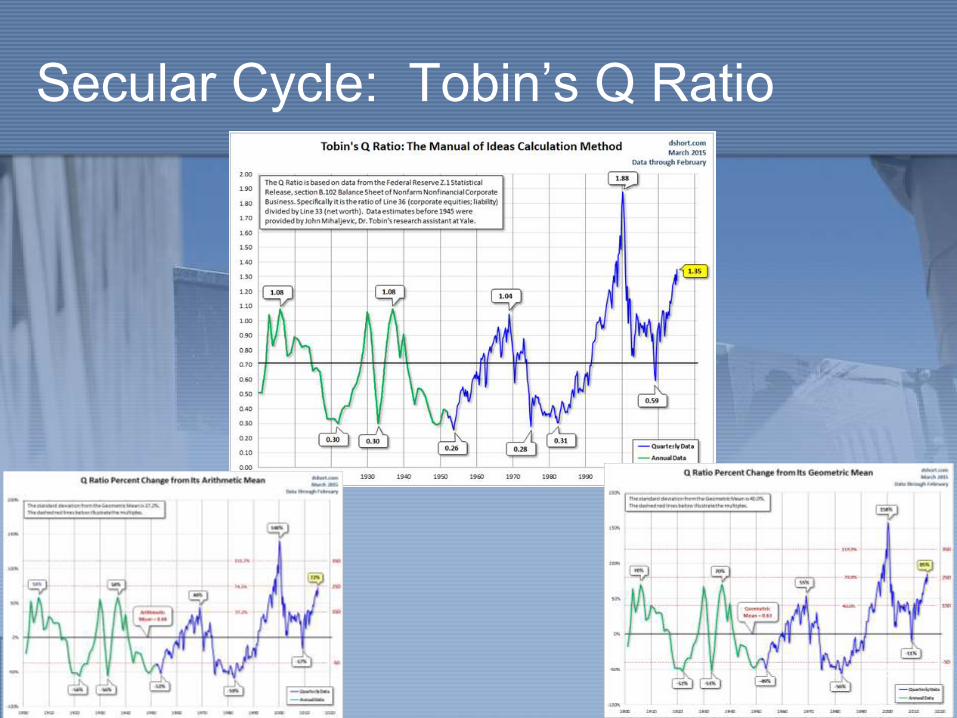
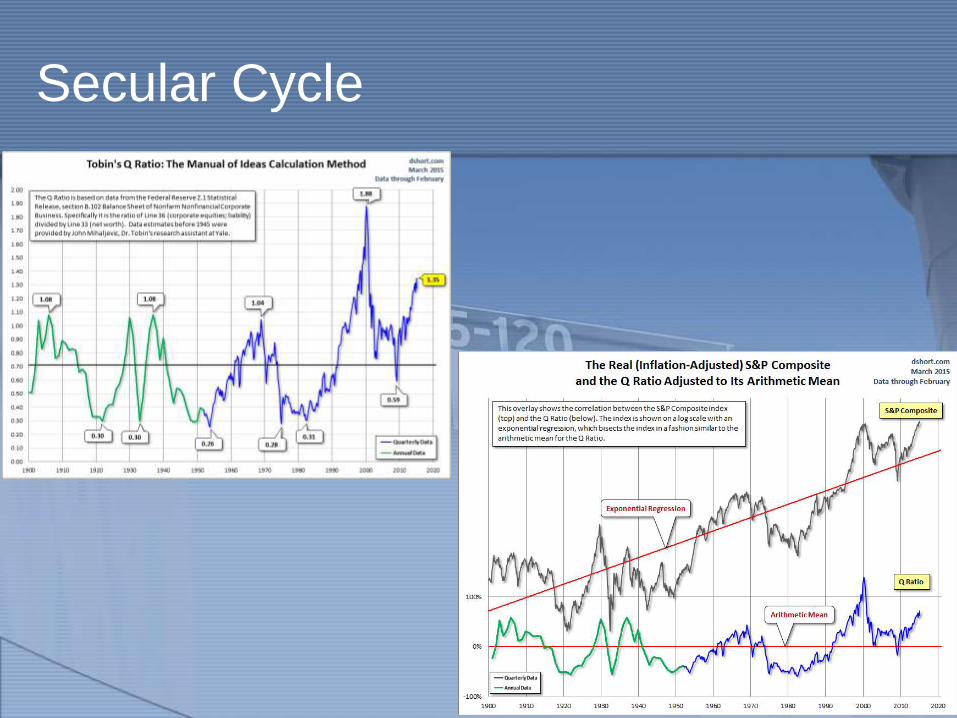
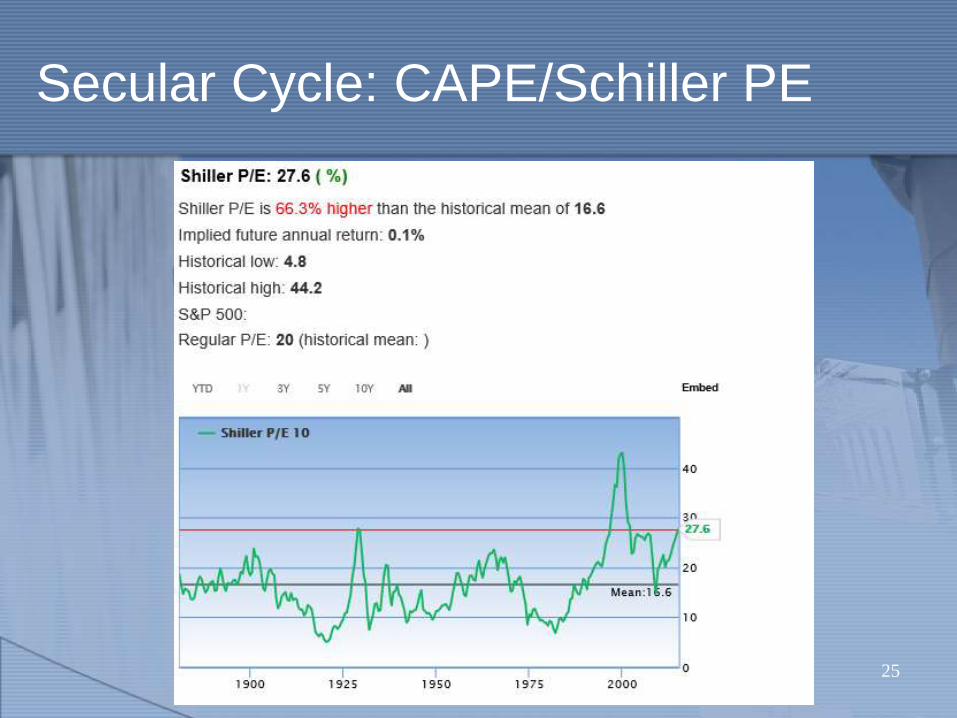
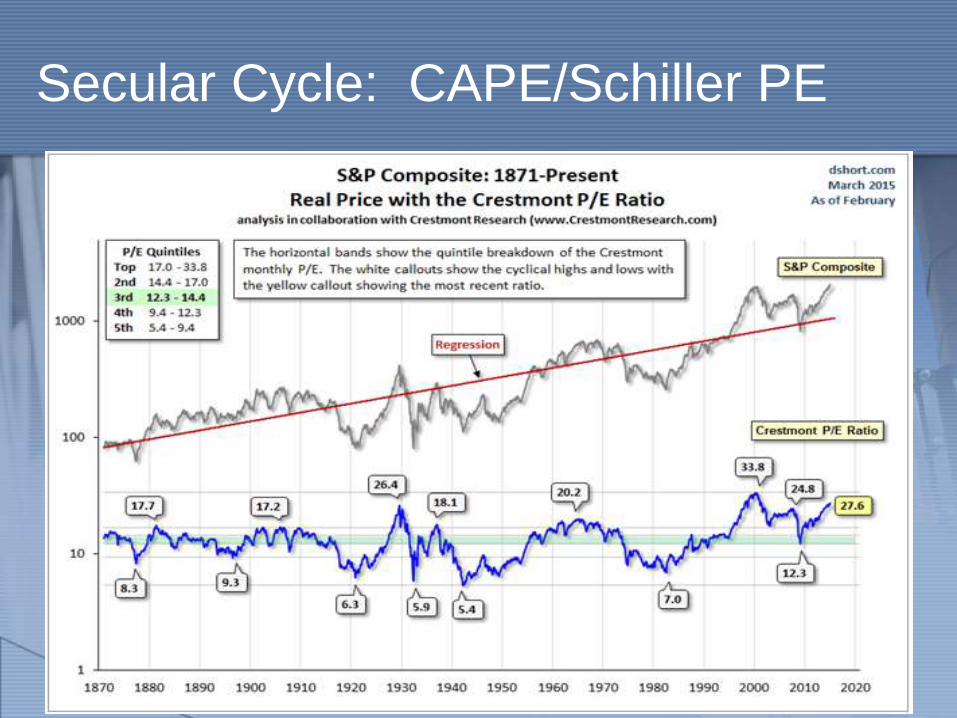
D) Relevant indicators: CAPE, Tobin's Q ratio, market cap/GDP ratio, margin debt levels and margin debt/GDP
12
Types of Cycles: Secular
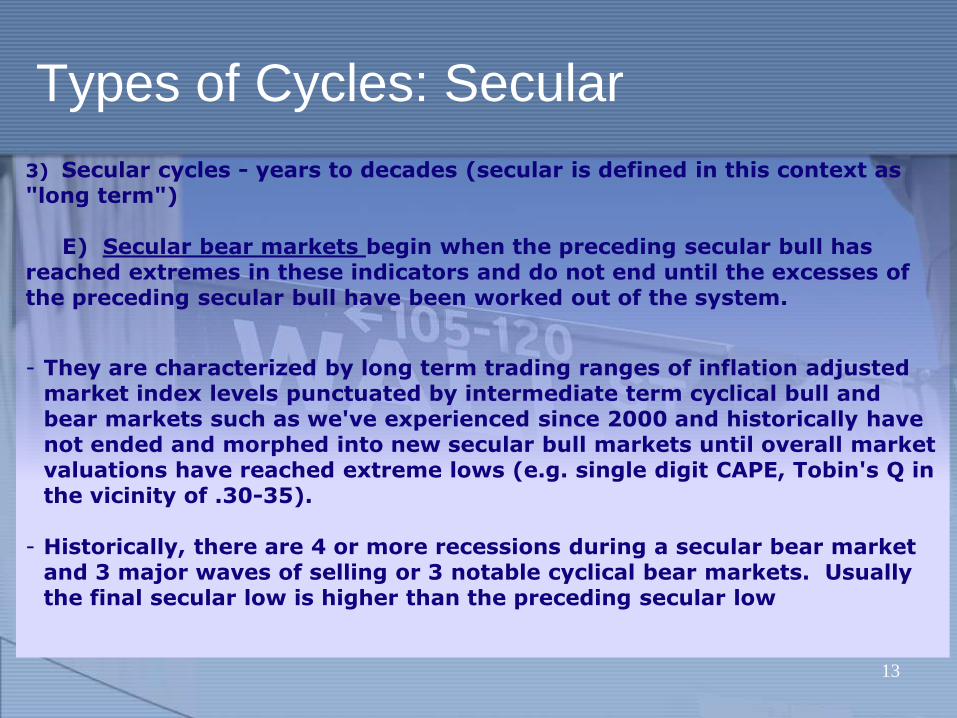
3) Secular cycles - years to decades (secular is defined in this context as "long term")
E) Secular bear markets begin when the preceding secular bull has reached extremes in these indicators and do not end until the excesses of the preceding secular bull have been worked out of the system.
- They are characterized by long term trading ranges of inflation adjusted market index levels punctuated by intermediate term cyclical bull and bear markets such as we've experienced since 2000 and historically have not ended and morphed into new secular bull markets until overall market valuations have reached extreme lows (e.g. single digit CAPE, Tobin's Q in the vicinity of .30-35).
- Historically, there are 4 or more recessions during a secular bear market and 3 major waves of selling or 3 notable cyclical bear markets. Usually the final secular low is higher than the preceding secular low
13

Types of Cycles: Secular
F) Secular bull markets begin when the above indicators have reached extremes to the downside and investor sentiment has reached extreme negative levels, marking the end of the preceding secular bear market.
- Secular bull markets are characterized by relatively brief and violent cyclical bear markets from which recovery to higher highs is quick and uninterrupted.
- Markets are driven by investor sentiment regardless of underlying economic and valuation fundamentals until valuations and the above indicators reach upside extremes, where they can stay for prolonged periods of time
14

Types of Cycles: Secular
G) Trading and investing strategies
1) Secular bull markets - buy and hold works; shorter term reversals are best for taking profits but not trading to the downside against the secular bull trend; take advantage of short to intermediate term corrections and cyclical bears by going long with the secular trend
2) Secular bear markets - buy and hold doesn't work well; timing becomes more important than it is in a secular bull market; extreme and prolonged moves both up and down
H) Overall, where are we now, where have we been, where are we likely to go?
15
Secular Cycles
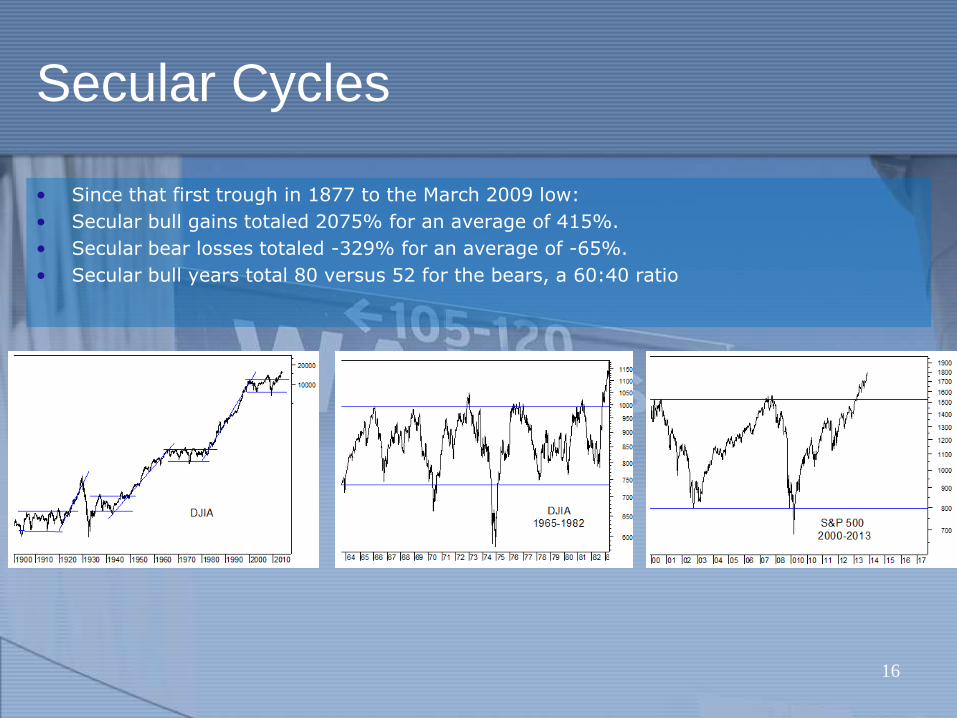
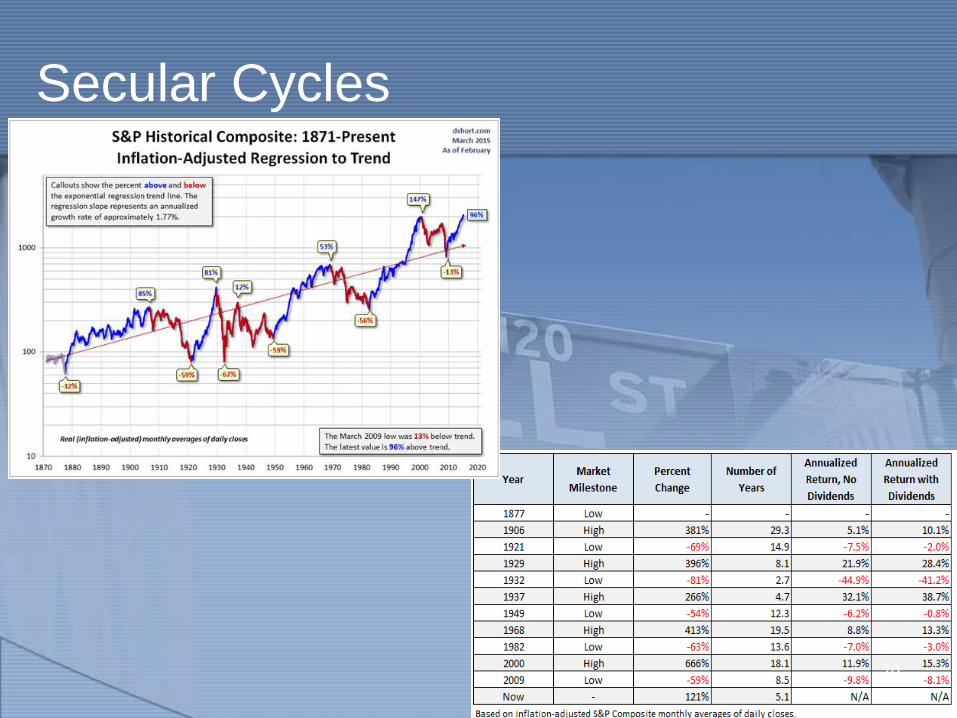
• Since that first trough in 1877 to the March 2009 low:
• Secular bull gains totaled 2075% for an average of 415%.
• Secular bear losses totaled -329% for an average of -65%.
• Secular bull years total 80 versus 52 for the bears, a 60:40 ratio
16
Types of Cycles: Secular
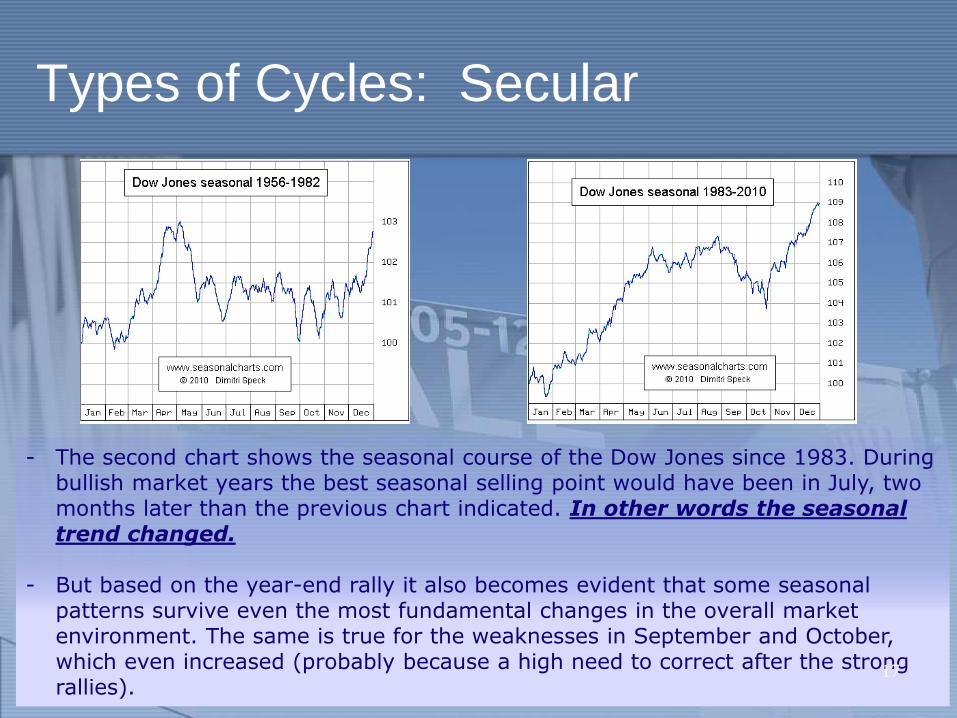
- The second chart shows the seasonal course of the Dow Jones since 1983. During bullish market years the best seasonal selling point would have been in July, two months later than the previous chart indicated. In other words the seasonal trend changed.
- But based on the year-end rally it also becomes evident that some seasonal patterns survive even the most fundamental changes in the overall market environment. The same is true for the weaknesses in September and October, which even increased (probably because a high need to correct after the strong rallies).
17
Ten Year Cycle
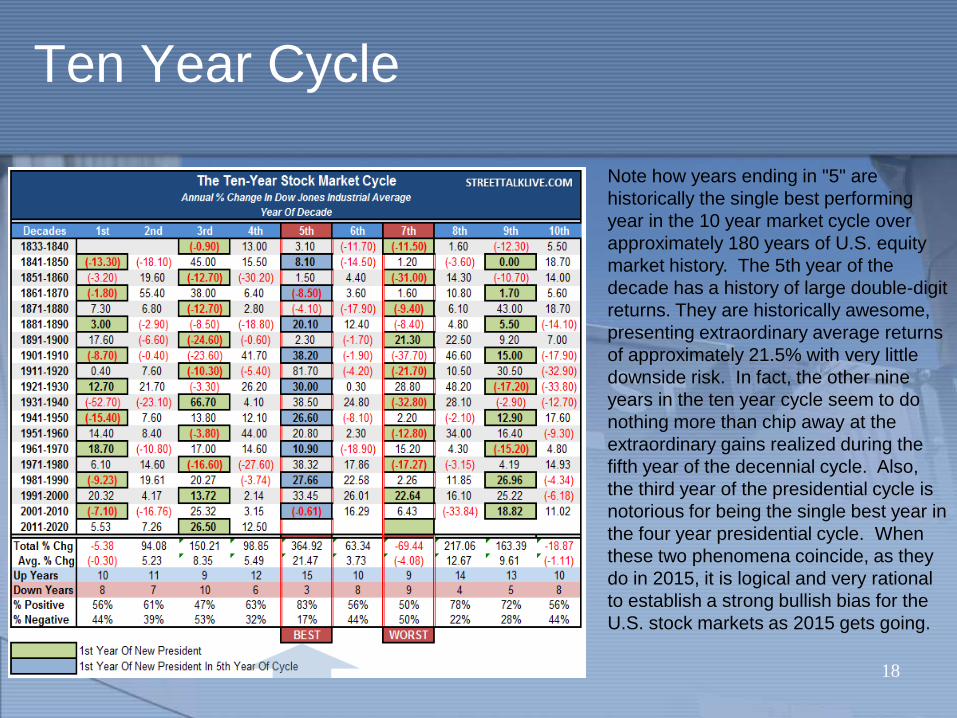
Note how years ending in "5" are
historically the single best performing
year in the 10 year market cycle over
approximately 180 years of U.S. equity
market history. The 5th year of the
decade has a history of large double-digit
returns. They are historically awesome,
presenting extraordinary average returns
of approximately 21.5% with very little
downside risk. In fact, the other nine
years in the ten year cycle seem to do
nothing more than chip away at the
extraordinary gains realized during the
fifth year of the decennial cycle. Also,
the third year of the presidential cycle is
notorious for being the single best year in
the four year presidential cycle. When
these two phenomena coincide, as they
do in 2015, it is logical and very rational
to establish a strong bullish bias for the
U.S. stock markets as 2015 gets going.
18
Shmita Cycle
19
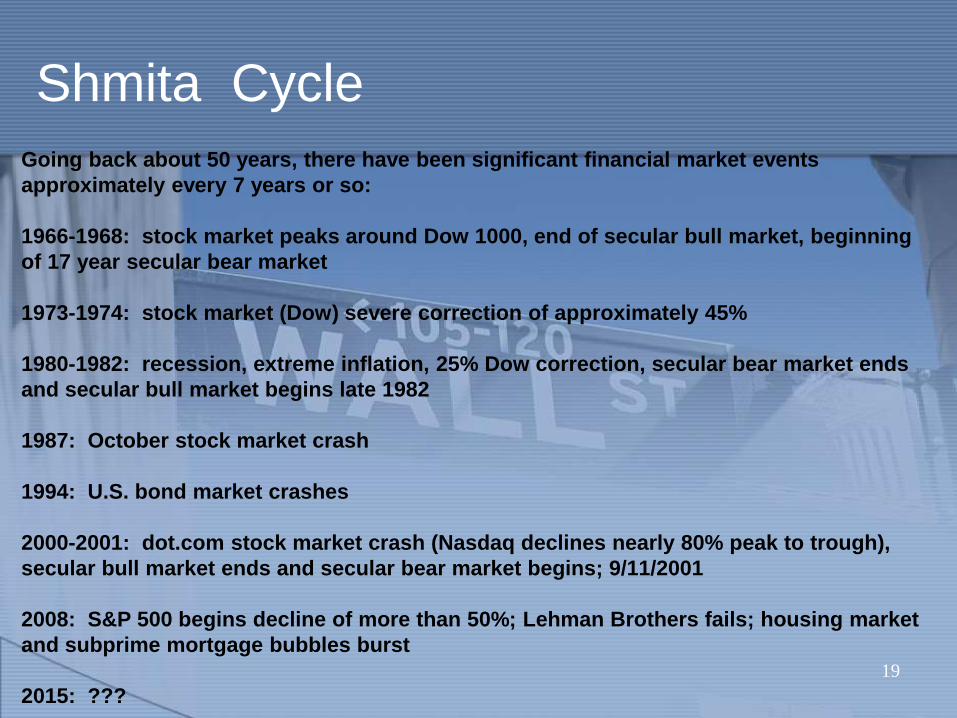
Going back about 50 years, there have been significant financial market events
approximately every 7 years or so:
1966-1968: stock market peaks around Dow 1000, end of secular bull market, beginning
of 17 year secular bear market
1973-1974: stock market (Dow) severe correction of approximately 45%
1980-1982: recession, extreme inflation, 25% Dow correction, secular bear market ends
and secular bull market begins late 1982
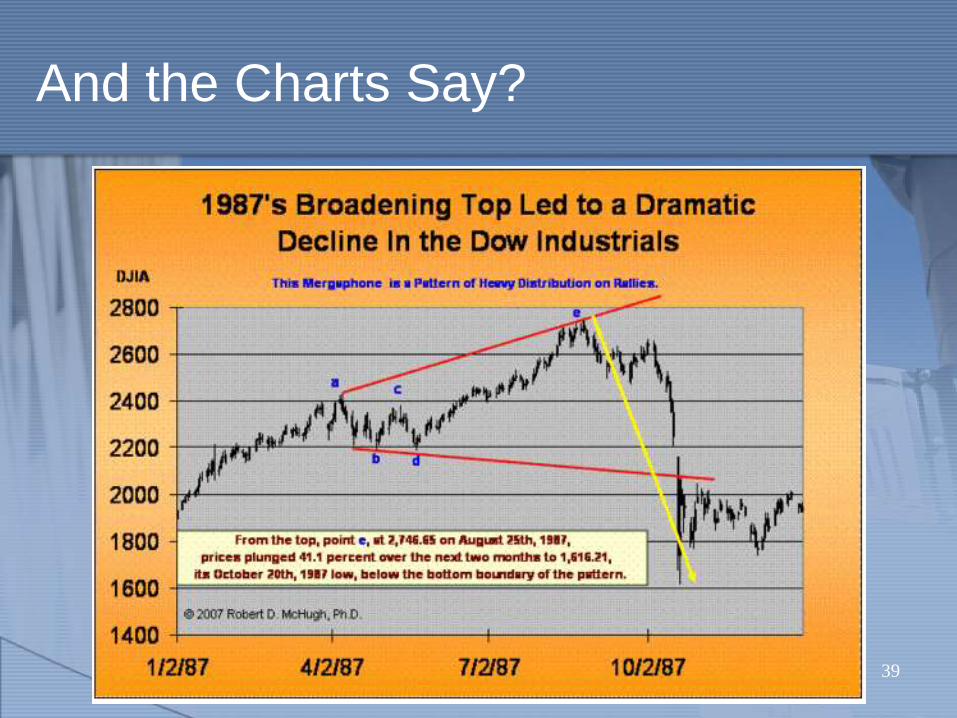
1987: October stock market crash
1994: U.S. bond market crashes
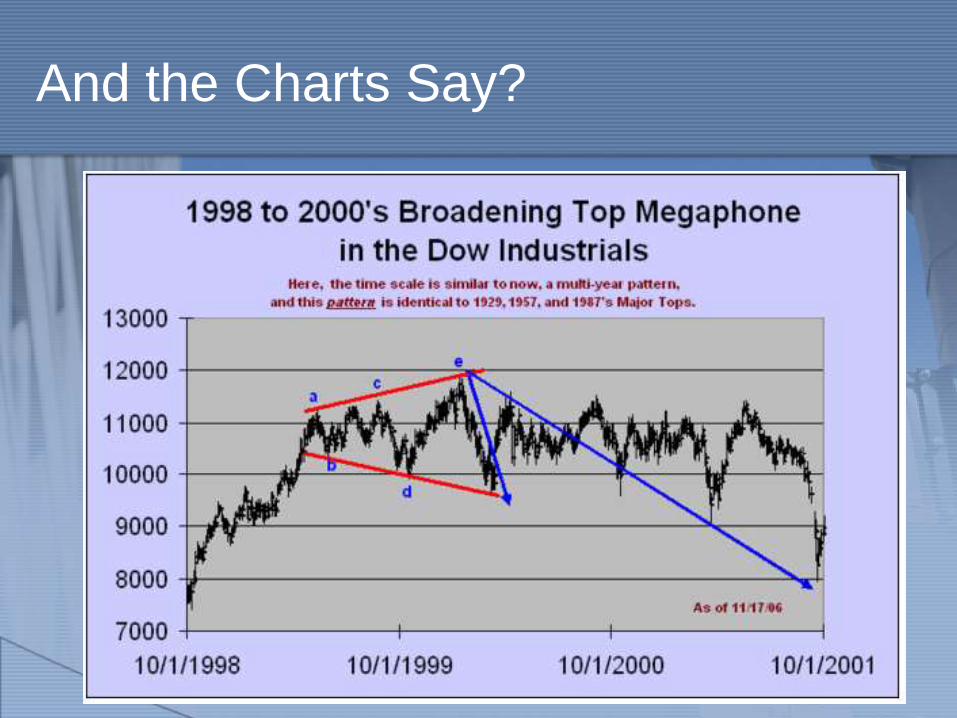
2000-2001: dot.com stock market crash (Nasdaq declines nearly 80% peak to trough),
secular bull market ends and secular bear market begins; 9/11/2001
2008: S&P 500 begins decline of more than 50%; Lehman Brothers fails; housing market
and subprime mortgage bubbles burst
2015: ???
Secular Cycles
20

Secular Cycles
21

10 Minute Break
22
Secular Cycle: Tobin’s Q Ratio
23
Secular Cycle
24
Secular Cycle: CAPE/Schiller PE
25
Secular Cycle: CAPE/Schiller PE
26

Secular Cycle: Market Cap to US GDP
27
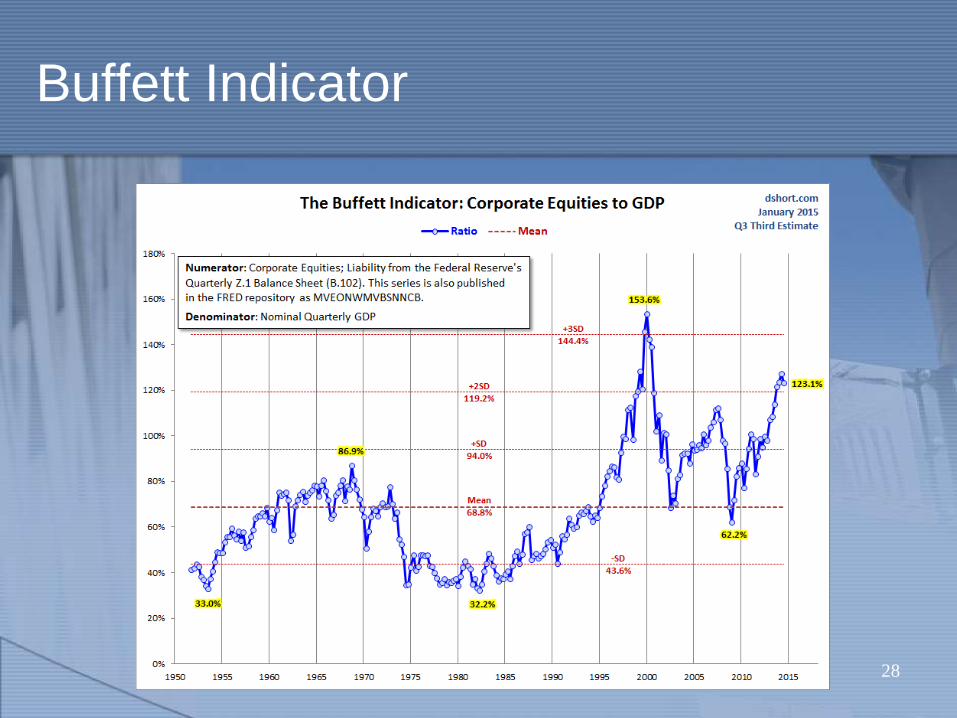
Buffett Indicator
28
Where are we today?
• March 7, 2015
The Stock Market is Significantly Overvalued. Based on historical ratio of total market cap over GDP (currently at 125.9%), it is likely to return 1.0% a year from this level of valuation.
29
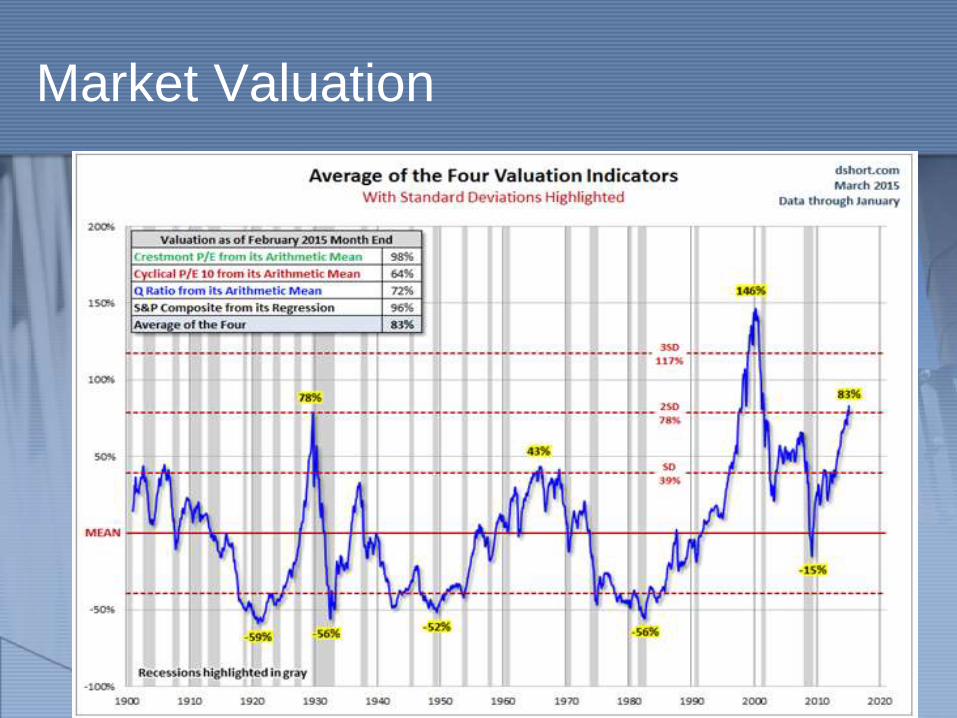
Market Valuation
30
Market Valuation
31
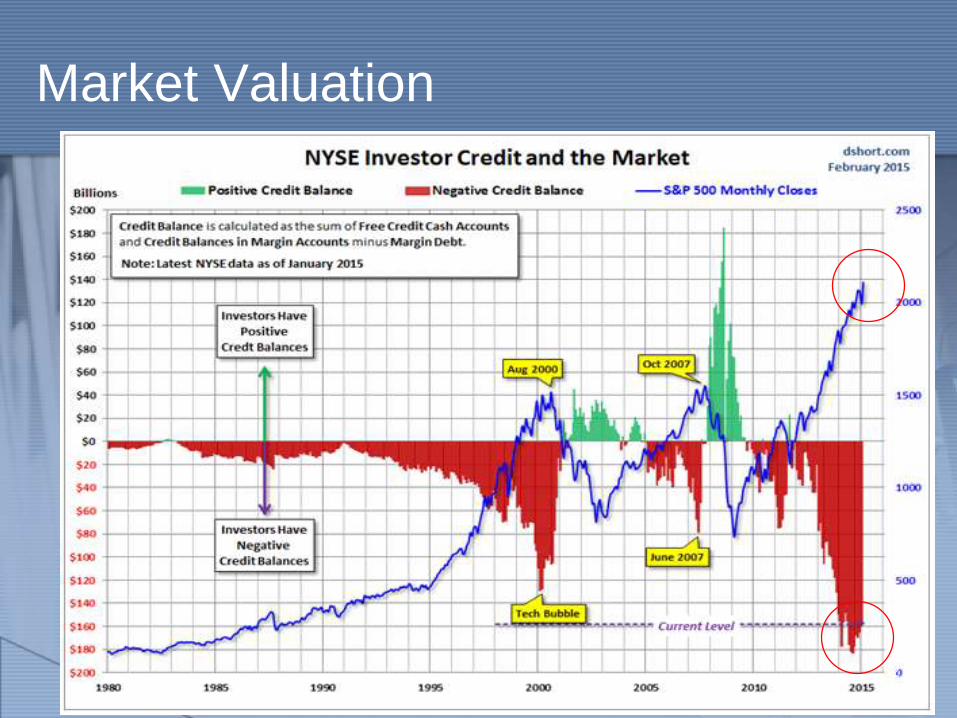
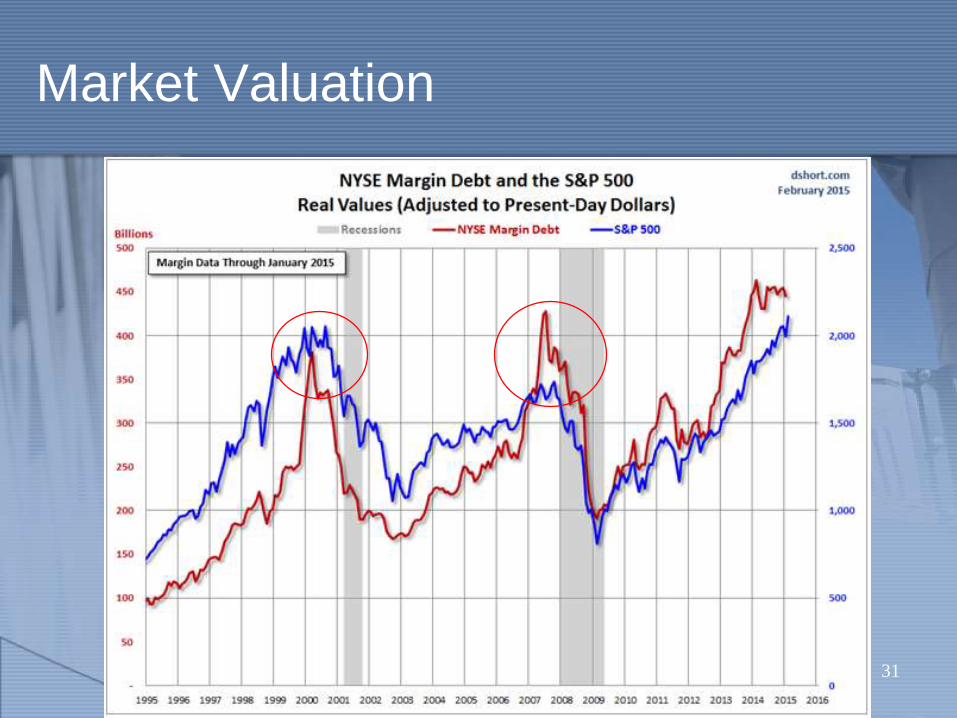
Market Valuation
32
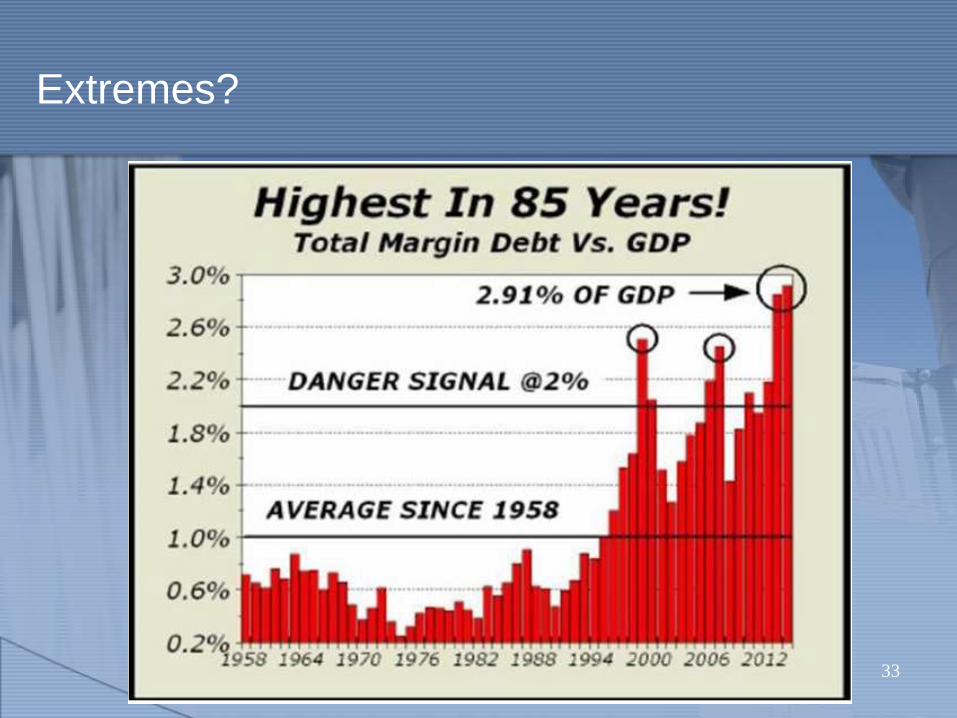
Extremes?
33
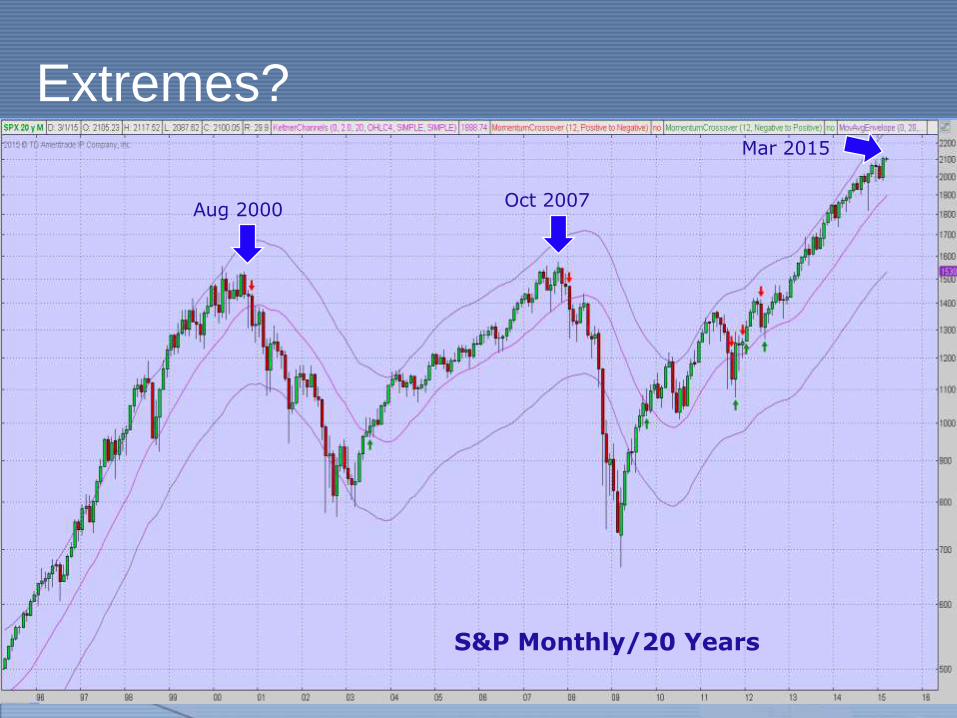
Extremes?
34
Aug 2000Oct 2007
S&P Monthly/20 Years
Mar 2015
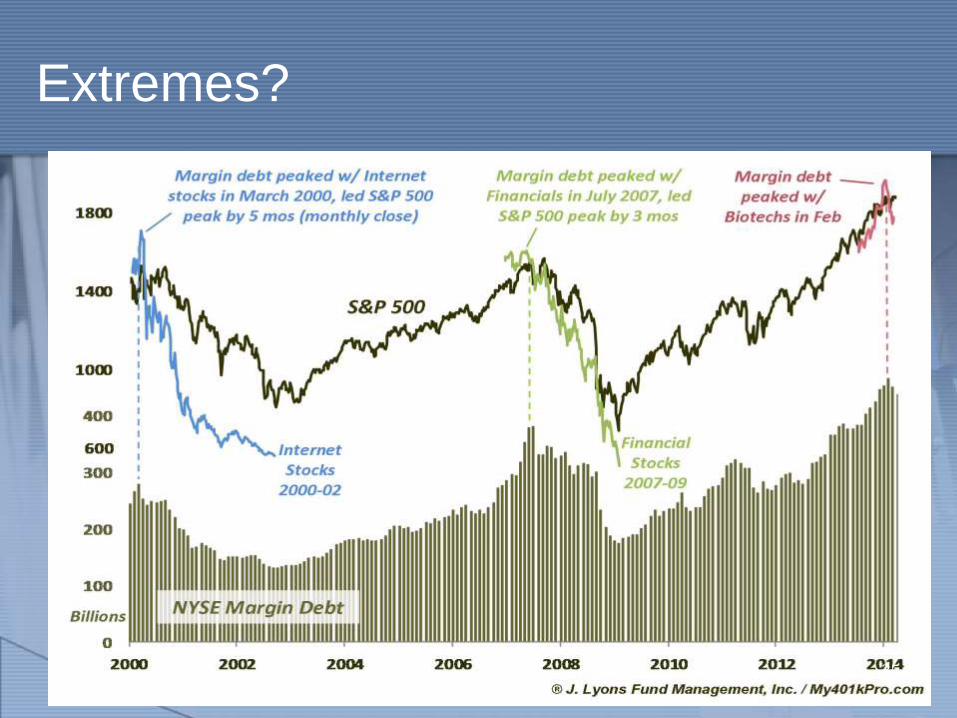
Extremes?
35

Forecast Models Modeled forecast future returns using
current valuations (as of June 2014)
36
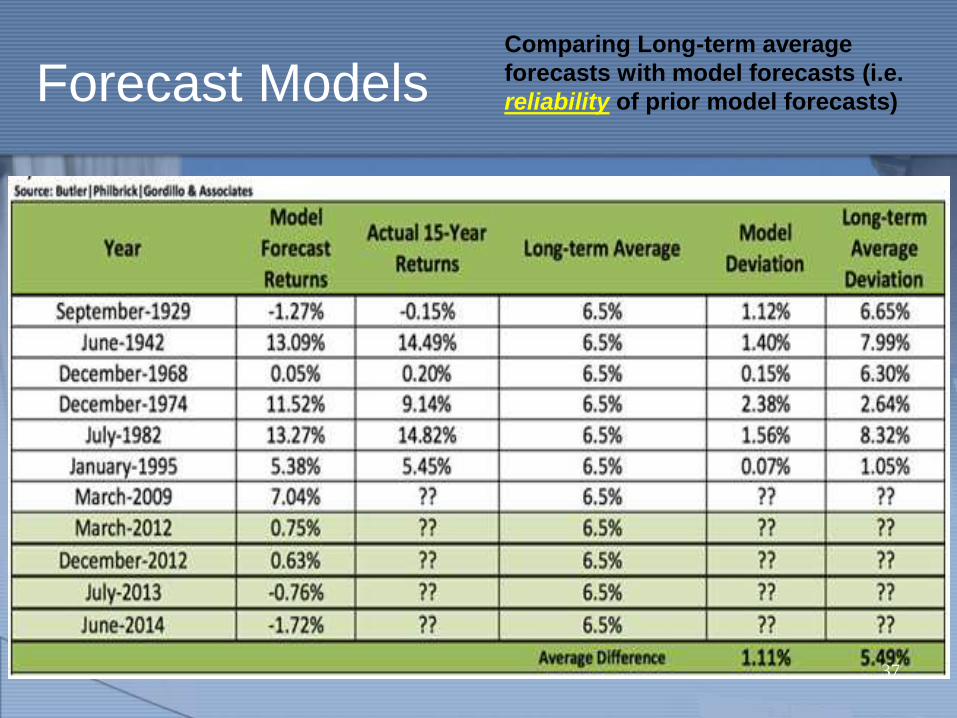
Forecast ModelsComparing Long-term average
forecasts with model forecasts (i.e.
reliability of prior model forecasts)
37

And the Charts Say?
38
And the Charts Say?
39
And the Charts Say?
40

And the Charts Say?
41
THE END
42
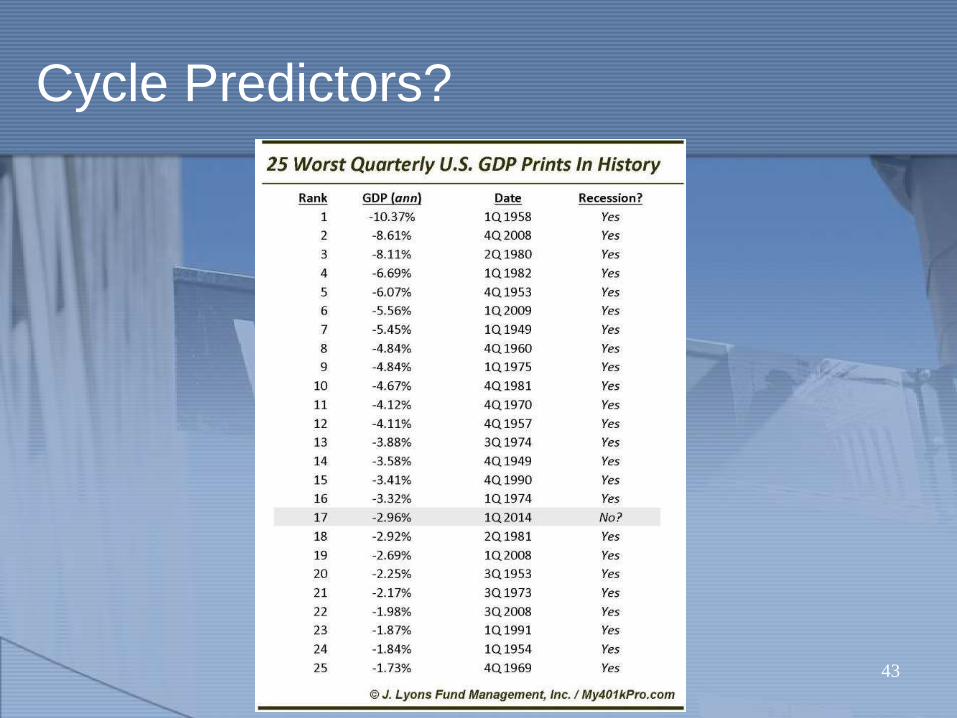
Cycle Predictors?
43

It’s Cold Up North! But what about the Growth!
44
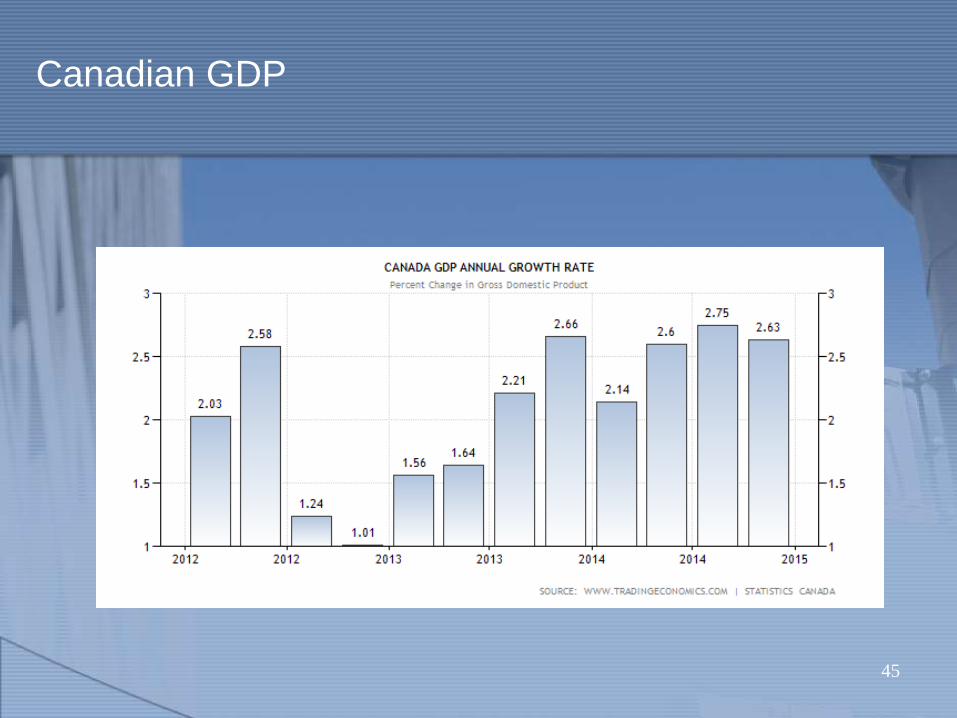
Canadian GDP
45
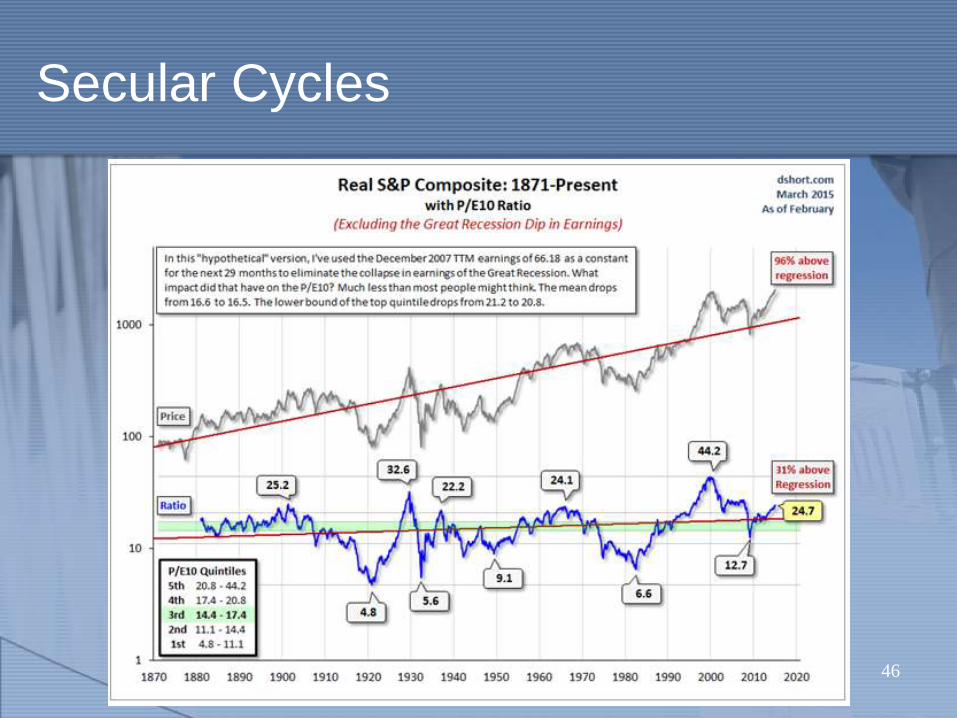
Secular Cycles
46

Market Valuation
Ratio = Total Market Cap / GDP Valuation
Ratio < 50% Significantly Undervalued
50% < Ratio < 75% Modestly Undervalued
75% < Ratio < 90% Fair Valued
90% < Ratio < 115% Modestly Overvalued
Ratio > 115% Significantly Overvalued
Where are we today (05/03/2014)? Ratio = 116.8%, Significantly Overvalued
Where Are We with Market Valuations?
Total Market Cap and US GDP
The Ratio of Total Market Cap to US GDP
The Stock Market is Significantly Overvalued. Based on historical ratio of total market cap over GDP
(currently at 116.8%),
it is likely to return 1.7% a year from this level of valuation.
47
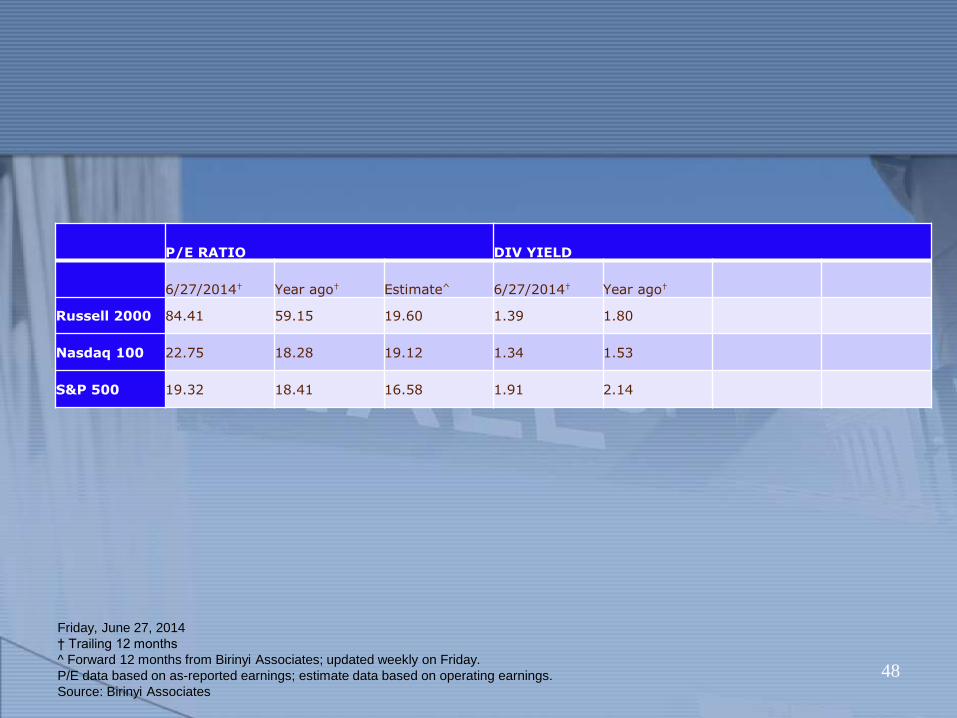
P/E RATIO DIV YIELD
6/27/2014† Year ago† Estimate^ 6/27/2014† Year ago†
Russell 2000 84.41 59.15 19.60 1.39 1.80
Nasdaq 100 22.75 18.28 19.12 1.34 1.53
S&P 500 19.32 18.41 16.58 1.91 2.14
Friday, June 27, 2014
† Trailing 12 months
^ Forward 12 months from Birinyi Associates; updated weekly on Friday.
P/E data based on as-reported earnings; estimate data based on operating earnings.
Source: Birinyi Associates
48
Related Documents