1 Market area of intermodal rail-road container terminals embedded in a hub-and–spoke network Sabine LIMBOURG and Bart JOURQUIN Louvain School of Management and FUCaM Mons Campus FUCaM – Catholic University of Mons 151 Ch. de Binche, B-7000, Mons, Belgique Tél : 32-65-323211, Fax : 32-65-315691, [email protected], [email protected] Abstract This paper presents a methodology able to compare road and rail-road intermodal market areas that takes the network structures, the operation costs and the location of the rail-road terminals into account. A particular way to model rail-road transport on hub-and-spoke networks is outlined and illustrated on the trans-European networks. The market area of an optimal nine hubs network configuration is presented, followed by a sensitivity analysis of the area to the number and locations of the implemented hubs. Kekwords: Market area, Terminals, Hub-and-Spoke, Intermodal, Transport 1. Introduction One of the objectives of the European Common Policy for freight transport is to restore the balance between modes and to develop intermodality. However, the structures of the modal networks and the operation costs are not similar. Consequently, the market areas can be very different from mode to mode. Among the various types of intermodal transports, Niérat (1997) compared road and rail- road intermodal transport and identified the market area of container terminals, and was so able to define the zones for which each mode is the most competitive. The focus of this paper is put on the market area of intermodal rail-road container terminals embedded in a hub-and–spoke network. In some circumstances, this kind of network topology can indeed reduce transportation costs by consolidating shipments at the hubs. The market area of these terminals can be determined by means of a comparison of the road only transport and the rail-road intermodal transport costs. Another recent paper by Jeong et al. (2007) is focused on freight transport by rail between ten European countries. It addresses the problem of a planner who has to identify the best combination of routes, frequencies, volume and length of trains. Limbourg and Jourquin (2008) also used the flows of commodities as input to determine a set of optimal hub locations, with an objective function that includes the costs of pre- and post-haulage by truck, trans-shipment and rail haulage, and an iterative procedure that takes the variation of the trans-shipment costs according to the flows captured by the optimally located hubs into account. The theoretical background about rail-road market areas is presented in section 2. The methodology used to determine the market area of a hub-and spoke network is explained in the following section. Finally, an application that concerns multi-modal transport over the whole trans-European networks is illustrated in Section 4.

Welcome message from author
This document is posted to help you gain knowledge. Please leave a comment to let me know what you think about it! Share it to your friends and learn new things together.
Transcript
1
Market area of intermodal rail-road container terminals embedded in a hub-and–spoke network
Sabine LIMBOURG and Bart JOURQUIN Louvain School of Management and FUCaM Mons Campus FUCaM – Catholic University of Mons 151 Ch. de Binche, B-7000, Mons, Belgique Tél : 32-65-323211, Fax : 32-65-315691, [email protected], [email protected]
Abstract
This paper presents a methodology able to compare road and rail-road intermodal market areas that takes the network structures, the operation costs and the location of the rail-road terminals into account.
A particular way to model rail-road transport on hub-and-spoke networks is outlined and illustrated on the trans-European networks. The market area of an optimal nine hubs network configuration is presented, followed by a sensitivity analysis of the area to the number and locations of the implemented hubs.
Kekwords: Market area, Terminals, Hub-and-Spoke, Intermodal, Transport
1. Introduction One of the objectives of the European Common Policy for freight transport is to restore the balance between modes and to develop intermodality. However, the structures of the modal networks and the operation costs are not similar. Consequently, the market areas can be very different from mode to mode. Among the various types of intermodal transports, Niérat (1997) compared road and rail-road intermodal transport and identified the market area of container terminals, and was so able to define the zones for which each mode is the most competitive.
The focus of this paper is put on the market area of intermodal rail-road container terminals embedded in a hub-and–spoke network. In some circumstances, this kind of network topology can indeed reduce transportation costs by consolidating shipments at the hubs. The market area of these terminals can be determined by means of a comparison of the road only transport and the rail-road intermodal transport costs. Another recent paper by Jeong et al. (2007) is focused on freight transport by rail between ten European countries. It addresses the problem of a planner who has to identify the best combination of routes, frequencies, volume and length of trains. Limbourg and Jourquin (2008) also used the flows of commodities as input to determine a set of optimal hub locations, with an objective function that includes the costs of pre- and post-haulage by truck, trans-shipment and rail haulage, and an iterative procedure that takes the variation of the trans-shipment costs according to the flows captured by the optimally located hubs into account. The theoretical background about rail-road market areas is presented in section 2. The methodology used to determine the market area of a hub-and spoke network is explained in the following section. Finally, an application that concerns multi-modal transport over the whole trans-European networks is illustrated in Section 4.

2
2. Market area theory
2.1. Rail-Road market area theory
The rail-road terminal market area can be defined as a region within the borders of which combined transport is a competitive mode. Combined transport is “an intermodal transport where the major part of the European journey is by rail, inland waterways or sea and any initial and/or final legs carried out by road are as short as possible” ECTM (2001). Within this context, this paper deals with intermodal transport units (ITU). These units are not accompanied by the truck driver. The determination of the market area for this type of transport is not simple because it depends on many factors such as costs (for road transport, rail transport, trans-shipment…), length of rail line-haul, freight volume, location of rail-road terminals, frequency and so on. Palander (1935) laid down the principles of the market area theory. Some developments in the domain of goods transport is developed by Niérat (1997). This author considered the topic from the point of view of a transport company. The assumption is made that a company, that transports commodities from A to M, is free to choose between two modes of transport (road or rail-road transport) and will retain the cheapest solution (Figure 1). The shipment cost is simply expressed as a sum of a fixed and a variable part, the latest being proportional to the Euclidian distance that separates the origin and the destination. The physical space is thus assumed to be homogeneous. For intermodal transport, some additional expenditure (for pick-up, for rail line-haul ...) must be added. He shows that the set of points M, where road and intermodal transport have exactly the same costs are on a hypercircle.
Figure 1. Possible choices.
Source : Niérat (1997)
The eccentricity of this conic section is equal to the ratio between the unit cost of long road haulage and the unit cost of a pre- or post-haulage. If the pre- or post-haulage is more expensive than the long road haulage, this curve is elliptic. Inside the surface of the ellipse, intermodal transport is the cheapest transport solution while road transport will be preferred elsewhere.
A B
M
Pre- or post-haulage Rail
Road
Trans-shipment
3
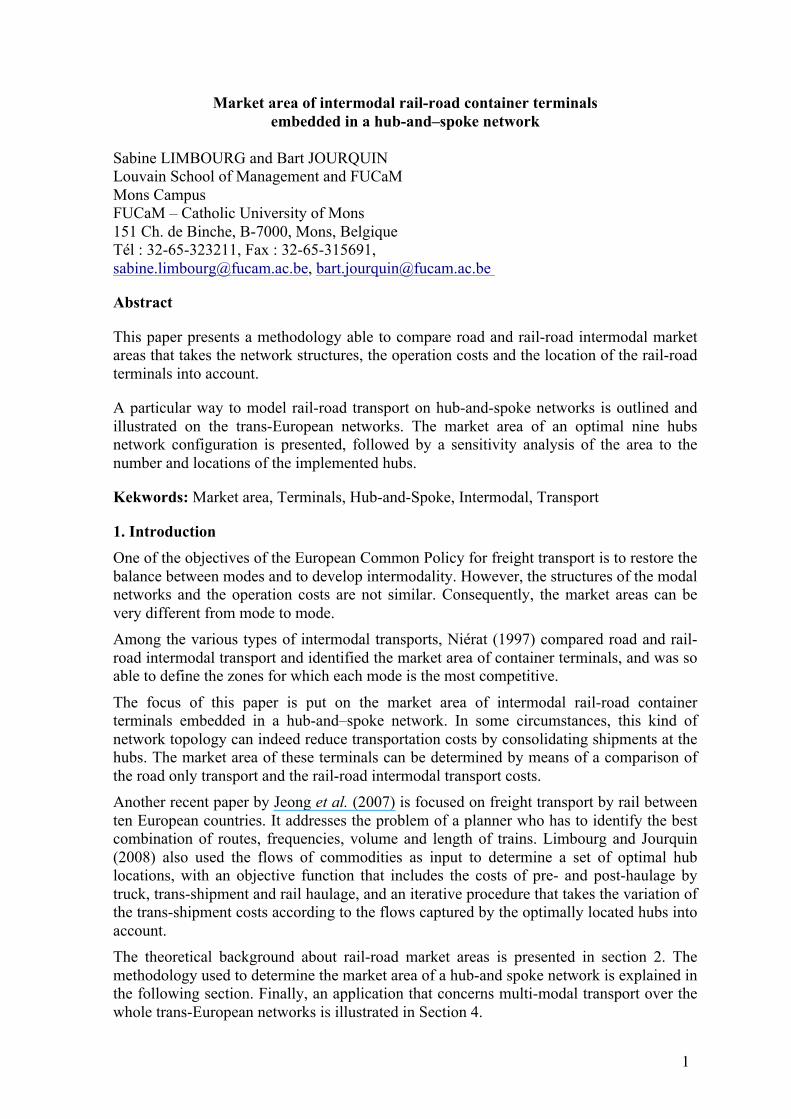
2.2. Estimated size of the market area between two terminals
Combined transport mostly needs a pre- and post-haulages. To estimate the market area of terminal B, Niérat assumed that the distance of pre- or post-haulage performed in A is nearly zero. The market area of terminal B is represented in Figure 2. It is oriented according to a line joining the origin and the destination terminals.
Figure 2. Estimated size of the area of market
With these different assumptions, the intermodal cost equals to the road only shipment costs if:
)( 11 rdcTTdccr rBAfp −=+++ (1)
where r1 is the distance between D and B d is the distance between A and B cp is the unit cost of a pre- or post-haulage cf is the unit cost of rail haulage cr is the unit cost of long haul road TK is the trans-shipment cost at terminal K So, the inferior limit at terminal B, where combined transport and road only transport costs are equal is:
rp
BAfr
ccTTdcdc
r+
−−−=1 (2)
While the upper limit, r2, for the same terminal can be expressed as:
rp
BAfr
ccTTdcdc
r−
−−−=2 (3)
This shows that r1 and r2 both depend on the distance between the terminals and on the shipment costs.
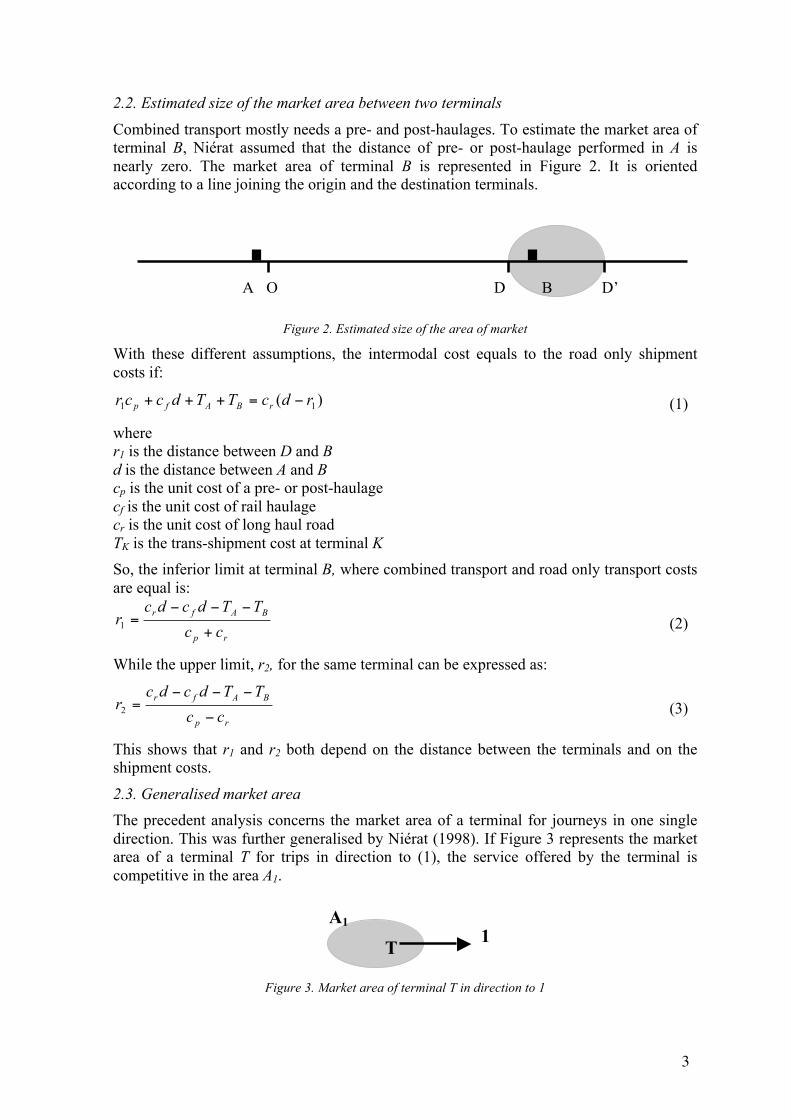
2.3. Generalised market area The precedent analysis concerns the market area of a terminal for journeys in one single direction. This was further generalised by Niérat (1998). If Figure 3 represents the market area of a terminal T for trips in direction to (1), the service offered by the terminal is competitive in the area A1.
Figure 3. Market area of terminal T in direction to 1
A B O D D’
T 1 A1

4
If terminal T provides services in the directions (1) and (2), the trans-shipments volumes can increase, creating economies of scale and thus lower trans-shipment costs (Figure 4). In such a case, the market area in direction (1) increases from A1 to A’1. Note that, in some cases, the reverse can be observed if the new service needs for instance an additional infrastructure, too expensive to maintain the same level of profitability, which can lead to a reduction of the market area.
Figure 4. Market area of terminal T, services in two directions
The market area of terminal T is now composed by different zones: • a zone (A’1 ∩ A’2) where combined transport is more competitive than road
transport in both two directions; • a zone where combined transport is more competitive than road transport in
direction (1) and road transport in direction (2): A’1 - A’2; • a zone where combined transport is more competitive in direction (2) and road
transport in direction (1): A’2 - A’1.
• out of these zones, road transport is more competitive than combined transport.
3. Market areas in hub-and-spoke network We will now try to generalise the concepts outline by Niérat to more complex networks such as hub-and-spoke systems with container terminals within the trans-European networks. These terminals will further be referred to as “hubs”.
In this section, a way to model hub-and-spoke networks will first be outlined.
3.1. Determining the demand for transport Our work is based on origin-destination (OD) matrices for the year 2000, produced by NEA Transport Research and Training. The matrices give information about the type of commodity being transported, classified according to the Standard Goods Classification for Transport Statistics/Revised (NST/R chapters). Only the figures for NST/R Chapter 9, containing the demand for containers among other manufactured products, are taken into account in the model. The database contains region-to-region relations at the NUTS 2 (Nomenclature of Territorial Units for Statistics) level, for the EU25 countries, plus Norway and Switzerland. Only the origin-destination pairs separated by at least 300 km were taken into account. Indeed, intermodal rail-road transport is often considered as being competitive only for these distances (see for instance ECMT (1998) and UIRR (2000)).
T 1
2
A’1
A’2

5
3.2. Setting up the network
A digital representation of the networks for the different transportation modes (roads, railways and inland waterways) was also needed. The railway and road networks were taken from the Digital Chart of the World (DCW) and updated. The DCW is an Environmental Systems Research Institute, Inc. product originally developed for the US Defense Mapping Agency (DMA) using DMA data. The inland waterway network was digitised at our research lab.
The borders of the NUTS 2 regions were provided by Geophysical Instrument Supply Co. (GISCO) and a centroid for each region was located at the centre of the most urbanised area of the zone. These centroids were further taken as origins and destinations for the commodities.
The different layers were finally connected together using “connectors” from each centroid to each modal layer. The complete set of layers can be considered as a geographical graph, that contains about 110 000 edges and 90 000 vertices. In order to take all the possible transport operations into account during the assignment of the demand on the network, “virtual networks” (Jourquin and Beuthe, 1996) were used. The main advantage of the use of this special network representation is that all the possible (combination of) transport modes can easily be compared, which is useful to determine the market areas. 3.3. Rail-road transport costs
The estimations of the costs were essentially based on the Recordit (REal COst Reduction of Door-to-door Intermodal Transport, 2002) European research program, which compared the costs of intermodal and road-only solutions. The methodology used to collect the data and to compute the costs was based on the description of the intermodal chain, defined as a sequence of activities. To refine and validate these costs, the PINE report (Prospective customers of Inland Navigation within the enlarged Europe report, 2004), data on road transport published by the French Road National Committee (CNR) and some data on railway costs published by Vervoort and Split (2005) were also used.
In order to take the variation of the trans-shipment costs according the number of handled ITU's into account, a logarithmic regression was performed on the results of the various trans-shipment costs obtained by Ballis and Golias (2002) for different terminal configurations. For terminals that handled between 25 000 and 300 000 ITU's per year, the trans-shipment cost, T(n), where n is the number of ITU's trans-shipped, can be expressed as 26.180ln163.12)( +−= (n) nT . A lower limit is set at 2 €/ton, in order to be in line with the figures found in the Recordit and ECMT (1998) reports.
3.4. Hub-and-spoke network design
A set of hubs can be integrated into the network and connected to the closest rail and road nodes. A hub-and-spoke network can further be designed between these hubs, using the results of an assignment that computes the fastest rail route between each couple of hubs.
3.5. Combined transport modelling
In order to distinguish pre- and post-haulage and truck-only transport, three different road transportation means were considered: the first is for truck-only transport, the second for pre-haulage and the third for post-haulage. For rail transport, two means are considered: one for traditional rail transport and another that corresponds to the rail part of combined
6
transport. In our model, pre- and post-haulages by truck can only be used in combination with “combined” rail, and the latest cannot be used alone on a trip between the origin and the destination centroïds. Thus, four possibilities can be offered: mono-modal road, waterway or railway transport, and combined road-rail transport.
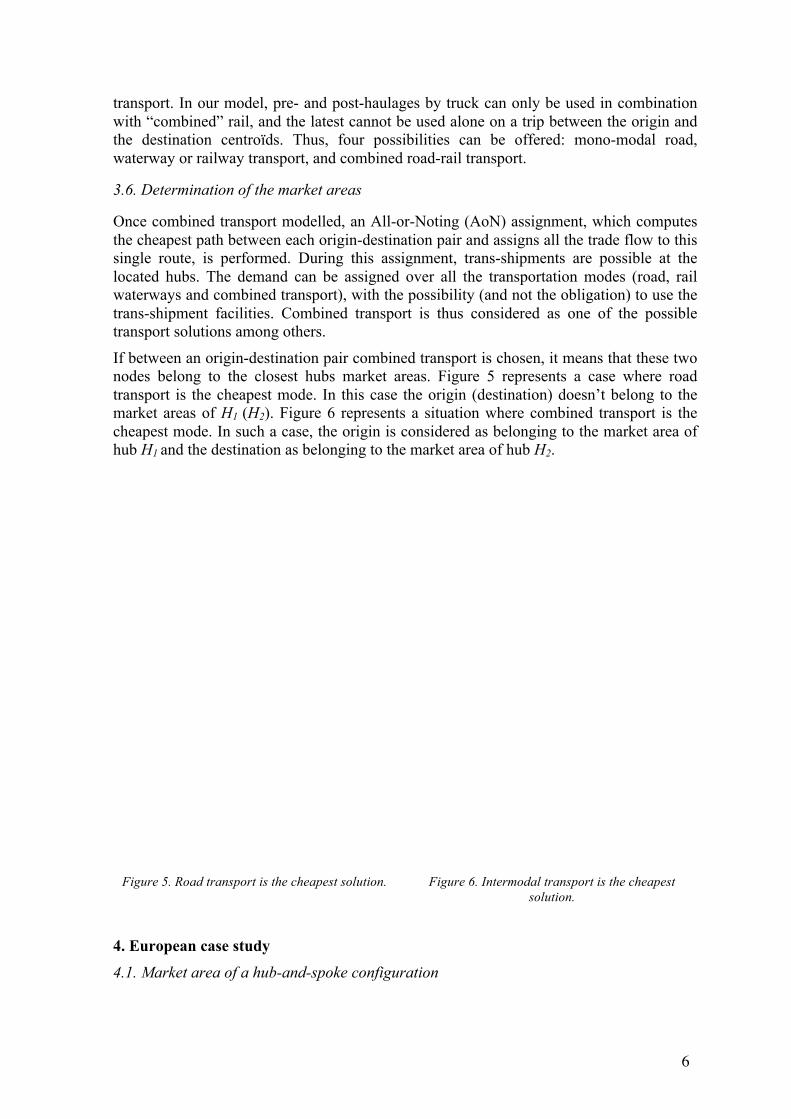
3.6. Determination of the market areas
Once combined transport modelled, an All-or-Noting (AoN) assignment, which computes the cheapest path between each origin-destination pair and assigns all the trade flow to this single route, is performed. During this assignment, trans-shipments are possible at the located hubs. The demand can be assigned over all the transportation modes (road, rail waterways and combined transport), with the possibility (and not the obligation) to use the trans-shipment facilities. Combined transport is thus considered as one of the possible transport solutions among others.
If between an origin-destination pair combined transport is chosen, it means that these two nodes belong to the closest hubs market areas. Figure 5 represents a case where road transport is the cheapest mode. In this case the origin (destination) doesn’t belong to the market areas of H1 (H2). Figure 6 represents a situation where combined transport is the cheapest mode. In such a case, the origin is considered as belonging to the market area of hub H1 and the destination as belonging to the market area of hub H2.
Figure 5. Road transport is the cheapest solution. Figure 6. Intermodal transport is the cheapest
solution.
4. European case study
4.1. Market area of a hub-and-spoke configuration

7
A methodology that is able to compute the optimal locations for intermodal hubs embedded in hub-and-spoke networks is presented in Limbourg and Jourquin (2008). In this paper, optimal configurations with a number of hubs to locate, p, varying from 2 to 11 are analysed. It is shown that, with a 10% cost reduction (economy of scale) assumption for intermodal rail haulage, only the configurations with between six and ten hubs capture more than 100 000 IUT on average, with the nine hubs configuration1 yielding the maximum capture. The complete market area (NUTS 2 regions) determined using the method explained in section 3.6, and where rail-road transport is competitive in at least one direction is represented in Figure 7 for the nine hubs configuration. In this case, combined transport is not competitive on some inter-hub relations such as Hamburg/Münster and Madrid/Barcelona, which are therefore not represented.
Figure 7. Market area of the nine hubs configuration.
4.2. Shape and evolution of market area
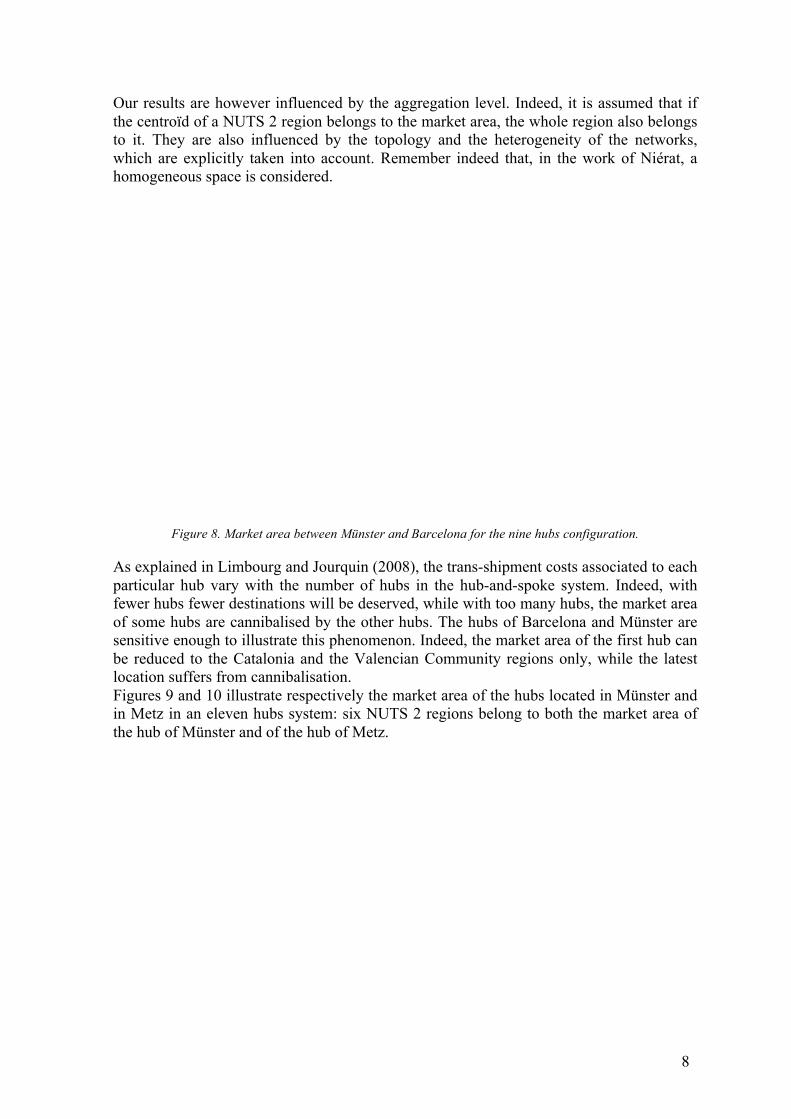
If pre- and post-haulage are more expensive than long road haulage unit costs, which is the case for the costs outlined in section 3.3, the theory of Niérat predicts an elliptic market area for combined transport, if it is competitive. Otherwise, there is no market area for this type of transport.
For the nine hubs configuration illustrated earlier, equations (2) and (3) respectively give values of about 200 km and 1100 km for r1 and r2 for the market area between the hubs localised at Münster and Barcelona. The limit of the theoretical market area and the obtained one using our methodology is illustrated by Figure 8.
Unlike what is supposed in most of the published work (Recordit (2002), Terminet (1997), Daubresse (1997), CEMT (1998) or Wiegmans (2003)), the obtained markets area are thus not circular.
1 Antwerp, Paris, Lyon, Milan, Barcelona, Madrid, Hamburg, Münster and Karlsruhe
8
Our results are however influenced by the aggregation level. Indeed, it is assumed that if the centroïd of a NUTS 2 region belongs to the market area, the whole region also belongs to it. They are also influenced by the topology and the heterogeneity of the networks, which are explicitly taken into account. Remember indeed that, in the work of Niérat, a homogeneous space is considered.
Figure 8. Market area between Münster and Barcelona for the nine hubs configuration.
As explained in Limbourg and Jourquin (2008), the trans-shipment costs associated to each particular hub vary with the number of hubs in the hub-and-spoke system. Indeed, with fewer hubs fewer destinations will be deserved, while with too many hubs, the market area of some hubs are cannibalised by the other hubs. The hubs of Barcelona and Münster are sensitive enough to illustrate this phenomenon. Indeed, the market area of the first hub can be reduced to the Catalonia and the Valencian Community regions only, while the latest location suffers from cannibalisation. Figures 9 and 10 illustrate respectively the market area of the hubs located in Münster and in Metz in an eleven hubs system: six NUTS 2 regions belong to both the market area of the hub of Münster and of the hub of Metz.

9
Figure 9. Münster market area. Figure 10. Metz market area.
If these two hubs are opened simultaneously, the demand of five of the six common regions is captured by the hub located in Münster. Only, the demand for North Rhine-Westphalia is split between the two hubs: the flow to Madrid is assigned to the hub of Münster, while the containers send to the market area of Barcelona will transit through the hub located in Metz (Figure 11). The variations of the market areas of the hubs located in Münster and Barcelona are thus a clear illustration of the theory explained in section 2.3.

10
Figure 11. Market area of Metz and Münster when they are in competition.
4.3. Refinement of the market area
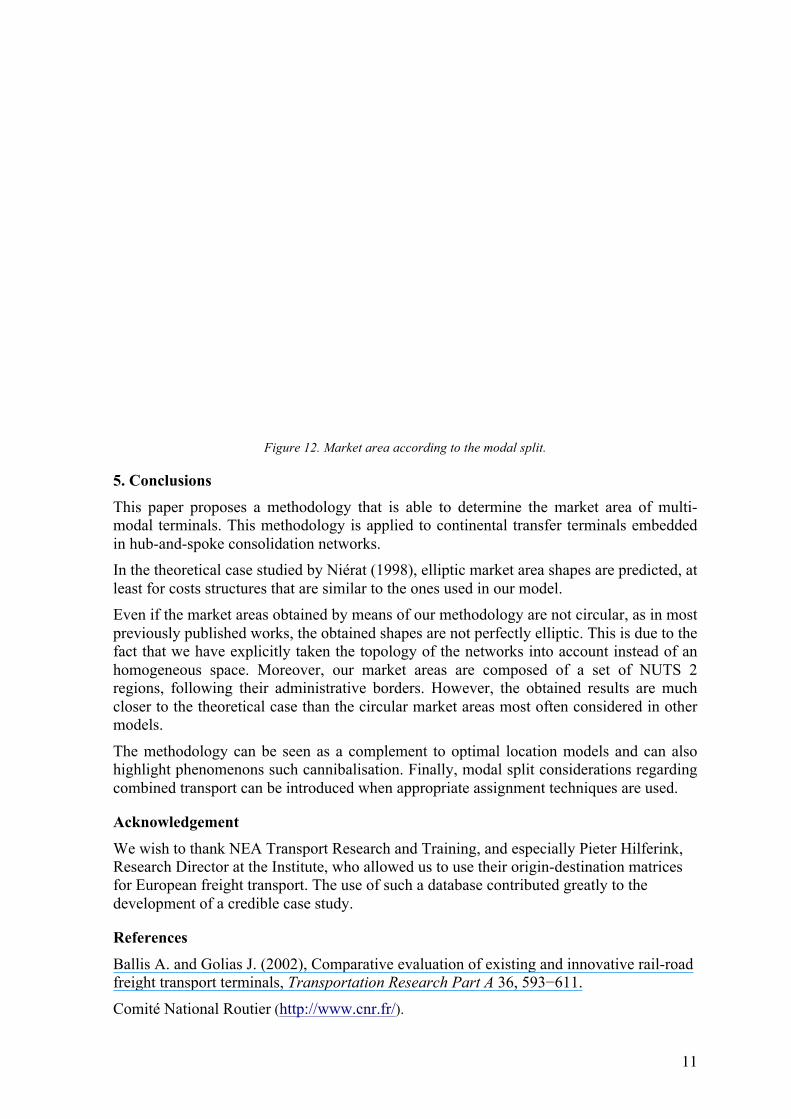
The aggregating level of the OD matrices (NUTS 2 region) is too important to consider that all the ITU's to be sent from a region to another are all transported using the same single transportation mode and route. Therefore a multi-flow algorithm that ensures that the computed set of paths both contains different itineraries and uses different transportation modes is required (Jourquin, 2006). Figure 12 illustrates the obtained market areas for combined transport, when a multi-flow assignment is used. This allows to estimate more precisely the market share of intermodal transport in the different sub-regions of a given market area, which was not possible with the results obtained by an All-Or-Nothing assignment (Figure 8). Note that, in both approaches, rail-road intermodal solutions are kept only if they are cheaper than any other transport solution. As expected, the market shares diminish with the distance to the hub.
11
Figure 12. Market area according to the modal split.
5. Conclusions
This paper proposes a methodology that is able to determine the market area of multi-modal terminals. This methodology is applied to continental transfer terminals embedded in hub-and-spoke consolidation networks. In the theoretical case studied by Niérat (1998), elliptic market area shapes are predicted, at least for costs structures that are similar to the ones used in our model. Even if the market areas obtained by means of our methodology are not circular, as in most previously published works, the obtained shapes are not perfectly elliptic. This is due to the fact that we have explicitly taken the topology of the networks into account instead of an homogeneous space. Moreover, our market areas are composed of a set of NUTS 2 regions, following their administrative borders. However, the obtained results are much closer to the theoretical case than the circular market areas most often considered in other models.
The methodology can be seen as a complement to optimal location models and can also highlight phenomenons such cannibalisation. Finally, modal split considerations regarding combined transport can be introduced when appropriate assignment techniques are used.
Acknowledgement
We wish to thank NEA Transport Research and Training, and especially Pieter Hilferink, Research Director at the Institute, who allowed us to use their origin-destination matrices for European freight transport. The use of such a database contributed greatly to the development of a credible case study.
References
Ballis A. and Golias J. (2002), Comparative evaluation of existing and innovative rail-road freight transport terminals, Transportation Research Part A 36, 593−611.
Comité National Routier (http://www.cnr.fr/).

12
Daubresse, Mp (1997), « Schéma national des plates-formes multimodales ». La Documentation Française.
ECMT (1998), The Current State of Combined Transport in Europe, Paris.
ECMT (2001), Terminology on combined transport, prepared by the UN/ECE the European Conference of Ministers of Transport and the European Commission, New York and Geneva, www.cemt.org/online/glossaries/termcomb.pdf. Jeong S-J, Lee C-G and Bookbinder J. H. (2007), The European freight railway system as a hub-and-spoke network, Transportation Research Part A 41, 523–536. Jourquin B. and Beuthe M. (1996), Transportation policy analysis with a geographic information system: the virtual network of freight transportation in Europe, Transportation Research C: Emerging Technologies, 4(6), 359−371.
Jourquin B. (2006), A multi-flow multi-modal assignment procedure on large freight transportation networks, Studies in Regional Science, 35, 929−946.
Limbourg S. and Jourquin B. (2008), Intermodal rail-road container terminal location in a multimodal network: a strategic model for Europe, submit to Transportation Research.
Niérat P. (1997), Market area of rail-truck terminals: Pertinence of the spatial theory, Transportation Research Part A: Policy and Practice, Volume 31, Issue 2, pp 109-127
Niérat P. (1998), Anatomie d'un réseau intermodal hub-and-spoke, Rapport Inrets n°220, Arcueil, 75 p.
Palander T. (1935), Beitrage zur standortstheorie, Almqvist et Wiksells Boktryckeri, Uppsala.
PINE (2004), Prospects of Inland Navigation in an Enlarged Europe, http://europa.eu.int/comm/transport/iw/prospect/index_fr.htm.
Recordit (2002), REal COst Reduction of Door-to-door Intermodal Transport, http://www.recordit.org/.
Terminet (1997), Quality Jump in Intermodal Transport: Theory and Practice, University of Technology, Delft, July.
U.I.R.R., Union Internationale des sociétés de transport combiné Rail-Route, http://www.uirr.com/.
Vervoort K, Split W (2005), « Economische toets variant 3: Betalen per kilometer vracht », Ministerie van Verkeer en Waterstaat.
Wiegmans B. (2003), Performance Conditions for Container Terminals, PhD Thesis, Vrije University, Amsterdam
Related Documents