Marine Turtles in the Kimberley: key biological indices required to understand and manage nesting turtles along the Kimberley coast Scott Whiting 1,2 , Tony Tucker 1,2 , Kellie Pendoley 3 , Nicki Mitchell 1,4 , Blair Bentley 1, 4 , Oliver Berry 1,5 , Nancy FitzSimmons 1,6 1 Western Australian Marine Science Institution, Perth, Western Australia 2 Marine Science Program, Department of Parks and Wildlife, Perth, Western Australia 3 Pendoley Environmental, Perth, Western Australia 4 The University of Western Australia, Perth, Western Australia 5 CSIRO Coastal Ecosystems and Modeling, Floreat, Western Australia 6 Griffith University, Brisbane, Queensland WAMSI Kimberley Marine Research Program Final Report Project 1.2.2 September 2018

Welcome message from author
This document is posted to help you gain knowledge. Please leave a comment to let me know what you think about it! Share it to your friends and learn new things together.
Transcript
Marine Turtles in the Kimberley: key biological indices required to understand and manage nesting turtles along the Kimberley coast Scott Whiting1,2 , Tony Tucker1,2, Kellie Pendoley3, Nicki Mitchell1,4, Blair Bentley1, 4, Oliver Berry1,5, Nancy FitzSimmons1,6 1Western Australian Marine Science Institution, Perth, Western Australia 2 Marine Science Program, Department of Parks and Wildlife, Perth, Western Australia 3 Pendoley Environmental, Perth, Western Australia 4The University of Western Australia, Perth, Western Australia 5CSIRO Coastal Ecosystems and Modeling, Floreat, Western Australia 6Griffith University, Brisbane, Queensland
WAMSI Kimberley Marine Research Program Final Report
Project 1.2.2 September 2018

WAMSI Kimberley Marine Research Program
Initiated with the support of the State Government as part of the Kimberley Science and Conservation Strategy, the Kimberley Marine Research Program is co-invested by the WAMSI partners to provide regional understanding and baseline knowledge about the Kimberley marine environment. The program has been created in response to the extraordinary, unspoilt wilderness value of the Kimberley and increasing pressure for development in this region. The purpose is to provide science based information to support decision making in relation to the Kimberley marine park network, other conservation activities and future development proposals
Ownership of Intellectual property rights
Unless otherwise noted, copyright (and any other intellectual property rights, if any) in this publication is owned by the Western Australian Marine Science Institution.
Copyright
© Western Australian Marine Science Institution
All rights reserved.
Unless otherwise noted, all material in this publication is provided under a Creative Commons Attribution 3.0 Australia Licence. (http://creativecommons.org/licenses/by/3.0/au/deed.en)
Legal Notice
The Western Australian Marine Science Institution advises that the information contained in this publication comprises general statements based on scientific research. The reader is advised and needs to be aware that such information may be incomplete or unable to be used in any specific situation. This information should therefore not solely be relied on when making commercial or other decision. WAMSI and its partner organisations take no responsibility for the outcome of decisions based on information contained in this, or related, publications.
Front cover images (L-R)
Image 1: Satellite image of the Kimberley coastline (Image: Landgate)
Image 2: Ranger taking turtle measurements. (Image: WAMSI)
Image 3: Humpback whale breaching (Image: Pam Osborn)
Image 4: Rangers undertake patrols to check the species and activity in Camden Sound Marine Park (Image: WAMSI)

Year of publication: 2018
Metadata: https://catalogue.aodn.org.au/geonetwork/srv/eng/metadata.show?uuid=fd1d3645-37f4-4834-a663-92d847cd7460
Citation: Whiting S, Tucker T, Pendoley K, Mitchell N, Bentley B, Berry O, FitzSimmons N (2018). Final Report of Project 1.2.2 prepared for the Kimberley Marine Research Program, Western Australian Marine Science Institution, Perth, Western Australia, 146 pp.
Author contributions: SW, NM, OB conceived and designed the project structure. TT, and KP completed the distribution and abundance project. NM and BB completed the climate change and temperature project. OB and NF completed the genetic project.
Funding Sources: This project was funded (commissioned) by the Western Australian Marine Science Institution as part of the WAMSI Kimberley Marine Research Project with co-investment of cash and inkind from the WAMSI Joint Venture partners. Substantioal funds were contributed from the Northwest Shelf Flatback Turtle Conservation Program. Funding and in-kind contributions were also made by the Kimberley Science Conservation Strategy and DBCA Kimberley district offices.
Competing Interests: The commercial investors and data providers had no role in the data analysis, data interpretation, the decision to publish or in the preparation of the manuscript. The authors have declared that no competing interests exists.
Kimberley Traditional Owner agreements: This research was enabled by data, traditional knowledge, and information provided by the Kimberley region’s Aboriginal Corporations. We developed working liaisons with multiple Traditional Owner groups through their advice, participation and consent to access their traditional lands. These saltwater country groups included Miruwung Gajerrong, Balanggarra, Wunambal Gaambera, Dambimangarri, Mayala, Bardi Jawi, Nyul Nyul, Yawuru, KariJarri, Nyangumarta, and Ngarla Traditional Owners.
Acknowledgements: Jessica Stubbs who conducted an honours project on climate change impacts at Cape Domett in the Kimberley. Rob Ryan of Image Aviation, Leigh Rawlings of Kimberley Air Tours, and Mark Dixon of DBCA aerial operations provided advice, flight planning and coordination. Andre Bobojcov, Todd Quartermaine, Leah Pearson, Erina Young, and Craig Williams facilitated field work in Eighty Mile Beach Marine Park. Michael Hourn, Todd Quartermaine, Danny Barrow of DBCA facilitated field work aboard the Worndoom in the Lalang Gaaram Camden Sound Marine Park. Luke Edwards, Ben Corey, Anna Smith, and Darryl Moncrief of DBCA facilitated field work in the North and East Kimberley. Tom Vigilante of Bush Heritage, Robert Warren and Bevan Stott of Wunambal Gaambera AC, Jeffrey Brown (Senior), Jeffrey Brown (Junior) of Gnarla, Margaret Rose of Nyangumarta, Rhys Swain and Ewan Noakes of KaraJarri, Mark Rothery and Albert Wiggan of Nyul Nyul, Damon Pyke and Phillip McCarthy of Bardi Jawi, Jarrad Holmes of Dambimangarri, Thomas Grounds, James Birch, and Tom Nagle of Balanggarra, and Daniel Oades of Kimberley Land Council, facilitated field work across the West and East Kimberley ranger groups. Darryl Moncreif and Amanda Moncreif were instrumental in ensuring links were made between this WAMSI project and the Kimberley Science Strategy activities.All specimen collections and animal ethics approvals were conducted under permit SC001352 to Scott Whiting- DBCA.

Marine Turtles
Kimberley Marine Research Program | Project 1.2.2
Contents EXECUTIVE SUMMARY ...................................................................................................................................... I
IMPLICATIONS FOR MANAGEMENT ................................................................................................................. II
KEY RESIDUAL KNOWLEDGE GAPS AND FUTURE WORK .................................................................................. III
CHAPTER 1- OVERVIEW:-BACKGROUND AND IMPLEMENTATION OF THE WAMSI KIMBERLEY NODE TURTLE PROJECT ........................................................................................................................................................... 1
1. INTRODUCTION ........................................................................................................................................ 1
1.1 KIMBERLEY MARINE TURTLE PROJECT DEVELOPMENT ......................................................................................... 1 1.2 AIMS/RESEARCH QUESTIONS: ........................................................................................................................ 2
2. PROJECT IMPLEMENTATION ..................................................................................................................... 2
2.1 PARTNERS ................................................................................................................................................... 2 2.2 PLANNING AND ENGAGEMENT PROCESSES ........................................................................................................ 2
3. KNOWLEDGE UPTAKE AND COMMUNICATION OUTPUTS ......................................................................... 2
3.1 KEY METHODS FOR UPTAKE OF KNOWLEDGE ..................................................................................................... 2 3.2 KNOCK-ON OPPORTUNITIES CREATED FROM TURTLE PROJECT ............................................................................... 4 3.3 COMMUNICATION OUTPUTS .......................................................................................................................... 5 3.4 ADDRESSING ORIGINAL RESEARCH QUESTIONS .................................................................................................. 5
4. REFERENCES ........................................................................................................................................... 10
CHAPTER 2: DISTRIBUTION AND ABUNDANCE OF NESTING MARINE TURTLES IN THE KIMBERLEY: PAIRING THE LANDSCAPE AND LOCAL PERSPECTIVES. .................................................................................................. 11
EXECUTIVE SUMMARY ................................................................................................................................... 11
INTRODUCTION ...................................................................................................................................... 12
1.1 PRE- WAMSI KNOWLEDGE OF KIMBERLEY TURTLE STOCKS ................................................................................ 12 1.2 KIMBERLEY MARINE TURTLE STOCKS-CURRENT STATUS ....................................................................................... 13
1.2.1 Green turtles .................................................................................................................................. 13 1.2.2 Flatback turtles .............................................................................................................................. 13 1.2.3 Hawksbill turtles ............................................................................................................................ 14 1.2.4 Olive ridley turtles ......................................................................................................................... 14 1.2.5 Loggerhead turtles ........................................................................................................................ 14 1.2.6 Leatherback turtles ....................................................................................................................... 14
2 MATERIALS AND METHODS .................................................................................................................... 15
2.1 BACKGROUND ........................................................................................................................................... 15 2.2 LOCATIONS DISTILLED FROM PRE-WAMSI SURVEYS .......................................................................................... 16 2.3 PREDICTIVE MODELLING (GIS) OF POTENTIAL BEACHES ...................................................................................... 16 2.4 FLIGHT PATH PLANNING-EFFICIENTLY CONNECTING THE SANDY PIXELS (BEACHES) ................................................... 16 2.5 IMAGE CAPTURE- OVERFLIGHTS IN SUMMER AND WINTER FOR GEOREFERENCED IMAGES .......................................... 16 2.6 IMAGE REVIEW, ANNOTATION, CLASSIFICATION, QUANTIFICATION ........................................................................ 18 2.7 GROUND TRUTHING COORDINATED WITH ESTABLISHED RANGER GROUPS (11 GROUPS) ............................................ 19 2.8 GIS PRODUCTS .......................................................................................................................................... 20
3 RESULTS .................................................................................................................................................. 21
3.1 COVERAGE AND TRACK DETERMINATION ......................................................................................................... 21 3.2 WINTER NESTING ....................................................................................................................................... 22 3.3 SUMMER NESTING ...................................................................................................................................... 23 3.4 ON-GROUND SURVEYS ................................................................................................................................ 25 3.5 COMMON, UNCOMMON, AND ABSENT NESTING ............................................................................................... 25
Marine Turtles
Kimberley Marine Research Program | Project 1.2.2
4 DISCUSSION AND CONCLUSIONS ............................................................................................................ 25
4.1 MANAGEMENT RELEVANCE-LOCAL AND LANDSCAPE NEEDS ................................................................................ 25 4.2 MANAGEMENT RELEVANCE- DINGO PREDATION ON THE MAINLAND ..................................................................... 26 4.3 MANAGEMENT RELEVANCE-BIGGER PICTURE ON POPULATION PRESSURES ............................................................. 26 4.4 PRIORITIZING MONITORING EFFORT ............................................................................................................... 26 4.5 FUTURE MONITORING-SCALED AERIAL SURVEYS ............................................................................................... 30 4.6 FUTURE MONITORING-NEW SITES .................................................................................................................. 30 4.7 INDEX SITE RECOMMENDATIONS .................................................................................................................... 31
5 REFERENCES ........................................................................................................................................... 32
6 ACKNOWLEDGMENTS ............................................................................................................................. 34
CHAPTER 3 – GENETIC STOCK IDENTIFICATION OF TURTLES IN THE KIMBERLEY ............................................. 35
EXECUTIVE SUMMARY ................................................................................................................................... 35
FLATBACK TURTLES ................................................................................................................................................. 35 GREEN TURTLES ..................................................................................................................................................... 35 KEY RESIDUAL KNOWLEDGE GAPS .............................................................................................................................. 36
1 INTRODUCTION ...................................................................................................................................... 37
2 MATERIALS AND METHODS .................................................................................................................... 37
2.1 SAMPLING ................................................................................................................................................ 37 2.2 DNA EXTRACTION ...................................................................................................................................... 40 2.3 REDUCED REPRESENTATION SNP GENOTYPING ................................................................................................ 40 2.4 SNP CALLING ............................................................................................................................................ 40 2.5 SNP QUALITY CONTROL FILTERING ................................................................................................................ 40 2.6 LOCUS SELECTION ...................................................................................................................................... 40 2.7 DESCRIPTIVE STATISTICS .............................................................................................................................. 41 2.8 GENETIC SUB-DIVISION ............................................................................................................................... 41 2.9 MODEL-BASED CLUSTERING ANALYSIS ............................................................................................................ 41 2.10 ISOLATION BY DISTANCE .............................................................................................................................. 41
3 RESULTS .................................................................................................................................................. 42
3.1 DESCRIPTIVE STATISTICS NATATOR DEPRESSUS ................................................................................................. 42 3.2 DESCRIPTIVE STATISTICS CHELONIA MYDAS ...................................................................................................... 43 3.3 GENETIC SUBDIVISION IN NATATOR DEPRESSUS ................................................................................................ 43 3.4 GENETIC SUBDIVISION IN CHELONIA MYDAS ..................................................................................................... 44 3.5 CLUSTERING ANALYSIS IN NATATOR DEPRESSUS ................................................................................................ 46 3.6 CLUSTERING ANALYSIS IN CHELONIA MYDAS ..................................................................................................... 47 3.7 ISOLATION BY DISTANCE IN N. DEPRESSUS ....................................................................................................... 49 3.8 ISOLATION BY DISTANCE IN C. MYDAS ............................................................................................................. 50
4 DISCUSSION AND CONCLUSIONS ............................................................................................................ 51
5 REFERENCES ........................................................................................................................................... 53
CHAPTER 4 – CLIMATE CHANGE ..................................................................................................................... 55
EXECUTIVE SUMMARY ................................................................................................................................... 55
INTRODUCTION ...................................................................................................................................... 56
2 MATERIALS AND METHODS .................................................................................................................... 58
2.1 RESOLUTION AND COMPARISON OF TSD PARAMETERS....................................................................................... 60 2.2 FITTING NONLINEAR DEVELOPMENT RATE FUNCTIONS FOR EACH POPULATION ........................................................ 61 2.3 SEX-RATIO AND MORTALITY PREDICTIONS UNDER CLIMATE CHANGE ...................................................................... 67
3 RESULTS .................................................................................................................................................. 67
3.1 PIVOTAL TEMPERATURE AND TRANSITIONAL RANGE OF TEMPERATURES ................................................................. 67
Marine Turtles
Kimberley Marine Research Program | Project 1.2.2
3.2 DEVELOPMENT RATE ................................................................................................................................... 68 3.3 THERMAL ENVIRONMENTS OF KIMBERLEY BEACHES ........................................................................................... 68 3.4 SEX-RATIOS AND EMBRYONIC MORTALITY AT FIVE KIMBERLEY MARINE TURTLE ROOKERIES ........................................ 69
4 DISCUSSION AND CONCLUSIONS ............................................................................................................ 79
4.1 VARIATION IN PHYSIOLOGICAL PARAMETERS .................................................................................................... 79 Sex ratios and development rates ................................................................................................. 79 Comparisons with other populations ............................................................................................ 80
4.2 PERFORMANCE OF THE MICROCLIMATE MODEL ................................................................................................ 80 4.3 THERMAL ENVIRONMENTS OF BEACHES........................................................................................................... 81 4.4 IMPACT OF CLIMATE CHANGE ON SEX RATIOS AND MORTALITY ............................................................................. 81
5 REFERENCES ........................................................................................................................................... 82
6 ACKNOWLEDGEMENTS ........................................................................................................................... 85
CHAPTER 5: INDIGENOUS ENGAGEMENT, COLLABORATION AND KNOWLEDGE EXCHANGE FOR THE KIMBERLEY NODE TURTLE PROJECT ............................................................................................................... 86
EXECUTIVE SUMMARY ................................................................................................................................... 86
1 INTRODUCTION ...................................................................................................................................... 87
2 AIMS ....................................................................................................................................................... 87
3 INDIGENOUS ENGAGEMENT ................................................................................................................... 87
4 SUMMARY OF ACTIVITIES AND SHARED KNOWLEDGE ............................................................................ 89
5 DISCUSSION AND CONCLUSIONS ............................................................................................................ 91
6 REFERENCES ........................................................................................................................................... 92
7 APPENDICES ........................................................................................................................................... 93
Marine Turtles
Kimberley Marine Research Program | Project 1.2.2
Marine Turtles
Kimberley Marine Research Program | Project 1.2.2 i
Executive Summary
Overview (Chapter 1)
The Kimberley coast remains a region of inadequate knowledge to understand the status of regional marine turtle stocks that face multiple contemporary pressures such as climate change, marine debris, coastal development and increasing visitation.
Existing knowledge reveals scattered information on the distribution and relative abundance of nesting turtles indicating that a systematic survey all sandy beaches for nesting turtles was required for a regional understanding. The spatial and temporal distribtion of nesitng is the minimum knowledge required to understand the impact of pressures and highlight key locations for management and ongoing monitoring. Previous genetic studies indicate multiple genetic stocks of marine turtles throughout Australian and south-east Asia with major sampling gaps in the Kimberley region resulting in unknown boundaries. It is recognised that within the Kimberley the endemic flatback turtle has summer nesting in the west and winter nesting in the east, yet it remains unknown if that pattern reflects incubation physiology determined by thermal conditions or different genetic stocks. The most widespread and influential pressure facing turtles in the Kimberley is climate change. Increased temperatures can skew sex ratios to predominately female, increase embryo mortality and potentially shift the distribution of nesting. Traditional and local knowledge is critical to comprehensive understanding of the environment and it is recognised that there is already existing turtle knowledge held by traditional onground managers and custodians in the Kimberley. For this reason, engagement, collaboration and joint planning was an important component of this project.
These major gaps of knowledge led to the development of four primary omponents in the WAMSI turtle study: 1) to map the distribution of nesting beaches across the Kimberley in space and time; 2) define nesting stocks of green and flatback turtles: 3) develop understanding of their thermal biology and the implications of climate change and 4) ensure Indigenous involvement through engagement, employment, participation, planning and training.
Distribution and Abundance (Chapter 2):
Near complete coverage of the Kimberley islands and coast was achieved in an aerial survey over eight to nine flight days for summer nesting season and again for winter nesting season in 2014. We captured >44,000 georeferenced aerial images to analyse and annotate with classifications of terrain type, and to quantify the visual evidence of crawl tracks or nesting depressions (body pits). These provided guidance for later verification by ground truth patrols in accessible areas. A GIS classification gave a priority ranking of turtle rookery beaches across the Kimberley. This information provided complimentary information to Traditional Owners about important turtle areas within their local areas and Indigenous Protected Areas (IPAs) and provided managers an overview of priority beaches for future study and monitoring.
Genetic studies (Chapter 3)
The Kimberley represents a major gap in understanding of population genetics of Australian marine turtles across the Kimberley bioregion partly due to the remoteness of nesting beaches. We planned and conducted field surveys to systematically sample these populations by dedicated field trips and opportunistic field samples. Rookeries are typically a focus of studies to determine breeding stocks whereas foraging grounds are a focus for mixed stocks analysis where multiple widely distributed turtle stocks can share feeding grounds. Sampling efforts are ongoing but sufficient samples have been collected from West Kimberley and East Kimberley flatback turtle rookeries and green turtles from the western Kimberley. The team sampled a strategic selection of field sites that included West Kimberley (summer flatbacks, summer greens), Northwest Kimberley (putative boundary for summer to winter flatbacks, summer greens), North Kimberley (winter flatbacks, winter greens, summer greens), and East Kimberly (winter flatbacks). The study aims were (1) to clarify genetically discrete population boundaries (= management units) for marine turtles in the Kimberley, (2), to identify any stock with breeding sites spanning state or regional boundaries, (3) to identify genetic markers unique to different management units and apply these to analyse the stock composition of turtles in harvest or feeding grounds.
Climate Change and thermal studies (Chapter 4)
Selected beaches were sampled for a thermal profile for green turtles and flatback turtles, with focus on summer

Marine Turtles
ii Kimberley Marine Research Program | Project 1.2.2
and winter nesting seasons for flatbacks that overlap with green turtles. Fresh eggs were collected and transported to the UWA laboratory to determine incubation conditions for sex determination and sex ratios. Portable weather stations installed at five beaches spanning the Kimberley recorded regional climate data that influence field incubation. Multiple thermal data-loggers at a strategic selection of field sites that included Eighty Mile Beach (summer flatbacks), Lacepede Islands (summer flatbacks, summer greens, winter greens), Deception Bay (winter flatbacks, summer greens), West Governor Island (winter flatbacks), King Sound (winter flatbacks), Cassini Island (winter flatbacks, unconfirmed summer flatbacks, winter greens, summer greens), and Cape Domett (winter flatbacks).These data enable the development of predictive numerical models to forecast future incubation conditions under changing climate conditions and the potential effects on sex ratios and mortality.
Traditional Knowledge (Chapter 5)
We planned and budgeted for Indigenous engagement, participation and employment in the project from the beginning. We met independently and repeatedly with eleven Traditional Owner (TO) groups over four years that host significant turtle resources across the Kimberley coast and offshore islands. We made dedicated planning trips prior to any field work to ensure that shared goals could be achieved.
We learned of traditional knowledge within groups and reciprocated by sharing results from a scientific overview. Educational products have included posters, seminars, and support of TO participation in national and regional conferences.
A central aim of all field trips was knowledge exchange with rangers and TOs and delivery of hands-on training in marine turtle techniques to build capacity for ranger groups for ongoing monitoring opportunities. We worked on turtle species identification, both in the water - from visual or behavioural characteristics - and on land - from beach track patterns, depth of body pits excavations and nest placement in relation to vegetation and dune crest. Other techniques practiced included how to excavate nests, evaluate hatching success by sorting hatched shells and undeveloped eggs, examine live or dead hatchlings, and record on data sheet.
The rangers shared cultural background about the coast and islands and relevant information from their previous experiences on their country.
Implications for management
The four components of this project identified key information with management implications.
The nesting turtle distribution component of the project revealed widespread marine turtle nesting across the Kimberley with species and seasonal differences. This information has already been used in the Kimberley Marine Park Planning process and will continue to be used during document review processes. This spatial and relative density information is extremely important for any proposed activities in the Kimberley including coastal development. The information was also widely distributed to local Indigenous groups and provides local and regional context to support local management. Surveys of places of known high management value which included summer nesting green turtles at the Lacepede Islands, summer nesting flatback turtles at Eighty Mile Beach, and winter nesting flatbacks at Cape Domett reiterated their previously known importance. These places plus many additional sites become priorities when planning future work or long-term monitoring. The Cape Domett and Eighty Mile Beach flatback rookeries are managed in conjunction with adjacent Marine Park Management Plans and have been monitored annually since 2006. The Lacepede Islands were surveyed annually between 1987-2002.
The genetic component of the project defined flatback and green turtle stocks in the Kimberley. Stocks are the key unit used for management in Australia and guided by the Recovery Plan for Marine Turtles in Australia. For flatback turtles six regions were differentiated from one another based on rookeries sampled from the Pilbara region, 80 Mile Beach, Eco Beach, King Sound, northwest Kimberley and northeast Kimberley. The degree of differentiation among these stocks indicates that genetic exchange is limited which supports the current management of managing turtles at a stock level. Green turtle samples were reanalysed with additional samples and the results confirm previous findings that there is genetic exchange among green turtle rookeries along coastal parts of Western Australia, but little exchange among offshore atolls, or between offshore and coastal rookeries. Nevertheless, exchange is not complete, indicating that Pilbara and Kimberley rookeries have a degree of demographic independence. Genetic affinities with Cassini Island are unclear due to a small sample size.

Marine Turtles
Kimberley Marine Research Program | Project 1.2.2 iii
Previously identified management units that were based on mtDNA were supported by the SNP data set.
The climate change impact component showed marked variation in the temperatures of beaches used for nesting by marine turtles in the Kimberley region and highlights the need for managers to manage populations at the level of individual rookeries. At a regional scale, retaining resilience is a key strategy, which can be achieved by protecting a broad nesting distribution across all habitat types, latitudinal ranges and including mainland and island rookeries. Localised management for female-biased sex-ratios and high mortality at particular nesting beaches could include artificial shading of natural nests (via shade cloth or vegetation plantings), or relocation of egg clutches to cooler sites or beaches. However, before such interventions are undertaken it will be prudent to collect further empirical data on the sex ratios of turtles hatching at major rookeries.
Two-way knowledge and the merging of western science, Traditional knowledge and local knowledge is essential for continuing to improve our understanding of marine turtles across the Kimberley. The WAMSI turtle project provides a substantial increase in knowledge but future projects and long-term monitoring are key for ongoing management.
Key residual knowledge gaps and future work
The following summarises key knowledge gaps and potential for future work in each component of this project.
The turtle distribution component was spatially comprehensive but restricted to two time periods: January and August. This means that we potentially have gaps for nesting populations where the nesting peak falls outside of this period. This is likely to be true for hawksbill turtles which have been observed in the Pilbara and the Northern Territory nesting in the spring. Future hawksbill surveys should be more spatially restricted to the region of Jones Island and Vansittart Bay in Wunambal Gaambera country and Sir Graham Moore Island and Scorpion island in Balanggara Country. Track evidence of nesting hawksbill turtles was observed through onground surveys in Vansittart Bay but samples should be acquired for genetic analysis to enable these turtles to be assigned to a stock. The survey flights did not collect data on the sparse olive ridley nesting known to occur in Dambimangari Country. Future olive ridley surveys should be incorporated into boat or aerial Marine Park surveys of Camden Sound with particular emphasis on Deception Bay and Smokey Bay increase our understanding of this species. Although not part of the WAMSI distribution and abundance study; we offer observations of potential population threats that need better quantification and include dingo and goanna predation on mainland populations and levels of marine debris.
The genetics component of the project indicated that future additional sampling and genetic analyses of flatback turtles across the Northern Kimberley using mitochondrial DNA could help clarify the boundaries between King Sound, NW and NE Kimberley populations. For green turtles, additional sampling of rookeries in the north Kimberley is needed to complete our understanding of genetic affinities. However, there is enough independence of the Pilbara and Kimberley green turtles to warrant them being managed as different stocks. Future research should focus on identifying the origins of turtles at foraging grounds around Western Australia, whether through genetic mixed stock analysis or through the analysis of telemetry data where sampling of foraging grounds is not possible.
The climate change component identified that future management should focus on regular monitoring of sand temperatures at selected beaches alongside periodic measurement of the sex ratios and hatching success of nests, to further validate the predictive models developed in this project. The models can then be used to evaluate the impact of management options, and to identify the rookeries that are most likely to be key recruitment sites under warmer future climates. Under extreme warming scenarios, these key sites could be much further south than the current nesting distribution.
Traditional knowledge is key to future research and management. Future research and management projects should be conducted collaboratively with agreed objectives, implementation activities and outputs. Consideration should be given to how new knowledge can be integrated into management after project completion. Regional scale objectives should be considered, and projects developed that can provide regional scale and turtle stock relevant indicators of population condition. The WAMSI Turtle project allocated funds from the beginning to include Indigenous participation and collaboration. Left over funds for this component were transferred to Kimberley Saltwater Science Project (changed to Indigenous Saltwater Advisory Group) to ensure that discussions, planning and implementation of turtle projects continues beyond WAMSI Kimberley Node.
Marine Turtles
iv Kimberley Marine Research Program | Project 1.2.2
Marine Turtles
Kimberley Marine Research Program | Project 1.2.2 1
Chapter 1- Overview:-background and implementation of the WAMSI Kimberley Node Turtle Project
Scott Whiting 1,2 , Tony Tucker 1,2, Kelly Pendoley 3, Nicki Mitchell1,4, Blair Bentley1, 4, Oliver Berry1,5, Nancy Fitzsimmons1,6 1 Western Australian Marine Science Institution, Perth, Western Australia 2 Marine Science Program, Department of Parks and Wildlife, Perth, Western Australia 3 Pendoley Environmental, Perth, Western Australia 4 University of Western Australian Marine Science Institution, Perth, Western Australia 5 CSIRO Coastal Ecosystems and Modeling, Floreat, Western Australia 6 Griffith University, Brisbane, Queensland
1. Introduction
Marine turtles are of significant value to a wide cross section of stakeholders throughout the community, with these values extending to those with no indirect contact, or irregular interactions with turtles (Campbell 2002). Turtles have high intrinsic values similar to those bestowed on other wildlife and megafauna (Catlin et al 2013 ) and this iconic status is the reason they are often used as flagships for marine conservation and management. Coastal Aboriginal people in northern Australia have a deep, complex and significant connection with marine turtles which makes them highly valued for cultural, spiritual, and subsistence reasons (O’Conner 1999 ). They are used for food, represented in rock art and stories and are part of the natural world to which traditional owners are custodians. These high values are represented in saltwater country plans by Indigenous groups across the Kimberley (Kimberley Land Council 2010, Wunambal Gaambera Aboriginal Corporation 2010, Balanggarra Aboriginal Corporation 2011, Dambimangari Aboriginal Corporation 2012, Bardi Jawi Niimidiman Aboriginal Corporation 2013, KaraJarri Traditional Lands Association 2014 ). For other stakeholders, turtles hold other values. For some, turtles hold economic values by attracting tourists and visitors to an area, e.g. rookeries at Mon Repos in Queensland (Tidsell and Wilson 2001) and Exmouth in Western Australia (Ningaloo Turtle Program). All turtles have high conservation values and are all listed on the IUCN Red List as Vulnerable, Endangered or Critically Endangered, except the flatback which is listed as Data Deficient. They are also protected under the Convention on the Conservation of Migratory Species of Wild Animals (CMS) and the Convention of International Trade in Endangered Species of Wild Fauna and Flora (CITES). All species that inhabit Australian waters are listed as threatened under the Commonwealth’s Environment and Biodiversity Conservation Act 1999 and under Western Australia’s Biodiversity Conservation Act 2016. This high conservation value often relates to high political value which often makes them a priority for management actions. Turtles rank highly under the Ecosystem Service concept defined in the Millennium Ecosystem Assessment (2005) with turtles providing three of the four services: Supporting services (nutrient recycling), Provisioning (food) and Cultural Services including culture (stories, art), spiritual (religion, natural value), recreational (tourism) (Troëng and Drews, 2004) and science and education.
All in all, these highly diverse values mean that marine turtles are prioritised for management and conservation actions.
1.1 Kimberley Marine Turtle Project Development
The Kimberley Marine Turtle Project was developed and shaped by the existing knowledge and knowledge gaps described in the following chapters.
Scattered information on the distribution and relative abundance of nesting from various sources meant that a regional approach of systematically surveying all sandy beaches for nesting turtles would provide a regional scale understanding of nesting for the Kimberley. The location of nesting beaches and the relative abundance of nesting turtles is the basic level of information required to assess the potential impact of pressures and highlight key locations for management. Sampling at multiple rookeries allows connectivity to be explored through genetic analyses and ultimately define the genetic stocks or management units. Previous genetic studies confirm that multiple genetic management units of marine turtles occur throughout Australian and south-east Asia with major sampling gaps in the Kimberley region resulting in unknown boundaries. It is recognised that within the Kimberley the endemic flatback turtle displays summer nesting in the west and winter nesting in the east, yet it remains unknown if that pattern reflects incubation physiology determined by thermal conditions or different genetic
Marine Turtles
2 Kimberley Marine Research Program | Project 1.2.2
stocks. The most widespread and influential pressure facing turtles in the Kimberley is climate change. Increased temperatures can skew sex ratios to predominately female, increase embryo mortality and potentially shift the distribution of nesting spatially or seasonally. It is recognised that there is already existing knowledge held by traditional onground managers and custodians in the Kimberley. For this reason, engagement, collaboration, joint planning and employment was an important component of this project.
These major gaps of knowledge frame four primary components of the WAMSI turtle study: 1) to map the distribution of nesting beaches in space and time; 2) define nesting stocks of green and flatback turtles: 3) develop an understanding of their thermal biology and the implications of climate change and 4) ensure Indigenous involvement through engagement, employment, participation, planning and training.
1.2 Aims/Research Questions:
The aims of the project were:
• Determine distribution, abundance, seasonality, and the duration and peak of nesting season for Kimberley marine turtles;
• Collect biological information on key population parameters from key nesting beaches; • Clarify stock management units and identify connectivity to foraging areas using genetic markers; • Select beaches and techniques to allow long term monitoring and trend detection; • Investigate critical physiological thresholds of embryos that can be used to predict the impact of climate
change on population viability; and • Develop systems for cross cultural transfer of knowledge (integration with other themes), participation
and training. • Integrate existing on ground works by community groups
2. Project Implementation
2.1 Partners
The WAMSI partners in this project where Department of Biodiversity, Conservation and Attractions (DBCA), University of Western Australia and CSIRO. Additional partners were sought in areas where additional scientific skills were required and included Griffith University (genetics) and Pendoley Environmental (aerial survey). Collaboration with Indigenous managers and custodians included: Miriuwong Gajerrong, Dambimangarri, Nyangumarta, Ngarla, Nyul Nyul, Bardi Jawi, Wunambal Gaambera, Balanggarra, KaraJarri and Yawuru. A partnership with Conservation Volunteers Australia was formed with DBCA beyond the life of WAMSI to continue monitoring turtles at Eco Beach on Yawuru country.
2.2 Planning and Engagement processes
Collaboration with Indigenous Owners was an important part of this project from the beginning with further details included in Chapter 5. Face to face project planning meetings were initially conducted across the Kimberley and included the district offices of DBCA at Broome and Kununurra and several of the Indigenous groups. We engaged with the Kimberley Land Council through the Research Ethics and Access Committee (REAC) to ensure that all formal engagement processes were in place. Standard Animal Ethics and Wildlife Permits were obtained as standard protocol. Multiple meetings with DBCA planners were also conducted to ensure that information collected for this project was relevant to the Kimberley Marine Park Planning process.
3. Knowledge Uptake and Communication Outputs
3.1 Key methods for uptake of Knowledge
Ensuring knowledge uptake of the project results to management was a key driver for all WAMSI projects and the Turtle Project attempted to achieve through many processes (see Table 1.1). During the term of this project the Marine Turtle Recovery Plan for Australia (Department of Environment and Conservation 2011) was being developed by the Commonwealth Department of Environment and Energy using consultation with a group of
Marine Turtles
Kimberley Marine Research Program | Project 1.2.2 3
experts from across the country. The WAMSI project provided advice into this process through three members who were WAMSI project partners which ensured that current knowledge obtained from the WAMSI project was input into the final recovery plan released in 2017. The Turtle Project also remain in constant contact with the DBCA marine park planning team to ensure up to date knowledge was available for the Kimberley Marine Park planning process (DBCA 2013, DBCA 2014, DBCA 2016a, b,c). Other DBCA turtle projects were kept informed of the WAMSI turtle Project which ensured there was transfer of information between projects such as Cable Beach flatback turtles, Eighty Mile Beach turtle surveys and tracking project, Cape Domett flatback project and the WA Turtle Stranding program. Close links with the Kimberley Conservation Strategy during the project ensured that efficiencies were gained, especially through Indigenous training (DBCA 2011). The Northwest Shelf Flatback Turtle Conservation Program (DBCA) co-funding provided to this project enabled this program to deliver on a turtle information on a Kimberley-wide scale (DBCA 2017). This partnership allowed objectives of both projects to be met but also allowed easy knowledge transfer. Two-way knowledge transfer between this project and Indigenous collaborators provided mutual benefit. For the project it meant broader and deeper knowledge of the Kimberley to plan and interpret survey information and for the Indigenous managers it filled gaps in their existing knowledge and provided a regional context. On-ground training built capacity for current and future projects. Ongoing relationships between the WAMSI Turtle project and KISSP (now ISWAG) means that the turtle project will continue to have a legacy in the Kimberley. During the project information was shared between other WAMSI Kimberley projects to ensure integration and efficiencies were achieved (see Table 1.2). This information exchange led to an agreement that DBCA NWSFTCP could co-fund the WAMSI Benthic Biodiversity Project to deliver additional habitat information for flatback turtles. The WASMI Turtle Project results will also delivery information in a wider context via the Australian Government to the Indian Ocean and South East Asia Sea Turtle MOU and to the IUCN marine turtle specialist group via current individual membership. Knowledge transfer direct to the science community was also achieved through communication outputs including peer reviewed publications and numerous presentations.
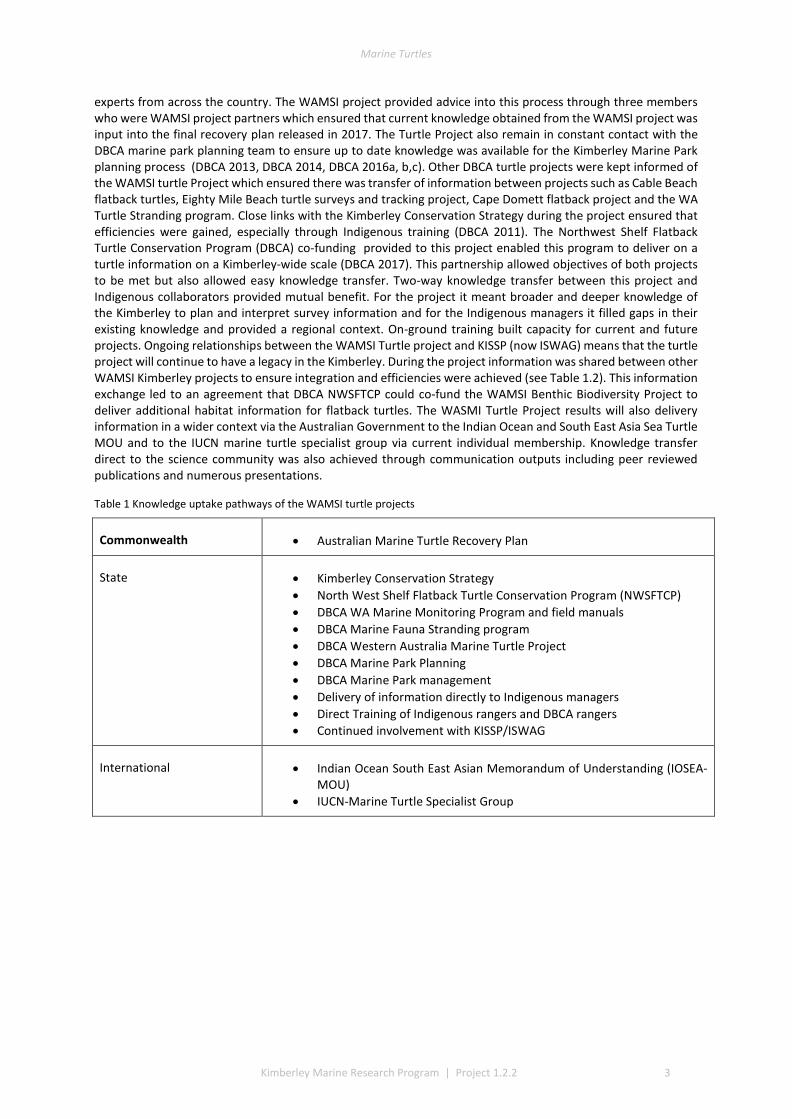
Table 1 Knowledge uptake pathways of the WAMSI turtle projects
Commonwealth • Australian Marine Turtle Recovery Plan
State • Kimberley Conservation Strategy • North West Shelf Flatback Turtle Conservation Program (NWSFTCP) • DBCA WA Marine Monitoring Program and field manuals • DBCA Marine Fauna Stranding program • DBCA Western Australia Marine Turtle Project • DBCA Marine Park Planning • DBCA Marine Park management • Delivery of information directly to Indigenous managers • Direct Training of Indigenous rangers and DBCA rangers • Continued involvement with KISSP/ISWAG
International • Indian Ocean South East Asian Memorandum of Understanding (IOSEA-MOU)
• IUCN-Marine Turtle Specialist Group
Marine Turtles
4 Kimberley Marine Research Program | Project 1.2.2
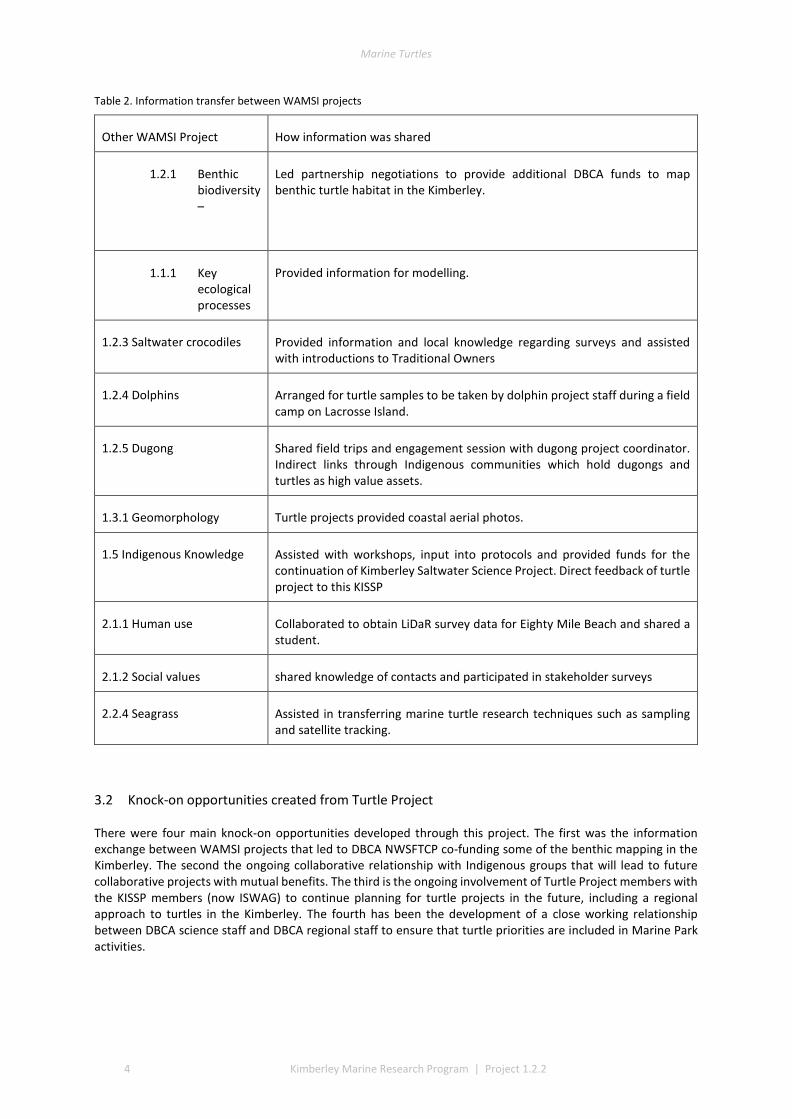
Table 2. Information transfer between WAMSI projects
Other WAMSI Project How information was shared
1.2.1 Benthic biodiversity –
Led partnership negotiations to provide additional DBCA funds to map benthic turtle habitat in the Kimberley.
1.1.1 Key ecological processes
Provided information for modelling.
1.2.3 Saltwater crocodiles Provided information and local knowledge regarding surveys and assisted with introductions to Traditional Owners
1.2.4 Dolphins Arranged for turtle samples to be taken by dolphin project staff during a field camp on Lacrosse Island.
1.2.5 Dugong Shared field trips and engagement session with dugong project coordinator. Indirect links through Indigenous communities which hold dugongs and turtles as high value assets.
1.3.1 Geomorphology Turtle projects provided coastal aerial photos.
1.5 Indigenous Knowledge Assisted with workshops, input into protocols and provided funds for the continuation of Kimberley Saltwater Science Project. Direct feedback of turtle project to this KISSP
2.1.1 Human use Collaborated to obtain LiDaR survey data for Eighty Mile Beach and shared a student.
2.1.2 Social values shared knowledge of contacts and participated in stakeholder surveys
2.2.4 Seagrass Assisted in transferring marine turtle research techniques such as sampling and satellite tracking.
3.2 Knock-on opportunities created from Turtle Project
There were four main knock-on opportunities developed through this project. The first was the information exchange between WAMSI projects that led to DBCA NWSFTCP co-funding some of the benthic mapping in the Kimberley. The second the ongoing collaborative relationship with Indigenous groups that will lead to future collaborative projects with mutual benefits. The third is the ongoing involvement of Turtle Project members with the KISSP members (now ISWAG) to continue planning for turtle projects in the future, including a regional approach to turtles in the Kimberley. The fourth has been the development of a close working relationship between DBCA science staff and DBCA regional staff to ensure that turtle priorities are included in Marine Park activities.
Marine Turtles
Kimberley Marine Research Program | Project 1.2.2 5
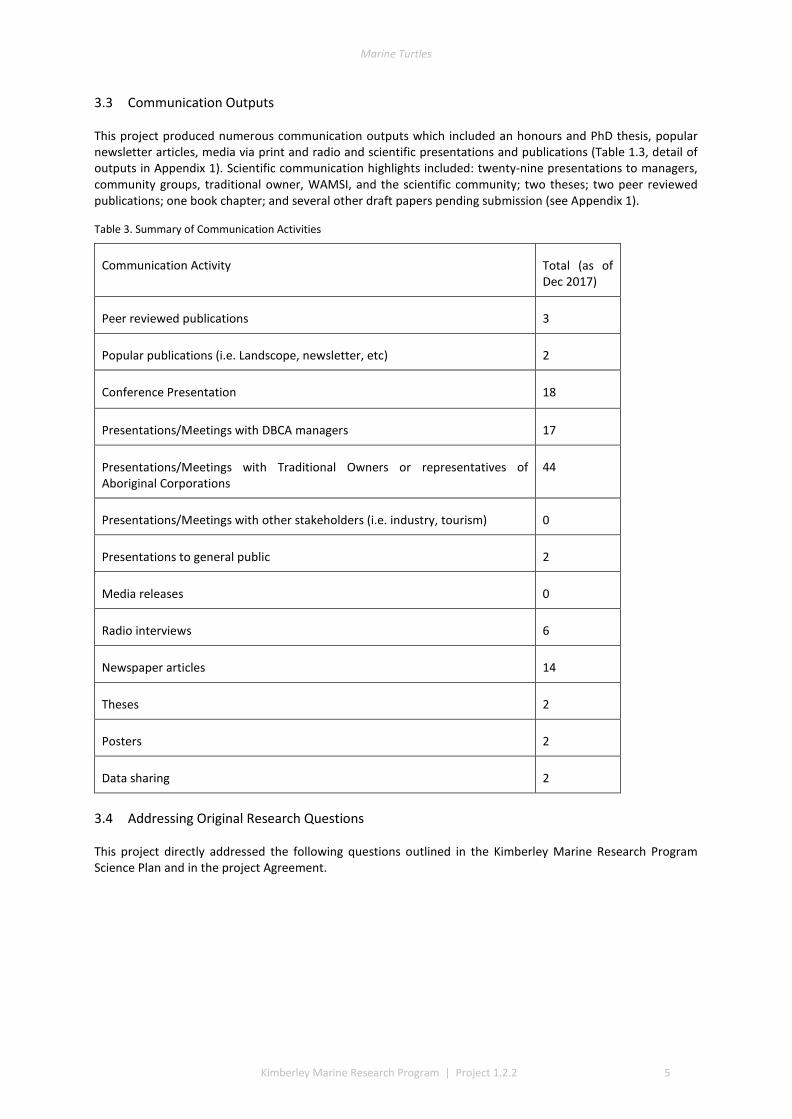
3.3 Communication Outputs
This project produced numerous communication outputs which included an honours and PhD thesis, popular newsletter articles, media via print and radio and scientific presentations and publications (Table 1.3, detail of outputs in Appendix 1). Scientific communication highlights included: twenty-nine presentations to managers, community groups, traditional owner, WAMSI, and the scientific community; two theses; two peer reviewed publications; one book chapter; and several other draft papers pending submission (see Appendix 1).
Table 3. Summary of Communication Activities
Communication Activity Total (as of Dec 2017)
Peer reviewed publications 3
Popular publications (i.e. Landscope, newsletter, etc) 2
Conference Presentation 18
Presentations/Meetings with DBCA managers 17
Presentations/Meetings with Traditional Owners or representatives of Aboriginal Corporations
44
Presentations/Meetings with other stakeholders (i.e. industry, tourism) 0
Presentations to general public 2
Media releases 0
Radio interviews 6
Newspaper articles 14
Theses 2
Posters 2
Data sharing 2
3.4 Addressing Original Research Questions
This project directly addressed the following questions outlined in the Kimberley Marine Research Program Science Plan and in the project Agreement.

Marine Turtles
6 Kimberley Marine Research Program | Project 1.2.2
Table 4. Responses to original questions
Key Questions
Informed Responses
What is the distribution and relative abundance of turtle nesting across the Kimberley?
Flatback turtles nesting is widespread across the islands and mainland beaches east of Dampier Peninsula in winter with Cape Domett supporting the highest densities; summer nesting along Eighty Mile Beach –Wallal Downs and Anna Plains have high-medium density in summer. More than 20+ Kimberley islands have medium-low density.
Green turtles: extensive summer nesting across the Kimberley on ocean facing beaches, but extended nesting season with no clear peak. The Lacepede Islands supports very high density, followed by Maret, Cassini, Parry Island. Sir Graham Moore Island has high-medium density. More than 20+ islands have medium-low density.
Hawksbill turtles: track counts revealed low density nesting in Vansittart Bay including Eclipse Islands. Further local anecdotal evidence for Sir Graham Moore and Scorpion Island. Historical records of Maccassan traders mention tortoiseshell harvested on Jones Island. WAMSI surveys included Mary Island tracks, Troughton carcass of female on land). Hawksbill nesting requires further investigation to place in context with the Northern Territory and Pilbara nesting aggregations.
Olive ridley turtles: sparse nesting by single females, largely April-May. TO knowledge and DBCA records include sparse nesting in Camden Sound at Langii, Darcy Island, Cape Leveque. Olive ridley nesting is sparse in WA at a western distribution margin of a range centred in the Northern Territory at Tiwi Islands or across he Timor Sea in Indonesia.
Loggerhead turtles: no nesting in Kimberley.
Leatherback turtles: no nesting in Kimberley
Where and when do marine turtles use beaches for nesting? (PRI)
Flatback turtles: winter nesting spreads east of Dampier Peninsula; summer nesting spreads west and south of Dampier Peninsula. Cape Domett is high density in winter, Eighty Mile Beach –Wallal and Anna Plains have high-medium density in summer. More than 20+ islands with medium-low density.
Green turtles: low density summer nesting occurs across the Kimberley on ocean facing beaches with an extended nesting season. Lacepede Islands is very high density, followed by Maret, Cassini, Parry Island, Sir Graham Moore at high density. More than 20+ islands have medium-low density.
Hawksbill turtles: Distribution as above with nesting season likely to occur in Austral spring
Olive ridley turtles: sparse nesting by single females, largely April-May. TO knowledge or DBCA records include sparse nesting in Camden Sound at Langii, Darcy Island, Cape Leveque.
Loggerhead turtles: no nesting in Kimberley.
Leatherback turtles: no nesting in Kimberley.
What are the appropriate spatial management units for marine turtles in the Kimberley? (PRI)
Management units are based on genetic stocks which group rookeries that have genetic frequent genetic exchange.
Flatback turtles (5 known): Pilbara summer, Eighty Mile summer (newly identified), Eco Beach summer (newly identified), Maret Island winter (newly identified), Cape Domett winter. Samples in King Sound are not yet

Marine Turtles
Kimberley Marine Research Program | Project 1.2.2 7
analysed. A boundary of summer and winter nesting overlap is on the Dampier Peninsula.
Green turtles: Northwest Shelf, Lacepede Islands (newly identified), Ashmore Reef, Scott-Browse, Cocos
Olive ridley turtles (Western Northern Territory stock)
Hawksbill turtles (East Indian Ocean)
Loggerhead turtles (Southeast Indian Ocean)
Leatherback turtles (unknown, but likely NE Indian Ocean, or W Pacific)
It is important to note that the Kimberley is likely to support foraging turtles of mixed stock and these areas will also include turtles from rookeries outside the Kimberley including international rookeries.
What environmental factors are ‘driving’ the above distribution patterns and population characteristics of nesting turtles in the Kimberley?
This question was beyond the scope of the study so not addressed fully. However, over evolutionary time scales, turtle nesting distribution aligns with those areas that provide good incubating conditions for eggs. For some beaches, turtle nesting patterns have predictable associations of higher activity during spring tides with dark nights to lower activity during neap tides with bright lunar illumination. This has not been tested during this study. With green turtle nesting, there are alternating peaks of high and low nesting seasons driven by oceanic cycles during El Nino conditions with an 18-month time lag, hypothesized to be driven by more and lesser productive periods of sea grass production.
How will nesting turtles in the Kimberley respond to increasing temperatures caused by global climate change?
Global climate change will raise incubation temperatures to unprecedented levels and these changes will have considerable regional variation. Marine turtles in the Kimberley have the potential to respond through both spatial and temporal shifts in nesting. Current summer nesting flatback and green populations may shift nesting to earlier or later in the season to avoid lethal and sex-ratio skewing temperatures. Winter nesting populations have a limited capacity to shift nesting phenology, and climate predictions suggest highly female-skewed sex-ratios and substantial mortality. Response in these populations may require poleward shifting of nesting location, or molecular evolution to ensure persistence.
How are marine turtles connected within and outside the Kimberley (Genetics only)?
This project was not designed to answer this question entirely, but the genetic stock identification from this project allows for links to be made across regional scales. Turtle foraging grounds comprise turtles from multiple stocks (mixed stock) and further sampling of these areas would be required to make connections using genetics. Previous tracking studies and flipper tags returns of green, hawksbill, loggerhead, flatback and olive ridley turtles show that the Kimberley is highly connected to the Pilbara of WA, the Northern Territory, Queensland and Indonesia.
What pressures and impacts from natural or anthropogenic factors are identified in a risk assessment framework on turtle life history stages?
Risk assessments have been conducted for the Marine Parks and the pressures vary across the Kimberley. Natural factors include predation of nests by crabs, dingoes, foxes, and goannas; juveniles by predatory birds, fish or sharks, adults taken by large crocodiles at a beach. Anthropogenic factors vary along the coast with urban centres such as Broome experiencing local pollution, boat strikes and disturbance. Indigenous take of green turtles occurs in some places along the Kimberley but is localised. Turtle eggs are taken opportunistically at some rookeries but the level of take appears small. Anthropogenic factors would usually include light management
Marine Turtles
8 Kimberley Marine Research Program | Project 1.2.2
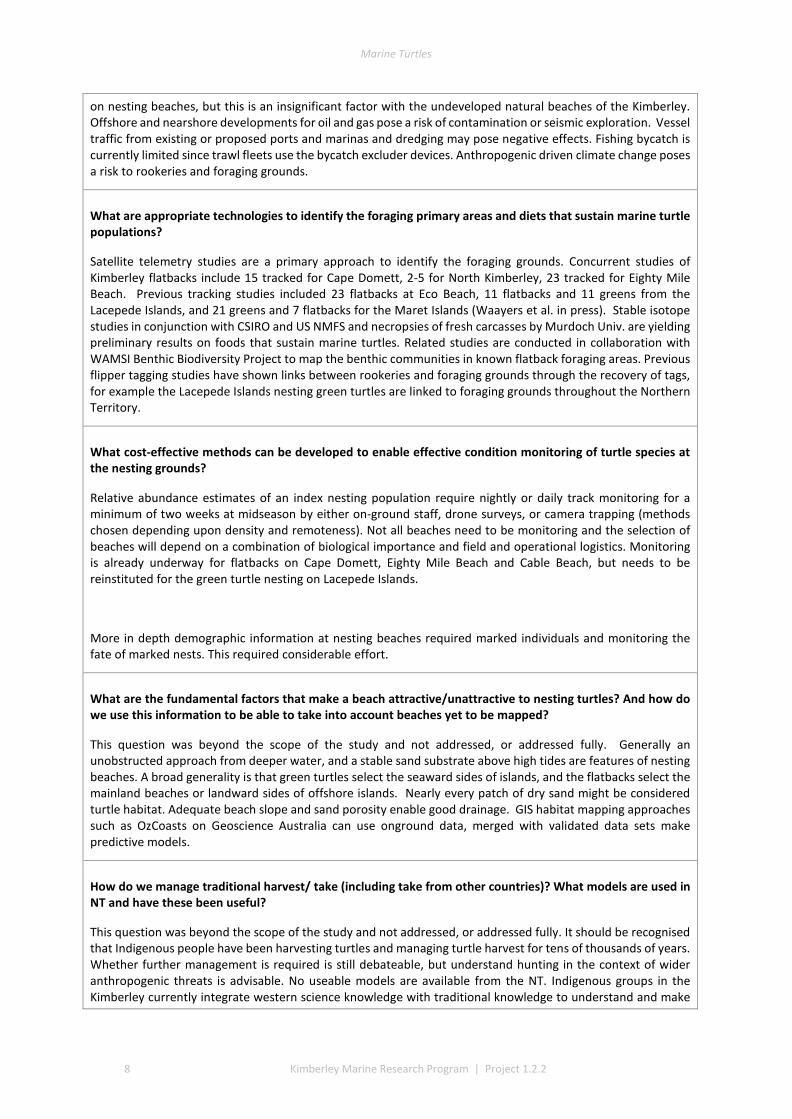
on nesting beaches, but this is an insignificant factor with the undeveloped natural beaches of the Kimberley. Offshore and nearshore developments for oil and gas pose a risk of contamination or seismic exploration. Vessel traffic from existing or proposed ports and marinas and dredging may pose negative effects. Fishing bycatch is currently limited since trawl fleets use the bycatch excluder devices. Anthropogenic driven climate change poses a risk to rookeries and foraging grounds.
What are appropriate technologies to identify the foraging primary areas and diets that sustain marine turtle populations?
Satellite telemetry studies are a primary approach to identify the foraging grounds. Concurrent studies of Kimberley flatbacks include 15 tracked for Cape Domett, 2-5 for North Kimberley, 23 tracked for Eighty Mile Beach. Previous tracking studies included 23 flatbacks at Eco Beach, 11 flatbacks and 11 greens from the Lacepede Islands, and 21 greens and 7 flatbacks for the Maret Islands (Waayers et al. in press). Stable isotope studies in conjunction with CSIRO and US NMFS and necropsies of fresh carcasses by Murdoch Univ. are yielding preliminary results on foods that sustain marine turtles. Related studies are conducted in collaboration with WAMSI Benthic Biodiversity Project to map the benthic communities in known flatback foraging areas. Previous flipper tagging studies have shown links between rookeries and foraging grounds through the recovery of tags, for example the Lacepede Islands nesting green turtles are linked to foraging grounds throughout the Northern Territory.
What cost-effective methods can be developed to enable effective condition monitoring of turtle species at the nesting grounds?
Relative abundance estimates of an index nesting population require nightly or daily track monitoring for a minimum of two weeks at midseason by either on-ground staff, drone surveys, or camera trapping (methods chosen depending upon density and remoteness). Not all beaches need to be monitoring and the selection of beaches will depend on a combination of biological importance and field and operational logistics. Monitoring is already underway for flatbacks on Cape Domett, Eighty Mile Beach and Cable Beach, but needs to be reinstituted for the green turtle nesting on Lacepede Islands.
More in depth demographic information at nesting beaches required marked individuals and monitoring the fate of marked nests. This required considerable effort.
What are the fundamental factors that make a beach attractive/unattractive to nesting turtles? And how do we use this information to be able to take into account beaches yet to be mapped?
This question was beyond the scope of the study and not addressed, or addressed fully. Generally an unobstructed approach from deeper water, and a stable sand substrate above high tides are features of nesting beaches. A broad generality is that green turtles select the seaward sides of islands, and the flatbacks select the mainland beaches or landward sides of offshore islands. Nearly every patch of dry sand might be considered turtle habitat. Adequate beach slope and sand porosity enable good drainage. GIS habitat mapping approaches such as OzCoasts on Geoscience Australia can use onground data, merged with validated data sets make predictive models.
How do we manage traditional harvest/ take (including take from other countries)? What models are used in NT and have these been useful?
This question was beyond the scope of the study and not addressed, or addressed fully. It should be recognised that Indigenous people have been harvesting turtles and managing turtle harvest for tens of thousands of years. Whether further management is required is still debateable, but understand hunting in the context of wider anthropogenic threats is advisable. No useable models are available from the NT. Indigenous groups in the Kimberley currently integrate western science knowledge with traditional knowledge to understand and make

Marine Turtles
Kimberley Marine Research Program | Project 1.2.2 9
decisions about harvest. Most groups recognise the political issues sometimes associated with hunting and groups in the Kimberley are working towards better two-way knowledge of cultural practices to ensure the wider community has a better understanding. Management is a question of scale. At a population or stock level, management should be at a regional scale, while individual groups may have more local management issues as a priority. It is important that stakeholders recognised different management scales. A local Kimberley turtle-dugong harvest workshop was hosted by Indigenous residents in June 2017 and input was provided by DBCA.
Are there protocols and methodologies to determine real vs false nesting that we should use?
A primary way is by using trained observers on selected beaches. Ground truthing of the aerial surveys with concurrent on-ground surveys is also important. U-turn tracks without any thrown sand are clearly not nests. Characteristics that aid the specific track and, body pit, and fill characteristics. It should be noted that there is always some degree of error and estimating this error is important. Error can be estimated by planning for dedicated surveys at night where researchers watch turtle lay on not lay and compare these with daytime surveys.
Does Sediment deposition from out of the Ord - Cape Dommet – have an impact on nesting beaches
Question was beyond the scope of the study and not addressed. It seems unlikely since finer silts and muds remain suspended by the dramatic Kimberley tidal amplitudes to be eventually deposited offshore, whereas coarser sand grains would be deposited nearshore. Geoscience Australia has defined marine and coastal datasets online for the predicted offshore mud, sand, and gravel content of Australia’s Northwest Shelf in an online marine sediment database (MARS). A batch of 51 beach sand samples were collected from turtle beaches across the Kimberley, Pilbara, and Gascoyne for sedimentology analysis and reported in Blair Bentley’s UWA PhD and these can form the basis of some benchmarking that could be compared in future years. Currently, the sand at Cape Domett does not seem to impact on nesting success (the likelihood of a turtle laying a clutch of eggs) or hatchling and emergence success.

Marine Turtles
10 Kimberley Marine Research Program | Project 1.2.2
4. References
Campbell, L.M., 2002. Science and sustainable use: views of marine turtle conservation experts. Ecological Applications, 12, pp.1229-1246.
Balanggarra Aboriginal Corporation / Kimberley Land Council (2011). Balanggarra Healthy Country Plan 2012-2022. 50 pp.
Bardi Jawi Niimidiman Aboriginal Corporation / Kimberley Land Council (2013). Bardi Jawi Indigenous Protected Area Management Plan 2013-2013. (2013). 29 pp.
Catlin, J., Hughes, M., Jones, T., Jones, R. and Campbell, R., 2013. Valuing individual animals through tourism: Science or speculation?. Biological conservation, 157, pp.93-98.
Dambimangari Aboriginal Corporation (2012). Dambimangari Healthy Country Plan 2012-2022. 56 pp.
Department of Environment and Conservation (2011). Kimberly Science and Conservation Strategy. Department of Environment and Conservation. 50 pp.
Department of Parks and Wildlife (2013). Lalang-garram / Camden Sound Marine Park. Management plan 73 2013–2023, Department of Parks and Wildlife, Perth. 94 pp.
Department of Parks and Wildlife 2014, Eighty Mile Beach Marine Park Management Plan 80 2014-2024. Department of Parks and Wildlife, Perth. 86 pp.
Department of Parks and Wildlife (2016a).Yawuru Nagulagun / Roebuck Bay Marine Park Joint Management Plan 2016, Department of Parks and Wildlife, Perth. 108 pp.
Department of Parks and Wildlife (2016b). North Kimberley Marine Park Joint management plan 2016 Uunguu, Balanggarra, Miriuwung Gajerrong, and Wilinggin management areas, Number plan 89 Department of Parks and Wildlife, Perth. 64 pp.
Department of Parks and Wildlife (2016c). Lalang-garram / Horizontal Falls and North Lalang-garram marine parks joint management plan 2016. Management Plan 88. Department of Parks and Wildlife, Perth. 65 pp.
Millennium Ecosystem Assessment, 2005. Ecosystems and Human Well-being: Synthesis. Island Press, Washington, DC.
O'Connor, S., 1999. 30,000 Years of Aboriginal Occupation: Kimberley, North West Australia. Canberra, ACT: Dept. of Archaeology and Natural History, The Australian National University.
Karajarri Healthy Country Plan 2013-2013 (2014). Karajarri Traditional Lands Association. 60 pp.
Tisdell, C. and Wilson, C., 2001. Wildlife-based tourism and increased support for nature conservation financially and otherwise: evidence from sea turtle ecotourism at Mon Repos. Tourism economics, 7, pp.233-249.
Troëng, S., and C. Drews. "Money talks." Economic aspects of marine turtle use and conservation. Gland: WWF-International (2004).
Wunambal Gaambera Aboriginal Corporation (2010). Wunambal Gaambera Healthy Country Plan. Looking after Wunambal Gaambera Country 2010-2020. 56 pp.

Marine Turtles
Kimberley Marine Research Program | Project 1.2.2 11
Chapter 2: Distribution and abundance of nesting marine turtles in the Kimberley: pairing the landscape and local perspectives.
Tony Tucker1,3, Kellie Pendoley2,3, Scott Whiting1,3 1Dept. Biodiversity, Conservation and Attractions, Marine Science Program, Kensington, Western Australia 2Pendoley Environmental, Booragoon, Western Australia 3Western Australia Marine Science Institution (WAMSI), Perth, Western Australia
Executive summary
An increased demand for knowledge on Kimberley marine turtle resources is driven by the establishment of new Kimberley Marine Parks, the Indigenous ranger groups responsible for on-country management, and the release of the 2017 Recovery Plan for Marine Turtles in Australia. We synthesized a background from Traditional Knowledge spanning millennia, historical accounts that spanned two centuries, and the industry related surveys of the last decade. Collectively, this information confirmed that systematic turtle nesting surveys over Kimberley coasts should span midsummer and midwinter periods at minimum.
The WAMSI Turtle Project 1.2.2 addressed this knowledge gap by conducting Kimberley-wide aerial surveys of turtle tracks in January and August 2014 which were complimented by on ground surveys for verification and temporal coverage. The aerial photos of beaches included all known rookeries and 91% of the Kimberley islands and mainland coasts. Over 44,000 georeferenced aerial images were annotated to quantify visual evidence of turtle tracks or body pits. On-ground surveys were conducted in 37 accessible locations after 22 field trips and 44 meetings to verify species by visual inspection of track characteristics. A single summer and winter season snapshot inventory quantified Kimberley turtle nesting at scales of 1-10s-100s-1000s of tracks.
The track data for GIS layers were classed into low, medium, and high track counts. Tracks can be discerned on almost all silica sand beaches across the Kimberley, with fewer tracks recorded in coastal stretches bordered by rocky cliffs or mangroves. The higher aggregations of tracks (above median of 20 nests) identify beaches significant to management interests. The most important rookeries ranked by track counts and density were winter flatbacks at Cape Domett, summer greens at the Lacepede Islands and summer flatbacks at Wallal Downs-Eighty Mile Beach. Aerial surveys had low probability to detect olive ridley or hawksbill turtles because these species are believed to be sparse and isolated in the Kimberley, the relatively shallow tracks of lighter-bodied species do not have a long duration and the survey period was not in phase with their seasonal phenology. No leatherback or loggerhead tracks were recorded although migrations through the region are known through Indigenous knowledge, fisheries bycatch or satellite telemetry.
The surveys enabled a preliminary multi-objective decision framework relevant to landscape understanding for Commonwealth and State interests and new detailed data for local management by Traditional Owners through land claims, Indigenous Protected Areas and Healthy Country Plans. Integrating landscape and local perspectives has identified the priority turtle beaches and facilitated strategic recommendations for future studies and monitoring.
Marine Turtles
12 Kimberley Marine Research Program | Project 1.2.2
Introduction
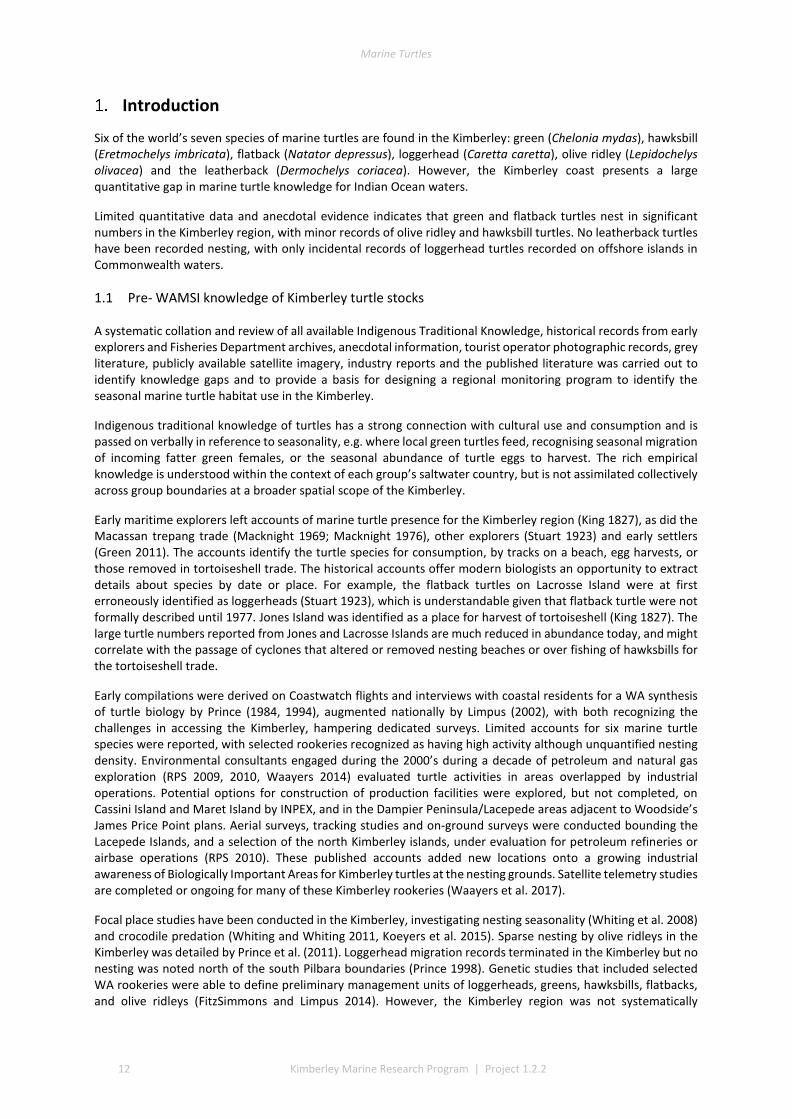
Six of the world’s seven species of marine turtles are found in the Kimberley: green (Chelonia mydas), hawksbill (Eretmochelys imbricata), flatback (Natator depressus), loggerhead (Caretta caretta), olive ridley (Lepidochelys olivacea) and the leatherback (Dermochelys coriacea). However, the Kimberley coast presents a large quantitative gap in marine turtle knowledge for Indian Ocean waters.
Limited quantitative data and anecdotal evidence indicates that green and flatback turtles nest in significant numbers in the Kimberley region, with minor records of olive ridley and hawksbill turtles. No leatherback turtles have been recorded nesting, with only incidental records of loggerhead turtles recorded on offshore islands in Commonwealth waters.
1.1 Pre- WAMSI knowledge of Kimberley turtle stocks
A systematic collation and review of all available Indigenous Traditional Knowledge, historical records from early explorers and Fisheries Department archives, anecdotal information, tourist operator photographic records, grey literature, publicly available satellite imagery, industry reports and the published literature was carried out to identify knowledge gaps and to provide a basis for designing a regional monitoring program to identify the seasonal marine turtle habitat use in the Kimberley.
Indigenous traditional knowledge of turtles has a strong connection with cultural use and consumption and is passed on verbally in reference to seasonality, e.g. where local green turtles feed, recognising seasonal migration of incoming fatter green females, or the seasonal abundance of turtle eggs to harvest. The rich empirical knowledge is understood within the context of each group’s saltwater country, but is not assimilated collectively across group boundaries at a broader spatial scope of the Kimberley.
Early maritime explorers left accounts of marine turtle presence for the Kimberley region (King 1827), as did the Macassan trepang trade (Macknight 1969; Macknight 1976), other explorers (Stuart 1923) and early settlers (Green 2011). The accounts identify the turtle species for consumption, by tracks on a beach, egg harvests, or those removed in tortoiseshell trade. The historical accounts offer modern biologists an opportunity to extract details about species by date or place. For example, the flatback turtles on Lacrosse Island were at first erroneously identified as loggerheads (Stuart 1923), which is understandable given that flatback turtle were not formally described until 1977. Jones Island was identified as a place for harvest of tortoiseshell (King 1827). The large turtle numbers reported from Jones and Lacrosse Islands are much reduced in abundance today, and might correlate with the passage of cyclones that altered or removed nesting beaches or over fishing of hawksbills for the tortoiseshell trade.
Early compilations were derived on Coastwatch flights and interviews with coastal residents for a WA synthesis of turtle biology by Prince (1984, 1994), augmented nationally by Limpus (2002), with both recognizing the challenges in accessing the Kimberley, hampering dedicated surveys. Limited accounts for six marine turtle species were reported, with selected rookeries recognized as having high activity although unquantified nesting density. Environmental consultants engaged during the 2000’s during a decade of petroleum and natural gas exploration (RPS 2009, 2010, Waayers 2014) evaluated turtle activities in areas overlapped by industrial operations. Potential options for construction of production facilities were explored, but not completed, on Cassini Island and Maret Island by INPEX, and in the Dampier Peninsula/Lacepede areas adjacent to Woodside’s James Price Point plans. Aerial surveys, tracking studies and on-ground surveys were conducted bounding the Lacepede Islands, and a selection of the north Kimberley islands, under evaluation for petroleum refineries or airbase operations (RPS 2010). These published accounts added new locations onto a growing industrial awareness of Biologically Important Areas for Kimberley turtles at the nesting grounds. Satellite telemetry studies are completed or ongoing for many of these Kimberley rookeries (Waayers et al. 2017).
Focal place studies have been conducted in the Kimberley, investigating nesting seasonality (Whiting et al. 2008) and crocodile predation (Whiting and Whiting 2011, Koeyers et al. 2015). Sparse nesting by olive ridleys in the Kimberley was detailed by Prince et al. (2011). Loggerhead migration records terminated in the Kimberley but no nesting was noted north of the south Pilbara boundaries (Prince 1998). Genetic studies that included selected WA rookeries were able to define preliminary management units of loggerheads, greens, hawksbills, flatbacks, and olive ridleys (FitzSimmons and Limpus 2014). However, the Kimberley region was not systematically

Marine Turtles
Kimberley Marine Research Program | Project 1.2.2 13
resampled to delineate stock structure in the Indian Ocean until WAMSI. Accounts for northern Australia flatback turtles distinguished a northern winter nesting component and southern summer nesting component (Limpus 2003). Green turtle rookeries had summer nesting peaks, although there was limited evidence of low nesting nearly year-round in the north latitudes. Hawksbill nesting was considered sparse and scattered in the Kimberley, but complicated to investigate when the dispersed nesting on small upper beaches would be difficult to document in the same manner as other species that aggregate in large numbers to nest.
Kimberley history on hawksbill harvest is sketchily related to early records of Jones Island which was visited for tortoiseshell harvests by Macassan and Indonesian sailors for trepang (Stacey 2007), but records of trade were not detailed on take of turtles by rookery (Halkyard 2009). The hawksbills taken by Indonesian fishers in the Kimberley waters were not well documented and export trade was underestimated from the actual historical exploitation that took place. Illegal, undocumented and unreported harvest by the tortoise shell industry likely had a significant impact on hawksbill populations in the state’s north even though it is difficult to pinpoint where the fishing effort was concentrated and which foraging and/ breeding aggregations were most impacted, as many of the records are missing in the WA fishing license records(Aldrich 1934).
In recent years, joint surveys between NAILSMA, CSIRO and Kimberley ranger groups have counted turtles during in-water surveys at selected sites; i.e. Montgomery Reef with Dambimangari, Sunday Island with Bardi Jawi, and Mary Island with Wunambal Gaambera. The in-water surveys are valuable for knowledge sharing and for the rigorous methods used in data collection (Bayliss et al. 2015, Jackson et al. 2015), however these results are disassociated with nesting beach studies that collect track census data and are the primary means of tracking trends in turtle population status (SWOT 2011).
Marine turtles are important to Kimberley Indigenous residents for cultural purposes and as food resources. Many Healthy Country Plans contain specific details regarding important nesting and foraging places, maps or seasonal timing of breeding and migration (Kimberley Land Council 2010, Wunambal Gaambera Aboriginal Corporation 2010, Balanggarra Aboriginal Corporation 2011, Dambimangari Aboriginal Corporation 2012, Bardi Jawi Niimidiman Aboriginal Corporation 2013, KaraJarri Traditional Lands Association 2014).
We systematically searched for images displayed on the internet by Kimberley tourist boats or private boats. Although this data set was sparse, images were accepted with geo-tags or if place-named and if the species track could be identified independently by two turtle experts.
This desktop study recognized that the knowledge gaps in turtle nesting for the Kimberley could only be filled efficiently by a spatially and temporally coordinated aerial survey to capture images of the nesting tracks left on all beaches. The background established an essential foundation to the WAMSI turtle study: determining the distribution and abundance of marine turtle nesting in the Kimberley.
1.2 Kimberley marine turtle stocks-current status
1.2.1 Green turtles
Green turtle breeding in the Kimberley occurs within three genetic stocks (north-west Australia, Scott Reef/Browse Island and Ashmore Reef) (FitzSimmons and Limpus 2014). Inshore breeding locations include the Lacepede Islands and several other medium density nesting sites along the North Kimberley coast. Green turtles that were flipper tagged on the Lacepede Islands in 1987-2002 have migrated to the Pilbara, the Northern Territory and Indonesia (Prince 1994; 1998). Green turtle post-nesting migration and inter-nesting studies have been conducted using satellite telemetry from Scott Reef, the Lacepede Islands and Maret Island by consultants (Pendoley 2005;reviewed by Waayers et al. 2017)
Green turtles feed predominantly on seagrass and algae and therefore foraging sites occur in shallow predictable habitats. Green turtle foraging locations will be spread along the Kimberley coast with some hot spot areas correlated with amount and quality of food. Montgomery Reef and Long Reef are known to support significant numbers of green turtles. Green turtles foraging on the Kimberley coast have also been tracked from their nesting sites in Java [http://www.wildlifetracking.org/index.shtml?project_id=275&dyn=1509436089].
1.2.2 Flatback turtles
The genetic stocks are still being refined for flatback turtles with new information offered in Chapter 3. The
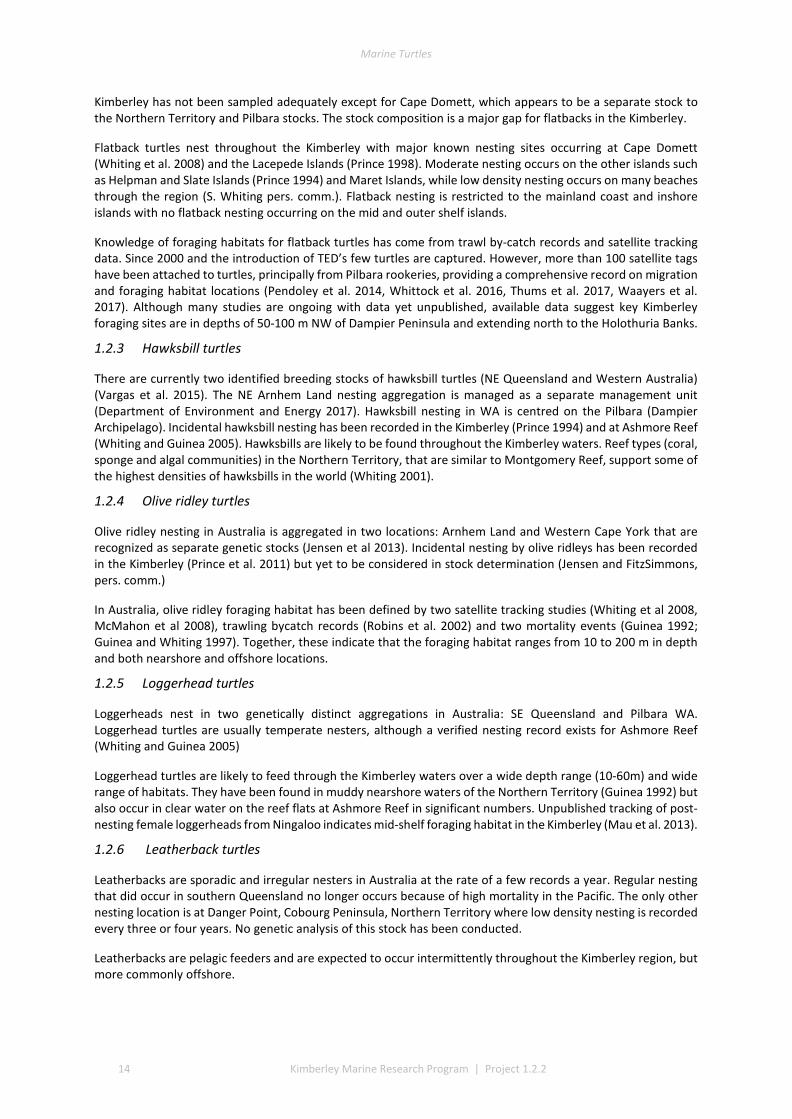
Marine Turtles
14 Kimberley Marine Research Program | Project 1.2.2
Kimberley has not been sampled adequately except for Cape Domett, which appears to be a separate stock to the Northern Territory and Pilbara stocks. The stock composition is a major gap for flatbacks in the Kimberley.
Flatback turtles nest throughout the Kimberley with major known nesting sites occurring at Cape Domett (Whiting et al. 2008) and the Lacepede Islands (Prince 1998). Moderate nesting occurs on the other islands such as Helpman and Slate Islands (Prince 1994) and Maret Islands, while low density nesting occurs on many beaches through the region (S. Whiting pers. comm.). Flatback nesting is restricted to the mainland coast and inshore islands with no flatback nesting occurring on the mid and outer shelf islands.
Knowledge of foraging habitats for flatback turtles has come from trawl by-catch records and satellite tracking data. Since 2000 and the introduction of TED’s few turtles are captured. However, more than 100 satellite tags have been attached to turtles, principally from Pilbara rookeries, providing a comprehensive record on migration and foraging habitat locations (Pendoley et al. 2014, Whittock et al. 2016, Thums et al. 2017, Waayers et al. 2017). Although many studies are ongoing with data yet unpublished, available data suggest key Kimberley foraging sites are in depths of 50-100 m NW of Dampier Peninsula and extending north to the Holothuria Banks.
1.2.3 Hawksbill turtles
There are currently two identified breeding stocks of hawksbill turtles (NE Queensland and Western Australia) (Vargas et al. 2015). The NE Arnhem Land nesting aggregation is managed as a separate management unit (Department of Environment and Energy 2017). Hawksbill nesting in WA is centred on the Pilbara (Dampier Archipelago). Incidental hawksbill nesting has been recorded in the Kimberley (Prince 1994) and at Ashmore Reef (Whiting and Guinea 2005). Hawksbills are likely to be found throughout the Kimberley waters. Reef types (coral, sponge and algal communities) in the Northern Territory, that are similar to Montgomery Reef, support some of the highest densities of hawksbills in the world (Whiting 2001).
1.2.4 Olive ridley turtles
Olive ridley nesting in Australia is aggregated in two locations: Arnhem Land and Western Cape York that are recognized as separate genetic stocks (Jensen et al 2013). Incidental nesting by olive ridleys has been recorded in the Kimberley (Prince et al. 2011) but yet to be considered in stock determination (Jensen and FitzSimmons, pers. comm.)
In Australia, olive ridley foraging habitat has been defined by two satellite tracking studies (Whiting et al 2008, McMahon et al 2008), trawling bycatch records (Robins et al. 2002) and two mortality events (Guinea 1992; Guinea and Whiting 1997). Together, these indicate that the foraging habitat ranges from 10 to 200 m in depth and both nearshore and offshore locations.
1.2.5 Loggerhead turtles
Loggerheads nest in two genetically distinct aggregations in Australia: SE Queensland and Pilbara WA. Loggerhead turtles are usually temperate nesters, although a verified nesting record exists for Ashmore Reef (Whiting and Guinea 2005)
Loggerhead turtles are likely to feed through the Kimberley waters over a wide depth range (10-60m) and wide range of habitats. They have been found in muddy nearshore waters of the Northern Territory (Guinea 1992) but also occur in clear water on the reef flats at Ashmore Reef in significant numbers. Unpublished tracking of post-nesting female loggerheads from Ningaloo indicates mid-shelf foraging habitat in the Kimberley (Mau et al. 2013).
1.2.6 Leatherback turtles
Leatherbacks are sporadic and irregular nesters in Australia at the rate of a few records a year. Regular nesting that did occur in southern Queensland no longer occurs because of high mortality in the Pacific. The only other nesting location is at Danger Point, Cobourg Peninsula, Northern Territory where low density nesting is recorded every three or four years. No genetic analysis of this stock has been conducted.
Leatherbacks are pelagic feeders and are expected to occur intermittently throughout the Kimberley region, but more commonly offshore.
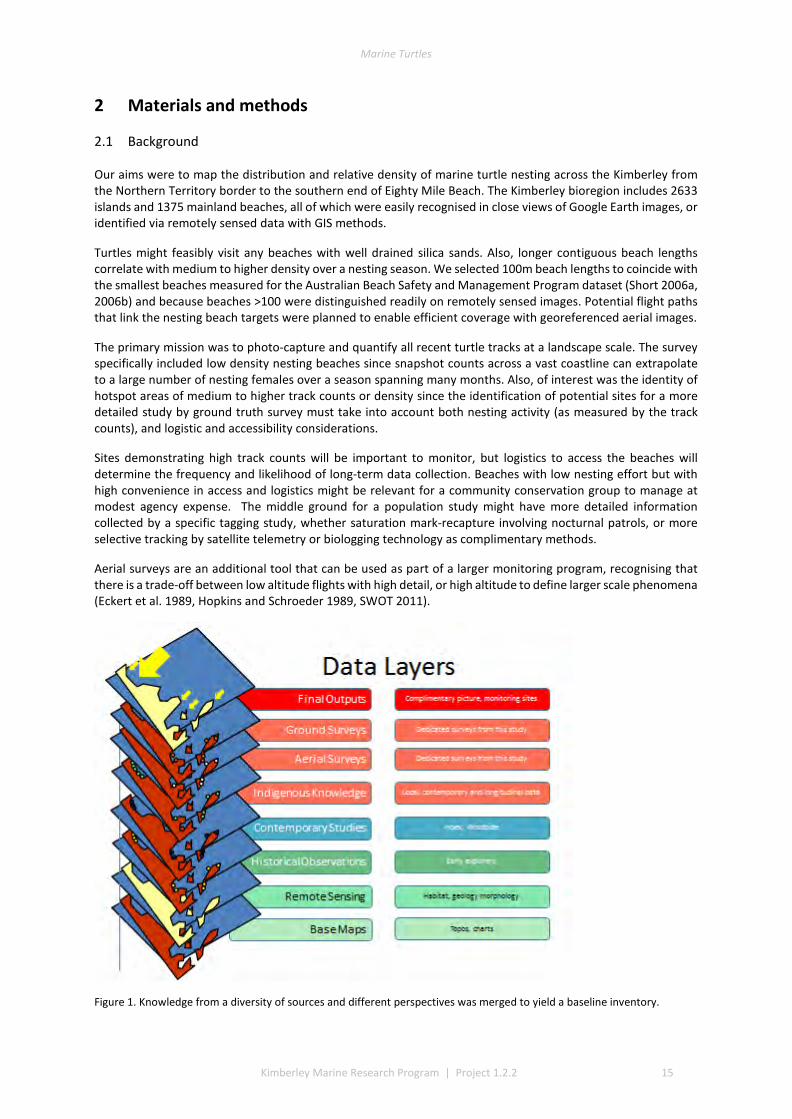
Marine Turtles
Kimberley Marine Research Program | Project 1.2.2 15
2 Materials and methods
2.1 Background
Our aims were to map the distribution and relative density of marine turtle nesting across the Kimberley from the Northern Territory border to the southern end of Eighty Mile Beach. The Kimberley bioregion includes 2633 islands and 1375 mainland beaches, all of which were easily recognised in close views of Google Earth images, or identified via remotely sensed data with GIS methods.
Turtles might feasibly visit any beaches with well drained silica sands. Also, longer contiguous beach lengths correlate with medium to higher density over a nesting season. We selected 100m beach lengths to coincide with the smallest beaches measured for the Australian Beach Safety and Management Program dataset (Short 2006a, 2006b) and because beaches >100 were distinguished readily on remotely sensed images. Potential flight paths that link the nesting beach targets were planned to enable efficient coverage with georeferenced aerial images.
The primary mission was to photo-capture and quantify all recent turtle tracks at a landscape scale. The survey specifically included low density nesting beaches since snapshot counts across a vast coastline can extrapolate to a large number of nesting females over a season spanning many months. Also, of interest was the identity of hotspot areas of medium to higher track counts or density since the identification of potential sites for a more detailed study by ground truth survey must take into account both nesting activity (as measured by the track counts), and logistic and accessibility considerations.
Sites demonstrating high track counts will be important to monitor, but logistics to access the beaches will determine the frequency and likelihood of long-term data collection. Beaches with low nesting effort but with high convenience in access and logistics might be relevant for a community conservation group to manage at modest agency expense. The middle ground for a population study might have more detailed information collected by a specific tagging study, whether saturation mark-recapture involving nocturnal patrols, or more selective tracking by satellite telemetry or biologging technology as complimentary methods.
Aerial surveys are an additional tool that can be used as part of a larger monitoring program, recognising that there is a trade-off between low altitude flights with high detail, or high altitude to define larger scale phenomena (Eckert et al. 1989, Hopkins and Schroeder 1989, SWOT 2011).
Figure 1. Knowledge from a diversity of sources and different perspectives was merged to yield a baseline inventory.
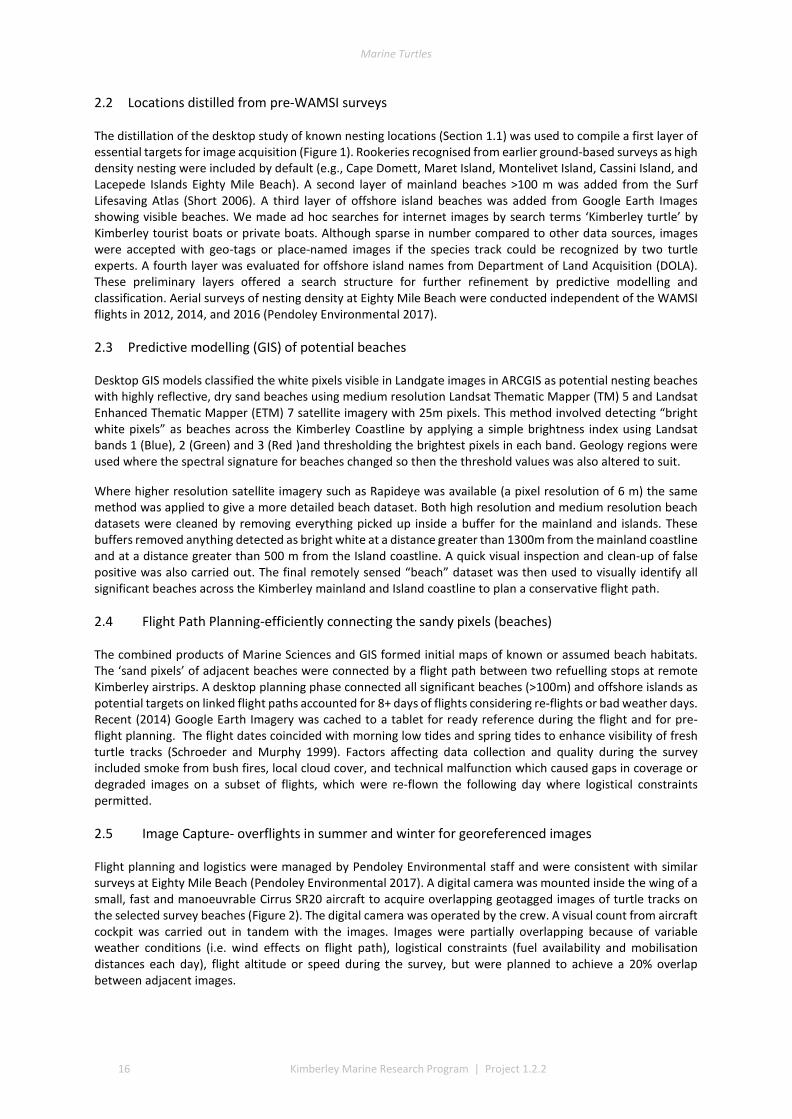
Marine Turtles
16 Kimberley Marine Research Program | Project 1.2.2
2.2 Locations distilled from pre-WAMSI surveys
The distillation of the desktop study of known nesting locations (Section 1.1) was used to compile a first layer of essential targets for image acquisition (Figure 1). Rookeries recognised from earlier ground-based surveys as high density nesting were included by default (e.g., Cape Domett, Maret Island, Montelivet Island, Cassini Island, and Lacepede Islands Eighty Mile Beach). A second layer of mainland beaches >100 m was added from the Surf Lifesaving Atlas (Short 2006). A third layer of offshore island beaches was added from Google Earth Images showing visible beaches. We made ad hoc searches for internet images by search terms ‘Kimberley turtle’ by Kimberley tourist boats or private boats. Although sparse in number compared to other data sources, images were accepted with geo-tags or place-named images if the species track could be recognized by two turtle experts. A fourth layer was evaluated for offshore island names from Department of Land Acquisition (DOLA). These preliminary layers offered a search structure for further refinement by predictive modelling and classification. Aerial surveys of nesting density at Eighty Mile Beach were conducted independent of the WAMSI flights in 2012, 2014, and 2016 (Pendoley Environmental 2017).
2.3 Predictive modelling (GIS) of potential beaches
Desktop GIS models classified the white pixels visible in Landgate images in ARCGIS as potential nesting beaches with highly reflective, dry sand beaches using medium resolution Landsat Thematic Mapper (TM) 5 and Landsat Enhanced Thematic Mapper (ETM) 7 satellite imagery with 25m pixels. This method involved detecting “bright white pixels” as beaches across the Kimberley Coastline by applying a simple brightness index using Landsat bands 1 (Blue), 2 (Green) and 3 (Red )and thresholding the brightest pixels in each band. Geology regions were used where the spectral signature for beaches changed so then the threshold values was also altered to suit.
Where higher resolution satellite imagery such as Rapideye was available (a pixel resolution of 6 m) the same method was applied to give a more detailed beach dataset. Both high resolution and medium resolution beach datasets were cleaned by removing everything picked up inside a buffer for the mainland and islands. These buffers removed anything detected as bright white at a distance greater than 1300m from the mainland coastline and at a distance greater than 500 m from the Island coastline. A quick visual inspection and clean-up of false positive was also carried out. The final remotely sensed “beach” dataset was then used to visually identify all significant beaches across the Kimberley mainland and Island coastline to plan a conservative flight path.
2.4 Flight Path Planning-efficiently connecting the sandy pixels (beaches)
The combined products of Marine Sciences and GIS formed initial maps of known or assumed beach habitats. The ‘sand pixels’ of adjacent beaches were connected by a flight path between two refuelling stops at remote Kimberley airstrips. A desktop planning phase connected all significant beaches (>100m) and offshore islands as potential targets on linked flight paths accounted for 8+ days of flights considering re-flights or bad weather days. Recent (2014) Google Earth Imagery was cached to a tablet for ready reference during the flight and for pre-flight planning. The flight dates coincided with morning low tides and spring tides to enhance visibility of fresh turtle tracks (Schroeder and Murphy 1999). Factors affecting data collection and quality during the survey included smoke from bush fires, local cloud cover, and technical malfunction which caused gaps in coverage or degraded images on a subset of flights, which were re-flown the following day where logistical constraints permitted.
2.5 Image Capture- overflights in summer and winter for georeferenced images
Flight planning and logistics were managed by Pendoley Environmental staff and were consistent with similar surveys at Eighty Mile Beach (Pendoley Environmental 2017). A digital camera was mounted inside the wing of a small, fast and manoeuvrable Cirrus SR20 aircraft to acquire overlapping geotagged images of turtle tracks on the selected survey beaches (Figure 2). The digital camera was operated by the crew. A visual count from aircraft cockpit was carried out in tandem with the images. Images were partially overlapping because of variable weather conditions (i.e. wind effects on flight path), logistical constraints (fuel availability and mobilisation distances each day), flight altitude or speed during the survey, but were planned to achieve a 20% overlap between adjacent images.

Marine Turtles
Kimberley Marine Research Program | Project 1.2.2 17
Aerial surveys were flown for 8 consecutive days of winter and summer 2014 to completely span the Kimberley coast (Figure 3). The images were obtained during sequential daily flight segments, beginning at the WA/NT border (-14.8818 S, 129.9875 E) and continued until reaching the western limit of Eighty Mile Beach Marine Park (-19.9664 S, 119.0814 E) (Table 1). Daily flight segments were constrained by the limited availability of both accommodation facilities for the survey crew and air strips with aviation fuel. The segments between the NT border and York Sound were mobilised out of Kalumburu for Day 1 – Day 4, while the southern Kimberley from York sound to the De Grey River were mobilised from Derby for the balance of the survey.
Data extracted from the images (Figure 4) included the geo-referenced ID number, by latitude and longitude in decimal degrees, with flight attributes of date/time, altitude, heading, and sequence. The metadata for all images were timestamped with geo-references from the flight navigation instruments. Images were downloaded to a portable hard drive and transferred to DBCA.
The primary limitations of this initial scoping survey were based around delineation of survey sections. Other limitations associated with the track census survey included overnight winds, high tides and cyclonic activity can erase tracks making accurate interpretation difficult. The survey targeted the known peak of the nesting season when nesting density is high and therefore some tracks may have been partially obscured, negatively impacting data resolution. In addition, a turtle may re-emerge on the same or several consecutive nights if nesting is unsuccessful, obscuring tracks or increasing the number of recorded tracks for an individual. Marine turtles nest over approximately 3+ months in this region. A three to four day snap shot survey of each beach is limited and greater temporal coverage (i.e. over more days during the peak nesting season) would provide greater confidence in results. The aircraft height and speed impacts on the collection of aerial images as a result of environmental factors (wind and rain), aircraft operations and flight planning. The impact of the vast distances that must be covered and the complete lack of support facilities for the aircraft and crew cannot be underestimated. The length of the survey and its position within the lunar cycle may introduce some error relating to tidal state, particularly at Eighty Mile Beach where the tidal range is large and the intertidal zone is very broad. While a statistical relationship between nesting effort and lunar phase has not been established, anecdotal evidence suggests lunar phase may influence temporal distribution of adult emergencies and thus the recorded track figures may vary depending on position of the sampling period within the lunar cycle.
Moreover the persistence of track features below the vegetated dune crests can vary depending on weather (recent rain or extended dry), wind (orientation and extent of exposure to prevailing winds), time of day (AM flights with heightened contrast), season (winter flights with lower sun angles), tide (spring high tides better to distinguish recent tracks from older tracks), sand colour (white quartz sand has high reflectance and images show low contrast), suspended particulates or aerosol (terrestrial burning and hazy days yield a unfocused image).
Despite these variables, aerial images at 160-200 m altitude gave enough image contrasts to reliably recognize tracks or old pits (1 m wide), whether or not it was possible to define species (unknown, flatback, green, and hawksbill were choices). Better image quality could resolve and document a range of vertebrates (predated nests by foxes = 0.5 m, hatchling track fans=10 cm wide; human footprints and cattle tracks = 10-20 cm, turtles swimming = 1 m, turtle tracks = 1 m, crocodiles 3-5 m; humpback whales 12-16m).
Beach characteristics of the Kimberley coasts were provided in a GIS dataset that accompanies an atlas of Australian mainland beaches (Short 2006a, 2006b). A systematic verification and granulometric analysis (a bag of sand collected, n = 50 turtle beaches from Dirk Hartog National Park north to Cape Domett) confirmed a good match of sand characteristics regardless of mainland or island source. Previous studies have demonstrated turtle preference for certain sand characteristics defined by acceptable ranges of humidity, drainage, albedo, and thermal retention.
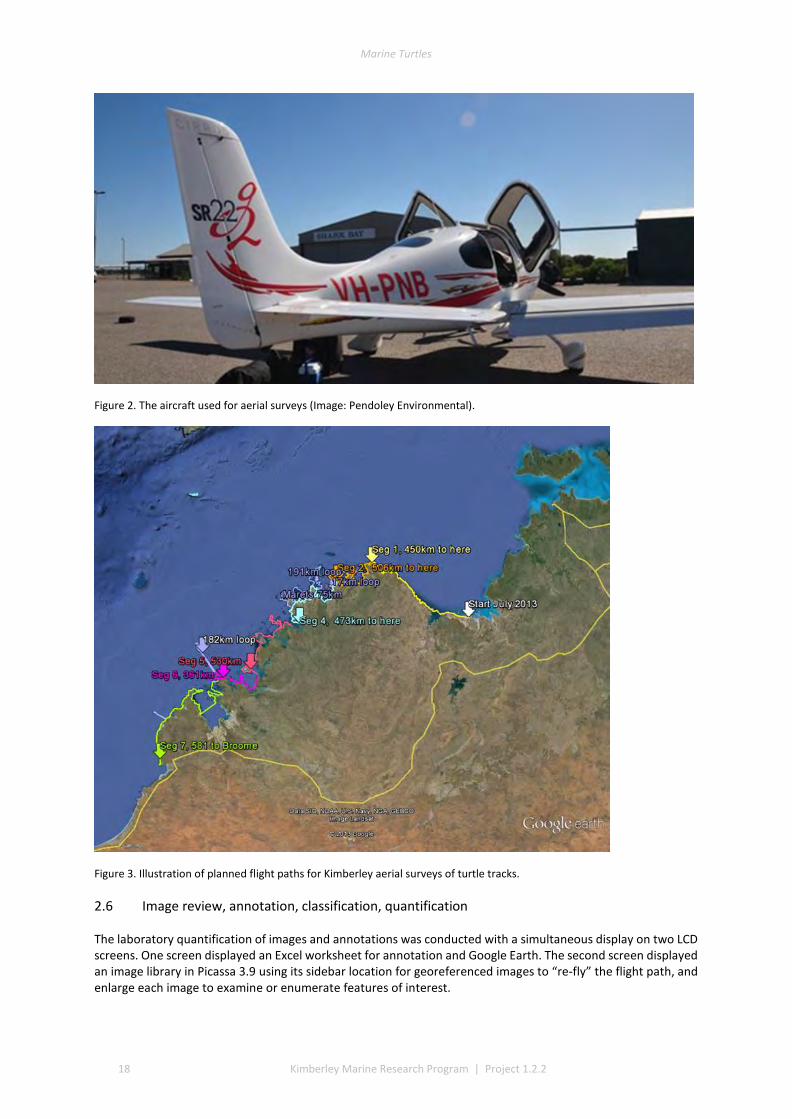
Marine Turtles
18 Kimberley Marine Research Program | Project 1.2.2
Figure 2. The aircraft used for aerial surveys (Image: Pendoley Environmental).
Figure 3. Illustration of planned flight paths for Kimberley aerial surveys of turtle tracks.
2.6 Image review, annotation, classification, quantification
The laboratory quantification of images and annotations was conducted with a simultaneous display on two LCD screens. One screen displayed an Excel worksheet for annotation and Google Earth. The second screen displayed an image library in Picassa 3.9 using its sidebar location for georeferenced images to “re-fly” the flight path, and enlarge each image to examine or enumerate features of interest.
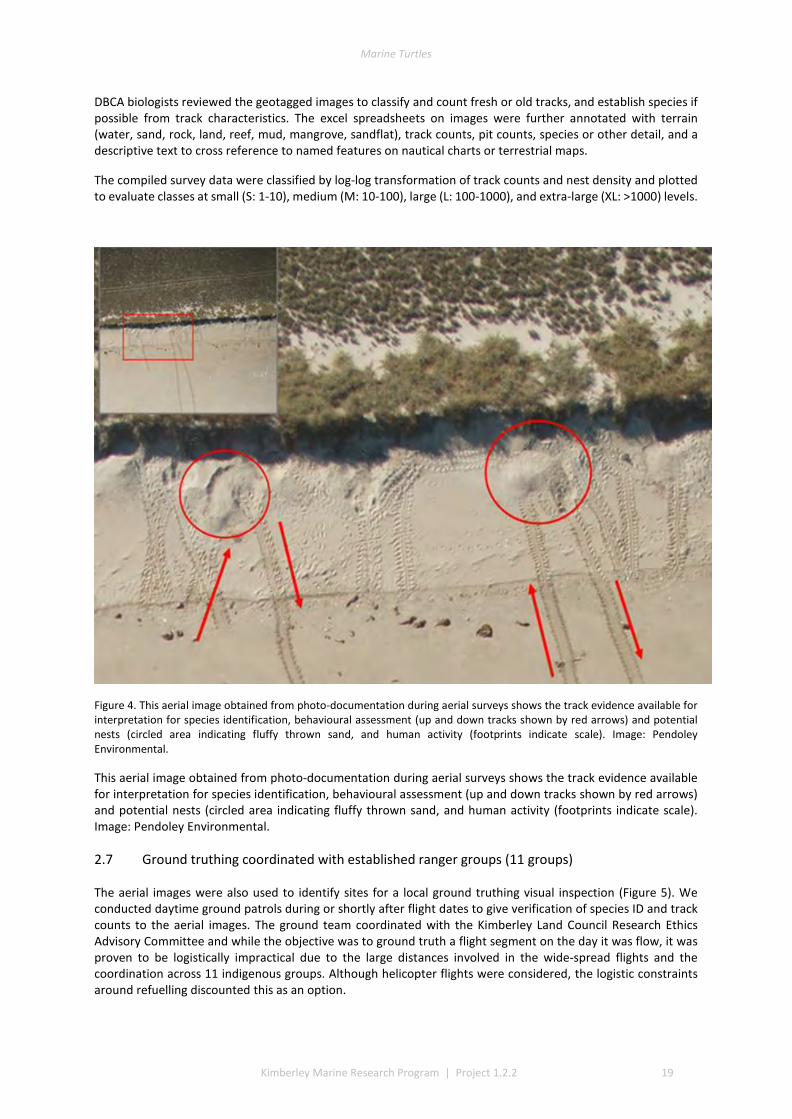
Marine Turtles
Kimberley Marine Research Program | Project 1.2.2 19
DBCA biologists reviewed the geotagged images to classify and count fresh or old tracks, and establish species if possible from track characteristics. The excel spreadsheets on images were further annotated with terrain (water, sand, rock, land, reef, mud, mangrove, sandflat), track counts, pit counts, species or other detail, and a descriptive text to cross reference to named features on nautical charts or terrestrial maps.
The compiled survey data were classified by log-log transformation of track counts and nest density and plotted to evaluate classes at small (S: 1-10), medium (M: 10-100), large (L: 100-1000), and extra-large (XL: >1000) levels.
Figure 4. This aerial image obtained from photo-documentation during aerial surveys shows the track evidence available for interpretation for species identification, behavioural assessment (up and down tracks shown by red arrows) and potential nests (circled area indicating fluffy thrown sand, and human activity (footprints indicate scale). Image: Pendoley Environmental.
This aerial image obtained from photo-documentation during aerial surveys shows the track evidence available for interpretation for species identification, behavioural assessment (up and down tracks shown by red arrows) and potential nests (circled area indicating fluffy thrown sand, and human activity (footprints indicate scale). Image: Pendoley Environmental.
2.7 Ground truthing coordinated with established ranger groups (11 groups)
The aerial images were also used to identify sites for a local ground truthing visual inspection (Figure 5). We conducted daytime ground patrols during or shortly after flight dates to give verification of species ID and track counts to the aerial images. The ground team coordinated with the Kimberley Land Council Research Ethics Advisory Committee and while the objective was to ground truth a flight segment on the day it was flow, it was proven to be logistically impractical due to the large distances involved in the wide-spread flights and the coordination across 11 indigenous groups. Although helicopter flights were considered, the logistic constraints around refuelling discounted this as an option.

Marine Turtles
20 Kimberley Marine Research Program | Project 1.2.2
To complete the ground truth surveys, we opportunistically took advantage of boats scheduled to travel to remote/outer islands or mainland coasts, float planes, helicopter or aeroplane surveys employed in other researcher programs (weed removal, materials transport, fire management). Overall, we established 37 locations that could be evaluated for species identification by an experienced or reliable set of observers. Track photos submitted by untrained viewers were accepted after evaluation of images at higher magnification. Photo verification and training was consistent with the DBCA turtle monitoring field guide (2016) or in the field training of indigenous rangers (all 11 groups). We observed that TOs were unfailingly accurate for species ID with the most frequently encountered species in summer or winter seasons (99% were either flatback or green, with isolated tracks for olive ridley and hawksbill turtles). Field validation was conducted on 27 field trips or 44 meetings or presentations by project staff in 2013-2017 to add ground-level verification on turtle species and traditional knowledge from 11 groups of indigenous rangers.
Ground truth surveys ideally occurred at six beaches during summer flights (including the two most abundant track counts for Lacepede Islands and Eighty Mile Beach, and lesser rookeries scattered across the outer islands) and 29 beaches on winter flights (including Cape Domett, Cassini Is, Maret Isles, Helpman Isles, Troughton Is, Jones Is, and lesser rookeries).
Figure 5. Rangers undertake patrols to check the species and activity in Camden Sound Marine Park.
2.8 GIS products
Photo-mosaics were assembled as a GIS product for geospatial analysis of track counts to establish densities in summer and winter. Post-processing the multiple days of the 2014 aerial survey data was undertaken in steps:
• Producing a single dataset containing all aerial turtle survey points representing the location of individual image capture;
• Completing attribution to agreed specification to include Image file name, date of survey, season, and
Marine Turtles
Kimberley Marine Research Program | Project 1.2.2 21
turtle observation data for each image; • Defining a polygon feature dataset containing the extents of individual images as part of the aerial turtle
survey; • Producing final datasets that included a priority rating for turtle sites identified by aerial photography; • Linking image files to spatial data; and • Producing image mosaics for individual beach sections so that analysis of turtle tracks can be completed
from composite images.
Original data from the 2014 Aerial Turtle Survey included image point location data in .xlsx format for both winter and summer and included attributes such as – latitude, longitude, location name, tracks, pits, species and observations. Image metadata were supplied in .txt format while .kml files for each flight segment contained the geographical footprint extent of each image captured. Separate folders contained images captured for each daily flight segment, organised by survey date.
Work required preparing the dataset ready for processing, analysis and online viewing included the linking of the each image’s metadata to the appropriate image folder by adding the date attribute to the turtle survey point data. Additional attributes were added for SEASON, PROJECT_NAME and PRIORITY. Point features for each day of the aerial turtle survey were then annotated into one point feature dataset: Turtle_Aerial_Survey. The kml files containing the spatial extent of each image were examined as closed line features. FME was used to convert these lines to polygons. For any .kml files that lacked attribution, the image attribution was carefully aligned to the correct image extent polygon. Once attributed the polygons for the image extents were loaded into one polygon feature. Additional features were generated to illustrate priority sites and priority site coverage for the 2014 survey.
Based on a review of the raw aerial survey data the following recommendations should be considered for future aerial surveys:
• data attribution should be to a pre-defined and agreed upon design; • where attributes are captured as a .csv or .xlsx file correct attribution according to data type should be
defined and collected; • KML files containing image extents should be generated with polygon features; and • each polygon feature should be attributed with the image name and date.
3 Results
3.1 Coverage and track determination
Near complete coverage of the Kimberley islands and coast was achieved in survey snap shots of eight to nine flight days in summer nesting season and again for winter nesting season. We captured >44,000 georeferenced aerial images to analyse and annotate with classifications of terrain type, and to quantify the visual evidence of crawl tracks or body pits. Flights were repeated in summer 2014 and winter 2014 to cover presumed midpoints of the nesting seasons since the Kimberley has diffuse year round nesting by green turtles but also summer and winter nesting by flatbacks. We estimate that >90% of all beaches among the 2,633 islands and 1,375 mainland beaches were covered by flights. These provided guidance for later verification by ground surveys in accessible areas.
The broad findings were referenced to the Dampier Peninsula. The North Kimberley (East of the Dampier Peninsula) encompasses two nesting seasons: winter nesting is primarily by flatback turtles and summer nesting is primarily by green turtle nesting. The West Kimberley (Southwest from the Dampier Peninsula through the western boundary of Eighty Mile Beach) hosts summer nesting primarily by flatback turtles.
A scatterplot of track counts against density at a log-log scale (Figure 6) identified three locations (Eighty Mile Beach, Lacepede Islands, and Cape Domett) as clear outliers in the highest scaled category. These rookeries were reported separately to avoid numeric bias of outlier values in statistical analyses. We add a caveat to the conservative estimates at the three high density rookeries because we likely missed tracks that were covered or obscured by later females. Raw data are given for season, placename, track counts, beach length, and density in Appendix 1 and 2.
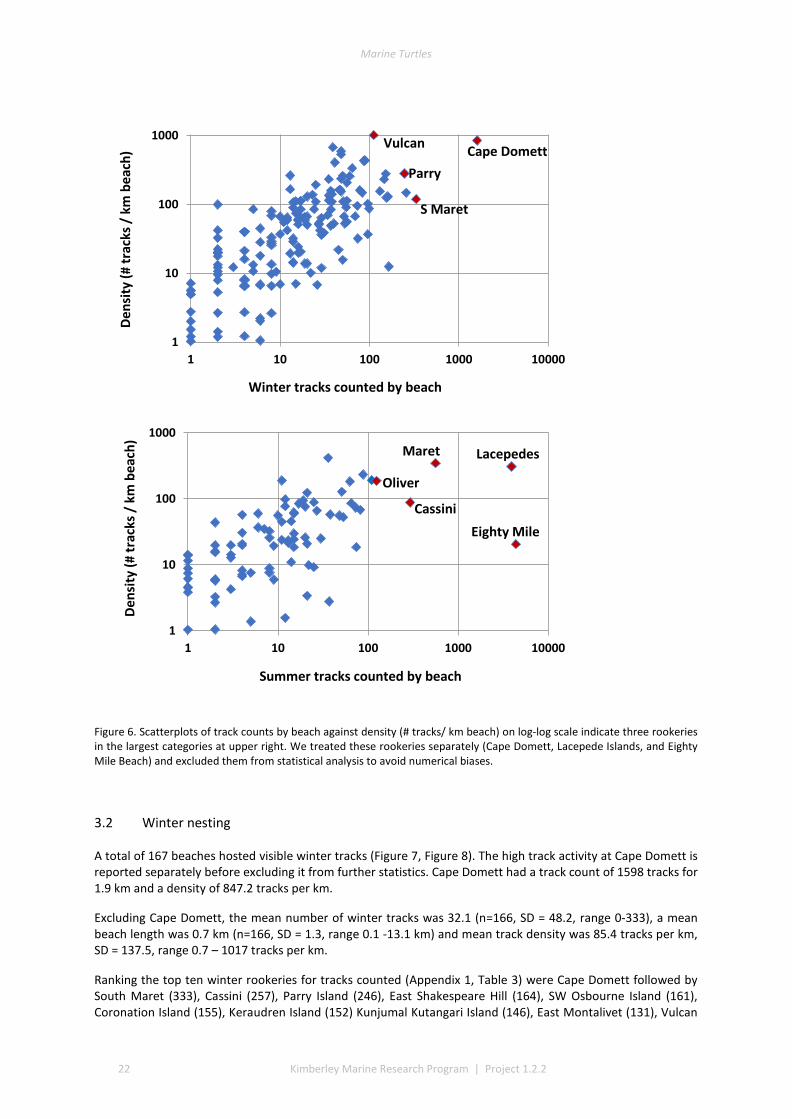
Marine Turtles
22 Kimberley Marine Research Program | Project 1.2.2
Figure 6. Scatterplots of track counts by beach against density (# tracks/ km beach) on log-log scale indicate three rookeries in the largest categories at upper right. We treated these rookeries separately (Cape Domett, Lacepede Islands, and Eighty Mile Beach) and excluded them from statistical analysis to avoid numerical biases.
3.2 Winter nesting
A total of 167 beaches hosted visible winter tracks (Figure 7, Figure 8). The high track activity at Cape Domett is reported separately before excluding it from further statistics. Cape Domett had a track count of 1598 tracks for 1.9 km and a density of 847.2 tracks per km.
Excluding Cape Domett, the mean number of winter tracks was 32.1 (n=166, SD = 48.2, range 0-333), a mean beach length was 0.7 km (n=166, SD = 1.3, range 0.1 -13.1 km) and mean track density was 85.4 tracks per km, SD = 137.5, range 0.7 – 1017 tracks per km.
Ranking the top ten winter rookeries for tracks counted (Appendix 1, Table 3) were Cape Domett followed by South Maret (333), Cassini (257), Parry Island (246), East Shakespeare Hill (164), SW Osbourne Island (161), Coronation Island (155), Keraudren Island (152) Kunjumal Kutangari Island (146), East Montalivet (131), Vulcan
1
10
100
1000
1 10 100 1000 10000
Winter tracks counted by beach
Dens
ity (#
trac
ks /
km
bea
ch) Cape Domett
Parry
S Maret
Vulcan
1
10
100
1000
1 10 100 1000 10000
Summer tracks counted by beach
Dens
ity(#
trac
ks /
km
bea
ch)
Eighty Mile
Lacepedes
Oliver
Cassini
Maret
Marine Turtles
Kimberley Marine Research Program | Project 1.2.2 23
Island (112) and North Maret Island (99). Ranking by density was biased by some short beaches that inflated the density. However, the same rookeries found by track counts commonly had density of >100 tracks/ km with the exceptions of North Maret (87/ km) and East Shakespeare Hill (13/ km).
3.3 Summer nesting
A total of 91 beaches hosted visible summer tracks (Figure 7, Figure 8). The high track activity at the Lacepede Islands and Eighty Mile Beach is reported separately before excluding the locations from further statistics. The Lacepede Islands had 3910 tracks over 12.6 km, for a density of 309 tracks/ km.
Eighty Mile Beach had 4387 tracks, over 212 km, and density of 20.7 tracks per km. However, the means do not reveal that Eighty Mile tracks are concentrated into two beach sections, Wallal in the south and Anna Plains in the north which are interspersed by coastal stretches of barren sand flats or exposed limestone that preclude any nesting. Track counts adjacent to Wallal represented 31.2-52.4 % of all tracks on Eighty Mile Beach, and were consistent with the results of the biennial aerial surveys in 2012, 2014, 2016 which were independent of the WAMSI flights (Pendoley Environmental 2017).
Excluding the Lacepede Islands and Eighty Mile Beach, the mean number of summer tracks was 27.4 (n=89, SD = 68.9, range 1-562), a mean beach length was 1.2 km (n=78, SD = 2.3, range 0.1 -13.2 km) and a mean track density was 48.1 tracks per km, SD = 74.9, range 0.7 – 417 tracks per km.
Ranking the top ten summer rookeries for tracks counted per beach (Appendix 2, Table 4) were Eighty Mile Beach and Lacepede Islands, followed by Maret Island (562) Cassini (293), Parry Island (124), Oliver Island (110), Bougainville Peninsula (88), West Montelivet Island (82), Sir Graham Moore (74) and Condillac Island (73). Ranking by density was biased again by the short beach stretches that inflate the density. High track densities (tracks per kilometre) were recorded from: Maret Island (345), all the Lacepede Islands (309), Oliver Islands (192), Parry Island (186), and Cassini Island (88).

Marine Turtles
24 Kimberley Marine Research Program | Project 1.2.2
Figure 7. The seasonal contrasts for the Kimberley marine turtle track distribution. The Dampier Peninsula is a changeover point where summer green turtle nesting occurs to the east, winter flatback nesting occurs to the east, and summer flatback nesting occurs to the west.
020406080
100120
20 40 60 80 100 120 140 160 180 200
Freq
uenc
y
Number of visible tracks
Seasonal contrast of tracks counted
Winter Summer
0
50
100
150
0.5 1 1.5 2 2.5 3 3.5 4 4.5 5Num
ber o
f bea
ches
Beach length (km)
Seasonal contrast of beach lengths
Winter Summer
0102030405060
20 40 60 80 100 120 140 160 180 200
Freq
uenc
y
Tracks per kilometer
Seasonal contrast of track density
Winter Summer
Marine Turtles
Kimberley Marine Research Program | Project 1.2.2 25
3.4 On-ground surveys
On-ground surveys were conducted in 37 accessible locations after 22 field trips and 44 meetings to verify species by visual inspection of track characteristics. The overlap of summer and winter nesting was defined during on-ground surveys by Kimberley ranger groups. The easternmost summer flatback nesting for the mainland was at One Arm Point verified by Bardi Jawi rangers. An easternmost summer flatback nests for offshore islands were on the Lacepede Islands, verified by the Nyul Nyul rangers. A westernmost winter nest on the mainland was near Lombadina reported by Nyul Nyul rangers.
3.5 Common, uncommon, and absent nesting
The GIS layers for the track data were classed into low (1-10 tracks), medium (10-100 tracks), and high (>100 tracks) track counts. Medium level counts of tracks are dispersed across the Kimberley, with fewer tracks recorded in coastal stretches bordered by rocky cliffs or mangroves. The higher aggregations of tracks (greater than a median of 20 nests) signify beaches of management interest. The most important rookeries ranked by track counts and density were winter flatbacks at Cape Domett, summer greens at the Lacepede Island and summer flatbacks at Wallal-Eighty Mile Beach.
Aerial surveys had low power to detect smaller and less frequent olive ridley or hawksbill turtle tracks. Those species are believed to be at range margins or uncommon/depleted status in the Kimberley. The relatively shallow tracks of lighter-bodied species do not persist as long and the survey period was not in phase with their seasonal phenology. No leatherback or loggerhead tracks were recorded although migrations through in the Kimberley region by both species are known by indigenous knowledge or separate satellite telemetry studies conducted outside the WAMSI project
4 Discussion and Conclusions
The WAMSI turtle project represents a first comprehensive study of remote mainland beaches and islands for the Kimberley. The added spatial information allows a better evaluation of conservation options at rookeries that vary in abundance or density and distance to Traditional Owners/Park Rangers operational bases. The improved spatial understanding will enhance protection of turtle rookeries at both landscape and local scales.
4.1 Management Relevance-local and landscape needs
A critical question for regional managers is how to identify management priorities around species, season and conservation status. We evaluated the high priority beaches across the Kimberley for regional planning, and within Traditional Owner boundaries for local management (Figure 9). The two largest flatback rookeries (Cape Domett-winter season; Eighty Mile Beach-summer season) are bordered by established Marine Parks with Traditional Owners/Park Rangers invested in ongoing annual marine turtle monitoring and management. Many of the smaller or less dense flatback rookeries are located on offshore islands which are more logistically challenging and expensive to monitor (e.g. Maret, Montelivet, and Cassini) but may be protected by the difficult or distant access. Some of the medium sized flatback rookeries are accessible by boat and with some planning could be monitored annually when they are accessed for traditional food (West Governor Island, Helpman Island). The more accessible, low density rookeries at Eco Beach, Cable Beach, and Berkley River may be better utilised for educational opportunities.
The major summer green turtle rookery (Lacepede Islands) is protected as part of a terrestrial Nature Reserve, but is not currently part of an ongoing monitoring or management arrangement. WAMSI partnerships with the Nyul Nyul or Bardi Jawi might be strengthened if an annual monitoring project could be coordinated. A tagging project was conducted by CALM in 1986-2000 and given the high numbers, it may be a better target for a tagging study than a track count monitoring site if research interest were to resume there. Many of the turtles tagged there have historically been harvested on foraging grounds ranging from Cape Leveque and Camden Sound to Arnhem Land (Prince unpublished data). Other high track count green turtle rookeries are grouped on offshore islands (mainly Dambimangari or Wunambal Gaambera country such as Maret, Montelivet, Cassini, Prudhoe and others identified in Waayers 2014). The isolation by distance is currently adequate to afford protection.
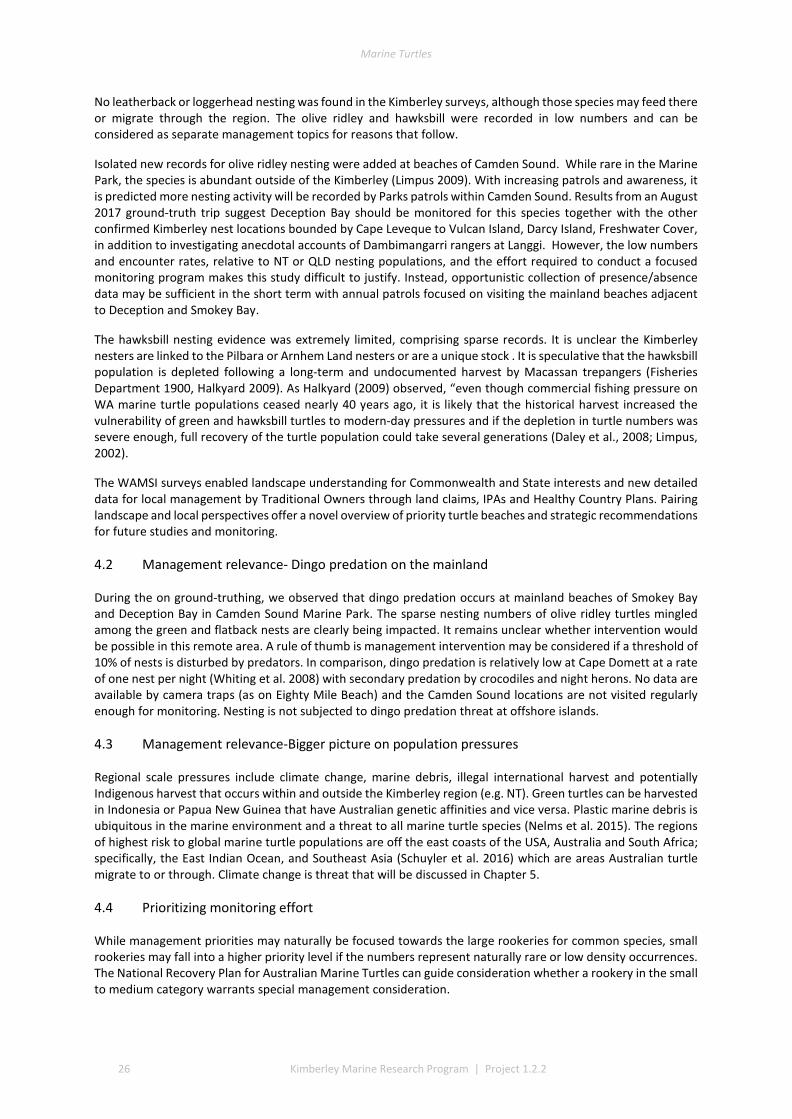
Marine Turtles
26 Kimberley Marine Research Program | Project 1.2.2
No leatherback or loggerhead nesting was found in the Kimberley surveys, although those species may feed there or migrate through the region. The olive ridley and hawksbill were recorded in low numbers and can be considered as separate management topics for reasons that follow.
Isolated new records for olive ridley nesting were added at beaches of Camden Sound. While rare in the Marine Park, the species is abundant outside of the Kimberley (Limpus 2009). With increasing patrols and awareness, it is predicted more nesting activity will be recorded by Parks patrols within Camden Sound. Results from an August 2017 ground-truth trip suggest Deception Bay should be monitored for this species together with the other confirmed Kimberley nest locations bounded by Cape Leveque to Vulcan Island, Darcy Island, Freshwater Cover, in addition to investigating anecdotal accounts of Dambimangarri rangers at Langgi. However, the low numbers and encounter rates, relative to NT or QLD nesting populations, and the effort required to conduct a focused monitoring program makes this study difficult to justify. Instead, opportunistic collection of presence/absence data may be sufficient in the short term with annual patrols focused on visiting the mainland beaches adjacent to Deception and Smokey Bay.
The hawksbill nesting evidence was extremely limited, comprising sparse records. It is unclear the Kimberley nesters are linked to the Pilbara or Arnhem Land nesters or are a unique stock . It is speculative that the hawksbill population is depleted following a long-term and undocumented harvest by Macassan trepangers (Fisheries Department 1900, Halkyard 2009). As Halkyard (2009) observed, “even though commercial fishing pressure on WA marine turtle populations ceased nearly 40 years ago, it is likely that the historical harvest increased the vulnerability of green and hawksbill turtles to modern-day pressures and if the depletion in turtle numbers was severe enough, full recovery of the turtle population could take several generations (Daley et al., 2008; Limpus, 2002).
The WAMSI surveys enabled landscape understanding for Commonwealth and State interests and new detailed data for local management by Traditional Owners through land claims, IPAs and Healthy Country Plans. Pairing landscape and local perspectives offer a novel overview of priority turtle beaches and strategic recommendations for future studies and monitoring.
4.2 Management relevance- Dingo predation on the mainland
During the on ground-truthing, we observed that dingo predation occurs at mainland beaches of Smokey Bay and Deception Bay in Camden Sound Marine Park. The sparse nesting numbers of olive ridley turtles mingled among the green and flatback nests are clearly being impacted. It remains unclear whether intervention would be possible in this remote area. A rule of thumb is management intervention may be considered if a threshold of 10% of nests is disturbed by predators. In comparison, dingo predation is relatively low at Cape Domett at a rate of one nest per night (Whiting et al. 2008) with secondary predation by crocodiles and night herons. No data are available by camera traps (as on Eighty Mile Beach) and the Camden Sound locations are not visited regularly enough for monitoring. Nesting is not subjected to dingo predation threat at offshore islands.
4.3 Management relevance-Bigger picture on population pressures
Regional scale pressures include climate change, marine debris, illegal international harvest and potentially Indigenous harvest that occurs within and outside the Kimberley region (e.g. NT). Green turtles can be harvested in Indonesia or Papua New Guinea that have Australian genetic affinities and vice versa. Plastic marine debris is ubiquitous in the marine environment and a threat to all marine turtle species (Nelms et al. 2015). The regions of highest risk to global marine turtle populations are off the east coasts of the USA, Australia and South Africa; specifically, the East Indian Ocean, and Southeast Asia (Schuyler et al. 2016) which are areas Australian turtle migrate to or through. Climate change is threat that will be discussed in Chapter 5.
4.4 Prioritizing monitoring effort
While management priorities may naturally be focused towards the large rookeries for common species, small rookeries may fall into a higher priority level if the numbers represent naturally rare or low density occurrences. The National Recovery Plan for Australian Marine Turtles can guide consideration whether a rookery in the small to medium category warrants special management consideration.
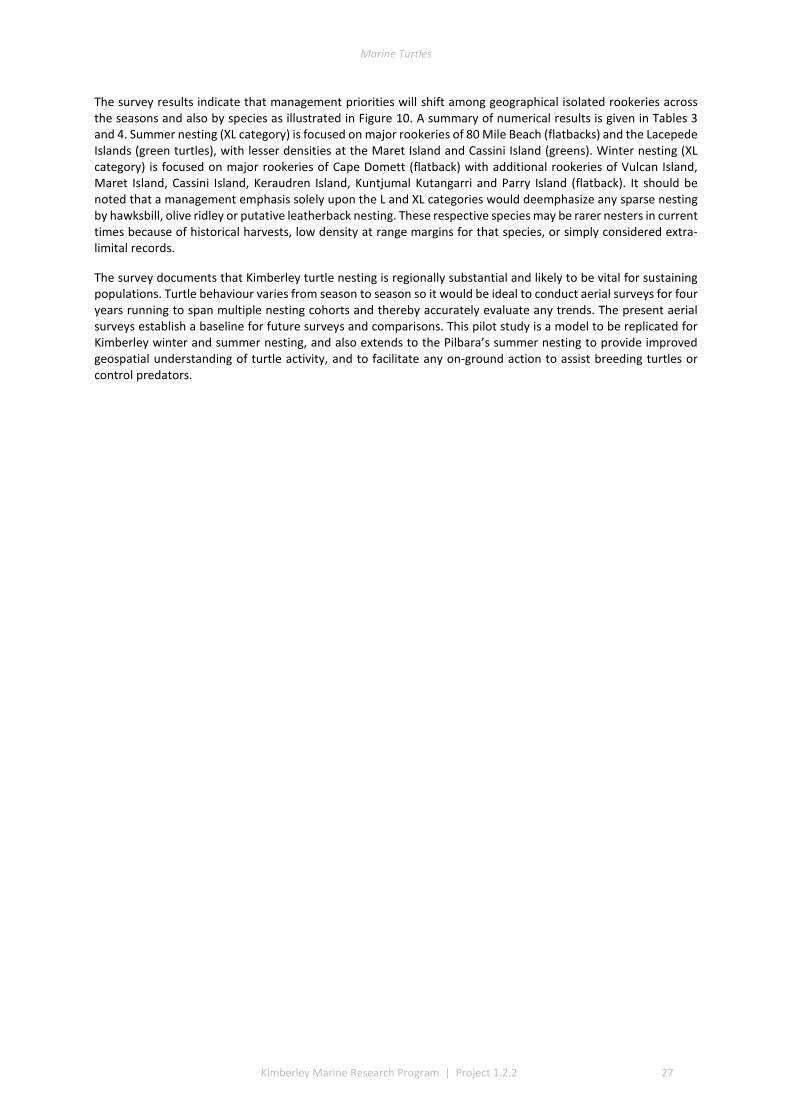
Marine Turtles
Kimberley Marine Research Program | Project 1.2.2 27
The survey results indicate that management priorities will shift among geographical isolated rookeries across the seasons and also by species as illustrated in Figure 10. A summary of numerical results is given in Tables 3 and 4. Summer nesting (XL category) is focused on major rookeries of 80 Mile Beach (flatbacks) and the Lacepede Islands (green turtles), with lesser densities at the Maret Island and Cassini Island (greens). Winter nesting (XL category) is focused on major rookeries of Cape Domett (flatback) with additional rookeries of Vulcan Island, Maret Island, Cassini Island, Keraudren Island, Kuntjumal Kutangarri and Parry Island (flatback). It should be noted that a management emphasis solely upon the L and XL categories would deemphasize any sparse nesting by hawksbill, olive ridley or putative leatherback nesting. These respective species may be rarer nesters in current times because of historical harvests, low density at range margins for that species, or simply considered extra-limital records.
The survey documents that Kimberley turtle nesting is regionally substantial and likely to be vital for sustaining populations. Turtle behaviour varies from season to season so it would be ideal to conduct aerial surveys for four years running to span multiple nesting cohorts and thereby accurately evaluate any trends. The present aerial surveys establish a baseline for future surveys and comparisons. This pilot study is a model to be replicated for Kimberley winter and summer nesting, and also extends to the Pilbara’s summer nesting to provide improved geospatial understanding of turtle activity, and to facilitate any on-ground action to assist breeding turtles or control predators.
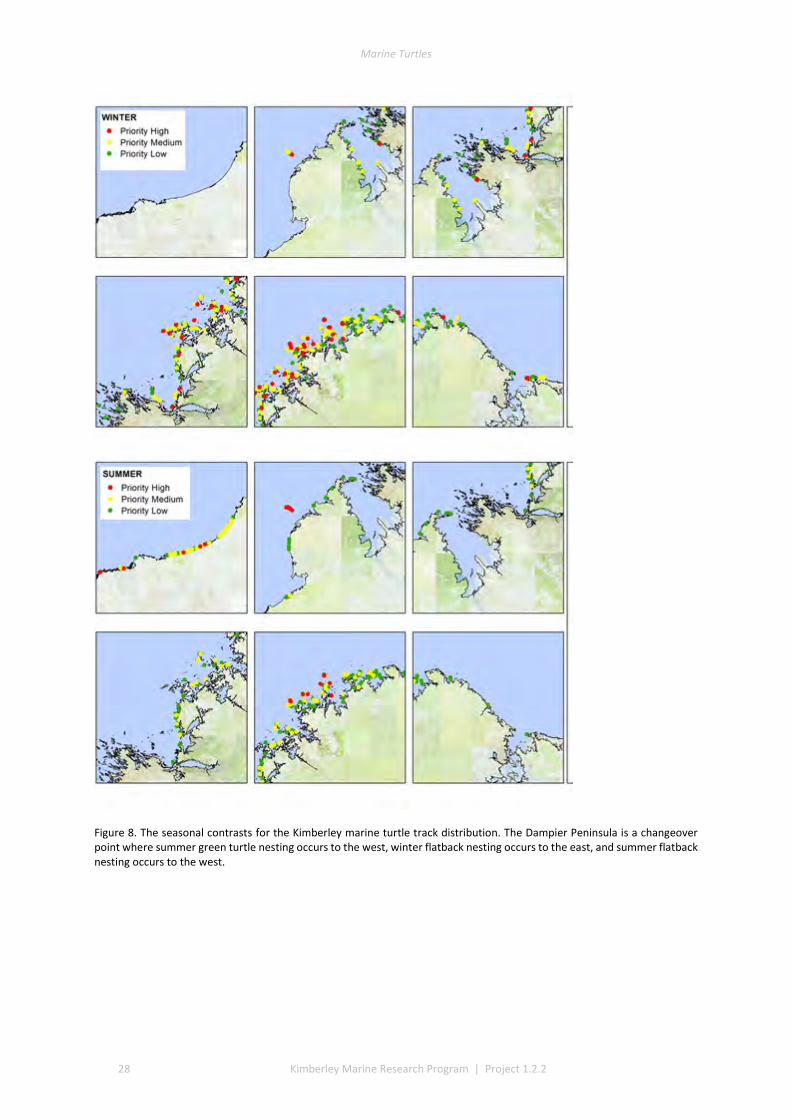
Marine Turtles
28 Kimberley Marine Research Program | Project 1.2.2
Figure 8. The seasonal contrasts for the Kimberley marine turtle track distribution. The Dampier Peninsula is a changeover point where summer green turtle nesting occurs to the west, winter flatback nesting occurs to the east, and summer flatback nesting occurs to the west.
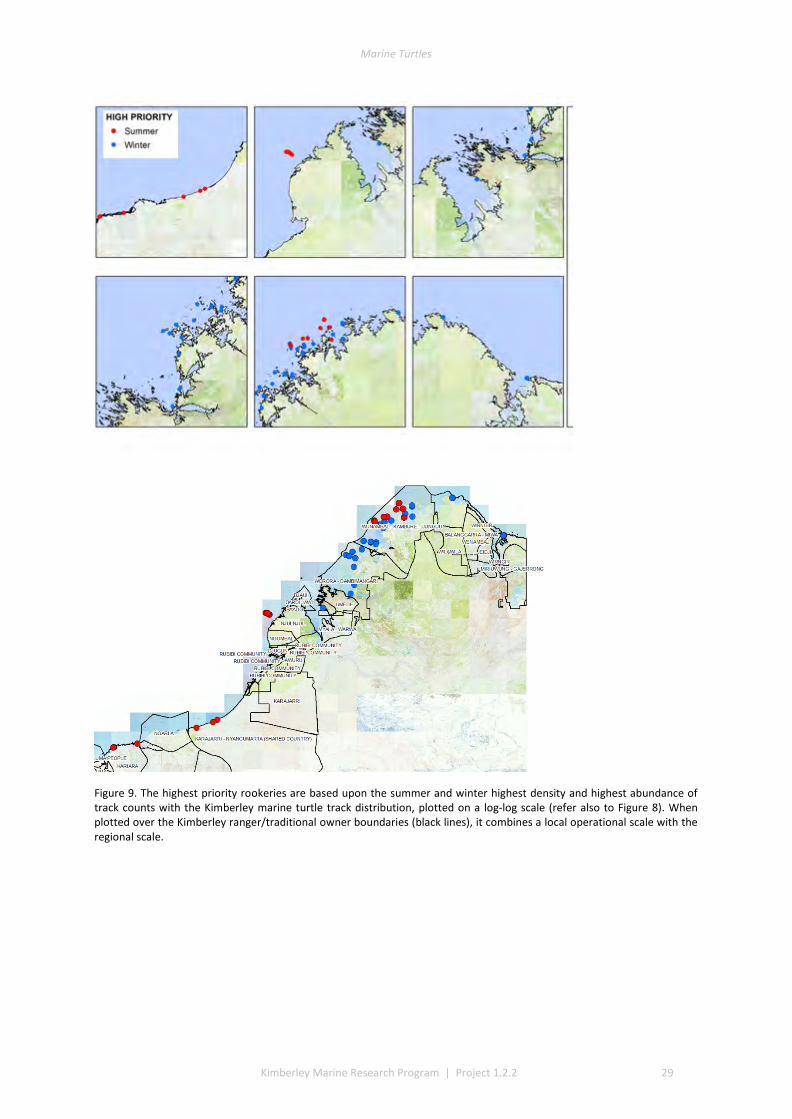
Marine Turtles
Kimberley Marine Research Program | Project 1.2.2 29
Figure 9. The highest priority rookeries are based upon the summer and winter highest density and highest abundance of track counts with the Kimberley marine turtle track distribution, plotted on a log-log scale (refer also to Figure 8). When plotted over the Kimberley ranger/traditional owner boundaries (black lines), it combines a local operational scale with the regional scale.
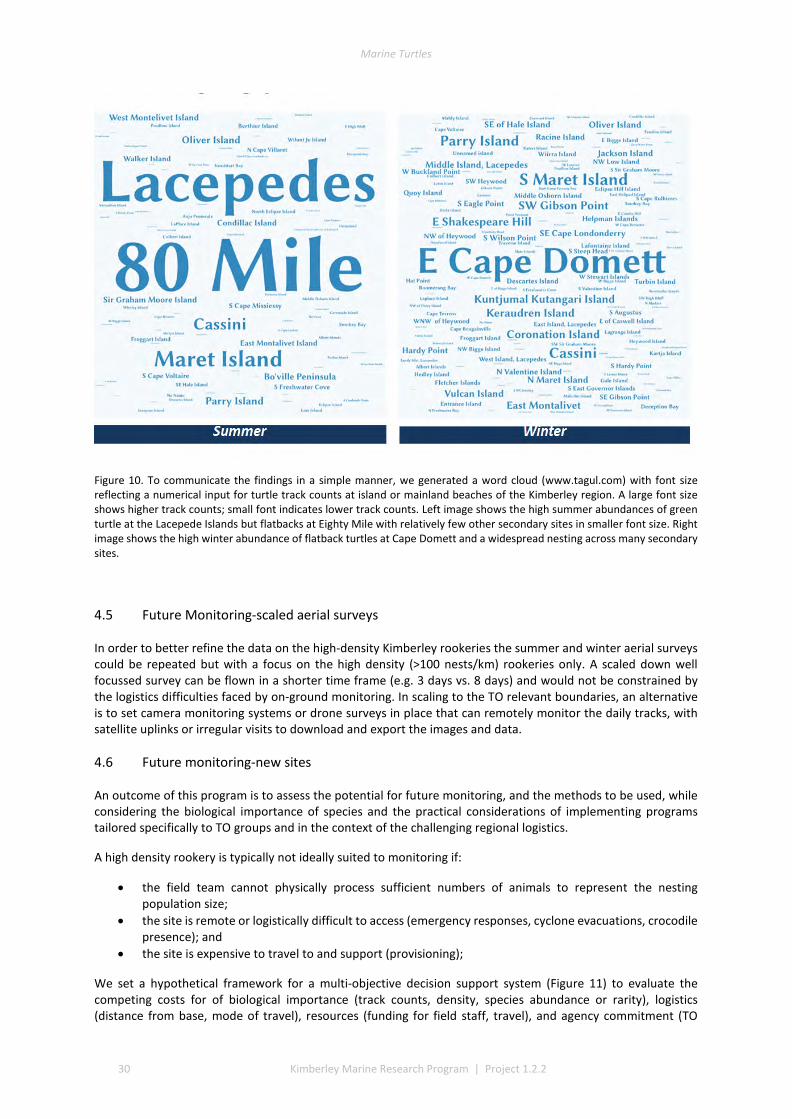
Marine Turtles
30 Kimberley Marine Research Program | Project 1.2.2
Figure 10. To communicate the findings in a simple manner, we generated a word cloud (www.tagul.com) with font size reflecting a numerical input for turtle track counts at island or mainland beaches of the Kimberley region. A large font size shows higher track counts; small font indicates lower track counts. Left image shows the high summer abundances of green turtle at the Lacepede Islands but flatbacks at Eighty Mile with relatively few other secondary sites in smaller font size. Right image shows the high winter abundance of flatback turtles at Cape Domett and a widespread nesting across many secondary sites.
4.5 Future Monitoring-scaled aerial surveys
In order to better refine the data on the high-density Kimberley rookeries the summer and winter aerial surveys could be repeated but with a focus on the high density (>100 nests/km) rookeries only. A scaled down well focussed survey can be flown in a shorter time frame (e.g. 3 days vs. 8 days) and would not be constrained by the logistics difficulties faced by on-ground monitoring. In scaling to the TO relevant boundaries, an alternative is to set camera monitoring systems or drone surveys in place that can remotely monitor the daily tracks, with satellite uplinks or irregular visits to download and export the images and data.
4.6 Future monitoring-new sites
An outcome of this program is to assess the potential for future monitoring, and the methods to be used, while considering the biological importance of species and the practical considerations of implementing programs tailored specifically to TO groups and in the context of the challenging regional logistics.
A high density rookery is typically not ideally suited to monitoring if:
• the field team cannot physically process sufficient numbers of animals to represent the nesting population size;
• the site is remote or logistically difficult to access (emergency responses, cyclone evacuations, crocodile presence); and
• the site is expensive to travel to and support (provisioning);
We set a hypothetical framework for a multi-objective decision support system (Figure 11) to evaluate the competing costs for of biological importance (track counts, density, species abundance or rarity), logistics (distance from base, mode of travel), resources (funding for field staff, travel), and agency commitment (TO
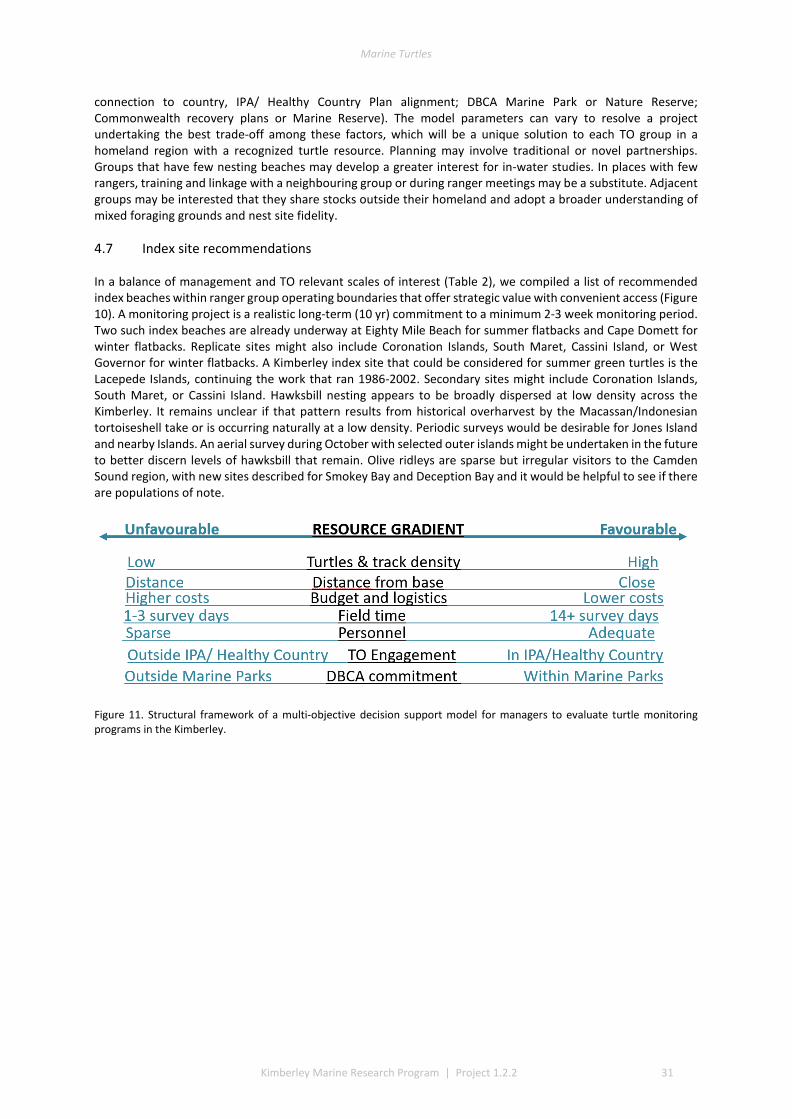
Marine Turtles
Kimberley Marine Research Program | Project 1.2.2 31
connection to country, IPA/ Healthy Country Plan alignment; DBCA Marine Park or Nature Reserve; Commonwealth recovery plans or Marine Reserve). The model parameters can vary to resolve a project undertaking the best trade-off among these factors, which will be a unique solution to each TO group in a homeland region with a recognized turtle resource. Planning may involve traditional or novel partnerships. Groups that have few nesting beaches may develop a greater interest for in-water studies. In places with few rangers, training and linkage with a neighbouring group or during ranger meetings may be a substitute. Adjacent groups may be interested that they share stocks outside their homeland and adopt a broader understanding of mixed foraging grounds and nest site fidelity.
4.7 Index site recommendations
In a balance of management and TO relevant scales of interest (Table 2), we compiled a list of recommended index beaches within ranger group operating boundaries that offer strategic value with convenient access (Figure 10). A monitoring project is a realistic long-term (10 yr) commitment to a minimum 2-3 week monitoring period. Two such index beaches are already underway at Eighty Mile Beach for summer flatbacks and Cape Domett for winter flatbacks. Replicate sites might also include Coronation Islands, South Maret, Cassini Island, or West Governor for winter flatbacks. A Kimberley index site that could be considered for summer green turtles is the Lacepede Islands, continuing the work that ran 1986-2002. Secondary sites might include Coronation Islands, South Maret, or Cassini Island. Hawksbill nesting appears to be broadly dispersed at low density across the Kimberley. It remains unclear if that pattern results from historical overharvest by the Macassan/Indonesian tortoiseshell take or is occurring naturally at a low density. Periodic surveys would be desirable for Jones Island and nearby Islands. An aerial survey during October with selected outer islands might be undertaken in the future to better discern levels of hawksbill that remain. Olive ridleys are sparse but irregular visitors to the Camden Sound region, with new sites described for Smokey Bay and Deception Bay and it would be helpful to see if there are populations of note.
Figure 11. Structural framework of a multi-objective decision support model for managers to evaluate turtle monitoring programs in the Kimberley.
Marine Turtles
32 Kimberley Marine Research Program | Project 1.2.2
5 References
Aldrich F (1934) The Fishery Resources of Western Australia. Fisheries Department, Western Australia.
Balanggarra Aboriginal Corporation (2011) Balanggarra Healthy Country Plan, 49 p
Bardi Jawi Niimidiman Aboriginal Corporation (2013) Bardi Jawi Indigenous Protected Area Management Plan 2013-2023, 29 p.
Bayliss P, Woodward E, Lawson TJ (2015) Integrating indigenous knowledge and survey techniques to develop a baseline for dugong. Western Australian Marine Science Institute Project 1.2.5.
Department of the Environment and Energy (2017) Recovery Plan for Marine Turtles in Australia, Commonwealth of Australia 2017, 154 p
Dambimangari Aboriginal Corporation (2012) Dambimangari Healthy Country Plan 2012-2022, 55 p
Daley B, Griggs P, Marsh H (2008) Exploiting Marine Wildlife in Queensland: The Commercial Dugong and Marine Turtle Fisheries, 1847-1969. Australian Economic History Review, Vol. 48, No.3. Blackwell Publishing Asia Pty Ltd and the Economic History Society of Australia and New Zealand.
Department of Parks and Wildlife (2016) Turtle Monitoring Field Guide 8th ed. Department of Parks and Wildlife, 70 p
Fisheries Department (1900 – 1901) Pearling and turtling industry in North West. Report on. State Records Office of Western Australia. File 1901/0344, Cons 477.
Fitzsimmons NN, Limpus CJ (2014) Marine Turtle Genetic Stocks of the Indo-Pacific: Identifying Boundaries and Knowledge Gaps. Indian Ocean Turtle Newsletter No. 20:2–18
Green N (2011) Triumphs and Tragedies- Oommbulgurri- an Australian aboriginal community. Hesperian Press, 212 p
Guinea ML,Chatto R (1992) "Sea turtles killed in Australian shark fin fishery." Marine Turtle Newsletter 57:5-6
Halkyard B (2009) Exploiting green and hawksbill turtles in Western Australia. A case study of the commercial marine turtle fishery, 1869-1973. Asia Research Centre HMAP Working Paper No. 160: 1-42.
Jackson MMV, Kennett R, Bayliss B, Warren R, Waina N, Adams J, Cheinmora L, Vigilante T, Jungine E, Woolagoodja K, Woolagoodja F, Umbagai J, Holmes J, Weisenberger F (2015) Developing collaborative marine turtle monitoring in the Kimberley region of northern Australia. Ecological Management and Restoration 16:163-176.
Karajarri Traditional Lands Association (2014) Karajarri Healthy Country Plan 2013-2023. Palanapayana
Tukjana Ngurra- Everybody looking after country properly,60 p
Kimberley Land Council (2010) North Kimberley Saltwater Country Plan for Balanggarra, Uungguu, Dambimangari, and Mayala Saltwater Country, 69 p
King PP (1827) Narrative of a Survey of the Intertropcial and Western Coasts of Australia Performed Between the Years 1818 and 1822. John Murray, London
Koeyers A, Koeyers J, Tucker AD (2015) Chelonia mydas (Green Sea Turtle). Predation. Herpetological Review 46 (2): 240.
Limpus CJ (2002) Western Australian Marine Turtle Review: A study commissioned by Western Australian Department of Conservation and Land Management. Department of Conservation and Land Management, Western Australia.
Limpus CJJ (2009) Biological Review of Australian Marine Turtles. Environment Protection Agency, Brisbane. Pp 334.
MacKnight CC (1969) The Farthest Coast- a selection of writing relating to the history of the Northern coast of Australia. Melbourne University Press.218 pp.
MacKnight, CC (1976) The Voyage to Marege. Macassan trepangers in northern Australia. Melbourne University Press. 175 p
Mau R, Halkyard B, Smallwood C, Downs J. (2013) Critical habitats and migratory routes of tagged loggerhead turtles (Caretta caretta) after nesting at Ningaloo Reef, Western Australia. First Western Australian Marine Turtle Symposium, 14
McMahon CR, Bradshaw CJA, Hays GC (2007) "Satellite tracking reveals unusual diving characteristics for a marine reptile, the olive ridley turtle Lepidochelys olivacea." Marine Ecology Progress Series 329:239-252
National Research Council (2010) Assessment of Sea-Turtle Status and Trends: integrating Demography and Abundance. National Academy Press, Washington DC.Robins, C.M., A.M. Goodspeed, I. Poiner & B.D. Harch (2002). Monitoring the catch of turtles in the Northern Prawn Fishery. Fisheries Research and Development Corporation. Department of Agriculture, Fisheries & Forestry: Canberra
Nelms SE Duncan EM, Broderick AC, Galloway TS, Godfrey MH, Hamann M, Lindeque PK, Godley BJ (2015) Plastic and marine turtles.: a review and call for research. ICES Journal of Marine Science 73:165-181
Pendoley KL (2005) Sea turtles and the environmental management of industrial activities in North West Western Australia Murdoch University. Division of Science and Engineering
Marine Turtles
Kimberley Marine Research Program | Project 1.2.2 33
Pendoley Environmental (2017) Eighty Mile Beach Marine Park Marine Turtle Aerial Surveys 2012, 2014, & 2016. Department of Parks and Wildlife Report, 29 p
Pendoley KL, Schofield G, Whittock PA, Ierodiaconou D, Hays GC (2014) Protected species use of a coastal marine migratory corridor connecting marine protected areas. Mar Biol 161:1455–1466
Prince RIT (1994) Status of the Western Australian Marine Turtle Populations: The Western Australian Marine Turtle Project 1986-1990. Proceedings of the Australian Marine Turtle Conservation Workshop, Gold Coast 14-17 November 1990. Queensland Department of Environment and Heritage and Australian Nature Conservation Agency. J. Russell. Canberra, Australian Nature Conservation Agency, p 1-14
Prince RIT (1998) Marine Turtle Conservation: The Links Between Populations in Western Australia and the Northern Australian Region. People and Turtles. Marine Turtle Conservation and Management in Northern Australia. Proceedings of a workshop held at Northern Territory University, Darwin, 3-4 June 1997. R. Kennett, A. Webb, G. Duff, M. Guinea and G. Hill. Darwin, Centre for Indigenous Natural and Cultural Resource Management, Northern Territory University, p 93-99
Prince RIT, Jensen MP, OadesD, Bardi Jawi Rangers (2011) Olive ridley turtle presence and nesting records for Western Australia. Marine Turtle Newsletter 129: 9-11
RPS Environment Pty Ltd (2008) INPEX environmental impact assessment studies: technical appendix – Marine turtle studies Report No. M06605: TA,, INPEX Browse Ltd., Perth, Western Australia.
RPS Environment and Planning Pty Ltd (2010) Woodside Browse turtle technical report: ecology of marine turtles of the Dampier Peninsula and the Lacepede Island Group 2009-2010. Woodside Browse PTY, Ltd Perth. Western Australia.
Schroeder BA, Murphy T (1999) Population surveys (ground and aerial) on nesting beachesIn Eckert, K. L., Bjorndal, K. A., Abreu-Grobois, F. A. and Donnelly, M. (Eds.) 1999. Research and Management Techniques for the Conservation of Sea Turtles. IUCN/SSC Marine Turtle Specialist Group Publication No. 4. Washington, DC, p 1-11
Schuyler QA, Wilcox C, Townsend KA, Wedemeyer-Strombel KR, Balazs GH, van Sebille E, BHardesty BD (2016) Risk analysis reveals global hotspots for marine debris ingestion by sea turtles. Global Change Biology 22:567-576
Short AD (2006a) Beaches of the Northern Australian Coast: The Kimberley, Northern Territory, and Cape York. Sydney University Press, Sydney
Short AD (2006b) Beaches of the Western Australian Coast: Eucla to Roebuck Bay Sydney University Press, Sydney
Stacey N (2007) Boats to Burn: Bajo fishing activity in the Australian fishing zone. Australian National University E Press.
Stuart EJ (1923) A Land of Opportunities. J. Lane the Bodley Head. 144 p.
SWOT Scientific Advisory Board (2011) The state of the world’s sea turtles (SWOT) Minimum Data Standards for Nesting Beach Monitoring. Version 1.0 Handbook, 28 p
Thums M, Waayers D, Huang Z, Pattiaratchi C, Bernus J, Meekan M (2017) Environmental predictors of foraging and transit behaviour in flatback turtles Natator depressus. Endang Spec. Res 32:333–349
Vargas SM, Jensen MP, Ho, SY, Mobaraki A, Broderick D, Mortimer JA, Whiting SD, Miller J, Prince RI, Bell IP, Hoenner X, (2015) Phylogeography, genetic diversity, and management units of hawksbill turtles in the Indo-Pacific. Journal of Heredity, 107: 199-213
Waayer, DA, Smith LM, Malseed BE (2011) Internesting distribution of green Chelonia mydas and flatback turtle Natator depressus at the Lacepede Islands, Western Australia. Journal of the Royal Society of Western Australia 94:59-64
WaayersDA (2014) Marine turtles. In Comrie-Grieg J. and Abdo LLJ(eds) Ecological Studies of the Bonaparte Archipelago and Browse Basin. INPEX Operation, Australia Pty Ltd, Perth Western Australia, p 213-271
Waayers D, Tucker T, Whiting S, Groom G, Vanderklift M, Pillans R, Rossendell J, Pendoley K, Hoenner X, Limpus C, Strydom A, Duke T, Whittock P, Thums M, Howlett K, OadesD, McFarlane G, Guinea M, Whiting A, Dethmers K, Speirs M, King J, Hattingh K, Heithaus M, Thomson J, Holley D, Mau R, Wirsing A, McMahon C (In press). Satellite tracking of marine turtles in south eastern Indian Ocean: a gap analysis of deployments spanning 1990-2016. Indian Ocean Turtle Newsletter 26
Whiting SD (2001). The ecology of immature green and hawksbill turtles foraging on two reef systems in north-western Australia. PhD Dissertation. Northern Territory University, Darwin Australia. 372 p
Whiting SD ,Guinea ML (2005) The Sea Turtles of Ashmore Reef: History, current status ad future direction research and management. Report to DEWHA. Biomarine International, Darwin. 172 p
Whiting AU, Thomson A, Chaloupka M, Limpus CJ (2008). Seasonality, abundance and breeding biology of one of the largest populations of nesting flatback turtles, Natator depressus: Cape Domett, Western Australia. Australian Journal of Zoology 56: 297-303
Whiting SD, Whiting AU (2011) Predation by the saltwater crocodile (Crocodylus porosus) on sea turtle adults, eggs, and hatchlings. Chelonian Conservation and Biology 10:198-205
Marine Turtles
34 Kimberley Marine Research Program | Project 1.2.2
Whiting SD, Long JL, Coyne M (2007) Migration routes and foraging behaviour of olive ridley turtles Lepidochelys olivacea in northern Australia. Endangered Species Research 3:1-9
Whiting S, Tucker A (2015) Planning for the future: Constraints and opportunities for long-term monitoring of marine turtles in Western Australia. In: Whiting S, Tucker A (eds) Proceedings of the Second Australian and Second Western Australian Marine Turtle Symposium. Science Division,
Department of Parks and Wildlife, Perth, Western Australia.
Whittock PA, Pendoley KL, Hamann M (2016). Flexible foraging: Post-nesting flatback turtles on the Australian continental shelf. Journal of Experimental Marine Biology and Ecology 477:112–119
Wunambal Gaambera Aboriginal Corporation (2010) Wunambal Gaambera Healthy Country Plan – Looking after Wunambal Gaambera Country 2010-2020. 56 p
6 Acknowledgments
Rob Ryan developed and installed the Wing 42 Digital Horizon imaging system, piloted the aircraft and developed the flight plan with Kellie Pendoley. For additional assistance with GIS products, we thank Kathy Murray, Chris Barber, Jai Dendai and Graham Lowenthal of the GIS Department in DBCA, and appreciate the WALIS support enabled by Ralph Talbot-Smith. The field work was accomplished through partnerships with the Rangers and Coordinators of the Miriuwung Gajerrong, Balanggarra, Wunambal Gaambera, Dambimangari, Mayala, Bardi Jawi, Nyul Nyul, Yawuru, KariJarri, Nyangumarta and Ngarla Traditional Owners. Kimberley Land Council staff helped with protocols and the Research Ethics and Access Committee process. We are indebted to the Department of Biodiversity, Conservation and Attractions Marine Park staff for coordination in the North Kimberley Marine Park, Lalang-Garram Marine Park, Roebuck Bay Marine Park and Eighty Mile Beach Marine Park. We relied on the friendly and helpful office staff in the East Kimberley (Kununurra) and West Kimberley (Broome) field offices. Ground truth surveys were assisted by Olly Berry, Nicki Mitchell, Blair Bentley, Ryan Douglas, Corrine Douglas and Chris Nutt.

Marine Turtles
Kimberley Marine Research Program | Project 1.2.2 35
Chapter 3 – Genetic stock identification of turtles in the Kimberley
Nancy FitzSimmons1, Oliver Berry2 and Pierre Feutry3 1Australian Rivers Institute, Griffith University, Nathan, Qld 4111 Australia. 2CSIRO National Collections and Marine Infrastructure Indian Ocean Marine Research Centre, The University of Western Australia, M097, 35 Stirling Highway, Crawley, W.A., 6009, Australia.
4CSIRO, Hobart, , TAS, 7000
Executive Summary
This report focuses on characterizing the genetic structure and diversity in green turtle (Chelonia mydas) and flatback turtle (Natator depressus) populations throughout Western Australia, with particular emphasis on breeding sites in the Kimberley bioregion. Marine turtles play an important role in marine ecosystems, they are important cultural symbols and resources for Indigenous communities, and they are iconic species that capture the public’s interest in nature and conservation. Marine turtle populations in Western Australia face a range of anthropogenic pressures that need to be addressed at a population level. Here we use the most current genomic tools to identify population boundaries and to characterise levels of connectivity in these prominent marine species at multiple spatial scales.
Samples from 388 N. depressus individuals were collected from throughout their range in Western Australia at coastal sites in the Kimberley and Pilbara. For C. mydas 125 individuals were collected from coastal sites in the Kimberley and Pilbara and previous samples were available from offshore sites at Ashmore Reef, Scott Reef, and Browse Island. For both species, samples were also available from earlier sampling in Western Australia, the Northern Territory and Queensland. We employed a genotype-by-sequencing approach to characterise genetic diversity within and between these sampling sites. Custom bioinformatics pipelines were developed to analyse these large datasets. After quality control filtering, 1003 single nucleotide polymorphisms (SNPS) were available for analysis of N. depressus and 2074 SNPs for analysis of C. mydas.
Flatback turtles
Flatback turtles exhibit significant levels of genetic differentiation among many sites within Western Australia, and throughout their range, which is consistent with previous mtDNA studies. Six regions were differentiated from one another based on rookeries sampled from the Pilbara, Eighty Mile Beach, Eco Beach, King Sound, NW Kimberley and NE Kimberley. Turtles nesting in the summer at Eco Beach exhibited stronger affinities to other summer nesting turtles in the Pilbara, whereas rookeries from the rest of the Kimberley exhibited stronger affinities to rookeries in the Northern Territory. The most significant genetic subdivision in flatback turtles was across Torres Strait, between rookeries in SE Queensland and all remaining rookeries. A moderate signal of genetic isolation by distance was observed, but this was mostly driven by the genetic disjunction across Torres Strait.
Implications for management
Six management units (sensu Moritz 1994), or stocks, of flatback turtles are represented in Western Australia based on the SNP data and previous mtDNA data. Previously named management units (Pittard 2010) include the Pilbara Coast (Barrow Island, Montebello Islands, Mundabullangana Station and Cemetery Beach), SW Kimberley (Eco Beach) and Joseph Bonaparte Gulf (Cape Domett) and a newly described management unit based on samples from 80 Mile Beach (FitzSimmons et al. in prep). Additional genetic differentiation based on new sample locations and SNP data was identified at King Sound (Helpman Island, Raft Point, Traverse Is) and the NW Kimberley (Slate, Lamarck and Maret Islands). The degree of differentiation among these stocks indicates that genetic exchange is limited.
Green turtles
Genetic mixing was more extensive among green turtles sampled from rookeries in Western Australia in comparison to flatback turtles. Samples from coastal rookeries (including both Pilbara and Kimberley) exhibited the greatest genetic exchange. Nevertheless significant, albeit weak, genetic differentiation was recorded between the Pilbara and Kimberley. This division had not previously been identified. Offshore rookeries
Marine Turtles
36 Kimberley Marine Research Program | Project 1.2.2
(Ashmore Reef, Scott Reef, and Browse Island) formed a discrete sub-group weakly isolated from coastal Kimberley rookeries despite their close proximity. Offshore rookeries were in turn weakly differentiated from each other. All Western Australian rookeries were more connected to each other than to a rookery sampled on the Cobourg peninsula in the Northern Territory. The most prominent genetic division occurred across Torres Strait. Genetic isolation by distance was more pronounced in green turtles across the entire range of rookeries sampled for each species.
Implications for management
These results confirm previous findings that there is genetic exchange among green turtle rookeries along coastal parts of Western Australia, but little exchange among offshore atolls, or between offshore and coastal rookeries. Nevertheless, exchange is not complete, indicating that Pilbara and Kimberley rookeries have a degree of demographic independence. Genetic affinities with Cassini Island are unclear due to a small sample size. Previously identified management units that were based on mtDNA were supported by the SNP data set.
Key residual knowledge gaps
Future additional sampling and genetic analyses of flatback turtles across the Northern Kimberley using mtDNA could help clarify the boundaries between the King Sound, NW and NE Kimberley populations. For green turtles, additional sampling of rookeries in the north Kimberley is needed to determine genetic affinities. Future research should focus on identifying the origins of turtles at foraging grounds around Western Australia, whether through genetic mixed stock analysis or through the analysis of telemetry data where sampling of foraging grounds is not possible.
Marine Turtles
Kimberley Marine Research Program | Project 1.2.2 37
1 Introduction
Marine turtle populations in Western Australia and around the world must contend with a range of anthropogenic and natural pressures. Some pressures operate at local spatial scales that may impact a single rookery, whereas others, such as climate change, marine debris and toxins, are more dispersed across rookeries and at foraging grounds. A key to managing these and similar pressures is an understanding of the extent of movement among breeding sites since this determines their level of demographic interdependence and vulnerability to local or dispersed pressures. This provides the basis for defining populations, or genetic stocks, which can then be integrated with knowledge of important migration routes and feeding grounds.
Where marine turtle populations can be intensively monitored, mark-recapture studies of tagged nesting females is an effective way to measure the geographic extent of nesting sites used by particular females. However, these methods are not well suited to remote and inaccessible regions, such as the Kimberley in Western Australia. Population genetic analyses, involving the measurement of genetic variation in wild populations, can provide a valuable indirect proxy for movements, and have proven their worth in studies of marine turtles globally (Jensen et al. 2013). Previous genetic studies in Australia and globally (Dethmers et al 2006, Jensen et al 2013, Vargas et al. 2015) have shown that population boundaries are not always predictable based on proximity, and require the use of genetic markers to determine which rookeries are part of the same, or different populations. By collecting tissue samples from nesting turtles at rookeries throughout a region and quantifying the genetic diversity at each rookery, the extent of genetic exchange among rookeries can be determined. From this, population boundaries can be defined and combined with data from mark-recapture studies and satellite telemetry to understand the geographic extent of the population. Previous genetic studies of marine turtles in the Indo-Pacific have been largely focused on analyses of mitochondrial DNA (mtDNA; e.g., Dethmers et al. 2006, Vargas et al. 2015), which provides information on genetic differentiation among rookeries that is solely based on females. While this is extremely important for understanding female behaviour and the historic exchange among rookeries, we need to compare this to genetic data from nuclear genes that represent the combined male and female genetic diversity and structure.
Single nucleotide polymorphisms (SNPs) are the current state of the art for genomic research. Typical population genomic analyses scrutinise several thousand independent genetic polymorphisms (Narum et al. 2013). This provides sufficient genome coverage in non-model organisms so that the power to resolve subtle spatial processes is high (Willing et al. 2012). Our studies of flatback and green turtles develop the first SNP markers for these species in Australia, we expand on sample sites, particularly for flatback turtles in the Kimberley, and we compare our data to previous studies.
Current knowledge of flatback turtle stock structure in Western Australia identifies genetic stocks in the Pilbara, the southwest Kimberley and at Cape Domett, with unknown stock boundaries, particularly in the Kimberley (FitzSimmons and Limpus 2014, Pittard 2010). Green turtle stock structure includes a geographically widespread stock of the Northwest Shelf (Northwest Cape to the Lacepede Islands), which is in contrast to an isolated stock at Ashmore Reef and another at the Scott and Browse reefs (Dethmers et al. 2006; Jensen 2010). Knowledge gaps for flatback turtle stocks include unknown boundaries or stocks from the northern Pilbara and throughout the Kimberley, particularly with regard to differences in nesting phenology. For a better understanding of green turtle population, analyses of a vast array of nuclear polymorphisms are needed to better understand the role of male-mediated gene flow among stocks and to explore whether there is heterogeneity within the Northwest Shelf stock.
2 Materials and Methods
2.1 Sampling
Samples from flatback and green turtles were collected through a combination of targeted fieldwork and opportunistically over a broad geographic range from 2013-2016 through WAMSI (Figures 1 – 3; Appendix 1) and as part of other projects since 1991 (Supplementary Tables 1, 2). The sampling regime was designed to encompass the maximum geographic range within Australian waters and all of the stocks previously recognised (FitzSimmons and Limpus 2014). In addition, in the case of N. depressus, samples were collected to include both summer and winter nesting sites, particularly throughout the Kimberley where a transition between the timing of nesting was believed to occur (see Chapter 2). For C. mydas, effort was directed towards collecting samples

Marine Turtles
38 Kimberley Marine Research Program | Project 1.2.2
from both the Lacepede Islands and Northwest Cape rookeries (Figure 3, Appendix 3) because these have previously been included in a single large genetic stock with rookeries that are 1000 km apart (Dethmers et al. 2006).
Typically, 5 mm biopsy samples were collected from the trailing edge of the front flipper of female turtles when they were returning to the water after egg laying. Additional tissue samples were obtained from recently dead hatchlings or breeding adults. Biopsies were collected with sterile single-use biopsy punches in accordance with DBCA’s standard operating protocols (T. Tucker pers. comm). During targeted WAMSI fieldwork, biopsies were stored in 2mL absolute ethanol and transported to the laboratory where they were stored at 4°C. Many previously collected samples were stored in a solution of 20% dimethysulfoxide (DMSO) under a range of conditions. A total of 376 N. depressus and 188 C. mydas samples were prepared for analysis.
Figure 1. Map showing sampling sites for Natator depressus. See Figure 3 for detail of Kimberley sampling sites.
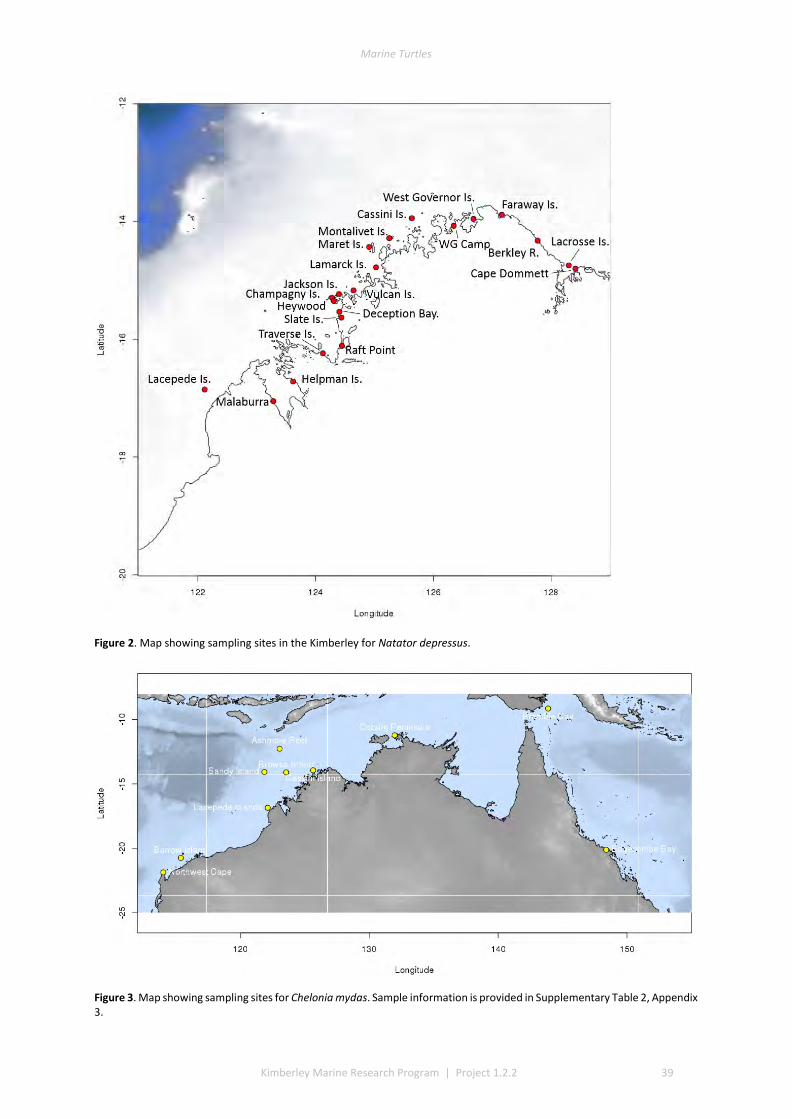
Marine Turtles
Kimberley Marine Research Program | Project 1.2.2 39
Figure 2. Map showing sampling sites in the Kimberley for Natator depressus.
Figure 3. Map showing sampling sites for Chelonia mydas. Sample information is provided in Supplementary Table 2, Appendix 3.
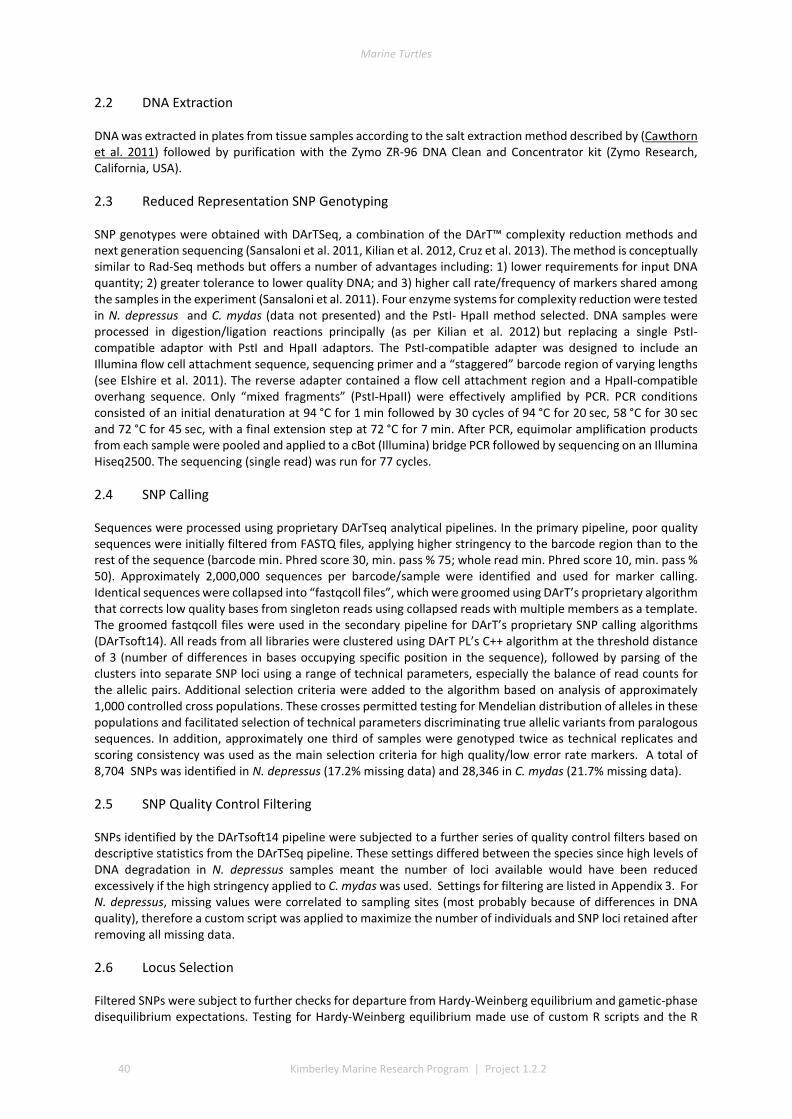
Marine Turtles
40 Kimberley Marine Research Program | Project 1.2.2
2.2 DNA Extraction
DNA was extracted in plates from tissue samples according to the salt extraction method described by (Cawthorn et al. 2011) followed by purification with the Zymo ZR-96 DNA Clean and Concentrator kit (Zymo Research, California, USA).
2.3 Reduced Representation SNP Genotyping
SNP genotypes were obtained with DArTSeq, a combination of the DArT™ complexity reduction methods and next generation sequencing (Sansaloni et al. 2011, Kilian et al. 2012, Cruz et al. 2013). The method is conceptually similar to Rad-Seq methods but offers a number of advantages including: 1) lower requirements for input DNA quantity; 2) greater tolerance to lower quality DNA; and 3) higher call rate/frequency of markers shared among the samples in the experiment (Sansaloni et al. 2011). Four enzyme systems for complexity reduction were tested in N. depressus and C. mydas (data not presented) and the PstI- HpaII method selected. DNA samples were processed in digestion/ligation reactions principally (as per Kilian et al. 2012) but replacing a single PstI-compatible adaptor with PstI and HpaII adaptors. The PstI-compatible adapter was designed to include an Illumina flow cell attachment sequence, sequencing primer and a “staggered” barcode region of varying lengths (see Elshire et al. 2011). The reverse adapter contained a flow cell attachment region and a HpaII-compatible overhang sequence. Only “mixed fragments” (PstI-HpaII) were effectively amplified by PCR. PCR conditions consisted of an initial denaturation at 94 °C for 1 min followed by 30 cycles of 94 °C for 20 sec, 58 °C for 30 sec and 72 °C for 45 sec, with a final extension step at 72 °C for 7 min. After PCR, equimolar amplification products from each sample were pooled and applied to a cBot (Illumina) bridge PCR followed by sequencing on an Illumina Hiseq2500. The sequencing (single read) was run for 77 cycles.
2.4 SNP Calling
Sequences were processed using proprietary DArTseq analytical pipelines. In the primary pipeline, poor quality sequences were initially filtered from FASTQ files, applying higher stringency to the barcode region than to the rest of the sequence (barcode min. Phred score 30, min. pass % 75; whole read min. Phred score 10, min. pass % 50). Approximately 2,000,000 sequences per barcode/sample were identified and used for marker calling. Identical sequences were collapsed into “fastqcoll files”, which were groomed using DArT’s proprietary algorithm that corrects low quality bases from singleton reads using collapsed reads with multiple members as a template. The groomed fastqcoll files were used in the secondary pipeline for DArT’s proprietary SNP calling algorithms (DArTsoft14). All reads from all libraries were clustered using DArT PL’s C++ algorithm at the threshold distance of 3 (number of differences in bases occupying specific position in the sequence), followed by parsing of the clusters into separate SNP loci using a range of technical parameters, especially the balance of read counts for the allelic pairs. Additional selection criteria were added to the algorithm based on analysis of approximately 1,000 controlled cross populations. These crosses permitted testing for Mendelian distribution of alleles in these populations and facilitated selection of technical parameters discriminating true allelic variants from paralogous sequences. In addition, approximately one third of samples were genotyped twice as technical replicates and scoring consistency was used as the main selection criteria for high quality/low error rate markers. A total of 8,704 SNPs was identified in N. depressus (17.2% missing data) and 28,346 in C. mydas (21.7% missing data).
2.5 SNP Quality Control Filtering
SNPs identified by the DArTsoft14 pipeline were subjected to a further series of quality control filters based on descriptive statistics from the DArTSeq pipeline. These settings differed between the species since high levels of DNA degradation in N. depressus samples meant the number of loci available would have been reduced excessively if the high stringency applied to C. mydas was used. Settings for filtering are listed in Appendix 3. For N. depressus, missing values were correlated to sampling sites (most probably because of differences in DNA quality), therefore a custom script was applied to maximize the number of individuals and SNP loci retained after removing all missing data.
2.6 Locus Selection
Filtered SNPs were subject to further checks for departure from Hardy-Weinberg equilibrium and gametic-phase disequilibrium expectations. Testing for Hardy-Weinberg equilibrium made use of custom R scripts and the R

Marine Turtles
Kimberley Marine Research Program | Project 1.2.2 41
packages SNPassoc (González et al. 2007) and pegas (González et al. 2007, Paradis 2010, R Core Team 2014). Testing for gametic-phase disequilibrium made use of custom R scripts and the R packages doParallel (Calaway et al. 2014) and Adegenet (Jombart 2008). Both Hardy-Weinberg and gametic-phase disequilibrium testing was carried out separately for each sampling site, and only applied to sites where the sample size was greater than 20. For Hardy-Weinberg testing we removed loci that showed departures from expectations at P < 0.05 in 5 or more of the 13 sample sites. For gametic-phase disequilibrium we removed loci with R2 values > 0.8 in 5 or more of the 13 sampling sites.
Testing for Markers Under Selection
We used the R package OutFlank (Whitlock & Lotterhos 2015) to identify outlier loci putatively under the influence of directional selection. The approach implemented in Outflank is based on an improved method for deriving the null distribution of population differentiation for neutral loci. It results in fewer false positives than other outlier tests, which are more influenced by the effects of demographic history (Lotterhos & Whitlock 2015). We ran Outflank with 5% left and right trim for the null distribution of FST, minimum heterozygosity for loci of 0.1, and a 5% false discovery rate (q value). This identified SNPs under putative directional selection. These loci were removed from further analyses unless noted.
Outlier loci were Blasted against the Ensemble database to search for significant homology to genes of known function. Search criteria were set at a maximum E-value of 1.00E-05 and identity ≥ 85%.
2.7 Descriptive Statistics
Levels of genetic diversity including observed and expected heterozygosity, allelic richness (El Mousadik & Petit 1996) and the inbreeding coefficient (FIS) were calculated for each sampling site with the R package Hierfstat (Goudet 2005).
2.8 Genetic Sub-Division
The fixation index of genetic sub-division (FST) was estimated overall and pairwise between each sampling site according to the Weir & Cockerham (1984) method using the R package StAMPP (Pembleton et al. 2013). The significance of the observed subdivision between all pairs of sampling sites was tested with 9999 bootstraps over loci. Tests of overall genic differentiation among sampling sites and between coastal Kimberley sampling sites were conducted with GenePop (Rousset 2008), based on genotypic differentiation and exact G tests. MCMC settings were as follows: dememorization 1000, batches 100, iterations per batch 1000.
2.9 Model-based Clustering Analysis
We used a model-based clustering approach to evaluate whether genetic variation was partitioned geographically, and at what scale. This was implemented in the software Structure 2.3.4 (Pritchard et al. 2000) run on the CSIRO Accelerator Cluster “Bragg”, which consists of 128 Dual Xeon 8-core E5-2650 compute nodes. Structure seeks to group individuals in such a way that the groups maximise conformity to Hardy-Weinberg and linkage equilibrium. We ran Structure across multiple pre-defined values for K (number of clusters), and evaluated the fit of the data to different values of K. We conducted an overall analysis incorporating all sampling sites for both species and varied K between 2 and 10. The fits of alternative models were evaluated with the Delta K method (Evanno et al., 2005) implemented in Clumpak (Kopelman et al., 2015) and based on 20 independent runs for each value of K. For all runs we incorporated a 200,000 iteration burn-in followed by 500,000 clustering iterations. Complete runs took between 1 and 2 days on the Bragg cluster. We ensured the adequacy of the run length by checking the runtime likelihood and alpha for stability. For all runs we assumed that allele frequencies were correlated between sampling sites and allowed for admixture. We incorporated prior information about sampling sites to assist clustering (LOCPRIOR=1). A subsequent set of STRUCTURE runs using identical settings was conducted on the cluster identified in the initial set of runs consisting of Pilbara and Kimberley samples but with sample sites grouped with neighbouring sites as needed to increase sample sizes.
2.10 Isolation by Distance
We applied Mantel tests to evaluate correlations between linearised FST (FST/(1-FST) and geographic distance.

Marine Turtles
42 Kimberley Marine Research Program | Project 1.2.2
Mantel tests were conducted on the whole dataset, and on the coastal Kimberley dataset. Geographic distances between sites were calculated based on the shortest across-water distance with a minimum water depth of 1 m as this was the minimum depth specifiable. These estimates were calculated with the Marmap R package (Pante & Simon-Bouhet 2013) and based on the GEBCO 2014 30-second bathymetry available from the British Oceanographic Data Centre. We employed partial Mantel tests to test for a correlation between linearised FST and oceanographic resistance while controlling for log (geographic distance). This analysis was conducted with the Vegan package in R (Oksanen et al. 2007).
3 Results
3.1 Descriptive statistics Natator depressus
After filtering, sample sizes ranged from 6 to 31 individuals per site (Table 1). This represented an average sample success of 70.7% (s.d = 19.8%, range 99.2-44.6%) across the sites. Observed and expected heterozygoisities varied across the sites. Inbreeding coefficients were all positive indicating no evidence for inbreeding at any sample site.
Table 1. Descriptive statistics for 363 individual Natator depressus genotyped at 1003 SNP loci. N mean number of individuals genotyped at each locus; SE standard error, Ar allelic richness; Ho observed heterozygosity, Hexp expected heterozygosity, Fis inbreeding coefficient.
Pooled sample N SE Ar SE Ho SE Hexp SE Fis SE
Pilbara West 13.5 0.11 1.25 0.007 0.191 0.006 0.255 0.007 0.221 0.014
Pilbara East Munda/Delambre Is 22.3 0.21 1.25 0.006 0.185 0.006 0.254 0.006 0.269 0.013
Pilbara East Cemetery Bch 22.1 0.21 1.25 0.006 0.174 0.005 0.253 0.007 0.298 0.013
Kimberley West 80 Mile 6.2 0.11 1.24 0.007 0.118 0.005 0.274 0.008 0.483 0.017
Kimberley West Eco Bch 24.7 0.18 1.25 0.006 0.199 0.006 0.247 0.006 0.198 0.013
Kimberley NW S 15.4 0.19 1.24 0.006 0.195 0.006 0.237 0.006 0.173 0.012
Kimberley NW N 26.6 0.16 1.24 0.007 0.198 0.006 0.240 0.007 0.172 0.012
Kimberley N 1 22.8 0.14 1.24 0.006 0.202 0.006 0.243 0.006 0.178 0.013
Kimberley N 2 10.7 0.20 1.25 0.007 0.124 0.005 0.263 0.007 0.471 0.015
Kimberley East 27.3 0.14 1.24 0.006 0.219 0.007 0.245 0.006 0.131 0.013
Northern Territory 30.9 0.22 1.26 0.006 0.204 0.006 0.263 0.006 0.327 0.014
QLD Gulf 23.8 0.14 1.19 0.006 0.168 0.006 0.186 0.006 0.096 0.013
QLD SE 20.3 0.14 1.26 0.006 0.199 0.006 0.263 0.006 0.322 0.015
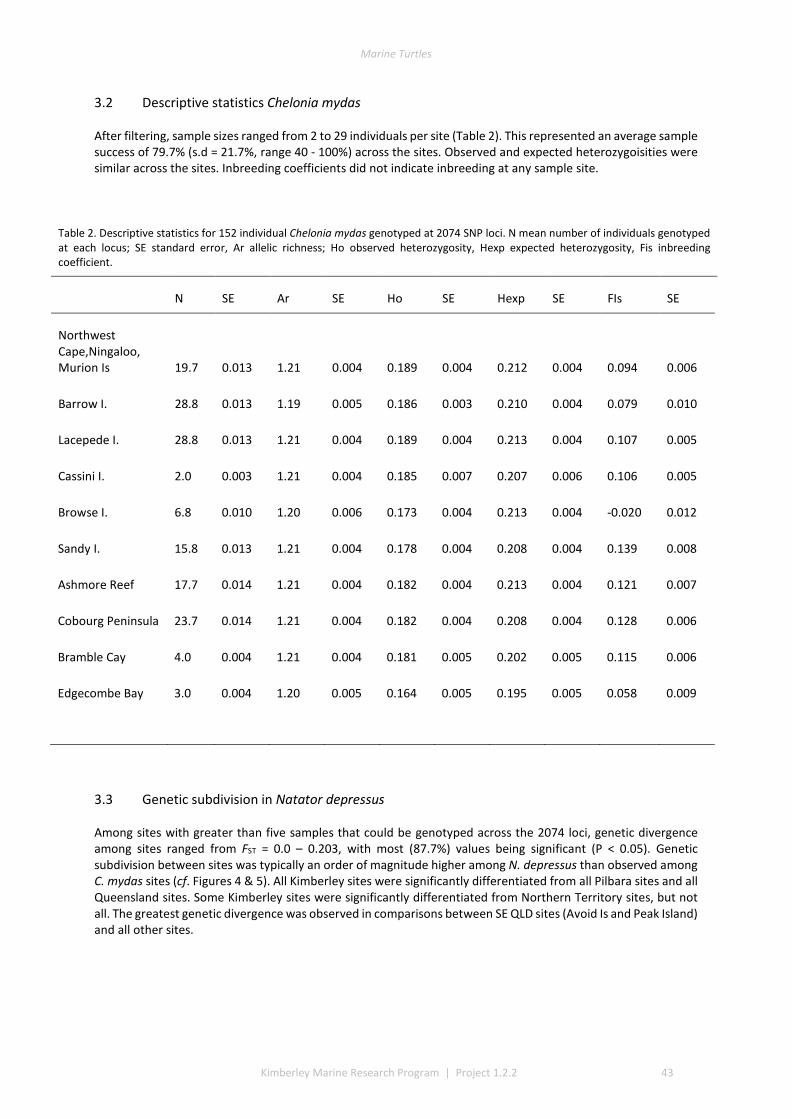
Marine Turtles
Kimberley Marine Research Program | Project 1.2.2 43
3.2 Descriptive statistics Chelonia mydas
After filtering, sample sizes ranged from 2 to 29 individuals per site (Table 2). This represented an average sample success of 79.7% (s.d = 21.7%, range 40 - 100%) across the sites. Observed and expected heterozygoisities were similar across the sites. Inbreeding coefficients did not indicate inbreeding at any sample site.
Table 2. Descriptive statistics for 152 individual Chelonia mydas genotyped at 2074 SNP loci. N mean number of individuals genotyped at each locus; SE standard error, Ar allelic richness; Ho observed heterozygosity, Hexp expected heterozygosity, Fis inbreeding coefficient.
N SE Ar SE Ho SE Hexp SE FIs SE
Northwest Cape,Ningaloo, Murion Is 19.7 0.013 1.21 0.004 0.189 0.004 0.212 0.004 0.094 0.006
Barrow I. 28.8 0.013 1.19 0.005 0.186 0.003 0.210 0.004 0.079 0.010
Lacepede I. 28.8 0.013 1.21 0.004 0.189 0.004 0.213 0.004 0.107 0.005
Cassini I. 2.0 0.003 1.21 0.004 0.185 0.007 0.207 0.006 0.106 0.005
Browse I. 6.8 0.010 1.20 0.006 0.173 0.004 0.213 0.004 -0.020 0.012
Sandy I. 15.8 0.013 1.21 0.004 0.178 0.004 0.208 0.004 0.139 0.008
Ashmore Reef 17.7 0.014 1.21 0.004 0.182 0.004 0.213 0.004 0.121 0.007
Cobourg Peninsula 23.7 0.014 1.21 0.004 0.182 0.004 0.208 0.004 0.128 0.006
Bramble Cay 4.0 0.004 1.21 0.004 0.181 0.005 0.202 0.005 0.115 0.006
Edgecombe Bay 3.0 0.004 1.20 0.005 0.164 0.005 0.195 0.005 0.058 0.009
3.3 Genetic subdivision in Natator depressus
Among sites with greater than five samples that could be genotyped across the 2074 loci, genetic divergence among sites ranged from FST = 0.0 – 0.203, with most (87.7%) values being significant (P < 0.05). Genetic subdivision between sites was typically an order of magnitude higher among N. depressus than observed among C. mydas sites (cf. Figures 4 & 5). All Kimberley sites were significantly differentiated from all Pilbara sites and all Queensland sites. Some Kimberley sites were significantly differentiated from Northern Territory sites, but not all. The greatest genetic divergence was observed in comparisons between SE QLD sites (Avoid Is and Peak Island) and all other sites.

Marine Turtles
44 Kimberley Marine Research Program | Project 1.2.2
Figure 4. Heatmap illustrating pairwise FST between all Natator depressus sampling sites populations (Weir & Cockerham FST). *** P < 0.001, ** P < 0.01, * P < 0.05, - P > 0.05 based on 1000 bootstraps.
3.4 Genetic subdivision in Chelonia mydas
Among sites with greater than five samples that could be genotyped across the 2074 loci, genetic divergence among sites ranged from FST = 0.0 – 0.01, with all values being significant (P < 0.05) except for Barrow Island and Northwest Cape (Figure 4). Barrow Island and the Northwest Cape were significantly, albeit weakly, divergent from Lacepede Islands. Higher levels of divergence were apparent in all other comparisons of sites. The greatest genetic divergence was observed in comparisons with Bramble Cay and Edgecombe Bay and all other sites, and between the Cobourg Peninsula and other sites.

Marine Turtles
Kimberley Marine Research Program | Project 1.2.2 45
Figure 5. Heatmap illustrating pairwise FST between all Chelonia mydas sampling sites (Weir & Cockerham FST). *** P < 0.001, ** P < 0.01, * P < 0.05, - P > 0.05 based on 1000 bootstraps. Sample sizes in parentheses.
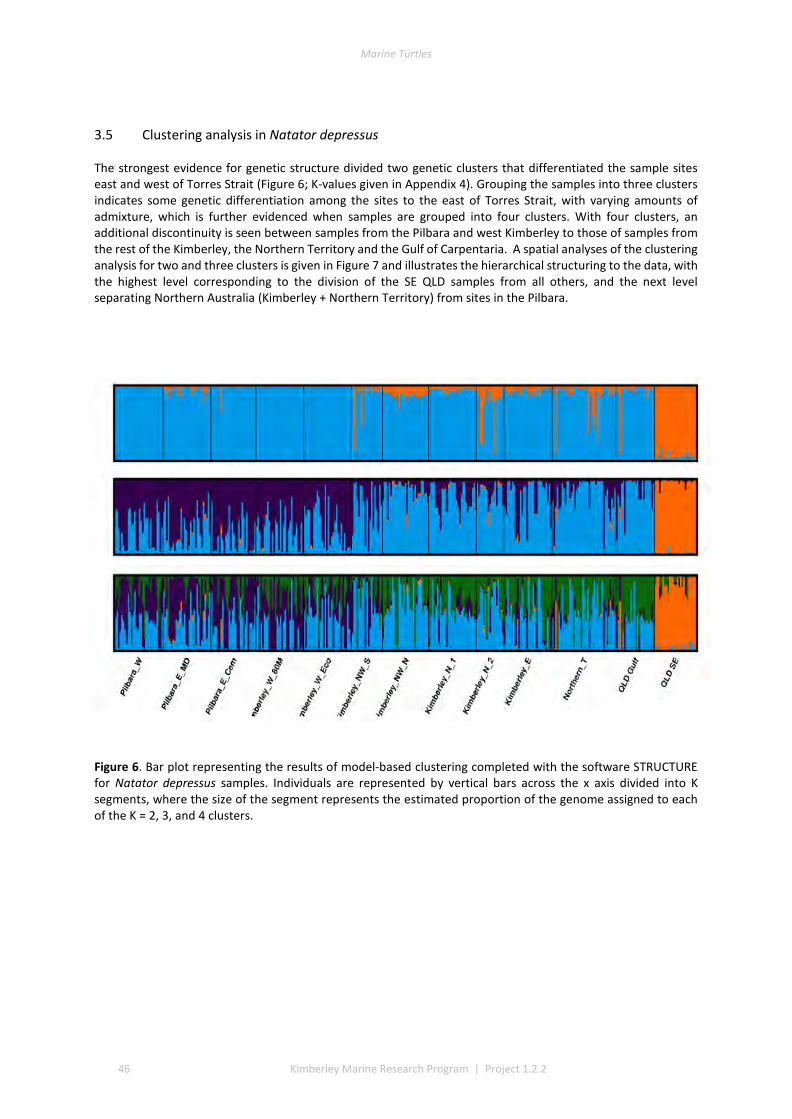
Marine Turtles
46 Kimberley Marine Research Program | Project 1.2.2
3.5 Clustering analysis in Natator depressus
The strongest evidence for genetic structure divided two genetic clusters that differentiated the sample sites east and west of Torres Strait (Figure 6; K-values given in Appendix 4). Grouping the samples into three clusters indicates some genetic differentiation among the sites to the east of Torres Strait, with varying amounts of admixture, which is further evidenced when samples are grouped into four clusters. With four clusters, an additional discontinuity is seen between samples from the Pilbara and west Kimberley to those of samples from the rest of the Kimberley, the Northern Territory and the Gulf of Carpentaria. A spatial analyses of the clustering analysis for two and three clusters is given in Figure 7 and illustrates the hierarchical structuring to the data, with the highest level corresponding to the division of the SE QLD samples from all others, and the next level separating Northern Australia (Kimberley + Northern Territory) from sites in the Pilbara.
Figure 6. Bar plot representing the results of model-based clustering completed with the software STRUCTURE for Natator depressus samples. Individuals are represented by vertical bars across the x axis divided into K segments, where the size of the segment represents the estimated proportion of the genome assigned to each of the K = 2, 3, and 4 clusters.
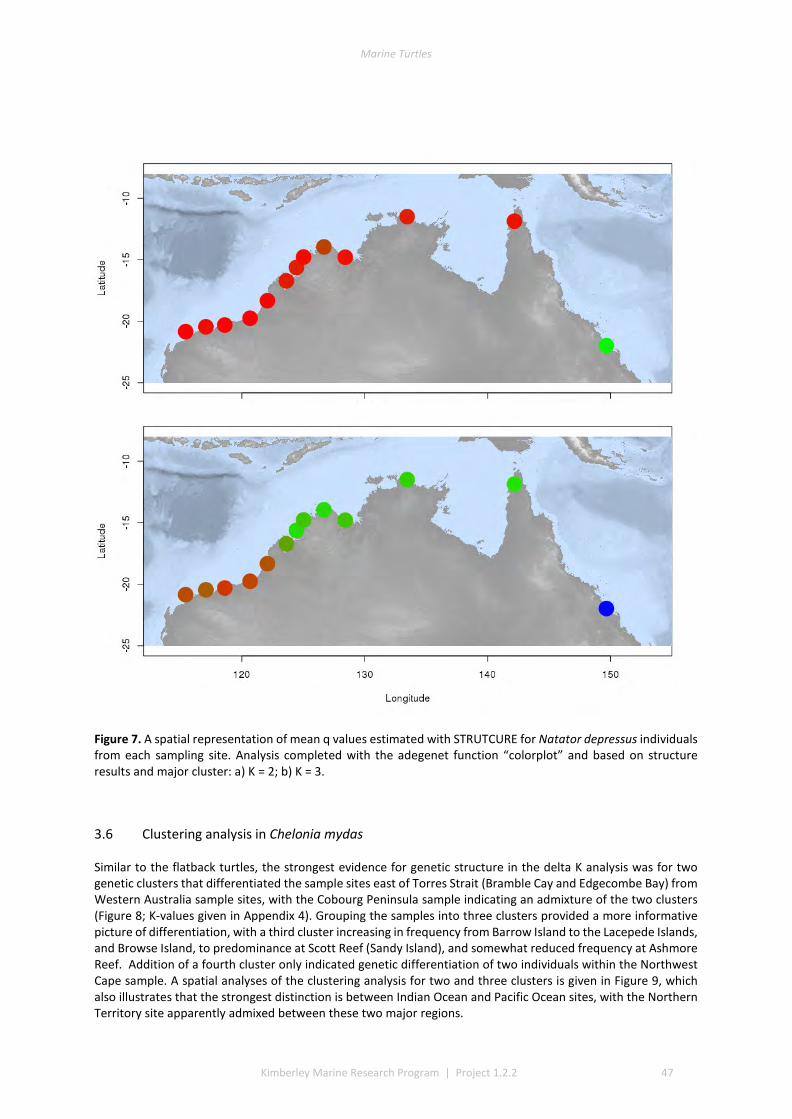
Marine Turtles
Kimberley Marine Research Program | Project 1.2.2 47
Figure 7. A spatial representation of mean q values estimated with STRUTCURE for Natator depressus individuals from each sampling site. Analysis completed with the adegenet function “colorplot” and based on structure results and major cluster: a) K = 2; b) K = 3.
3.6 Clustering analysis in Chelonia mydas
Similar to the flatback turtles, the strongest evidence for genetic structure in the delta K analysis was for two genetic clusters that differentiated the sample sites east of Torres Strait (Bramble Cay and Edgecombe Bay) from Western Australia sample sites, with the Cobourg Peninsula sample indicating an admixture of the two clusters (Figure 8; K-values given in Appendix 4). Grouping the samples into three clusters provided a more informative picture of differentiation, with a third cluster increasing in frequency from Barrow Island to the Lacepede Islands, and Browse Island, to predominance at Scott Reef (Sandy Island), and somewhat reduced frequency at Ashmore Reef. Addition of a fourth cluster only indicated genetic differentiation of two individuals within the Northwest Cape sample. A spatial analyses of the clustering analysis for two and three clusters is given in Figure 9, which also illustrates that the strongest distinction is between Indian Ocean and Pacific Ocean sites, with the Northern Territory site apparently admixed between these two major regions.
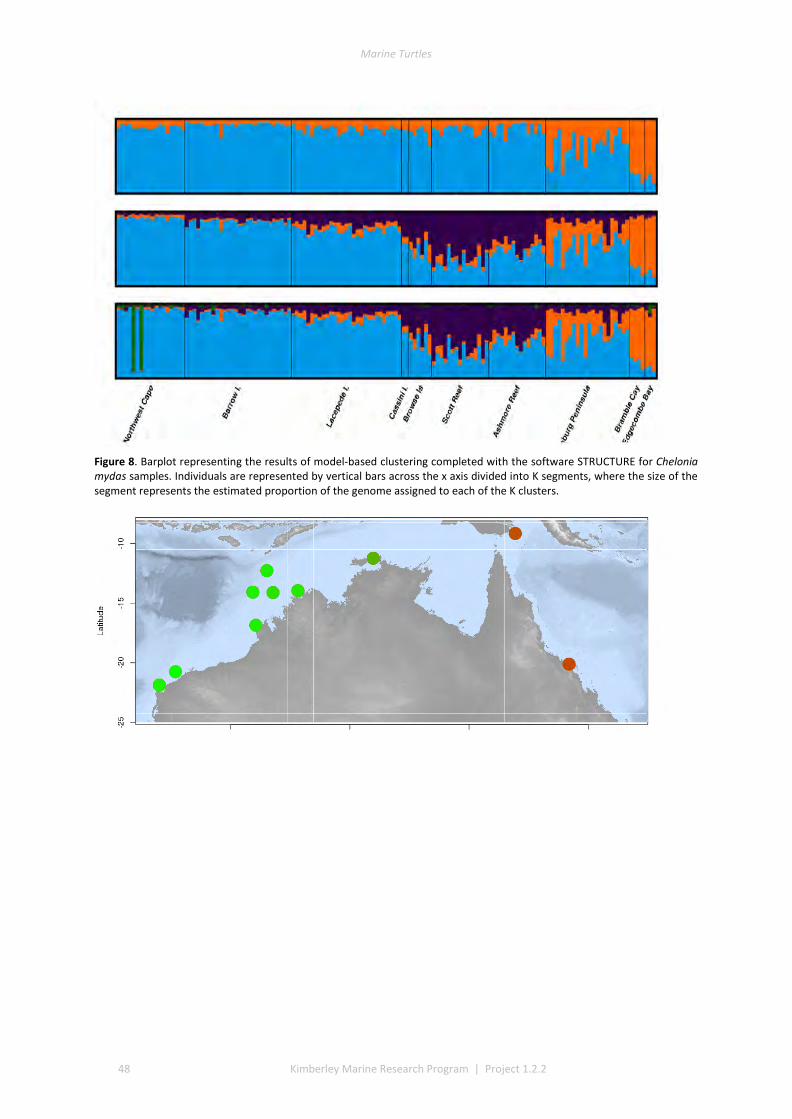
Marine Turtles
48 Kimberley Marine Research Program | Project 1.2.2
Figure 8. Barplot representing the results of model-based clustering completed with the software STRUCTURE for Chelonia mydas samples. Individuals are represented by vertical bars across the x axis divided into K segments, where the size of the segment represents the estimated proportion of the genome assigned to each of the K clusters.
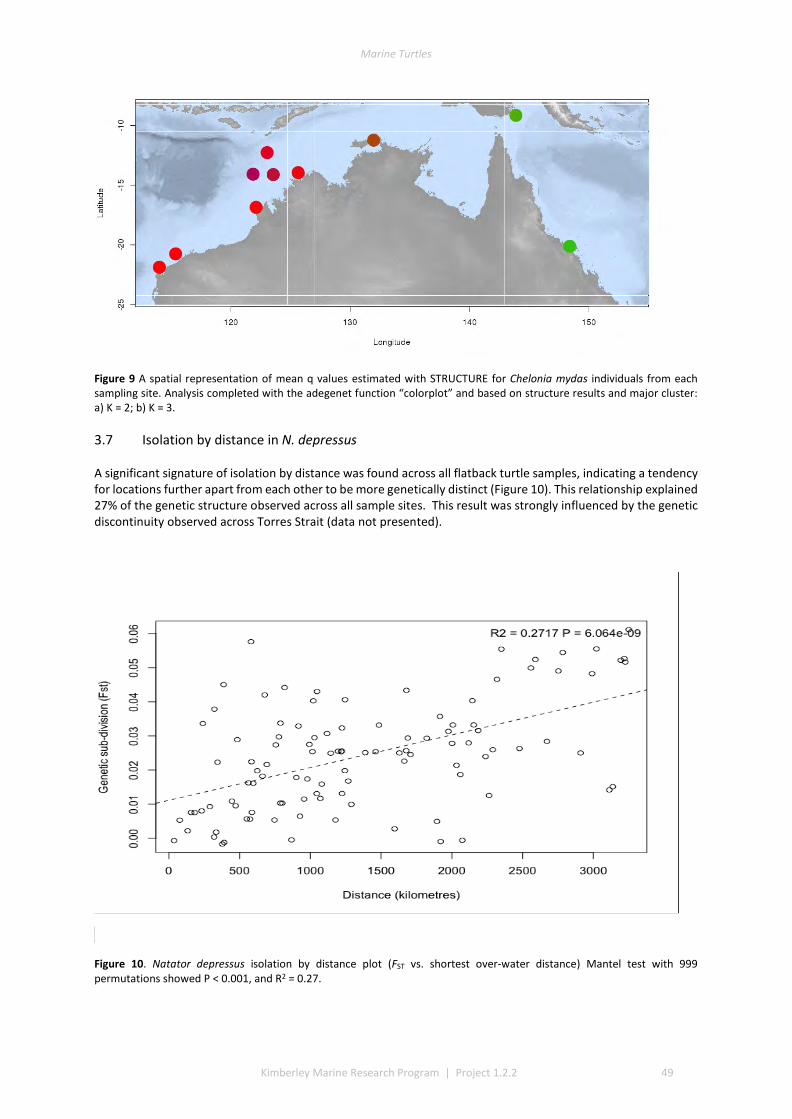
Marine Turtles
Kimberley Marine Research Program | Project 1.2.2 49
Figure 9 A spatial representation of mean q values estimated with STRUCTURE for Chelonia mydas individuals from each sampling site. Analysis completed with the adegenet function “colorplot” and based on structure results and major cluster: a) K = 2; b) K = 3.
3.7 Isolation by distance in N. depressus
A significant signature of isolation by distance was found across all flatback turtle samples, indicating a tendency for locations further apart from each other to be more genetically distinct (Figure 10). This relationship explained 27% of the genetic structure observed across all sample sites. This result was strongly influenced by the genetic discontinuity observed across Torres Strait (data not presented).
FSt
Figure 10. Natator depressus isolation by distance plot (FST vs. shortest over-water distance) Mantel test with 999 permutations showed P < 0.001, and R2 = 0.27.
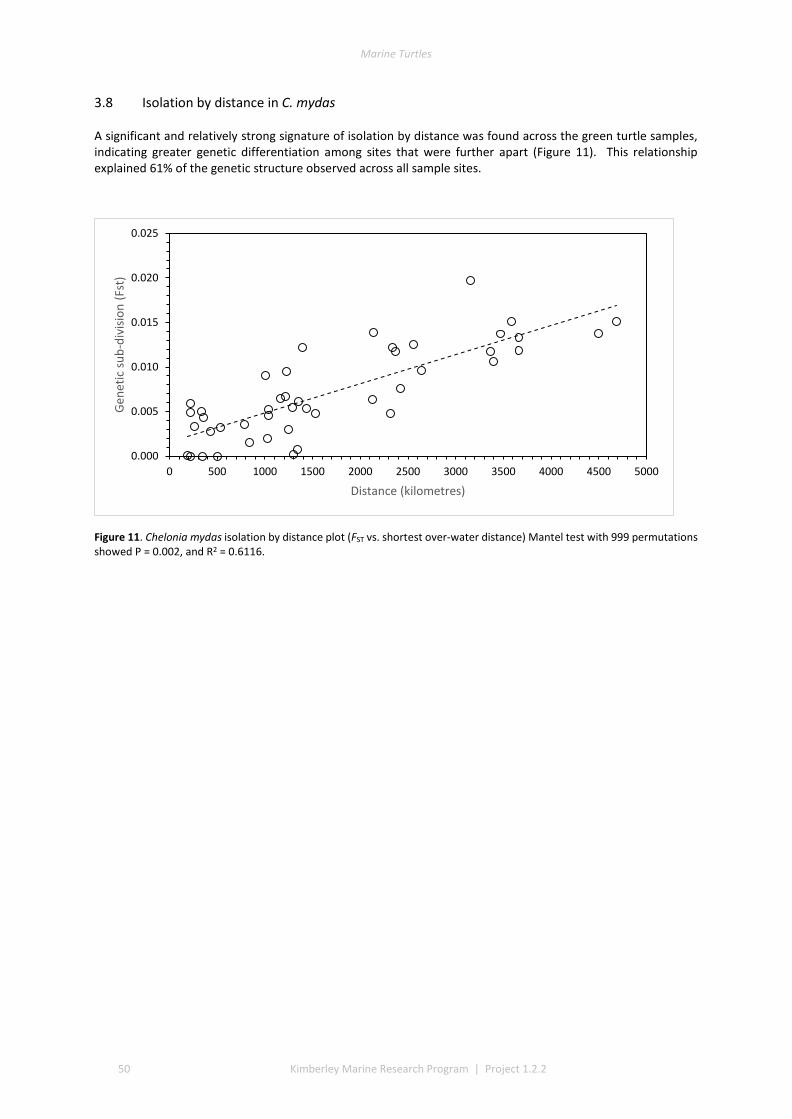
Marine Turtles
50 Kimberley Marine Research Program | Project 1.2.2
3.8 Isolation by distance in C. mydas
A significant and relatively strong signature of isolation by distance was found across the green turtle samples, indicating greater genetic differentiation among sites that were further apart (Figure 11). This relationship explained 61% of the genetic structure observed across all sample sites.
Figure 11. Chelonia mydas isolation by distance plot (FST vs. shortest over-water distance) Mantel test with 999 permutations showed P = 0.002, and R2 = 0.6116.
0.000
0.005
0.010
0.015
0.020
0.025
0 500 1000 1500 2000 2500 3000 3500 4000 4500 5000
Gene
tic su
b-di
visio
n (F
st)
Distance (kilometres)

Marine Turtles
Kimberley Marine Research Program | Project 1.2.2 51
4 Discussion and Conclusions
Natator depressus
Analyses of 1004 SNP loci in samples from across the nesting range of flatback turtles and including previously unsampled rookeries, has provided for strong comparative analyses and addressed several questions regarding flatback behaviour. One striking feature is the general agreement between the SNP and mtDNA data in terms of defining population boundaries, and the unpredictability of the geographic extent of boundaries. SNP data grouped rookeries at Barrow Is., Montebello Islands and Cemetery Beach into a single population, and the 80 Mile Beach and Eco Beach as both being separate populations, in agreement with mtDNA data and microsatellite data (Pittard 2010, FitzSimmons and Limpus 2014). One difference was that the 80 Mile Beach sample was not different from the Cemetery Beach sample, indicating that although there is differentiation at the mtDNA, and hence differentiation between the nesting females at these two locations, there is male-mediated gene flow between them providing for exchange among nuclear genes.
In the Kimberley genetic differentiation was observed between Eco Beach and Helpman Island and between these locations and Slate Island. In the cluster analyses, the genetic break between Eco Beach and Helpman Island was quite pronounced. Slate, Maret and Lamarck Islands were not differentiated, but they were all differentiated from Cape Domett. This suggests that within the Kimberley there are three groupings of rookeries that are functioning relatively independently.
Less genetic differentiation is shown at mtDNA among sites in the Northern Territory and Gulf of Carpentaria, which led to the designation of the Arafura Sea management unit (Pittard 2010, FitzSimmons and Limpus 2014). In contrast, the SNP data indicate a grouping among the rookeries at Field Island, the Cobourg Peninsula and West Island that is differentiated from a grouping of rookeries on the west side of the Cape York Peninsula at Mapoon and Crab Island. West Island is somewhat anomalous in not being differentiated from rookeries in the northern Kimberley (Slate Island to Cape Domett), which may reflect historic colonization of the Gulf of Carpentaria by rookeries to the west, as suggested for green turtles (FitzSimmons et al. 1997). Alternatively, opportunities for male-mediated gene flow may be greater for this population in comparison to other populations, but additional data on foraging locations and migratory routes is needed to determine whether this is a feasible hypothesis. A substantial genetic discontinuity occurs across Torres Strait, as is also observed in several species. This discontinuity is a prominent feature of the observed pattern of isolation by distance among rookeries. Levels of genetic differentiation (FST) were somewhat less than expected in comparison to mtDNA data (Pittard 2010), indicating the operation of male-mediated gene flow among the populations.
One question of importance was whether there were obvious genetic discontinuities between rookeries where turtles mostly nest during summer months versus rookeries where turtles nest mostly in the winter. In Western Australia the transition zone is between Broome and King Sound (see Chapter 2). Our sampling included Eco Beach south of Broome and Helpman Island in King Sound, and the cluster analysis indicated a discontinuity between them that was the most obvious transition after the discontinuity across Torres Strait. This is an important discontinuity as it is located where the transition between summer and winter nesting occurs. Thus, we do see evidence of this behavioural difference in the genetic data. In Western Australia within the summer nesting rookeries we identify three grouping of rookeries that are genetically differentiated. Within the winter nesting rookeries of Western Australia there are an additional three grouping of rookeries. These can be considered to form six management units as the genetic results indicate that they are functioning independently on time scales suited to management.
Chelonia mydas
Genotyping of 2074 SNP loci in green turtle samples provided several new insights into population boundaries and the extent of genetic admixture among sites. Previous research of green turtles nesting in the Indo-Pacific has been largely focused on analyses of mtDNA (Dethmers et al. 2006, Jensen 2010), with only one study published that compared mtDNA and nuclear microsatellite loci (FitzSimmons et al. 1997). Each of these studies concluded that the green turtles nesting in the Northwest Cape were grouped together with those of the Lacepede Islands to form a single population referred to as the Northwest Shelf population. Additional sampling by Jensen (2010) included Browse Island, which was also grouped in the Northwest Shelf population. In contrast, our extensive SNP data indicate a low, but significant level of genetic differentiation (FST) among the three sites. This result is also visualized in the clustering analysis using three clusters, where noticeable differences in
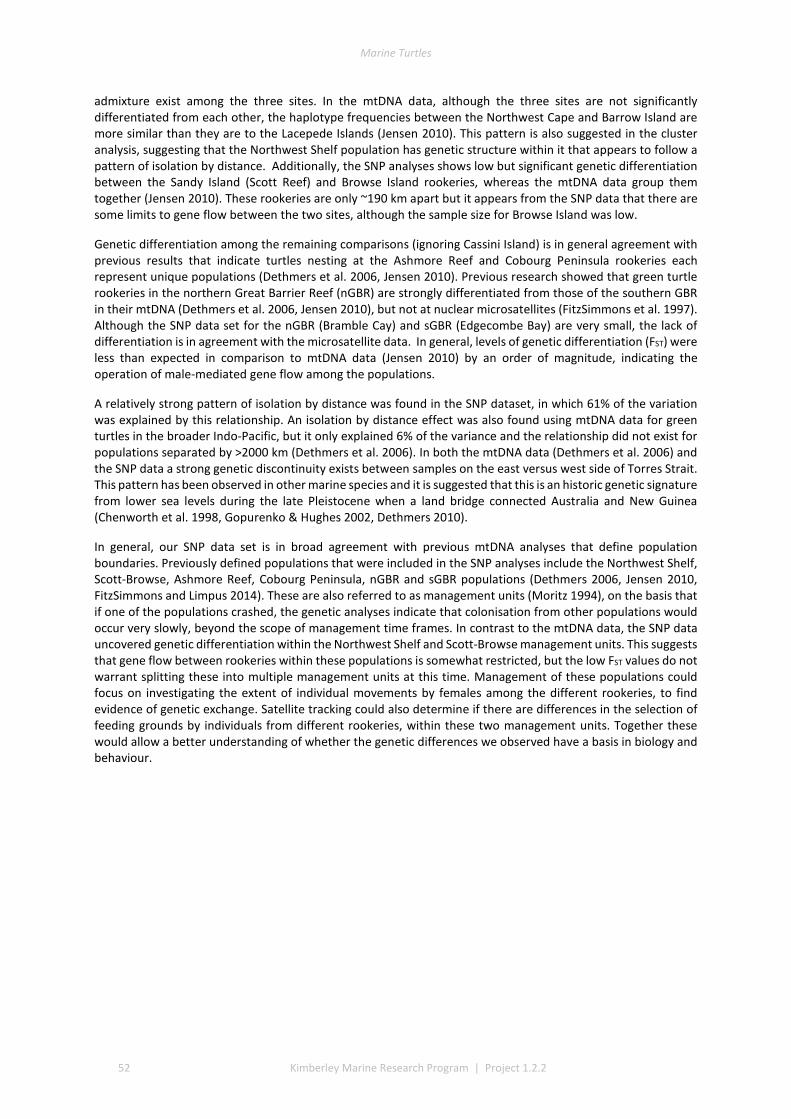
Marine Turtles
52 Kimberley Marine Research Program | Project 1.2.2
admixture exist among the three sites. In the mtDNA data, although the three sites are not significantly differentiated from each other, the haplotype frequencies between the Northwest Cape and Barrow Island are more similar than they are to the Lacepede Islands (Jensen 2010). This pattern is also suggested in the cluster analysis, suggesting that the Northwest Shelf population has genetic structure within it that appears to follow a pattern of isolation by distance. Additionally, the SNP analyses shows low but significant genetic differentiation between the Sandy Island (Scott Reef) and Browse Island rookeries, whereas the mtDNA data group them together (Jensen 2010). These rookeries are only ~190 km apart but it appears from the SNP data that there are some limits to gene flow between the two sites, although the sample size for Browse Island was low.
Genetic differentiation among the remaining comparisons (ignoring Cassini Island) is in general agreement with previous results that indicate turtles nesting at the Ashmore Reef and Cobourg Peninsula rookeries each represent unique populations (Dethmers et al. 2006, Jensen 2010). Previous research showed that green turtle rookeries in the northern Great Barrier Reef (nGBR) are strongly differentiated from those of the southern GBR in their mtDNA (Dethmers et al. 2006, Jensen 2010), but not at nuclear microsatellites (FitzSimmons et al. 1997). Although the SNP data set for the nGBR (Bramble Cay) and sGBR (Edgecombe Bay) are very small, the lack of differentiation is in agreement with the microsatellite data. In general, levels of genetic differentiation (FST) were less than expected in comparison to mtDNA data (Jensen 2010) by an order of magnitude, indicating the operation of male-mediated gene flow among the populations.
A relatively strong pattern of isolation by distance was found in the SNP dataset, in which 61% of the variation was explained by this relationship. An isolation by distance effect was also found using mtDNA data for green turtles in the broader Indo-Pacific, but it only explained 6% of the variance and the relationship did not exist for populations separated by >2000 km (Dethmers et al. 2006). In both the mtDNA data (Dethmers et al. 2006) and the SNP data a strong genetic discontinuity exists between samples on the east versus west side of Torres Strait. This pattern has been observed in other marine species and it is suggested that this is an historic genetic signature from lower sea levels during the late Pleistocene when a land bridge connected Australia and New Guinea (Chenworth et al. 1998, Gopurenko & Hughes 2002, Dethmers 2010).
In general, our SNP data set is in broad agreement with previous mtDNA analyses that define population boundaries. Previously defined populations that were included in the SNP analyses include the Northwest Shelf, Scott-Browse, Ashmore Reef, Cobourg Peninsula, nGBR and sGBR populations (Dethmers 2006, Jensen 2010, FitzSimmons and Limpus 2014). These are also referred to as management units (Moritz 1994), on the basis that if one of the populations crashed, the genetic analyses indicate that colonisation from other populations would occur very slowly, beyond the scope of management time frames. In contrast to the mtDNA data, the SNP data uncovered genetic differentiation within the Northwest Shelf and Scott-Browse management units. This suggests that gene flow between rookeries within these populations is somewhat restricted, but the low FST values do not warrant splitting these into multiple management units at this time. Management of these populations could focus on investigating the extent of individual movements by females among the different rookeries, to find evidence of genetic exchange. Satellite tracking could also determine if there are differences in the selection of feeding grounds by individuals from different rookeries, within these two management units. Together these would allow a better understanding of whether the genetic differences we observed have a basis in biology and behaviour.

Marine Turtles
Kimberley Marine Research Program | Project 1.2.2 53
5 References
Calaway R, Weston S, Tenenbaum D (2014) doParallele: Foreach Parallel Adaptor for the 'parallel' Package. Book 1.0.10. CRAN
Cawthorn D-M, Steinman HA, Witthuhn RC (2011) Comparative study of different methods for the extraction of DNA from fish species commercially available in South Africa. Food Control 22:231-244
Chenoweth SF, Hughes JM, Keenan CP, Lavery S (1998) Concordance between dispersal and mitochondrial gene flow: isolation by distance in a tropical teleost, Lates calcarifer (Australian barramundi). Heredity 80:187-197.
Cruz VM, Kilian A, Dierig DA (2013) Development of DArT marker platforms and genetic diversity assessment of the U.S. collection of the new oilseed crop lesquerella and related species. PLoS One 8:e64062
Dethmers KEM, Broderick, D, Moritz, C, FitzSimmons, NN, Limpus, CJ, Lavery, S, Whiting, S, Guinea, M, Prince,
RIT and Kennett R (2006) The genetic structure of Australasian green turtles (Chelonia mydas): exploring the geographic scale of genetic exchange. Molecular Ecology 15:393-3946.
El Mousadik A, Petit R (1996) High level of genetic differentiation for allelic richness among populations of the argan tree [Argania spinosa (L.) Skeels] endemic to Morocco. Theoretical and Applied genetics 92:832-839
Elshire RJ, Glaubitz JC, Sun Q, Poland JA, Kawamoto K, Buckler ES, Mitchell SE (2011) A robust, simple genotyping-by-sequencing (GBS) approach for high diversity species. PLoS One 6:e19379
FitzSimmons NN, Limpus CJ (2014) Marine turtle genetic stocks of the Indo-Pacific: identifying boundaries and knowledge gaps. Indian Ocean Turtle Newsletter. 20: 2-18.
FitzSimmons NN, Moritz C, Limpus CJ, Pope L, Prince R (1997) Geographic structure of mitochondrial and nuclear gene polymorphisms in Australian green turtle populations and male-biased gene flow. Genetics 147:1843-1854
González JR, Armengol L, Solé X, Guinó E, Mercader JM, Estivill X, Moreno V (2007) SNPassoc: an R package to perform whole genome association studies. Bioinformatics 23:654-655
Gopurenko D, Hughes JM (2002) Regional patterns of genetic structure among Australian populations of the mud crab, Scylla serrata (Crustacea: Decapoda): evidence from mitochondrial DNA. Marine and Freshwater Research 53:849-857.
Goudet J (2005) Hierfstat, a package for R to compute and test hierarchical F-statistics. Mol Ecol Notes 5:184-186
Jensen MP (2010) Assessing the composition of green turtle (Chelonia mydas) foraging grounds in
Australasia using mixed stock analyses. PhD Dissertation, University of Canberra
Jensen MP, FitzSimmons NN, Dutton PH (2013) Molecular Genetics of Sea Turtles pp 135-161. In: Wyneken J, Lohmann KJ, Musick JA (eds) Biology of the Sea Turtles Vol. 3. CRC Press, Boca Raton.
Jombart T (2008) adegenet: a R package for the multivariate analysis of genetic markers. Bioinformatics 24:1403-1405
Kilian A, Wenzl P, Huttner E, Carling J, Xia L, Blois H, Caig V, Heller-Uszynska K, Jaccoud D, Hopper C, Aschenbrenner-Kilian M, Evers M, Peng K, Cayla C, Hok P, Uszynski G (2012) Diversity Arrays Technology: A Generic Genome Profiling Technology on Open Platforms. In: Pompanon F, Bonin A (eds) Data Production and Analysis in Population Genomics: Methods and Protocols. Humana Press, Totowa, NJ
Lotterhos KE, Whitlock MC (2015) The relative power of genome scans to detect local adaptation depends on sampling design and statistical method. Molecular Ecology 24:1031-1046
Moritz C (1994) Defining Evolutionarily Significant Units' for conservation. Trends in Ecology & Evolution 9:373-375.
Narum SR, Buerkle CA, Davey JW, Miller MR, Hohenlohe PA (2013) Genotyping-by-sequencing in ecological and conservation genomics. Molecular Ecology 22:2841-2847
Oksanen J, Kindt R, Legendre P, O’Hara B, Stevens MHH, Oksanen MJ, Suggests M (2007) The vegan package. Community ecology package 10
Pante E, Simon-Bouhet B (2013) marmap: A Package for Importing, Plotting and Analyzing Bathymetric and Topographic Data in R. PLoS ONE 8:e73051
Paradis E (2010) pegas: an R package for population genetics with an integrated–modular approach. Bioinformatics 26:419-420
Pembleton LW, Cogan NO, Forster JW (2013) StAMPP: an R package for calculation of genetic differentiation and structure of mixed-ploidy level populations. Molecular ecology resources 13:946-952
Pittard, SD (2010) Genetic population structure of the flatback turtle (Natator depressus): A nuclear and mitochondrial analysis. Honours Thesis, University of Canberra.
R Core Team (2014) R: A language and environment for statistical computing. R Foundation for Statistical Computing, Vienna, Austria. 2013. ISBN 3-900051-07-0
Rousset F (2008) genepop’007: a complete re-implementation of the genepop software for Windows and Linux. Molecular ecology resources 8:103-106

Marine Turtles
54 Kimberley Marine Research Program | Project 1.2.2
Sansaloni C, Petroli C, Jaccoud D, Carling J, Detering F, Grattapaglia D, Kilian A (2011) Diversity Arrays Technology (DArT) and next-generation sequencing combined: genome-wide, high throughput, highly informative genotyping for molecular breeding of Eucalyptus. BMC Proceedings 5:1-2
Vargas SM, Jensen MP, Ho, SYW, Mobaraki A, Broderick D, Mortimer JA, Whiting S, Miller J, Prince RI, Bell I, Hoenner X, Limpus CJ, Santos FR, FitzSimmons NN (2015) Phylogeography, genetic diversity and management units of hawksbill turtles in the Indo-Pacific region. Journal of Heredity 2015:1-15
Weir BS, Cockerham CC (1984) Estimating F-statistics for the analysis of population structure. Evolution 38:1358-1370
Whitlock MC, Lotterhos KE (2015) Reliable Detection of Loci Responsible for Local Adaptation: Inference of a Null Model through Trimming the Distribution of FST. The American Naturalist 186:S24-36
Willing E-M, Dreyer C, van Oosterhout C (2012) Estimates of Genetic Differentiation Measured by F<sub>ST</sub> Do Not Necessarily Require Large Sample Sizes When Using Many SNP Markers. PLoS ONE 7:e42649

Marine Turtles
Kimberley Marine Research Program | Project 1.2.2 55
Chapter 4 – Climate Change
Blair Bentley1, Scott Whiting2, Jessica Stubbs1, Nicola Mitchell1 1School of Biological Sciences, The University of Western Australia, Crawley, Western Australia 2Department of Parks and Wildlife, Marine Science Program, Kensington, Western Australia
Executive Summary
Contemporary declines of marine turtle populations are expected to be exacerbated through a number of processes associated with anthropogenic climate change. A rapid increase in ambient temperatures will adversely impact all life history stages of marine turtles, with the embryonic stage being the most vulnerable due to narrow physiological thresholds and their inability to avoid excess heat during incubation. Incubation temperatures now often occur close to the upper thermal limits of the embryo. Further, incubation temperatures are important drivers of population demography, as marine turtles have a temperature-dependent mechanism of sex determination (TSD), where females are produced at warmer temperatures and males are produced at cooler temperatures (type-MF TSD). As a consequence, increasing temperatures have been predicted to lead to rookery feminization and increased embryonic mortality, and this is already being observed at many marine turtle rookeries within and outside of Australia.
The effects of climate change will vary over regional scales, with geographical and temporal variation in nesting behaviours expected to influence the severity of these impacts. Here, by incubating eggs from various rookeries across a range of temperatures, we find that the parameters defining the TSD reaction norm vary between and within two species of marine turtle in the Kimberley region of Australia, and that the differences are correlated with temperatures at typical nesting depths at their respective rookeries. The resulting sex-ratios we predict using a mechanistic niche model also differ between rookeries, with high female production at Eighty Mile Beach (flatback turtles) and the Lacepede Islands (green turtles), while winter nesting populations (flatback turtles) and Cassini Island (green turtles) appear to produce more balanced sex-ratios. We present the details of our mechanistic model and show how it can be used to explore the effects of increasing ambient temperature on the embryonic life stage. Winter nesting rookeries are at the highest risk from climate change, as their nesting phenology can only shift slightly to avoid highly female-skewed sex-ratios. Under the most severe climate change scenario for 2070, the narrow temporal window where embryonic mortality could be avoided disappears, very likely meaning that no current marine turtle rookeries in the Kimberley would be viable.
Marine Turtles
56 Kimberley Marine Research Program | Project 1.2.2
Introduction
Marine turtle populations are declining globally as a consequence of anthropogenic activities, with contemporary declines attributed to processes such as habitat loss and by-catch through fisheries (Mazaris et al. 2017). These declines will be exacerbated by a number of processes associated with anthropogenic climate change. However, there is expected to be considerable variation in the magnitude of climate change effects at regional and local scales (Hawkes et al. 2009). For example, in Australia mean air temperatures have increased by approximately 1°C since 1910, with extreme heat events also increasing in frequency and severity. This trend is expected to continue over the coming century (BOM and CSIRO 2016). The impacts of these temperature changes on marine turtles will vary with their life history stage due to differences in habitat requirements and physiological thresholds between adult and embryonic stages (Howard et al. 2014; Howard et al. 2015; Pike 2014; Telemeco et al. 2013). Additionally, the embryonic stages of oviparous species that lack parental care, such as marine turtles, are particularly vulnerable to the effects of climate change as they remain in the nest for extended periods prior to hatching and are unable to ‘behaviourally buffer’ themselves against suboptimal nest environments (Fuentes et al. 2011; Hawkes et al. 2009; Tedeschi et al. 2016).
Temperature increases are of profound importance when considering the development of marine turtle embryos, as all extant species possess a temperature-dependent mechanism of sex determination (TSD; Yntema and Mrosovsky 1980). All species of marine turtle have a male-female pattern of TSD, where female phenotypes are produced at higher temperatures, and males are produced at lower temperatures (Wibbels 2003). Two parameters are typically used to characterize and compare TSD reaction norms between and within species (Hulin et al. 2009). The first is the transitional range of temperatures (TRT), which describes the range of temperatures that produce both sexes, with incubation temperatures above or below this range producing either males or females respectively (Godfrey and Mrosovsky 2006; Hulin et al. 2009; Mrosovsky and Pieau 1991). The TRT varies from abrupt transitions between male and female-producing temperatures, to broader ranges of temperatures that produce mixed-sexes (Ewert et al. 2004), with larger TRTs suggesting greater resilience and potential capacity to adapt to climate change (Patrício et al. 2017). Within the TRT is the ‘pivotal temperature’ (TPIV), defined as the constant incubation temperature that produces a balanced sex-ratio. The TPIV generally lies between 29-30°C in marine turtles (Wibbels 2003; Yntema and Mrosovsky 1982), but can also occur outside of this range (e.g. Howard et al. 2015). Resolving the TRT and TPIV of marine turtle populations allows for accurate prediction of sex-ratios in natural nests, and the information can be used to enhance the reproductive output of a population for conservation purposes (Wibbels 2003).
Due to the narrow temperature ranges associated with thermal traits in marine turtles, even subtle changes in incubation temperature will have a significant influence on the resulting sex-ratios (Hewavisenthi and Parmenter 2002), with climate change anticipated to lead to widespread rookery feminization, potentially threatening population persistence (Fuentes et al. 2010; Hulin et al. 2009; Nelson et al. 2004). Many rookeries already show highly female-skewed primary sex-ratios (e.g. Broderick et al. 2000; Godfrey and Mrosovsky 1999), and identifying the cause of the skew requires that TSD parameters are resolved not only the species level, but also at a population level. Further, temperatures in marine turtle nests are often close to the upper thermal limits for successful embryonic development, and lethal temperatures may be reached more regularly under climate change (Pike 2014). Early studies suggested that temperatures above 33-35°C decreased embryonic survival (Ackerman 1997; Miller 1997), however nest temperatures often exceed these limits, towards the end of development when metabolic heating increases (Broderick et al. 2001; Howard et al. 2014). Hence, changes in air (and/or sea surface) temperatures may result in beaches that are currently suitable for nesting becoming too hot for successful incubation, and similarly, unsuitable beaches may ultimately become new rookeries (e.g. Butt et al. 2016).
Modelling approaches are an important tool for developing management strategies to mitigate the impacts of climate change on reptiles with TSD (e.g. Botkin et al. 2007; Mitchell et al. 2008). Many earlier studies on the impacts of climate change on marine turtle rookeries employed correlative models, where climatic variables such as air temperatures, sea surface temperatures and rainfall are correlated with sand temperatures and the associated sex-ratios and mortality (Fuentes and Porter 2013). However, a mechanistic modelling approach allows predictions to be made outside of the range of typical environmental variables, which is not possible for a correlative approach (Buckley et al. 2010; Kearney et al. 2010; Mitchell et al. 2008). Mechanistic models incorporate environmental data in the form of gridded climate surfaces or point data derived from weather stations (Kearney et al. 2014b), and predict soil temperatures based on laws of thermodynamics. These

Marine Turtles
Kimberley Marine Research Program | Project 1.2.2 57
predictions are then used to drive a model of embryonic development that can be customised with population-specific physiological parameters to allow predictions of hatching sex-ratios and mortality (e.g. Mitchell et al. 2008). The gridded climate surfaces can also be adjusted to simulate future climate change scenarios, and the developmental models can be altered to consider the effects of changed nesting phenology, or nest depth (e.g. Mitchell et al. 2008, Mitchell et al. 2016). These adjustments allow the exploration of impacts of climate change on sex-ratios and mortality at individual rookeries.
Six of the seven extant species of marine turtle forage in water waters along the Kimberley coast in Western Australia, with the Kemp’s Ridley marine turtle (Lepidochelys kempii) being the only exception. Five of these species also nest on island and mainland beaches throughout the Kimberley, with globally significant rookeries of flatback (N. depressus) and green (Chelonia mydas) turtles (see Limpus 2009). Despite this high density of marine turtles, relatively few studies have focused on nesting populations, and as a consequence, there are substantial knowledge gaps in the basic biology, ecology and physiology of these populations. This is particularly important as both species are listed as Vulnerable under the Australian Environment Protection and Conservation Act (EPBC 1999), and C. mydas is listed as Endangered under the International Union for Conservation of Nature Red List (IUCN 2015) while N. depressus has been listed as Data Deficient. An understanding of how nesting sites may change under different climate change scenarios has been identified as an important consideration for threat abatement and recovery of marine turtle populations (Hamann et al. 2007). This is particularly important in the Kimberley, where N. depressus rookeries show a distinct nesting peak in the summer months (November to January) south of the Lacepede Islands, while nesting occurs primarily in winter and spring (August to October) north of this location (Chapter 2 of this report; Whiting et al. 2008).
Due to the remoteness of most Kimberley rookeries, reliable predictions of sex-ratios, hatching success, and the impacts of climate change are critical for the development of conservation and management strategies. Here we describe differences in TSD patterns between two populations of flatback turtles (N. depressus) and one population of green turtle (C. mydas), and integrate this information within a mechanistic model to predict current sex-ratios. We also model the effects of increasing ambient temperature expected under climate change scenarios for 2030 and 2070, and show how hypothetical changes in nesting phenology could mitigate high embryonic mortality and strongly feminised hatching sex ratios.
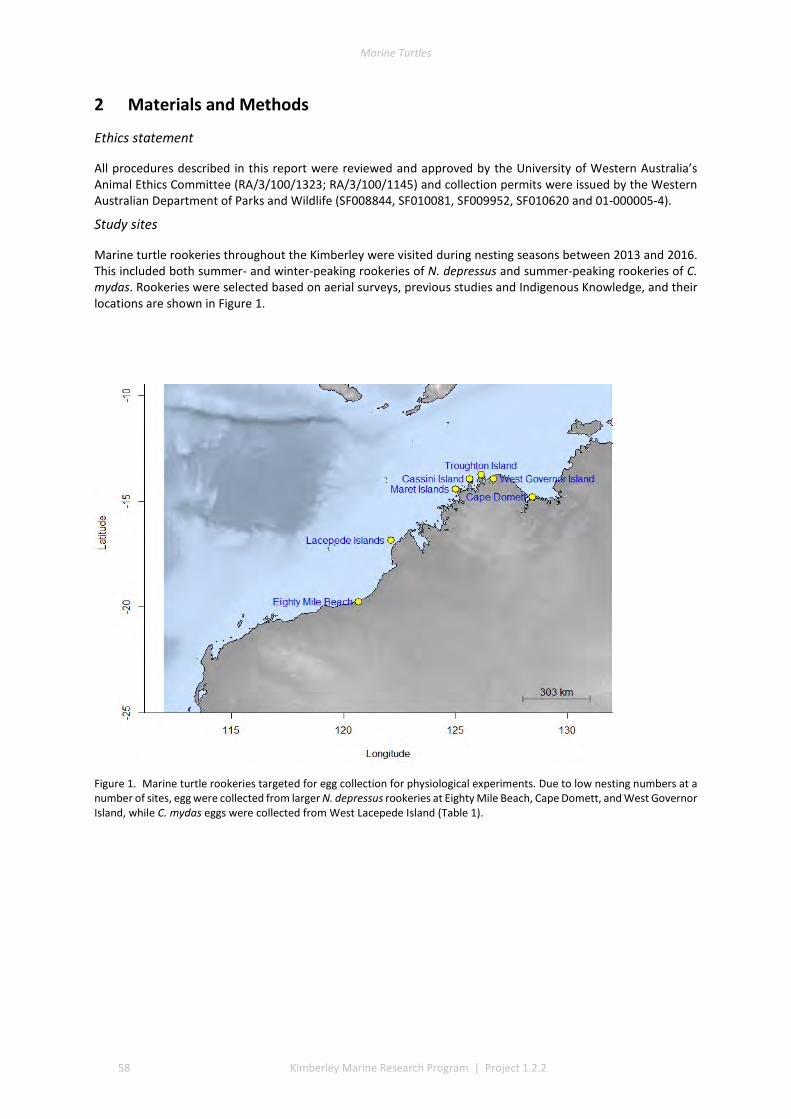
Marine Turtles
58 Kimberley Marine Research Program | Project 1.2.2
2 Materials and Methods
Ethics statement
All procedures described in this report were reviewed and approved by the University of Western Australia’s Animal Ethics Committee (RA/3/100/1323; RA/3/100/1145) and collection permits were issued by the Western Australian Department of Parks and Wildlife (SF008844, SF010081, SF009952, SF010620 and 01-000005-4).
Study sites
Marine turtle rookeries throughout the Kimberley were visited during nesting seasons between 2013 and 2016. This included both summer- and winter-peaking rookeries of N. depressus and summer-peaking rookeries of C. mydas. Rookeries were selected based on aerial surveys, previous studies and Indigenous Knowledge, and their locations are shown in Figure 1.
Figure 1. Marine turtle rookeries targeted for egg collection for physiological experiments. Due to low nesting numbers at a number of sites, egg were collected from larger N. depressus rookeries at Eighty Mile Beach, Cape Domett, and West Governor Island, while C. mydas eggs were collected from West Lacepede Island (Table 1).
Marine Turtles
Kimberley Marine Research Program | Project 1.2.2 59
Table 1. Collection sites and dates for each rookery in the Kimberley. Number of eggs refers to the total number of eggs collected from that rookery, and number of females describes the number of nesting females the eggs were collected from.
Rookery Species Latitude Longitude Collection date(s) No of eggs
Number of females
Cape Domett (CD)
N. depressus -14.798 128.415 Aug 2012, Aug 2014, Aug 2015
614 24
Eighty Mile Beach (EMB)
N. depressus -19.753 120.672 Nov 2014, Nov 2015 300 17
West Governor Island (WGI)
N. depressus
-13.949
126.684 Aug 2016 62 1
West Lacepede Island (LI)
C. mydas -16.853 122.125 Dec 2015 300 10
Egg collection
Eggs were collected during the process of oviposition where possible, with the back of the egg chamber dug away and eggs caught with a bowl, or by hand, as they were laid. We attempted to randomly collect eggs to sample across the entire clutch – with eggs collected at the start of oviposition, in the middle of oviposition and at the end of the process. In some cases we encountered a nesting female that had already initiated oviposition. In these events, we dropped a string attached to a relatively heavy object (e.g. a metal washer) into the egg chamber and tied the other end to a stake or held onto it. Once the female had covered the nest, we carefully excavated the top of the nest within three hours, removed the top 20 or 30 eggs, and re-covered the remaining clutch. In all cases we expected the hatching success of the remaining eggs to reflect those of undisturbed nests (Koch et al. 2007; Stancyk et al. 1980 ). Collections preferentially targeted nesting females laying at sub-optimal positions on the beach, included nests below the high tide mark and high up in dunes.
Care was taken during collection not to rotate or jostle the eggs to avoid movement induced mortality (see Limpus et al. 1979). The top of each egg was individually labelled using a soft (4B) pencil, which later assisted in maintaining the correct orientation during incubation. All eggs were transferred within three hours of collection to a portable refrigerator (models ENGEL MT45F-S and MT60F-G4P with 40L and 60L capacity respectively) cushioned and covered with damp vermiculite (~1 L H2O kg-1) and cooled to 7-15°C to arrest development during transport (Harry and Limpus 1989). Eggs were transported from the nesting beaches to commercial aircraft via boat, vehicle and or small aircraft. Temperature was continuously monitored using K-Type Thermocouples (MAKE) until eggs were repacked into ice chests for commercial flights, at which point the temperature within the ice chest was also logged using iButtons (DS1921G; accuracy ±1°C; resolution 0.5°C) for the duration of transport. In all cases, eggs were transported back to the Crawley campus of The University of Western Australia within 96 hours of collection.
Incubation experiments
Upon arrival to the laboratory, eggs were weighed (± 0.01g) and their diameter was measured using digital callipers. Eggs were then randomly allocated to plastic containers, with 5-10 eggs being allocated to each container depending on the collection trip. Incubation containers were half filled with washed white sand and covered with a plastic lid to ensure high humidity within the box during incubation. Containers were partially sealed to allow for respiratory gas exchange, and therefore required weekly re-wetting of sand via light spraying of deionized water. Containers were placed at target temperatures (see below) inside incubators (Steridium models i140 and i500) and viability was initially determined by the development of a ‘white spot’ (Yntema 1981) which appears on the top of the eggs within the first few days of development. Eggs were monitored every 2-3
Marine Turtles
60 Kimberley Marine Research Program | Project 1.2.2
days, then daily after day 40 of development, and then several times per day once hatching within a container commenced. Containers were rotated within the incubators to account for fine-scale heterogeneity at different positions.
Natural incubation temperatures differed slightly between rookeries, so we used subtly different sets of incubation temperatures for each rookery, including one daily fluctuating temperature regime to simulate more natural incubation conditions (Table 2). Temperatures inside incubation containers were measured with ThermochronTM iButtons (DS1921H model). Eggs were incubated for the entirety of development, the end point of which was characterized by the hatchling breaching the egg shell with the egg tooth (i.e. “pipping”; Miller and Limpus 1981). This occurred for all eggs with the exception of a small subset of the 29°C treatment (which were used a heat shock experiment not reported here). Hatchlings were euthanised within 48 hours of pipping by intra-muscular injection of Zoletil® (Provet; 10mg/kg) followed by pithing, and cerebral dislocation. Labelled hatchlings were preserved in 10% neutral buffered formalin until dissection.
Table 2. Target laboratory incubation temperatures for each rookery.
Rookery Species Laboratory incubation temperatures (°C)
Eggs set per temperature
Cape Domett* N. depressus 28.0, 28.4, 28.8, 29.0, 29.2, 32±5 60, 60, 60, 78, 60, 60
Eighty Mile Beach N. depressus 28.0, 28.6, 29.0, 29.4, 29.8, 32.0, 30±5 15, 48, 48, 78, 48, 15, 48
West Governor Island
N. depressus 28.0, 29.0, 30.0, 31.0, 32.0, 30±5 10, 12, 10, 10, 10, 10
Lacepede Islands C. mydas 28.0, 29.0, 31.0, 32.0, 30±5 60, 60, 60, 60, 60
* N.B. for Cape Domett, field data sourced from Stubbs et al. (2014) were included in subsequent analyses.
Sex identification through histology
Marine turtles show no external sexual dimorphism until sexual maturity (Wibbels 2003), which occurs at 15-50 years of age, depending on the species (Chaloupka and Musick 1997). As such, histological examination of hatchling gonads is required to reliably assign their sex. Gonads are fully differentiated at around 80% of embryonic development, and are small (<500µm) and attached to the kidney. Entire left kidneys with gonads attached were removed from formalin-fixed specimens by making abdominal incisions through the plastron, before being transferred to labelled histology cassettes and stored in 70% ethanol. Kidneys were then prepared as paraffin-embedded sections and stained with haematoxylin and eosin for light microscopy (Stubbs et al. 2014). Individuals were classified as either male, female or unknown based on the criteria by Ceriani and Wyneken (2008) and Ikonomopoulou et al. (2012) where males were characterized by the presence of seminiferous tubules in the medulla and a regressed cortex, while females had a relatively disorganised medulla with a thick, well developed cortex. The identification process was repeated three times for each sample without reference to previous assignment, and a repeatability analysis was performed to determine the reliability of sex assignment. Any specimen where gonads were absent or unable to be distinguished were re-sectioned and re-examined until sex could be determined. If this was still not possible, then entire right kidneys from that individual were removed and the process was repeated.
2.1 Resolution and comparison of TSD parameters
We used the EMBRYOGROWTH package for R (v6.5.8; Girondot and Kaska 2014) to determine the relationship between incubation temperature and sex ratio. This method allows for up to six threshold models to be fitted to the data (Logistic, Hill, Richards, Double-Richards, GSD and Hulin) using maximum likelihood, and requires at least two temperatures producing mixed sexes (Girondot 1999a). AIC criteria are then used to select the model

Marine Turtles
Kimberley Marine Research Program | Project 1.2.2 61
with the strongest fit (Girondot 1999a; Godfrey et al. 2003; Hulin et al. 2009). All models are based on equations with a sigmoidal shape, with differences between models based around the asymmetry of the inflection point (Hulin et al. 2009). For each rookery, the model with the best fit to the data was selected and used to estimate TSD parameters.
The first publication generated from Project 1.2.2 (Stubbs et al. 2014) focused on identifying the thermosensitive period (TSP) for N. depressus , which occurred between 43 and 66% of development, consistent with other studies that state that the TSP occurs within the middle third of incubation (Mrosovsky and Pieau 1991). Hence, for each incubation treatment we calculated the average temperatures during the TSP and used this value during model fitting, with the exception of Cape Domett, where constant temperature equivalents (CTEs; Georges 1994) derived from field sex ratio data collected by Stubbs et al. (2014) were also included for TSD model fitting. For simplicity, we also assumed that the TSP of C. mydas fell between 43 and 66% of development, although this has not been demonstrated experimentally.
The output parameters from the best fitting maximum-likelihood model were used as priors for Markov chain Monte Carlo (MCMC) iterations using the Metropolis-Hastings algorithm for sex-ratios to compare TPIV and TRT correlations. To determine whether there was variation in TSD parameters between rookeries, we combined all data into a single ‘meta-dataset’, as well as compiled data from N. depressus rookeries. The TSD model fittings described above for each population were then applied to these two combination datasets. AICc comparisons were utilized to determine whether the combined datasets or the separate datasets were the best fitting model for the data. Where separate models were identified as the better fit, it was assumed that there were differences between rookeries. The outputs from the MCMC analyses were also used to compare pivotal temperature and transitional range of temperatures between rookeries by calculating a probability differential.
2.2 Fitting nonlinear development rate functions for each population
The effect of temperature on incubation duration was tested using a generalized linear mixed model (GLMM) for each rookery, where maternal ID and incubation box were included as random factors, using the LME4 package for R (Bates et al. 2014). Development rate (the inverse of incubation time), expressed as a function of temperature, was calculated using the program DEVARA (Dallwitz and Higgins 1992). This program allows for non-linear curve fitting and incorporation of incubation times that result from fluctuating or variable temperatures (e.g. Mitchell et al. 2008; Neuwald and Valenzuela 2011). The average incubation time (in days) and hourly temperature data from constant and fluctuating incubations were used as model inputs. DEVARA fits a nonlinear model expressing development rate (r_a) as a percentage per day, as a function of temperature (T):
𝑟𝑟_𝑎𝑎 = 𝑏𝑏_1 〖10〗^(−𝑣𝑣2(1 − 𝑏𝑏5 + 𝑏𝑏5𝑣𝑣2)) (1)
where
𝑢𝑢 = (𝑇𝑇 − 𝑏𝑏_3)/(𝑏𝑏_2 − 𝑏𝑏_3 ) − 𝑐𝑐_1 (2)
𝑣𝑣 = (𝑢𝑢 + 𝑒𝑒^(𝑏𝑏_4 𝑢𝑢))/𝑐𝑐_2 (3)
𝑐𝑐_1 = 1/(1 + 0.28𝑏𝑏_4 + 0.72 𝑙𝑙𝑙𝑙 (1 + 𝑏𝑏_4 )) (4)
and
𝑐𝑐_2 = 1 + 𝑏𝑏_4/(1 + 1.5𝑏𝑏_4 + 0.39〖𝑏𝑏_4)〗^2 (5)
These parameters fitted by DEVARA define the maximum development rate (b_1) and its corresponding temperature (b3), and the temperature at which development approaches zero (b_2). The asymmetry and steepness of the curve are controlled by parameters b_4 and b_5, which were fixed at 6 and 0.4 respectively, as is recommended when development rates at extreme temperatures are unknown (Dallwitz and Higgins 1992), as was the case here.

Marine Turtles
62 Kimberley Marine Research Program | Project 1.2.2
Microclimate model
To model temperatures of beach sand we used NicheMapR (Kearney and Porter 2016) - a version of the Niche MapperTM mechanistic (process-explicit) microclimate model (Porter and Mitchell 2006) adapted to operate within the R environment (R Development Team 2016). The microclimate model component of NicheMapR utilizes climate data and other inputs such as the physical properties of beach sand to calculate sand temperatures at any specified depth, via a one-dimensional partial differential equation that simultaneously solves heat and mass balance equations (Kearney et al. 2014a; Kearney and Porter 2016; Kearney et al. 2014b; McCullough and Porter 1971; Porter et al. 1973; Porter et al. 2002). A summary of the modelling framework employed in this project is shown in Figure 2, and further details of the model assumptions are outlined below.
We modelled sand temperatures at 31 island and mainland beaches throughout the Kimberley region of Western Australia, extending from Pardoo Station, north of Port Headland, to Cape Domett, close to the Northern Territory border (Figure 3). Five sites were selected as focal beaches based on the abundance of nesting females; these were Cape Domett, Cassini Island, Eighty Mile Beach, West Lacepede Island, and West Governor Island.
Topographic parameters
The topographic parameters of the microclimate model, which includes measures of elevation, slope, aspect, and horizon angle in order to calculate the clear sky radiation, were kept constant for all simulations of sand temperatures. Foe ease of comparison we assumed that all beaches were flat (slope = 0) and at sea level (elevation = 0 m), although in reality beach slopes were likely between 1-5 degrees. Clear sky solar radiation was predicted based on the specified point location (latitude, longitude) using algorithms described by McCullough and Porter (1971). Scatter from atmospheric particles was additionally accounted for by computing aerosol attenuation using the Global Aerosol Data Set (GADS) (Koepke et al. 1997). All models were run assuming no beach shading, as a related study suggested that running soil temperature models with a shade component reduced the accuracy of the simulations (Carter et al. 2015), but we acknowledge that some sections of Kimberley beaches can be shaded by vegetation and/or rock ledges. We ran the models with the ‘runmoist’ parameter equal to 1 and 0 to determine if using a soil moisture model within the calculations had an impact on the sand temperature predictions.
Soil property inputs
With the exception of sand reflectance, we modelled all sites with a set of general soil parameters (Kearney et al. 2014a; Kearney et al. 2014b) rather than ‘fine tuning’ each site, as customised soil inputs do not tend to improve the accuracy of the microclimate model predictions (Carter et al. 2015). The general soil properties included a thermal conductivity of 2.5 W mC-1, a density of 2560 kg m-3, and a specific heat of 870 J kg-1 –K, and assumed a bulk density of 1400kg m-3. The colour of beach sand at marine turtle rookeries influences nest temperature (e.g. Hays et al. 2001) and NicheMapR’s microclimate model allows this parameter to be adjusted on a site-by-site basis to account for its effect on sand temperatures. As such, surface sand samples were collected from many Kimberley marine turtle nesting beaches, and their visual and non-visual reflectance was measured using methods described in Stubbs et al. (2014), or were inferred through interpolation. Briefly, where reflectance was measured directly, solar reflectance was measured in the wavelength range of 300 – 2,100 nm using two spectrometers (Ocean Optics USB2000 for the UV-visible range and NIRQuest for the NIR range) and two light sources (Ocean Optics PX-2 pulsed xenon light for the UV-visible range and HL-2000 tungsten halogen light for the visible-NIR range) all connected with a quadrifurcated fibre optic. To estimate the reflectance of the remaining samples, all sand samples were photographed under a dissection microscope (Olympus SZ-CTV) using Olympus DP20 digital camera with consistent exposure settings and lighting (Figure A3.1). A software program that operates in the Java environment (http://matkl.github.io/average-color/) was then used to estimate the average colour of each image in the RGB channels. A linear regression analysis was applied to determine the correlation of each of the channels of the spectrum with the measured reflectance values. The red colouration explained 84.3% of the reflectance values (p < 0.01) and was subsequently used to estimate the reflectance of the remaining samples with the linear equation: REFL=0.3824 ×RED-7.1687 (Figure A3.2).

Marine Turtles
Kimberley Marine Research Program | Project 1.2.2 63
Figure 2. The mechanistic modelling framework employed in this research to predict sand temperatures throughout the Kimberley, and subsequently the sex-ratios and embryonic mortality of Natator depressus and Chelonia mydas. Figure is adapted from Stubbs et al. (2014) and Mitchell et al. (2016). The DEVOUR script was written by Anna Carter, based on a methodology described in Mitchell et al. 2008.
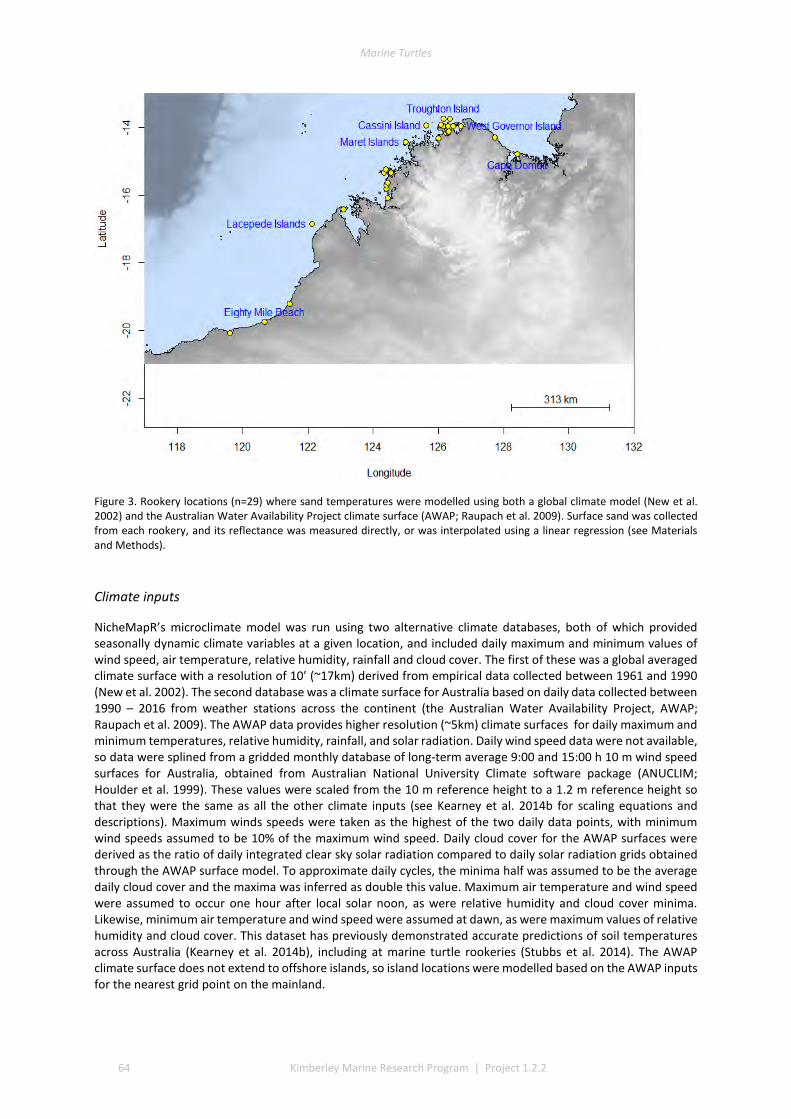
Marine Turtles
64 Kimberley Marine Research Program | Project 1.2.2
Figure 3. Rookery locations (n=29) where sand temperatures were modelled using both a global climate model (New et al. 2002) and the Australian Water Availability Project climate surface (AWAP; Raupach et al. 2009). Surface sand was collected from each rookery, and its reflectance was measured directly, or was interpolated using a linear regression (see Materials and Methods).
Climate inputs
NicheMapR’s microclimate model was run using two alternative climate databases, both of which provided seasonally dynamic climate variables at a given location, and included daily maximum and minimum values of wind speed, air temperature, relative humidity, rainfall and cloud cover. The first of these was a global averaged climate surface with a resolution of 10’ (~17km) derived from empirical data collected between 1961 and 1990 (New et al. 2002). The second database was a climate surface for Australia based on daily data collected between 1990 – 2016 from weather stations across the continent (the Australian Water Availability Project, AWAP; Raupach et al. 2009). The AWAP data provides higher resolution (~5km) climate surfaces for daily maximum and minimum temperatures, relative humidity, rainfall, and solar radiation. Daily wind speed data were not available, so data were splined from a gridded monthly database of long-term average 9:00 and 15:00 h 10 m wind speed surfaces for Australia, obtained from Australian National University Climate software package (ANUCLIM; Houlder et al. 1999). These values were scaled from the 10 m reference height to a 1.2 m reference height so that they were the same as all the other climate inputs (see Kearney et al. 2014b for scaling equations and descriptions). Maximum winds speeds were taken as the highest of the two daily data points, with minimum wind speeds assumed to be 10% of the maximum wind speed. Daily cloud cover for the AWAP surfaces were derived as the ratio of daily integrated clear sky solar radiation compared to daily solar radiation grids obtained through the AWAP surface model. To approximate daily cycles, the minima half was assumed to be the average daily cloud cover and the maxima was inferred as double this value. Maximum air temperature and wind speed were assumed to occur one hour after local solar noon, as were relative humidity and cloud cover minima. Likewise, minimum air temperature and wind speed were assumed at dawn, as were maximum values of relative humidity and cloud cover. This dataset has previously demonstrated accurate predictions of soil temperatures across Australia (Kearney et al. 2014b), including at marine turtle rookeries (Stubbs et al. 2014). The AWAP climate surface does not extend to offshore islands, so island locations were modelled based on the AWAP inputs for the nearest grid point on the mainland.

Marine Turtles
Kimberley Marine Research Program | Project 1.2.2 65
In addition to these two climate surface inputs, we also ran the NicheMapR microclimate model with hourly weather station data retrieved from weather stations deployed for short periods at various Kimberley marine turtle rookeries (Table 3). Any missing data from the weather stations were approximated using the ‘na.approx’ function of the R package ‘ZOO’ (Zeileis and Grothendieck 2005). In all cases, climate data were used to predict sand temperatures at standardized depths (0, 2.5, 5, 10, 15, 20, 30, 50, 100, 200 cm) as well as at customised depths that matched the depths where sand temperatures had been measured empirically (Table 4, and see below).
Sand temperature measurements and model validation
In order to test the accuracy of the modelled sand temperatures, we buried temperature data loggers (ThermochronTM DS1921H iButtons; resolution: 0.125°C, accuracy: 1°C) on beaches throughout the Kimberley (Table 4). Temperature loggers were programmed to record hourly, or every 4.25 hours in order to capture data over a calendar year. Loggers were buried at depths between 30 and 70 cm, with the majority at 50cm, which is a typical nest depth for a marine turtle (Limpus 2009) and is a consistent reference depth for marine turtle rookeries globally.
To test the accuracy of the microclimate model we generated a series of hourly sand temperature predictions at the same depths as our temperature logger deployments, as well as at the depths at which loggers were retrieved (where known, see Table 4). In all cases, the site-specific sand reflectance was used as an input, along with the general soil parameters described above, and we assumed 0% shade. Two or three models were run for each site, depending on whether data from weather stations were available. Summary statistics were generated to compare the predicted sand temperatures to the empirical data (e.g. Carter et al. 2015; Kearney et al. 2014a; Kearney et al. 2014b; Mitchell et al. 2016); these being the coefficient of determination (r2) and the root-mean-squared deviation (RMSD). We also calculated the normalized-RSMD (nRMSD), which is the RMSD value divided by the range of observed temperatures, and was used to compare the model fit by depth and by the type of climate input used (global, AWAP or weather station). All summary statistics were calculated using the ‘HYDROGOF’ and ‘PLYR’ packages in R (Wickham 2011; Zambrano-Bigiarini 2014). Closer agreement between observed and predicted values were indicated by lower RMSD and nRSMD values, and higher r2 values.

Marine Turtles
66 Kimberley Marine Research Program | Project 1.2.2
Table 3. Locations and deployment durations of local weather stations throughout the Kimberley region of Western Australia.
Weather station deployment
GPS coordinates (lat, long)
Weather station model
Start date
End date
Number of recordings (intervals/errors)
Cape Domett 2013 – 2014
S 14.816 /E 128.583
MEA
02/11/2013
09/08/2014
41,909 (every 10 minutes)
Cape Domett 2015 – 2016
S 14.816 / E 128.583
MEA NA NA 0 (logger malfunction)
Cassini Island 2015 – 2016
S 14.317 / E 125.583
WeatherHawk 29/08/2015
23/05/2016
6,432 (hourly)
Deception Bay S 15.633/ E 124.442
MEA NA NA 0 (battery malfunction)
Eighty Mile Beach 2015
S 19.753 / E 120.673
WeatherHawk 10/02/2015
25/11/2015
6,936 (hourly)
West Lacepede Island 2015 – 2016
S 17.150 / E 122.417
Em50 data logger
16/12/2015
25/01/2016
984 (hourly)
Table 4. Locations, duration, recording intervals and depths of temperature loggers used for validation of sand temperature models.
Site Number of loggers Start date End date
Logging interval (hrs)
Depths at deployment (cm)
Depths at retrieval (cm)
Cape Domett 8 12/08/2013 09/08/2014 4.25 50 44, 45.5, 46, 53
Cape Domett 5 17/08/2014 09/08/2015 4.25 50 10, 40, 50
Cassini Island 1 21/08/2015 12/11/2015 1 50 unknown
Deception Bay 11 01/10/2014 08/07/2015 4.25 h 50 36, 40, 44, 47, 48, 49
Eighty Mile Beach 10 28/11/2014 21/02/2015 1 30, 40, 50, 60, 68, 70
44, 57, 58, 62, 66, 67, 68, 70, 74, 79
Eighty Mile Beach 6 28/05/2015 27/11/2015 4.25 50 55, unknown
Eighty Mile Beach 6 27/11/2015 07/01/2016 1 35, 43, 46, 52, 63, 68
35, 45, 48, 57, 62
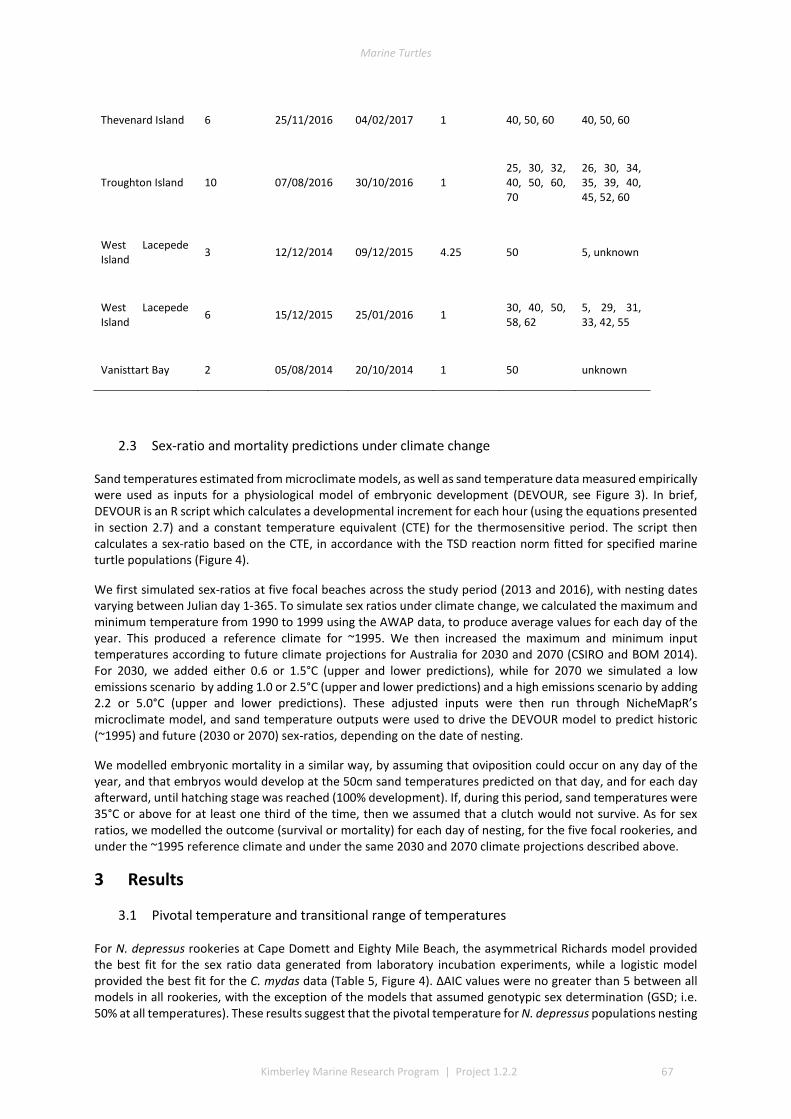
Marine Turtles
Kimberley Marine Research Program | Project 1.2.2 67
Thevenard Island 6 25/11/2016 04/02/2017 1 40, 50, 60 40, 50, 60
Troughton Island 10 07/08/2016 30/10/2016 1 25, 30, 32, 40, 50, 60, 70
26, 30, 34, 35, 39, 40, 45, 52, 60
West Lacepede Island 3 12/12/2014 09/12/2015 4.25 50 5, unknown
West Lacepede Island 6 15/12/2015 25/01/2016 1 30, 40, 50,
58, 62 5, 29, 31, 33, 42, 55
Vanisttart Bay 2 05/08/2014 20/10/2014 1 50 unknown
2.3 Sex-ratio and mortality predictions under climate change
Sand temperatures estimated from microclimate models, as well as sand temperature data measured empirically were used as inputs for a physiological model of embryonic development (DEVOUR, see Figure 3). In brief, DEVOUR is an R script which calculates a developmental increment for each hour (using the equations presented in section 2.7) and a constant temperature equivalent (CTE) for the thermosensitive period. The script then calculates a sex-ratio based on the CTE, in accordance with the TSD reaction norm fitted for specified marine turtle populations (Figure 4).
We first simulated sex-ratios at five focal beaches across the study period (2013 and 2016), with nesting dates varying between Julian day 1-365. To simulate sex ratios under climate change, we calculated the maximum and minimum temperature from 1990 to 1999 using the AWAP data, to produce average values for each day of the year. This produced a reference climate for ~1995. We then increased the maximum and minimum input temperatures according to future climate projections for Australia for 2030 and 2070 (CSIRO and BOM 2014). For 2030, we added either 0.6 or 1.5°C (upper and lower predictions), while for 2070 we simulated a low emissions scenario by adding 1.0 or 2.5°C (upper and lower predictions) and a high emissions scenario by adding 2.2 or 5.0°C (upper and lower predictions). These adjusted inputs were then run through NicheMapR’s microclimate model, and sand temperature outputs were used to drive the DEVOUR model to predict historic (~1995) and future (2030 or 2070) sex-ratios, depending on the date of nesting.
We modelled embryonic mortality in a similar way, by assuming that oviposition could occur on any day of the year, and that embryos would develop at the 50cm sand temperatures predicted on that day, and for each day afterward, until hatching stage was reached (100% development). If, during this period, sand temperatures were 35°C or above for at least one third of the time, then we assumed that a clutch would not survive. As for sex ratios, we modelled the outcome (survival or mortality) for each day of nesting, for the five focal rookeries, and under the ~1995 reference climate and under the same 2030 and 2070 climate projections described above.
3 Results
3.1 Pivotal temperature and transitional range of temperatures
For N. depressus rookeries at Cape Domett and Eighty Mile Beach, the asymmetrical Richards model provided the best fit for the sex ratio data generated from laboratory incubation experiments, while a logistic model provided the best fit for the C. mydas data (Table 5, Figure 4). ΔAIC values were no greater than 5 between all models in all rookeries, with the exception of the models that assumed genotypic sex determination (GSD; i.e. 50% at all temperatures). These results suggest that the pivotal temperature for N. depressus populations nesting

Marine Turtles
68 Kimberley Marine Research Program | Project 1.2.2
in the Kimberley region varies by 1°C (29.5 °C and 30.5°C); while the pivotal temperature for C. mydas at the Lacepede Islands was estimated to be 29.4°C (Table 5). The transitional range of temperatures (RT) also varied between nesting populations and species, ranging from 6.3°C in C. mydas to 2.1°C for N. depressus nesting at Cape Domett rookery.
A comparison of AICc values suggested that separate models for each rookery fitted the data better than models that combined all studied rookeries (AIC: 208.68 vs 241.79), as well as when only the two N. depressus rookeries were combined (AIC: 167.57 vs 186.73). This suggests that the TSD reaction norms differ between populations, with the pivotal temperature being highest at the Eighty Mile Beach N. depressus rookery, and the TRT broadest for the C. mydas rookery (Table 5).
3.2 Development rate
Incubation duration decreased significantly as incubation temperature increased (r2 = 0.89, p < 0.01) for all rookeries and ranged from 40.5 days at ~33°C to 64 days at ~28°C. There were small differences in the development rate between rookeries at similar temperatures. Eggs from West Governor Island appeared to have a relatively faster development rate, however this observation is based on a single clutch and consequently this rookery was not included when calculating a nonlinear development rate function using the DEVARA software. Figure 5 shows the development rate data and the reaction norm for each rookery, with the fitted parameters b1, b2 and b3 presented in Table 6.
Table 5. Model scores for each rookery according to Akaike information criterion (AIC) and their associated TSD reaction norm parameters with standard errors. TPIV and TRT refer to pivotal temperature and transitional range of temperatures respectively.
Model Selection (AIC) TSD Parameters
Species Rookery Logistic Hill Richards GSD Hulin Double-Richards
TPIV (°C) (SE)
TRT (°C) (SE)
Natator depressus
Cape Domett
54.0
54.4
53.0
243.4
55.0
55.0
29.54 (0.14)
2.13 (0.10)
Eighty Mile Beach
68.1 68.5 67.6 141.2 69.6 69.6 30.54 (0.26)
4.00 (0.19)
Chelonia mydas
Lacepede Islands
44.9 45.0 46.1 62.0 48.1 48.1 29.41 (0.3)
6.31 (0.28)
3.3 Thermal environments of Kimberley beaches
All microclimate models driven with the Australian Water Availability Project (AWAP) climate surfaces outperformed those run using the global climate model (GCM) (see Figures A3.3-A3.13, which include summary statistics). Including a soil moisture subroutine in the microclimate model decreased the accuracy of the sand temperature predictions, irrespective of whether the soil moisture input was generated through the AWAP or
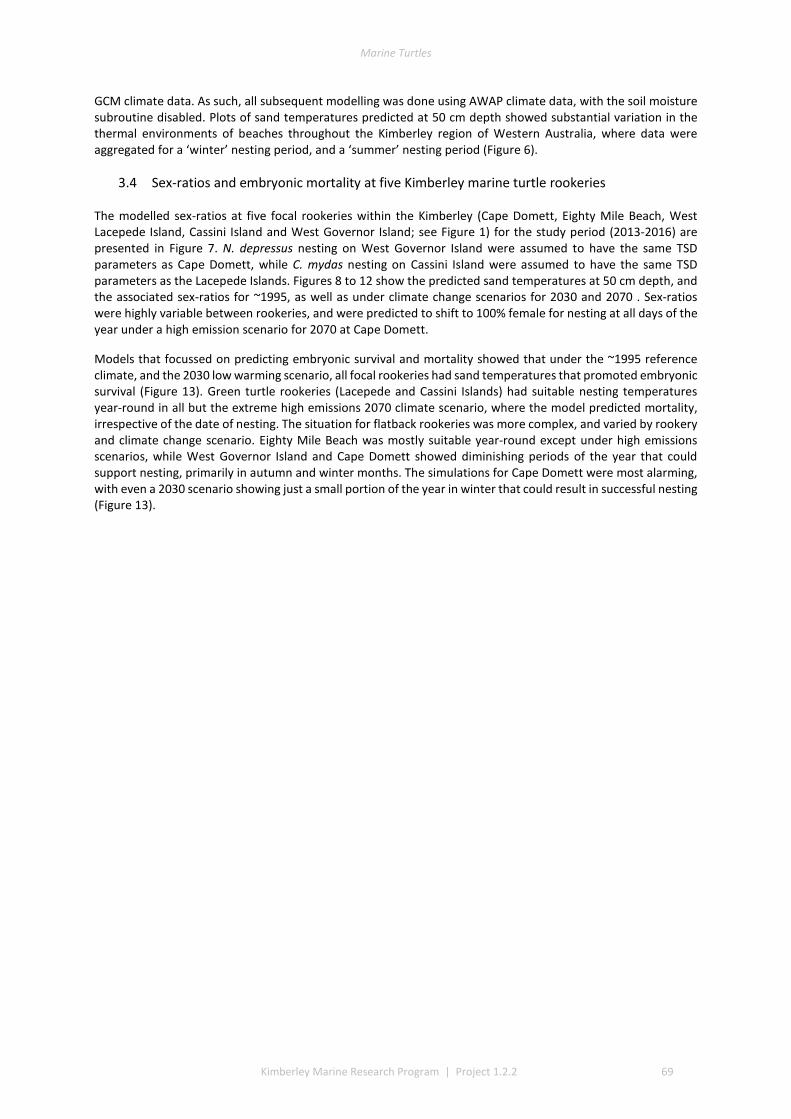
Marine Turtles
Kimberley Marine Research Program | Project 1.2.2 69
GCM climate data. As such, all subsequent modelling was done using AWAP climate data, with the soil moisture subroutine disabled. Plots of sand temperatures predicted at 50 cm depth showed substantial variation in the thermal environments of beaches throughout the Kimberley region of Western Australia, where data were aggregated for a ‘winter’ nesting period, and a ‘summer’ nesting period (Figure 6).
3.4 Sex-ratios and embryonic mortality at five Kimberley marine turtle rookeries
The modelled sex-ratios at five focal rookeries within the Kimberley (Cape Domett, Eighty Mile Beach, West Lacepede Island, Cassini Island and West Governor Island; see Figure 1) for the study period (2013-2016) are presented in Figure 7. N. depressus nesting on West Governor Island were assumed to have the same TSD parameters as Cape Domett, while C. mydas nesting on Cassini Island were assumed to have the same TSD parameters as the Lacepede Islands. Figures 8 to 12 show the predicted sand temperatures at 50 cm depth, and the associated sex-ratios for ~1995, as well as under climate change scenarios for 2030 and 2070 . Sex-ratios were highly variable between rookeries, and were predicted to shift to 100% female for nesting at all days of the year under a high emission scenario for 2070 at Cape Domett.
Models that focussed on predicting embryonic survival and mortality showed that under the ~1995 reference climate, and the 2030 low warming scenario, all focal rookeries had sand temperatures that promoted embryonic survival (Figure 13). Green turtle rookeries (Lacepede and Cassini Islands) had suitable nesting temperatures year-round in all but the extreme high emissions 2070 climate scenario, where the model predicted mortality, irrespective of the date of nesting. The situation for flatback rookeries was more complex, and varied by rookery and climate change scenario. Eighty Mile Beach was mostly suitable year-round except under high emissions scenarios, while West Governor Island and Cape Domett showed diminishing periods of the year that could support nesting, primarily in autumn and winter months. The simulations for Cape Domett were most alarming, with even a 2030 scenario showing just a small portion of the year in winter that could result in successful nesting (Figure 13).

Marine Turtles
70 Kimberley Marine Research Program | Project 1.2.2
Figure 4. Sex-ratio reaction norms and observed sex-ratios (open circles) from laboratory incubations for the three study rookeries: (a) Cape Domett (N. depressus), (b) Eighty Mile Beach (N. depressus), and (c) Lacepede Islands (Chelonia mydas). Cape Domett observations include field data collected and published by Stubbs et al. (2014), as well as more recent data. The dashed lines indicate the pivotal temperatures, and the shaded region represents the transitional range of temperatures (TRT).
Table 6. Fitted parameters* for the nonlinear development rate function calculated using DEVARA software.
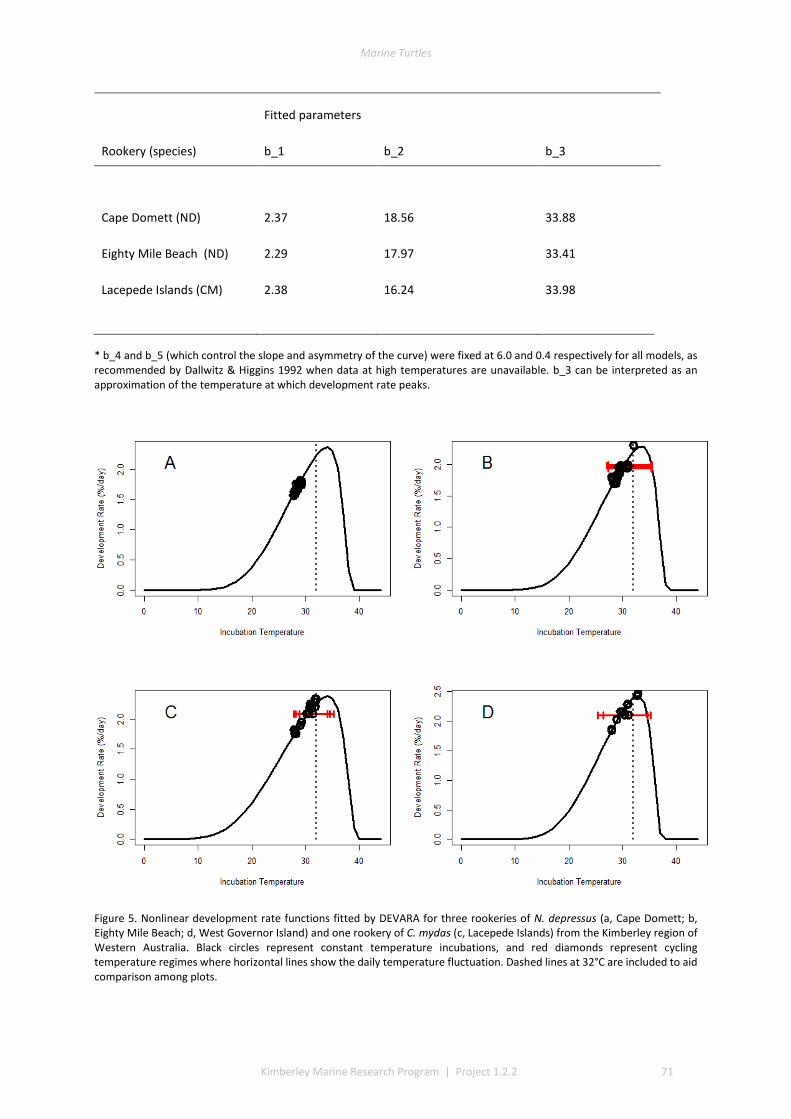
Marine Turtles
Kimberley Marine Research Program | Project 1.2.2 71
Fitted parameters
Rookery (species) b_1 b_2 b_3
Cape Domett (ND)
2.37
18.56
33.88
Eighty Mile Beach (ND) 2.29 17.97 33.41
Lacepede Islands (CM) 2.38 16.24 33.98
* b_4 and b_5 (which control the slope and asymmetry of the curve) were fixed at 6.0 and 0.4 respectively for all models, as recommended by Dallwitz & Higgins 1992 when data at high temperatures are unavailable. b_3 can be interpreted as an approximation of the temperature at which development rate peaks.
Figure 5. Nonlinear development rate functions fitted by DEVARA for three rookeries of N. depressus (a, Cape Domett; b, Eighty Mile Beach; d, West Governor Island) and one rookery of C. mydas (c, Lacepede Islands) from the Kimberley region of Western Australia. Black circles represent constant temperature incubations, and red diamonds represent cycling temperature regimes where horizontal lines show the daily temperature fluctuation. Dashed lines at 32°C are included to aid comparison among plots.
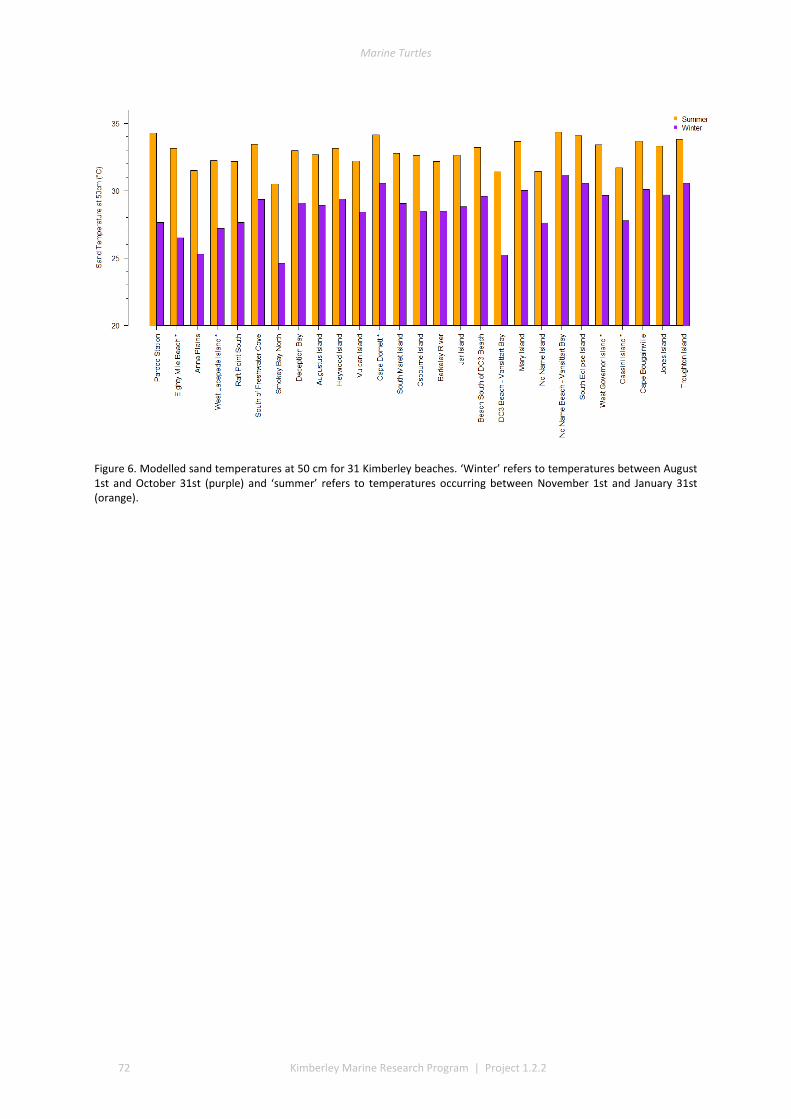
Marine Turtles
72 Kimberley Marine Research Program | Project 1.2.2
Figure 6. Modelled sand temperatures at 50 cm for 31 Kimberley beaches. ‘Winter’ refers to temperatures between August 1st and October 31st (purple) and ‘summer’ refers to temperatures occurring between November 1st and January 31st (orange).
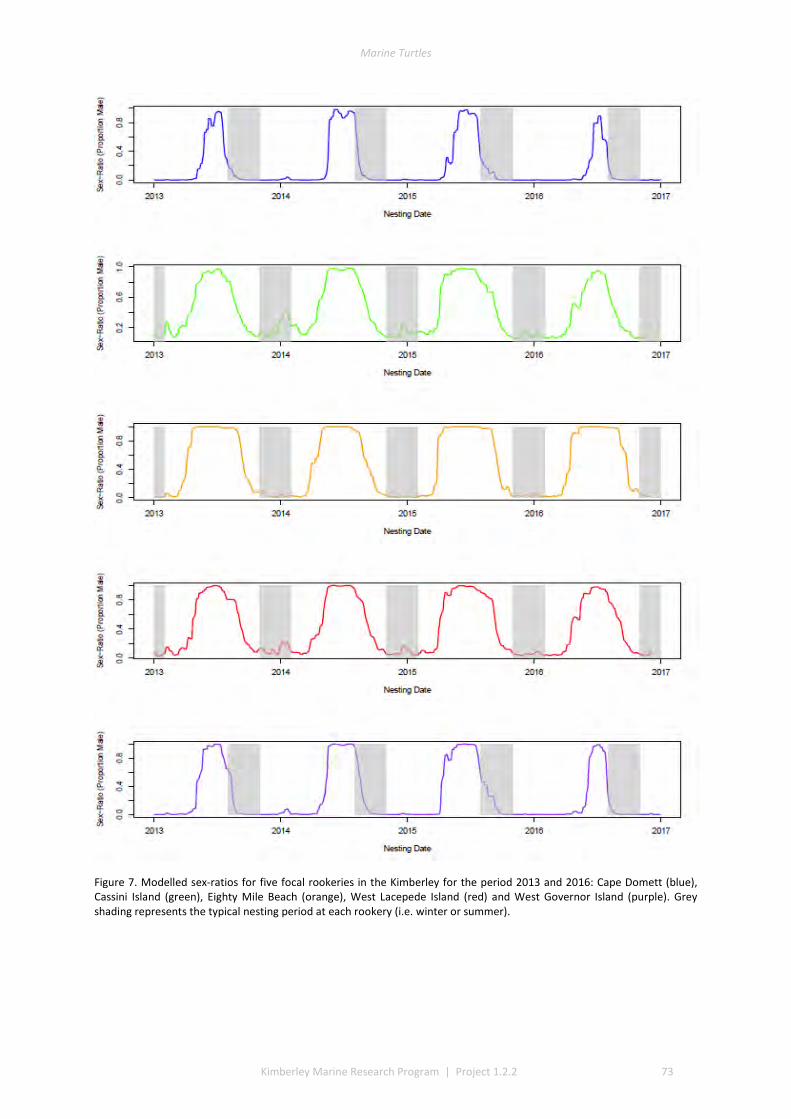
Marine Turtles
Kimberley Marine Research Program | Project 1.2.2 73
Figure 7. Modelled sex-ratios for five focal rookeries in the Kimberley for the period 2013 and 2016: Cape Domett (blue), Cassini Island (green), Eighty Mile Beach (orange), West Lacepede Island (red) and West Governor Island (purple). Grey shading represents the typical nesting period at each rookery (i.e. winter or summer).
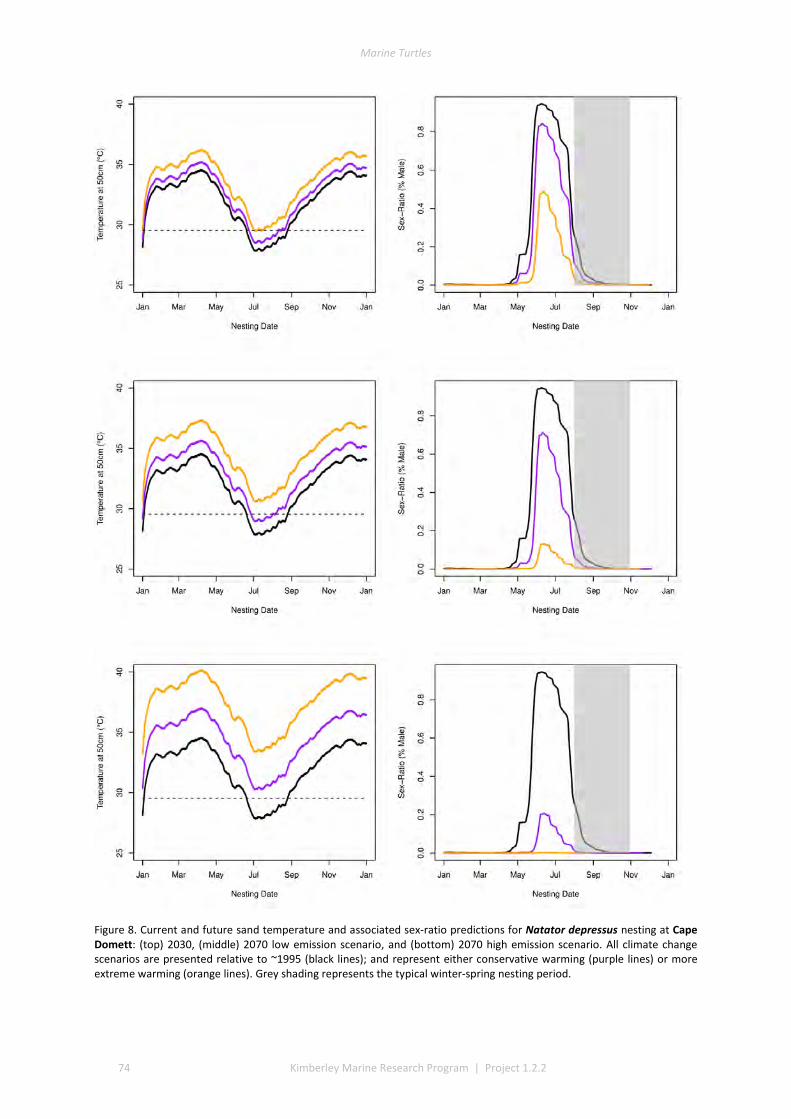
Marine Turtles
74 Kimberley Marine Research Program | Project 1.2.2
Figure 8. Current and future sand temperature and associated sex-ratio predictions for Natator depressus nesting at Cape Domett: (top) 2030, (middle) 2070 low emission scenario, and (bottom) 2070 high emission scenario. All climate change scenarios are presented relative to ~1995 (black lines); and represent either conservative warming (purple lines) or more extreme warming (orange lines). Grey shading represents the typical winter-spring nesting period.

Marine Turtles
Kimberley Marine Research Program | Project 1.2.2 75
Figure 9. Current and future sand temperature and associated sex-ratio predictions for Chelonia mydas nesting on Cassini Island: (top) 2030, (middle) 2070 low emission scenario, and (bottom) 2070 high emission scenario. All climate change scenarios are presented relative to ~1995 (black lines); and represent either conservative warming (purple lines) or more extreme warming (orange lines). Grey shading represents the typical summer nesting period.

Marine Turtles
76 Kimberley Marine Research Program | Project 1.2.2
Figure 10. Current and future sand temperature and associated sex-ratio predictions for Natator depressus nesting at Eighty Mile Beach: (top) 2030, (middle) 2070 low emission scenario, and (bottom) 2070 high emission scenario. All climate change scenarios are presented relative to ~1995 (black lines); and represent either conservative warming (purple lines) or more extreme warming (orange lines). Grey shading represents the typical summer nesting period.
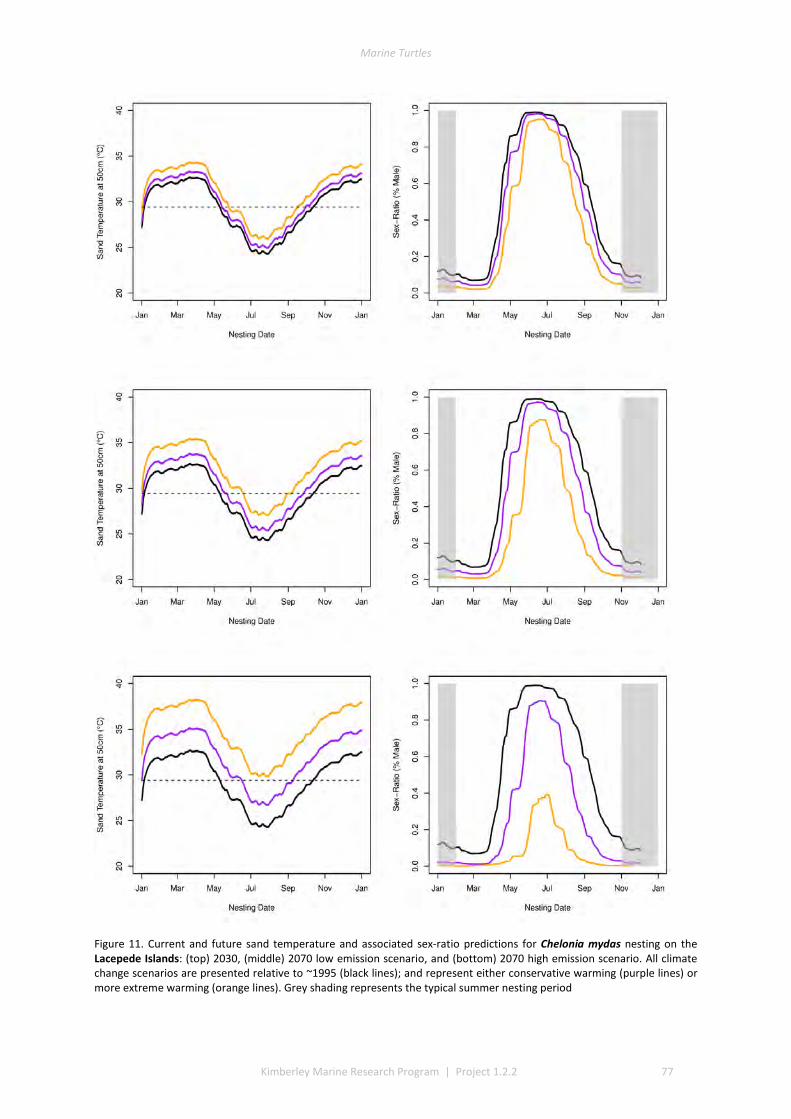
Marine Turtles
Kimberley Marine Research Program | Project 1.2.2 77
Figure 11. Current and future sand temperature and associated sex-ratio predictions for Chelonia mydas nesting on the Lacepede Islands: (top) 2030, (middle) 2070 low emission scenario, and (bottom) 2070 high emission scenario. All climate change scenarios are presented relative to ~1995 (black lines); and represent either conservative warming (purple lines) or more extreme warming (orange lines). Grey shading represents the typical summer nesting period

Marine Turtles
78 Kimberley Marine Research Program | Project 1.2.2
Figure 12. Current and future sand temperature and associated sex-ratio predictions for Natator depressus nesting at West Governor Island: (top) 2030, (middle) 2070 low emission scenario, and (bottom) 2070 high emission scenario. All climate change scenarios are presented relative to ~1995 (black lines); and represent either conservative warming (purple lines) or more extreme warming (orange lines). Grey shading represents the typical winter-spring nesting period.
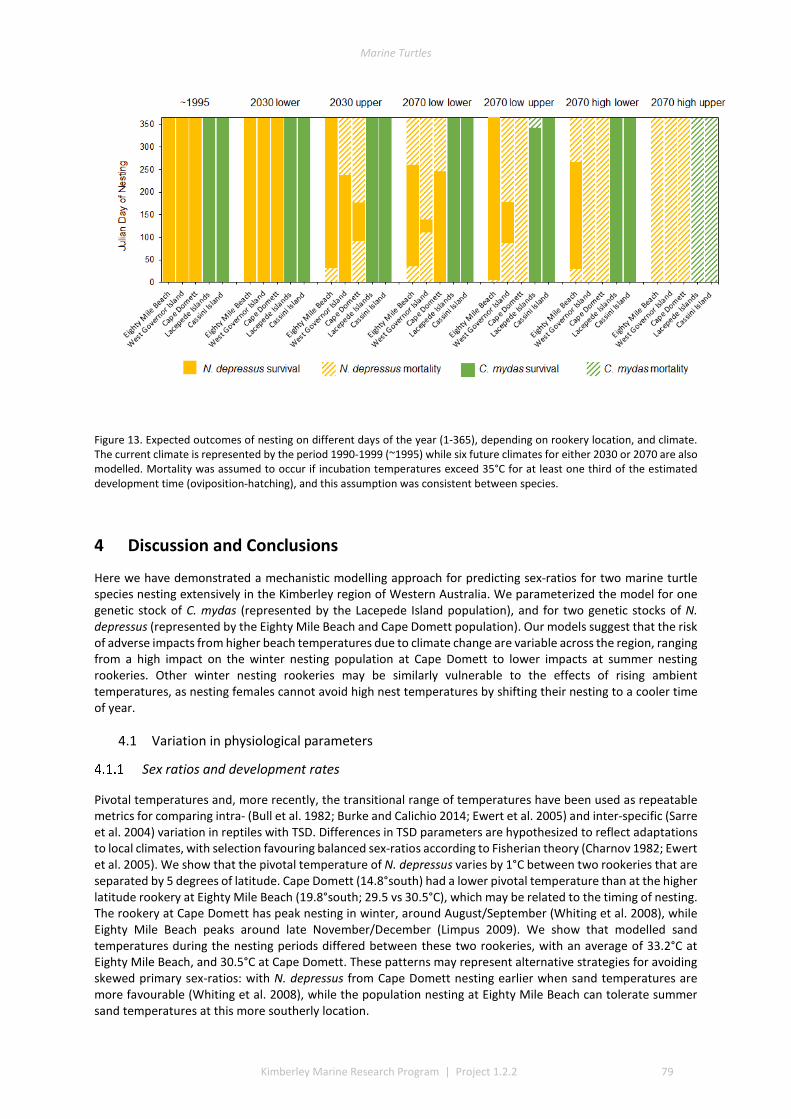
Marine Turtles
Kimberley Marine Research Program | Project 1.2.2 79
Figure 13. Expected outcomes of nesting on different days of the year (1-365), depending on rookery location, and climate. The current climate is represented by the period 1990-1999 (~1995) while six future climates for either 2030 or 2070 are also modelled. Mortality was assumed to occur if incubation temperatures exceed 35°C for at least one third of the estimated development time (oviposition-hatching), and this assumption was consistent between species.
4 Discussion and Conclusions
Here we have demonstrated a mechanistic modelling approach for predicting sex-ratios for two marine turtle species nesting extensively in the Kimberley region of Western Australia. We parameterized the model for one genetic stock of C. mydas (represented by the Lacepede Island population), and for two genetic stocks of N. depressus (represented by the Eighty Mile Beach and Cape Domett population). Our models suggest that the risk of adverse impacts from higher beach temperatures due to climate change are variable across the region, ranging from a high impact on the winter nesting population at Cape Domett to lower impacts at summer nesting rookeries. Other winter nesting rookeries may be similarly vulnerable to the effects of rising ambient temperatures, as nesting females cannot avoid high nest temperatures by shifting their nesting to a cooler time of year.
4.1 Variation in physiological parameters
Sex ratios and development rates
Pivotal temperatures and, more recently, the transitional range of temperatures have been used as repeatable metrics for comparing intra- (Bull et al. 1982; Burke and Calichio 2014; Ewert et al. 2005) and inter-specific (Sarre et al. 2004) variation in reptiles with TSD. Differences in TSD parameters are hypothesized to reflect adaptations to local climates, with selection favouring balanced sex-ratios according to Fisherian theory (Charnov 1982; Ewert et al. 2005). We show that the pivotal temperature of N. depressus varies by 1°C between two rookeries that are separated by 5 degrees of latitude. Cape Domett (14.8°south) had a lower pivotal temperature than at the higher latitude rookery at Eighty Mile Beach (19.8°south; 29.5 vs 30.5°C), which may be related to the timing of nesting. The rookery at Cape Domett has peak nesting in winter, around August/September (Whiting et al. 2008), while Eighty Mile Beach peaks around late November/December (Limpus 2009). We show that modelled sand temperatures during the nesting periods differed between these two rookeries, with an average of 33.2°C at Eighty Mile Beach, and 30.5°C at Cape Domett. These patterns may represent alternative strategies for avoiding skewed primary sex-ratios: with N. depressus from Cape Domett nesting earlier when sand temperatures are more favourable (Whiting et al. 2008), while the population nesting at Eighty Mile Beach can tolerate summer sand temperatures at this more southerly location.
Marine Turtles
80 Kimberley Marine Research Program | Project 1.2.2
High proportions of mixed-sex nests favour the expression of heritable genetic variation between embryos and promotes the presence of both sexes in the breeding population (Hulin et al. 2008). We show marked variation in the TRT for the marine turtle rookeries we studied, with variation of almost 2°C between the N. depressus rookeries (2.1 vs 4.0 at Cape Domett and Eighty Mile Beach respectively), while the TRT in the Lacepede Island C. mydas population was substantially higher at 6.3. While these estimates should be considered as preliminary given limited data points below the lower TRT limit, they provide important insights into the primary sex-ratios that are likely to be generated at these locations. The higher TRT in the C. mydas rookery, and at the southernmost N. depressus rookery suggest they have a higher capacity to avoid strongly skewed sex ratios associated with climate change.
Development rates were relatively similar at Eighty Mile Beach (19.8 °south) and Cape Domett (14.8 °south), but were slightly slower in Lacepede Island green turtles. The temperatures at which development rates peaked (fitted parameter b3) were also similar between each rookery (33.4 - 34.0°C), and implied that embryos experiencing temperatures above this threshold would be subject to thermal stress and consequently slower rates of development.
Comparisons with other populations
Despite the discovery of TSD in marine turtles by Yntema and Mrosovsky (1979) over 25 years ago, few studies have directly estimated pivotal temperatures or TRTs (see review by Wibbels 2003). Estimates of these traits are particularly sparse for Australian marine turtle populations. For N. depressus, estimates of pivotal temperature range from 29.3 to 30.4°C (Box et al. 2010; Hewavisenthi and Parmenter 2000; Howard et al. 2015; Limpus 2009; Reinhold et al in Press, Stubbs et al. 2014), however these studies primarily relied on sex-ratios derived from natural nests or laboratory experiments using small numbers of nesting females. The results presented here from constant incubation provide additional evidence for variation in this trait between populations of N. depressus. The TRT for N. depressus also varies between populations, with an estimated TRT of 1°C in Queensland stocks (Hewavisenthi and Parmenter 2000) up to 3.6°C for a population the Pilbara region of Western Australia (Box et al. 2010). Our estimate for the Eighty Mile Beach population is slightly higher (4.0°C), while the population at Cape Domett has a TRT of ~2°C.
The TSD parameters for C. mydas populations from Australia are less well defined, with estimates of pivotal temperature ranging between 27.6 to 29.3°C on the Great Barrier Reef (Limpus 2009; Miller and Limpus 1981). On a global scale, the pivotal temperature ranges from between 28.0 to 30.3°C (Broderick et al. 2000; Godfrey and Mrosovsky 2006; Kaska et al. 1998; Mrosovsky et al. 1984; Patrício et al. 2017; Spotila et al. 1987; Standora and Spotila 1985). Our Tpiv estimate was similar to other populations (29.4 °C) but our TRT estimate (6.3°C) is much higher than any other previous estimate for this species, with TRTs for populations from Costa Rica and Suriname estimated to be 1.5 and 3°C respectively (Mrosovsky et al. 1984; Standora and Spotila 1985). We suggest that additional incubation experiments at the upper and lower extremes of the incubation regime (i.e. 28 and 32°C) would better resolve this parameter.
4.2 Performance of the microclimate model
As expected, microclimate models that utilized the Australian Water Availability Project climate surface data produced sand temperature predictions that were better correlated with empirical data than models that were forced with a global climate surface. There are two likely reasons for this observation, the first being related to the resolution of the surfaces. The AWAP surfaces have been specifically generated for the Australian continent at a resolution of approximately 5 km (Kearney et al. 2014b), while the global model is gridded at lower resolution (approximately 17 x 17 km pixels). Higher resolution surfaces will generally produce more reliable outputs as they have a higher probability of accounting for subtle variation in local climates. The second explanation relates to the nature of the input, with the AWAP data interpolated from hourly weather station data from across Australia, while the global model simulates an average climate for each day based on interpolation of historic data (1961 - 1990; New et al. 2002). Surprisingly, the weather stations that were deployed simultaneously with the temperature loggers were less effective than the AWAP climate surfaces at predicting sand temperatures.
We show that models forced with the AWAP climate surfaces were variable in the reliability of the sand temperature predictions. For a number of sites, particularly islands off the northern Kimberley coast, correlations between the predicted and observed sand temperatures were high. At other sites, such as mainland beaches, predictions were less reliable. Eighty Mile Beach for example, shows a strong correlation between modelled and

Marine Turtles
Kimberley Marine Research Program | Project 1.2.2 81
observed sand temperatures for 2015 (r2 = 0.98), however predictions are lower than observed in winter, and higher than observed in summer (see Figure A3.8). These discrepancies may be due to a number of stochastic processes, such as movement of beach sand causing a change in the depth of the temperature logger. For example, during the summer of 2014/2015 at Eighty Mile Beach, we observed large shifts in beach sand associated with a storm surge and strong winds, and loggers were recovered at depths approximately 15 - 30 cm deeper than they were deployed at. We were unable to pinpoint the timing of the depth change, and assume that the sand movement was gradual.
4.3 Thermal environments of beaches
Nesting of N. depressus in the Kimberley region has two peaks, with a winter (Whiting et al. 2008) and summer peak (Chapter 2 of this report). It appears that the split occurs around the King Sound (see Chapter 2), with summer nesting at latitudes south of this point, and winter nesting occurring at lower latitudes. Our results suggest that summer sand temperatures across this range are similar (ranging between ~31-35°C), which despite being around the upper thermal limits of marine turtles (Ackerman 1997; Howard et al. 2014; Miller 1997), result in rapid embryonic development, which is likely favoured by natural selection, as it reduces the risk of mortality through environmental perturbation or predation. Therefore, winter nesting at latitudes higher than the Lacepede Islands may be selected against as sand temperatures are too cool (less than 28°C), with incubation expected to take 65-70 days based on the development models presented here. At these same sites (i.e. Pardoo Station, Eighty Mile Beach, Anna Plains, and the Lacepede Islands), temperatures during the summer should result in hatching after approximately 42-45 days, which is consistent with field observations in both N. depressus and C. mydas.
The temperature increases associated with climate change are expected to push beach temperatures considerably higher than those of historic (i.e. ~1995) and contemporary levels. Our models of focal rookeries suggest that beach temperatures will rise to unprecedented levels under all climate change scenarios, particularly beaches in the tropical northern and eastern Kimberley, where temperatures at 50 cm depth will consistently exceed 35°C for a large proportion of the year. However we also show substantial local variation in beach temperatures throughout the Kimberley (Figure 6), and it is possible that some beaches will be increasingly suitable for nesting as the climate warms.
4.4 Impact of climate change on sex ratios and mortality
Our results show that climate change will have variable impacts on the sex-ratios and embryonic mortality of marine turtle rookeries in the Kimberley region. Of particular concern is the impact on winter nesting rookeries of N. depressus in the northern and eastern Kimberley, as these populations currently nesting during the coolest time of year, and therefore shifts in nesting will have limited impacts on embryonic mortality and primary sex-ratios (Stubbs et al. 2014). All other focal rookeries modelled showed a shift towards producing more female offspring, but sites such as Eighty Mile Beach and Cassini Island still have a viability window where shifting to earlier nesting should contribute to production of male hatchlings, and thereby maintain balanced primary sex-ratios.
More alarmingly, we show that under high carbon emission scenarios, sand temperatures at depths where marine turtle eggs are commonly deposited (~50cm) will exceed putative upper thermal limits for embryonic survival (Ackerman 1997; Howard et al. 2014; Miller 1997; this study) at a higher frequency, duration and magnitude than occurs currently. Embryonic mortality is therefore expected to increase at most focal rookeries, with a consequent decrease in the window for viable development as climate change becomes more pronounced. For example, by 2030 it is expected that mortality will impact the winter nesting rookeries of N. depressus if upper predictions of ambient increases are reached. By 2070, low emission scenarios predict increasing mortality at Cape Domett, West Governor Island and Eighty Mile Beach, while Cassini Island and the Lacepede Islands only show marginal changes. Under 2070 high emission scenarios, the impacts range from minimal for the Lacepede Islands and Cassini Island C. mydas rookeries (conservative warming), to the extreme situation for the winter nesting N. depressus rookeries at Cape Domett and West Governor Island, where no matter which day of the year nesting occurs, mortality would be expected. These predictions of mortality effectively negate the predictions of entirely female primary sex ratios by 2070 (as shown in Figures 8 and 12), as without micro evolutionary change in thermal tolerance, embryos will die before their sex is determined.
Marine Turtles
82 Kimberley Marine Research Program | Project 1.2.2
5 References
Ackerman, R.A. 1997. The nest environment and the embryonic development of marine turtles. pp. 83-106 in P. Lutz and J. Musick, eds. The Biology of Marine turtles.
Bates, D., M. Mächler, B. Bolker and S. Walker. 2014. Fitting linear mixed-effects models using lme4. Journal of Statistical Software 67: 1-48.
Bentley, B.P., B. Haas, J.N. Tedeschi and O. Berry. 2017. Loggerhead marine turtle embryos (Caretta caretta) regulate expression of stress-response and developmental genes when exposed to a biologically realistic heat stress. Molecular Ecology 26: 2978-2992.
Bobyn, M.L., and R.J. Brooks. 1994. Interclutch and interpopulation variation in the effects of incubation conditions on sex, survival and growth of hatchling turtles (Chelydra serpentina). Journal of Zoology 233: 233-257.
Box, T. 2010. A mechanistic approach to predicting hatchling sex ratios of the Flatback Turtle (Natator depressus).Honours Thesis, School of Animal Biology. The University of Western Australia, Perth, Western Australia.
Broderick, A.C., B.J. Godley and G.C. Hays. 2001. Metabolic heating and the prediction of sex ratios for green turtles (Chelonia mydas). Physiological and Biochemical Zoology 74: 161-170.
Broderick, A.C., B.J. Godley, S. Reece and J.R. Downie. 2000. Incubation periods and sex ratios of green turtles: highly female biased hatchling production in the eastern Mediterranean. Marine Ecology Progress Series 202: 273-281.
Bull, J., R.C. Vogt and C. McCoy. 1982. Sex determining temperatures in turtles: a geographic comparison. Evolution 36: 326-332.
Burke, R.L., and A.M. Calichio. 2014. Temperature-dependent sex determination in the diamond-backed terrapin (Malaclemys terrapin). Journal of Herpetology 48: 466-470.
Butt, N., S. Whiting and K. Dethmers. 2016. Identifying future marine turtle conservation areas under climate change. Biological Conservation 204: 189-196.
Carter, A., M. Kearney, N. Mitchell, S. Hartley, W. Porter and N. Nelson. 2015. Modelling the soil microclimate: does the spatial or temporal resolution of input parameters matter? Frontiers of Biogeography 7: 138-154.
Ceriani, S.A., and J. Wyneken. 2008. Comparative morphology and sex identification of the reproductive system in formalin-preserved marine turtle specimens. Zoology 111: 179-187.
Charnov, E.L. 1982. The theory of sex allocation. Princeton University Press, Princeton, NJ.
Chaloupka, M. Y. and J. A. Musick. 1997. Age, growth, and population dynamics. pp. 233 – 276 in P. Lutz and J. Musick eds. The Biology of Marine turtles.
Commonwealth Scientific and Industrial Research Organisation (CSIRO) and the Bureau of Meteorology (BOM). 2014. State of the Climate 2014. Commonwealth of Australia, Australia.
Commonwealth Scientific and Industrial Research Organisation (CSIRO) and the Bureau of Meteorology (BOM). 2016. State of the Climate 2016. Commonwealth of Australia, Australia.
Dallwitz, M., and J. Higgins. 1992. DEVAR: a computer program for estimating development rate as a function of temperature.
Deeming, D.C., and M.W.J. Ferguson. 1990. Morphometric analysis of embryonic development in Alligator mississippiensis, Crocodylus johnstoni and Crocodylus porosus. Journal of Zoology 221: 419-439.
Doody, J.S., E. Guarino, A. Georges, B. Corey, G. Murray and M. Ewert. 2006. Nest site choice compensates for climate effects on sex ratios in a lizard with environmental sex determination. Evolutionary Ecology 20: 307-330.
Du, W.-G., D.A. Warner, T. Langkilde, T. Robbins and R. Shine. 2010. The physiological basis of geographic variation in rates of embryonic development within a widespread lizard species. The American Naturalist 176: 522-528.
Environment Protection and Biodiversity Conservation Act (EPBC). 1999. Commonwealth of Australia, Australia.
Ewert, M.A. 1979. The embryo and its egg: development and natural history. Turtles: Perspectives and research: 333-413.
Ewert, M.A. 1985. Embryology of turtles. pp. 75-267 in C. Gans, F. Billett and P.F.A. Maderson, eds. Biology of the Reptilia. Wiley, New York, NY.
Ewert, M.A., C.R. Etchberger and C.E. Nelson. 2004. Turtle sex-determining modes and TSD patterns, and some TSD pattern correlates. pp. 21-32 in N. Valenzuela and V.A. Lance, eds. Temperature-dependent sex determination in vertebrates. Smithsonian Books, Washington, DC.
Ewert, M.A., J.W. Lang and C.E. Nelson. 2005. Geographic variation in the pattern of temperature-dependent sex determination in the American snapping turtle (Chelydra serpentina). Journal of Zoology 265: 81-95.
Fuentes, M.M.P.B., C. Limpus and M. Hamann. 2011. Vulnerability of marine turtle nesting grounds to climate change. Global Change Biology 17: 140-153.
Fuentes, M.M.P.B., and W.P. Porter. 2013. Using a microclimate model to evaluate impacts of climate

Marine Turtles
Kimberley Marine Research Program | Project 1.2.2 83
change on marine turtles. Ecological Modelling 251: 150-157.
Georges, A. 1994. The influence of fluctuating temperatures on hatchling sex ratios-a model and proposed test using Caretta caretta. pp. 156-162. Proceedings of the Australian Marine Turtle Conservation Workshop; Gold Coast.
Girondot, M. 1999a. A fifth hypothesis for the evolution of TSD in reptiles. Trends in ecology & evolution 14: 359-360.
Girondot, M. 1999b. Statistical description of temperature-dependent sex determination using maximum likelihood. Evolutionary Ecology Research 1: 479-486.
Girondot, M., and Y. Kaska. 2014. A model to predict the thermal reaction norm for the embryo growth rate from field data. Journal of thermal biology 45: 96-102.
Godfrey, M.H., V. Delmas and M. Girondot. 2003. Assessment of patterns of temperature-dependent sex determination using maximum likelihood model selection. Ecoscience 10: 265-272.
Godfrey, M.H., and N. Mrosovsky. 2006. Pivotal temperature for green marine turtles, Chelonia mydas, nesting in Suriname. The Herpetological Journal 16: 55-61.
Hamann, M., M. Godfrey, J. Seminoff, K. Arthur, P. Barata, K. Bjorndal, A. Bolten, A. Broderick, L. Campbell and C. Carreras. 2010. Global research priorities for marine turtles: informing management and conservation in the 21st century. Endangered Species Research 11: 245-269.
Hamann, M., C. Limpus and M. Read. 2007. Vulnerability of marine reptiles to climate change in the Great Barrier Reef. in J. Johnson and P. Marshal, eds. Climate change and the Great Barrier Reef: a vulnerability assessment. Great Barrier Reef Marine Park Authority and the Australian Greenhouse Office, Townsville.
Harry, J., and C. Limpus. 1989. Low-temperature protection of marine turtle eggs during long-distance relocation. Wildlife Research 16: 317-320.
Hawkes, L.A., A.C. Broderick, M.H. Godfrey and B.J. Godley. 2009. Climate change and marine turtles. Endangered Species Research 7: 137-154.
Hays, G., J. Ashworth, M. Barnsley, A. Broderick, D. Emery, B. Godley, A. Henwood and E. Jones. 2001. The importance of sand albedo for the thermal conditions on marine turtle nesting beaches. Oikos 93: 87-94.
Hewavisenthi, S., and C.J. Parmenter. 2000. Hydric environment and sex determination in the flatback turtle (Natator depressus Garman)(Chelonia: Cheloniidae). Australian Journal of Zoology 48: 653-659.
Hewavisenthi, S., and C.J. Parmenter. 2002. Thermosensitive period for sexual differentiation of the gonads of the flatback turtle (Natator depressus Garman). Australian Journal of Zoology 50: 521-527.
Houlder, D., M. Hutchinson, H. Nix and J. McMahon. 1999. ANUCLIM User Guide, Version 5.0. in A.N.U. Centre for Resource and Environmental Studies, ed. Centre for Resource and Environmental Studies, Australian National University, Canberra.
Howard, R., I. Bell and D.A. Pike. 2014. Thermal tolerances of marine turtle embryos: current understanding and future directions. Endangered Species Research 26: 75-86.
Howard, R., I. Bell and D.A. Pike. 2015. Tropical flatback turtle (Natator depressus) embryos are resilient to the heat of climate change. Journal of Experimental Biology 218: 3330-3335.
Hulin, V., V. Delmas, M. Girondot, M.H. Godfrey and J.-M. Guillon. 2009. Temperature-dependent sex determination and global change: are some species at greater risk? Oecologia 160: 493-506.
Hulin, V., M. Girondot, M.H. Godfrey and J.M. Guillon. 2008. Mixed and uniform brood sex ratio strategy in turtles: the facts, the theory and their consequences. pp. 279-300 in J. Wyneken, V. Bels and M.H. Godfrey, eds. Turtles: from structures to strategies of life. CRC, Boca Raton.
Ikonomopoulou, M.P., R.C. Aland, K. Ibrahim, E. Gosden and J.M. Whittier. 2012. Quantitative sex identification of hatchling green marine turtles (Chelonia mydas). Journal of Herpetology 46: 331-337.
International Union for Conservation of Nature (IUCN). 2015. IUCN Red List of threatened species. Version 2015.2.
Kaska, Y., R. Downie, R. Tippett and R.W. Furness. 1998. Natural temperature regimes for loggerhead and green turtle nests in the eastern Mediterranean. Canadian Journal of Zoology 76: 723-729.
Kearney, M.R., A.P. Isaac and W.P. Porter. 2014a. microclim: Global estimates of hourly microclimate based on long-term monthly climate averages. Scientific Data 1: 140006.
Kearney, M.R., and W.P. Porter. 2016. NicheMapR-an R package for biophysical modelling: the microclimate model. Ecography 40: 664-674.
Kearney, M.R., A. Shamakhy, R. Tingley, D.J. Karoly, A.A. Hoffmann, P.R. Briggs and W.P. Porter. 2014b. Microclimate modelling at macro scales: a test of a general microclimate model integrated with gridded continental-scale soil and weather data. Methods in Ecology and Evolution 5: 273-286.
Koch, A. U., M. L. Guinea and S. D. Whiting. 2007. Effects of sand erosion and current harvest practices on incubation of the flatback marine turtle (Natator depressus). Australian Journal of Zoology 55: 97-105.

Marine Turtles
84 Kimberley Marine Research Program | Project 1.2.2
Koepke, P., M. Hess, I. Schult and E. Shettle. 1997. Global aerosol data set. p. 44. Max-Planck-Institut fur Meteorologie, Hamburg.
Limpus, C.J. 2009. A biological review of Australian marine turtles. Environmental Protection Agency (EPA).
Limpus, C.J., V. Baker and J.D. Miller. 1979. Movement induced mortality of loggerhead eggs. Herpetologica: 335-338.
Matsuzawa, Y., K. Sato, W. Sakamoto and K. Bjorndal. 2002. Seasonal fluctuations in sand temperature: effects on the incubation period and mortality of loggerhead marine turtle (Caretta caretta) pre-emergent hatchlings in Minabe, Japan. Marine Biology 140: 639-646.
McCullough, E.C., and W.P. Porter. 1971. Computing clear day solar radiation spectra for the terrestrial ecological environment. Ecology 52: 1008-1015.
Miller, J., and C. Limpus. 1981. Incubation period and sexual differentiation in the green turtle Chelonia mydas L. pp. 66-73. Proceedings of the Melbourne Herpetological Symposium. Zoological Board of Victoria, Parkville, Victoria, Australia.
Miller, J.D. 1997. Reproduction in marine turtles. pp. 51-81 in P. Lutz and J. Musick, eds. The biology of marine turtles. CRC Press, Boca Raton.
Mitchell, N.J., M.R. Kearney, N.J. Nelson and W.P. Porter. 2008. Predicting the fate of a living fossil: how will global warming affect sex determination and hatching phenology in tuatara? Proceedings of the Royal Society B: Biological Sciences 275: 2185-2193.
Mitchell, N.J., N. Rodriguez, G. Kuchling, S.G. Arnall and M.R. Kearney. 2016. Reptile embryos and climate change: modelling limits of viability to inform translocation decisions. Biological Conservation 204: 134-147.
Mrosovsky, N., P. Dutton and C. Whitmore. 1984. Sex ratios of two species of marine turtle nesting in Suriname. Canadian Journal of Zoology 62: 2227-2239.
Mrosovsky, N., and C. Pieau. 1991. Transitional range of temperature, pivotal temperatures and thermosensitive stages for sex determination in reptiles. Amphibia-Reptilia 12: 169-179.
Neuwald, J.L., and N. Valenzuela. 2011. The Lesser Known Challenge of Climate Change: Thermal Variance and Sex-Reversal in Vertebrates with Temperature-Dependent Sex Determination. PLoS One 6: e18117.
New, M., D. Lister, M. Hulme and I. Makin. 2002. A high-resolution data set of surface climate over global land areas. Climate research 21: 1-25.
Patrício, A.R., A. Marques, C. Barbosa, A.C. Broderick, B.J. Godley, L.A. Hawkes, R. Rebelo, A. Regalla and P. Catry. 2017. Balanced primary sex ratios and resilience to climate change in a major marine turtle population. Marine Ecology Progress Series 577: 189-203.
Pike, D.A. 2014. Forecasting the viability of marine turtle eggs in a warming world. Global Change Biology 20: 7-15.
Porter, W., J. Mitchell, W. Beckman and C. DeWitt. 1973. Behavioral implications of mechanistic ecology. Oecologia 13: 1-54.
Porter, W.P., and J.W. Mitchell. 2006. Method and system for calculating the spatial-temporal effects of climate and other environmental conditions on animals. p. 155:377 in U.P.a.T. Office, ed, USA.
Porter, W.P., J.L. Sabo, C.R. Tracy, O. Reichman and N. Ramankutty. 2002. Physiology on a landscape scale: plant-animal interactions. Integrative and Comparative Biology 42: 431-453.
R Core Team. 2016. R: A language and environment for statistical computing. R Foundation for Statistical Computing, Vienna, Austria. URL: https://www.R-project.org/.
Raupach, M.R., P.R. Briggs, V. Haverd, E.A. King, M. Paget and C.M. Trudinger. 2009. Australian water availability project (AWAP): CSIRO marine and atmospheric research component: final report for phase 3; CAWCR Technical Report No. 013. in BOM and. CSIRO, ed. Bureau of Meteorology and CSIRO, Canberra, Australia.
Sarre, S.D., A. Georges and A. Quinn. 2004. The ends of a continuum: genetic and temperature-dependent sex determination in reptiles. Bioessays 26: 639-645.
Spotila, J.R., E.A. Standora, S.J. Morreale and G.J. Ruiz. 1987. Temperature dependent sex determination in the green turtle (Chelonia mydas): effects on the sex ratio on a natural nesting beach. Herpetologica: 74-81.
Stancyk, S.E., O.R. Talbert and J.M. Dean. 1980. Nesting activity of the loggerhead turtle Caretta caretta in South Carolina, protection of nests from raccoon predation by transplantation. Biological Conservation 18: 289-298.
Standora, E.A., and J.R. Spotila. 1985. Temperature dependent sex determination in marine turtles. Copeia: 711-722.
Stubbs, J.L., M.R. Kearney, S.D. Whiting and N.J. Mitchell. 2014. Models of primary sex ratios at a major flatback turtle rookery show an anomalous masculinising trend. Climate Change Responses 1: 1-18.
Tedeschi, J., W. J. Kennington, J. Tomkins, O. Berry, S. Whiting, M. Meekan and N. Mitchell. 2016. Heritable variation in heat shock gene expression: a potential mechanism for adaptation to thermal stress in embryos of marine turtles. Proceedings of the Royal Society B: Biological Sciences 283: 20152320.

Marine Turtles
Kimberley Marine Research Program | Project 1.2.2 85
Telemeco, R.S., D.A. Warner, M.K. Reida and F.J. Janzen. 2013. Extreme developmental temperatures result in morphological abnormalities in painted turtles (Chrysemys picta): a climate change perspective. Integrative Zoology 8: 197-208.
Whiting, A.U., A. Thomson, M. Chaloupka and C.J. Limpus. 2008. Seasonality, abundance and breeding biology of one of the largest populations of nesting flatback turtles, Natator depressus: Cape Domett, Western Australia. Australian Journal of Zoology 56: 297-303.
Wibbels, T. 2003. Critical approaches to sex determination in marine turtles. pp. 103-134. The biology of marine turtles.
Wickham, H. 2011. The split-apply-combine strategy for data analysis. Journal of Statistical Software 40: 1-29.
Yntema, C. 1981. Characteristics of gonads and oviducts in hatchlings and young of Chelydra serpentina resulting from three incubation temperatures. Journal of Morphology 167: 297-304.
Yntema, C., and N. Mrosovsky. 1982. Critical periods and pivotal temperatures for sexual differentiation in loggerhead marine turtles. Canadian Journal of Zoology 60: 1012-1016.
Yntema, C.L., and N. Mrosovsky. 1979. Incubation temperature and sex ratio in hatchling loggerhead turtles: a preliminary report. Marine Turtle Newsletter 11: 9-10.
Yntema, C.L., and N. Mrosovsky. 1980. Sexual differentiation in hatchling loggerheads (Caretta caretta) incubated at different controlled temperatures. Herpetologica 36: 33-36.
Zambrano-Bigiarini, M. 2014. hydroGOF: Goodness-of-fit functions for comparison of simulated and observed hydrological time series. R package version 0.3-8.
Zeileis, A., and G. Grothendieck. 2005. zoo: S3 infrastructure for regular and irregular time series. Journal of Statistical Software 14: 1-27.
6 Acknowledgements
The authors are grateful for the assistance provided by many volunteers and collaborators: first and foremost, Tony Tucker, without whom many trips to the remote north-west would not have been possible. We also thank Ryan Douglas, Ben Corey, Erina Young, Sabrina Fossette-Halot, Lauren Peel, Phillipa Wilson, Leia Howes and Oliver Berry who assisted with fieldwork. Histological preparation of samples was conducted by Tom Stewart from the former School of Animal Biology at UWA (2012 study) and Slavica Pervin from the Lions Eye Institute, and we thank Thomas Windsor, Jamie Tedeschi, Lorian Woolgar and Peter Derbyshire for their assistance in the laboratory. We also thank Michael Kearney for his assistance with modelling beach microclimates, and for providing AWAP climate datasets, and Anna Carter for providing the original DEVOUR script. Finally, the authors acknowledge the traditional owners of all sites where research was conducted, and the ranger groups that provided logistical and field assistance as well as their knowledge of country, including: Balanggarra, Karajarri, Miriuwung Gajerrong, Ngarla, Nyangumarta Warren, Nyul Nyul, Thalanyji, and Wunambal Gaambera. Funding for this project was made available by the Western Australian Marine Science Institution (WAMSI) as a part of the Kimberley node project 1.2.2, the Department of Parks and Wildlife (DBCA), and the University of Western Australia (UWA).
Marine Turtles
86 Kimberley Marine Research Program | Project 1.2.2
Chapter 5: Indigenous engagement, collaboration and knowledge exchange for the Kimberley Node Turtle Project
Scott Whiting12 and Tony Tucker1,2 1Dept.Biodiversity, Conservation and Attractions, Marine Science Program, Kensington, Western Australia 2Western Australia Marine Science Institution (WAMSI), Perth, Western Australia
Executive Summary
Indigenous engagement, collaboration, knowledge exchange and Indigenous employment were fundamental components of this project. From the beginning funds were allocated to ensure appropriate levels of collaboration and participation in the project, which amounted to approximately one quarter of the budget. Onground project planning could only commence once funding was received which meant the project did not have the money to engage prior to project scoping. However, flexibility in project scope meant that adjustments to this project following engagement through face to face meetings was possible. The willingness of groups on the ground to progress this project and to discuss turtle issues led to common ground for planning this project. To help implement the project we employed a senior research scientist through DBCA that had both science and Indigenous engagement skills. Several independent trips were made to the Kimberley prior to any field work being conducted to ensure that appropriate consultation was conducted. During the project we met independently and repeatedly with 11 traditional owner or ranger groups that co-manage significant turtle resources across the Kimberley coast and offshore islands.
Information exchange occurred during 50 Indigenous engagement meeting and 32 field trips that collected data. Two-way knowledge transfer occurred between
Over 31 educational products had been prepared at the time of the WAMSI November 2017 conference, including posters, seminars, and support of TO participation in national and regional conferences.
A central aim of all field trips was knowledge exchange with rangers which included delivery of hands-on training in marine turtle techniques to build capacity for ranger groups for ongoing monitoring opportunities. During these trip rangers shared cultural background about the coast and islands and relevant information from their previous visits to the islands.
Marine Turtles
Kimberley Marine Research Program | Project 1.2.2 87
1 Introduction
Indigenous engagement, collaboration and knowledge exchange were a fundamental component of this project. Indigenous knowledge and two-way communication between onground managers and western science is recognised and valued for conservation outcomes across the world (Berkes at al 2000; Drew 2005; Vigilante et al. 2013). In Australia, the value of these partners are displayed through the commitment of State, Territory and Commonwealth governments in programs such as land and sea ranger programs, Indigenous Protected Areas (IPAs) and cross border initiatives such as the Northern Australian Indigenous Land and Sea Alliance (NAILSMA). The benefits of such programs often are far reaching and with outcomes benefiting other sectors including health, employment and education. Indigenous engagement and collaboration was a fundamental component of this project, with its importance enhanced because marine turtles hold high value as food and in ceremony for coastal Indigenous communities.
2 Aims
The aims of this component were integrated through all other components of the project and included:
• Incorporating Indigenous knowledge into project planning and field work planning • Developing opportunities for Indigenous engagement and employment during the project period • Conducting collaborative field trips to enhance training opportunities • Delivering products back to the communities including data layers that can be used for local area
management • Enhancing the capacity for continued turtle research ad monitoring beyond the life of WAMSI Kimberley
Node.
3 Indigenous engagement
Project Scope and budgeting
The initial project scoping by the WAMSI partners acknowledged the cultural significance of marine turtles to Traditional Owners and recognised that need to incorporate existing traditional knowledge into the planning and deliver of the project. For this reason, a substantial budget was allocated for meetings, employment, feedback of information and products. The budget allocation was about a quarter of the total budget.
Project Staff
There were mixed levels of Indigenous engagement experience amongst the staff and students from WAMSI partner organisations for this project. It was emphasised to all staff and students that worked on this project that the Indigenous engagement process was extremely important and that this project would follow the advice from the traditional owners and Kimberley Land Council. DBCA specifically recruited a staff member for this project who had both turtle experience and Indigenous engagement experience.
Planning
Funding for the WAMSI Kimberley Node was delivered by a process which meant that projects and total budgets were allocated prior to initial engagement. Broad scopes of work were already developed prior to any project being provided with funds to allow project development. In future, it would be preferable if project funds could be provided in advance to allow for project scoping prior to the detail project development. There was some flexibility in the original project design that allowed changes to the project to be made based on the advice of traditional owners. Face to face meetings were conducted across the Kimberley at key locations that inlcuded Kununurra, Kalumbaru, Derby, Broome and One Arm Point to ensure that there was a collaborative approach to this project.
Engagement and Collaboration
The planning meetings were a great way to establish formal and informal relationships to progress planning and discuss employment options. At the commencement of the WAMSI Kimberley node, most systems and processes around research agreements and access permissions were ad hoc for each group and different between groups. The Kimberley Land Council supported a Research and Ethics Committee (REAC) process and received
Marine Turtles
88 Kimberley Marine Research Program | Project 1.2.2
applications on behalf of some groups across the Kimberley. Project applications were communicated to the right people and advice or permission was provided back to the researcher. This process was not suited to all groups and communication was not always consistent. Since then, common research protocols have been adopted for the Kimberley under the Kimberley Saltwater Science Project and are available for all groups to use.
The early planning meetings and subsequent engagement led to collaborative work where there was an agreed working relationship and communication protocol. This was often informal but with some groups a formal schedule was developed that was appended to an initial WAMSI MOU. These schedules outlined the scope of the project, the working relationship between the Turtle Project and the individual groups.
The following is a list of actions by the Turtle Project to ensure best endeavours were undertaking to engage appropriately:
• Used existing documents, such as healthy country plans to align objectives to achieve mutual benefit (see references)
• Ensured that contact was made with the appropriate people in each group • Met face to face with groups to ensure appropriate introductions and agree of way forward • Used emails and telephones to communicate regularly between face to face meetings • Submitted REAC application to the Kimberley Land Council • Provided advice on development of WAMSI protocols • Once developed, followed WAMSO General MOU principles. • Develop specific contact agreement between Turtle Project and two individual groups • Paid part PBC meeting costs to one group to ensure that we could introduce the project • Offered salary to all Indigenous groups who worked on the project • Always offered participation in field work • Always offered training in turtle research techniques • Ensured that information and photographs were delivered back to each group
Marine Turtles
Kimberley Marine Research Program | Project 1.2.2 89
4 Summary of activities and shared knowledge
We completed 32 field trips and 50 engagement meetings for the project as detailed in Tables 4.1 and Table 4.2.
Aerial survey
The aerial surveys of Summer and Winter 2014 yielded over 45,000 images that were shared with each TO group in 2015 via a portable hard drive and the data within their boundaries was delineated.
Ground truthing
The verification of turtle tracks or nests by species occurred with ranger participants at least one of the major rookeries for each of the TO groups. Those significant rookeries are detailed in the Chapter on Distribution and Abundance. These field trips provided opportunities for training and knowledge exchange (See Figure 1.).
TO knowledge exchange as a collective overview
Leatherback- Rarely seen, the individuals migrating through Kimberley are not known to nest there. The Wunambal Gaambera recall an elder’s story of a leatherback turtle whose flipper were entangled in a boat line and it dragged the fisherman and his boat along until the line was cut.
Olive ridley- Rare nesters in Kimberley, but individual nesting has been documented on Camden Sound beaches. The recent decade has slowly accumulated records of single nests on Cape Leveque, within Camden Sound at Darcy Island, Vulcan Island, on Smokey Bay and Deception Bay, and an unconfirmed account at Langii. These accounts led to more focus on the Dambimangari track counts for Deception Bay where the light tracks of olive ridleys may be mis-identified.
Loggerheads- Known but rare locally. One observed by Bardi rangers near Cygnet Bay Pearl Farm. Often seen in creeks with muddy water.
Hawksbills-known but rare locally. No recent knowledge of the Jones Island rookery reported by Macassans and early explorers but may relate to survey timing or lack of access. Several tracks seen during Vansittart surveys and one adult female carcass on Troughton Island found with WG rangers. Reports were also noted from Sir Graham Moore Island and Scorpion Island. Several juveniles observed in-water during Montgomery Reef survey with Dambimangari rangers. The Healthy Country plans mention that hawksbill turtles are sometimes poisonous (identifies Lewis Island as having poisonous sea-grass or soft corals).
Flatbacks-known and common, taken for eggs when a rookery is close to a settlement. Seldom taken for meat, and then is usually mistaken for a green turtle. Said to be common in Prince Regent River in Dambimangarri country. A juvenile was observed in Mayala country at Helpman Island by Bardi Jawi rangers. Bardi Jawi identify the eastern-most summer nests of flatbacks at One Arm Point, and Nyul Nyul report the western-most winter nests around Lombadina Point.
Greens –known and common. Harvested differently by size and sex but in general there is a preference for breeding females as having more fat and better tasting. Most of the TO group’s calendar of seasonal events include the times of married turtles, and turtle reproduction, and egg availability.

Marine Turtles
90 Kimberley Marine Research Program | Project 1.2.2
Figure 1. Training activities during ground truthing field trips across the Kimberley. Activities undertaken during WAMSI field trips included data collection, hatchling success, morning track counts, hatchling success measurements, turtle measurements, turtle tagging, paper GIS, data logger excavation, weather station installation, boat surveys, morphometrics and samples from carcasses, genetic samples, satellite tracking of females, predator evaluations.
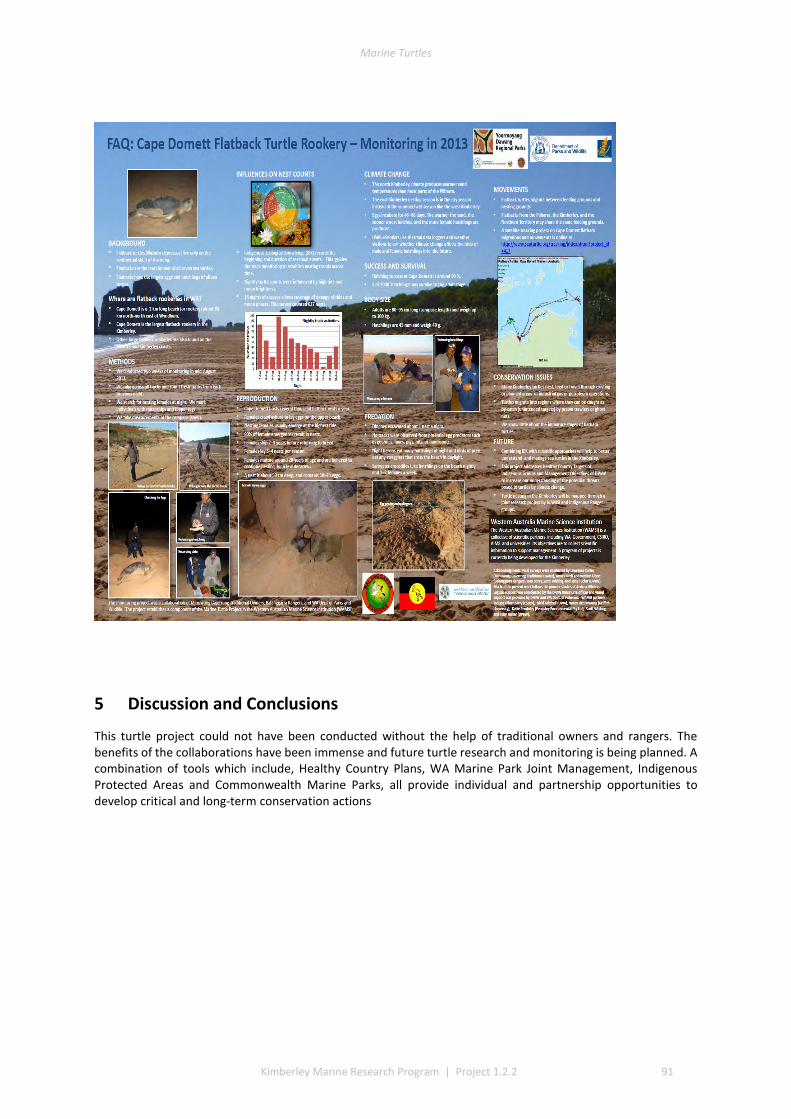
Marine Turtles
Kimberley Marine Research Program | Project 1.2.2 91
5 Discussion and Conclusions
This turtle project could not have been conducted without the help of traditional owners and rangers. The benefits of the collaborations have been immense and future turtle research and monitoring is being planned. A combination of tools which include, Healthy Country Plans, WA Marine Park Joint Management, Indigenous Protected Areas and Commonwealth Marine Parks, all provide individual and partnership opportunities to develop critical and long-term conservation actions

Marine Turtles
92 Kimberley Marine Research Program | Project 1.2.2
6 References
Balanggarra Aboriginal Corporation / Kimberley Land Council (2011). Balanggarra Healthy Country Plan 2012-2022. 50 pp.
Bardi Jawi Niimidiman Aboriginal Corporation / Kimberley Land Council (2013). Bardi Jawi Indigenous Protected Area Management Plan 2013-2013. (2013). 29 pp.
Berkes, F., Colding, J. and Folke, C., 2000. Rediscovery of traditional ecological knowledge as adaptive management. Ecological applications, 10(5), pp.1251-1262.
Dambimangari Aboriginal Corporation (2012). Dambimangari Healthy Country Plan 2012-2022. 56 pp.
Department of Environment and Conservation (2011). Kimberly Science and Conservation Strategy. Department of Environment and Conservation. 50 pp.
Department of Parks and Wildlife (2013). Lalang-garram / Camden Sound Marine Park. Management plan 73 2013–2023, Department of Parks and Wildlife, Perth. 94 pp.
Department of Parks and Wildlife 2014, Eighty Mile Beach Marine Park Management Plan 80 2014-2024. Department of Parks and Wildlife, Perth. 86 pp.
Department of Parks and Wildlife (2016).Yawuru Nagulagun / Roebuck Bay Marine Park Joint Management Plan 2016, Department of Parks and Wildlife, Perth. 108 pp.
Department of Parks and Wildlife (2016). North Kimberley Marine Park Joint management plan 2016 Uunguu, Balanggarra, Miriuwung Gajerrong, and Wilinggin management areas, Number plan 89 Department of Parks and Wildlife, Perth. 64 pp.
Department of Parks and Wildlife (2016). Lalang-garram / Horizontal Falls and North Lalang-garram marine parks joint management plan 2016. Management Plan 88. Department of Parks and Wildlife, Perth. 65 pp.
Drew, J.A., 2005. Use of traditional ecological knowledge in marine conservation. Conservation biology, 19(4), pp.1286-1293.
Karajarri Healthy Country Plan 2013-2013 (2014). Karajarri Traditional Lands Association. 60 pp.
North Kimberley Saltwater Country Steering Committee / Kimberley Land Council (2010.) North Kimberley Saltwater Country Plan. 78 pp.
Vigilante T, et al. (2013). Island Country: aboriginal connections, values and knowledge of the Western Australian Kimberley islands in the context of an island biological survey. Records of the Western Australian Museum Supplement 81: 145-182.
Wunambal Gaambera Aboriginal Corporation (2010). Wunambal Gaambera Healthy Country Plan. Looking after Wunambal Gaambera Country 2010-2020. 56 pp.
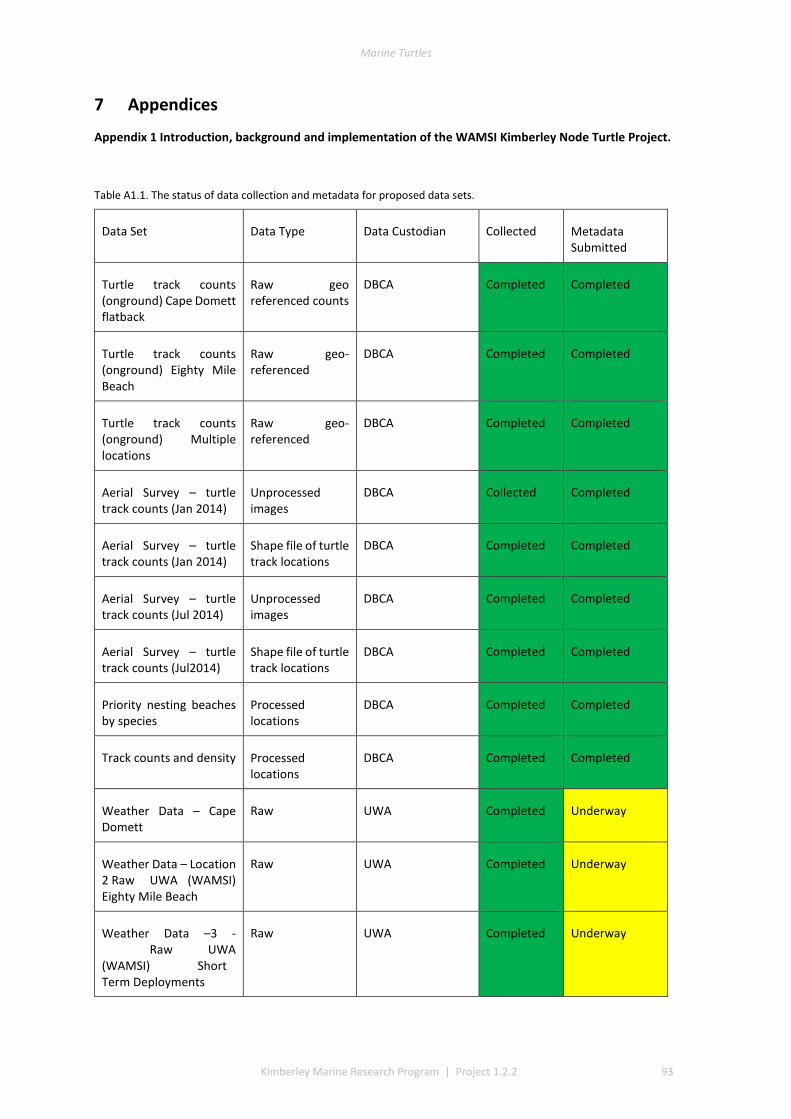
Marine Turtles
Kimberley Marine Research Program | Project 1.2.2 93
7 Appendices
Appendix 1 Introduction, background and implementation of the WAMSI Kimberley Node Turtle Project.
Table A1.1. The status of data collection and metadata for proposed data sets.
Data Set Data Type Data Custodian Collected Metadata Submitted
Turtle track counts (onground) Cape Domett flatback
Raw geo referenced counts
DBCA Completed Completed
Turtle track counts (onground) Eighty Mile Beach
Raw geo-referenced
DBCA Completed Completed
Turtle track counts (onground) Multiple locations
Raw geo-referenced
DBCA Completed Completed
Aerial Survey – turtle track counts (Jan 2014)
Unprocessed images
DBCA Collected Completed
Aerial Survey – turtle track counts (Jan 2014)
Shape file of turtle track locations
DBCA Completed Completed
Aerial Survey – turtle track counts (Jul 2014)
Unprocessed images
DBCA Completed Completed
Aerial Survey – turtle track counts (Jul2014)
Shape file of turtle track locations
DBCA Completed Completed
Priority nesting beaches by species
Processed locations
DBCA Completed Completed
Track counts and density Processed locations
DBCA Completed Completed
Weather Data – Cape Domett
Raw UWA Completed Underway
Weather Data – Location 2 Raw UWA (WAMSI) Eighty Mile Beach
Raw UWA Completed Underway
Weather Data –3 - Raw UWA (WAMSI) Short Term Deployments
Raw UWA Completed Underway
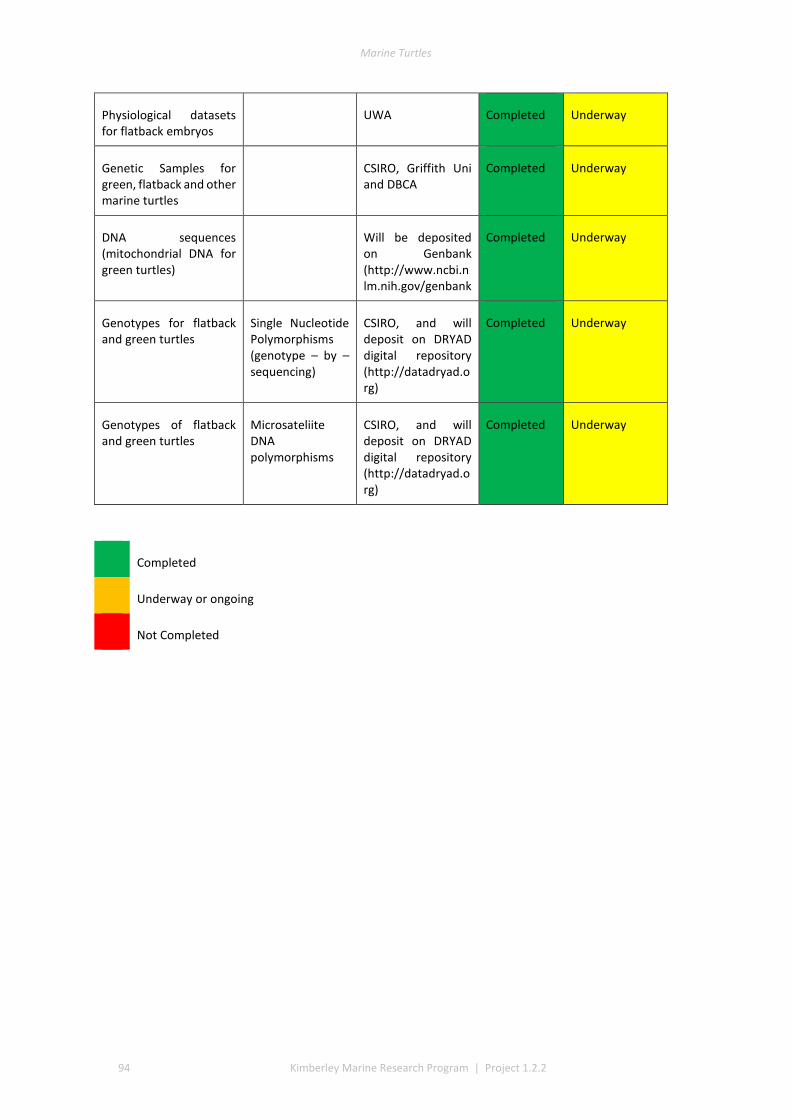
Marine Turtles
94 Kimberley Marine Research Program | Project 1.2.2
Physiological datasets for flatback embryos
UWA Completed Underway
Genetic Samples for green, flatback and other marine turtles
CSIRO, Griffith Uni and DBCA
Completed Underway
DNA sequences (mitochondrial DNA for green turtles)
Will be deposited on Genbank (http://www.ncbi.nlm.nih.gov/genbank
Completed Underway
Genotypes for flatback and green turtles
Single Nucleotide Polymorphisms (genotype – by –sequencing)
CSIRO, and will deposit on DRYAD digital repository (http://datadryad.org)
Completed Underway
Genotypes of flatback and green turtles
Microsateliite DNA polymorphisms
CSIRO, and will deposit on DRYAD digital repository (http://datadryad.org)
Completed Underway
Completed
Underway or ongoing
Not Completed
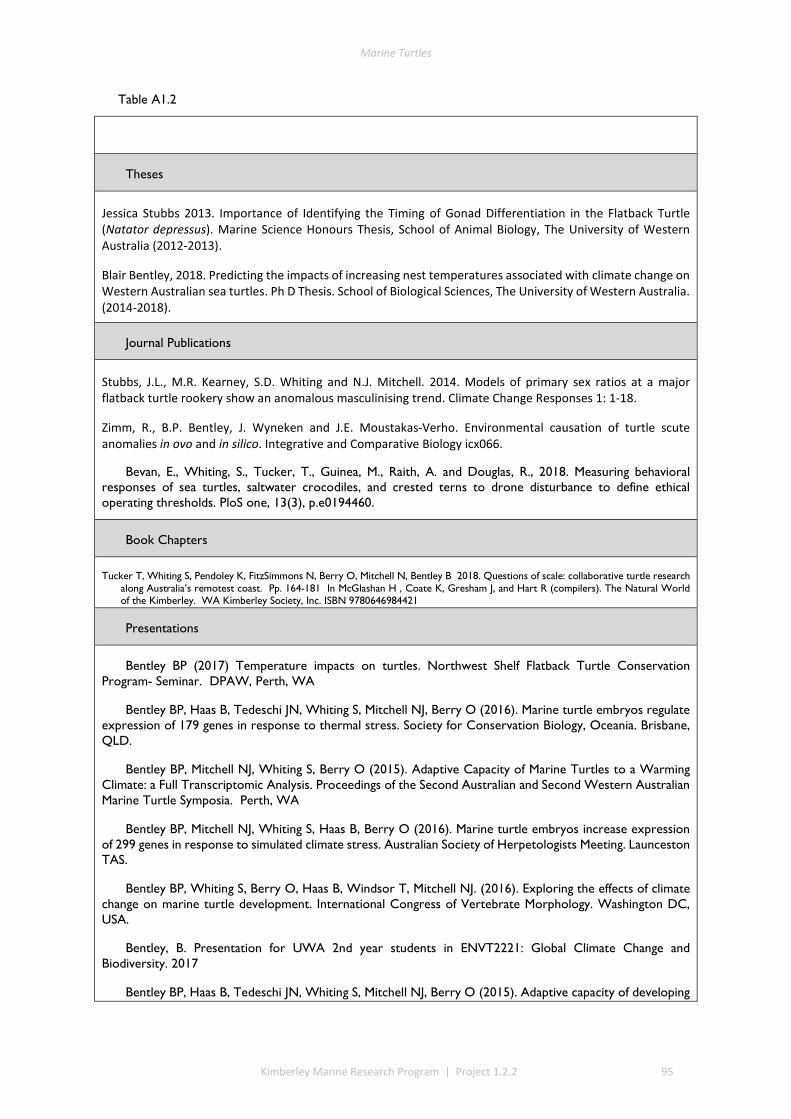
Marine Turtles
Kimberley Marine Research Program | Project 1.2.2 95
Table A1.2
Theses
Jessica Stubbs 2013. Importance of Identifying the Timing of Gonad Differentiation in the Flatback Turtle (Natator depressus). Marine Science Honours Thesis, School of Animal Biology, The University of Western Australia (2012-2013).
Blair Bentley, 2018. Predicting the impacts of increasing nest temperatures associated with climate change on Western Australian sea turtles. Ph D Thesis. School of Biological Sciences, The University of Western Australia. (2014-2018).
Journal Publications
Stubbs, J.L., M.R. Kearney, S.D. Whiting and N.J. Mitchell. 2014. Models of primary sex ratios at a major flatback turtle rookery show an anomalous masculinising trend. Climate Change Responses 1: 1-18.
Zimm, R., B.P. Bentley, J. Wyneken and J.E. Moustakas-Verho. Environmental causation of turtle scute anomalies in ovo and in silico. Integrative and Comparative Biology icx066.
Bevan, E., Whiting, S., Tucker, T., Guinea, M., Raith, A. and Douglas, R., 2018. Measuring behavioral responses of sea turtles, saltwater crocodiles, and crested terns to drone disturbance to define ethical operating thresholds. PloS one, 13(3), p.e0194460.
Book Chapters
Tucker T, Whiting S, Pendoley K, FitzSimmons N, Berry O, Mitchell N, Bentley B 2018. Questions of scale: collaborative turtle research along Australia’s remotest coast. Pp. 164-181 In McGlashan H , Coate K, Gresham J, and Hart R (compilers). The Natural World of the Kimberley. WA Kimberley Society, Inc. ISBN 9780646984421
Presentations
Bentley BP (2017) Temperature impacts on turtles. Northwest Shelf Flatback Turtle Conservation Program- Seminar. DPAW, Perth, WA
Bentley BP, Haas B, Tedeschi JN, Whiting S, Mitchell NJ, Berry O (2016). Marine turtle embryos regulate expression of 179 genes in response to thermal stress. Society for Conservation Biology, Oceania. Brisbane, QLD.
Bentley BP, Mitchell NJ, Whiting S, Berry O (2015). Adaptive Capacity of Marine Turtles to a Warming Climate: a Full Transcriptomic Analysis. Proceedings of the Second Australian and Second Western Australian Marine Turtle Symposia. Perth, WA
Bentley BP, Mitchell NJ, Whiting S, Haas B, Berry O (2016). Marine turtle embryos increase expression of 299 genes in response to simulated climate stress. Australian Society of Herpetologists Meeting. Launceston TAS.
Bentley BP, Whiting S, Berry O, Haas B, Windsor T, Mitchell NJ. (2016). Exploring the effects of climate change on marine turtle development. International Congress of Vertebrate Morphology. Washington DC, USA.
Bentley, B. Presentation for UWA 2nd year students in ENVT2221: Global Climate Change and Biodiversity. 2017
Bentley BP, Haas B, Tedeschi JN, Whiting S, Mitchell NJ, Berry O (2015). Adaptive capacity of developing

Marine Turtles
96 Kimberley Marine Research Program | Project 1.2.2
marine turtle embryos to a warming climate. UWA Animal Biology Postgraduate Seminar Series. Perth, WA.
Bentley, B. UWA School of Biological Sciences Seminars; 2015, 2016 and 2017.
Bentley, BP (2017) Geographic variation in temperature-dependent sex determining mechanism and development rate of marine turtles in Western Australia. Australian Society of Herpetologists, Fairbridge WA
FitzSimmons, N (2017) Northwest Shelf Flatback turtle populations: a genetic perspective. Northwest Shelf Flatback Turtle Conservation Program- Seminar. DPAW, Perth, WA
Mitchell N, Stubbs J, Whiting S, Kearne, M. Sand. (2015) Temperatures at a Major Flatback Rookery Suggest a Masculinising Trend in Recent Decades. Proceedings of the Second Australian and Second Western Australian Marine Turtle Symposia. Proceedings of the Second Australian and Second Western Australian Marine Turtle Symposia. Perth, WA.
Mitchell N. (2017) Pivotal temperatures of marine turtles in WA. Northwest Shelf Flatback Turtle Conservation Program- Seminar. DPAW, Perth, WA
Mitchell, N. Stubbs, J. Whiting. S. and Kearney, M. Australian Marine turtle Symposium, Hillarys, Western Australia. 2014. Talk title: “Sand temperatures at a major flatback rookery suggest a masculinising trend in recent decades.”
Tedeshi J (2017) Flatback marine turtle embryos show a positive response to acute thermal stress. Australian Society of Herpetologists, Fairbridge WA
Tucker T (2015). Known unknowns and the puzzling Teflon turtle: new research directions for flatback turtles. Western Australia Threatened Species Forum. Batavia Maritime Institute. 30 /10/15. Geraldton, WA
Tucker T (2017) Kimberley turtle distribution and abundance from aerial surveys. Northwest Shelf Flatback Turtle Conservation Program- Seminar. DPAW, Perth, WA
Tucker T (2017) Satellite tracking summary. Northwest Shelf Flatback Turtle Conservation Program- Seminar. DPAW, Perth, WA
Tucker T (2017) Skeletochronology summary. Northwest Shelf Flatback Turtle Conservation Program- Seminar. DPAW, Perth, WA
Tucker T (2017) Stable Isotope summary Northwest Shelf Flatback Turtle Conservation Program- Seminar. DPAW, Perth, WA
Tucker T and S Whiting (2016) Collaborative turtle research along Australia’s remotest coast. Kimberley Society Oct 15, 2016. Perth, WA.
Tucker T, Whiting S, Mitchell N, Berry O, FitzSimmons N, Pendoley K (2015) The Kimberley Marine Turtle Project under the Western Australian Marine Sciences Institution (WAMSI). Proceedings of the Second Australian and Second Western Australian Marine Turtle Symposia. Perth, WA
Whiting S. (2016) Marine turtles: iconic ambassadors linking marine habitats, cultures, and regions in north-western Australia. Science on the Broome Coast, June 8, 2016. Broome, WA.
Whiting S, Tucker T, Mitchell N, Berry O, FitzSimmons N, and Pendoley K. (2015) Marine Turtles of the Kimberley. Proceedings of the 2015 WAMSI Research Conference, p. 64. Perth, WA.
Whiting S, Tucker T, Mitchell N, Berry O, FitzSimmons N, and Pendoley K. (2017) Key biological indices required to understand and manage nesting marine turtles along the Kimberley coast. WAMSI conference. Perth, WA.
Whiting S, Tucker T, Mitchell N, Berry O, FitzSimmons N, and Pendoley K. (2015) Marine Turtles of the Kimberley. Kimberley Indigenous Saltwater Science Project. Broome, WA.
Whiting S, Tucker T, Mitchell N, Berry O, Pendoley K, FitzSimmons N (2015) WAMSI Project 1.2.2. – Marine Turtles. Proceedings 2015 WAMSI Research Conference. Perth, WA, 30 March- 1 April 2015.

Marine Turtles
Kimberley Marine Research Program | Project 1.2.2 97
Western Australian Marine Science Institution. Pp 80.
Whiting S. (2017) Time series data and monitoring of marine turtles in WA. Northwest Shelf Flatback Turtle Conservation Program- Seminar. DPAW, Perth, WA.
Whiting S. et al. (2016) Planning and implementing flatback turtle conservation strategies in Western Australia. Third Australian Marine Turtle Symposia- Darwin, NT.
Whiting S., and Tucker T. (2015) Planning for the Future: Constraints and Opportunities for Long-Term Monitoring of Marine Turtles in Western Australia. Proceedings of the Second Australian and Second Western Australian Marine Turtle Symposia. Perth, WA.
Whiting S. Tucker T, Mitchell N, Berry O, FitzSimmons N, and Pendoley K. (2017). Key biological indices required to understand and manage nesting marine turtles along the Kimberley coast, DBCA, Kensington, WA.
Wyneken J, Salmon M, Hamann M, Tucker A, and Whiting S. (2016) Successful and unsuccessful adhesives for use on neonate flatback turtles (Natator depressus): what works and doesn’t work on the “Teflon turtles”. Proc. 36th Annual Symp. Marine turtle Biology and Conservation. Lima Peru.
Young E (2017) Mortality and health of marine turtles in WA. Northwest Shelf Flatback Turtle Conservation Program- Seminar. DPAW, Perth, WA
Young E , Whiting S, Tucker T, Bobojcov A , Williams C, Badal A,Karajarri Ranger Group. (2015) Eighty Mile Beach Turtle Monitoring Program: Past, Present and Future. Proceedings of the Second Australian and Second Western Australian Marine Turtle Symposia. Proceedings of the Second Australian and Second Western Australian Marine Turtle Symposia. Perth, WA.
Media
25/11/2013 Flatback turtles nesting at Eighty Mile Beach West Australian
26/11/2013 Flatback turtles make way to Kimberley beach for nesting season Perth Now
26/11/2013 Many turtles returning to Eighty Mile Beach without laying eggs WA today
27/08/2014 Australian Marine turtle Symposium DPAW
27/08/2014 North West Australian turtles amongst the world's least known ABC radio
4/11/2014 Turtle populations benefit from cooler rookery
Science Network Western Australia
5/11/2014 Cooler temperatures at rookery could lead to increase in male turtle hatchlings, scientists say ABC
1/4/2015 Turtle biodiversity-WAMSI research conference WAMSI website
19/06/2015 Eighty Mile Beach Turtle Monitoring Program DPAW
1/12/2015 Turtle rare to Western Australia found on remote Kimberley coast ABC
22/1/15 Secrets of the green marine turtle revealed KLC newletter
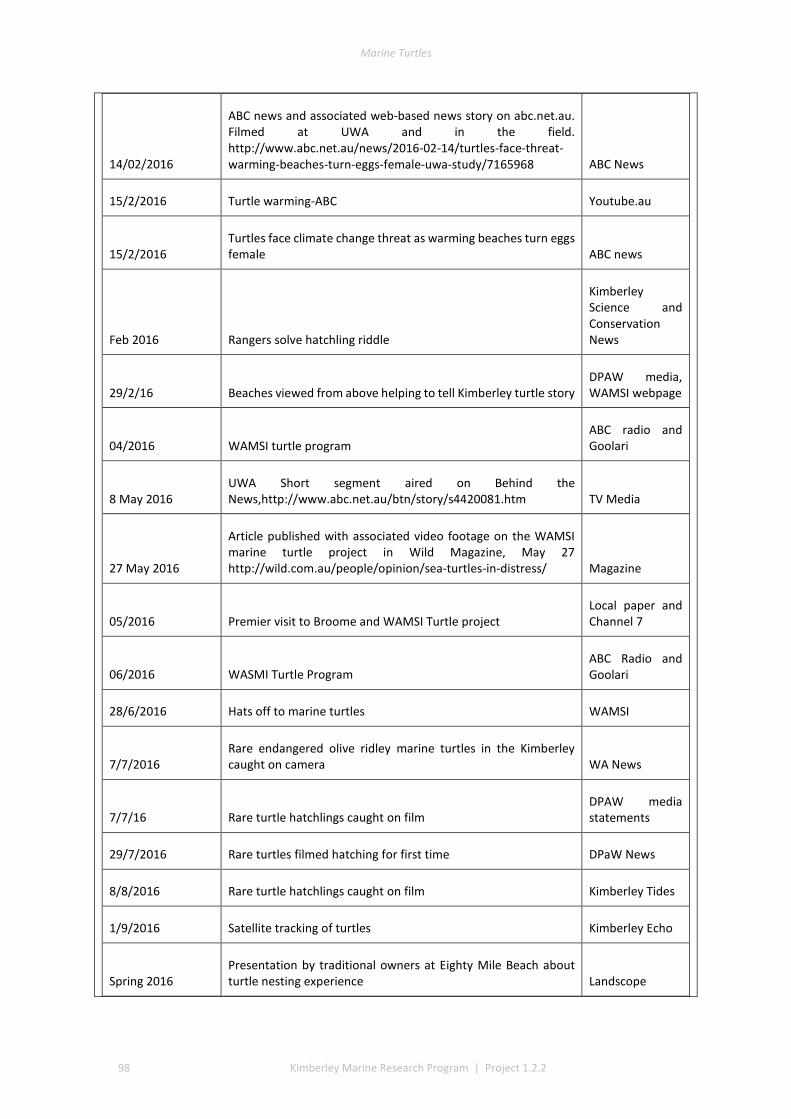
Marine Turtles
98 Kimberley Marine Research Program | Project 1.2.2
14/02/2016
ABC news and associated web-based news story on abc.net.au. Filmed at UWA and in the field. http://www.abc.net.au/news/2016-02-14/turtles-face-threat-warming-beaches-turn-eggs-female-uwa-study/7165968 ABC News
15/2/2016 Turtle warming-ABC Youtube.au
15/2/2016 Turtles face climate change threat as warming beaches turn eggs female ABC news
Feb 2016 Rangers solve hatchling riddle
Kimberley Science and Conservation News
29/2/16 Beaches viewed from above helping to tell Kimberley turtle story DPAW media, WAMSI webpage
04/2016 WAMSI turtle program ABC radio and Goolari
8 May 2016 UWA Short segment aired on Behind the News,http://www.abc.net.au/btn/story/s4420081.htm TV Media
27 May 2016
Article published with associated video footage on the WAMSI marine turtle project in Wild Magazine, May 27 http://wild.com.au/people/opinion/sea-turtles-in-distress/ Magazine
05/2016 Premier visit to Broome and WAMSI Turtle project Local paper and Channel 7
06/2016 WASMI Turtle Program ABC Radio and Goolari
28/6/2016 Hats off to marine turtles WAMSI
7/7/2016 Rare endangered olive ridley marine turtles in the Kimberley caught on camera WA News
7/7/16 Rare turtle hatchlings caught on film DPAW media statements
29/7/2016 Rare turtles filmed hatching for first time DPaW News
8/8/2016 Rare turtle hatchlings caught on film Kimberley Tides
1/9/2016 Satellite tracking of turtles Kimberley Echo
Spring 2016 Presentation by traditional owners at Eighty Mile Beach about turtle nesting experience Landscope
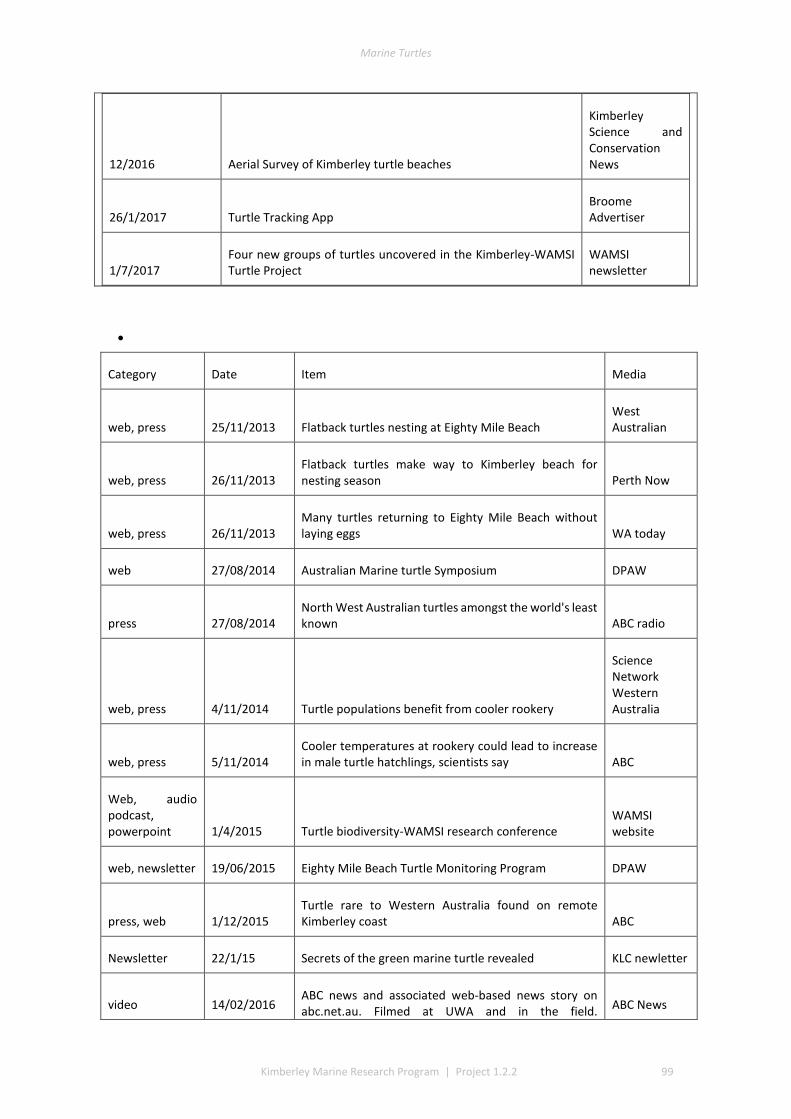
Marine Turtles
Kimberley Marine Research Program | Project 1.2.2 99
12/2016 Aerial Survey of Kimberley turtle beaches
Kimberley Science and Conservation News
26/1/2017 Turtle Tracking App Broome Advertiser
1/7/2017 Four new groups of turtles uncovered in the Kimberley-WAMSI Turtle Project
WAMSI newsletter
•
Category Date Item Media
web, press 25/11/2013 Flatback turtles nesting at Eighty Mile Beach West Australian
web, press 26/11/2013 Flatback turtles make way to Kimberley beach for nesting season Perth Now
web, press 26/11/2013 Many turtles returning to Eighty Mile Beach without laying eggs WA today
web 27/08/2014 Australian Marine turtle Symposium DPAW
press 27/08/2014 North West Australian turtles amongst the world's least known ABC radio
web, press 4/11/2014 Turtle populations benefit from cooler rookery
Science Network Western Australia
web, press 5/11/2014 Cooler temperatures at rookery could lead to increase in male turtle hatchlings, scientists say ABC
Web, audio podcast, powerpoint 1/4/2015 Turtle biodiversity-WAMSI research conference
WAMSI website
web, newsletter 19/06/2015 Eighty Mile Beach Turtle Monitoring Program DPAW
press, web 1/12/2015 Turtle rare to Western Australia found on remote Kimberley coast ABC
Newsletter 22/1/15 Secrets of the green marine turtle revealed KLC newletter
video 14/02/2016 ABC news and associated web-based news story on abc.net.au. Filmed at UWA and in the field. ABC News
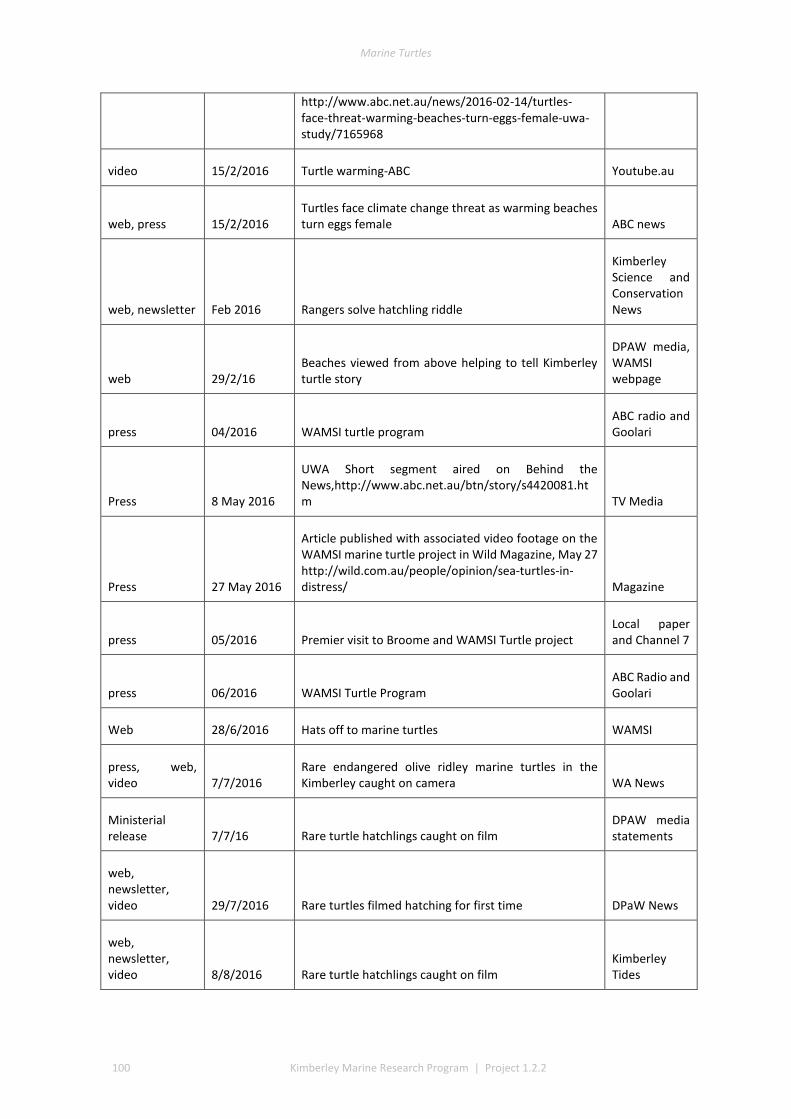
Marine Turtles
100 Kimberley Marine Research Program | Project 1.2.2
http://www.abc.net.au/news/2016-02-14/turtles-face-threat-warming-beaches-turn-eggs-female-uwa-study/7165968
video 15/2/2016 Turtle warming-ABC Youtube.au
web, press 15/2/2016 Turtles face climate change threat as warming beaches turn eggs female ABC news
web, newsletter Feb 2016 Rangers solve hatchling riddle
Kimberley Science and Conservation News
web 29/2/16 Beaches viewed from above helping to tell Kimberley turtle story
DPAW media, WAMSI webpage
press 04/2016 WAMSI turtle program ABC radio and Goolari
Press 8 May 2016
UWA Short segment aired on Behind the News,http://www.abc.net.au/btn/story/s4420081.htm TV Media
Press 27 May 2016
Article published with associated video footage on the WAMSI marine turtle project in Wild Magazine, May 27 http://wild.com.au/people/opinion/sea-turtles-in-distress/ Magazine
press 05/2016 Premier visit to Broome and WAMSI Turtle project Local paper and Channel 7
press 06/2016 WAMSI Turtle Program ABC Radio and Goolari
Web 28/6/2016 Hats off to marine turtles WAMSI
press, web, video 7/7/2016
Rare endangered olive ridley marine turtles in the Kimberley caught on camera WA News
Ministerial release 7/7/16 Rare turtle hatchlings caught on film
DPAW media statements
web, newsletter, video 29/7/2016 Rare turtles filmed hatching for first time DPaW News
web, newsletter, video 8/8/2016 Rare turtle hatchlings caught on film
Kimberley Tides
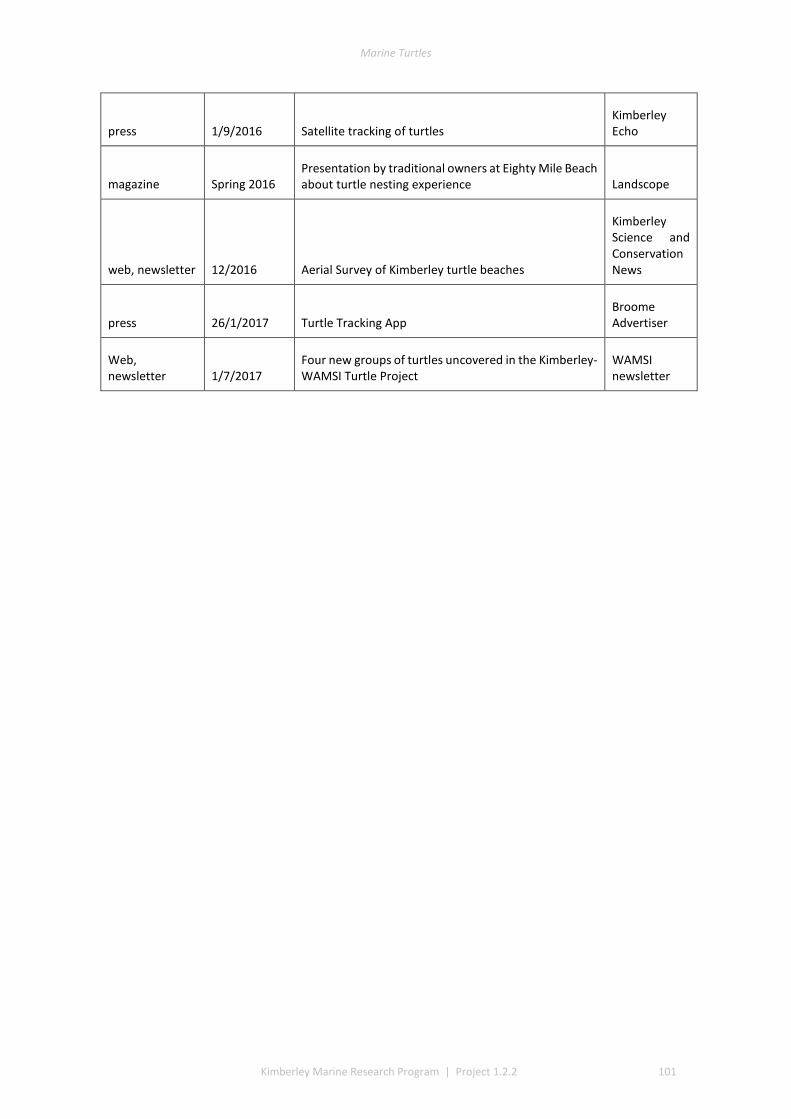
Marine Turtles
Kimberley Marine Research Program | Project 1.2.2 101
press 1/9/2016 Satellite tracking of turtles Kimberley Echo
magazine Spring 2016 Presentation by traditional owners at Eighty Mile Beach about turtle nesting experience Landscope
web, newsletter 12/2016 Aerial Survey of Kimberley turtle beaches
Kimberley Science and Conservation News
press 26/1/2017 Turtle Tracking App Broome Advertiser
Web, newsletter 1/7/2017
Four new groups of turtles uncovered in the Kimberley-WAMSI Turtle Project
WAMSI newsletter
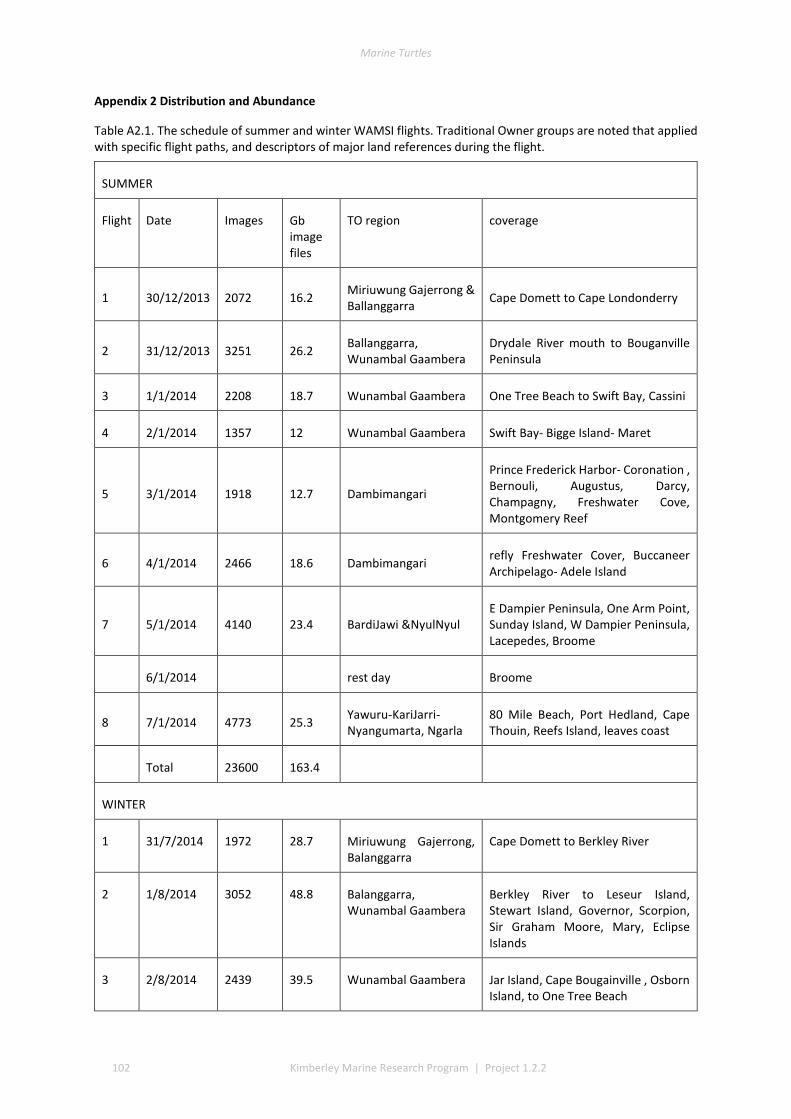
Marine Turtles
102 Kimberley Marine Research Program | Project 1.2.2
Appendix 2 Distribution and Abundance
Table A2.1. The schedule of summer and winter WAMSI flights. Traditional Owner groups are noted that applied with specific flight paths, and descriptors of major land references during the flight.
SUMMER
Flight Date Images Gb image files
TO region coverage
1 30/12/2013 2072 16.2 Miriuwung Gajerrong & Ballanggarra Cape Domett to Cape Londonderry
2 31/12/2013 3251 26.2 Ballanggarra, Wunambal Gaambera
Drydale River mouth to Bouganville Peninsula
3 1/1/2014 2208 18.7 Wunambal Gaambera One Tree Beach to Swift Bay, Cassini
4 2/1/2014 1357 12 Wunambal Gaambera Swift Bay- Bigge Island- Maret
5 3/1/2014 1918 12.7 Dambimangari
Prince Frederick Harbor- Coronation , Bernouli, Augustus, Darcy, Champagny, Freshwater Cove, Montgomery Reef
6 4/1/2014 2466 18.6 Dambimangari refly Freshwater Cover, Buccaneer Archipelago- Adele Island
7 5/1/2014 4140 23.4 BardiJawi &NyulNyul E Dampier Peninsula, One Arm Point, Sunday Island, W Dampier Peninsula, Lacepedes, Broome
6/1/2014 rest day Broome
8 7/1/2014 4773 25.3 Yawuru-KariJarri-Nyangumarta, Ngarla
80 Mile Beach, Port Hedland, Cape Thouin, Reefs Island, leaves coast
Total 23600 163.4
WINTER
1 31/7/2014 1972 28.7 Miriuwung Gajerrong, Balanggarra
Cape Domett to Berkley River
2 1/8/2014 3052 48.8 Balanggarra, Wunambal Gaambera
Berkley River to Leseur Island, Stewart Island, Governor, Scorpion, Sir Graham Moore, Mary, Eclipse Islands
3 2/8/2014 2439 39.5 Wunambal Gaambera Jar Island, Cape Bougainville , Osborn Island, to One Tree Beach
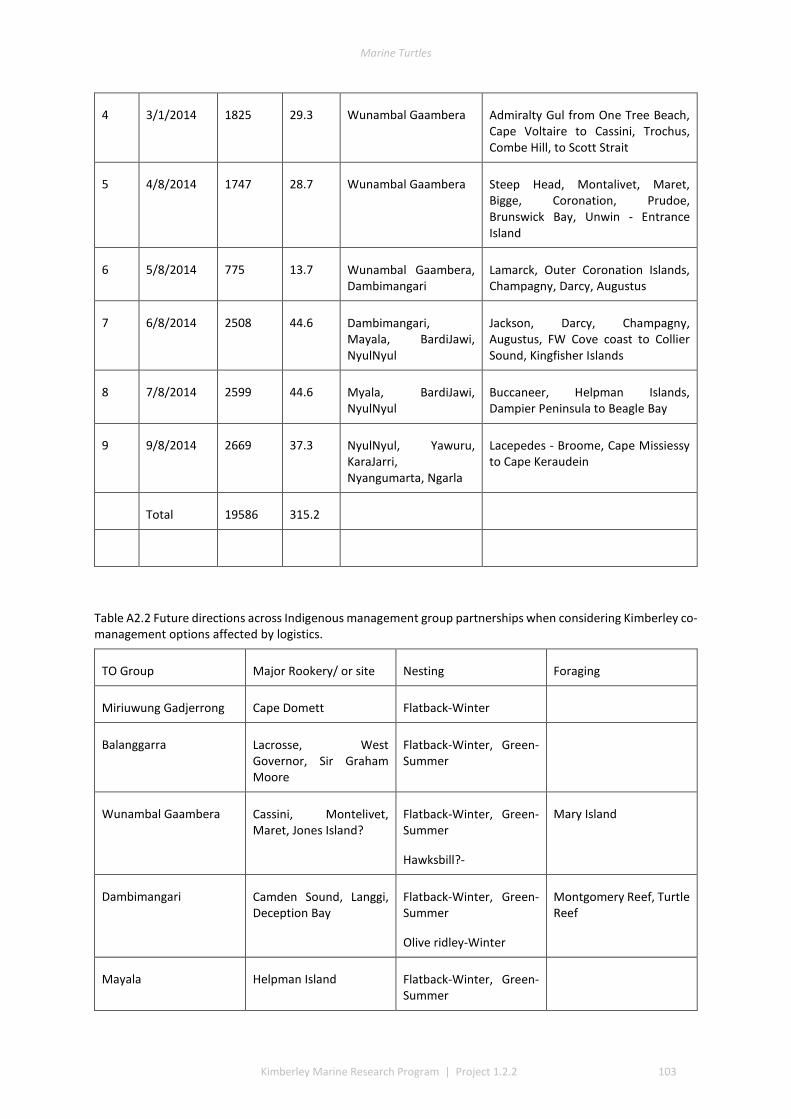
Marine Turtles
Kimberley Marine Research Program | Project 1.2.2 103
4 3/1/2014 1825 29.3 Wunambal Gaambera Admiralty Gul from One Tree Beach, Cape Voltaire to Cassini, Trochus, Combe Hill, to Scott Strait
5 4/8/2014 1747 28.7 Wunambal Gaambera Steep Head, Montalivet, Maret, Bigge, Coronation, Prudoe, Brunswick Bay, Unwin - Entrance Island
6 5/8/2014 775 13.7 Wunambal Gaambera, Dambimangari
Lamarck, Outer Coronation Islands, Champagny, Darcy, Augustus
7 6/8/2014 2508 44.6 Dambimangari, Mayala, BardiJawi, NyulNyul
Jackson, Darcy, Champagny, Augustus, FW Cove coast to Collier Sound, Kingfisher Islands
8 7/8/2014 2599 44.6 Myala, BardiJawi, NyulNyul
Buccaneer, Helpman Islands, Dampier Peninsula to Beagle Bay
9 9/8/2014 2669 37.3 NyulNyul, Yawuru, KaraJarri, Nyangumarta, Ngarla
Lacepedes - Broome, Cape Missiessy to Cape Keraudein
Total 19586 315.2
Table A2.2 Future directions across Indigenous management group partnerships when considering Kimberley co-management options affected by logistics.
TO Group Major Rookery/ or site Nesting Foraging
Miriuwung Gadjerrong Cape Domett Flatback-Winter
Balanggarra Lacrosse, West Governor, Sir Graham Moore
Flatback-Winter, Green-Summer
Wunambal Gaambera Cassini, Montelivet, Maret, Jones Island?
Flatback-Winter, Green-Summer
Hawksbill?-
Mary Island
Dambimangari Camden Sound, Langgi, Deception Bay
Flatback-Winter, Green-Summer
Olive ridley-Winter
Montgomery Reef, Turtle Reef
Mayala Helpman Island Flatback-Winter, Green-Summer
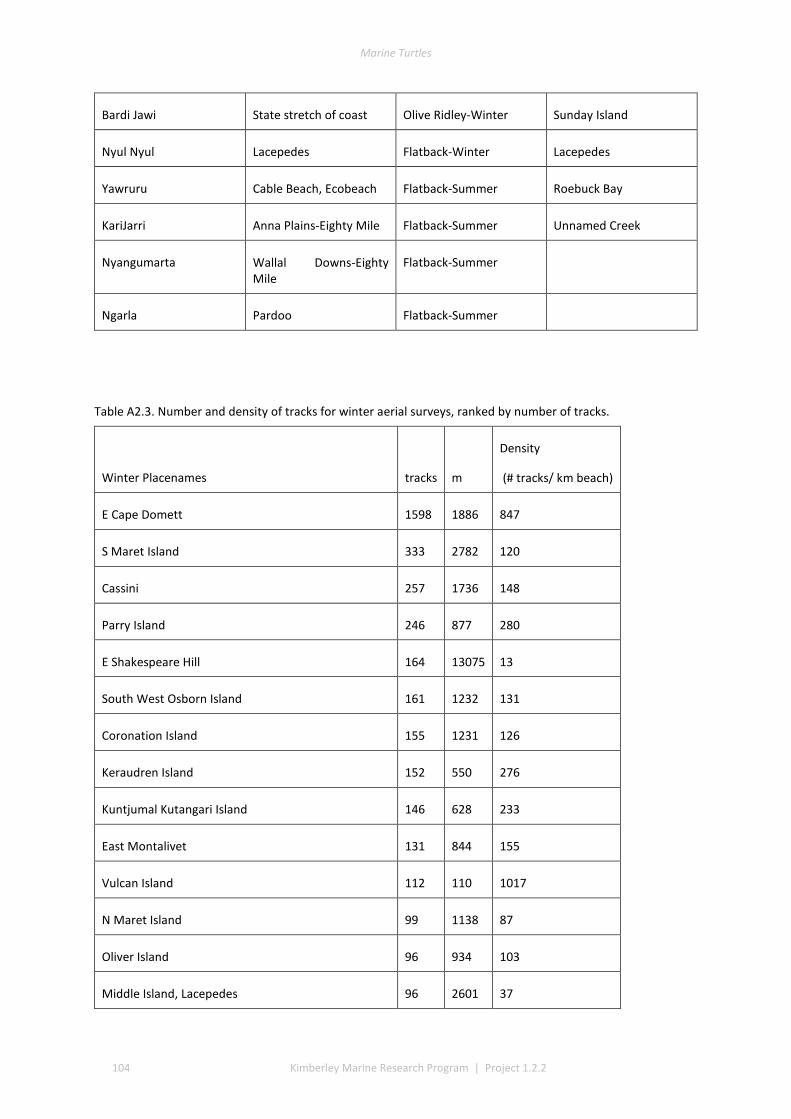
Marine Turtles
104 Kimberley Marine Research Program | Project 1.2.2
Bardi Jawi State stretch of coast Olive Ridley-Winter Sunday Island
Nyul Nyul Lacepedes Flatback-Winter Lacepedes
Yawruru Cable Beach, Ecobeach Flatback-Summer Roebuck Bay
KariJarri Anna Plains-Eighty Mile Flatback-Summer Unnamed Creek
Nyangumarta Wallal Downs-Eighty Mile
Flatback-Summer
Ngarla Pardoo Flatback-Summer
Table A2.3. Number and density of tracks for winter aerial surveys, ranked by number of tracks.
Winter Placenames tracks m
Density
(# tracks/ km beach)
E Cape Domett 1598 1886 847
S Maret Island 333 2782 120
Cassini 257 1736 148
Parry Island 246 877 280
E Shakespeare Hill 164 13075 13
South West Osborn Island 161 1232 131
Coronation Island 155 1231 126
Keraudren Island 152 550 276
Kuntjumal Kutangari Island 146 628 233
East Montalivet 131 844 155
Vulcan Island 112 110 1017
N Maret Island 99 1138 87
Oliver Island 96 934 103
Middle Island, Lacepedes 96 2601 37
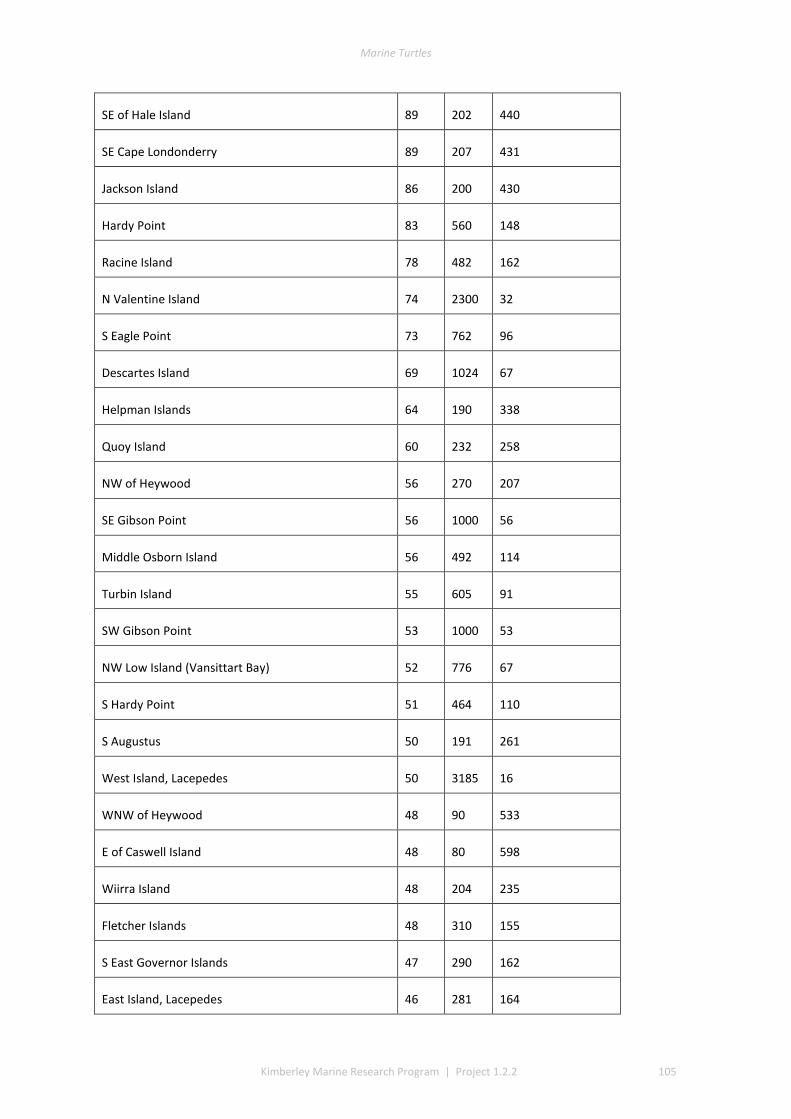
Marine Turtles
Kimberley Marine Research Program | Project 1.2.2 105
SE of Hale Island 89 202 440
SE Cape Londonderry 89 207 431
Jackson Island 86 200 430
Hardy Point 83 560 148
Racine Island 78 482 162
N Valentine Island 74 2300 32
S Eagle Point 73 762 96
Descartes Island 69 1024 67
Helpman Islands 64 190 338
Quoy Island 60 232 258
NW of Heywood 56 270 207
SE Gibson Point 56 1000 56
Middle Osborn Island 56 492 114
Turbin Island 55 605 91
SW Gibson Point 53 1000 53
NW Low Island (Vansittart Bay) 52 776 67
S Hardy Point 51 464 110
S Augustus 50 191 261
West Island, Lacepedes 50 3185 16
WNW of Heywood 48 90 533
E of Caswell Island 48 80 598
Wiirra Island 48 204 235
Fletcher Islands 48 310 155
S East Governor Islands 47 290 162
East Island, Lacepedes 46 281 164
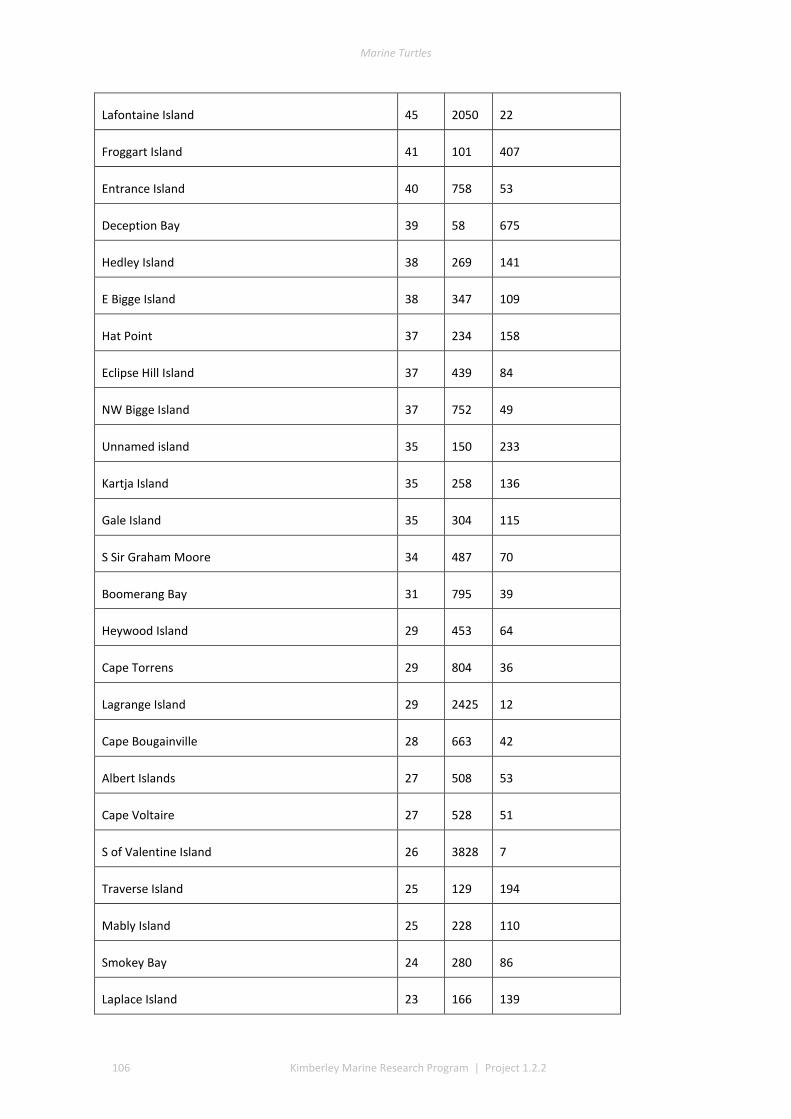
Marine Turtles
106 Kimberley Marine Research Program | Project 1.2.2
Lafontaine Island 45 2050 22
Froggart Island 41 101 407
Entrance Island 40 758 53
Deception Bay 39 58 675
Hedley Island 38 269 141
E Bigge Island 38 347 109
Hat Point 37 234 158
Eclipse Hill Island 37 439 84
NW Bigge Island 37 752 49
Unnamed island 35 150 233
Kartja Island 35 258 136
Gale Island 35 304 115
S Sir Graham Moore 34 487 70
Boomerang Bay 31 795 39
Heywood Island 29 453 64
Cape Torrens 29 804 36
Lagrange Island 29 2425 12
Cape Bougainville 28 663 42
Albert Islands 27 508 53
Cape Voltaire 27 528 51
S of Valentine Island 26 3828 7
Traverse Island 25 129 194
Mably Island 25 228 110
Smokey Bay 24 280 86
Laplace Island 23 166 139

Marine Turtles
Kimberley Marine Research Program | Project 1.2.2 107
SW Sir Graham Moore 22 2165 10
East Helipad Island 20 153 131
Colbert Island 20 298 67
Katers Island 20 396 50
Fenelon Island 20 1439 14
W Bigge Island 19 287 66
Malcolm Island 19 320 59
S Freshwater Cove 19 1369 14
E Combe Hill Island 17 150 113
N Madarr 17 150 113
SW Heywood 17 200 85
Hecla Island 17 258 66
N Freshwater Bay (Western side of Vansittart Bay) 17 822 21
Prudhoe Island 16 262 61
Laseron 16 271 59
Slate Islands (Wailgwin Island) 16 310 52
Sandy Islet, Lacepedes 16 662 24
W Cape Brewster 16 804 20
NW of Darcy Island 15 200 75
Woninjaba Islands 15 135 112
Gibson Point 15 2125 7
SE Laseron 14 130 108
Lulim Island (Slate Islands) 14 156 90
Point Torment (N of Mary Island N and Mary Island S) 14 436 32
Corvisart Island 14 485 29
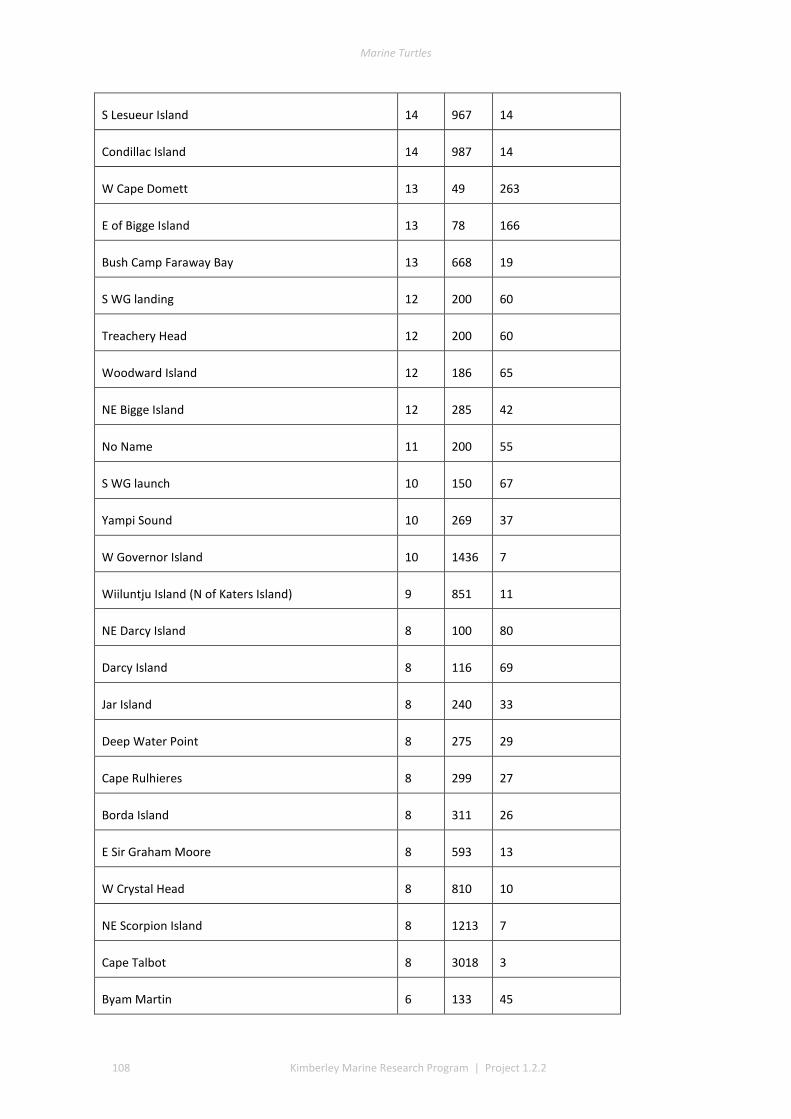
Marine Turtles
108 Kimberley Marine Research Program | Project 1.2.2
S Lesueur Island 14 967 14
Condillac Island 14 987 14
W Cape Domett 13 49 263
E of Bigge Island 13 78 166
Bush Camp Faraway Bay 13 668 19
S WG landing 12 200 60
Treachery Head 12 200 60
Woodward Island 12 186 65
NE Bigge Island 12 285 42
No Name 11 200 55
S WG launch 10 150 67
Yampi Sound 10 269 37
W Governor Island 10 1436 7
Wiiluntju Island (N of Katers Island) 9 851 11
NE Darcy Island 8 100 80
Darcy Island 8 116 69
Jar Island 8 240 33
Deep Water Point 8 275 29
Cape Rulhieres 8 299 27
Borda Island 8 311 26
E Sir Graham Moore 8 593 13
W Crystal Head 8 810 10
NE Scorpion Island 8 1213 7
Cape Talbot 8 3018 3
Byam Martin 6 133 45

Marine Turtles
Kimberley Marine Research Program | Project 1.2.2 109
West Montalivet Island 6 211 28
Combe Hill Island 6 333 18
E Governor Island 6 868 7
Glycosmis Bay 6 893 7
N Freshwater Cove 6 2688 2
Truscott 6 2937 2
Anjo Peninsula 6 5634 1
Tjungkurakutangari Island 5 59 85
S Cape Bougainville 5 378 13
Corneille Island 5 464 11
E Wollaston Island 4 100 40
Melomys Island 4 100 40
Unnamed 4 100 40
Edeline Islands 4 188 21
Queen Island 4 247 16
Parry Harbour 4 486 8
Berthier Island 4 500 8
SE Low Island (Vansittart Bay) 4 598 7
Lamarck Island 4 618 6
SW High Bluff 4 1473 3
W Drysdale R mouth 4 3262 1
SW Kingfisher 3 244 12
E Dempsey Island (near Cheriton Island) 2 100 20
Lucas Island 2 100 20
N Darcy Island 2 100 20

Marine Turtles
110 Kimberley Marine Research Program | Project 1.2.2
NE Long Island 2 100 20
W King Island Sound 2 250 8
Helpman East 2 20 100
High Island 2 47 42
SE Point Usborne 2 61 33
Eclipse Islands 2 89 22
S Lizard Island 2 101 20
Seaflower Bay 2 112 18
Moliere Island 2 151 13
E Katers Island 2 165 12
S Hat Point 2 187 11
Swan Island 2 209 10
Solem Island 2 376 5
Sandy Island 2 747 3
Goodenough Bay 2 1400 1
Jones Island 2 1675 1
N Eclipse Island 2 2151 1
Cape Dussejour 2 2871 1
inlet N Current Point 1 200 5
W Buckland Point 1 200 5
S Cape Rulhieres 1 139 7
E Cape Pond 1 176 6
E Hall Point 1 178 6
Rocky Cove 1 360 3
S Wilson Point 1 496 2

Marine Turtles
Kimberley Marine Research Program | Project 1.2.2 111
S of Steep Head 1 652 2
W Stewart Islands 1 827 1
Maddarr 1 965 1
Table A2 4. Number and density of tracks for summer aerial surveys, ranked from number of tracks.
Summer Placenames tracks m
Density
(# tracks / km of beach)
80 Mile 4387 212418 21
Lacepedes 3910 12650 309
Maret Island 562 1625 346
Cassini 293 3327 88
Parry Island 124 663 187
Oliver Island 110 571 193
Bo'ville Peninsula 88 377 233
West Montelivet Island 82 1197 68
Sir Graham Moore Island 74 3966 19
Condillac Island 73 987 74
East Montalivet Island 65 754 86
Walker Island (Montalivet Islands) 63 342 184
S Cape Missiessy 53 1000 53
S Cape Voltaire 51 396 129
S Freshwater Cove 48 856 56
Berthier Island 38 652 58
N Cape Villaret 37 13207 3

Marine Turtles
112 Kimberley Marine Research Program | Project 1.2.2
Froggart Island (NE of Fenelon Island) 36 86 417
Wiiluntju Island (N of Katers Island) 30 1190 25
SE of Hale Island 27 406 67
Smokey Bay 25 280 89
North Eclipse Island 25 2703 9
Vansittart Bay 22 2214 10
LaPlace Island 21 169 124
Colbert Island 21 1008 21
Anjo Peninsula 21 6147 3
Prudhoe Island 20 262 76
Low Island (Vansittart Bay) 20 770 26
No Name 19 200 95
Unnamed 17 200 85
Whitley Island 15 241 62
Scorpion Island 15 249 60
Middle Osborn Island 15 503 30
Eclipse Island 15 611 25
E High Bluff 15 804 19
Albert Islands (Bonaparte Archipelago) 14 306 46
Carronade Island 14 1264 11
Keraudren Island 13 555 23
Turbin Island 13 602 22
Mictyis Island 12 121 99
Cape Bernier 12 154 78
S Coulomb Point 12 7617 2
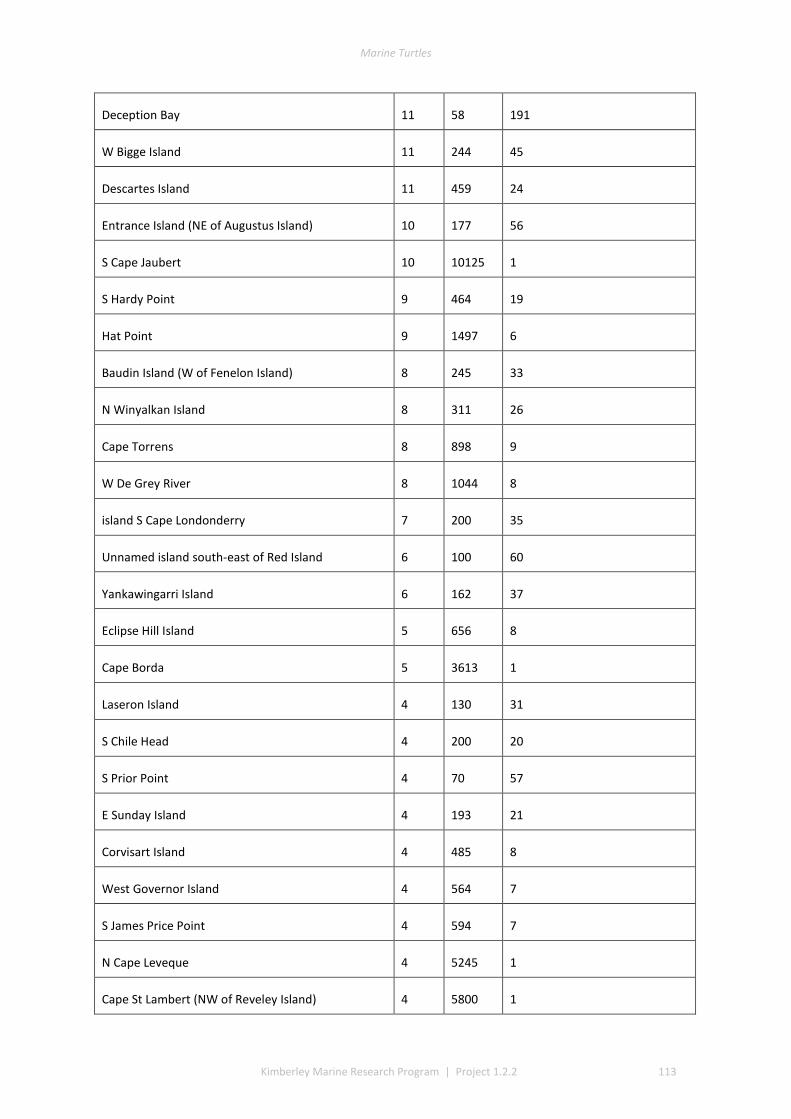
Marine Turtles
Kimberley Marine Research Program | Project 1.2.2 113
Deception Bay 11 58 191
W Bigge Island 11 244 45
Descartes Island 11 459 24
Entrance Island (NE of Augustus Island) 10 177 56
S Cape Jaubert 10 10125 1
S Hardy Point 9 464 19
Hat Point 9 1497 6
Baudin Island (W of Fenelon Island) 8 245 33
N Winyalkan Island 8 311 26
Cape Torrens 8 898 9
W De Grey River 8 1044 8
island S Cape Londonderry 7 200 35
Unnamed island south-east of Red Island 6 100 60
Yankawingarri Island 6 162 37
Eclipse Hill Island 5 656 8
Cape Borda 5 3613 1
Laseron Island 4 130 31
S Chile Head 4 200 20
S Prior Point 4 70 57
E Sunday Island 4 193 21
Corvisart Island 4 485 8
West Governor Island 4 564 7
S James Price Point 4 594 7
N Cape Leveque 4 5245 1
Cape St Lambert (NW of Reveley Island) 4 5800 1

Marine Turtles
114 Kimberley Marine Research Program | Project 1.2.2
S Cape Londonderry 3 150 20
Gaimard Island 3 209 14
Quoy Island 3 233 13
Hale Island 3 699 4
North Head 2 100 20
Mary Island 2 740 3
Solem Islands 2 45 44
Carlia Island 2 124 16
Poolngin Island 2 129 16
Coronation Island 2 330 6
Combe Hill Island 2 340 6
Fenelon Island 2 343 6
Bernoulli Island (SW of Waring Island) 2 612 3
Cape Domett 2 1897 1
Steep Head Island 1 70 14
Fletcher Islands 1 71 14
Purrungki Island 1 87 12
Vulcan Island 1 112 9
S Raft Point 1 132 8
Galley Point 1 163 6
N Bigge Island 1 216 5
Katers Island 1 220 5
N of Kannamatju Island 1 257 4
Long Island 1 957 1
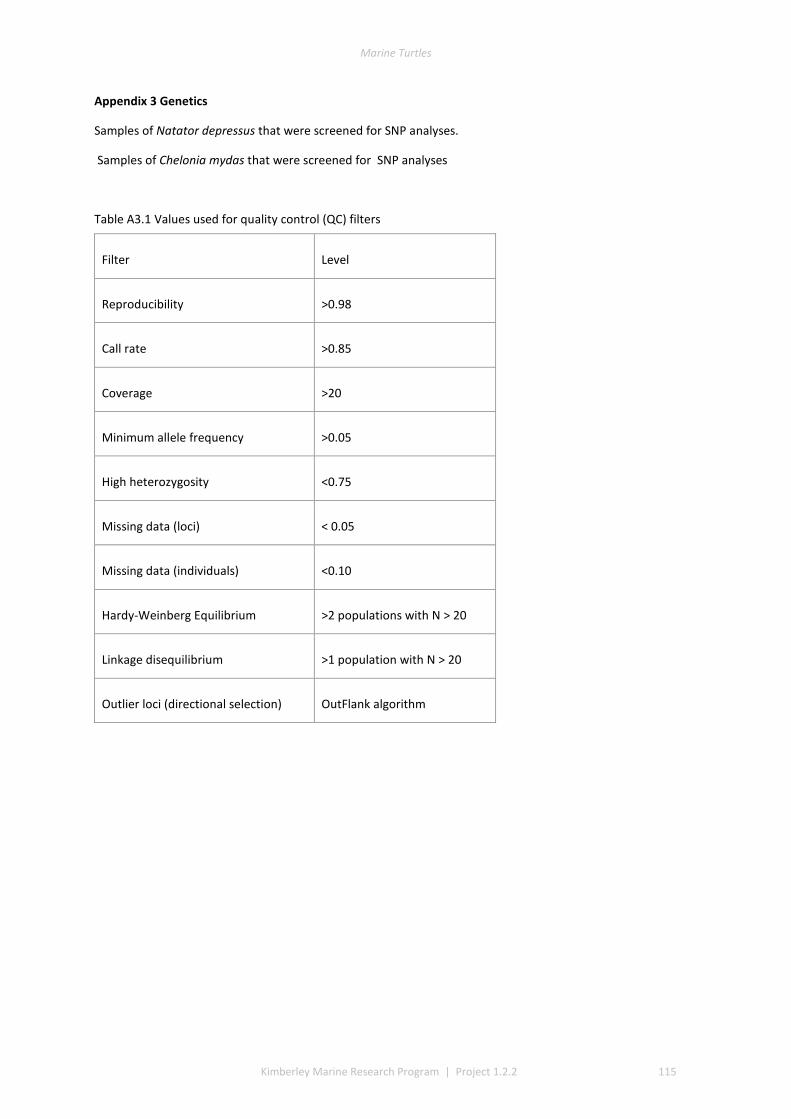
Marine Turtles
Kimberley Marine Research Program | Project 1.2.2 115
Appendix 3 Genetics
Samples of Natator depressus that were screened for SNP analyses.
Samples of Chelonia mydas that were screened for SNP analyses
Table A3.1 Values used for quality control (QC) filters
Filter Level
Reproducibility >0.98
Call rate >0.85
Coverage >20
Minimum allele frequency >0.05
High heterozygosity <0.75
Missing data (loci) < 0.05
Missing data (individuals) <0.10
Hardy-Weinberg Equilibrium >2 populations with N > 20
Linkage disequilibrium >1 population with N > 20
Outlier loci (directional selection) OutFlank algorithm
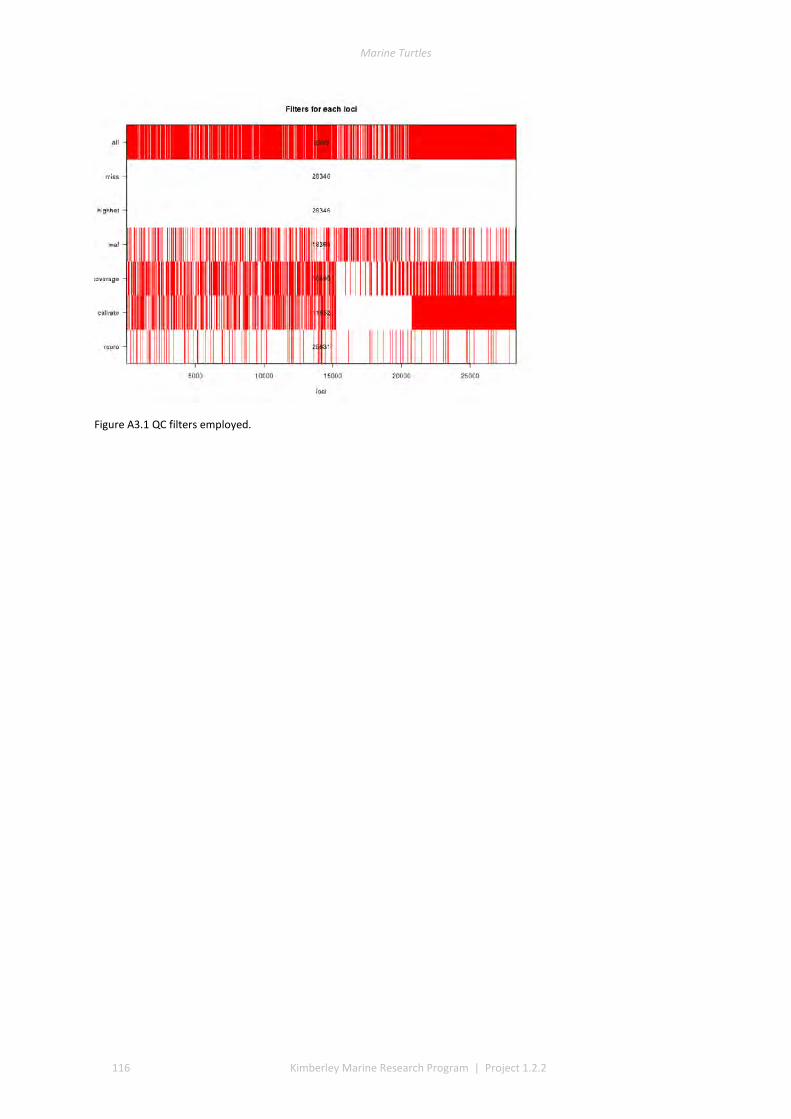
Marine Turtles
116 Kimberley Marine Research Program | Project 1.2.2
Figure A3.1 QC filters employed.
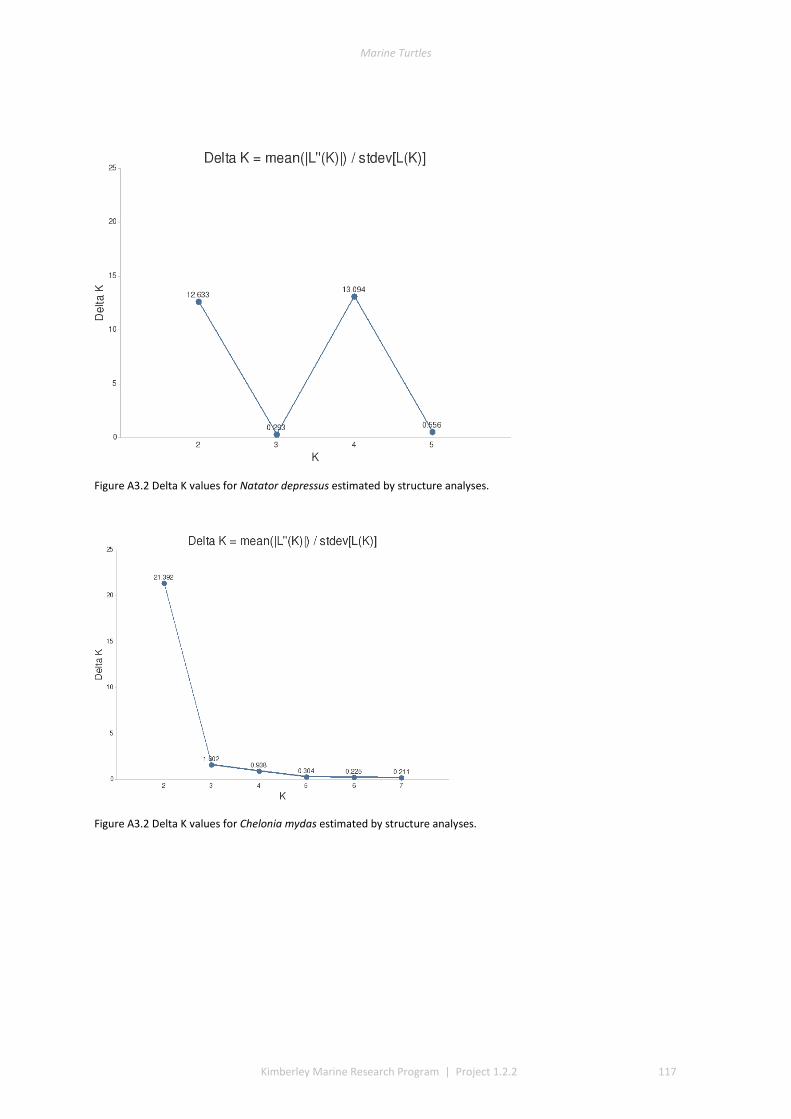
Marine Turtles
Kimberley Marine Research Program | Project 1.2.2 117
Figure A3.2 Delta K values for Natator depressus estimated by structure analyses.
Figure A3.2 Delta K values for Chelonia mydas estimated by structure analyses.
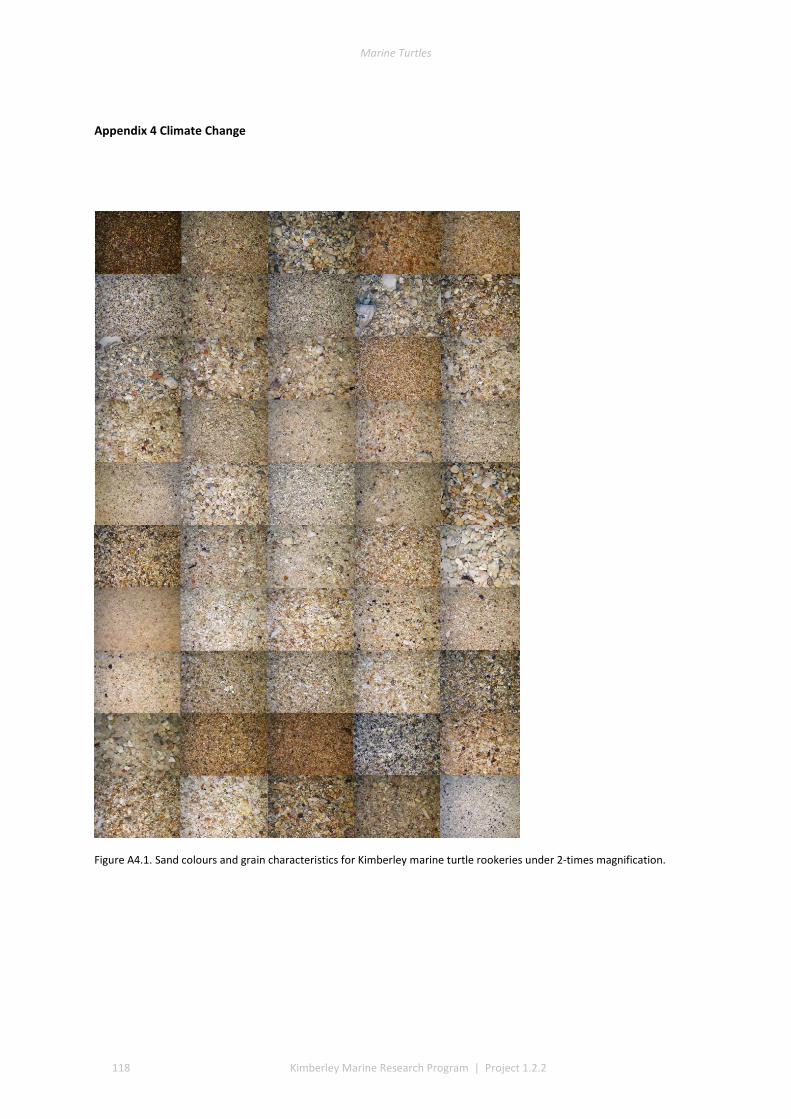
Marine Turtles
118 Kimberley Marine Research Program | Project 1.2.2
Appendix 4 Climate Change
Figure A4.1. Sand colours and grain characteristics for Kimberley marine turtle rookeries under 2-times magnification.

Marine Turtles
Kimberley Marine Research Program | Project 1.2.2 119
Figure A4.2. Relationship between ‘average image colour’ and solar reflectance for sand samples collected throughout the Kimberley region of Western Australia. Black open circles represent observed values and red crosses represent predicted values for samples where reflectance data was not available. The linear regression explained 84% of the observed variance.
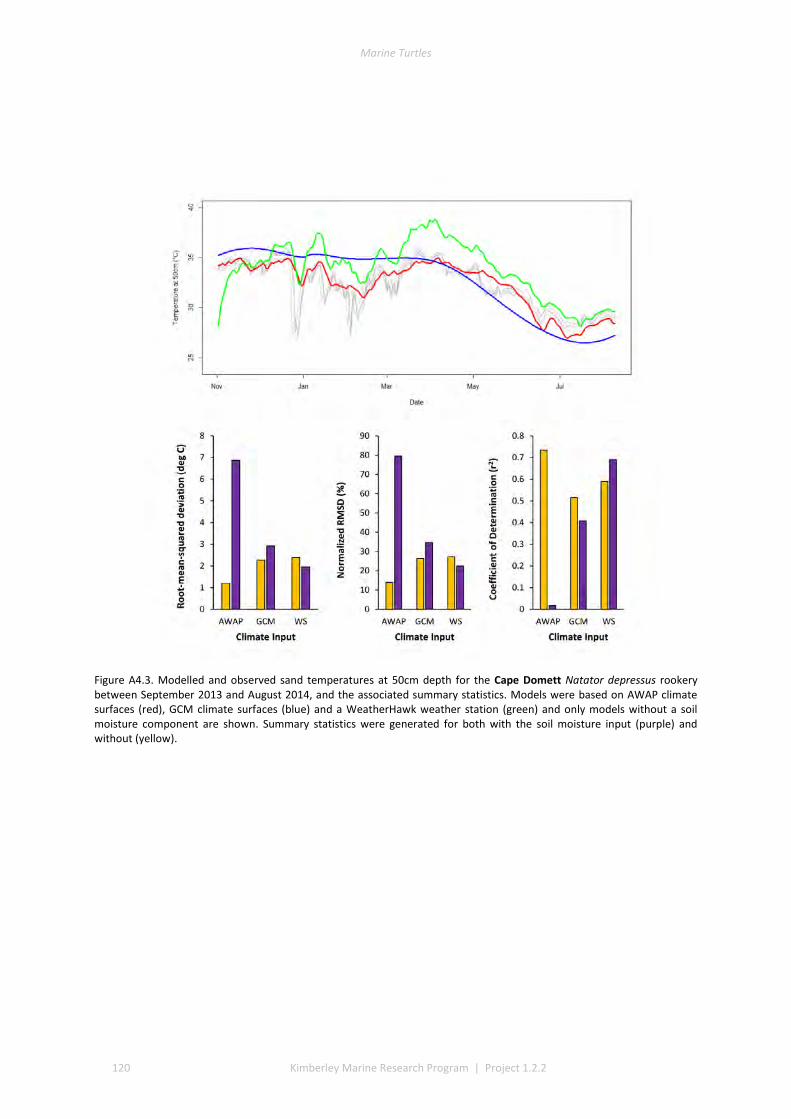
Marine Turtles
120 Kimberley Marine Research Program | Project 1.2.2
Figure A4.3. Modelled and observed sand temperatures at 50cm depth for the Cape Domett Natator depressus rookery between September 2013 and August 2014, and the associated summary statistics. Models were based on AWAP climate surfaces (red), GCM climate surfaces (blue) and a WeatherHawk weather station (green) and only models without a soil moisture component are shown. Summary statistics were generated for both with the soil moisture input (purple) and without (yellow).
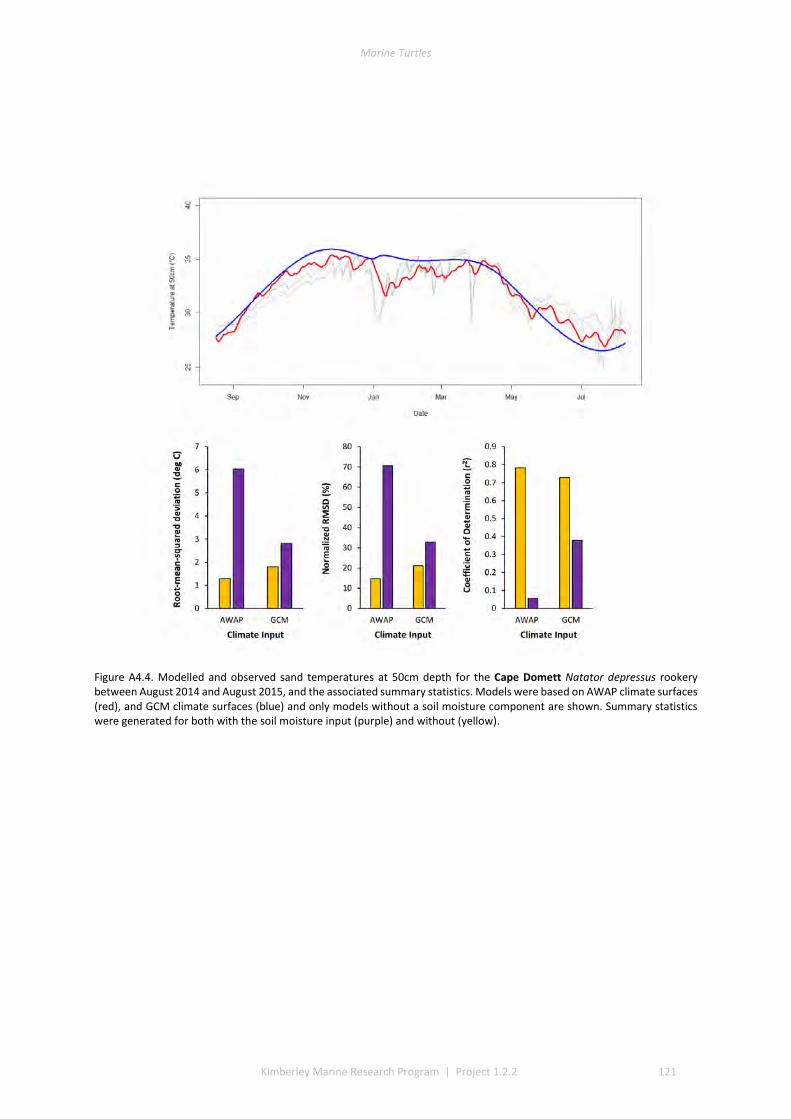
Marine Turtles
Kimberley Marine Research Program | Project 1.2.2 121
Figure A4.4. Modelled and observed sand temperatures at 50cm depth for the Cape Domett Natator depressus rookery between August 2014 and August 2015, and the associated summary statistics. Models were based on AWAP climate surfaces (red), and GCM climate surfaces (blue) and only models without a soil moisture component are shown. Summary statistics were generated for both with the soil moisture input (purple) and without (yellow).
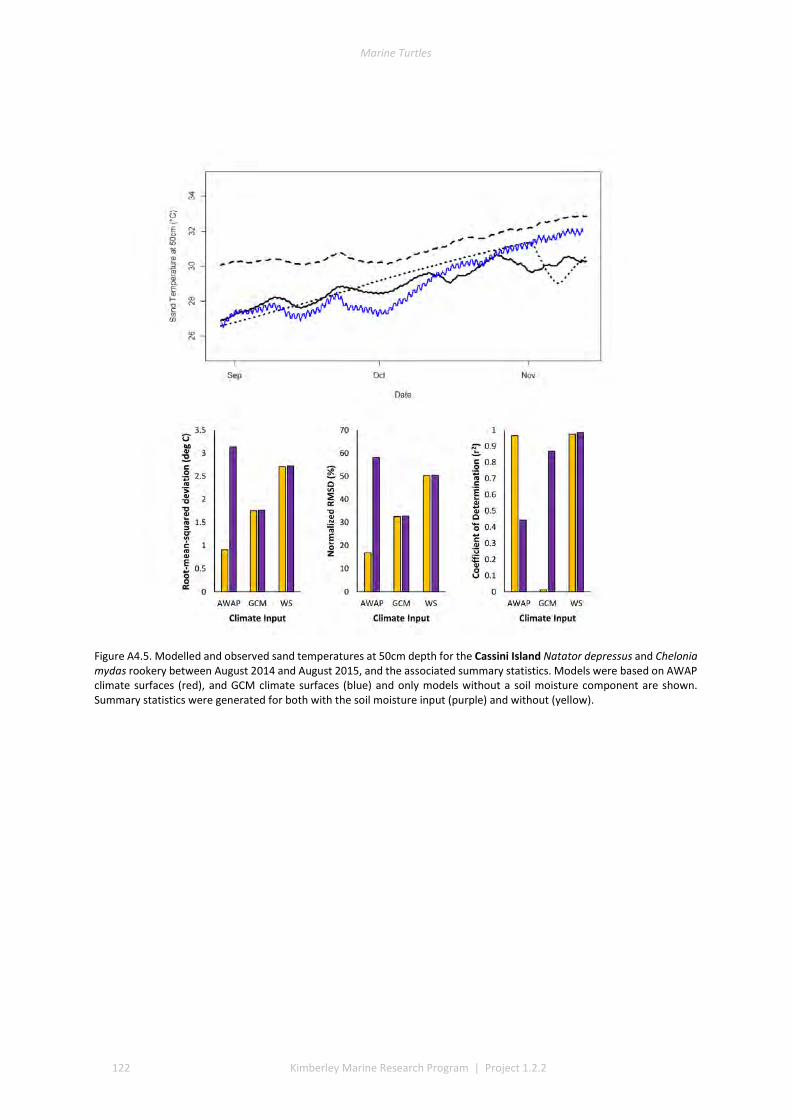
Marine Turtles
122 Kimberley Marine Research Program | Project 1.2.2
Figure A4.5. Modelled and observed sand temperatures at 50cm depth for the Cassini Island Natator depressus and Chelonia mydas rookery between August 2014 and August 2015, and the associated summary statistics. Models were based on AWAP climate surfaces (red), and GCM climate surfaces (blue) and only models without a soil moisture component are shown. Summary statistics were generated for both with the soil moisture input (purple) and without (yellow).
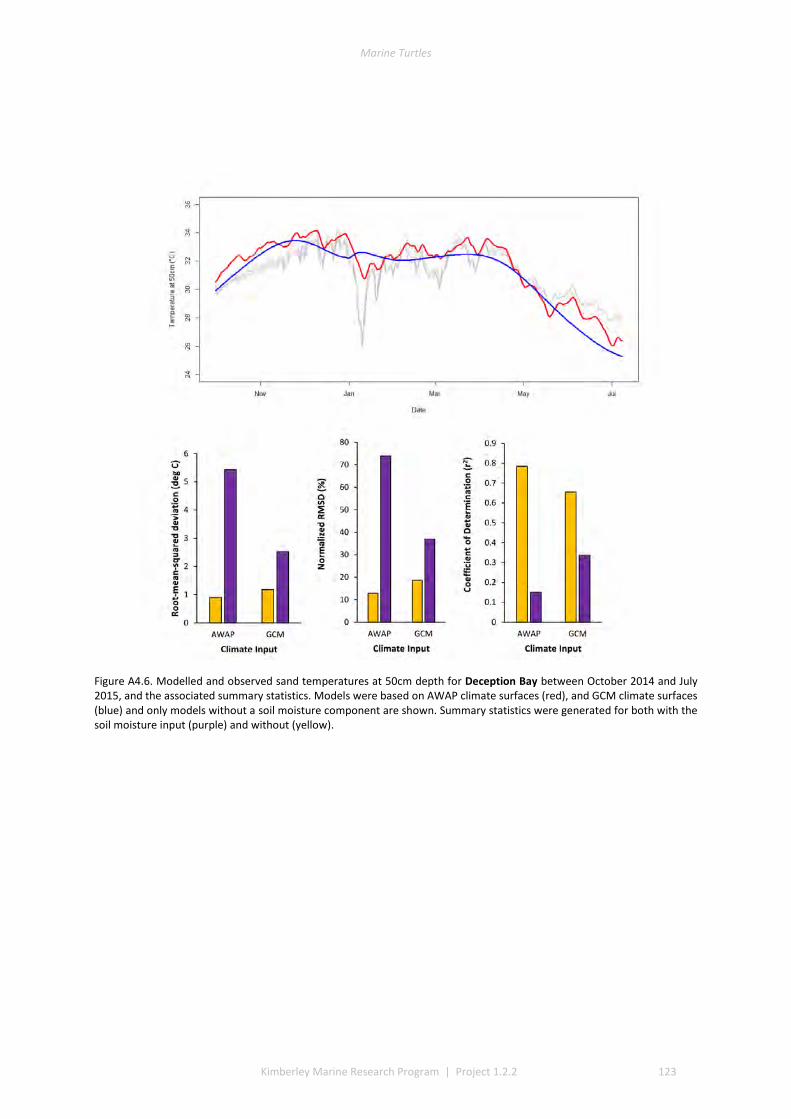
Marine Turtles
Kimberley Marine Research Program | Project 1.2.2 123
Figure A4.6. Modelled and observed sand temperatures at 50cm depth for Deception Bay between October 2014 and July 2015, and the associated summary statistics. Models were based on AWAP climate surfaces (red), and GCM climate surfaces (blue) and only models without a soil moisture component are shown. Summary statistics were generated for both with the soil moisture input (purple) and without (yellow).

Marine Turtles
124 Kimberley Marine Research Program | Project 1.2.2
Figure A4.7. Modelled and observed sand temperatures at 50cm depth for the Eighty Mile Beach Natator depressus rookery between December 2014 and February 2015, and the associated summary statistics. Models were based on AWAP climate surfaces (red), and GCM climate surfaces (blue) and only models without a soil moisture component are shown. Summary statistics were generated for both with the soil moisture input (purple) and without (yellow), and depths at deployment and retrieval were used for correlations.
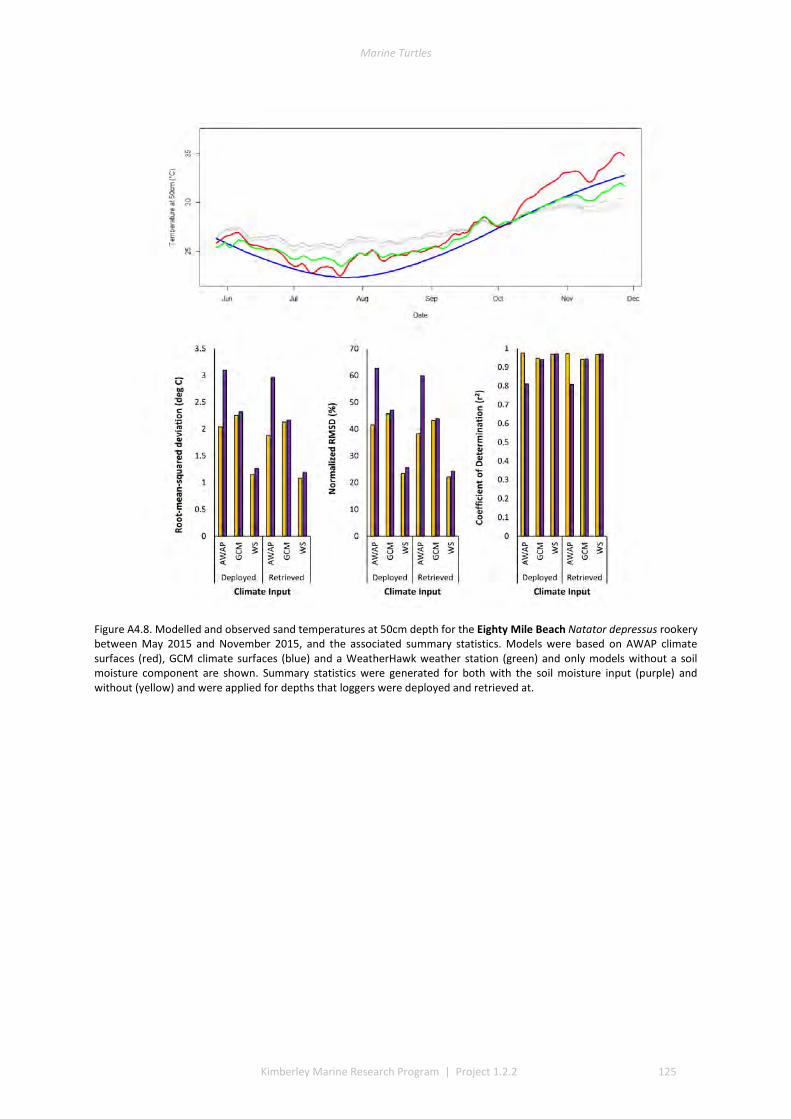
Marine Turtles
Kimberley Marine Research Program | Project 1.2.2 125
Figure A4.8. Modelled and observed sand temperatures at 50cm depth for the Eighty Mile Beach Natator depressus rookery between May 2015 and November 2015, and the associated summary statistics. Models were based on AWAP climate surfaces (red), GCM climate surfaces (blue) and a WeatherHawk weather station (green) and only models without a soil moisture component are shown. Summary statistics were generated for both with the soil moisture input (purple) and without (yellow) and were applied for depths that loggers were deployed and retrieved at.
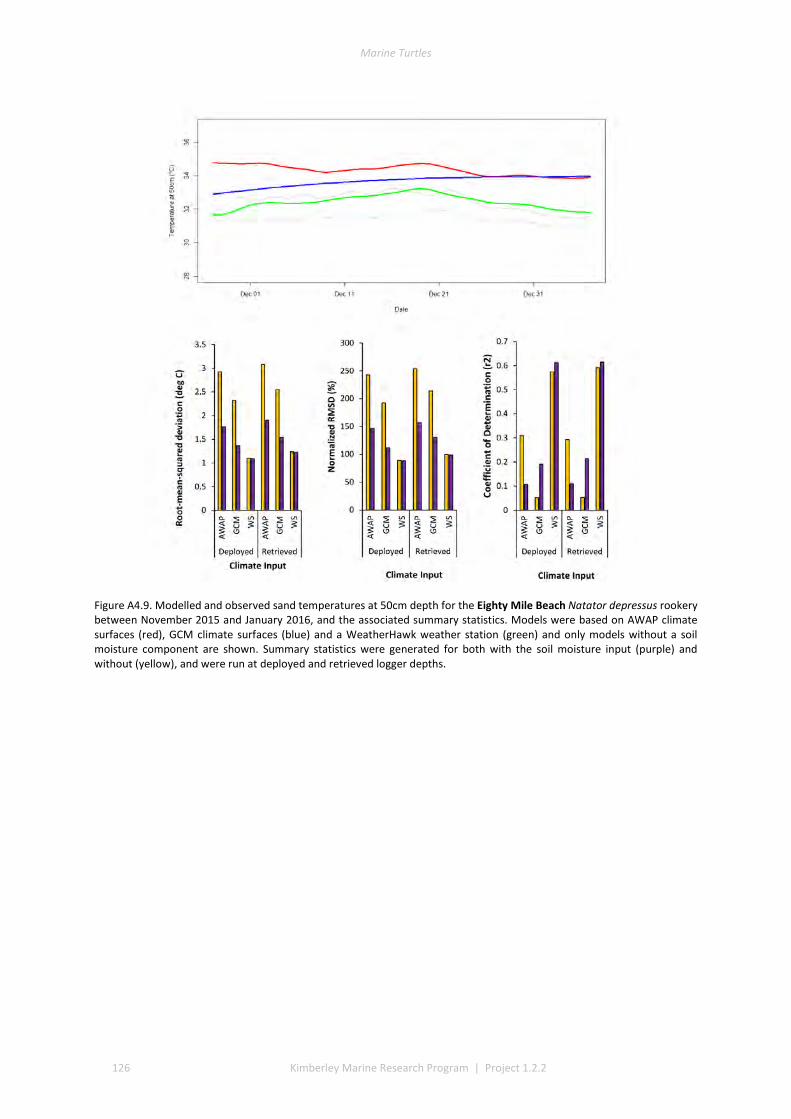
Marine Turtles
126 Kimberley Marine Research Program | Project 1.2.2
Figure A4.9. Modelled and observed sand temperatures at 50cm depth for the Eighty Mile Beach Natator depressus rookery between November 2015 and January 2016, and the associated summary statistics. Models were based on AWAP climate surfaces (red), GCM climate surfaces (blue) and a WeatherHawk weather station (green) and only models without a soil moisture component are shown. Summary statistics were generated for both with the soil moisture input (purple) and without (yellow), and were run at deployed and retrieved logger depths.
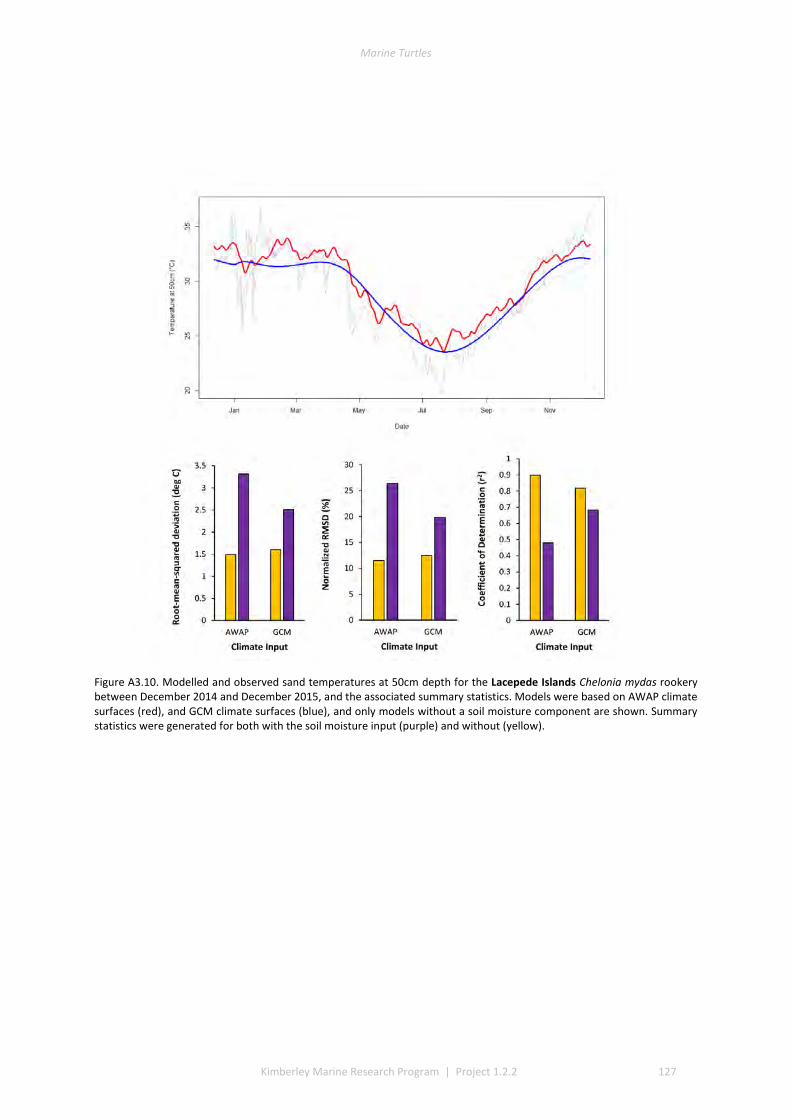
Marine Turtles
Kimberley Marine Research Program | Project 1.2.2 127
Figure A3.10. Modelled and observed sand temperatures at 50cm depth for the Lacepede Islands Chelonia mydas rookery between December 2014 and December 2015, and the associated summary statistics. Models were based on AWAP climate surfaces (red), and GCM climate surfaces (blue), and only models without a soil moisture component are shown. Summary statistics were generated for both with the soil moisture input (purple) and without (yellow).
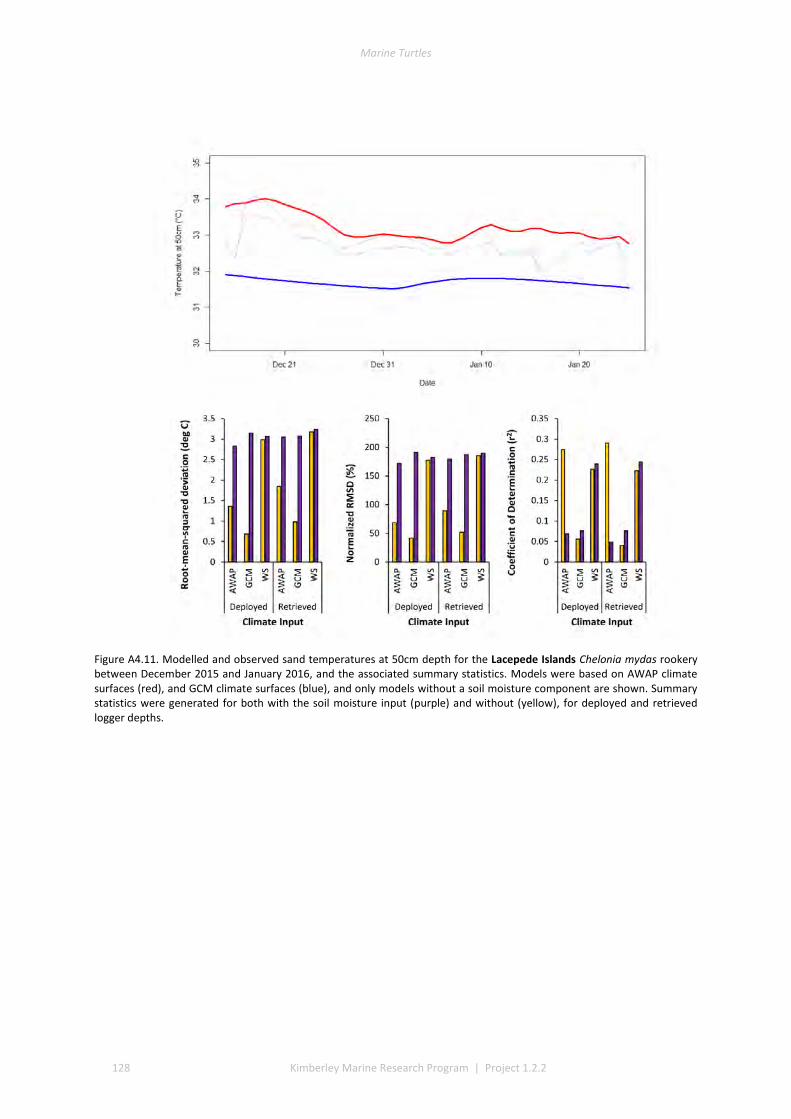
Marine Turtles
128 Kimberley Marine Research Program | Project 1.2.2
Figure A4.11. Modelled and observed sand temperatures at 50cm depth for the Lacepede Islands Chelonia mydas rookery between December 2015 and January 2016, and the associated summary statistics. Models were based on AWAP climate surfaces (red), and GCM climate surfaces (blue), and only models without a soil moisture component are shown. Summary statistics were generated for both with the soil moisture input (purple) and without (yellow), for deployed and retrieved logger depths.
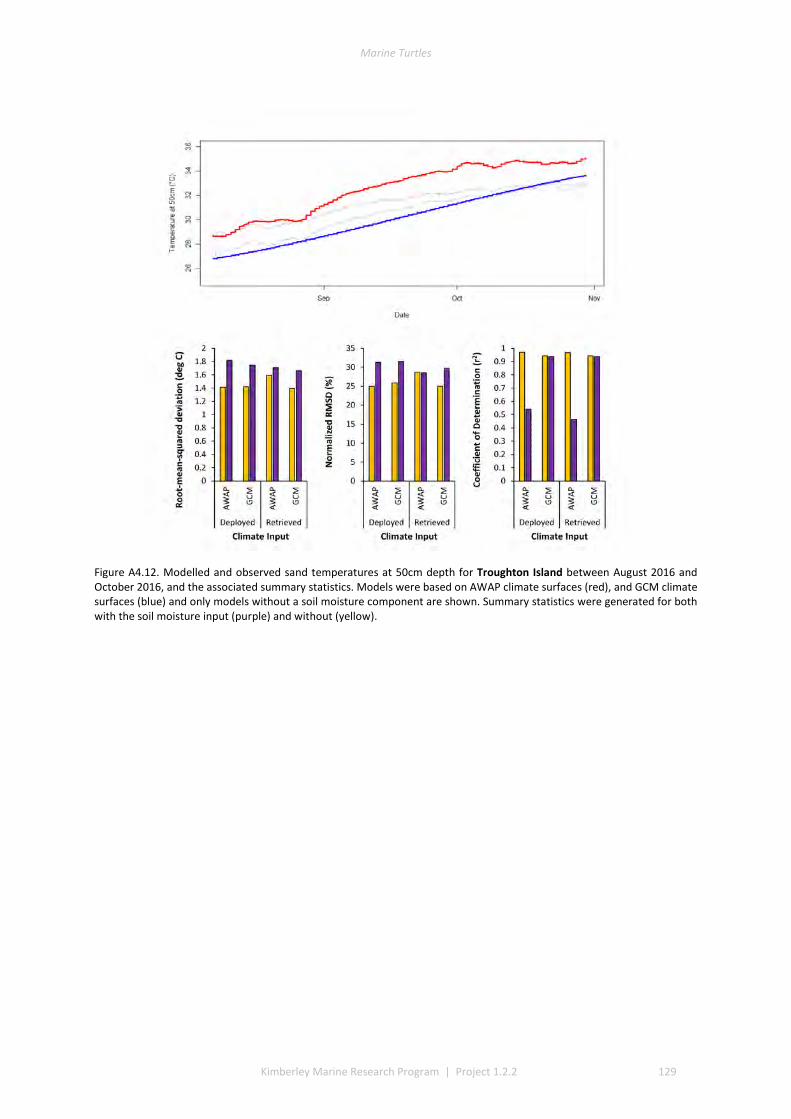
Marine Turtles
Kimberley Marine Research Program | Project 1.2.2 129
Figure A4.12. Modelled and observed sand temperatures at 50cm depth for Troughton Island between August 2016 and October 2016, and the associated summary statistics. Models were based on AWAP climate surfaces (red), and GCM climate surfaces (blue) and only models without a soil moisture component are shown. Summary statistics were generated for both with the soil moisture input (purple) and without (yellow).

Marine Turtles
130 Kimberley Marine Research Program | Project 1.2.2
Figure A4.13. Modelled and observed sand temperatures at 50cm depth for Vansittart Bay between August 2014 and October 2014, and the associated summary statistics. Models were based on AWAP climate surfaces (red), and GCM climate surfaces (blue) and only models without a soil moisture component are shown. Summary statistics were generated for both with the soil moisture input (purple) and without (yellow).

Marine Turtles
Kimberley Marine Research Program | Project 1.2.2 131
Appendix 6 Indigenous Engagement
Presentations and Meetings - Indigenous Engagement (44 instances)
Face to face meetings and presentations have been included in the table below.
Table A5.1. A summary of presentations and face to face meetings with Indigenous groups.
Date Meeting with Purpose and outcome
Apr 2013 Wunambal Gaambera
Informal introductory discussions regarding the broad objectives (at Indigenous Ranger Forum) (Scott Whiting )
Apr 2013 Dambimangari, Nyul Nyul
Informal introductory discussions regarding the broad objectives (at Indigenous Ranger Forum) (Scott Whiting) (One Arm Point)
Jun 2013 Miriuwung Gajerrong
Formal presentation to the MG board describing the proposed project and implications (Scott Whiting) (Kununurra)
Jun 2013 Balanggarra Informal face to face information sharing with Cissy Gult Birch (Scott Whiting) (Kununurra)
Aug 2013 Wunambal Gaambera
Informal presentation to Rangers and ranger coordinator describing the turtle project (Scott Whiting) (Truscott Airbase)
Sep 2013 Nyangumarta Formal presentation to Nyangumarta board members and rangers describing the turtle project (Tony Tucker) (Bidyadanga)
Nov 2013 Dambimangari Formal presentation to Traditional Owners and rangers describing the turtle project. (Scott Whiting) (Derby)
Nov 2013 Wunambal Gaambera
Informal meeting with Tom Vigilante in regards to developing a schedule of activities as an annex to a formal agreement with WAMSI (Scott Whiting) (Broome)
Nov 2013 DBCA Aboriginal Heritage Unit
Develop and distribute of Kimberley turtle program poster
Tony Tucker- Kensington
May 2014 Wunambal Gaambera
Formal meeting with Tom Vigilante and Bevan Stott and WG Council – specific to planning and onground work. Tony Tucker-Kalumburu
May 2014 Dambimangari WAMSI project Produced operating Schedule Scott Whiting-Kensington
Jul 2014 Wunambal Gaambera
Meeting at Truscott, poster, informal seminar, field work
Scott Whiting, Tony Tucker-Truscott field camp
Aug 2014 Miriuwung Gajerrong
Cape Domett – field work, poster
Tony Tucker-Kununurra
Sep 2014 Dambimangari Field work Camden Sound , poster Tony Tucker-Broome
Nov 2014 Karajarri and Nyangumarta
Council Meeting and field work at Eighty Mile Beach, poster
Scott Whiting, Tony Tucker- Bidyadanga
Dec 2014 Nyul Nyul Field Work Lacepedes, poster Blair Bentley-Beagle Bay
March 2015 Nyul Nyul, Kimberley Land Council
WAMSI conference. Scott Whiting, Tony Tucker- Perth
Apr 2015 Bardi Jawi Field work and meeting One Arm Point, poster Tony Tucker-One Arm Point
Apr 2015 Nyul Nyul Meeting and informal seminar with rangers. Tony Tucker-Beagle Bay
Apr 2015 Dambimangari Formal meeting with elder council, poster. Tony Tucker-Derby
May 2015 Karajarri, Meeting and field work at Eighty Mile Beach, juvenile flatbacks, poster Scott Whiting-

Marine Turtles
132 Kimberley Marine Research Program | Project 1.2.2
Nyangumarta, Ngarla
Broome-Caravan Park
Aug 2015 Wunambal Gaambera
Field Work Cassini Island – float plane, Tony Tucker-Kalumburu
Aug 2015 Miriuwung Gajerrong
Cape Domett Fieldwork- Ryan Douglas-Kununurra
May 2015 Yawaru Meeting. Scott Whiting-Broome
Sep 2015 Mayala, Nyul Nyul, Kimberley Land Council
Malaburra and Helpman Islands information. Tony Tucker-Kensington
Oct 2015 Balanaggarra Field work on vessel across North Kimberley Marine Park, poster, informal seminar with elder council. Tony Tucker-Kununurra
Nov 2015 Karajarri, Nyangumarta, Ngarla
Meeting and field work at Eighty Mile Beach, 3 informal seminars Tony Tucker- Pardoo, Caravan Park, and Anna Plains
Dec 2015 Nyangumarta, Ngarla
Field work at Eighty Mile Beach. Ryan Douglas-Caravan Park and Anna Plains.
Dec 2015 Nyul Nyul Field work Lacepedes Islands. UWA, CSIRO
Jan 2016 Nyul Nyul Field work Lacepedes Islands. UWA, CSIRO
Jun 2016 Yawaru Field work in Roebuck Bay, olive ridley release, public lecture, poster coordinated Scott Whiting-Kensington, Broome
Jul 2016 Nyul Nyul Field work in King Sound, Malaburra, planning in Beagle Bay, informal seminar with elders. Tony Tucker-Broome, Beagle Bay
Jul 2016 Desktop survey Kimberley Indigenous Saltwater Science Project. Tony Tucker-Kensington
Aug 2016 Miriuwung Gadjerrong,
Field work on Cape Domett, Ryan Douglas-Kununurra
Aug 2016 Balanggarra Field work on Lacrosse Island, coordinated Tony Tucker-Kensington
Aug 2016 Wunambal Gaambera
Field work on Troughton Island, Tony Tucker - Kalumburu
Aug 2016 Balanggarra Field work on West Governor Island, Tony Tucker- Kalumburu
Aug 2016 Karrajarri, Nyangumarta, Ngarla
Field work at Eighty Mile Beach, foraging flatback. Scott Whiting and Tony Tucker-Kensington
Sep 2016 Bardi Jawi, Mayala Meeting and field work on Helpman Islands, informal seminar to rangers at One Arm Point, poster. Tony Tucker-One Arm Point
Sept 2016 Nyul Nyul Meeting with rangers . Tony Tucker-Broome to Beagle Bay
Oct 2016 Yawaru Project coordination for Ecobeach with indigenous engagement. Scott Whiting, Tony Tucker coordinated with Chris Nutt and CVA-Broome
Nov 2016 Karajarri, Nyangumarta, Ngarla,
Meeting and field work across sections of Eighty Mile Beach, 3 informal seminars. Tony Tucker-Pardoo, Caravan Park and Anna Plains
Nov 2016 Wunambal Gaambera
South Maret Island. Tony Tucker-Kalumburu
June 2017 Yawuru Roebuck Bay field work, planning- Scott and Tony
June 2017 Yawuru, Bardi Jawi, Dambimangari,
Broome- Kimberley Indigenous Saltwater Science Project
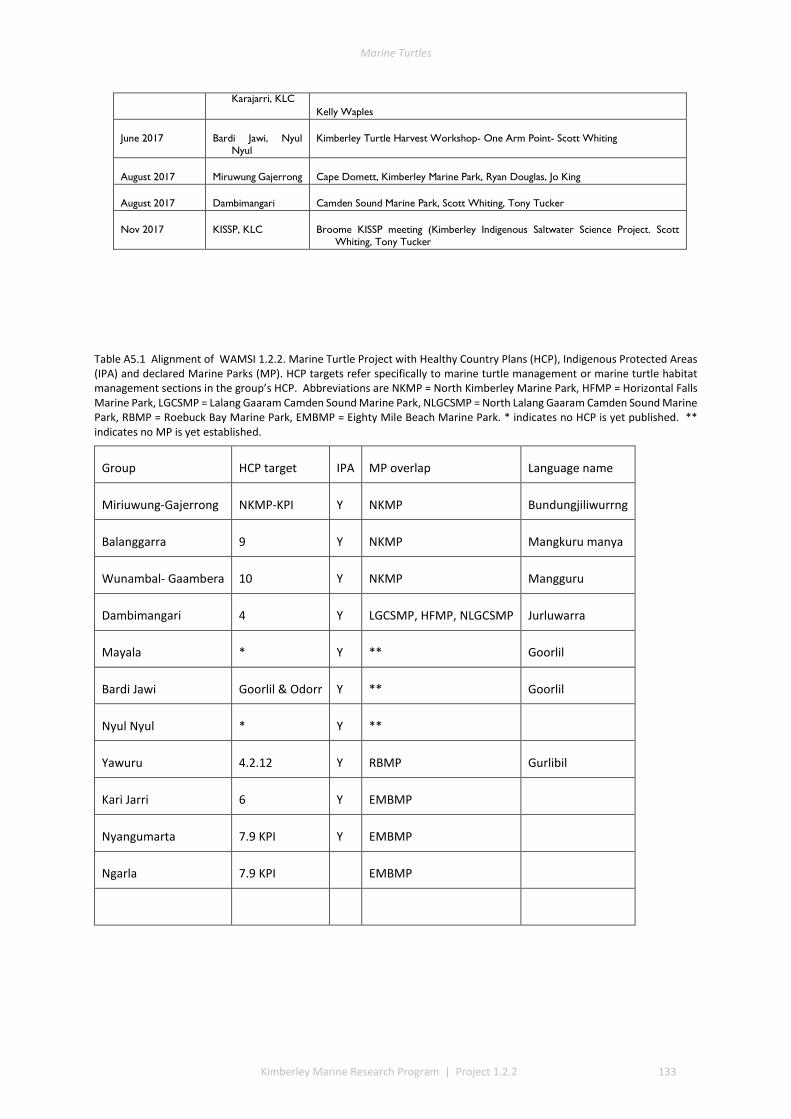
Marine Turtles
Kimberley Marine Research Program | Project 1.2.2 133
Karajarri, KLC Kelly Waples
June 2017 Bardi Jawi, Nyul Nyul
Kimberley Turtle Harvest Workshop- One Arm Point- Scott Whiting
August 2017 Miruwung Gajerrong Cape Domett, Kimberley Marine Park, Ryan Douglas, Jo King
August 2017 Dambimangari Camden Sound Marine Park, Scott Whiting, Tony Tucker
Nov 2017 KISSP, KLC Broome KISSP meeting (Kimberley Indigenous Saltwater Science Project. Scott Whiting, Tony Tucker
Table A5.1 Alignment of WAMSI 1.2.2. Marine Turtle Project with Healthy Country Plans (HCP), Indigenous Protected Areas (IPA) and declared Marine Parks (MP). HCP targets refer specifically to marine turtle management or marine turtle habitat management sections in the group’s HCP. Abbreviations are NKMP = North Kimberley Marine Park, HFMP = Horizontal Falls Marine Park, LGCSMP = Lalang Gaaram Camden Sound Marine Park, NLGCSMP = North Lalang Gaaram Camden Sound Marine Park, RBMP = Roebuck Bay Marine Park, EMBMP = Eighty Mile Beach Marine Park. * indicates no HCP is yet published. ** indicates no MP is yet established.
Group HCP target IPA MP overlap Language name
Miriuwung-Gajerrong NKMP-KPI Y NKMP Bundungjiliwurrng
Balanggarra 9 Y NKMP Mangkuru manya
Wunambal- Gaambera 10 Y NKMP Mangguru
Dambimangari 4 Y LGCSMP, HFMP, NLGCSMP Jurluwarra
Mayala * Y ** Goorlil
Bardi Jawi Goorlil & Odorr Y ** Goorlil
Nyul Nyul * Y **
Yawuru 4.2.12 Y RBMP Gurlibil
Kari Jarri 6 Y EMBMP
Nyangumarta 7.9 KPI Y EMBMP
Ngarla 7.9 KPI EMBMP

Marine Turtles
134 Kimberley Marine Research Program | Project 1.2.2
Related Documents