MARINE REPORT Marine biodiversity and ecology of the Wakatobi Marine National Park, Southeast Sulawesi JULY - August 2003 DR DAVID J. SMITH HEAD MARINE SCIENTIST OPERATION WALLACE SENIOR FELLOW, INSTITUTE OF COASTAL AND CATCHMENT RESEARCH, UNIVERSITY OF ESSEX, UK. SPONSORED BY THE RESEARCH AND DEVELOPMENT CENTRE FOR OCEANOLOGY, THE INDONESIAN INSTITUTE OF SCIENCE AND THE WALLACEA DEVELOPMENT INSTITUTE

Welcome message from author
This document is posted to help you gain knowledge. Please leave a comment to let me know what you think about it! Share it to your friends and learn new things together.
Transcript

MARINE REPORT
Marine biodiversity and ecology of the
Wakatobi Marine National Park, Southeast Sulawesi
JULY - August 2003
DR DAVID J. SMITH HEAD MARINE SCIENTIST OPERATION WALLACE
SENIOR FELLOW, INSTITUTE OF COASTAL AND CATCHMENT RESEARCH, UNIVERSITY OF ESSEX, UK.
SPONSORED BY
THE RESEARCH AND DEVELOPMENT CENTRE FOR OCEANOLOGY, THE INDONESIAN INSTITUTE OF SCIENCE
AND
THE WALLACEA DEVELOPMENT INSTITUTE
University of Essex
2
Contents 1.0. INTRODUCTION
1.1. BACKGROUND 1.2. SCIENTIFIC APPROACH
1.3. RESEARCH AREAS
1.3.1. CORAL REEF DYNAMICS 1.3.2. CORAL REEF BIODIVERSITY AND
ECOLOGY 1.3.3. MANGROVE ECOLOGY
2.0. METHODS AND MATERIAL
2.1. THE STUDY SITE 2.2. CORAL REEF DYNAMICS
2.2.1. CORAL REEF MONITORING PROGRAMME 2.2.2. REEF CHECK SURVEYS 2.2.3. CORAL REEF GROWTH AND RECRUITMENT RATES 2.2.4. CORAL REEF RECOVERY RATES
2.3. CORAL REEF BIODIVERSITY AND ECOLOGY
2.3.1. FACTORS IMPACTING CORAL REEF DIVERSITY
2.3.2. COMPARISON OF CORAL REEF HEALTH
ASSESSMENT METHODS IN THE WMNP
2.3.3. THE IMPORTANCE OF CORAL BOMBIES FOR
CORAL REEF DIVERSITY
2.3.4. THE INFLUENCE OF HABITAT AND FISHING
PRESSURE ON GROUPER DISTRIBUTION AND
ABUNDANCE
2.3.5. THE DISTRIBUTION, DIVERSITY, ABUNDANCE
AND SHELL USE OF HERMIT CRABS
2.3.6. THE ECOLOGY OF SPONGES IN THE WMNP
2.3.7. CLEANER WRASSE
2.3.8. BUTTERFLYFISH AS CORAL REEF INDICATOR
SPECIES
3
2.3.9. CAN THE TUBE0BUILDING POLYCHAETE WORMS
SABELLASTREA AND SPIROBRANCHIUS BE USED
AS CORAL REEF INDICATOR SPECIES
2.3.10. THE ABUNDANCE AND DIVERSITY OF
NUDIBRANCHS ON THE REEFS OF THE WMNP
2.4. MANGROVE ECOLOGY
2.4.1. THE DIVERSITY AND EXPLOITATION RATES OF
MANGROVE WITHIN THE STUDY AREA 2.4.2. HABITAT SPECIFICITY AND RESOURCE
UTILISATION OF A FIDDLER CRAB ASSEMBLAGE 2.4.3. RELEASERS OF BEHAVIOUR OF HE MAJOR
CHELIPAD IN UCA VOCANS AND UCA DUSSUMIERI
3.0. RESULTS
3.1. CORAL REEF DYNAMICS 3.1.1. CORAL REEF MONITORING PROGRAMME 3.1.2. REEF CHECK SURVEYS 3.1.3. CORAL REF GROWTH AND RECRUITMENT RATES 3.1.4. CORAL REEF RECOVERY RATES
3.2. CORAL REEF ECOLOGY AND BIODIVERSITY
3.2.1. FACTORS IMPACTING CORAL REEF DIVERSITY
3.2.2. COMPARISON OF CORAL REEF HEALTH
ASSESSMENT METHODS IN THE WMNP
3.2.3. THE IMPORTANCE OF CORAL BOMBIES FOR
CORAL REEF DIVERSITY
3.2.4. THE INFLUENCE OF HABITAT AND FISHING
PRESSURE ON GROUPER DISTRIBUTION AND
ABUNDANCE
3.2.5. THE DISTRIBUTION, DIVERSITY, ABUNDANCE
AND SHELL USE OF HERMIT CRABS
3.2.6. THE ECOLOGY OF SPONGES IN THE WMNP
3.2.7. CLEANER WRASSE
3.2.8. BUTTERFLYFISH AS CORAL REEF INDICATOR
SPECIES

4
3.2.9. CAN THE TUBE0BUILDING POLYCHAETE WORMS
SABELLASTREA AND SPIROBRANCHIUS BE USED
AS CORAL REEF INDICATOR SPECIES
3.2.10. THE ABUNDANCE AND DIVERSITY OF
NUDIBRANCHS ON THE REEFS OF THE WMNP
3.3. MANAGROVE ECOLOGY
3.3.1. THE DIVERSITY AND EXPLOITATION RATES OF MANGROVE WITHIN THE STUDY AREA
3.3.2. HABITAT SPECIFICITY AND RESOURCE UTILISATION OF A FIDDLER CRAB ASSEMBLAGE
3.3.3. RELEASERS OF BEHAVIOUR OF HE MAJOR CHELIPAD IN UCA VOCANS AND UCA DUSSUMIERI
4.0. DISUCSSION AND CONCLUDING REMARKS
4.1. CORAL REEF DYNAMICS 4.1.1. CORAL REEF MONITORING PROGRAMME 4.1.2. REEF CHECK SURVEYS 4.1.3. CORAL REF GROWTH AND RECRUITMENT RATES 4.1.4. CORAL REEF RECOVERY RATES
4.2. CORAL REEF ECOLOGY AND BIODIVERSITY
4.2.1. FACTORS IMPACTING CORAL REEF DIVERSITY
4.2.2. COMPARISON OF CORAL REEF HEALTH
ASSESSMENT METHODS IN THE WMNP
4.2.3. THE IMPORTANCE OF CORAL BOMBIES FOR
CORAL REEF DIVERSITY
4.2.4. THE INFLUENCE OF HABITAT AND FISHING
PRESSURE ON GROUPER DISTRIBUTION AND
ABUNDANCE
4.2.5. THE DISTRIBUTION, DIVERSITY, ABUNDANCE
AND SHELL USE OF HERMIT CRABS
4.2.6. THE ECOLOGY OF SPONGES IN THE WMNP
4.2.7. CLEANER WRASSE
4.2.8. BUTTERFLYFISH AS CORAL REEF INDICATOR
SPECIES

5
4.2.9. CAN THE TUBE0BUILDING POLYCHAETE WORMS
SABELLASTREA AND SPIROBRANCHIUS BE USED
AS CORAL REEF INDICATOR SPECIES
4.2.10. THE ABUNDANCE AND DIVERSITY OF
NUDIBRANCHS ON THE REEFS OF THE WMNP
4.3. MANAGROVE ECOLOGY
4.3.1. THE DIVERSITY AND EXPLOITATION RATES OF MANGROVE WITHIN THE STUDY AREA
4.3.2. HABITAT SPECIFICITY AND RESOURCE UTILISATION OF A FIDDLER CRAB ASSEMBLAGE
4.3.3. RELEASERS OF BEHAVIOUR OF HE MAJOR CHELIPAD IN UCA VOCANS AND UCA DUSSUMIERI
4.4. CONCLUDING REMARKS
5.0. REFERENCES

6
1.0. INTRODUCTION
Information included within this document represents a preliminary report of
the scientific programme implemented by Operation Wallacea, in collaboration
with THE RESEARCH AND DEVELOPMENT CENTRE FOR OCEANOLOGY, THE
INDONESIAN INSTITUTE OF SCIENCE and THE WALLACEA DEVELOPMENT
INSTITUTE, during the summer research season of 2003. within this report is
also included some data collected as part of the 2002 research season. A
variety of research topics and scientific approaches were used during the
2003 season, the overall aims of which were to address the dynamics of reefs
within the north-east section of the Wakatobi Marine National Park (WMNP)
herein refereed to as the study area, Coral Reef Biodiversity, Mangrove
Ecology and Fisheries Ecology. These research topics can be considered
research themes, and under each theme, a number of specieis scientific
research activities and tasks were implemented. Some of the research
activities represent repeated surveys of the 2002, which are needed to ensure
that a true representation of the diversity and dynamics of coral reefs of the
study area are determined. Other research activities build upon results
obtained during 2002 or represent novel research. All research aims to
address and highlight the importance of the WMNP as a sites of extreme
biological diversity whilsts also takining into account that the reefs within the
study area represent an important resource for local communities. Therefore
some of the research represented within this report include information
regarding the exploitation rates of habitats and fisheries of the study area.
The WMNP represents an actively managed marine park and cponsequnelty a
proportion of the research implemented during the 2003 season, recognised
this point and has been designed to aid managers of reef systems by
examining survey techniques, the possibility of producing coral reef
parameters that are directly applicable to management. The 2003 research
season, to date, has been extremely successfully in reaching its clrealry
defined research aims and objectives and this report outlines the data which
7
has been collected and analysised to date. Although data collection has now
finished, not all results have been fully analysised or interpreted and therefore
this report should be considered a preliminary report only.
Due to the large variety of subjected areas investigated during the 2003
season, this introduction only intends to introduce the reader to the major
research themes. So as to allow for continuity and easy of understanding, a
brief introductory paragraph setting the scene for each individual research
project is included when the methods and aims of each research project are
described within the relevant place in the Materials and Methods [2.0 +]
section. Although not the normal format, the author feels that such a format
will increase the continuity of the report and ultimately the easy at which the
reasons why as well as how, the investigations were carried out.
1.1. BACKGROUND Coral reefs are sites of extreme biological diversity and the reefs surrounding
the archipelago of Indonesia are the most diverse in the world. Consequently
there are several global programmes that have recognised the importance of
coral reef as representing a bank of genetic diversity which should be
conserved. Reefs also offer an important resource for many millions of
maritime communities. Despite the importance of reefs systems to global
biodiversity and millions of people, reefs are becoming degraded at an
alarming rate. Both natural phenomena and anthropogenic stresses have
resulted in the decline of reefs globally. Natural phenomena, which include
storm damage, climate change and coral disease, are in part, respo0nsible for
the extreme biological diversity common to reefs as they represent an
intermediate level of disturbance, a known major component of diverse
biological systems. Unfortunately, as maritime populations expand and the
resource requirements from reefs increase, anthropogenic stresses are
increasing. Thus the fine balance between an intermediate level of
disturbance and extreme disturbance is being disrupted, globally, by
anthropogenic stresses which as led to a loss of coral reef systems, a

8
reduction of coral reef diversity and reduced coral reef productivity around
the global. Reduced diversity and productivity has led many communities to
extract species and resources that would not usually be extracted from reef
systems, or to utilise extraction techniques, that although are extremely
efficient are also extremely detrimental to reef systems and are not exploited.
These are the direct effects many communities are having on reef systems,
however there also exists several indirect effect which are having an equally
adverse affect on reef systems. Such indirect effects includes the
eutrophication of coral reef overlying waters. Eutrophication generally is
brought about by increased nutrient additions to overlying waters as a result
of increased organic input in the form of faecal production. Increased
population sizes have led to organic enrichment and the out-competition of
coral systems, the major component of the physical structure of reefs, by
algal species. Organic enrichment can also lead to an increase frequency of
coral disease to the detriment of reefs generally. Other indirect effects include
physical damage by reef trampling and the destruction of habitat types
associated with reef systems that are pivotal in the maintenance of coral ref
biodiversity, productivity and physical integrity. Habitats which are under
threat by indirect pressures include mangrove, seagrass beds and sand flat
habitats.
Therefore, increasingly so, coral reefs are under threat, and all the above
detrimental impacts are seen on the reefs of the study site. Such impacts will
lead to a disintegration of the coral ref ecosystem unless they are successfully
and actively managed. There is a need therefore for coral reefs to be
managed to ensure that the productivity of reefs is able to supply the ever
increasing demand of local communities, and that over-exploitation does not
result in ecosystem collapse. Before active management can be instigated or
appropriate adaptive management strategies employed, there is a need to
fully understand the dynamics, ecology and ecosystem function of coral reefs
and associated habitats. Furthermore it is important that we understand
current levels of exploitation and impact and how coral reefs respond to such
9
impacts as well as management practises. Therefore for the past 7 years
Operation Wallacea have instigated scientific investigations and research
programmes in the WMNP. Operation Wallacea research programme is aimed
at increasing our understanding off the diversity of the region, factors
currently impacting the reefs systems, the success of management practises
and current exploitation rates. This report outlines the research programme
instigated during the 2003 season. This report does not stand alone and
represents information collected from several years of research, and will be
further supported by research carried out in future years. Only by such
detailed scientific investigations, can coral reef managers hope to design and
implement management strategies which consider the global importance of
the reefs of the WKMNP as a biodiverse hot spot but also the resource
requirements of local communities. To ensure that this second facet of coral
reef communities, is local resource requirements, is also considered during
Operation Wallacea Marine Science, the marine science programme was
designed in collaboration with Operation Wallacea’s social science team and
therefore considers both biological and local and regional social issues such as
local communities needs, perceptions to coral reef management practises and
the likelihood of compliance if strict management procedures are needed. If
further information is required or clarification needed the author of this
report can be contacted directly or through the UK office of Operation
Wallacea .
1.2. SCIENTIFIC APPROACH Operation Wallacea is a scientific organisation that has clearly defined
conservation objectives that have been designed with the natural high
biodiversity of the region and local community requirements in mind. So that
the 2003 research programme remained focused and that conservation
objectives were met the marine programme for 2003 researched three Marine
Science research themes that examine:

10
a. Coral reef and associated habitat biodiversity and ecology
b. How reefs and associated habitats change in time and
respond to environmental change.
c. Ecosystem responses to management
The research programme creates a focused directional approach but also
allows for adaptability therefore maximising the production of the most
appropriate and scientifically robust research outcomes. A hierarchical three-
tiered structure was utilised during the 2003 research seasons which
produces focused and efficient research.
Research themes covered broad scientific subject areas that encompass all
conservation objectives and research necessary to examine major
management concepts. Under each research theme are a number of research
specific activities. Research activities encompass specific areas of research
that rigoursly and robustly examine all aspects of the research theme. Each
research activity includes a series of topic-specific research tasks, which
represent individual research projects.
1.3 RESEARCH AREAS Research themes are not independent but are designed to be supportive
therefore maximising the focus and efficiency of all scientific investigations
carried out by Operation Wallacea.
1.3.1. Coral Reef Dynamics
Due to the time spent at the same site, Operation Wallacea’s scientific
research programme has an excellent opportunity to examine long-term
trends in coral reef communities that are characteristic of the Indo Pacific
region. Coral reefs exist in a dynamic equilibrium and changes in reef
characteristics often occur over time scales greater than those generally used
for the survey of reefs within the region. An idea of coral reef dynamics is
11
essential if coral reef systems are to be managed sustainably, efficiently and
appropriately in the mid- to long term.
The reefs of the WMNP are subjected to varying management practises that
have been devised based on other reef case studies, theoretical biology and
local resource requirements. But how do we know that the management
procedures are most effective and efficient in reaching their pre-designated
conservation objectives? What rates of change would we expect for different
reef systems afforded varying degrees of protection? One way in which the
biological success of management practises can be quantified thereby
allowing adaptive and strategic management procedures to be instigated if
needs be, is to identify biological performance criteria which should be
sensitive to change, quantifiable and statistically robust. A further aim of the
coral reef dynamics research theme, to identify and to evaluate changes in
performance criteria appropriate for the coral reef systems of the WMNP.
Coral reefs are among the most productive ecosystems in the world. In order
to exploit their potential in the environments in which they are found, we
need to know much more about the mechanisms underlying their recruitment,
growth, and behaviour, particularly under conditions of stress. Recent studies
on coral recruitment suggest that high juvenile mortality is a key factor in the
restructuring of coral communities.
In order to increase the accuracy of such estimates, we developed a model
which gave a very accurate fit to coral growth data, and so allows growth
prediction with a high level of accuracy. Simple polynomial functions have
been used to model a number of ecological processes, including growth of
neotropical trees, and we used a general rational polynomial function with an
increased number of parameters in numerator and denominator that allowed
excellent data fitting (Crabbe and Smith, 2002, 2003; Crabbe et al., 2002).
We have also used state-of-art videophotographic techniques and image
12
analysis to study biodiversity and real-time growth of branching corals, which
could be developed as a monitoring technique for reef management.
1.3.2. Coral Reef Biodiversity and Ecology
Coral reefs are renowned for their biological diversity and the WMNP is
positioned within an area of extreme biological diversity. Consequently one of
the major research themes of the Operation Wallacea Marine Team is to
examine coral reef biodiversity, the causative factors influencing diversity and
the factors that effect diversity. Coral reefs are characteristically complex
systems and offer an excellent opportunity to study fundamental ecological
principles and interactions and also to carryout ecological behavioural studies.
Many different factors impact coral reef systems. Some of these factors result
from natural phenomena such as short-term (e.g. El Nino effects) and long-
term (e.g. global warming and concomitant sea level rise) climate change,
storm damage, disease (which in part can be enhanced by anthropogenic
factors such as organic input) and natural increases in coralivores such as the
crown-of-thorns starfish. Unfortunately, often coupled with natural
disturbance events are anthropogenic impacting factors that can severely
decrease coral reef diversity, productivity and also the physical integrity of
coral reefs. So that the impacts of such factors can be appropriately managed
it is necessary to determine how coral reef communities respond to
disturbance events, in particular, disturbance events that could lead to a
decrease in reef health. Therefore this research theme will examined coral
communities that are adversely impacted by factors such as high
sedimentation, light-limitation, potential eutrophication, and physical
abrasion.
Despite the large amounts of coral reef research carried out by marine
scientists around the world, some methodologies are yet to be standardised
and it is often difficult to apply standard biological measures and parameters

13
(e.g. diversity indices) to coral reef management issues. Therefore the
methods used to assess coral reef diversity and in particular:
a. Their robustness
b. The extent to which they reflect the true situation
c. Their accuracy and precision
d. Their cost
and
e. Their usefulness to applied management
Was examined.
This research theme also examined the kind of parameters that could be
usefully applied to management e.g.:
a. Conservation value measures
b. Habitat quality measures
and
c. Habitat quality potential measures
Remarkably, despite the global importance of coral reefs and the relatively
large amount of interest in conserving reefs by active and applied
management, few attempts have been made to identify and quantify indices
that can be transparently used for reef based management. This is a
particularly important research theme carried out by the Marine team as the
WMNP represents a working Marine Park and insights into causative factors
influencing diversity and the development of useful applied parameters would
be of immediate use to coral reef managers.

14
1.3.3. Mangrove Ecology
Mangroves are an important resource utilised by local communities and play
an essential ecosystem function by biostabilising sediments that could
otherwise impact coral reef systems and by providing sheltered nursery
grounds for coral reef species, some of which are of economic importance.
The health and diversity of mangrove systems is therefore of major
importance for coral reef managers and therefore research based on
mangrove systems have been prioritised by Operation Wallacea. Mangroves
are exploited for several reasons including for firewood, and thatching whilst
many associated invertebrate species have been heavily collected as a food
resource. Consequently as part of this research theme, the current health and
diversity of Mangroves were investigated along with the associated
invertebrate diversity.
2.0. METHODS AND MATERIAL
2.1. THE STUDY SITE Sulawesi is the fourth biggest island (area of 159,000 km2) in Indonesia and
lies between Borneo to the west and the Mollucas Islands to the east.
Sulawesi also lies on the theoretical division (The Wallace Line) between
fauna and flora characteristic of Asia and Australia and is consequently an
extremely important area for global biodiversity, evolutionary biology and
biogeography.
Sulawesi has four provinces, one of which is Southeast Sulawesi which
encompasses the Southeast peninsula of the island. It lies between latitudes
3o – 6o S and 120o 45’ – 124o06’ E. Sulawesi also includes many smaller
islands which are often characterised by high endemism and are biologically
diverse. The large number of islands and remote location has also resulted in

15
extensive coral reef systems that are also extremely biologically diverse. The
Wakatobi Marine National Park lies within this region and is consequently
characterised by high biological diversity.
Operation Wallacea’s Marine Research programme is most concentrated
around the islands of Kaledupa , Lintea and Hoga in the north east of the
WMNP (herein referred to as the “study area”). Recently this area has been
trailed as a stakeholder co-managed area and a large proportion of the
research focuses on this management concept. Some studies were carried out
further-a-field , down to the island of Tomia. However it was only the Reef
Check surveys and some marine mammal surveys that were initiated in these
regions of the Park.
2.2. CORAL REEF DYNAMICS
A number of research activities are included within this research theme, some
of the data and studies represented under this theme are part of a long term
programme specifically designed to encompass repeated measures over 5
years to determine how coral reef diversity and productivity changes with
time and how different reefs are affected by different management practises.
2.2.1. Coral Reef Monitoring Programme
This investigation aims to:
1. Understand how the abundance and diversity of
scleractinian corals change in annually in different
areas of the study area subjected to varying
management practises.
2. Understand how the characteristics of benthic
biological and non-biological features change in
annually in different areas of the study area subjected
to varying management practises.
3. Understand how the abundance and diversity of fish
associated with coral reefs change in annually in

16
different areas of the study area subjected to varying
management practises.
The coral reef monitoring programme was first established during the
2002 season during which time 108 permanent transects were laid at 12
sites around the study area in replicates of three at the reef flat (10 m
horizontal distance on the landward side from the reef crest), reef crest
and upper reef slope (defined by habitat type and a depth of 10 m). The
monitoring programme provides the backbone of the Coral Reef Dynamics
research theme and underpins many of the other research programmes
carried out by the Marine Team. Specifically the following data was
collected as part of the monitoring programme and results obtained from
2002 and preliminary results (4 sites only) for 2003 are presented within
this document:
a. The percentage cover, diversity and community structure of
hard corals as assessed by a 50 m continual line intercept
transect
b. The percentage cover of soft corals as assessed by a 50 m
continual line intercept transect.
c. The percentage cover and functional diversity of algae as
assessed by a 50 m continual line intercept transect.
d. The percentage cover of dead coral (separated into recent and
not recent mortality) and coral rubble as assessed by a 50 m
continual line intercept transect.
e. The density, diversity and the community and functional
structure of coral reef fish as assessed by a 50 m by 5 x5 m
restricted effort belt transect in the morning and afternoon.
f. The density of ecologically and economically important
invertebrate species as assessed by a 50 m by 5 x5 m restricted
effort belt transect (data for 2003 not presented herein).

17
2.2.2. Reef Check Surveys
This investigation aimed to:
1. Carryout a series of reef check surveys in various sites of the
WMNP
2. To produce data from Reef Check surveys that could be
compared to the detailed data collected by the monitoring
programme so that we understand the limitations of reef
check data
The study took place between July and September 2003 in several different
areas of the WMNP. Surveys are carried out at two depth contours; one at
five and the other at ten meters. Along each depth contour there are four
20m sample units separated by 5 m making one transect of 100 length.
Four types of data are collected:
a. a site description
b. fish belt transect
c. invertebrate belt survey
d. substratum line transect.
Site description includes basic information of the site, the reefs geographic
location (GPS), the nearest population size, distance from shore and nearest
riverine input and any visually obvious signs of impact e.g. blast fishing, invert
harvesting etc. The fish transect is the first to be surveyed as any disturbance
of the area will bias the data set. The fish transect is a timed and distance
restricted 20 m x 10 m belt transect and target species identified (as
published for the Indo Pacific region, see Hodgson et al 2003) and counted.
Following completion of the fish transect, the invertebrate transect is
examined over the same area and species belonging to the target species list
identified and counted (see Hodgson et al 2003). The substratum type is

18
estimated by using 50 cm point sampling line intercept technique and data is
expressed as percentage cover.
2.2.3. Coral Reef Growth and Recruitment Rates This investigation aimed to:
1. To record massive coral surface areas and growth rates at three
sites (Sampela, Kaledupa, and Hoga reef) to understand the role of
reef degradation on the recruitment and growth of coral species.
2. To record branching coral extension rates at the three sites, to
understand the role of reef sedimentation on growth and coral
morphology.
3. To investigate the life strategies of scleractinian corals growing
under light limitation conditions.
4. To understand how species common to light –limited reefs allocate
their resources to corallite production
Replicate 10m long transects and permanent 1 m2 quadrats were laid in 2001
at Sampela, Kaledupa and Hoga reefs, at depths of 5m on the reef flats, and
5m, 10m and 15m on the reef walls (the last not at Sampela as the depth
there is only 12m). Physical measurements of surface areas have been made
on over 1,000 individual massive coral specimens on these transects, and on
quadrats in similar areas. Ambient in situ light measurements were also taken
at the same sites and at varying depths using a standard light-meter encased
in a transparent and waterproof camera housing.
Digital videorecordings have been made of all transects and quadrats at these
sites. Image analysis will be used to quantitatively analyse biodiversity and
coral dimensions from digital image analysis by computer. Similar techniques
were used in 2002 as have been published for the 2001 study (Crabbe and
Smith, 2002). Digital videorecordings have also be made of rapid-growing
branching corals, in order to study their linear extension rates.
19
To determine how species respond to light-limited conditions, the size (width,
height and width-to height ratio), the corallite density and inter-croallite
distance of Galaxea fascularis, a species common to light-limited reefs, was
recroded at a variety of depths and therefore light-regimes at the light-limited
reef.
2.2.4. Coral Reef Recovery Rates Despite the best efforts of the WMNP authorities, local NGO’s and local
communities, the coral reefs of the Park are still affected by destructive
fishing techniques such as blast fishing. Consequently this investigation aimed
to:
1. Understand how individuals coral colonies recovery
after being impacted by blast fishing.
2. Evaluate how coral mining activities affect coral reef
communities.
During 2002 a large blast fishing event took place at one of the investigation
sites and the damage caused by this blast was recorded. During 2003, the
same area was examined and the recovery of large colonies adjacent to the
blast center was recorded and the results are presented within this report.
Also reefs around the Park are presently, but perhaps more intensively in the
histroically, affected by coral mining activities. Assessments in to the diversity
and productivity of areas subjected to present and previous mining activities
were investigated as part of this research activity. Reef surveys were
conducted on two reef flat sites to compare % coral cover between a mined
(Pak Kasims) and un-mined site (Hoga No Take Area). Four 50m transects
were laid down parallel to the reef crest in a random manner. Two transects
were laid down 20m from the reef crest on the reef flat and the remaining
two were laid down another 30m from the reef crest. Every 25cm data was
recorded as to what lies beneath the transect line.

20
Along with the transect lines, rugosity was recorded by horizontally laying a
metal chain of known length along the reef. The rugosity was calculated as a
percentage by equation 1.
Equation 1.
Rugosity % = (Length of chain in situ/ total length of chain)*100
In order to obtain a representative sample of the biological structure of the
coral cover at the two reef flats of the no take area and Pak Kasims, 1 x 1 m
quadrats were laid down on alternate sides of the transects every 5m. The
percentage cover of various living forms and substratum type were recorded
along with the number of species identified coral colonies. The invertebrate
community was also examined at each of the sites.
2.3. CORAL REEF BIODIVERSITY AND ECOLOGY A number of investigations were instigated under this research theme. Also
results obtained from the monitoring programme are also applicable here, but
are included under the previous research theme. Data collected as part of the
monitoring programme will be rigoursly analysied and modelled and will be
used to produce important and management applicable parameters and also
to evaluate the use of other habitat quality parameters and the use of novel
target species.
2.3.1. Factors impacting coral reef biodiversity
Several factors can result in decreased biological diversity of coral reef
systems. Some of these factors are part of the natural cycle of coral reefs
whilst others are anthropogenically induced. This research activity aimed at:
1. Understand how light-limitation and sedimentation
affect coral recruits.

21
2. Understanding the community ecology and affects of
light-limitation send sedimentation on coral reef
systems.
Two sites were chosen within the study area on the basis of the amounts of
sediment present within the water column; the sites chosen were Sampela
and Kaledupa. These sites are markedly different, with Sampela buoy
1(5°29.01’S, 123° 43.47’E) being a site which has been heavily impacted by
sedimentation (following the removal of mangrove and sea grass beds on the
nearby shoreline), and Kaledupa buoy 1 (05°28.22’S, 123°43.47’E) being a
site which is considered to be of a far more pristine nature, with much less
sedimentation and an apparent higher concentration of coral growth.
Samples of the number and types of coral recruits were gathered by placing
35 quadrats (1m x 1m) along 50m transect lines at intervals of every 5m. Any
recruits (i.e. defined as a coral colony of < 5 cm in maximal diameter) were
recorded along with the type of substratum they were growing upon. The
transects and quadrat studies were carried out at both 5 and 10m depths at
both sites, to determine whether depth and therefore light availability played
a significant role in coral recruitment. This gave a grand total of 140 quadrats
available for statistical analyses.
To evaluate the effects of varying amounts of sedimentation on the success
of coral recruitment, sediment traps were secured to the reefs at each of the
depths. The sediment traps were made out of inverted 250ml water bottles
with the bottoms cut off to allow sediment to settle. The traps were removed
after 4 weeks in place and the captured sediment dried. Although it was
apparent that the amount of sediment being deposited at Sampela was
approximately 3-4 times higher than at Kaledupa, the results have not yet
been fully analysied and are not presented within this report. The light
intensity at each of the four study areas was calculated both horizontally and
22
vertically using a Secchi disk. This was repeated over a period of several dives
and an average figure calculated for light intensity.
Box transects (5 m x 2 m) were used to assess the characteristics of the
scleractinian coral community at each of the sites. which were five metre
transect lines with one metre either side of the line. Acropora, Galaxea,
Porites, Pavona, Pectinia, Diploastrea and Plerogyra were the Genera chosen
to be measured, as they are either very resilient or competitive species that
are common on Indonesian fringing reefs. Each colony was identified to
genera and the growth form noted. Its transition along the transect was
measured, as was the transition away from the transect to the centre of the
colony. Minus numbers were used if it was left of the transect line and plus
numbers if it lay on the right. The size of the colony i.e. length, width and
height were measured, and the percentage of the colony that was dead was
also estimated. Two depths of five metres and ten metres were measured
with 20 box transects at each depth. Resulting in 80 box transects all
together.
2.3.2. Comparison of coral reef health assessment methods
This investigation aimed to:
1. Understand how different survey techniques affect results obtained
during coral reef investigations.
2. Produce parameters that would be useful to indicate the quality of
coral reefs for coral reef management purposes.
Four sites within the Stakeholder Managed Zone were surveyed for
percentage live coral cover, coral growth form and commercial fish and invert
abundance. The four sites were Kaledupa Buoy 1 (GPS: 05 28.22S, 123
43.47E) and Sampela Buoy 1 (GPS: 05 29.01S, 123 45.08E), both off
Kaledupa Island and one site off Hoga Island, Hoga Buoy 3 (GPS: 05 28.29S,
123 45.40E) within the No Take Area.

23
To measure and calculate percentage coral cover and species richness, 100m
Line Intercept Transects (English et al.,1994), were used at a depth of 10m,
to create species accumulation curves that allowed the optimisation of
transect length to be used for the study. Three replicate 30m LIT were carried
out at depths of 3m and 10m at each site, with each transect separated by at
least 20m, after the GCRMN method (English et al.,1994).
The percentage cover data was used to calculate the species richness at each
site as well as the Coral Mortality Index, the Reef Condition Index and
percentage live coral cover. The coral growth form data was used to define
the Conservation Class (CC) of each site using ternary diagrams based on CSR
life histories.
The abundance of local target fish species and commercially exploited
invertebrates was established using belt transects 5m wide and 5m high
along the same length as the benthic transects, with a period of 15 minutes
allowed after the transect was laid to allow the fish to return to normal
behaviour after the diver disturbance. A simple index was devised to rate sites
according to target species abundance.
The data from the benthic transects was also used to generate the CMI, RCI,
%LCC and CC using only data from transects of 10m in length as
recommended by the COREMAP BME report.
These two data sets (GCRMN/AIMS and COREMAP methods) were then
compared to data for the same sites collected by the Operation Wallacea
Biodiversity Monitoring Program which utilises three permanent 50m
transects at three depths at each site. The data was then analysed by One-
Way ANOVA and by Tukey post-hoc test to detect any differences between
the methods. The datasets were also tested for correlation between methods.
Similarity indices were calculated for each site using each of the methods.

24
The three methods were then rated by least-cost analysis (time) and the
development of a mathematical index to rate the sites conservation potential,
in terms of reef health and fisheries potential. This index was then used to
classify all twelve of the monitoring program sites within and outside the
Stakeholder Managed Zone around Kaledupa Island.
2.3.3. The Importance of Coral Bombies for Coral Reef Biodiversity
Coral bombies are outcrops of coral found on reef flats, with an average
diameter of approximately one metre and have enormous variety in size, coral
cover, shape and structure. Both bombies and the adjacent seagrass beds
are inhabited by juvenile fish and therefore have important conservation
value. Consequently this investigation aimed to:
1. Understand the importance of coral bombies for overall
coral reef fish diversity.
2. Understand the features of coral bombies that
influences the associated fish assemblage
Forty bombies on the reef flat in the vicinity of Hoga Take Area were selected
for study, with a range of size, coral cover, rugosity and volume of branching
coral. All were at a distance greater than 5 metres from the coral crest and
seagrass beds to achieve an accurate representation of the fish species of the
reef flat. Each bombie was allocated a code and a labelled plastic tile, which
was tied to a metal pin and placed at the base.
A pilot study was conducted for fish counts to deduce the most appropriate
length of time to let the fish settle after approach of the snorkler, and for the
duration of data collection. It was found that 2 minutes would suffice, and
that the species composition and abundance did not change over the time
period of 20 minutes, therefore 5 minutes was chosen for observation. Four
fish counts were taken at regular intervals over the lunar cycle. The
25
frequency of all species present was recorded over a 2 hour time period over
high tide. The abundance was calculated as the total number of fish per
bombie and fish diversity per bombie calculated with the Shannon-Weaver
index.
The shape and dimensions of bombies were recorded with a metre ruler, to
the nearest 5cm and an appropriate equation (bombies shape dependant)
was used to calculate volume. The shape and dimensions of branching hard
coral were also recorded with a metre ruler, to the nearest 5cm and an
appropriate equation was used to calculate volume.
Rugosity, as an index of topographic diversity, was calculated as a ratio of the
length of string when laid flat against the colony surface to the length when
pulled tight over the same orientation (see equation 1). Both measurements
were taken four times, the first being along the maximum length of the
bombie, the second perpendicular to the first, and the third and fourth
approximately 45° clockwise and anticlockwise to the first.
Benthic characteristics of the bombies i.e. cover of hard coral (genera), soft
coral and algae, were determined by use of 50 cm² (divided into smaller 5
cm2 sections) quadrats which were placed on the top and sides of the
bombies and the frequency that the benthic form was present in 5cm2
sections was recorded. Hard coral were identified to genus level. The
diversity of cover of each individual bombie was calculated using the
Shannon-Weaver index.
2.3.4. The influence of habitat and fishing pressure on grouper
distribution and abundance Groupers of the family Serranidae are carnivorous apex predators feeding on
fishes, crustaceans and cephalopods. They occur at the top or near the top of
food chains and play a major role in the population structure of the faunal
communities of coral reef environments. A large grouper population is

26
therefore indicative of a thriving community. Groupers are important
commercially for local consumption and for the live fish trade. Monitoring
grouper populations is important in order to develop appropriate management
strategies and to determine which species may be particularly at risk from
overfishing.
Therefore this project aimed to :
1. Evaluate the effects of the Hoga No-take area on grouper
populations
2. Understand the relationship between reef quality, habitats
and grouper populations.
Population Surveys were undertaken on three areas of reef around the island
of Hoga were sampled; No Fishing Zone (Hoga Buoys 2 and 3), Fishing Zone
(Hoga Buoys 4 and 5), Sampela (fished and sediment impacted reef).
Abundance, diversity and distribution of Groupers was determined. Sampling
was conducted using diver observation along 30m transects at the reef flat,
crest, walls at 8m, slope at 4m and slope at 8m.
Preferential microhabitats (herein reffered to as “perching sites”) of four
grouper species, Epinephelus .fasciatus (black-tipped), Cephalopholis
cyanostigma (blue-spotted), Epinephelus .merra (honeycomb) and
Cephalopholis .urodeta ( flagtail) were examined in detail and classified using
digital photographs of 1 m2 quadrats to estimate substratum characteristics
and benthic cover. Underwater visual diver observation was used to ground
proof the images and to determine key physical characteristics of the
perching sites.
2.3.5. The distribution, diversity, abundance and shell use of
the hermit crabs of Hoga Island Hermit crabs are found in marine and terrestrial habitats. They are Anomuran
Decapod Crustaceans, with an un-calcified abdomen and are adapted to use
27
abandoned gastropod shells as protection against predators and desiccation.
The populations of hermit crabs are extremely dependant on the presence of
empty shells and therefore the gastropod population in an area, as they need
a shell to survive and a larger shell in which to grow.
The aim of this study was to
1. Evalaute the relationship between the abundance and
size range of hermit crabs, gastropods and empty shells
in the area to increase our understanding of the factors
influencing hermit crab abundance and diversity
Three separate sites around Hoga island were sampled: the southeast littoral
(“lodge” beach), the south littoral (“resort” beach) and the east littoral
(“bounty bay”) at four tidal depths (supra-littoral, high littoral, low littoral and
sub littoral) using three replicates. A 50m line with 1m2 quadrats placed every
2m, was used to quantify microhabitat, and the abundance and diversity of
live gastropods and hermit crabs. 50 hermit crabs, 25 gastropods and all
empty shells found were collected for further laboratory analysis of shell
species, dimensions, weight and condition, together with body weight relative
to shell size.
Shell choice experiments were conducted on thirty individuals of the most
common terrestrial hermit crab species (Cenobites spp.) and inter-tidal hermit
species (Dardanus spp.). A hierarchy of shell selection was created by
discarding those shells selected against, this culminated in determining the
ideal shell for each species.
2.3.6. The ecology of sponges in the Wakatobi region,
Indonesia Sponges form an important part of most major hard substratum benthic
communities in temperate (Hiscock et al., 1983; Picton, 1990), polar (Dayton
et al., 1974) and tropical marine habitats (Rutzler, 1970; Diaz et al., 1990).
However, their contribution to community structure is often under-estimated
28
or ignored due to the problem of identification of sponges in the field (Ackers
and Moss, 1987). Since sponges often occupy a significant proportion of both
primary and secondary space in coral reef ecosystems their conservation
value, in terms of biodiversity, and also as an economic resource (e.g.
potential sources of bioactive compounds) is mostly undervalued. Also sponge
species diversity and importantly, growth form morphology is greatly
influenced by environmental conditions and could therefore be used to
indicate environmental stress (Könnecker, 1973; Storr, 1976; Alvarez et al.,
1990; Witman and Sebens, 1990 and Sarà et al., 1979).
Detailed investigations have not yet been instigated within the study areas
and therefore this pilot research project aimed to :
1. Increase our understanding of the species diversity
and richness in two sites of the study area.
2. To understand the diversity of sponges in the study
area in relation to other more rigoursly investigated
sites around the world.
Sampela and Buoy 3 have similar gross sedimentation rates (between 20-30 g
d.wt. m-2. d-1), but the sediment composition (grain size) varies considerably
(Smith Unpublished data). Particles collected in previous sediment traps at
Sampela were much finer (smaller) than those at Hoga Island, where the
sediment was mainly composed of sand particles (Smith unpublished data).
Although the site at Hoga Island has been impacted in the past, the
instigation of the no fishing zone may have afforded some protection to the
communities during the past 3 years.
Ten 0.5m x 0.5m random (within surface types available) quadrats were
taken on vertical (∼90°), inclined (∼45°) and horizontal (∼0°) reef surfaces at
each site. Sampling was under taken on the reef crest, 6m, 12m and 18m
(Bouy 3 only since the reef at Sampela only extends to 12-15m). Within each
quadrat the number of each species (number of patches) was recorded along
29
with the total area occupied by each species. Sponges were only included in
abundance accounts if >50% of the sponge occurred within the quadrat
boundary. A small tissue sample (∼5mm3) was taken from each sponge
species. These samples were then dissolved in bleach (on site) to remove all
organic material, washed with freshwater and used to produce crude spicule
preparations. Drawings were made from spicule preparations on site to allow
identification to family/genus level on return to the UK. Photographs were
also taken of approximately 90% of the species to allow the production of a
basic field guide of species of the region.
Sponge assemblage data (percentage cover estimates) was subjected to
Bray-Curtis similarity analysis using hierarchical agglomerative group average
clustering for all habitats and depths. This was performed using the
unweighted pair group method using arithmetic averages (UPGMA) with the
PRIMER program (Plymouth Marine Laboratory). Data was log (x+1)
transformed to reduce the importance of extreme values (rare species).
Ordination by non-metric Multi-Dimensional Scaling (MDS in PRIMER) was
undertaken on the similarity matrix created from Bray-Curtis similarity
analysis to ascertain any similarity or differences between sites, depth and
surface angles (if any).
2.3.7. Cleaner wrasse
Information regarding cleaner wrasse stations are required as it is possible
that the client base of stations and / or traits regarding cleaner wrasse station
density and size could vary with habitat quality and could therefore be used
to help grade the quality of a reef system. Therefore the following research
tasks examine specific aspects of cleaner wrasse species, their ecology and
behaviour. Detailed investigations have also been carried out on cleaner
wrasse densities, in particular, whether traits of their density can be used as
indicators of reef health, and whether the number of clients visiting cleaner
30
wrasse station is directly related to the species diversity and abundance of
reef fish in general. However this data has not yet been analysised and is
therefore not included within this report.
Bluesteak Cleaner Wrasse Labroides dimidiatus Behaviour
This research aimed to:
1. To understand the variations in cleaning and associated behavior of cleaner wrasse at different stages in their life cycle.
2. To understand the variation in client for cleaner wrasse stations at different stages of their life cycle.
A number of cleaner wrasse individuals at different life cycles were observed
and an appropriate ethogram of behavior produced. Six stations were
selected for each age group and 15 mint observations were made. The
duration of the behavior of the Cleaner Wrasse was recorded, along with the
species and size of the fish that were cleaned.
The effect of stripe contrast on the attractiveness of Labroides dimidatus Labroides dimidatus, the bluestreak cleaner wrasse, is an obligate cleaner and
has an important role in fish health and abundance. Many studies have
recognised a similarity in colouration of cleaning species, and it is thought
that there is a world wide colouration which helps client fish identify a
cleaner. Cleaners often have stripes, and it is thought that this may indicate
to other species that it is a cleaner.
Consequently this research aimed to:
1. To elucidate whether it is cleaner wrasse lateral stripe colour or contrast that is important in attracting clientele
31
2.3.8. Butterflyfish as Coral Reef Indicators: Study into the Relationship between Chaetodontidae species and Coral Reefs around Hoga Island
Butterfly-fishes of the family Chaetodontidae are conspicuous inhabitants of
coral reefs throughout the world (Burgess, 1978; Motta, 1989) characterized
as diurnally active, brightly coloured fish belonging to three feeding guilds:
corallivores, benthic omnivores, and planktivores. Coral feeders are closely
associated with the living coral reef for both food and shelter, generally living
in monogamous pairs that are broadly home ranging or territorial.
Many species are obligate corallivores, and thus depend on the live tissue of
corals for their food. Because their metabolic or energetic demand is so
intimately linked to the existence and overall condition or ‘health’ of the coral
substrate, it is believed that these species of butterfly-fishes are excellent
candidates for indicators of changes in conditions of the coral reef.
Consequently this research aimed to
1. Increase our understanding of the relationship that
exists between butterfly-fish and hard coral cover
around Hoga Island.
2. To elucidate the relationship between the quality of
coral reefs and the territory size of the common Red-
din butterflyfish on the reefs surrounding Hoga.
2.3.9. Can the Tube-Building Polychaete worms Serpulidae and
Sabellidae be used as Indicators of the Health of Coral Reefs?
This project looks at the abundance and distribution of two types of
Polychaete worms, the Serpulidae (commonly called Christmas Tree Worms)
and the Sabellidae (commomly known as Fan or Feather Duster Worms).
These worms are useful study organisms because they are brightly coloured,

32
sessile and common on coral reefs. Serpulids live inside living coral and
secrete a calcareous tube for protection. Sabellids form tubes out of large
particles which they trap in their fronds, and live in dead coral or sediment.
The branchial plumes which protrude from the tubes of both worm types are
used for both filter feeding and respiration. As these worms are filter feeders
it has been suggested that they may serve as indicators of sedimentation
levels on coral reefs.
Therefore this research aimed to:
1. Increase our understanding of the factors affecting
the distribution of Spirobranchius and Sabellastrea
and the relationship between abundance and coral
reef health.
Four sites were used for the survey, the relatively pristine reef of Kaledupa,
the intermediate sites of Hoga no take area and Pak Kasims, and the
impacted reef around Sampela. All locations are near Hoga Island, SE
Sulawesi. At each site transects were laid at 2m (reef flat) 5m (reef crest) and
10m (reef slope), with three replicates at each depth, giving a total of 9
replicates per site. Transects were 25m long and coral 1m either side was
included in the survey. The number of worms encountered along the transect
was recorded, along with which genus of coral they were on, their position
along the transect, and their colour and tube size.
2.3.10. The abundance and diversity of Nudibranchs on reefs of
the study area Much work has gone in to taxonomically identifying Phillid and Chromodorie
Nudibranchs (Bruckhorst 1993, Fahrner 2000, Bertsch 1978, Rudman 1990,
1984), however very few Biodiversity and habitat investigations have taken
place.

33
Consequently this research aimed to:
1. Evaluate the density of Nudibranch species on the
reefs of the study area
2. Increase our understanding of relationship between
the abundance and diversity of the Nudibranch
community in relation to the hard coral cover of coral
reefs as an indicator of reef health.
Three sites, of ranging exposure, were investigated. Sampela reef is a site
subjected to low exposure, the Hoga No Take Area is an an area of
intermediate exposure, and Hoga ridge 2, situated on the southwest side of
Hoga island, represents a site of high exposure. Surveys carried out between
the 15th June – 25th July.
Coral cover was recorded by 3 continual line intercept transects of 75 metres
length. Two depths were investigated at each site at 5 m (representing the
reef crest habitat) and 13 meters (on the upper reef slope).
Nudibranch species richness and density was examined utilising the same
transect study survey, but on this occasion a belt transect of 2 m width was
used as the sampling unit. Each time an individual was located, the following
was obtained:
a. The exact depth
b. The species.
c. Its length
d. The substratum it was located on
e. The percentage cover of benthic life forms in a 1x 1m surrounding the Nudibranch
34
2.4. MANGROVE ECOLOGY To date limited investigations have been carried out on Mangrove systems
and most of the research carried out by Operation Wallacea have been based
on coral reef habitats. However due to the importance of mangrove in the
maintenance of health, productive and diverse reef systems, investigations
into Mangrove were carried out during the 2003 season. The main
investigation also included the setting up of a monitoring programme and
repeated measures permanent transects will be used to monitor the health,
diversity, productivity and exploitation rates in years to come. Due to a lack of
resources, this years pilot investigations into mangrove ecology was focused
on the island of Hoga and eastern Kaledupa, and not all of the study area. It
is envisaged that in future years the studies, particularly the establishment of
annual monitoring transects, will occur in all parts of the study area as for the
coral reef monitoring programme. This research theme also included some
ecological studies looking at macro-invertebrate behaviour. Other studies,
including a detailed mangrove – associated invertebrate study was also
carried out but due to incomplete data analysis, the investigation has not
been included within this document.
2.4.1. The diversity and exploitation rates of Mangrove
in the eastern part of the study area Five sites mangrove sites were identified within the study area. The Mangrove
species diversity , density, physical characteristics, exploitation rates, and
regeneration potential was examined. Permanent transects have also been
established within these sites, so that rates of change in diversity, exploitation
and abundance can be examined over the next 5 years. Such rates of change
should be used to dictate management procedures.
Random belt transects of 100m length was used to estimate tree abundance
and size frequency distribution. No less than 5 transects were examined at
each site. Throughout the belt transects a number of randomly placed
quadrats were used to assess invertebrate diversity which were counted
35
directly, or in the case of burrowing endofauna, burrow density was recorded
as an index of animal density.
Exploitation rates were semi-quantitatively estimated at each site by recording
of the number of trees which had been cut down and other obvious signs of
harvesting. The regeneration potential of the mangrove was inferred to by
examining the number of saplings vs mature trees, and the densities and
frequency of seeds and propagule’s.
2.4.2. Habitat specificity and resource utilization of a
fiddler crab assemblage
Fiddler crabs inhabit intertidal mud and sand flats of protected shores and are
among the most abundant animals in tropical mangrove forests. Fiddler crabs
are small semi-terrestrial crabs of the genus Uca that are characterised by the
males who have one greatly enlarged claw. The claw is displayed in a
‘waving’ motion to attract females and as a defence against other males.
Different species of fiddler crabs have become specialised to exists on shores
of different sediment composition. Species that prefer coarser, sandy
sediments have chelae with a wider gape to accommodate the larger particles
and those that specialise in finer sediments tend to have a narrower gape.
Therefore, theoretically, the different species of Uca are adapted to feeding
on different sediment types, which can vary at different positions on the
shore as a function of average exposure levels. Interactions between species
will occur on some shore types, where there is mixed sedimentology,
although the outcome of such interactions, particalry between different sized
individuals and therefore assumingly of variable competitive ability is largely
unknown.
Fiddler crabs play an important ecological role within their habitat. They often
burrow to depth and consequently serve to mid sediments, and introduce
oxygen deep into often anoxic sediments and therefore can drastically alter
36
the redox potential of the sediments and hence the cycling of inorganic
nutrients. Their presence and activity therefore effects nutrient cycling within
sedimentary shores and mangrove systems, and this affect can be highly
significant due to the characteristic high densities of fiddler crab populations.
This research aims to:
1. Understand resource partitioning between, and
habitat utilisation of different species of fiddler
crab and different sized fiddler crabs.
2. To evaluate the density and size distribution of
fiddler crab species existing within the study area.
This study was carried out within two relatively different sites : site 1 was
located on the mudflat and mangrove edges near the jetty in the town of
Ambeua, Kaledupa and site 2 was located in a sandy, sheltered bay on the
small mangrove edge behind the village of Furake, Hoga.
Site 1 on Kaledupa has a wide range of sediments, from clay on the right of
the pier to thick, wet mud and mangrove roots far left of the pier across from
Ambeua river. The mangrove species consist of Sonneratia alba, Rhizophora
stylosa, Avicennia marine and the most abundant Avicinnia officinalis.
Site 2 on Hoga has a more gradual change in sediment, from sandy clay on
the mangrove edge where the sediment is only just covering the coral
substratum to coarser, wetter and more calcareous sediment further away
from the mangrove area. The mangrove area consists of one large
Sonneratia alba and several smaller Rhizophora stylosa.
A number of areas of 5m x 5m were located at each study site covering the
range of tidal levels and changes in sediment type (that occurred horizontally

37
as well as vertically) and within each area 5 random quadrats ( 0.25m2) were
used as the sample unit.
At site 1, Kaledupa, a total of 15 areas were selected within three different
zones, high-, mid- and low-shore. Five areas were chosen running along the
top of the shore on the mangrove edges (areas 1-5a), five areas running
below these on the middle of the shore 20m from the top (areas 1-5b) and
five areas at the bottom of the shore, 45m from the top and exposed only at
low tide (area 1-5c).
At site 2, Hoga, only 5 areas were sampled due to the significantly smaller
study site and ranged from the mangrove edge high on the shore to lower
down on the shore away from the mangrove where fewer fiddler crabs
occurred.
Co-ordinates to determine the position of each quadrat within an area were
generated using random number tables and for each quadrat the following
was carried out:
a. A picture was taken of each quadrat
b. Each burrow was numbered and distances to the right
and to the bottom of the quadrat measured
c. The largest and smallest dimension of each burrow
entrance was recorded
d. Each burrow was dug out, and noted as either been
empty, occupied, shared or connected to other
burrow. If occupied, the sex, species, carapace width,
length and depth were recorded
e. Burrow depth was measured vertically from the
surface
f. A sediment sample was taken for visual categorisation
of sediment type.
38
2.4.3. Releasers of Behaviour of the Major Cheliped in Uca vocans and Uca dussumieri
They are characterised by their sexual dimorphism as the males posses a
grossly enlarged cheliped, or claw. This is employed in sexual displays and
antagonistic interactions with other males, but not in feeding (Crane 1975;
Christy and Salmon 1984). Uca vocans and U.dussumieri are two species of
such Fiddler crabs that inhabit mangroves and inter-tidal mudflats
constructing burrows in dense communities. Jennions and Blackwell1995
found that carapace width and claw size were a key determinant in the
outcome of combat and so a key releaser to the involved crabs. Rosenberg
2001 continued and extended this work by looking at claw shape variation
and correlation of this with carapace size; the same conclusions were
reached. More recent work has been carried out by Rollinson 2003 and
Holdom 2003, that takes into account the effects of waving the claw and claw
colouring respectively.
The aim of this research was to:
1. Increase our understanding of which features of
the chelipad has greatest influence on opposing
fiddler crab behaviour .
A random sample of twenty fiddler crabs were examined of two species; Uca
vocans and U.dussumieri. The length and width of the major claw was
recorded. The colouration, although very similar between individuals of the
same species, was also recorded. The extremes of the sizes and colours
recorded were used as the basis on which to construct model claws for
experimentation. Model claw were constructed from wood and coloured
accordingly. A wooden chamber was also constructed in order to house the
39
crab while the experiment was conducted. Crabs again, were collected at
random from the mudflats and brought back to the laboratory.
Crabs were allowed to acclimatise for no less than two hours in which time
they would construct burrows. Each crab was then transferred in turn the
experimentation chamber. Again, a period of acclimatisation was required of
no less than thirty minutes. The crab was confined to one end of the box by a
barrier. This barrier was then removed for prior to the start of the
experiment. The crab was presented with each of the model claws twice,
once waving and once still. Each of the sixteen claw combinations were
presented in a random fashion to forty crabs of each species. The response of
the crab to the claws was recorded, along with how close the claw was when
the response was seen and the length of the claw of the crab being tested.
40
3.0. Results
3.1. Coral Reef Dynamics
3.1.1. Coral Reef Monitoring Programme
To aid comparison between data collected during 2003 (not yet fully
analysed) and the 2002 data set, summary figures for 2002 have been
included.
Summary of 2002 Monitoring data
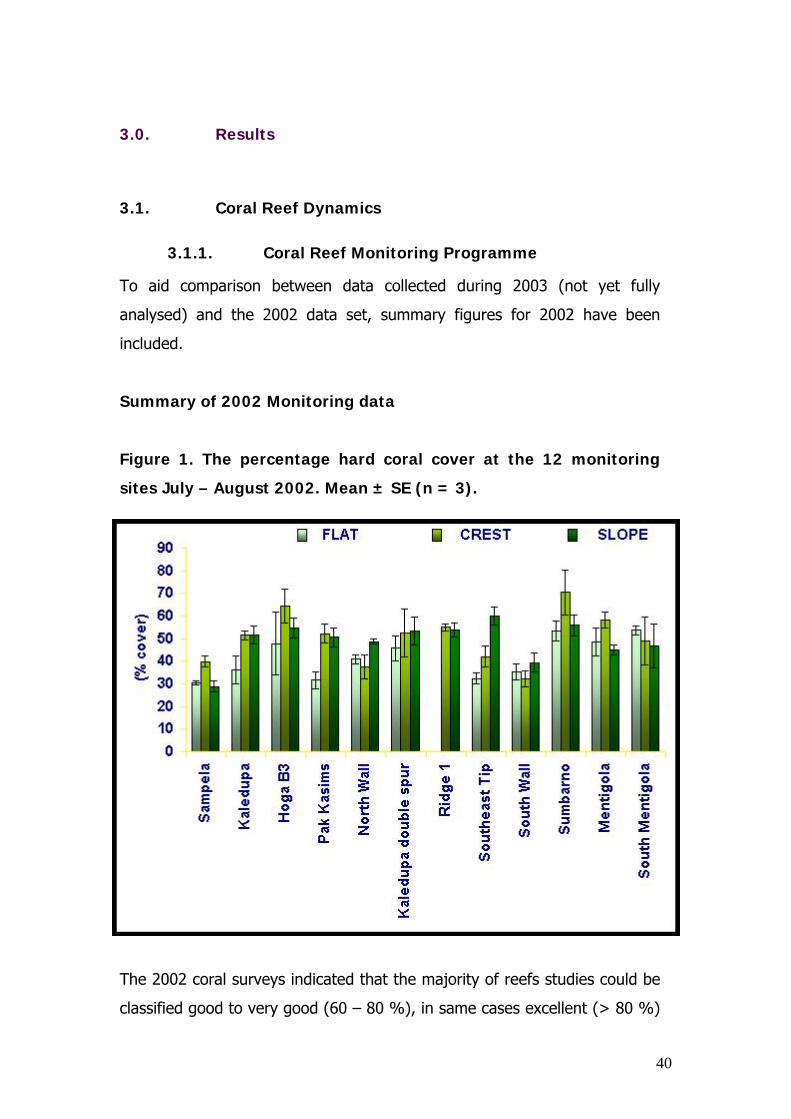
Figure 1. The percentage hard coral cover at the 12 monitoring
sites July – August 2002. Mean ± SE (n = 3).
The 2002 coral surveys indicated that the majority of reefs studies could be
classified good to very good (60 – 80 %), in same cases excellent (> 80 %)
41
and only for 1 or 2 transects did the reef fall into the average category (30
– 50 %). Highest coral cover was generally determined for the reef crest
habitat and was particualry high at Sumbarno and Hoga B£, the No Take
area. Lowest coral cover was found at Sampela, a previopusly investigated
light-limited reef (see Crabbe and Smith 2002, 2003), the highly exposed
areas: North Wall, South Wall and the South East tip and on the Kaledupa
reef flat which is an area of reef heavily impacted by blast fishing.
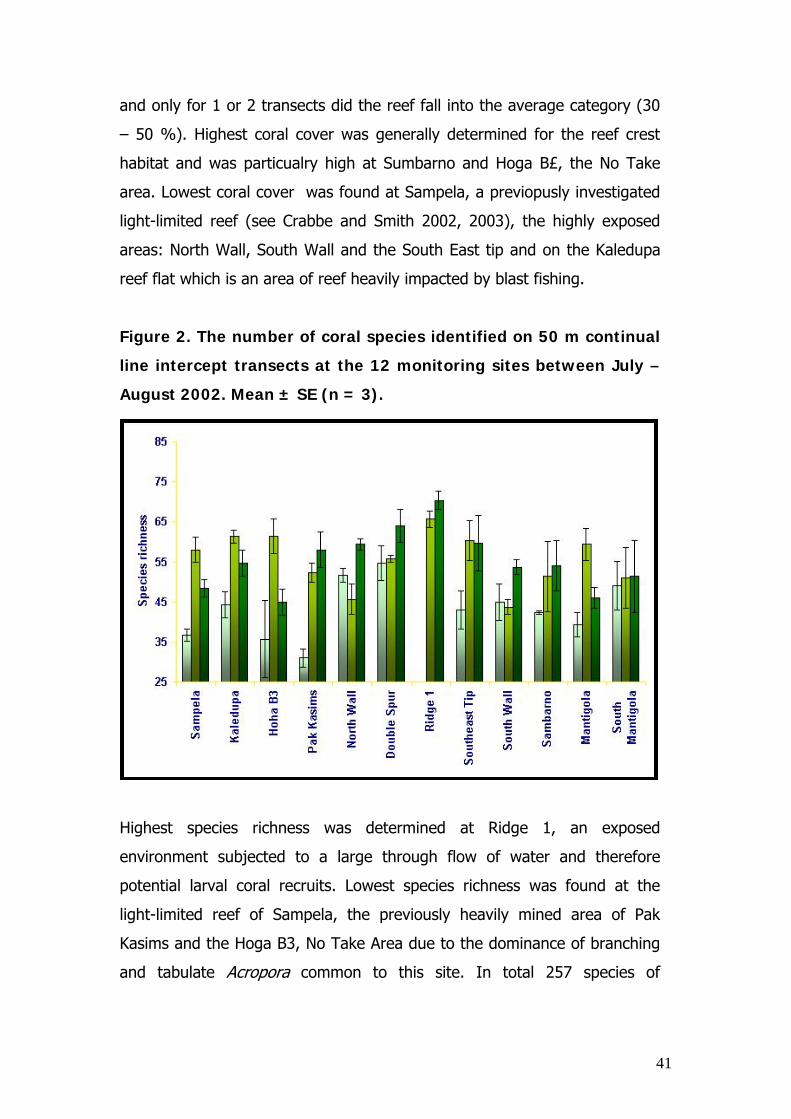
Figure 2. The number of coral species identified on 50 m continual
line intercept transects at the 12 monitoring sites between July –
August 2002. Mean ± SE (n = 3).
Highest species richness was determined at Ridge 1, an exposed
environment subjected to a large through flow of water and therefore
potential larval coral recruits. Lowest species richness was found at the
light-limited reef of Sampela, the previously heavily mined area of Pak
Kasims and the Hoga B3, No Take Area due to the dominance of branching
and tabulate Acropora common to this site. In total 257 species of

42
scleractinian corals were identified, making the area a diversity global hot
spot for scleractinian corals.
Simple multivariate statistical procedures can be used to highlight
similarities in the coral community and benthic life forms. Sites which are
most similar cluster together allowing patterns to be see in the data set that
would not be obvious when using univariate procedures
Figure 3: Dendogram showing the similarity between the benthic
community characteristics of reef flat, crest and slope habitats at
the 12 monitoring sites. UPGMA clustering technique was used and
the red-line represents an arbitrary similarity division at the 65 %
level.

43
At a similarity of 65 % 7 groupings can be seen. The sites were grouped
according to exposure levels and physical impacts i.e mined, bslatred and
light-limited reefs (see table 1).. The community ecology of hard corals at
each site can be compared annually to determine how management
procedures affects the overall community structure.
Table 1. Sites with > 65 % similarity as determined through
cluster analysis. General descriptions on major
common factors influencing community structure are
also given.
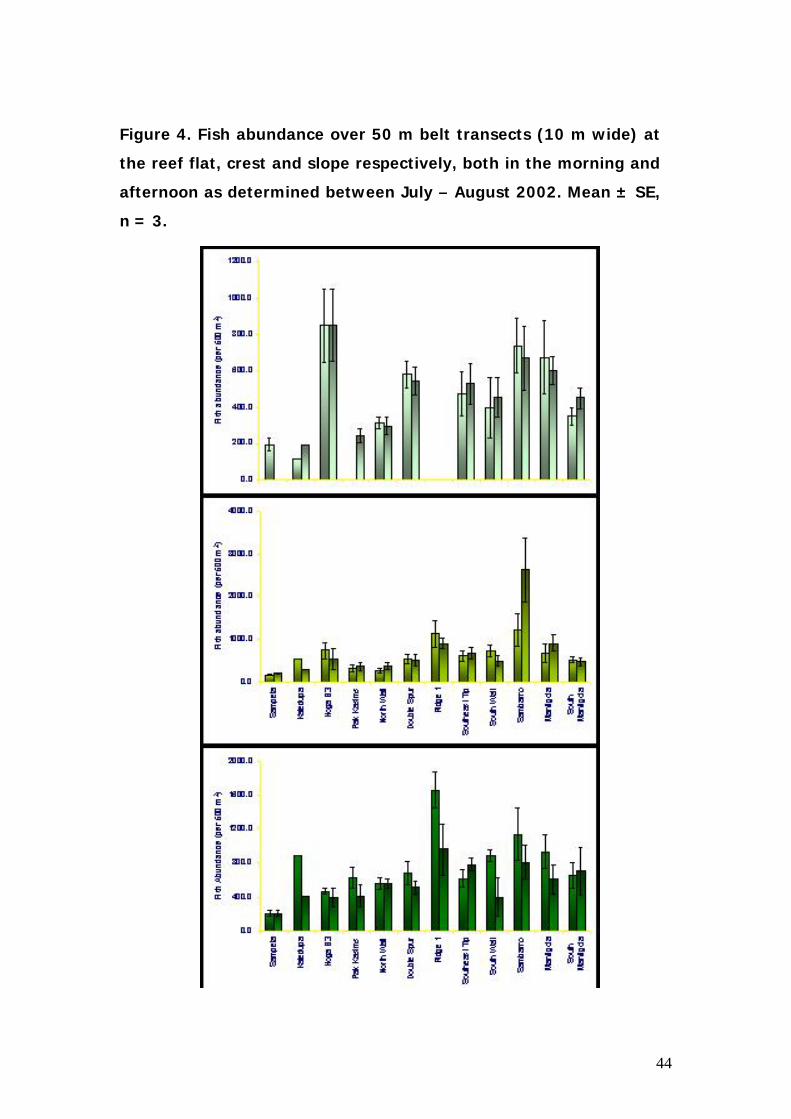
Fish abundance varied significantly with site and was generally highest at
the reef crest. Highest counts were observed at Sumbarno due to the high
numbers of Anthias found at this site. Beside Sumbarno, the ridge has
heights fish counts as this site was characterised both by demersal reef
species as well as schooling pelagic species.
44
Figure 4. Fish abundance over 50 m belt transects (10 m wide) at
the reef flat, crest and slope respectively, both in the morning and
afternoon as determined between July – August 2002. Mean ± SE,
n = 3.
45
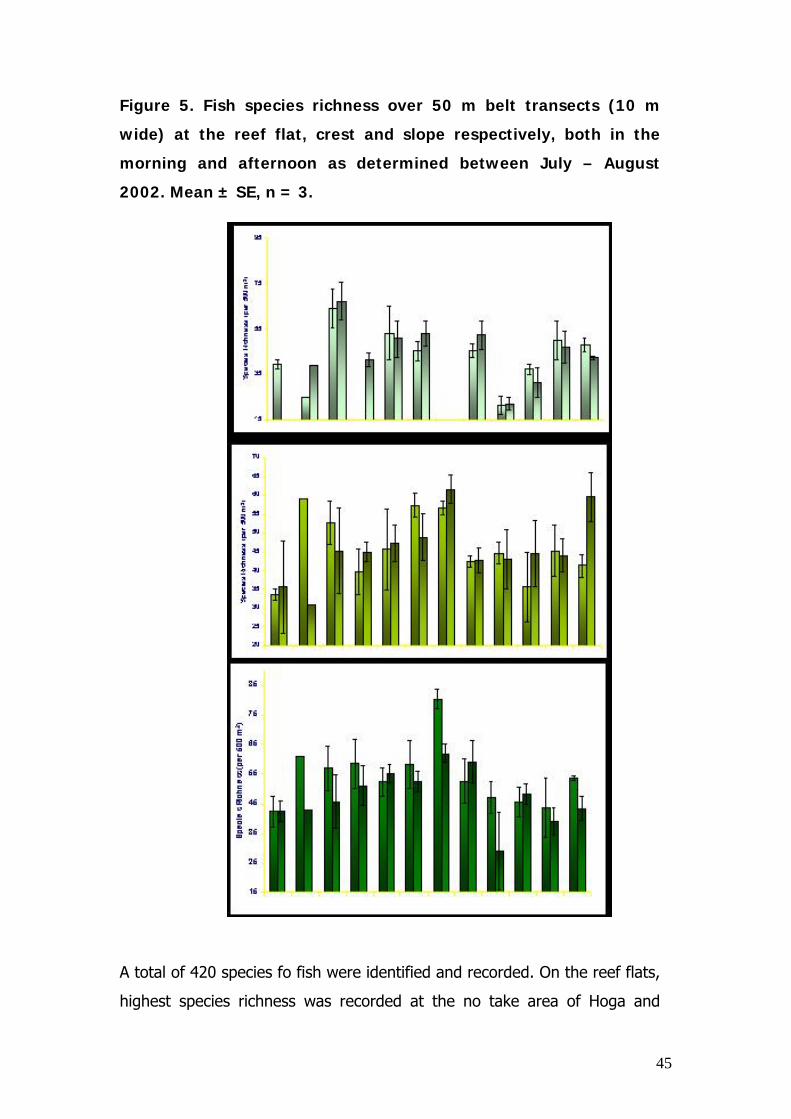
Figure 5. Fish species richness over 50 m belt transects (10 m
wide) at the reef flat, crest and slope respectively, both in the
morning and afternoon as determined between July – August
2002. Mean ± SE, n = 3.
A total of 420 species fo fish were identified and recorded. On the reef flats,
highest species richness was recorded at the no take area of Hoga and

46
lowest counts were found at the highly exposed South Wall which also has
very low coral cover. Highest species richness on the reef crest and slope
was found at the ridge site due to the mixed community of reef and pelagic
species existing in this site characterised by intermediate levels of exposure
and high coral cover. Lowest species richness on the crest and slope was
found at the light limited site of Sampela and the exposed South Wall both
also being indicative of relatively low coral cover.
Relationships between benthic features e.g. coral cover ect, and the fish
community can clearly be seen when the data is analysised using
multivariate statistics such as Canonical Correspondence Analysis (figure 5).
Figure 5. CCA of fish community structure and benthic features.
The trends lines indicate the major features of the benthic
community that are important in sculpturing the community
structure of the different sites (as indicated by letter codes on the
figure).
47
Fish community structure is seemingly influenced by the benthic cover of
coral and there exists a negative strong relationship between coral and algal
cover. Some sites are more influenced by the number of species of coral
rather than simply the abundance of coral. Higher diversity is therefore seen
when there is maximal coral cover and species diversity and minimal cover
of algae. These are the traits that are therefore required if coral reef fish
productivity is to be maximised and therefore these benthic features should
be considered performance criteria for reef systems rates of change in
which can be examined to determine how reef community structure
changes in time, particularly in response to variable management
techniques.
Summary of 2003 monitoring data analysed thus far
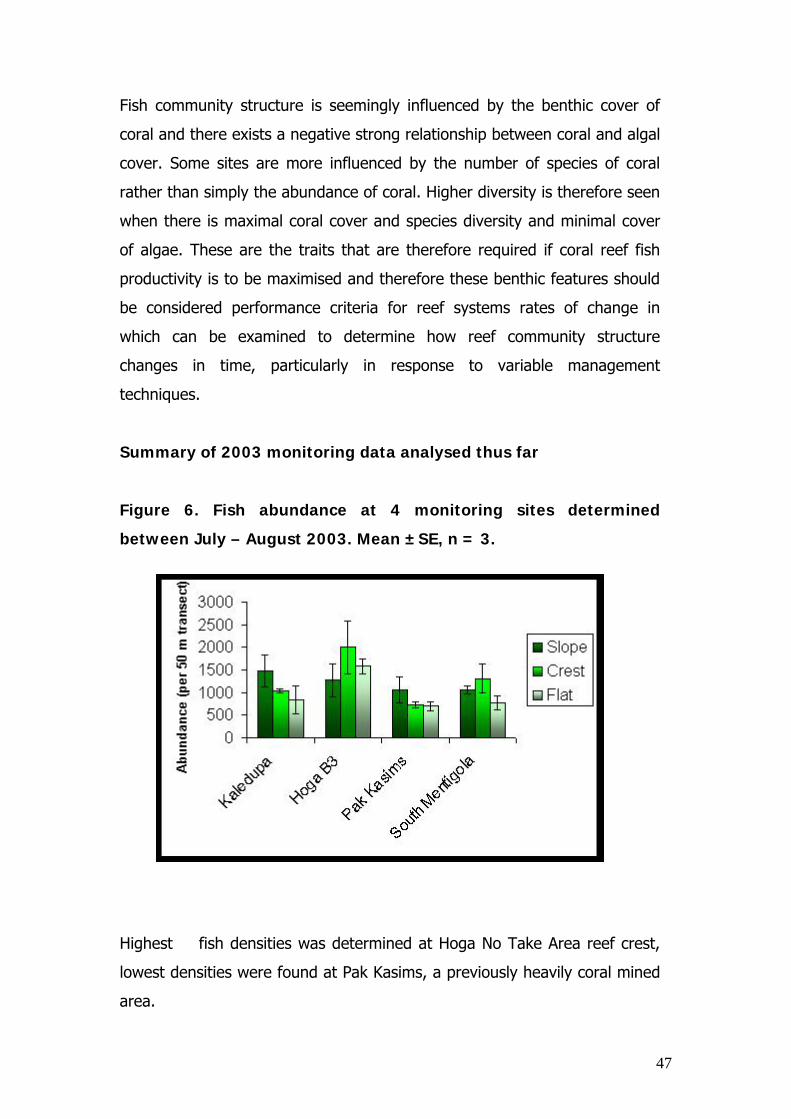
Figure 6. Fish abundance at 4 monitoring sites determined
between July – August 2003. Mean ±SE, n = 3.
Highest fish densities was determined at Hoga No Take Area reef crest,
lowest densities were found at Pak Kasims, a previously heavily coral mined
area.
48
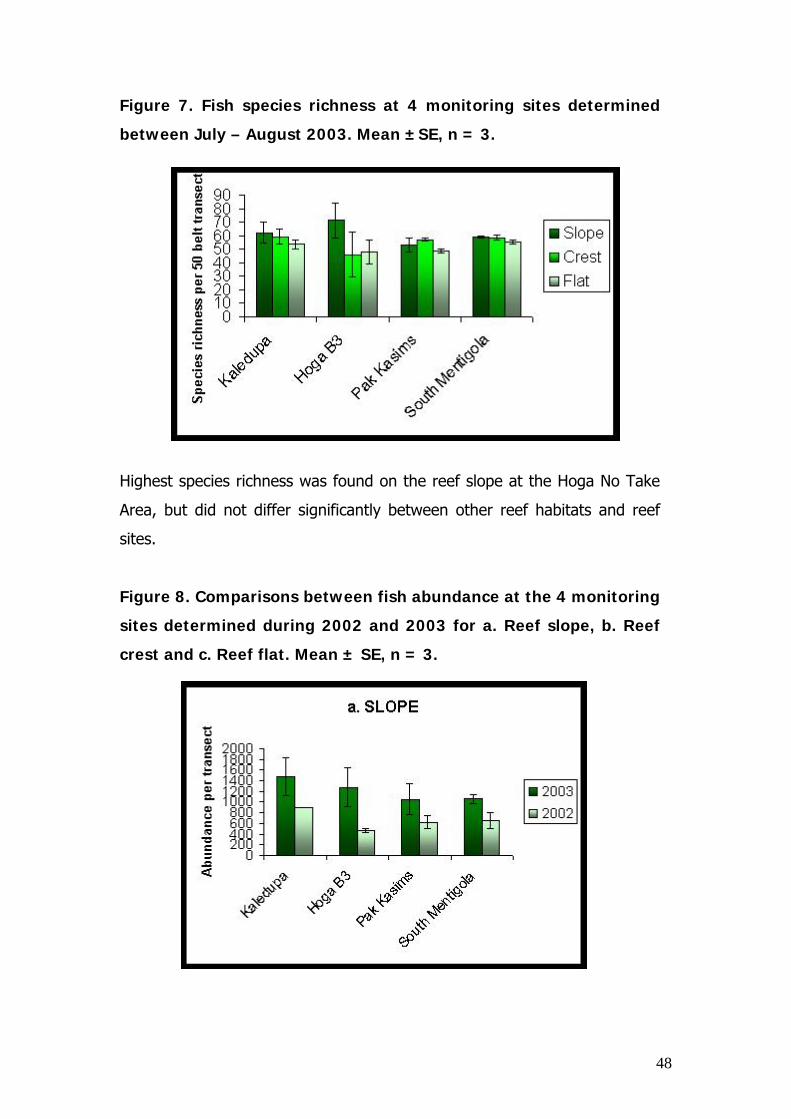
Figure 7. Fish species richness at 4 monitoring sites determined
between July – August 2003. Mean ±SE, n = 3.
Highest species richness was found on the reef slope at the Hoga No Take
Area, but did not differ significantly between other reef habitats and reef
sites.
Figure 8. Comparisons between fish abundance at the 4 monitoring
sites determined during 2002 and 2003 for a. Reef slope, b. Reef
crest and c. Reef flat. Mean ± SE, n = 3.

49
In all cases fish abundances observed on the 2003 transects were
significantly higher than observed during 2002 although exactly the same
location was examined. The greatest difference was found at the Hoga No
Take Area.
50
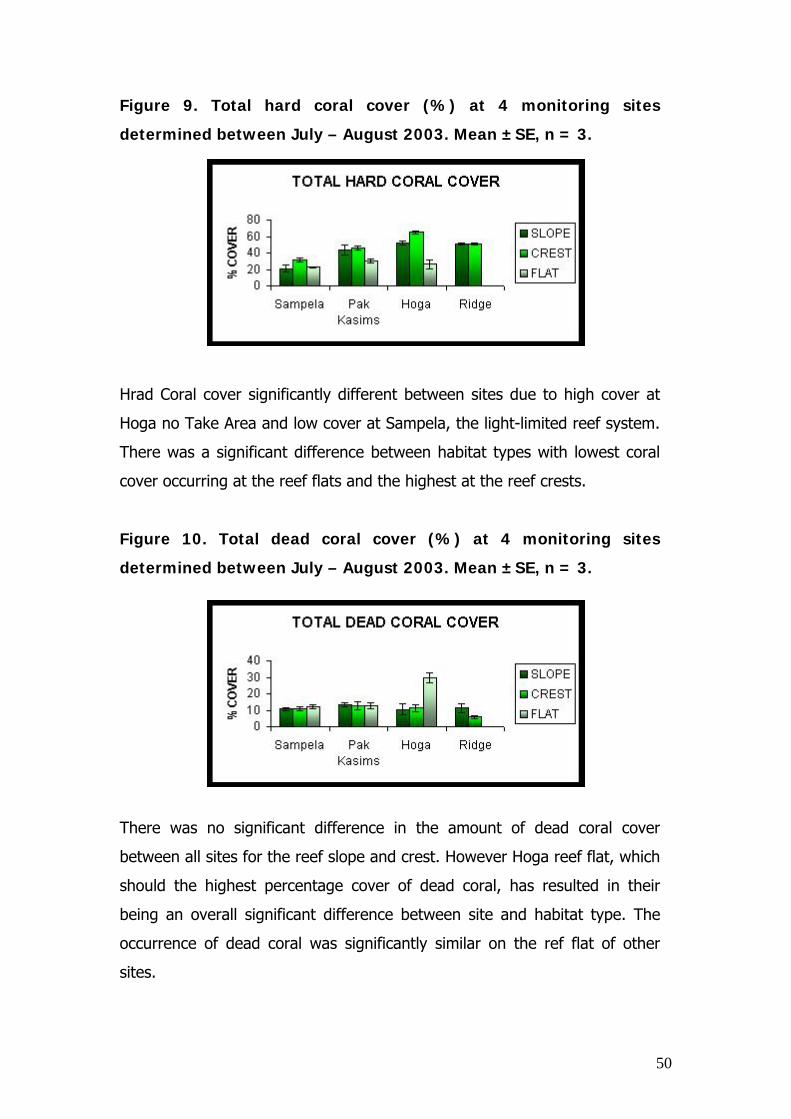
Figure 9. Total hard coral cover (%) at 4 monitoring sites
determined between July – August 2003. Mean ±SE, n = 3.
Hrad Coral cover significantly different between sites due to high cover at
Hoga no Take Area and low cover at Sampela, the light-limited reef system.
There was a significant difference between habitat types with lowest coral
cover occurring at the reef flats and the highest at the reef crests.
Figure 10. Total dead coral cover (%) at 4 monitoring sites
determined between July – August 2003. Mean ±SE, n = 3.
3.1.2. Reef Check Surveys
There was no significant difference in the amount of dead coral cover
between all sites for the reef slope and crest. However Hoga reef flat, which
should the highest percentage cover of dead coral, has resulted in their
being an overall significant difference between site and habitat type. The
occurrence of dead coral was significantly similar on the ref flat of other
sites.
51
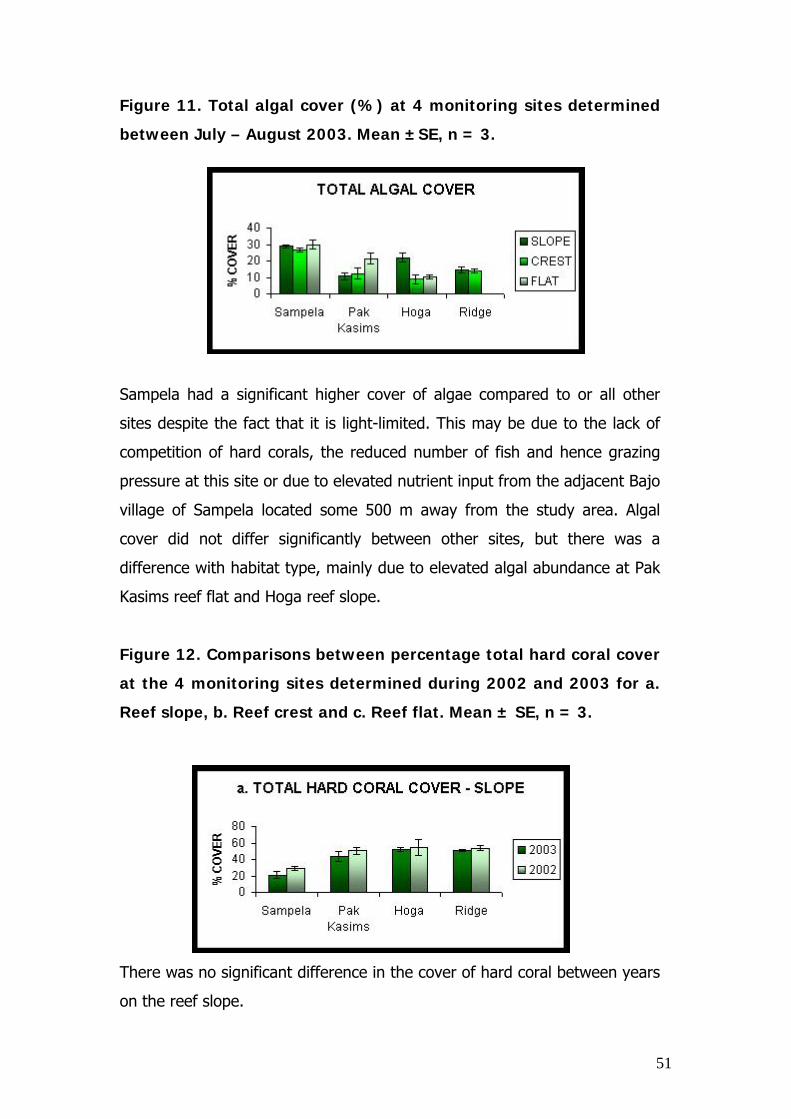
Figure 11. Total algal cover (%) at 4 monitoring sites determined
between July – August 2003. Mean ±SE, n = 3.
Sampela had a significant higher cover of algae compared to or all other
sites despite the fact that it is light-limited. This may be due to the lack of
competition of hard corals, the reduced number of fish and hence grazing
pressure at this site or due to elevated nutrient input from the adjacent Bajo
village of Sampela located some 500 m away from the study area. Algal
cover did not differ significantly between other sites, but there was a
difference with habitat type, mainly due to elevated algal abundance at Pak
Kasims reef flat and Hoga reef slope.
Figure 12. Comparisons between percentage total hard coral cover
at the 4 monitoring sites determined during 2002 and 2003 for a.
Reef slope, b. Reef crest and c. Reef flat. Mean ± SE, n = 3.
There was no significant difference in the cover of hard coral between years
on the reef slope.

52
There was no significant difference in the cover of hard coral between years
on the reef crest.
There was a significant difference in the percentage hard coral cover of the
reef flat between 2003 and 2002 due to a significant reduction of coral
recorded during 2003.
Figure 13. Comparisons between percentage total dead coral cover
at the 4 monitoring sites determined during 2002 and 2003 for a.
Reef slope, b. Reef crest and c. Reef flat. Mean ± SE, n = 3.
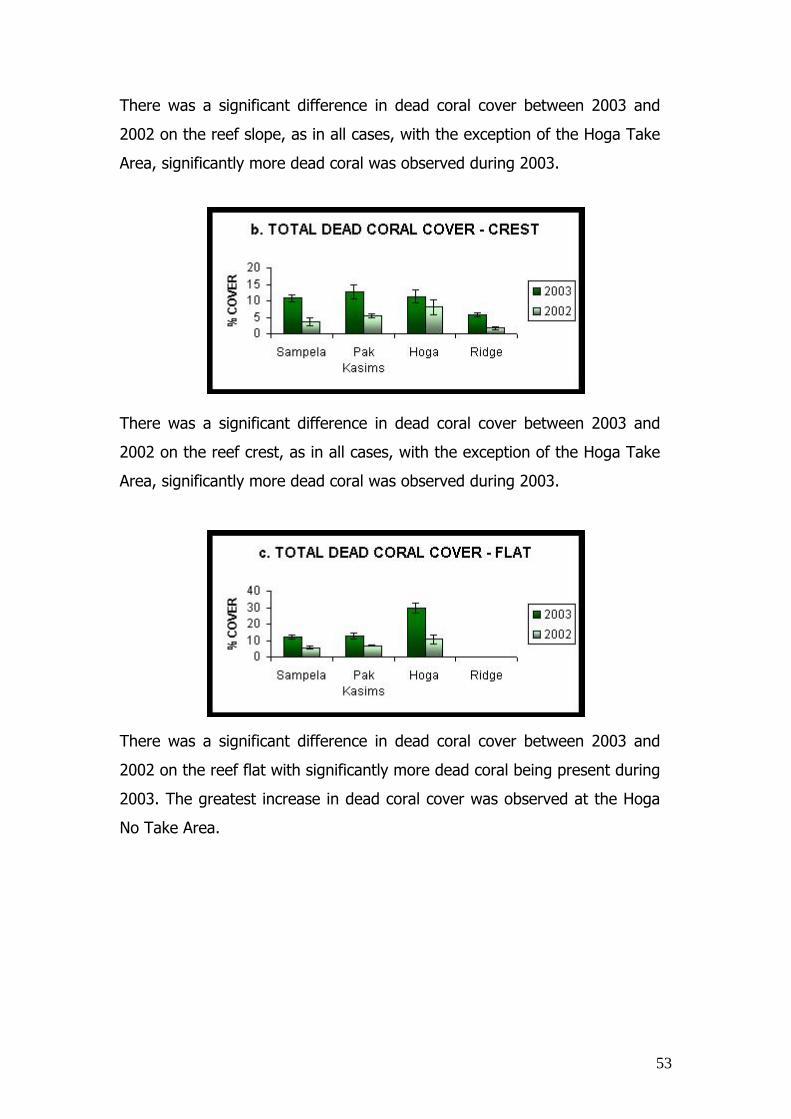
53
There was a significant difference in dead coral cover between 2003 and
2002 on the reef slope, as in all cases, with the exception of the Hoga Take
Area, significantly more dead coral was observed during 2003.
There was a significant difference in dead coral cover between 2003 and
2002 on the reef crest, as in all cases, with the exception of the Hoga Take
Area, significantly more dead coral was observed during 2003.
There was a significant difference in dead coral cover between 2003 and
2002 on the reef flat with significantly more dead coral being present during
2003. The greatest increase in dead coral cover was observed at the Hoga
No Take Area.

54
Figure 14. Comparisons between percentage total algal cover at
the 4 monitoring sites determined during 2002 and 2003 for a.
Reef slope, b. Reef crest and c. Reef flat. Mean ± SE, n = 3.
There was no significant difference in the abundance of algae recorded at
the reef slope of all sites during 2002 and 2003.
At all sites there was significant reduction in the amount of algae recorded
on the reef crest and the greatest reduction was seen at the Ridge site.
3.12 Reef Check Surveys
The data gathered from the Wakatobi Marine National Park for Reef Check
2003 was analysed and put into graphical form to identify clearly the
occurrence of species at each of the sites. Six pieces of data has been
analysed to date. The mean number of Butterflyfish and Parrotfish
throughout the eleven sights did not vary at the 5m transect (Figure 15),
however Snappers and Sweetlips were more variable. Humphead wrasse and
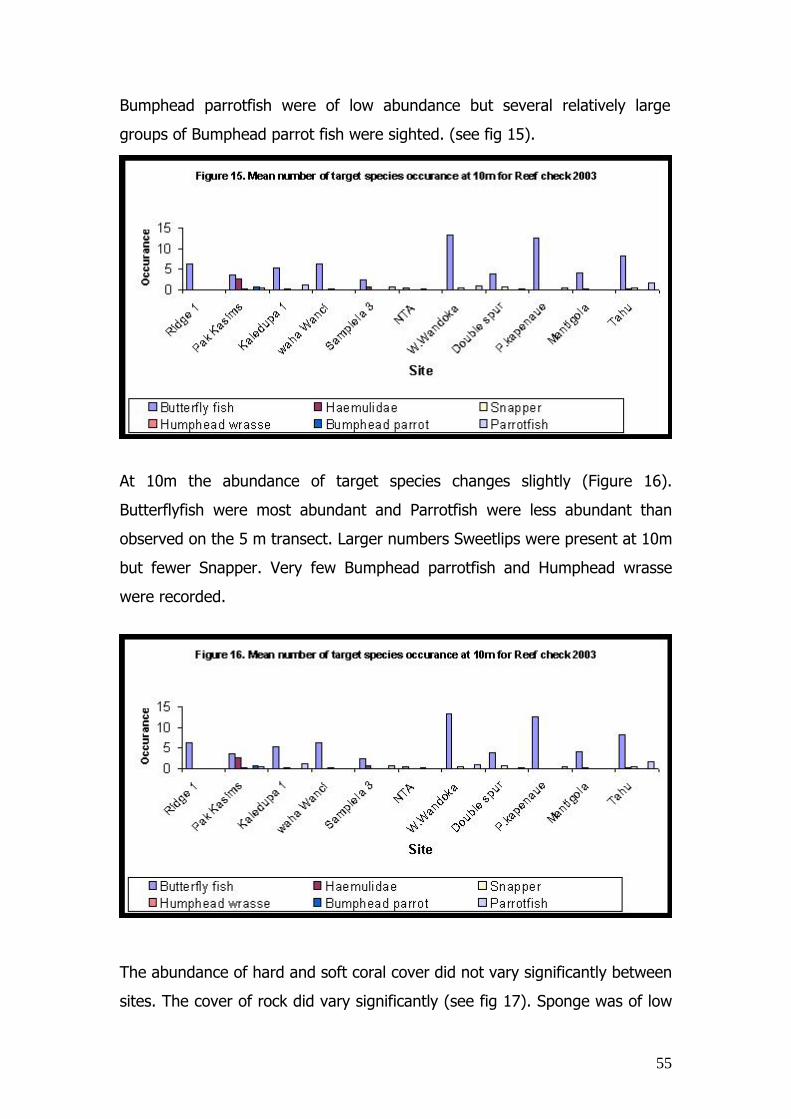
55
Bumphead parrotfish were of low abundance but several relatively large
groups of Bumphead parrot fish were sighted. (see fig 15).
At 10m the abundance of target species changes slightly (Figure 16).
Butterflyfish were most abundant and Parrotfish were less abundant than
observed on the 5 m transect. Larger numbers Sweetlips were present at 10m
but fewer Snapper. Very few Bumphead parrotfish and Humphead wrasse
were recorded.
The abundance of hard and soft coral cover did not vary significantly between
sites. The cover of rock did vary significantly (see fig 17). Sponge was of low

56
abundance throughout all sites. There was limited amounts of recently killed
coral, with maximum cover being found at the Hoga No Take Area.
There is slightly more soft coral recorded at the 5m (see fig 18) compared to
the 10 m transect, and slightly higher proportion of recently killed coral. The
remaining categories show a constant mid to low range abundance at 5m.
Several sites had no target invertebrate species at the 10 m transect (see fig
19). A relatively large number of giant clams were observed at the Ridge at
10 m but were of low abundance low or absent at all other sites. Sea
cucumbers were also relatively abundant at 10 m at Ridge 1. Crown of thorns
starfish were only present at 10 m at Kaledupa. Banded coral shrimp were
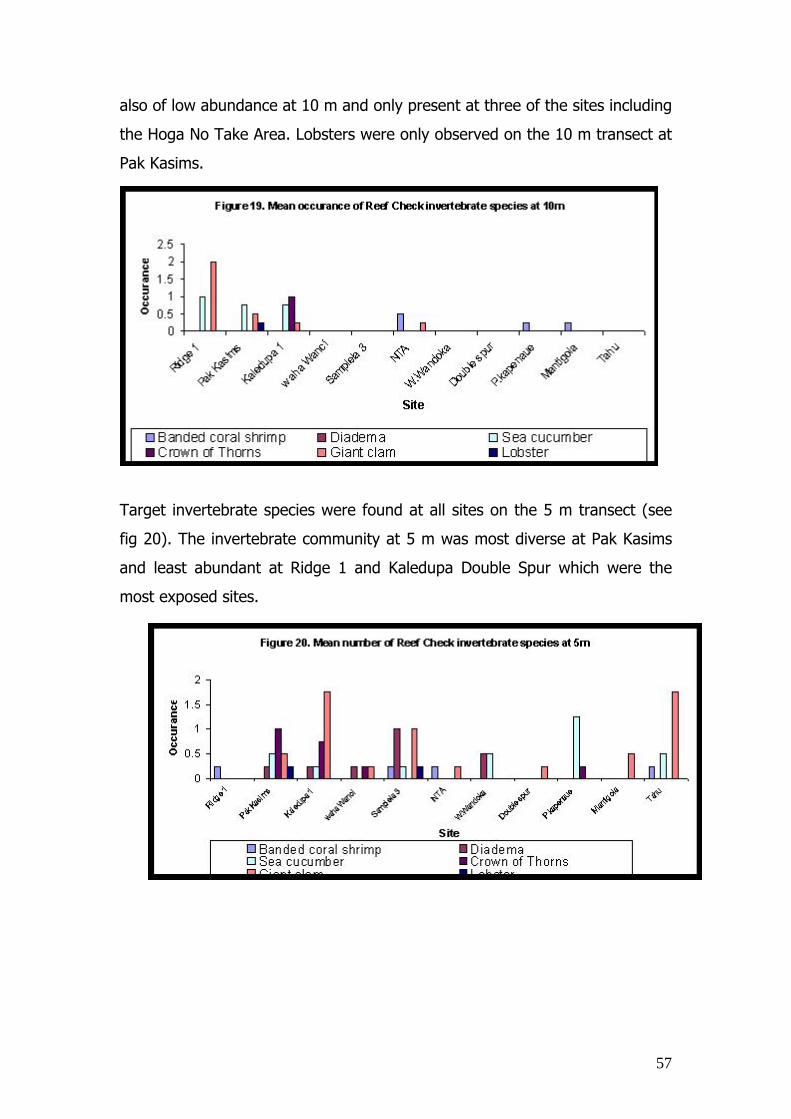
57
also of low abundance at 10 m and only present at three of the sites including
the Hoga No Take Area. Lobsters were only observed on the 10 m transect at
Pak Kasims.
Target invertebrate species were found at all sites on the 5 m transect (see
fig 20). The invertebrate community at 5 m was most diverse at Pak Kasims
and least abundant at Ridge 1 and Kaledupa Double Spur which were the
most exposed sites.

58
3.1.3. Coral Reef Growth and Recruitment Rates
Figure 21. Light concentrations determined at three sites and
varying depths
Lowest light levels were determined at Sampela, followed by Hoga and were
maximised for all depths at Kaledupa. The rates of decrease of light with
depth were greatest for Kaledupa, the site with the least amount of
sediment within the water column (see figure 21).
Radial growth rates of Acropora colony linear extension rates were similar at
the three sites to those previously reported (Crabbe and Smith, 2002; LIPI
report 2002). Radial growth rates of Favites colonies were slightly higher at
Hoga than at Kaledupa (Fig.22), while radial growth rates of Astreopora spp.
Were significantly lower aat Sampela than at Hoga or Kaledupa (Fig.23).
Growth rates of Diploastrea heliopora were similar at all three sites.
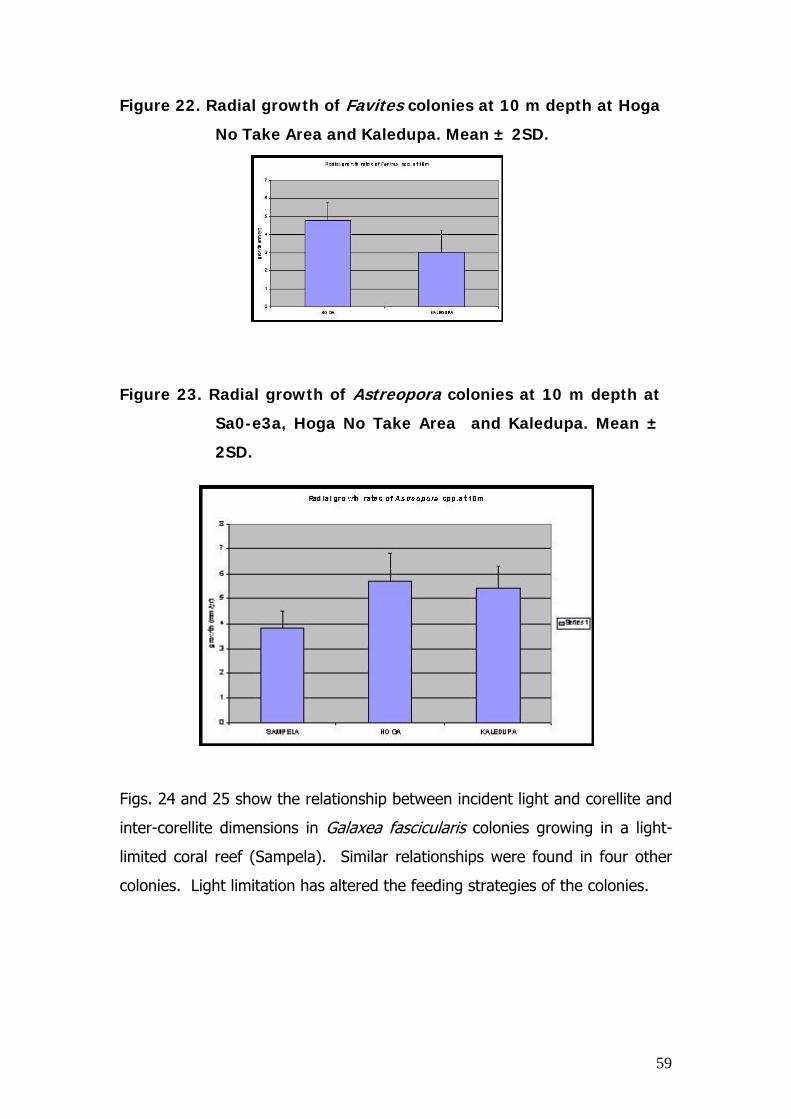
59
Figure 22. Radial growth of Favites colonies at 10 m depth at Hoga
No Take Area and Kaledupa. Mean ± 2SD.
Figure 23. Radial growth of Astreopora colonies at 10 m depth at
Sa0-e3a, Hoga No Take Area and Kaledupa. Mean ±
2SD.
Figs. 24 and 25 show the relationship between incident light and corellite and
inter-corellite dimensions in Galaxea fascicularis colonies growing in a light-
limited coral reef (Sampela). Similar relationships were found in four other
colonies. Light limitation has altered the feeding strategies of the colonies.
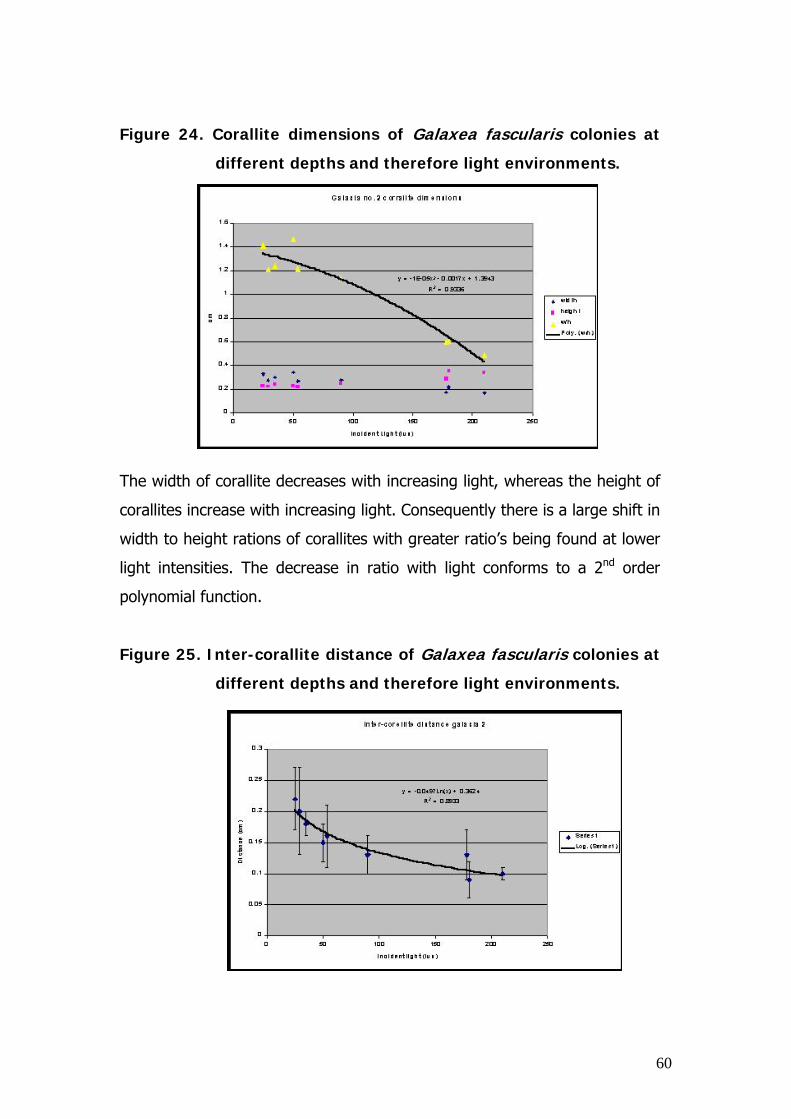
60
Figure 24. Corallite dimensions of Galaxea fascularis colonies at
different depths and therefore light environments.
The width of corallite decreases with increasing light, whereas the height of
corallites increase with increasing light. Consequently there is a large shift in
width to height rations of corallites with greater ratio’s being found at lower
light intensities. The decrease in ratio with light conforms to a 2nd order
polynomial function.
Figure 25. Inter-corallite distance of Galaxea fascularis colonies at
different depths and therefore light environments.

61
Inter-corallite distance decreases with increasing light intensity and
corallites become denser. This increase in density and decrease in inter-
corallite distance explains a 2nd order polynomial function.
3.1.4. Coral Reef Recovery Rates
Fig. 25 shows the effects of a bomb blast in 2001 on two large Porites
colonies in 2003. While significant areas of bleaching have recovered, the
colonisation by other species (soft corals etc.) has increased, implying that
the colony was placed under stress by the blast, and was at increased risk of
being opportunistically colonised. These results should inform environmental
educational policies and management in the Wakatobi Marine Park.
Figure 25. The response of Porites colonies to a blast event
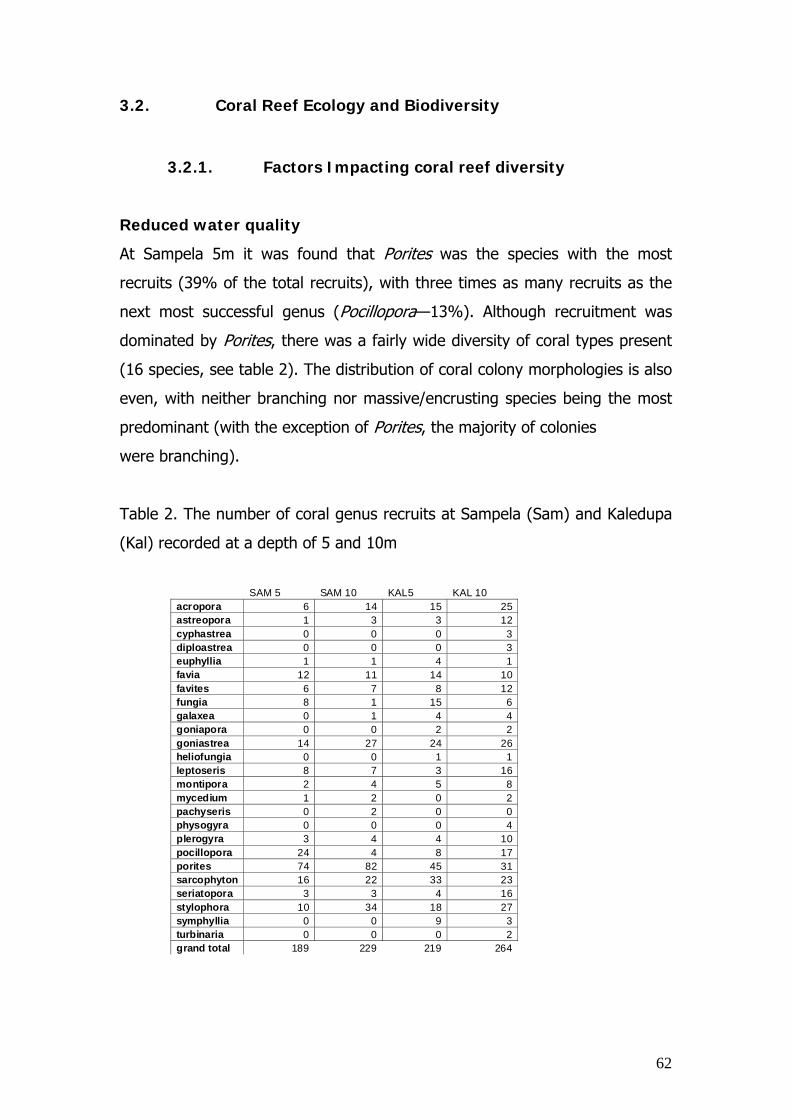
62
3.2. Coral Reef Ecology and Biodiversity
3.2.1. Factors Impacting coral reef diversity
Reduced water quality
At Sampela 5m it was found that Porites was the species with the most
recruits (39% of the total recruits), with three times as many recruits as the
next most successful genus (Pocillopora—13%). Although recruitment was
dominated by Porites, there was a fairly wide diversity of coral types present
(16 species, see table 2). The distribution of coral colony morphologies is also
even, with neither branching nor massive/encrusting species being the most
predominant (with the exception of Porites, the majority of colonies
were branching).
Table 2. The number of coral genus recruits at Sampela (Sam) and Kaledupa
(Kal) recorded at a depth of 5 and 10m
SAM 5 SAM 10 KAL5 KAL 10 acropora 6 14 15 25astreopora 1 3 3 12cyphastrea 0 0 0 3diploastrea 0 0 0 3euphyllia 1 1 4 1favia 12 11 14 10favites 6 7 8 12fungia 8 1 15 6galaxea 0 1 4 4goniapora 0 0 2 2goniastrea 14 27 24 26heliofungia 0 0 1 1leptoseris 8 7 3 16montipora 2 4 5 8mycedium 1 2 0 2pachyseris 0 2 0 0physogyra 0 0 0 4plerogyra 3 4 4 10pocillopora 24 4 8 17porites 74 82 45 31sarcophyton 16 22 33 23seriatopora 3 3 4 16stylophora 10 34 18 27symphyllia 0 0 9 3turbinaria 0 0 0 2grand total 189 229 219 264
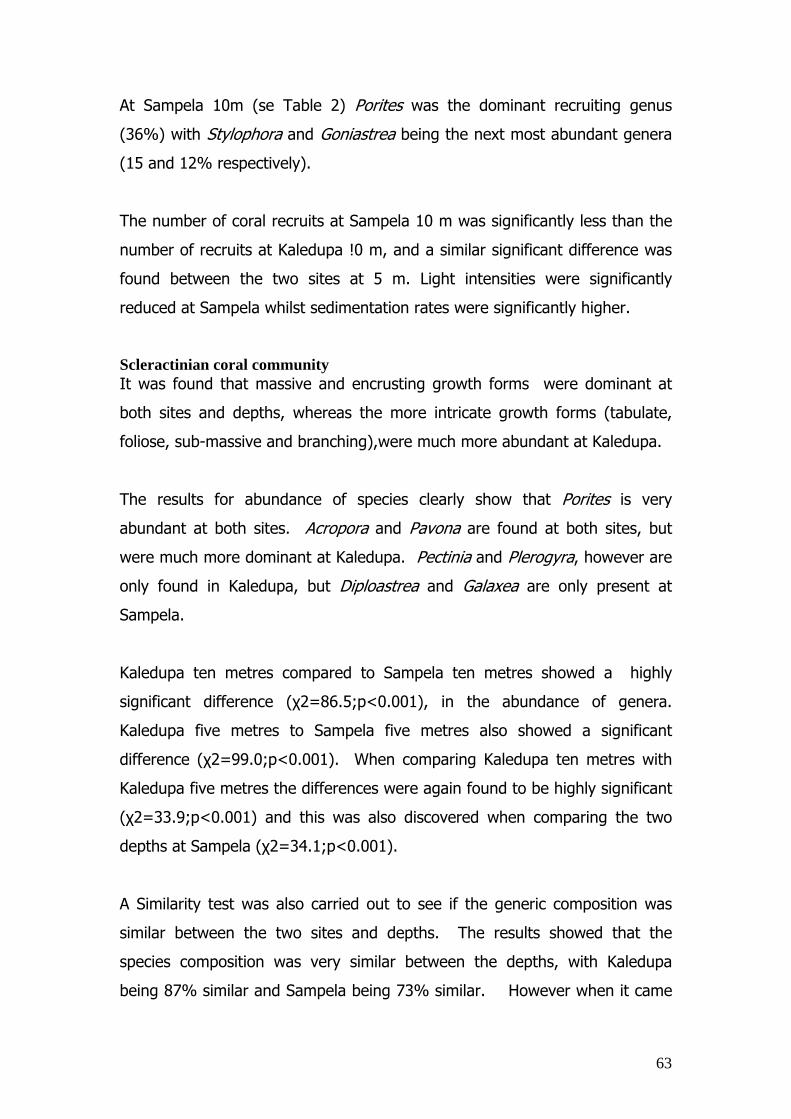
63
At Sampela 10m (se Table 2) Porites was the dominant recruiting genus
(36%) with Stylophora and Goniastrea being the next most abundant genera
(15 and 12% respectively).
The number of coral recruits at Sampela 10 m was significantly less than the
number of recruits at Kaledupa !0 m, and a similar significant difference was
found between the two sites at 5 m. Light intensities were significantly
reduced at Sampela whilst sedimentation rates were significantly higher.
Scleractinian coral community It was found that massive and encrusting growth forms were dominant at
both sites and depths, whereas the more intricate growth forms (tabulate,
foliose, sub-massive and branching),were much more abundant at Kaledupa.
The results for abundance of species clearly show that Porites is very
abundant at both sites. Acropora and Pavona are found at both sites, but
were much more dominant at Kaledupa. Pectinia and Plerogyra, however are
only found in Kaledupa, but Diploastrea and Galaxea are only present at
Sampela.
Kaledupa ten metres compared to Sampela ten metres showed a highly
significant difference (χ2=86.5;p<0.001), in the abundance of genera.
Kaledupa five metres to Sampela five metres also showed a significant
difference (χ2=99.0;p<0.001). When comparing Kaledupa ten metres with
Kaledupa five metres the differences were again found to be highly significant
(χ2=33.9;p<0.001) and this was also discovered when comparing the two
depths at Sampela (χ2=34.1;p<0.001).
A Similarity test was also carried out to see if the generic composition was
similar between the two sites and depths. The results showed that the
species composition was very similar between the depths, with Kaledupa
being 87% similar and Sampela being 73% similar. However when it came
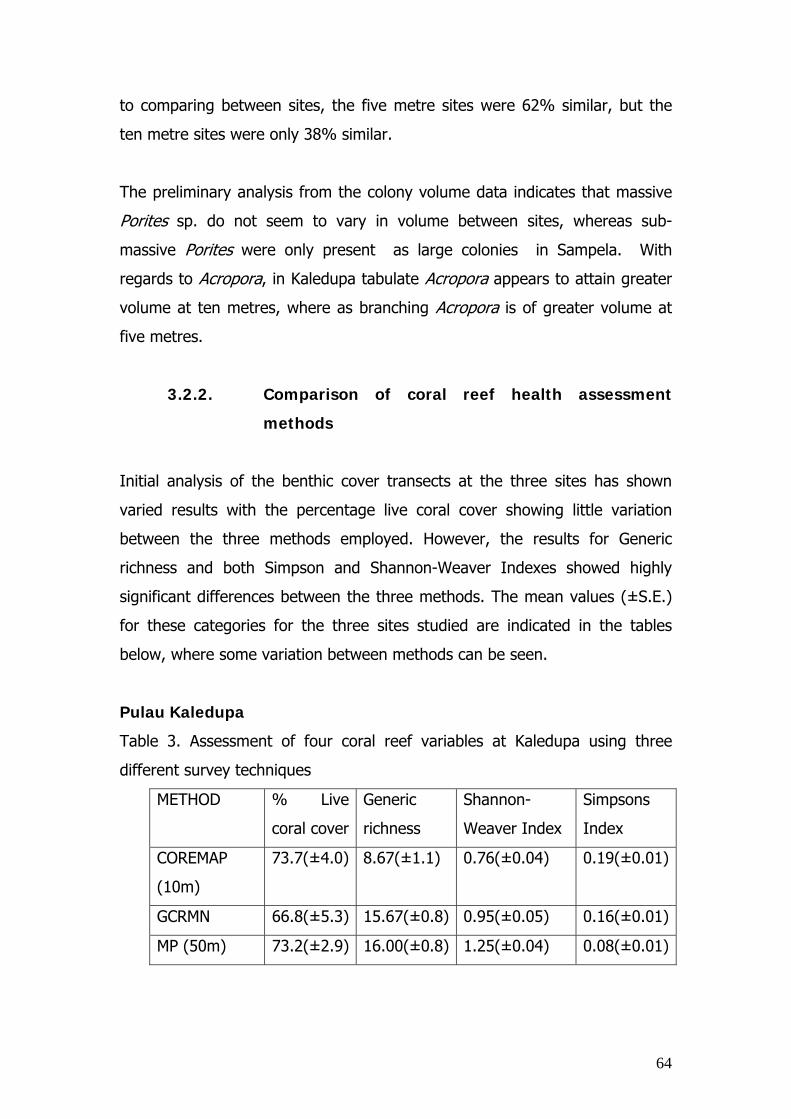
64
to comparing between sites, the five metre sites were 62% similar, but the
ten metre sites were only 38% similar.
The preliminary analysis from the colony volume data indicates that massive
Porites sp. do not seem to vary in volume between sites, whereas sub-
massive Porites were only present as large colonies in Sampela. With
regards to Acropora, in Kaledupa tabulate Acropora appears to attain greater
volume at ten metres, where as branching Acropora is of greater volume at
five metres.
3.2.2. Comparison of coral reef health assessment
methods
Initial analysis of the benthic cover transects at the three sites has shown
varied results with the percentage live coral cover showing little variation
between the three methods employed. However, the results for Generic
richness and both Simpson and Shannon-Weaver Indexes showed highly
significant differences between the three methods. The mean values (±S.E.)
for these categories for the three sites studied are indicated in the tables
below, where some variation between methods can be seen.
Pulau Kaledupa
Table 3. Assessment of four coral reef variables at Kaledupa using three
different survey techniques
METHOD % Live
coral cover
Generic
richness
Shannon-
Weaver Index
Simpsons
Index
COREMAP
(10m)
73.7(±4.0) 8.67(±1.1) 0.76(±0.04) 0.19(±0.01)
GCRMN 66.8(±5.3) 15.67(±0.8) 0.95(±0.05) 0.16(±0.01)
MP (50m) 73.2(±2.9) 16.00(±0.8) 1.25(±0.04) 0.08(±0.01)

65
It can be seen in Table 3 that there is no significant difference in estimation
of live coral cover between the three methods. However, very highly
significant differences (F2,15=21.24;p<0.001) were observed when using the
three methods to estimate the Generic richness of the site. Tukey Post-hoc
tests confirmed that there was significant difference between the COREMAP
method (p<0.001) and the other two methods, between which there was no
difference. When diversity indexes were calculated for the Kaledupa site, the
different survey methods gave varied results. There was a very highly
significant difference (F2,15=72.16;p<0.001) between the three methods when
calculating the Shannon-Weaver Index, with post hoc tests suggesting the
differences were significant (p<0.001) between all three methods, with the
monitoring program giving the highest diversity value, followed by the
GCRMN method and the lowest diversity scores were those calculated from
the COREMAP method. Again significant differences (F2,15=32.04;p<0.001)
were found in the results of Simpsons diversity index when calculated from
data collected by the three different methods, although here, post hoc tests
found no significant difference between the COREMAP and GCRMN method,
but the monitoring program method was significantly different (p<0.001) to
the other two methods, giving lower vales indicating higher diversity.
No Take Area (Pulau Hoga)
Table 4. Assessment of four coral reef variables within the No Take Area
using three different survey techniques
METHOD % Live
coral cover
Generic
richness
Shannon-
Weaver Index
Simpsons
Index
COREMAP
(10m)
52.8(±11.5) 6.33(±1.20) 0.73(±0.05) 0.18(±0.04)
GCRMN 49.0(±7.4) 12.17(±1.64) 0.82(±0.05) 0.22(±0.02)
MP (50m) 71.2(±2.6) 15.50(±0.85) 1.21(±0.03) 0.09(±0.01)
It can be seen in Table 4 that there is no significant difference in estimation
of live coral cover between the three methods. However, very highly

66
significant differences (F2,15=13.3;p<0.001)were observed when using the
three methods to estimate the Generic richness of the site. Tukey Post-hoc
tests confirmed that there was significant difference between the COREMAP
method (p<0.05) and the GCRMN method, The significance of the variation
increased between the COREMAP an MP methods (p<0.001), however, there
was no identifiable difference between the GCRMN and MP methods. When
diversity indexes were calculated for the No Take Area site, the different
survey methods gave varied results. There was a very highly significant
difference (F2,14=34.5;p<0.001) between the three methods when calculating
the Shannon-Weaver Index, with post hoc tests suggesting the differences
were significant (p<0.001) between the monitoring program and the other
two methods, but with no discernable difference between the COREMAP and
GCRMN method, with the MP method giving the highest diversity value,
followed by the GCRMN method and the lowest diversity scores were those
calculated from the COREMAP method. Again significant differences
(F2,14=8.91;p<0.01) were found in the results of Simpsons diversity index
when calculated from data collected by the three different methods, although
here, post hoc tests found no significant difference between the COREMAP
and GCRMN method, but the monitoring program method was significantly
different (p<0.01) to the GCRMN method and also significantly different to
the COREMAP method (p<0.05), again with the MP method giving lower vales
indicating higher diversity.
Sampela
Table 5. Assessment of four coral reef variables adjacent to Sampela
Bajo village using three different survey techniques
METHOD % Live
coral cover
Generic
richness
Shannon-
Weaver Index
Simpsons
Index
COREMAP
(10m)
30.5(±5.6) 6.5(±0.9) 0.70(±0.05) 0.16(±0.03)
GCRMN 28.2(±3.6) 10.7(±0.8) 0.89(±0.03) 0.14(±0.02)
MP (50m) 53.3(±4.4) 12.9(±1.2) 1.15(±0.02) 0.11(±0.01)
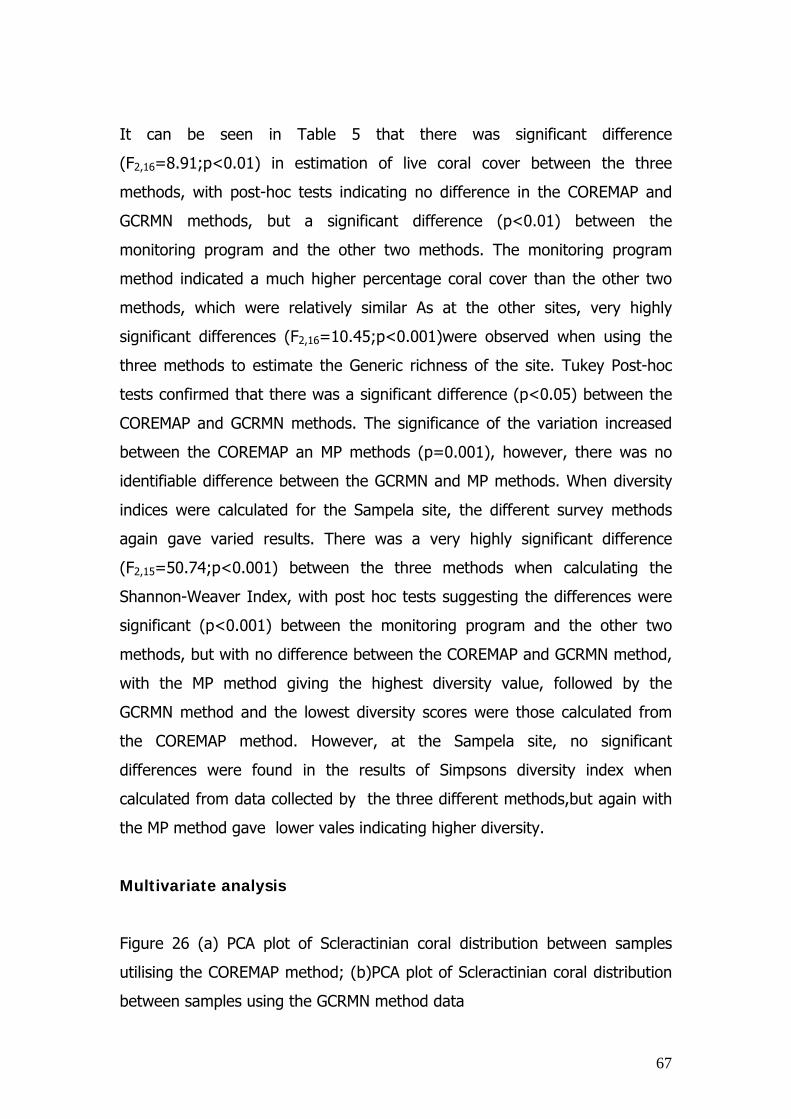
67
It can be seen in Table 5 that there was significant difference
(F2,16=8.91;p<0.01) in estimation of live coral cover between the three
methods, with post-hoc tests indicating no difference in the COREMAP and
GCRMN methods, but a significant difference (p<0.01) between the
monitoring program and the other two methods. The monitoring program
method indicated a much higher percentage coral cover than the other two
methods, which were relatively similar As at the other sites, very highly
significant differences (F2,16=10.45;p<0.001)were observed when using the
three methods to estimate the Generic richness of the site. Tukey Post-hoc
tests confirmed that there was a significant difference (p<0.05) between the
COREMAP and GCRMN methods. The significance of the variation increased
between the COREMAP an MP methods (p=0.001), however, there was no
identifiable difference between the GCRMN and MP methods. When diversity
indices were calculated for the Sampela site, the different survey methods
again gave varied results. There was a very highly significant difference
(F2,15=50.74;p<0.001) between the three methods when calculating the
Shannon-Weaver Index, with post hoc tests suggesting the differences were
significant (p<0.001) between the monitoring program and the other two
methods, but with no difference between the COREMAP and GCRMN method,
with the MP method giving the highest diversity value, followed by the
GCRMN method and the lowest diversity scores were those calculated from
the COREMAP method. However, at the Sampela site, no significant
differences were found in the results of Simpsons diversity index when
calculated from data collected by the three different methods,but again with
the MP method gave lower vales indicating higher diversity.
Multivariate analysis
Figure 26 (a) PCA plot of Scleractinian coral distribution between samples
utilising the COREMAP method; (b)PCA plot of Scleractinian coral distribution
between samples using the GCRMN method data
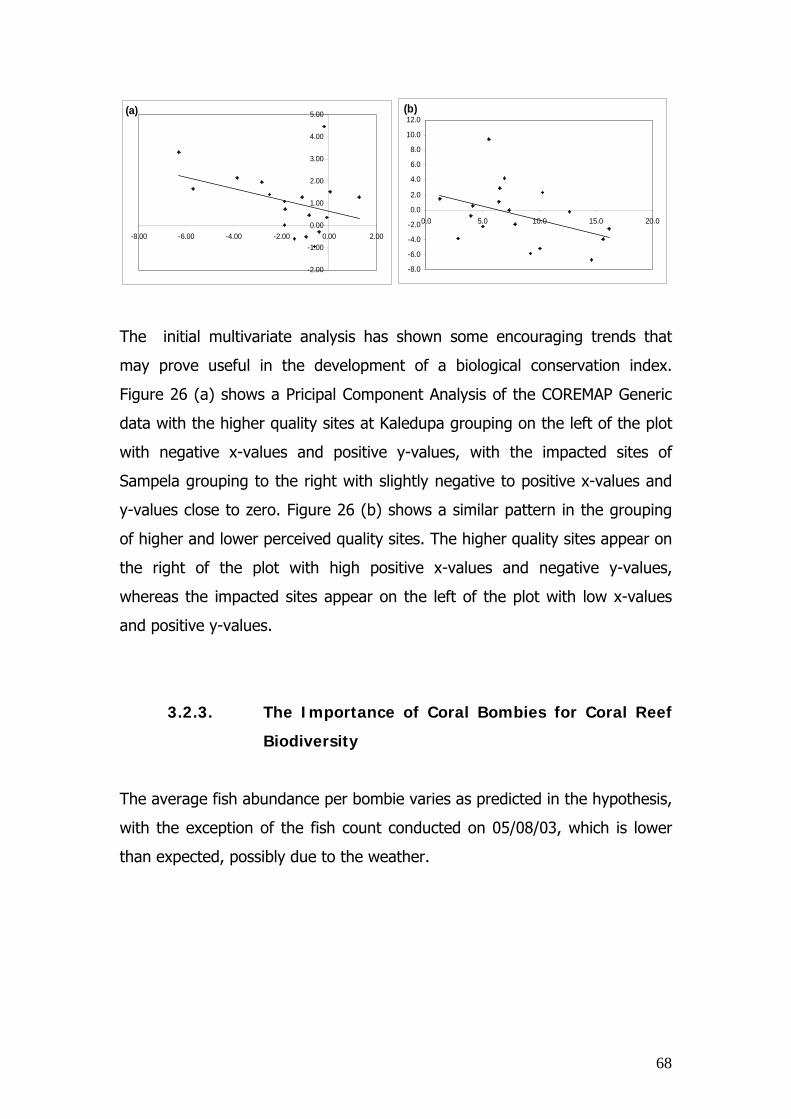
68
(a)
-2.00
-1.00
0.00
1.00
2.00
3.00
4.00
5.00
-8.00 -6.00 -4.00 -2.00 0.00 2.00
(b)
-8.0
-6.0
-4.0
-2.0
0.0
2.0
4.0
6.0
8.0
10.0
12.0
0.0 5.0 10.0 15.0 20.0
The initial multivariate analysis has shown some encouraging trends that
may prove useful in the development of a biological conservation index.
Figure 26 (a) shows a Pricipal Component Analysis of the COREMAP Generic
data with the higher quality sites at Kaledupa grouping on the left of the plot
with negative x-values and positive y-values, with the impacted sites of
Sampela grouping to the right with slightly negative to positive x-values and
y-values close to zero. Figure 26 (b) shows a similar pattern in the grouping
of higher and lower perceived quality sites. The higher quality sites appear on
the right of the plot with high positive x-values and negative y-values,
whereas the impacted sites appear on the left of the plot with low x-values
and positive y-values.
3.2.3. The Importance of Coral Bombies for Coral Reef
Biodiversity
The average fish abundance per bombie varies as predicted in the hypothesis,
with the exception of the fish count conducted on 05/08/03, which is lower
than expected, possibly due to the weather.

69
3.2.4. The influence of habitat and fishing pressure on
grouper distribution and abundance
Preliminary statistical analysis suggests a significant difference in the
abundance of groupers inside (Mean No = 7.4, see figure 28a ) and outside
the No Fishing Zone (Mean No = 3.8 see figure 28b), the site of low reef
quality and high fishing pressure had much lower abundance (Mean No =
1.25).
Figure 28. The size frequency distribution of Grouper species inside (a) and
inside (b) the No Take Area
A.

70
B.
The species diversity was also higher in the No Fishing Zone. Size data shows
similar proportions of smaller groupers (size cat 5-15cm) inside and outside
the No Fishing Zone but there were greater numbers of larger groupers in the
No Fishing Zone suggesting a more mature grouper population. There were
no groupers recorded above 35cm in the fishing zone compared with 5% in
the No Fishing Zone. The largest groupers recorded at Sampela were 25cm.
Abundance of Honeycomb groupers on the reef flats was similar between the
No Fishing Zone and fished area but significantly less abundant at Sampela,
this is in line with fishery surveys suggesting more spear fishing close to
Sampela whereas the fishing around Hoga is principally located over the reef
slopes and walls using hook and lines.
Habitat at a large spatial scale was found to be species specific, however
digital images of micro-habitat are as yet un-processed The honeycomb
groupers tend to be located on the reef flat whilst peacock groupers were
almost exclusively found on the crest.
3.2.5. The distribution, diversity, abundance and shell
use of the hermit crabs of Hoga Island
Due to the shear volume of results obtained during this study it has not been
possible to analyze them fully. Basic analysis found little variation in inter-tidal
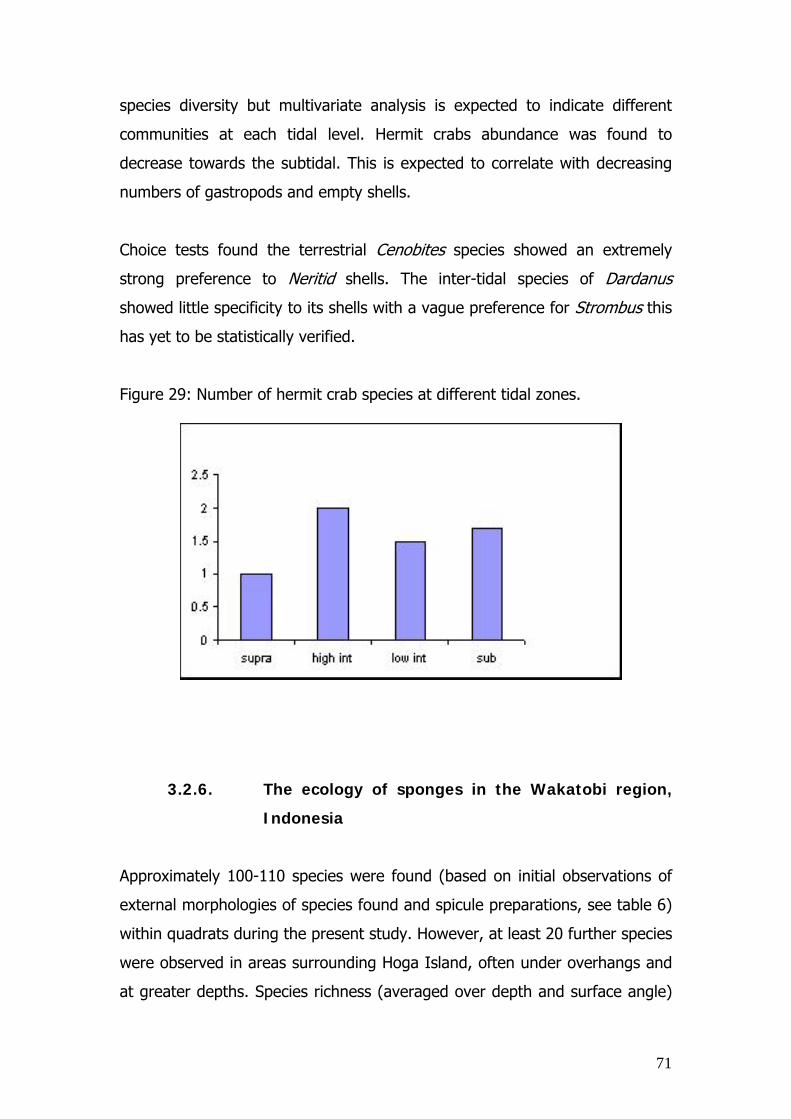
71
species diversity but multivariate analysis is expected to indicate different
communities at each tidal level. Hermit crabs abundance was found to
decrease towards the subtidal. This is expected to correlate with decreasing
numbers of gastropods and empty shells.
Choice tests found the terrestrial Cenobites species showed an extremely
strong preference to Neritid shells. The inter-tidal species of Dardanus
showed little specificity to its shells with a vague preference for Strombus this
has yet to be statistically verified.
Figure 29: Number of hermit crab species at different tidal zones.
3.2.6. The ecology of sponges in the Wakatobi region,
Indonesia
Approximately 100-110 species were found (based on initial observations of
external morphologies of species found and spicule preparations, see table 6)
within quadrats during the present study. However, at least 20 further species
were observed in areas surrounding Hoga Island, often under overhangs and
at greater depths. Species richness (averaged over depth and surface angle)

72
showed little variability between Sampela and Hoga Island, with
approximately 70-80 species being found at both sites.
Even though species richness values indicate similar levels of biodiversity at
both Sampela and Hoga Island, the results of Bray-Curtis similarity analysis
and subsequent ordination using MDS indicates clear differences between the
sponge assemblages within these two sites (Figure 30) and between the two
sites (Figure 31). Within site differences are characterised by different
assemblages with increased depth, such that sponges found on the reef crest
differ from those found at 6m, which intern differ from those at 12 m and 18
m at Sampela and Hoga respectively. However, little difference was found
between surface types within each depth zone at either site (Figure 31).
Table 6. Sponge species richness for global sponge assemblages
(from where data is available). Data is taken for similar sized
sampling areas (approximately 20-30 m2) between 0-18m depth.
Location Species
Richness Source
Indonesia (Wakatobi) 100-120 Bell (unpublished)
Cuba (Havana) 80 Alcollado (1990)
Ireland (Lough Hyne) 77 Bell and Barnes (2000)
Mozambique (Quirimba) 73 Bell and Barnes (2000)
Southern Florida 43 Schmahl (1990)
Antarctica (Signy) 19 Bell and Barnes (2000)
Panama (San Blas) 17 Bell and Barnes (2000)
Venezuela 15 Diaz et al. (1990)
Britain (Sussex) 12 Bell and Barnes (2000)
Ireland (Cork) 13 Bell and Barnes (2000)
Cape Verde (Sal) 9 Bell and Barnes (2000)

73
Figure 30. A Multi-Dimensional Scaling Plot (MDS) of sponge
assemblages at different depths at Sampela (SA) and B3 (B) on
vertical (V), inclined (I) and horizontal surfaces. Dotted lines
indicate separation between sponge assemblages at Samepla and
Bouy 3 (Hoga).
Figure 31. A Multi-Dimensional Scaling Plot (MDS) of sponge
assemblages at different depths at Sampela (SA) and B3 (B) on
vertical (V), inclined (I) and horizontal surfaces. Dotted lines
indicate separation between sponge assemblages at different
depths Samepla and Bouy 3 (Hoga).

74
3.2.7. Cleaner wrasse
Bluesteak Cleaner Wrasse Labroides dimidiatus Behaviour
The data has not yet been analysised and the following represents a brief
description of the major findings only. The majority of the time the juveniles
(also referred to as “wigglers” ) advertise and clean. They stay with in a
small territory, approximately 1m2. Sub-adults spend the majority of there
time actively seeking out clients and then cleaning them. They spend
significantly less time advertising. The cover a much larger range than
juveniles. Adultsactively and continuously patrol their cleaning range. This is a
solitary and group behaviour and therefore have more social interaction than
other life stages. They territories cover a relatively large area compared to
other life stages. Generally they did not spend any time cleaning individuals
which were of smaller size than the themselves.
The effect of stripe contrast on the attractiveness of Labroides
dimidatus
There was a significant difference in the number of interactions that took
place with the different models (see figure 32).
Figure 32. The number of interaction clients had with the different models

75
3.2.8. Butterflyfish as Coral Reef Indicators: Study into
the Relationship between Chaetodontidae species
and Coral Reefs around Hoga Island
Coral Cover was highest within the reef crest of Hoga No Take area (B3), this
site showed the highest number of corallivore butterfly species, whereas
Sampela with the lowest level of Coral Cover had the lowest abundance of
coralivores. Three independent studies looked at the abundance of
corallivores relative to coral cover, the first study utilized 30m transects and
three repeats whilst the second used 50m transects and four repeats. The
first study (figure 33) found a strong indication of the corallivores dependence
on the coral reef whist the second found no significant evidence of such a
relationship, data from the third study is as yet un-analysed. Further analysis
utilising multivariate MDS will aim to shed further light on these trends.
Regression analysis examined the relationship between coral cover and
corallivore butterflyfish abundance (see fig 33):
Fish Abundance = 0.46 +0.11 * coral cover
r2 = 0.64, p < 0.05
Analysis of data on behaviour is as yet incomplete, but preliminary ANOVA
analysis suggests that aggressive behaviour is significantly greater at Sampela
(low Coral Cover and high human disturbance) than other sites of lower
human impacts.
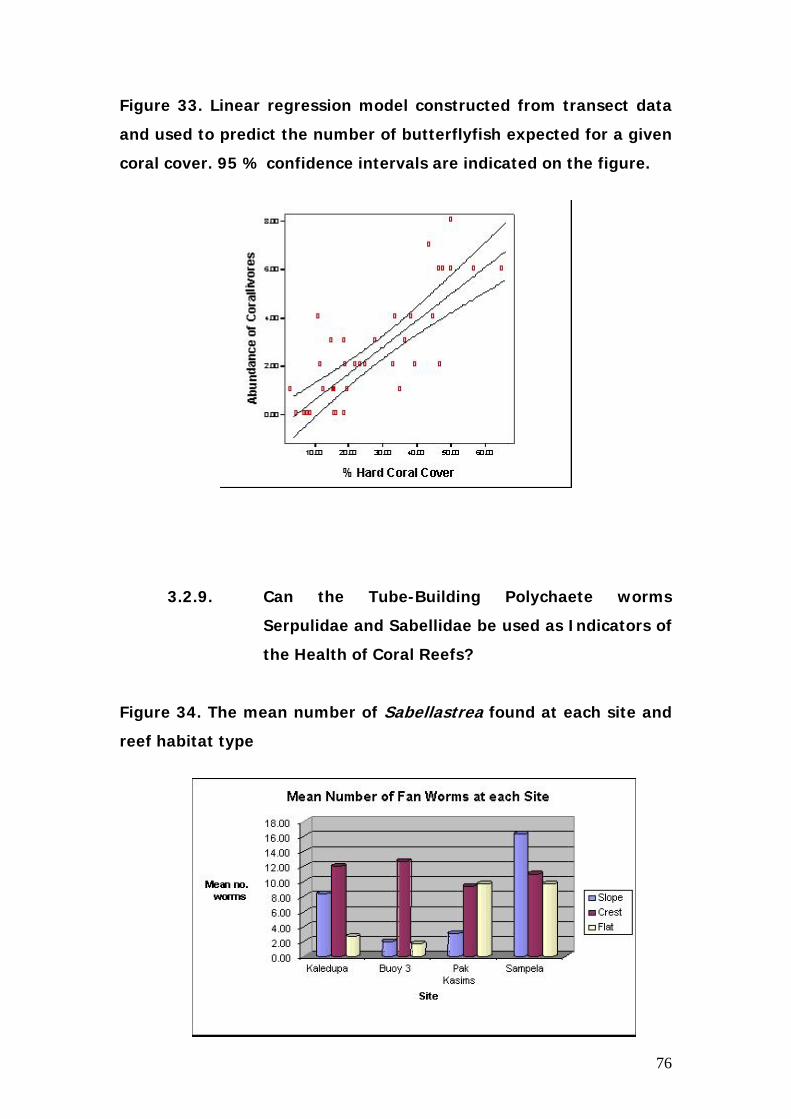
76
Figure 33. Linear regression model constructed from transect data
and used to predict the number of butterflyfish expected for a given
coral cover. 95 % confidence intervals are indicated on the figure.
3.2.9. Can the Tube-Building Polychaete worms
Serpulidae and Sabellidae be used as Indicators of
the Health of Coral Reefs?
Figure 34. The mean number of Sabellastrea found at each site and
reef habitat type

77
There was a significant difference in the number of individuals recorded at
each site. Generally higher numbers were found at Sampela, and significantly
so at the reef slope. There was no significant difference in the numbers
observed at each site on the reef crest, but there was on the reef flats with
Pak Kasims and Sampela having significantly higher numbers than the other
two sites.
Figure 35. The mean number of Spirobranchius found at each site
and reef habitat type
In contrast to Sabellastrea, Spirobranchius densities were lowest at Sampela
and were maximal at the reef flat habitats at the Hoga No Take Area (B3) and
Pak Kasims which resulted in a significant difference between site and habitat
type (see fig 35).
3.2.10. The abundance and diversity of Nudibranchs on reefs of
the study area
21 species where found over the 3 sites and a total of 67 individuals was
recorded in the transects. The diversity of Nudibranchs was lowest at
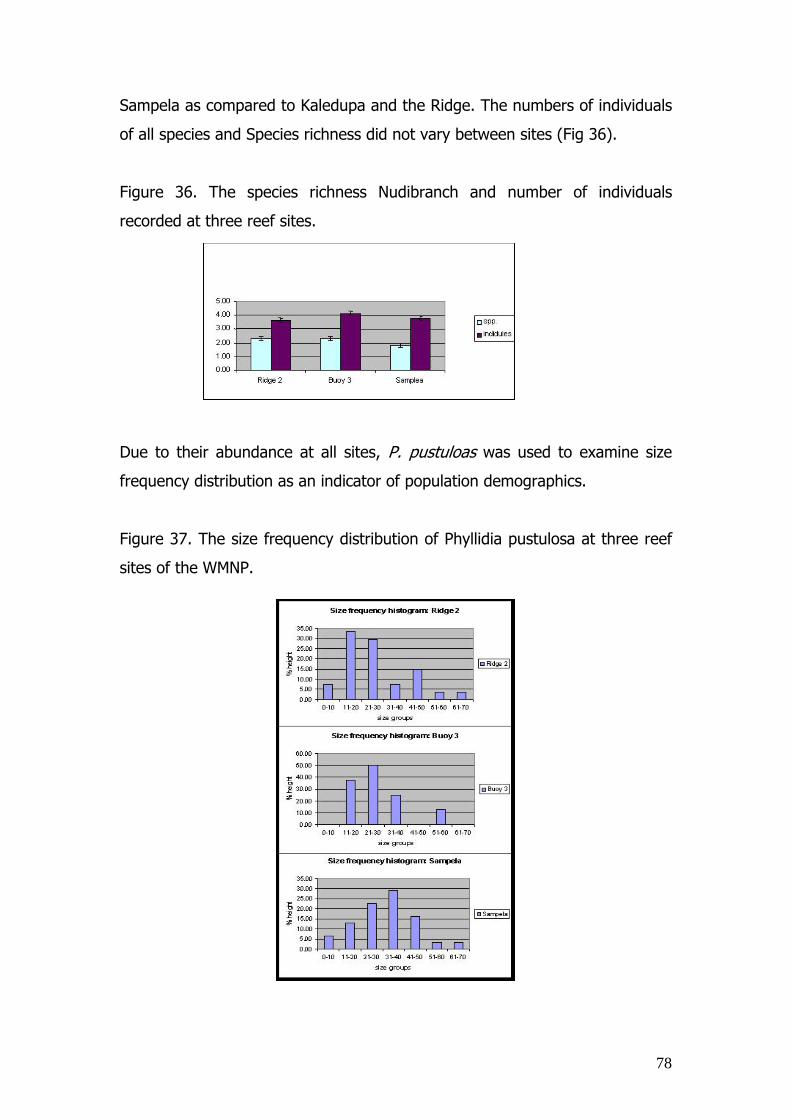
78
Sampela as compared to Kaledupa and the Ridge. The numbers of individuals
of all species and Species richness did not vary between sites (Fig 36).
Figure 36. The species richness Nudibranch and number of individuals
recorded at three reef sites.
Due to their abundance at all sites, P. pustuloas was used to examine size
frequency distribution as an indicator of population demographics.
Figure 37. The size frequency distribution of Phyllidia pustulosa at three reef
sites of the WMNP.
79
The size frequency distribution and therefore probably the age structure
varies with sight. The population structure has implications for the
recruitment potential of this species which is also therefore sen to vary
between sites.
3.3. Mangrove Ecology
3.3.1. The diversity and exploitation rates of Mangrove
in the eastern part of the study area
A semi-quantitative study and quantitative study was initiated during 2003.
Data from the quantitative study is yet to be analysed and the following
represents preliminary observations only.
Five sites were examined and the results showed that there was a clear
difference between the number of mangrove species inhabiting mangrove of
the five different sites. Two of the sites only had two species and the most
species richness had 7 species of mangrove. Exploitation rates, as determined
by the number of cut down tress and signs of harvesting also varied between
sites, with the Mangrove site situated behind the village of Sampela being
most exploited area. The number of seedlings and propagule’s observed in
each site also varied suggesting that the recovery potential of mangrove
varied between sites. The number of invertebrates associated with the
mangrove also varied significantly, being much reduced in the sites which also
showed signs of mangrove tree exploitation.
3.3.2. Habitat specificity and resource utilization of a
fiddler crab assemblage
Data from the quantitative study is yet to be analysed and the following
represents preliminary observations only.
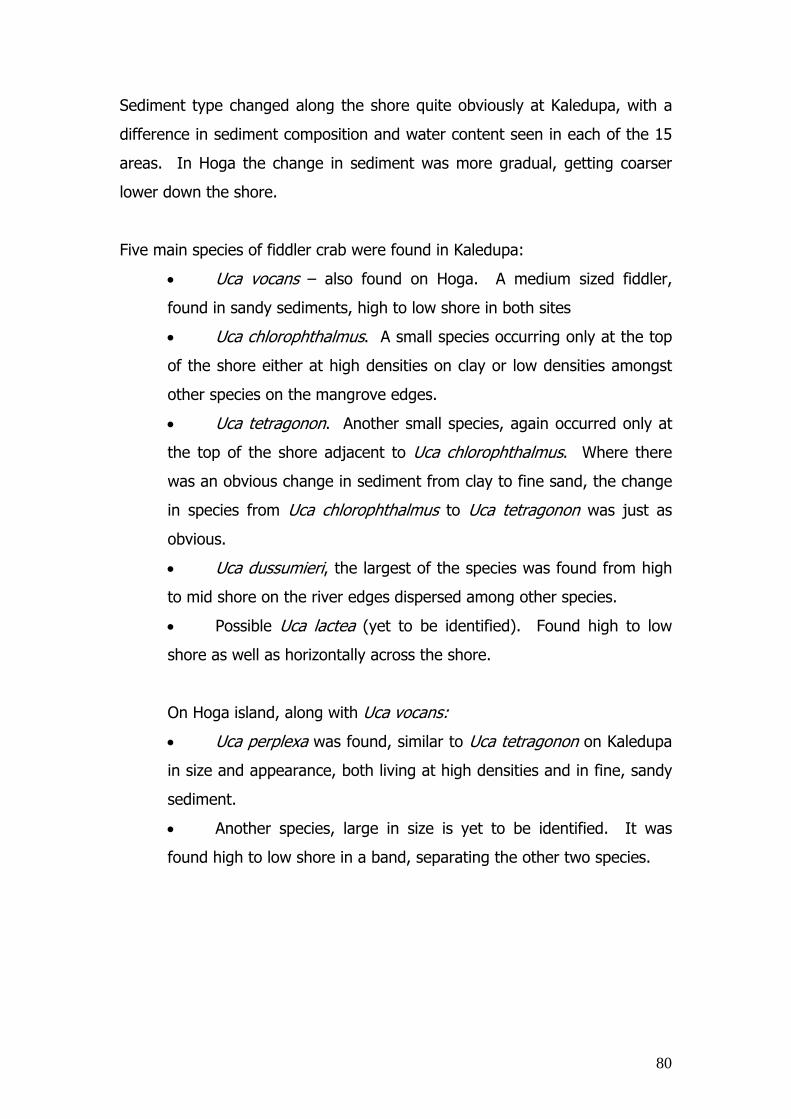
80
Sediment type changed along the shore quite obviously at Kaledupa, with a
difference in sediment composition and water content seen in each of the 15
areas. In Hoga the change in sediment was more gradual, getting coarser
lower down the shore.
Five main species of fiddler crab were found in Kaledupa:
• Uca vocans – also found on Hoga. A medium sized fiddler,
found in sandy sediments, high to low shore in both sites
• Uca chlorophthalmus. A small species occurring only at the top
of the shore either at high densities on clay or low densities amongst
other species on the mangrove edges.
• Uca tetragonon. Another small species, again occurred only at
the top of the shore adjacent to Uca chlorophthalmus. Where there
was an obvious change in sediment from clay to fine sand, the change
in species from Uca chlorophthalmus to Uca tetragonon was just as
obvious.
• Uca dussumieri, the largest of the species was found from high
to mid shore on the river edges dispersed among other species.
• Possible Uca lactea (yet to be identified). Found high to low
shore as well as horizontally across the shore.
On Hoga island, along with Uca vocans:
• Uca perplexa was found, similar to Uca tetragonon on Kaledupa
in size and appearance, both living at high densities and in fine, sandy
sediment.
• Another species, large in size is yet to be identified. It was
found high to low shore in a band, separating the other two species.
81
3.3.3. Releasers of Behaviour of the Major Cheliped in
Uca vocans and Uca dussumieri
From preliminary comparisons of single variables, colour and size, in one
species it can been said that the smaller claws show a more aggressive
response in comparison to bigger claws that show a retreating response. This
is also the case when looking at colour; the orange claws elicited an
aggressive response where the red claws elicited a retreat response. This is
not taking int o account the shape of movement of the claw or the possible
interactions between the four variables.
Full analysis will be carried out to determine if there is a significant result and
test for an interaction between the variables. In addition to this comparisons
will be made between the two species tested.
82
4.0. DISCUSSION AND CONCLUDING REMARKS
4.1. CORAL REEF DYNAMICS
4.1.1. Coral Reef Monitoring Programme
During 2002 the coral reef monitoring was successfully established. A total
number of 257 species of scleractinian coral and 420 species of fish and
consequently, although on 12 sites were examined, the Wakatobi is an area
of extreme coral reef biodiversity. The coral studies showed that the majority
of reefs studies were in a good conditions and even the most impacted sites
were still within the average category as defined by LIPI.
Multivariate analysis proved to be a useful tool in examining the similarities
between sites and also in examining the major features of benthic
characteristics that are important in influencing fish community structure and
therefore reef productivity. Multivariate analysis will also be able to be used
on community data collected over success years and shifts in community
structure will be able to be clearly identified and related to management
procedures. The factors that have been shown to most influence fish
community structure could be further used in multiple regression techniques
and models produced to predict the rates of change that would be expected
for reefs subjected to varying degrees of management and consequently such
detailed data could be used as management performance criteria.
Despite the fact that transects were examined in exactly the same place in
2003 as in 2002, the results obtained for the sites so far analysised were very
different. Fish abundance seems to be much higher in 2003 compared to
2002, and the greatest positive difference was seen in the Hoga No Take
Area, perhaps proving the benefits of such strictly protected areas in
conserving fish productivity.
83
Coral coverage, itself an important criteria for a healthy reef system, also
varied between years but not for each site or reef habitat type. Coral
coverage on the reef slope and crest was not significantly different between
years. However there was a large difference (approximately 30 %, see Fig 12
c) in live coral cover at the Hoga reef flat between successive years. This
decrease was due to a large die off of some of the branching Acropora
colonies, which look most likely due to either disease or coralivores activity
(possibly the Crown of Thorns Starfish).
The amount of dead coral also varied significantly between years for all
habitat types and was most marked at Sampela and in particular, the Hoga
reef flats. Algal cover was no significantly different ant the reef slopes but
had decreased on the reef crests.
Further analysis will be undertaken once on all data and rates of change in
important criteria compared between sites and perhaps normalised against
“natural” rates of change at represented by the Hoga No Take Area, as this
site is not subjected to human exploitation and theoretically should represent
natural and perhaps stochastic events.
4.1.2. Reef Check Surveys
Reef check is a global initiative that allows relatively inexperienced divers to
examine the health of coral reef systems and the level of human exploitation.
The project is coordinated from a base at the University of Californian and
gathers data on coral reefs across the globe.
Although not as detailed as the monitoring programme outlined in section 1.1,
Reef check surveys are required around the study area, so that the reefs of
the study area can easily and rapidly be compared to the large number of
sites included within the global Reef Check survey. This work is part of the 7th
Global Survey of Coral Reefs with more than 40 countries and around 400
similar teams participating to produce an annual assessment of global coral
reef health.

84
The data collected this years, agrees, in general, with the data collected as
part of the monitoring programme and identifies Sampela as being an
exploited reef site. The Reef Check data will be directly compared to the
monitoring data to determine the resolution of Reef Check in identifying
exploited and otherwise impacted reefs of the Wakatobi. Data collected
throughout the Reef Check surveys will be submitted to Reef Check
Headquarters.
4.1.3. Coral Reef Growth and Recruitment Rates
Favia is a common genera of scleractinian coral which is abundant at all
sites around the study area. Initial analysis of the growth rate data suggests
a rate of growth of 3 – 5 mm year which is in the range of data reported for
other massive coral species. We need to increase our understanding of
specieis specific growth rates which will vary amongst sites. Such data is
invaluable when the fate of coral reefs, under varying environmental
conditions, is needed to be ascertained. The natural dynamics of reefs,
including growth and recruitment rate, is needed to be understood if most
appropriate management procedures are to be instigated. Also, as seen in
this study, growth rates of massive corals are sensitive to environmental
conditions and could consequently be used to examine the annual quality of
reef systems and perhaps a performance criteria for the success of
management.
Astreopora, another common massive coral genus, supports this hypothesis
as rates of growth were not highly variable within a reef site but did vary
significantly between sites (see fig 23), with growth rates been restricted in
the light-limited reef as compared to other reef systems. The restricted
growth was by some 30 % and such percentage differences could be used
as performance criteria and also used to identify those sites most at threat.

85
It is not only coral growth that is effected by light environments. The ways
in which a coral colony distributed its resources is also light dependant.
Such a scenario was observed for the studies carried out on Galaxea
colonies, at smaller but more densely packed corallites were produced under
high light environments. Such a strategy, or conversely, a reduction of
corallite density and n increase in corallite size, could be a phenotypic
adaptation to limited light or increased sedimentation rates. Further
investigations are required on how coral colonies react to varying
environmental conditions. This is also another important piece of
information that could be used by coral reef managers wishing to gain a
long term picture of reef quality rather than a snap shot view over the time
scale of biological investigations. Also detailed data on how coral colonies
are influenced by environmental conditions can be used in the field of paleo-
biology when fossilised (perhaps from as little at 10 – 50 years ago) can be
examined and conditions of the reefs during the time of fossilised coral
active growth inferred by the structure of the now fossilised coral. Perhaps a
time-line in the changes of environmental conditions could be produced to
answer such questions as When did the Sampela Reef Wall start to degrade,
was it at the time at which Sampela bringing about a change in water
quality? Such information would be of use to coral reef managers who need
to predict how reefs will respond to changing environmental conditions
which could be brought about by increases in local population sizes and
local landuse.
4.1.4. Coral Reef Recovery Rates Despite the fact that the reefs of the WMNP are protected, there is still a high
frequency of blast fishing occurring within the park. Blast fishing is an
extremely destructive and non-sustainable commercial fisheries technique.
The physical damage caused to the reef by a blast event is obvious to see by
the total destruction of topographic features and the production of bomb
craters. The longer-terms more chronic influences of blast fishing are however
a lot less obvious and consequently the actual damaged caused by blast
86
fishing is often underestimated. This study examined how colonies, that are
not physically destroyed by the blast, are affected. It is clear from the results
obtained that colonies are adversely affected, and that blast fishing brings
about colony bleaching in corals located up to 20 m away from the blast
event. In some cases the bleaching causes colony mortality, but the results
from this study did indicated that colonies can recover although the extent of
recovery does vary. It seems likely that in some case, the physically affect of
blasting and resulting bleaching allows opportunistic species to invade coral
colonies, settle and eventually outgrow the colony leading eventually to
reducing colony growth rates and topographic diversity.
An interesting result obtained from this study was that it is not just the side of
the colony facing the blast that is affected. The opposite side of the colony
also shows bleaching indicating the presence of a mechanism that can bring
about bleaching at the time of stress. The most likely candidate at the center
of such a mechanism is a heat shock protein, however further laboratory
based investigations would be needed to prove this. It does pose however,
the potential for an environmental forensic tolls which could be used to
examine the actual impact of blasting on colonies which, perhaps do not show
physical signs of impact.
Further investigations and repeated surveys of blasted sites will be instigated
during the 2004 season to examine the long term affects of chronic damage
cased by blasting, and the ecological succession of species within blast
craters. Blast fishing is a big problem, and besides incentives being offered to
stop destructive fishing such as alternative income streams, information
collected on the devastating, long term and wide ranging effects blast fishing
has on coral reef communities could be used to a positive effect in local
environmental awareness projects.

87
4.2. CORAL REEF BIODIVERSITY AND ECOLOGY
4.2.1. Factors Impacting coral reef diversity The two sites at Sampela and Kaledupa are of a markedly differing physical
nature. One is a reef which would appear to be heavily impacted by
sedimentation, and the other seems to be a pristine reef with little
sedimentation and good levels of light intensity, so it could be expected that
the sites would show a substantial difference in both the amount of coral
recruits found and in the diversity of species found at the two sites. This,
however, is not the case. There are differences in the number of recruits and
the number of species present but these differences are small. The same
species seem to dominate at both sites, whether affected by sediment or not,
indeed depth appears to be a contributing factor on the number of species
present, with the deeper study areas at both sites being the most diversely
populated.
Exact assumptions regarding the effects of sedimentation on the recruitment
of corals cannot be made at this time, but by examining the light intensity
levels it can be seen that the greatest horizontal light intensities can be found
at the deeper depth of 10m. This suggests that any suspended sediment
present is at a lower level than at 5m, where it is more likely to be held in
suspension by the action of currents and waves.
The two sites differ greatly in the substrate on which coral has the
opportunity to grow. Kaledupa is a solid rock formation with a flat sandy/rock
reef top. Sampela however is a reef of a degraded nature, with large areas of
either sand or rubble. This variation in substrate type and the similarity of
species and numbers of recruits present shows that the species present must
be highly adaptable to varying conditions. At Kaledupa for example, the good
conditions for coral recruitment mean that the species which wish to be
successful must be highly competitive. From looking at the distribution of the
species present at the two sites and four depths, we can conclude that certain

88
species are able to withstand the effects of sedimentation and competition
better than others, Porites , Galaxea and Diploastrea for example.
An important factor which also needs to be taken into account is the varying
growth rates of coral recruits under varying conditions. Crabbe & Smith
(2002) studied the reefs at Kaledupa and Sampela over three generations of
coral recruits and found that the radial growth rates of non branching corals
were significantly lower at Sampela than they were at Kaledupa. Crabbe &
Smith concluded that the coral community at Sampela is severely impacted by
depositing sediments which can lead to the suffocation of corals. In other
words, coral recruits at Sampela grow at a slower rate and do not survive to
maturity whereas the colonies at Kaledupa do not have to endure such severe
conditions, and have a much greater chance of surviving to maturity. This
means that the colonies at Sampela, although similar in number and species
diversity, will more than likely be of a greater age than those at Kaledupa.
All hermatypic corals require adequate light so that their zooxanthellae can
photosynthesise and fix carbon for the coral. Light changes drastically both in
intensity and composition with depth. This range of light levels and forms
controls the depths at which corals can grow, and different species have
different tolerances to both maximum and minimum light levels. It is also a
major cause of variation in reef community structures (Veron 1986).
The study at Sampela and Kaledupa set out to study the physical factors
affecting the performance of coral recruitment. It has been found that
sediment does not appear to be a limiting factor on coral recruitment, but has
more influence on the performance of growing juvenile corals. The overriding
factors at this stage would appear to be the availability of light at the sight
chosen for recruitment.
The data gathered on abundance of growth forms clearly shows that massive
and encrusting corals are very abundant at both sites. This could be due to
89
the fact that they may be resilient growth form that can withstand the high
sediment loads and low light at Sampela, but can also compete for the space
at Kaledupa.
With regards to abundance of species, Porites may be a resilient yet
competitive species, which may be linked to the point above as they can
remove the excess sediment at Sampela and yet still grow to some large
volumes. As they have been found to be slow growing this indicates that the
colonies measured may be very old. Porites, Galaxea and Diploastrea were
dominant at the sediment impacted sites, but Porites was also dominant at
the pristine site, so it must be competitive as well as resilient. Acropora,
Pavona , Pectinia and Plerogyra Genera were dominant at the pristine site,
but Acropora and Pavona were also present at the sediment impacted site so
they must be able to either tolerate or remove the excess sediment and still
be able to grow.
Sampela and Kaledupa have a significant difference in the abundance of the
chosen species. The species composition is very similar between the depths at
each site, but is very different between the sites themselves.
Clearly, the scleractinian coral community is affected by light-limitation and
increased sedimentation. Some species are able to tolerate such conditions
better than others and further investigations are required to determine why
this is so. Such information would be important to coral reef managers is
the fate of reefs is to be predicted under a variety of environmental and
potential changing conditions.
4.2.2. Comparison of coral reef health assessment methods
Although the three methods appear to give similar values for live coral cover
(with the exception of the Sampela site which is heavily impacted by
sedimentation), the use of the recommended COREMAP ten metre Line
90
Intercept Transect may be the most cost and time efficient survey method if a
rapid assessment is required to give a general picture of the health of a coral
reef as classified by the Reef Condition Index. However, if detailed biological
and ecological information about a site is required for management, such as
in the Stakeholder Area within the Wakatobi Marine National Park, a more
detailed approach to surveys seems to be appropriate.
The GCRMN method seems to fit between the other two methods in terms of
definition, being an ideal compromise in terms of cost, time and data quality.
This method does not require the taxonomic expertise of the monitoring
program, and can be carried out by semi-skilled surveyors. The live cover
data gives a similar picture to the other two methods, and the Generic
richness data generated is not significantly different from that of the
monitoring program data.
The use of the monitoring program method, utilising taxonomic expertise to
identify lifeforms over a longer, more representative transect distance has
been shown to generate high definition data sets that give a more in depth
indicator of the species richness and species diversity of a coral reef, allowing
more informed management decisions to be made and applied.
The initial multivariate analysis has produced some very encouraging results
with regard to the development of a general reef conservation value index as
some clear trends have been identified. However, again this data was simply
the live coral genera recorded on each transect and similar trends are not yet
clear when analysing data collected using all three methods.
Complete species accumulation curves will be compiled from the collected
data to identify the ideal transect length for each site. The growth form data
will be plotted in ternary diagrams to rate the conservation class of each site,
which can then be compared between survey methods. Statistical analysis will
be completed on Mortality Indices calculated for the sites from data collected
by the three methods. Conical Component Analysis will be used to identify
91
trends in the data which will be used to generate a conservation index by
linear regression. The percentage cover data will also be analysed for trends
in the other benthic categories recorded such as soft corals, rubble and algae.
These will then be incorporated into a biological index to represent the overall
health of a coral reef system. This index can then utilise the data collected by
the biodiversity monitoring program to rate the conservation value of the
reefs within the Stakeholder Managed Area of the Wakatobi MNP
4.2.3. The Importance of Coral Bombies for Coral Reef Biodiversity
From observations made it is obvious that bombies primarily provide shelter
for their associated fish although a few coralivores (mainly butterfly fish) were
observed but they were generally transient and not always associated with
the same bombie.
Two categories of fish occupy niches on bombies. Some permanently remain
on the bombie, never moving further than 30cm away, and their levels
remain approximately constant throughout the lunar cycle. Examples include
Dascyllus aruanus, Neoglyphidodon melas and Chromis viridis. Others are
more transient, spending short periods of time on numerous bombies, and
had a low abundance after the extreme low tides. This includes Balistapus
undulates, Parupeneus multifasciatus and Sufflamen chrysopterus.
The high juvenile fish abundance of bombies indicates a high conservation
value and they are used by certain species as a recruitment area. Once
calculated, the average fish abundance per 1m² of bombie will be compared
to that of the coral crest. Seven years ago, numerous coral bombies in the
area of study were mined, so a consideration of their conservation value, as
shown by this research, will aid their future protection.
92
4.2.4. The influence of habitat and fishing pressure on grouper distribution and abundance
The results of this study are encouraging as they suggest that the No Take
Area is having a positive effect on grouper size, abundance and diversity
despite its small size. The No Take Area has only been present for 3 years
and 3-5 years is the limited amount of time that is supposed to be given for
positive returns are seen in respect to increased size and number of fish,
particularly predatory species such as grouper. Such information as gained in
this study should be disseminated to local stakeholders and used positively to
indicate the success of strictly protected areas. However more research
should be carried out to determine which species aggregate at which
breeding sites and to investigate the ranging distance of the different species
to be able to accurately determine the benefits of the No Take Area and so
that future No Take Areas can be positioned in locations where they will have
maximum benefit for local fisheries.
4.2.5. The distribution, diversity, abundance and shell use of the hermit crabs of Hoga Island
Not enough data analysis has been carried out as yet to arrive at any firm
conclusions however it is expected that analysis will show a direct relationship
between shell size and gastropod size but little correlation between gastropod
species present and hermit crab shell use. It is the intention to build a model
of shell use to crab size.
4.2.6. The ecology of sponges in the Wakatobi region,
Indonesia
This initial baseline survey of the sponge assemblages at two sites within the
Wakatobi region has shown this area to have highest sponge species richness
(per unit area) compared to all other published figures currently available for
tropical reef systems as well as temperate and polar habitats. There is also
considerable differences in the sponge assemblages found at different depths
93
and between sites of experiencing different sedimentation regimes. So results
are consistent with studies elsewhere of tropical sponge assemblages (e.g.
Rutzler, 1970; Diaz et al., 1990). However, less variability was observed
between the sponges inhabiting different reef surface angles at any particular
depth. The sponges of the Wakatobi region represent an extremely important
resource in terms of biodiversity and potential economic value, particularly
with respect to the possibility that some may contain bioactive compounds.
4.2.7. Cleaner wrasse Bluesteak Cleaner Wrasse Labroides dimidiatus Behaviour
Clear difference exist in the behaviour of cleaner wrasse at different life
stages, However, as yet, the data has not be sufficiently analysed to allow
firm conclusions to be drawn from the research. Once the data has been
anlsyised it will be possible to examine the success and energetic’s of each life
stage, to determine whether individuals which have been cleaning for longer
are in fact more efficient and therefore if cleaning ability is most likely a learnt
response.
The effect of stripe contrast on the attractiveness of Labroides dimidatus
From the results obtained it can clearly be seen that there is a slight
difference between responses of clients to the models between morning and
afternoon.. The highest numbers of species have been responding to the dark
grey and black stripe model. These models also have the highest duration
rate for posing client species. Therefore it appears likely that clients are
responding to the physical characteristics of the strip and that cleaner fish
strip play a pivotal role in influencing the success of individual species and
have probably played an important evolution function in several different fish
families which have undertaken cleaning activity as a mechanisms of gaining
food resources.
94
4.2.8. Butterflyfish as Coral Reef Indicators: Study into
the Relationship between Chaetodontidae species and Coral Reefs around Hoga Island
Clear patterns have been identified during the preliminary data analysis. Quite
an accurate ecological model has been produced relating the abundance of
certain species of butterflyfish and the abundance of hard corals. This model
now needs to be validated against further ecological data, perhaps that data
obtained as part of the monitoring programme.
When data set is complete it is hoped that multivariate analysis will
demonstrate the applicability of Butterflyfish as indicators of reef health. If
the monitoring data fits the model then the number of certain butterflyfish
could be used as a monitoring tool not requiring the considerable expertise
which is required is currently required. Rates of change in butterflyfish could
also be used as a performance criteria is strong relationships are found within
the larger dataset. Such possibilities will be explored.
4.2.9. Can the Tube-Building Polychaete worms
Serpulidae and Sabellidae be used as Indicators of the Health of Coral Reefs?
Initial results show a preference by Christmas Tree worms for the
intermediate sites of Buoy 3 and Pak Kasims. This may be due to the fact that
although Sampela reef has the highest levels of sedimentation, as the worms
both feed and respire with the same organs obtaining enough oxygen may be
a limiting factor for them at this site. Kaledupa should have least
sedimentation and therefore the Christmas Tree worms may find availability
of food a limiting factor. There was however large variability within the data
which will require statistical analysis. A strong preference for the reef flat at
the intermediate sites was also demonstrated, perhaps due to the fact that
this area suffers less from bomb fishing.
95
The data on Fan worms is less conclusive and will require further analysis,
though they do appear more abundant at the Sampela reef. A preference of
Serpulids for Porites coral was seen. After further detailed analysis and the
comparisons between abundance of the two genera with the detailed
community data collected by the monitoring programme, the use of the the
densities of these two species as an indicator of coral reef health or of certain
environmental conditions, will be examined.
4.2.10. The abundance and diversity of Nudibranchs on reefs
of the study area This research was successful in determining the most appropriate technique
to estimate population sizes of Nudibranchs on the reefs of the WMNP. Such
techniques will also be used in the future to monitor changes in abundances
at the different sites.
The size frequency data produced some interesting trends as it can explain
recruitment potential of these species on each of the different sites. The data
needs further analysis to determine the mean size of sexual maturity of these
Nudibranch species . Such information is required to determine the future fate
of Nudibranchs within the WMNP and to estimate the regeneration potential
of the different sites. The size frequency data of different species will be
studies in detail in the future
4.3.1. MANGROVE ECOLOGY
A monitoring programme will be established during the latter part of the 2003
season and along with ecological studies, will enable sustainable exploitation
rates to be determined. The importance of mangrove systems to local
communities will also be investigated by the Social Science Team to support
the biological data collected by the Marine Team. Only through combining
data on the biological, ecological and dynamic aspects of mangrove, coupled
with local communities usage and perceptions of the local community to the
mangrove, can appropriate management plans be developed and
96
implemented. It is therefore the long-term aim of this theme to collectively
manage the mangrove systems of the study area with participation from local
communities to ensure that the diversity of mangrove remains constant or
increases and that exploitation rates remain sustainable in the long term.
4.3.1. The diversity and exploitation rates of Mangrove in the eastern part of the study area
The data for this survey has not yet been fully compiled or analysed and
therefore no conclusions can be drawn at this time. However it was obvious
from the data that certain species of mangrove are heavily exploited as are
certain areas of mangrove forest. As mangrove plays such an important role
in sculpturing the community of coral reefs and in influencing water quality
reaching reefs and hence reef productivity, management procedures need to
include the protection of mangrove forest. It seems likely that the level of
exploitation noted at some of the sites will eventually lead to a significant
demise of mangrove in certain areas which will have consequently effects on
adjacent reef productivity and biodiversity. Such issues need to be considered
by coral reef managers.
4.3.2. Habitat specificity and resource utilization of a
fiddler crab assemblage
As sediment type changed along the shore in both sites, it was quite obvious
that the species and sizes of fiddler crabs changed with it. The larger species
inhabited the sediment of medium depth with fine to medium grain size and
the smaller species (U.perplexa) inhabited the shallow, finer grained
sediment. Because of their size, the smaller crabs were able to burrow down
the holes in the coral, making this type of substrate more suitable for them.
The medium sized U.vocans was found lowest on the shore where the
sediment was coarser and less desirable. This may be because they could not
compete against the larger species for habitat on the middle shore, and could
not burrow into the coral substrate of the high shore.

97
Burrow densities being higher when the crab size is smaller could be due to
smaller crabs being able to, or preferring to live at higher densities. It could
also be a trait in this particular species (Uca perplexa). The results showing
that the higher densities were found on the middle of the shore where the
sediment is shallow indicates that it may be desirable for the smaller species
to live where they can burrow into the holes of the coral. This way it is
harder for them to be dug out by predators and so providing more protection.
Kaledupa was a much larger study site, with a greater range in sediment
type, environmental conditions, number and sizes of species. The possible
factors that could be influencing the species, carapace size, burrow/crab
densities and distributions include:
• Feeding preferences of each species
• Sediment type as it changes horizontally, vertically and with depth
• Zone on shore, horizontally and vertically
• Sex
The species, carapace size, burrow/crab densities could then influence other
factors such as:
• Burrow entrance size
• Burrow depth
All of the factors stated could in turn be influencing each other. It will be
shown with further analysis which factors have the most importance and then
whether or not these are significant.
Consequently this studies showed that species distribution seems to be due to
different species having different habitat requirements, for example; sediment
type composition, zone on the shore in relation to the tides and in substratum
that provide protection such as the mangrove roots and coral bedrock. The
fact that species seem to be distributed in clusters relatively separate from
each other indicates that there could be interspecific competition occurring.
Different species also seem to have different requirements or preferences,
preferring to live either at high densities such as Uca tetragonon, Uca

98
chlorophthalmus and Uca perplexa, medium densities such as Uca vocans or
at low densities such as Uca dussumieri. However, because the species
preferring to live at higher densities are small species, it is not yet certain if
the high density is due to them being less territorial, their size (safety in
numbers) or a combination of both.
4.3.3. Releasers of Behaviour of the Major Cheliped in Uca
vocans and Uca dussumieri
Although the data has not yet been fully analysised it was obvious that both
size and colour of the claw influences the behaviour of fiddler crabs. Fiddler
crabs have excellent vision and, in many cases it therefore seems that having
the appropriate sized claw and possibly colour is a good deterrent to would-
be invaders. This would be an advantageous strategy to reduce the physical
threats of invaders without risking physical injury by part participating in
physical disputes.
4.4. CONCLUDING REMARKS Several pieces of data have been collected during the research season but
have not yet been analysised and are therefore not included within this
preliminary report. However the majority of scientific investigations are
represented. Data not include:
1. Fish abundance and size frequency distribution for the
Hoga No Take Area
2. Monitoring data for all sites, only four sites being
included.
3. Detailed data for all sites investigated as part of the
establishment of a mangrove monitoring programme and
full results from the pilot quantitative surveys.
4. All data from the biodiversity assessment.
99
The 2003n research season was extremely successful and productive, and the
use of research themes has made the research collection most efficient and
has also maximised research output. Some of this research will be submitted
for per-reviewed publications others aspects of the research will be used for
management purposes and others aspects of the research will be used to
refine data collection and study and experimental design to be implemented
during the 2004 season.
5.0. References Ackers RG, Moss D. 1987. Current problems with field recognition and species differentiation in shallow water British sponges. In Marine Recordings eds Earll Alvarez B, MC Diaz, RA Laughlin. 1990. The sponge fauna on a fringing coral reef in Venezuela, I: Composition, Distribution, and Abundance. Pp. 358−366 in New Perspectives in Sponge Biology, K. Rützler, ed. Smithsonian Institute Press, London. Bell JJ, DKA Barnes. 2000a. A sponge diversity centre within a marine island’. Hydrobiologia 440: 55−64. Bell JJ, DKA Barnes. 2000b. The distribution and prevalence of sponges in relation to environmental gradient within a temperate sea lough. Vertical cliff surfaces. Diver Distrib 6: 283−303. Bell JJ, DKA Barnes. 2000c. The distribution and prevalence of sponges in relation to environmental gradient within a temperate sea lough. Inclined cliff surfaces. Diver Distrib 6: 305−323. Dayton PK, Robilliard GA, Paine RT, Dayton LB. 1974. Biological Accommodation in the Benthic Community at McMurdo Sound, Antarctica. Ecological. Monographs 44 (1): 105-128. Diaz MC, Alvarez B, Laughlin RA. 1990. The Sponge Fauna on a Fringing Coral Reef in Venezuela, II: Community Structure. In: New Perspectives in Sponge Biology, ed. K Rützler, Smithsonian Institute Press: 367-375. COREMAP-AMSAT, (2001) Optimisation of survey design for reef health monitoring. COREMAP BME Report 2.COREMAP Secretariat, Jakarta, Indonesia. pp33, Annex 1. Crabbe, M.J.C. and Smith, D.J. (2003) Computer modelling and estimation of recruitment patterns of non-branching coral colonies at three sites in the

100
Wakatobi Marine Park, SE Sulawesi, Indonesia; Implications for coral reef conservation. Computational Biology and Chemistry. 27, 17-27. Crabbe, M.J.C. and Smith, D.J. (2002) Comparison of two reef sites in the Wakatobi Marine National Park (SE Sulawesi, Indonesia) using digital image analysis. Coral Reefs. 21: 242-244 Crabbe, M.J.C., Mendes, J.M. and Warner, G.F. (2002) Lack of recruitment of non-branching corals in Discovery Bay is linked to severe storms. Bull. Marine Sci. 70, 939-945. Edinger E.N.,Jompa J., Limmon G.V.,Widjatmoko W. and Risk M.J.(1998) Reef degradation and coral biodiversity in Indonesia: Effects of land-based pollution, destructive fishing practices and changes over time. Marine Pollution Bulletin 36(8):617-630 London:Pergamon Edinger E.N. and Risk M.J.(2000)Reef classification by coral morphology predicts coral reef conservation value. Biological Conservation 92:1-13 Amsterdam:Elsevier Science English, S.,Wilkinson, C. and Baker, V. (1994) Survey manual for tropical marine resources Townsville:AIMS Gomez E.D. and Yap H.T. (1988) Monitoring reef condition. In:Coral reef management handbook. UNESCO regional office for science and technology for South East Asia. Jakarta, pp171-178 Gomez E.D., Aliño P.M., Yap H.T. and Licuanan W.Y. (1994) A review of the status of Philippine reefs. Marine Pollution Bulletin 29:62-678 Gubbay S: 2, 22-27. Marine Conservation Society, UK. Hiscock K, Stone S, George JD. 1983. The marine fauna of Lundy. Porifera (sponges): A preliminary study. Report of the Lundy Field Society 34: 16-35. Hodgson G, Maun L, Shuman C. 2003. Reef Check Survey Manual for Coral Reefs of the Indo Pacific, Hawaii, Atlantic/ Caribbean, Red Sea and Arabian Gulf. Reef Check, Institute of the Environment, University of California, Los Angeles, CA. 33p. Könnecker, G. 1973. Littoral and Benthic Investigations on the West Coast of Ireland - I. (Sectiion A: Faunistic and Ecological Studies). The Sponge Fauna of Kilkieran Bay and adjacent Areas. Proc. Royal Iri. Acad. 73B (26): 450−472. Picton BE. 1990. The sessile fauna of sublittoral cliffs. In The Ecology of Lough Hyne: Proceeding of a conference 4-5th Sep 1990, eds AA Myers, C Little, MJ Costello and JC Partridge. Royal Irish Academy, pp 139-142.

101
Reiswig HM. 1973. Population Dynamics of Three Jamaican Demospongiae. Bulletin of Marine Science 23: 191-226. Riegl B. and Riegl A. (1996) Studies on coral community structure and damage as a basis for zoning marine reserves. Biological Conservation 77:269-277 Amsterdam:Elsevier Science Rützler K. 1970. Spatial Competition among Porifera: Solution by Epizoism. Oecologia 5: 85-95. Sarà, M, M Pansini, R Pronzato. 1979. Zonation of photophilous sponges related to water movement in reef biotopes of Obhor Creek (Red Sea). in Sponge Biology, Colloques internationaux du C.N.R.S 291, C. Levi, N. Boury- Esnault, eds. Storr, JF. 1976 Ecological factors controlling sponge distributions in the Gulf of Mexico and the resulting zonation. Pp. 261−276 in Aspects of Sponge Biology,F.W. Harrison, and R.R. Cowden, eds. New York Academic Press. New York. Witman JD, KP Sebens. 1990. Distribution and Ecology of Sponges at a Subtidal Rock Ledge in the Central Gulf of Maine. Pp. 391−396 in New Perspectives in Sponge Biology, K. Rützler, ed. Smithsonian Institute Press, London
Related Documents