Marine pelagic ecosystems: the West Antarctic Peninsula Hugh W. Ducklow 1, * , Karen Baker 2 , Douglas G. Martinson 3 , Langdon B. Quetin 4 , Robin M. Ross 4 , Raymond C. Smith 5 , Sharon E. Stammerjohn 3 , Maria Vernet 2 and William Fraser 6 1 School of Marine Science, The College of William and Mary, Gloucester Point, VA 23062, USA 2 Scripps Institution of Oceanography, University of California, San Diego, La Jolla, CA 92093-0239, USA 3 Lamont-Doherty Earth Observatory, 61 Route 9W, Palisades, NY 10964, USA 4 Marine Science Institute, University of California, Santa Barbara, CA 93106, USA 5 ICESS, University of California, Santa Barbara, CA 93106, USA 6 Polar Oceans Research Group, Sheridan, MT 59749, USA The marine ecosystem of the West Antarctic Peninsula (WAP) extends from the Bellingshausen Sea to the northern tip of the peninsula and from the mostly glaciated coast across the continental shelf to the shelf break in the west. The glacially sculpted coastline along the peninsula is highly convoluted and characterized by deep embayments that are often interconnected by channels that facilitate transport of heat and nutrients into the shelf domain. The ecosystem is divided into three subregions, the continental slope, shelf and coastal regions, each with unique ocean dynamics, water mass and biological distributions. The WAP shelf lies within the Antarctic Sea Ice Zone (SIZ) and like other SIZs, the WAP system is very productive, supporting large stocks of marine mammals, birds and the Antarctic krill, Euphausia superba. Ecosystem dynamics is dominated by the seasonal and interannual variation in sea ice extent and retreat. The Antarctic Peninsula is one among the most rapidly warming regions on Earth, having experienced a 28C increase in the annual mean temperature and a 68C rise in the mean winter temperature since 1950. Delivery of heat from the Antarctic Circumpolar Current has increased significantly in the past decade, sufficient to drive to a 0.68C warming of the upper 300 m of shelf water. In the past 50 years and continuing in the twenty-first century, the warm, moist maritime climate of the northern WAP has been migrating south, displacing the once dominant cold, dry continental Antarctic climate and causing multi-level responses in the marine ecosystem. Ecosystem responses to the regional warming include increased heat transport, decreased sea ice extent and duration, local declines in ice- dependent Ade ´lie penguins, increase in ice-tolerant gentoo and chinstrap penguins, alterations in phytoplankton and zooplankton community composition and changes in krill recruitment, abundance and availability to predators. The climate/ecological gradients extending along the WAP and the presence of monitoring systems, field stations and long-term research programmes make the region an invaluable observatory of climate change and marine ecosystem response. Keywords: Palmer Station; LTER; climate change; Ade ´lie penguin; Antarctic krill; Antarctic Circumpolar Current 1. INTRODUCTION The marine ecosystem of the West Antarctic Peninsula (WAP) extends for approximately 1500 km from the Bellingshausen Sea near 758 S, 808 W to the northern tip of the peninsula near 638 S, 608 W, and from the mostly glaciated coast in the east across the continental shelf to the shelf break in the west. The shelf is about 200 km wide and averages 430 m in depth. The shelf break is defined by steep, rapidly deepening bathym- etry between 750 and 3000 m (figure 1). The glacially sculpted (Anderson 2002) coastline along the penin- sula is highly convoluted, cut with numerous islands, deeps, bays, fjords and a series of embayments often interconnected by channels, sometimes as deep as 900 m. The domain is divided into three subregions (continental slope, shelf and coastal regions of figure 1b) consistent with the bathymetry, ocean dynamics, water mass and biological distributions. This region at its widest extent includes three of the four circumpolar Antarctic marine ecosystem types or biomes defined by Treguer & Jacques (1992): the Permanently Open Ocean Zone; Sea Ice Zone (SIZ) and, bordering the continent, the Coastal and Continental Shelf Zone. The Polar Front Zone per se is not in our study region but the Southern Antarctic Circumpolar Current Front (SACCF) impinges on the continental shelf (see below). Like other SIZs, the WAP system is very productive, supporting large stocks of marine mammals and birds, as well as the Antarctic krill, Euphausia superba (Ross et al. 1996). The dynamics of Phil. Trans. R. Soc. B (2007) 362, 67–94 doi:10.1098/rstb.2006.1955 Published online 30 November 2006 One contribution of 8 to a Theme Issue ‘Antarctic ecology: from genes to ecosystems. I’. * Author for correspondence ([email protected]). 67 This journal is q 2006 The Royal Society

Welcome message from author
This document is posted to help you gain knowledge. Please leave a comment to let me know what you think about it! Share it to your friends and learn new things together.
Transcript
Phil. Trans. R. Soc. B (2007) 362, 67–94
doi:10.1098/rstb.2006.1955
Marine pelagic ecosystems: the WestAntarctic Peninsula
Published online 30 November 2006
Hugh W. Ducklow1,*, Karen Baker2, Douglas G. Martinson3,
Langdon B. Quetin4, Robin M. Ross4, Raymond C. Smith5,
Sharon E. Stammerjohn3, Maria Vernet2 and William Fraser6
One congenes to
*Autho
1School of Marine Science, The College of William and Mary, Gloucester Point, VA 23062, USA2Scripps Institution of Oceanography, University of California, San Diego, La Jolla, CA 92093-0239, USA
3Lamont-Doherty Earth Observatory, 61 Route 9W, Palisades, NY 10964, USA4Marine Science Institute, University of California, Santa Barbara, CA 93106, USA
5ICESS, University of California, Santa Barbara, CA 93106, USA6Polar Oceans Research Group, Sheridan, MT 59749, USA
The marine ecosystem of the West Antarctic Peninsula (WAP) extends from the Bellingshausen Sea tothe northern tip of the peninsula and from the mostly glaciated coast across the continental shelf to theshelf break in the west. The glacially sculpted coastline along the peninsula is highly convoluted andcharacterized by deep embayments that are often interconnected by channels that facilitate transport ofheat and nutrients into the shelf domain.The ecosystem is divided into three subregions, the continentalslope, shelf and coastal regions, each with unique ocean dynamics, water mass and biologicaldistributions. TheWAP shelf lies within the Antarctic Sea Ice Zone (SIZ) and like other SIZs, theWAPsystem is very productive, supporting large stocks of marine mammals, birds and the Antarctic krill,Euphausia superba. Ecosystemdynamics is dominated by the seasonal and interannual variation in sea iceextent and retreat. The Antarctic Peninsula is one among the most rapidly warming regions on Earth,having experienced a 28C increase in the annual mean temperature and a 68C rise in the mean wintertemperature since 1950. Delivery of heat from the Antarctic Circumpolar Current has increasedsignificantly in the past decade, sufficient to drive to a 0.68Cwarming of the upper 300 m of shelf water.In the past 50 years and continuing in the twenty-first century, the warm, moist maritime climate of thenorthernWAP has been migrating south, displacing the once dominant cold, dry continental Antarcticclimate and causingmulti-level responses in themarine ecosystem. Ecosystem responses to the regionalwarming include increased heat transport, decreased sea ice extent and duration, local declines in ice-dependent Adelie penguins, increase in ice-tolerant gentoo and chinstrap penguins, alterations inphytoplankton and zooplankton community composition and changes in krill recruitment, abundanceandavailability topredators.Theclimate/ecological gradients extendingalong theWAPand thepresenceof monitoring systems, field stations and long-term research programmesmake the region an invaluableobservatory of climate change and marine ecosystem response.
Keywords: Palmer Station; LTER; climate change; Adelie penguin; Antarctic krill;Antarctic Circumpolar Current
1. INTRODUCTIONThe marine ecosystem of the West Antarctic Peninsula(WAP) extends for approximately 1500 km from theBellingshausen Sea near 758 S, 808W to the northerntip of the peninsula near 638 S, 608 W, and from themostly glaciated coast in the east across the continentalshelf to the shelf break in the west. The shelf is about200 km wide and averages 430 m in depth. The shelfbreak is defined by steep, rapidly deepening bathym-etry between 750 and 3000 m (figure 1). The glaciallysculpted (Anderson 2002) coastline along the penin-sula is highly convoluted, cut with numerous islands,deeps, bays, fjords and a series of embayments often
tribution of 8 to a Theme Issue ‘Antarctic ecology: fromecosystems. I’.
r for correspondence ([email protected]).
67
interconnected by channels, sometimes as deep as
900 m. The domain is divided into three subregions
(continental slope, shelf and coastal regions of
figure 1b) consistent with the bathymetry, ocean
dynamics, water mass and biological distributions.
This region at its widest extent includes three of the
four circumpolar Antarctic marine ecosystem types or
biomes defined by Treguer & Jacques (1992): the
Permanently Open Ocean Zone; Sea Ice Zone (SIZ)
and, bordering the continent, the Coastal and
Continental Shelf Zone. The Polar Front Zone per se isnot in our study region but the Southern Antarctic
Circumpolar Current Front (SACCF) impinges on the
continental shelf (see below). Like other SIZs, theWAP
system is very productive, supporting large stocks of
marinemammals andbirds, aswell as theAntarctic krill,
Euphausia superba (Ross et al. 1996). The dynamics of
This journal is q 2006 The Royal Society

−75˚
−70˚
−65˚
−100˚
−90˚−80˚ −70˚
−60˚
−60˚
150200 160 120 80 40 0 −40
200
250
300
350
400
450
500
550
600
650
grid
line
(km
)
An
peni
nsul
a
FP
GR
C
Ad
Ro
MBMB
grid station (km)
4500
-37503000
2250
750
bellingshaugensea
(a) (b)
Figure 1. (a) Palmer LTER study region along the WAP showing sampling grid (filled squares with labelled contouredbathymetry (750 m intervals) and climatological southern edge of Antarctic Circumpolar Current (ACC; dashed grey line).(b) The main sampling grid occupied each January since 1993 consists of stations (small squares 10 km apart) arranged in 10onshore to offshore lines spaced 100 km apart, with line 000 to the south and 900 to the north along the peninsula (only lines200–600 shown); stations proceed offshore from an arbitrary 0 line defining the peninsular coastline. Bathymetry shaded(whiteR750 m, 750 m!light-grey%450 m, dark-grey!450 m) and contoured (greater than or equal to 1500 m at 750 mintervals); white diamond, Palmer Station; white triangle, long-term sediment trap mooring; F, Faraday (Vernadsky) base; P,Palmer Deep region on shelf; Ro, Rothera Station; G and C, Grandidier Channel and Crystal Sound; MB, Marguerite Bay;An, R and Ad, Anvers, Renaud and Adelaide Islands, respectively; continental shelf break indicated by dashed bold line (slope toleft); shelf-coastal subregions separated by solid bold line; and small white circles, various stations ‘inside’ the islands andchannels with distinct hydrography influenced by glacial ice melt.
68 H. W.Ducklow et al. Marine pelagic ecosystems: the WAP
the ecosystem is dominated by the seasonal growth,extent and retreat of sea ice and their interannualvariations. The Antarctic Peninsula (AP) is also oneamong the most rapidly warming regions on Earth,having experienced a 28C increase in annual meantemperature since 1950. The surface ocean, west of thepeninsula, has also warmed significantly. Meredith &King (2005) demonstrate warming of over 18C since1955–1964. In the past two decades, dramaticresponses of the ecosystem to the climate and oceanwarming have been documented. In this article, wesynthesize the studies of rapid climate change andecosystem responses to it, proposing the WAP marinesystem as a premier example of the more generalizedphenomenon experienced globally. Results from thePalmer Antarctic Long-Term Ecological Research(Pal-LTER) project (Ross et al. 1996; Smith et al.2003b),Research onCoastalAntarcticEcosystemRates(RACER; Huntley et al. 1991), Southern OceanGLOBEC (Hofmann et al. 2004) and other studies arereviewed. This paper provides an observational contextfor the recent review of Southern Ocean ecology bySmetacek & Nicol (2005).
The life cycles of organisms in the Antarctic coastalmarine ecosystem depend profoundly on the annualcycle and interannual variations in sea ice cover. Webegin by discussing recent climate changes and theireffects on the duration and extent of sea ice, thenproceed to some of the principal components of theupper ocean pelagic ecosystem. Benthopelagicexchanges are of less importance because Antarcticcontinental shelves are greater than 300 m deep, well
Phil. Trans. R. Soc. B (2007)
below the winter mixed layer. Benthic systems arereviewed by Clarke et al. (2007) and by Smith et al.(in press a).
2. CLIMATE AND ICE(a) Surface air temperature
Significant changes have occurred over the last half-century in the AP region, including the northwesternWeddell and southern Bellingshausen seas, as revealedby instrument records, station observations, satellitedata and paleoenvironmental records (Domack et al.2003). Surface air temperature records, in particular,reveal a warming in winter of 5–68C over the past 50years, a warming rate that exceeds any other observedglobally (Vaughan et al. 2003). The paleo-recordsprovide a longer-term history of change in the APregion and lend perspective for understanding the mostrecent (half century) warming trend, showing it to beunique within the last few millennia (Smith et al.1999b; Domack et al. 2003; Vaughan et al. 2003).
The British Antarctic Survey meteorological obser-vations (http://www.antarctica.ac.uk/met/gjma/temps.html) at Faraday/Vernadsky station (65815 0 S,64816 0 W) have been especially useful given their length(O5 decades), consistency and quality control. Here,we update and augment our earlier analyses of thesedata (Smith et al. 1996b; Smith & Stammerjohn 2001)with the addition of data through 2004. Figure 2ashows the Faraday/Vernadsky annual average airtemperatures from 1951 to 2004 (NZ54). The lineartrend (solid line) determined by the least squares slope
–1050 55 60 65 70 75 80
year year85 90 95 00 05 78
–6 –3 0 3trend (days/year)
(–earlier later–)
6
82 86 90 94 98 02
–8
–6
–2
2.0×10⁵
1.4×10⁵
8.0×10⁴
2.0×10⁴
0 surface air temperature
day of advance
Palmer LTER sea ice extent
southern ocean1.29×107
1.24×10⁷
1.19×10⁷
78 82 86 90 94 98 02
day of retreat
(a) (b)
(c) (d)
–4
air
tem
pera
ture
(°C
)
sea
ice
exte
nt (
km2 )
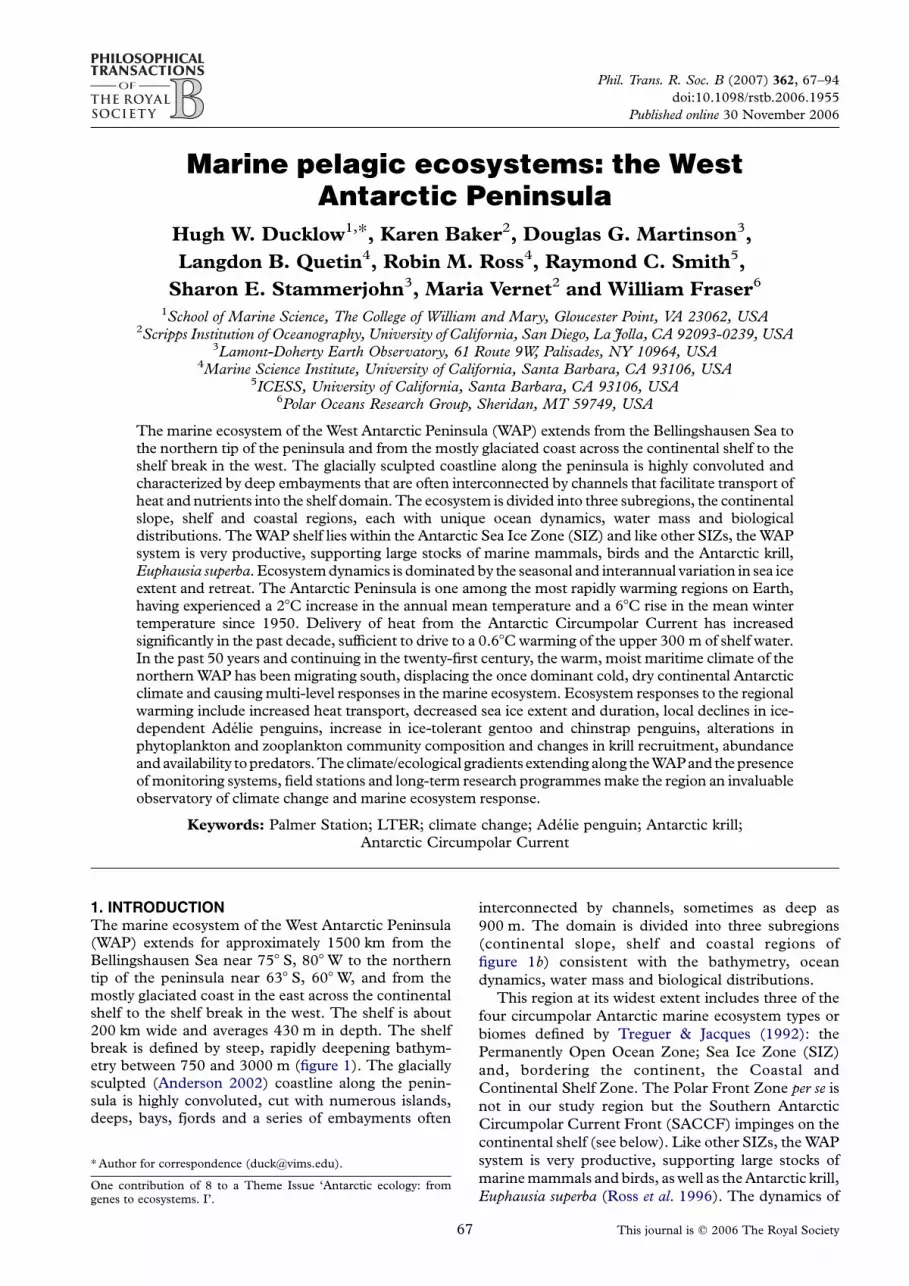
Figure 2. (a) Annual average air temperature recorded at Faraday/Vernadsky Station (65815 0 S, 64816 0 W) from 1951 to 2004.The linear regression fit (solid) and G1 standard deviation (dotted) about this fit are included. Annual average air temperaturerecorded at Rothera Station (67834 0 S, 68808 0 W) from 1977 to 2004 is shown by the dotted curve. The standard error andsignificance were determined using the effective degrees of freedom (NeffZ24.8) present in the regression residuals (see Smithet al. 1996a for methods). Also included are the G1 standard deviation lines (dotted). (b) Annual average sea ice extent for thePalmer LTER region and for the Southern Ocean (inset) from 1979 to 2004. The linear regression fit (solid) and G1 s.d.(dotted) about this fit are included. Spatial maps of linear trends (1979–2004) in (c) day of advance and (d) day of retreat in thegreater AP region.
Marine pelagic ecosystems: the WAP H. W.Ducklow et al. 69
is 0.054G0.0178C yrK1 (p!0.01). Monthly and
seasonal analyses show that the warming trend in
Faraday/Vernadsky air temperatures is strongest during
the midwinter months and peaks in July at 0.1165G0.0476 8C yrK1 (NeffZ32.5, pZ0.01). This represents
a 6.38C increase in July temperatures over the 54-year
record. Spring and summer trends are not as
pronounced. The record from Rothera (further south
on the WAP, 67834 0 S, 68808 0 W) shows strong
temporal coherence to Faraday/Vernadsky (figure 2),
displaying similar trends but with mean annual
temperatures averaging a few degrees cooler (King
1994; Smith et al. 1996b). Spatial coherence of surfaceair and sea surface temperature in the AP region is also
displayed in infrared satellite observations (Comiso
Phil. Trans. R. Soc. B (2007)
2000). Changes in the annual progression of tempera-ture and the amount of variability associated with thosetemperatures is suggestive of a climate shift along theWAP, where continental influences from the south aregiving way to increasing maritime influences from thenorth (Smith et al. 1999).
(b) Sea ice
Concurrently, various trends have been detected inAntarctic sea ice, showing that magnitude anddirection are strongly dependent on the region andtime-interval studied (Cavalieri et al. 1997; Stammer-john & Smith 1997; Watkins & Simmonds 2000;Zwally et al. 2002; Parkinson 2004). Here, we analysethe trends during 1979–2004 (NZ26), the time period

70 H. W.Ducklow et al. Marine pelagic ecosystems: the WAP
for which reliable satellite observations (Comiso et al.1997) are currently available. In contrast to theSouthern Ocean as a whole, but consistent with theobserved AP warming, the annual mean sea ice extenthas trended down in the WAP region. Figure 2b showsthe mean annual sea ice extent for the Southern Ocean(inset) and the Pal-LTER region. The Southern Oceantrend is weakly positive (11001G5982 km2 yrK1,NeffZ20.4, pZ0.04), representing a 2% increaserelative to the mean (1.2!107 km2) over 26 years. Incontrast, the trend in the Pal-LTER region is stronglynegative (K1502G814 km2 yrK1, NeffZ13.9,pZ0.05), representing a 40% decrease relative to themean (98 361 km2) over 26 years. As shown bySmith & Stammerjohn (2001), the decreasing trendin annually averaged sea ice extent in the Pal-LTERregion is due to a decrease in the duration (notmagnitude) of winter sea ice extent (i.e. winter sea icestill roughly extends as far equatorward as before butdoes not remain there for as long). This is in agreementwith other studies that have shown a decrease in thewinter sea ice season in the AP region (Parkinson 2002,2004). Concurrently, winter sea ice concentration isdecreasing (Vaughan et al. 2003; Liu et al. 2004).
Recent studies confirm that the decrease in theduration of winter sea ice extent is due to strong trendsin the timing of sea ice advance and retreat, such thatthe advance is occurring later while the retreat isoccurring earlier (Stammerjohn et al. in press a,b).Figure 2c,d also shows the spatial distribution of thetrends in the advance and retreat in the greater APregion. The solid and dotted contours denote the 0.01and 0.10 significance levels. Most of the WAP coastalregion shows a strong trend towards a later advance anda somewhat weaker trend towards an earlier retreat;further to the south (i.e. southern Bellingshausen Sea)the magnitudes of the trends increase. Elsewhere in theSouthern Ocean, the advance and retreat trends areweak except in the western Ross Sea region wherewinter sea ice duration is increasing (Parkinson 2002),concurrent with trends towards an earlier advanceand later retreat (Stammerjohn et al. in press a),and overall increasing winter sea ice concentration(Liu et al. 2004).
(c) Climate covariability
Numerous studies have shown air temperature and seaice in the AP region to be sensitive to variability in(i) the Southern Oscillation (Simmonds & Jacka 1995;Smith et al. 1996b; Kwok & Comiso 2002a), (ii) the ElNino/southern Oscillation (ENSO; Marshall & King1998; Harangozo 2000; Rind et al. 2001; Yuan &Martinson 2000, 2001), and (iii) the Southern AnnularMode (SAM; Hall & Visbeck 2002; Thompson &Solomon 2002; Simmonds 2003; van den Broeke &Lipzig 2003; Lefebvre et al. 2004; Marshall et al. 2004).Other studies offer general reviews of climate covari-ability and the high latitude teleconnection in theSouthern Ocean (Carleton 2003; Parkinson 2004;Simmonds & King 2004; Turner 2004; Yuan 2004).Yuan (2004) provides a thorough conceptualization(figures 5 and 8 in that study) of the potentialmechanistic linkages between polar and lower latitudeocean and atmospheric processes. A few studies in
Phil. Trans. R. Soc. B (2007)
particular have analysed the high latitude response inthe Southeast Pacific to the combined effect of ENSOand SAM variability (Kwok & Comiso 2002b; Liu et al.2004; Fogt & Bromwich 2005; Stammerjohn et al.in press a). In fact, Yuan (2004) notes that this regionundergoes the largest extra-tropical surface tempera-ture response to ENSO on Earth.
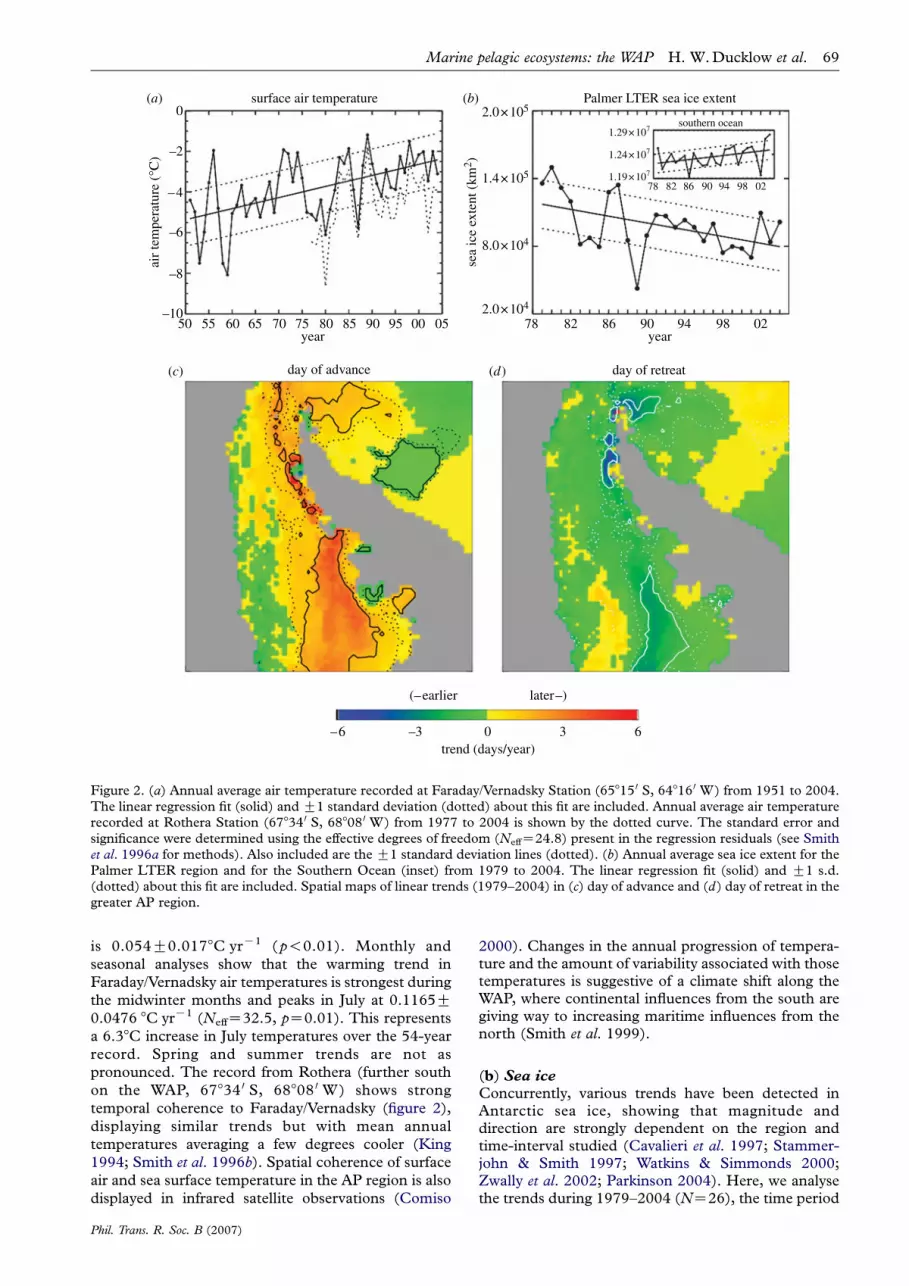
Figure 3 summarizes some of the highlightsof climate covariability in the Pal-LTER region.(i) Pal-LTER sea ice extent negatively covaries withFaraday/Vernadsky air temperature (1979–2004monthly, RZK0.79; annual, RZK0.94), (ii) 10-yearrunning correlations show, however, that covariabilityhas decreased since the 1990s, (iii) Pal-LTER sea iceextent and the Southern Oscillation Index (SOI; thestandardized sea-level pressure difference betweenTahiti and Darwin, Australia) negatively covary(1979–2004 monthly, RZK0.24; annual, RZK0.43),and (iv) 10-year running correlations show, however,that covariability between Pal-LTER sea ice extent andthe SOI has decreased since the 1990s (unless the time-series are first smoothed, dotted lines), while the longerview provided by the Faraday/Vernadsky air tempera-ture record shows that SOI covariability was alsostronger in the 1960s to mid-1970s in addition to the1980s. Similar results to (iii) and (iv) are obtainedwhen an ENSO index (e.g. Nino3.4) is used.Additionally, Pal-LTER sea ice extent negativelycovaries with SAM variability. However, correlationsare in general weak unless examined on a month-to-month basis, November showing the most consist-ent and strongest correlations (e.g. 10-year runningcorrelations range from K0.4 to K0.5).
Concurrent with decreased climate covariability withPal-LTER sea ice extent in the 1990s is increased intra-seasonal variability in monthly sea ice extent (Smithet al. 1998a; Smith&Stammerjohn 2001; Stammerjohnet al. in press b). This is partially confirmed by the factthat correlations remain higher in the 1990s when usingsmoothed timeseries (dotted lines in figure 3b,d). Theincrease in intraseasonal variability between the 1980sand 1990s is captured by the degree of persistence inmonthly sea ice extent anomalies, which decreased from12 to 13months in the 1980s to twomonths in the 1990s(based on autocorrelation analysis). Increased intrasea-sonal variability is largely a result of increased variabilityin the timing of sea ice advance and retreat in the 1990s,and this has direct implications for the marineecosystem. The life histories of most polar marinespecies have evolved to be synchronized with theseasonality of sea ice (Smith et al. 1995; Ross et al.1996). Therefore, the marine ecosystem may be moresensitive to changes in the seasonal timing of sea iceadvance and retreat than to overall changes inmagnitude of winter sea ice extent (Smith et al.2003a,b), thus providing further impetus to understandthe increased variability in sea ice advance and retreat.
As indicated by figure 2, we have analysed thevariability and trends in the timing of sea ice advanceand retreat (Stammerjohn et al. 2003, in press a).In contrast to results shown in figure 3 that were basedon monthly sea ice extent, correlations betweenthe timing of sea ice advance and the SOI are strongerand markedly increase in the 1990s (RZC0.72 for
4
2
0
−2
−4
4
2
0
−2
−4
−0.2
−0.4
−0.6
−0.8
−1.0
−1.2
1.0
0.5
0.0
−0.5
−1.0
79
80 82 84 86 88 90 92 94
81 83 85 87 89 91 93 95 97 99 01 03 05
79 81 83 85 87 89 91 93 95 97 99 01 03 05
57 59 61 63 65 67 69 71 73 75 77 79 81 83 85 87 89 91 93 95
year
year start of 10-year (120 month) running correlation
year start of 10-year (120 month) running correlation
year
sea iceSAT
sea iceSOI
unsmoothedsmoothed (5-month)
unsmoothedsmoothed (5-month)
SAT
vs
SIE
SOI
vs S
AT
SOI
vs S
IE
stan
dard
dev
iate
stan
dard
dev
iate
corr
elat
ion
coef
fici
ent
corr
elat
ion
coef
fici
ent
(a)
(b)
(c)
(d )
Figure 3. Monthly standard deviates (smoothed by 5-month running means) from January 1979 to December 2004. Monthlystandard deviates were determined by dividing the anomaly (for the month and year in question) by the standard deviation of theanomaly (for the month in question). (a) Faraday/Vernadsky air temperature (dotted) and Palmer LTER sea ice extent (solid);(b) 10-year (120 month) running correlations between unsmoothed (solid) and smoothed (dotted) time-series ofFaraday/Vernadsky air temperature and Palmer LTER sea ice extent: the smoothing was by 5-month running means;(c) Palmer LTER sea ice extent (solid) and the Southern Oscillation Index (SOI; dotted); and (d) 10-year (120 month) runningcorrelations between unsmoothed (solid) and smoothed (dotted) time-series of Faraday/Vernadsky air temperature and SOI(positive correlations from 1957 to 1995), and between unsmoothed (solid) and smoothed (dotted) time-series of Palmer LTERsea ice extent and the SOI (negative correlations from 1979 to 1995).
Marine pelagic ecosystems: the WAP H. W.Ducklow et al. 71
1992–2004 compared with RZC0.38 for 1979–2004).
The correlations between sea ice retreat and the SOI also
showan increase in the 1990s (RZK0.46 for 1992–2004
compared with RZK0.38 for 1979–2004) and are
somewhat weaker than for the advance but still stronger
than for monthly sea ice extent. Again, similar results are
obtained when an ENSO index (e.g. Nino3.4) is used.
These results further confirm that the high latitude
Southeast Pacific is sensitive to ENSO variability.
However, given the increased intraseasonal variability
of sea ice in theWAP region, monthly sea ice extent may
not be the best variable for examining this relationship.
Phil. Trans. R. Soc. B (2007)
As our most recent results show (Stammerjohn et al. inpress a,b), we seem to better capture sea ice sensitivity to
ENSOvariability by restrictingour focus to the periodsof
sea ice advance and retreat.
This is not surprising when given that the high-
latitude response to ENSO variability is strongest
during the austral spring–summer (especially in the
1990s due to a strengthening of the in-phase relation-
ship with SAM during spring; Fogt & Bromwich 2005).
Our studies, however, suggest that the sea ice response
to ENSO variability is still evident well into austral
autumn (Stammerjohn et al. in press a,b), given
600
500
400
300
200
600
500
400
line
(km
)lin
e (k
m)
300
200
190 110 30 190 110 30 190 110 30 190 110 30 190 110 30 190 110 30
station (km) station (km) station (km) station (km) station (km)station (km)
1993 1994 1995 1996 1997 1998
1999 2000 2001 2002 2003 2004
1.52
1.57
1.47
1.42
1.47
1.52 1.
37
1.32
1.47
1.47
1.32
1.37
1.47
1.42
1.47
1.37 1.37
1.47
1.42
1.42
1.42 1.37
1.57 1.52
1.82 1.42
1.52
1.47
1.42
1.37
1.37
1.37
1.33
1.27
1.471.52
1.42
1.47
1.471.37
1.521.621.571.72
1.48
1.32
1.52
1.57
1.57
1.47
1.521.62
1.37
1.52 1.47
1.42
1.42
1.52
1.47 1.
42 1.321.
37
1.27
1.221.
371.
47
1.32
1.32
1.32 1.37
1.271.32
1.321.421.27
1.271
.22
1.321.37
1.32
1.27
1.32
1.37
1.47
1.42
1.42
1.47
1.37
1.42
1.32
1.27
1.37
1.42
1.321.32
1.22
1.32
1.27
1.32
1.27
1.22
1.37
1.371.32
1.22
1.37
1.27
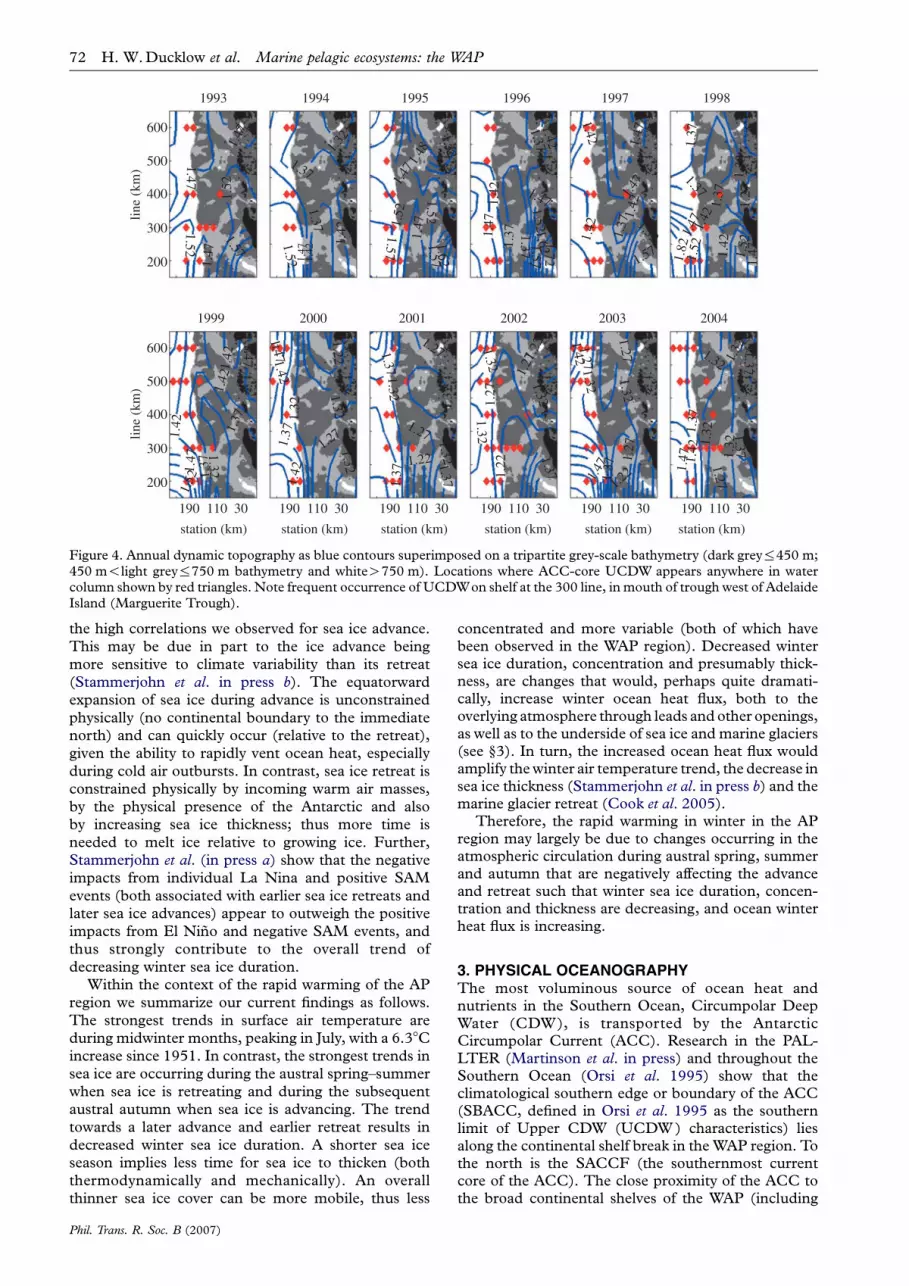
Figure 4. Annual dynamic topography as blue contours superimposed on a tripartite grey-scale bathymetry (dark grey%450 m;450 m!light grey%750 m bathymetry and whiteO750 m). Locations where ACC-core UCDW appears anywhere in watercolumn shown by red triangles. Note frequent occurrence of UCDWon shelf at the 300 line, in mouth of trough west of AdelaideIsland (Marguerite Trough).
72 H. W.Ducklow et al. Marine pelagic ecosystems: the WAP
the high correlations we observed for sea ice advance.
This may be due in part to the ice advance beingmore sensitive to climate variability than its retreat
(Stammerjohn et al. in press b). The equatorwardexpansion of sea ice during advance is unconstrained
physically (no continental boundary to the immediatenorth) and can quickly occur (relative to the retreat),
given the ability to rapidly vent ocean heat, especially
during cold air outbursts. In contrast, sea ice retreat isconstrained physically by incoming warm air masses,
by the physical presence of the Antarctic and alsoby increasing sea ice thickness; thus more time is
needed to melt ice relative to growing ice. Further,Stammerjohn et al. (in press a) show that the negative
impacts from individual La Nina and positive SAM
events (both associated with earlier sea ice retreats andlater sea ice advances) appear to outweigh the positive
impacts from El Nino and negative SAM events, andthus strongly contribute to the overall trend of
decreasing winter sea ice duration.Within the context of the rapid warming of the AP
region we summarize our current findings as follows.
The strongest trends in surface air temperature areduring midwinter months, peaking in July, with a 6.38C
increase since 1951. In contrast, the strongest trends insea ice are occurring during the austral spring–summer
when sea ice is retreating and during the subsequentaustral autumn when sea ice is advancing. The trend
towards a later advance and earlier retreat results in
decreased winter sea ice duration. A shorter sea iceseason implies less time for sea ice to thicken (both
thermodynamically and mechanically). An overallthinner sea ice cover can be more mobile, thus less
Phil. Trans. R. Soc. B (2007)
concentrated and more variable (both of which havebeen observed in the WAP region). Decreased wintersea ice duration, concentration and presumably thick-ness, are changes that would, perhaps quite dramati-cally, increase winter ocean heat flux, both to theoverlying atmosphere through leads and other openings,as well as to the underside of sea ice and marine glaciers(see §3). In turn, the increased ocean heat flux wouldamplify thewinter air temperature trend, the decrease insea ice thickness (Stammerjohn et al. in press b) and themarine glacier retreat (Cook et al. 2005).
Therefore, the rapid warming in winter in the APregion may largely be due to changes occurring in theatmospheric circulation during austral spring, summerand autumn that are negatively affecting the advanceand retreat such that winter sea ice duration, concen-tration and thickness are decreasing, and ocean winterheat flux is increasing.
3. PHYSICAL OCEANOGRAPHYThe most voluminous source of ocean heat andnutrients in the Southern Ocean, Circumpolar DeepWater (CDW), is transported by the AntarcticCircumpolar Current (ACC). Research in the PAL-LTER (Martinson et al. in press) and throughout theSouthern Ocean (Orsi et al. 1995) show that theclimatological southern edge or boundary of the ACC(SBACC, defined in Orsi et al. 1995 as the southernlimit of Upper CDW (UCDW) characteristics) liesalong the continental shelf break in the WAP region. Tothe north is the SACCF (the southernmost currentcore of the ACC). The close proximity of the ACC tothe broad continental shelves of the WAP (including
4.0(a)
(b)
3.8
3.6
3.4
3.2
3.0
2.8
2.6
2.4
2.2
2.0
3.8
3.6
3.4
3.21994 1996 1998 2000 2002 2004
1930 1940 1950 1960
number of profiles per average
rms about µ
sm
–0.7˚C warming of 300m columnof water below winter mixed layer(+4 W/m2 increased F
T for same ∆Q
shelf)
1930–1989 mean Qslope
= (2.98±0.16)×109
1990–2004 average Qslope
= (3.83±0.07)×109
1970
year
Qsl
ope
(×10
9 J
m–2
)Q
shel
f (×
109
J m
–2 )
1980 1990 2000182227112
all shelf stations
42010
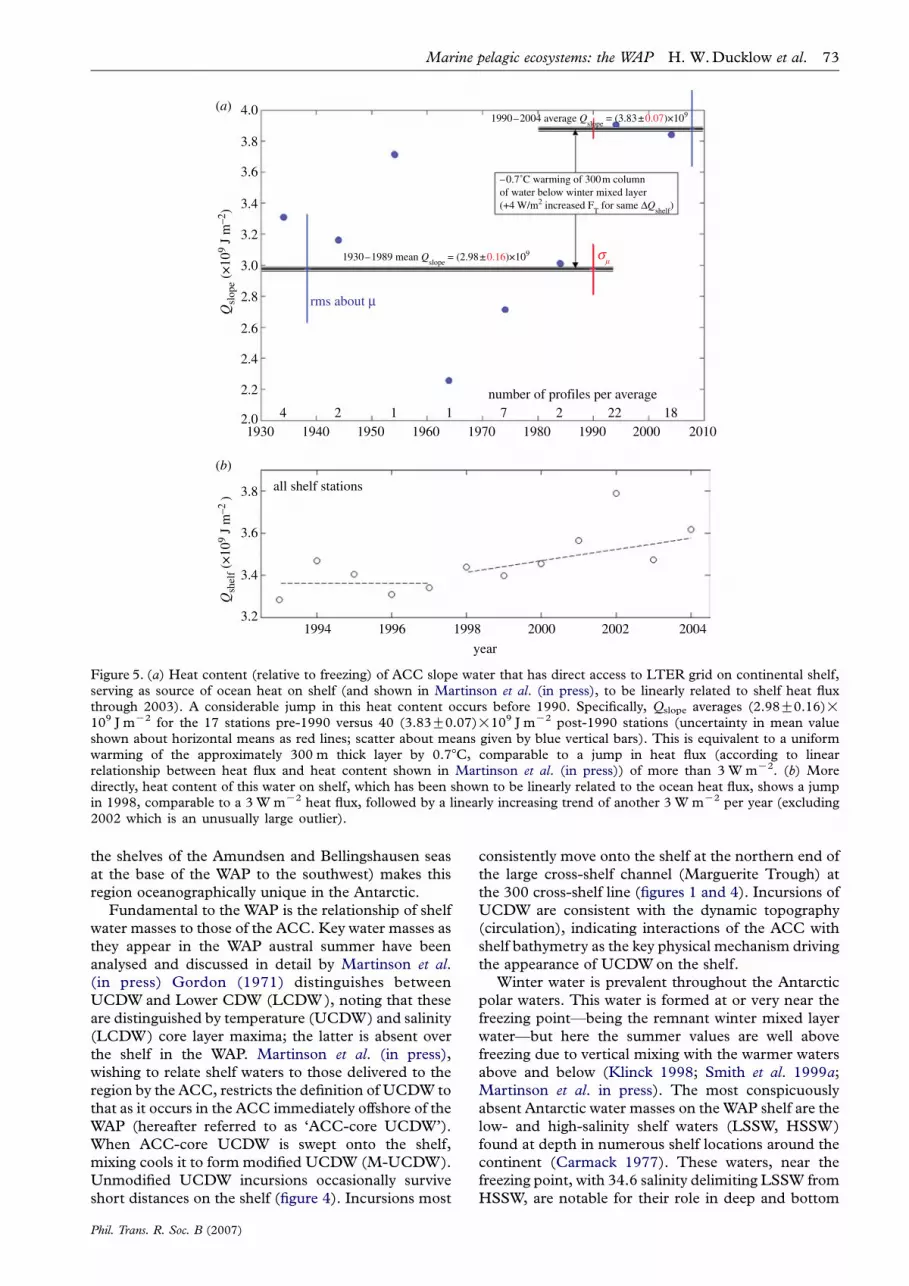
Figure 5. (a) Heat content (relative to freezing) of ACC slope water that has direct access to LTER grid on continental shelf,serving as source of ocean heat on shelf (and shown in Martinson et al. (in press), to be linearly related to shelf heat fluxthrough 2003). A considerable jump in this heat content occurs before 1990. Specifically, Qslope averages (2.98G0.16)!109 J mK2 for the 17 stations pre-1990 versus 40 (3.83G0.07)!109 J mK2 post-1990 stations (uncertainty in mean valueshown about horizontal means as red lines; scatter about means given by blue vertical bars). This is equivalent to a uniformwarming of the approximately 300 m thick layer by 0.78C, comparable to a jump in heat flux (according to linearrelationship between heat flux and heat content shown in Martinson et al. (in press)) of more than 3 W mK2. (b) Moredirectly, heat content of this water on shelf, which has been shown to be linearly related to the ocean heat flux, shows a jumpin 1998, comparable to a 3 W mK2 heat flux, followed by a linearly increasing trend of another 3 W mK2 per year (excluding2002 which is an unusually large outlier).
Marine pelagic ecosystems: the WAP H. W.Ducklow et al. 73
the shelves of the Amundsen and Bellingshausen seas
at the base of the WAP to the southwest) makes this
region oceanographically unique in the Antarctic.
Fundamental to the WAP is the relationship of shelf
water masses to those of the ACC. Key water masses as
they appear in the WAP austral summer have been
analysed and discussed in detail by Martinson et al.(in press) Gordon (1971) distinguishes between
UCDW and Lower CDW (LCDW), noting that these
are distinguished by temperature (UCDW) and salinity
(LCDW) core layer maxima; the latter is absent over
the shelf in the WAP. Martinson et al. (in press),
wishing to relate shelf waters to those delivered to the
region by the ACC, restricts the definition of UCDW to
that as it occurs in the ACC immediately offshore of the
WAP (hereafter referred to as ‘ACC-core UCDW’).
When ACC-core UCDW is swept onto the shelf,
mixing cools it to form modified UCDW (M-UCDW).
Unmodified UCDW incursions occasionally survive
short distances on the shelf (figure 4). Incursions most
Phil. Trans. R. Soc. B (2007)
consistently move onto the shelf at the northern end of
the large cross-shelf channel (Marguerite Trough) at
the 300 cross-shelf line (figures 1 and 4). Incursions of
UCDW are consistent with the dynamic topography
(circulation), indicating interactions of the ACC with
shelf bathymetry as the key physical mechanism driving
the appearance of UCDWon the shelf.
Winter water is prevalent throughout the Antarctic
polar waters. This water is formed at or very near the
freezing point—being the remnant winter mixed layer
water—but here the summer values are well above
freezing due to vertical mixing with the warmer waters
above and below (Klinck 1998; Smith et al. 1999a;Martinson et al. in press). The most conspicuously
absent Antarctic water masses on the WAP shelf are the
low- and high-salinity shelf waters (LSSW, HSSW)
found at depth in numerous shelf locations around the
continent (Carmack 1977). These waters, near the
freezing point, with 34.6 salinity delimiting LSSW from
HSSW, are notable for their role in deep and bottom
74 H. W.Ducklow et al. Marine pelagic ecosystems: the WAP
water formation (Gill 1973). This absence is consistentwith the notion that bottom waters do not form in theWAP region today. LCDW is not commonly seen onthe WAP shelf.
UCDW is quickly modified (cooled by mixing) as itmoves across the shelf, cooling approximately linearlywith distance from the slope (source) of the ACC-coreUCDW. The significance of the cooling of thisrelatively warm water (3–48C above the freezingpoint) on the continental shelf is that the heat is passedfrom the water either to the atmosphere through leadsand other openings or to the underside of ice (both seaice and marine glaciers) thus melting it. This isimportant given the role of glacial ice melt to risingsea level, and the ocean heat is the only source ofenough heat to melt this ice (the heat content of water is1000 times larger than that of a comparable volume ofair at the same temperature above freezing). Recentresearch in the Pal-LTER region, using two differentapproaches for estimating the ocean heat flux suggeststhat the heat flux from the ocean has resulted in asubstantial increase in the water temperature andassociated heat flux beginning in the 1990s (figure 5;comparable with a number of other changes docu-mented throughout the region for sea ice and otherclimate variables, Stammerjohn et al. in press a).Figure 5 shows that the increase in heat flux since1990 is sufficient to cause a w0.78C warming of theupper 300 m of the water column below the wintermixed layer—and indicates that the warming noted byMeredith & King (2005) extends well below the surfacelayer. There was a further jump in the heat flux after1998, with an increasing trend since then (figure 5b).This increase is a profound change in the physicalenvironment and underlines the role of ocean circula-tion as the principal driver translating climate warminginto ecosystem changes on the WAP shelf. The heatflux is also a proxy for nutrient fluxes because UCDWis the primary imported source of these as well as heat;see §4a.
4. NUTRIENTS AND CARBON(a) Nutrients and UCDW intrusions
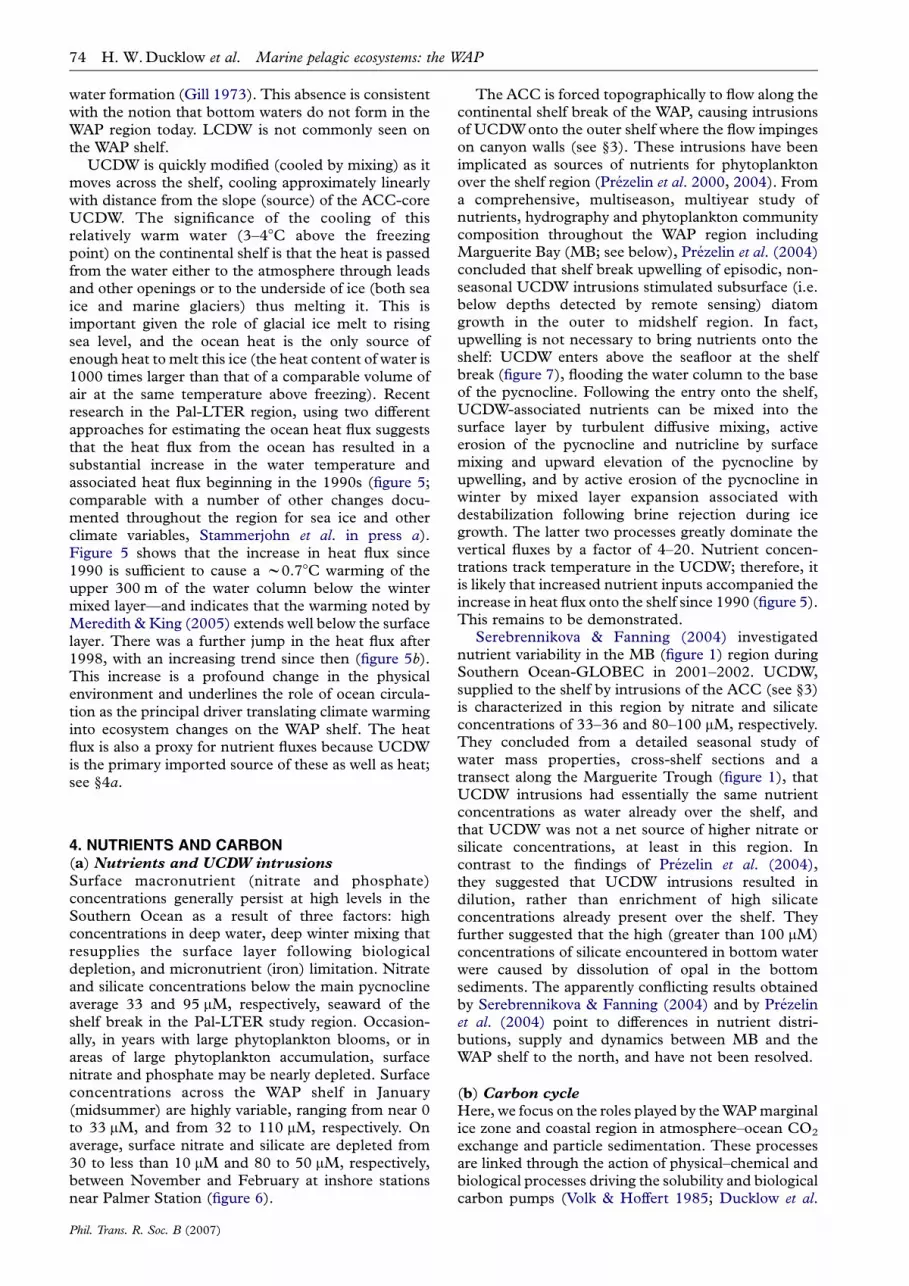
Surface macronutrient (nitrate and phosphate)concentrations generally persist at high levels in theSouthern Ocean as a result of three factors: highconcentrations in deep water, deep winter mixing thatresupplies the surface layer following biologicaldepletion, and micronutrient (iron) limitation. Nitrateand silicate concentrations below the main pycnoclineaverage 33 and 95 mM, respectively, seaward of theshelf break in the Pal-LTER study region. Occasion-ally, in years with large phytoplankton blooms, or inareas of large phytoplankton accumulation, surfacenitrate and phosphate may be nearly depleted. Surfaceconcentrations across the WAP shelf in January(midsummer) are highly variable, ranging from near 0to 33 mM, and from 32 to 110 mM, respectively. Onaverage, surface nitrate and silicate are depleted from30 to less than 10 mM and 80 to 50 mM, respectively,between November and February at inshore stationsnear Palmer Station (figure 6).
Phil. Trans. R. Soc. B (2007)
The ACC is forced topographically to flow along thecontinental shelf break of the WAP, causing intrusionsof UCDWonto the outer shelf where the flow impingeson canyon walls (see §3). These intrusions have beenimplicated as sources of nutrients for phytoplanktonover the shelf region (Prezelin et al. 2000, 2004). Froma comprehensive, multiseason, multiyear study ofnutrients, hydrography and phytoplankton communitycomposition throughout the WAP region includingMarguerite Bay (MB; see below), Prezelin et al. (2004)concluded that shelf break upwelling of episodic, non-seasonal UCDW intrusions stimulated subsurface (i.e.below depths detected by remote sensing) diatomgrowth in the outer to midshelf region. In fact,upwelling is not necessary to bring nutrients onto theshelf: UCDW enters above the seafloor at the shelfbreak (figure 7), flooding the water column to the baseof the pycnocline. Following the entry onto the shelf,UCDW-associated nutrients can be mixed into thesurface layer by turbulent diffusive mixing, activeerosion of the pycnocline and nutricline by surfacemixing and upward elevation of the pycnocline byupwelling, and by active erosion of the pycnocline inwinter by mixed layer expansion associated withdestabilization following brine rejection during icegrowth. The latter two processes greatly dominate thevertical fluxes by a factor of 4–20. Nutrient concen-trations track temperature in the UCDW; therefore, itis likely that increased nutrient inputs accompanied theincrease in heat flux onto the shelf since 1990 (figure 5).This remains to be demonstrated.
Serebrennikova & Fanning (2004) investigatednutrient variability in the MB (figure 1) region duringSouthern Ocean-GLOBEC in 2001–2002. UCDW,supplied to the shelf by intrusions of the ACC (see §3)is characterized in this region by nitrate and silicateconcentrations of 33–36 and 80–100 mM, respectively.They concluded from a detailed seasonal study ofwater mass properties, cross-shelf sections and atransect along the Marguerite Trough (figure 1), thatUCDW intrusions had essentially the same nutrientconcentrations as water already over the shelf, andthat UCDW was not a net source of higher nitrate orsilicate concentrations, at least in this region. Incontrast to the findings of Prezelin et al. (2004),they suggested that UCDW intrusions resulted indilution, rather than enrichment of high silicateconcentrations already present over the shelf. Theyfurther suggested that the high (greater than 100 mM)concentrations of silicate encountered in bottom waterwere caused by dissolution of opal in the bottomsediments. The apparently conflicting results obtainedby Serebrennikova & Fanning (2004) and by Prezelinet al. (2004) point to differences in nutrient distri-butions, supply and dynamics between MB and theWAP shelf to the north, and have not been resolved.
(b) Carbon cycle
Here, we focus on the roles played by theWAPmarginalice zone and coastal region in atmosphere–ocean CO2
exchange and particle sedimentation. These processesare linked through the action of physical–chemical andbiological processes driving the solubility and biologicalcarbon pumps (Volk & Hoffert 1985; Ducklow et al.
30
25
20
15
10
5
0
90
80
70
60
50
4016 Oct 5 Nov 25 Nov 15 Dec 05 Jan 25 Jan 14 Feb 06 Mar 24 Mar
date
µM S
iO2
µM N
O3
(a)
(b)
Figure 6. Surface layer nutrient utilization. (a)Nitrate and (b) silicate depletion at inshore time-series station near Palmer Station,1993–2004. Error bars show standard errors. The number of data points for each 5-day interval ranges from 1 (no bars) to 12.
Marine pelagic ecosystems: the WAP H. W.Ducklow et al. 75
2001b) that transport dissolved inorganic carbon (DIC
or TCO2) as well as dissolved organic carbon (DOC)
against the vertical concentration gradient towards
long-term storage in the deep ocean (Ducklow &
McCallister 2004; Feely et al. 2001). The Southern
Ocean below 508 S, with 10% of the total ocean area, is
responsible for approximately 20% of the global ocean
CO2 uptake (0.47 of 2.2 Pg C yrK1; Takahashi et al.2002). Polar continental shelves covered by seasonal sea
ice have been hypothesized to act as rectified (one-way)
CO2 pumps, due to the phasing of sea ice cover and
biological activity. Sea surface temperature is almost
constant near Antarctica (relative to lower-latitude
systems) and the CO2 partial pressure (pCO2) excur-
sion in seawater governing CO2 gas exchange is almost
entirely due to biological drawdown and respiration
(Takahashi et al. 2002). In nearshore areas, dilution of
seawater with high DIC by glacial meltwater with
negligible DIC is also important. Yager et al. (1995)found that the northeast water polynya on the Green-
land Shelf was strongly undersaturated in the summer,
ice-free season. They put forward the ‘seasonal
rectification hypothesis’, stating that in marginal ice
zones, the ice-free season coincides with the main
summer period of low pCO2, when the regions act as
atmospheric sinks. At other times of the year, when
pCO2 could be well above saturation, the water is
Phil. Trans. R. Soc. B (2007)
covered by sea ice and gas exchange is prevented. In
spring, primary production may consume excess DIC
even before the ice cover recedes. Yager et al. (1995) andMiller et al. (2002) used estimates of CO2 exchange in
the ice-free season as an annual average for air–sea gas
exchange, leading to very areal high estimates of the air
to sea flux. The Ross Sea polynya may function as such
as a sink for atmospheric CO2 because it is strongly
undersaturated in CO2 in summer in response to the
Phaeocystis bloom (Takahashi et al. 2002) and covered
by ice during the rest of the year.
Whether the WAP shelves act as rectified or
unrectified net annual CO2 sinks is not established.
The Pal-LTER grid (figure 1) has been surveyed for
DIC each January since 1993 (Carrillo et al. 2004). The
area is characterized by large spatial and temporal
variability and by the co-occurrence of various biologi-
cal (e.g. respiration and photosynthesis) and physical
(e.g. heating, cooling, ice formation and ablation,
melting, freshening and dilution) processes, all of
which make understanding and budgeting very challen-
ging. Carrillo et al. (2004) studied these variations in
detail using high spatial resolution underway mapping
of surface fCO2 and fO2 ( fZfugacity, similar to pCO2)
during cruises in January and July 1997. Different
regions of the Pal-LTER grid showed different patterns
of CO2 and O2 over- and undersaturation, resulting

0
Qslope200
400
600
800
1000
dept
h (d
b)
1200
1400
1600
1800
2000150 –4040 0120200
200250
300
350
tem
pera
ture
sec
tion
400
450
500
550600
650
0
200
400
600
800
1000
dept
h (d
b)
1200
1400
1600
1800
2000200300400500600
grid line200300400500600
grid line
2000 2001
(a) (b)
(c) (d)
2.0
1.5
0
–0.5
–1.0
1.0
0.5
tem
pera
ture
(°C
)
2002 2003
Figure 7. Temperature sections along the red line shown in inset of (a) off Palmer LTER sampling region. Heavy black line showsaverage depth of shelf break. UCDW is the warmest (orange–red) water in each panel. Note that UCDW has direct access toshelf, providing considerable heat and nutrients.
76 H. W.Ducklow et al. Marine pelagic ecosystems: the WAP
from spatial variation in dominance of physical orbiological processes. Even in summer, dissolved CO2
was near atmospheric equilibrium in some regions,particularly offshore and towards the north part of thegrid. This pattern leads to some doubt regarding theuniversality of the rectified sink hypothesis.
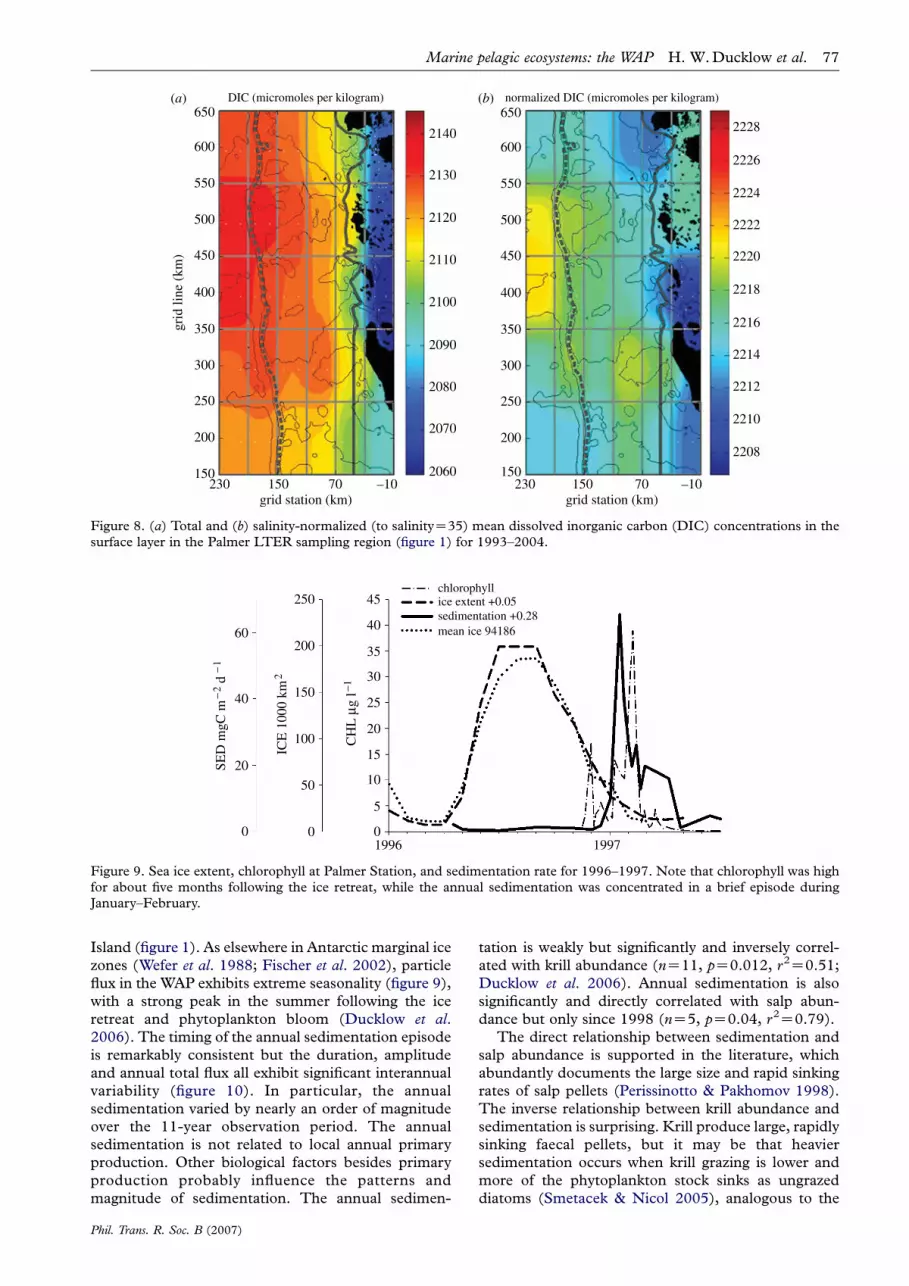
Positive net community production (NCP) is thedominant biological process in the inshore areas andespecially in MB, leading to strong drawdown of DICand undersaturation of dissolved CO2 (pCO2!200 p.p.m.). Serebrennikova & Fanning (2004) estim-ated NCP from total inorganic N and Si drawdownover the growing season. They found that NCPestimated from net N utilization was 3.8G1.9 and2.8G1.3 mol C mK2 yrK1 in MB in 2001 and 2002.NCP estimated from Si utilization was 1.1 and0.9 mol C mK2 yrK1, suggesting diatoms were respon-sible for about 30% of the annual NCP. The estimatesfor NCP in MB are comparable to the estimates madein the hyperproductive Ross Sea by Sweeney et al.(2000a,b; 3.9G0.9 mol C mK2 yrK1), but the range inMB was 0.6–9.6 mol C mK2 yrK1. Figure 8 shows theaverage distribution of DIC over the Pal-LTER grid for1993–2005. Normalization of the DIC concentrationsto salinity of 35 indicates the strong dilution by glacial
Phil. Trans. R. Soc. B (2007)
meltwater in the nearshore zone. Higher concen-trations offshore may reflect offshore inputs, and thedrawdown south of Anvers Island reveals the effects ofthe phytoplankton bloom in the northern area.
(c) Dissolved organic carbon
There have been fewmeasurements of DOC in theWAPshelf region. DOC concentrations in January range45–50 mM, against a deepwater background concen-tration of 39 mM (H. W. Ducklow 2005, unpublisheddata). Carlson et al. (1998) showed that DOC accumu-lation was similarly low in the Ross Sea (cf. Bermudasummertime DOC of 60–70 mM and Hawaii, greaterthan 70 mM) and suggested that Antarctic planktonsystems funnel most of the seasonal net primaryproduction through the particulate, not dissolved carbonpools. This appears to be true in the WAP as well.
(d) Sedimentation
CO2 uptake in the WAP is strongly influenced byvertical sedimentation (Karl et al. 1991b). PalmerLTER has maintained a sediment trap moored at64.58 S, 668 W since 1993, about 100 km from PalmerStation in 350 m depth (trap depth 150 m) andseaward of the Palmer Deep trough west of Anvers
250
200
150
100
50
00
20
40
60
SED
mgC
m − 2
d − 1
ICE
100
0 km
2
CH
L µ
g l −1
45
40
35
30
25
20
15
10
5
01996 1997
chlorophyllice extent +0.05sedimentation +0.28mean ice 94186
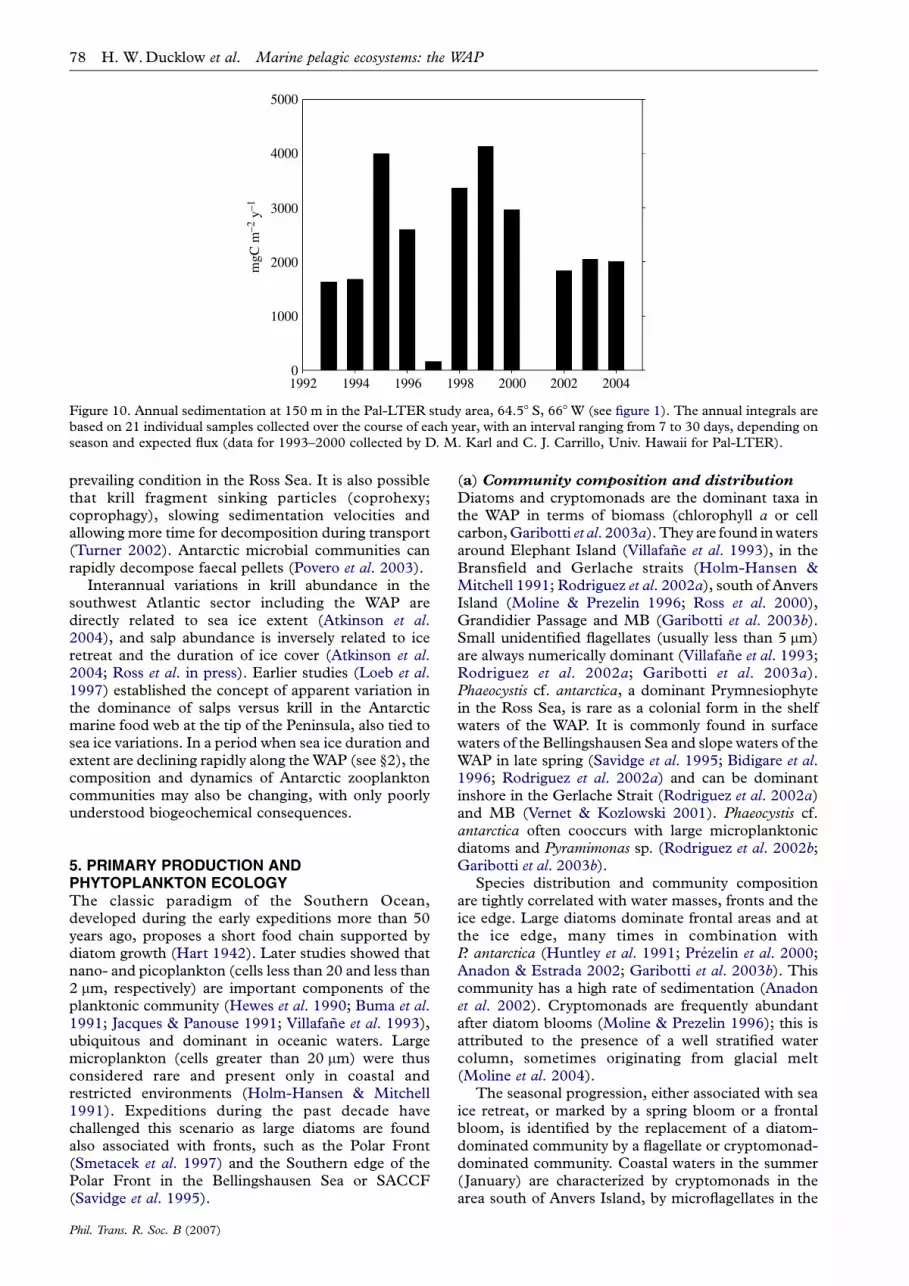
Figure 9. Sea ice extent, chlorophyll at Palmer Station, and sedimentation rate for 1996–1997. Note that chlorophyll was highfor about five months following the ice retreat, while the annual sedimentation was concentrated in a brief episode duringJanuary–February.
150230 150
grid station (km) grid station (km)70 –10 230 150 70 –10
200
250
300
350
400
grid
line
(km
) 450
500
550
600
650(a) (b)
150
200
250
300
350
400
450
500
550
600
650
2140
2130
2120
2110
2100
2090
2080
2070
2060
2228
2226
2224
2222
2220
2218
2216
2214
2212
2210
2208
DIC (micromoles per kilogram) normalized DIC (micromoles per kilogram)
Figure 8. (a) Total and (b) salinity-normalized (to salinityZ35) mean dissolved inorganic carbon (DIC) concentrations in thesurface layer in the Palmer LTER sampling region (figure 1) for 1993–2004.
Marine pelagic ecosystems: the WAP H. W.Ducklow et al. 77
Island (figure 1). As elsewhere in Antarctic marginal ice
zones (Wefer et al. 1988; Fischer et al. 2002), particleflux in the WAP exhibits extreme seasonality (figure 9),
with a strong peak in the summer following the ice
retreat and phytoplankton bloom (Ducklow et al.2006). The timing of the annual sedimentation episode
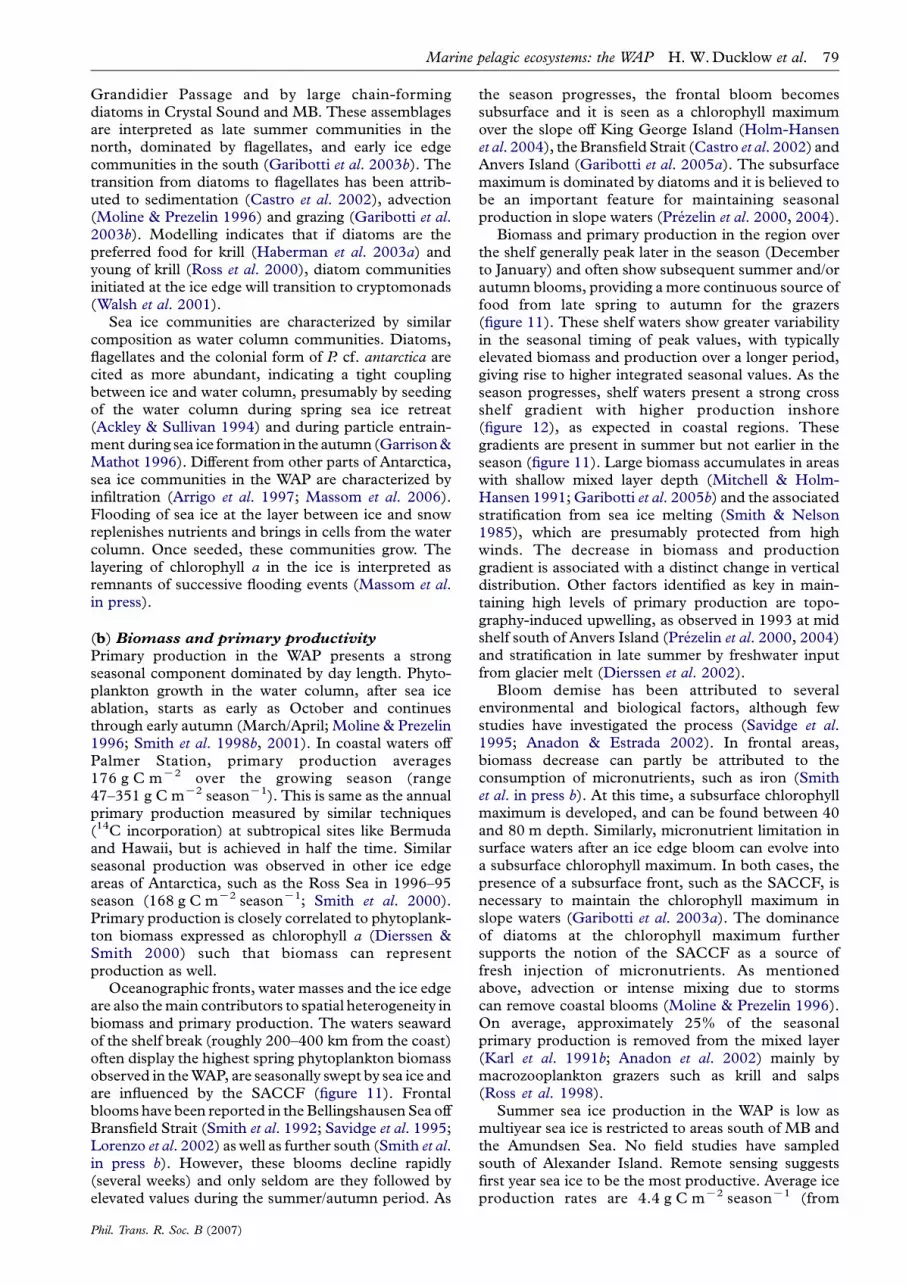
is remarkably consistent but the duration, amplitude
and annual total flux all exhibit significant interannual
variability (figure 10). In particular, the annual
sedimentation varied by nearly an order of magnitude
over the 11-year observation period. The annual
sedimentation is not related to local annual primary
production. Other biological factors besides primary
production probably influence the patterns and
magnitude of sedimentation. The annual sedimen-
Phil. Trans. R. Soc. B (2007)
tation is weakly but significantly and inversely correl-
ated with krill abundance (nZ11, pZ0.012, r2Z0.51;
Ducklow et al. 2006). Annual sedimentation is also
significantly and directly correlated with salp abun-
dance but only since 1998 (nZ5, pZ0.04, r2Z0.79).
The direct relationship between sedimentation and
salp abundance is supported in the literature, which
abundantly documents the large size and rapid sinking
rates of salp pellets (Perissinotto & Pakhomov 1998).
The inverse relationship between krill abundance and
sedimentation is surprising. Krill produce large, rapidly
sinking faecal pellets, but it may be that heavier
sedimentation occurs when krill grazing is lower and
more of the phytoplankton stock sinks as ungrazed
diatoms (Smetacek & Nicol 2005), analogous to the
5000
4000
3000
2000
1000
01992 1994 1996 1998 2000 2002 2004
mgC
m–2
y–1
Figure 10. Annual sedimentation at 150 m in the Pal-LTER study area, 64.58 S, 668W (see figure 1). The annual integrals arebased on 21 individual samples collected over the course of each year, with an interval ranging from 7 to 30 days, depending onseason and expected flux (data for 1993–2000 collected by D. M. Karl and C. J. Carrillo, Univ. Hawaii for Pal-LTER).
78 H. W.Ducklow et al. Marine pelagic ecosystems: the WAP
prevailing condition in the Ross Sea. It is also possiblethat krill fragment sinking particles (coprohexy;coprophagy), slowing sedimentation velocities andallowing more time for decomposition during transport(Turner 2002). Antarctic microbial communities canrapidly decompose faecal pellets (Povero et al. 2003).
Interannual variations in krill abundance in thesouthwest Atlantic sector including the WAP aredirectly related to sea ice extent (Atkinson et al.2004), and salp abundance is inversely related to iceretreat and the duration of ice cover (Atkinson et al.2004; Ross et al. in press). Earlier studies (Loeb et al.1997) established the concept of apparent variation inthe dominance of salps versus krill in the Antarcticmarine food web at the tip of the Peninsula, also tied tosea ice variations. In a period when sea ice duration andextent are declining rapidly along theWAP (see §2), thecomposition and dynamics of Antarctic zooplanktoncommunities may also be changing, with only poorlyunderstood biogeochemical consequences.
5. PRIMARY PRODUCTION ANDPHYTOPLANKTON ECOLOGYThe classic paradigm of the Southern Ocean,developed during the early expeditions more than 50years ago, proposes a short food chain supported bydiatom growth (Hart 1942). Later studies showed thatnano- and picoplankton (cells less than 20 and less than2 mm, respectively) are important components of theplanktonic community (Hewes et al. 1990; Buma et al.1991; Jacques & Panouse 1991; Villafane et al. 1993),ubiquitous and dominant in oceanic waters. Largemicroplankton (cells greater than 20 mm) were thusconsidered rare and present only in coastal andrestricted environments (Holm-Hansen & Mitchell1991). Expeditions during the past decade havechallenged this scenario as large diatoms are foundalso associated with fronts, such as the Polar Front(Smetacek et al. 1997) and the Southern edge of thePolar Front in the Bellingshausen Sea or SACCF(Savidge et al. 1995).
Phil. Trans. R. Soc. B (2007)
(a) Community composition and distribution
Diatoms and cryptomonads are the dominant taxa inthe WAP in terms of biomass (chlorophyll a or cellcarbon,Garibotti et al. 2003a).They are found inwatersaround Elephant Island (Villafane et al. 1993), in theBransfield and Gerlache straits (Holm-Hansen &Mitchell 1991; Rodriguez et al. 2002a), south of AnversIsland (Moline & Prezelin 1996; Ross et al. 2000),Grandidier Passage and MB (Garibotti et al. 2003b).Small unidentified flagellates (usually less than 5 mm)are always numerically dominant (Villafane et al. 1993;Rodriguez et al. 2002a; Garibotti et al. 2003a).Phaeocystis cf. antarctica, a dominant Prymnesiophytein the Ross Sea, is rare as a colonial form in the shelfwaters of the WAP. It is commonly found in surfacewaters of the Bellingshausen Sea and slope waters of theWAP in late spring (Savidge et al. 1995; Bidigare et al.1996; Rodriguez et al. 2002a) and can be dominantinshore in the Gerlache Strait (Rodriguez et al. 2002a)and MB (Vernet & Kozlowski 2001). Phaeocystis cf.antarctica often cooccurs with large microplanktonicdiatoms and Pyramimonas sp. (Rodriguez et al. 2002b;Garibotti et al. 2003b).
Species distribution and community compositionare tightly correlated with water masses, fronts and theice edge. Large diatoms dominate frontal areas and atthe ice edge, many times in combination withP. antarctica (Huntley et al. 1991; Prezelin et al. 2000;Anadon & Estrada 2002; Garibotti et al. 2003b). Thiscommunity has a high rate of sedimentation (Anadonet al. 2002). Cryptomonads are frequently abundantafter diatom blooms (Moline & Prezelin 1996); this isattributed to the presence of a well stratified watercolumn, sometimes originating from glacial melt(Moline et al. 2004).
The seasonal progression, either associated with seaice retreat, or marked by a spring bloom or a frontalbloom, is identified by the replacement of a diatom-dominated community by a flagellate or cryptomonad-dominated community. Coastal waters in the summer(January) are characterized by cryptomonads in thearea south of Anvers Island, by microflagellates in the
Marine pelagic ecosystems: the WAP H. W.Ducklow et al. 79
Grandidier Passage and by large chain-formingdiatoms in Crystal Sound and MB. These assemblagesare interpreted as late summer communities in thenorth, dominated by flagellates, and early ice edgecommunities in the south (Garibotti et al. 2003b). Thetransition from diatoms to flagellates has been attrib-uted to sedimentation (Castro et al. 2002), advection(Moline & Prezelin 1996) and grazing (Garibotti et al.2003b). Modelling indicates that if diatoms are thepreferred food for krill (Haberman et al. 2003a) andyoung of krill (Ross et al. 2000), diatom communitiesinitiated at the ice edge will transition to cryptomonads(Walsh et al. 2001).
Sea ice communities are characterized by similarcomposition as water column communities. Diatoms,flagellates and the colonial form of P. cf. antarctica arecited as more abundant, indicating a tight couplingbetween ice and water column, presumably by seedingof the water column during spring sea ice retreat(Ackley & Sullivan 1994) and during particle entrain-ment during sea ice formation in the autumn(Garrison&Mathot 1996). Different from other parts of Antarctica,sea ice communities in the WAP are characterized byinfiltration (Arrigo et al. 1997; Massom et al. 2006).Flooding of sea ice at the layer between ice and snowreplenishes nutrients and brings in cells from the watercolumn. Once seeded, these communities grow. Thelayering of chlorophyll a in the ice is interpreted asremnants of successive flooding events (Massom et al.in press).
(b) Biomass and primary productivity
Primary production in the WAP presents a strongseasonal component dominated by day length. Phyto-plankton growth in the water column, after sea iceablation, starts as early as October and continuesthrough early autumn (March/April; Moline & Prezelin1996; Smith et al. 1998b, 2001). In coastal waters offPalmer Station, primary production averages176 g C mK2 over the growing season (range47–351 g C mK2 seasonK1). This is same as the annualprimary production measured by similar techniques(14C incorporation) at subtropical sites like Bermudaand Hawaii, but is achieved in half the time. Similarseasonal production was observed in other ice edgeareas of Antarctica, such as the Ross Sea in 1996–95season (168 g C mK2 seasonK1; Smith et al. 2000).Primary production is closely correlated to phytoplank-ton biomass expressed as chlorophyll a (Dierssen &Smith 2000) such that biomass can representproduction as well.
Oceanographic fronts, water masses and the ice edgeare also themain contributors to spatial heterogeneity inbiomass and primary production. The waters seawardof the shelf break (roughly 200–400 km from the coast)often display the highest spring phytoplankton biomassobserved in theWAP, are seasonally swept by sea ice andare influenced by the SACCF (figure 11). Frontalblooms have been reported in theBellingshausen Sea offBransfield Strait (Smith et al. 1992; Savidge et al. 1995;Lorenzo et al. 2002) as well as further south (Smith et al.in press b). However, these blooms decline rapidly(several weeks) and only seldom are they followed byelevated values during the summer/autumn period. As
Phil. Trans. R. Soc. B (2007)
the season progresses, the frontal bloom becomessubsurface and it is seen as a chlorophyll maximumover the slope off King George Island (Holm-Hansenet al. 2004), theBransfield Strait (Castro et al. 2002) andAnvers Island (Garibotti et al. 2005a). The subsurfacemaximum is dominated by diatoms and it is believed tobe an important feature for maintaining seasonalproduction in slope waters (Prezelin et al. 2000, 2004).
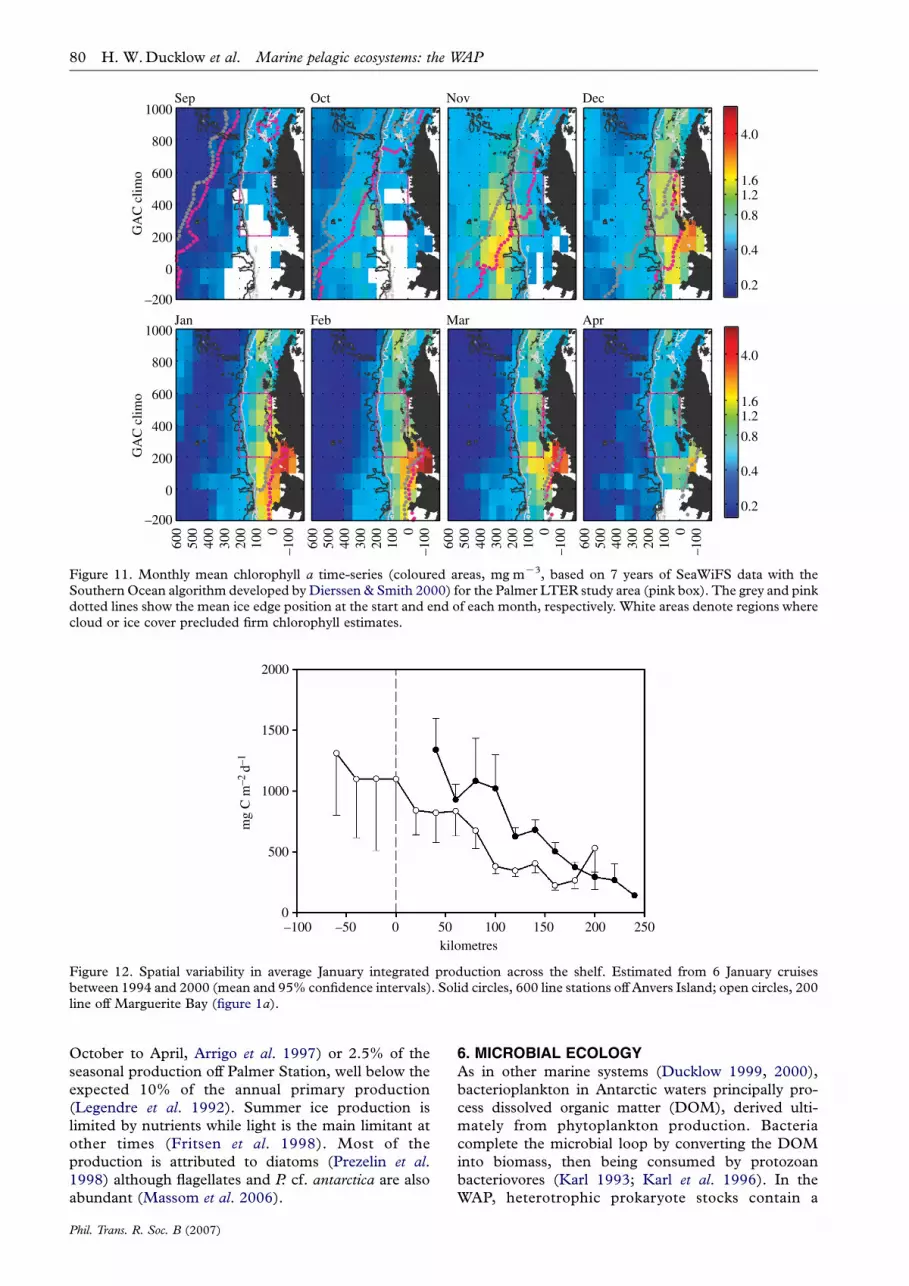
Biomass and primary production in the region overthe shelf generally peak later in the season (Decemberto January) and often show subsequent summer and/orautumn blooms, providing a more continuous source offood from late spring to autumn for the grazers(figure 11). These shelf waters show greater variabilityin the seasonal timing of peak values, with typicallyelevated biomass and production over a longer period,giving rise to higher integrated seasonal values. As theseason progresses, shelf waters present a strong crossshelf gradient with higher production inshore(figure 12), as expected in coastal regions. Thesegradients are present in summer but not earlier in theseason (figure 11). Large biomass accumulates in areaswith shallow mixed layer depth (Mitchell & Holm-Hansen 1991; Garibotti et al. 2005b) and the associatedstratification from sea ice melting (Smith & Nelson1985), which are presumably protected from highwinds. The decrease in biomass and productiongradient is associated with a distinct change in verticaldistribution. Other factors identified as key in main-taining high levels of primary production are topo-graphy-induced upwelling, as observed in 1993 at midshelf south of Anvers Island (Prezelin et al. 2000, 2004)and stratification in late summer by freshwater inputfrom glacier melt (Dierssen et al. 2002).
Bloom demise has been attributed to severalenvironmental and biological factors, although fewstudies have investigated the process (Savidge et al.1995; Anadon & Estrada 2002). In frontal areas,biomass decrease can partly be attributed to theconsumption of micronutrients, such as iron (Smithet al. in press b). At this time, a subsurface chlorophyllmaximum is developed, and can be found between 40and 80 m depth. Similarly, micronutrient limitation insurface waters after an ice edge bloom can evolve intoa subsurface chlorophyll maximum. In both cases, thepresence of a subsurface front, such as the SACCF, isnecessary to maintain the chlorophyll maximum inslope waters (Garibotti et al. 2003a). The dominanceof diatoms at the chlorophyll maximum furthersupports the notion of the SACCF as a source offresh injection of micronutrients. As mentionedabove, advection or intense mixing due to stormscan remove coastal blooms (Moline & Prezelin 1996).On average, approximately 25% of the seasonalprimary production is removed from the mixed layer(Karl et al. 1991b; Anadon et al. 2002) mainly bymacrozooplankton grazers such as krill and salps(Ross et al. 1998).
Summer sea ice production in the WAP is low asmultiyear sea ice is restricted to areas south of MB andthe Amundsen Sea. No field studies have sampledsouth of Alexander Island. Remote sensing suggestsfirst year sea ice to be the most productive. Average iceproduction rates are 4.4 g C mK2 seasonK1 (from
Sep
GA
C c
limo
–200
0
200
400
600
800
1000
GA
C c
limo
–200
0
200
400
600
800
1000
Oct Nov Dec
Jan
–1000
100
200
300
400
500
600
Feb
–1000
100
200
300
400
500
600
Mar
–1000
100
200
300
400
500
600
Apr
–1000
100
200
300
400
500
600
0.2
0.4
0.8
1.21.6
4.0
0.2
0.4
0.8
1.21.6
4.0
Figure 11. Monthly mean chlorophyll a time-series (coloured areas, mg mK3, based on 7 years of SeaWiFS data with theSouthern Ocean algorithm developed by Dierssen & Smith 2000) for the Palmer LTER study area (pink box). The grey and pinkdotted lines show the mean ice edge position at the start and end of each month, respectively. White areas denote regions wherecloud or ice cover precluded firm chlorophyll estimates.
2000
1500
1000
500
0–100 –50 0 50 100 150 200 250
kilometres
mg
C m
–2 d
–1
Figure 12. Spatial variability in average January integrated production across the shelf. Estimated from 6 January cruisesbetween 1994 and 2000 (mean and 95% confidence intervals). Solid circles, 600 line stations off Anvers Island; open circles, 200line off Marguerite Bay (figure 1a).
80 H. W.Ducklow et al. Marine pelagic ecosystems: the WAP
October to April, Arrigo et al. 1997) or 2.5% of the
seasonal production off Palmer Station, well below the
expected 10% of the annual primary production
(Legendre et al. 1992). Summer ice production is
limited by nutrients while light is the main limitant at
other times (Fritsen et al. 1998). Most of the
production is attributed to diatoms (Prezelin et al.1998) although flagellates and P. cf. antarctica are also
abundant (Massom et al. 2006).
Phil. Trans. R. Soc. B (2007)
6. MICROBIAL ECOLOGYAs in other marine systems (Ducklow 1999, 2000),
bacterioplankton in Antarctic waters principally pro-
cess dissolved organic matter (DOM), derived ulti-
mately from phytoplankton production. Bacteria
complete the microbial loop by converting the DOM
into biomass, then being consumed by protozoan
bacteriovores (Karl 1993; Karl et al. 1996). In the
WAP, heterotrophic prokaryote stocks contain a
1
10
100
1000
0 10 20 30
per cent of Archaea
met
res
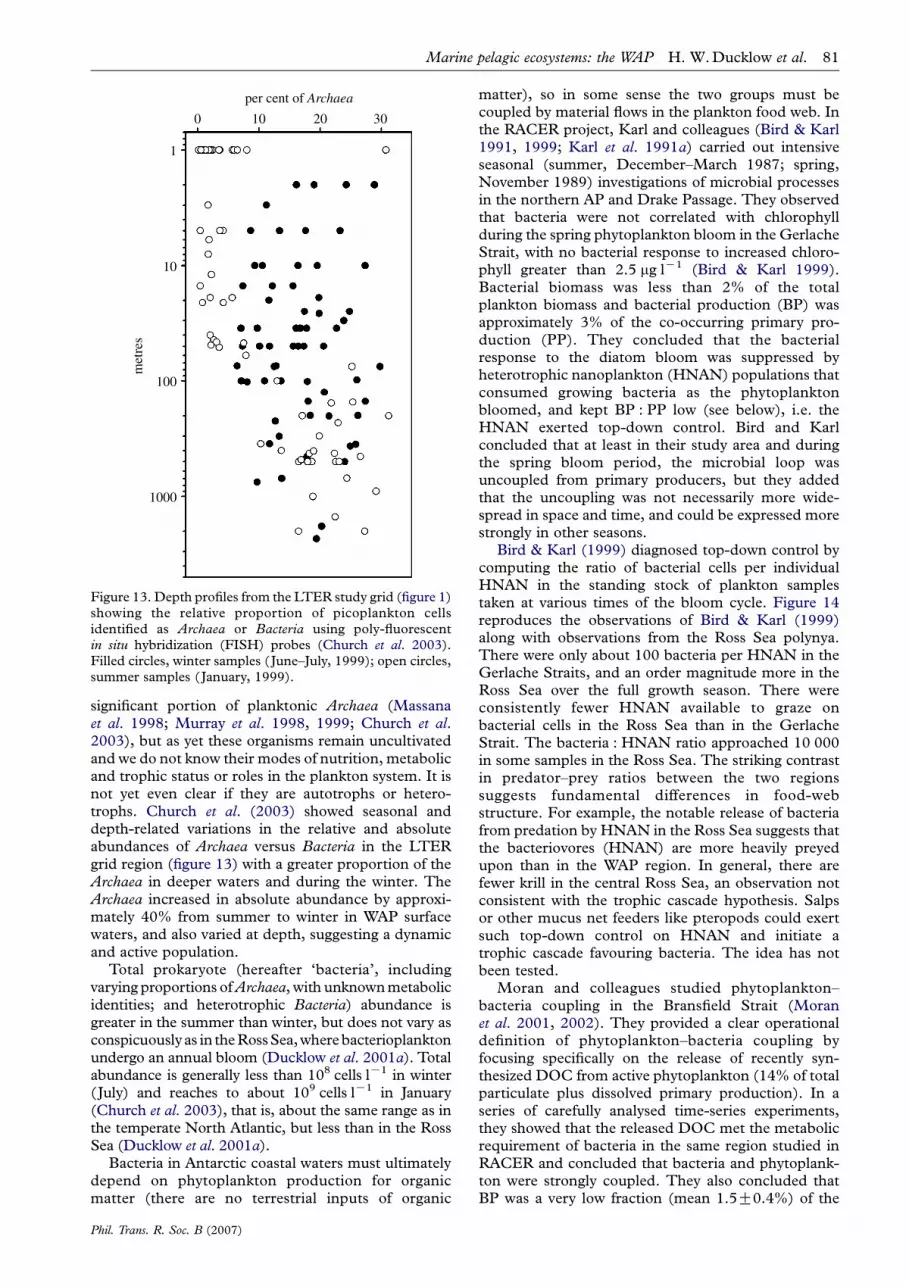
Figure 13. Depth profiles from the LTER study grid (figure 1)showing the relative proportion of picoplankton cellsidentified as Archaea or Bacteria using poly-fluorescentin situ hybridization (FISH) probes (Church et al. 2003).Filled circles, winter samples (June–July, 1999); open circles,summer samples (January, 1999).
Marine pelagic ecosystems: the WAP H. W.Ducklow et al. 81
significant portion of planktonic Archaea (Massanaet al. 1998; Murray et al. 1998, 1999; Church et al.2003), but as yet these organisms remain uncultivatedand we do not know their modes of nutrition, metabolicand trophic status or roles in the plankton system. It isnot yet even clear if they are autotrophs or hetero-trophs. Church et al. (2003) showed seasonal anddepth-related variations in the relative and absoluteabundances of Archaea versus Bacteria in the LTERgrid region (figure 13) with a greater proportion of theArchaea in deeper waters and during the winter. TheArchaea increased in absolute abundance by approxi-mately 40% from summer to winter in WAP surfacewaters, and also varied at depth, suggesting a dynamicand active population.
Total prokaryote (hereafter ‘bacteria’, includingvarying proportions ofArchaea, with unknownmetabolicidentities; and heterotrophic Bacteria) abundance isgreater in the summer than winter, but does not vary asconspicuously as in theRossSea,wherebacterioplanktonundergo an annual bloom (Ducklow et al. 2001a). Totalabundance is generally less than 108 cells lK1 in winter(July) and reaches to about 109 cells lK1 in January(Church et al. 2003), that is, about the same range as inthe temperate North Atlantic, but less than in the RossSea (Ducklow et al. 2001a).
Bacteria in Antarctic coastal waters must ultimatelydepend on phytoplankton production for organicmatter (there are no terrestrial inputs of organic
Phil. Trans. R. Soc. B (2007)
matter), so in some sense the two groups must becoupled by material flows in the plankton food web. Inthe RACER project, Karl and colleagues (Bird & Karl1991, 1999; Karl et al. 1991a) carried out intensiveseasonal (summer, December–March 1987; spring,November 1989) investigations of microbial processesin the northern AP and Drake Passage. They observedthat bacteria were not correlated with chlorophyllduring the spring phytoplankton bloom in the GerlacheStrait, with no bacterial response to increased chloro-phyll greater than 2.5 mg lK1 (Bird & Karl 1999).Bacterial biomass was less than 2% of the totalplankton biomass and bacterial production (BP) wasapproximately 3% of the co-occurring primary pro-duction (PP). They concluded that the bacterialresponse to the diatom bloom was suppressed byheterotrophic nanoplankton (HNAN) populations thatconsumed growing bacteria as the phytoplanktonbloomed, and kept BP : PP low (see below), i.e. theHNAN exerted top-down control. Bird and Karlconcluded that at least in their study area and duringthe spring bloom period, the microbial loop wasuncoupled from primary producers, but they addedthat the uncoupling was not necessarily more wide-spread in space and time, and could be expressed morestrongly in other seasons.
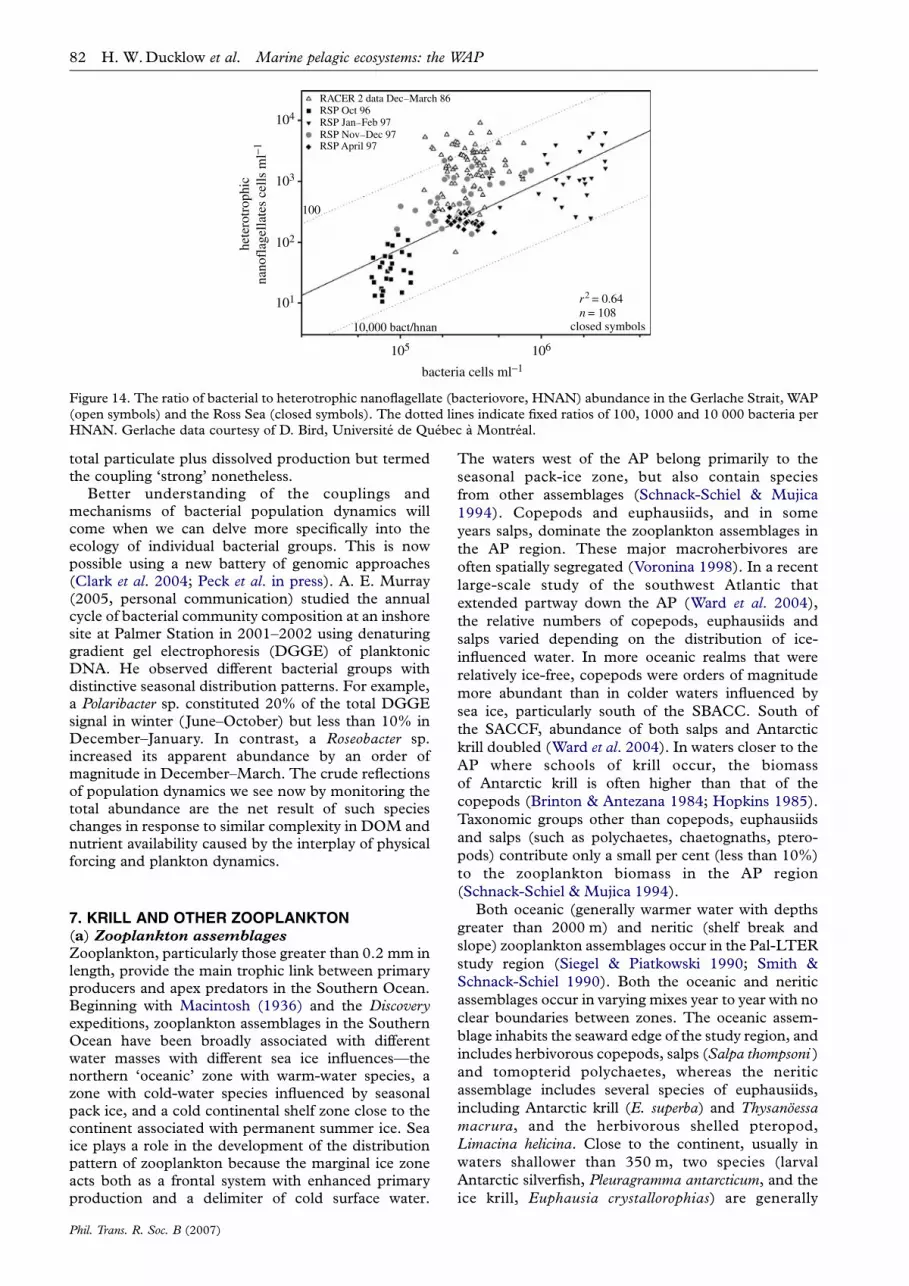
Bird & Karl (1999) diagnosed top-down control bycomputing the ratio of bacterial cells per individualHNAN in the standing stock of plankton samplestaken at various times of the bloom cycle. Figure 14reproduces the observations of Bird & Karl (1999)along with observations from the Ross Sea polynya.There were only about 100 bacteria per HNAN in theGerlache Straits, and an order magnitude more in theRoss Sea over the full growth season. There wereconsistently fewer HNAN available to graze onbacterial cells in the Ross Sea than in the GerlacheStrait. The bacteria : HNAN ratio approached 10 000in some samples in the Ross Sea. The striking contrastin predator–prey ratios between the two regionssuggests fundamental differences in food-webstructure. For example, the notable release of bacteriafrom predation by HNAN in the Ross Sea suggests thatthe bacteriovores (HNAN) are more heavily preyedupon than in the WAP region. In general, there arefewer krill in the central Ross Sea, an observation notconsistent with the trophic cascade hypothesis. Salpsor other mucus net feeders like pteropods could exertsuch top-down control on HNAN and initiate atrophic cascade favouring bacteria. The idea has notbeen tested.
Moran and colleagues studied phytoplankton–bacteria coupling in the Bransfield Strait (Moranet al. 2001, 2002). They provided a clear operationaldefinition of phytoplankton–bacteria coupling byfocusing specifically on the release of recently syn-thesized DOC from active phytoplankton (14% of totalparticulate plus dissolved primary production). In aseries of carefully analysed time-series experiments,they showed that the released DOC met the metabolicrequirement of bacteria in the same region studied inRACER and concluded that bacteria and phytoplank-ton were strongly coupled. They also concluded thatBP was a very low fraction (mean 1.5G0.4%) of the
104
103
102
101
105 106
bacteria cells ml−1
hete
rotr
ophi
cna
nofl
agel
late
s ce
lls m
l−1
100
10,000 bact/hnan
RACER 2 data Dec–March 86RSP Oct 96RSP Jan–Feb 97RSP Nov–Dec 97RSP April 97
r2 = 0.64n = 108
closed symbols
Figure 14. The ratio of bacterial to heterotrophic nanoflagellate (bacteriovore, HNAN) abundance in the Gerlache Strait, WAP(open symbols) and the Ross Sea (closed symbols). The dotted lines indicate fixed ratios of 100, 1000 and 10 000 bacteria perHNAN. Gerlache data courtesy of D. Bird, Universite de Quebec a Montreal.
82 H. W.Ducklow et al. Marine pelagic ecosystems: the WAP
total particulate plus dissolved production but termedthe coupling ‘strong’ nonetheless.
Better understanding of the couplings andmechanisms of bacterial population dynamics willcome when we can delve more specifically into theecology of individual bacterial groups. This is nowpossible using a new battery of genomic approaches(Clark et al. 2004; Peck et al. in press). A. E. Murray(2005, personal communication) studied the annualcycle of bacterial community composition at an inshoresite at Palmer Station in 2001–2002 using denaturinggradient gel electrophoresis (DGGE) of planktonicDNA. He observed different bacterial groups withdistinctive seasonal distribution patterns. For example,a Polaribacter sp. constituted 20% of the total DGGEsignal in winter (June–October) but less than 10% inDecember–January. In contrast, a Roseobacter sp.increased its apparent abundance by an order ofmagnitude in December–March. The crude reflectionsof population dynamics we see now by monitoring thetotal abundance are the net result of such specieschanges in response to similar complexity in DOM andnutrient availability caused by the interplay of physicalforcing and plankton dynamics.
7. KRILL AND OTHER ZOOPLANKTON(a) Zooplankton assemblages
Zooplankton, particularly those greater than 0.2 mm inlength, provide the main trophic link between primaryproducers and apex predators in the Southern Ocean.Beginning with Macintosh (1936) and the Discoveryexpeditions, zooplankton assemblages in the SouthernOcean have been broadly associated with differentwater masses with different sea ice influences—thenorthern ‘oceanic’ zone with warm-water species, azone with cold-water species influenced by seasonalpack ice, and a cold continental shelf zone close to thecontinent associated with permanent summer ice. Seaice plays a role in the development of the distributionpattern of zooplankton because the marginal ice zoneacts both as a frontal system with enhanced primaryproduction and a delimiter of cold surface water.
Phil. Trans. R. Soc. B (2007)
The waters west of the AP belong primarily to the
seasonal pack-ice zone, but also contain species
from other assemblages (Schnack-Schiel & Mujica
1994). Copepods and euphausiids, and in some
years salps, dominate the zooplankton assemblages in
the AP region. These major macroherbivores are
often spatially segregated (Voronina 1998). In a recent
large-scale study of the southwest Atlantic that
extended partway down the AP (Ward et al. 2004),
the relative numbers of copepods, euphausiids and
salps varied depending on the distribution of ice-
influenced water. In more oceanic realms that were
relatively ice-free, copepods were orders of magnitude
more abundant than in colder waters influenced by
sea ice, particularly south of the SBACC. South of
the SACCF, abundance of both salps and Antarctic
krill doubled (Ward et al. 2004). In waters closer to the
AP where schools of krill occur, the biomass
of Antarctic krill is often higher than that of the
copepods (Brinton & Antezana 1984; Hopkins 1985).
Taxonomic groups other than copepods, euphausiids
and salps (such as polychaetes, chaetognaths, ptero-
pods) contribute only a small per cent (less than 10%)
to the zooplankton biomass in the AP region
(Schnack-Schiel & Mujica 1994).
Both oceanic (generally warmer water with depths
greater than 2000 m) and neritic (shelf break and
slope) zooplankton assemblages occur in the Pal-LTER
study region (Siegel & Piatkowski 1990; Smith &
Schnack-Schiel 1990). Both the oceanic and neritic
assemblages occur in varying mixes year to year with no
clear boundaries between zones. The oceanic assem-
blage inhabits the seaward edge of the study region, and
includes herbivorous copepods, salps (Salpa thompsoni )and tomopterid polychaetes, whereas the neritic
assemblage includes several species of euphausiids,
including Antarctic krill (E. superba) and Thysanoessamacrura, and the herbivorous shelled pteropod,
Limacina helicina. Close to the continent, usually in
waters shallower than 350 m, two species (larval
Antarctic silverfish, Pleuragramma antarcticum, and the
ice krill, Euphausia crystallorophias) are generally
Marine pelagic ecosystems: the WAP H. W.Ducklow et al. 83
considered indicator species for a zone of coldcontinental shelf water (Smith& Schnack-Schiel 1990).
Salps and Antarctic krill often dominate the totalzooplankton biomass, accounting for over 50% of thevolume in 62% of the tows conducted in summers1993–2004, and for over 70% in 48% of the same tows.Catches varied in the presence or absence of krill andsalps: 45% contained both krill and salps; 45%, krilland no salps; 4%, salps and no krill; and 3.3%, neitherspecies. This large spatial scale co-occurrence of salpsand Antarctic krill is not common. In most otherregions there is a relatively distinct demarcation in thehabitats of these two species (Loeb et al. 1997;Voronina 1998; Nicol et al. 2000; Atkinson et al.2004), although in the recent large scale CCAMLR(Commission for the Conservation of Antarctic MarineLiving Resources) 2000 study in the southwestAtlantic, considerable overlap was also found in thedistributions of the two species (Kawaguchi et al.2004). West of the AP, the SBACC comes closer to theshelf break than in most of the Southern Ocean, whichmay foster the mixing of the two assemblages.
(b) Trends or cycles
Some evidence exists for trends and/or cycles inzooplankton abundance, specifically salps and Antarc-tic krill. Atkinson et al. (2004), in a study of net towdata from around the Southern Ocean, suggested thatsalps increased and Antarctic krill decreased in thesouthwest Atlantic between 1976 and 2004. Smaller-scale (both time and space) studies of zooplankton westof the AP support the increase in salp numbers at thetip of the peninsula (Loeb et al. 1997) and in the Pal-LTER region (Ross et al. in press). For example,between 1993 and 1998 there were only 2 years withabundances of salps above the long-term mean on themid-grid and southern shelf. However, from 1999 tothe present, abundances have been above the long-termmean in most regions, suggesting that there has been adistinct shift in the frequency of occurrence of salpsacross the entire Palmer Shelf (Ross et al. in press).This shift is consistent with the observation ofPakhomov et al. (2002) that during the past twodecades the region of dense concentrations ofS. thompsoni has extended southwards to approximately658 S, i.e. the latitude of the most northern transect lineof the Palmer summer study region. Confirmation ofthe trend found by Atkinson et al. (2004) for Antarctickrill is more problematic (Smetacek &Nicol 2005). Forexample, a shorter acoustic time-series from thenorthern tip of the AP shows different patterns thanthe net-tow time-series (Hewitt et al. 2003). Some ofthe difficulties with studying trends in Antarctic krill aretechnical (patchiness, net avoidance, acoustic calibra-tions, etc.), but others lie in attempting to detect alinear trend in a species with a cycle in populationabundance due to variability in recruitment (Siegel &Loeb 1995; Quetin & Ross 2003).
Fewer studies have investigated trends in otherzooplankton species. In the Pal-LTER region, abun-dance and distribution of the two indicator species forcold continental shelf water (larvae of Antarcticsilverfish and ice krill) have shown different patternsover the past 12 years. For larval Antarctic silverfish,
Phil. Trans. R. Soc. B (2007)
abundance at the northern coastal stations decreaseddramatically between 1997 and 1998, and none havebeen found at those stations since 1999. However,abundance of larval Antarctic silverfish at the southerncoastal stations remained about the same throughoutthe time-series. The distribution and abundance of theice krill, E. crystallorophias, has not shown any long-term trends, but is correlated in time and space with theday of ice retreat (Ross et al. in press), and thus wouldbe expected to change if the trend in the day of retreatcontinues.
(c) Antarctic krill as a key species
Historically, Antarctic krill have been studied farmore extensively than other Southern Ocean zoo-plankton (Huntley et al. 1991; El-Sayed 1994;Hofmann et al. 2004). Antarctic krill occupy a keyposition in the ecosystem, as they are both animportant prey item for many of the seabirds andmammals in the region (Everson 2000), and adominant grazer, particularly of the larger phyto-plankton (Ross et al. 1998; Garibotti et al. 2003a),and produce fast-sinking faecal pellets that contributeto carbon flux. Studies have also been conducted togather data on both Antarctic krill and the ecology ofthe ‘krill-based ecosystem’ (Watkins et al. 2004) tohelp in the management of its stocks by CCAMLR(Hewitt et al. 2004). Two long-term studies havebeen established in the waters west of the AP: initiallythe Antarctic Marine Living Resources (AMLR)programme was primarily sited at the tip of the AP,but it now currently includes prey and oceanographystudies ranging from the tip of the peninsula throughBransfield Strait and outside the South ShetlandIslands; the Pal-LTER study region is to the south ofthe AMLR study region in an area with comparativelylittle historical research on the zooplankton commu-nity. Shelf areas east and west of the AP have beensuggested as the source region for populations oflarvae and young krill for the high krill biomassregions in the Scotia Sea and its surrounding shelfareas with many of the major predator colonies ofthe Southern Ocean (Croxall et al. 1988; Murphyet al. 2004).
(d) Interface with primary production
Historically, concentrations of Antarctic krill arecoherent with phytoplankton concentrations at rela-tively long length-scales, but not coherent at length-scales below about 20 km (Weber & El-Sayed 1986).Within the Pal-LTER study region, north/south andon/offshore gradients in primary production arereflected in the gradients in abundance of Antarctickrill. Krill abundance is generally higher at inner shelfstations than offshore, and higher in the north than thesouth in January (figure 15, cf. figure 12). The samedistribution will not hold in the autumn and winterwhen Antarctic krill are concentrated inshore at innershelf stations and in the fjords (Siegel 1988; Ross et al.1996; Lascara et al. 1999; Ashjian et al. 2004; Lawsonet al. 2004). The main difference between the gradientsfor primary production and Antarctic krill abundanceis the decrease in abundance at the innermost stationsof the 200 line for krill compared to a continuing

500
400
300
200
100
00 50 100 200150
cross-shelf distance (km)
abun
danc
e pe
r 10
00m
3
Figure 15. Gradients in abundance of Euphausia superba within the Palmer LTER region in January. Mean abundance(1993–2004) with standard error for abundance within standard grid cells 100 km alongshore and 20 km on/offshore.Abundance estimates from the delta distribution (Ross et al. in press). Abundance data shown for the 600 line (invertedtriangles) just south of Anvers Island, and the 200 line (open circles) which enters Marguerite Bay just south of Adelaide Island.
84 H. W.Ducklow et al. Marine pelagic ecosystems: the WAP
increase for primary production. What possiblemechanism could underlie this difference? One possi-bility to explore is the role of phytoplankton commu-nity composition in controlling the distribution of krill.Adult Antarctic krill are known to select for diatomswhen given mixtures of diatoms and prymnesiophytesor diatoms and cryptomonads (Haberman et al.2003a,b). Higher growth rates of young krill in thefield were also observed when phytoplankton commu-nities were dominated by diatoms and not prymnesio-phytes (Ross et al. 2000). Reproduction was alsocorrelated with measures of primary production. Theper cent of female krill reproducing during thereproductive season varied between 10 and 90% inthe first 7 years of the Pal-LTER sampling, and wassignificantly correlated with annual primary pro-duction (Quetin & Ross 2001). Thus, krill are selectivegrazers, and potentially select the location with themost desirable phytoplankton community.
(e) Interface with seasonal sea ice
The concept that Antarctic krill populations are tightlycoupled to seasonal sea ice dynamics stems from earlyobservations that the distribution of Antarctic krill wascoherent with the region affected by the seasonaladvance and retreat of sea ice (Marr 1962; Laws1985). Based on behavioural and physiological evi-dence from research in the 1980s (Daly 1990;Smetacek et al. 1990; Ross & Quetin 1991; Quetinet al. 1996), the initial LTER hypotheses regardingrecruitment in Antarctic krill addressed the interactionof krill with seasonal sea ice both during the first winterfor the larvae (a critical period, Ross & Quetin 1991)and during the austral spring prior to spawning. Thepotential mechanisms underlying interannual variabil-ity in recruitment success included, (i) higher young-of-the-year survival after winters of heavy sea ice extentbecause the under-ice habitat with its resident sea icemicrobial communities plays an important role inwinter growth rates and, potentially, survival of larvalkrill and (ii) higher reproductive effort (the number of
Phil. Trans. R. Soc. B (2007)
larvae produced) after a spring of high sea ice extentbased on the assumption that food levels in the australspring and in the summer (when the ovary isdeveloping and the oocytes mature prior to spawning)will determine reproductive output, and that the foodlevels are partly determined by seasonal sea icedynamics. These hypotheses have expanded to includethe dynamics of the sea ice cycle, the consequences ofthe warming trend west of the AP, and teleconnectionsto the rest of the world’s ocean. The rapidly changingclimate in the region west of the AP, including delay inthe timing of advance of seasonal sea ice and decreasein the extent of summer sea ice (see §2b), suggest thatkrill, and in particular krill recruitment, may be a keyindicator of interactions between climate change ormigration and ecosystem response, including potentialchanges in the classical diatom–krill–higher predatorfood web.
(f ) Time-series of recruitment success
The time-series data from both AMLR and the Pal-LTER have been analysed for recruitment success(Siegel & Loeb 1995; Siegel et al. 1998, 2002; Quetin &Ross 2003). Recruitment success (R1, the proportionof the total population that is AC1 or 1 year old inJanuary) is episodic in these long-lived animals. Twosequential successful year classes (YCs) have domi-nated the 5–6 year cycles in the Pal-LTER region, withstrong YCs in 1990 and 1991, 1995 and 1996, and2001 and 2002 (figure 16) (Quetin & Ross 2003). Atthe northern tip of the AP strong YCs have tended tooccur only once every 5–6 years (Siegel et al. 2003).Basin-scale linkages and interactions are important tounderstanding the structure of the circumpolar eco-system. Given the established linkage between sea-iceand the SOI (see §2c), recruitment success might alsobe linked to a seasonal index of ENSO that wouldsummarize all times relevant to the life cycle of krill, i.e.spring (reproduction) through winter (larval survival).A correlation with the absolute value of summedENSO seasonal rankings (Quetin & Ross 2003;
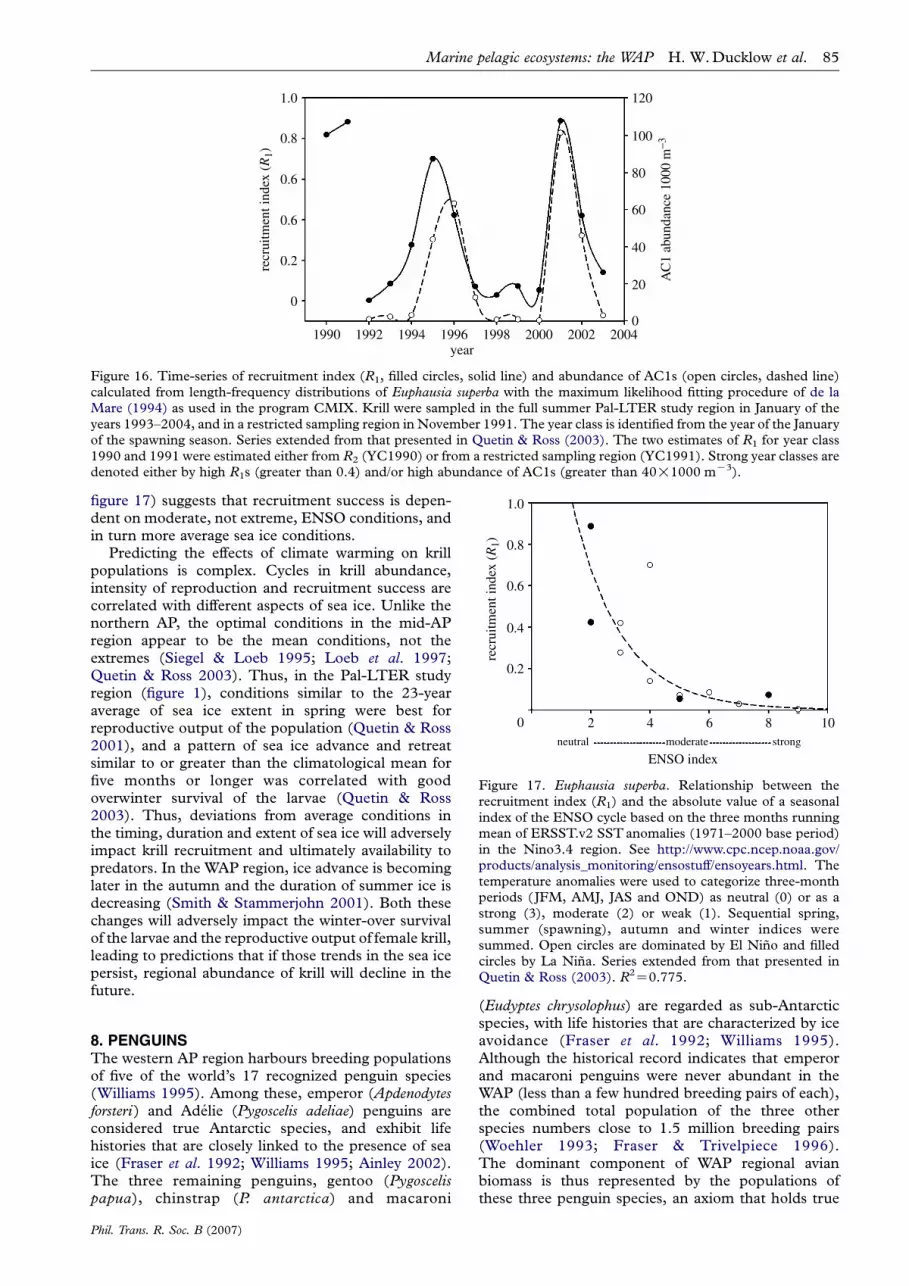
1.0
0.8
0.6
0.4
0.2
0 2 4 6 8 10strongmoderateneutral
ENSO index
recr
uitm
ent i
ndex
(R
1)
Figure 17. Euphausia superba. Relationship between therecruitment index (R1) and the absolute value of a seasonalindex of the ENSO cycle based on the three months runningmean of ERSST.v2 SSTanomalies (1971–2000 base period)in the Nino3.4 region. See http://www.cpc.ncep.noaa.gov/products/analysis_monitoring/ensostuff/ensoyears.html. Thetemperature anomalies were used to categorize three-monthperiods (JFM, AMJ, JAS and OND) as neutral (0) or as astrong (3), moderate (2) or weak (1). Sequential spring,summer (spawning), autumn and winter indices weresummed. Open circles are dominated by El Nino and filledcircles by La Nina. Series extended from that presented inQuetin & Ross (2003). R2Z0.775.
1.0
0.8
0.6
0.6
0.2
0
1990 1992 1994 1996 1998 2000 2002 2004year
recr
uitm
ent i
ndex
(R
1)
120
100
80
60
40
20
0
AC
1 ab
unda
nce
1000
m−3
Figure 16. Time-series of recruitment index (R1, filled circles, solid line) and abundance of AC1s (open circles, dashed line)calculated from length-frequency distributions of Euphausia superba with the maximum likelihood fitting procedure of de laMare (1994) as used in the program CMIX. Krill were sampled in the full summer Pal-LTER study region in January of theyears 1993–2004, and in a restricted sampling region in November 1991. The year class is identified from the year of the Januaryof the spawning season. Series extended from that presented in Quetin & Ross (2003). The two estimates of R1 for year class1990 and 1991 were estimated either from R2 (YC1990) or from a restricted sampling region (YC1991). Strong year classes aredenoted either by high R1s (greater than 0.4) and/or high abundance of AC1s (greater than 40!1000 mK3).
Marine pelagic ecosystems: the WAP H. W.Ducklow et al. 85
figure 17) suggests that recruitment success is depen-dent on moderate, not extreme, ENSO conditions, andin turn more average sea ice conditions.
Predicting the effects of climate warming on krillpopulations is complex. Cycles in krill abundance,intensity of reproduction and recruitment success arecorrelated with different aspects of sea ice. Unlike thenorthern AP, the optimal conditions in the mid-APregion appear to be the mean conditions, not theextremes (Siegel & Loeb 1995; Loeb et al. 1997;Quetin & Ross 2003). Thus, in the Pal-LTER studyregion (figure 1), conditions similar to the 23-yearaverage of sea ice extent in spring were best forreproductive output of the population (Quetin & Ross2001), and a pattern of sea ice advance and retreatsimilar to or greater than the climatological mean forfive months or longer was correlated with goodoverwinter survival of the larvae (Quetin & Ross2003). Thus, deviations from average conditions inthe timing, duration and extent of sea ice will adverselyimpact krill recruitment and ultimately availability topredators. In the WAP region, ice advance is becominglater in the autumn and the duration of summer ice isdecreasing (Smith & Stammerjohn 2001). Both thesechanges will adversely impact the winter-over survivalof the larvae and the reproductive output of female krill,leading to predictions that if those trends in the sea icepersist, regional abundance of krill will decline in thefuture.
8. PENGUINSThe western AP region harbours breeding populationsof five of the world’s 17 recognized penguin species(Williams 1995). Among these, emperor (Apdenodytesforsteri) and Adelie (Pygoscelis adeliae) penguins areconsidered true Antarctic species, and exhibit lifehistories that are closely linked to the presence of seaice (Fraser et al. 1992; Williams 1995; Ainley 2002).The three remaining penguins, gentoo (Pygoscelispapua), chinstrap (P. antarctica) and macaroni
Phil. Trans. R. Soc. B (2007)
(Eudyptes chrysolophus) are regarded as sub-Antarcticspecies, with life histories that are characterized by iceavoidance (Fraser et al. 1992; Williams 1995).Although the historical record indicates that emperorand macaroni penguins were never abundant in theWAP (less than a few hundred breeding pairs of each),the combined total population of the three otherspecies numbers close to 1.5 million breeding pairs(Woehler 1993; Fraser & Trivelpiece 1996).The dominant component of WAP regional avianbiomass is thus represented by the populations ofthese three penguin species, an axiom that holds true
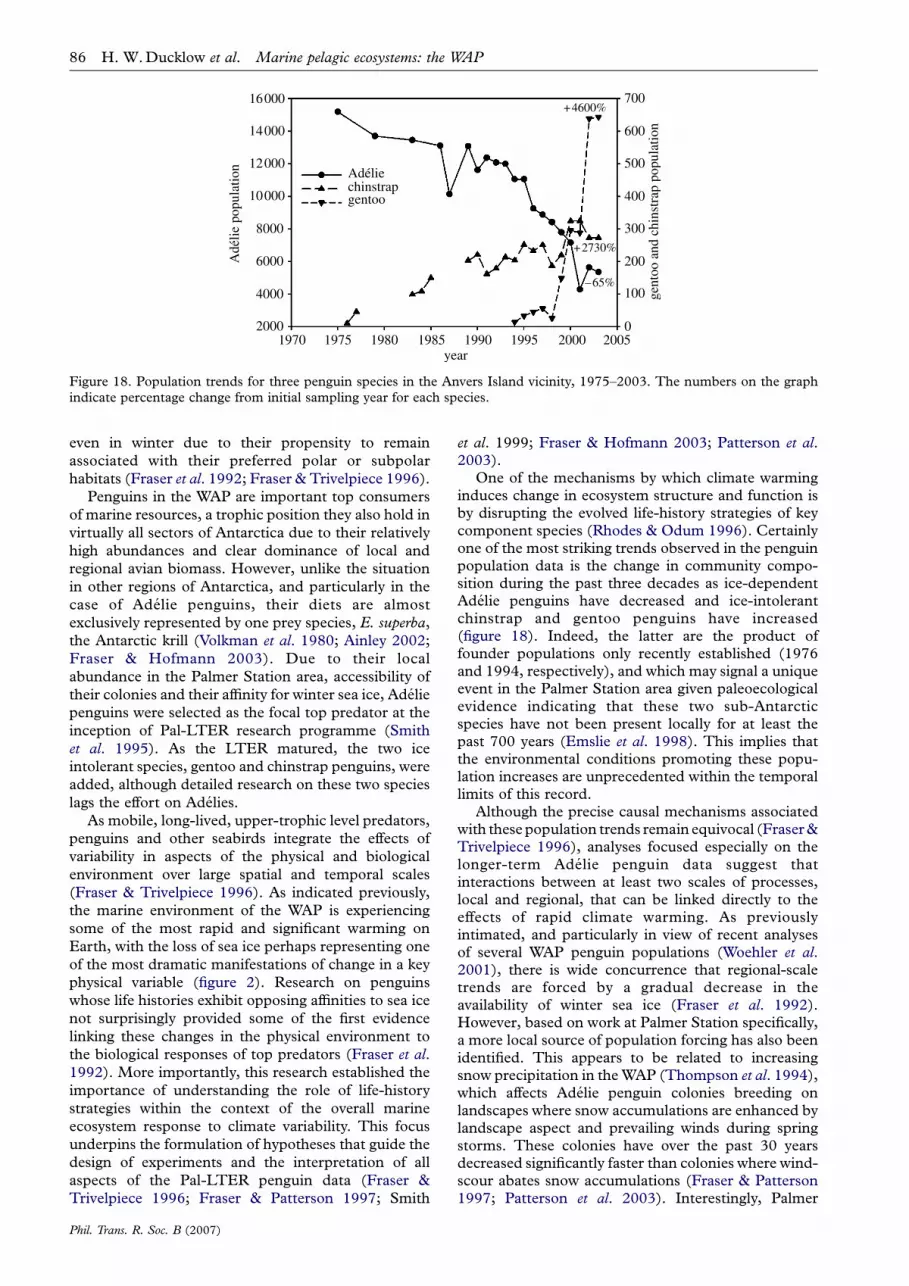
16000
14000
12000
10000
8000
6000
4000
20001970 1975 1980 1985 1990 1995 2000 2005
year
Adé
lie p
opul
atio
n Adéliechinstrapgentoo
+4600%
+2730%
–65%
0
100
200
300
400
500
600
700
gent
oo a
nd c
hins
trap
pop
ulat
ion
Figure 18. Population trends for three penguin species in the Anvers Island vicinity, 1975–2003. The numbers on the graphindicate percentage change from initial sampling year for each species.
86 H. W.Ducklow et al. Marine pelagic ecosystems: the WAP
even in winter due to their propensity to remain
associated with their preferred polar or subpolar
habitats (Fraser et al. 1992; Fraser & Trivelpiece 1996).
Penguins in the WAP are important top consumers
of marine resources, a trophic position they also hold in
virtually all sectors of Antarctica due to their relatively
high abundances and clear dominance of local and
regional avian biomass. However, unlike the situation
in other regions of Antarctica, and particularly in the
case of Adelie penguins, their diets are almost
exclusively represented by one prey species, E. superba,the Antarctic krill (Volkman et al. 1980; Ainley 2002;
Fraser & Hofmann 2003). Due to their local
abundance in the Palmer Station area, accessibility of
their colonies and their affinity for winter sea ice, Adelie
penguins were selected as the focal top predator at the
inception of Pal-LTER research programme (Smith
et al. 1995). As the LTER matured, the two ice
intolerant species, gentoo and chinstrap penguins, were
added, although detailed research on these two species
lags the effort on Adelies.
As mobile, long-lived, upper-trophic level predators,
penguins and other seabirds integrate the effects of
variability in aspects of the physical and biological
environment over large spatial and temporal scales
(Fraser & Trivelpiece 1996). As indicated previously,
the marine environment of the WAP is experiencing
some of the most rapid and significant warming on
Earth, with the loss of sea ice perhaps representing one
of the most dramatic manifestations of change in a key
physical variable (figure 2). Research on penguins
whose life histories exhibit opposing affinities to sea ice
not surprisingly provided some of the first evidence
linking these changes in the physical environment to
the biological responses of top predators (Fraser et al.1992). More importantly, this research established the
importance of understanding the role of life-history
strategies within the context of the overall marine
ecosystem response to climate variability. This focus
underpins the formulation of hypotheses that guide the
design of experiments and the interpretation of all
aspects of the Pal-LTER penguin data (Fraser &
Trivelpiece 1996; Fraser & Patterson 1997; Smith
Phil. Trans. R. Soc. B (2007)
et al. 1999; Fraser & Hofmann 2003; Patterson et al.2003).
One of the mechanisms by which climate warminginduces change in ecosystem structure and function isby disrupting the evolved life-history strategies of keycomponent species (Rhodes & Odum 1996). Certainlyone of the most striking trends observed in the penguinpopulation data is the change in community compo-sition during the past three decades as ice-dependentAdelie penguins have decreased and ice-intolerantchinstrap and gentoo penguins have increased(figure 18). Indeed, the latter are the product offounder populations only recently established (1976and 1994, respectively), and which may signal a uniqueevent in the Palmer Station area given paleoecologicalevidence indicating that these two sub-Antarcticspecies have not been present locally for at least thepast 700 years (Emslie et al. 1998). This implies thatthe environmental conditions promoting these popu-lation increases are unprecedented within the temporallimits of this record.
Although the precise causal mechanisms associatedwith these population trends remain equivocal (Fraser&Trivelpiece 1996), analyses focused especially on thelonger-term Adelie penguin data suggest thatinteractions between at least two scales of processes,local and regional, that can be linked directly to theeffects of rapid climate warming. As previouslyintimated, and particularly in view of recent analysesof several WAP penguin populations (Woehler et al.2001), there is wide concurrence that regional-scaletrends are forced by a gradual decrease in theavailability of winter sea ice (Fraser et al. 1992).However, based on work at Palmer Station specifically,a more local source of population forcing has also beenidentified. This appears to be related to increasingsnow precipitation in theWAP (Thompson et al. 1994),which affects Adelie penguin colonies breeding onlandscapes where snow accumulations are enhanced bylandscape aspect and prevailing winds during springstorms. These colonies have over the past 30 yearsdecreased significantly faster than colonies where wind-scour abates snow accumulations (Fraser & Patterson1997; Patterson et al. 2003). Interestingly, Palmer
Marine pelagic ecosystems: the WAP H. W.Ducklow et al. 87
populations of the ice-intolerant chinstrap and gentoopenguins have maintained their sub-Antarctic breedingchronologies (Williams 1995); hence by breedingapproximately three weeks later than Adelies, chinstrapand gentoo penguins in effect permit spring melt tocircumvent the negative effects of snow accumulation.
These two scales of processes operate by producing aspatial and/or temporal mismatch between neededresources and critical aspects of a species’ life history.What remains a key challenge, however, is integrating afood web perspective within the context of thisdynamics. Changes in the abundance and availabilityof prey must surely have a role in altering the thresholdstates that lead to optimal habitat conditions for onespecies but suboptimal conditions for another (Fraseret al. 1992; Fraser & Trivelpiece 1996), yet integratingthese factors into a model in which sea ice seems quitewell established as a key determinant of changes inpredator populations has been problematic (Smithet al. 1999). Palmer Station Adelie penguin responsesto changes in krill abundance are temporally coherentwith those of other krill-dependent predators overspatial scales that include the northern WAP and muchof the southwest Atlantic sector of the Southern Ocean(Fraser & Hofmann 2003). The response variables,moreover, are diverse, encompassing a range of factorsfrom changes in foraging trip durations to populationtrajectories, and involve other predator groups besidespenguins. A key conclusion to be drawn from thesefindings, given the large spatial scales over whichchanges in krill abundance affect predator responses,is that the causal mechanisms that determine how thepresence or absence of sea ice tips the balance in favourof one life-history strategy over another may actuallyoperate over much smaller scales than previouslythought. These scales may encompass, for example,the factors that determine access to breeding sites ortraditional wintering areas (Fraser & Trivelpiece 1996),and incorporate predator responses that result fromspecies-specific competitive abilities for local preyresources (Lynnes et al. 2002, 2004). ContinuingPal-LTER research on penguins is currently startingto focus on the possible relevance of these small-scaleprocesses within the scope of understanding regionaldemographic responses to climate change.
9. MARINE MAMMALSThe marine mammals of the WAP include fivepinniped species and at least nine species of cetaceans.Although these megafauna are one of the mostconspicuous features of the WAP marine ecosystem,they are also among the least well known, a charac-teristic that holds true for the Antarctic in general.Indeed, it is probably not even possible to give firmorder-of-magnitude estimates of standing stocks of anyof these organisms along the WAP (Costa & Crocker1996), a region where survey and other basic data arestill addressing the possible presence of new species andnew populations of known species (Pitman & Ensor2003; Sirovic et al. 2004).
Not unlike the penguins previously discussed, boththe pinnipeds and cetaceans are composed of specieswhose life histories also exhibit varying affinities to sea
Phil. Trans. R. Soc. B (2007)
ice. Thus, the pack ice seals, crabeater (Lobodoncarcinophagus), Weddell (Leptonychotes weddellii), leo-pard (Hydrurga leptonyx) and Ross (Ommatophocarossii ), are ice-obligate species whose distribution,
abundance, reproduction and foraging ecology areclosely tied to the presence of sea ice, while southern
elephant (Mirounga leonina) and fur (Arctocephalusgazella) seals tend to winter and forage in open
water and marginal ice zones, but reproduce onland (Costa & Crocker 1996; Burns et al. 2004; Gales
et al. 2004). Among cetaceans, minke (Balaenopterabonaerensis) and killer (Orcinus orca) whales exhibit lifehistories with affinities to sea ice, while the other known
species tend to be ice-avoiding, feeding in the WAPduring the summer, but migrating north during austral
winter to reproduce (Bonner 1998; Pitman & Ensor
2003; Sirovic et al. 2004).What seems most clear about the role of the WAP
in the ecology of these marine mammals is itssignificance as a feeding ground. Apart from the
ice-dependent species that are tied to the region year-round, the other species clearly migrate into the
region for the sole purpose of feeding during austral
summer (most of the whales) or in autumn followingreproduction in the sub-Antarctic (fur and southern
elephant seals; Bonner 1998; Parmelee & Parmelee1987; W. R. Fraser 1978–2006, unpublished data).
Although fish and squid are fed upon by all these
species to varying degrees, Antarctic krill is by far themost important single component in the diets of these
marine mammals. Thus, in light of the betterdocumented population responses of penguins to
changes in factors such as sea ice and krill availability(see §8), it is not inconceivable that WAP marine
mammal populations that are similarly associated
with these variables through life history haveresponded in kind. Early surveys seem to support
the existence of such changes, including dramaticincreases in fur seal populations, an ice-avoiding
species, and possible decreases in the pack ice seals,
especially crabeater (Bonner 1985; Laws 1985;Erickson & Hanson 1990; Parmelee & Parmelee
1987; W. R. Fraser 1978–2006, unpublished data).Fur seals at South Georgia (north of the WAP)
responded in a nonlinear fashion to climate-drivenanomalies in sea surface temperature and food
availability (Forcada et al. 2005). Atkinson et al.(2004), moreover, have shown convincingly thatdeclining sea ice has resulted in a significant decrease
in krill abundance in the regions where the surveyswere undertaken, the WAP and southwest Atlantic
sector of the Southern Ocean. However, although
climate-related population changes are suspected formarine mammals in other Antarctic sectors (e.g. fur
and southern elephant seals (Weimerskirch et al.2003; Hucke-Gaete et al. 2004; McMahon et al.2005) and minke whales (Branch & Butterworth
2001)), data interpretation is potentially confoundedby the fact that many of these species are recovering
from massive population declines induced by humanharvest. As indicated by Smetacek & Nicol (2005),
disentangling the effects of human exploitation,climate change and changing modes of top-down
88 H. W.Ducklow et al. Marine pelagic ecosystems: the WAP
control exerted by large predators is a major scientificand societal challenge facing Antarctic science.
10. CONCLUSIONThe marine pelagic ecosystem WAP, dominated bydiatom primary producers, krill and a great variety ofupper level vertebrate consumers, is similar in itsstructure and dynamics to other Antarctic shelfregions, with the exception of the Ross Sea system(Smith et al. 2007). The Ross Sea is dominated byP. antarctica, and has fewer krill than the WAP (Danielset al. 2006). However, the WAP differs from all otherAntarctic systems in one important respect: it isexperiencing the most rapid warming of any marineecosystem on the planet. Recently resolved changes inthe regional climate and sea ice are now understood toaffect all levels of the food web, from top predatorswhose life histories exhibit different affinities to sea iceto fish, krill, phytoplankton and bacteria. Changes inthese ecosystem components appear to be modulatedby global teleconnections with ENSO and other modesof climate variability. Clarke et al. (2007) present aschematic view of a Southern Ocean food web in whichprimary production is channelled through krill, salpsand other zooplankton towards three general fates:passage to higher predators, sinking to benthic foodwebs and transfer into the microbial food web. In theWAP, most production appears to move up through thefood chain to the higher predators or into bacteria.Only a few per cent of the primary production sinksthrough the deep (300–700 m) water column to thebenthos. Whether these modes of ecosystem functionwill change in importance with further warming (orindeed, if they have already changed) is unknown.
A major challenge for Antarctic scientists involvesnot only documenting ecosystem responses at all levelsof biotic organization (genome to planetary), but alsoestablishing a mechanistic understanding of thelinkages between climate, sea ice, biogeochemicalprocesses and lower to upper trophic levels. TheWAP is fortuitously characterized by a relativelysimplified marine ecosystem (though one still demon-strating complex dynamics and feedbacks), rapidclimate warming and a well-populated scientificcontingent. These factors present the internationalcommunity of Antarctic scientists and policymakerswith an unparalleled opportunity for observing andunderstanding the interactions between climate changeand marine ecosystem response.
Preparation of this article was supported by US NSF grant0217282 from the Office of Polar Programs Antarctic Biologyand Medicine Program and the US Antarctic Program.
REFERENCESAckley, S. F. & Sullivan, C. W. 1994 Physical controls on the
development and characteristics of Antarctic sea ice
biological communities—a review and synthesis. Deep-Sea Res. I 41, 1583–1604. (doi:10.1016/0967-0637(94)
90062-0)Ainley, D. G. 2002 The Adelie penguin: bellwether of climate
change. New York, NY: Columbia University Press.
Phil. Trans. R. Soc. B (2007)
Anadon, R. & Estrada, M. 2002 The Fruela cruises: a carbon
flux study in productive areas of the Antarctic Peninsula
(December 1995–February 1996). Deep-Sea Res. II 49,
567–583. (doi:10.1016/S0967-0645(01) 00112-6)
Anadon, R., Alvarez-Marques, F., Fernandez, E., Varela, M.,
Zapata, M., Gasol, J. M. & Vaque, D. 2002 Vertical
biogenic particle flux during austral summer in the
Antarctic Peninsula area. Deep-Sea Res. II 49, 883–901.
(doi:10.1016/S0967-0645(01)00129-1)
Anderson, J. B. 2002 Antarctic marine geology. Cambridge,
UK: Cambridge University Press.
Arrigo, K. R., Worthen, D. L., Lizotte, M. P., Dixon, P. &
Dieckmann, G. 1997 Primary production in Antarctic
sea ice. Science 276, 394–397. (doi:10.1126/science.276.
5311.394)
Ashjian, C. J., Rosenwaks, G. A., Wiebe, P. H., Davis, C. S.,
Gallager, S. M., Copley, N. J., Lawson, G. L. & Alatalo, P.
2004 Distribution of zooplankton on the continental shelf
off Marguerite Bay, Antarctic Peninsula, during austral fall
and winter, 2001. Deep-Sea Res. II 51, 2073–2098.
(doi:10.1016/j.dsr2.2004.07.025)
Atkinson, A., Siegel, V., Pakhomov, E. & Rothery, P. 2004
Long-term decline in krill stock and increase in salps
within the Southern Ocean. Nature 432, 100–103. (doi:10.
1038/nature02996)
Bidigare, R. R., Iriarte, J. L., Kang, S., Karentz, D.,
Ondrusek, M. E. & Fryxell, G. A. 1996 Phytoplankton:
quantitative and qualitative assessments. In Foundations for
ecological research west of the Antarctic Peninsula, vol. 70 (ed.
R. M. Ross, E. E. Hofmann & L. B. Quetin), pp. 173–198.
Washington, DC: American Geophysical Union.
Bird, D. F. & Karl, D. M. 1991 Spatial patterns of glutamate
and thymidine assimilation in the Bransfield Strait,
Antarctica, during and following the austral spring
bloom. Deep-Sea Res. 38, 1057–1075. (doi:10.1016/
0198-0149(91)90096-X)
Bird, D. F. & Karl, D. M. 1999 Uncoupling of bacteria and
phytoplankton during the austral spring bloom in
Gerlache Strait, Antarctic Peninsula. Aquat. Microb. Ecol.
19, 13–27.
Bonner, W. N. 1985 Impact of fur seals on the terrestrial
environment at South Georgia. In Antarctic nutrient cycles
and food webs (ed. W. R. Siegfried, P. R. Condy & R. M.
Laws), pp. 641–646. Berlin, Germany; New York, NY:
Springer.
Bonner, N. 1998 Whales of the world. London, UK: Blandford
Press.
Branch, T. A. & Butterworth, D. S. 2001 Southern hemi-
sphere minke whales: standardized abundance estimates
from the 1978/79 to 1997/98 IDCR-SOWER surveys.
J. Cetacean Res. Manag. 3, 143–174.Brinton, E. & Antezana, T. 1984 Structures of swarming
and dispersed populations of krill (Euphausia superba)
in Scotia Sea and South Shetland waters during
January–March 1981, determined by bongo nets.
J. Crust. Biol. 4, 45–66.
Buma, A. G. J., de Baar Nolting, H. J. W. & van Bennekom,
R. F. 1991Metal enrichment experiments in the Weddell–
Scotia Seas: effects of Fe and Mn on various plankton
communities. Limnol. Oceanogr. 36, 1865–1878.Burns, J. M., Costa, D. P., Fedak, M. A., Hindell, M. A.,
Bradshaw, C. J. A., Gales, N. J., McDonald, B., Trumble,
S. J. &Crocker, D. E. 2004Winter habitat use and foraging
behavior of crabeater seals along the Western Antarctic
Peninsula. Deep-Sea Res. II. 51, 2279–2303. (doi:10.1016/
j.dsr2.2004.07.021)
Carleton, A. M. 2003 Atmospheric teleconnections involving
the Southern Ocean. J. Geophys. Res. 108, 8080. (doi:10.
1029/2000JC000379)

Marine pelagic ecosystems: the WAP H. W.Ducklow et al. 89
Carlson, C. A., Ducklow, H. W., Hansell, D. A. & Smith Jr,
W. O. 1998 Organic carbon partitioning during spring
phytoplankton blooms in the Ross Sea polynya and the
Sargasso Sea. Limnol. Oceanogr. 43, 375–386.Carmack, E. C. 1977 Water characteristics of the Southern
Ocean south of the polar front. In A voyage of discovery (ed.
E. Angel), pp. 15–42. New York, NY: Pergamon Press.
Carrillo, C. J., Smith, R. C. & Karl, D. M. 2004 Processes
regulating oxygen and carbon dioxide in surface waters
west of the Antarctic Peninsula. Mar. Chem. 84, 161–179.
(doi:10.1016/j.marchem.2003.07.004)
Castro, C. G., Rios, A. F., Doval, M. D. & Perez, F. F. 2002
Nutrient utilisation and chlorophyll distribution in the
Atlantic sector of the Southern Ocean during austral
summer 1995–96. Deep-Sea Res. II 49, 623–641. (doi:10.
1016/S0967-0645(01)00115-1)
Cavalieri, D. J., Gloersen, P., Parkinson, C. L., Comiso, J. C.
& Zwally, H. J. 1997 Observed hemispheric asymmetry in
global sea ice changes. Science 278, 1104–1106. (doi:10.
1126/science.278.5340.1104)
Church, M. J., DeLong, E. F., Ducklow, H. W., Karner,
M. B., Preston, C.M. &Karl, D.M. 2003 Abundance and
distribution of planktonic Archaea and Bacteria in the
waters west of the Antarctic Peninsula. Limnol. Oceanogr.
48, 1893–1902.
Clark, M. S. et al. 2004 Antarctic genomics. Comp. Funct.
Genom. 5, 230–238. (doi:10.1002/cfg.398)Clarke, A., Murphy, E. J., Meredith, M. P., King, J. C., Peck,
L. S., Barnes, D. K. A. & Smith, R. C. 2007 Climate
change and the marine ecosystem of the western Antarctic
Peninsula. Phil. Trans. R. Soc. B 362, 149–166. (doi:10.
1098/rstb.2006.1958)
Comiso, J. C. 2000 Variability and trends in Antarctic surface
temperatures from in situ and satellite infrared measure-
ments. J. Clim. 13, 1674–1696. (doi:10.1175/1520-
0442(2000)013!1674:VATIASO2.0.CO;2)
Comiso, J. C., Cavalieri, D., Parkinson, C. & Gloersen, P.
1997 Passive microwave algorithms for sea ice concen-
tration—a comparison of two techniques. Remote Sens.Environ. 60, 357–384. (doi:10.1016/S0034-4257(96)
00220-9)
Cook, A. J., Fox, A. J., Vaughan, D. J. & Ferrigno, J. G. 2005
Retreating glacier fronts on the Antarctic Peninsula over
the past half-century. Science 308, 541–544. (doi:10.1126/science.1104235)
Costa, D. P. & Crocker, D. E. 1996 Marine mammals of the
Southern Ocean. In Foundations for ecological research west
of the Antarctic Peninsula (ed. R. M. Ross, E. E. Hofmann
& L. B. Quetin), pp. 287–301. Washington, DC:
American Geophysical Union.
Croxall, J. P., McCann, T. S., Prince, P. A. & Rothery, P. 1988
Reproductive performance of seabirds and seals at South
Georgia and Signy Island, South Orkney Islands,
1976–1987: implications for Southern Ocean monitoring
studies. In Antarctic ocean and resources variability (ed.
D. Sahrhage), pp. 261–285. Berlin, Germany: Springer.
Daly, K. L. 1990 Overwintering development, growth, and
feeding of larval Euphausia superba in the Antarctic
marginal ice zone. Limnol. Oceanogr. 35, 1564–1576.Daniels, R. M., Ducklow, H. W. & Richardson, T. L. 2006.
Food web structure and biogeochemical processes during
oceanic phytoplankton blooms: an inverse model analysis.
Deep-Sea Res. II 53, 532–554.De la Mare, W. K. 1994 Estimating krill recruitment and its
variability. CCAMLR Sci. 1, 55–69.Dierssen, H. M. & Smith, R. C. 2000 Bio-optical properties
and remote sensing ocean color algorithms for Antarctic
Peninsula waters. J. Geophys. Res. 105, 26 301–26 312.
(doi:10.1029/1999JC000296)
Phil. Trans. R. Soc. B (2007)
Dierssen, H. M., Smith, R. C. & Vernet, M. 2002 Glacialmeltwater dynamics in coastal waters west of the AntarcticPeninsula. Proc. Natl Acad. Sci. USA 99, 1790–1795.(doi:10.1073/pnas.032206999)
Domack, E., Leventer, A., Burnett, A., Bindschadler, R.,Convey, P. & Kirby, M. 2003 Antarctic Peninsula climatevariability: historical and paleoenvironmental perspectives.Washington, DC: American Geophysical Union.
Ducklow, H.W. 1999Minireview: the bacterial content of theoceanic euphotic zone. FEMS Microbiol. Ecol. 30, 1–10.(doi:10.1111/j.1574-6941.1999.tb00630.x)
Ducklow, H. W. 2000 Bacterioplankton production andbiomass in the oceans. In Microbial ecology of the oceans (ed.D. L. Kirchman), pp. 85–120. New York, NY: Wiley.
Ducklow, H. W. & McCallister, S. L. 2004 The biogeochem-istry of carbon dioxide in the coastal oceans. In The sea (ed.A. R. Robinson, K. Brink & B. J. Rothschild), The globalcoastal ocean: multiscale interdisciplinary processes, vol. 13,ch. 9, pp. 269–315. Cambridge, MA: Harvard UniversityPress.
Ducklow, H. W., Carlson, C. A., Church, M., Kirchman, D.,Smith, D. & Steward, G. 2001a The seasonal develop-ment of the bacterioplankton bloom in the Ross Sea,Antarctica, 1994–1997. Deep-Sea Res. II 48, 4199–4221.(doi:10.1016/S0967-0645(01)00086-8)
Ducklow, H. W., Steinberg, D. K. & Buesseler, K. O. 2001bUpper ocean carbon export and the biological pump.Oceanography 14, 50–58.
Ducklow, H.W., Fraser, W., Karl, D.M., Quetin, L. B., Ross,R. M., Smith, R. C., Stammerjohn, S. E., Vernet, M. &Daniels, R. M. 2006. Water column processes in the WestAntarctic Peninsula and the Ross Sea: foodweb structureand interannual variability. Deep-Sea Res. II 53, 834–852.
El-Sayed, S. Z. 1994 History, organization and accomplish-ments of the BIOMASS programme. In Southern Oceanecology (ed. S. Z. El-Sayed), pp. 1–8. Cambridge, UK:Cambridge University Press.
Emslie, S. D., Fraser, W. R., Smith, R. C. & Walker, W. 1998Abandoned penguin colonies and environmental changein the Palmer Station area, Anvers Island, AntarcticPeninsula. Antarctic Sci. 10, 257–268.
Erickson, A. W. &Hanson, M. B. 1990 Continental estimatesand population trends in Antarctic seals. In Ecologicalchange and the conservation of Antarctic ecosystems (ed. K. R.Kerry & G. Hempel), pp. 253–254. Berlin, Germany;New York, NY: Springer.
Everson, I. 2000 Role of krill in marine food webs: theSouthern Ocean. In Krill: biology, ecology and fisheries (ed.I. Everson), pp. 194–201. Oxford, UK: Blackwell Science.
Feely, R. A., Sabine, C. L., Takahashi, T. & Wanninkhof, R.2001 Uptake and storage of carbon dioxide in the ocean.Oceanography, vol. 14, pp. 18–32.
Fischer, G., Gersonde, R. & Wefer, G. 2002 Organic carbon,biogenic silica and diatom fluxes in the marginal wintersea-ice zone and in the Polar Front Region: interannualvariations and differences in composition. Deep-Sea Res. II49, 1721–1745.
Fogt, R. L. & Bromwich, D. H. 2005 Decadal variability ofthe ENSO teleconnection to the high latitude SouthPacific governed by coupling with the southern annularmode. J. Clim. 19, 979–997. (doi:10.1175/JCLI3671.1)
Forcada, J., Trathan, P. N., Reid, K. & Murphy, E. J. 2005The effects of global climate variability in pup productionof Antarctic fur seals. Ecology 86, 2408–2417.
Fraser, W. R. & Hofmann, E. E. 2003 A predator’sperspective on causal links between climate change,physical forcing and ecosystem response. Mar. Ecol.Prog. Ser. 265, 1–15.
Fraser, W. R. & Patterson, D. L. 1997 Human disturbanceand long-term changes in Adelie penguin populations: a
90 H. W.Ducklow et al. Marine pelagic ecosystems: the WAP
natural experiment at Palmer Station, Antarctic Peninsula.
In Antarctic communities: species, structure and survival,
scientific committee for Antarctic research (SCAR), sixth
biological symposium (ed. B. Battaglia, J. Valencia &
D. W. H. Walton), pp. 445–452. New York, NY:
Cambridge University Press.
Fraser, W. R. & Trivelpiece, W. Z. 1996 Factors controlling
the distribution of seabirds: winter–summer heterogeneity
in the distribution of Adelie penguin populations. In
Foundations for ecological research west of the AntarcticPeninsula, vol. 70 (ed. R. M. Ross, E. E. Hofmann &
L. B. Quetin), pp. 257–272. Washington, DC: American
Geophysical Union.
Fraser, W. R., Trivelpiece, W. Z., Ainley, D. G. & Trivelpiece,
S. G. 1992 Increases in Antarctic penguin populations:
reduced competition with whales or a loss of sea ice due to
environmental warming? Polar Biol. 11, 525–531. (doi:10.
1007/BF00237945)
Fritsen, C. H., Ackley, S. F., Kremer, J. N. & Sullivan, C. W.
1998 Flood–freeze cycles and microalgal dynamics in
Antarctic pack ice. In Antarctic sea ice: biological processes,
interactions, and variability (ed. M. L. Lizotte & K. R.
Arrigo), pp. 1–21. Washington, DC: American Geophys-
ical Union.
Gales, N. J., Fraser, W. R., Costa, D. P. & Southwell, C. 2004
Do crabeater seals forage cooperatively? Deep-Sea Res. II
51, 2305–2310. (doi:10.1016/j.dsr2.2004.07.006)
Garibotti, I. A., Vernet, M., Ferrario, M. E., Smith, R. C.,
Ross, R. M. & Quetin, L. B. 2003a Phytoplankton spatial
distribution patterns along the western Antarctic Penin-
sula (Southern Ocean). Mar. Ecol. Prog. Ser. 261, 21–39.Garibotti, I. A., Vernet, M., Kozlowski, W. A. & Ferrario,
M. E. 2003b Composition and biomass of phytoplankton
assemblages in coastal Antarctic waters: a comparison of
chemotaxonomic and microscopic analyses. Mar. Ecol.
Prog. Ser. 247, 27–42.Garibotti, I. A., Vernet, M. & Ferrario, M. E. 2005a Annually
recurrent phytoplanktonic assemblages during summer in
the seasonal ice zone west of the Antarctic Peninsula
(Southern Ocean). Deep-Sea Res. II 52, 1823–1841.
(doi:10.1016/j.dsr.2005.05.003)
Garibotti, I. A., Vernet, M., Smith, R. C. & Ferrario, M. E.
2005b Marine phytoplankton distribution during three
summers in the seasonal sea-ice zone west of the Antarctic
Peninsula. J. Plankton Res. 27, 825–843.Garrison, D. L. & Mathot, S. 1996 Pelagic and sea ice
microbial communities. InFoundations for ecological researchwest of the Antarctic Peninsula, vol. 70 (ed. R.M. Ross, E. E.
Hofmann & L. B. Quetin), pp. 155–172.Washington, DC:
American Geophysical Union.
Gill, A. E. 1973 Circulation and bottom water production in
the Weddell Sea. Deep-Sea Res. 20, 111–140.Gordon, A. L. 1971 Oceanography of Antarctic Waters.
Antarctic Res. Ser. 15, 169–203.Haberman, K. L., Quetin, L. B. & Ross, R. M. 2003a Diet of
the Antarctic krill (Euphausia superba Dana) I. Compari-
sons of grazing on Phaeocystis antarctica (Karsten) and
Thalassiosira antarctica (Comber). J. Exp. Mar. Biol. Ecol.
283, 79–95. (doi:10.1016/S0022-0981(02)00466-5)
Haberman, K. L., Ross, R. M. & Quetin, L. B. 2003b Diet of
the Antarctic krill (Euphausia superba Dana) II. Selective
grazing onmixed phytoplankton assemblages. J. Exp. Mar.Biol. Ecol. 283, 97–113. (doi:10.1016/S0022-0981(02)
00467-7)
Hall, A. & Visbeck, M. 2002 Synchronous variability in
the southern hemisphere atmosphere, sea ice and
ocean resulting from the annular mode. J. Clim. 15,
3043–3057. (doi:10.1175/1520-0442(2002)015!3043:
SVITSHO2.0.CO;2)
Phil. Trans. R. Soc. B (2007)
Harangozo, S. A. 2000 A search for ENSO teleconnections inthe West Antarctic Peninsula climate in austral winter. Int.J. Climatol. 20, 663–679. (doi:10.1002/(SICI)1097-0088(200005)20:6!663::AID-JOC493O3.0.CO;2-I)
Hart, T. J. 1942 Phytoplankton periodicity in Antarcticsurface waters. Discov. Rep. 21, 261–356.
Hewes, C. D., Sakshaug, E., Reid, F. M. H. &Holm-Hansen,O. 1990 Microbial autotrophic and heterotrophic eucar-yotes in Antarctic waters: relationships between biomassand chlorophyll, adenosine triphosphate and particulateorganic carbon. Mar. Ecol. Prog. Ser. 63, 27–35.
Hewitt, R. P., Demer, D. A. & Emery, J. H. 2003 An 8-yearcycle in krill biomass density inferred from acousticsurveys conducted in the vicinity of the South ShetlandIslands during the austral summers of 1991/92 through2001/2002. Aquat. Living Resour. 16, 205–213. (doi:10.1016/S0990-7440(03)00019-6)
Hewitt, R. P. et al. 2004 Biomass of Antarctic krill in theScotia Sea in January/February 2000 and its use in revisingan estimate of precautionary yield. Deep-Sea Res. II 51,1215–1236. (doi:10.1016/j.dsr2.2004.06.011)
Hofmann, E. E., Wiebe, P. H., Costa, D. P. & Torres, J. J.2004 An overview of the Southern Ocean global oceanecosystems dynamics program. Deep-Sea Res. II 51,1921–1924. (doi:10.1016/j.dsr2.2004.08.007)
Holm-Hansen, O. & Mitchell, B. G. 1991 Spatial andtemporal distribution of phytoplankton and primaryproduction in the western Bransfield Strait region.Deep-Sea Res. 38, 961–980. (doi:10.1016/0198-0149(91)90092-T)
Holm-Hansen, O. et al. 2004 Factors influencing thedistribution, biomass, and productivity of phytoplanktonin the Scotia Sea and adjoining waters. Deep-Sea Res. II 51,1333–1350. (doi:10.1016/j.dsr2.2004.06.015)
Hopkins, T. L. 1985 The zooplankton community of Crokerpassage, Antarctic Peninsula. Polar Biol. 4, 161–170.(doi:10.1007/BF00263879)
Hucke-Gaete, R., Osman, L. P., Moreno, C. A. & Torres, D.2004 Examining natural population growth from nearextinction: the case of the Antarctic fur seal at the SouthShetlands, Antarctica. Polar Biol. 27, 304–311. (doi:10.1007/s00300-003-0587-8)
Huntley, M. E., Karl, D.M., Niiler, P. P. &Holm-Hansen, O.1991 Research on Antarctic coastal ecosystem rates(RACER): an interdisciplinary field experiment. Deep-Sea Res. 38, 911–941. (doi:10.1016/0198-0149(91)90090-3)
Jacques, G. & Panouse, M. 1991 Biomass and composition ofsize fractionated phytoplankton in the Weddell Seaconfluence area. Polar Biol. 11, 315–328. (doi:10.1007/BF00239024)
Karl, D. M. 1993 Microbial processes in the SouthernOceans. In Antarctic microbiology (ed. I. E. Friedman),pp. 1–63. New York, NY: Wiley-Liss.
Karl, D. M., Holm-Hansen, O., Taylor, G. T., Tien, G. &Bird, D. F. 1991a Microbial biomass and productivity inthe western Bransfield Strait, Antarctica during the1986–87 austral summer. Deep-Sea Res. 38, 1029–1055.(doi:10.1016/0198-0149(91)90095-W)
Karl, D. M., Tilbrook, B. D. & Tien, G. 1991b Seasonalcoupling of organic matter production and particle flux inthe western Bransfield Strait, Antarctica. Deep-Sea Res. 38,1097–1126. (doi:10.1016/0198-0149(91)90098-Z)
Karl, D.M., Christian, J. R., Dore, J. E. & Letelier, R.M. 1996Microbiological oceanography in the region west of theAntarctic Peninsula:microbial dynamics, nitrogen cycle andcarbon flux. In Foundations for ecological research west of theAntarctic Peninsula, vol. 70 (ed. R. M. Ross, E. E. Hofmann& L. B. Quetin), pp. 303–332. Washington, DC: AmericanGeophysical Union.
Marine pelagic ecosystems: the WAP H. W.Ducklow et al. 91
Kawaguchi, S., Siegel, V., Litvinov, F., Loeb, V. & Watkins, J.2004 Salp distribution and size composition in theAtlantic sector of the Southern Ocean. Deep-Sea Res. II51, 1369–1381. (doi:10.1016/j.dsr2.2004.06.017)
King, J. C. 1994 Recent climate variability in the vicinity ofthe Antarctic Peninsula. Int. J. Climatol. 14, 357–369.
Klinck, J. M. 1998 Heat and salt changes on the continentalshelf west of the Antarctic Peninsula between January ’93and January ’94. J. Geophys. Res. 103b, 7617–7636.(doi:10.1029/98JC00369)
Kwok, R. & Comiso, J. C. 2002a Southern Ocean climateand sea ice anomalies associated with the SouthernOscillation. J. Clim. 15, 487–501. (doi:10.1175/1520-0442(2002)015!0487:SOCASIO2.0.CO;2)
Kwok, R. &Comiso, J. C. 2002b Spatial patterns of variabilityin Antarctic surface temperature: connections to thesouthern hemisphere annular mode and the SouthernOscillation. Geophys. Res. Lett. 29, 1705. (doi:10:1029/2002GL015415)
Lascara, C. M., Hofmann, E. E., Ross, R. M. & Quetin, L. B.1999 Seasonal variability in the distribution of Antarctickrill, Euphausia superba, west of the Antarctic Peninsula.Deep-Sea Res. 46, 951–984. (doi:10.1016/S0967-0637(98)00099-5)
Laws, R. M. 1985 The ecology of the Southern Ocean. Am.Sci. 73, 26–40.
Lawson, G. L., Wiebe, P. H., Ashjian, C. J., Gallager, S. M.,Davis, C. S. & Warren, J. D. 2004 Acoustically-inferredzooplankton distribution in relation to hydrography westof the Antarctic Peninsula. Deep-Sea Res. II 51,2041–2072. (doi:10.1016/j.dsr2.2004.07.022)
Lefebvre, W., Goosse, H., Timmermann, R. & Fichefet, T.2004 Influence of the southern annular mode on the seaice-ocean system. J. Geophys. Res. 109. (doi:101029/2004JC002403)
Legendre, L. et al. 1992 Ecology of sea ice biota 2: globalsignificance. Polar Biol. 12, 429–444.
Liu, J., Curry, J. A. & Martinson, D. G. 2004 Interpretationof recent Antarctic sea ice variability. Geophys. Res. Lett.31, L02205. (doi:10.1029/2003GL018732)
Loeb, V., Siegel, V., Holm-Hansen, O., Hewitt, R., Fraser,W.R., Trivelpiece,W. Z.&Trivelpiece, S.G. 1997Effects ofsea-ice extent and krill or salp dominance on the Antarcticfood web. Nature 387, 897–900. (doi:10.1038/43174)
Lorenzo, L. M., Arbones, B., Figueiras, F. G., Tilstone,G. H. & Figueroa, F. L. 2002 Photosynthesis, primaryproduction and phytoplankton growth rates in Gerlacheand Bransfield Straits during austral summer: cruiseFruela 95. Deep-Sea Res. II 49, 707–721. (doi:10.1016/S0967-0645(01)00120-5)
Lynnes, A. S., Reid, K., Croxall, J. P. & Trathan, P. N. 2002Conflict or coexistence? Foraging distribution and compe-tition for prey between Adelie and chinstrap penguins.Mar. Biol. 141, 1165–1174. (doi:10.1007/s00227-002-0899-1)
Lynnes, A. S., Reid, K. & Croxall, J. P. 2004 Diet andreproductive success of Adelie and chinstrap penguins:linking response of predators to prey population dynamics.Polar Biol. 27, 544–554. (doi:10.1007/s00300-004-0617-1)
Macintosh, N. S. 1936 Distribution of the macroplankton inthe Atlantic sector of the Antarctic. Discov. Rep. 9, 65–160.
Marr, J. W. S. 1962 The natural history and geography of theAntarctic krill (Euphausia superba Dana). Discov. Rep. 32,33–464.
Marshall, G. J. & King, J. C. 1998 Southern hemispherecirculation anomalies associated with extreme AntarcticPeninsula winter temperatures. Geophys. Res. Lett. 25,2437–2440. (doi:10.1029/98GL01651)
Marshall, G. J., Stott, P. A., Turner, J., Connolley, W. M.,King, J. C. & Lachlan-Cope, T. A. 2004 Causes of
Phil. Trans. R. Soc. B (2007)
exceptional atmospheric circulation changes in thesouthern hemisphere. Geophys. Res. Lett. 31, L14205.(doi:101029/2004GL019952)
Martinson, D. G., Stammerjohn, S. E., Smith, R. C. &Iannuzzi, R. A. In press. Palmer, Antarctica, long-termecological research program first 12 years: physical ocean-ography, spatio-temporal variability. Deep-Sea Res. II.
Massana, R., Taylor, L. T., Murray, A. E., Wu, K. Y., Jeffrey,W. H. & DeLong, E. F. 1998 Distribution of marineplanktonic archaea in the Gerlache Strait, AntarcticPeninsula, during early spring. Limnol. Oceanogr. 43,607–617.
Massom, R. A. et al. 2006 Extreme anomalous atmosphericcirculation in the West Antarctic Peninsula region inaustral spring and summer 2001/02, and its profoundimpact on sea ice and biota. J. Clim. 19, 3544–3571.
McMahon, C. R., Bester, M. N., Burton, H. R., Hindell,M. A. & Bradshaw, C. J. A. 2005 Population status, trendsand a re-examination of the hypotheses explaining therecent declines of the southern elephant seal Miroungaleonina. Mammal Rev. 35, 82–100. (doi:10.1111/j.1365-2907.2005.00055.x)
Meredith, M. P. & King, J. C. 2005 Rapid climate change inthe ocean west of the Antarctic Peninsula during thesecond half of the 20th century. Geophys. Res. Lett. 32,L19604. (doi:101029/2005GL024042)
Miller, L. A. et al. 2002 Carbon distributions and fluxes in theNorth Water, 1998 and 1999. Deep-Sea Res. II 49,5151–5170. (doi:10.1016/S0967-0645(02)00183-2)
Mitchell, B. G. & Holm-Hansen, O. 1991 Observations andmodeling of the Antarctic phytoplankton crop in relationto mixing depth. Deep-Sea Res. 38, 981–1007.
Moline, M. A. & Prezelin, B. B. 1996 Palmer LTER 1991-1994: long-term monitoring and analyses of physicalfactors regulating variability in coastal Antarctic phyto-plankton biomass, in situ productivity and taxonomiccomposition over subseasonal, seasonal and interannualtime scales phytoplankton dynamics. Mar. Ecol. Prog. Ser.145, 143–160.
Moline, M. A., Claustre, H., Frazer, T. K., Schofield, O. &Vernet, M. 2004 Alteration of the food web along theAntarctic Peninsula in response to a regional warmingtrend. Global Change Biol. 10, 1973–1980. (doi:10.1111/j.1365-2486.2004.00825.x)
Moran, X. A. G., Gasol, J. M., Pedros-Alio, C. & Estrada, M.2001 Dissolved and particulate primary production andbacterial production in offshore Antarctic waters duringAustral summer: coupled or uncoupled? Mar. Ecol. Prog.Ser. 222, 25–39.
Moran, X. A. G., Estrada, M., Gasol, J. M. & Pedros-Alio, C.2002 Dissolved primary production and the strength ofphytoplankton–bacterioplankton coupling in contrastingmarine regions. Microb. Ecol. 44, 217–223.
Murphy, E. J., Thorpe, S. E., Watkins, J. L. & Hewitt, R.2004 Modeling the krill transport pathways in the ScotiaSea: spatial and environmental connections generating theseasonal distribution of krill. Deep-Sea Res. II 51,1435–1456. (doi:10.1016/j.dsr2.2004.06.019)
Murray, A. E., Preston, C. M., Massana, R., Taylor, L. T.,Blakis, A., Wu, K. & DeLong, E. F. 1998 Seasonal andspatial variability of bacterial and archaeal assemblages inthe coastal waters off Anvers Island, Antarctica. Appl.Environ. Microb. 64, 2585–2595.
Murray, A. E., Wu, K. Y., Moyer, C. L., Karl, D. M. &DeLong, E. F. 1999 Evidence for circumpolar distributionof planktonic Archaea in the Southern Ocean. Aquat.Microb. Ecol. 18, 263–273.
Nicol, S., Constable, A. & Pauly, T. 2000 Estimates ofcircumpolar Antarctic krill abundance based on recentacoustic density measurements. CCAMLR Sci. 7, 87–99.

92 H. W.Ducklow et al. Marine pelagic ecosystems: the WAP
Orsi, A. H., Whitworth III, T. & Nowlin, W. D. 1995 On the
meridional extent and fronts of the Antarctic circumpolar
current. Deep-Sea Res. 42, 641–673. (doi:10.1016/0967-
0637(95)00021-W)
Pakhomov, E. A., Froneman, P. W. & Perissinotto, R. 2002
Salp/krill interactions in the Southern Ocean: spatial
segregation and implications for the carbon flux. Deep-
Sea Res. II 49, 1881–1907. (doi:10.1016/S0967-
0645(02)00017-6)
Parkinson, C. L. 2002 Trends in the length of the Southern
Ocean sea ice season. Ann. Glaciol. 34, 435–440.Parkinson, C. L. 2004 Southern Ocean sea ice and its
wider linkages: insights revealed from models and obser-
vations. Antarctic Sci. 16, 387–400. (doi:10.1017/
S0954102004002214)
Parmelee, D. F. & Parmelee, J. M. 1987 Updated penguin
distribution for Anvers Island. Antarctica. Br. Antarctic
Surv. Bull. 76, 65–74.Patterson, D. L., Easter-Pilcher, A. & Fraser, W. R. 2003 The
effects of human activity and environmental variability on
long-termchanges inAdelie penguin populations at Palmer
Station, Antarctica. In Antarctic biology in a global context
(ed. A. H. L. Huiskes, W. W. C. Gieskes, J. Rozema,
R. M. L. Schorno, S. M. van der Vies & W. J. Wolff ),
pp. 301–307. Leiden, The Netherlands: Backhuys
Publishers.
Peck, L. S. et al. 2005 Genomics: applications to Antarctic
ecosystems. Polar Biol. 28, 351–365.Perissinotto, R. & Pakhomov, E. A. 1998 Contribution of
salps to carbon flux of marginal ice zone of the Lazarev
Sea, Southern Ocean. Mar. Biol. 131, 25–32. (doi:10.
1007/s002270050292)
Pitman, R. L. & Ensor, P. 2003 Three different forms of killer
whales in Antarctic waters. J. Cetacean Res. Manag. 5,
131–139.
Povero, P., Misic, C., Ossola, C., Castellano, M. & Fabiano,
M. 2003 The trophic role and ecological implications of
oval faecal pellets in Terra Nova Bay (Ross Sea). Polar Biol.
26, 302–310.
Prezelin, B. B., Moline, M. A. & Matlick, H. A. 1998
Icecolors 1993: spectral UV radiation effects on Antarctic
frazil ice algae. In Antarctic sea ice: biological processes,
interactions and variability, vol. 73 (ed. M. P. Lizotte &
K. R. Arrigo), pp. 45–83. Washington, DC: American
Geophysical Union.
Prezelin, B. B., Hofmann, E. E., Mengelt, C. & Klinck, J. M.
2000 The linkage between upper circumpolar deep water
(UCDW) and phytoplankton assemblages on the West
Antarctic Peninsula continental shelf. J. Mar. Res. 58,
165–202. (doi:10.1357/002224000321511133)
Prezelin, B. B., Hofmann, E. E., Moline, M. & Klinck, J. M.
2004 Physical forcing of phytoplankton community
structure and primary production in continental shelf
waters of the Western Antarctic Peninsula. J. Mar. Res. 62,
419–460. (doi:10.1357/0022240041446173)
Quetin, L. B. & Ross, R. M. 2001 Environmental variability
and its impact on the reproductive cycle of Antarctic krill.
Am. Zool. 41, 74–89. (doi:10.1668/0003-1569(2001)041
[0074:EVAIIO]2.0.CO;2)
Quetin, L. B. & Ross, R. M. 2003 Episodic recruitment in
Antarctic krill, Euphausia superba, in the Palmer LTER
study region. Mar. Ecol. Prog. Ser. 259, 185–200.Quetin, L. B., Ross, R. M., Frazer, T. K., Haberman & K. L.
1996 Factors affecting distribution and abundance of
zooplankton, with an emphasis on Antarctic krill,
Euphausia superba. In Foundations for ecological researchwest of the Antarctic Peninsula, vol. 70 (ed. R.M. Ross, E. E.
Hofmann & L. B. Quetin), pp. 357–371. Washington,
DC: American Geophysical Union.
Phil. Trans. R. Soc. B (2007)
Rhodes, O. E. & Odum, E. P. 1996 Spatiotemporalapproaches in ecology and genetics: the road less traveled.In Population dynamics in ecological space and time (ed. O. E.Rhodes, R. K. Chesser &M. H. Smith), pp. 1–8. Chicago,IL: University of Chicago Press.
Rind, D., Chandler, M., Lerner, J., Martinson, D. G. & Yuan,X. 2001 Climate response to basin-specific changes inlatitudinal temperature gradients and implications for seaice variability. J. Geophys. Res. 106, 20 161–20 173.(doi:10.1029/2000JD900643)
Rodriguez, F., Varela, M. & Zapata, M. 2002a Phytoplanktonassemblages in the Gerlache and Bransfield Straits(Antarctic Peninsula) determined by light microscopyand CHEMTAX analysis of HPLC pigment data. Deep-Sea Res. II 49, 723–747. (doi:10.1016/S0967-0645(01)00121-7)
Rodriguez, J., Jimenez-Gomez, F., Blanco, J. M. &Figueroa, F. L. 2002b Physical gradients and spatialvariability of the size structure and composition ofphytoplankton in the Gerlache Strait (Antarctica).Deep-Sea Res. II 49, 693–706. (doi:10.1016/S0967-0645(01)00119-9)
Ross, R. M. & Quetin, L. B. 1991 Ecological physiology oflarval euphausiids, Euphausia superba (Euphausiacea).Mem. Queensl. Mus. 31, 321–333.
Ross, R. M., Hofmann, E. E. & Quetin, L. B. (eds) 1996Foundations for ecological research west of the AntarcticPeninsula. AGU Antarctic research series, vol. 70. Washing-ton, DC: American Geophysical Union.
Ross, R. M., Quetin, L. B. & Haberman, K. L. 1998Interannual and seasonal variability in short-term grazingimpact of Euphausia superba in nearshore and offshorewaters west of the Antarctic Peninsula. J. Mar. Syst. 17,261–273. (doi:10.1016/S0924-7963(98)00042-6)
Ross, R. M., Quetin, L. B., Baker, K. S., Vernet, M. & Smith,R. C. 2000 Growth limitation in young Euphausia superbaunder field conditions. Limnol. Oceanogr. 45, 31–43.
Ross, R. M., Quetin, L. B., Martinson, D. G., Iannuzzi,R. A., Stammerjohn, S. E. & Smith, R. C. In press. PalmerLTER: patterns of distribution of major zooplanktonspecies west of the Antarctic Peninsula over a twelve yearspan. Deep-Sea Res. II.
Savidge, G., Harbour, D. S., Gilpin, L. C. & Boyd, P.W. 1995Phytoplankton distributions and production in theBellingshausen Sea, Austral spring 1992. Deep-Sea Res. II42, 1201–1224. (doi:10.1016/0967-0645(95) 00062-U)
Schnack-Schiel, S. B. & Mujica, A. 1994 The zooplankton ofthe Antarctic Peninsula region. In Southern Ocean ecology:the BIOMASS perspective (ed. S. Z. El-Sayed), pp. 79–92.Cambridge, UK: Cambridge University Press.
Serebrennikova, Y. M. & Fanning, K. A. 2004 Nutrients inthe Southern Ocean GLOBEC region: variations, watercirculation, and cycling. Deep-Sea Res. II 51, 1981–2002.(doi:10.1016/j.dsr2.2004.07.023)
Siegel, V. 1988 A concept of seasonal variation of krill(Euphausia superba) distribution and abundance west ofthe Antarctic Peninsula. In Antarctic ocean and resourcesvariability (ed. D. Sarhage), pp. 220–230. Berlin,Germany: Springer.
Siegel, V. & Loeb, V. 1995 Recruitment of Antarctic krillEuphausia superba and possible causes for its variability.Mar. Ecol. Prog. Ser. 123, 45–56.
Siegel, V. & Piatkowski, U. 1990 Variability in the macro-zooplankton community off the Antarctic Peninsula. PolarBiol. 10, 373–386.
Siegel, V., Loeb, V. & Groger, J. 1998 Krill (Euphausiasuperba) density, proportional and absolute recruitmentand biomass in the Elephant Island region (AntarcticPeninsula) during the period 1977 to 1997. Polar Biol. 19,393–398. (doi:10.1007/s003000050264)

Marine pelagic ecosystems: the WAP H. W.Ducklow et al. 93
Siegel, V., Bergstrom, B., Muhlenhardt-Siegel, U. &
Thomasson, M. 2002 Demography of krill in the Elephant
Island area during summer 2001 and its significance for
stock recruitment. Antarctic Sci. 14, 162–170. (doi:10.
1017/S095410200200072X)
Siegel, V., Ross, R. M. & Quetin, L. B. 2003 Krill (Euphausiasuperba) recruitment indices from the western Antarctic
Peninsula: are they representative of larger regions? Polar
Biol. 26, 672–679. (doi:10.1007/s00300-003-0537-5)Simmonds, I. 2003Modes of atmospheric variability over the
Southern Ocean. J. Geophys. Res. 108. (doi:101029/
2000JC000542)
Simmonds, I. & Jacka, T. H. 1995 Relationships between the
interannual variability of Antarctic sea ice and the
Southern Oscillation. J. Clim. 8, 637–647. (doi:10.1175/
1520-0442(1995)008!0637:RBTIVOO2.0.CO;2)
Simmonds, I. & King, J. C. 2004 Global and hemispheric
climate variations affecting the Southern Ocean. Antarctic
Sci. 16, 401–413. (doi:10.1017/S0954102004002226)Sirovic, A., Hildebrand, J. A., Wiggins, S. M., McDonald,
M. A., Moore, S. E. & Thiele, D. 2004 Seasonality of blue
and fin whale calls and the influence of sea ice in the
Western Antarctic Peninsula. Deep-Sea Res. II 51,
2327–2344. (doi:10.1016/j.dsr2.2004.08.005)
Smetacek, V. & Nicol, S. 2005 Polar ocean ecosystems in a
changing world. Nature 437, 362–368. (doi:10.1038/
nature04161)
Smetacek, V., Scharek, R. & Nothig, E. M. 1990 Seasonal
and regional variation in the pelagial and its relationship to
the life history of krill. In Antarctic ecosystems: ecological
change and conservation (ed. K. R. Kerry & G. Hempel),
pp. 103–114. Berlin, Germany: Springer.
Smetacek, V., De Baar, H. J. W., Bathmann, U. V., Lochte, K.
& Rutgers van der Loeff, M. M. 1997 Ecology and
biogeochemistry of the Antarctic circumpolar current
during austral spring: a summary of Southern Ocean
JGOFS cruise ANT X/6 of R.V. Polarstern. Deep-Sea Res.
II 44, 1–21. (doi:10.1016/S0967-0645(96)00100-2)Smith Jr, W. O. & Nelson, D. M. 1985 Phytoplankton bloom
produced by a receding ice edge in the Ross Sea: spatial
coherence with the density field. Science 227, 163–166.
(doi:10.1126/science.227.4683.163)
Smith, S. L. & Schnack-Schiel, S. B. 1990 Polar Zooplank-
ton. In Polar oceanography (ed. W. O. Smith), pp. 527–598.
San Diego, CA: Academic Press.
Smith, R. C. & Stammerjohn, S. E. 2001 Variations of surface
air temperature and sea ice extent in theWestern Antarctic
Peninsula (WAP) region. Ann. Glaciol. 33, 493–500.Smith, R. C. et al. 1992 Ozone depletion: ultraviolet radiation
and phytoplankton biology in Antarctic waters. Science255, 952–959. (doi:10.1126/science.1546292)
Smith, R. C. et al. 1995 The Palmer LTER: a long-term
ecological research program at Palmer Station, Antarctica.
Oceanography 8, 77–86.
Smith, R. C., Dierssen, H. M. & Vernet, M. 1996aPhytoplankton biomass and productivity in the western
Antarctic peninsula region. In Foundations for ecological
research west of the Antarctic Peninsula, vol. 70 (R. M. Ross,
E. E.Hofmann&L. B.Quetin), pp. 333–356.Washington,
DC: American Geophysical Union.
Smith, R. C., Stammerjohn, S. E. & Baker, K. S. 1996b
Surface air temperature variations in the western Antarctic
peninsula region. In Foundations for ecological research west
of the Antarctic Peninsula, vol. 70 (ed. R. M. Ross, E. E.
Hofmann & L. B. Quetin), pp. 105–121. Washington,
DC: American Geophysical Union.
Smith, R. C., Baker, K. S. & Stammerjohn, S. E. 1998a
Exploring sea ice indexes for polar ecosystem studies.
BioScience 48, 83–93. (doi:10.2307/1313133)
Phil. Trans. R. Soc. B (2007)
Smith, R. C., Baker, K. S. & Vernet, M. 1998b Seasonal andinterannual variability of phytoplankton biomass west ofthe Antarctic Peninsula. J. Mar. Syst. 17, 229–243.(doi:10.1016/S0924-7963(98)00040-2)
Smith, D. A., E, E., Hofmann, J. M. & Klinck, C. M. 1999aLascara hydrography and circulation of the west AntarcticPeninsula continental shelf. Deep-Sea Res. I. 46, 925–949.(doi:10.1016/S0967-0637(98)00103-4)
Smith, R. C. et al. 1999b Marine ecosystems sensitivity tohistorical climate change: Antarctic Peninsula. BioScience49, 393–404. (doi:10.2307/1313632)
Smith Jr, W. O., Marra, J., Hiscock, M. R. & Barber, R. T.2000 The seasonal cycle of phytoplankton biomass andprimary productivity in the Ross Sea, Antarctica. Deep-SeaRes. II 47, 3119–3140. (doi:10.1016/S0967-0645(00)00061-8)
Smith, R. C., Baker, K. S., Dierssen, H. M., Stammerjohn,S. E. &Vernet,M. 2001Variability of primary production inan Antarctic marine ecosystem as estimated using a multi-scale sampling strategy. Am. Zool. 41, 40–56. (doi:10.1668/0003-1569(2001)041[0040:VOPPIA]2.0.CO;2)
Smith, R. C., Fraser, W. R. & Stammerjohn, S. E. 2003aClimate variability and ecological response of the marineecosystem in the western Antarctic Peninsula (WAP)region. In Climate variability and ecosystem response at long-term ecological research sites (ed. D. Greenland, D. G.Goodin & R. C. Smith), pp. 158–173. New York, NY:Oxford University Press.
Smith, R. C., Fraser, W. R., Stammerjohn, S. E. & Vernet, M.2003b Palmer long-term ecological research on theAntarctic marine ecosystem. In Antarctic Peninsula climatevariability: historical and paleoenvironmental perspective (ed.E. Domack, A. Leventer, A. Burnett, R. Bindschadler, P.Convey & M. Kirby), pp. 131–144. Washington, DC:American Geophysical Union.
Smith, W. O., Ainley, D. G. & Cattaneo-Vietti, R. 2007Trophic interactions within the Ross Sea Continental shelfecosystem. Phil. Trans. R. Soc. B 362, 95–111. (doi:10.1098/rstb.2006.1956)
Smith, C. R., Mincks, S. & DeMaster, D. J. In press a. Asynthesis of bentho-pelagic coupling on the AntarcticShelf: food banks, ecosystem inertia and global climatechange. Deep-Sea Res. II.
Smith, R. C., Martinson, D. G., Stammerjohn, S. E.,Iannuzzi, R. A. & Ireson, K. In press b. Bellingshausenand Western Antarctic Peninsula region: pigment biomassand sea ice spatial/temporal distributions and interannualvariability. Deep-Sea Res. I.
Stammerjohn, S. E. & Smith, R. C. 1997 Opposing SouthernOcean climate patterns as revealed by trends in regionalsea ice coverage. Clim. Change 37, 617–639. (doi:10.1023/A:1005331731034)
Stammerjohn, S.E.,Drinkwater,M.R., Smith,R.C.&Liu,X.2003 Ice–atmosphere interactions during sea-ice advanceand retreat in the western Antarctic Peninsula region.J. Geophys. Res. 108. (doi:101029/2002JC001543)
Stammerjohn, S. E., Martinson, D. G., Smith, R. C. & Yuan,X. In press a. Trends in sea ice retreat and subsequentadvance in response to ENSO and SAM variability at highsouthern latitudes. J. Climatol.
Stammerjohn, S. E., Martinson, D. G., Smith, R. C. &Iannuzzi, R. A. In press b. Sea ice in the Palmer LTERregion: spatio-temporal variability from ecological andclimate change perspectives. Deep Sea Res. II.
Sweeney, C., Hansell, D. A., Carlson, C. A., Codispoti, L. A.,Gordon, L. I., Marra, J., Millero, F. J., Smith, W. O. &Takahashi, T. 2000a Biogeochemical regimes, net com-munity production and carbon export in the Ross Sea,Antarctica. Deep-Sea Res. II 47, 3369–3394. (doi:10.1016/S0967-0645(00)00072-2)
94 H. W.Ducklow et al. Marine pelagic ecosystems: the WAP
Sweeney, C. et al. 2000b Nutrient and carbon removal ratiosand fluxes in the Ross Sea, Antarctica. Deep-Sea Res. II 47,3395–3421. (doi:10.1016/S0967-0645(00)00073-4)
Takahashi, T. et al. 2002 Global sea–air CO2 flux based onclimatological surface ocean pCO2, and seasonal biologi-cal and temperature effects. Deep-Sea Res. II 49,1601–1622. (doi:10.1016/S0967-0645(02)00003-6)
Thompson, D. W. J. & Solomon, S. 2002 Interpretation ofrecent southern hemisphere climate change. Science 296,895–899. (doi:10.1126/science.1069270)
Thompson, L. G., Peel, D. A., Mosley-Thompson, E.,Mulvaney, R., Dai, J., Lin, P. N., Davis, M. E. &Raymond, C. F. 1994 Climate since A.D. 1510 on DyerPlateau, Antarctic Peninsula: evidence for recent climatechange. Ann. Glaciol. 20, 420–426.
Treguer, P. & Jacques, G. 1992 Dynamics of nutrients andphytoplankton and fluxes of carbon, nitrogen and siliconin the Antarctic Ocean. Polar Biol. 12, 149–162. (doi:10.1007/BF00238255)
Turner, J. T. 2002 Zooplankton fecal pellets, marine snowand sinking phytoplankton blooms. Aquat. Microb. Ecol.27, 57–102.
Turner, J. 2004 Review: the El Nino-Southern Oscillation andAntarctica. Int. J. Clim. 24, 1–31. (doi:10.1002/joc.965)
van den Broeke, M. R. & van Lipzig, N. 2003 Response ofwintertime Antarctic temperatures to the AntarcticOscillation: results of a regional climate model. InAntarctic Peninsula climate variability: historical and paleo-environmental perspectives (ed. E. Domack, A. Leventer,A. Burnett, R. Bindschadler, P. Convey & M. Kirby),pp. 43–58. Washington, DC: American GeophysicalUnion.
Vaughan, D. G., Marshall, G. J., Connolley, W. M.,Parkinson, C., Mulvaney, R., Hodgson, D. A., King,J. C., Pudsey, C. J. & Turner, J. 2003 Recent rapid regionalclimate warming on the Antarctic Peninsula. Clim. Change60, 243–274. (doi:10.1023/A:1026021217991)
Vernet, M. &Kozlowski, W. A. 2001Ultraviolet radiation andthe Antarctic coastal marine ecosystem. In Ecosystems andultraviolet radiation (ed. C. S. Cockell & A. R. Blaustein),pp. 170–194. New York, NY: Springer.
Villafane, V., Helbling, E. W. & Holm-Hansen, O. 1993Phytoplankton around Elephant Island, Antarctica. PolarBiol. 13, 183–191.
Volk,T.&Hoffert,M. I. 1985Ocean carbon pumps: analysis ofrelative strengths and efficiencies in ocean-driven atmos-phericCO2changes. InThe carbon cycle andatmospheric CO2:natural variations Archean to present, vol. 32 (ed. E. T.Sundquist &W. S.Broecker), pp. 99–110.Washington,DC:American Geophysical Union.
Volkman, N. J., Presler, P. & Trivelpiece, W. Z. 1980 Diets ofpygoscelid penguins at King George Island, Antarctica.Condor 82, 373–378.
Voronina, N. M. 1998 Comparative abundance and distri-bution of major filter-feeders in the Antarctic pelagic zone.J. Mar. Syst. 17, 375–390. (doi:10.1016/S0924-7963(98)00050-5)
Phil. Trans. R. Soc. B (2007)
Walsh, J. J., Dieterle, D. A. & Lenes, J. 2001 A numericalanalysis of carbon dynamics of the Southern Oceanphytoplankton community: the roles of light and grazingin effecting both sequestration of atmospheric CO2 andfood availability to krill. Deep-Sea Res. I 48, 1–48. (doi:10.1016/S0967-0637(00)00032-7)
Ward, P., Grant, S., Brandon, M., Siegel, V., Sushin, V.,Loeb, V. & Griffiths, H. 2004 Mesozooplankton commu-nity structure in the Scotia Sea during the CCAMLR 2000survey: January–February 2000. Deep-Sea Res. II 51,1351–1367. (doi:10.1016/j.dsr2.2004.06.016)
Watkins, A. B. & Simmonds, I. 2000 Current trends inAntarctic sea ice: the 1990s impact on a short climatology.J. Clim. 13, 4441–4451. (doi:10.1175/1520-0442(2000)013!4441:CTIASIO2.0.CO;2)
Watkins, J. L., Hewitt, R., Naganobu, M. & Sushin, V. 2004The CCAMLR 2000 survey: a multinational, multi-shipbiological oceanography survey of the Atlantic sector ofthe Southern Ocean. Deep-Sea Res. II 51, 1205–1213.(doi:10.1016/j.dsr2.2004.06.010)
Weber, L. H. & El-Sayed, S. Z. 1986 The variance spectra ofphytoplankton, krill and water temperature in theAntarctic Ocean south of Africa. Deep-Sea Res. I 33,1327–1343. (doi:10.1016/0198-0149(86)90039-7)
Wefer, G., Fischer, G., Futterer, D. & Gersonde, R. 1988Seasonal particle flux in the Bransfield Strait. Antarctica.Deep-Sea Res. 35, 891–898.
Weimerskirch, H., Inchausti, P., Guinet, C. & Barbraud, C.2003 Trends in bird and seal populations as indicators of asystem shift in the Southern Ocean. Antarctic Sci. 15,249–256. (doi:10.1017/S0954102003001202)
Williams, T. D. 1995 The penguins. New York, NY: OxfordUniversity Press.
Woehler, E. J. 1993 The distribution and abundance of Antarcticand Subantarctic penguins. Australia: Hobart, ScientificCommittee on Antarctic Research.
Woehler, E. J., et al. 2001 A statistical assessment of the statusand trends of Antarctic and Subantarctic seabirds. Hobart,Australia: Scientific Committee on Antarctic Research.
Yager, P. L., Wallace, D. W. R., Johnson, K. M., Smith Jr,W. O., Minnett, P. J. & Deming, J. W. 1995 The NortheastWater Polynya as an atmospheric CO2 sink: a seasonalrectification hypothesis. J. Geophys. Res. C 100,4389–4398. (doi:10.1029/94JC01962)
Yuan, X. 2004 ENSO-related impacts on Antarctic sea ice: asynthesis of phenomenon and mechanisms. Antarctic Sci.16, 415–425. (doi:10.1017/S0954102004002238)
Yuan, X. & Martinson, D. G. 2000 Antarctic sea iceextent variability and its global connnectivity. J. Clim.13, 1697–1717. (doi:10.1175/1520-0442(2000)013!1697:ASIEVAO2.0.CO;2)
Yuan, X. & Martinson, D. G. 2001 The Antarctic dipole andits predictability. Geophys. Res. Lett. 28, 3609–3612.(doi:10.1029/2001GL012969)
Zwally, J. H., Comiso, J. C., Parkinson, C. L., Cavalieri, D. J.& Gloersen, P. 2002 Variability of Antarctic sea ice 1979K1998. J. Geophys. Res. 107. (doi:101029/2000JC000733)
Related Documents