Marginal Effects of Merit Aid for Low-Income Students ∗ Joshua Angrist David Autor Amanda Pallais December 2021 Abstract Financial aid from the Susan Thompson Buffett Foundation (STBF) provides comprehen- sive support to a college population similar to that served by a host of state aid programs. In conjunction with STBF, we randomly assigned aid awards to thousands of Nebraska high school graduates from low-income, minority, and first-generation college households. Randomly- assigned STBF awards boost bachelor’s (BA) degree completion for students targeting four-year schools by about 8 points. Degree gains are concentrated among four-year applicants who would otherwise have been unlikely to pursue a four-year program. Degree effects are mediated by award-induced increases in credits earned towards a BA in the first year of college. The extent of initial four-year college engagement explains impact differences by target campus and across covariate subgroups. The projected lifetime earnings impact of awards exceeds marginal educa- tional spending for all of the subgroups examined in the study. Projected earnings gains exceed funder costs for urban students and for students with relatively weak academic preparation. JEL Codes: H52, I22, J24. ∗ This study was carried out under data-use agreements between MIT and the Susan Thompson Buffett Foundation (STBF) and between STBF and Nebraska’s public colleges and universities. We are grateful to Sally Hudson for her contributions to this project. Noa Benveniste, Nick Gebbia, Raymond Han, Kenya Heard, Anran Li, and Julia Turner provided outstanding research assistance. Enrico Cantoni, Sydnee Caldwell, Brandon Enriquez, Tyler Hoppenfeld, Sookyo Jeong, Olivia Kim, Brendan Malone, Kemi Oyewole, Karen Scott, and Carolyn Stein were instrumental in the project’s early stages. Our thanks also go to Eryn Heying and Anna Vallee for invaluable administrative support, and to the staff of the Susan Thompson Buffett Foundation for their expert assistance in implementing the evaluation. We thank the Provost’s Office at the University of Nebraska, the Nebraska State College System, and Nebraska’s community colleges for their support for this effort and for sharing their data. Raj Chetty, Amy Finkelstein, Nathan Hendren, Lisa Kahn, Lawrence Katz, Danielle Li, Ben Sprung-Keyser and seminar participants at AASLE, Amazon, Brookings, Boston University, Carleton College, Dartmouth, Harvard, IIES, J-PAL, MIT, NBER Summer Institute, Northwestern, Princeton, UC Berkeley, University of Chicago, University of Melbourne, University of Michigan, and Yale made many helpful comments and suggestions. We acknowledge financial support from the Susan Thompson Buffett Foundation and the MIT SEII seed fund. The views expressed herein are those of the authors and do not necessarily reflect the views of the National Bureau of Economic Research or the views of institutional study partners. Corresponding author: Pallais; Email: [email protected]; Address: Littauer Center of Public Administration, 1805 Cambridge St, Cambridge, MA 02138; Phone: 617-495-2151; Fax: 617-495-7730. Word count: 11567.

Welcome message from author
This document is posted to help you gain knowledge. Please leave a comment to let me know what you think about it! Share it to your friends and learn new things together.
Transcript
Marginal Effects of Merit Aid for Low-Income Students∗
Joshua Angrist
David Autor
Amanda Pallais
December 2021
Abstract
Financial aid from the Susan Thompson Buffett Foundation (STBF) provides comprehen-sive support to a college population similar to that served by a host of state aid programs.In conjunction with STBF, we randomly assigned aid awards to thousands of Nebraska highschool graduates from low-income, minority, and first-generation college households. Randomly-assigned STBF awards boost bachelor’s (BA) degree completion for students targeting four-yearschools by about 8 points. Degree gains are concentrated among four-year applicants who wouldotherwise have been unlikely to pursue a four-year program. Degree effects are mediated byaward-induced increases in credits earned towards a BA in the first year of college. The extentof initial four-year college engagement explains impact differences by target campus and acrosscovariate subgroups. The projected lifetime earnings impact of awards exceeds marginal educa-tional spending for all of the subgroups examined in the study. Projected earnings gains exceedfunder costs for urban students and for students with relatively weak academic preparation.JEL Codes: H52, I22, J24.
∗This study was carried out under data-use agreements between MIT and the Susan Thompson Buffett Foundation(STBF) and between STBF and Nebraska’s public colleges and universities. We are grateful to Sally Hudson for hercontributions to this project. Noa Benveniste, Nick Gebbia, Raymond Han, Kenya Heard, Anran Li, and Julia Turnerprovided outstanding research assistance. Enrico Cantoni, Sydnee Caldwell, Brandon Enriquez, Tyler Hoppenfeld,Sookyo Jeong, Olivia Kim, Brendan Malone, Kemi Oyewole, Karen Scott, and Carolyn Stein were instrumental in theproject’s early stages. Our thanks also go to Eryn Heying and Anna Vallee for invaluable administrative support, andto the staff of the Susan Thompson Buffett Foundation for their expert assistance in implementing the evaluation.We thank the Provost’s Office at the University of Nebraska, the Nebraska State College System, and Nebraska’scommunity colleges for their support for this effort and for sharing their data. Raj Chetty, Amy Finkelstein, NathanHendren, Lisa Kahn, Lawrence Katz, Danielle Li, Ben Sprung-Keyser and seminar participants at AASLE, Amazon,Brookings, Boston University, Carleton College, Dartmouth, Harvard, IIES, J-PAL, MIT, NBER Summer Institute,Northwestern, Princeton, UC Berkeley, University of Chicago, University of Melbourne, University of Michigan, andYale made many helpful comments and suggestions. We acknowledge financial support from the Susan ThompsonBuffett Foundation and the MIT SEII seed fund. The views expressed herein are those of the authors and do notnecessarily reflect the views of the National Bureau of Economic Research or the views of institutional study partners.Corresponding author: Pallais; Email: [email protected]; Address: Littauer Center of Public Administration,1805 Cambridge St, Cambridge, MA 02138; Phone: 617-495-2151; Fax: 617-495-7730. Word count: 11567.

I. Introduction
American governments and private organizations spent $184 billion on financial aid to under-
graduates in 2019. Government grant aid amounted to about $3,250 per full-time undergraduate,
while private and institutional grants came to almost $5,600 per student.1 Yet, the consequences of
this vast expenditure for college enrollment and degree completion remain unclear. Causal effects
of aid are difficult to identify for at least two reasons. First, aid decisions are confounded with
student characteristics like family background and ability. Second, naturally-occurring variation in
aid rules often changes aid packages by only a few hundred dollars. It’s hard to say whether the
response to such modest changes predict those of withdrawing or adding more substantial awards.
This paper gauges the effects of grant aid on degree completion using a randomized field exper-
iment that allocated scholarships to 3,700 high school seniors who graduated from 2012-16. The
experiment was conducted in partnership with the Susan Thompson Buffett Foundation (STBF),
which funds about eleven percent of Nebraska high school seniors who go on to attend a Nebraska
public college.2 Characterized by modest merit cutoffs, a focus on applicants to public colleges
and strict family income eligibility caps, the STBF program targets an economically-disadvantaged
population judged capable of college-level work. Three-quarters of those in the experimental sample
are eligible for need-based federal Pell grant aid, one-third are nonwhite, and fewer than a third
have a parent with a bachelor’s degree (BA). STBF awards are unusually comprehensive, paying
college costs for up to five years at any Nebraska public four-year college and up to three years
at any Nebraska public two-year college. Because STBF grant aid can be applied to any part
of a student’s total cost of attendance—tuition, fees, books, room and board, personal expenses,
and transportation—STBF awards are offset little by clawbacks or caps that affect other sorts of
post-secondary aid.
For whom and by how much does STBF aid boost degree completion? Random assignment of
STBF awards shows that aid boosts six-year BA completion rates for students targeting four-year
schools by about 8 points (on a base of 64 percent). Degree gains are concentrated in groups of
four-year applicants who are unlikely to have otherwise enrolled in four-year programs and who have
1These statistics are from https://research.collegeboard.org/ (accessed May 2020). The federal governmentalso loaned an average of $4,090 per undergraduate in 2019.
2Authors’ calculations from data obtained from STBF and Coordinating Commission for Postsecondary Education(2013).
1

low predicted BA completion rates. This inverse relationship between baseline expected completion
rates and the causal effect of aid on BAs is not a mechanical ceiling effect: even in the subgroups
most likely to graduate, completion rates are below 80 percent. Aid to applicants targeting two-year
schools does not increase associate degrees but may increase BAs. The latter effect is positive but
not significantly different from zero.
Our analysis explains degree gains among applicants targeting BA programs with the aid of
a simple causal model. Specifically, we show that degree effects can be explained by the effect of
awards on credit units earned towards a BA in the first year of study. STBF aid is effective to the
extent that it promotes early and deep engagement with a four-year college program. This early
engagement mediator accounts for heterogeneous effects by target campus (e.g., whether a student
targets a University of Nebraska campus in Omaha or Lincoln) and across covariate subgroups
defined by characteristics like race and ACT scores.3
We use an over-identification test to evaluate the hypothesis that early four-year engagement
is the sole channel through which aid affects degree completion. While other stories cannot be
ruled out, the null hypothesis that attributes bachelor’s degree gains to this single causal pathway
fits remarkably well. The results reported here also show no significant difference in the effects
of aid accompanied by academic support services (delivered through a program called Learning
Communities) and the effects of financial awards alone. Results comparing recipients of aid plus
academic support services with other award recipients should be seen as preliminary, however, since
they rely on data for only two cohorts.4
The paper concludes with a provisional comparison of program costs and anticipated earnings
gains for STBF award recipients. This analysis highlights the gap between the private and social
costs of marginal degrees. On average, scholarship awards to students targeting bachelor’s degrees
cost the funder a total of $32, 250 over six years, while raising direct costs of attendance (tuition
plus books and supplies) by only $2, 390. Viewed through this lens, most funder spending is a
transfer. At the same time, the estimated lifetime earnings gains generated by scholarship awards
3By “engagement”, we mean four-year college credits taken in the first year after high school. Other studiesuse this term to capture emotional, behavioral, and cognitive involvement in learning (Appleton, Christenson andFurlong 2008). Cole et al. (2020), who study the STBF Learning Communities program, measure engagement by howfrequently students ask questions and connect with peer mentors.
4Larger samples, available in years to come, should generate more precise estimates of the causal impact of LearningCommunity services.
2

seem likely to exceed the sum of incremental educational costs and foregone earnings for each of the
subgroups examined here (defined by race, gender, academic preparation, and Pell eligibility). The
comparison of expected gains with funder costs is more mixed, but gains are likely large enough to
outweigh costs for award recipients whose degree attainment is most strongly affected by scholarship
awards. This includes urban applicants, applicants who indicate they prefer a four-year college but
are also considering two-year colleges, and applicants with weaker academic preparation. From the
funder’s point of view, award targeting increases program efficiency markedly.
II. Background
II.A. The STBF Scholarship Program
STBF has been funding Nebraskan college students since 1965, and supported around 4,000
students in 2020. STBF is the largest private provider of post-secondary grant aid in Nebraska;
more than half of Pell-eligible Nebraska seniors who apply for federal aid also apply for an STBF
scholarship.5
STBF financial support is awarded on the basis of need and merit to Nebraska-resident high
school seniors and Nebraska high school graduates. Both public and private school graduates are
eligible, as are GED holders. Aid can be applied toward cost of attendance (including tuition, fees,
and room and board) at any public two-year or four-year college in Nebraska. Award amounts
are campus-specific. STBF sets a maximum award amount for each institution which is roughly
equal to tuition and fees plus a $500 book allotment. For example, 2013 awards provided $8,500
per academic year for full-time students at the University of Nebraska’s Lincoln campus, where
tuition and fees amounted to $8,060. Awards are pro-rated for part-time students. Recipients’
total grant aid is capped at the federally recognized cost of attendance (COA). Conditional on good
academic standing (award recipients are expected to maintain at least a 2.0 GPA), STBF awards
are renewable for five years, three of which can be used at a two-year college.6
5Authors’ calculations from data obtained by request from the Federal Student Aid office.6STBF awards renew annually conditional on awarded students earning a GPA of at least 2.0 and at the Founda-
tion’s discretion otherwise. Nebraska public colleges require a 2.0 cumulative GPA to graduate. Grade reports arefrom schools rather than students. Award recipients are encouraged to update their FAFSAs annually.
3
Scholarship eligibility is limited to applicants with a FAFSA-determined expected family con-
tribution (EFC) below $10,000 and a high school GPA above 2.5.7 Scholarship applicants complete
an online application (typically due around February 1st), submitting their FAFSA, high school
transcript, an essay, and recommendation letters from adults in their community. Scholarship de-
cisions are announced in mid-April. Applicants are asked to identify a first-choice target school at
which they hope to use the scholarship (such as the University of Nebraska at Omaha). This is
non-binding, but highly predictive of award winners’ college choices. Online Appendix A.1 details
the application and scholarship renewal process further.
STBF aid has much in common with major public programs for post-secondary support. Like
the federal government’s Pell program, STBF awards are based in part on financial need. Like
many state aid programs, STBF considers a variety of applicant features including financial need and
indicators of college readiness. STBF awards are more comprehensive than Pell grants and available
to many applicants with EFCs above the Pell cutoff, though some state programs approach STBF
levels of aid. Generous state benchmarks include the CalGrant program examined by Kane (2003)
and Bettinger et al. (2019), and the Texas Longhorn Opportunity Scholarship and Century Scholars
programs evaluated by Andrews, Imberman and Lovenheim (2020). Combined with Pell, the Texas
programs cover all tuition and fees at The University of Texas and Texas A&M. Like STBF awards,
the Texas programs target low-income college-bound high school students and provide a range of
academic support services to recipients who enroll at a covered campus.
Many recipients of STBF awards (known as Buffett Scholars) attend the University of Nebraska,
known locally as “NU.” Scholarship winners who attend one of NU’s three main campuses—Lincoln
(UNL), Omaha (UNO), or Kearney (UNK)—are required to participate in STBF-funded Learning
Community (LC) programs during their first and second years of college. These programs, detailed
in Kezar and Kitchen (2020), incorporate a mix of college classes for STBF-funded students, social
activities, peer mentoring, and academic advising. Many LC participants at UNK and UNL live in
dedicated residence halls.8
7By way of comparison, the 2013 Pell-eligibility threshold was $5,081. EFC cutoffs for STBF awards were $15,000in 2012, the first year of the experiment.
8Some award recipients after 2013 were offered aid without required LC participation through a new award programdescribed below. Impact evaluations of LC programs and LC-type services include Bloom and Sommo (2015), Angrist,Lang and Oreopoulos (2009), Bettinger and Baker (2014), Weiss et al. (2015), and Levin and Garcıa (2018).
4
1. Related Work. This study builds on decades of empirical work examining causal effects
of post-secondary financial aid. Since the pioneering investigation by Fuller, Manski and Wise
(1983), economists have explored the hypothesis that college aid aid is mostly inframarginal, leaving
recipients’ college outcomes unchanged.
Online Appendix Table A1 summarizes many econometric analyses of grant aid.9 This table
shows a wide range of estimated aid effects, even when computed for the same programs (as do
the research summaries in Dynarski and Scott-Clayton 2008; Deming and Dynarski 2010; Page
and Scott-Clayton 2016). Most relevant for our purposes are studies using experimental and quasi-
experimental methods. In the latter category, econometric investigations of the effects of Pell grants
typically exploit discontinuities in the Pell award formula via a regression discontinuity (RD) design.
Recent RD estimates from Scott-Clayton and Schudde (2019) and Denning, Marx and Turner (2019)
suggest that Pell aid has a modest effect on persistence and degree completion. Early contributions
by Hansen (1983) and Kane (1996), by contrast, show little effect of the introduction of the Pell
program on student outcomes.
Regression discontinuity investigations are not limited to investigations of Pell grants. Castleman
and Long (2016), for example, uses a RD design to examine the impact of Florida’s Student Access
Grant. The resulting estimates show that grants increase college enrollment, particularly in four-
year institutions, as well as increasing BA completion. Bettinger et al. (2019) finds that California’s
CalGrant significantly increases bachelor’s degree completion, but does not impact initial college
enrollment.
Other studies use difference-in-difference-style analyses of state aid program roll-outs to identify
causal aid effects. In an influential implementation of this approach, Dynarski (2000) finds that
Georgia’s HOPE Program increased both college enrollment and college completion. Applying sim-
ilar methodology, Barr (2019) estimates positive post-911 GI Bill effects on both college enrollment
and graduation.
The wide range of results arising from observational studies is exemplified by Cohodes and
Goodman (2014), which finds that Massachusetts’ Adams Scholarship decreased bachelor’s degree
completion. These negative effects appear to reflect diversion of scholarship recipients from insti-
9A related literature looks at the impact of family income on college enrollment. For example, Bulman et al. (2021)finds that lottery windfalls increase college enrollment only if they are sufficiently large, while Hilger (2016) estimatessmall negative enrollment effects of parental job loss.
5

tutions with higher graduation rates to less competitive (on average) public colleges. Evidence on
state merit aid since Dynarski (2000) is also mixed. Fitzpatrick and Jones (2016) and Sjoquist
and Winters (2015), for example, find little or no effect of state merit scholarship programs on
enrollment and completion. As we discuss at length below, a key channel for STBF impact appears
to operate through initial enrollment. Our results are therefore aligned with earlier work showing
aid impacts in one of two configurations: (a) both initial enrollment and college completion rise,
or (b) neither enrollment nor completion rise.10 Also suggestive of the importance of early college
engagement, Carruthers and Ozek (2016) finds that the loss of financial aid leaves degree completion
rates unchanged.
Consistent with our emphasis on the timing of award impact, programs that focus on academic
performance and post-enrollment progress have so far yielded modest and/or subgroup-specific grad-
uation effects, if any. Interventions in this domain include West Virginia PROMISE scholarships
evaluated in Scott-Clayton (2011); Scott-Clayton and Zafar (2019) and the incentive schemes ex-
amined in Angrist, Lang and Oreopoulos (2009), Angrist, Oreopoulos and Williams (2014). The
incentive-heavy WV Promise six-year BA completion effects faded ten years beyond the award date.
Recent randomized evaluations provide an important point of comparison for our study. One
of the most noteworthy of these examines the Wisconsin Scholars Grant (WSG), a program that
offered $3,500 per year to Pell-eligible Wisconsin residents enrolled as full-time freshmen at four-
year colleges. WSG receipt leaves degree completion rates unchanged (Anderson et al. 2019). It is
noteworthy, however, that because WSG awards are made to already-enrolled first-year students,
they cannot affect first-year enrollment. Similarly, Mayer, Patel and Gutierrez (2015) reports that
aid contingent on academic performance given to low-income parents enrolled at two-year schools
and already receiving financial support accelerates degree completion but does not increase it. Harris
and Mills (2021) reports results from a program offering financial aid to Milwaukee high school
students enrolled at in-state colleges; this aid affected neither college enrollment nor bachelor’s
degree completion.
The Accelerated Study in Associate Programs (ASAP) initiative, which targets already-enrolled
community college students, appears to be highly effective at increasing degree completion and
shortening time to degree in a randomized trial. ASAP is unusual, however, in that its low-income
10Bettinger et al. (2019) is a notable exception.
6

recipients receive a wide array of support services, including some targeting non-academic needs (see
Scrivener et al. 2015 and Miller et al. 2020). Deming and Walters (2017) also finds large positive
effects of college spending—broadly defined—on enrollment and degree completion.
How does the STBF program and our evaluation of it fit into this literature? First, STBF
awards are unusually comprehensive (though some state programs offering aid at public institutions
are almost as generous). Program awards are also made early enough to change the entire post-
secondary path for college-bound high school students. And STBF awards include an incentive
component that may or may not be important. Finally, aid evaluations using random assignment
are rare.
II.B. Research Design and Sample Construction
Among five cohorts of scholarship applicants aiming to enroll in the fall of 2012 through the
fall of 2016, a subset of STBF awards were allocated by random assignment. Applications were
given a score based on students’ college-readiness, financial need, and other factors important to
the Foundation. The highest-scoring applicants (roughly 15 percent of the applicant pool) were
guaranteed awards, while the lowest-scoring applicants (roughly 10 percent) were removed from
consideration. The rest were subject to random assignment, with award rates determined by a
variety of constraints on award counts at the target schools in each cohort. Because award rates
differ by application year and target school, regression estimates discussed below control for a full
set of target-school by application-year dummies to reflect differing award rates. We refer to these
controls as “strata dummies.”
In the 2013–16 cohorts (the second through fifth cohorts), treated applicants targeting NU
campuses received one of two types of scholarships. The first, described to recipients as “Susan T.
Buffett Scholarships” combined financial aid with an obligation to participate in LCs. The second,
“College Opportunity Scholarships” (COS), consisted of financial aid only.11 This second arm of
the study was designed to reveal any incremental treatment effects due to LC participation. In
practice, awards with and without an LC component generate similar effects on college enrollment
and degree completion. Our ability to distinguish effects of the two types of awards is limited,
11Named scholarships may be more prestigious than the same amount of generic grant aid. The Buffett Scholarsprogram is well-known in Nebraska, while College Opportunity Scholarships were new in 2013 and not publicizedbeyond those offered one. COS awards might therefore be expected to have less of a motivating prestige effect.
7

however, by the size of the COS treatment sample. Most of the analysis below therefore pools the
two treatment groups.
The five cohorts involved in the randomized study include 3,699 treated applicants (applicants
offered aid) and 4,491 controls. Among treatment and control applicants, 6,845 indicated a four-
year college as their target school were they to be funded; the rest indicated that they would prefer
a two-year school. A breakdown of the number of applicants in the treatment and control groups
by application year and target campus appears in Table A2 in the Online Appendix. Of the 6,845
applicants targeting a four-year campus, 2,197 were offered STBF scholarships and 862 were offered
COS awards (where STBF awards are defined here as those mandating LC participation among NU
students). Of the 1,345 applicants targeting two-year schools, 640 were offered scholarships. We
analyze scholarship effects separately by target school program length, referring to applicants tar-
geting NU and other four-year colleges as in the “four-year strata,” and those targeting community
colleges as in the “two-year strata.” The primary analyses pool all five experimental cohorts, two
of which have not yet completed the experiment–so that the number of cohorts differs across out-
comes, e.g., enrollment versus completion. Online Appendix B reports a set of comparable (albeit
less precise) results computed using samples of balanced cohorts.
II.C. Data and Descriptive Statistics
Data for this project come from the STBF online application, linked with administrative records
from Nebraska’s public colleges and from the National Student Clearinghouse (NSC), which covers
most American post-secondary schools. Scholarship application records cover a rich set of base-
line characteristics, including high school transcripts, ACT scores, and demographic and financial
information from the FAFSA.12 Over 90 percent of STBF applicants who ultimately enrolled in
college attended a Nebraska public post-secondary school. These colleges and universities provided
information on their students’ enrollment, aid packages, and academic outcomes. To capture enroll-
ment at private and out-of-state colleges, we supplemented school-provided data on post-secondary
outcomes with information from the NSC. Appendix A provides additional information about data
sources and data processing.
12Data on the race of 2012 and 2013 applicants come from the Nebraska Department of Motor Vehicles.
8

The first three columns of Table I compare eligible scholarship applicants with national and
statewide samples of high school seniors.13 STBF applicants are from households with an average
income equal only to about half the average for the broader population of Nebraska high school
seniors. Compared to the average Nebraska high school senior, STBF applicants are more likely to
be female and less likely to have a parent who attended college. ACT scores among STBF applicants
are similar to those of other Nebraska ACT test-takers, though applicants are more likely to have
taken the ACT.14
Consistent with the criteria used to evaluate applications, STBF’s top-scoring applicants (those
guaranteed awards) have academic credentials well above the smaller group of applicants that did
not qualify for inclusion in the experimental sample. This can be seen in columns 4 and 5 in
Table I, which contain statistics for the top- and lowest-scoring applicants. Applicants guaranteed
STBF awards without random assignment had lower family incomes and less-educated parents than
applicants in the experimental group, statistics for which appear in column 6. The group guaranteed
awards also includes a higher proportion of Hispanic applicants. At the other end of the distribution,
applicants disqualified before random assignment have lower high school grades and ACT scores
than those subject to random assignment.
Finally, the last column of Table I, which reports strata-adjusted differences in characteristics by
treatment status for applicants in the experimental group, suggests the set of applicants randomly
selected for an award is indeed comparable to the randomly-selected control group. Table A3 in the
Online Appendix reports similar balance statistics computed within target-school strata.
III. Gauging Award Impacts
STBF paid $8,200 on average towards the first year of study for treated students targeting
a four-year program. Panel A of Figure I shows that these awards boosted applicants’ first-year
financial aid packages from $13,300 to $19,200. Importantly, Panel B shows that while a dollar
awarded raised total aid by only 52 cents, the gap between funder cost and amount received is due
almost entirely to a reduction in loans. In fact, for every dollar awarded, grant aid rose 96 cents,
13Data in column 1 comes from SEER (gender and race), ACS(family income and parent education status), and anACT National Profile Report (ACT 2012).
14The high rate of ACT-taking in the sample is indicative of the fact that scholarship applicants are actively thinkingabout attending college. Although we believe the sample is broadly representative of students traditionally served bygrant aid programs, it misses students who do not apply to college or for aid.
9

with concomitant declines of 33 cents in loans and 5 cents in earnings through work-study programs.
Figure A1 in the Online Appendix reports award effects on aid for applicants in two-year strata.
Consistent with the much lower cost of two-year programs, Figure A1 shows average first-year award
amounts of around $3,800. Here too, STBF awards increased grant aid substantially, in this case
by one extra dollar for each dollar awarded.15
III.A. Effects on Enrollment and Degrees
The reduced-form analysis discussed in this section ignores considerations of initial award take-
up. As 93 percent of applicants who receive an award accept it, this is innocuous. The more
structured analysis outlined in the next section uses randomized award offers to construct two-stage
least squares (2SLS) estimates of the effect of mediating post-secondary choices, such as the type
of college attended in the first year enrolled, on degree completion.
Reduced-form treatment effects on post-secondary outcomes, Yi, are regression estimates of
coefficient ρ in the equation
Yi = X ′iδ + ρAi + εi, (1)
where Ai indicates a scholarship was offered to applicant i. The covariate vector Xi includes
saturated controls for application year and target institution, the strata variables that determine
experimental award rates. Equation (1) is estimated using the 8,190 randomized applicants who
applied between 2012–2016.
Students applying to the STBF scholarship program are highly motivated to attend college. All
but 4 percent of control-group applicants in four-year strata enrolled in college in the fall semester
following their award application. Even so, as can be seen at the top of column 2 in Table II,
STBF awards boosted any-college enrollment rates among four-year applicants by a statistically
significant 2.3 percentage points. Moreover, while award offers had only modest effects on any-
college enrollment in the four-year strata, they appear to have increased enrollment in four-year
programs by 10 points (on a base of 83 percent). Much of this gain is attributable to a 6.7 point
decline in enrollment at two-year schools.
15Award effects on loans are small among applicants in two-year strata because two-year students borrow relativelylittle.
10

Like many state-funded financial aid schemes, the STBF program is meant to encourage in-
state public college enrollment. The estimates in Panel B of Table II show that STBF awards
increased Nebraska public college enrollment among four-year applicants by almost 7 points, a gain
driven by an even larger effect on NU enrollment. Paralleling the award-induced decline in any
two-year enrollment, awards induced a marked decline in Nebraska community college enrollment.
The estimates in Panel B also show a modest award-induced drop in out-of-state and private college
enrollment.16
Columns 3 and 4 in Table II report estimates of the impact of regular awards (with mandatory
LC participation) and COS awards (without mandated LCs) for applicants in the 2013-2016 cohorts
who targeted an NU campus. (Only students in these cohorts were eligible for COS awards.) These
estimates are computed by replacing Ai in equation (1) with dummies for each version of the NU
treatment. Because regular award recipients are exposed to LC participation only once enrolled,
it seems reasonable to expect the two award schemes to affect initial enrollment similarly. Initial
enrollment effects of COS and regular awards are indeed similar.
The initial enrollment gains generated by award offers made to applicants in four-year strata led
to a persistent increase in college enrollment. This is apparent in Figure II, which plots treatment
and control enrollment rates each semester after random assignment.17 The sample used to compute
each point omits applicants who had completed a college degree by the time the enrollment outcome
was recorded. Conditional on not having earned a degree, college enrollment in the treated group
is sharply higher than college enrollment in the control group 2-5 years after random assignment.
The figure therefore suggests that awards reduced college dropout rates
STBF award offers boosted college enrollment rates more for applicants in two-year strata than
for applicants in four-year strata. In particular, the estimate at the top of column 6 in Table
II shows a gain of 5.8 points in any-college enrollment for the two-year group (compared with a
control mean of 90 percent, reported in column 5). Four-year enrollment gains are much smaller,
however, for applicants in two-year strata: awards increase the probability that a two-year targeting
applicant enrolls in a four-year program by only 4 points. The estimates in Panel B also show awards
16Most STBF applicants who enrolled outside of Nebraska’s public colleges and universities attended private,religiously-affiliated schools in the Midwest such as Nebraska Wesleyan University, Creighton University and HastingsCollege.
17Figure A2 in the Online Appendix plots treatment and control enrollment rates for students in two-year strata.
11

generated a marked gain in Nebraska public college enrollment for applicants in two-year strata,
due mostly to a shift towards NU. Perhaps surprisingly, increased enrollment at NU appears to be
mostly a net gain in college enrollment rather than a move away from two-year schools. The working
paper (Angrist et al. 2016) presents additional estimates of award effects on college enrollment and
persistence.
1. Degree Completion. STBF awards boosted six-year BA completion rates by 8.1 percentage
points for applicants in four-year strata, a substantial gain relative to the control mean of 64 percent.
Estimated degree completion effects for the 2012-14 cohorts (those for which six-year follow-up is
now available) appear in column 2 of Table III. The overall completion effect is estimated reasonably
precisely, with a standard error of 0.016.
Columns 3 and 4 juxtapose estimates of the effect of COS and regular STBF awards on degree
completion, estimated for the cohort of 2013-14 applicants targeting NU (the subsample eligible
for the COS treatment, for which we see degrees.) In contrast with effects on initial enrollment
outcomes, here, we might expect program effects to differ. As it turns out, however, estimated
COS effects (in column 4) are close to the regular-award effects (in column 3), though the COS
estimates are somewhat less precise. Estimates of award by type are also close to the estimates for
all four-year strata in column 2.
The award-induced increase in BAs is due partly to a shift from two-year to four-year programs.
STBF awards reduced associate degree completion by 3 points for applicants in four-year strata,
with similar drops seen for the 2013/14-only NU sample and among COS award winners. Most of
the 8.1 point gain in BA completion, however, is due to a 5.2 point decline in the likelihood that
applicants earn no degree (Degree outcomes in Table III are not mutually exclusive).
As can be seen in column 6 of Table III, awards do not appear to have increased associate degree
completion among applicants in two-year strata. Estimates in this column show a modest positive
award impact on BAs in two-year strata, but this estimated gain is not significantly different from
zero. It seems especially noteworthy that awards made to applicants in two-year strata—comprising
applicants who indicated a desire to attend two-year programs—generated no discernible rise in two-
year degree completion.
12

Figure III plots award effects on BA completion rates in post-assignment years four through
six, estimated separately by target campus for applicants in four-year strata. STBF awards appear
to have increased time to completion for some. This delay is visible in a statistically significant
5-point decline in completion rates four years out for applicants targeting UNL (and a 4-point drop
for applicants targeting UNK). Five years after random assignment, however, completion effects
turn positive. Award offers boost completion rates most clearly for applicants targeting UNO, by 7
points five years out and 13 points six years out. Estimated effects for applicants targeting other NU
campuses are smaller, though (state colleges excepted) close to the pooled estimate of 8 percentage
points in year six. Estimated five- and six-year completion effects for applicants targeting state
colleges are positive, but less precise than the corresponding estimates for applicants targeting NU
and not significantly different from zero.
The large degree gains seen for UNO applicants play a leading role in our account of the mech-
anism by which awards increase completion. UNO serves a mostly low-income, disproportionately
nonwhite population, and UNO-targeting award winners are less likely to enroll in a four-year col-
lege in the absence of STBF support than are applicants targeting other campuses. Consistent with
the pooled estimates in Table III, a year-by-year analysis of treatment effects in four-year strata
shows similar degree gains for award winners with and without mandatory participation in LCs.
This is documented in Figure A3 in the Online Appendix, which plots yearly estimates of the two
types of award effects. The analysis below therefore pools the LC and non-LC treatment groups
when estimating effects in four-year strata.
III.B. Degree Effects by Subgroup
Panel A of Figure IV contrasts award effects in sample splits by demographic subgroup. We
see degree gains of nine points for treated nonwhite applicants, with a corresponding gain of seven
points for whites. Award effects are also larger for Pell-eligible applicants than for applicants with
family incomes above the Pell threshold. These conditional effects align with the pattern of larger
effects on UNO-targeters seen in the previous figure: nonwhite and Pell-eligible Nebraskans are
over-represented in Omaha, and therefore disproportionately likely to target UNO. Online Appendix
Figure A4, which reports degree effects in additional subgroup splits, shows larger award effects for
13
Omaha residents and for students without college-educated parents, but little difference in impact
by gender.
Degree gains are larger for applicant subgroups likely to be less prepared for college, a pattern
documented in Panel B of Figure IV. These plots show award-induced BA gains of 12 points among
applicants with GPA below the Nebraska median, but only a 4-point gain for above-median appli-
cants. This difference in impact is especially striking in light of the low control-group completion
rate (of 42%) among applicants with below-median GPAs. Estimates by ACT score, reported in
Online Appendix Figure A4, show a similar pattern. A final split in Figure IV shows estimates
conditional on whether applicants indicated they were likely to attend a two-year school in the
absence of STBF support. Applicants indicating a two-year fallback might be seen as ambivalent
about their readiness to commit to a four-year program. The estimated BA effect for those indicat-
ing a two-year fallback is almost twice as large as the estimate for applicants who considered only
four-year colleges.
Online Appendix Figure A5 shows that the subgroup differences in Figures III, IV, and A4
are driven by more than outsized effects on applicants targeting UNO. In a split between UNO
targeters and all remaining four-year applicants, effects are larger in the former group, but still
significantly different from zero in the latter. A final subgroup analysis appears in Online Appendix
Figure A6. This figure reports results for a sample split determined by above- and below-median
predicted BA completion, where completion is predicted using the covariates generating Figure IV
and Online Appendix Figure A4. Award-induced BA gains are estimated to be 12 points for those
with below-median predicted completion, but only 4 points for those with high predicted completion
rates.
IV. Explaining Award Effects
The variation in strata and subgroup effects seen in Figures III, IV, and Online Appendix
Figure A4 is explained here by a causal mediation story that hinges on the type of campus at which
applicants first enroll. Specifically, we argue that an award-induced shift towards early, strong
engagement with a four-year college is the primary channel by which STBF aid generates additional
14

bachelor’s degrees. Variation in the strength of award-induced shifts into four-year programs offers
a coherent account of the reduced form treatment-effect variation seen in the figures.
IV.A. College Targets and Destinies
Most award recipients in four-year strata started their college careers on a four-year campus. But
many applicants not selected for an award also embarked on a four-year program. How did awards
change the likelihood of four-year college enrollment? For applicants in four-year strata, effects
on initial four-year enrollment are strongest when awards facilitate enrollment at an applicant’s
target campus, and when the alternative to target-campus enrollment is not a four-year program.
We therefore quantify award-induced changes in initial college enrollment in two steps: first, by
estimating award effects on target campus enrollment; second, by computing four-year enrollment
rates among target-enrollment compliers when these applicants do not receive an award.
The effects of STBF awards on target campus enrollment largely mirror award effects on BA
completion, a pattern documented in Panel A of Figure V (where bar height shows effects on target
enrollment and dots mark effects on BA completion). We see, for example, that among four-year
applicants, target enrollment effects are especially high for applicants targeting UNO, for Omaha
residents, and for nonwhite applicants. On the other hand, target enrollment effects are similar
for men and women, while BA effects also differ little by sex. With one exception (the split by
Pell-eligibility), subgroup differences in target enrollment effects are consistent with the direction
of differences in group-specific BA effects.
Effects on target enrollment by measures of college readiness likewise parallel the differences
in degree gains seen across college-readiness subgroups. As noted above, Figure IV and Online
Appendix Figure A4 show especially large degree gains for applicants with below-median ACT scores
and below-median high school GPAs, as well as for students in four-year strata who considered a
two-year alternative. Differences in target campus enrollment effects across these splits are also
noteworthy, with larger effects in groups that appear less prepared for BA programs.
In the causal framework outlined by Angrist, Imbens and Rubin (1996), award effects on target
campus enrollment can be interpreted as a target-enrollment compliance rate. To make this idea
precise, let Tji denote potential target enrollment when Ai = j; j = 0, 1. Observed target enrollment,
15

Ti, is determined by potential target enrollment according to:
Ti = T0i + (T1i − T0i)Ai.
Target compliers are defined as applicants for whom T1i = 1 and T0i = 0, that is, they enroll at
their target campus when offered an award but not otherwise. Target compliers have T1i ≥ T0i and
award effects on Ti equal the probability of this event.
By definition, target-enrollment compliers in four-year strata enroll in a four-year program when
Ai = 1 (because applicants in four-year strata have a four-year target). We’re interested in the like-
lihood that target compliers enroll in four-year programs when assigned to the control group. This
is measured by computing the share of target compliers enrolled in four-year programs, the share
enrolled in two-year programs, and the share unenrolled–in the event they fail to receive an award.
As in Abdulkadiroglu et al. (2017), we refer to these shares as the distribution of counterfactual
destinies. Following Abdulkadiroglu, Angrist and Pathak (2014)), destinies are estimated by 2SLS.18
Panel B of Figure V plots estimated destiny distributions for target compliers in four-year
strata, separately by target campus and subgroup. An important finding here is the substantial
heterogeneity in the fraction of compliers who enroll in four-year programs without STBF aid. In
the breakdown by target campus, for example, compliers targeting UNO are least likely to find their
way to a four-year program absent an STBF award. This fact, in combination with a relatively high
target-campus compliance rate in the UNO group, contributes to out-sized award-induced degree
gains for applicants targeting UNO. Similarly, across demographic and college-readiness subgroups,
degree gains are most impressive for applicants whose counterfactual destinies are least likely to
include a four-year program.
18Briefly letWi = c for c ∈ {4, 2, 0} encode whether an STBF applicant is in a four-year program, two-year program,or unenrolled. In this case, the 3-point destiny distribution, ωc, is given by:
ωc =E[(1− Ti)1{Wi = c}|Ai = 1]− E[(1− Ti)1{Wi = c}|Ai = 0]
E[(1− Ti)|Ai = 1]− E[(1− Ti)|Ai = 0],
computed separately for each c. This formula, an IV estimand, is derived using the fact that Wi = (1− Ti)1{W0i =c} + Ti1{W1i = c}, where W0i and W1i denote potential enrollment indexed against Ti, and the fact that thedenominator is the negative of the target compliance rate. Abadie (2002) uses these facts to establish identification ofmarginal potential outcome distributions in an extension of the LATE Theorem (Imbens and Angrist 1994). A 2SLSversion of ωc allows for covariates.
16
IV.B. Measuring Mediation
The target compliance rates and college enrollment destinies exhibited in Figure V motivate a
parsimonious mediation hypothesis that specifies early engagement with four-year programs as a
key causal channel for STBF award effects. To make this hypothesis concrete, let f1i denote the
fraction of a full-time four-year course load an applicant completes in the school year immediately
following random assignment (STBF defines a full load as 12 credit units per semester and 24 credit
units per year). The mediation hypothesis is captured by a model in which awards boost f1i, which
in turn increases BA completion, Yi. This can be written:
Yi = β′1Xi + µ1f1i + ε1i (2)
f1i = π′10Xi + π11Ai +(π′12Xi
)Ai + η1i, (3)
where ε1i in equation (2) is the random part of potential degree completion in the absence of
treatment, and µ1 is the causal effect of interest. Equation (3) is the first stage for a 2SLS procedure
that uses Ai to instrument f1i. The first stage residual, denoted η1i in (3), is uncorrelated with Ai
and Xi by construction.
Equation (3) allows the first-stage effect of award offers on f1i to vary with covariates. It is
convenient to write these covariate-specific first stage coefficients as:
π(Xi) = π11 + π′12Xi.
Importantly, the causal relationship of interest, described by equation (2), omits interactions be-
tween f1i and Xi. The reduced form implied by (2) and (3) therefore satisfies
ρ(Xi) ≡ E[f1i|Xi, Ai = 1]− E[f1i|Xi, Ai = 0] = π(Xi)µ1, (4)
for each value ofXi. In other words, the assumptions behind (2) and (3) imply that all heterogeneity
in reduced-form award effects by strata and subgroup is explained by differences in the extent to
which offers change early four-year engagement. It bears emphasizing that (4) says more than that
first year course completion is correlated with college completion (as it surely is). The moments
underlying this restriction do not involve the covariance of f1i with degree completion. Equation
(4) restricts award effects only.
17

Figure VI offers a visual instrumental variables (VIV) representation of equation (4). This figure
plots covariate-specific reduced-form estimates for degree outcomes against the corresponding first-
stage estimates. The sample used to compute these estimates includes the 2012-14 cohorts in two-
year and four-year strata. The vector Xi includes dummies indicating four-year target campuses
(UNO, UNL, UNK, and state colleges), a dummy for those targeting two-year schools, and dummies
for the demographic and college-readiness subgroups seen in Figures IV and A4. Because the Xi
on many values, and reference groups for each interaction are arbitrary, the figure plots easily-
interpreted sample average values of estimated ρ(Xi) and π(Xi) for all groups of interest. For
example, one point in the figure has coordinates (E[π(Xi)|Fi = 1]), E[ρ(Xi)|Fi = 1]) where Fi
indicates female applicants and E[·|Fi = 1] denotes sample averages. Appendix B details the
calculations behind this figure further, and shows that the slope of the line through the points
plotted therein is an IV estimate of µ1 identified by instrumenting f1i in equation (2) using Ai and
the set of interactions between Xi and Ai as instruments. The figure also plots the point determined
by first stage and reduced form estimates for an IV model without interactions.19
The fitted line in Panel A of the figure, computed for award effects on BA completion, has a slope
of 0.61 when estimated with no intercept, a proportionality restriction implied by equation (4). The
relationship between first-year college success and degree completion that this estimate reflects is
partly mechanical. At the same time, while success in the first year of college is necessary for degree
completion, it’s not sufficient. Likewise, STBF awards need not boost degree completion only to
the extent that they improve first-year outcomes. The over-identification statistic associated with
2SLS provides a formal test of the hypothesis that all variation in ρ(Xi) is explained by variation in
π(Xi), leaving no room for other effects of Ai on degree completion. This test statistic is essentially
a scaled version of the R2 for the lines plotted in Figure VI (see, e.g., Section 2.2.2 of Angrist and
Pischke 2009). The addition of two-year strata reveals whether low degree impact for applicants
targeting two-year schools is explained by small award effects on f1i in these strata.
19The interaction terms underlying the figure are estimated jointly (the interaction of offer with low ACT, forexample, is estimated in a model with other interactions, including that for low GPA). The figure plots fitted valuesfrom a group-size weighted regression of group-specific average reduced forms on the corresponding group-specificaverage first stage, omitting the estimate without interactions since this point is implied by the group-specific estimates.The estimates plotted in Figure VI and reported in Table IV (discussed below) are from reduced-form and first-stageequations that include the full vector of Xi as controls.
18

Over-identification test results, along with the associated 2SLS estimates and first-stage F-
statistics, appear in columns 1-3 of Table IV for alternative specifications of Xi. Formal test results
accord with the impression that the VIV line fits well. The large p-values associated with the over-
identification test statistics suggest that—across all strata and subgroups—any deviation between
sample moments and the proportionality hypothesis expressed by equation (4) can be attributed to
sampling variance. The first-stage estimate for female applicants, for example, shows STBF offers
boost f1i by about 0.11. This in turn boosts BA completion by about .069, so the implied IV
estimate for this group is 0.62, close to the slope of the line in Panel A of the VIV figure. The
point for two-year strata also lands near the line, and (consistent with modest degree gains for this
group) appears in the southwest corner of the figure.20
Combining all strata- and subgroup-specific instruments leads to the over-identified 2SLS esti-
mate of 0.55 reported in the first column of Table IV (over-identified 2SLS estimates differ from
the corresponding VIV estimates due to differences in weighting and because the set of covariate
interactions in the instrument list is not saturated). The first-stage F-statistic for this heavily over-
identified model is only around 11. In view of the risk of finite-sample bias in this scenario, it’s
noteworthy that 2SLS estimates computed using smaller instrument sets are similar. In particular,
column 2 reports a 2SLS estimate of 0.58 when using subgroup interactions only, column 3 shows
an estimate of 0.59 using strata interactions only, and column 4 reports a just-identified IV estimate
computed using only an award dummy as an instrument. The first-stage relationship is notably
stronger in these models, while the estimated effect of f1i on degree completion changes little.
As a point of comparison, the OLS estimate generated by regressing a BA completion dummy
on f1i, controlling for Xi, appears in the last column of Table IV. At 0.57, this estimate is close
to the corresponding IV estimates. The similarity between OLS and 2SLS estimates of the effect
of f1i on degree completion suggests, perhaps surprisingly, that there’s little selection bias in the
OLS. Finally, other panels in Figure VI and Table IV repeat the analyses of Panel A with different
dependent variables. The VIV and 2SLS estimates in Panel B of these exhibits suggest f1i boosts
overall degree attainment by only around 0.37, a gain well below the estimated increase in BAs. As
can be seen in Panel C of Table IV, the gap between BA and overall degree gains is accounted for by
20Figure A7 in the online appendix shows that VIV proportionality restrictions fit equally well in the sample ofapplicants not targeting UNO.
19
the fact that early engagement with four-year colleges decreases associate degrees. The VIV slope for
f1i effects on associate degree completion is −0.26 (almost identical to the 2SLS estimates in Panel
C of Table IV). OLS estimates of the effect of f1i on any degree and associate degree completion
differ noticeably from the corresponding 2SLS estimates, with evidence of positive selection bias in
the first.
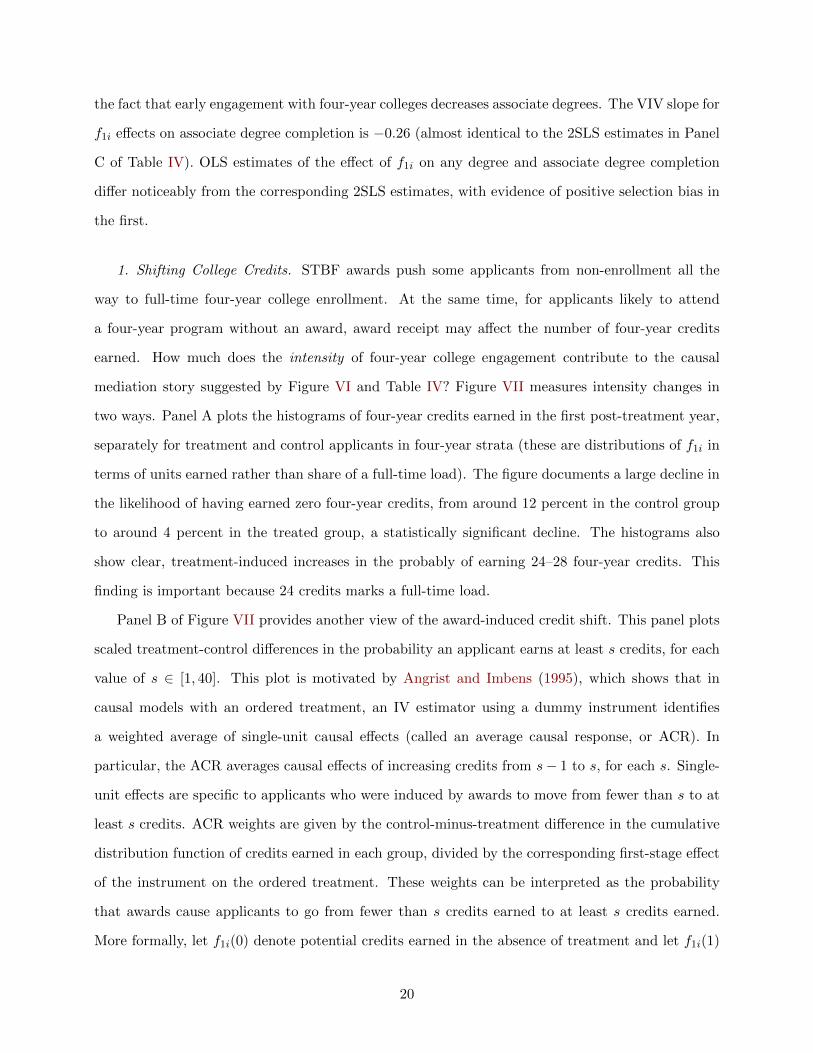
1. Shifting College Credits. STBF awards push some applicants from non-enrollment all the
way to full-time four-year college enrollment. At the same time, for applicants likely to attend
a four-year program without an award, award receipt may affect the number of four-year credits
earned. How much does the intensity of four-year college engagement contribute to the causal
mediation story suggested by Figure VI and Table IV? Figure VII measures intensity changes in
two ways. Panel A plots the histograms of four-year credits earned in the first post-treatment year,
separately for treatment and control applicants in four-year strata (these are distributions of f1i in
terms of units earned rather than share of a full-time load). The figure documents a large decline in
the likelihood of having earned zero four-year credits, from around 12 percent in the control group
to around 4 percent in the treated group, a statistically significant decline. The histograms also
show clear, treatment-induced increases in the probably of earning 24–28 four-year credits. This
finding is important because 24 credits marks a full-time load.
Panel B of Figure VII provides another view of the award-induced credit shift. This panel plots
scaled treatment-control differences in the probability an applicant earns at least s credits, for each
value of s ∈ [1, 40]. This plot is motivated by Angrist and Imbens (1995), which shows that in
causal models with an ordered treatment, an IV estimator using a dummy instrument identifies
a weighted average of single-unit causal effects (called an average causal response, or ACR). In
particular, the ACR averages causal effects of increasing credits from s− 1 to s, for each s. Single-
unit effects are specific to applicants who were induced by awards to move from fewer than s to at
least s credits. ACR weights are given by the control-minus-treatment difference in the cumulative
distribution function of credits earned in each group, divided by the corresponding first-stage effect
of the instrument on the ordered treatment. These weights can be interpreted as the probability
that awards cause applicants to go from fewer than s credits earned to at least s credits earned.
More formally, let f1i(0) denote potential credits earned in the absence of treatment and let f1i(1)
20

denote potential credits earned when treated. The ACR weighting function is proportional to
P [f1i(0) < s ≤ f1i(0)].
In a scenario where awards move some applicants from zero four-year credits earned to 24
or more credits earned, with no one affected otherwise, the ACR weighting function is flat for
s ∈ [1, 24]. To see this, note that if f0i = 0 and f1i ≥ t for all affected applicants, the probability
f1i(0) < s ≤ f1i(0) is the same for all 0 < s ≤ t. Panel B of Figure VII is largely consistent
with this, showing a reasonably flat weighting function from s = 1 through s = 24, with a modest
rise in the probability of completing 14-22 credits that’s also visible in the histograms in Panel A
(the vertical hash marks denote 34 -time and full-time enrollment; students must be enrolled at least
34 -time to qualify for STBF support). This pattern suggests that most applicants for whom awards
boost four-year engagement move from attempting no four-year credits to full-time study. Some,
however, move to more intensive but still part-time study. The fact that the weighting function
declines steeply for s > 24 suggests awards push few students beyond the threshold for full-time
enrollment.
2. Dynamic Exclusion. Early engagement with a four-year program appears to be an important
channel through which STBF awards increase BA completion. But this claim raises the question
of why we should focus on initial engagement and not, say, sophomore or junior-year measures
of four-year college credits earned. Is engagement in the first year of college the key step on the
path to BA completion? Defining fti as the fraction of a full credit load earned in year t, it seems
reasonable to imagine that awards boost fti for t > 1 as well as boosting f1i. These gains, in turn,
may also contribute to degree completion. We show here, however, that award-induced changes in
downstream fti, as well as the consequences of these changes for BA completion, can be explained
by award effects on f1i. Because this model attributes all causal effects of fti to effects on f1i, we
say that it embeds dynamic exclusion restrictions.
Dynamic exclusion is captured by a model of sequential credit completion. This model is:
fti = α′tXi + ψtf1i + ξti; t = 2, 3, 4, (5)
where ψt is the causal effect of f1i on fti and ξti is a residual assumed to be uncorrelated with Ai,
conditional on covariates, Xi. Equation (5) is complemented by a causal model for the effect of fti
21
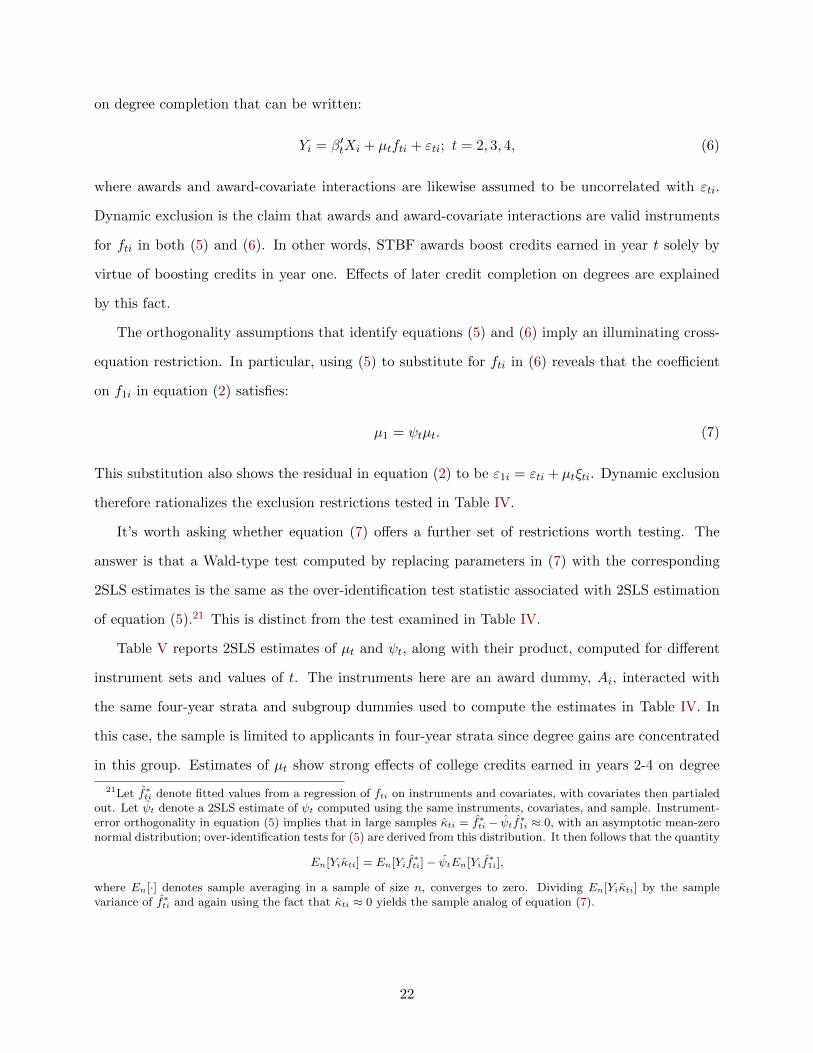
on degree completion that can be written:
Yi = β′tXi + µtfti + εti; t = 2, 3, 4, (6)
where awards and award-covariate interactions are likewise assumed to be uncorrelated with εti.
Dynamic exclusion is the claim that awards and award-covariate interactions are valid instruments
for fti in both (5) and (6). In other words, STBF awards boost credits earned in year t solely by
virtue of boosting credits in year one. Effects of later credit completion on degrees are explained
by this fact.
The orthogonality assumptions that identify equations (5) and (6) imply an illuminating cross-
equation restriction. In particular, using (5) to substitute for fti in (6) reveals that the coefficient
on f1i in equation (2) satisfies:
µ1 = ψtµt. (7)
This substitution also shows the residual in equation (2) to be ε1i = εti + µtξti. Dynamic exclusion
therefore rationalizes the exclusion restrictions tested in Table IV.
It’s worth asking whether equation (7) offers a further set of restrictions worth testing. The
answer is that a Wald-type test computed by replacing parameters in (7) with the corresponding
2SLS estimates is the same as the over-identification test statistic associated with 2SLS estimation
of equation (5).21 This is distinct from the test examined in Table IV.
Table V reports 2SLS estimates of µt and ψt, along with their product, computed for different
instrument sets and values of t. The instruments here are an award dummy, Ai, interacted with
the same four-year strata and subgroup dummies used to compute the estimates in Table IV. In
this case, the sample is limited to applicants in four-year strata since degree gains are concentrated
in this group. Estimates of µt show strong effects of college credits earned in years 2-4 on degree
21Let f∗ti denote fitted values from a regression of fti on instruments and covariates, with covariates then partialed
out. Let ψt denote a 2SLS estimate of ψt computed using the same instruments, covariates, and sample. Instrument-error orthogonality in equation (5) implies that in large samples κti = f∗
ti − ψtf∗1i ≈ 0, with an asymptotic mean-zero
normal distribution; over-identification tests for (5) are derived from this distribution. It then follows that the quantity
En[Yiκti] = En[Yif∗ti]− ψtEn[Yif
∗1i],
where En[·] denotes sample averaging in a sample of size n, converges to zero. Dividing En[Yiκti] by the samplevariance of f∗
ti and again using the fact that κti ≈ 0 yields the sample analog of equation (7).
22

completion, while the estimated ψt indicate increases in f1i yield large gains in four-year credits
earned down the road. The latter effects range from 0.85− 1.08.
The product of the estimated µt and ψt suggest these parameters indeed reflect the impact of
credits earned in the first year of college on later academic progress. In particular, the estimated
µtψt are remarkably close to the corresponding estimates of µ1 shown at the top of Table IV (all
around 0.58). Moreover, the over-identification test statistics associated with 2SLS estimates of
equation (5) are consistent with the claim that STBF awards affect four-year credits earned in later
years solely by increasing f1i. This finding notwithstanding, it may be the guarantee of financial
support for five years that induces otherwise hesitant prospective four-year students to fully dive in.
Additional work is needed to determine whether front-loading aid is a cost-effective way to enhance
aid effectiveness.
V. Cost-Benefit Perspectives
The causal effects of STBF scholarship awards on adult employment, earnings, and financial
security will not be known for at least a decade. To gauge the potential cost-effectiveness of schol-
arships, this section provides a prospective cost-benefit analysis that compares predicted award-
induced increases in lifetime earnings with measures of program cost overall and by demographic
subgroup.
V.A. Estimating Costs
Funder spending on awards is easily measured. While a funder’s award costs may affect pro-
gram viability, the economic cost of an award is a distinct concept: economic costs correspond to
program-induced spending net of transfers. Scholarships may increase overall educational spending
by increasing time spent in school and by moving students into more expensive programs. We
therefore use the experimental framework to measure the incremental spending induced by awards,
while also reporting per capita funder spending.
To determine the impact of award offers on funder spending, we put aid disbursements, Di, on
the left hand side of the reduced-form model for treatment effects (equation 1). No aid is disbursed
23

to control group applicants, so the effect of STBF offers on Di captures average funder spending on
treated applicants adjusted for strata differences.
To quantify the extent of marginal educational spending—that is, spending induced by awards—
we replace the funder cost variable, Di, on the left-hand side of equation (1) with a measure of the
cost of college attendance. We use this award induced cost of attendance later in our cost-benefit
analysis in Section C. This variable, denoted COAi, is proxied by the federally-determined cost of
attendance as reported in the Institutional Characteristics File of the publicly-available Integrated
Postsecondary Education Data System (IPEDS, U.S. Department of Education 2019). The imputed
COAi variable used here covers tuition, fees, and an allowance for books and supplies. We compute
COAi for all ever-enrolled applicants, including those who attend private schools or non-Nebraska
public schools.22
The statistics for Di and COAi reported in Panel A of Table VI highlight the difference between
STBF disbursements and marginal educational spending. Average COAi is roughly $30, 940 among
treated applicants in the four-year strata, close to average program disbursements in this group
($32, 250). On the other hand, while mean Di is zero for controls, average control COAi is around
$28, 550, only modestly below average cost in the treated group.
Panel B of Table VI allocates award effects on COAi to a component that reflects increased time
in school and a component that reflects a shift towards more expensive programs. We refer to the
latter as “cost-upgrading.” To gauge the relative importance of these components, let COA1i denote
college costs incurred when applicant i is treated and let COA0i denote costs incurred otherwise.
Because {COAji; j = 0, 1} is the product of years enrolled (denoted Sji) and cost per year (denoted
Fji), we can write:
log(COA1i)− log(COA0i) = log(S1iF1i)− log(S0iF0i)
= log(S1i)− log(S0i)︸ ︷︷ ︸extra years
+ log(F1i)− log(F0i)︸ ︷︷ ︸extra cost per year
.
The first term on the second line of this expression captures incremental costs generated by more
time in school, while the second captures cost upgrading, both measured in proportional terms. The
22This calculation omits housing and transportation costs and uses the smaller of credit-based costs or full-timetuition. Cost data are missing for one applicant. Costs of books and supplies for eight percent of applicants areimputed using averages for two- and four-year schools. We discount funder cost and cost of attendance back to Year1 at a 3% rate.
24
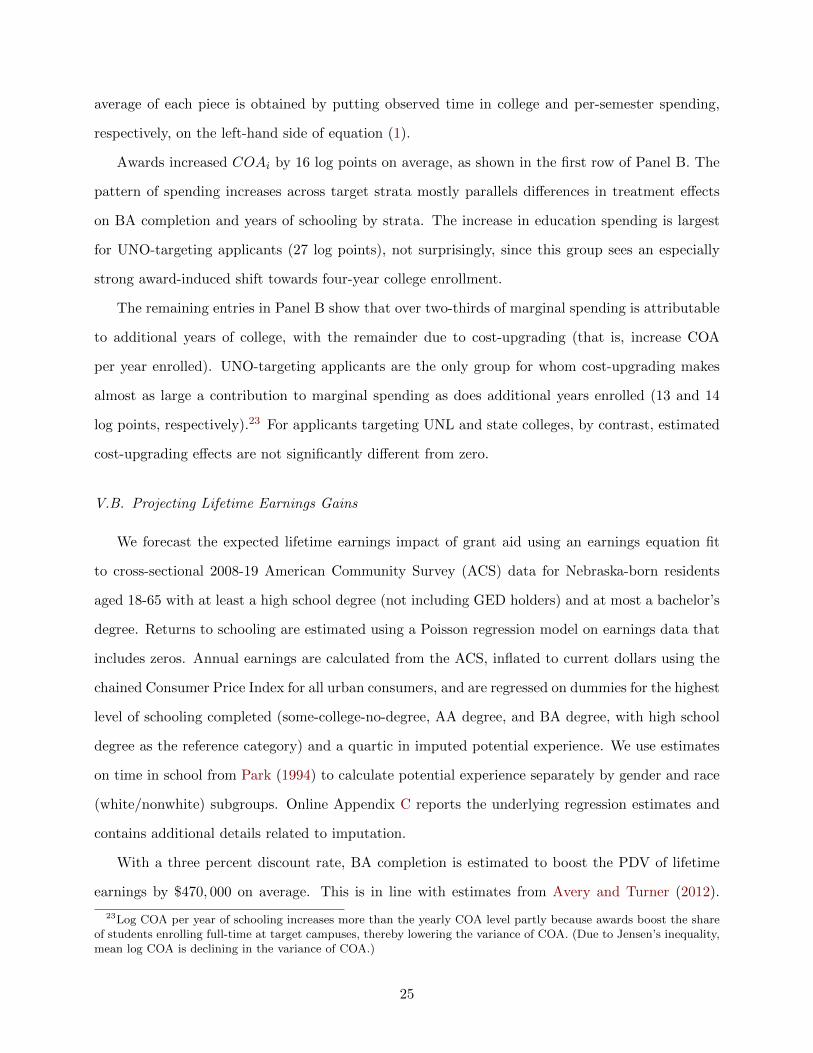
average of each piece is obtained by putting observed time in college and per-semester spending,
respectively, on the left-hand side of equation (1).
Awards increased COAi by 16 log points on average, as shown in the first row of Panel B. The
pattern of spending increases across target strata mostly parallels differences in treatment effects
on BA completion and years of schooling by strata. The increase in education spending is largest
for UNO-targeting applicants (27 log points), not surprisingly, since this group sees an especially
strong award-induced shift towards four-year college enrollment.
The remaining entries in Panel B show that over two-thirds of marginal spending is attributable
to additional years of college, with the remainder due to cost-upgrading (that is, increase COA
per year enrolled). UNO-targeting applicants are the only group for whom cost-upgrading makes
almost as large a contribution to marginal spending as does additional years enrolled (13 and 14
log points, respectively).23 For applicants targeting UNL and state colleges, by contrast, estimated
cost-upgrading effects are not significantly different from zero.
V.B. Projecting Lifetime Earnings Gains
We forecast the expected lifetime earnings impact of grant aid using an earnings equation fit
to cross-sectional 2008-19 American Community Survey (ACS) data for Nebraska-born residents
aged 18-65 with at least a high school degree (not including GED holders) and at most a bachelor’s
degree. Returns to schooling are estimated using a Poisson regression model on earnings data that
includes zeros. Annual earnings are calculated from the ACS, inflated to current dollars using the
chained Consumer Price Index for all urban consumers, and are regressed on dummies for the highest
level of schooling completed (some-college-no-degree, AA degree, and BA degree, with high school
degree as the reference category) and a quartic in imputed potential experience. We use estimates
on time in school from Park (1994) to calculate potential experience separately by gender and race
(white/nonwhite) subgroups. Online Appendix C reports the underlying regression estimates and
contains additional details related to imputation.
With a three percent discount rate, BA completion is estimated to boost the PDV of lifetime
earnings by $470, 000 on average. This is in line with estimates from Avery and Turner (2012).
23Log COA per year of schooling increases more than the yearly COA level partly because awards boost the shareof students enrolling full-time at target campuses, thereby lowering the variance of COA. (Due to Jensen’s inequality,mean log COA is declining in the variance of COA.)
25

Also consistent with Avery and Turner (2012), the estimated return to BA attainment is larger for
men than women. Estimated earnings gains differ little by race (white/nonwhite).
These regression results are combined with the scholarship’s treatment effects to determine
the expected lifetime earnings impact of grant aid. To calculate control group earnings, we use
means of degree attainment and imputed time in school from our ACS sample as point estimates
in our estimated earnings function. Expected earnings are calculated separately for gender-by-race
subgroups and then averaged using as weights the subgroups’ prevalence in the control group. By
adding treatment effects on degree attainment and time in school calculated by equation (1) to
the ACS means, we create expected treatment group earnings. Overall, the STBF scholarship
is estimated to increase discounted lifetime earnings by $21, 150 for each treated applicant. These
estimates ignore award-induced changes in post-graduate schooling.24 This gain exceeds the award’s
average impact on educational spending ($2, 390), but falls below the funder’s average cost per
awardee of $32, 250.
V.C. Picturing Costs and Benefits
Figure VIII puts the cost-benefit pieces together for each of the subgroups considered in Section
IV. The cost-benefit comparisons in the figure take the form of intervals, with the top marker
indicating funder costs and the bottom indicating marginal educational spending, that is, effects on
COA. Predicted lifetime earnings gains are estimated using a similar parametric approach to the
award effects in Panel C of Online Appendix Table C2. As in Avery and Turner (2012), these are
computed using a discount rate of three percent.
For all groups, predicted earnings gains fall between funder costs and marginal COA, a finding
that suggests STBF awards generate a positive social return on average and for all demographic
subgroups. These estimates also imply that funder costs exceed award-induced earnings gains for
most subgroups. However, estimated earnings gains exceed both marginal COA and funder costs
for the subset of applicants with below median grades, those who chose a community college as an
alternative target, those with below median ACT scores, those who indicated UNO as a target, and
Omaha residents.
24A more detailed description of this procedure can be found in Online Appendix C.
26

As a benchmark, we compare the cost-effectiveness of STBF aid with that of similar public
sector scholarship programs in a hypothetical scenario where the STBF program were publicly
funded. Following Hendren and Sprung-Keyser (2020), this comparison uses the marginal value of
public funds (MVPF), defined as the ratio of program benefits among policy beneficiaries to net costs
to the government. For STBF beneficiaries, program benefits include a transfer of $32, 250 (equal to
the transfer made from the funder to the student, seen in Table VI) plus the award-induced increase
in the PDV of lifetime earnings. The latter quantity is taken to be $21, 150 (Online Appendix Table
C2 Panel C). Assuming that incremental earnings are taxed at 20% reduces the government’s cost
of operating the program by $4, 230, while reducing the private benefit by the same amount.
The ratio of private benefits ($32, 250+$21, 150−$4, 230 = $49, 170) to public costs ($32, 250−
$4, 230 = $28, 020) in this scenario yields an MVPF of 1.75, which implies that one dollar of public
spending on the STBF program generates $1.75 of private benefits. An MVPF of 1.75 puts the
STBF program near the median of estimated MVPFs of other cost-effective grant aid programs
examined in Hendren and Sprung-Keyser (2020). STBF ranks especially highly among programs
targeting college-bound high school students. Relevant comparisons include the Massachusetts
Adams scholarship, with an MVPF of 0.72, and the Wisconsin Scholars Grant program, with an
MVPF of 1.43.25
Based as they are on a predictive model of lifetime earnings, these cost-benefit comparisons are
provisional. But they seem likely to be conservative for a number of reasons. First, they omit non-
pecuniary benefits of schooling related to health, social intelligence, and marriage (documented in
Oreopoulos and Salvanes 2011). Our estimated earnings gains also ignore any scholarship-induced
increases in post-BA schooling and possible economic returns to reductions in college debt. Finally,
the overall returns to schooling estimated here may also fall below the economic returns to education
for students whose school decisions are sensitive to financial constraints (a possibility suggested by,
e.g., Card 2001 and Zimmerman 2014).
25With a 5% discount rate, the estimated MVPF for STBF aid falls to 1.42. Other comparably structured grantaid programs covered by Hendren and Sprung-Keyser (2020) include Kalamazoo Promise and Tennessee HOPE.
27

VI. Summary and Conclusions
Randomized evaluation of the comprehensive STBF aid program yields results that are both
encouraging and cautionary. On one hand, scholarship awards increase four-year degree attainment
substantially. On the other, the bulk of award spending is a transfer flowing to applicants whose
schooling behavior is unchanged by awards. Aid boosts degree completion most sharply for appli-
cants who aspire to a BA but are unlikely to embark on a four-year program in the absence of aid.
Those who benefit most include groups of applicants with below-median grades and test scores,
those seeking to enroll at the urban campus of the University of Nebraska at Omaha, and those
considering two-year colleges.
We explain the pattern of degree effects with a parsimonious model that makes the main mediator
of award impact a credit-based measure of initial engagement with four-year college. Estimates of
this model support the notion that awards induce degree completion primarily by prompting and
deepening early engagement with four-year college programs. This finding suggests there may
be a large payoff to other, perhaps less costly, interventions that act to enhance early engagement.
Examples of inexpensive service-oriented early engagement interventions include pre-college advising
and mentoring (as in Bettinger and Evans 2019 and Carrell and Sacerdote 2017) and efforts to boost
SAT and ACT-taking (as in Bulman 2015 and Goodman, Gurantz and Smith 2020).
To put the early engagement hypothesis in context, it’s worth noting that almost all STBF
applicants start college somewhere regardless of whether they are awarded a scholarship. Yet, many
are no longer enrolled two and three years out (as shown in Angrist et al. 2016). This leaves
scope for STBF awards to boost four-year degree attainment by increasing persistence in college
for those likely to start a four-year program even without STBF aid. The results reported here,
however, weigh against the importance of persistence effects beyond those engendered by early
credit completion.
Similarly, because STBF awards provide incentives for students to remain in good academic
standing, we might expect award incentives to have incremental effects in each academic year,
even for applicants destined to start a four-year program anyway. Our findings weigh against the
importance of incentives to remain in good academic standing as well. Once aid recipients have
responded to awards in year one by choosing to start and stick with a four-year school, academic
28
performance incentives and other downstream forces appear to matter little. This conclusion should
be qualified, however, with the observation that results for a motivated, college-bound population
of STBF applicants need not predict aid effects in other populations and circumstances.
A cost-benefit analysis highlights the fact that most STBF aid spending is a transfer, flowing
to applicants likely to earn degrees even without an award. The flip side of high transfer cost,
however, is the fact that the marginal educational spending induced by STBF awards is low. For
each subgroup considered here, the projected net earnings gains from scholarship-induced schooling
outweigh the corresponding marginal educational cost. Moreover, although most award money is in-
framarginal, the projected earnings gains for high-benefit groups (with especially low counterfactual
enrollment in a four-year program) also exceeds the corresponding funder cost.
The findings reported here strongly suggest that increased targeting of financial aid awards is
likely to enhance aid impact, thereby boosting program MVPF. Given that STBF award impact
can be explained by the effect of scholarships on full-time four-year enrollment in year one, a fruit-
ful question for subsequent research is whether front-loading financial aid might increase program
effectiveness while reducing aid costs. Our results suggest that programs that encourage many stu-
dents who would not do so otherwise to enroll at a four-year college are especially likely to increase
BA attainment. That said, the promise of continuous aid may be necessary to induce four-year
engagement. This suggests the question of the optimal timing of aid flows should be high priority
for future work. Finally, Scott-Clayton and Zafar’s (2019) evidence on longer-run fade-out of degree
effects highlights the importance of continued follow-up and an investigation of effects on non-degree
outcomes such as student debt and earnings.
Massachusetts Institute of Technology and National Bureau of Economic Research,
United States
Massachusetts Institute of Technology and National Bureau of Economic Research,
United States
Harvard University and National Bureau of Economic Research, United States
29
A. Data Appendix
A.A. Application Data
The STBF scholarship application collects detailed information on applicants’ baseline charac-
teristics. Academic measures such as GPA are gathered primarily from high school transcripts. We
standardize GPAs to a 4.0 scale using the grade conversion formula provided by the University of
Nebraska-Lincoln. We also consider students’ ACT score. Since not all high schools report stu-
dents’ ACT scores on transcripts, transcript data are supplemented with self-reported scores from
the application survey for 54 percent of the experimental sample.26
Most of the financial and demographic data used here come from applicants’ Student Aid Re-
ports (SARs). These reports are available for all STBF applicants who filed the Free Application
for Federal Student Aid (FAFSA). SARs contain responses to more than 100 FAFSA questions re-
garding students’ financial resources and family structure, including family income, parents’ marital
status, and parents’ education. Roughly three percent of scholarship applicants are undocumented
immigrants, who are ineligible for federal financial aid and therefore cannot file the FAFSA. STBF
permits these students to submit an alternate form called the College Funding Estimator (CFE).
The CFE is published by the EducationQuest Foundation, a non-profit organization in Nebraska,
and gathers a similar, though less detailed, set of information.
Neither SARs nor CFEs report students’ race, and the scholarship application did not collect
this variable until the 2014 cohort. Supplemental data on race were obtained from the Nebraska
Department of Motor Vehicles. Over 85 percent of the randomization sample was successfully
matched to driver’s license records.
A.B. Financial Aid Data
Nebraska’s public colleges and universities provided detailed information on their students’ fi-
nancial aid packages. These data report costs of attendance, grants, loans, and Federal Work Study
aid. While all schools report federal loans, most do not report private loans, which may be obtained
directly from lenders without involving financial aid officers. We therefore exclude private loans
26In Nebraska, the majority of students take the ACT rather than the SAT. In 2012-2013, 70 percent of Nebraskahigh school students took the ACT, compared with the national average of 52 percent.
30

from our analysis. For most STBF applicants, however, federal loans offer the lowest available in-
terest rate and therefore account for the vast majority of borrowing. Figure I reports various kinds
of aid distributed in the first academic year following the scholarship application year.
1. Cost of Attendance. Publicly available IPEDS institutional characteristics data were used
to estimate a sticker price of college for every student in the experimental sample. The sticker
price calculation includes in-state tuition, fees, and a books and supplies stipend. The institutional
characteristics dataset in each year from IPEDS has nearly full coverage of tuition and fees for
schools attended by students in the experimental sample. There is only one school for which we do
not have tuition and fees—this is a special case in which the student transferred to an out-of-state
certificate school. This school’s cost of attendance varies greatly based on certificate program, so
we drop the student from the sample.
The IPEDS data are missing a books and supplies cost value for 8 percent of the sample. In these
cases we impute costs using the mean books and supplies costs for students in the same calendar
year and college type (four-year vs two-year and for-profit vs not for profit).
We calculate each student’s sticker price by matching credits attempted per term to the cost per
credit at the school attended in every year of attendance. Importantly, we use credits attempted,
as opposed to credits earned because a student is charged for every credit attempted, whether or
not they pass the course. As above, IPEDS has nearly full coverage of cost per credit for schools
attended by the experimental sample. Every school that reports tuition also reports cost per credit.
We also calculate the total cost based on credits attempted for each student at each school. When
this credit-based cost exceeds the school’s reported tuition, the cost variable is assigned the full-
time tuition value. Each student’s sticker price is then estimated by summing credits-based cost
per term, a books and supplies stipend, and the school-reported fees in each academic year.
A.C. Education Outcome Variables
Over 90 percent of experimental subjects enrolled in Nebraska’s public colleges and universities.
We match STBF applicants to administrative data provided by these schools using names, dates of
birth, and the last four digits of Social Security Numbers (SSNs). To measure enrollment at out-of-
state and private institutions, we match applicants to National Student Clearinghouse (NSC) data
31

using names and dates of birth. Though the NSC captures more than 91 percent of enrollment
nationwide (and more than 99 percent at four-year public institutions), its name-based match has
limitations, as Dynarski, Hemelt and Hyman (2015) detail. Roughly four percent of experimental
applicants have enrollment at Nebraska’s public colleges and universities that does not appear in
the NSC-matched sample. These students are disproportionately nonwhite.
1. Enrollment Measures. The enrollment outcomes used for this paper are dummy variables
indicating type of institution enrolled. Table II, for example, reports effects on the probability of
enrollment in year one for two- and four-year schools and schools in various sectors. We define
follow-up windows to match the start and end dates of each academic year based on individually
published academic calendars at each school. So year one covers the period from the beginning of
the fall term to the end of the last summer term of an applicant’s school in the year following the
application (and randomization) year. When data is unavailable from the Nebraska public colleges,
we use similar timing conventions from the NSC. Within each window, we force binary enrollment
outcomes to be mutually exclusive. Students who enroll at both two- and four-year institutions are
coded as having “any four-year” enrollment. Likewise, those who enroll at in-state public colleges
do not contribute to the out-of-state or private categories.
We also track cumulative credit completion. Most credit data come from Nebraska’s public
colleges and universities. Credits for the seven percent of applicants who attend out-of-state or
private colleges are imputed using the NSC’s coarse enrollment status variable: an indicator for
whether students were enrolled full-time, half-time, or less than half-time. Imputed credit is the
predicted value from a regression of credits on enrollment status, degree program, academic term,
and cohort. Less than two percent of applicants attend out-of-state or private schools that do not
report the full-time enrollment indicator to the NSC. These students are coded as enrolled full time
when the full-time enrollment share at their chosen school is at least 85 percent, as reported by
IPEDS.
Annual enrollment is coded as follows. A student is coded as enrolled in year one (from the
point of our research timeline) if they completed credits at some point during their first year, either
in the fall, spring, or summer term. To be coded as enrolled in year 2+, a student must be coded
as enrolled in fall, spring, or summer of the academic year beginning 2+ years after their STBF
32

application year. If a student is enrolled in year 2+, there is no requirement to be enrolled in year
1. Figures that plot term-wise enrollment show enrollment in either a fall or spring term, where the
fall term includes both fall and winter terms and the spring term includes both spring and summer
terms.
2. Years of Schooling Data. Years of schooling variables are term counts derived from term-wise
enrollment status as reported by Nebraska’s public colleges and universities, or in the NSC when
the former are not available. These indicate “attempted enrollment” at an institution (as opposed
to measuring credits completed). Using data from the NSC-matched sample, students are coded
as enrolled in a given term if the NSC records them as enrolled at any level in any institution in a
particular term.
3. Degrees Data. Degree completion indicators come from Nebraska’s public colleges and uni-
versities, or the NSC when the former are not available. NSC and the colleges report completion
of associate degrees and bachelor’s degrees for each student, as well as the year and term in which
degree requirements were met. Figures show degree completion by year and term, while tables
report treatment effects on year 6 completion. Degree completion dates are likewise coded from
term-wise information on completion. A student is coded as having completed a degree in year 6 if
they earned a degree in either the fall, spring, or summer term of that academic year.
B. Methods: Construction of VIV Figure VI
Points plotted in Figure VI are the average reduced form and first stage coefficients associated
with equations (2) and (3). The setup here allows each element of Xi to interact with Ai in the
instrument list, but higher-order terms (such as an interaction between strata, GPA, and Ai) are
omitted. Because the reference groups for dummy variables need not be of intrinsic interest, the
figure plots sample average values of ρ(Xi) and π(Xi), conditioning on membership in the groups
for which degree effects are plotted in Figures III, IV, and Online Appendix Figure A4. Interaction
terms appear together in the instrument list, but the averages in the figure are plotted one covariate
at a time.
33

A simplified example illuminates the nature of these average effects. Suppose there are three
strata, coded Si ∈ {1, 2, 3} and a single Bernoulli covariate, Fi. The corresponding covariate vector
is Xi = [S1i S2i Fi]′ where Sji = 1[Si = j]. So the reference group for Si is 3.
The reduced form in this case can be written:
Yi = X ′iδ + ρ0Ai + θ1S1iAi + θ2S2iAi + ϕFiAi + εi (8)
= X ′iδ +Ai[ρ0 + θ1S1i + θ2S2i + ϕFi] + εi
= X ′iδ +Aiρ(Xi) + εi.
This model implies
E[ρ(Xi)|Si = 1] = ρ0 + θ1 + ϕE[Fi|Si = 1] (9)
E[ρ(Xi)|Si = 2] = ρ0 + θ2 + ϕE[Fi|Si = 2]
E[ρ(Xi)|Si = 3] = ρ0 + ϕE[Fi|Si = 3]
and
E[ρ(Xi)|Fi = 1] = ρ0 + θ1E[S1i|Fi = 1] + θ2E[S2i|Fi = 1] + ϕ (10)
E[ρ(Xi)|Fi = 0] = ρ0 + θ1E[S1i|Fi = 0] + θ2E[S2i|Fi = 0]
Note that reference groups for each categorical conditioning variable have different effects. Specifi-
cally,
E[ρ(Xi)|Si = 3] = E[ρ(Xi)|Fi = 0] (11)
Neither of these equal the award main effect, ρ0.
In this example, 2SLS estimates are identified by exclusion of the four-instrument set Zi =
{Ai S1iAi S2iAi FiAi} from equation (2). It remains to show that that average reduced form
associated with this procedure is proportional to the corresponding average first stage. Substituting
(3) in (2) to obtain the reduced form, it’s easy to show the marginal sample mean reduced form
and first stage satisfy:
E[ρ(Xi)|Si] = E[π(Xi)|Si]µ1, (12)
34

A corresponding Figure VI for this example has five points, three for the values of Si and two for
the values of Fi.
References
Abadie, Alberto. 2002. “Bootstrap Tests for Distributional Treatment Effects in Instrumental
Variable Models.” Journal of the American Statistical Association, 97(457): 284–292.
Abdulkadiroglu, Atila, Joshua Angrist, and Parag A. Pathak. 2014. “The Elite Illusion:
Achievement Effects at Boston and New York Exam Schools.” Econometrica, 82(1): 137–196.
Abdulkadiroglu, Atila, Joshua D. Angrist, Yusuke Narita, and Parag A. Pathak. 2017.
“Research Design Meets Market Design: Using Centralized Assignment for Impact Evaluation.”
Econometrica, 85(5): 1373–1432.
ACT. 2012. “ACT National Profile Reports 2012-2016.” ACT, Iowa City, IA.
Anderson, Drew M., Katharine M. Broton, Sara Goldrick-Rab, and Robert Kelchen.
2019. “Experimental Evidence on the Impacts of Need-Based Financial Aid: Longitudinal Assess-
ment of the Wisconsin Scholars Grant.” Journal of Policy Analysis and Management, 39(3): 720–
739.
Andrews, Rodney J., Scott A. Imberman, and Michael F. Lovenheim. 2020. “Recruit-
ing and supporting low-income, high-achieving students at flagship universities.” Economics of
Education Review, 74.
Angrist, Josh, David Autor, Sally Hudson, and Amanda Pallais. 2016. “Evaluating Post-
Secondary Aid: Enrollment, Persistence, and Projected Completion.” NBER Working Paper
Series No. 23015.
Angrist, Joshua D., and Guido W. Imbens. 1995. “Two-Stage Least Squares Estimation of
Average Causal Effects in Models with Variable Treatment Intensity.” Journal of the American
Statistical Association, 90(430): 431.
Angrist, Joshua D., and Jorn-Steffen Pischke. 2009. Mostly Harmless Econometrics: An
Empiricist’s Companion. Princeton: Princeton University Press.
35
Angrist, Joshua D., Daniel Lang, and Philip Oreopoulos. 2009. “Incentives and Services for
College Achievement: Evidence from a Randomized Trial.” American Economic Journal: Applied
Economics, 1(1): 136–163.
Angrist, Joshua D., Guido W. Imbens, and Donald B. Rubin. 1996. “Identification of
Causal Effects Using Instrumental Variables.” Journal of the American Statistical Association,
91(434): 444–455.
Angrist, Joshua D., Philip Oreopoulos, and Tyler Williams. 2014. “When Opportunity
Knocks, Who Answers? New Evidence on College Achievement Awards.” Journal of Human
Resources, 49(3): 572–610.
Appleton, James J., Sandra L. Christenson, and Michael J. Furlong. 2008. “Student
Engagement with School: Critical Conceptual and Methodological Issues of the Construct.” Psy-
chology in the Schools, 45(5): 369–386.
Avery, Christopher, and Sarah Turner. 2012. “Student loans: Do college students borrow too
much-or not enough?” Journal of Economic Perspectives, 26(1): 167–192.
Barr, Andrew. 2019. “Fighting for Education: Veterans and Financial Aid.” Journal of Labor
Economics, 37(2): 509–544.
Bettinger, Eric, Oded Gurantz, Laura Kawano, Bruce Sacerdote, and Michael Stevens.
2019. “The Long-Run Impacts of Financial Aid: Evidence from California’s Cal Grant.” American
Economic Journal: Economic Policy, 11(1): 64–94.
Bettinger, Eric P., and Brent J. Evans. 2019. “College Guidance for All: A Randomized
Experiment in Pre-College Advising.” Journal of Policy Analysis and Management, 38(1).
Bettinger, Eric P., and Rachel Baker. 2014. “The Effects of Student Coaching in College:
An Evaluation of a Randomized Experiment in Student Mentoring.” Educational Evaluation and
Policy Analysis, 36(1): 3–19.
Bloom, Dan, and Colleen Sommo. 2015. “Building Learning Communities: Early Results from
the Opening Doors Demonstration at Kingsborough Community College.” Educational Evaluation
and Policy Analysis, 37(4): 520–541.
36

Bulman, George. 2015. “The Effect of Access to College Assessments on Enrollment and Attain-
ment.” Journal of Applied Econometrics, 7(4): 1–36.
Bulman, George, Robert W. Fairlie, Sarena Goodman, and Adam Isen. 2021. “Parental
Resources and College Attendance: Evidence from Lottery Wins.” American Economic Review,
111(4): 1201–1240.
Card, David. 2001. “Estimating the Return to Schooling: Progress on Some Persistent Econo-
metric Problems.” Econometrica, 69(5): 1127–1160.
Carrell, Scott, and Bruce Sacerdote. 2017. “Why Do College-Going Interventions Work.”
American Economic Journal: Applied Economics, 9(3): 124–151.
Carruthers, Celeste K., and Umut Ozek. 2016. “Losing HOPE: Financial Aid and the Line
Between College and Work.” Economics of Education Review, 53: 1–15.
Castleman, Benjamin L., and Bridget Terry Long. 2016. “Looking Beyond Enrollment: The
Causal Effect of Need-Based Grants on College Access, Persistence, and Graduation.” Journal of
Labor Economics, 34(4): 1023 – 1073.
Cohodes, Sarah R, and Joshua S Goodman. 2014. “Merit Aid, College Quality, and College
Completion: Massachusetts’ Adams Scholarship as an In-Kind Subsidy.” American Economic
Journal: Applied Economics, 6(4): 251–285.
Cole, Darnell, KC Culver, Joseph Kitchen, Gwendelyn Rivera, and Elise Swanson. 2020.
“How and Why a Comprehensive College Transition Program Works: Promoting At-Promise
Students’ Success in the Thompson Scholars Learning Communities.” Pullias Center for Higher
Education Report October.
Coordinating Commission for Postsecondary Education. 2013. “Nebraska Higher Education
Progress Report.” Coordinating Commission for Postsecondary Education.
Deming, David J, and Christopher R Walters. 2017. “The Impact of Price Caps and Spending
Cuts on U.S. Postsecondary Attainment.” NBER Working Paper Series No. 23736.
37
Deming, David J., and Susan M. Dynarski. 2010. “Into College, Out of Poverty? Policies
to Increase the Postsecondary Attainment of the Poor.” In Targeting Investments in Children:
Fighting Poverty When Resources are Limited. eds. Phillip B. Levine, and David J. Zimmerman,
Chapter 10, 283–302. Chicago: University of Chicago Press.
Denning, Jeffrey T., Benjamin M. Marx, and Lesley J. Turner. 2019. “ProPelled: The
Effects of Grants on Graduation, Earnings, and Welfare.” American Economic Journal: Applied
Economics, 11(3): 193–224.
Dynarski, Susan M. 2000. “Hope for Whom? Financial Aid for the Middle Class and Its Impact
on College Attendance.” National Tax Journal, 53(3, Part 2): 629–662.
Dynarski, Susan M, and Judith Scott-Clayton. 2008. “Complexity and Targeting in Federal
Student Aid: A Quantitative Analysis.” In Tax Policy and the Economy. Vol. 22, eds. James
Poterba, 109 – 150. Chicago: University of Chicago Press.
Dynarski, Susan M., Steven W. Hemelt, and Joshua M. Hyman. 2015. “The Missing Man-
ual: Using National Student Clearinghouse Data to Track Postsecondary Outcomes.” Educational
Evaluation and Policy Analysis, 37: 53S–79S.
Fitzpatrick, Maria D., and Damon Jones. 2016. “Higher Education, Merit-Based Scholarships
and Post-Baccalaureate Migration.” Economics of Education Review, 54(October): 155–172.
Fuller, Win, Charles F. Manski, and David A. Wise. 1983. “Enrollment Effects of the BEOG
Program.” In College Choice in America. eds. Charles F. Manski, and David A. Wise, Chapter
7, 118–128. Cambridge: Harvard University Press.
Goodman, Joshua, Oded Gurantz, and Jonathan Smith. 2020. “Take Two! SAT Retaking
and College Enrollment Gaps.” American Economic Journal: Economic Policy, 12(2): 115–158.
Hansen, W. Lee. 1983. “Impact of Student Financial Aid on Access.” Proceedings of the Academy
of Political Science, 35(2): 84–96.
Harris, Douglas N., and Jonathan Mills. 2021. “Optimal College Financial Aid: Theory and
Evidence on Free College, Early Commitment, and Merit Aid from an Eight-Year Randomized
Control Trial.” EdWorkingPaper No. 21-393.
38

Hendren, Nathaniel, and Ben Sprung-Keyser. 2020. “A Unified Welfare Analysis of Govern-
ment Policies.” The Quarterly Journal of Economics, 135(3): 1209–1318.
Hilger, Nathaniel G. 2016. “Parental Job Loss and Children’s Long-Term Outcomes: Evidence
from 7 Million Fathers’ Layoffs.” American Economic Journal: Applied Economics, 8(3): 247–283.
Imbens, Guido W., and Joshua D. Angrist. 1994. “Identification and Estimation of Local
Average Treatment Effects.” Econometrica, 62(2): 467–475.
Kane, Thomas J. 1996. “Lessons from the Largest School Voucher Program Ever: Two Decades
of Experience with Pell Grants.” In Who Chooses? Who Loses? Culture, Institutions, and the
Unequal Effects of School Choice. eds. Bruce Fuller, Richard Elmore, and Gary Orfield. New
York: Teachers College Press.
Kane, Thomas J. 2003. “A Quasi-Experimental Estimate of the Impact of Financial Aid on
College-Going.” NBER Working Paper Series.
Kezar, Adrianna, and Joseph A. Kitchen. 2020. “Supporting First-Generation, Low-Income,
and Underrepresented Students’ Transitions to College Through Comprehensive and Integrated
Programs.” American Behavioral Scientist, 64(3): 223–229.
Levin, Henry M., and Emma Garcıa. 2018. “Accelerating Community College Graduation
Rates: A Benefit–Cost Analysis.” The Journal of Higher Education, 89(1): 1–27.
Mayer, Alexander K., Reshma Patel, and Melvin Gutierrez. 2015. “Four-Year Effects on
Degree Receipt and Employment Outcomes from a Performance-Based Scholarship Program in
Ohio.” MDRC Report.
Miller, Cynthia, Camielle Headlam, Michelle Manno, and Dan Cullinan. 2020. “Increas-
ing Community College Graduation Rates with a Proven Model: Three-Year Results from the
Accelerated Study in Associate Programs (ASAP) Ohio Demonstration.” MDRC Report January.
Oreopoulos, Philip, and Kjell G. Salvanes. 2011. “Priceless: The Nonpecuniary Benefits of
Schooling.” Journal of Economic Perspectives, 25(1): 159–184.
39

Page, Lindsay C., and Judith Scott-Clayton. 2016. “Improving College Access in the United
States: Barriers and Policy Responses.” Economics of Education Review, 51: 4–22.
Park, Jin Huem. 1994. “Estimation of Sheepskin Effects and Returns to Schooling Using he Old
and the New CPS Measures of Educational Attainment.” Princeton University, Department of
Economics, Industrial Relations Section. Working Papers 717, August.
Scott-Clayton, Judith. 2011. “On Money and Motivation: A Quasi-Experimental Analysis of
Financial Incentives for College Achievement.” Journal of Human Resources, 46(3): 614–646.
Scott-Clayton, Judith, and Basit Zafar. 2019. “Financial aid, debt management, and so-
cioeconomic outcomes: Post-college effects of merit-based aid.” Journal of Public Economics,
170(2019): 68–82.
Scott-Clayton, Judith, and Lauren Schudde. 2019. “The Consequences of Performance Stan-
dards in Need Based Aid: Evidence From Community Colleges.” The Journal of Human Re-
sources.
Scrivener, Susan, Michael J. Weiss, Alyssa Ratledge, Timothy Rudd, Colleen Sommo,
and Hannah Fresques. 2015. “Doubling Graduation Rates: Three-Year Effects of CUNY’s Ac-
celerated Study in Associate Programs (ASAP) for Developmental Education Students.” MDRC
Report February.
Sjoquist, David, and John Winters. 2015. “State Merit Aid Programs and College Major: A
Focus on STEM.” Journal of Labor Economics, 33(4): 973–1003.
U.S. Department of Education. 2019. “Integrated Postsecondary Education Data System: In-
stitutional Characteristics File.”
Weiss, Michael J., Mary G. Visher, Evan Weissman, and Heather D. Wathington. 2015.
“The Impact of Learning Communities for Students in Developmental Education: A Synthesis of
Findings from Randomized Trials at Six Community Colleges.” Education Evaluation and Policy
Analysis, 37(4): 520–541.
Zimmerman, Seth D. 2014. “The Returns to College Admission for Academically Marginal Stu-
dents.” Journal of Labor Economics, 32(4): 711–754.
40
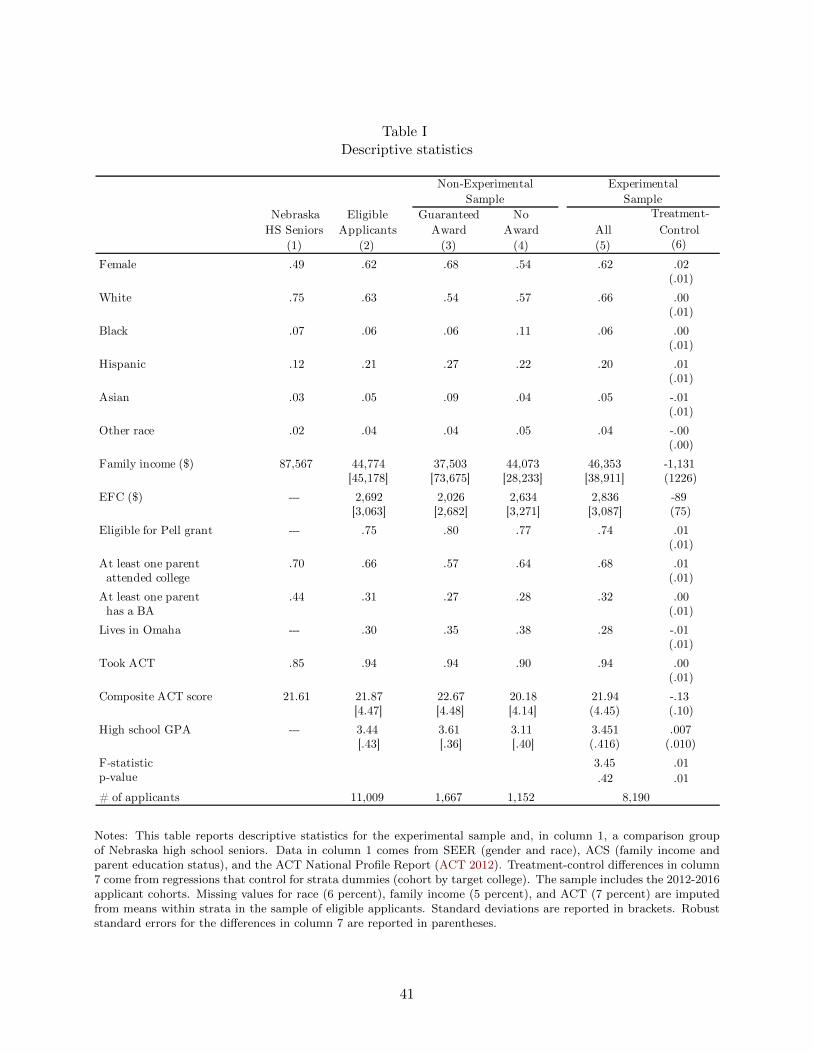
Table IDescriptive statistics
Nebraska Eligible Guaranteed NoHS Seniors Applicants Award Award All
(1) (2) (3) (4) (5)Female .49 .62 .68 .54 .62 .02
(.01)White .75 .63 .54 .57 .66 .00
(.01)Black .07 .06 .06 .11 .06 .00
(.01)Hispanic .12 .21 .27 .22 .20 .01
(.01)Asian .03 .05 .09 .04 .05 -.01 (.01)Other race .02 .04 .04 .05 .04 -.00 (.00)Family income ($) 87,567 44,774 37,503 44,073 46,353 -1,131
[45,178] [73,675] [28,233] [38,911] (1226)EFC ($) --- 2,692 2,026 2,634 2,836 -89
[3,063] [2,682] [3,271] [3,087] (75)Eligible for Pell grant --- .75 .80 .77 .74 .01
(.01)At least one parent .70 .66 .57 .64 .68 .01attended college (.01)
At least one parent .44 .31 .27 .28 .32 .00has a BA (.01)
Lives in Omaha --- .30 .35 .38 .28 -.01 (.01)
Took ACT .85 .94 .94 .90 .94 .00 (.01)
Composite ACT score 21.61 21.87 22.67 20.18 21.94 -.13 [4.47] [4.48] [4.14] (4.45) (.10)
High school GPA --- 3.44 3.61 3.11 3.451 .007 [.43] [.36] [.40] (.416) (.010)
F-statistic 3.45 .01p-value .42 .01# of applicants 11,009 1,667 1,152
Non-Experimental ExperimentalSample Sample
Treatment-Control
(6)
Notes: This table reports descriptive statistics for the experimental sample and, in columns 1 and 2, a comparison group of US and Nebraska high school seniors. Data in columns 1 and 2 come from SEER (gender and race), ACS (family income and parent education status), and the ACT National Profile Report (ACT 2012). Treatment-control differences in column 7 come from regressions that control for strata dummies (cohort by target college). The sample includes the 2012-2016 cohorts. Missing values for race (6 percent), family income (5 percent), and ACT (7 percent) are imputed from means within strata in the sample of eligible applicants. Standard deviations are reported in brackets. Standard errors for the differences in column 7 are reported in parentheses.
8,190
Notes: This table reports descriptive statistics for the experimental sample and, in column 1, a comparison groupof Nebraska high school seniors. Data in column 1 comes from SEER (gender and race), ACS (family income andparent education status), and the ACT National Profile Report (ACT 2012). Treatment-control differences in column7 come from regressions that control for strata dummies (cohort by target college). The sample includes the 2012-2016applicant cohorts. Missing values for race (6 percent), family income (5 percent), and ACT (7 percent) are imputedfrom means within strata in the sample of eligible applicants. Standard deviations are reported in brackets. Robuststandard errors for the differences in column 7 are reported in parentheses.
41

Table IIInitial enrollment effects
ControlMean
(1) (2) (3) (4) (5) (6) .964 .023 .021 .024 .899 .058
(.004) (.005) (.005) (.014)
.833 .104 .115 .089 .057 .041 (.008) (.010) (.012) (.015)
.095 -.067 -.078 -.065 .838 .004 (.006) (.007) (.009) (.020)
.036 -.014 -.016 -.001 .004 .013 (.004) (.005) (.007) (.005)
.876 .067 .067 .062 .862 .077 (.007) (.009) (.011) (.016)
.678 .115 .137 .119 .017 .046 (.009) (.012) (.014) (.011)
.108 .014 .001 .004 .017 .012 (.005) (.004) (.005) (.008)
.121 -.073 -.084 -.057 .830 .024 (.007) (.008) (.011) (.020)
.024 -.016 -.019 -.014 .017 -.014 (.003) (.004) (.005) (.005)
.064 -.027 -.028 -.025 .020 -.005 (.005) (.007) (.008) (.007)
# of applicants 3,786 705 1,345
B. Sector and Location
Four-year strata Two-year strata
Control mean
Award effect
NU 2013-2016Award effect
Regular COSAward Award
Any college enrollment
A. Program Type
Four-year
Two-year
Dual enrollment
6,845
Notes: This table reports the effect of scholarship offers on enrollment by the end of the scholarship application year. The sample includes 2012-2016 applicant cohorts. Columns 1 and 2 report estimates for all four-year targeters. Estimates in columns 3 and 4 are for NU applicants from 2013-2016 cohorts to capture the effect of COS awards. Estimates in column 3 are for those who were offered COS awards and only includes students who received an STBF award with mandated LC participation and conrol applicants. Column 4 reports estimates for those who werre offered an LC award , without mandatory LC participation, and control applicants. Outcomes in each panel are mutually exclusive. Students simulatneously enrolled at both Nebraska public colleges and universities and non-Buffett eligible campuses are coded as Nebraska public only. The regressions used to estimate treatment effects control for strata dummies.
Nebraska public
University of Nebraska
State college
Community college
Out-of-state public
Private
5,212
Notes: This table reports scholarship award effects on post-secondary enrollment measured at the end of the scholarshipapplication year. Columns 1 and 2 show estimates for four-year strata from all experimental cohorts. Estimates incolumns 3 and 4 show estimates for NU applicants from the 2013-16 cohorts. These were computed by replacingAi in equation (1) with dummies for each version of the NU treatment (regular or COS, where the latter dropsthe obligation to participate in LCs). Columns 5 and 6 show estimates for two-year strata from all experimentalcohorts. Outcomes in each panel are mutually exclusive. Students simultaneously enrolled at both Nebraska publiccolleges and universities and non-Buffett eligible campuses are coded as being in Nebraska public schools only. Theregressions used to estimate treatment effects control for strata dummies. Dependent variable construction is detailedin Appendix 1. Robust standard errors appear in parentheses.
42

Table IIIDegree completion effects
ControlMean(1) (2) (3) (4) (5) (6)
.636 .081 .089 .080 .240 .055 (.016) (.022) (.026) (.034)
.076 -.032 -.030 -.038 .531 -.001 (.008) (.010) (.011) (.038)
.015 -.006 -.009 -.009 .046 .009 (.004) (.005) (.005) (.017)
.307 -.052 -.058 -.055 .395 -.046 (.015) (.021) (.025) (.037)
.051 -.003 -.009 -.016 .014 .005 (.007) (.010) (.012) (.009)
3.93 .360 .366 .249 3.06 .393 (.041) (.056) (.068) (.121)
3.17 .592 .622 .465 .751 .429 (.051) (.070) (.083) (.108)
.487 -.219 -.239 -.212 2.20 -.077 (.031) (.042) (.049) (.098)
.278 -.012 -.018 -.004 .102 .042 (.019) (.025) (.033) (.029)
# of applicants 1,924
No degree earned
Four-year strata Two-year strata
Award effect
NU 2013-2014Regular COS Control AwardAward Award mean effect
Bachelor's degree earned
Associate degree earned
Enrolled at four year
Enrolled at four-year
Total years of schooling
Time in four-year
Time in two-year
Dual enrollment
367 666
Notes: This table reports effects on degree completion and years of schooling by the end of year six. Estimated effects on year-six outcomes use data from the 2012-2014 cohorts. Columns 1 and 2 report estimates for all four-year targeters. Estimates in columns 3 and 4 are for NU applicants from 2013 and 2014 cohorts to capture the effect of COS awards. Estimates in column 3 are for those who were offered COS awards and only includes students who received an STBF award with mandated LC participation and control applicants. Column 4 reports estimates for those who were offered a COS award, without mandatory LC participation, and control applicants. Columns 5 and 6 use the experimental two-year strata in the 2012-2014 cohorts. The regressions control for stata dummies. Years of schooling are measured using a dummy for enrollment of any intensity (number of credits) in a given term. Variables are defined in more detail in Appendix A.3.
3,639 2,383
Notes: This table reports scholarship award effects on degree completion and years of schooling measured at the endof year six. Columns 1 and 2 show estimates for four-year strata in the 2012-14 cohorts. Estimates in columns 3 and4 are for NU applicants from the 2013 and 2014 cohorts. These estimates were computed by replacing Ai in equation(1) with dummies for each version of the NU treatment (regular or COS, where the latter drops the obligation toparticipate in LCs). Columns 5 and 6 show estimates for two-year strata in the 2012-14 cohorts. Regressions usedto estimate treatment effects control for strata dummies. Dependent variable construction is detailed in Appendix 1.Robust standard errors appear in parentheses.
43

Table IVIV estimates of the effect of initial four-year credits completed on degrees
(1) (2) (3) (4) (5)
Four-year credits earned 0.55 0.58 0.59 0.61 0.57(0.09) (0.10) (0.10) (0.11) (0.02)
First stage
Any award 0.11(0.01)
F-stat 11.20 14.55 25.09
Over-identification test 7.75 6.69 0.71 --Degrees of freedom 12 8 4p-value 0.80 0.57 0.95
Four-year credits earned 0.32 0.34 0.36 0.37 0.43(0.09) (0.10) (0.10) (0.11) (0.02)
Over-identification test 8.25 5.64 2.23 --p-value 0.77 0.69 0.69
Four-year credits earned -0.28 -0.27 -0.27 -0.26 -0.20(0.05) (0.07) (0.05) (0.08) (0.01)
Over-identification test 3.75 1.72 2.09 --p-value 0.99 0.99 0.72
N 4,305 4,305 4,305 4,305
A. Bachelor's Degree
B. Any Degree
C. Associate Degree
Notes: This table reports 2SLS estimates and over-identification test statistics for models where the outcome is BA completion and the endogenous variable is initial four-year engagement as defined in Figure VI. The just-identified estimate in column 4 uses a single offer dummy as an instrument. Estimates in columns 1 to 3 are from over-identified models with instrument sets constructed by interacting award offers woth sets of dummies indicated in column headings. Instruments include any award dummy plus interactions with strata dummies: UNL, UNO, UNK, SC, and two-year colleges and subgroup dummies: Omaha residency, Nonwhite, male, Pell-eligible, below-median ACT, below-median GPA, first-generation, and listing a two-year college as an alternate. The sample in restricted to the 2012-2014 cohorts. All regressions control for strata and subgroup main effects.
2SLSStrata and Subgroup
Interactions
Supgroup Interactions
Strata Interactions
Just-identified
OLS
Notes: This table reports 2SLS estimates and over-identification test statistics for models where the outcome is BAcompletion and the endogenous variable is initial four-year engagement as defined in Figure VI. The just-identifiedestimate in column 4 uses a single offer dummy as instrument. Estimates in columns 1 to 3 are from over-identifiedmodels with instrument sets constructed by interacting award offers with sets of dummies indicated in column headings.Instruments include an any-award dummy plus interactions with strata dummies: UNL, UNO, UNK, SC, and two-yearcolleges and subgroup dummies: Omaha residency, Nonwhite, male, Pell-eligible, below-median ACT, below-medianGPA, first-generation, and listing a two-year college as an alternate. Strata and subgroups plotted are not mutuallyexclusive. We give an example of VIV using mutually exclusive subgroups in Online Appendix Figure A8. Estimatesare for 2012-14 applicant cohorts in two- and four-year strata. All models control for strata and subgroup main effects.Robust standard errors appear in parentheses.
44

Table VDynamic exclusion parameter estimates and specification tests
Year 2 Year 3 Year 4 Year 2 Year 3 Year 4 Year 2 Year 3 Year 4(1) (2) (3) (4) (5) (6) (7) (8) (9)
0.54 0.61 0.60 0.55 0.65 0.65 0.53 0.63 0.63(0.08) (0.08) (0.08) (0.08) (0.08) (0.07) (0.07) (0.08) (0.07)
1.08 0.95 0.94 1.01 0.86 0.85 1.02 0.87 0.85(0.08) (0.09) (0.11) (0.07) (0.09) (0.09) (0.07) (0.08) (0.09)0.58 0.58 0.57 0.55 0.56 0.55 0.55 0.55 0.54 ψt µt
Over-id test 4.00 0.72 3.91 9.52 8.39 7.06 14.32 9.24 10.62 p-value 0.262 0.869 0.271 0.300 0.397 0.530 0.216 0.600 0.475
Notes: This table reports 2SLS estimates of mu_t in equation (6) and psi_t in equation (5). The product of these two should equal mu_1 in equation (2). The over-identification test associated for 2SLS estimation of equation (7) tests this restriction. Instrument sets are indicated above column headings. Robust standard errors appear in parentheses.
Strata Interactions Subgroup InteractionsStrata and Subgroup
Interactions
µt
ψt
Notes: This table reports 2SLS estimates of µt in equation (6) and ψt in equation (5). The product of these two
should equal µ1 in equation (2). The over-identification test associated for 2SLS estimation of equation (7) tests this
restriction. Instrument sets are indicated above column headings. Robust standard errors appear in parentheses.
45

Table VICollege costs and marginal spending by target campus
NU target campuses Statestrata UNL UNO UNK Colleges
(2) (3) (4) (5)
Treated
Funder cost 32.25 33.09 33.05 32.97 26.77 COA 30.94 32.75 30.87 30.63 25.49 years of schooling 4.30 4.31 4.39 4.32 3.98
Control COA 28.55 31.07 26.03 26.55 25.78 years of schooling 3.93 4.01 3.91 3.88 3.78
# of applicants 3,639 1,632 1,009 500 498
Award effects on:(1) Log cost of attendance 0.16 0.10 0.27 0.20 0.08
(0.02) (0.03) (0.04) (0.05) (0.06)(2) Log years of college 0.11 0.09 0.13 0.13 0.07
(0.01) (0.02) (0.03) (0.04) (0.04)
(3) Log cost per year of college 0.05 0.01 0.14 0.07 0.01(0.01) (0.02) (0.03) (0.03) (0.04)
Share of marginal spending due to increased years of college (2)/(1) 0.66 0.91 0.49 0.65 0.88
# of applicants 3,593 1,616 990 495 492
(1)
Four-year
Notes: This table reports award effects on degree costs. Panel A shows statistics including students who have zero years of schooling and thus zero cost of attendance; Panel B excludes these students. Panel A reports mean cost and years of attendance for control students. Values for treatment students are the sum of control means and strata adjusted treatment effects. The first three rows in Panel B report results from regressions of log COA, log years, and log cost per year on a dummy for winning a scholarship in the given sample. These regressions include strata dummies. Estimates are for the 2012-2014 cohorts in four-year strata. Dollar values are reported in thousands.
A. College Costs ($1000s)
B. Decomposition of marginal spending
Notes: This table reports award effects on degree costs. Panel A shows statistics including students who have zeroyears of schooling and thus zero cost of attendance; Panel B excludes these students. Panel A reports mean cost andyears of attendance for control students and treatment students. The first three rows in Panel B report results fromregressions of log COA, log years, and log cost per year on a dummy for winning a scholarship in the given sample.These regressions include strata dummies. Estimates are for the 2012-2014 cohorts in four-year strata. Funder costand COA are discounted back to Year 1 at 3%. Dollars values are reported in thousands.
46
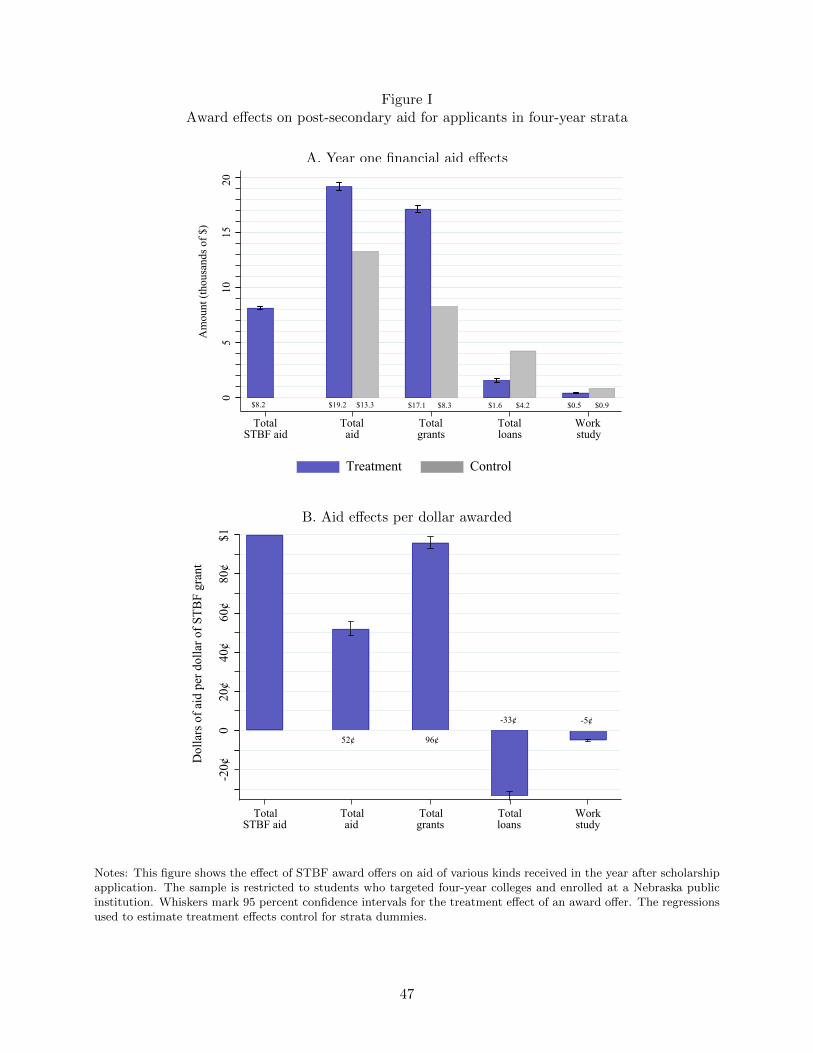
Figure IAward effects on post-secondary aid for applicants in four-year strata
A. Year one financial aid effects
05
1015
20
Am
ount
(tho
usan
ds o
f $)
TotalSTBF aid
Totalaid
Totalgrants
Totalloans
Workstudy
$8.2 $19.2 $13.3 $17.1 $8.3 $1.6 $4.2 $0.5 $0.9
05,
000
10,0
0015
,000
amou
ntre
ceiv
ed ($
)
total aid grants governmentloans
work study
Treatment Control
B. Aid effects per dollar awarded
$1-20¢D
olla
rs o
f aid
per
dol
lar o
f STB
F gr
ant
0 20
¢ 40
¢ 60
¢ 80
¢
TotalSTBF aid
Totalaid
Totalgrants
Totalloans
Workstudy
52¢ 96¢
-33¢ -5¢
Notes: This figure shows the effect of STBF award offers on aid of various kinds received in the year after scholarshipapplication. The sample is restricted to students who targeted four-year colleges and enrolled at a Nebraska publicinstitution. Whiskers mark 95 percent confidence intervals for the treatment effect of an award offer. The regressionsused to estimate treatment effects control for strata dummies.
47

Figure IIEnrollment effects in four-year strata
0.2
.4.6
.81
0.2
.4.6
.81
shar
e of
app
lican
ts
fall
Year 1
spring fall
Year 2
spring fall
Year 3
spring fall
Year 4
spring fall
Year 5
spring fall
Year 6
spring
.04.06 .08
.09
.10
-.02
.96
.99
.88
.95
.83
.91
.79
.88
.43
.60
.18
.25.34
.28
.56
.60
.58
.67
0.1
.2.3
.4.5
.6.7
.8.9
1
0.1
.2.3
.4.5
.6.7
.8.9
1
shar
e of
app
lican
ts
fall
Year 1
spring fall
Year 2
spring fall
Year 3
spring fall
Year 4
spring fall
Year 5
spring fall
Year 6
spring fall
Year 7
spring
years since high school graduation
Treatment Control
Notes: This figure plots enrollment rates by treatment status for the four-year strata. Grey lines plot completionrates for control applicants; blue lines plot the sum of control means and strata-adjusted treatment effects. Whiskersmark 95 percent confidence intervals. Samples differ by year. Regressions control for strata dummies. Whiskers mark95 percent confidence intervals.
48

Figure IIIBA effects by target campus
-.2-.1
0.1
.2
treat
men
t eff
ect
Year 4 Year 5 Year 6
.13.09
.06.03
.07
.04.04
.05-.01
-.04-.05 -.01
-.2-.1
0.1
.2Tr
eatm
ent e
ffec
t
Year 4 Year 5 Year 6
.17
.04
.09
.04
-.02
-.05
.05.04
-.05-.03
.03
.05
University of Nebraska Lincoln (UNL)
StateColleges
University of Nebraska Omaha (UNO)
University of Nebraska Kearney (UNK)
UNL SCUNO UNK
FIGURE 3 — Degree effects by target campus. Notes: This figure plots the effect of an STBF award on degreecompletion for applicants targeting four-year campuses. Whiskers mark 95 percent confidence intervals. Samplediffers by year.
10
Notes: This figure plots STBF award effects on BA completion for applicants in four-year strata. Samples differby year. The regressions used to compute these estimates control for strata dummies. Whiskers mark 95 percentconfidence intervals.
49

Figure IVBA completion in demographic and college readiness subgroups
A. Demographic Subgroups
Nonwhite(35%)
0.00
0.05
0.09
.06
0.2
.4.6
.8
shar
e of
app
lican
ts
fall
Year 4
spring fall
Year 5
spring fall
Year 6
spring
White(65%)
-0.05
0.05
0.07
.05
0.2
.4.6
.8
shar
e of
app
lican
ts
fall
Year 4
spring fall
Year 5
spring fall
Year 6
spring
Pell-Eligible(74%)
-0.01
0.05
0.09
.03
0.2
.4.6
.8
shar
e of
app
lican
ts
fall
Year 4
spring fall
Year 5
spring fall
Year 6
spring
Not Pell-Eligible(26%)
-0.08
0.05
0.06
.03
0.2
.4.6
.8
shar
e of
app
lican
ts
fall
Year 4
spring fall
Year 5
spring fall
Year 6
spring
B. Four-Year College Readiness Subgroups
Below-median GPA(47%)
0.01
0.07
0.12
.01
0.2
.4.6
.8
shar
e of
app
lican
ts
fall
Year 4
spring fall
Year 5
spring fall
Year 6
spring
Above-median GPA(53%)
-0.06
0.03
0.04
.01
0.2
.4.6
.8
shar
e of
app
lican
ts
fall
Year 4
spring fall
Year 5
spring fall
Year 6
spring
Two-year college alternate(33%)
-0.01
0.08
0.13
.05
0.2
.4.6
.8
shar
e of
app
lican
ts
fall
Year 4
spring fall
Year 5
spring fall
Year 6
spring
No two-year college alternate(67%)
-0.04
0.04
0.07
.05
0.2
.4.6
.8
shar
e of
app
lican
ts
fall
Year 4
spring fall
Year 5
spring fall
Year 6
spring
Notes: This figure plots mean degree completion rates by treatment status and subgroup for 2012-16 applicants infour-year strata. Grey lines plot completion rates for control applicants; blue lines plot the sum of control means andstrata-adjusted treatment effects. Whiskers mark 95 percent confidence intervals. Samples differ by year. Percentagesin each panel are for all experimental cohorts. The median high school GPA for Panel B is 3.49. STBF awardapplicants were asked to indicate their first choice (“target school”) and to rank alternatives. “Two-year collegealternate” indicates that a student ranked a two-year college among their alternative target schools on the STBFapplication. The differences in treatment effects in year six for each subgroup split are as follows (standard errorsgiven in parentheses): Race: .018 (.005), Pell-eligibility: .027 (.006), GPA: .081 (.005), two-year alternate: .060 (.006).
50

Figure VFirst-stage estimates and counterfactual destinies for target-school compliers in four-year strata
A. Target school enrollment by target campus and subgroup
5%10
%15
%20
%25
%0
NKNK
Nonwhit
e
Nonwhit
eUUNLNL
UNOUNO
UU SCSC
Not Pell-W
hite
lig
Peem
aleMale
Low A
CT
Low A
CT
High A
High A
LoLoCTCT
HHw w
igh
igh GG rr
AAGGPPAA tiv
etiv
etitiv
eve
yyrr a a
22No 2
yr alt
erna
No 2yr
altern
altelte
PP
NoNo
nana
paren
t BA
paren
t BA
Parent
Parent
BABA
ll elig
ible
ible
t Omah
a resi
Omaha r
eside
nt
No
Fde
nt
Effect of an award on target school enrollment
Effect of an award on degree completion
-e
B. Counterfactual destiny distributions for target compliers
020%
40%
60%
80%
100%
UNLUNO
U NK SC
Nonwhit
eW
hite
Low A
CT
High A
LoCT PA
rw G
P
High G
A tiveve
2y al
terna
ti
paren
t BA
Parent
BAUNL
UNOU NK SC
Nonwhit
eW
hite
emaleMa
le
Low A
CT
High A
LoCT PA
rw G
P
High G
A tiveve
2y al
terna
ti
paren
t BA
Parent
BA
Pell-el
igible
Not Pell
-eligi
ble
Omaha r
eside
nt
Not an
Omah
a resi
dent
F
NoNo 2
yr alt
erna
Not enrolled Two-year Four year
Notes: Bar height in Panel A measures the share of four-year applicant strata and subgroups who are target-schoolcompliers; target school compliers are defined as the set of applicants who enroll in their target school when awardedscholarships but not otherwise. Dots in Panel A indicate BA completion effects in each group. Panel B shows thedistribution of enrollment by school type for target-school compliers when compliers are untreated. Enrollment statusis computed using first-year data only. Groups in the figure are the union of those used for Figure IV and OnlineAppendix Figure A4.
51
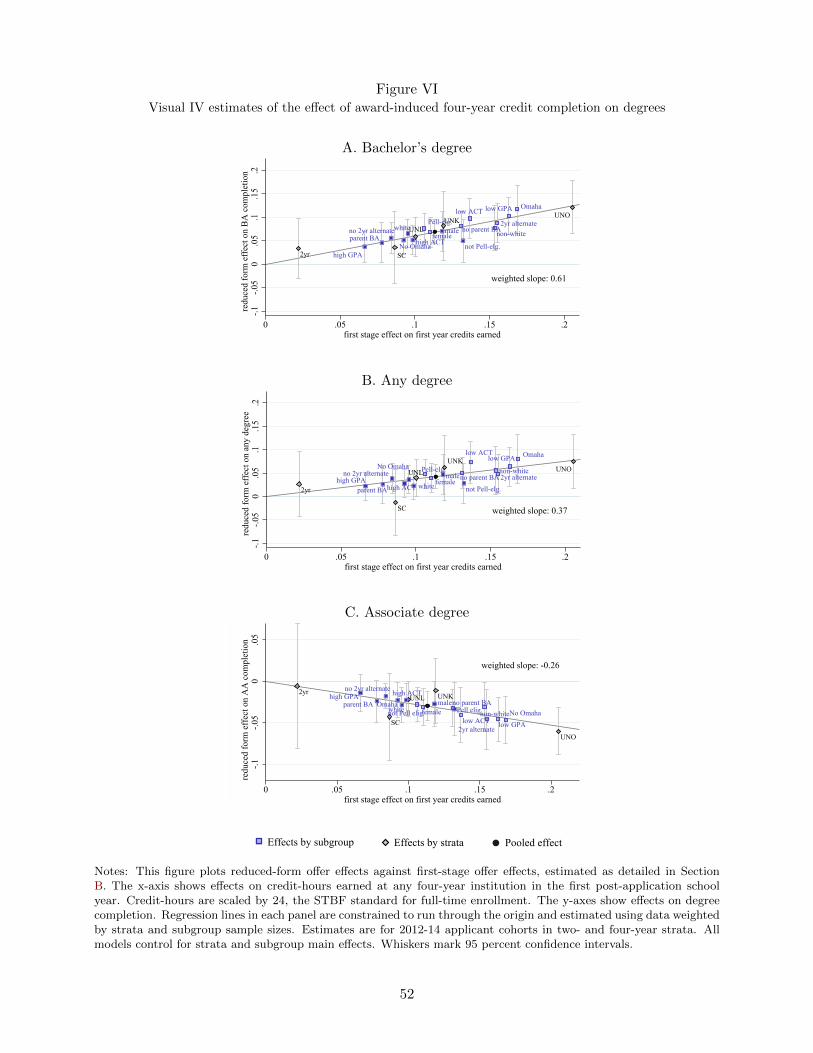
Figure VIVisual IV estimates of the effect of award-induced four-year credit completion on degrees
A. Bachelor’s degree
UNO
2yrnot Pell-elg.
low ACT
non-white
low GPA Omaha
no parent BA
weighted slope: 0.61
redu
ced
form
eff
ect o
n B
A c
ompl
etio
n-.1
-.0
5 0
.05
.1
.15
.2
0 .05 .1 .15 .2first stage effect on first year credits earned
2yr alternateUNK
high GPA
parent BAno 2yr alternate UNL
SCNo Omaha
white
high ACT
Pell-elg.
femalemale
B. Any degree
UNOUNK
SC
2yr not Pell-elg.
low ACT Omaha
weighted slope: 0.37
redu
ced
form
eff
ect o
n an
y de
gree
-.1
-.05
0 .0
5 .1
.1
5 .2
0 .05 .1 .15 .2first stage effect on first year credits earned
non-white2yr alternate
low GPA
high GPAPell-elg.no 2yr alternate
parent BAhigh ACT white femalemaleUNL
No Omahano parent BA
C. Associate degree
UNO
UNK
SC
2yr
parent BA
low ACT
weighted slope: -0.26
-.1-.0
50
.05
redu
ced
form
eff
ect o
n A
A c
ompl
etio
n
0 .05 .1 .15 .2first stage effect on first year credits earned
high GPAno 2yr alternate
white
2yr alternate
OmahaNo Omaha
low GPA
high ACTUNL
femalemaleno parent BA
Pell elig.not Pell elig. non-white
020
4060
2-year
alter
nativ
ede
nt
Pell el
igible
abov
e med
ian A
CT
abov
e med
ian G
PA
below
m
ACT
below
med
ian G
PAfem
alemale
no 2-
year
altern
ative
not O
maha r
eside
nt
not P
ell el
igible
paren
ts BA
paren
ts no B
Awhit
e
1030
50
Effects by subgroup Effects by strata Pooled effect
Notes: This figure plots reduced-form offer effects against first-stage offer effects, estimated as detailed in SectionB. The x-axis shows effects on credit-hours earned at any four-year institution in the first post-application schoolyear. Credit-hours are scaled by 24, the STBF standard for full-time enrollment. The y-axes show effects on degreecompletion. Regression lines in each panel are constrained to run through the origin and estimated using data weightedby strata and subgroup sample sizes. Estimates are for 2012-14 applicant cohorts in two- and four-year strata. Allmodels control for strata and subgroup main effects. Whiskers mark 95 percent confidence intervals.
52

Figure VIIThe distribution of four-year credits by treatment status
A. Four-year credit histograms by treatment status
0.0
5.1
.15
Prop
ortio
n
0 10 20 30 40
Treatment Control
B. Normalized treatment-control difference in credit CDFs
0.0
5.1
.15
Prop
ortio
n
0 10 20 30 40creditsEarn_4yr_
Density Density
-.01
0.0
1.0
2.0
3.0
4.0
5(1
-CD
F) D
iffer
ence
0 10 30 4020Average Credits per semester
at four-year institution in year one
Notes: Panel A plots the histogram of four-year credits earned in the first post-application school year, separately bytreatment status. Panel B plots the difference in the (negative of the) CDF of four-year credits earned by treatmentstatus, normalized to generate the weighting function described in the text. The x-axis in panel B measures thelikelihood that an award shifts applicants from completing fewer than s credit(s) to completing at least s credit(s).Cutoffs for 3
4- and full-time enrollment are marked on the x-axis. Students must be enrolled at least 3
4time to qualify
for STBF support. Estimates are for 2012-14 applicant cohorts in four-year strata.
53

Figure VIIIEarnings gains compared with program costs
010
2030
4050
Thou
sand
s of d
olla
rs
2-year
alter
nativ
e
Omaha r
eside
nt
Pell-el
igibleSC
UNKUNL
UNO
abov
e med
ian A
CT
abov
e med
ian G
PA
below
med
ian A
CT
below
med
ian G
PAfem
ale male
no 2-
year
altern
ative
nonw
hite
not O
maha r
eside
nt
not P
ell-el
igible
paren
ts BA
paren
ts no B
Awhit
e
sub
earn stbf/social
2040
6030
50
Earnings gains Funder cost Incremental COA
Notes: This figure compares program costs with estimates of the lifetime earnings generated by award receipt, whenthe latter are measured by the returns to levels of schooling. Details of this estimation can be found in OnlineAppendix C. Costs are measured two ways: the lower tick mark indicates the increase in educational spending (COA)generated by awards, while the upper tick mark shows average funder cost. Estimates are for the 2012-2014 cohortsin the four-year strata.
54

Online Appendix for “Marginal Effects of Merit Aid for
Low-Income Students”
Joshua Angrist David Autor Amanda Pallais
December 2021
1

Contents
A Supplementary Material 3
A.1 STBF Application Details . . . . . . . . . . . . . . . . . . . . . . . . . . . . . . . . . 3
A.1.1 Award Eligibility . . . . . . . . . . . . . . . . . . . . . . . . . . . . . . . . . . 3
A.1.2 Application Process . . . . . . . . . . . . . . . . . . . . . . . . . . . . . . . . 3
A.1.3 Award Details . . . . . . . . . . . . . . . . . . . . . . . . . . . . . . . . . . . 4
A.1.4 Renewing STBF Scholarships . . . . . . . . . . . . . . . . . . . . . . . . . . . 5
A.2 Additional Exhibits . . . . . . . . . . . . . . . . . . . . . . . . . . . . . . . . . . . . . 6
B Estimates in a Sample of Balanced Cohorts 20
C Earnings Imputation 26
C.1 Details . . . . . . . . . . . . . . . . . . . . . . . . . . . . . . . . . . . . . . . . . . . . 26
C.2 Earnings-Related Exhibits . . . . . . . . . . . . . . . . . . . . . . . . . . . . . . . . . 29
2

A Supplementary Material
A.1 STBF Application Details
The following are eligibility and application guidelines for students in the 2012-2016 cohorts.
All students in the experimental sample, in other words, were subject to these requirements.
A.1.1 Award Eligibility
The STBF scholarship is awarded annually to students who meet the following eligibility re-
quirements:
• Current residents of Nebraska
• Nebraska high school graduates or Nebraska GED recipients
– Earned at least a 2.5 unweighted cumulative GPA
• First-time freshman when entering college
• Plan to attend a Nebraska public institution
• Need financial assistance in order to attend college
– Students do not need to be Pell Grant eligible
– Students must have an expected family contribution (EFC) of less than $10,000 ($15,000
in 2012)
A.1.2 Application Process
The STBF application goes live in the fall of each year. Students have a deadline of February 1
to submit a completed application, consisting of five parts: the application form, the student’s high
school transcript, two letters of recommendation, a student aid report generated by the FAFSA
form, and a personal essay.
The application form asks for basic contact information, family background (such as parent
names and education), student GPA and high school attended, and the student’s “target school.”
3
When soliciting an applicant’s target school, the application asks the applicant to “please select the
college you plan to attend if you receive this scholarship.” 1
Students are then prompted to upload a high school transcript and send requests for letters of
recommendation to two adults in their community. The application instructs that recommendations
“should come from teachers, school administrators, school counselors, employers, clergy, or other
adult mentors.” Requests will cue the recommenders to respond to the following prompts:
• Please speak to the student’s work ethic and leadership skills
• Discuss the student’s understanding of him or herself and how you have seen this play a role
in his or her life.
• Discuss the student’s motivation, goals, and any challenges they have overcome.
• How have you seen this student be active in the community or giving back to others?
After requesting recommendations, the applicant is prompted to upload a typed admissions
essay of 1,000-1,500 words responding to the following prompt:
“We’d like to learn more about the factors in your life that have led you to pursue a college
education. Please compose an essay describing your reasons for wanting to attend college.”
The final step in the application asks the applicant to complete the FAFSA and upload the resulting
student aid report (SAR), which provides an estimated expected family contribution (EFC).
A.1.3 Award Details
Once a student applies for and is awarded a STBF scholarship, the Foundation coordinates pri-
marily with the student’s institution. STBF scholarship funds are determined based on a student’s
enrollment status. All STBF students are required to enroll at least three-quarters time (be enrolled
in at least 9 credit hours) across all institutions. STBF determines maximum award amounts by
school. These maximum amounts are calculated by taking the cost per credit and multiplying that
by 15 credit hours.2 The Foundation also awards each student a $500 stipend for books. Based
1The application also asks applicants to indicate other schools they might attend from a list of all Nebraska publicinstitutions. We use this information to understand whether a student is considering a two-year college.
2Although maximum amounts are calculated using 15 credits, students only have to be taking 12+ credit hoursfor the Foundation to consider them “full-time.”
4
on enrollment, these maximum award amounts are scaled by a student’s enrollment status. For
example, Mid Plains Community College (MPCC) has a $107 charge per credit hour for tuition and
fees.
$107 ∗ 15 = $1, 605 + $500 = $2, 105
so the maximum award amount is set at $2,105. If a student is enrolled three quarters time (9-11
credits), they would be awarded $1,578 ($2, 105 ∗ 0.75).
Although maximum award amounts are based on tuition and enrolled credits, STBF scholarship
funds can be applied to any part of an undergraduate student’s cost of attendance including tuition,
fees, books, room and board, personal expenses, and transportation. STBF is generous with this
aid, explicitly stating in the award handbook that “STBF scholarships are intended to maximize
the amount of aid a student can receive.” In this spirit, STBF works to not “crowd-out” other
forms of aid. STBF scholarships can be awarded in excess of a student’s financial need (COA less
EFC and other forms of aid), but the award from STBF may not exceed a student’s baseline cost
of attendance.
A.1.4 Renewing STBF Scholarships
STBF awards are renewable for up to five years at the University of Nebraska and Nebraska state
colleges. Awards are renewable for up to three years at Nebraska Community Colleges (including
NCTA). To maintain eligibility for the award, awardees must meet the following criteria:
• Maintain a 2.0 cumulative GPA at the end of all terms
• Earn at least 18 credit hours or 27 quarter hours in each year (3/4 time)
Failure to meet these requirements will result in a “probationary period.” Two consecutive or three
total terms of probation will result in the loss of scholarship eligibility.
Barring two consecutive or three total probationary periods, a student’s STBF scholarship will
automatically renew without action from the student. The Foundation communicates directly
with each institution, so STBF students are not responsible for reporting grades directly to the
Foundation. Students are encouraged, but not required, to complete and submit an updated FAFSA
form each year.
5

A.2 Additional Exhibits
6
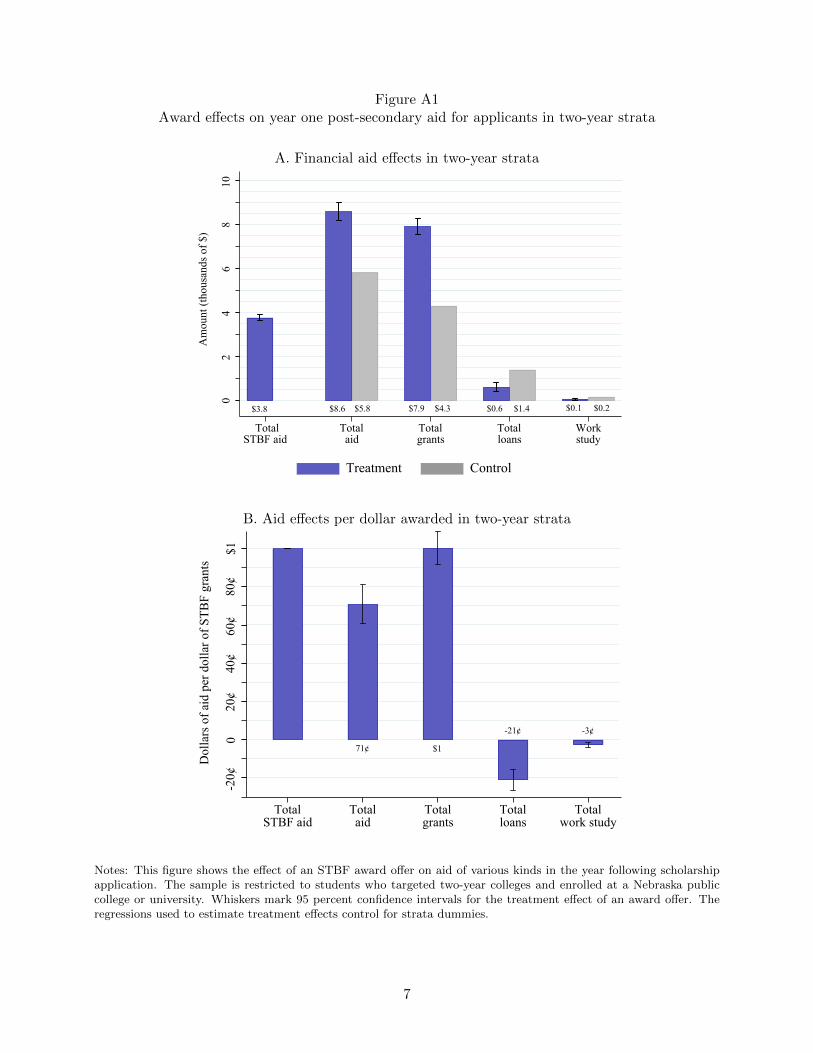
Figure A1Award effects on year one post-secondary aid for applicants in two-year strata
A. Financial aid effects in two-year strata
02
46
810
Am
ount
(tho
usan
ds o
f $)
TotalSTBF aid
Totalaid
Totalgrants
Totalloans
Workstudy
$3.8 $8.6 $5.8 $7.9 $4.3 $0.6 $1.4 $0.1 $0.205,
000
10,0
0015
,000
amou
ntre
ceiv
ed ($
)
total aid grants governmentloans
work study
Treatment Control
B. Aid effects per dollar awarded in two-year strata
-20¢
$1
Dol
lars
of a
id p
er d
olla
r of S
TBF
gran
ts
0 .2
.4
.6
.8
TotalSTBF aid
Totalaid
Totalgrants
Totalloans
Totalwork study
strata-adjusted
020
¢40
¢60
¢80
¢
71¢ $1
-21¢ -3¢
Notes: This figure shows the effect of an STBF award offer on aid of various kinds in the year following scholarshipapplication. The sample is restricted to students who targeted two-year colleges and enrolled at a Nebraska publiccollege or university. Whiskers mark 95 percent confidence intervals for the treatment effect of an award offer. Theregressions used to estimate treatment effects control for strata dummies.
7

Figure A2Enrollment effects in two-year strata
0.2
.4.6
.81
0.2
.4.6
.81
shar
e of
app
lican
ts
fall
Year 1
spring fall
Year 2
spring fall
Year 3
spring fall
Year 4
spring fall
Year 5
spring fall
Year 6
spring
.09
.09
.14
.11
.02
.02
.96
.99
.88
.95
.83
.91
.79
.88
.43
.60
.18
.25.34
.28
.56
.60
.58
.67
0.1
.2.3
.4.5
.6.7
.8.9
1
0.1
.2.3
.4.5
.6.7
.8.9
1
shar
e of
app
lican
ts
fall
Year 1
spring fall
Year 2
spring fall
Year 3
spring fall
Year 4
spring fall
Year 5
spring fall
Year 6
spring fall
Year 7
spring
years since high school graduation
Treatment Control
Notes: This figure plots the effect of an award on enrollment rates for students in the two-year strata without a BA.Samples differ by year. Regressions control for strata dummies. Whiskers mark 95 percent confidence intervals.
8

Figure A3Bachelor’s degree effects by award type
-0.04
0.06
-0.02
0.04
-.2-.1
0.1
.2
treat
men
t eff
ect
fall
Year 4
spring fall
Year 5
spring fall
Year 6
spring
0.09
0.08
020
4060
2-year
alter
nativ
ede
nt
Pell el
igible
abov
e med
ian A
CT
abov
e med
ian G
PA
below
m
ACT
below
med
ian G
PAfem
alemale
no 2-
year
altern
ative
not O
maha r
eside
nt
not P
ell el
igible
paren
ts BA
paren
ts no B
Awhit
e
1030
50
STBF award COS award
Notes: This figure plots the effect of awards with and without learning community participation on six-year degreecompletion for applicants targeting four-year campuses. Awards without an LC mandate are called CollegeOpportunity Scholarships (COS). Whiskers mark 95 percent confidence intervals. The samples used to estimatetreatment effects differ by year.
9
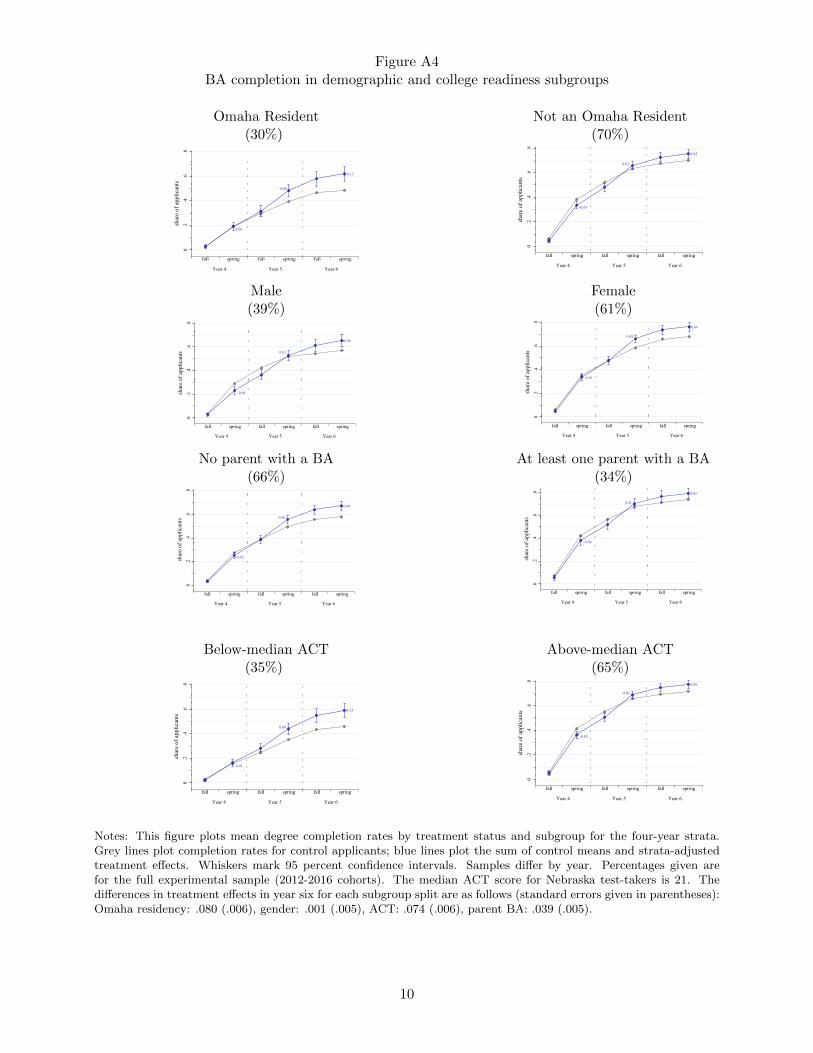
Figure A4BA completion in demographic and college readiness subgroups
Omaha Resident(30%)
0.00
0.09
0.13
.00
0.2
.4.6
.8
shar
e of
app
lican
ts
fall
Year 4
spring fall
Year 5
spring fall
Year 6
spring
Not an Omaha Resident(70%)
-0.05
0.03
0.05
.06
0.2
.4.6
.8
shar
e of
app
lican
ts
fall
Year 4
spring fall
Year 5
spring fall
Year 6
spring
Male(39%)
-0.06
0.01
0.08
.05
0.2
.4.6
.8
shar
e of
app
lican
ts
fall
Year 4
spring fall
Year 5
spring fall
Year 6
spring
Female(61%)
-0.01
0.08
0.08
.03
0.2
.4.6
.8
shar
e of
app
lican
ts
fall
Year 4
spring fall
Year 5
spring fall
Year 6
spring
No parent with a BA(66%)
-0.02
0.06
0.09
.05
0.2
.4.6
.8
shar
e of
app
lican
ts
fall
Year 4
spring fall
Year 5
spring fall
Year 6
spring
At least one parent with a BA(34%)
-0.04
0.02
0.05
.03
0.2
.4.6
.8
shar
e of
app
lican
ts
fall
Year 4
spring fall
Year 5
spring fall
Year 6
spring
Below-median ACT(35%)
0.01
0.09
0.13
.03
0.2
.4.6
.8
shar
e of
app
lican
ts
fall
Year 4
spring fall
Year 5
spring fall
Year 6
spring
Above-median ACT(65%)
-0.05
0.03
0.06
.05
0.2
.4.6
.8
shar
e of
app
lican
ts
fall
Year 4
spring fall
Year 5
spring fall
Year 6
spring
Notes: This figure plots mean degree completion rates by treatment status and subgroup for the four-year strata.Grey lines plot completion rates for control applicants; blue lines plot the sum of control means and strata-adjustedtreatment effects. Whiskers mark 95 percent confidence intervals. Samples differ by year. Percentages given arefor the full experimental sample (2012-2016 cohorts). The median ACT score for Nebraska test-takers is 21. Thedifferences in treatment effects in year six for each subgroup split are as follows (standard errors given in parentheses):Omaha residency: .080 (.006), gender: .001 (.005), ACT: .074 (.006), parent BA: .039 (.005).
10

Figure A5BA completion in UNO and non-UNO strata
A. BA completion in UNO strata(27%)
-0.01
0.07
0.13
0.2
.4.6
.8
shar
e of
app
lican
ts
fall
Year 4
spring fall
Year 5
spring fall
Year 6
spring
B. BA completion in non-UNO strata(73%)
-0.02
0.04
0.06
0.2
.4.6
.8
shar
e of
app
lican
ts
fall
Year 4
spring fall
Year 5
spring fall
Year 6
spring
Notes: This figure plots mean degree completion rates by UNO strata status. The “non-UNO strata” group includesall non-UNO four-year strata (UNK, UNL, and SC strata). Grey lines plot completion rates for control applicants;blue lines plot the sum of control means and strata-adjusted treatment effects. Whiskers mark 95 percent confidenceintervals. Samples differ by year.
11

Figure A6BA completion by predicted bachelor’s degree completion
A. Below-median Y0(48%)
-0.02
0.08
0.12
0.2
.4.6
.8
Shar
e of
app
lican
ts
fall
Year 4
spring fall
Year 5
spring fall
Year 6
spring
.1.3
.5.7
B. Above-median Y0(52%)
-0.07
0.030.04
0.2
.4.6
.8
Shar
e of
app
lican
ts
fall
Year 4
spring fall
Year 5
spring fall
Year 6
spring
.1.3
.5.7
Notes: This figure plots mean degree completion rates by treatment status and predicted bachelor’s degree completionfor the four-year strata. Y0 represents a student’s predicted propensity to complete a BA. Grey lines plot completionrates for control applicants; blue lines plot the sum of control means and strata-adjusted treatment effects. Whiskersmark 95 percent confidence intervals. Sample is restricted to the 2012-2014 cohorts. Predicted control group BAcompletion is estimated based on Abadie, Chingos and West (2018), using second-order strata and subgroup termsas in Figure VI in the main text.
12

Figure A7Visual IV estimates of the effect of award-induced
four-year credit completion on degrees in non-UNO strata
A. Bachelor’s degree
UNK
SC2yr
high GPA
non-white
low GPA
weighted slope: 0.62
-.1.2
redu
ced
form
eff
ect o
n B
A
0 .1
.25
no 2yr alternate
parent BAhigh ACT
white Pell elg.female
not Omaha
no parent BA
not Pell elg.male 2yr alternate
Omahalow ACT
.05 .10 .15 0first stage effect on initial four-year credits earned
UNL
redu
ced
form
eff
ect o
n B
A c
ompl
etio
n
B. Any degree
SC
2yr
high GPA
low ACT UNK
nonwhite2yr alternate
low GPA
weighted slope: 0.38
-.10
.1.2
redu
ced
form
eff
ect o
n an
y de
gree
.25.05 .10 .15first stage effect on initial four-year credits earned
0
no 2yr alternate
parent BA high ACT
whitenot Omaha
Pell elg.female
malenot Pell elg.no parent BA
OmahaUNL
C. Associate degree
UNK
SC
2yr
high GPA
low GPAOmaha
white
weighted slope: -0.24
-.10
redu
ced
form
eff
ect o
n A
A c
ompl
etio
n
.25
no 2yr alternateparent BA
high ACTPell elg.
femalenot Pell elg.
no parent BAmalewhite2yr alternate
high ACT
UNL
-.05
.05
.05 .10 .15 0
first stage effect on initial four-year credits earned
020
4060
2-year
alter
nativ
ede
nt
Pell el
igible
abov
e med
ian A
CT
abov
e med
ian G
PA
below
m
ACT
below
med
ian G
PAfem
alemale
no 2-
year
altern
ative
not O
maha r
eside
nt
not P
ell el
igible
paren
ts BA
paren
ts no B
Awhit
e
1030
50
Effects by subgroup Effects by strata Pooled effect
Notes: This figure plots reduced-form offer effects against first-stage offer effects, estimated in multivariable regressionsas detailed in Section B. The x-axis shows effects on credit-hours earned at any four-year institution in the first post-application year. Credit-hours are scaled by 24, the STBF standard for full-time enrollment. The y-axes shows effectson degree completion. Regression lines in each panel are constrained to run through the origin and estimated usingdata weighted by strata and subgroup sample sizes. The sample is restricted to non-UNO targeters in the 2012-2014cohorts. All models control for strata and subgroup main effects. Whiskers mark 95 percent confidence intervals.
13

Figure A8Visual IV estimates of the effect of award-induced
four-year credit completion on degrees using mutually exclusive subgroups
A. Bachelor’s degree
1 23
4
5
6
78
9
10 11
12
13
14
15
16
17
weighted slope: 0.61
redu
ced
form
eff
ect o
n B
As
-.3
-.2
-.1
0 .1
.2
.3
.4
-.05 .05 .15 .25first stage effect on initial four-year credits earned
redu
ced
form
eff
ect o
n B
A c
ompl
etio
n
B. Any degree
123
4
5
67
89
1011
12
13
14
15
16
17
weighted slope: 0.37
redu
ced
form
eff
ect o
n an
yDeg
s-.3
-.2
-.1
0
.1
.2
.3
.4
-.05 .05 .15 .25first stage effect on initial four-year credits earned
redu
ced
form
eff
ect o
n an
y de
gree
C. Associate degree
1
23
4
5
67
89 10
1112
13
14
15
1617
weighted slope: -0.28
-.2.2
redu
ced
form
eff
ect o
n A
As
-.1
0 .1
-.05 .05 .15 .25first stage effect on initial four-year credits earned
redu
ced
form
eff
ect o
n A
A c
ompl
etio
n
Notes: This figure plots reduced-form offer effects against first-stage offer effects for a set of mutually exclusivesubgroup splits. The x-axis shows effects on credit-hours earned at any four-year institution in the first post-applicationyear. Credit-hours are scaled by 24, the STBF standard for full-time enrollment. The y-axes shows effects on degreecompletion. Regression lines in each panel are constrained to run through the origin and estimated using data weightedby strata and subgroup sample sizes. The sample is restricted to the 2012-2014 cohorts. Whiskers mark 95 percentconfidence intervals. Point labels are given in Online Appendix Table A4.
14

Tab
leA1
Econom
etricresearch
ongran
taid
Fina
ncia
l Aid
Pro
gram
Typ
e of
Aid
Sour
ceA
vera
ge A
nnua
l G
rant
Am
ount
Stud
ent
Popu
latio
nT
ype
of S
choo
lSe
rvic
es
Incl
uded
?T
imin
g of
A
war
dLe
ngth
of
Aw
ard
Stud
yPu
blish
ed I
nSt
udy
Des
ign
Ang
rist,
Aut
or, H
udso
n, a
nd P
alla
is (2
016)
WP
NB
ERR
CT
Ang
rist,
Aut
or, a
nd P
alla
is (2
020)
WP
NB
ERR
CT
Ope
ning
Doo
rs L
ouisi
ana
Scho
lars
hip
Bot
hPr
ivat
e1,
488
Att
end
elig
ible
New
Orle
ans-
area
CC
, att
endi
ng s
choo
l at
leas
t ha
lf-tim
e, 1
8-34
yea
rs o
ld, p
aren
t of
at
leas
t on
e de
pend
ent,
fam
ily
inco
me
belo
w 2
00%
of t
he fe
dera
l pov
erty
line
.T
hree
LA
CC
sY
esIn
col
lege
Ren
ewab
le
Bar
row
, et
al. (
2014
)Jo
urna
lJo
urna
l of L
abor
Eco
nom
ics
RC
T
And
erso
n an
d G
oldr
ick-
Rab
(20
16)
Jour
nal
Econ
omic
s of
Edu
catio
n R
evie
wR
CT
Gol
dric
k-R
ab, K
elch
en, H
arris
, and
Ben
son
(201
6)Jo
urna
lA
mer
ican
Jou
rnal
of S
ocio
logy
RC
T
Ariz
ona
Inst
rum
ent
to M
easu
re S
tand
ards
Mer
itSt
ate
6,53
3B
or
bett
er in
HS
"cor
e" c
lass
es, 3
.5 G
PA o
r to
p 5%
of c
lass
, exc
eed
stan
dard
s on
sta
ndar
dize
d A
IMS
test
AZ
4yr
(pub
lic)
No
Yea
rlyFo
ur y
ears
Upt
on (
2016
)Jo
urna
lJo
urna
l of L
abor
Res
earc
hD
D
Kan
e (2
003)
WP
NB
ERR
DB
ettin
ger,
Gur
antz
, Kaw
ano,
and
Sac
erdo
te (
2019
)Jo
urna
lA
EJ: E
cono
mic
Pol
icy
RD
Car
olin
a C
oven
ant
Nee
dIn
stitu
tion
2,40
0In
com
ing
fresh
man
/tra
nsfe
r st
uden
ts a
t U
NC
- C
hape
l Hill
, firs
t-tim
e B
A, f
ull-t
ime
stud
ent,
AG
I <
= 2
00%
fed
pove
rty
line
UN
C -
Cha
pel H
illSo
me
year
sH
S9
sem
este
rsC
lotfe
lter,
Hem
elt,
and
Ladd
(20
16)
Jour
nal
Econ
omic
Inq
uiry
DD
D.C
. Tui
tion
Ass
istan
ce G
rant
Pro
gram
Oth
erSt
ate
516
- 12
88D
.C. m
etro
-are
a re
siden
ts a
tten
ding
col
lege
at
leas
t ha
lf-tim
eA
nyN
oY
early
Ren
ewab
leK
ane
(200
7)Jo
urna
lT
he J
ourn
al o
f Hum
an R
esou
rces
DD
Del
l Sch
olar
sB
oth
Priv
ate
3,24
0Pa
rtic
ipat
ed in
an
affil
iate
d co
llege
rea
dine
ss p
rogr
am, H
S G
PA o
f 2.
4 or
hig
her,
Pell-
elig
ible
Four
-yea
rY
esH
S4
year
sPa
ge, K
ehoe
, Cas
tlem
an, a
nd S
ahad
ewo
(201
7)Jo
urna
lT
he J
ourn
al o
f Hum
an R
esou
rces
RD
Zhan
g, e
t al
(20
16)
Jour
nal
The
Jou
rnal
of H
ighe
r Ed
ucat
ion
RD
Cas
tlem
an (
2014
)W
PEd
Pol
icy
Wor
ksD
DC
astle
man
and
Lon
g (2
016)
Jour
nal
Jour
nal o
f Lab
or E
cono
mic
sR
DC
astle
man
, Lon
g, a
nd M
abel
(20
18)
Jour
nal
Jour
nal o
f Pol
icy
Ana
lysis
and
Man
agem
ent
RD
Gat
es M
illen
ium
Sch
olar
sB
oth
Priv
ate
8,00
0Pe
ll el
igib
le, 3
.33
min
imum
HS
GPA
, eva
luat
ed o
n ot
her
crite
riaA
nyN
oH
S5
year
sD
esJa
rdin
s, et
al.
(201
0)Jo
urna
lEd
ucat
iona
l Eva
luat
ion
and
Polic
y A
naly
sisR
DD
ynar
ski (
2000
)Jo
urna
lN
atio
nal T
ax J
ourn
alC
ornw
ell,
Mus
tard
, and
Srid
har
(200
6)Jo
urna
lJo
urna
l of L
abor
Eco
nom
ics
Indi
ana
Tw
enty
-Firs
t C
entu
ry S
chol
ars
Nee
dSt
ate
2,37
2R
esid
ents
of I
ndia
na, e
ligib
le fo
r fre
e an
d re
duce
d pr
ice
lunc
h as
of
mid
dle
scho
ol, s
ign
the
TFC
S pl
edge
, mai
ntai
n C
avg
in H
S, a
pply
to
at
leas
t on
e po
stse
cond
ary
inst
itutio
n
IN p
ublic
s (o
r $
equi
v. a
t pr
ivat
es)
Yes
HS
Ren
ewab
leT
outk
oush
ian,
et
al. (
2015
)Jo
urna
lT
he R
evie
w o
f Hig
her
Educ
atio
nIV
And
rew
s, D
esJa
rdin
s, an
d R
anch
hod
(201
0)Jo
urna
lEc
onom
ics
of E
duca
tion
Rev
iew
DD
Bar
tik, H
ersh
bein
, and
Lar
chow
ska
(201
9)Jo
urna
lT
he J
ourn
al o
f Hum
an R
esou
rces
DD
Long
horn
Opp
ortu
nity
Sch
olar
ship
and
Cen
tury
Sch
olar
sB
oth
Inst
itutio
n4,
000
Att
end
elig
ible
TX
hig
h sc
hool
, gai
n ad
mitt
ance
to
UT
Aus
tin o
r T
exas
A&
M u
nive
rsiti
esU
T A
ustin
or
Tex
as
A &
MY
esH
SR
enew
able
And
rew
s, Im
berm
an, a
nd L
oven
heim
(20
20)
WP
NB
ERD
D
Mas
sach
uset
ts A
dam
s Sc
hola
rshi
pM
erit
Stat
e1,
714
Adv
ance
d sc
ore
on o
ne s
ectio
n of
MC
AS
and
prof
icie
nt/a
dvan
ced
on
othe
r po
rtio
n, a
nd t
op 2
5% s
core
in d
istric
t; en
rolle
d in
and
gra
duat
e fro
m M
assa
chus
etts
pub
lic h
igh
scho
olM
A p
ublic
No
HS
8 se
mes
ters
Coh
odes
and
Goo
dman
(20
14)
Jour
nal
AEJ
: App
lied
RD
New
Mex
ico
Legi
slativ
e Lo
tter
y Sc
hola
rshi
pM
erit
Stat
e6,
950
NM
res
iden
t, 2.
5 G
PA a
fter
one
full-
time
(12
cred
its)
sem
este
r at
2yr
or
4yr
NM
pub
lic c
olle
geN
M p
ublic
(2
or 4
yr)
No
Afte
r 1s
t se
mes
ter
8 se
mes
ters
Erw
in a
nd B
inde
r (2
019)
Jour
nal
Educ
atio
n Fi
nanc
e an
d Po
licy
DD
Ohi
o C
olle
ge O
ppor
tuni
ty G
rant
Nee
dSt
ate
860
EFC
bel
ow $
2,19
0, O
H r
esid
ent
OH
pub
lic (
2 or
4yr
)N
oH
SR
enew
able
B
ettin
ger
(201
5)Jo
urna
lEd
ucat
iona
l Eva
luat
ion
and
Polic
y A
naly
sisD
D
Post
-9/1
1 G
I B
illO
ther
Fede
ral
5,00
0M
ilita
ry s
ervi
ce m
embe
rs a
ges
22 t
o 39
who
had
sep
arat
ed w
ithin
10
year
s of
initi
al e
ntry
into
the
mili
tary
Any
No
Yea
rly13
mon
ths
Bar
r (2
019)
Jour
nal
Jour
nal o
f Lab
or E
cono
mic
sD
D
Wel
ch (
2014
)Jo
urna
lEc
onom
ics
of E
duca
tion
Rev
iew
RD
Car
ruth
ers
and
Oze
k (2
016)
Jour
nal
Econ
omic
s of
Edu
catio
n R
evie
wR
D
Ten
ness
ee S
tude
nt A
ssist
ant
Aw
ards
Nee
dSt
ate
1,80
0T
N r
esid
ents
, at
leas
t ha
lf tim
e, fi
rst
time
colle
ge, l
ess
than
2K
EFC
TN
pub
lic (
2 or
4yr
)N
oY
early
Four
yea
rsD
oyle
, Lee
, and
Ngu
yen
(201
7)Jo
urna
lR
evie
w o
f Edu
catio
nal R
esea
rch
RD
Scot
t-C
layt
on (
2011
)Jo
urna
lEd
ucat
iona
l Eva
luat
ion
and
Polic
y A
naly
sisR
D
Scot
t-C
layt
on a
nd Z
afar
(20
16)
Jour
nal
Jour
nal o
f Pub
lic E
cono
mic
sR
D
2,10
0B
egin
ning
Pos
tsec
onda
ry S
tude
nts
Long
itudi
nal S
tudy
(B
PS)
coho
rt
base
d on
the
Nat
iona
l Pos
tsec
onda
ry S
tude
nt A
id S
tudy
(N
PSA
S)
1996
; dep
ende
nts
enro
lled
at a
ny 4
yr in
the
fall
of 1
995
4-ye
arA
lon
(201
1)Jo
urna
lSo
cial
Sci
ence
Qua
rter
lyIV
709
Dep
ende
nt c
olle
ge s
tude
nts
enro
lled
in a
pub
lic 4
yr in
TX
in 2
008
- 20
11 a
cade
mic
yea
rs; f
amily
AG
I w
ithin
$12
K o
f the
aut
omat
ic z
ero
EFC
inco
me
elig
ibili
ty t
hres
hold
.T
X 4
yrD
enni
ng, M
arx,
and
Tur
ner
(201
7)Jo
urna
lA
EJ: A
pplie
dR
D
1,09
6N
PSA
S un
derg
radu
ate
stud
ents
who
file
d fo
r fin
anci
al a
id a
nd a
re
with
in $
2K o
f EFC
thr
esho
ld fo
r Pe
ll el
igib
ility
4-ye
arEv
ans
and
Ngu
yen
(201
8)Jo
urna
lEc
onom
ics
of E
duca
tion
Rev
iew
RD
3,32
5Fi
rst
time,
deg
ree
seek
ing
"non
-tra
ditio
nal"
stu
dent
s st
artin
g co
llege
at
a t
wo-
year
in 2
003-
2004
2-ye
arJ.
Che
n an
d H
ossle
r (2
017)
Jour
nal
Res
earc
h in
Hig
her
Educ
atio
nPS
M
560
Firs
t-tim
e C
C e
nrol
lees
, ent
erin
g in
200
8-20
10; U
S ci
tizen
s w
ho fi
led
a FA
FSA
and
hav
e EF
C w
ithin
$2K
of t
he P
ell e
ligib
ility
thr
esho
ld2-
year
(in
an
anoy
mou
s st
ate)
Park
and
Sco
tt-C
layt
on (
2018
)Jo
urna
lEd
ucat
iona
l Eva
luat
ion
and
Polic
y A
naly
sisR
D
389
Firs
t-tim
e, d
egre
e se
ekin
g fir
st-y
ear
stud
ents
ent
erin
g C
UN
Y s
yste
m
in fa
ll 20
04 -
fall
2010
; US
citiz
ens
who
com
plet
ed t
he F
AFS
A a
nd
have
EFC
with
in $
4K o
f the
Pel
l elig
ibili
ty t
hres
hold
CU
NY
(2y
r)M
arx
and
Tur
ner
(201
8)Jo
urna
lA
EJ: A
pplie
dR
D
Yea
r-R
ound
Pel
l Gra
ntN
eed
Fede
ral
312
Firs
t-tim
e, d
egre
e se
ekin
g , P
ell-e
ligib
le s
tude
nts
who
ent
ered
the
CC
sy
stem
in a
n an
onym
ous
stat
e be
twee
n fa
ll 20
06 a
nd fa
ll 20
092-
year
(in
an
anon
ymou
s st
ate)
No
Yea
rly12
sem
este
rsLi
u (2
018)
Jour
nal
Educ
atio
n Fi
nanc
e an
d Po
licy
DD
Pan
el A
: R
CT S
tudi
es
Pan
el B
: Q
uasi-E
xper
imen
tal St
ate
Aid
Stu
dies
Pan
el C
: Pell G
rant
Stu
dies
Pell
Gra
ntN
eed
Fede
ral
No
Yea
rly12
sem
este
rs
Qua
lific
atio
ns t
o be
incl
uded
:nam
ed s
chol
arsh
ip p
rogr
am a
t th
e st
ate,
inst
itutio
n, o
r pr
ivat
e le
vel (
for
exam
ple,
pap
ers
that
util
ize
cuto
ffs in
a s
peci
fic s
choo
l's m
erit
or n
eed-
base
d ai
d ca
lcul
atio
n ar
e no
t in
clud
ed: s
ee S
inge
ll an
d St
one
(200
2) fo
r an
exa
mpl
e); u
ses
only
the
mos
t re
cent
stu
dy fr
om a
sin
gle
orga
niza
tion
or s
ub-s
et o
f aut
hors
if u
sing
sam
e ou
tcom
e m
easu
res
(for
eaxm
ple
Cha
and
Pat
el (
2014
) vs
May
er, P
atel
, and
Gut
tiere
z (2
016)
).
5 ye
ars
(3 fo
r 2y
r)
Wes
t V
irgin
ia P
rom
ise
CA
4yr
(pu
blic
or
priv
ate)
No
Yea
rlyR
enew
able
EFC
und
er $
1,59
0, F
L re
siden
tFL
pub
lics
(2 o
r 4y
r)N
oY
early
Ren
ewab
le86
4
WV
pub
lic (
2 or
4yr
)
Wisc
onsin
Sch
olar
s G
rant
Nee
dPr
ivat
e
CA
res
iden
t, in
com
e an
d G
PA li
mits
var
y by
yea
r; 53
,100
- 5
9,00
0 fo
r a
fam
ily o
f 3; 2
.95
- 3.
15 G
PAC
al G
rant
Bot
hSt
ate
Ten
ness
ee H
OPE
Mer
itSt
ate
Mer
itSt
ate
Flor
ida
Stud
ent
Ass
istan
ce G
rant
Nee
dSt
ate
TN
res
iden
ts, e
nrol
l in
elig
ible
col
lege
with
in 1
6 m
onth
s of
HS
grad
uatio
n, 2
1+ A
CT
OR
HS
GPA
abo
ve 3
.0.
3,50
0
HS
NE
publ
ic (
2 or
4yr
)O
ne a
rm7,
807
NE
resid
ent,
belo
w 1
0K fa
mily
EFC
, 2.5
HS
GPA
, eva
luat
ed o
n ot
her
crite
ria
Susa
n T
hom
pson
Buf
fett
Fou
ndat
ion
(ST
BF)
Sch
olar
ship
Bot
hPr
ivat
e
TN
pub
lic 2
yr o
r 4y
r; T
N p
rivat
e no
n-pr
ofit
No
HS
Five
yea
rs2,
500
5 ye
ars
In c
olle
geN
oW
I pu
blic
(2
or 4
yr)
Pell-
elig
ible
, gra
duat
ed fr
om W
I pu
blic
hig
h sc
hool
in la
st 3
yea
rs,
enro
lled
at W
I pu
blic
2yr
, ful
l-tim
e st
atus
(12
cre
dit
hour
s)
No
HS
4 ye
ars
WV
res
iden
t, en
rolle
d fu
ll-tim
e, 3
.0 H
S G
PA, 2
1+ o
n A
CT
or
1000
+ o
n SA
T, n
o fin
anci
al e
ligib
ility
req
s.2,
500
MI
publ
ics
(or
$ eq
uiv.
at
priv
ates
)N
oH
S13
0 cr
edits
Geo
rgia
HO
PEM
erit
Stat
e1,
834
Ren
ewab
le
Kal
amaz
oo P
rom
iseO
ther
Priv
ate
2,93
7G
radu
ate
from
Kal
amaz
oo p
ublic
sch
ool s
yste
m, r
esid
e in
the
di
stric
t, ha
ve b
een
cont
inuo
usly
enr
olle
d sin
ce t
he b
egin
ning
of h
igh
scho
ol
Ren
ewab
leFl
orid
a B
right
Fut
ures
Sch
olar
ship
Mos
t G
A c
olle
ges
and
univ
ersit
ies
Gra
duat
e fro
m G
A H
S af
ter
1993
with
a B
ave
rage
and
be
a G
A
resid
ent
No
Yea
rly
Mer
itSt
ate
1,70
0-2,
300
Com
plet
ed 1
5 co
re H
S cr
edits
, 3.0
HS
GPA
, 97
0 ST
A o
r 20
AC
T
(FM
S aw
ard
) /
3.5
GPA
, 127
0 ST
A o
r 28
AC
T (
FAS
awar
d)FL
pub
lics
(or
$ eq
uiva
lent
at
No
HS
DD
DD
Notes:
This
table
reviewsother
grantaid
programsthathavebeenthesubject
ofacadem
icstudies.
Qualificationsto
beincluded
inthis
table
include:
named
scholarship
program
atthestate,institution,orprivate
level
(forexample,papersthatutilize
cutoffsin
asp
ecificschool’smerit
orneed-basedaid
calculationare
notincluded
:seeSingellandStone(2016)foranexample),
focu
sedontraditionalstuden
tssimilarto
theSTBF
sample
(forexample,papersfocu
sedonparents
incollegesuch
asBarrow
etal.(2014)are
notincluded
),andpublished
inapeer-reviewed
journalorworking-paper
series
(technicalreports,
althoughvaluable,
are
notincluded
).Finally,
thetable
usesonly
themost
recentstudyfrom
asingle
organizationorsub-set
ofauthors
ifusingsameoutcomemeasures.
15
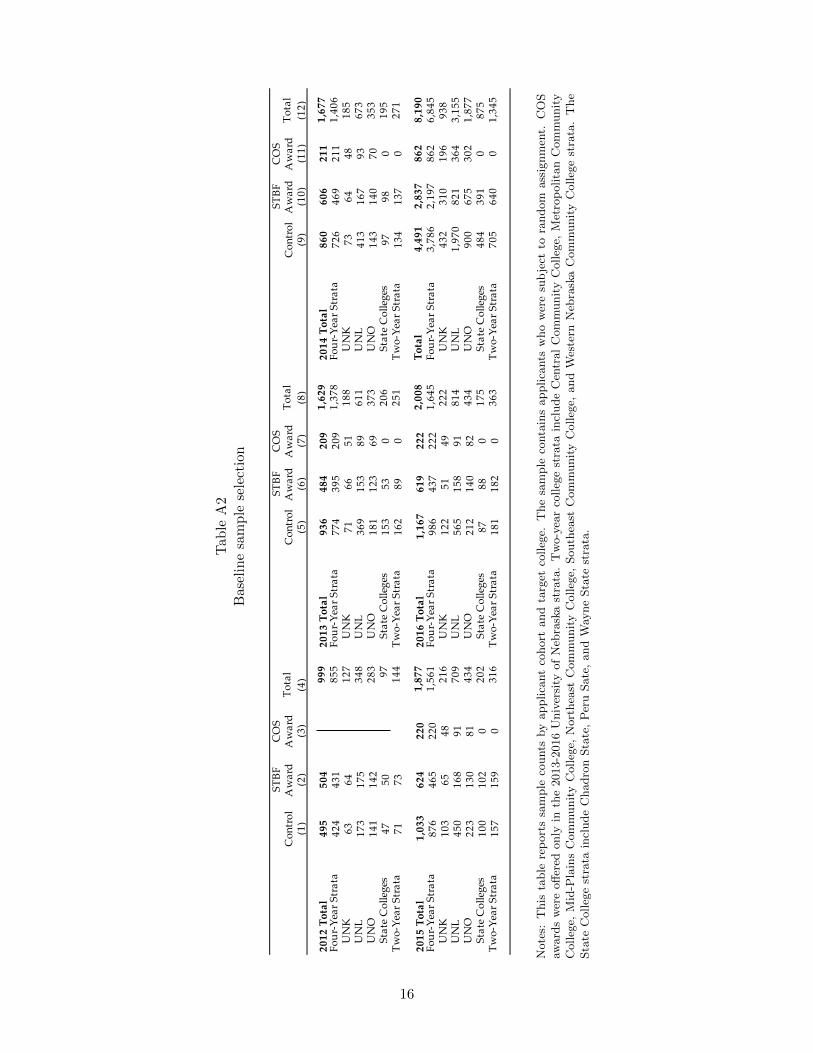
Tab
leA2
Baselinesample
selection
STBF
CO
SST
BFC
OS
STBF
CO
SC
ontr
olA
war
dA
war
dTo
tal
Con
trol
Aw
ard
Aw
ard
Tota
lC
ontr
olA
war
dA
war
dTo
tal
(1)
(2)
(3)
(4)
(5)
(6)
(7)
(8)
(9)
(10)
(11)
(12)
2012
Tot
al49
550
499
920
13 T
otal
936
484
209
1,62
920
14 T
otal
860
606
211
1,67
7Fo
ur-Y
ear S
trat
a42
443
185
5Fo
ur-Y
ear S
trat
a77
439
520
91,
378
Four
-Yea
r Str
ata
726
469
211
1,40
6U
NK
6364
127
UN
K71
6651
188
UN
K73
6448
185
UN
L17
317
534
8U
NL
369
153
8961
1U
NL
413
167
9367
3U
NO
141
142
283
UN
O18
112
369
373
UN
O14
314
070
353
Stat
e C
olle
ges
4750
97St
ate
Col
lege
s15
353
020
6St
ate
Col
lege
s97
980
195
Two-
Year
Str
ata
7173
144
Two-
Year
Str
ata
162
890
251
Two-
Year
Str
ata
134
137
027
1
2015
Tot
al1,
033
624
220
1,87
720
16 T
otal
1,16
761
922
22,
008
Tota
l4,
491
2,83
786
28,
190
Four
-Yea
r Str
ata
876
465
220
1,56
1Fo
ur-Y
ear S
trat
a98
643
722
21,
645
Four
-Yea
r Str
ata
3,78
62,
197
862
6,84
5U
NK
103
6548
216
UN
K12
251
4922
2U
NK
432
310
196
938
UN
L45
016
891
709
UN
L56
515
891
814
UN
L1,
970
821
364
3,15
5U
NO
223
130
8143
4U
NO
212
140
8243
4U
NO
900
675
302
1,87
7St
ate
Col
lege
s10
010
20
202
Stat
e C
olle
ges
8788
017
5St
ate
Col
lege
s48
439
10
875
Two-
Year
Str
ata
157
159
031
6Tw
o-Ye
ar S
trat
a18
118
20
363
Two-
Year
Str
ata
705
640
01,
345
Notes:
This
table
reportssample
counts
byapplicantcohort
andtarget
college.
Thesample
containsapplicants
whoweresubject
torandom
assignment.
COS
awardswereoffered
only
inthe2013-2016University
ofNeb
raskastrata.Two-yearcollegestrata
includeCentralCommunityCollege,
MetropolitanCommunity
College,
Mid-P
lainsCommunityCollege,
Northeast
CommunityCollege,
Southeast
CommunityCollege,
andWestern
Neb
raskaCommunityCollegestrata.The
State
Collegestrata
includeChadronState,PeruSate,andWay
neState
strata.
16

Tab
leA3
Descriptive
statistics
bytarget
college
All
All
All
All
All
(1)
(3)
(5)
(7)
(9)
Fem
ale
.55
.037
.64
.007
.71
-.014
.65
-.003
.61
.027
(.0
21)
(.0
25)
(.0
35)
(.0
33)
(.0
26)
Whi
te.6
7-.0
05.4
7-.0
14.7
7-.0
04.8
3 .0
24.6
9 .0
13 (
.020
) (
.025
) (
.032
) (
.025
) (
.024
)B
lack
.07
.004
.09
.008
.02
-.021
.03
.002
.02
.002
(.0
11)
(.0
15)
(.0
08)
(.0
11)
(.0
08)
His
pani
c.1
6 .0
05.3
0 .0
32.1
9 .0
33.1
0-.0
13.2
0-.0
08 (
.015
) (
.023
) (
.030
) (
.020
) (
.022
)O
ther
rac
e.0
5-.0
05.0
9-.0
10.0
1-.0
01.0
1-.0
05.0
6-.0
11 (
.009
) (
.014
) (
.007
) (
.003
) (
.012
)F
amily
inco
me
($)
49,
374
-4,7
85 4
2,59
773
6 5
0,14
1-6
26 4
8,33
52,
179
42,
444
570
[29,
058]
(3,0
91)
[27,
886]
(1,
359)
[39,
452]
(3,1
25)
[33,
960]
(2,
185)
[33,
379]
(1,
736)
EF
C (
$) 3
,051
2 2
,389
-148
3,2
12-1
57 3
,167
-59
2,5
94-1
59 [3
,115
](1
35)
[2,9
14]
(150
)[3
,126
](2
38)
[3,1
95]
(216
)[3
,096
](1
62)
At
leas
t on
e pa
rent
.74
.011
.57
-.014
.73
-.028
.75
.029
.59
.046
atte
nded
col
lege
(.0
18)
(.0
25)
(.0
34)
(.0
30)
(.0
26)
At
leas
t on
e pa
rent
ear
ned
.40
-.010
.25
.003
.33
-.012
.36
-.009
.18
.029
a ba
chel
or's
deg
ree
(.0
21)
(.0
22)
(.0
35)
(.0
33)
(.0
21)
Too
k A
CT
.98
-.004
.95
.001
.98
-.007
.98
-.000
.80
.011
(.0
07)
(.0
11)
(.0
12)
(.0
09)
(.0
22)
Com
posi
te A
CT
sco
re23
.8-.2
321
.1-.2
822
.2-.5
521
.7-.0
918
.9 .4
2 [4
.3]
(.1
8) [4
.6]
(.2
3) [3
.9]
(.2
8) [3
.8]
(.2
7) [3
.4]
(.1
9)H
igh
scho
ol G
PA
3.56
-.017
3.34
-.006
3.52
.041
3.48
-.006
3.26
.053
[.38
] (
.016
) [.
41]
(.0
21)
[.41
] (
.030
) [.
41]
(.0
29)
[.41
] (
.022
)F
-sta
tist
ic1.
10.9
71.
64.6
11.
19p-
valu
e.3
5.4
8.0
6.8
5.2
8#
of a
pplic
ants
2,79
12,
791
1,57
51,
575
742
742
875
875
1,34
51,
345
UN
LU
NO
UN
KSt
ate
Col
lege
sT
wo-
Yea
r St
rata
-con
trol
-con
trol
-con
trol
-con
trol
-con
trol
Tre
atm
ent
Tre
atm
ent
Tre
atm
ent
Tre
atm
ent
Tre
atm
ent
(2)
(4)
(6)
(8)
(10)
Fou
r-Y
ear
Stra
ta
Notes:
This
table
reportsdescriptivestatisticsbytarget
collegeforthe2012-2016cohorts.
See
Table
Inotesforvariable
defi
nitionsanddescriptions.
17

Table A4Point labels for visual IV estimates using mutually exclusive subgroups
Label Gender Race ACT Score Residency1 Female White High Non-Omaha2 Female White High Omaha3 Female White Low Non-Omaha4 Female White Low Omaha5 Female Nonwhite High Non-Omaha6 Female Nonwhite High Omaha7 Female Nonwhite Low Non-Omaha8 Female Nonwhite Low Omaha9 Male White High Non-Omaha10 Male White High Omaha11 Male White Low Non-Omaha12 Male White Low Omaha13 Male Nonwhite High Non-Omaha14 Male Nonwhite High Omaha15 Male Nonwhite Low Non-Omaha16 Male Nonwhite Low Omaha
Notes: This table labels the points plotted in Online Appendix Figure A8.
18

Table A5IV estimates of the effect of initial credits on degrees for mutually exclusive subgroups
(1) (2) (3)
Four-year credits earned 0.50 0.61 0.61(0.01) (0.10) (0.09)
First stage
Any award 0.12(0.01)
F-stat 6.49
Over-identification test -- 15.36Degrees of freedom 15p-value 0.43
Four-year credits earned 0.27 0.35 0.40(0.01) (0.10) (0.10)
Over-identification test -- 18.02
Degrees of freedom 15p-value 0.26
Four-year credits earned -0.34 -0.30 -0.28(0.01) (0.07) (0.06)
Over-identification test -- 11.28
Degrees of freedom 15p-value 0.73
N 4,305 4,305
B. Any Degree
C. Associate Degree
Notes: This table reports on the effect of enrolling at a four-year college in year one on BA degree completion. Students are considered enrolled if they have full-time enrollment status for at least one term. Sample is restricted to the 2012 cohort. Column (1) uses a single any-award instrument. Estimates in columns (2)-(4) come from over-identified IV models with instruments constructed by interacting an award indicator with the dummies given in the column heading. All regressions control for strata. Regressions in columns (3) and (4) additionally control for subgroup dummies. Potential outcomes for compliers are computed using the procedure described in Abadie (1993).
2SLS
OLSJust-
identified Disjoint VIV
A. Bachelor's Degree
Notes: This table reports 2SLS estimates and over-identification test statistics for models where the outcome is degreecompletion and the endogenous variable is initial four-year engagement as defined in Online Appendix Figure A8.The just-identified estimates in column 2 use a single offer dummy as instrument. Estimates in column 3 are fromover-identified models with instrument sets constructed by interacting award offers with sets of dummies labeledin Online Appendix Table A4. The sample is restricted to the 2012-14 cohorts. All models control for strata andsubgroup main effects.
19

B Estimates in a Sample of Balanced Cohorts
20

Figure B1Enrollment effects in the balanced sample four-year strata
0.2
.4.6
.81
0.2
.4.6
.81
shar
e of
app
lican
ts
fall
Year 1
spring fall
Year 2
spring fall
Year 3
spring fall
Year 4
spring fall
Year 5
spring fall
Year 6
spring
.03.06
.08.09
.10
-.02
.96
.99
.88
.95
.83
.91
.79
.88
.43
.60
.18
.25.34
.28
.56
.60
.58
.67
0.1
.2.3
.4.5
.6.7
.8.9
1
0.1
.2.3
.4.5
.6.7
.8.9
1
shar
e of
app
lican
ts
fall
Year 1
spring fall
Year 2
spring fall
Year 3
spring fall
Year 4
spring fall
Year 5
spring fall
Year 6
spring fall
Year 7
spring
years since high school graduation
Treatment Control
Notes: This figure plots the effect of an award on enrollment rates for students in the four year strata without a BA.Sample is restricted to the 2012-2014 cohorts. Regressions control for strata dummies. Whiskers mark 95 percentconfidence intervals.
21

Figure B2Enrollment effects in the balanced sample two-year strata
0.2
.4.6
.81
0.2
.4.6
.81
shar
e of
app
lican
ts
fall
Year 1
spring fall
Year 2
spring fall
Year 3
spring fall
Year 4
spring fall
Year 5
spring fall
Year 6
spring
.03
.06
.12
.11
.01
.02
.96
.99
.88
.95
.83
.91
.79
.88
.43
.60
.18
.25.34
.28
.56
.60
.58
.67
0.1
.2.3
.4.5
.6.7
.8.9
1
0.1
.2.3
.4.5
.6.7
.8.9
1
shar
e of
app
lican
ts
fall
Year 1
spring fall
Year 2
spring fall
Year 3
spring fall
Year 4
spring fall
Year 5
spring fall
Year 6
spring fall
Year 7
spring
years since high school graduation
Treatment Control
Notes: This figure plots the effect of an award on enrollment rates for students in two-year strata without a BA.The sample is restricted to the 2012-2014 cohorts. Regressions control for strata dummies. Whiskers mark 95percent confidence intervals.
22

Figure B3BA effects by target campus in a balanced sample
-.2-.1
0.1
.2
treat
men
t eff
ect
Year 4 Year 5 Year 6
.13
.09.06
.03
.08
-.03
.05
-.06
.05
-.06
.03
-.03
-.2-.1
0.1
.2Tr
eatm
ent e
ffec
t
Year 4 Year 5 Year 6
.17
.04
.09
.04
-.02
-.05
.05.04
-.05-.03
.03
.05
University of Nebraska Lincoln (UNL)
StateColleges
University of Nebraska Omaha (UNO)
University of Nebraska Kearney (UNK)
UNL SCUNO UNK
FIGURE 3 — Degree effects by target campus. Notes: This figure plots the effect of an STBF award on degreecompletion for applicants targeting four-year campuses. Whiskers mark 95 percent confidence intervals. Samplediffers by year.
10
Notes: This figure plots the effect of an STBF award on degree completion for applicants targeting four-year campuses.Sample is restricted to the 2012-2014 cohorts. Whiskers mark 95 percent confidence intervals.
23
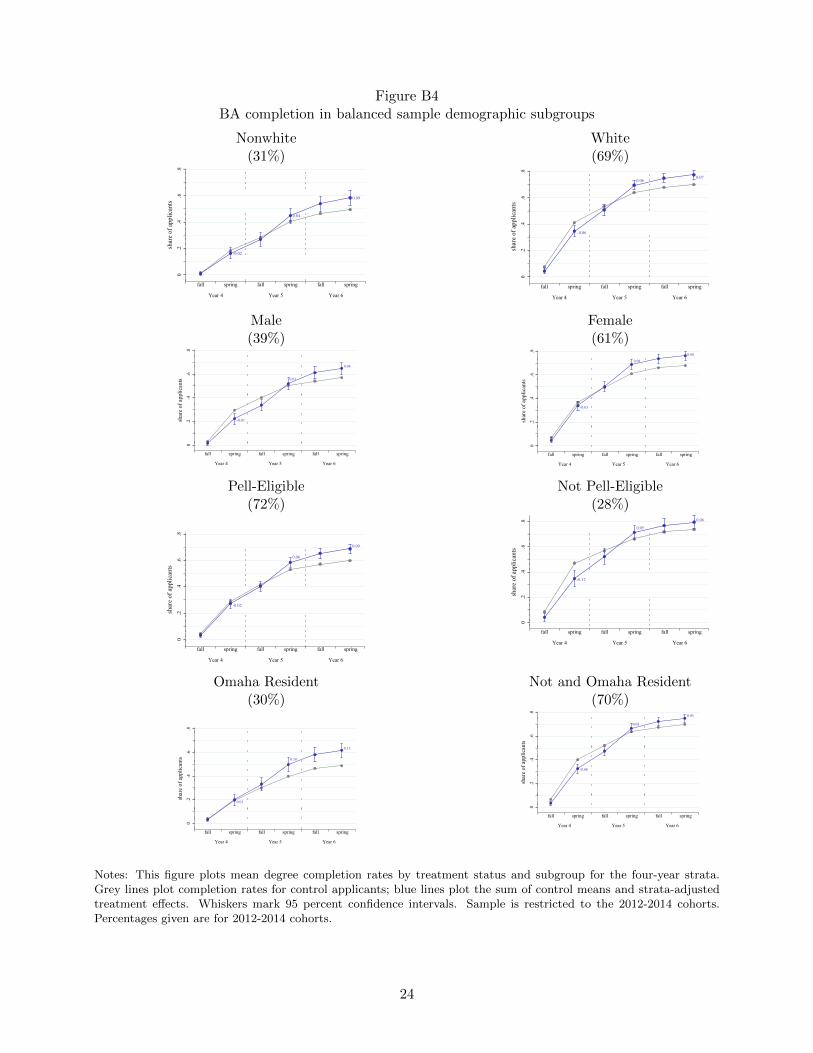
Figure B4BA completion in balanced sample demographic subgroups
Nonwhite(31%)
-0.02
0.04
0.09
.05
0.2
.4.6
.8
shar
e of
app
lican
ts
fall
Year 4
spring fall
Year 5
spring fall
Year 6
spring
White(69%)
-0.06
0.060.07
.05
0.2
.4.6
.8
shar
e of
app
lican
ts
fall
Year 4
spring fall
Year 5
spring fall
Year 6
spring
Male(39%)
-0.07
0.01
0.08
.02
0.2
.4.6
.8
shar
e of
app
lican
ts
fall
Year 4
spring fall
Year 5
spring fall
Year 6
spring
Female(61%)
-0.03
0.08
0.08
.01
0.2
.4.6
.8
shar
e of
app
lican
ts
fall
Year 4
spring fall
Year 5
spring fall
Year 6
spring
Pell-Eligible(72%)
-0.02
0.06
0.09
.02
0.2
.4.6
.8
shar
e of
app
lican
ts
fall
Year 4
spring fall
Year 5
spring fall
Year 6
spring
Not Pell-Eligible(28%)
-0.12
0.05
0.06
.03
0.2
.4.6
.8
shar
e of
app
lican
ts
fall
Year 4
spring fall
Year 5
spring fall
Year 6
spring
Omaha Resident(30%)
0.01
0.10
0.13
.01
0.2
.4.6
.8
shar
e of
app
lican
ts
fall
Year 4
spring fall
Year 5
spring fall
Year 6
spring
Not and Omaha Resident(70%)
-0.08
0.03
0.05
.01
0.2
.4.6
.8
shar
e of
app
lican
ts
fall
Year 4
spring fall
Year 5
spring fall
Year 6
spring
Notes: This figure plots mean degree completion rates by treatment status and subgroup for the four-year strata.Grey lines plot completion rates for control applicants; blue lines plot the sum of control means and strata-adjustedtreatment effects. Whiskers mark 95 percent confidence intervals. Sample is restricted to the 2012-2014 cohorts.Percentages given are for 2012-2014 cohorts.
24

Figure B5BA completion in balanced college readiness subgroups
No parent with a BA(64%)
-0.04
0.06
0.09
.01
0.2
.4.6
.8
shar
e of
app
lican
ts
fall
Year 4
spring fall
Year 5
spring fall
Year 6
spring
At least one parent with a BA(35%)
-0.07
0.03
0.05
.03
0.2
.4.6
.8
shar
e of
app
lican
ts
fall
Year 4
spring fall
Year 5
spring fall
Year 6
spring
Below-median GPA(45%)
-0.02
0.08
0.12
.02
0.2
.4.6
.8
shar
e of
app
lican
ts
fall
Year 4
spring fall
Year 5
spring fall
Year 6
spring
Above-median GPA(55%)
-0.07
0.030.04
.01
0.2
.4.6
.8
shar
e of
app
lican
ts
fall
Year 4
spring fall
Year 5
spring fall
Year 6
spring
Two-year college alternate(30%)
-0.02
0.10
0.13
.05
0.2
.4.6
.8
shar
e of
app
lican
ts
fall
Year 4
spring fall
Year 5
spring fall
Year 6
spring
No two-year college alternate(70%)
-0.06
0.04
0.06
.02
0.2
.4.6
.8
shar
e of
app
lican
ts
fall
Year 4
spring fall
Year 5
spring fall
Year 6
spring
Below-median ACT(34%)
-0.01
0.10
0.13
.01
0.2
.4.6
.8
shar
e of
app
lican
ts
fall
Year 4
spring fall
Year 5
spring fall
Year 6
spring
Above-median ACT(66%)
-0.07
0.030.06
.02
0.2
.4.6
.8
shar
e of
app
lican
ts
fall
Year 4
spring fall
Year 5
spring fall
Year 6
spring
Notes: This figure plots mean degree completion rates by treatment status and subgroup for the four-year strata.Grey lines plot completion rates for control applicants; blue lines plot the sum of control means and strata-adjustedtreatment effects. Whiskers mark 95 percent confidence intervals. Sample is restricted to the 2012-2014 cohorts.Percentages given are for 2012-2014 cohorts. The median high school GPA for the lottery sample is 3.49. STBFaward applicants were asked to indicate their first choice (“target school”) and to rank alternatives. “Two-yearcollege alternate” indicates that a student ranked a two-year college among their alternative target schools on theSTBF application. The median ACT score for Nebraska test-takers is 21.
25

C Earnings Imputation
C.1 Details
This section describes the lifetime earnings imputation sketched in Section B in more detail.
The lifetime earnings imputation proceeds in three steps. First, we estimate lifetime earnings
profiles of Nebraska-born men and women aged 18 to 65 in ACS data from 2008-2019. The sample
omits full-time students, those without a high school degree, those who hold a GED, and those with
a degree higher than a BA. The sample also excludes self-employed respondents but includes those
who are unemployed or not in the labor force. Earnings profiles are estimated separately in four
subgroups: white men, white women, nonwhite men, and nonwhite women.
The earnings model is fit using Poisson regression. The Poisson specification stems from the
role that zeroes play in the earnings regressions. Models used for imputation can be written as:
log (E (wi|si)) = α+ β1si + β2ei + β3e2i + β4e
3i + β5e
4i (1)
where wi is annual earnings from the ACS, si is a vector of dummies indicating the highest level of
schooling completed (with high school graduates as the omitted group) and ei is years of potential
experience.
The dummies included in si are as follows:
• NDi = college enrollment but no degree completed
• AAi = associate degree completed
• BAi = bachelor’s degree completed
We impute potential experience from time in school estimates by Park (1994). Potential expe-
rience is defined as ei ≡ max{age − ti(si) − 18, 0} where ti(si) is the Park (1994) imputed time in
school for highest level of schooling completed over the 12 years expected for high school graduation.
We use subgroup-specific time in school estimates. Online Appendix Table C1 reports regression
estimates of the wage equation by subgroup.
In a second step, we use the wage equation estimates to calculate the PDV of expected lifetime
earnings for each educational level, j. For sj = s, ej = e, and demographic group xj = x, equation
26

(1) generates a fitted value, w(s, e, x). The PDV of expected earnings for someone with s years of
schooling in demographic group x is
wsx(Sj) =
65∑18
w(s, e, x)
(1 + r)age−18, (2)
where r is a discount rate, set to 3% in our reported figures and tables, and Sj is observed years of
post-secondary enrollment.3 Panel B of Online Appendix Table C2 applies equation (2) to calculate
the PDV of the expected gain in lifetime earnings for each level of educational attainment relative
to a high school degree.
In a final step, we calculate earnings profiles for the treatment and control groups in our exper-
imental data to estimate the effect of scholarships on the PDV of expected lifetime earnings. For
this exercise, we use a parametric approach to calculate an average expected earnings profile for the
treatment and control groups. First, for the control group, we use means of potential experience
and schooling dummies from our ACS sample as point estimates, which we plug into the earnings
function estimated by equation (1) for the relevant subgroups. We do this separately for each
race-by-gender subgroup. Next, we calculate treatment effects for time in school and educational
attainment in the subgroup using the reduced form equation (1) in the main text. Panel A of Online
Appendix Table C2 reports the treatment effects on degree attainment and time in school. These
treatment effects are added to the control group estimates to obtain treatment group estimates for
time in school and educational attainment which are plugged into the earnings function estimated
by equation (1) to obtain expected earnings for the treated group. We difference the PDV of lifetime
earnings for the treatment and control groups to obtain the estimated award effect on the PDV of
lifetime earnings in each subgroup. Panel C of Online Appendix Table C2 reports these estimates.4
We apply an analogous procedure to obtain earnings gains for cost-benefit analysis (CBA)
subgroups plotted in Figure VIII in the main text. We again use the ACS sample to calculate
means of potential experience and schooling dummies for the control group, using as weights the
race/sex distribution in the relevant CBA subgroup. We calculate treatment effects in the CBA
subgroup for time in school and educational attainment using the reduced form equation (1) in the
3For imputations where potential experience is negative (i.e., the earnings of college graduates at age 18), we assignthe intercept of the wage equation.
4To obtain the award effect on earnings for the full sample, we form a weighted average of the earnings gains ineach of the four subgroups, using the groups’ prevalence in the control group as weights.
27
main text. We finally take the difference in the PDV of lifetime earnings between the treatment
and control groups calculated with equation (2) to obtain the estimated award effect for the CBA
subgroup.
28

C.2 Earnings-Related Exhibits
29
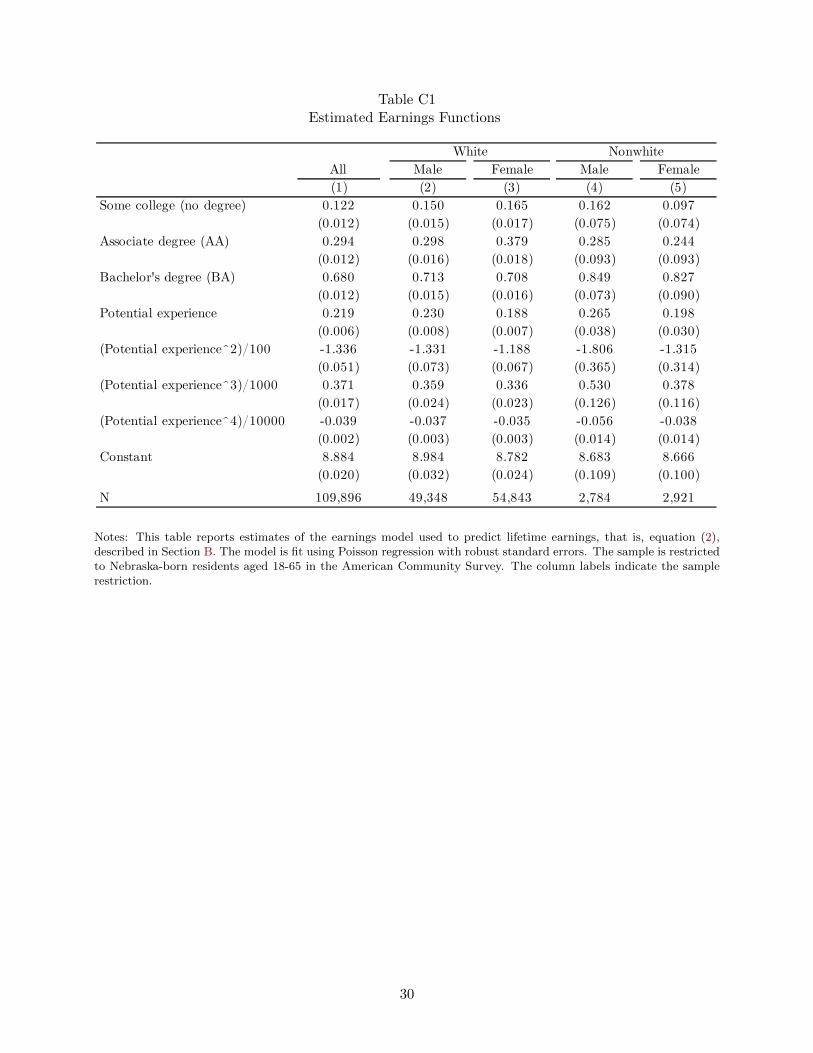
Table C1Estimated Earnings Functions
Male Female Male Female(1) (2) (3) (4) (5)
Some college (no degree) 0.122 0.150 0.165 0.162 0.097(0.012) (0.015) (0.017) (0.075) (0.074)
Associate degree (AA) 0.294 0.298 0.379 0.285 0.244(0.012) (0.016) (0.018) (0.093) (0.093)
Bachelor's degree (BA) 0.680 0.713 0.708 0.849 0.827(0.012) (0.015) (0.016) (0.073) (0.090)
Potential experience 0.219 0.230 0.188 0.265 0.198(0.006) (0.008) (0.007) (0.038) (0.030)
(Potential experience^2)/100 -1.336 -1.331 -1.188 -1.806 -1.315(0.051) (0.073) (0.067) (0.365) (0.314)
(Potential experience^3)/1000 0.371 0.359 0.336 0.530 0.378(0.017) (0.024) (0.023) (0.126) (0.116)
(Potential experience^4)/10000 -0.039 -0.037 -0.035 -0.056 -0.038(0.002) (0.003) (0.003) (0.014) (0.014)
Constant 8.884 8.984 8.782 8.683 8.666(0.020) (0.032) (0.024) (0.109) (0.100)
N 109,896 49,348 54,843 2,784 2,921
AllWhite Nonwhite
Notes: This table reports estimates of the earnings model used to predict lifetime earnings, that is, equation (2),described in Section B. The model is fit using Poisson regression with robust standard errors. The sample is restrictedto Nebraska-born residents aged 18-65 in the American Community Survey. The column labels indicate the samplerestriction.
30
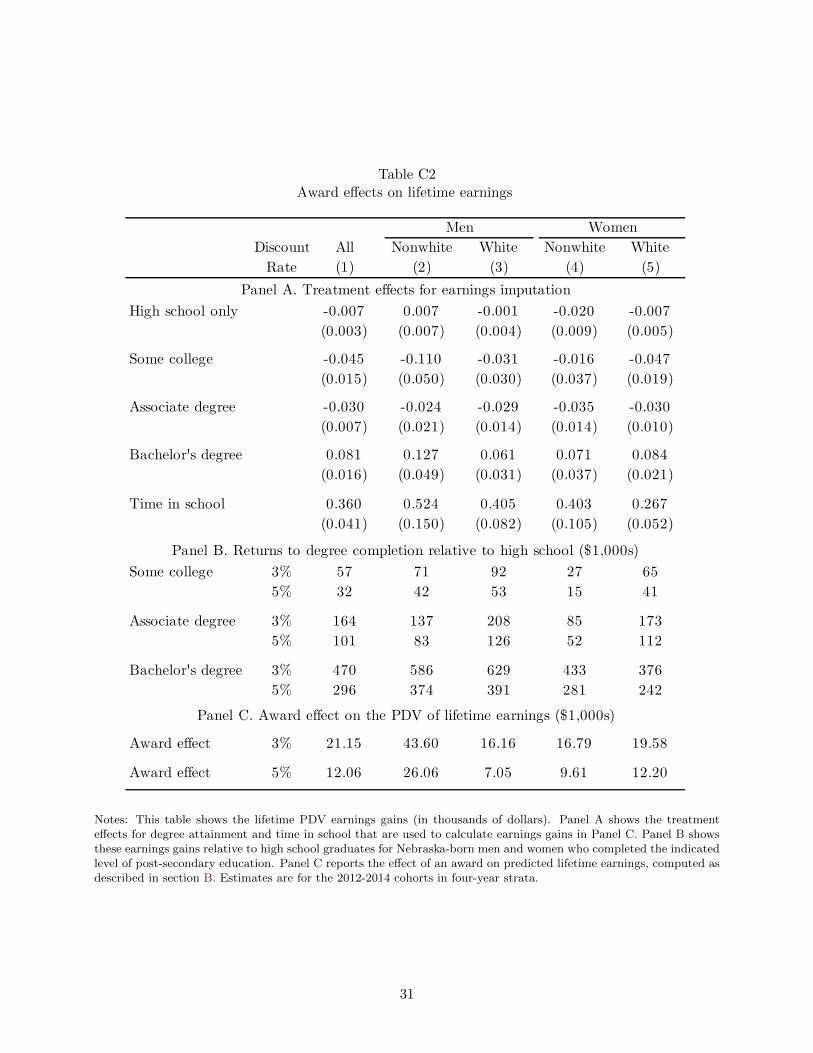
Table C2Award effects on lifetime earnings
Discount All Nonwhite White Nonwhite WhiteRate (1) (2) (3) (4) (5)
High school only -0.007 0.007 -0.001 -0.020 -0.007(0.003) (0.007) (0.004) (0.009) (0.005)
Some college -0.045 -0.110 -0.031 -0.016 -0.047(0.015) (0.050) (0.030) (0.037) (0.019)
Associate degree -0.030 -0.024 -0.029 -0.035 -0.030(0.007) (0.021) (0.014) (0.014) (0.010)
Bachelor's degree 0.081 0.127 0.061 0.071 0.084(0.016) (0.049) (0.031) (0.037) (0.021)
Time in school 0.360 0.524 0.405 0.403 0.267(0.041) (0.150) (0.082) (0.105) (0.052)
Some college 3% 57 71 92 27 655% 32 42 53 15 41
Associate degree 3% 164 137 208 85 1735% 101 83 126 52 112
Bachelor's degree 3% 470 586 629 433 3765% 296 374 391 281 242
Award effect 3% 21.15 43.60 16.16 16.79 19.58
Award effect 5% 12.06 26.06 7.05 9.61 12.20
Men Women
Panel A. Treatment effects for earnings imputation
Panel C. Award effect on the PDV of lifetime earnings ($1,000s)
Panel B. Returns to degree completion relative to high school ($1,000s)
Notes: This table shows the lifetime PDV earnings gains (in thousands of dollars). Panel A shows the treatmenteffects for degree attainment and time in school that are used to calculate earnings gains in Panel C. Panel B showsthese earnings gains relative to high school graduates for Nebraska-born men and women who completed the indicatedlevel of post-secondary education. Panel C reports the effect of an award on predicted lifetime earnings, computed asdescribed in section B. Estimates are for the 2012-2014 cohorts in four-year strata.
31

References
Abadie, Alberto, Matthew M. Chingos, and Martin R. West. 2018. “Endogenous Stratifi-
cation in Randomized Experiments.” Review of Economics and Statistics, 100(4): 567–580.
Barrow, Lisa, Lashawn Richburg-Hayes, Cecilia Elena Rouse, and Thomas Brock. 2014.
“Paying for Performance: The Education Impacts of a Community College Scholarship Program
for Low Income Adults.” Journal of Labor Economics, 32(3): 563–599.
Park, Jin Huem. 1994. “Estimation of Sheepskin Effects and Returns to Schooling Using he Old
and the New CPS Measures of Educational Attainment.” Princeton University, Department of
Economics, Industrial Relations Section. Working Papers 717, August.
Singell, Larry D., and Joe A. Stone. 2016. “The Good, the Poor, and the Wealthy: Who
Responds Most to College Financial Aid?” Bulletin of Economic Research, 54(4): 393–407.
32
Related Documents