The Effect of Sugar, Starch and Pectin as Microbial Energy Sources on In Vitro Forage Fermentation Kinetics by Marcia Malan Thesis presented in partial fulfilment of the requirements for the degree of Master of Science in Agriculture (Animal Science) at Stellenbosch University Department of Animal Sciences Faculty of AgriScience Supervisor: Prof CW Cruywagen Date: March 2009

Welcome message from author
This document is posted to help you gain knowledge. Please leave a comment to let me know what you think about it! Share it to your friends and learn new things together.
Transcript

The Effect of Sugar Starch and Pectin as Microbial Energy Sources on In Vitro Forage
Fermentation Kinetics
by
Marcia Malan
Thesis presented in partial fulfilment of the requirements for the degree of Master of Science in Agriculture (Animal Science)
at
Stellenbosch University
Department of Animal Sciences
Faculty of AgriScience
Supervisor Prof CW Cruywagen
Date March 2009
ii
Declaration
By submitting this thesis electronically I declare that the entirety of the work contained therein is my own original work and that I have not previously in its entirety or in part submitted it for obtaining any qualification
Date helliphelliphelliphelliphelliphelliphelliphelliphelliphelliphelliphelliphelliphelliphelliphelliphellip
Copyright copy 2009 Stellenbosch University
All rights reserved
iii
Abstract
Title The Effect of Sugar Starch and Pectin as Microbial Energy Sources on In Vitro Forage
Fermentation Kinetics
Name Marcia Malan
Supervisor Prof CW Cruywagen
Institution Department of Animal Sciences Stellenbosch University
Degree MScAgric
Ruminants have a compound stomach system that enables them to utilize forages more efficiently than
monogastric animals However forages alone do not contain sufficient nutrients to meet the requirements of
high producing dairy cows Forages are high in fibre and their nutrient availability depends on the degree of
cell wall degradability Improvements in forage fermentation would increase energy intake and subsequently
milk production and performance by dairy cows It is therefore important to find ways to improve forage
degradation and utilization in the rumen
The use of different non-fibre carbohydrate (NFC) sources has different effects on animal performance
Supplementing forage based diets with energy sources containing sugar starch or pectin results in variation
in performance measurements such as milk yield milk composition and dry matter intake (DMI)
This thesis reports on two studies in which the effect of energy supplementation on forage fermentation and
digestion parameters was investigated In the first study an in vitro gas production protocol was used to
determine the effect of sugar (molasses) starch (maize meal) and pectin (citrus pulp) on total gas production
and rate of gas production of different forages The forage substrates included wheat straw (WS) oat hay
(OH) lucerne hay (LUC) ryegrass (RYE) and kikuyu grass (KIK) The three energy sources as well as a
control (no energy source) were incubated in vitro with each of the above mentioned forages Rumen fluid
was collected from two lactating Holstein cows receiving a diet consisting of oat hay lucerne wheat straw
and a concentrate mix Forages alone (025 g DM) andor together (0125 g DM) with either molasses
(01412 g DM) citrus pulp (01425 g DM) or maize meal (0125 g DM) were weighed into glass vials and
incubated for 72 hours The weights of the energy sources were calculated on an energy equivalent basis
Blank vials that contained no substrates were included to correct for gas production from rumen fluid alone
iv
The substrates were incubated in 40 ml buffered medium 2 ml of reducing solution and 10 ml rumen fluid
Gas pressure was recorded automatically every five minutes using a pressure transducer system and the
method based on the Reading Pressure Technique (Mauricio et al 1999) Gas pressure was converted to
gas volume using a predetermined regression equation In the first gas production trial the gas production
included gas produced by the energy sources while in the second gas production trial the energy source
gas production was deducted from the total gas production to determine the effect of energy source on gas
production of respective forage substrates per se Data were fitted to two non-linear models adapted from
Oslashrskov and McDonald (1979) Significant forage x energy interactions were observed for the non-linear
parameter gas production (b) in Model 1 and for b and lag phase (L) in Model 2 in both trials In the first gas
production trial the higher fermentability of the energy sources supplemented to forage substrates
increased b (Model 1 amp 2) of the LUC and WS The gas production rate was affected in different ways for
different forages with the most noticeable effect on WS when it was supplemented with energy sources All
the energy sources increased c of WS irrespective of the model used Energy sources had no effect on the
L of LUC OH or RYE but decreased the L of WS and KIK In the second trial maize meal had no effect on
b for any of the forages (Model 1 amp 2) while molasses (Model 1 amp 2) decreased b for all forage substrates
and citrus pulp (Model 1 amp 2) decreased b of OH and RYE to lower values than those of the control
treatments Gas production rate was not affected by molasses for any of the forage substrates while citrus
pulp (Model 1 amp 2) increased c of OH and maize meal increased c of OH and KIK Lag phase was only
affected by energy sources in WS and KIK where all the energy sources had lower L values than the control
treatment It was concluded that forage fermentability is affected differently by different energy sources
These observations may have important implications in practice on rumen health and milk production and
the data obtained can potentially be used as guidelines in feed formulations
In the second study in vitro digestibility trials were undertaken to determine the effect of sugar (molasses
and sucrose) starch (maize meal and maize starch) and pectin (citrus pulp and citrus pectin) on neutral
detergent fibre (NDF) and dry matter (DM) degradability of forages Forage substrates used included wheat
straw oat hay lucerne hay ryegrass and kikuyu grass Rumen fluid was collected from two lactating
Holstein cows receiving a diet consisting of oat hay wheat straw and a concentrate mix In vitro
degradability was done with an ANKOM Daisy II incubator and forage substrates were incubated with or
without the respective energy sources for 24 48 and 72 hours The substrates were incubated in 1076 ml
buffered medium 54 ml of reducing solution and 270 ml rumen fluid The residues were washed dried and
analyzed for NDF In the study with the applied energy sources (molasses maize meal and citrus pulp)
there were a forage x energy source interactions Supplementation with the applied energy sources all
improved dry matter degradability (DMD) of forages (24 and 72 hours) when compared to the control
treatment except for RYE supplemented with maize meal and citrus pulp at 24 hours Molasses seemed to
have had the biggest effect on DMD in all forage substrates Supplementation with maize meal had no effect
on neutral detergent fibre degradability (NDFD) of any forage substrate except for an improvement in NDFD
of LUC at 72 hours Molasses improved NDFD of LUC at 24h but had no effect on the other forage
substrates Citrus pulp improved NDFD of OH (72 hours) as well as LUC and WS (24 and 72 hours) It is
postulated that the NDF of the energy sources was more digestible than that of the respective forages and
that the improved NDFD values could be ascribed to the contribution of the energy source NDFD Overall
pasture grasses had a higher NDFD than the hays and straw and appear to be more readily fermentable by
v
rumen microbes than the low quality hays and straw explaining the higher NDFD In the study involving the
purified energy sources (sucrose maize starch and citrus pectin) forage x energy source interactions were
observed In general supplementation with these energy sources improved DMD at 24 and 72 hours except
for RYE and KIK (72 hours) Pasture grasses (RYE and KIK) had a higher NDFD than LUC OH and WS At
72 hours NDFD was 371 for LUC 425 for OH and 403 for WS compared to 705 for KIK and
649 for RYE A possible explanation is that KIK and RYE samples came from freshly cut material
harvested after a 28d re-growth period In general sucrose (24 and 72 hours) and citrus pectin (72 hours)
had no effect on NDFD of forage substrates However supplementing oat hay (24 hours) with starch and
citrus pectin and wheat straw (24 and 72 hours) with starch lowered NDFD when compared to the control
treatment It is hypothesized that microbes fermented the easily fermentable energy sources first before
attacking forage NDF The study suggested that forage NDFD values are not fixed and may be altered by
type of energy supplementation
vi
Uittreksel
Titel Die invloed van stysel suiker en pektien as mikrobiese energiebronne op in vitro ruvoer-
fermentasiekinetika
Naam Marcia Malan
Studieleier Prof CW Cruywagen
Instansie Departement Veekundige Wetenskappe Universiteit van Stellenbosch
Graad MScAgric
Die meervoudige maagsisteem van herkouers stel hulle in staat om ruvoer meer effektief te benut as
enkelmaagdiere Ruvoere alleen bevat egter nie genoeg voedingstowwe om die behoeftes van hoog-
produserende melkbeeste te bevredig nie Ruvoere is ryk aan vesel en hul voedingstofbeskikbaarheid word
bepaal deur die graad van selwand degradeerbaarheid lsquon Verhoging in ruvoerfermentasie sal energie-
inname verhoog en gevolglik ook melkproduksie en prestasie Dit is dus belangrik om maniere te vind om
ruvoerdegradeerbaarheid en -verbruik in die rumen te verbeter
Die gebruik van verskillende nie-vesel koolhidraat (NFC) bronne het verskillende uitwerkings op die prestasie
van diere Energie-aanvullings soos suiker stysel en pektien tot ruvoer-gebasseerde dieumlte beiumlnvloed
prestasiemaatstawwe soos melkproduksie melksamestelling en droeumlmateriaalinname (DMI) op verskillende
maniere
Hierdie tesis lewer verslag oor twee studies waar die invloed van energie-aanvullings op ruvoerfermentasie
en verteringsmaatstawwe ondersoek is In die eerste studie is lsquon in vitro gasproduksieprotokol gebruik om
die invloed van suiker (melasse) stysel (mieliemeel) en pektien (sitruspulp) op totale gasproduksie (b) en
tempo van gasproduksie (c) van verskillende ruvoersubstrate te bepaal Ruvoersubstrate wat gebruik is
was koringstrooi (WS) hawerhooi (OH) lusernhooi (LUC) raaigras (RYE) en kikuyugras (KIK) Die drie
energiebronne sowel as lsquon kontrole (geen energiebron) is in vitro geiumlnkubeer saam met elk van die
genoemde ruvoere Rumenvloeistof is verkry van twee lakterende Holsteinkoeie wat lsquon dieet ontvang het
bestaande uit hawerhooi koringstrooi en lsquon kragvoermengsel Ruvoere is alleen enof in kombinasie met
melasse (01412 g DM) sitruspulp (01425 g DM) of mieliemeel (0125 g DM) in glasbottels afgeweeg en vir
72 uur geiumlnkubeer Die massas van die energiebronne is op lsquon energie-ekwivalente basis bereken Leeuml
bottels wat geen substraat bevat het nie is ingesluit om te korrigeer vir gasproduksie afkomstig vanaf
rumenvloeistof alleen Substrate is in 40 ml van lsquon buffermedium 2 ml reduserende oplossing en 10ml
rumenvloeistof geiumlnkubeer Gasdruk is elke vyf minute outomaties aangeteken deur gebruik te maak van lsquon
drukmetersisteem en die metode is gebasseer op die Reading gasdruktegniek Gasdruk is omgeskakel na
vii
gasvolume deur gebruik te maak van lsquon voorafbepaalde regressievergelyking In die eerste proef het totale
gasproduksie die gas wat deur die onderskeie energiebronne geproduseer is ingesluit In die tweede proef
is gasproduksie afkomstig van die energiebronne afgetrek van totale gasproduksie om sodoende die invloed
van die energiebronne per se op die gasproduksie van die onderskeie ruvoersubstrate te bepaal Data is
met behulp van twee nie-linieumlre modelle gepas Betekenisvolle ruvoer x energie-interaksies is in albei
proewe waargeneem vir die nie-linieumlre parameter b (gasproduksie) in Model 1 en vir b en L (sloerfase) in
Model 2 In die eerste proef het die energiebronne se hoeuml fermentasie gelei to lsquon verhoging in b (Model 1 amp
2) van LUC en WS Energie-aanvullings het die c-waarde van die onderskeie ruvoere verskillend beiumlnvloed
met WS wat die mees opvallende effek gehad het Al die energiebronne het die c-waarde van WS verhoog
ongeag watter model gebruik is Energiebronne het geen invloed op die L-waarde van LUC OH of RYE
gehad nie maar het wel die L-waarde van WS en KIK verlaag In die tweede proef het mieliemeel geen
invloed op die b-waarde van enige van die ruvoere gehad nie (Model 1 amp 2) terwyl melasse (Model 1 amp 2)
die b-waarde van alle ruvoere verlaag het en sitruspulp (Model 1 amp 2) OH en RYE se b waardes verlaag het
tot laer as die kontroles Melasse het geen invloed op die c-waarde van die onderskeie ruvoersubstrate
gehad nie terwyl sitruspulp (Model 1 amp 2) die c-waarde van OH en mieliemeel die c-waarde van OH en KIK
verhoog het Energiebronne het slegs lsquon invloed op die sloerfase in WS en KIK gehad waar dit L verlaag
het tot laer waardes as dieacute van die kontroles Daar is gevind dat ruvoer-fermenteerbaarheid verskillend
beiumlnvloed word deur verskillende energiebronne Bogenoemde resultate kan in die praktyk betekenisvolle
invloede hecirc op rumengesondheid en melkproduksie en die data wat verkry is kan potensieeumll gebruik word
as riglyne in voerformulerings
In die tweede studie is in vitro verteerbaarheidsproewe gedoen om die effek van suiker (molasse en
sukrose) stysel (mieliemeel en mieliestysel) en pektien (sitruspulp en sitrus-pektien) op neutraal-
onoplosbare vesel (NDF) en droeuml materiaal (DM) degradeerbaarheid van ruvoere te bepaal
Ruvoersubstrate wat gebruik is was WS OH LUC RYE en KIK Rumen vloeistof is verkry van twee
lakterende Holstein koeie wat lsquon dieet ontvang het bestaande uit hawerhooi koringstrooi en lsquon konsentraat
mengsel Die in vitro degradeerbaarheidsproef is gedoen met lsquon ANKOM Daisy II inkubator
Ruvoersubstrate is geiumlnkubeer met of sonder die onderskeie energiebronne vir 24 48 en 72 uur Die
substrate is geiumlnkubeer in 1076 ml buffer medium 54 ml reduserende oplossing en 270 ml rumen vloeistof
Residue is gewas gedroog en geanaliseer vir NDF In die proef met toegepaste energiebronne (molasse
mieliemeel en sitruspulp) was daar ruvoer x energiebron interaksies Toegepaste energiebron aanvullings
het almal DMD van ruvoersubstrate (24 en 72 uur) verbeter uitsluitend vir RYE wat aangevul is met
mieliemeel (24 uur) en sitruspulp (24 uur) Van al die ruvoersubstrate het molasse die grootste effek gehad
op DMD Mieliemeel aanvullings het geen effek gehad op neutraal-onoplosbare vesel degradeerbaarheid
(NDFD) van ruvoersubstrate nie behalwe vir lsquon verbetering in NDFD van LUC by 72 uur Molasse het NDFD
van lucern by 24 uur verbeter maar geen effek gehad op ander ruvoersubstrate nie Sitruspulp het NDFD
van OH (72 uur) asook LUC en WS (24 amp 72 uur) verbeter Daar word beweer dat die NDF van
energiebronne meer verteerbaar is as die van ruvoersubstrate en dat die verbetering in NDFD waardes
toegeskryf kan word aan die bydraes van energiebronne se NDFD Weidingsgrasse (RYE amp KIK) het oor die
algemeen lsquon hoeumlr NDFD as hooie en strooi gehad Rumen mikrobes blyk ook om dieacute grasse vinniger te
verteer as lae kwaliteit hooie en strooi wat gevolglik die hoeumlr NDFD verduidelik In die proef met suiwer
energiebronne (sukrose mieliestysel en sitrus-pektien) is ruvoer x energiebron interaksies waargeneem
viii
Energiebronaanvullings het DMD by 24 en 72 uur verbeter buiten vir RYE en KIK (72 uur) Weidingsgrasse
het hoeumlr NDFD as LUC OH en WS By 72 uur was die NDFD van LUC 371 OH 425 WS 403 in
vergelyking met 705 vir KIK en 649 vir RYE lsquon Moontlike verklaring vir die hoeumlr NDFD van KIK en
RYE is omdat dit vars gesnyde material is geoes na slegs 28 dae hergroei Oor die algemeen het sukrose
(24 amp 72 uur) en sitrus-pektien (72 uur) geen effek gehad op NDFD van ruvoersubstrate nie terwyl stysel en
pektien aanvullings tot OH (24 uur) en stysel aanvullings tot WS (24 amp 72 uur) NDFD verlaag het Daar
word hipotetieseer dat mikrobes eers die vinnig fermenteerbare energiebronne fermenteer voordat hulle
ruvoer NDF aanval Hierdie studie beweer dat ruvoer NDFD waardes nie vas is nie en dat dieacute waardes
beiumlnvloed mag word deur energiebron aanvullings
ix
Acknowledgements
I wish to thank the following people and organizations
Prof CW Cruywagen for his support and guidance
Dr Nherera for her help and support
The Hennie Steenberg Trust Fund for funding for the study
The Western Cape Department of Agriculture (Elsenburg) who made cannulated Holstein cows
available for the collection of rumen fluid
Academic and technical staff at the Department of Animal Sciences Stellenbosch University for
providing support where necessary and an ideal working environment
Fellow students who provided me with help and support throughout
My parents for their motivation and support
Al my friends for their motivation support and help
x
Table of Contents
Abstract
ii
Uittreksel
v
Acknowledgements
viii
List of Figures
xii
List of Tables
ix
List of Abbreviations
xiv
CHAPTER 1 INTRODUCTION 1
11 References 2
CHAPTER 2 LITERATURE REVIEW 4
21 Introduction 4
22 Non-fibre carbohydrates and non-structural carbohydrates 5
23 Rumen microbiology 5
24 Physical effective fibre and particle size 6
25 Forage classification 7
251 Factors influencing forage nutritive value 7
2511 Age and maturity 8
2512 Soil fertility and environment 8
26 Fibre 9
27 Van Soest forage fraction analysis 9
28 In vitro techniques for evaluating feed resources 10
29 Carbohydrates 10
291 Non-fibre carbohydrates non-structural carbohydrates 11
2911 Sugar 12
2912 Starch 12
2913 Pectin 13
2914 Sugar vs Starch 14
210 Non-fibre carbohydrate digestibility 14
xi
211 Non-fibre carbohydrate fermentation and organic acid production 15
212 Ruminal acidosis 16
213 Conclusion 17
214 References 18
CHAPTER 3 THE EFFECT OF SUGAR STARCH OR PECTIN ON RATE AND EXTENT OF GAS
PRODUCTION IN DIFFERENT FORAGES 23
Abstract 23
31 Introduction 23
32 Materials and methods 24
321 Study area 24
322 Simulated diets 24
3221 Basal forages 24
3222 Energy supplements 25
3223 Defining the diets 25
323 Chemical analyses of forages and energy sources 25
324 Preparation of samples for gas production 26
325 Preparation of the in vitro medium and reducing solution 28
326 Collection and preparation of rumen fluid 28
327 In vitro incubation 28
328 Converting gas pressure to gas volume 29
329 Estimating kinetic coefficients 29
33 Statistical analysis 30
34 Results and discussion 30
341 Gas production including that from the energy sources 30
342 Gas production parameters including that of forage and energy sources in cases where no
interaction was observed 37
343 Gas production excluding that from energy sources 39
344 Gas production parameters excluding that of energy sources in cases where no interaction was
observed 45
35 Conclusion 47
36 References 48
CHAPTER 4 THE EFFECT OF SUGAR STARCH AND PECTIN AS MICROBIAL ENERGY
SOURCES ON IN VITRO NEUTRAL DETERGENT FIBRE AND DRY MATTER DEGRADABILITY OF
FORAGES
51
Abstract 51
xii
41 Introduction 52
42 Materials and methods 52
421 Study area 52
422 Simulated diets 52
4221 Basal forages 52
4222 Energy supplements 53
4223 Defining the diets 54
423 Chemical analyses of forages and energy sources 54
424 Sample preparation 55
425 Preparation of in vitro medium and reducing solution 58
426 Collection and preparation of rumen fluid 58
427 In vitro incubation 58
428 Residue analysis 59
429 Estimating dry matter degradability 59
4210 Estimating neutral detergent fibre degradability 59
43 Statistical analyses 60
44 Results and discussion 60
441 Effect of maize meal citrus pulp and molasses on apparent in vitro dry matter
degradability 60
442 Effect of maize meal citrus pulp and molasses on apparent in vitro neutral
detergent fibre degradability 62
443 Effect of maize starch citrus pectin and sucrose on apparent in vitro dry matter
degradability 64
444 Effect of maize starch citrus pectin and sucrose on apparent in vitro neutral
detergent fibre degradability 65
45 Conclusion 67
46 References 67
CHAPTER 5 GENERAL CONCLUSION 71
xiii
List of Tables
Table 21 Feed types that fall within the definition of forage (adapted from
Wilkens 2000)
7
Table 22 Energy (MJkg DM) and protein (gkg DM) content of different
classes of forages (Wilkens 2000)
8
Table 23 Forage fraction classification using the method of Van Soest (Van
Soest amp Wine 1967)
9
Table 24 The effect of sugar on dairy cattle performance 14
Table 25
Non-fibre carbohydrate levels for various ration types (Ishler amp
Varga 2001)
15
Table 26 Comparison of acute and sub-acute acidosis (Henning 2004) 6
Table 31 Forages used in simulation diets for lactating dairy cows 25
Table 32 Energy sources used in simulating lactating dairy cow diets 25
Table 33 Chemical composition (gkg DM plusmn SD) of forages and energy
sources used in the trial All values are on a DM basis
27
Table 34 Substrate samples containing either forage or energy
supplements
27
Table 35 Composite dietary samples containing forage and energy sources 28
Table 36 Effects of maize meal citrus pulp and molasses as energy
sources on fermentation kinetics of different forage substrates as
measured by in vitro gas production Gas production of both
energy sources and forage substrates are included
32
Table 37 In vitro gas production parameters of forages as affected by
energy sources as main effects in cases where no interactions
were observed Gas production of both energy sources and
forage substrates are included
38
Table 38 In vitro gas production parameters of forages (irrespective of
forage substrate used) as affected by different energy sources as
main effects in cases where no interactions were observed Gas
production of both energy sources and forage substrates are
included
38
Deleted 8
Deleted 9
Deleted 11
Deleted 6
Deleted 7
Deleted 1
Deleted 8
Deleted 7
Deleted 7
Deleted para
Deleted 9
Deleted 30
Deleted 30
Deleted para35
Deleted 41
Deleted 41
xiv
Table 39 Effects of maize meal citrus pulp and molasses as energy
sources on fermentation kinetics of different forage substrates as
measured by in vitro gas production Gas production resulting
from energy sources was deducted from total gas production
40
Table 310 In vitro gas production parameters of forages as affected by
energy sources as main effects in cases where no interactions
were observed Gas production resulting from energy sources
was deducted from total gas production
45
Table 311 In vitro gas production parameters of forages (irrespective of
forage substrate used) as affected by different energy sources as
main effects in cases where no interactions were observed Gas
production resulting from energy sources was deducted from total
gas production
52
Table 41 Forages used in simulation diets for lactating dairy cows 53
Table 42 Applied energy sources used in simulating the dairy cow diets 54
Table 43 Purified energy sources used in simulating the dairy cow diets 54
Table 44 Chemical composition (gkg DM plusmn SD) of forages and energy
sources used in the trial All values are on a DM basis
55
Table 45 Substrate samples containing either forage or applied energy
supplements
55
Table 46 Composite diets containing forage and applied energy sources 56
Table 47
Diets containing forages alone or a mixture of forages and purified
energy sources Amounts are on an air dry basis
56
Table 48 Effects of maize meal citrus pulp and molasses as energy
sources on in vitro dry matter degradability (DMD) parameters of
different forage substrates
60
Table 49 Effects of maize meal citrus pulp and molasses as energy
sources on in vitro neutral detergent fibre degradability (NDFD)
parameters when incubated in combination with different forage
substrates
63
Table 410 Effects of maize starch citrus pectin and sucrose as energy
sources on in vitro dry matter degradability (DMD) parameters of
different forage substrates
64
Deleted 43
Deleted parapara 48
Deleted 49
Deleted 57
Deleted 57
Deleted
Deleted 58
Deleted para59
Deleted 60
Deleted para60
Deleted 61
Deleted 65
Deleted 67
Deleted 9
xv
Table 411 Effects of maize starch citrus pectin and sucrose as energy
sources on in vitro neutral detergent fibre degradability (NDFD)
parameters of different forage substrates
65
Deleted 70
xvi
List of Figures
Figure 21 Structural and non-structural carbohydrates of plants where ADF
= acid detergent fibre szlig-glucans = (1 rarr 3) (1 rarr 4)-szlig-D-glucans
NDF = neutral detergent fibre NDSF = neutral detergent-soluble
fibre (includes all non-starch polysaccharides not present in
NDF) NSC = non-NDF carbohydrates (Ishler amp Varga 2001)
11
Figure 22 Ruminal pH results for citrus and hominy rations where CPD =
citrus pulp diet and HD = hominy diet (Leiva et al 2000)
14
Figure 31 Gas production of forage substrates alone 34
Figure 32 Gas production of lucerne hay when supplemented with different
energy sources
35
Figure 33 Gas production of oat hay when supplemented with different
energy sources
36
Figure 34 Gas production of wheat straw when supplemented with different
energy sources
36
Figure 35 Gas production of ryegrass when supplemented with different
energy sources
37
Figure 36 Gas production of kikuyu grass when supplemented with
different energy sources
37
Figure 37 Gas production of forage substrates after gas production of
energy sources has been deducted
42
Figure 38 The net effect of energy supplements on gas production of
lucerne hay
42
Figure 39 The net effect of energy supplements on gas production of oat
hay
43
Figure 310 The net effect of energy supplements on gas production of
wheat straw
44
Figure 311 The net effect of energy supplements on gas production of
ryegrass
44
Figure 312 The net effect of energy supplements on gas production of
kikuyu grass
45
Deleted para
Deleted 2
Deleted para15
Deleted 6
Deleted 7
Deleted 8
Deleted 9
Deleted 9
Deleted 40
Deleted 4
Deleted 5
Deleted 6
Deleted 6
Deleted 7
Deleted 7
xvii
List of Abbreviations
ADF Acid detergent fibre
ADL Acid detergent lignin
b Gas production
c Gas production rate
C3H7NO2HCL Cysteine hydrochloride
cp Citrus pulp
CP Crude protein
DM Dry matter
DMI Dry matter intake
EE Ether extract
KIK Kikuyu grass
KOH Potassium hydroxide
L Lag phase
LUC lucerne hay
mm Maize meal
mol Molasses
MP Microbial protein
Na2S9H2O Sodium sulfide nonahydrate
ND Neutral detergent
NDF Neutral detergent fibre
NDSF Neutral detergent-soluble fibre
NFC Non-fibre carbohydrates
NH3N Ammonia nitrogen
NPN Non-protein nitrogen
NSC Non-structural carbohydrates
OH Oat hay
OM Organic matter
pef Physical effectiveness factor
peNDF Physical effective neutral detergent fibre
RDP Rumen degradable protein
RPT Reading pressure technique
RYE Ryegrass
VFA Volatile fatty acids
WS Wheat straw
1
Chapter 1
INTRODUCTION
The compound stomach system of ruminants is adapted to roughage based diets mainly grass (Cherney
1998) Diets of grass and other fibrous feeds however do not meet the energy requirements of high
producing dairy cows (Schwarz et al 1995) Fibre is low in energy and a large consumption thereof results
in rumen fill thus limiting feed intake (Allen amp Oba 2000) Concentrate feeds such as non-fibre
carbohydrates (NFC) provide lactating dairy cows with energy needed to improve performance and
efficiency of production (Henning 2004) Balanced rations consisting of forages and concentrate feeds
ensure optimal production and rumen health For dairy cattle forages should comprise at least 40 of the
diet and NFC should constitute between 35 and 42 of the diet (NRC 2001) Non-fibre carbohydrates such
as sugars starch and pectin are critical in meeting energy requirements for growth and production (Roche amp
Dalley 1996)
The symbiotic relationship between rumen micro-organisms and the host animal is an essential component
in nutrient supply (Van Saun 1998) Ruminant rations should provide the rumen micro-organisms with
sufficient nutrients and an optimal environment for growth (Ishler et al 1996) According to the NRC (2001)
the most important nutrients for optimal microbial growth are protein and carbohydrates Microbial
fermentation and digestion of carbohydrates and protein provide ruminants with volatile fatty acids (VFA) and
microbial protein (MP) The animal uses the VFA as energy and the MP for protein synthesis (Van Saun
1998)
Energy shortages affect lactating cows especially during the first three weeks after calving (Hutjens 1998)
During this time dry matter intake (DMI) is low and milk production is high resulting in a negative energy
balance When formulating diets for lactating dairy cows it is important to consider the total NFC fraction
which primarily comprise of sugars starch and pectins (Larson 2003) The NFC ferment rapidly in the
rumen to VFA (Holtshausen 2004) Batajoo amp Shaver (1994) reported that cows receiving diets with more
than 30 NFC produced more than 40 kg of milkday However they found no milk yield benefits by
increasing the NFC beyond 36 Molasses is a common energy supplement used in dairy rations
(Holtshausen 2004) In addition to this molasses also reduce dustiness and increase palatibility and
moisture content of diets (De Ondarza 2000) Other energy supplements include soybean hulls sugar beet
pulp and citrus pulp Leiva et al (2000) showed that substituting diets that contain 205 citrus pulp (pectin)
for diets containing 195 maize meal (starch) increased milk yield Solomon et al (2000) however
reported that substituting starch-rich diets with pectinndashrich diets had no effect on milk yield
Energy sources such as sugar starch and pectin are frequently used as supplements to forage in ruminant
diets in order to meet the energy requirements for growth and production However there is a lack of
information on the magnitude of the relationship between different carbohydrate sources and rumen neutral
detergent fibre fermentation kinetics
2
The objectives of this study were to determine the impact of three energy sources viz maize meal
molasses and citrus pulp on total gas production rate of gas production dry matter (DM) degradability and
NDF degradability of different forage substrates Forages commonly used in dairy cow diets were chosen as
fermentation substrates These were wheat straw (Triticum aestivum) oat hay (Avena sativa) lucerne hay
(Medicago sativa) kikuyu (Pennisetum clandestinum) and ryegrass (Lolium multiflorum)
11 References
Allen M amp Oba M 2000 Getting more milk from forages Michigan Dairy Review 5(4) Department of
Animal Science Michigan State University
Available at
httpwwwadmanicomalliancedairyTechBulletinsNon20Structural20Carbohydrate20Nutrition
htm
(Accessed 5 August 2008)
Batajoo KK amp Shaver RD 1994 Impact of nonfiber carbohydrate on intake digestion and milk
production by dairy cows J Dairy Sci 77 1580 - 1588
Cherney DJR 1998 Forages for dairy cattle Economical alternatives to alfalfa grass and corn In
Proceedings of the 1998 Tri-State Dairy Nutrition Conference April 21 - 22 Fort Wayne Indiana
USA pp 35 - 50
De Ondarza MB 2000 Non-fibre carbohydrates
Available at httpwwwmilkproductioncomLibraryArticlesNon_Fibre_Carbohydrateshtm
(Accessed 5 August 2008)
Henning P 2004 Acidosis in high producing ruminants - myth or menace Animal Feed Manufacturers
Association (AFMA) South Africa pp 1 - 9
Available at httpwwwengormixcome_articles_viewaspart=529ampAREA=GDC
(Accessed 5 Augustus 2008)
Holtshausen L 2004 Effect of nonfibre carbohydrates on product yield and fibre digestion in fermentations
with mixed ruminal microbes PhD thesis University of Florida Gainesville Florida USA pp 1 - 33
Hutjens MF 1998 Practical approaches to feeding the high producing cow Illini DairyNet University of
Illinois Extension
Available at httpwwwlivestocktrailuiucedudairynetpaperDisplaycfmContentID=247
(Accessed 5 Augustus 2008)
Ishler V Heinrichs J amp Varga G 1996 From feed to milk Understanding rumen function Pennsylvania
State University Extension Circular 422
3
Available at httpanimsciagrenvmcgillcacourses450extrafeed_to_milkconceptshtml
(Accessed 25 August 2008)
Larson CC 2003 The effect of nonfiber carbohydrate source and protein degradability on lactation
performance of holstein cows MSc (Agric) thesis University of Florida Gainesville Florida USA pp
1 - 4
Leiva E Hall MB amp Van Horn HH 2000 Performance of dairy cattle fed citrus pulp or corn products as
sources of neutral detergent-soluble carbohydrates J Dairy Sci 83 2866 - 2875
National Research Council (NRC) 2001 Nutrient requirements of dairy cattle (7th Rev Ed) National
Academy Press Washington DC USA pp 34 - 35
Roche J amp Dalley D 1996 Nutrition and milk composition Agriculture Notes State of Victoria Department
of Primary Industries pp 1 - 3
Available at
httpwwwdpivicgovaudpinreninfnsf9e58661e880ba9e44a256c640023eb2e036a3ac34d507323c
a257181001f0359$FILEAG0534pdf
(Accessed 1 October 2008)
Schwarz FJ Haffner J amp Krichgessner M 1995 Supplementation of zero-grazed dairy cows with
molassed sugar beet pulp maize or cereal-rich concentrate Anim Feed Sci Technol 54 237 - 248
Solomon R Chase LE Ben-Ghedalia D amp Bauman DE 2000 The effect of nonstructural carbohydrate
and addition of full fat soybeans on the concentration of conjugated linoleic acid in milk fat of dairy
cows J Dairy Sci 83 1322 - 1329
Van Saun RJ 1998 Beef cattle nutrition Feeding for two (How to properly feed the cow and her rumen)
In Cow-calf management guide-cattle producers library (2nd Ed) Cooperative Extension Service
Publications Agricultural Publications University of Idaho Moscow Idaho USA pp 172 - 180
4
Chapter 2
LITERATURE REVIEW
21 Introduction
With the increase in the cost of feed medicine labour fuel and other production essentials it is vital for any
agricultural enterprise specifically the traditional lsquofarmrsquo to be operated like a business With the profit-
making goal in mind the single most important facet of a modern dairy-operation is its feeding program An
efficient and successful feeding program will not only maximize the animalrsquos production but will also cut
costs in other areas of the operation by increasing animal health productive life-expectancy and reducing
labour costs A feeding program that achieve these goals will ultimately make the agricultural enterprise
more economically competitive
Dairy cattle require specific amounts of nutrients to support various levels of performance Feeding high
levels of concentrates (especially non-fibrous carbohydrates) to high producing dairy cows is common in all
intensive production systems around the world The problem with high levels of concentrates in dairy cow
diets is the risk of these diets causing digestive disturbances The aim of diet formulation and thus nutritional
management for intensive production systems must be to maximize productivity and overall efficiency
without enhancing digestive disturbances such as acidosis (Henning 2004) A successful feeding program
will meet the cowrsquos nutritive needs for high production minimize weight loss (during early lactation) prevent
digestive upsets and maintain ruminal and animal health
In order to achieve full genetic potential for high milk production it is of the utmost importance to keep the
rumens of dairy cows in a healthy state The rumen is home to a wide diversity of micro-organisms
(including bacteria protozoa and fungi) collectively utilizing the extensive variety of feeds which make up
dairy cow diets (Kamra 2005) Forages are the main component of dairy cow diets Forages alone
however do not meet the energy requirements of high producing dairy cows (Schwarz et al 1995)
Supplementing dairy cow diets with concentrate feeds provide high milk producing cows with energy needed
to improve efficiency of production and performance (Henning 2004) Carbohydrates are the largest nutrient
component of dairy diets and the most important source of energy for rumen micro-organisms
Carbohydrates important for growth reproduction milk production and rumen health make up roughly 70
of dry matter (DM) in dairy diets making it the lsquoheartrsquo of dairy diets (Mertens 1997) Carbohydrates (fibre
starch and sugar) are degraded in the rumen to simple sugars and then fermented into volatile fatty acids
(VFA) by rumen bacteria supplying up to 80 of the animalrsquos energy requirements
5
22 Non-fibre carbohydrates and non-structural carbohydrates
The three main components of the carbohydrate fraction of feeds referred to as non-fibre carbohydrates
(NFC) are starch NDSF (neutral detergent-soluble fibre) and sugars The NFC fraction of feedstuffs is
estimated from the following calculation as proposed by Holtshausen (2004)
100 - crude protein - ether extract - ash - neutral detergent fibre + neutral detergent insoluble crude
protein
The fraction derived by the above calculation has at times been used interchangeably for the terms NFC and
non-structural carbohydrates (NSC) Non-structural carbohydrates however refer to plant cell contents and
include mono- and oligosaccharides organic acids (which are not carbohydrates) starch and fructans Non-
fibre carbohydrates include all of the above substances as well as soluble fibre (pectic substances szlig-
glucans and galactans) Thus NFC includes non-structural and structural carbohydrates as well as non-
fibrous and fibrous carbohydrates (Holtshausen 2004)
In the interest of clarity I will not use the terms NSC and NFC interchangeably I will use NFC exclusively
as its meaning is more complete in the context of this thesis
23 Rumen microbiology
All living organisms require some essential nutrients to sustain metabolic processes and to maintain a
healthy state These essential nutrients include water protein minerals vitamins and essential energy The
difference between the cow itself and the micro-organisms living within its rumen is defined by the source of
their respective nutrients (Van Saun 1993)
Feeding dairy cattle nutritional balanced diets ensures healthy rumens that maximize microbial production
and growth Ruminal pH is the main variable influencing the microbial population and thus the overall VFA
production (major energy source to animal) Diets containing too much NFC may cause the ruminal pH to
decrease below 6 This low rumen pH leads to a reduction in cellulolytic organisms and an increase in
propionate producing micro-organisms in turn leading to a low acetate-propionate ratio This in turn results
in low milk fat percentages (Ishler et al 1996)
Maintaining a healthy rumen microbial population is an essential function of any feeding program Carbon
skeletons and energy are used by rumen micro-organisms for protein synthesis Ruminant systems are
sometimes based on digestible organic or fermentable matter even though rumen micro-organisms are able
to grow and develop on only secondary carbohydrate products Rumen bacteria have specific maintenance
requirements for growth and development Both bacterial growth rate and fractional degradation rate of
carbohydrates determine bacterial yield (Nocek amp Tamminga 1991)
6
24 Physical effective fibre and particle size
Preventing ruminal acidosis requires chemical and physical considerations of the diet as well as a well-
organized feed and herd management system (Hall 2002) The physical form of the diet affects the nutritive
value of the feed as well as the chewing activity dry matter intake rumen function and milk production of the
animal
Particle size plays a critical role in the extent to which rumen micro-organisms can carry out their digestive
functions Grinding or chopping forages does not change the forage composition it only reduces the particle
size Reduced particle size increases dry matter intake and the rumen turnover rate resulting in a reduced
time period within which rumen micro-organisms can digest fibre Reduced particle size also reduces the
time spent on rumination thus leading to less mucus production and a subsequent decrease in rumen pH
Low rumen pH leads to an increase in propionic acid production and tend to change milk components by
lowering milk fat percentages and increasing milk protein percentages Chopping and grinding of
concentrates increase the starch exposure to rumen microbial digestion resulting in increased degradation
Processing methods such as pelleting steam rolling or grinding of concentrates alter the structure of starch
by increasing its availability for fermentation in the rumen This increase in starch availability can be either
favorable by boosting rumen microbial growth or harmful by enhancing the risk of rumen acidosis (Van der
Merwe amp Smith 1991)
As with particle length fibre content of the diet plays an important role in maintaining rumen functions Fibre
ensures sufficient amounts of carbohydrates to slow down the rate of digestion and prevent rumen acidity
Neutral detergent fibre (NDF) and acid detergent fibre (ADF) are the most important fibre fractions in ration
formulation Effective fibre is needed in dairy diets to form a ruminal mat and slow down carbohydrate
availability thereby preventing rumen acidosis (Ishler et al 1996) Balancing the dairy ration for NDF and
non-fibre carbohydrates (NFC) fractions is very important in controlling the rumen pH Buffers are also
commonly used for controlling pH
Physical effective fibre (peNDF) relates the physical properties of a feed (by measuring particle size and
chewing activity) to rumen pH The peNDF of a feed is the product of the feedrsquos physical effectiveness factor
(pef) and the feedrsquos NDF By definition pef varies between 0 (if NDF if is not successful in stimulating
chewing activity) and 1 (if NDF is successful in encouraging chewing activity) (Mertens 1997)
It is very important to always balance the peNDF of the dairy cow diet with dietary fermentability Physical
effective fibre is that fraction of fibre that promotes the chewing activity Thus when feeding lactating cows
it is very important to add adequate amounts of peNDF Optimal inclusion of peNDF will ensure that the cow
chews her cud well enough and in the process secrete enough saliva that helps to control rumen pH
Ruminal pH is primarily determined by the balance between the quantity of fermentation acid produced and
the buffer secretion during chewing (Allen 1997)
7
25 Forage classification
Good forage sources are the foundation of efficient dairy production (Morrison 1959) A large variety of
feeds can be defined as forages (Baloyi 2008) as listed in Table 21 By definition forages are the edible
fractions of plants other than grain that can be harvested for feeding or used as feed for grazing animals
(Forage amp Grazing Terminology Committee 1991) The definition also states that feedstuff must contain
35 or more NDF to be classified as forage (Zinn amp Ware 2007)
It is of utmost importance to remember that a high producing dairy cowrsquos digestible nutrient and net energy
requirements cannot be met by forage alone Generally dairy cows are fed good quality forages and then
supplemented with additional grains or other concentrates in order to meet their requirements
Table 21 Feed types that fall within the definition of forage (adapted from Wilkens 2000)
Forage Feed types
Herbage Leaves roots of non-woody species stems sown and
permanent grasslands crops that may be cut or grazed
Hay Grasses and legumes that have been cut dried and
stored for use as animal feed
Silage
Browse
Fermented high moisture fodder
Leaves bud and twigs of woody species
Straw Dry stalk of cereal plant after the grain or seed has been
removed
251 Factors influencing forage nutritive value
Chemical composition digestibility and the physical characteristics of the digested feed determines the
nutritive value of forage (Goosen 2004) Forages between and within species differ significantly in
composition and nutritive value as indicated in Table 22
8
Table 22 Energy (MJkg DM) and protein (gkg DM) content of different classes of forages (Wilkens 2000)
Forage class Metabolizable energy
MJkg DM
Crude protein
gkg DM
Temperate grasses hays and silages
70-130 60-250
Tropical grasses
50-110 20-200
Maize silage
100-120 60-120
Cereal straw
50-80 20-40
Root crops
110-140 40-130
Kale and rape 90-120 140-220
Age and maturity soil fertility and environmental conditions are the primary factors influencing the nutritive
value of forages Herbage maturity has the largest influence on forage nutritive value (Buxton amp Mertens
1995) Mature forages have higher lignin and cell wall contents that limit fibre utilization due to the rate and
degree of plant cell hydrolysis (Van Soest 1994)
2511 Age and maturity
Young plants are tender with less structural carbohydrates (hemicellulose and cellulose) and lignin compared
to mature plants (McDonald et al 2002) Lignin is indigestible explaining the higher digestibility in younger
plants As plants mature the stems and leaves become lignified decreasing the nutritive value of the plant
due to the lower digestibility of nutrients enclosed in the cell walls (Morrison 1959) Leaves have lower cell
wall content than stems As the plant matures there is an increase in the proportion of stems compared to
leaves thus contributing to the lower digestibility of mature plants (Van Soest 1994)
2512 Soil fertility and environment
Environmental factors that affect forage quality the most are temperature light water and soil fertility (Van
Soest 1994) The mineral content in soil influences not only the crop yield but also its composition
Fertilizers can have a great influence on the nutrient content of soils Fertilized pastures grow better are
more palatable and have higher protein vitamin and mineral contents than unfertilized pastures (Morrison
1959)
9
26 Fibre
Fibre is composed of an indigestible fraction and several potentially digestible fractions that occupy space in
the gastrointestinal tract of ruminants (Mertens 1997) The primary components of fibre are cellulose
hemicellulose and lignin In the rumen feed is digested through microbial fermentation and the physical
breakdown of feed through rumination (Ishler amp Varga 2001) The type of diet fed influences and change
bacteria population in the rumen in order to successfully digest the food used by the cows The level to
which fibre will digest depends on the particle size rumen pH and fibre level in the diet
27 Van Soest forage fraction analysis
Fibre lignin and protein are the three most important chemical fractions determining nutrient supply and
performance (Mould 2003) According to Van Soest (1994) chemical analysis measures digestibility and
intake using the statistical relationship between feed quality and the analyzed feed components The
proximate analysis divided feedstuff into six fractions namely moisture crude protein ash ether extract
nitrogen-free extract and crude fibre (Fisher et al 1995) Van Soest (1994) claimed that the proximate
analysis had one serious error namely that the proximate analysis divided carbohydrates into crude fibre
and nitrogen-free extract Van Soest then developed an analysis specifically for fibre-rich feeds that
replaced the proximate analysis The method of Van Soest predicts intake and the nutritive value of
feedstuffs by determining the fibre fractions according to the degradability of fractions insoluble in neutral
detergent and fractions insoluble in acid detergent (Goosen 2004) Acid detergent fibre determines the
cellulose and lignin content and NDF the cellulose hemicellulose and lignin The difference between NDF
and ADF gives the hemicellulose content (Knudsen 2001) Table 23 gives an outlay of the components
soluble and insoluble in NDF
Table 23 Forage fraction classification using the method of Van Soest (Van Soest amp Wine 1967)
Fraction Components
Cell contents (soluble in neutral detergent) Lipids
Sugar organic acids
Water-soluble matter
Pectin starch
Non-protein nitrogen
Soluble protein
10
Table 23(continue) Forage fraction classification using the method of Van Soest (Van Soest amp Wine 1967)
Cell wall contents (insoluble in neutral detergent)
1 Soluble in acid detergent Fibre-bound protein
Hemicellulose
2 ADF Cellulose
Lignin
Lignified N
Silica
28 In vitro techniques for evaluating feed resources
In vitro methods used to evaluate feed resources are less time-consuming and less expensive than in vivo
methods The in vitro gas production procedure measures the amount of gas produced or collected
recording it manually (Theodorou et al 1994) or automatically (Pell amp Schofield 1993 Davies et al 2000)
This procedure thus generates kinetic data rather than digested feed disappearance (Baloyi 2008) Gas
production gives a description of the microbial activity and how micro-organisms respond to a specific
substrate thereby giving a practical imitation of what happens in the rumen Pell et al (1998) used in vitro
gas production to measure the rate and extent of fermentation VFA production and microbial protein (MP)
production The biggest advantage of the gas production technique is that there is no need to terminate the
gas production in order to measure the extent of digestion The disadvantage of this technique however is
the lack of uniformity in methodology and factors such as pH and temperature that may affect a feedrsquos gas
production (Getachew et al 1997) The traditional two-stage method (Tilley amp Terry 1963) involved an in
vitro fermentation of forages in rumen fluid followed by pepsin digestion The disadvantage of this
technique however is that it is an end-point measurement thus giving no indication on forage digestion
kinetics (Theodorou et al 1994) Goering amp Van Soest (1970) modified the procedure to accurately
estimate the true DM digestibility by treating the residue with a ND solution (Baloyi 2008) The method of
Goering and Van Soest however are also an end-point measurement thus giving no indication on forage
digestion kinetics (Theodorou et al 1994) ANKOM technology developed a technique that simplifies in vitro
digestibility evaluations using an insulated incubator (Daisy II incubator) (Baloyi 2008) The ANKOM
technique predict potential and true digestibility in vitro accurately faster and with less labour
29 Carbohydrates
Carbohydrates can be classified into two groups (structural carbohydrates and non-fibrous carbohydrates)
based on their function in plants (see Figure 21) Structural carbohydrates which are located in the plantrsquos
cell walls are very fibrous and are digested slowly Non-fibrous carbohydrates are located in the plantrsquos
11
leaves and seeds Non-fibrous carbohydrates are easily digested and include starches sugars fructans and
organic acids (Ishler amp Varga 2001)
Acid detergent fibre and NDF are the most universal way of analyzing fibre It is important to note that
although pectins are part of the cell wall they are grouped as non-structural carbohydrates The reason for
this is because pectin other than hemicellulose is entirely fermentable by rumen micro-organisms (Van der
Merwe amp Smith 1991)
Figure 21 Structural and non-structural carbohydrates of plants where ADF = acid detergent fibre szlig-
glucans = (1 rarr 3) (1 rarr 4)-szlig-D-glucans NDF = neutral detergent fibre NDSF = neutral detergent-soluble
fibre (includes all non-starch polysaccharides not present in NDF) NSC = non-NDF carbohydrates (Ishler amp
Varga 2001)
291 Non-fibre carbohydrates non-structural carbohydrates
Non-fibre carbohydrates are the major source of energy for high producing dairy cattle all around the world
Non-fibre carbohydrates are very palatable and easily digested but fermentation varies with type of feed and
means of processing Increasing NFC in the diet fulfils the high energy demands of a lactating dairy cow but
at the expense of NDF (NRC 2001)
The non-structural component of plants can be identified by two different methods chemical analysis (which
uses enzymes to determine the level of starch and sugar in the feed) or difference calculations (which use
NDF crude protein fat and ash to estimate NFC) (Stokes 1997) Russell et al (1992) reported that greater
amounts of NFC in dairy cow diets increase the production of MP Thus NFC in diets for lactating cows has
the potential to increase MP synthesis as well as the efficiency of ruminal undegradable protein utilization
(Casper et al 1990) It must however be emphasized that MP yield differs with different NFC sources
12
Different NFC sources require different inclusions of rumen degradable protein and rumen undegradable
protein in order for an animal to reach optimal performance (Mertens et al 1994)
Milk production per cow is the major factor determining any dairy farmrsquos profitability The inclusion of NFC is
a fashionable way to increase energy density and thus milk production of the dairy herd Replacing part of
the starch in the diet with sugar leads to higher fermentation rates and more MP This might be due to the
fact that sugar digests at a rate of 300 per hour whereas starch digests at a rate of 6 ndash 60 per hour
(Carver 2007) Research has also shown that additional supplementary sugar in feed has the power to
increase feed intake milk yield and fat content of milk due to better fibre digestion and production of MP in
the rumen (Lykos et al 1997)
The importance of adequate amounts of NFC cannot be over emphasized Feeding inadequate amounts of
NFC reduces the energy available from propionic and lactic acid production reduces MP synthesis and
decrease fibre digestion Overfeeding of NFC depress fibre digestion and acetic acid production (lowering
milk fat percentages)
It is important to note that NFC and NSC is not the same in all feeds The difference between these two is
caused by the input of pectin and organic acids Pectin is always included in NFC but not in NSC (NRC
2001) Numerous research experiments investigated the effect of NFC on ruminal pH Knowledge of the
individual as well as a combination of supplemented NFC fermentation characteristics can be helpful in
predicting an animalrsquos performance (Holtshausen 2004)
2911 Sugar
Simple sugars are rapidly fermented in the rumen (at a rate of 300 per hour) and are composed of one or
two units of sugar Sugars commonly fed to dairy cows include sucrose lactose and dextrose Initially
sugar was used in diets to improve the palatability of the feed Recently it was discovered that rumen micro-
organisms respond to sugar by increasing their production of MP leading to higher milk production The
addition of sugar to the feed also helps rumen micro-organisms capture and utilize diet nitrogen Even
though sugar has very advantageous effects on rumen micro-organisms and their actions it is important not
to add too much sugar in dairy cow diets as it can cause ruminal acid-spikes resulting in acidosis (De
Ondarza 2000)
2912 Starch
The NFC in most grain-based diets is made up of starch (24 ndash 28 of the total ration DM) Starch
digestibility plays an important role in the milk production of dairy cows Maize and barley (being cereal
grains) provide most of the starch in a dairy cowrsquos diet Theoretically starch is units of glucose bonded
together Depending on the starch source and method of processing the glucose units can be firmly bonded
or weakly connected This is the main reason why some starches ferment rapidly and others slowly in the
13
rumen of dairy cows Ruminal digestion of starch can vary from 6 ndash 60 per hour depending on the starch
source and processing method used The goal of feeding starch is to achieve maximum total tract
digestibility and maximum MP production without causing ruminal health problems due to production of
fermentation acids (De Ondarza 2000)
2913 Pectin
Pectin is one of the three most essential structural components in forages and is found primarily in the
intercellular layers of plant tissues Pectin diminishes as the plant gets older Most feeds consumed by
dairy cows are low in pectin (2 ndash 3) but several feeds may contain higher concentrations such as citrus
pulp (15) beet pulp (15 ndash 20) and lucerne (3 ndash 10) Pectin contributes to the energy requirements of
rumen micro-organisms (75 ndash 90 of pectin fermentation takes place in the rumen) (Allen 2001)
Many of the species that break down pectin also digest plant components such as cellulose and
hemicellulose Pectin is extremely fermentable and highly digestible but this does not appear to lower pH as
is often seen with starch digestion Due to this feeds containing pectin are often supplemented into high
concentrate dairy diets to avoid problems associated with rumen acidosis (Mohney 2002)
A study done by Dehority (1969) found that a number of different rumen bacteria are capable of fermenting
pectin (using it as a carbon source) eg Butyrivibrio fibrisolvens Prevotella ruminicola Lachnospira
multiparus Treponema bryantii and Succinivibrio dextrinosolvens Later studies discovered that the
products of the hydrolysis (by Lachnospira multiparus bacterium) of pectic material can be used by other
ruminal micro-organisms such as Selenomonas ruminantium Fusobacterium sp Eubacterium ruminantium
and Succinivibrio dextrinosolvens (Paggi et al 2005)
2914 Sugar vs Starch
Leiva et al (2000) investigated the effect of two maize silagelucerne hay-based diets on ruminal pH The
only difference between these two diets was that their NFC came from either starch (hominy) or sugars
(dried citrus pulp) From this trial it was concluded that the pH declined more rapidly on citrus diets (sugar)
than on hominy (starch) diets and also reaching the lowest pH point faster (Figure 22)
14
Figure 22 Ruminal pH results for citrus and hominy rations where CPD = citrus pulp diet and HD = hominy
diet (Leiva et al 2000)
From the studies done by Leiva et al (2000) it was observed that starch has the best chance of increasing
milk production However the problem with high starch diets is that they are likely to cause serious rumen
acidosis One way to ensure healthy rumens as well as high milk production is to use peNDF as a
benchmark The more peNDF a cow consumes the more starch may be included in the diet Physical
effective neutral detergent fibre thus lowers the risk of ruminal acidosis The effect of supplementing sugar
to forage based diets is shown in Table 24
Table 24 The effect of sugar on dairy cattle performance
MP = microbial protein OM = organic matter DMI = dry matter intake
210 Non-fibre carbohydrate digestibility
Non fibre carbohydrates are composed of starch and sugar Starch digestibility has a major effect on the
rumen Starch fermentation varies with processing and type of grain fed Processing such as grinding
Reference Forage Source Supplements Intake g DM day Animal Response
Chamberlain et al
1985
Grass Sugar 9072 g sugar MP synthesis uarr
Huhtanen 1988 Grass Molasses 9979 g molasses
(499 g sugar)
OM digestion amp
MP production uarr
Nombekela amp
Murphy 1995
Lucerne Haylage
amp Maize Silage
Sucrose 2858 g sucrose Milk yield (9072 g)
amp DMI uarr
15
steaming and ensiling affects ruminal availability of starch Processing mostly increases rate of fermentation
and digestibility of starch Soluble sugar ferments rapidly in the rumen and is readily available as energy
sources for the animal (Ishler amp Varga 2001) Mature grains (maize or oats) usually contain a small amount
of sugar because most has been converted to storage polysaccharides Forages (pasture or hay) usually
contain a lot of sugars The level of sugar in hay is depended on crop management Byproducts (molasses
citrus pulp and almond hulls) contain high levels of sugars However the variation in processing methods
(as in the case of starch) and the type of material used can lead to large variation in sugar content (Hall
2002)
One problem with diets high in NFC is the fact that it lowers the rumen pH increasing the risk of acidosis
The main reason for this is NFC fast fermentability especially if it replaces fibre in low fibre diets Acidosis in
turn affects ruminal digestion intake metabolism milk fat production milk production as well as rumen and
animal health The NFC levels of various feed types are shown in Table 25
Table 25 Non-fibre carbohydrate levels for various ration types (Ishler amp Varga 2001)
211 Non-fibre carbohydrate fermentation and organic acid production
The rate and extent of carbohydrate fermentation determines the concentration of organic acids produced
Rumen micro-organisms digest simple and complex carbohydrates (fibre) by converting them into VFA
(mainly acetic propionic and butyric acid) These VFA are the most important energy source for ruminants
Volatile fatty acids account for 60 ndash 70 of metabolizable energy supply in ruminants making it of great
importance in the production of milk by dairy cows Reduction in fibre digestion leads to a reduction in
ruminal pH This is caused by rapid NFC fermentations leading to increased VFA production by rumen
micro-organisms
Typical NFC level Typical feedstuffs
33 ndash 36 Barley oats high moisture- steam flaked-
and finely ground grain predominate the
concentrate portion of the diet
37 ndash 39
High quality hay crop forages
predominates the ration maize silage
rations include non-forage fibre sources
40 ndash 42
Coarsely processed maize is used diet
has a high inclusion level of non-forage
fibre sources
16
Feeding large amounts of forage produces greater amounts of acetic acid whilst resulting in lesser amounts
of propionic and butyric acid On the other hand feeding grain or other finely ground forages may lead to a
reduction in acetic acid while the amount of propionic acid may increase The ratio of acetic to propionic
acids imitates the rumen fermentation pattern Under an optimal rumen fermentation environment the acetic
to propionic ratio should be greater than 221 High planes of acetate can point to a low fermentable
carbohydrate high fibre ration High planes of propionic acid on the other hand can point to reduced fibre
digestion and acidosis (University of Minnesota 1996)
A study done by Strobel amp Russel (1986) found that pectin fermentation increased acetate concentrations
further compared to starch and sucrose The study concluded that the increased acetate might ultimately
contribute to increase precursors for fatty acid and milk fat synthesis in lactating dairy cows Fermentation
studies done with sucrose and starch on the other hand increased butyrate production (Hoover et al
2006) Butyrate has shown to be an important precursor of energy supplied to skeletal and heart muscles
(Holtshausen 2004) Sugar ferments extremely fast in the rumen Without linkages to other carbohydrates
and due to the high solubility of sugars there is little to impede microbial fermentation (Hall 2002) Several
studies reported that sugar has a much higher potential for lactate production when compared to other NFC
sources (for example starch) (Strobel amp Russel 1986 Heldt et al 1999)
212 Ruminal acidosis
Micro-organisms in the rumen obtain energy primarily from fermentation of carbohydrates Acidosis occurs
when the diet of ruminants is suddenly changed from a forage based diet to a predominant concentrate diet
The highest risks come from diets that are high in starch or fast fermentable carbohydrates and the effective
fibre is below the recommended level or the particle size is too small This leads to higher VFA production
as well as very high glucose levels in the rumen Subsequently ruminal osmolarity increases leading to
ruminal acidity The increase in osmolarrity is due to the negative effect the high glucose level has on
Streptococcus bovis and lactic acid-producing micro-organisms (Henning 2004) Acidosis can be divided
into sub-acute ruminal acidosis and acute acidosis as seen in Table 26
Table 26 Comparison of acute and sub-acute acidosis (Henning 2004)
Acidosis Item Acute Sub-Acute
Clinical Signs Present Absent
Systemic Acidosis Present Absent
Mortality Yes No
Ruminal pH lt 50 50 -55
17
Table 26(continue) Comparison of acute and sub-acute acidosis (Henning 2004)
Ruminal Acids
Lactic Acid High (50-100mM) Normal (0-5mM)
Volatile Fatty Acids Below Normal (lt100mM) High (150-200mM)
Ruminal Bacteria
Lactic Acid Producers Very High Normal to Small Increase
Lactic acid Utilisers Significant Reduction Increase
Ruminal Protozoa Absent or Reduced Absent or Reduced
Indicators determining whether ruminal acidosis is accruing in the herd include (Ishler amp Varga 2001)
Milk fat percentage (darr milk fat ndash darr ruminal pH)
Chewing activity (darr rumination ndash uarr ruminal acidosis)
Laminitis (uarr laminitis ndash uarr ruminal acidosis)
Strategies for avoiding acidosis
Provide good quality total mixed rations
Give small but frequent meals
Avoid abrupt changes in diets
213 Conclusion
Achieving maximum production and maintaining a healthy rumen ecosystem at the same time is a balancing
act A cow will attain more VFA when fermentation is maximized These VFA are used as energy
precursors and to synthesize MP Increased fermentation however goes together with increased acid
production and a lower rumen pH Low rumen pH can lead to metabolic disorders due to impaired fibre
digestion Thus by increasing the peNDF intake the risk of acidosis can be reduced effectively
Non-fibre carbohydrates are the essential source of energy for high producing dairy cattle One problem with
diets high in NFC however is the fact that it lowers the rumen pH increasing the risk of acidosis This is
mainly due to the fast fermentability of NFC especially if it replaces fibre in low fibre diets Acidosis in turn
affects ruminal digestion intake metabolism milk fat production and milk production as well as rumen and
animal health
A better understanding of the workings of the rumen as a whole ecosystem as well as ensuring optimal
sugar starch and peNDF in dairy cow ration will enable farmers to maintain the fine balance between
productivity and acidosis
18
Whilst the goal of any modern agricultural enterprise is to maximize profits special care should be taken not
to increase short-term profits at the cost of long-term viability A dairy cowrsquos productivity can easily be
increased whilst the animalrsquos health could suffer in the long term In the modern scenario the farm is as
much a profit-seeking enterprise as any other business With this in mind the modern farmer in his capacity
as a business manager should ensure the well-being and optimal performance of his assets
214 References
Allen MS 1997 Relationship between fermentation acid production in the rumen and the requirement
for physically effective fiber J Dairy Sci 80 1447 - 1462
Allen M 2001 Formulating lactating cow diets for carbohydrates In Proceedings of the 5th Western Dairy
Management Conference April 4 - 6 Las Vegas Nevada USA pp 79 - 86
Baloyi TF 2008 Effects of exogenous fibrolytic enzymes on in vitro fermentation kinetics of forage and
mixed feed substrates MSc (Agric) thesis Stellenbosch University Stellenbosch South Africa pp 1 -
28
Buxton DR amp Mertens DR 1995 Quality-related characteristics of forage In Forages An introduction to
grassland agriculture (2nd Ed) Eds Barnes RF Miller DA and Nelson CJ Iowa State University
Press Ames Iowa USA pp 83 - 96
Carver LA 2007 Sugar aids lactating dairy cattle production Feedstuffs 79(2) 1 - 3
Casper DP Schingoethe DJ amp Esenbeisz WA 1990 Response of early lactation dairy cows fed diets
varying in source of nonstructural carbohydrate and crude protein J Dairy Sci 73 1039 - 1050
Chamberlain DG Thomas PC Wilson W Newbold CJ amp MacDonald JC 1985 The effects of
carbohydrate supplements on ruminal concentrations of ammonia in animals given diets of grass
silage J Agric Sci Cam 104 331 - 340
Davies ZS Mason D Brooks AE Griffith GW Merry RW amp Theodorou MK 2000 An automated
system for measuring gas production from forages inoculated with rumen fluid and its use in
determining the effect of enzymes on grass silage Anim Feed Sci Technol 83 205 - 221
Dehority BA 1969 Pectin-fermenting bacteria isolated from bovine rumen J Bacteriol 99 189 - 196
De Ondarza MB 2000 Non-fibre carbohydrates
Available at httpwwwmilkproductioncomLibraryArticlesNon_Fibre_Carbohydrateshtm
(Accessed 5 August 2008)
19
Fisher DS Burns JC amp Moore JE 1995 The nutritive evaluation of forage In Forages An introduction
to grassland agriculture (1st Ed) Eds Barnes RF Miller DA amp Nelson CJ Iowa State University
Press Ames Iowa USA pp 105 - 115
Forage amp Grazing Terminology Committee 1991 Vegetation terms In Terminology for grazing lands and
grazing animals Pocahontas Press Inc Blacksburg Virginia USA
Getachew G Makkar HPS amp Becker K 1997 The in vitro gas coupled with ammonia measurements for
evaluation of nitrogen digestibility in low quality roughages using incubation measurements of different
measuring capacity J Sci Food Agric
Goering HK amp Van Soest PJ 1970 Forage fibre analysis (apparatus reagents procedures and some
applications) Agricultural Handbook Number 379 ARS-USDA Washington DC USA
Goosen L 2004 The effect of an exogenous fibrolytic enzyme on forage digestibility parameters MSc
(Agric) thesis Stellenbosch University Stellenbosch South Africa pp 1 - 27
Hall MB 2002 Working with sugars (and molasses) In Proceedings of the 13th Annual Florida Ruminant
Nutrition Symp January 11 - 12 Gainesville Florida USA pp 146 - 158
Heldt JS Cochran GL Stokka GL Farmer CG Mathis CP Titgemeyer EC amp Nagaraja TG
1999 Effects of different supplemental sugars and starch fed in combination with degradable intake
protein on low-quality forage use by beef steers J Anim Sci 77 2793 - 2802
Henning P 2004 Acidosis in high-producing ruminants - myth or menace Animal Feed Manufacturers
Association (AFMA) South Africa pp 1 - 9
Available at httpwwwengormixcome_articles_viewaspart=529ampAREA=GDC
(Accessed 5 Augustus 2008)
Holtshausen L 2004 Effect of nonfibre carbohydrates on product yield and fibre digestion in fermentations
with mixed ruminal microbes PhD thesis University of Florida Gainesville Florida USA pp 1 - 33
Hoover WH Tucker C Harris J Sniffen CF amp De Ondarza MB 2006 Effects of nonstructural
carbohydrate level and starchsugar ratio on microbial metabolism in continuous culture of rumen
contents Anim Feed Sci Technol 128(3 - 4) 307 - 319
Huhtanen P 1988 The effects of barley unmolassed sugar-beet pulp and molasses supplements on
organic matter nitrogen and fibre digestion in the rumen of cattle given a silage diet Anim Feed Sci
Technol 20 259
20
Ishler V Heinrichs J amp Varga G 1996 From feed to milk Understanding rumen function Pennsylvania
State University Extension Circular 422
Available at httpanimsciagrenvmcgillcacourses450extrafeed_to_milkconceptshtml
(Accessed 25 August 2008)
Ishler V amp Varga G 2001 Carbohydrate nutrition for lactating dairy cattle Pennsylvania State University
Code DAS 01 - 29 (online) pp 1 - 11
Available at httpwwwdaspsueduteamdiary
(Accessed 5 August 2008)
Kamra DN 2005 Rumen microbial ecosystem Current Science 89(1) 124 - 135
Knudsen KE 2001 The nutritional significance of lsquodietary fibrersquo analysis Anim Feed Sci Technol 90 3 -
20
Leiva E Hall MB amp Van Horn HH 2000 Performance of dairy cattle fed citrus pulp or corn products as
sources of neutral detergent-soluble carbohydrates J Dairy Sci 83 2866 - 2875
Lykos T Varga GA amp Casper D 1997 Varying degradation rates of total nonstructural carbohydrates
effects on ruminal fermentation blood metabolites and milk production and composition in high
producing holstein cows J Dairy Sci 80(12) 3341 - 3355
McDonald P Edwards RA Greenhalgh JFD amp Morgan CA 2002 Evaluation of food Digestibility In
Animal Nutrition (6th Ed) Pearson Education Ltd Edinburgh Gate Harlow Essex UK pp 246 - 263
Mertens DR 1997 Creating a system for meeting the fibre requirements of dairy cows J Dairy Sci 80
1463 - 1481
Mertens D R Broderick GA amp Simons R 1994 Efficacy of carbohydrate sources for improving
utilization of N in alfalfa silage J Dairy Sci 77(Suppl 1) 240 - 252
Mohney K 2002 Synchronization of carbohydrate and protein metabolism by ruminal microbes in
continuous culture PhD thesis North Carolina State University Raleigh North Carolina USA pp 1 -
69
Morrison FB 1959 Feeds and feeding A handbook for the student and stockman (22nd Ed) Eds The
Morrison Publishing Company Clinton Iowa USA 1165 pp
Mould FL 2003 Predicting feed quality - chemical analysis and in vitro evaluation Field Crops Research
84(1) 31 - 44
21
National Research Council (NRC) 2001 Nutrient requirements of dairy cattle (7th Rev Ed) National
Academy Press Washington DC USA pp 34 - 35
Nocek J E amp Tamminga S 1991 Site of digestion of starch in the gastrointestinal tract of dairy cows and
its effect on milk yield and composition J Dairy Sci 74 3598 - 3629
Nombekela S W amp Murphy MR 1995 Sucrose supplementation and feed intake of dairy cows in early
lactation J Dairy Sci 78 880 - 885
Paggi RA Rodriguez C amp Fay JP 2005 Growth and pectate-lyase activity of the ruminal bacterium
lachnospira multiparus in the presence of short-chain organic acids Lett Appl Microbiol 41 434 -
439
Pell AN amp Schofield P 1993 Computerized monitoring of gas production to measure forage digestion in
vitro J Dairy Sci 76 1063 - 1073
Pell AN Pitt RE Doane PH amp Shofield P 1998 The development use and application of gas
production techniques at Cornell University USA In In vitro techniques for measuring nutrient supply
to ruminants Eds Deaville ER Owen E Adesogan AT Rymer CHuntington JA amp Lawrence
TLJ British Society of Animal Science Edinburgh UK Publication 22 45 - 54
Russell JB OrsquoConnor JD Fox DG Van Soest PJ amp Sniffen CJ 1992 A net carbohydrate and
protein system for evaluating cattle diets Ruminal fermentation J Anim Sci 70 3551 ndash 3561
Schwarz FJ Haffner J amp Krichgessner M 1995 Supplementation of zero-grazed dairy cows with
molassed sugar beet pulp maize or cereal-rich concentrate Anim Feed Sci Technol 54 237 - 248
Stobel HJ amp Russel JB 1986 Effect of pH and energy spilling on bacterial proteien synthesis by
carbohydrate-limited cultures of mixed rumen bacteria J Dairy Sci 69 2941 - 2947
Stokes SR 1997 Balancing carbohydrates for optimal rumen function and animal health In Proceedings
of the West Can Dairy Sem 9 73 - 86
Available at httpwwwwcdsafnsualbertacaProceedings1997ch06-97htm
(Accessed 7 October 2008)
Theodorou MK Williams BA Dhanoa MS McAllan AB amp France J 1994 A simple gas production
method using a pressure transducer to determine the fermentation kinetics of ruminant feeds Anim
Feed Sci Technol 48 185 - 197
Tilley JMA amp Terry RA 1963 A two-stage technique for the in vitro digestion of forage crops J Br
Grassl Soc 18 104 - 111
22
University of Minnesota 1996 Feeding the dairy herd (online)
Available at httpwwwextensionumnedudistributionlivestocksystemscomponentsDI0469-02
(Accessed 5 August 2008)
Van der Merwe FJ amp Smith WA 1991 Dierevoeding Kosmo Publ Stellenbosch South Africa pp 89 -
141 (in Afrikaans)
Van Saun RJ 1993 Dairy cattle nutrition feeding for two In Proceedings of the 1993 Northwest and
Lower Columbia Dairy Short Course January 21 - 22 amp 25 - 26 Everett Washington and Portland
Oregon USA pp 172 - 180
Van Soest PJ 1994 Nutritional ecology of the ruminant (2nd Ed) Cornell University Press Ithaca New
York USA pp 467 - 476
Van Soest PJ amp Wine RH 1967 Use of detergents in the analysis of fibrous feeds IV Contamination of
Plant Cell-wall Constituents J Assoc Off Anal Chem 50 50 - 55
Wilkins RJ 2000 Forages and their role in animal systems In Forage evaluation in ruminant nutrition
Eds Givens DI Owen E Axford RFE Omed HM CAB International Wallingford UK pp 1 -14
Zinn RA amp Ware RA 2007 Forage quality Digestive limitations and their relationships to performance of
beef and dairy cattle 22nd Annual Southwest Nutrition amp Management Conference February 22 - 23
University of California Davis Caifornia USA
Available at httpagarizonaeduansswnmc2007talksZinn_2007SWNMCpdf
(Accessed 16 September 2008)
23
Chapter 3
THE EFFECT OF SUGAR STARCH OR PECTIN ON RATE AND
EXTENT OF GAS PRODUCTION IN DIFFERENT FORAGES
Abstract
The study evaluated the effect of sugar (molasses) starch (maize meal) or pectin (citrus pulp) on total gas production (b)
and rate of gas production (c) of different forages The forage substrates included wheat straw (WS) oat hay (OH)
lucerne hay (LUC) ryegrass (RYE) and kikuyu grass (KIK) The three energy sources as well as a control (no energy
source) were incubated in vitro with each of the above mentioned forages Rumen fluid was collected from two lactating
Holstein cows receiving a diet consisting of oat hay lucerne wheat straw and a concentrate mix Forages alone andor
together with either molasses citrus pulp or maize meal were weighed into 100 ml glass vials and incubated for 72
hours The weights of the energy sources were calculated on an energy equivalent basis Blank vials that contained no
substrates were included to correct for gas production from rumen fluid alone The substrates were incubated in a
mixture of 40 ml buffered medium 2 ml of reducing solution and 10 ml rumen fluid Gas pressure was recorded
automatically every five minutes using a pressure transducer system and the method based on the Reading Pressure
Technique Gas pressure was converted to gas volume using a predetermined regression equation In the first trial the
gas production included gas produced by the energy sources while in the second trial the energy source gas production
was deducted from the total gas production to determine the effect of energy source on gas production of respective
forage substrates per se Data were fitted to two non-linear models Significant forage x energy interactions were
observed for the non-linear parameter b (gas production) in Model 1 and for b and L (lag phase) in Model 2 in both trials
In the first trial the higher fermentability of the energy sources supplemented to forage substrates increased b (Model 1
amp 2) of the LUC and WS (P lt 005) The gas production rate was affected in different ways for different forages with the
most noticeable effect when WS was supplemented with energy sources All the energy sources increased c of WS
irrespective of the model used Energy sources had no effect on the L of LUC OH or RYE but decreased the L of WS (P
= 0004) and KIK (P = 0022) In the second trial maize meal had no effect on b for any of the forages (Model 1 amp 2)
while molasses (Model 1 amp 2) decreased b for all forage substrates and citrus pulp (Model 1 amp 2) decreased b of OH and
RYE to lower values than those of the control treatments Gas production rate was not affected by molasses for any of
the forage substrates while citrus pulp (Model 1 amp 2) increased c of OH and maize meal increased c of OH and KIK
Lag phase was only affected by energy sources in WS (P = 0001) and KIK (P = 0009) where all the energy sources
had lower L values than the control treatment It was concluded that forage fermentability is affected differently by
different energy sources These observations may have important implications for rumen health and milk production
and the data obtained can potentially be used as guidelines in feed formulations
31 Introduction
Forages contribute significant major part of dairy cow diets However forages alone cannot provide all the
energy requirements of high producing dairy cows (Schwarz et al 1995) Forage degradation by rumen
micro-organisms is restricted by the chemical composition and physical quality of the forage (Mertens 1997)
Fibrous feeds are low in energy and a large consumption thereof results in rumen fill thus limiting feed intake
24
(Allen amp Oba 2000) It is important to find ways to improve forage degradation and utilization
Improvements in forage degradation will increase energy intake and subsequently milk production and
performance (Giraldo et al 2008)
Different sources of non-fibre carbohydrates (NFC) have different effects on animal performance
Supplementing forage based diets with energy sources containing sugar starch or pectin results in variation
of performance measurements such as milk yield milk composition dry matter intake (DMI) and feed
efficiency (Larson 2003) Aldrich et al (1993) reported that feeding high rumen-available NFC increased
milk protein percentage slightly (301 vs 307) but significantly Leiva et al (2000) showed that
substituting diets containing 205 citrus pulp for diets containing 195 corn meal yielded more milk
Solomon et al (2000) however reported that substituting starch (maize) diets with pectin (citrus pulp) diets
had no effect on milk yield but increased linoleic acid concentration in milk fat When formulating diets for
dairy cows it is important to understand the digestion and metabolizable nutrient yield of the various NFC
sources (Larson 2003)
The objective of this study was to determine the impact of three energy sources viz maize meal
(representative of starch) molasses (representative of sugar) and citrus pulp (representative of pectin) on
fermentation kinetics of different forage substrates as determined by total gas production (b) and the rate of
gas production (c) Forages commonly used in dairy cow diets in South Africa (wheat straw oat hay lucerne
hay kikuyu and ryegrass) were used as substrates
32 Materials and methods
321 Study area
The study to evaluate the effect of supplementing forage based diets with sugar starch and pectin on rumen
kinetic parameters was conducted at Stellenbosch University Stellenbosch South Africa (33deg 55prime 12Prime S
18deg 51prime 36Prime E)
322 Simulated diets
3221 Basal forages
Five forages (Table 31) were used to prepare rations to simulate diets for lactating dairy cows
25
Table 31 Forages used in simulation diets for lactating dairy cows
Forage Type Abbreviation
Wheat straw (Triticum aestivum) WS
Oat hay (Avena sativa) OH
Lucerne hay (Medicago sativa) LUC
Ryegrass (Lolium multiflorum) RYE
Kikuyu grass (Pennisetum clandestinum) KIK
Rye and kikuyu grasses were harvested after four weeks of re-growth All the forages were oven dried at
60ordmC for 72 hours Wheat straw oat hay and lucerne hay were ground (Cyclotec 1093 mill) through a 2 mm
screen Rye and kikuyu grasses were obtained from the Outeniqua experimental farm (33deg 57prime 0Prime S
22deg 25prime 0Prime E) situated just outside George South Africa (33deg 58prime 0Prime S 22deg 27prime 0Prime E) The rye and kikuyu
grasses were already ground through a 1 mm screen when received
3222 Energy supplements
Three energy sources (Table 32) were selected as supplements to prepare rations that would simulate
lactating cow diets
Table 32 Energy sources used in simulating lactating dairy cow diets
Energy type Source Abbreviation
Starch Yellow maize meal (Zea mays) Mm
Sugar Molasses syrup Mol
Pectin Citrus pulp Cp
These energy feedstuffs were sourced in the following forms molasses as a syrup by-product from the
processing of sugar cane (Officinarum saccharum) citrus pulp as a finely granulated residue by-product from
the peel pulp and seeds of oranges and grapefruit and yellow maize grain The citrus pulp and maize was
milled (Cyclotec 1093 mill) through a 1 mm screen
3223 Defining the diets
A total of 23 simulated diets (forages and forage-concentrate mixes) were prepared
bull 5 diets contained forage substrates only (Table 31)
bull 3 diets contained energy sources only (Table 32)
bull 15 diets contained a mixture of forages (Table 31) and energy sources (Table 32)
26
The final substrate compositions are indicated in Table 34
323 Chemical analyses of forages and energy sources
Samples (1 g) of each forage type and energy sources (1 g) were accurately weighed and placed in a 100ordmC
conventional oven for 24 hours to determine dry matter (DM) content (AOAC 1995 Method 93015)
Organic matter was determined by weighing 1 g of each feedstuff into crucibles and ashing the content at
500ordmC in a muffle furnace for 6 hours (AOAC 1995 Method 94205)
The NDF content was determined by measuring 05 g of each feedstuff into F57 ANKOM fibre analysis bags
The bags were heat sealed and NDF determined using the method of Van Soest et al (1991) Sodium
sulfite (Na2SO3) was added to the NDF solution during digestion and heat-stable amylase was added during
rinsing Ether extract was determined using the AOAC method (AOAC 1995 Method 92039) About 2 g of
ground sample was weighed into a thimble and samples were extracted with diethyl ether (C4H10O)
Acid detergent lignin (ADL) was determined by measuring 05 g of each substrate sample into separate F57
ANKOM fibre analysis bags The bags were heat sealed and acid detergent fibre (ADF) determined using
the method of Van Soest et al (1991) The ADF residue was then soaked in 72 sulphuric acid for three
hours to dissolve the cellulose Acid detergent lignin was determined using the ANKOM method (ANKOM
2005)
Total nitrogen content was determined with a Leco Nitrogen Gas Analyzer custom designed and built by
LECO Africa (Pty) Ltd (Kempton Park) About 01 g of sample was accurately weighed into a small square of
aluminum foil The samples were then ignited inside the Leco furnace at about 900degC according to the
Dumas procedure (AOAC 1990 Method 96806) Crude protein (CP) was calculated by multiplying the
nitrogen content with 625 (AOAC 1995 Method 99003) The results obtained from the chemical analysis
are shown in Table 33
324 Preparation of samples for gas production
The gas production method used was based on the Reading Pressure Technique (Mauricio et al 1999)
Samples of the respective dietary substrates (Tables 34 and 35) were weighed into glass vials with known
volume The vials had a nominal volume of 100 ml but the exact volume of each vial was previously
accurately determined The amount of the energy sources in Table 35 were calculated to provide the same
amount of metabolizable energy (ME) than 0125 g maize DM For calculation purposes ME values were
assumed to be 139 MJkg DM for maize 122 MJkg DM for citrus pulp and 123 MJkg for molasses (NRC
2001) Blank vials were prepared exactly as the others except that they did not contain any substrates in
order to correct for gas production from rumen fluid alone
27
Table 33 Chemical composition (gkg DM plusmn SD) of forages and energy sources used in the trial All values
are on a DM basis
Feedstuff DM OM NDF CP EE ADL
WS 9150 plusmn 05 9022 plusmn 16 8179 plusmn 71 723 plusmn 10 36 plusmn 05 1022 plusmn 30
OH 8504 plusmn 23 9403 plusmn 173 7819 plusmn 110 910 plusmn 12 97 plusmn 08 825 plusmn 03
LUC 8989 plusmn 20 9062 plusmn 18 5153 plusmn 10 2370 plusmn 46 81 plusmn 06 927 plusmn 67
RYE 938 plusmn 10 845 plusmn 05 4892 plusmn 30 2509 plusmn 27 431 plusmn 01 448 plusmn 181
KIK 1242 plusmn 104 1122 plusmn 01 6512 plusmn 20 2534 plusmn 41 283 plusmn 11 480 plusmn 17
mm 8559 plusmn 09 9844 plusmn 13 1743 plusmn 550 1071 plusmn 02 377 plusmn 04 70 plusmn 06
cp 8799 plusmn 09 9285 plusmn 07 2614 plusmn 140 786 plusmn 18 164 plusmn 04 253 plusmn 64
mol 6980 plusmn 19 8927 plusmn 06 ND ND ND ND
DM = dry matter OM = organic matter NDF = neutral detergent fibre CP = crude protein EE = ether
extract ADL = acid detergent lignin ND = not determined WS = wheat straw OH = oat hay LUC = lucerne
RYE = ryegrass KIK = kikuyu grass mm = maize meal cp = citrus pulp mol = molasses
Table 34 Substrate samples containing either forage or energy supplements
Forage type Energy source Sample size (g DM)
Wheat straw - 02500
Oat hay - 02500
Lucerne hay - 02500
Ryegrass - 02500
Kikuyu grass - 02500
- Maize meal 01250
- Citrus pulp 01425
- Molasses 01412
28
Table 35 Composite dietary samples containing forage and energy sources
Forage type Energy source Forage (g DM) Energy (g DM)
Wheat straw Maize meal 01250 01250
Wheat straw Citrus pulp 01250 01425
Wheat straw Molasses 01250
01412
Oat hay Maize meal 01250 01250
Oat hay Citrus pulp 01250 01425
Oat hay Molasses 01250
01412
Lucerne hay Maize meal 01250 01250
Lucerne hay Citrus pulp 01250 01425
Lucerne hay Molasses 01250 01412
Ryegrass Maize meal 01250 01250
Ryegrass Citrus pulp 01250 01425
Ryegrass Molasses 01250
01412
Kikuyu grass Maize meal 01250 01250
Kikuyu grass Citrus pulp 01250 01425
Kikuyu grass Molasses 01250 01412
325 Preparation of the in vitro medium and reducing solution
The incubation medium was prepared as described by Van Soest amp Robertson (1985) The medium
consisted of micro minerals macro-mineral solution buffer solution tryptose rezasurin and distilled water
The medium was kept in a water bath at 395ordmC The pH of the medium was about 78 Reducing solution
was prepared as described by Van Soest amp Robertson (1985) and consisted of cysteine hydrochloride
(C3H7NO2HCL) potassium hydroxide (KOH) pellets sodium sulfide nonahydrate (Na2S9H2O) and distilled
water
326 Collection and preparation of rumen fluid
Rumen fluid was collected from two ruminally cannulated lactating Holstein cows The cows were confined
and received 25 kg per day (air dry basis) of a diet consisting of oat hay lucerne hay wheat straw and a
concentrate mix The total diet contained 11279 gkg CP 55948 gkg NDF and 5950 gkg ash with a
calculated ME content of 108 MJkg The diet was offered in two equal amounts viz 125 kg in the morning
(0630) and 125 kg in the afternoon (1630) Rumen fluid was squeezed through two layers of cheese cloth
into pre-warmed thermos flasks and a handful of solid material was added The rumen fluid was then
blended in a pre-warmed blender at a low speed for 10 seconds The rumen fluid was then filtered through
29
four layers of cheese cloth into pre-warmed beakers while flushing with carbon dioxide (CO2) The
temperature of the rumen fluid averaged 38ordmC and the pH averaged 58
327 In vitro incubation
The glass vials were flushed with CO2 while adding 40 ml of the medium and 2 ml of the reducing solution to
each vial A magnetic stirrer (02 ml) was also placed into each vial The vials were then lightly closed with
rubber stoppers and placed in the incubator at 39ordmC until the medium was reduced (ie clear) Vials were re-
opened and 10 ml of rumen fluid was added while flushing with CO2 The vials were then closed tightly with
rubber stoppers crimp sealed and connected via needles to a pressure logging system The vials were
placed on magnetic stirrer plates in an incubator at 39ordmC and were constantly stirred at a low speed The
material was incubated for 72 hours and gas pressure was recorded automatically every five minutes using a
pressure transducer system that was custom designed and built by Eagle Technology (Pty) Ltd (Cape Town)
based on the Reading Pressure Technique (RPT) (Mauricio et al 1999) Gas pressure was released on
regular intervals to prevent pressure build-up in the vials
328 Converting gas pressure to gas volume
Gas pressure data were converted to gas volume using the following linear regression equation developed
by Goosen (2004) for Department of Animal Sciencesrsquo in vitro lab
OMCXY )])09770((1000[=
Where Y = Gas volume (mlg OM)
X = Gas pressure (psi)
C = Vial head space (ml)
OM = Organic Matter (mg)
329 Estimating kinetic coefficients
Kinetic coefficients for gas production were derived from the gas volume data using the solver option in Excel
and the non-linear models 1 and 2 (with and without a lag phase respectively) The models are based on the
modified version described by Oslashrskov and McDonald (1979)
30
Model 1 ⎟⎠⎞
⎜⎝⎛ minusminus= ctebY 1
Model 2 ( )⎟⎠⎞
⎜⎝⎛ minusminusminus= LtcebY 1
Where Y = gas volume at time t
b = total gas production
c = rate of gas production
t = incubation time
L = lag time
33 Statistical analysis
The first derivatives b and c (Model 1) and b c and L (Model 2) were subjected to statistical analysis The
experiment was a two way cross classification and data was subjected to a factorial ANOVA with the factors
forage and energy using Statistica 81 (2008) This was done for all the non-linear parameters Main effects
were interpreted in the cases where no interaction was observed Significant forage x energy source
interactions were observed for the non-linear parameter b in Model 1 and for b and L in Model 2 Therefore
a one-way ANOVA was done on each of the forages to determine the effect of energy sources Differences
between means were determined with a Tukey test and significance was declared at P lt 005
34 Results and discussion
341 Gas production including that from the energy sources
Results of total gas (b) and rate (c) of gas production are presented in Table 36 Pasture grasses had
higher gas volumes than mature forages before substitution with energy sources Gas volume is generally a
good indicator of digestibility fermentability and microbial protein production (Sommart et al 2000)
Substitution with energy sources tended to raise gas production (Table 36) When maize meal replaced
50 of the forage substrate total 72 hour gas production was increased in the case of lucerne and wheat
straw irrespective of the model used In wheat straw total gas production was also increased with citrus
pulp supplementation (Models 1 amp 2) and with molasses (Model 2) For the other forages (oat hay ryegrass
and kikuyu) energy supplements did not have an effect on total gas production values The total (72 hour)
gas production values represent the sum of forage and energy source fermentations except for the control
31
treatment where the substrates were forages only The higher gas production values observed with energy
supplementation (especially for wheat straw) was due to the energy sources being more readily fermentable
and easily available to rumen micro-organisms Energy sources are also low in NDF and ADL (Table 33)
which would increase gas production as there exists a negative correlation between gas production and
plant cell wall content (Sallam 2005)
The rate of gas production (c) of forage substrates alone ranged between 003 and 009 mlh with lucerne
and ryegrass having the highest rates When the respective energy sources replaced 50 of the forage
substrates there were variable positive responses in terms of c of different forage substrates In general
energy sources tended to raise the rate of gas production probably due to the higher nutrient content and
easier accessibility of chemical constitutes to rumen microbial enzymes as compared to the forage
substrates alone (Arigbede et al 2006) In lucerne hay molasses increased c compared to the control
treatment (Model 1 amp 2) Maize meal had no effect on c when compared to the control treatment The latter
agrees with Mertens amp Loften (1980) where starch increased the lag time but had no effect on digestion rate
of lucerne This would suggest that the addition of energy sources to forage substrates do not decrease
fibre digestibility by lowering the rate of fermentation In oat hay citrus pulp had the biggest effect on c (both
models) while with Model 1 molasses also increased c Maize meal (both models) tended to increase c but
not significantly compared to the control treatment The most noticeable effect of forage substitution with
energy sources was observed for wheat straw In this case all the energy sources increased the rate of gas
production irrespective of the model used While the other forages have moderate fermentation potentials
(as can be seen from the b and c values) the fermentability of wheat straw is low resulting in a higher
response when energy was supplemented In ryegrass maize meal had no effect on c (Model 1 amp 2) while
citrus pulp (Model 1) and molasses (both models) improved c compared to the control treatment Citrus pulp
increased gas production rate in kikuyu (P lt 005) when Model 1 was used while maize meal and molasses
only tended to increase c Supplementation with citrus pulp tended to improve gas production rates of
forages more than maize meal Citrus pulp is high in degradable NDF resulting in less negative effects on
cellulolytic bacteria and the ruminal environment than starch supplementations (Bampidis amp Robinson
2006) Unlike sugars and starches pectin substances do not lower the rumen pH (Mohney 2002) Pectin
supplementation would thus sustain an optimal ruminal environment for cellulolytic bacteria functions
explaining the better gas production rates resulting from forages supplemented with citrus pulp Leiva et al
(2000) also reported that citrus pulp ferment at a faster rate than corn hominy Energy source had no
significant effect on gas production rate of kikuyu in Model 2 It thus seems that energy sources per se
tended to improve forage gas production rate Energy sources are high in nutrients that are easily available
and rapidly fermentable by rumen micro-organisms Hiltner amp Dehority (1983) found that forage digestion
improved with energy sources supplementation due to an increase in the number of rumen micro-organisms
available to help with fermentation
When the respective energy sources replaced 50 of the forage substrates a significant forage x energy
source interaction was observed for the lag phase Different lag times of forage substrates (control
treatments) may be the result of differences in plant tissue composition between forages that require different
degrees of physical or chemical changes before rumen micro-organisms can start with fibre digestion
(Mertens amp Loften 1980) Lucerne fermented alone had almost no lag phase but supplementation of maize
32
meal tended (P = 0069) to increase the lag phase Adesogan et al (2005) found that maize and citrus pulp
incubated individually had longer lag phases when compared to hays (P lt 0001) agreeing with results
obtained in this study that the energy sources tended to lengthen the lag phase of lucerne hay The longer
lag phase for the maize and citrus pulp treatments might be associated with a high proportion of cellulolytic
micro-organisms in the rumen fluid The diet of the cannulated cows consisted predominantly of oat hay
lucerne hay and wheat straw and might have resulted in insufficient numbers of pectin-fermenting and
amylolytic bacteria in the collected rumen fluid to instantly colonize the citrus pulp and maize respectively
(Adesogan et al 2005) The results also agree with the work of Mertens amp Loften (1980) where starch
increased the lag time but had no effect on digestion rate of lucerne Possible reasons include a delay in
fermentation due to microbial colonization (Chesson amp Forsberg 1988) In contrast Haddad amp Grant (2000)
found that a reduction in NFC content substituted to lucerne based diets in vitro increased the lag time of
lucerne
Table 36 Effects of maize meal citrus pulp and molasses as energy sources on fermentation kinetics of
different forage substrates as measured by in vitro gas production Gas production of both energy sources
and forage substrates are included
Treatment
Item Maize meal Citrus pulp Molasses Control
SEm
P
Lucerne hay
Model 1
b 3981 b 3500 ab 3342 ab 2701 a 2498 0025
c 009 a 011 ab 014 b 009 a 001 0005
Model 2
b 3965 b 3490 ab 3340 ab 2700 a 2513 0028
c 010 a 011 ab 015 b 009 a 001 0013
L 045 033 009 005 011 0069
Oat hay
Model 1
b 3982 3654 3150 2966 372 0250
c 008 ab 011 b 008 b 004 a 001 0002
Model 2
b 3971 3654 3150 2951 3745 0253
c 008 ab 011 b 008 ab 005 a 001 0004
L 032 0 0 036 013 0125
33
Table 36 (continue) Effects of maize meal citrus pulp and molasses as energy sources on fermentation kinetics of different forage substrates as measured by in vitro gas production Gas production of both energy sources and forage substrates are included
Wheat straw
Model 1
b 3706 b 3591 b 3062 ab 2460 a 1876 0002
c 008 b 010 b 009 b 003 a 001 0001
Model 2
b 3696 b 3591 b 3062 b 2289 a 1796 0001
c 008 b 010 b 009 b 003 a 001 0001
L 032 b 000 b 000 b 225 a 040 0004
Ryegrass
Model 1
b 4492 4113 3777 3727 3454 0406
c 008 a 012 b 012 b 008 a 001 0001
Model 2
b 4471 4106 3776 3711 3475 0422
c 008 a 012 cb 012 b 009 ac 001 0006
L 051 024 003 054 018 0213
Kikuyu grass
Model 1
b 4236 4269 3902 3230 2634 0055
c 009 ab 011 b 010 ab 005 a 001 0025
Model 2
b 4224 4266 3902 3776 2403 0425
c 010 011 010 006 001 0059
L 026 ab 011 b 000 b 163 a 035 0022
b = Total gas production (mlg OM) c = gas production rate (mlh) L = Lag time (h)
Model 1 Y = b + (1 ndash e-ct) Model 2 Y = b + (1 ndash e-c(t-L)) Superscripts are comparing across rows
The lag phase for oat hay was about 22 minutes and was not significantly affected by energy source The
greatest effect of forage substitution with energy sources was observed for wheat straw where all the energy
sources shortened the lag phase compared to the control treatment where wheat straw had a lag phase of
more than 2 hours In ryegrass treatment had no significant effect on lag phase but molasses tended to
decrease the lag phase In kikuyu the lag phase was significantly shortened when supplemented with citrus
pulp and molasses (P lt 005) while maize meal only tended to shorten the lag Hiltner amp Dehority (1983)
also found a decrease in lag times of fibre digestion when soluble carbohydrates were added to in vitro
incubations They concluded that the decrease in lag phase was due to an increase in bacteria numbers
helping with digestion as they found similar results when they increased the inoculum
The parameters presented in Table 36 (Model 2) were used to construct Figures 31 - 36 The data
presented in the figures represent total gas production including that of the energy sources
34
0
50
100
150
200
250
300
350
400
450
0 10 20 30 40 50 60 70 80
Gas
Pro
duct
ion
(mlg
OM
)
Time (hours)
Lucerne hay
Oat hay
Wheat straw
Ryegrass
Kikuyu grass
Figure 31 Gas production of forage substrates alone
Figure 31 show differences in fermentation characteristics of the different forages Variations in NDF ADL
and CP contents of these forages (Table 33) as well as different arrangements of their cell-wall
polysaccharides (Cheng et al 1984) are most likely responsible for different fermentation characteristics
observed between forage substrates The fermentation patterns of the forages are functions of the forage
type as well as the physiological stage at which they were harvested both of which affect their chemical
composition The grasses (ryegrass and kikuyu) were immature (28 days of re-growth) Lucerne and oat
hay were harvested at the 10 flowering stage while wheat straw was a mature forage As forages mature
their NDF and ADL contents increase (McDonald et al 2002) Wheat straw had the highest NDF and ADL
contents (Table 33) Although lucerne hay had a relatively low NDF content its ADL content was quite high
compared to kikuyu which had a fairly high NDF content but a low ADL content resulting in the early cut
grasses to manifest a much higher fermentability profile than the other forages Figure 31 clearly indicates
that wheat straw has a much lower fermentability both in terms of total gas production and rate of gas
production than the other forages Wheat straw also has a much longer lag phase compared to other
forages The lower fermentability and longer lag phase of wheat straw which is a mature forage can be
explained by the tissue content of wheat straw that is high in NDF and ADL (which is negatively correlated
with gas production) subsequently requiring more physical and chemical alterations before bacteria in the
rumen can start digestion The high rate and extent of gas production from both ryegrass and kikuyu can
also be observed (Figure 31) Apart from readily fermentable fibre these pasture grasses are also high in
nitrogen (Table 33) and total carbohydrates which are both needed for optimal growth of rumen micro-
organisms and thus fermentation (NRC 2001)
35
The effect of energy sources on the fermentation profiles of the different forages can be observed in Figures
32 - 36
0
50
100
150
200
250
300
350
400
450
0 10 20 30 40 50 60 70 80
Gas
Pro
duct
ion
(mlg
OM
)
Tme (hours)
Maize mealCitrus pulpMolassesControl
Figure 32 Gas production of lucerne hay when supplemented with different energy sources
Substituting 50 of the forages with an energy source improved gas production (Figures 32 - 36) probably
by boosting microbial growth Maize meal and citrus pulp had the biggest effect throughout Molasses is a
fast fermenting simple sugar (Hall 2002) which is rapidly utilized explaining the fast increase in gas
production followed by a plateau soon afterwards Maize meal and citrus pulp other than molasses are
more complex energy sources which ferment slower and are available over a longer period of time As
mentioned before wheat straw was a mature forage compared to ryegrass and kikuyu which were harvested
after only 28 days of re-growth while lucerne and oat hay were harvested at 10 flowering stage
Ryegrass lucerne and kikuyu are high in nitrogen (Table 33) Sufficient nitrogen ensures nitrogen-energy
coupling to occur at a greater extent thereby ensuring more efficient microbial fermentation and cellulose
degradation by rumen bacteria (NRC 2001) As forages mature the NDF and ADF contents increase and
CP (supplying nitrogen) decreases making less nitrogen readily available to rumen micro-organisms for
fermentation (Ghadaki et al 1975) This may explain why maize meal and citrus pulp had higher impacts
than molasses on gas production of the mature forages Citrus pulp and maize meal release energy at a
slower rate which match the slow release of nitrogen in mature forages Also even though small these
energy sources contributes rumen degradable protein (RDP) which with substrates like wheat straw (that
has very low CP content) could be quite substantial It should be kept in mind though that the gas
production profiles in these figures reflect the combination of forages and energy sources
36
0
50
100
150
200
250
300
350
400
450
0 10 20 30 40 50 60 70 80
Gas
Pro
duct
ion
(mlg
OM
)
Time (hours)
Maize mealCitrus pulpMolassesControl
Figure 33 Gas production of oat hay when supplemented with different energy sources
0
50
100
150
200
250
300
350
400
450
0 10 20 30 40 50 60 70 80
Gas
Pro
duct
ion
(mlg
OM
)
Time (hours)
Maize mealCitrus pulpMolassesControl
Figure 34 Gas production of wheat straw when supplemented with different energy sources
37
0
50
100
150
200
250
300
350
400
450
0 10 20 30 40 50 60 70 80
Gas
Pro
duct
ion
(mlg
OM
)
Time (hours)
Maize mealCitrus pulpMolassesControl
Figure 35 Gas production of ryegrass when supplemented with different energy sources
0
50
100
150
200
250
300
350
400
450
0 10 20 30 40 50 60 70 80
Gas
Pro
duct
ion
(mlg
OM
)
Time (hours)
Maize mealCitrus pulpMolassesControl
Figure 36 Gas production of kikuyu grass when supplemented with different energy sources
342 Gas production parameters including that of forage and energy sources in cases where no interaction was observed
In the cases where in vitro gas production parameters showed no interactions the main effects are
discussed Gas production values of the different forages (Models 1 amp 2) differed (P lt 005) from each other
38
independent of the energy source supplemented (Table 37) The NDF ADL and CP content of the forages
differed (Table 33) The differences in chemical and physical tissue structure probably influenced their
fermentation kinetic patterns (Figure 31) In Model 1 ryegrass resulted in higher gas productions than oat
hay wheat straw and lucerne but did not differ from kikuyu In Model 2 the same trend was seen for gas
production with kikuyu and ryegrass having higher values than lucerne oat hay and wheat straw The
reason for the higher gas production from ryegrass compared to lucerne wheat straw and oat hay are due to
the lower NDF and ADF contents of ryegrass resulting in higher gas production (Sallam 2005) Ryegrass
and kikuyu as mentioned before were harvested young compared to the other forages These pasture
grasses therefore had more rapidly fermentable sugar resulting in higher gas production values Ryegrass
and kikuyu are also high in CP (Table 33) which is essential for optimal rumen fermentation as it supplies
the rumen micro-organisms with nitrogen that is important for their growth Gas production rates differed for
among forages (P lt 005) irrespective of the energy source Ryegrass and lucerne had higher c values than
oat hay and wheat straw
Table 37 In vitro gas production parameters of forages as affected by energy sources as main effects in
cases where no interactions were observed Gas production of both energy sources and forage substrates
are included
Forage Item Lucerne
hay Oat hay Wheat
straw Ryegrass Kikuyu grass SEm P
Model 1
b 3381 ac 3438 ac 3205 a 4027 b 3909 bc 1457 lt0001
Model 2
b 3374 a 3431 a 3159 a 4016 b 4042 b 1439 lt0001
c 011 b 008 a 008 a 010 bc 009 ac 001 lt0001
b = Total gas production (mlg OM) c = gas production rate (mlh)
Model 1 Y = b + (1 ndash e-ct) Model 2 Y = b + (1 ndash e-c(t-L)) Superscripts are compared across rows
The total gas production values of forage substrates (Models 1 amp 2) differed (P lt 005) for each energy
source supplemented (Table 38) Maize meal and citrus pulp supplementations resulted in higher forage
gas production values than the control treatment (Model 1 amp 2) Maize meal tended to have higher gas
production than citrus pulp supporting the theory of Sallam (2005) that feedstuffs higher in NDF and ADF
content result in lower gas production Gas production rate (c) of the forages were all higher for the energy
source treatments than that of the control treatment (P lt 005) indicating the faster fermentation potential of
the energy sources The highest gas production rates were achieved when forages were supplemented with
citrus pulp and molasses irrespective of the forage substrate used Pectin substances other than starches
and sugars produce no lactic acid (Van Soest 1994) Pectin subsequently does not tend to lower the
rumen pH as much as sugars and starches thus sustaining optimal ruminal environments for cellulolytic
bacteria This could partly explain the better gas production rates of forages supplemented with citrus pulp
39
Table 38 In vitro gas production parameters of forages (irrespective of forage substrate used) as affected by
different energy sources as main effects in cases where no interactions were observed Gas production of
both energy sources and forage substrates are included
Energy source Item Maize meal Citrus pulp Molasses Control SEm P
Model 1
b 4079 b 3825 bc 3446 ac 3017 a 1303 lt0001
Model 2
b 4065 b 3821 bc 3446 ac 3085 a 1287 lt0001
c 009 b 011 c 011 c 006 a 000 lt0001
b = Total gas production (mlg OM) c = gas production rate (mlh)
Model 1 Y = b + (1 ndash e-ct) Model 2 Y = b + (1 ndash e-c(t-L)) Superscripts are compared across rows
343 Gas production excluding that from energy sources
Gas production values from the respective energy sources alone were obtained from separate fermentations
where forage substrates were omitted These values were subtracted from total gas production values
where forages and energy sources were incubated together to calculate the effect of energy sources on gas
production of the respective forage sources per se (Table 39)
When the maize meal gas production was deducted from the total gas production there was no difference
between the control and the maize meal supplemented treatments in any of the forages (Models 1 amp 2)
When molasses gas production was deducted from the total gas production however total gas production
from forages in the molasses supplemented treatments was lower than that of the control treatments in all
forage substrates irrespective of the model used In oat hay molasses lowered gas production more than in
any of the other treatments including the control treatment In oat hay and ryegrass (both models) and in
lucerne hay (Model 2) citrus pulp as energy source also decreased forage gas production compared to the
control treatment The lower gas production after energy sources gas production was deducted illustrate that
energy sources were the main reason for the higher gas production presented earlier in treatments with
forage and energy source combinations as substrates Gas production is negatively correlated with NDF
and ADL content (Sallam 2005) Energy sources had lower NDF and trace amounts of lignin content when
compared to forage substrates (Table 33) supporting the theory of higher gas production observed after
energy inclusions in the simulated dairy cow diets Energy sources per se thus seemed to increase the rate
of forage digestion but maintained or decreased the digestibility of forages Possible reasons for the lower
digestibility as determined by gas production can be because micro-organisms first attack the easily
fermentable energy sources before starting with fibre digestion
40
Deducting energy source gas production resulted in variable positive responses in terms of rate of gas
production from forage substrates In oat hay maize meal and citrus pulp treatments both improved c
compared to the control treatment (Models 1 amp 2) In kikuyu grass maize meal had a profound effect and
increased c when compared to the control treatment For the other forages (lucerne wheat straw and
ryegrass) deduction of the energy sources had no effect on fermentation rate
Deducting energy source gas production values indicated that treatment with energy sources affected the lag
phase differently for the different forages Lucerne hay oat hay and ryegrass had short lag phases which
were not affected by energy source Citrus pulp and maize meal however tended to increase the lag phase
of lucerne hay Similar results were obtained by Adesogan et al (2005) who found that maize and citrus
pulp resulted in a longer lag phase than hays (P lt 0001) The diet of the cows consisted predominantly of
oat hay lucerne hay and wheat straw The diet of donor cows thus had high proportions of cellulolytic micro-
organisms and less pectin-fermenting and amylolytic bacteria needed to colonize citrus pulp and maize meal
respectively explaining the longer lag phase of maize meal and citrus pulp (Adesogan et al 2005) Kikuyu
and wheat straw had long lag phases compared to the other forages All the energy sources significantly
shortened the lag phase of wheat straw and kikuyu
Table 39 Effects of maize meal citrus pulp and molasses as energy sources on fermentation kinetics of
different forage substrates as measured by in vitro gas production Gas production resulting from energy
sources was deducted from total gas production
Treatment
Item Maize meal Citrus pulp Molasses Control SEm P
Lucerne hay
Model 1
b 2293 ab 1974 ab 1789 b 2837 a 2063 0018
c 009 010 015 009 002 0103
Model 2
b 2192 ab 1959 b 1789 b 2836 a 1836 0008
c 012 011 015 009 002 0189
L 023 076 006 005 023 0166
Oat hay
Model 1
b 2842 ab 2367 b 1761 c 3283 a 1315 0001
c 008 b 010 b 004 a 004 a 001 0001
Model 2
b 2842 ab 2367 b 1761 c 3273 a 1317 0001
c 008 b 010 b 004 a 004 a 001 0001
L 000 000 000 017 007 0240
41
Table 39(continue) Effects of maize meal citrus pulp and molasses as energy sources on fermentation kinetics of different forage substrates as measured by in vitro gas production Gas production resulting from energy sources was deducted from total gas production
Wheat straw
Model 1
b 2108 ab 1903 ab 1510 b 2499 a 1657 0009
c 008 007 006 002 002 0110
Model 2
b 2108 ab 1903 ab 1510 b 2312 a 1559 0020
c 008 007 006 003 002 0168
L 000 b 000 b 000 b 229 a 036 0001
Ryegrass
Model 1
b 2845 ab 2429 b 2093 b 3995 a 291 0003
c 008 010 011 008 001 0324
Model 2
b 2835 ab 2419 b 2092 b 3983 a 2934 0004
c 009 010 011 009 001 0459
L 040 062 005 039 029 0588
Kikuyu grass
Model 1
b 2500 ab 2611 ab 2193 b 3349 a 2369 0028
c 012 b 010 ab 008 ab 005 a 001 0017
Model 2
b 2499 ab 2610 ab 2193 b 3243 a 2408 0050
c 012 b 010 ab 008 ab 005 a 002 0040
L 007 b 012 b 000 b 173 a 034 0009
b = Total gas production (mlg OM) c = gas production rate (mlh) L = Lag time (h)
Model 1 Y = b + (1 ndash e-ct) Model 2 Y = b + (1 ndash e-c(t-L)) Superscripts are compared across rows
Hiltner amp Dehority (1983) similarly found that the addition of soluble carbohydrates to in vitro incubations
decreased the lag time of fibre digestion They concluded that supplementation increased bacteria numbers
thus decreasing the lag phase by supporting fibre digestion They found similar results with increased
amounts of inoculum A possible reason for the long lag phase of kikuyu grass may be because it was
heavily fertilized with nitrogen Marais et al (1988) showed that nitrite derived from high nitrate pastures
resulted in reduced in vitro digestibility as it affected rumen microbial function The long lag phase of wheat
straw was probably due to the high NDF content which is slowly digested and the high ADL content which is
not digested by rumen micro-organisms The latter could also have an effect on the structure of the fibre
matrix making it more difficult for rumen organisms to reach the more digestible fibre fractions The short
lag phases of lucerne and oat hay could partially be explained by the fact that the cannulated cows received
diets containing these substrates but also because their chemical composition allows higher digestibility
compared to wheat straw In general it would appear that the supplementation of forages with various
42
energy sources had a negative effect on total gas production but increased the rate of gas production in
some instances
Profiles of forage fermentation after deduction of energy source values are illustrated in Figures 37 ndash 312
0
50
100
150
200
250
300
350
400
450
0 10 20 30 40 50 60 70 80
Gas
Pro
duct
ion
(mlg
OM
)
Time (hours)
Lucerne hayOat hayWheat strawRyegrassKikuyu grass
Figure 37 Gas production of forage substrates after gas production of energy sources has been deducted
Variations in fermentation patterns of different forages are illustrated in Figure 37 All the forages differed in
terms of gas production lag phase and gas production rate This is probably due to differences in their cell-
wall polysaccharide arrangements (Cheng et al 1984) as well as NDF ADL and CP composition (Table
33) It is clear that wheat straw has a much lower fermentability both in terms of total gas production and
rate of gas production than the other forages As forages mature their NDF and ADL contents increase
(McDonald et al 2002) Wheat straw had the highest NDF and ADL contents (Table 33) The NDF and
ADF contents of diets are negatively correlated with gas production (Sallam 2005) which would explain the
lower gas production of wheat straw in comparison with the other forages Wheat straw is also very low in
CP (Table 33) Crude protein provides rumen micro-organisms with nitrogen needed for optimal growth and
fermentation Ryegrass and kikuyu show a high rate and extent of gas production maybe due to the lower
NDF and ADL and higher CP contents as compared to wheat straw Although lucerne hay had a relatively
low NDF content its ADL content was quite high compared to kikuyu which had a higher NDF content but a
low ADL content resulting in the early cut grasses to manifest a much higher fermentability profile than the
other forages
43
0
50
100
150
200
250
300
350
400
450
0 10 20 30 40 50 60 70 80
Gas
Pro
duct
ion
(mlg
OM
)
Time (hours)
Maize meal
Citrus pulp
Molasses
Control
Figure 38 The net effect of energy supplements on gas production of lucerne hay
0
50
100
150
200
250
300
350
400
450
0 10 20 30 40 50 60 70 80
Gas
Pro
duct
ion
(mlg
OM
)
Time (hours)
Maize mealCitrus pulpMolassesControl
Figure 39 The net effect of energy supplements on gas production of oat hay
44
0
50
100
150
200
250
300
350
400
450
0 10 20 30 40 50 60 70 80
Gas
Pro
duct
ion
(mlg
OM
)
Time (hours)
Maize meal
Citrus pulpMolassesControl
Figure 310 The net effect of energy supplements on gas production of wheat straw
0
50
100
150
200
250
300
350
400
450
0 10 20 30 40 50 60 70 80
Gas
Pro
duct
ion
(mlg
OM
)
Time (hours)
Maize mealCitrus pulpMolassesControl
Figure 311 The net effect of energy supplements on gas production of ryegrass
45
0
50
100
150
200
250
300
350
400
450
0 10 20 30 40 50 60 70 80
Gas
Pro
duct
ion
(mlg
OM
)
Time (hours)
Maize mealCitrus pulpMolassesControl
Figure 312 The net effect of energy supplements on gas production of kikuyu grass
In many of these figures the control clearly did not reach a plateau in the 72 hour incubation period This
enforces the findings that the energy sources increased the rate of gas production especially during the
earlier parts of the incubation
344 Gas production parameters excluding that of energy sources in cases where no interaction was observed
The in vitro gas parameters that showed no interactions were interpreted in terms of main effects Gas
production values from the energy sources were deducted from the total gas production to derive forage gas
production values (Table 310) It can be seen that the gas production values of the forage substrates
differed (P lt 005) from each other independent of the deducted energy source (Models 1 amp 2) Gas
production resulting from wheat straw differed from ryegrass oat hay and kikuyu but not from lucerne (both
models) The higher gas production of ryegrass and kikuyu compared to wheat straw results from the
higher NDF and ADF contents of wheat straw which negatively affected its gas production (Sallam 2005)
Rate of gas production (c) also differed (P lt 005) between forages independent of energy source (Model 2)
Oat hay and wheat straw had lower c-values than ryegrass and lucerne but did not differ from kikuyu The
lower gas production rate of wheat straw and oat hay can be due to the maturity of these forages These
forages contain less readily fermentable substrates and more NDF and ADL compared to immature ryegrass
and kikuyu cut at 28 days of re-growth
46
Table 310 In vitro gas production parameters of forages as affected by energy sources as main effects in
cases where no interactions were observed Gas production resulting from energy sources was deducted
from total gas production
Forage
Item Lucerne hay Oat hay Wheat
straw Ryegrass Kikuyu grass
SEm P
Model 1
b 2223 ab 2563 bc 2005 a 2840 c 2663 c 1068 lt0001
Model 2
b 2194 ab 2561 bc 1959 a 2832 c 2636 c 1047 lt0001
c 012 b 007 a 006 a 010 b 009 ab 001 lt0001
b = Total gas production (mlg OM) c = gas production rate (mlh)
Model 1 Y = b + (1 ndash e-ct) Model 2 Y = b + (1 ndash e-c(t-L)) Superscripts are compared across rows
The effect of energy source treatment on forage fermentation is presented in Table 311 Energy sources
differed in terms of total gas produced by forages as a group It appeared that deduction of gas production
resulting from energy supplementation lowered total gas production of forages when either of the two models
was used Molasses resulted in the lowest total gas production from forages With Model 2 all the energy
sources increased the rate of fermentation of forage substrates but no differences occurred between energy
sources The increase in fermentation rates might suggest that energy supplementation does not
necessarily result in lower fibre digestion as observed by Mertens amp Loften (1980) by reducing their
fermentation rates (Miller amp Muntifering 1985) The increase in rate of gas production of forages after
energy sources substitution may be due to their higher nutrient content and easier accessibility of the energy
sources chemical constitutes to rumen microbial enzymes (Arigbede et al 2006)
Table 311 In vitro gas production parameters of forages (irrespective of forage substrate used) as affected
by different energy sources as main effects in cases where no interactions were observed Gas production
resulting from energy sources was deducted from total gas production
Energy source
Item Maize meal Citrus pulp Molasses Control SEm P
Model 1
b 2518 b 2257 b 1869 c 3193 a 955 lt0001
Model 2
b 2495 b 2251 b 1869 c 3130 a 937 lt0001
c 010 b 010 b 009 b 006 a 001 lt0001
b = Total gas production (mlg OM) c = gas production rate (mlh)
Model 1 Y = b + (1 ndash e-ct) Model 2 Y = b + (1 ndash e-c(t-L)) Superscripts are compared across rows
47
35 Conclusion
Forage diets alone do not provide in the high energy requirements of lactating cows Lactating cows
produce large quantities of milk which can only be maintained if forage diets are supplemented with
concentrates Supplementation of dairy cow diets with optimal amounts of energy substrates provide the
high producing dairy cow with energy needed to improve fibre digestibility and utilization Energy improves
the total digestibility of a diet when forages are supplemented with energy sources but decreases the
utilization of the forage component per se Possible reasons for the latter could be the structure of the fibre
matrix making it more difficult for rumen organisms to reach the more digestible fractions in forages thereby
digesting first the easily fermentable energy sources before attacking the more complex fibre fractions It
should be noted however that overfeeding of energy supplements increase the risks of acidosis due to the
production of large amounts of lactic acid subsequently lowering milk production and income
Looking at the individual forage fermentation kinetics irrespective of the energy source used it is evident
that the pasture grasses had higher total gas production values than the straw and hays This is most likely
because the pasture grasses were cut after only 28 days of re-growth whereas the hays and straw were
more mature and of lower quality especially the straw The pasture grasses thus had more readily
fermentable nutrients and less NDF and ADL than the hays and straw leading to higher gas production
values The fermentation rate of the forages supplemented with energy sources differed amongst each
other with lucerne and ryegrass having the fastest fermentation rates irrespective of the energy source
supplemented Gas production of forages supplemented with citrus pulp and maize meal were higher
compared to molasses Molasses produced a greater volume of gas during the first few hours of incubation
but it was also quickly depleted due to its high content of readily fermentable sugars These sugars are
highly soluble and rumen micro-organisms have easy access to induce fermentation The gas production
rate of forages supplemented with energy sources was higher than the control treatments (forages alone)
with molasses and citrus pulp resulting in the highest rates It thus seemed that supplementation of energy
sources improved forage fermentability as well as the rate of forage fermentation This could have major
implications in practice as there is a need to find ways of improving fibre utilization in South Africa
The effect of the energy sources on the fermentation kinetics of different forages per se showed a decrease
in gas production and lag phase but a tendency to raise gas production rate Molasses decreased gas
production the most throughout all the forage substrates A possible reason may be that the rumen micro-
organisms first digest the fast fermentable simple sugar substrates before starting with substrates that are
digested at a slower rate The raise in gas production rate and decrease in lag time may be due to a higher
number of rumen micro-organisms available to ferment the feed when energy sources were added to the
forage substrates thus supporting digestion
Little research has been done on this and related topics to quantify the relationship between different
carbohydrate sources and rumen metabolism parameters leaving room for improvement and further studies
More research is also needed with regard to inclusion levels of different energy sources in lactating cow diets
and the potential outcomes regarding milk production and rumen health
48
36 References
Adesogan T Krueger NK amp Kim SC 2005 A novel wireless automated system for measuring
fermentation gas production kinetics of feeds and its application to feed characterization Anim Feed
Sci Technol 123 - 124(1) 211 - 223
Aldrich JM Muller LD amp Varga GA 1993 Nonstructural carbohydrates and protein effects on rumen
fermentation nutrient flow and performance of dairy cows J Dairy Sci 76 1091 - 1105
Allen M amp Oba M 2000 Getting more milk from forages Michigan Dairy Review 5(4) Michigan State
University
Available at
httpwwwadmanicomalliancedairyTechBulletinsNon20Structural20Carbohydrate20Nutrition
htm
(Accessed 5 August 2008)
ANKOM 2005 Method for determining acid detergent lignin in beakers ANKOM Technology 0805
AOAC 1990 Official Methods of Analysis (15th Ed) Association of Official Analytical Chemists Inc
Arlington Virginia USA
AOAC 1995 Official Methods of Analysis (15th Ed) Association of Official Analytical Chemists Inc
Washington DC USA
Arigbede OM Anele UY Olanite JA Adekunle IO Jolaosho OA amp Onifade OS 2006 Seasonal in
vitro gas production parameters of three multi - purpose tree species in Abeokuta Nigeria Livestock
Res Rural Dev 18(10) Article 142
Available at httpwwwcipavorgcolrrdlrrd1810arig18142htm
(Accessed 14 October 2008)
Bampidis VA amp Robinson PH 2006 Citrus by-products as ruminant feeds A review Anim Feed Sci
Technol 128 175 - 217
Cheng KJ Stewart CS Dinsdale D amp Costeron JW 1984 Electron bacteria involved in the digestion
of plant cell walls Anim Feed Sci Technol 10 93 - 120
Chesson A amp Forsberg C W 1988 Polysaccharide degradation by rumen micro-organisms In The
Rumen Microbial Ecosystem Ed Hobson PN Elsevier Science Publishers Ltd London UK pp 251
- 284
49
Ghadaki MB Van Soest PJ McDowell RE amp Malekpour B 1975 Chemical composition and in vitro
digestibility of some range forage species of Iran In Proceedings of the sem Bamako 2 - 3 March
Bamako Mali
Available at httpwwwfaoorgwairdocsilrix5543bx5543b0zhtm
(Accessed 17 October 2008)
Giraldo LA Tejido ML Ranilla MJ amp Carro MD 2008 Effect of exogenous fibrolytic enzymes on in
vitro rumen fermentation of substrates with different forageconcentrate ratios Anim Feed Sci
Technol 141 306 - 325
Goosen L 2004 Effect of an exogenous fibrolytic enzyme on forage digestibility parameters MSc (Agric)
thesis Stellenbosch University Stellenbosch South Africa pp 1 - 91
Haddad SG amp Grant RJ 2000 Influence of nonfiber carbohydrate concentration on forage fiber digestion
in vitro Anim Feed Sci Technol 86 107 - 115
Hall MB 2002 Working with sugars (and molasses) In Proceedings of the 13th Annual Florida Ruminant
Nutrition Symp Jaunary 11 - 12 Gainesville Florida USA pp 146 - 158
Hiltner P amp Dehority A 1983 Effect of soluble carbohydrates on digestion of cellulose by pure
cultures of rumen bacteria Appl Environ Microbiol 46 542
Larson CC 2003 The effect of nonfibre carbohydrate source and protein degradability on lactation
performance of holstein cows MSc (Agric) thesis University of Florida Gainesville Florida USA pp
1 - 108
Leiva E Hall MB amp Van Horn HH 2000 Performance of dairy cattle fed citrus pulp or corn products as
sources of neutral detergent-soluble carbohydrates J Dairy Sci 83 2866 - 2875
Marais JP Therion JJ Mackie RI Kistner A amp Dennison C 1988 Effect of nitrate and its reduction
products on the growth and activity of the rumen microbial population Brit J Nutr 59 301 - 313
Mauricio RM Mould FL Dhanoa MS Owen E Channa KS amp Theodorou MK 1999 A semi-
automated in vitro gas production technique for ruminants feedstuff evaluation Anim Feed Sci
Technol 79 321 - 330
McDonald P Edwards RA Greenhalgh JFD amp Morgan CA 2002 Evaluation of food Digestibility In
Animal Nutrition (6th Ed) Pearson Education Ltd Edinburgh Gate Harlow Essex UK pp 246 - 263
Mertens DR 1997 Creating a system for meeting the fibre requirements of dairy cows J Dairy Sci 80
1463 - 1481
50
Mertens DR amp Loften JR 1980 The effect of starch on forage fiber digestion kinetics in vitro J Dairy Sci
63 1437 - 1446
Miller BG amp Muntifering RB 1985 Effect of forageconcentrate on kinetics of forage fiber digestion in
vitro J Dairy Sci 68 40 - 44
Mohney K 2002 Synchronization of carbohydrate and protein metabolism by ruminal microbes in
continuous culture PhD thesis North Carolina State University Raleigh North Carolina USA pp 1 -
69
National Research Council (NRC) 2001 Nutrient requirements of dairy cattle (7th Rev Ed) National
Academy Press Washington DC USA pp 34 - 35
Sallam SMA 2005 Nutritive value assessment of the alternative feed resources by gas production and
rumen fermentation in vitro Res J Agric amp Biol Sci 1(2) 200 - 209
Schwarz FJ Haffner J amp Krichgessner M 1995 Supplementation of zero-grazed dairy cows with
molassed sugar beet pulp maize or cereal-rich concentrate Anim Feed Sci Technol 54 237 - 248
Solomon R Chase LE Ben-Ghedalia D amp Bauman DE 2000 The effect of nonstructural carbohydrate
and addition of full fat soybeans on the concentration of conjugated linoleic acid in milk fat of dairy
cows J Dairy Sci 83 1322 - 1329
Sommart K Parker DS Wanapat M amp Rowlinson P 2000 Fermentation characteristics and microbial
protein synthesis in an in vitro system using cassava rice straw and dried ruzi grass as substrates
Asian-Aust J Anim Sci 13 1084 - 1093
Statistica 81 2008 StatSoft Inc USA
Van Soest PJ 1994 Nutritional ecology of the ruminant (2nd Ed) Cornell University Press Ithaca New
York USA pp 251 - 252
Van Soest PJ amp Robertson JB 1985 Analysis of forages and fibrous feeds A laboratory manual for
animal science 613 Cornell University Ithaca New York USA
Van Soest PJ Robertson JB amp Lewis BA 1991 Methods for dietary fibre neutral detergent fibre and
nonstarch polysaccharides in relation to animal nutrition J Dairy Sci 74 3583 - 3587
Oslashrskov ER amp McDonald P 1979 The estimation of protein degradability in the rumen from incubation
measurements weighed according to rate of passage J Agric Sci 92 499 - 503
51
Chapter 4
THE EFFECT OF SUGAR STARCH AND PECTIN AS MICROBIAL
ENERGY SOURCES ON IN VITRO NEUTRAL DETERGENT FIBRE
AND DRY MATTER DEGRADABILITY OF FORAGES
Abstract
The study evaluated the effect of sugar (molasses and sucrose) starch (maize meal and maize starch) and
pectin (citrus pulp and citrus pectin) on neutral detergent fibre (NDF) and dry matter (DM) degradability of
forages Forage substrates used included wheat straw (WS) oat hay (OH) lucerne hay (LUC) ryegrass
(RYE) and kikuyu grass (KIK) Rumen fluid was collected from two lactating Holstein cows receiving a diet
consisting of oat hay lucerne wheat straw and a concentrate mix In vitro degradability was done with an
ANKOM Daisy II incubator and forage substrates were incubated with or without the respective energy
sources for 24 48 and 72 hours The substrates were incubated in 1076 ml buffered medium 54 ml of
reducing solution and 270 ml rumen fluid The residues were washed dried and analyzed for NDF In the
trial with the applied energy sources (molasses maize meal and citrus pulp) there was forage x energy
source interactions Supplementation with the applied energy sources all improved DMD of forages (24 amp 72
hours) when compared to the control treatment except for RYE supplemented with maize meal and citrus
pulp at 24 hours Molasses had the biggest effect on DMD in all forage substrates Supplementation with
maize meal had no effect on neutral detergent fibre degradability (NDFD) of any forage substrate except for
an improvement in NDFD of LUC at 72 hours Molasses improved NDFD of LUC at 24 hours but had no
effect on the other forage substrates Citrus pulp improved NDFD of OH (72 hours) as well as LUC and WS
(24 amp 72 hours) It is postulated that the NDF of the energy sources was more digestible than that of the
respective forages and that the improved NDFD values could be ascribed to the contribution of the energy
source NDFD Overall pasture grasses had a higher NDFD than the hays and straw and appear to be more
readily fermentable by rumen micro-organisms than the low quality hays and straw explaining the higher
NDFD In the trial involving the purified energy sources (sucrose maize starch and citrus pectin) forage x
energy source interactions were observed In general supplementation with these energy sources improved
DMD at 24 and 72 hours except for RYE and KIK (72 hours) Pasture grasses (RYE amp KIK) had a higher
NDFD than LUC OH and WS At 72 hours NDFD was 371 for LUC 425 for OH and 403 for WS
compared to 705 for KIK and 649 for RYE A possible explanation is that KIK and RYE samples came
from freshly cut material harvested after a 28d re-growth period In general sucrose (24 amp 72 hours) and
citrus pectin (72 hours) had no effect on NDFD of forage substrates Supplementing oat hay (24 hours) with
starch and citrus pectin and wheat straw (24 amp 72 hours) with starch however lowered NDFD (P lt 005)
when compared to the control treatment It is hypothesized that micro-organisms fermented the easily
fermentable energy sources first before attacking forage NDF The study suggested that forage NDFD
values are not fixed and may be altered by type of energy supplementation
52
41 Introduction
The production potential of ruminants is determined to a great extent by the availability and quality of
forages Lactating dairy cows depend significantly on forages to maintain optimal fermentation rumen
function and high production However the ability of rumen micro-organisms to degrade forages is restricted
by the chemical composition and physical quality of the forage (Mertens 1997) Forages alone also do not
provide all the energy requirements of a high producing dairy cow (Schwarz et al 1995) Supplementing
dairy cow diets with energy-rich feeds provide high yielding dairy cows with the energy needed to improve
efficiency of production and performance (Henning 2004) The most important source of energy and largest
nutrient component for rumen micro-organisms is carbohydrates (especially non-fibre carbohydrates or
NFC)
It is important to try and find ways to improve forage degradation Improvement of forage utilization and
degradation will aid in animal performance (Giraldo et al 2008) Forage based diets supplemented with NFC
(sugar starch or pectin) result in variation of performance measurements such as milk yield milk
composition dry matter intake (DMI) and feed efficiency (Larson 2003) Miron et al (2002) reported that
cows receiving total mixed rations (TMR) with a high percentage of citrus pulp had higher NDF and NSC
digestibilities compared to cows that received TMR with a high percentage of corn Leiva et al (2000)
reported that the rumen pH declined more rapidly on citrus diets (pectin) than on hominy (starch) diets and
also reached the lowest pH point faster Knowledge of the individual (as well as a combination of NFC)
fermentation characteristics can thus be helpful in predicting an animalrsquos performance due to NFC
supplementation (Holtshausen 2004)
The objectives of this study were to determine the impact of three applied energy sources viz maize meal
molasses syrup and citrus pulp and three purified energy sources viz maize starch sucrose and citrus
pectin on dry matter (DM) and neutral detergent fibre (NDF) digestibility of different forage substrates
Forages commonly used in dairy cow diets (wheat straw oat hay lucerne hay kikuyu grass and ryegrass)
were used
42 Materials and methods
421 Study area
The study to evaluate the effect of supplementing forage based diets with sugar starch and pectin on DM
and NDF degradability was conducted at the Stellenbosch University Stellenbosch South Africa
(33deg 55prime 12Prime S 18deg 51prime 36Prime E)
53
422 Simulated diets
4221 Basal forages
Five forages (Table 41) were used to prepare rations to simulate diets for lactating dairy cows
Table 41 Forages used in simulation diets for lactating dairy cows
Forage Type Acronym
Wheat straw (Triticum aestivum ) WS
Oat hay (Avena sativa) OH
Lucerne hay (Medicago sativa) LUC
Ryegrass (Lolium multiflorum ) RYE
Kikuyu grass (Pennisetum clandestinum) KIK
Rye and kikuyu grasses were harvested after four weeks of re-growth All the forages were oven dried at
60ordmC for 72 hours Wheat straw oat hay and lucerne hay were ground (cyclotec 1093 mill) through a 2 mm
screen Rye and kikuyu grasses were obtained from Outeniqua experimental farm (33deg 57prime 0Prime S
22deg 25prime 0Prime E) just outside George South Africa (33deg 58prime 0Prime S 22deg 27prime 0Prime E) The rye and kikuyu grasses were
already ground through a 1 mm screen when received
4222 Energy supplements
Three energy sources (Table 42) were selected as supplements to prepare rations that would simulate
lactating dairy cow diets
Table 42 Applied energy sources used in simulating the dairy cow diets
Energy type Source Acronym
Starch Yellow maize (Zea mays) meal Mm
Sugar Molasses syrup Mol
Pectin Citrus pulp Cp
These energy feedstuffs were sourced in the following forms molasses as a syrup by-product from the
processing of sugar cane (Officinarum saccharum) citrus pulp as a finely granulated residue by-product from
the peel pulp and seeds of oranges and grapefruit and yellow maize grain The citrus pulp and maize were
ground (cyclotec 1093 mill) through a 1 mm screen
Three purified energy sources (Table 43) were selected as supplements to prepare rations that would
simulate lactating cow diets
54
Table 43 Purified energy sources used in simulating the dairy cow diets
Energy type Source Acronym
Starch Maize starch Maiz
Sugar Sucrose Suc
Pectin Citrus pectin Pec
4223 Defining the diets
A total of 43 simulated diets were prepared
bull 5 diets contained forage substrates only (Table 41)
bull 3 diets contained applied energy sources only (Table 42)
bull 15 diets contained a mixture of forages and applied energy sources
bull 5 diets contained forage substrates only (Table 41)
bull 15 diets contained a mixture of forages and purified energy sources
The final substrate compositions are indicated in Tables 45 and 46
423 Chemical analyses of forages and energy sources
About 1 g of each forage type as well as 1 g of the energy sources were weighed and placed in a 100ordmC
conventional oven for 24 hours to determine DM content (AOAC 1995 Method 93015) Organic matter
(OM) was determined by weighing 1 g of each type of feedstuff used into crucibles and ashing the content at
500ordmC in a muffle furnace for 6 hours (AOAC 1995 Method 94205)
The NDF component was determined by measuring 05 g of each feedstuff into F57 ANKOM fibre analysis
bags The bags were heat sealed and NDF determined using the method of Van Soest et al (1991)
Sodium sulfite (Na2SO3) was added to the NDF solution during digestion and heat-stable amylase was
added during rinsing Ether extract was determined using the AOAC method (AOAC 1995 Method 92039) About 2 g of ground sample was weighed into a thimble The samples were then extracted with diethyl ether
(C4H10O)
Acid detergent lignin (ADL) was determined by measuring 05 g of each basal forage and 05 g of maize
meal and citrus pulp into separate F57 ANKOM fibre analysis bags The bags were heat sealed and acid
detergent fibre (ADF) was determined using the method of Van Soest et al (1991) The ADF residue was
then soaked in 72 sulphuric acid for three hours to dissolve the cellulose Acid detergent lignin was
determined using the ANKOM method (ANKOM 2005)
55
Total nitrogen content was determined with a Leco Nitrogen Gas Analyzer custom designed and built by
LECO Africa (Pty) Ltd (Kempton Park) About 01 g of sample was weighed into a small piece of aluminum
foil The samples were then ignited inside the Leco furnace at about 900degC using the Dumas procedure
(AOAC 1990 Method 96806) Crude protein (CP) was calculated by multiplying nitrogen content with 625
(AOAC 1995 Method 99003)
Table 44 Chemical composition (gkg DM plusmn SD) of forages and energy sources used in the trial All values
are on a DM basis
Sources DM OM NDF CP EE ADL
WS 9150plusmn05 9022plusmn16 8179plusmn71 723plusmn10 36plusmn05 1022plusmn30
OH 8504plusmn23 9403plusmn173 7819plusmn110 910plusmn12 97plusmn08 825plusmn03
LUC 8989plusmn20 9062plusmn18 5153plusmn10 2370plusmn46 81plusmn06 927plusmn67
RYE 938plusmn10 845plusmn05 4892plusmn30 2509plusmn27 431plusmn01 448plusmn181
KIK 1242plusmn104 1122plusmn01 6512plusmn20 2534plusmn41 283plusmn11 480plusmn17
mm 8559plusmn09 9844plusmn13 1743plusmn550 1071plusmn02 377plusmn04 70plusmn06
cp 8799plusmn09 9285plusmn07 2614plusmn140 786plusmn18 164plusmn04 253plusmn64
mol 6980plusmn19 8927plusmn06 ND ND ND ND
DM = dry matter OM = organic matter NDF = neutral detergent fibre CP = crude protein EE = ether
extract ADL = acid detergent lignin ND = not determined WS = wheat straw OH = oat hay LUC = lucerne
RYE = ryegrass KIK = kikuyu grass mm = maize meal cp = citrus pulp mol = molasses
Purified energy sources were 99 pure based on manufacturers analyses
424 Sample preparation
Small fibre analysis bags were used (F57 ANKOM Technology) The bags were pre-rinsed in acetone for
five minutes air dried and placed in a conventional oven at 100ordmC for three to four hours The diets were
constituted as shown in Tables 45 46 and 47 The total amount of substrate was based on a forage to
concentrate ratio of 5050 The substrate amount of the energy sources in Table 45 was calculated to
provide the same amount of metabolizable energy (ME) contained in 025 g DM of yellow maize meal For
calculation purposes the ME values were assumed to be 139 MJkg DM for maize 123 MJkg for molasses
and 122 MJkg for citrus pulp (NRC 2001)
56
Table 45 Substrate samples containing either forage or applied energy supplements
Forage type Energy source Forage (g DM) Energy (g DM)
Wheat straw - 0250 -
Oat hay - 0250 -
Lucerne hay - 0250 -
Ryegrass - 0250 -
Kikuyu grass - 0250 -
- Maize meal - 0250
- Citrus pulp - 0285
- Molasses - 0282
The amount of energy sources used in the composite substrates (Table 46) was calculated to provide the
same amount of ME contained in 0125 g DM of yellow maize meal (139 MJMEkg)
Table 46 Composite diets containing forage and applied energy sources
Forage type Energy source Forage (g DM) Energy (g DM)
Wheat straw Maize meal 01250 01250
Wheat straw Citrus pulp 01250 01425
Wheat straw Molasses 01250
01412
Oat hay Maize meal 01250 01250
Oat hay Citrus pulp 01250 01425
Oat hay Molasses 01250
01412
Lucerne hay Maize meal 01250 01250
Lucerne hay Citrus pulp 01250 01425
Lucerne hay Molasses 01250
01412
Ryegrass Maize meal 01250 01250
Ryegrass Citrus pulp 01250 01425
Ryegrass Molasses 01250
01412
Kikuyu grass Maize meal 01250 01250
Kikuyu grass Citrus pulp 01250 01425
Kikuyu grass Molasses 01250 01412
The amount of purified energy sources (Table 47) was based on suggestions by Holtshausen (2004) who
used starch pectin and sucrose at hexose equivalent amounts of 40 80 or 120 mg per 120 mg purified NDF
in in vitro incubations
57
Table 47 Diets containing forages alone or a mixture of forages and purified energy sources Amounts are
on an air dry basis
Forage type Energy source Forage (g) Energy (g)
Wheat straw - 0500 -
Oat hay - 0500 -
Lucerne hay - 0500 -
Ryegrass - 0500 -
Kikuyu grass - 0500
-
Wheat straw Maize starch 0500 0163
Wheat straw Citrus pectin 0500 0192
Wheat straw Sucrose 0500
0137
Oat hay Maize starch 0500 0152
Oat hay Citrus pectin 0500 0178
Oat hay Sucrose 0500
0127
Lucerne hay Maize starch 0500 0160
Lucerne hay Citrus pectin 0500 0189
Lucerne hay Sucrose 0500
0135
Ryegrass Maize starch 0500 0162
Ryegrass Citrus pectin 0500 0191
Ryegrass Sucrose 0500
0137
Kikuyu grass Maize starch 0500 0161
Kikuyu grass Citrus pectin 0500 0190
Kikuyu grass Sucrose 0500 0136
In the current study a hexose equivalent amount of 40 mg of each energy source per 120 mg of forage
substrate was used Since 500 mg (air dry) of each forage substrate was weighed out into the incubation
bags in the current study the hexose equivalent of the energy sources amounted to 167 mg DM
To calculate the actual amount of energy source DM the following conversion coefficients were used (based
on Holtshausen 2004)
bull 090 for maize starch
bull 114 for citrus pectin
bull 095 for sucrose
58
The DM content of the energy sources were taken into account when calculating the air dry amounts that
were finally weighed out into the bags (Table 47)
Blank bags were included to correct for residues from rumen fluid alone All bags were heat-sealed using an
impulse sealer after sample preparation
425 Preparation of in vitro medium and reducing solution
The incubation medium was prepared as described by Van Soest amp Robertson (1985) The medium
consisted of micro minerals macro-mineral solution buffer solution tryptose rezasurin and distilled water
The medium was kept in a water bath at 395ordmC The pH of the medium was about 78 Reducing solution
was prepared as described by Van Soest amp Robertson (1985) and consisted of cysteine hydrochloride
(C3H7NO2HCL) potassium hydroxide (KOH) pellets sodium sulfide nonahydrate (Na2S9H2O) and distilled
water
426 Collection and preparation of rumen fluid Rumen fluid was collected from two ruminally cannulated lactating dairy cows The cows were confined and
fed 25 kg (as is) of a diet (125 kg in the mornings and 125 kg in the evenings) consisting of oat hay lucerne
hay wheat straw and a concentrate mix Rumen fluid was squeezed through two layers of cheesecloth into
pre-warmed flasks and a small amount of coarse material was added The rumen fluid was then blended in
a pre-warmed blender at a low speed for 10 seconds The rumen fluid was then filtered through four layers
of cheesecloth into pre-warmed flasks while flushing with carbon dioxide (CO2) The temperature of the
rumen fluid averaged 38ordmC and the pH averaged 58
427 In vitro incubation
The in vitro procedure for the ANKOM Daisy incubations required four glass vessels (2 L) and is based on
the method described by Goering amp Van Soest (1970) The glass vessels were flushed with CO2 while
adding 1076 ml of incubation medium and 54 ml of reducing solution to each vessel The vessels were
closed and placed in the incubator at 395ordmC until the medium was clear The vessels were opened and
flushed with CO2 while adding 270 ml of rumen fluid and bags to the vessels Incubation periods were 24
and 72 hours At each time interval one vessel was removed and the residue bags washed with water air-
dried and then placed in a conventional oven at 100ordmC for 24 hours
59
428 Residue analysis
The NDF content of the residues in the bags was determined using an ANKOM fibre machine (ANKOM220
fibre analyzer) and was based on the method of Van Soest et al (1991) Sodium sulfite (20 g) was added to
19 L of NDF solution during digestion and heat-stable amylase (4 ml x 2 rinse) was added during rinsing
Before using the bags they were rinsed in acetone for three to five minutes and then air-dried before being
placed in a forced draft oven at 100ordmC for 24 hours After the NDF procedure the bags were dried weighed
and subsequently ashed in a muffle furnace at 500ordmC for 6 hours
429 Estimating dry matter degradability
The estimation of DM degradability of the substrates was based on DM disappearance and calculated in
Excel using the following equation (Van Soest et al 1991)
( )[ ] 1001002
113 timestimesminus
minus=W
CWWDMD Equation 5
Where DMD = Apparent DM degradability ()
W1 = Bag weight (mg)
W2 = Sample weight (mg DM)
W3 = Weight of dried bag and residue after incubation (mg DM)
C1 = Blank bag correction factor
4210 Estimating neutral detergent fibre degradability
The estimation of NDF degradability of the substrates was based on NDF disappearance and was
calculated in Excel using the following equation (Van Soest et al 1991)
( )[ ]100100
2
113 timestimesminus
minus=W
CWWNDF Equation 6
60
Where NDF = Apparent NDF degradability ()
W1 = Bag weight (mg)
W2 = Sample weight (mg NDF in DM)
W3 = Dried weight of bag with residue after incubation (mg NDF in DM)
C1 = Blank bag correction factor
43 Statistical analyses
The in vitro digestibility experiment was a three way cross classification and the data was subjected to a
factorial ANOVA with the three factors being forage energy and time using Statistica 81 (2008) This was
done for all the non-linear parameters Significant forage x energy interactions were observed for the non-
linear parameters Therefore a one-way ANOVA was done on each of the forages to determine the effect of
the energy sources Differences between means were determined using a Tukey test Significance was
declared at P lt 005
44 Results and discussion
441 Effect of maize meal citrus pulp and molasses on apparent in vitro dry matter degradability
Results of the in vitro dry matter degradability (DMD) trial are presented in Table 48 Unsupplemented
forage values clearly indicate that ryegrass and kikuyu are more digestible than lucerne hay oat hay and
wheat straw This can be attributed to the fact that pasture grasses were cut after only 28 days of re-growth
thus having more digestible nutrients compared to lucerne and oat hay which were harvested at the 10
flowering stage and wheat straw at maturity With maturity the NDF and ADL contents increase (Table 44)
and DMD decreases (Canbolat et al 2006) When forage substrates were supplemented with applied
energy sources a forage x energy source interaction was observed When maize meal citrus pulp and
molasses replaced 50 of the forage substrates DMD was increased (P lt 001) in all forage substrates
(after 24 and 72 hours of incubation) with molasses having the biggest effect throughout It should be kept
in mind that the energy sources as such were all more degradable than the forages and therefore it could be
expected that a 50 replacement of forages with energy sources would increase total substrate DMD The
increase in DMD of forage substrates could thus be due to increased stimulation of rumen micro-organisms
in response to the readily available energy supplied by energy sources
61
Table 48 Effects of maize meal citrus pulp and molasses as energy sources on in vitro dry matter
degradability (DMD) parameters of different forage substrates
Treatment
Item Maize meal Citrus pulp Molasses Control
SEm
P
Lucerne hay
DMD 24h 707 b 731 b 832 c 565 a 159 lt0001
DMD 72h 829 b 825 b 858 c 690 a 044 lt0001
Oat hay
DMD 24h 637 b 676 bc 739 c 442 a 153 lt0001
DMD 72h 773 b 788 bc 820 c 588 a 080 lt0001
Wheat straw
DMD 24h 602 b 627 b 710 c 383 a 092 lt0001
DMD 72h 721 b 744 bc 778 c 510 a 089 lt0001
Ryegrass
DMD 24h 796 a 835 ab 901 b 760 a 212 0003
DMD 72h 926 b 934 b 964 b 877 a 095 lt0001
Kikuyu grass
DMD 24h 802 b 806 b 886 c 695 a 188 lt0001
DMD 72h 915 b 923 b 953 b 867 a 098 lt0001
Superscripts are compared across rows
The biggest effect of energy supplementation occurred with wheat straw as also reported in the gas
production experiments (Chapter 3) Wheat straw was high in NDF and ADL (Table 44) Neutral detergent
fibre is slowly degraded by rumen micro-organisms whereas ADL are not degraded by rumen micro-
organisms explaining the lower DMD of wheat straw when compared to the other forages Supplementing
readily available energy sources would therefore have a greater impact on DMD of wheat straw compared to
other forages Molasses had the highest impact on wheat straw DMD during the early phases of incubation
(24 hours) but after 72 hours the effect of molasses and citrus pulp was similar
In lucerne hay molasses had the highest impact on DMD at 24 and 72 hours incubation but citrus pulp and
maize meal also improved DMD significantly In oat hay maize meal citrus pulp and molasses improved
DMD at 24 and 72 hours incubation with molasses also having the most noticeable effect (P lt 001) Fall et
al (1998) also found improvements in DMD of straws supplemented with molasses In contrast to results
obtained in this study Williams et al (1953) found that addition of starch to oat hay diets of sheep decreased
DMD by one to two percentage units Burroughs et al (1949) observed a 5 ndash 12 reduction in lucerne hay
DMD when the diet was supplemented with 60 starch Mould amp Orskov (1983) however concluded that
62
the decrease in DMD of hays are mainly due to reduced rumen pH and not directly related to starch
digestion Abrupt changes in cattle diets (forage to concentrate diets) decrease rumen pH resulting in an
overgrowth of starch fermenting bacteria which causes acute acidosis with devastating effects on production
(Owens et al 1998) Cellulolytic bacteria are also inhibited at low rumen pH values decreasing fibre
digestion (Russel amp Wilson 1996)
In ryegrass molasses was the only energy source that improved DMD after 24 hours incubation Simeone
et al (2004) found similar results and reported that neither ground nor whole maize meal had an effect on
ryegrass DMD Ryegrass and kikuyu are highly fermentable forages as was also observed in terms of total
gas production and rate of gas production (Chapter 3) Molasses which is also rapidly fermentable had the
largest influence on DMD of pasture grasses at 24 hours probably because of its high fermentation rates
(Chapter 3) and because it is free of NDF and does not have trace amounts of lignin (Table 44) Overall
however all the energy sources improved DMD of ryegrass and kikuyu to the same extent at 72 hours
442 Effect of maize meal citrus pulp and molasses on apparent in vitro neutral detergent fibre degradability
The effects of sugar (molasses) starch (maize meal) and pectin (citrus pulp) on in vitro apparent NDF
degradability (NDFD) of different forages and forage-energy source combinations are shown in Table 49
Unsupplemented pasture grasses harvested at 28 days of re-growth had a higher NDFD than the mature
forages The NDFD of mature forages ranged between 197 and 284 which is too low to sustain
production and hence the need for energy supplementation Ryegrass and kikuyu was lower in NDF and
ADL (Table 44) and had greater gas production volumes (above 320 mlg OM Chapter 3) compared to the
other forages (ranging between 229 and 297 mlg OM) A negative correlation between ADL content and
NDFD of forage substrates have been reported by Smith et al (1972) and Tomlin et al (1964)
When forage substrates were supplemented with applied energy sources a forage x energy source
interaction was observed When energy sources replaced 50 of the forage substrates 24 hours NDFD of
lucerne hay was significantly increased by citrus pulp and molasses Hall (2002a) however postulated that
molasses decreases fibre digestion when fed in large quantities After 72 hours both maize meal and citrus
pulp resulted in increased NDFD Contrary to this observation Mertens amp Loften (1980) reported that starch
decreased the potential extent of fibre digestion These results (Mertens amp Loften 1980) however confirm
our findings obtained in the gas production experiments (Chapter 3) namely that maize meal tended to
increase the lag time of lucerne hay The lack of response of molasses at 72 hours could be due to its rapid
fermentation rate (Chapter 3) and also to the fact that molasses does not have any NDF (Table 44) that
could contribute to NDFD Maize meal and especially citrus pulp however contain some NDF that is readily
digestible
63
Table 49 Effects of maize meal citrus pulp and molasses as energy sources on in vitro neutral detergent
fibre degradability (NDFD) parameters when incubated in combination with different forage substrates
Treatment
Item Maize meal Citrus pulp Molasses Control
SEm
P
Lucerne hay
NDFD 24h 230 ab 296 b 300 b 197 a 219 0014
NDFD 72h 503 b 541 b 414 a 403 a 126 lt0001
Oat hay
NDFD 24h 300 356 289 284 222 0138
NDFD 72h 522 ab 579 b 509 a 472 a 139 lt0001
Wheat straw
NDFD 24h 196 a 285 b 249 ab 247 ab 171 0024
NDFD 72h 437 a 509 b 421 a 403 a 163 0003
Ryegrass
NDFD 24h 522 599 571 501 249 0059
NDFD 72h 775 822 843 748 242 0063
Kikuyu grass
NDFD 24h 516 561 624 530 424 0326
NDFD 72h 794 826 837 795 205 0368
Superscripts are compared across rows
Apparent NDFD of oat hay was not affected by energy source after 24 hours incubation but with citrus pulp
longer incubations (72 hours) resulted in higher NDFD (P lt 001) probably due to a relative high digestibility
of citrus pulp NDF Miron et al (2002) obtained similar positive results on NDFD of forages when maize or
barley was replaced with citrus pulp Voelker amp Allen (2003) proposed that the optimal rate and extent of
NDFD of high concentrate diets can be achieved by using dried beet pulp instead of high moisture corn
Heldt et al (1999) found that supplementing low-quality tallgrass-prairie hay with degradable intake protein
and NFC increased the total tract NDFD but supplementation with NFC alone decreased NDFD
Citrus pulp was the only energy source that consistently improved apparent NDFD when incubated in
combination with the hays and straw Citrus pulp had significant positive effects on NDFD of these forages
probably because mature forages are slowly degradable and citrus pulp supplementation thus provided high
amounts of digestable fibre at both 24 hours and 72 hours incubations The degradation rate of citrus pulp
possibly synchronizes the release of nutrients with the requirements of fibrolytic bacteria Increased NDFD is
important as it increases the supply of energy and support microbial N production (Allen amp Oba 2000)
64
resulting in higher milk production and reduced rumen fill in lactating dairy cows (Dado amp Allen 1995)
Bampidis amp Robinson (2006) stated that citrus pulp might be a good supplement to dairy cow diets as it
improves NDFD and has less negative effects on rumen pH and cellulolytic activities compared to sugar and
starch
Energy sources had no effect on apparent NDFD of kikuyu and ryegrass possibly because these pasture
grasses was immature and thus high in soluble readily available energy In the gas production experiments
(Chapter 3) these pasture grasses also had higher gas production volumes than the mature forages It
would thus appear given the high nutrient content in these forages that energy supplementation would have
minimal effects on NDFD
None of the energy source and forage combinations had lower NDFD values than the forages alone
contrary to Sanson et al (1990) who reported that the supplementation of low-quality forages with rapidly
degradable NFC depressed NDFD Grant amp Mertens (1992) suggested that acidification of the rumen due
to fast ruminal NFC fermentation is a prime factor responsible for depression in fibre digestion
443 Effect of maize starch citrus pectin and sucrose on apparent in vitro dry matter degradability
The effect of purified energy sources viz sugar (sucrose) starch (maize starch) and pectin (citrus pectin) on
in vitro apparent DMD of different forages are shown in Table 410 When forage substrates were
supplemented with purified energy sources a forage x energy source interaction was observed In lucerne
hay only pectin resulted in an improved DMD (both at 24 hours and 72 hours) while in oat hay all the
energy sources improved DMD at both incubation times Carey et al (1993) reported similar improvements
in DMD of brome hay (in situ) when it was supplemented with maize and beet pulp In contrast Burroughs et
al (1949) reported that DMD of lucerne was reduced when forages were supplemented with 20 and 40
starch In wheat straw all the energy sources improved DMD but at 24 hours pectin and sucrose had a
bigger effect than starch Pectin and sucrose are more fermentable than starch hence the more visible
effect on DMD of slow degradable wheat straw forages At 72 hours pectin also improved DMD more than
starch
Ryegrass and kikuyu had high DMD values without supplementation The higher DMD of pasture grasses
was most likely because they were immature at harvesting whereas lucerne and oat hay were cut at the
10 flowering stage and wheat straw was harvested at maturity Immature pasture grasses were thus
higher in fast fermentable sugars and lower in NDF and ADL (Table 44) improving DMD and gas production
volumes (Chapter 3) Only sucrose was sufficient in improving DMD in these grasses and then only at 24
hours due to their very high fermentability The absence of a sucrose effect at 72 hours was probably
because sucrose was depleted before 72 hours as it is rapidly fermented in the early hours of incubation
Purified energy sources are all more degradable than forages and therefore it could be expected that
inclusion of these energy sources in forage diets will increase DMD In general purified energy sources
resulted in lower DMD when compared to the applied energy sources (Table 48) We can postulate that
65
there was a rapid decline in rumen pH with purified energy source supplementation (as these energy sources
has no NDF) resulting in higher lactic acid production and slower microbial growth hence the lower DMD
Table 410 Effects of maize starch citrus pectin and sucrose as energy sources on in vitro dry matter
degradability (DMD) parameters of different forage substrates
Treatment
Item Maize starch Citrus pectin Sucrose Control
SEm
P
Lucerne hay
DMD 24h 642 ab 687 b 660 ab 593 a 182 0021
DMD 72h 745 ab 773 b 746 ab 673 a 203 0025
Oat hay
DMD 24h 476 b 512 b 504 b 377 a 096 lt0001
DMD 72h 638 b 658 b 644 b 552 a 116 lt0001
Wheat straw
DMD 24h 449 b 508 c 520 c 348 a 080 lt0001
DMD 72h 591 b 643 c 617 bc 510 a 094 lt0001
Ryegrass
DMD 24h 769 ab 768 ab 771 b 708 a 147 0026
DMD 72h 884 862 875 847 185 0548
Kikuyu grass
DMD 24h 681 ab 684 ab 709 b 634 a 150 0027
DMD 72h 859 826 843 808 213 0408
Superscripts are compared across rows
444 Effect of maize starch citrus pectin and sucrose on apparent in vitro neutral detergent fibre degradability
Purified energy source supplementation on in vitro apparent NDFD of the different forage substrates are
illustrated in Table 411 As was the case with DMD an energy source x forage interaction was observed for
NDFD Purified energy sources have negligible amounts of NDF thus the NDFD was solely from forages
In the control diets it is evident that the immature pasture grasses had the highest NDFD probably as they
are low in NDF and ADL (Table 44)
With lucerne hay energy supplementation had no significant effect on NDFD while in oat hay starch and
pectin supplementation suppressed NDFD but only at 24 hours incubation (P = 0011) Sucrose had no
66
effect on NDFD of oat hay at 24 hours Hall (2002a) proposed that in general sucrose tends to decrease
fibre digestion when fed in large quantities probably due to its lowering effect on rumen pH Heldt et al
(1999) reported that NFC supplementation to low-quality tallgrass-prairie decrease NDFD agreeing with our
results
Table 411 Effects of maize starch citrus pectin and sucrose as energy sources on in vitro neutral
detergent fibre degradability (NDFD) parameters of different forage substrates
Treatment
Item Maize starch Citrus pectin Sucrose Control
SEm
P
Lucerne hay NDFD 24h 123 197 178 179 277 0305
NDFD 72h 353 319 366 371 218 0364
Oat hay
NDFD 24h 131 b 137 b 174 ab 202 a 138 0011
NDFD 72h 389 395 406 425 201 0608
Wheat straw
NDFD 24h 116 b 171 a 239 c 205 ac 126 lt0001
NDFD 72h 343 b 402 a 393 a 403 a 140 0032
Ryegrass
NDFD 24h 419 401 392 403 186 0781
NDFD 72h 687 a 556 b 620 ab 649 ab 236 0013
Kikuyu grass
NDFD 24h 353 329 419 437 293 0068
NDFD 72h 714 a 573 b 687 ab 705 ab 324 0033
Superscripts are compared across rows
Sucrose had no effect on NDFD of wheat straw while pectin had a negative effect and starch severely
suppressed NDFD at both incubation times (P lt 005) The severe suppression in NDFD after
supplementation of maize starch can result from the negative effect that starch has on rumen pH Sucrose
and starch ferment rapidly producing lactic acid a product that lowers rumen pH whereas pectin does not
produce lactic acid (Hall 2002b) Starch has shown to decrease rumen pH and affect cellulolytic activity in
the rumen thereby lowering fibre digestion and increasing the risks of acidosis (Mertens amp Loften 1980)
Heldt et al (1999) reported similar results and found that starch decreased fibre digestion more than sugar
This is also in agreement with Vallimont et al (2004) who found that by replacing starch with sugar
incrementally in a continuous culture system fibre digestion was increased
67
Ryegrass and kikuyu NDFD was not affected at 24 hours by energy supplementation Pasture grasses are
high in rapidly fermentable sugars especially when harvested young as was the case with ryegrass and
kikuyu (28 days re-growth) Supplementation with energy sources would thus have a much smaller effect on
these forages compared to mature forages
45 Conclusion
Forage based diets that constitute mainly of mature forages are deficient in energy and therefore cannot
support growth and production in ruminant animals Lactating dairy cows have high energy requirements for
milk production Supplementation of lactating dairy cow diets with concentrates which are high in energy
can thus not be over-emphasized Supplementation with optimal amounts of energy substrates provide the
high producing dairy cow with energy needed to improve fibre digestibility and utilization It must however
be kept in mind that incorrect feeding and large amounts of energy substrates (especially starch and sugar)
increase the risks of ruminal acidosis due to the production of large quantities of lactic acid which
subsequently reduces milk production and profitability
Results obtained from this study proved that supplementation of applied as well as purified energy sources
have positive effects on DMD of forages Supplementing forages with 50 of the applied energy sources
improved DMD of all forages significantly Purified energy sources improved DMD of the hays and straws
significantly These forages are mature and thus have less soluble readily fermentable energy sources in
their tissue compared to ryegrass and kikuyu With the applied energy sources molasses tended to have
the biggest effect on DMD In general however the applied energy sources had a greater influence on
DMD probably because they do not tend to lower rumen pH as much as purified energy sources
The effect of applied energy sources on NDFD showed similar positive results The energy sources
improved NDFD of the total hay and straw substrates significantly These forages are high in NDF and ADL
which lowers NDFD It must also be kept in mind that these energy sources also contain various amounts of
NDF Subsequently substitution with energy sources (low in NDF and ADL) lowered the cell wall content of
the substrate thereby improving NDFD Citrus pulp had the greatest effect on all forages NDFD probably
due to its highly digestible NDF content The energy sources however had no effect on kikuyu grass and
ryegrass because these grasses were lower in NDF and ADL content and high in available sugars Purified
energy sources in contrast tended to decrease NDFD of all the forages The negative effect on NDFD
when supplementing with purified energy sources may be because fermentation of these energy sources by
rumen micro-organisms may result in a depletion of available nitrogen needed by micro-organisms to
ferment the slowly digestible fibre in forages (Heldt et al 1999) Another reason may be due to the fact that
these energy sources lower the rumen fluid pH due to large amounts of lactic acid production (especially by
sucrose and starch) thus decreasing the activity of cellulolytic and hemicellulolytic enzymes needed for fibre
digestion (Hoover amp Miller-Webster 1998) Another reason may be that rumen micro-organisms first attack
the readily fermentable energy sources before attaching to the forage substrates thereby decreasing the
rate of NDFD
68
It must be emphasized that when supplementing dairy cow diets with large amounts of energy sources it is
of utmost importance to provide adequate amounts of effective fibre to ensure a healthy rumen as well as
enough RDP to provide in the rumen microorganismrsquos nitrogen requirements In vitro experiments that show
the effects of supplementing poor quality roughage (such as wheat straw) with RDP or non-protein nitrogen
(NPN would also be useful in further studies as the limiting nutrient in wheat straw is nitrogen Nitrogen in
turn is needed for energy-nitrogen coupling to take place and improve microbial growth Not much research
has also been done to quantify the relationship between different carbohydrate sources and rumen
metabolism parameters leaving room for improvement and further studies
46 References
Allen M amp Oba M 2000 Getting more milk from forages Michigan Dairy Review 5(4) Michigan State
University
Available at
httpwwwadmanicomalliancedairyTechBulletinsNon20Structural20Carbohydrate20Nutrition
htm
(Accessed 5 August 2008)
ANKOM 2005 Method for Determining Acid Detergent Lignin in Beakers ANKOM Technology 0805
AOAC 1990 Official Methods of Analysis 15th edition Association of Official Analytical Chemists Arlington
Virginia
AOAC 1995 Official Methods of Analysis 15th edition Association of Official Analytical Chemists
Washington DC USA
Bampidis VA amp Robinson PH 2006 Citrus by-products as ruminant feeds A review Anim Feed Sci
Technol 128 175 - 217
Burroughs W Gerlaugh WP Edington BH amp Bethke RM 1949 The influence of corn starch upon
roughage digestion in cattle J Anim Sci 8 271
Canbolat O Kamalak A Ozkan CO Erol A Sahin M Karakas E amp Ozkose E 2006 Prediction of
relative feed value of alfalfa hays harvested at different maturity stages using in vitro gas production
Livestock Res Rural Dev 18(2) Article 27
Available at httpwwwcipavorgcolrrdlrrd182canb18027htm
(Accessed 18 October 2008)
Carey D A Caton J S amp Biondini M 1993 Influence of energy source on forage intake digestibility in
situ forage degradation and ruminal fermentation in beef steers fed medium-quality brome hay J
Anim Sci 71 2260 - 2269
69
Dado RG amp M S Allen 1995 Intake limitations feeding behaviour and rumen function of cows
challenged with rumen fill from dietary fiber or inert bulk J Dairy Sci 78 118 - 133
Fall ST Cisseacute M Ditaroh D Richard D Ndiaye NS amp Diaw B 1998 In vivo nutrient digestibility in
sheep and rumen dry matter degradability in cattle fed crop by-product based diets J Anim Feed
Sci 7 171 - 185
Goering HK Van Soest PJ 1970 Forage Fiber Analysis (apparatus reagents procedures and some
applications) In Agriculture Handbook No 379 Agriculture Research Service United States
Department of Agriculture Washington USA
Giraldo LA Tejido ML Ranilla MJ amp Carro MD 2008 In press Effect of exogenous fibrolytic
enzymes on in vitro rumen fermentation of substrates with different forage concentrate ratios Anim
Feed Sci Technol 141 306 - 325
Grant RJ amp Mertens DR 1992 Development of buffer systems for pH control and evaluation of pH
effects on fiber digestion in vitro J Dairy Sci 75 1581 - 1587
Hall MB 2002a Working with Non-NDF carbohydrates with manure evaluation and environmental
considerations In Proc Mid-South Ruminant Nutrition Conference Texas A amp M University Texas
USA pp 37 - 48
Available at httpwwwtxancorgproceedings2002Non-NDF20Carbohydratespdf
(Accessed 20 October 2008)
Hall MB 2002b Working with sugars (and molasses) In Proceedings of the 13th Annual Florida Ruminant
Nutrition Symp January 11 - 12 Gainesville Florida USA pp 146 - 158
Heldt JS Cochran GL Stokka GL Farmer CG Mathis CP Titgemeyer EC amp Nagaraja TG
1999 Effects of different supplemental sugars and starch fed in combination with degradable intake
protein on low-quality forage use by beef steers J Anim Sci 77 2793 - 2802
Henning P 2004 Acidosis in high-producing ruminants - myth or menace Animal Feed Manufacturers
Association (AFMA) South Africa pp 1 - 9
Available at httpwwwengormixcome_articles_viewaspart=529ampAREA=GDC
(Accessed 5 Augustus 2008)
Holtshausen L 2004 Effect of nonfibre carbohydrates on product yield and fibre digestion in fermentations
with mixed ruminal microbes PhD thesis University of Florida Gainesville Florida USA pp 1 - 33
Hoover WH amp Miller-Webster TK 1998 Role of sugar and starch in ruminal fermentation Tri-State Dairy
Nutrition Conference Michigan State University pp 1 - 16
70
Larson CC 2003 The effect of nonfiber carbohydrate source and protein degradability on lactation
performance of Holstein cows pp 1 - 108 MSc (Agric) thesis University of Florida Gainesville
Florida USA pp 1 - 108
Leiva E Hall MB amp Van Horn HH 2000 Performance of dairy cattle fed citrus pulp or corn products as
sources of neutral detergent-soluble carbohydrates J Dairy Sci 83 2866 - 2875
Mertens DR 1997 Creating a system for meeting the fiber requirements of dairy cows J Dairy Sci 80
1463 - 1481
Mertens DR amp Loften JR 1980 The effect of starch on forage fiber digestion kinetics in vitro J Dairy Sci
63 1437 - 1446
Miron J Yosef E Ben-Ghedalia D Chase LE Bauman DE amp Solomon R 2002 Digestibility by dairy
cows of monosaccharide constituents in total mixed rations containing citrus pulp J Dairy Sci 85 89 -
94
Mould F L amp Orskov E R 1983 Manipulation of rumen fluid pH and its influence on cellulolysis in sacco
dry matter degradation and the rumen microflora of sheep offered either hay or concentrate Anim
Feed Sci Technol 10 1 - 14
National Research Council (NRC) 2001 Nutrient requirements of dairy cattle (7th Rev Ed) National
Academy Press Washington DC USA pp 34 - 35
Owens FN Secrist DS Hill WJ amp Gill DR 1998 Acidosis in cattle a review J Anim Sci 76 275 -
286
Russel JB amp Wilson DB 1996 Why are ruminal cellulolytic bacteria unable to digest cellulose at low pH
J Dairy Sci 79 1503 - 1509
Sanson DW Clanton DC Rush IG 1990 Intake and digestion of low-quality meadow hay by steers
and performance of cows on native range when fed protein supplements containing various levels of
corn J Anim Sci 68 595 - 603
Schwarz FJ Haffner J amp Krichgessner M 1995 Supplementation of zero-grazed dairy cows with
molassed sugar beet pulp maize or cereal-rich concentrate Anim Feed Sci Technol 54 237 - 248
Simeone A Beretta V Rowe J Nolan J Elizalde JC amp Baldi F 2004 Rumen fermentation in
Hereford steers grazing ryegrass and supplemented with whole or ground maize In Proceedings of
the 25th Biennial Conference of the Australian Society of Animal Production 4 - 8 July University of
Melbourne Victoria Australia 25 168 - 171
71
Smith LW Goering HK amp Gordon CH 1972 Relationships of forage composition with rates of cell wall
digestion and indigestibility of cell walls J Dairy Sci 55 1140
Statistica 81 2008 StatSoft Inc USA
Tomlin DC Johnson RR amp Dehority BA 1964 Relationship of lignification to in vitro cellulose
digestibility of grasses and legumes J Anim Sci 23 161
Vallimont JE Bargo F Cassidy TW Luchini ND Broderick GA amp Varga GA 2004 Effects of
replacing dietary starch with sucrose on ruminal fermentation and nitrogen metabolism in continuous
culture J Dairy Sci 87 4221 - 4229
Van Soest PJ amp Robertson JB 1985 Analysis of forages and fibrous feeds A laboratory manual for
animal science 613 Cornell University Ithaca New York USA
Van Soest PJ Robertson JB amp Lewis BA 1991 Methods for dietary fiber neutral detergent fiber and
nonstarch polysaccharides in relation to animal nutrition J Dairy Sci 74 3583 - 3587
Voelker JA amp Allen MS 2003 Pelleted beet pulp substituted for high-moisture corn effect on rumianl
fermentation pH and microbial protein efficiency in lactating dairy cows J Dairy Sci 86 (11) 3562 -
3570
Williams VJ Rottle MC Moir RJ amp Underwood EJ 1953 Ruminal flora studies in the sheep IV The
influence of varying dietary levels of protein and starch upon digestibility nitrogen retention and the
free microorganisms of the rumen Aust J Biol Sci 6 142
72
Chapter 5
GENERAL CONCLUSION
The constant availability of high quality forages remains a problem in South Africa The efficiency of forage
utilization by ruminants is limited by several chemical and physical properties of forages including a high
fibre content and relative low energy content The primary components of fibre are cellulose hemicellulose
and lignin Supplementing dairy cow diets with concentrates such as sugar starch and pectin has the
potential to improve animal performance by improving the degradability of forage feedstuffs
Results from the current study suggested that the in vitro methods used were sufficient to indicate not only
that forages differ in terms of fermentability and digestibility but also to show that different energy sources
affect fermentation and digestion patterns of forages in different ways
The first study indicated that molasses per se may have a negative effect on total forage fermentability (as
determined by gas production) while citrus pulp may have a negative effect on the fermentability of certain
forages in this case oat hay and ryegrass Maize meal did not affect forage fermentability as measured by
total gas production The study also suggested that citrus pulp and maize meal may increase the
fermentation rate of oat hay while maize may also increase the fermentation rate of kikuyu The lag phase
of wheat straw and kikuyu fermentation may be shortened by all the energy sources investigated viz maize
meal molasses and citrus pulp It was concluded from the first study that forage fermentability is affected
differently by different energy sources These observations may have significant effects in practice on
rumen health and milk production and the data obtained can potentially be used as guide lines in feed
formulations
In the second study it was shown that different energy sources had different effects on in vitro NDF
digestibility (NDFD) of forages In general sucrose (after 24 and 72 hours of incubation) and pectin (72
hours) had no effect on NDFD of forage substrates The supplementation of oat hay with starch and pectin
(24 hours) and wheat straw with starch (24 and 72 hours) however lowered NDFD when compared to the
control treatment It is hypothesized that micro-organisms fermented the easily fermentable energy sources
first before attacking forage NDF The study suggested that forage NDF degradation values are not fixed
and may be altered by energy supplementation
Understanding the interactions that exist between rumen pH forages and NFC fractions used in dairy cow
rations will help when formulating diets for lactating dairy cows Knowledge of these concepts will aid in
formulating diets that will ensure optimal NDFD milk yield and milk composition without causing ruminal
health problems Papers focusing on the topic of the effect of energy sources on forage digestibility and
comparisons between in vivo and in vitro trials are limited and more research are needed in this regard

ii
Declaration
By submitting this thesis electronically I declare that the entirety of the work contained therein is my own original work and that I have not previously in its entirety or in part submitted it for obtaining any qualification
Date helliphelliphelliphelliphelliphelliphelliphelliphelliphelliphelliphelliphelliphelliphelliphelliphellip
Copyright copy 2009 Stellenbosch University
All rights reserved
iii
Abstract
Title The Effect of Sugar Starch and Pectin as Microbial Energy Sources on In Vitro Forage
Fermentation Kinetics
Name Marcia Malan
Supervisor Prof CW Cruywagen
Institution Department of Animal Sciences Stellenbosch University
Degree MScAgric
Ruminants have a compound stomach system that enables them to utilize forages more efficiently than
monogastric animals However forages alone do not contain sufficient nutrients to meet the requirements of
high producing dairy cows Forages are high in fibre and their nutrient availability depends on the degree of
cell wall degradability Improvements in forage fermentation would increase energy intake and subsequently
milk production and performance by dairy cows It is therefore important to find ways to improve forage
degradation and utilization in the rumen
The use of different non-fibre carbohydrate (NFC) sources has different effects on animal performance
Supplementing forage based diets with energy sources containing sugar starch or pectin results in variation
in performance measurements such as milk yield milk composition and dry matter intake (DMI)
This thesis reports on two studies in which the effect of energy supplementation on forage fermentation and
digestion parameters was investigated In the first study an in vitro gas production protocol was used to
determine the effect of sugar (molasses) starch (maize meal) and pectin (citrus pulp) on total gas production
and rate of gas production of different forages The forage substrates included wheat straw (WS) oat hay
(OH) lucerne hay (LUC) ryegrass (RYE) and kikuyu grass (KIK) The three energy sources as well as a
control (no energy source) were incubated in vitro with each of the above mentioned forages Rumen fluid
was collected from two lactating Holstein cows receiving a diet consisting of oat hay lucerne wheat straw
and a concentrate mix Forages alone (025 g DM) andor together (0125 g DM) with either molasses
(01412 g DM) citrus pulp (01425 g DM) or maize meal (0125 g DM) were weighed into glass vials and
incubated for 72 hours The weights of the energy sources were calculated on an energy equivalent basis
Blank vials that contained no substrates were included to correct for gas production from rumen fluid alone
iv
The substrates were incubated in 40 ml buffered medium 2 ml of reducing solution and 10 ml rumen fluid
Gas pressure was recorded automatically every five minutes using a pressure transducer system and the
method based on the Reading Pressure Technique (Mauricio et al 1999) Gas pressure was converted to
gas volume using a predetermined regression equation In the first gas production trial the gas production
included gas produced by the energy sources while in the second gas production trial the energy source
gas production was deducted from the total gas production to determine the effect of energy source on gas
production of respective forage substrates per se Data were fitted to two non-linear models adapted from
Oslashrskov and McDonald (1979) Significant forage x energy interactions were observed for the non-linear
parameter gas production (b) in Model 1 and for b and lag phase (L) in Model 2 in both trials In the first gas
production trial the higher fermentability of the energy sources supplemented to forage substrates
increased b (Model 1 amp 2) of the LUC and WS The gas production rate was affected in different ways for
different forages with the most noticeable effect on WS when it was supplemented with energy sources All
the energy sources increased c of WS irrespective of the model used Energy sources had no effect on the
L of LUC OH or RYE but decreased the L of WS and KIK In the second trial maize meal had no effect on
b for any of the forages (Model 1 amp 2) while molasses (Model 1 amp 2) decreased b for all forage substrates
and citrus pulp (Model 1 amp 2) decreased b of OH and RYE to lower values than those of the control
treatments Gas production rate was not affected by molasses for any of the forage substrates while citrus
pulp (Model 1 amp 2) increased c of OH and maize meal increased c of OH and KIK Lag phase was only
affected by energy sources in WS and KIK where all the energy sources had lower L values than the control
treatment It was concluded that forage fermentability is affected differently by different energy sources
These observations may have important implications in practice on rumen health and milk production and
the data obtained can potentially be used as guidelines in feed formulations
In the second study in vitro digestibility trials were undertaken to determine the effect of sugar (molasses
and sucrose) starch (maize meal and maize starch) and pectin (citrus pulp and citrus pectin) on neutral
detergent fibre (NDF) and dry matter (DM) degradability of forages Forage substrates used included wheat
straw oat hay lucerne hay ryegrass and kikuyu grass Rumen fluid was collected from two lactating
Holstein cows receiving a diet consisting of oat hay wheat straw and a concentrate mix In vitro
degradability was done with an ANKOM Daisy II incubator and forage substrates were incubated with or
without the respective energy sources for 24 48 and 72 hours The substrates were incubated in 1076 ml
buffered medium 54 ml of reducing solution and 270 ml rumen fluid The residues were washed dried and
analyzed for NDF In the study with the applied energy sources (molasses maize meal and citrus pulp)
there were a forage x energy source interactions Supplementation with the applied energy sources all
improved dry matter degradability (DMD) of forages (24 and 72 hours) when compared to the control
treatment except for RYE supplemented with maize meal and citrus pulp at 24 hours Molasses seemed to
have had the biggest effect on DMD in all forage substrates Supplementation with maize meal had no effect
on neutral detergent fibre degradability (NDFD) of any forage substrate except for an improvement in NDFD
of LUC at 72 hours Molasses improved NDFD of LUC at 24h but had no effect on the other forage
substrates Citrus pulp improved NDFD of OH (72 hours) as well as LUC and WS (24 and 72 hours) It is
postulated that the NDF of the energy sources was more digestible than that of the respective forages and
that the improved NDFD values could be ascribed to the contribution of the energy source NDFD Overall
pasture grasses had a higher NDFD than the hays and straw and appear to be more readily fermentable by
v
rumen microbes than the low quality hays and straw explaining the higher NDFD In the study involving the
purified energy sources (sucrose maize starch and citrus pectin) forage x energy source interactions were
observed In general supplementation with these energy sources improved DMD at 24 and 72 hours except
for RYE and KIK (72 hours) Pasture grasses (RYE and KIK) had a higher NDFD than LUC OH and WS At
72 hours NDFD was 371 for LUC 425 for OH and 403 for WS compared to 705 for KIK and
649 for RYE A possible explanation is that KIK and RYE samples came from freshly cut material
harvested after a 28d re-growth period In general sucrose (24 and 72 hours) and citrus pectin (72 hours)
had no effect on NDFD of forage substrates However supplementing oat hay (24 hours) with starch and
citrus pectin and wheat straw (24 and 72 hours) with starch lowered NDFD when compared to the control
treatment It is hypothesized that microbes fermented the easily fermentable energy sources first before
attacking forage NDF The study suggested that forage NDFD values are not fixed and may be altered by
type of energy supplementation
vi
Uittreksel
Titel Die invloed van stysel suiker en pektien as mikrobiese energiebronne op in vitro ruvoer-
fermentasiekinetika
Naam Marcia Malan
Studieleier Prof CW Cruywagen
Instansie Departement Veekundige Wetenskappe Universiteit van Stellenbosch
Graad MScAgric
Die meervoudige maagsisteem van herkouers stel hulle in staat om ruvoer meer effektief te benut as
enkelmaagdiere Ruvoere alleen bevat egter nie genoeg voedingstowwe om die behoeftes van hoog-
produserende melkbeeste te bevredig nie Ruvoere is ryk aan vesel en hul voedingstofbeskikbaarheid word
bepaal deur die graad van selwand degradeerbaarheid lsquon Verhoging in ruvoerfermentasie sal energie-
inname verhoog en gevolglik ook melkproduksie en prestasie Dit is dus belangrik om maniere te vind om
ruvoerdegradeerbaarheid en -verbruik in die rumen te verbeter
Die gebruik van verskillende nie-vesel koolhidraat (NFC) bronne het verskillende uitwerkings op die prestasie
van diere Energie-aanvullings soos suiker stysel en pektien tot ruvoer-gebasseerde dieumlte beiumlnvloed
prestasiemaatstawwe soos melkproduksie melksamestelling en droeumlmateriaalinname (DMI) op verskillende
maniere
Hierdie tesis lewer verslag oor twee studies waar die invloed van energie-aanvullings op ruvoerfermentasie
en verteringsmaatstawwe ondersoek is In die eerste studie is lsquon in vitro gasproduksieprotokol gebruik om
die invloed van suiker (melasse) stysel (mieliemeel) en pektien (sitruspulp) op totale gasproduksie (b) en
tempo van gasproduksie (c) van verskillende ruvoersubstrate te bepaal Ruvoersubstrate wat gebruik is
was koringstrooi (WS) hawerhooi (OH) lusernhooi (LUC) raaigras (RYE) en kikuyugras (KIK) Die drie
energiebronne sowel as lsquon kontrole (geen energiebron) is in vitro geiumlnkubeer saam met elk van die
genoemde ruvoere Rumenvloeistof is verkry van twee lakterende Holsteinkoeie wat lsquon dieet ontvang het
bestaande uit hawerhooi koringstrooi en lsquon kragvoermengsel Ruvoere is alleen enof in kombinasie met
melasse (01412 g DM) sitruspulp (01425 g DM) of mieliemeel (0125 g DM) in glasbottels afgeweeg en vir
72 uur geiumlnkubeer Die massas van die energiebronne is op lsquon energie-ekwivalente basis bereken Leeuml
bottels wat geen substraat bevat het nie is ingesluit om te korrigeer vir gasproduksie afkomstig vanaf
rumenvloeistof alleen Substrate is in 40 ml van lsquon buffermedium 2 ml reduserende oplossing en 10ml
rumenvloeistof geiumlnkubeer Gasdruk is elke vyf minute outomaties aangeteken deur gebruik te maak van lsquon
drukmetersisteem en die metode is gebasseer op die Reading gasdruktegniek Gasdruk is omgeskakel na
vii
gasvolume deur gebruik te maak van lsquon voorafbepaalde regressievergelyking In die eerste proef het totale
gasproduksie die gas wat deur die onderskeie energiebronne geproduseer is ingesluit In die tweede proef
is gasproduksie afkomstig van die energiebronne afgetrek van totale gasproduksie om sodoende die invloed
van die energiebronne per se op die gasproduksie van die onderskeie ruvoersubstrate te bepaal Data is
met behulp van twee nie-linieumlre modelle gepas Betekenisvolle ruvoer x energie-interaksies is in albei
proewe waargeneem vir die nie-linieumlre parameter b (gasproduksie) in Model 1 en vir b en L (sloerfase) in
Model 2 In die eerste proef het die energiebronne se hoeuml fermentasie gelei to lsquon verhoging in b (Model 1 amp
2) van LUC en WS Energie-aanvullings het die c-waarde van die onderskeie ruvoere verskillend beiumlnvloed
met WS wat die mees opvallende effek gehad het Al die energiebronne het die c-waarde van WS verhoog
ongeag watter model gebruik is Energiebronne het geen invloed op die L-waarde van LUC OH of RYE
gehad nie maar het wel die L-waarde van WS en KIK verlaag In die tweede proef het mieliemeel geen
invloed op die b-waarde van enige van die ruvoere gehad nie (Model 1 amp 2) terwyl melasse (Model 1 amp 2)
die b-waarde van alle ruvoere verlaag het en sitruspulp (Model 1 amp 2) OH en RYE se b waardes verlaag het
tot laer as die kontroles Melasse het geen invloed op die c-waarde van die onderskeie ruvoersubstrate
gehad nie terwyl sitruspulp (Model 1 amp 2) die c-waarde van OH en mieliemeel die c-waarde van OH en KIK
verhoog het Energiebronne het slegs lsquon invloed op die sloerfase in WS en KIK gehad waar dit L verlaag
het tot laer waardes as dieacute van die kontroles Daar is gevind dat ruvoer-fermenteerbaarheid verskillend
beiumlnvloed word deur verskillende energiebronne Bogenoemde resultate kan in die praktyk betekenisvolle
invloede hecirc op rumengesondheid en melkproduksie en die data wat verkry is kan potensieeumll gebruik word
as riglyne in voerformulerings
In die tweede studie is in vitro verteerbaarheidsproewe gedoen om die effek van suiker (molasse en
sukrose) stysel (mieliemeel en mieliestysel) en pektien (sitruspulp en sitrus-pektien) op neutraal-
onoplosbare vesel (NDF) en droeuml materiaal (DM) degradeerbaarheid van ruvoere te bepaal
Ruvoersubstrate wat gebruik is was WS OH LUC RYE en KIK Rumen vloeistof is verkry van twee
lakterende Holstein koeie wat lsquon dieet ontvang het bestaande uit hawerhooi koringstrooi en lsquon konsentraat
mengsel Die in vitro degradeerbaarheidsproef is gedoen met lsquon ANKOM Daisy II inkubator
Ruvoersubstrate is geiumlnkubeer met of sonder die onderskeie energiebronne vir 24 48 en 72 uur Die
substrate is geiumlnkubeer in 1076 ml buffer medium 54 ml reduserende oplossing en 270 ml rumen vloeistof
Residue is gewas gedroog en geanaliseer vir NDF In die proef met toegepaste energiebronne (molasse
mieliemeel en sitruspulp) was daar ruvoer x energiebron interaksies Toegepaste energiebron aanvullings
het almal DMD van ruvoersubstrate (24 en 72 uur) verbeter uitsluitend vir RYE wat aangevul is met
mieliemeel (24 uur) en sitruspulp (24 uur) Van al die ruvoersubstrate het molasse die grootste effek gehad
op DMD Mieliemeel aanvullings het geen effek gehad op neutraal-onoplosbare vesel degradeerbaarheid
(NDFD) van ruvoersubstrate nie behalwe vir lsquon verbetering in NDFD van LUC by 72 uur Molasse het NDFD
van lucern by 24 uur verbeter maar geen effek gehad op ander ruvoersubstrate nie Sitruspulp het NDFD
van OH (72 uur) asook LUC en WS (24 amp 72 uur) verbeter Daar word beweer dat die NDF van
energiebronne meer verteerbaar is as die van ruvoersubstrate en dat die verbetering in NDFD waardes
toegeskryf kan word aan die bydraes van energiebronne se NDFD Weidingsgrasse (RYE amp KIK) het oor die
algemeen lsquon hoeumlr NDFD as hooie en strooi gehad Rumen mikrobes blyk ook om dieacute grasse vinniger te
verteer as lae kwaliteit hooie en strooi wat gevolglik die hoeumlr NDFD verduidelik In die proef met suiwer
energiebronne (sukrose mieliestysel en sitrus-pektien) is ruvoer x energiebron interaksies waargeneem
viii
Energiebronaanvullings het DMD by 24 en 72 uur verbeter buiten vir RYE en KIK (72 uur) Weidingsgrasse
het hoeumlr NDFD as LUC OH en WS By 72 uur was die NDFD van LUC 371 OH 425 WS 403 in
vergelyking met 705 vir KIK en 649 vir RYE lsquon Moontlike verklaring vir die hoeumlr NDFD van KIK en
RYE is omdat dit vars gesnyde material is geoes na slegs 28 dae hergroei Oor die algemeen het sukrose
(24 amp 72 uur) en sitrus-pektien (72 uur) geen effek gehad op NDFD van ruvoersubstrate nie terwyl stysel en
pektien aanvullings tot OH (24 uur) en stysel aanvullings tot WS (24 amp 72 uur) NDFD verlaag het Daar
word hipotetieseer dat mikrobes eers die vinnig fermenteerbare energiebronne fermenteer voordat hulle
ruvoer NDF aanval Hierdie studie beweer dat ruvoer NDFD waardes nie vas is nie en dat dieacute waardes
beiumlnvloed mag word deur energiebron aanvullings
ix
Acknowledgements
I wish to thank the following people and organizations
Prof CW Cruywagen for his support and guidance
Dr Nherera for her help and support
The Hennie Steenberg Trust Fund for funding for the study
The Western Cape Department of Agriculture (Elsenburg) who made cannulated Holstein cows
available for the collection of rumen fluid
Academic and technical staff at the Department of Animal Sciences Stellenbosch University for
providing support where necessary and an ideal working environment
Fellow students who provided me with help and support throughout
My parents for their motivation and support
Al my friends for their motivation support and help
x
Table of Contents
Abstract
ii
Uittreksel
v
Acknowledgements
viii
List of Figures
xii
List of Tables
ix
List of Abbreviations
xiv
CHAPTER 1 INTRODUCTION 1
11 References 2
CHAPTER 2 LITERATURE REVIEW 4
21 Introduction 4
22 Non-fibre carbohydrates and non-structural carbohydrates 5
23 Rumen microbiology 5
24 Physical effective fibre and particle size 6
25 Forage classification 7
251 Factors influencing forage nutritive value 7
2511 Age and maturity 8
2512 Soil fertility and environment 8
26 Fibre 9
27 Van Soest forage fraction analysis 9
28 In vitro techniques for evaluating feed resources 10
29 Carbohydrates 10
291 Non-fibre carbohydrates non-structural carbohydrates 11
2911 Sugar 12
2912 Starch 12
2913 Pectin 13
2914 Sugar vs Starch 14
210 Non-fibre carbohydrate digestibility 14
xi
211 Non-fibre carbohydrate fermentation and organic acid production 15
212 Ruminal acidosis 16
213 Conclusion 17
214 References 18
CHAPTER 3 THE EFFECT OF SUGAR STARCH OR PECTIN ON RATE AND EXTENT OF GAS
PRODUCTION IN DIFFERENT FORAGES 23
Abstract 23
31 Introduction 23
32 Materials and methods 24
321 Study area 24
322 Simulated diets 24
3221 Basal forages 24
3222 Energy supplements 25
3223 Defining the diets 25
323 Chemical analyses of forages and energy sources 25
324 Preparation of samples for gas production 26
325 Preparation of the in vitro medium and reducing solution 28
326 Collection and preparation of rumen fluid 28
327 In vitro incubation 28
328 Converting gas pressure to gas volume 29
329 Estimating kinetic coefficients 29
33 Statistical analysis 30
34 Results and discussion 30
341 Gas production including that from the energy sources 30
342 Gas production parameters including that of forage and energy sources in cases where no
interaction was observed 37
343 Gas production excluding that from energy sources 39
344 Gas production parameters excluding that of energy sources in cases where no interaction was
observed 45
35 Conclusion 47
36 References 48
CHAPTER 4 THE EFFECT OF SUGAR STARCH AND PECTIN AS MICROBIAL ENERGY
SOURCES ON IN VITRO NEUTRAL DETERGENT FIBRE AND DRY MATTER DEGRADABILITY OF
FORAGES
51
Abstract 51
xii
41 Introduction 52
42 Materials and methods 52
421 Study area 52
422 Simulated diets 52
4221 Basal forages 52
4222 Energy supplements 53
4223 Defining the diets 54
423 Chemical analyses of forages and energy sources 54
424 Sample preparation 55
425 Preparation of in vitro medium and reducing solution 58
426 Collection and preparation of rumen fluid 58
427 In vitro incubation 58
428 Residue analysis 59
429 Estimating dry matter degradability 59
4210 Estimating neutral detergent fibre degradability 59
43 Statistical analyses 60
44 Results and discussion 60
441 Effect of maize meal citrus pulp and molasses on apparent in vitro dry matter
degradability 60
442 Effect of maize meal citrus pulp and molasses on apparent in vitro neutral
detergent fibre degradability 62
443 Effect of maize starch citrus pectin and sucrose on apparent in vitro dry matter
degradability 64
444 Effect of maize starch citrus pectin and sucrose on apparent in vitro neutral
detergent fibre degradability 65
45 Conclusion 67
46 References 67
CHAPTER 5 GENERAL CONCLUSION 71
xiii
List of Tables
Table 21 Feed types that fall within the definition of forage (adapted from
Wilkens 2000)
7
Table 22 Energy (MJkg DM) and protein (gkg DM) content of different
classes of forages (Wilkens 2000)
8
Table 23 Forage fraction classification using the method of Van Soest (Van
Soest amp Wine 1967)
9
Table 24 The effect of sugar on dairy cattle performance 14
Table 25
Non-fibre carbohydrate levels for various ration types (Ishler amp
Varga 2001)
15
Table 26 Comparison of acute and sub-acute acidosis (Henning 2004) 6
Table 31 Forages used in simulation diets for lactating dairy cows 25
Table 32 Energy sources used in simulating lactating dairy cow diets 25
Table 33 Chemical composition (gkg DM plusmn SD) of forages and energy
sources used in the trial All values are on a DM basis
27
Table 34 Substrate samples containing either forage or energy
supplements
27
Table 35 Composite dietary samples containing forage and energy sources 28
Table 36 Effects of maize meal citrus pulp and molasses as energy
sources on fermentation kinetics of different forage substrates as
measured by in vitro gas production Gas production of both
energy sources and forage substrates are included
32
Table 37 In vitro gas production parameters of forages as affected by
energy sources as main effects in cases where no interactions
were observed Gas production of both energy sources and
forage substrates are included
38
Table 38 In vitro gas production parameters of forages (irrespective of
forage substrate used) as affected by different energy sources as
main effects in cases where no interactions were observed Gas
production of both energy sources and forage substrates are
included
38
Deleted 8
Deleted 9
Deleted 11
Deleted 6
Deleted 7
Deleted 1
Deleted 8
Deleted 7
Deleted 7
Deleted para
Deleted 9
Deleted 30
Deleted 30
Deleted para35
Deleted 41
Deleted 41
xiv
Table 39 Effects of maize meal citrus pulp and molasses as energy
sources on fermentation kinetics of different forage substrates as
measured by in vitro gas production Gas production resulting
from energy sources was deducted from total gas production
40
Table 310 In vitro gas production parameters of forages as affected by
energy sources as main effects in cases where no interactions
were observed Gas production resulting from energy sources
was deducted from total gas production
45
Table 311 In vitro gas production parameters of forages (irrespective of
forage substrate used) as affected by different energy sources as
main effects in cases where no interactions were observed Gas
production resulting from energy sources was deducted from total
gas production
52
Table 41 Forages used in simulation diets for lactating dairy cows 53
Table 42 Applied energy sources used in simulating the dairy cow diets 54
Table 43 Purified energy sources used in simulating the dairy cow diets 54
Table 44 Chemical composition (gkg DM plusmn SD) of forages and energy
sources used in the trial All values are on a DM basis
55
Table 45 Substrate samples containing either forage or applied energy
supplements
55
Table 46 Composite diets containing forage and applied energy sources 56
Table 47
Diets containing forages alone or a mixture of forages and purified
energy sources Amounts are on an air dry basis
56
Table 48 Effects of maize meal citrus pulp and molasses as energy
sources on in vitro dry matter degradability (DMD) parameters of
different forage substrates
60
Table 49 Effects of maize meal citrus pulp and molasses as energy
sources on in vitro neutral detergent fibre degradability (NDFD)
parameters when incubated in combination with different forage
substrates
63
Table 410 Effects of maize starch citrus pectin and sucrose as energy
sources on in vitro dry matter degradability (DMD) parameters of
different forage substrates
64
Deleted 43
Deleted parapara 48
Deleted 49
Deleted 57
Deleted 57
Deleted
Deleted 58
Deleted para59
Deleted 60
Deleted para60
Deleted 61
Deleted 65
Deleted 67
Deleted 9
xv
Table 411 Effects of maize starch citrus pectin and sucrose as energy
sources on in vitro neutral detergent fibre degradability (NDFD)
parameters of different forage substrates
65
Deleted 70
xvi
List of Figures
Figure 21 Structural and non-structural carbohydrates of plants where ADF
= acid detergent fibre szlig-glucans = (1 rarr 3) (1 rarr 4)-szlig-D-glucans
NDF = neutral detergent fibre NDSF = neutral detergent-soluble
fibre (includes all non-starch polysaccharides not present in
NDF) NSC = non-NDF carbohydrates (Ishler amp Varga 2001)
11
Figure 22 Ruminal pH results for citrus and hominy rations where CPD =
citrus pulp diet and HD = hominy diet (Leiva et al 2000)
14
Figure 31 Gas production of forage substrates alone 34
Figure 32 Gas production of lucerne hay when supplemented with different
energy sources
35
Figure 33 Gas production of oat hay when supplemented with different
energy sources
36
Figure 34 Gas production of wheat straw when supplemented with different
energy sources
36
Figure 35 Gas production of ryegrass when supplemented with different
energy sources
37
Figure 36 Gas production of kikuyu grass when supplemented with
different energy sources
37
Figure 37 Gas production of forage substrates after gas production of
energy sources has been deducted
42
Figure 38 The net effect of energy supplements on gas production of
lucerne hay
42
Figure 39 The net effect of energy supplements on gas production of oat
hay
43
Figure 310 The net effect of energy supplements on gas production of
wheat straw
44
Figure 311 The net effect of energy supplements on gas production of
ryegrass
44
Figure 312 The net effect of energy supplements on gas production of
kikuyu grass
45
Deleted para
Deleted 2
Deleted para15
Deleted 6
Deleted 7
Deleted 8
Deleted 9
Deleted 9
Deleted 40
Deleted 4
Deleted 5
Deleted 6
Deleted 6
Deleted 7
Deleted 7
xvii
List of Abbreviations
ADF Acid detergent fibre
ADL Acid detergent lignin
b Gas production
c Gas production rate
C3H7NO2HCL Cysteine hydrochloride
cp Citrus pulp
CP Crude protein
DM Dry matter
DMI Dry matter intake
EE Ether extract
KIK Kikuyu grass
KOH Potassium hydroxide
L Lag phase
LUC lucerne hay
mm Maize meal
mol Molasses
MP Microbial protein
Na2S9H2O Sodium sulfide nonahydrate
ND Neutral detergent
NDF Neutral detergent fibre
NDSF Neutral detergent-soluble fibre
NFC Non-fibre carbohydrates
NH3N Ammonia nitrogen
NPN Non-protein nitrogen
NSC Non-structural carbohydrates
OH Oat hay
OM Organic matter
pef Physical effectiveness factor
peNDF Physical effective neutral detergent fibre
RDP Rumen degradable protein
RPT Reading pressure technique
RYE Ryegrass
VFA Volatile fatty acids
WS Wheat straw
1
Chapter 1
INTRODUCTION
The compound stomach system of ruminants is adapted to roughage based diets mainly grass (Cherney
1998) Diets of grass and other fibrous feeds however do not meet the energy requirements of high
producing dairy cows (Schwarz et al 1995) Fibre is low in energy and a large consumption thereof results
in rumen fill thus limiting feed intake (Allen amp Oba 2000) Concentrate feeds such as non-fibre
carbohydrates (NFC) provide lactating dairy cows with energy needed to improve performance and
efficiency of production (Henning 2004) Balanced rations consisting of forages and concentrate feeds
ensure optimal production and rumen health For dairy cattle forages should comprise at least 40 of the
diet and NFC should constitute between 35 and 42 of the diet (NRC 2001) Non-fibre carbohydrates such
as sugars starch and pectin are critical in meeting energy requirements for growth and production (Roche amp
Dalley 1996)
The symbiotic relationship between rumen micro-organisms and the host animal is an essential component
in nutrient supply (Van Saun 1998) Ruminant rations should provide the rumen micro-organisms with
sufficient nutrients and an optimal environment for growth (Ishler et al 1996) According to the NRC (2001)
the most important nutrients for optimal microbial growth are protein and carbohydrates Microbial
fermentation and digestion of carbohydrates and protein provide ruminants with volatile fatty acids (VFA) and
microbial protein (MP) The animal uses the VFA as energy and the MP for protein synthesis (Van Saun
1998)
Energy shortages affect lactating cows especially during the first three weeks after calving (Hutjens 1998)
During this time dry matter intake (DMI) is low and milk production is high resulting in a negative energy
balance When formulating diets for lactating dairy cows it is important to consider the total NFC fraction
which primarily comprise of sugars starch and pectins (Larson 2003) The NFC ferment rapidly in the
rumen to VFA (Holtshausen 2004) Batajoo amp Shaver (1994) reported that cows receiving diets with more
than 30 NFC produced more than 40 kg of milkday However they found no milk yield benefits by
increasing the NFC beyond 36 Molasses is a common energy supplement used in dairy rations
(Holtshausen 2004) In addition to this molasses also reduce dustiness and increase palatibility and
moisture content of diets (De Ondarza 2000) Other energy supplements include soybean hulls sugar beet
pulp and citrus pulp Leiva et al (2000) showed that substituting diets that contain 205 citrus pulp (pectin)
for diets containing 195 maize meal (starch) increased milk yield Solomon et al (2000) however
reported that substituting starch-rich diets with pectinndashrich diets had no effect on milk yield
Energy sources such as sugar starch and pectin are frequently used as supplements to forage in ruminant
diets in order to meet the energy requirements for growth and production However there is a lack of
information on the magnitude of the relationship between different carbohydrate sources and rumen neutral
detergent fibre fermentation kinetics
2
The objectives of this study were to determine the impact of three energy sources viz maize meal
molasses and citrus pulp on total gas production rate of gas production dry matter (DM) degradability and
NDF degradability of different forage substrates Forages commonly used in dairy cow diets were chosen as
fermentation substrates These were wheat straw (Triticum aestivum) oat hay (Avena sativa) lucerne hay
(Medicago sativa) kikuyu (Pennisetum clandestinum) and ryegrass (Lolium multiflorum)
11 References
Allen M amp Oba M 2000 Getting more milk from forages Michigan Dairy Review 5(4) Department of
Animal Science Michigan State University
Available at
httpwwwadmanicomalliancedairyTechBulletinsNon20Structural20Carbohydrate20Nutrition
htm
(Accessed 5 August 2008)
Batajoo KK amp Shaver RD 1994 Impact of nonfiber carbohydrate on intake digestion and milk
production by dairy cows J Dairy Sci 77 1580 - 1588
Cherney DJR 1998 Forages for dairy cattle Economical alternatives to alfalfa grass and corn In
Proceedings of the 1998 Tri-State Dairy Nutrition Conference April 21 - 22 Fort Wayne Indiana
USA pp 35 - 50
De Ondarza MB 2000 Non-fibre carbohydrates
Available at httpwwwmilkproductioncomLibraryArticlesNon_Fibre_Carbohydrateshtm
(Accessed 5 August 2008)
Henning P 2004 Acidosis in high producing ruminants - myth or menace Animal Feed Manufacturers
Association (AFMA) South Africa pp 1 - 9
Available at httpwwwengormixcome_articles_viewaspart=529ampAREA=GDC
(Accessed 5 Augustus 2008)
Holtshausen L 2004 Effect of nonfibre carbohydrates on product yield and fibre digestion in fermentations
with mixed ruminal microbes PhD thesis University of Florida Gainesville Florida USA pp 1 - 33
Hutjens MF 1998 Practical approaches to feeding the high producing cow Illini DairyNet University of
Illinois Extension
Available at httpwwwlivestocktrailuiucedudairynetpaperDisplaycfmContentID=247
(Accessed 5 Augustus 2008)
Ishler V Heinrichs J amp Varga G 1996 From feed to milk Understanding rumen function Pennsylvania
State University Extension Circular 422
3
Available at httpanimsciagrenvmcgillcacourses450extrafeed_to_milkconceptshtml
(Accessed 25 August 2008)
Larson CC 2003 The effect of nonfiber carbohydrate source and protein degradability on lactation
performance of holstein cows MSc (Agric) thesis University of Florida Gainesville Florida USA pp
1 - 4
Leiva E Hall MB amp Van Horn HH 2000 Performance of dairy cattle fed citrus pulp or corn products as
sources of neutral detergent-soluble carbohydrates J Dairy Sci 83 2866 - 2875
National Research Council (NRC) 2001 Nutrient requirements of dairy cattle (7th Rev Ed) National
Academy Press Washington DC USA pp 34 - 35
Roche J amp Dalley D 1996 Nutrition and milk composition Agriculture Notes State of Victoria Department
of Primary Industries pp 1 - 3
Available at
httpwwwdpivicgovaudpinreninfnsf9e58661e880ba9e44a256c640023eb2e036a3ac34d507323c
a257181001f0359$FILEAG0534pdf
(Accessed 1 October 2008)
Schwarz FJ Haffner J amp Krichgessner M 1995 Supplementation of zero-grazed dairy cows with
molassed sugar beet pulp maize or cereal-rich concentrate Anim Feed Sci Technol 54 237 - 248
Solomon R Chase LE Ben-Ghedalia D amp Bauman DE 2000 The effect of nonstructural carbohydrate
and addition of full fat soybeans on the concentration of conjugated linoleic acid in milk fat of dairy
cows J Dairy Sci 83 1322 - 1329
Van Saun RJ 1998 Beef cattle nutrition Feeding for two (How to properly feed the cow and her rumen)
In Cow-calf management guide-cattle producers library (2nd Ed) Cooperative Extension Service
Publications Agricultural Publications University of Idaho Moscow Idaho USA pp 172 - 180
4
Chapter 2
LITERATURE REVIEW
21 Introduction
With the increase in the cost of feed medicine labour fuel and other production essentials it is vital for any
agricultural enterprise specifically the traditional lsquofarmrsquo to be operated like a business With the profit-
making goal in mind the single most important facet of a modern dairy-operation is its feeding program An
efficient and successful feeding program will not only maximize the animalrsquos production but will also cut
costs in other areas of the operation by increasing animal health productive life-expectancy and reducing
labour costs A feeding program that achieve these goals will ultimately make the agricultural enterprise
more economically competitive
Dairy cattle require specific amounts of nutrients to support various levels of performance Feeding high
levels of concentrates (especially non-fibrous carbohydrates) to high producing dairy cows is common in all
intensive production systems around the world The problem with high levels of concentrates in dairy cow
diets is the risk of these diets causing digestive disturbances The aim of diet formulation and thus nutritional
management for intensive production systems must be to maximize productivity and overall efficiency
without enhancing digestive disturbances such as acidosis (Henning 2004) A successful feeding program
will meet the cowrsquos nutritive needs for high production minimize weight loss (during early lactation) prevent
digestive upsets and maintain ruminal and animal health
In order to achieve full genetic potential for high milk production it is of the utmost importance to keep the
rumens of dairy cows in a healthy state The rumen is home to a wide diversity of micro-organisms
(including bacteria protozoa and fungi) collectively utilizing the extensive variety of feeds which make up
dairy cow diets (Kamra 2005) Forages are the main component of dairy cow diets Forages alone
however do not meet the energy requirements of high producing dairy cows (Schwarz et al 1995)
Supplementing dairy cow diets with concentrate feeds provide high milk producing cows with energy needed
to improve efficiency of production and performance (Henning 2004) Carbohydrates are the largest nutrient
component of dairy diets and the most important source of energy for rumen micro-organisms
Carbohydrates important for growth reproduction milk production and rumen health make up roughly 70
of dry matter (DM) in dairy diets making it the lsquoheartrsquo of dairy diets (Mertens 1997) Carbohydrates (fibre
starch and sugar) are degraded in the rumen to simple sugars and then fermented into volatile fatty acids
(VFA) by rumen bacteria supplying up to 80 of the animalrsquos energy requirements
5
22 Non-fibre carbohydrates and non-structural carbohydrates
The three main components of the carbohydrate fraction of feeds referred to as non-fibre carbohydrates
(NFC) are starch NDSF (neutral detergent-soluble fibre) and sugars The NFC fraction of feedstuffs is
estimated from the following calculation as proposed by Holtshausen (2004)
100 - crude protein - ether extract - ash - neutral detergent fibre + neutral detergent insoluble crude
protein
The fraction derived by the above calculation has at times been used interchangeably for the terms NFC and
non-structural carbohydrates (NSC) Non-structural carbohydrates however refer to plant cell contents and
include mono- and oligosaccharides organic acids (which are not carbohydrates) starch and fructans Non-
fibre carbohydrates include all of the above substances as well as soluble fibre (pectic substances szlig-
glucans and galactans) Thus NFC includes non-structural and structural carbohydrates as well as non-
fibrous and fibrous carbohydrates (Holtshausen 2004)
In the interest of clarity I will not use the terms NSC and NFC interchangeably I will use NFC exclusively
as its meaning is more complete in the context of this thesis
23 Rumen microbiology
All living organisms require some essential nutrients to sustain metabolic processes and to maintain a
healthy state These essential nutrients include water protein minerals vitamins and essential energy The
difference between the cow itself and the micro-organisms living within its rumen is defined by the source of
their respective nutrients (Van Saun 1993)
Feeding dairy cattle nutritional balanced diets ensures healthy rumens that maximize microbial production
and growth Ruminal pH is the main variable influencing the microbial population and thus the overall VFA
production (major energy source to animal) Diets containing too much NFC may cause the ruminal pH to
decrease below 6 This low rumen pH leads to a reduction in cellulolytic organisms and an increase in
propionate producing micro-organisms in turn leading to a low acetate-propionate ratio This in turn results
in low milk fat percentages (Ishler et al 1996)
Maintaining a healthy rumen microbial population is an essential function of any feeding program Carbon
skeletons and energy are used by rumen micro-organisms for protein synthesis Ruminant systems are
sometimes based on digestible organic or fermentable matter even though rumen micro-organisms are able
to grow and develop on only secondary carbohydrate products Rumen bacteria have specific maintenance
requirements for growth and development Both bacterial growth rate and fractional degradation rate of
carbohydrates determine bacterial yield (Nocek amp Tamminga 1991)
6
24 Physical effective fibre and particle size
Preventing ruminal acidosis requires chemical and physical considerations of the diet as well as a well-
organized feed and herd management system (Hall 2002) The physical form of the diet affects the nutritive
value of the feed as well as the chewing activity dry matter intake rumen function and milk production of the
animal
Particle size plays a critical role in the extent to which rumen micro-organisms can carry out their digestive
functions Grinding or chopping forages does not change the forage composition it only reduces the particle
size Reduced particle size increases dry matter intake and the rumen turnover rate resulting in a reduced
time period within which rumen micro-organisms can digest fibre Reduced particle size also reduces the
time spent on rumination thus leading to less mucus production and a subsequent decrease in rumen pH
Low rumen pH leads to an increase in propionic acid production and tend to change milk components by
lowering milk fat percentages and increasing milk protein percentages Chopping and grinding of
concentrates increase the starch exposure to rumen microbial digestion resulting in increased degradation
Processing methods such as pelleting steam rolling or grinding of concentrates alter the structure of starch
by increasing its availability for fermentation in the rumen This increase in starch availability can be either
favorable by boosting rumen microbial growth or harmful by enhancing the risk of rumen acidosis (Van der
Merwe amp Smith 1991)
As with particle length fibre content of the diet plays an important role in maintaining rumen functions Fibre
ensures sufficient amounts of carbohydrates to slow down the rate of digestion and prevent rumen acidity
Neutral detergent fibre (NDF) and acid detergent fibre (ADF) are the most important fibre fractions in ration
formulation Effective fibre is needed in dairy diets to form a ruminal mat and slow down carbohydrate
availability thereby preventing rumen acidosis (Ishler et al 1996) Balancing the dairy ration for NDF and
non-fibre carbohydrates (NFC) fractions is very important in controlling the rumen pH Buffers are also
commonly used for controlling pH
Physical effective fibre (peNDF) relates the physical properties of a feed (by measuring particle size and
chewing activity) to rumen pH The peNDF of a feed is the product of the feedrsquos physical effectiveness factor
(pef) and the feedrsquos NDF By definition pef varies between 0 (if NDF if is not successful in stimulating
chewing activity) and 1 (if NDF is successful in encouraging chewing activity) (Mertens 1997)
It is very important to always balance the peNDF of the dairy cow diet with dietary fermentability Physical
effective fibre is that fraction of fibre that promotes the chewing activity Thus when feeding lactating cows
it is very important to add adequate amounts of peNDF Optimal inclusion of peNDF will ensure that the cow
chews her cud well enough and in the process secrete enough saliva that helps to control rumen pH
Ruminal pH is primarily determined by the balance between the quantity of fermentation acid produced and
the buffer secretion during chewing (Allen 1997)
7
25 Forage classification
Good forage sources are the foundation of efficient dairy production (Morrison 1959) A large variety of
feeds can be defined as forages (Baloyi 2008) as listed in Table 21 By definition forages are the edible
fractions of plants other than grain that can be harvested for feeding or used as feed for grazing animals
(Forage amp Grazing Terminology Committee 1991) The definition also states that feedstuff must contain
35 or more NDF to be classified as forage (Zinn amp Ware 2007)
It is of utmost importance to remember that a high producing dairy cowrsquos digestible nutrient and net energy
requirements cannot be met by forage alone Generally dairy cows are fed good quality forages and then
supplemented with additional grains or other concentrates in order to meet their requirements
Table 21 Feed types that fall within the definition of forage (adapted from Wilkens 2000)
Forage Feed types
Herbage Leaves roots of non-woody species stems sown and
permanent grasslands crops that may be cut or grazed
Hay Grasses and legumes that have been cut dried and
stored for use as animal feed
Silage
Browse
Fermented high moisture fodder
Leaves bud and twigs of woody species
Straw Dry stalk of cereal plant after the grain or seed has been
removed
251 Factors influencing forage nutritive value
Chemical composition digestibility and the physical characteristics of the digested feed determines the
nutritive value of forage (Goosen 2004) Forages between and within species differ significantly in
composition and nutritive value as indicated in Table 22
8
Table 22 Energy (MJkg DM) and protein (gkg DM) content of different classes of forages (Wilkens 2000)
Forage class Metabolizable energy
MJkg DM
Crude protein
gkg DM
Temperate grasses hays and silages
70-130 60-250
Tropical grasses
50-110 20-200
Maize silage
100-120 60-120
Cereal straw
50-80 20-40
Root crops
110-140 40-130
Kale and rape 90-120 140-220
Age and maturity soil fertility and environmental conditions are the primary factors influencing the nutritive
value of forages Herbage maturity has the largest influence on forage nutritive value (Buxton amp Mertens
1995) Mature forages have higher lignin and cell wall contents that limit fibre utilization due to the rate and
degree of plant cell hydrolysis (Van Soest 1994)
2511 Age and maturity
Young plants are tender with less structural carbohydrates (hemicellulose and cellulose) and lignin compared
to mature plants (McDonald et al 2002) Lignin is indigestible explaining the higher digestibility in younger
plants As plants mature the stems and leaves become lignified decreasing the nutritive value of the plant
due to the lower digestibility of nutrients enclosed in the cell walls (Morrison 1959) Leaves have lower cell
wall content than stems As the plant matures there is an increase in the proportion of stems compared to
leaves thus contributing to the lower digestibility of mature plants (Van Soest 1994)
2512 Soil fertility and environment
Environmental factors that affect forage quality the most are temperature light water and soil fertility (Van
Soest 1994) The mineral content in soil influences not only the crop yield but also its composition
Fertilizers can have a great influence on the nutrient content of soils Fertilized pastures grow better are
more palatable and have higher protein vitamin and mineral contents than unfertilized pastures (Morrison
1959)
9
26 Fibre
Fibre is composed of an indigestible fraction and several potentially digestible fractions that occupy space in
the gastrointestinal tract of ruminants (Mertens 1997) The primary components of fibre are cellulose
hemicellulose and lignin In the rumen feed is digested through microbial fermentation and the physical
breakdown of feed through rumination (Ishler amp Varga 2001) The type of diet fed influences and change
bacteria population in the rumen in order to successfully digest the food used by the cows The level to
which fibre will digest depends on the particle size rumen pH and fibre level in the diet
27 Van Soest forage fraction analysis
Fibre lignin and protein are the three most important chemical fractions determining nutrient supply and
performance (Mould 2003) According to Van Soest (1994) chemical analysis measures digestibility and
intake using the statistical relationship between feed quality and the analyzed feed components The
proximate analysis divided feedstuff into six fractions namely moisture crude protein ash ether extract
nitrogen-free extract and crude fibre (Fisher et al 1995) Van Soest (1994) claimed that the proximate
analysis had one serious error namely that the proximate analysis divided carbohydrates into crude fibre
and nitrogen-free extract Van Soest then developed an analysis specifically for fibre-rich feeds that
replaced the proximate analysis The method of Van Soest predicts intake and the nutritive value of
feedstuffs by determining the fibre fractions according to the degradability of fractions insoluble in neutral
detergent and fractions insoluble in acid detergent (Goosen 2004) Acid detergent fibre determines the
cellulose and lignin content and NDF the cellulose hemicellulose and lignin The difference between NDF
and ADF gives the hemicellulose content (Knudsen 2001) Table 23 gives an outlay of the components
soluble and insoluble in NDF
Table 23 Forage fraction classification using the method of Van Soest (Van Soest amp Wine 1967)
Fraction Components
Cell contents (soluble in neutral detergent) Lipids
Sugar organic acids
Water-soluble matter
Pectin starch
Non-protein nitrogen
Soluble protein
10
Table 23(continue) Forage fraction classification using the method of Van Soest (Van Soest amp Wine 1967)
Cell wall contents (insoluble in neutral detergent)
1 Soluble in acid detergent Fibre-bound protein
Hemicellulose
2 ADF Cellulose
Lignin
Lignified N
Silica
28 In vitro techniques for evaluating feed resources
In vitro methods used to evaluate feed resources are less time-consuming and less expensive than in vivo
methods The in vitro gas production procedure measures the amount of gas produced or collected
recording it manually (Theodorou et al 1994) or automatically (Pell amp Schofield 1993 Davies et al 2000)
This procedure thus generates kinetic data rather than digested feed disappearance (Baloyi 2008) Gas
production gives a description of the microbial activity and how micro-organisms respond to a specific
substrate thereby giving a practical imitation of what happens in the rumen Pell et al (1998) used in vitro
gas production to measure the rate and extent of fermentation VFA production and microbial protein (MP)
production The biggest advantage of the gas production technique is that there is no need to terminate the
gas production in order to measure the extent of digestion The disadvantage of this technique however is
the lack of uniformity in methodology and factors such as pH and temperature that may affect a feedrsquos gas
production (Getachew et al 1997) The traditional two-stage method (Tilley amp Terry 1963) involved an in
vitro fermentation of forages in rumen fluid followed by pepsin digestion The disadvantage of this
technique however is that it is an end-point measurement thus giving no indication on forage digestion
kinetics (Theodorou et al 1994) Goering amp Van Soest (1970) modified the procedure to accurately
estimate the true DM digestibility by treating the residue with a ND solution (Baloyi 2008) The method of
Goering and Van Soest however are also an end-point measurement thus giving no indication on forage
digestion kinetics (Theodorou et al 1994) ANKOM technology developed a technique that simplifies in vitro
digestibility evaluations using an insulated incubator (Daisy II incubator) (Baloyi 2008) The ANKOM
technique predict potential and true digestibility in vitro accurately faster and with less labour
29 Carbohydrates
Carbohydrates can be classified into two groups (structural carbohydrates and non-fibrous carbohydrates)
based on their function in plants (see Figure 21) Structural carbohydrates which are located in the plantrsquos
cell walls are very fibrous and are digested slowly Non-fibrous carbohydrates are located in the plantrsquos
11
leaves and seeds Non-fibrous carbohydrates are easily digested and include starches sugars fructans and
organic acids (Ishler amp Varga 2001)
Acid detergent fibre and NDF are the most universal way of analyzing fibre It is important to note that
although pectins are part of the cell wall they are grouped as non-structural carbohydrates The reason for
this is because pectin other than hemicellulose is entirely fermentable by rumen micro-organisms (Van der
Merwe amp Smith 1991)
Figure 21 Structural and non-structural carbohydrates of plants where ADF = acid detergent fibre szlig-
glucans = (1 rarr 3) (1 rarr 4)-szlig-D-glucans NDF = neutral detergent fibre NDSF = neutral detergent-soluble
fibre (includes all non-starch polysaccharides not present in NDF) NSC = non-NDF carbohydrates (Ishler amp
Varga 2001)
291 Non-fibre carbohydrates non-structural carbohydrates
Non-fibre carbohydrates are the major source of energy for high producing dairy cattle all around the world
Non-fibre carbohydrates are very palatable and easily digested but fermentation varies with type of feed and
means of processing Increasing NFC in the diet fulfils the high energy demands of a lactating dairy cow but
at the expense of NDF (NRC 2001)
The non-structural component of plants can be identified by two different methods chemical analysis (which
uses enzymes to determine the level of starch and sugar in the feed) or difference calculations (which use
NDF crude protein fat and ash to estimate NFC) (Stokes 1997) Russell et al (1992) reported that greater
amounts of NFC in dairy cow diets increase the production of MP Thus NFC in diets for lactating cows has
the potential to increase MP synthesis as well as the efficiency of ruminal undegradable protein utilization
(Casper et al 1990) It must however be emphasized that MP yield differs with different NFC sources
12
Different NFC sources require different inclusions of rumen degradable protein and rumen undegradable
protein in order for an animal to reach optimal performance (Mertens et al 1994)
Milk production per cow is the major factor determining any dairy farmrsquos profitability The inclusion of NFC is
a fashionable way to increase energy density and thus milk production of the dairy herd Replacing part of
the starch in the diet with sugar leads to higher fermentation rates and more MP This might be due to the
fact that sugar digests at a rate of 300 per hour whereas starch digests at a rate of 6 ndash 60 per hour
(Carver 2007) Research has also shown that additional supplementary sugar in feed has the power to
increase feed intake milk yield and fat content of milk due to better fibre digestion and production of MP in
the rumen (Lykos et al 1997)
The importance of adequate amounts of NFC cannot be over emphasized Feeding inadequate amounts of
NFC reduces the energy available from propionic and lactic acid production reduces MP synthesis and
decrease fibre digestion Overfeeding of NFC depress fibre digestion and acetic acid production (lowering
milk fat percentages)
It is important to note that NFC and NSC is not the same in all feeds The difference between these two is
caused by the input of pectin and organic acids Pectin is always included in NFC but not in NSC (NRC
2001) Numerous research experiments investigated the effect of NFC on ruminal pH Knowledge of the
individual as well as a combination of supplemented NFC fermentation characteristics can be helpful in
predicting an animalrsquos performance (Holtshausen 2004)
2911 Sugar
Simple sugars are rapidly fermented in the rumen (at a rate of 300 per hour) and are composed of one or
two units of sugar Sugars commonly fed to dairy cows include sucrose lactose and dextrose Initially
sugar was used in diets to improve the palatability of the feed Recently it was discovered that rumen micro-
organisms respond to sugar by increasing their production of MP leading to higher milk production The
addition of sugar to the feed also helps rumen micro-organisms capture and utilize diet nitrogen Even
though sugar has very advantageous effects on rumen micro-organisms and their actions it is important not
to add too much sugar in dairy cow diets as it can cause ruminal acid-spikes resulting in acidosis (De
Ondarza 2000)
2912 Starch
The NFC in most grain-based diets is made up of starch (24 ndash 28 of the total ration DM) Starch
digestibility plays an important role in the milk production of dairy cows Maize and barley (being cereal
grains) provide most of the starch in a dairy cowrsquos diet Theoretically starch is units of glucose bonded
together Depending on the starch source and method of processing the glucose units can be firmly bonded
or weakly connected This is the main reason why some starches ferment rapidly and others slowly in the
13
rumen of dairy cows Ruminal digestion of starch can vary from 6 ndash 60 per hour depending on the starch
source and processing method used The goal of feeding starch is to achieve maximum total tract
digestibility and maximum MP production without causing ruminal health problems due to production of
fermentation acids (De Ondarza 2000)
2913 Pectin
Pectin is one of the three most essential structural components in forages and is found primarily in the
intercellular layers of plant tissues Pectin diminishes as the plant gets older Most feeds consumed by
dairy cows are low in pectin (2 ndash 3) but several feeds may contain higher concentrations such as citrus
pulp (15) beet pulp (15 ndash 20) and lucerne (3 ndash 10) Pectin contributes to the energy requirements of
rumen micro-organisms (75 ndash 90 of pectin fermentation takes place in the rumen) (Allen 2001)
Many of the species that break down pectin also digest plant components such as cellulose and
hemicellulose Pectin is extremely fermentable and highly digestible but this does not appear to lower pH as
is often seen with starch digestion Due to this feeds containing pectin are often supplemented into high
concentrate dairy diets to avoid problems associated with rumen acidosis (Mohney 2002)
A study done by Dehority (1969) found that a number of different rumen bacteria are capable of fermenting
pectin (using it as a carbon source) eg Butyrivibrio fibrisolvens Prevotella ruminicola Lachnospira
multiparus Treponema bryantii and Succinivibrio dextrinosolvens Later studies discovered that the
products of the hydrolysis (by Lachnospira multiparus bacterium) of pectic material can be used by other
ruminal micro-organisms such as Selenomonas ruminantium Fusobacterium sp Eubacterium ruminantium
and Succinivibrio dextrinosolvens (Paggi et al 2005)
2914 Sugar vs Starch
Leiva et al (2000) investigated the effect of two maize silagelucerne hay-based diets on ruminal pH The
only difference between these two diets was that their NFC came from either starch (hominy) or sugars
(dried citrus pulp) From this trial it was concluded that the pH declined more rapidly on citrus diets (sugar)
than on hominy (starch) diets and also reaching the lowest pH point faster (Figure 22)
14
Figure 22 Ruminal pH results for citrus and hominy rations where CPD = citrus pulp diet and HD = hominy
diet (Leiva et al 2000)
From the studies done by Leiva et al (2000) it was observed that starch has the best chance of increasing
milk production However the problem with high starch diets is that they are likely to cause serious rumen
acidosis One way to ensure healthy rumens as well as high milk production is to use peNDF as a
benchmark The more peNDF a cow consumes the more starch may be included in the diet Physical
effective neutral detergent fibre thus lowers the risk of ruminal acidosis The effect of supplementing sugar
to forage based diets is shown in Table 24
Table 24 The effect of sugar on dairy cattle performance
MP = microbial protein OM = organic matter DMI = dry matter intake
210 Non-fibre carbohydrate digestibility
Non fibre carbohydrates are composed of starch and sugar Starch digestibility has a major effect on the
rumen Starch fermentation varies with processing and type of grain fed Processing such as grinding
Reference Forage Source Supplements Intake g DM day Animal Response
Chamberlain et al
1985
Grass Sugar 9072 g sugar MP synthesis uarr
Huhtanen 1988 Grass Molasses 9979 g molasses
(499 g sugar)
OM digestion amp
MP production uarr
Nombekela amp
Murphy 1995
Lucerne Haylage
amp Maize Silage
Sucrose 2858 g sucrose Milk yield (9072 g)
amp DMI uarr
15
steaming and ensiling affects ruminal availability of starch Processing mostly increases rate of fermentation
and digestibility of starch Soluble sugar ferments rapidly in the rumen and is readily available as energy
sources for the animal (Ishler amp Varga 2001) Mature grains (maize or oats) usually contain a small amount
of sugar because most has been converted to storage polysaccharides Forages (pasture or hay) usually
contain a lot of sugars The level of sugar in hay is depended on crop management Byproducts (molasses
citrus pulp and almond hulls) contain high levels of sugars However the variation in processing methods
(as in the case of starch) and the type of material used can lead to large variation in sugar content (Hall
2002)
One problem with diets high in NFC is the fact that it lowers the rumen pH increasing the risk of acidosis
The main reason for this is NFC fast fermentability especially if it replaces fibre in low fibre diets Acidosis in
turn affects ruminal digestion intake metabolism milk fat production milk production as well as rumen and
animal health The NFC levels of various feed types are shown in Table 25
Table 25 Non-fibre carbohydrate levels for various ration types (Ishler amp Varga 2001)
211 Non-fibre carbohydrate fermentation and organic acid production
The rate and extent of carbohydrate fermentation determines the concentration of organic acids produced
Rumen micro-organisms digest simple and complex carbohydrates (fibre) by converting them into VFA
(mainly acetic propionic and butyric acid) These VFA are the most important energy source for ruminants
Volatile fatty acids account for 60 ndash 70 of metabolizable energy supply in ruminants making it of great
importance in the production of milk by dairy cows Reduction in fibre digestion leads to a reduction in
ruminal pH This is caused by rapid NFC fermentations leading to increased VFA production by rumen
micro-organisms
Typical NFC level Typical feedstuffs
33 ndash 36 Barley oats high moisture- steam flaked-
and finely ground grain predominate the
concentrate portion of the diet
37 ndash 39
High quality hay crop forages
predominates the ration maize silage
rations include non-forage fibre sources
40 ndash 42
Coarsely processed maize is used diet
has a high inclusion level of non-forage
fibre sources
16
Feeding large amounts of forage produces greater amounts of acetic acid whilst resulting in lesser amounts
of propionic and butyric acid On the other hand feeding grain or other finely ground forages may lead to a
reduction in acetic acid while the amount of propionic acid may increase The ratio of acetic to propionic
acids imitates the rumen fermentation pattern Under an optimal rumen fermentation environment the acetic
to propionic ratio should be greater than 221 High planes of acetate can point to a low fermentable
carbohydrate high fibre ration High planes of propionic acid on the other hand can point to reduced fibre
digestion and acidosis (University of Minnesota 1996)
A study done by Strobel amp Russel (1986) found that pectin fermentation increased acetate concentrations
further compared to starch and sucrose The study concluded that the increased acetate might ultimately
contribute to increase precursors for fatty acid and milk fat synthesis in lactating dairy cows Fermentation
studies done with sucrose and starch on the other hand increased butyrate production (Hoover et al
2006) Butyrate has shown to be an important precursor of energy supplied to skeletal and heart muscles
(Holtshausen 2004) Sugar ferments extremely fast in the rumen Without linkages to other carbohydrates
and due to the high solubility of sugars there is little to impede microbial fermentation (Hall 2002) Several
studies reported that sugar has a much higher potential for lactate production when compared to other NFC
sources (for example starch) (Strobel amp Russel 1986 Heldt et al 1999)
212 Ruminal acidosis
Micro-organisms in the rumen obtain energy primarily from fermentation of carbohydrates Acidosis occurs
when the diet of ruminants is suddenly changed from a forage based diet to a predominant concentrate diet
The highest risks come from diets that are high in starch or fast fermentable carbohydrates and the effective
fibre is below the recommended level or the particle size is too small This leads to higher VFA production
as well as very high glucose levels in the rumen Subsequently ruminal osmolarity increases leading to
ruminal acidity The increase in osmolarrity is due to the negative effect the high glucose level has on
Streptococcus bovis and lactic acid-producing micro-organisms (Henning 2004) Acidosis can be divided
into sub-acute ruminal acidosis and acute acidosis as seen in Table 26
Table 26 Comparison of acute and sub-acute acidosis (Henning 2004)
Acidosis Item Acute Sub-Acute
Clinical Signs Present Absent
Systemic Acidosis Present Absent
Mortality Yes No
Ruminal pH lt 50 50 -55
17
Table 26(continue) Comparison of acute and sub-acute acidosis (Henning 2004)
Ruminal Acids
Lactic Acid High (50-100mM) Normal (0-5mM)
Volatile Fatty Acids Below Normal (lt100mM) High (150-200mM)
Ruminal Bacteria
Lactic Acid Producers Very High Normal to Small Increase
Lactic acid Utilisers Significant Reduction Increase
Ruminal Protozoa Absent or Reduced Absent or Reduced
Indicators determining whether ruminal acidosis is accruing in the herd include (Ishler amp Varga 2001)
Milk fat percentage (darr milk fat ndash darr ruminal pH)
Chewing activity (darr rumination ndash uarr ruminal acidosis)
Laminitis (uarr laminitis ndash uarr ruminal acidosis)
Strategies for avoiding acidosis
Provide good quality total mixed rations
Give small but frequent meals
Avoid abrupt changes in diets
213 Conclusion
Achieving maximum production and maintaining a healthy rumen ecosystem at the same time is a balancing
act A cow will attain more VFA when fermentation is maximized These VFA are used as energy
precursors and to synthesize MP Increased fermentation however goes together with increased acid
production and a lower rumen pH Low rumen pH can lead to metabolic disorders due to impaired fibre
digestion Thus by increasing the peNDF intake the risk of acidosis can be reduced effectively
Non-fibre carbohydrates are the essential source of energy for high producing dairy cattle One problem with
diets high in NFC however is the fact that it lowers the rumen pH increasing the risk of acidosis This is
mainly due to the fast fermentability of NFC especially if it replaces fibre in low fibre diets Acidosis in turn
affects ruminal digestion intake metabolism milk fat production and milk production as well as rumen and
animal health
A better understanding of the workings of the rumen as a whole ecosystem as well as ensuring optimal
sugar starch and peNDF in dairy cow ration will enable farmers to maintain the fine balance between
productivity and acidosis
18
Whilst the goal of any modern agricultural enterprise is to maximize profits special care should be taken not
to increase short-term profits at the cost of long-term viability A dairy cowrsquos productivity can easily be
increased whilst the animalrsquos health could suffer in the long term In the modern scenario the farm is as
much a profit-seeking enterprise as any other business With this in mind the modern farmer in his capacity
as a business manager should ensure the well-being and optimal performance of his assets
214 References
Allen MS 1997 Relationship between fermentation acid production in the rumen and the requirement
for physically effective fiber J Dairy Sci 80 1447 - 1462
Allen M 2001 Formulating lactating cow diets for carbohydrates In Proceedings of the 5th Western Dairy
Management Conference April 4 - 6 Las Vegas Nevada USA pp 79 - 86
Baloyi TF 2008 Effects of exogenous fibrolytic enzymes on in vitro fermentation kinetics of forage and
mixed feed substrates MSc (Agric) thesis Stellenbosch University Stellenbosch South Africa pp 1 -
28
Buxton DR amp Mertens DR 1995 Quality-related characteristics of forage In Forages An introduction to
grassland agriculture (2nd Ed) Eds Barnes RF Miller DA and Nelson CJ Iowa State University
Press Ames Iowa USA pp 83 - 96
Carver LA 2007 Sugar aids lactating dairy cattle production Feedstuffs 79(2) 1 - 3
Casper DP Schingoethe DJ amp Esenbeisz WA 1990 Response of early lactation dairy cows fed diets
varying in source of nonstructural carbohydrate and crude protein J Dairy Sci 73 1039 - 1050
Chamberlain DG Thomas PC Wilson W Newbold CJ amp MacDonald JC 1985 The effects of
carbohydrate supplements on ruminal concentrations of ammonia in animals given diets of grass
silage J Agric Sci Cam 104 331 - 340
Davies ZS Mason D Brooks AE Griffith GW Merry RW amp Theodorou MK 2000 An automated
system for measuring gas production from forages inoculated with rumen fluid and its use in
determining the effect of enzymes on grass silage Anim Feed Sci Technol 83 205 - 221
Dehority BA 1969 Pectin-fermenting bacteria isolated from bovine rumen J Bacteriol 99 189 - 196
De Ondarza MB 2000 Non-fibre carbohydrates
Available at httpwwwmilkproductioncomLibraryArticlesNon_Fibre_Carbohydrateshtm
(Accessed 5 August 2008)
19
Fisher DS Burns JC amp Moore JE 1995 The nutritive evaluation of forage In Forages An introduction
to grassland agriculture (1st Ed) Eds Barnes RF Miller DA amp Nelson CJ Iowa State University
Press Ames Iowa USA pp 105 - 115
Forage amp Grazing Terminology Committee 1991 Vegetation terms In Terminology for grazing lands and
grazing animals Pocahontas Press Inc Blacksburg Virginia USA
Getachew G Makkar HPS amp Becker K 1997 The in vitro gas coupled with ammonia measurements for
evaluation of nitrogen digestibility in low quality roughages using incubation measurements of different
measuring capacity J Sci Food Agric
Goering HK amp Van Soest PJ 1970 Forage fibre analysis (apparatus reagents procedures and some
applications) Agricultural Handbook Number 379 ARS-USDA Washington DC USA
Goosen L 2004 The effect of an exogenous fibrolytic enzyme on forage digestibility parameters MSc
(Agric) thesis Stellenbosch University Stellenbosch South Africa pp 1 - 27
Hall MB 2002 Working with sugars (and molasses) In Proceedings of the 13th Annual Florida Ruminant
Nutrition Symp January 11 - 12 Gainesville Florida USA pp 146 - 158
Heldt JS Cochran GL Stokka GL Farmer CG Mathis CP Titgemeyer EC amp Nagaraja TG
1999 Effects of different supplemental sugars and starch fed in combination with degradable intake
protein on low-quality forage use by beef steers J Anim Sci 77 2793 - 2802
Henning P 2004 Acidosis in high-producing ruminants - myth or menace Animal Feed Manufacturers
Association (AFMA) South Africa pp 1 - 9
Available at httpwwwengormixcome_articles_viewaspart=529ampAREA=GDC
(Accessed 5 Augustus 2008)
Holtshausen L 2004 Effect of nonfibre carbohydrates on product yield and fibre digestion in fermentations
with mixed ruminal microbes PhD thesis University of Florida Gainesville Florida USA pp 1 - 33
Hoover WH Tucker C Harris J Sniffen CF amp De Ondarza MB 2006 Effects of nonstructural
carbohydrate level and starchsugar ratio on microbial metabolism in continuous culture of rumen
contents Anim Feed Sci Technol 128(3 - 4) 307 - 319
Huhtanen P 1988 The effects of barley unmolassed sugar-beet pulp and molasses supplements on
organic matter nitrogen and fibre digestion in the rumen of cattle given a silage diet Anim Feed Sci
Technol 20 259
20
Ishler V Heinrichs J amp Varga G 1996 From feed to milk Understanding rumen function Pennsylvania
State University Extension Circular 422
Available at httpanimsciagrenvmcgillcacourses450extrafeed_to_milkconceptshtml
(Accessed 25 August 2008)
Ishler V amp Varga G 2001 Carbohydrate nutrition for lactating dairy cattle Pennsylvania State University
Code DAS 01 - 29 (online) pp 1 - 11
Available at httpwwwdaspsueduteamdiary
(Accessed 5 August 2008)
Kamra DN 2005 Rumen microbial ecosystem Current Science 89(1) 124 - 135
Knudsen KE 2001 The nutritional significance of lsquodietary fibrersquo analysis Anim Feed Sci Technol 90 3 -
20
Leiva E Hall MB amp Van Horn HH 2000 Performance of dairy cattle fed citrus pulp or corn products as
sources of neutral detergent-soluble carbohydrates J Dairy Sci 83 2866 - 2875
Lykos T Varga GA amp Casper D 1997 Varying degradation rates of total nonstructural carbohydrates
effects on ruminal fermentation blood metabolites and milk production and composition in high
producing holstein cows J Dairy Sci 80(12) 3341 - 3355
McDonald P Edwards RA Greenhalgh JFD amp Morgan CA 2002 Evaluation of food Digestibility In
Animal Nutrition (6th Ed) Pearson Education Ltd Edinburgh Gate Harlow Essex UK pp 246 - 263
Mertens DR 1997 Creating a system for meeting the fibre requirements of dairy cows J Dairy Sci 80
1463 - 1481
Mertens D R Broderick GA amp Simons R 1994 Efficacy of carbohydrate sources for improving
utilization of N in alfalfa silage J Dairy Sci 77(Suppl 1) 240 - 252
Mohney K 2002 Synchronization of carbohydrate and protein metabolism by ruminal microbes in
continuous culture PhD thesis North Carolina State University Raleigh North Carolina USA pp 1 -
69
Morrison FB 1959 Feeds and feeding A handbook for the student and stockman (22nd Ed) Eds The
Morrison Publishing Company Clinton Iowa USA 1165 pp
Mould FL 2003 Predicting feed quality - chemical analysis and in vitro evaluation Field Crops Research
84(1) 31 - 44
21
National Research Council (NRC) 2001 Nutrient requirements of dairy cattle (7th Rev Ed) National
Academy Press Washington DC USA pp 34 - 35
Nocek J E amp Tamminga S 1991 Site of digestion of starch in the gastrointestinal tract of dairy cows and
its effect on milk yield and composition J Dairy Sci 74 3598 - 3629
Nombekela S W amp Murphy MR 1995 Sucrose supplementation and feed intake of dairy cows in early
lactation J Dairy Sci 78 880 - 885
Paggi RA Rodriguez C amp Fay JP 2005 Growth and pectate-lyase activity of the ruminal bacterium
lachnospira multiparus in the presence of short-chain organic acids Lett Appl Microbiol 41 434 -
439
Pell AN amp Schofield P 1993 Computerized monitoring of gas production to measure forage digestion in
vitro J Dairy Sci 76 1063 - 1073
Pell AN Pitt RE Doane PH amp Shofield P 1998 The development use and application of gas
production techniques at Cornell University USA In In vitro techniques for measuring nutrient supply
to ruminants Eds Deaville ER Owen E Adesogan AT Rymer CHuntington JA amp Lawrence
TLJ British Society of Animal Science Edinburgh UK Publication 22 45 - 54
Russell JB OrsquoConnor JD Fox DG Van Soest PJ amp Sniffen CJ 1992 A net carbohydrate and
protein system for evaluating cattle diets Ruminal fermentation J Anim Sci 70 3551 ndash 3561
Schwarz FJ Haffner J amp Krichgessner M 1995 Supplementation of zero-grazed dairy cows with
molassed sugar beet pulp maize or cereal-rich concentrate Anim Feed Sci Technol 54 237 - 248
Stobel HJ amp Russel JB 1986 Effect of pH and energy spilling on bacterial proteien synthesis by
carbohydrate-limited cultures of mixed rumen bacteria J Dairy Sci 69 2941 - 2947
Stokes SR 1997 Balancing carbohydrates for optimal rumen function and animal health In Proceedings
of the West Can Dairy Sem 9 73 - 86
Available at httpwwwwcdsafnsualbertacaProceedings1997ch06-97htm
(Accessed 7 October 2008)
Theodorou MK Williams BA Dhanoa MS McAllan AB amp France J 1994 A simple gas production
method using a pressure transducer to determine the fermentation kinetics of ruminant feeds Anim
Feed Sci Technol 48 185 - 197
Tilley JMA amp Terry RA 1963 A two-stage technique for the in vitro digestion of forage crops J Br
Grassl Soc 18 104 - 111
22
University of Minnesota 1996 Feeding the dairy herd (online)
Available at httpwwwextensionumnedudistributionlivestocksystemscomponentsDI0469-02
(Accessed 5 August 2008)
Van der Merwe FJ amp Smith WA 1991 Dierevoeding Kosmo Publ Stellenbosch South Africa pp 89 -
141 (in Afrikaans)
Van Saun RJ 1993 Dairy cattle nutrition feeding for two In Proceedings of the 1993 Northwest and
Lower Columbia Dairy Short Course January 21 - 22 amp 25 - 26 Everett Washington and Portland
Oregon USA pp 172 - 180
Van Soest PJ 1994 Nutritional ecology of the ruminant (2nd Ed) Cornell University Press Ithaca New
York USA pp 467 - 476
Van Soest PJ amp Wine RH 1967 Use of detergents in the analysis of fibrous feeds IV Contamination of
Plant Cell-wall Constituents J Assoc Off Anal Chem 50 50 - 55
Wilkins RJ 2000 Forages and their role in animal systems In Forage evaluation in ruminant nutrition
Eds Givens DI Owen E Axford RFE Omed HM CAB International Wallingford UK pp 1 -14
Zinn RA amp Ware RA 2007 Forage quality Digestive limitations and their relationships to performance of
beef and dairy cattle 22nd Annual Southwest Nutrition amp Management Conference February 22 - 23
University of California Davis Caifornia USA
Available at httpagarizonaeduansswnmc2007talksZinn_2007SWNMCpdf
(Accessed 16 September 2008)
23
Chapter 3
THE EFFECT OF SUGAR STARCH OR PECTIN ON RATE AND
EXTENT OF GAS PRODUCTION IN DIFFERENT FORAGES
Abstract
The study evaluated the effect of sugar (molasses) starch (maize meal) or pectin (citrus pulp) on total gas production (b)
and rate of gas production (c) of different forages The forage substrates included wheat straw (WS) oat hay (OH)
lucerne hay (LUC) ryegrass (RYE) and kikuyu grass (KIK) The three energy sources as well as a control (no energy
source) were incubated in vitro with each of the above mentioned forages Rumen fluid was collected from two lactating
Holstein cows receiving a diet consisting of oat hay lucerne wheat straw and a concentrate mix Forages alone andor
together with either molasses citrus pulp or maize meal were weighed into 100 ml glass vials and incubated for 72
hours The weights of the energy sources were calculated on an energy equivalent basis Blank vials that contained no
substrates were included to correct for gas production from rumen fluid alone The substrates were incubated in a
mixture of 40 ml buffered medium 2 ml of reducing solution and 10 ml rumen fluid Gas pressure was recorded
automatically every five minutes using a pressure transducer system and the method based on the Reading Pressure
Technique Gas pressure was converted to gas volume using a predetermined regression equation In the first trial the
gas production included gas produced by the energy sources while in the second trial the energy source gas production
was deducted from the total gas production to determine the effect of energy source on gas production of respective
forage substrates per se Data were fitted to two non-linear models Significant forage x energy interactions were
observed for the non-linear parameter b (gas production) in Model 1 and for b and L (lag phase) in Model 2 in both trials
In the first trial the higher fermentability of the energy sources supplemented to forage substrates increased b (Model 1
amp 2) of the LUC and WS (P lt 005) The gas production rate was affected in different ways for different forages with the
most noticeable effect when WS was supplemented with energy sources All the energy sources increased c of WS
irrespective of the model used Energy sources had no effect on the L of LUC OH or RYE but decreased the L of WS (P
= 0004) and KIK (P = 0022) In the second trial maize meal had no effect on b for any of the forages (Model 1 amp 2)
while molasses (Model 1 amp 2) decreased b for all forage substrates and citrus pulp (Model 1 amp 2) decreased b of OH and
RYE to lower values than those of the control treatments Gas production rate was not affected by molasses for any of
the forage substrates while citrus pulp (Model 1 amp 2) increased c of OH and maize meal increased c of OH and KIK
Lag phase was only affected by energy sources in WS (P = 0001) and KIK (P = 0009) where all the energy sources
had lower L values than the control treatment It was concluded that forage fermentability is affected differently by
different energy sources These observations may have important implications for rumen health and milk production
and the data obtained can potentially be used as guidelines in feed formulations
31 Introduction
Forages contribute significant major part of dairy cow diets However forages alone cannot provide all the
energy requirements of high producing dairy cows (Schwarz et al 1995) Forage degradation by rumen
micro-organisms is restricted by the chemical composition and physical quality of the forage (Mertens 1997)
Fibrous feeds are low in energy and a large consumption thereof results in rumen fill thus limiting feed intake
24
(Allen amp Oba 2000) It is important to find ways to improve forage degradation and utilization
Improvements in forage degradation will increase energy intake and subsequently milk production and
performance (Giraldo et al 2008)
Different sources of non-fibre carbohydrates (NFC) have different effects on animal performance
Supplementing forage based diets with energy sources containing sugar starch or pectin results in variation
of performance measurements such as milk yield milk composition dry matter intake (DMI) and feed
efficiency (Larson 2003) Aldrich et al (1993) reported that feeding high rumen-available NFC increased
milk protein percentage slightly (301 vs 307) but significantly Leiva et al (2000) showed that
substituting diets containing 205 citrus pulp for diets containing 195 corn meal yielded more milk
Solomon et al (2000) however reported that substituting starch (maize) diets with pectin (citrus pulp) diets
had no effect on milk yield but increased linoleic acid concentration in milk fat When formulating diets for
dairy cows it is important to understand the digestion and metabolizable nutrient yield of the various NFC
sources (Larson 2003)
The objective of this study was to determine the impact of three energy sources viz maize meal
(representative of starch) molasses (representative of sugar) and citrus pulp (representative of pectin) on
fermentation kinetics of different forage substrates as determined by total gas production (b) and the rate of
gas production (c) Forages commonly used in dairy cow diets in South Africa (wheat straw oat hay lucerne
hay kikuyu and ryegrass) were used as substrates
32 Materials and methods
321 Study area
The study to evaluate the effect of supplementing forage based diets with sugar starch and pectin on rumen
kinetic parameters was conducted at Stellenbosch University Stellenbosch South Africa (33deg 55prime 12Prime S
18deg 51prime 36Prime E)
322 Simulated diets
3221 Basal forages
Five forages (Table 31) were used to prepare rations to simulate diets for lactating dairy cows
25
Table 31 Forages used in simulation diets for lactating dairy cows
Forage Type Abbreviation
Wheat straw (Triticum aestivum) WS
Oat hay (Avena sativa) OH
Lucerne hay (Medicago sativa) LUC
Ryegrass (Lolium multiflorum) RYE
Kikuyu grass (Pennisetum clandestinum) KIK
Rye and kikuyu grasses were harvested after four weeks of re-growth All the forages were oven dried at
60ordmC for 72 hours Wheat straw oat hay and lucerne hay were ground (Cyclotec 1093 mill) through a 2 mm
screen Rye and kikuyu grasses were obtained from the Outeniqua experimental farm (33deg 57prime 0Prime S
22deg 25prime 0Prime E) situated just outside George South Africa (33deg 58prime 0Prime S 22deg 27prime 0Prime E) The rye and kikuyu
grasses were already ground through a 1 mm screen when received
3222 Energy supplements
Three energy sources (Table 32) were selected as supplements to prepare rations that would simulate
lactating cow diets
Table 32 Energy sources used in simulating lactating dairy cow diets
Energy type Source Abbreviation
Starch Yellow maize meal (Zea mays) Mm
Sugar Molasses syrup Mol
Pectin Citrus pulp Cp
These energy feedstuffs were sourced in the following forms molasses as a syrup by-product from the
processing of sugar cane (Officinarum saccharum) citrus pulp as a finely granulated residue by-product from
the peel pulp and seeds of oranges and grapefruit and yellow maize grain The citrus pulp and maize was
milled (Cyclotec 1093 mill) through a 1 mm screen
3223 Defining the diets
A total of 23 simulated diets (forages and forage-concentrate mixes) were prepared
bull 5 diets contained forage substrates only (Table 31)
bull 3 diets contained energy sources only (Table 32)
bull 15 diets contained a mixture of forages (Table 31) and energy sources (Table 32)
26
The final substrate compositions are indicated in Table 34
323 Chemical analyses of forages and energy sources
Samples (1 g) of each forage type and energy sources (1 g) were accurately weighed and placed in a 100ordmC
conventional oven for 24 hours to determine dry matter (DM) content (AOAC 1995 Method 93015)
Organic matter was determined by weighing 1 g of each feedstuff into crucibles and ashing the content at
500ordmC in a muffle furnace for 6 hours (AOAC 1995 Method 94205)
The NDF content was determined by measuring 05 g of each feedstuff into F57 ANKOM fibre analysis bags
The bags were heat sealed and NDF determined using the method of Van Soest et al (1991) Sodium
sulfite (Na2SO3) was added to the NDF solution during digestion and heat-stable amylase was added during
rinsing Ether extract was determined using the AOAC method (AOAC 1995 Method 92039) About 2 g of
ground sample was weighed into a thimble and samples were extracted with diethyl ether (C4H10O)
Acid detergent lignin (ADL) was determined by measuring 05 g of each substrate sample into separate F57
ANKOM fibre analysis bags The bags were heat sealed and acid detergent fibre (ADF) determined using
the method of Van Soest et al (1991) The ADF residue was then soaked in 72 sulphuric acid for three
hours to dissolve the cellulose Acid detergent lignin was determined using the ANKOM method (ANKOM
2005)
Total nitrogen content was determined with a Leco Nitrogen Gas Analyzer custom designed and built by
LECO Africa (Pty) Ltd (Kempton Park) About 01 g of sample was accurately weighed into a small square of
aluminum foil The samples were then ignited inside the Leco furnace at about 900degC according to the
Dumas procedure (AOAC 1990 Method 96806) Crude protein (CP) was calculated by multiplying the
nitrogen content with 625 (AOAC 1995 Method 99003) The results obtained from the chemical analysis
are shown in Table 33
324 Preparation of samples for gas production
The gas production method used was based on the Reading Pressure Technique (Mauricio et al 1999)
Samples of the respective dietary substrates (Tables 34 and 35) were weighed into glass vials with known
volume The vials had a nominal volume of 100 ml but the exact volume of each vial was previously
accurately determined The amount of the energy sources in Table 35 were calculated to provide the same
amount of metabolizable energy (ME) than 0125 g maize DM For calculation purposes ME values were
assumed to be 139 MJkg DM for maize 122 MJkg DM for citrus pulp and 123 MJkg for molasses (NRC
2001) Blank vials were prepared exactly as the others except that they did not contain any substrates in
order to correct for gas production from rumen fluid alone
27
Table 33 Chemical composition (gkg DM plusmn SD) of forages and energy sources used in the trial All values
are on a DM basis
Feedstuff DM OM NDF CP EE ADL
WS 9150 plusmn 05 9022 plusmn 16 8179 plusmn 71 723 plusmn 10 36 plusmn 05 1022 plusmn 30
OH 8504 plusmn 23 9403 plusmn 173 7819 plusmn 110 910 plusmn 12 97 plusmn 08 825 plusmn 03
LUC 8989 plusmn 20 9062 plusmn 18 5153 plusmn 10 2370 plusmn 46 81 plusmn 06 927 plusmn 67
RYE 938 plusmn 10 845 plusmn 05 4892 plusmn 30 2509 plusmn 27 431 plusmn 01 448 plusmn 181
KIK 1242 plusmn 104 1122 plusmn 01 6512 plusmn 20 2534 plusmn 41 283 plusmn 11 480 plusmn 17
mm 8559 plusmn 09 9844 plusmn 13 1743 plusmn 550 1071 plusmn 02 377 plusmn 04 70 plusmn 06
cp 8799 plusmn 09 9285 plusmn 07 2614 plusmn 140 786 plusmn 18 164 plusmn 04 253 plusmn 64
mol 6980 plusmn 19 8927 plusmn 06 ND ND ND ND
DM = dry matter OM = organic matter NDF = neutral detergent fibre CP = crude protein EE = ether
extract ADL = acid detergent lignin ND = not determined WS = wheat straw OH = oat hay LUC = lucerne
RYE = ryegrass KIK = kikuyu grass mm = maize meal cp = citrus pulp mol = molasses
Table 34 Substrate samples containing either forage or energy supplements
Forage type Energy source Sample size (g DM)
Wheat straw - 02500
Oat hay - 02500
Lucerne hay - 02500
Ryegrass - 02500
Kikuyu grass - 02500
- Maize meal 01250
- Citrus pulp 01425
- Molasses 01412
28
Table 35 Composite dietary samples containing forage and energy sources
Forage type Energy source Forage (g DM) Energy (g DM)
Wheat straw Maize meal 01250 01250
Wheat straw Citrus pulp 01250 01425
Wheat straw Molasses 01250
01412
Oat hay Maize meal 01250 01250
Oat hay Citrus pulp 01250 01425
Oat hay Molasses 01250
01412
Lucerne hay Maize meal 01250 01250
Lucerne hay Citrus pulp 01250 01425
Lucerne hay Molasses 01250 01412
Ryegrass Maize meal 01250 01250
Ryegrass Citrus pulp 01250 01425
Ryegrass Molasses 01250
01412
Kikuyu grass Maize meal 01250 01250
Kikuyu grass Citrus pulp 01250 01425
Kikuyu grass Molasses 01250 01412
325 Preparation of the in vitro medium and reducing solution
The incubation medium was prepared as described by Van Soest amp Robertson (1985) The medium
consisted of micro minerals macro-mineral solution buffer solution tryptose rezasurin and distilled water
The medium was kept in a water bath at 395ordmC The pH of the medium was about 78 Reducing solution
was prepared as described by Van Soest amp Robertson (1985) and consisted of cysteine hydrochloride
(C3H7NO2HCL) potassium hydroxide (KOH) pellets sodium sulfide nonahydrate (Na2S9H2O) and distilled
water
326 Collection and preparation of rumen fluid
Rumen fluid was collected from two ruminally cannulated lactating Holstein cows The cows were confined
and received 25 kg per day (air dry basis) of a diet consisting of oat hay lucerne hay wheat straw and a
concentrate mix The total diet contained 11279 gkg CP 55948 gkg NDF and 5950 gkg ash with a
calculated ME content of 108 MJkg The diet was offered in two equal amounts viz 125 kg in the morning
(0630) and 125 kg in the afternoon (1630) Rumen fluid was squeezed through two layers of cheese cloth
into pre-warmed thermos flasks and a handful of solid material was added The rumen fluid was then
blended in a pre-warmed blender at a low speed for 10 seconds The rumen fluid was then filtered through
29
four layers of cheese cloth into pre-warmed beakers while flushing with carbon dioxide (CO2) The
temperature of the rumen fluid averaged 38ordmC and the pH averaged 58
327 In vitro incubation
The glass vials were flushed with CO2 while adding 40 ml of the medium and 2 ml of the reducing solution to
each vial A magnetic stirrer (02 ml) was also placed into each vial The vials were then lightly closed with
rubber stoppers and placed in the incubator at 39ordmC until the medium was reduced (ie clear) Vials were re-
opened and 10 ml of rumen fluid was added while flushing with CO2 The vials were then closed tightly with
rubber stoppers crimp sealed and connected via needles to a pressure logging system The vials were
placed on magnetic stirrer plates in an incubator at 39ordmC and were constantly stirred at a low speed The
material was incubated for 72 hours and gas pressure was recorded automatically every five minutes using a
pressure transducer system that was custom designed and built by Eagle Technology (Pty) Ltd (Cape Town)
based on the Reading Pressure Technique (RPT) (Mauricio et al 1999) Gas pressure was released on
regular intervals to prevent pressure build-up in the vials
328 Converting gas pressure to gas volume
Gas pressure data were converted to gas volume using the following linear regression equation developed
by Goosen (2004) for Department of Animal Sciencesrsquo in vitro lab
OMCXY )])09770((1000[=
Where Y = Gas volume (mlg OM)
X = Gas pressure (psi)
C = Vial head space (ml)
OM = Organic Matter (mg)
329 Estimating kinetic coefficients
Kinetic coefficients for gas production were derived from the gas volume data using the solver option in Excel
and the non-linear models 1 and 2 (with and without a lag phase respectively) The models are based on the
modified version described by Oslashrskov and McDonald (1979)
30
Model 1 ⎟⎠⎞
⎜⎝⎛ minusminus= ctebY 1
Model 2 ( )⎟⎠⎞
⎜⎝⎛ minusminusminus= LtcebY 1
Where Y = gas volume at time t
b = total gas production
c = rate of gas production
t = incubation time
L = lag time
33 Statistical analysis
The first derivatives b and c (Model 1) and b c and L (Model 2) were subjected to statistical analysis The
experiment was a two way cross classification and data was subjected to a factorial ANOVA with the factors
forage and energy using Statistica 81 (2008) This was done for all the non-linear parameters Main effects
were interpreted in the cases where no interaction was observed Significant forage x energy source
interactions were observed for the non-linear parameter b in Model 1 and for b and L in Model 2 Therefore
a one-way ANOVA was done on each of the forages to determine the effect of energy sources Differences
between means were determined with a Tukey test and significance was declared at P lt 005
34 Results and discussion
341 Gas production including that from the energy sources
Results of total gas (b) and rate (c) of gas production are presented in Table 36 Pasture grasses had
higher gas volumes than mature forages before substitution with energy sources Gas volume is generally a
good indicator of digestibility fermentability and microbial protein production (Sommart et al 2000)
Substitution with energy sources tended to raise gas production (Table 36) When maize meal replaced
50 of the forage substrate total 72 hour gas production was increased in the case of lucerne and wheat
straw irrespective of the model used In wheat straw total gas production was also increased with citrus
pulp supplementation (Models 1 amp 2) and with molasses (Model 2) For the other forages (oat hay ryegrass
and kikuyu) energy supplements did not have an effect on total gas production values The total (72 hour)
gas production values represent the sum of forage and energy source fermentations except for the control
31
treatment where the substrates were forages only The higher gas production values observed with energy
supplementation (especially for wheat straw) was due to the energy sources being more readily fermentable
and easily available to rumen micro-organisms Energy sources are also low in NDF and ADL (Table 33)
which would increase gas production as there exists a negative correlation between gas production and
plant cell wall content (Sallam 2005)
The rate of gas production (c) of forage substrates alone ranged between 003 and 009 mlh with lucerne
and ryegrass having the highest rates When the respective energy sources replaced 50 of the forage
substrates there were variable positive responses in terms of c of different forage substrates In general
energy sources tended to raise the rate of gas production probably due to the higher nutrient content and
easier accessibility of chemical constitutes to rumen microbial enzymes as compared to the forage
substrates alone (Arigbede et al 2006) In lucerne hay molasses increased c compared to the control
treatment (Model 1 amp 2) Maize meal had no effect on c when compared to the control treatment The latter
agrees with Mertens amp Loften (1980) where starch increased the lag time but had no effect on digestion rate
of lucerne This would suggest that the addition of energy sources to forage substrates do not decrease
fibre digestibility by lowering the rate of fermentation In oat hay citrus pulp had the biggest effect on c (both
models) while with Model 1 molasses also increased c Maize meal (both models) tended to increase c but
not significantly compared to the control treatment The most noticeable effect of forage substitution with
energy sources was observed for wheat straw In this case all the energy sources increased the rate of gas
production irrespective of the model used While the other forages have moderate fermentation potentials
(as can be seen from the b and c values) the fermentability of wheat straw is low resulting in a higher
response when energy was supplemented In ryegrass maize meal had no effect on c (Model 1 amp 2) while
citrus pulp (Model 1) and molasses (both models) improved c compared to the control treatment Citrus pulp
increased gas production rate in kikuyu (P lt 005) when Model 1 was used while maize meal and molasses
only tended to increase c Supplementation with citrus pulp tended to improve gas production rates of
forages more than maize meal Citrus pulp is high in degradable NDF resulting in less negative effects on
cellulolytic bacteria and the ruminal environment than starch supplementations (Bampidis amp Robinson
2006) Unlike sugars and starches pectin substances do not lower the rumen pH (Mohney 2002) Pectin
supplementation would thus sustain an optimal ruminal environment for cellulolytic bacteria functions
explaining the better gas production rates resulting from forages supplemented with citrus pulp Leiva et al
(2000) also reported that citrus pulp ferment at a faster rate than corn hominy Energy source had no
significant effect on gas production rate of kikuyu in Model 2 It thus seems that energy sources per se
tended to improve forage gas production rate Energy sources are high in nutrients that are easily available
and rapidly fermentable by rumen micro-organisms Hiltner amp Dehority (1983) found that forage digestion
improved with energy sources supplementation due to an increase in the number of rumen micro-organisms
available to help with fermentation
When the respective energy sources replaced 50 of the forage substrates a significant forage x energy
source interaction was observed for the lag phase Different lag times of forage substrates (control
treatments) may be the result of differences in plant tissue composition between forages that require different
degrees of physical or chemical changes before rumen micro-organisms can start with fibre digestion
(Mertens amp Loften 1980) Lucerne fermented alone had almost no lag phase but supplementation of maize
32
meal tended (P = 0069) to increase the lag phase Adesogan et al (2005) found that maize and citrus pulp
incubated individually had longer lag phases when compared to hays (P lt 0001) agreeing with results
obtained in this study that the energy sources tended to lengthen the lag phase of lucerne hay The longer
lag phase for the maize and citrus pulp treatments might be associated with a high proportion of cellulolytic
micro-organisms in the rumen fluid The diet of the cannulated cows consisted predominantly of oat hay
lucerne hay and wheat straw and might have resulted in insufficient numbers of pectin-fermenting and
amylolytic bacteria in the collected rumen fluid to instantly colonize the citrus pulp and maize respectively
(Adesogan et al 2005) The results also agree with the work of Mertens amp Loften (1980) where starch
increased the lag time but had no effect on digestion rate of lucerne Possible reasons include a delay in
fermentation due to microbial colonization (Chesson amp Forsberg 1988) In contrast Haddad amp Grant (2000)
found that a reduction in NFC content substituted to lucerne based diets in vitro increased the lag time of
lucerne
Table 36 Effects of maize meal citrus pulp and molasses as energy sources on fermentation kinetics of
different forage substrates as measured by in vitro gas production Gas production of both energy sources
and forage substrates are included
Treatment
Item Maize meal Citrus pulp Molasses Control
SEm
P
Lucerne hay
Model 1
b 3981 b 3500 ab 3342 ab 2701 a 2498 0025
c 009 a 011 ab 014 b 009 a 001 0005
Model 2
b 3965 b 3490 ab 3340 ab 2700 a 2513 0028
c 010 a 011 ab 015 b 009 a 001 0013
L 045 033 009 005 011 0069
Oat hay
Model 1
b 3982 3654 3150 2966 372 0250
c 008 ab 011 b 008 b 004 a 001 0002
Model 2
b 3971 3654 3150 2951 3745 0253
c 008 ab 011 b 008 ab 005 a 001 0004
L 032 0 0 036 013 0125
33
Table 36 (continue) Effects of maize meal citrus pulp and molasses as energy sources on fermentation kinetics of different forage substrates as measured by in vitro gas production Gas production of both energy sources and forage substrates are included
Wheat straw
Model 1
b 3706 b 3591 b 3062 ab 2460 a 1876 0002
c 008 b 010 b 009 b 003 a 001 0001
Model 2
b 3696 b 3591 b 3062 b 2289 a 1796 0001
c 008 b 010 b 009 b 003 a 001 0001
L 032 b 000 b 000 b 225 a 040 0004
Ryegrass
Model 1
b 4492 4113 3777 3727 3454 0406
c 008 a 012 b 012 b 008 a 001 0001
Model 2
b 4471 4106 3776 3711 3475 0422
c 008 a 012 cb 012 b 009 ac 001 0006
L 051 024 003 054 018 0213
Kikuyu grass
Model 1
b 4236 4269 3902 3230 2634 0055
c 009 ab 011 b 010 ab 005 a 001 0025
Model 2
b 4224 4266 3902 3776 2403 0425
c 010 011 010 006 001 0059
L 026 ab 011 b 000 b 163 a 035 0022
b = Total gas production (mlg OM) c = gas production rate (mlh) L = Lag time (h)
Model 1 Y = b + (1 ndash e-ct) Model 2 Y = b + (1 ndash e-c(t-L)) Superscripts are comparing across rows
The lag phase for oat hay was about 22 minutes and was not significantly affected by energy source The
greatest effect of forage substitution with energy sources was observed for wheat straw where all the energy
sources shortened the lag phase compared to the control treatment where wheat straw had a lag phase of
more than 2 hours In ryegrass treatment had no significant effect on lag phase but molasses tended to
decrease the lag phase In kikuyu the lag phase was significantly shortened when supplemented with citrus
pulp and molasses (P lt 005) while maize meal only tended to shorten the lag Hiltner amp Dehority (1983)
also found a decrease in lag times of fibre digestion when soluble carbohydrates were added to in vitro
incubations They concluded that the decrease in lag phase was due to an increase in bacteria numbers
helping with digestion as they found similar results when they increased the inoculum
The parameters presented in Table 36 (Model 2) were used to construct Figures 31 - 36 The data
presented in the figures represent total gas production including that of the energy sources
34
0
50
100
150
200
250
300
350
400
450
0 10 20 30 40 50 60 70 80
Gas
Pro
duct
ion
(mlg
OM
)
Time (hours)
Lucerne hay
Oat hay
Wheat straw
Ryegrass
Kikuyu grass
Figure 31 Gas production of forage substrates alone
Figure 31 show differences in fermentation characteristics of the different forages Variations in NDF ADL
and CP contents of these forages (Table 33) as well as different arrangements of their cell-wall
polysaccharides (Cheng et al 1984) are most likely responsible for different fermentation characteristics
observed between forage substrates The fermentation patterns of the forages are functions of the forage
type as well as the physiological stage at which they were harvested both of which affect their chemical
composition The grasses (ryegrass and kikuyu) were immature (28 days of re-growth) Lucerne and oat
hay were harvested at the 10 flowering stage while wheat straw was a mature forage As forages mature
their NDF and ADL contents increase (McDonald et al 2002) Wheat straw had the highest NDF and ADL
contents (Table 33) Although lucerne hay had a relatively low NDF content its ADL content was quite high
compared to kikuyu which had a fairly high NDF content but a low ADL content resulting in the early cut
grasses to manifest a much higher fermentability profile than the other forages Figure 31 clearly indicates
that wheat straw has a much lower fermentability both in terms of total gas production and rate of gas
production than the other forages Wheat straw also has a much longer lag phase compared to other
forages The lower fermentability and longer lag phase of wheat straw which is a mature forage can be
explained by the tissue content of wheat straw that is high in NDF and ADL (which is negatively correlated
with gas production) subsequently requiring more physical and chemical alterations before bacteria in the
rumen can start digestion The high rate and extent of gas production from both ryegrass and kikuyu can
also be observed (Figure 31) Apart from readily fermentable fibre these pasture grasses are also high in
nitrogen (Table 33) and total carbohydrates which are both needed for optimal growth of rumen micro-
organisms and thus fermentation (NRC 2001)
35
The effect of energy sources on the fermentation profiles of the different forages can be observed in Figures
32 - 36
0
50
100
150
200
250
300
350
400
450
0 10 20 30 40 50 60 70 80
Gas
Pro
duct
ion
(mlg
OM
)
Tme (hours)
Maize mealCitrus pulpMolassesControl
Figure 32 Gas production of lucerne hay when supplemented with different energy sources
Substituting 50 of the forages with an energy source improved gas production (Figures 32 - 36) probably
by boosting microbial growth Maize meal and citrus pulp had the biggest effect throughout Molasses is a
fast fermenting simple sugar (Hall 2002) which is rapidly utilized explaining the fast increase in gas
production followed by a plateau soon afterwards Maize meal and citrus pulp other than molasses are
more complex energy sources which ferment slower and are available over a longer period of time As
mentioned before wheat straw was a mature forage compared to ryegrass and kikuyu which were harvested
after only 28 days of re-growth while lucerne and oat hay were harvested at 10 flowering stage
Ryegrass lucerne and kikuyu are high in nitrogen (Table 33) Sufficient nitrogen ensures nitrogen-energy
coupling to occur at a greater extent thereby ensuring more efficient microbial fermentation and cellulose
degradation by rumen bacteria (NRC 2001) As forages mature the NDF and ADF contents increase and
CP (supplying nitrogen) decreases making less nitrogen readily available to rumen micro-organisms for
fermentation (Ghadaki et al 1975) This may explain why maize meal and citrus pulp had higher impacts
than molasses on gas production of the mature forages Citrus pulp and maize meal release energy at a
slower rate which match the slow release of nitrogen in mature forages Also even though small these
energy sources contributes rumen degradable protein (RDP) which with substrates like wheat straw (that
has very low CP content) could be quite substantial It should be kept in mind though that the gas
production profiles in these figures reflect the combination of forages and energy sources
36
0
50
100
150
200
250
300
350
400
450
0 10 20 30 40 50 60 70 80
Gas
Pro
duct
ion
(mlg
OM
)
Time (hours)
Maize mealCitrus pulpMolassesControl
Figure 33 Gas production of oat hay when supplemented with different energy sources
0
50
100
150
200
250
300
350
400
450
0 10 20 30 40 50 60 70 80
Gas
Pro
duct
ion
(mlg
OM
)
Time (hours)
Maize mealCitrus pulpMolassesControl
Figure 34 Gas production of wheat straw when supplemented with different energy sources
37
0
50
100
150
200
250
300
350
400
450
0 10 20 30 40 50 60 70 80
Gas
Pro
duct
ion
(mlg
OM
)
Time (hours)
Maize mealCitrus pulpMolassesControl
Figure 35 Gas production of ryegrass when supplemented with different energy sources
0
50
100
150
200
250
300
350
400
450
0 10 20 30 40 50 60 70 80
Gas
Pro
duct
ion
(mlg
OM
)
Time (hours)
Maize mealCitrus pulpMolassesControl
Figure 36 Gas production of kikuyu grass when supplemented with different energy sources
342 Gas production parameters including that of forage and energy sources in cases where no interaction was observed
In the cases where in vitro gas production parameters showed no interactions the main effects are
discussed Gas production values of the different forages (Models 1 amp 2) differed (P lt 005) from each other
38
independent of the energy source supplemented (Table 37) The NDF ADL and CP content of the forages
differed (Table 33) The differences in chemical and physical tissue structure probably influenced their
fermentation kinetic patterns (Figure 31) In Model 1 ryegrass resulted in higher gas productions than oat
hay wheat straw and lucerne but did not differ from kikuyu In Model 2 the same trend was seen for gas
production with kikuyu and ryegrass having higher values than lucerne oat hay and wheat straw The
reason for the higher gas production from ryegrass compared to lucerne wheat straw and oat hay are due to
the lower NDF and ADF contents of ryegrass resulting in higher gas production (Sallam 2005) Ryegrass
and kikuyu as mentioned before were harvested young compared to the other forages These pasture
grasses therefore had more rapidly fermentable sugar resulting in higher gas production values Ryegrass
and kikuyu are also high in CP (Table 33) which is essential for optimal rumen fermentation as it supplies
the rumen micro-organisms with nitrogen that is important for their growth Gas production rates differed for
among forages (P lt 005) irrespective of the energy source Ryegrass and lucerne had higher c values than
oat hay and wheat straw
Table 37 In vitro gas production parameters of forages as affected by energy sources as main effects in
cases where no interactions were observed Gas production of both energy sources and forage substrates
are included
Forage Item Lucerne
hay Oat hay Wheat
straw Ryegrass Kikuyu grass SEm P
Model 1
b 3381 ac 3438 ac 3205 a 4027 b 3909 bc 1457 lt0001
Model 2
b 3374 a 3431 a 3159 a 4016 b 4042 b 1439 lt0001
c 011 b 008 a 008 a 010 bc 009 ac 001 lt0001
b = Total gas production (mlg OM) c = gas production rate (mlh)
Model 1 Y = b + (1 ndash e-ct) Model 2 Y = b + (1 ndash e-c(t-L)) Superscripts are compared across rows
The total gas production values of forage substrates (Models 1 amp 2) differed (P lt 005) for each energy
source supplemented (Table 38) Maize meal and citrus pulp supplementations resulted in higher forage
gas production values than the control treatment (Model 1 amp 2) Maize meal tended to have higher gas
production than citrus pulp supporting the theory of Sallam (2005) that feedstuffs higher in NDF and ADF
content result in lower gas production Gas production rate (c) of the forages were all higher for the energy
source treatments than that of the control treatment (P lt 005) indicating the faster fermentation potential of
the energy sources The highest gas production rates were achieved when forages were supplemented with
citrus pulp and molasses irrespective of the forage substrate used Pectin substances other than starches
and sugars produce no lactic acid (Van Soest 1994) Pectin subsequently does not tend to lower the
rumen pH as much as sugars and starches thus sustaining optimal ruminal environments for cellulolytic
bacteria This could partly explain the better gas production rates of forages supplemented with citrus pulp
39
Table 38 In vitro gas production parameters of forages (irrespective of forage substrate used) as affected by
different energy sources as main effects in cases where no interactions were observed Gas production of
both energy sources and forage substrates are included
Energy source Item Maize meal Citrus pulp Molasses Control SEm P
Model 1
b 4079 b 3825 bc 3446 ac 3017 a 1303 lt0001
Model 2
b 4065 b 3821 bc 3446 ac 3085 a 1287 lt0001
c 009 b 011 c 011 c 006 a 000 lt0001
b = Total gas production (mlg OM) c = gas production rate (mlh)
Model 1 Y = b + (1 ndash e-ct) Model 2 Y = b + (1 ndash e-c(t-L)) Superscripts are compared across rows
343 Gas production excluding that from energy sources
Gas production values from the respective energy sources alone were obtained from separate fermentations
where forage substrates were omitted These values were subtracted from total gas production values
where forages and energy sources were incubated together to calculate the effect of energy sources on gas
production of the respective forage sources per se (Table 39)
When the maize meal gas production was deducted from the total gas production there was no difference
between the control and the maize meal supplemented treatments in any of the forages (Models 1 amp 2)
When molasses gas production was deducted from the total gas production however total gas production
from forages in the molasses supplemented treatments was lower than that of the control treatments in all
forage substrates irrespective of the model used In oat hay molasses lowered gas production more than in
any of the other treatments including the control treatment In oat hay and ryegrass (both models) and in
lucerne hay (Model 2) citrus pulp as energy source also decreased forage gas production compared to the
control treatment The lower gas production after energy sources gas production was deducted illustrate that
energy sources were the main reason for the higher gas production presented earlier in treatments with
forage and energy source combinations as substrates Gas production is negatively correlated with NDF
and ADL content (Sallam 2005) Energy sources had lower NDF and trace amounts of lignin content when
compared to forage substrates (Table 33) supporting the theory of higher gas production observed after
energy inclusions in the simulated dairy cow diets Energy sources per se thus seemed to increase the rate
of forage digestion but maintained or decreased the digestibility of forages Possible reasons for the lower
digestibility as determined by gas production can be because micro-organisms first attack the easily
fermentable energy sources before starting with fibre digestion
40
Deducting energy source gas production resulted in variable positive responses in terms of rate of gas
production from forage substrates In oat hay maize meal and citrus pulp treatments both improved c
compared to the control treatment (Models 1 amp 2) In kikuyu grass maize meal had a profound effect and
increased c when compared to the control treatment For the other forages (lucerne wheat straw and
ryegrass) deduction of the energy sources had no effect on fermentation rate
Deducting energy source gas production values indicated that treatment with energy sources affected the lag
phase differently for the different forages Lucerne hay oat hay and ryegrass had short lag phases which
were not affected by energy source Citrus pulp and maize meal however tended to increase the lag phase
of lucerne hay Similar results were obtained by Adesogan et al (2005) who found that maize and citrus
pulp resulted in a longer lag phase than hays (P lt 0001) The diet of the cows consisted predominantly of
oat hay lucerne hay and wheat straw The diet of donor cows thus had high proportions of cellulolytic micro-
organisms and less pectin-fermenting and amylolytic bacteria needed to colonize citrus pulp and maize meal
respectively explaining the longer lag phase of maize meal and citrus pulp (Adesogan et al 2005) Kikuyu
and wheat straw had long lag phases compared to the other forages All the energy sources significantly
shortened the lag phase of wheat straw and kikuyu
Table 39 Effects of maize meal citrus pulp and molasses as energy sources on fermentation kinetics of
different forage substrates as measured by in vitro gas production Gas production resulting from energy
sources was deducted from total gas production
Treatment
Item Maize meal Citrus pulp Molasses Control SEm P
Lucerne hay
Model 1
b 2293 ab 1974 ab 1789 b 2837 a 2063 0018
c 009 010 015 009 002 0103
Model 2
b 2192 ab 1959 b 1789 b 2836 a 1836 0008
c 012 011 015 009 002 0189
L 023 076 006 005 023 0166
Oat hay
Model 1
b 2842 ab 2367 b 1761 c 3283 a 1315 0001
c 008 b 010 b 004 a 004 a 001 0001
Model 2
b 2842 ab 2367 b 1761 c 3273 a 1317 0001
c 008 b 010 b 004 a 004 a 001 0001
L 000 000 000 017 007 0240
41
Table 39(continue) Effects of maize meal citrus pulp and molasses as energy sources on fermentation kinetics of different forage substrates as measured by in vitro gas production Gas production resulting from energy sources was deducted from total gas production
Wheat straw
Model 1
b 2108 ab 1903 ab 1510 b 2499 a 1657 0009
c 008 007 006 002 002 0110
Model 2
b 2108 ab 1903 ab 1510 b 2312 a 1559 0020
c 008 007 006 003 002 0168
L 000 b 000 b 000 b 229 a 036 0001
Ryegrass
Model 1
b 2845 ab 2429 b 2093 b 3995 a 291 0003
c 008 010 011 008 001 0324
Model 2
b 2835 ab 2419 b 2092 b 3983 a 2934 0004
c 009 010 011 009 001 0459
L 040 062 005 039 029 0588
Kikuyu grass
Model 1
b 2500 ab 2611 ab 2193 b 3349 a 2369 0028
c 012 b 010 ab 008 ab 005 a 001 0017
Model 2
b 2499 ab 2610 ab 2193 b 3243 a 2408 0050
c 012 b 010 ab 008 ab 005 a 002 0040
L 007 b 012 b 000 b 173 a 034 0009
b = Total gas production (mlg OM) c = gas production rate (mlh) L = Lag time (h)
Model 1 Y = b + (1 ndash e-ct) Model 2 Y = b + (1 ndash e-c(t-L)) Superscripts are compared across rows
Hiltner amp Dehority (1983) similarly found that the addition of soluble carbohydrates to in vitro incubations
decreased the lag time of fibre digestion They concluded that supplementation increased bacteria numbers
thus decreasing the lag phase by supporting fibre digestion They found similar results with increased
amounts of inoculum A possible reason for the long lag phase of kikuyu grass may be because it was
heavily fertilized with nitrogen Marais et al (1988) showed that nitrite derived from high nitrate pastures
resulted in reduced in vitro digestibility as it affected rumen microbial function The long lag phase of wheat
straw was probably due to the high NDF content which is slowly digested and the high ADL content which is
not digested by rumen micro-organisms The latter could also have an effect on the structure of the fibre
matrix making it more difficult for rumen organisms to reach the more digestible fibre fractions The short
lag phases of lucerne and oat hay could partially be explained by the fact that the cannulated cows received
diets containing these substrates but also because their chemical composition allows higher digestibility
compared to wheat straw In general it would appear that the supplementation of forages with various
42
energy sources had a negative effect on total gas production but increased the rate of gas production in
some instances
Profiles of forage fermentation after deduction of energy source values are illustrated in Figures 37 ndash 312
0
50
100
150
200
250
300
350
400
450
0 10 20 30 40 50 60 70 80
Gas
Pro
duct
ion
(mlg
OM
)
Time (hours)
Lucerne hayOat hayWheat strawRyegrassKikuyu grass
Figure 37 Gas production of forage substrates after gas production of energy sources has been deducted
Variations in fermentation patterns of different forages are illustrated in Figure 37 All the forages differed in
terms of gas production lag phase and gas production rate This is probably due to differences in their cell-
wall polysaccharide arrangements (Cheng et al 1984) as well as NDF ADL and CP composition (Table
33) It is clear that wheat straw has a much lower fermentability both in terms of total gas production and
rate of gas production than the other forages As forages mature their NDF and ADL contents increase
(McDonald et al 2002) Wheat straw had the highest NDF and ADL contents (Table 33) The NDF and
ADF contents of diets are negatively correlated with gas production (Sallam 2005) which would explain the
lower gas production of wheat straw in comparison with the other forages Wheat straw is also very low in
CP (Table 33) Crude protein provides rumen micro-organisms with nitrogen needed for optimal growth and
fermentation Ryegrass and kikuyu show a high rate and extent of gas production maybe due to the lower
NDF and ADL and higher CP contents as compared to wheat straw Although lucerne hay had a relatively
low NDF content its ADL content was quite high compared to kikuyu which had a higher NDF content but a
low ADL content resulting in the early cut grasses to manifest a much higher fermentability profile than the
other forages
43
0
50
100
150
200
250
300
350
400
450
0 10 20 30 40 50 60 70 80
Gas
Pro
duct
ion
(mlg
OM
)
Time (hours)
Maize meal
Citrus pulp
Molasses
Control
Figure 38 The net effect of energy supplements on gas production of lucerne hay
0
50
100
150
200
250
300
350
400
450
0 10 20 30 40 50 60 70 80
Gas
Pro
duct
ion
(mlg
OM
)
Time (hours)
Maize mealCitrus pulpMolassesControl
Figure 39 The net effect of energy supplements on gas production of oat hay
44
0
50
100
150
200
250
300
350
400
450
0 10 20 30 40 50 60 70 80
Gas
Pro
duct
ion
(mlg
OM
)
Time (hours)
Maize meal
Citrus pulpMolassesControl
Figure 310 The net effect of energy supplements on gas production of wheat straw
0
50
100
150
200
250
300
350
400
450
0 10 20 30 40 50 60 70 80
Gas
Pro
duct
ion
(mlg
OM
)
Time (hours)
Maize mealCitrus pulpMolassesControl
Figure 311 The net effect of energy supplements on gas production of ryegrass
45
0
50
100
150
200
250
300
350
400
450
0 10 20 30 40 50 60 70 80
Gas
Pro
duct
ion
(mlg
OM
)
Time (hours)
Maize mealCitrus pulpMolassesControl
Figure 312 The net effect of energy supplements on gas production of kikuyu grass
In many of these figures the control clearly did not reach a plateau in the 72 hour incubation period This
enforces the findings that the energy sources increased the rate of gas production especially during the
earlier parts of the incubation
344 Gas production parameters excluding that of energy sources in cases where no interaction was observed
The in vitro gas parameters that showed no interactions were interpreted in terms of main effects Gas
production values from the energy sources were deducted from the total gas production to derive forage gas
production values (Table 310) It can be seen that the gas production values of the forage substrates
differed (P lt 005) from each other independent of the deducted energy source (Models 1 amp 2) Gas
production resulting from wheat straw differed from ryegrass oat hay and kikuyu but not from lucerne (both
models) The higher gas production of ryegrass and kikuyu compared to wheat straw results from the
higher NDF and ADF contents of wheat straw which negatively affected its gas production (Sallam 2005)
Rate of gas production (c) also differed (P lt 005) between forages independent of energy source (Model 2)
Oat hay and wheat straw had lower c-values than ryegrass and lucerne but did not differ from kikuyu The
lower gas production rate of wheat straw and oat hay can be due to the maturity of these forages These
forages contain less readily fermentable substrates and more NDF and ADL compared to immature ryegrass
and kikuyu cut at 28 days of re-growth
46
Table 310 In vitro gas production parameters of forages as affected by energy sources as main effects in
cases where no interactions were observed Gas production resulting from energy sources was deducted
from total gas production
Forage
Item Lucerne hay Oat hay Wheat
straw Ryegrass Kikuyu grass
SEm P
Model 1
b 2223 ab 2563 bc 2005 a 2840 c 2663 c 1068 lt0001
Model 2
b 2194 ab 2561 bc 1959 a 2832 c 2636 c 1047 lt0001
c 012 b 007 a 006 a 010 b 009 ab 001 lt0001
b = Total gas production (mlg OM) c = gas production rate (mlh)
Model 1 Y = b + (1 ndash e-ct) Model 2 Y = b + (1 ndash e-c(t-L)) Superscripts are compared across rows
The effect of energy source treatment on forage fermentation is presented in Table 311 Energy sources
differed in terms of total gas produced by forages as a group It appeared that deduction of gas production
resulting from energy supplementation lowered total gas production of forages when either of the two models
was used Molasses resulted in the lowest total gas production from forages With Model 2 all the energy
sources increased the rate of fermentation of forage substrates but no differences occurred between energy
sources The increase in fermentation rates might suggest that energy supplementation does not
necessarily result in lower fibre digestion as observed by Mertens amp Loften (1980) by reducing their
fermentation rates (Miller amp Muntifering 1985) The increase in rate of gas production of forages after
energy sources substitution may be due to their higher nutrient content and easier accessibility of the energy
sources chemical constitutes to rumen microbial enzymes (Arigbede et al 2006)
Table 311 In vitro gas production parameters of forages (irrespective of forage substrate used) as affected
by different energy sources as main effects in cases where no interactions were observed Gas production
resulting from energy sources was deducted from total gas production
Energy source
Item Maize meal Citrus pulp Molasses Control SEm P
Model 1
b 2518 b 2257 b 1869 c 3193 a 955 lt0001
Model 2
b 2495 b 2251 b 1869 c 3130 a 937 lt0001
c 010 b 010 b 009 b 006 a 001 lt0001
b = Total gas production (mlg OM) c = gas production rate (mlh)
Model 1 Y = b + (1 ndash e-ct) Model 2 Y = b + (1 ndash e-c(t-L)) Superscripts are compared across rows
47
35 Conclusion
Forage diets alone do not provide in the high energy requirements of lactating cows Lactating cows
produce large quantities of milk which can only be maintained if forage diets are supplemented with
concentrates Supplementation of dairy cow diets with optimal amounts of energy substrates provide the
high producing dairy cow with energy needed to improve fibre digestibility and utilization Energy improves
the total digestibility of a diet when forages are supplemented with energy sources but decreases the
utilization of the forage component per se Possible reasons for the latter could be the structure of the fibre
matrix making it more difficult for rumen organisms to reach the more digestible fractions in forages thereby
digesting first the easily fermentable energy sources before attacking the more complex fibre fractions It
should be noted however that overfeeding of energy supplements increase the risks of acidosis due to the
production of large amounts of lactic acid subsequently lowering milk production and income
Looking at the individual forage fermentation kinetics irrespective of the energy source used it is evident
that the pasture grasses had higher total gas production values than the straw and hays This is most likely
because the pasture grasses were cut after only 28 days of re-growth whereas the hays and straw were
more mature and of lower quality especially the straw The pasture grasses thus had more readily
fermentable nutrients and less NDF and ADL than the hays and straw leading to higher gas production
values The fermentation rate of the forages supplemented with energy sources differed amongst each
other with lucerne and ryegrass having the fastest fermentation rates irrespective of the energy source
supplemented Gas production of forages supplemented with citrus pulp and maize meal were higher
compared to molasses Molasses produced a greater volume of gas during the first few hours of incubation
but it was also quickly depleted due to its high content of readily fermentable sugars These sugars are
highly soluble and rumen micro-organisms have easy access to induce fermentation The gas production
rate of forages supplemented with energy sources was higher than the control treatments (forages alone)
with molasses and citrus pulp resulting in the highest rates It thus seemed that supplementation of energy
sources improved forage fermentability as well as the rate of forage fermentation This could have major
implications in practice as there is a need to find ways of improving fibre utilization in South Africa
The effect of the energy sources on the fermentation kinetics of different forages per se showed a decrease
in gas production and lag phase but a tendency to raise gas production rate Molasses decreased gas
production the most throughout all the forage substrates A possible reason may be that the rumen micro-
organisms first digest the fast fermentable simple sugar substrates before starting with substrates that are
digested at a slower rate The raise in gas production rate and decrease in lag time may be due to a higher
number of rumen micro-organisms available to ferment the feed when energy sources were added to the
forage substrates thus supporting digestion
Little research has been done on this and related topics to quantify the relationship between different
carbohydrate sources and rumen metabolism parameters leaving room for improvement and further studies
More research is also needed with regard to inclusion levels of different energy sources in lactating cow diets
and the potential outcomes regarding milk production and rumen health
48
36 References
Adesogan T Krueger NK amp Kim SC 2005 A novel wireless automated system for measuring
fermentation gas production kinetics of feeds and its application to feed characterization Anim Feed
Sci Technol 123 - 124(1) 211 - 223
Aldrich JM Muller LD amp Varga GA 1993 Nonstructural carbohydrates and protein effects on rumen
fermentation nutrient flow and performance of dairy cows J Dairy Sci 76 1091 - 1105
Allen M amp Oba M 2000 Getting more milk from forages Michigan Dairy Review 5(4) Michigan State
University
Available at
httpwwwadmanicomalliancedairyTechBulletinsNon20Structural20Carbohydrate20Nutrition
htm
(Accessed 5 August 2008)
ANKOM 2005 Method for determining acid detergent lignin in beakers ANKOM Technology 0805
AOAC 1990 Official Methods of Analysis (15th Ed) Association of Official Analytical Chemists Inc
Arlington Virginia USA
AOAC 1995 Official Methods of Analysis (15th Ed) Association of Official Analytical Chemists Inc
Washington DC USA
Arigbede OM Anele UY Olanite JA Adekunle IO Jolaosho OA amp Onifade OS 2006 Seasonal in
vitro gas production parameters of three multi - purpose tree species in Abeokuta Nigeria Livestock
Res Rural Dev 18(10) Article 142
Available at httpwwwcipavorgcolrrdlrrd1810arig18142htm
(Accessed 14 October 2008)
Bampidis VA amp Robinson PH 2006 Citrus by-products as ruminant feeds A review Anim Feed Sci
Technol 128 175 - 217
Cheng KJ Stewart CS Dinsdale D amp Costeron JW 1984 Electron bacteria involved in the digestion
of plant cell walls Anim Feed Sci Technol 10 93 - 120
Chesson A amp Forsberg C W 1988 Polysaccharide degradation by rumen micro-organisms In The
Rumen Microbial Ecosystem Ed Hobson PN Elsevier Science Publishers Ltd London UK pp 251
- 284
49
Ghadaki MB Van Soest PJ McDowell RE amp Malekpour B 1975 Chemical composition and in vitro
digestibility of some range forage species of Iran In Proceedings of the sem Bamako 2 - 3 March
Bamako Mali
Available at httpwwwfaoorgwairdocsilrix5543bx5543b0zhtm
(Accessed 17 October 2008)
Giraldo LA Tejido ML Ranilla MJ amp Carro MD 2008 Effect of exogenous fibrolytic enzymes on in
vitro rumen fermentation of substrates with different forageconcentrate ratios Anim Feed Sci
Technol 141 306 - 325
Goosen L 2004 Effect of an exogenous fibrolytic enzyme on forage digestibility parameters MSc (Agric)
thesis Stellenbosch University Stellenbosch South Africa pp 1 - 91
Haddad SG amp Grant RJ 2000 Influence of nonfiber carbohydrate concentration on forage fiber digestion
in vitro Anim Feed Sci Technol 86 107 - 115
Hall MB 2002 Working with sugars (and molasses) In Proceedings of the 13th Annual Florida Ruminant
Nutrition Symp Jaunary 11 - 12 Gainesville Florida USA pp 146 - 158
Hiltner P amp Dehority A 1983 Effect of soluble carbohydrates on digestion of cellulose by pure
cultures of rumen bacteria Appl Environ Microbiol 46 542
Larson CC 2003 The effect of nonfibre carbohydrate source and protein degradability on lactation
performance of holstein cows MSc (Agric) thesis University of Florida Gainesville Florida USA pp
1 - 108
Leiva E Hall MB amp Van Horn HH 2000 Performance of dairy cattle fed citrus pulp or corn products as
sources of neutral detergent-soluble carbohydrates J Dairy Sci 83 2866 - 2875
Marais JP Therion JJ Mackie RI Kistner A amp Dennison C 1988 Effect of nitrate and its reduction
products on the growth and activity of the rumen microbial population Brit J Nutr 59 301 - 313
Mauricio RM Mould FL Dhanoa MS Owen E Channa KS amp Theodorou MK 1999 A semi-
automated in vitro gas production technique for ruminants feedstuff evaluation Anim Feed Sci
Technol 79 321 - 330
McDonald P Edwards RA Greenhalgh JFD amp Morgan CA 2002 Evaluation of food Digestibility In
Animal Nutrition (6th Ed) Pearson Education Ltd Edinburgh Gate Harlow Essex UK pp 246 - 263
Mertens DR 1997 Creating a system for meeting the fibre requirements of dairy cows J Dairy Sci 80
1463 - 1481
50
Mertens DR amp Loften JR 1980 The effect of starch on forage fiber digestion kinetics in vitro J Dairy Sci
63 1437 - 1446
Miller BG amp Muntifering RB 1985 Effect of forageconcentrate on kinetics of forage fiber digestion in
vitro J Dairy Sci 68 40 - 44
Mohney K 2002 Synchronization of carbohydrate and protein metabolism by ruminal microbes in
continuous culture PhD thesis North Carolina State University Raleigh North Carolina USA pp 1 -
69
National Research Council (NRC) 2001 Nutrient requirements of dairy cattle (7th Rev Ed) National
Academy Press Washington DC USA pp 34 - 35
Sallam SMA 2005 Nutritive value assessment of the alternative feed resources by gas production and
rumen fermentation in vitro Res J Agric amp Biol Sci 1(2) 200 - 209
Schwarz FJ Haffner J amp Krichgessner M 1995 Supplementation of zero-grazed dairy cows with
molassed sugar beet pulp maize or cereal-rich concentrate Anim Feed Sci Technol 54 237 - 248
Solomon R Chase LE Ben-Ghedalia D amp Bauman DE 2000 The effect of nonstructural carbohydrate
and addition of full fat soybeans on the concentration of conjugated linoleic acid in milk fat of dairy
cows J Dairy Sci 83 1322 - 1329
Sommart K Parker DS Wanapat M amp Rowlinson P 2000 Fermentation characteristics and microbial
protein synthesis in an in vitro system using cassava rice straw and dried ruzi grass as substrates
Asian-Aust J Anim Sci 13 1084 - 1093
Statistica 81 2008 StatSoft Inc USA
Van Soest PJ 1994 Nutritional ecology of the ruminant (2nd Ed) Cornell University Press Ithaca New
York USA pp 251 - 252
Van Soest PJ amp Robertson JB 1985 Analysis of forages and fibrous feeds A laboratory manual for
animal science 613 Cornell University Ithaca New York USA
Van Soest PJ Robertson JB amp Lewis BA 1991 Methods for dietary fibre neutral detergent fibre and
nonstarch polysaccharides in relation to animal nutrition J Dairy Sci 74 3583 - 3587
Oslashrskov ER amp McDonald P 1979 The estimation of protein degradability in the rumen from incubation
measurements weighed according to rate of passage J Agric Sci 92 499 - 503
51
Chapter 4
THE EFFECT OF SUGAR STARCH AND PECTIN AS MICROBIAL
ENERGY SOURCES ON IN VITRO NEUTRAL DETERGENT FIBRE
AND DRY MATTER DEGRADABILITY OF FORAGES
Abstract
The study evaluated the effect of sugar (molasses and sucrose) starch (maize meal and maize starch) and
pectin (citrus pulp and citrus pectin) on neutral detergent fibre (NDF) and dry matter (DM) degradability of
forages Forage substrates used included wheat straw (WS) oat hay (OH) lucerne hay (LUC) ryegrass
(RYE) and kikuyu grass (KIK) Rumen fluid was collected from two lactating Holstein cows receiving a diet
consisting of oat hay lucerne wheat straw and a concentrate mix In vitro degradability was done with an
ANKOM Daisy II incubator and forage substrates were incubated with or without the respective energy
sources for 24 48 and 72 hours The substrates were incubated in 1076 ml buffered medium 54 ml of
reducing solution and 270 ml rumen fluid The residues were washed dried and analyzed for NDF In the
trial with the applied energy sources (molasses maize meal and citrus pulp) there was forage x energy
source interactions Supplementation with the applied energy sources all improved DMD of forages (24 amp 72
hours) when compared to the control treatment except for RYE supplemented with maize meal and citrus
pulp at 24 hours Molasses had the biggest effect on DMD in all forage substrates Supplementation with
maize meal had no effect on neutral detergent fibre degradability (NDFD) of any forage substrate except for
an improvement in NDFD of LUC at 72 hours Molasses improved NDFD of LUC at 24 hours but had no
effect on the other forage substrates Citrus pulp improved NDFD of OH (72 hours) as well as LUC and WS
(24 amp 72 hours) It is postulated that the NDF of the energy sources was more digestible than that of the
respective forages and that the improved NDFD values could be ascribed to the contribution of the energy
source NDFD Overall pasture grasses had a higher NDFD than the hays and straw and appear to be more
readily fermentable by rumen micro-organisms than the low quality hays and straw explaining the higher
NDFD In the trial involving the purified energy sources (sucrose maize starch and citrus pectin) forage x
energy source interactions were observed In general supplementation with these energy sources improved
DMD at 24 and 72 hours except for RYE and KIK (72 hours) Pasture grasses (RYE amp KIK) had a higher
NDFD than LUC OH and WS At 72 hours NDFD was 371 for LUC 425 for OH and 403 for WS
compared to 705 for KIK and 649 for RYE A possible explanation is that KIK and RYE samples came
from freshly cut material harvested after a 28d re-growth period In general sucrose (24 amp 72 hours) and
citrus pectin (72 hours) had no effect on NDFD of forage substrates Supplementing oat hay (24 hours) with
starch and citrus pectin and wheat straw (24 amp 72 hours) with starch however lowered NDFD (P lt 005)
when compared to the control treatment It is hypothesized that micro-organisms fermented the easily
fermentable energy sources first before attacking forage NDF The study suggested that forage NDFD
values are not fixed and may be altered by type of energy supplementation
52
41 Introduction
The production potential of ruminants is determined to a great extent by the availability and quality of
forages Lactating dairy cows depend significantly on forages to maintain optimal fermentation rumen
function and high production However the ability of rumen micro-organisms to degrade forages is restricted
by the chemical composition and physical quality of the forage (Mertens 1997) Forages alone also do not
provide all the energy requirements of a high producing dairy cow (Schwarz et al 1995) Supplementing
dairy cow diets with energy-rich feeds provide high yielding dairy cows with the energy needed to improve
efficiency of production and performance (Henning 2004) The most important source of energy and largest
nutrient component for rumen micro-organisms is carbohydrates (especially non-fibre carbohydrates or
NFC)
It is important to try and find ways to improve forage degradation Improvement of forage utilization and
degradation will aid in animal performance (Giraldo et al 2008) Forage based diets supplemented with NFC
(sugar starch or pectin) result in variation of performance measurements such as milk yield milk
composition dry matter intake (DMI) and feed efficiency (Larson 2003) Miron et al (2002) reported that
cows receiving total mixed rations (TMR) with a high percentage of citrus pulp had higher NDF and NSC
digestibilities compared to cows that received TMR with a high percentage of corn Leiva et al (2000)
reported that the rumen pH declined more rapidly on citrus diets (pectin) than on hominy (starch) diets and
also reached the lowest pH point faster Knowledge of the individual (as well as a combination of NFC)
fermentation characteristics can thus be helpful in predicting an animalrsquos performance due to NFC
supplementation (Holtshausen 2004)
The objectives of this study were to determine the impact of three applied energy sources viz maize meal
molasses syrup and citrus pulp and three purified energy sources viz maize starch sucrose and citrus
pectin on dry matter (DM) and neutral detergent fibre (NDF) digestibility of different forage substrates
Forages commonly used in dairy cow diets (wheat straw oat hay lucerne hay kikuyu grass and ryegrass)
were used
42 Materials and methods
421 Study area
The study to evaluate the effect of supplementing forage based diets with sugar starch and pectin on DM
and NDF degradability was conducted at the Stellenbosch University Stellenbosch South Africa
(33deg 55prime 12Prime S 18deg 51prime 36Prime E)
53
422 Simulated diets
4221 Basal forages
Five forages (Table 41) were used to prepare rations to simulate diets for lactating dairy cows
Table 41 Forages used in simulation diets for lactating dairy cows
Forage Type Acronym
Wheat straw (Triticum aestivum ) WS
Oat hay (Avena sativa) OH
Lucerne hay (Medicago sativa) LUC
Ryegrass (Lolium multiflorum ) RYE
Kikuyu grass (Pennisetum clandestinum) KIK
Rye and kikuyu grasses were harvested after four weeks of re-growth All the forages were oven dried at
60ordmC for 72 hours Wheat straw oat hay and lucerne hay were ground (cyclotec 1093 mill) through a 2 mm
screen Rye and kikuyu grasses were obtained from Outeniqua experimental farm (33deg 57prime 0Prime S
22deg 25prime 0Prime E) just outside George South Africa (33deg 58prime 0Prime S 22deg 27prime 0Prime E) The rye and kikuyu grasses were
already ground through a 1 mm screen when received
4222 Energy supplements
Three energy sources (Table 42) were selected as supplements to prepare rations that would simulate
lactating dairy cow diets
Table 42 Applied energy sources used in simulating the dairy cow diets
Energy type Source Acronym
Starch Yellow maize (Zea mays) meal Mm
Sugar Molasses syrup Mol
Pectin Citrus pulp Cp
These energy feedstuffs were sourced in the following forms molasses as a syrup by-product from the
processing of sugar cane (Officinarum saccharum) citrus pulp as a finely granulated residue by-product from
the peel pulp and seeds of oranges and grapefruit and yellow maize grain The citrus pulp and maize were
ground (cyclotec 1093 mill) through a 1 mm screen
Three purified energy sources (Table 43) were selected as supplements to prepare rations that would
simulate lactating cow diets
54
Table 43 Purified energy sources used in simulating the dairy cow diets
Energy type Source Acronym
Starch Maize starch Maiz
Sugar Sucrose Suc
Pectin Citrus pectin Pec
4223 Defining the diets
A total of 43 simulated diets were prepared
bull 5 diets contained forage substrates only (Table 41)
bull 3 diets contained applied energy sources only (Table 42)
bull 15 diets contained a mixture of forages and applied energy sources
bull 5 diets contained forage substrates only (Table 41)
bull 15 diets contained a mixture of forages and purified energy sources
The final substrate compositions are indicated in Tables 45 and 46
423 Chemical analyses of forages and energy sources
About 1 g of each forage type as well as 1 g of the energy sources were weighed and placed in a 100ordmC
conventional oven for 24 hours to determine DM content (AOAC 1995 Method 93015) Organic matter
(OM) was determined by weighing 1 g of each type of feedstuff used into crucibles and ashing the content at
500ordmC in a muffle furnace for 6 hours (AOAC 1995 Method 94205)
The NDF component was determined by measuring 05 g of each feedstuff into F57 ANKOM fibre analysis
bags The bags were heat sealed and NDF determined using the method of Van Soest et al (1991)
Sodium sulfite (Na2SO3) was added to the NDF solution during digestion and heat-stable amylase was
added during rinsing Ether extract was determined using the AOAC method (AOAC 1995 Method 92039) About 2 g of ground sample was weighed into a thimble The samples were then extracted with diethyl ether
(C4H10O)
Acid detergent lignin (ADL) was determined by measuring 05 g of each basal forage and 05 g of maize
meal and citrus pulp into separate F57 ANKOM fibre analysis bags The bags were heat sealed and acid
detergent fibre (ADF) was determined using the method of Van Soest et al (1991) The ADF residue was
then soaked in 72 sulphuric acid for three hours to dissolve the cellulose Acid detergent lignin was
determined using the ANKOM method (ANKOM 2005)
55
Total nitrogen content was determined with a Leco Nitrogen Gas Analyzer custom designed and built by
LECO Africa (Pty) Ltd (Kempton Park) About 01 g of sample was weighed into a small piece of aluminum
foil The samples were then ignited inside the Leco furnace at about 900degC using the Dumas procedure
(AOAC 1990 Method 96806) Crude protein (CP) was calculated by multiplying nitrogen content with 625
(AOAC 1995 Method 99003)
Table 44 Chemical composition (gkg DM plusmn SD) of forages and energy sources used in the trial All values
are on a DM basis
Sources DM OM NDF CP EE ADL
WS 9150plusmn05 9022plusmn16 8179plusmn71 723plusmn10 36plusmn05 1022plusmn30
OH 8504plusmn23 9403plusmn173 7819plusmn110 910plusmn12 97plusmn08 825plusmn03
LUC 8989plusmn20 9062plusmn18 5153plusmn10 2370plusmn46 81plusmn06 927plusmn67
RYE 938plusmn10 845plusmn05 4892plusmn30 2509plusmn27 431plusmn01 448plusmn181
KIK 1242plusmn104 1122plusmn01 6512plusmn20 2534plusmn41 283plusmn11 480plusmn17
mm 8559plusmn09 9844plusmn13 1743plusmn550 1071plusmn02 377plusmn04 70plusmn06
cp 8799plusmn09 9285plusmn07 2614plusmn140 786plusmn18 164plusmn04 253plusmn64
mol 6980plusmn19 8927plusmn06 ND ND ND ND
DM = dry matter OM = organic matter NDF = neutral detergent fibre CP = crude protein EE = ether
extract ADL = acid detergent lignin ND = not determined WS = wheat straw OH = oat hay LUC = lucerne
RYE = ryegrass KIK = kikuyu grass mm = maize meal cp = citrus pulp mol = molasses
Purified energy sources were 99 pure based on manufacturers analyses
424 Sample preparation
Small fibre analysis bags were used (F57 ANKOM Technology) The bags were pre-rinsed in acetone for
five minutes air dried and placed in a conventional oven at 100ordmC for three to four hours The diets were
constituted as shown in Tables 45 46 and 47 The total amount of substrate was based on a forage to
concentrate ratio of 5050 The substrate amount of the energy sources in Table 45 was calculated to
provide the same amount of metabolizable energy (ME) contained in 025 g DM of yellow maize meal For
calculation purposes the ME values were assumed to be 139 MJkg DM for maize 123 MJkg for molasses
and 122 MJkg for citrus pulp (NRC 2001)
56
Table 45 Substrate samples containing either forage or applied energy supplements
Forage type Energy source Forage (g DM) Energy (g DM)
Wheat straw - 0250 -
Oat hay - 0250 -
Lucerne hay - 0250 -
Ryegrass - 0250 -
Kikuyu grass - 0250 -
- Maize meal - 0250
- Citrus pulp - 0285
- Molasses - 0282
The amount of energy sources used in the composite substrates (Table 46) was calculated to provide the
same amount of ME contained in 0125 g DM of yellow maize meal (139 MJMEkg)
Table 46 Composite diets containing forage and applied energy sources
Forage type Energy source Forage (g DM) Energy (g DM)
Wheat straw Maize meal 01250 01250
Wheat straw Citrus pulp 01250 01425
Wheat straw Molasses 01250
01412
Oat hay Maize meal 01250 01250
Oat hay Citrus pulp 01250 01425
Oat hay Molasses 01250
01412
Lucerne hay Maize meal 01250 01250
Lucerne hay Citrus pulp 01250 01425
Lucerne hay Molasses 01250
01412
Ryegrass Maize meal 01250 01250
Ryegrass Citrus pulp 01250 01425
Ryegrass Molasses 01250
01412
Kikuyu grass Maize meal 01250 01250
Kikuyu grass Citrus pulp 01250 01425
Kikuyu grass Molasses 01250 01412
The amount of purified energy sources (Table 47) was based on suggestions by Holtshausen (2004) who
used starch pectin and sucrose at hexose equivalent amounts of 40 80 or 120 mg per 120 mg purified NDF
in in vitro incubations
57
Table 47 Diets containing forages alone or a mixture of forages and purified energy sources Amounts are
on an air dry basis
Forage type Energy source Forage (g) Energy (g)
Wheat straw - 0500 -
Oat hay - 0500 -
Lucerne hay - 0500 -
Ryegrass - 0500 -
Kikuyu grass - 0500
-
Wheat straw Maize starch 0500 0163
Wheat straw Citrus pectin 0500 0192
Wheat straw Sucrose 0500
0137
Oat hay Maize starch 0500 0152
Oat hay Citrus pectin 0500 0178
Oat hay Sucrose 0500
0127
Lucerne hay Maize starch 0500 0160
Lucerne hay Citrus pectin 0500 0189
Lucerne hay Sucrose 0500
0135
Ryegrass Maize starch 0500 0162
Ryegrass Citrus pectin 0500 0191
Ryegrass Sucrose 0500
0137
Kikuyu grass Maize starch 0500 0161
Kikuyu grass Citrus pectin 0500 0190
Kikuyu grass Sucrose 0500 0136
In the current study a hexose equivalent amount of 40 mg of each energy source per 120 mg of forage
substrate was used Since 500 mg (air dry) of each forage substrate was weighed out into the incubation
bags in the current study the hexose equivalent of the energy sources amounted to 167 mg DM
To calculate the actual amount of energy source DM the following conversion coefficients were used (based
on Holtshausen 2004)
bull 090 for maize starch
bull 114 for citrus pectin
bull 095 for sucrose
58
The DM content of the energy sources were taken into account when calculating the air dry amounts that
were finally weighed out into the bags (Table 47)
Blank bags were included to correct for residues from rumen fluid alone All bags were heat-sealed using an
impulse sealer after sample preparation
425 Preparation of in vitro medium and reducing solution
The incubation medium was prepared as described by Van Soest amp Robertson (1985) The medium
consisted of micro minerals macro-mineral solution buffer solution tryptose rezasurin and distilled water
The medium was kept in a water bath at 395ordmC The pH of the medium was about 78 Reducing solution
was prepared as described by Van Soest amp Robertson (1985) and consisted of cysteine hydrochloride
(C3H7NO2HCL) potassium hydroxide (KOH) pellets sodium sulfide nonahydrate (Na2S9H2O) and distilled
water
426 Collection and preparation of rumen fluid Rumen fluid was collected from two ruminally cannulated lactating dairy cows The cows were confined and
fed 25 kg (as is) of a diet (125 kg in the mornings and 125 kg in the evenings) consisting of oat hay lucerne
hay wheat straw and a concentrate mix Rumen fluid was squeezed through two layers of cheesecloth into
pre-warmed flasks and a small amount of coarse material was added The rumen fluid was then blended in
a pre-warmed blender at a low speed for 10 seconds The rumen fluid was then filtered through four layers
of cheesecloth into pre-warmed flasks while flushing with carbon dioxide (CO2) The temperature of the
rumen fluid averaged 38ordmC and the pH averaged 58
427 In vitro incubation
The in vitro procedure for the ANKOM Daisy incubations required four glass vessels (2 L) and is based on
the method described by Goering amp Van Soest (1970) The glass vessels were flushed with CO2 while
adding 1076 ml of incubation medium and 54 ml of reducing solution to each vessel The vessels were
closed and placed in the incubator at 395ordmC until the medium was clear The vessels were opened and
flushed with CO2 while adding 270 ml of rumen fluid and bags to the vessels Incubation periods were 24
and 72 hours At each time interval one vessel was removed and the residue bags washed with water air-
dried and then placed in a conventional oven at 100ordmC for 24 hours
59
428 Residue analysis
The NDF content of the residues in the bags was determined using an ANKOM fibre machine (ANKOM220
fibre analyzer) and was based on the method of Van Soest et al (1991) Sodium sulfite (20 g) was added to
19 L of NDF solution during digestion and heat-stable amylase (4 ml x 2 rinse) was added during rinsing
Before using the bags they were rinsed in acetone for three to five minutes and then air-dried before being
placed in a forced draft oven at 100ordmC for 24 hours After the NDF procedure the bags were dried weighed
and subsequently ashed in a muffle furnace at 500ordmC for 6 hours
429 Estimating dry matter degradability
The estimation of DM degradability of the substrates was based on DM disappearance and calculated in
Excel using the following equation (Van Soest et al 1991)
( )[ ] 1001002
113 timestimesminus
minus=W
CWWDMD Equation 5
Where DMD = Apparent DM degradability ()
W1 = Bag weight (mg)
W2 = Sample weight (mg DM)
W3 = Weight of dried bag and residue after incubation (mg DM)
C1 = Blank bag correction factor
4210 Estimating neutral detergent fibre degradability
The estimation of NDF degradability of the substrates was based on NDF disappearance and was
calculated in Excel using the following equation (Van Soest et al 1991)
( )[ ]100100
2
113 timestimesminus
minus=W
CWWNDF Equation 6
60
Where NDF = Apparent NDF degradability ()
W1 = Bag weight (mg)
W2 = Sample weight (mg NDF in DM)
W3 = Dried weight of bag with residue after incubation (mg NDF in DM)
C1 = Blank bag correction factor
43 Statistical analyses
The in vitro digestibility experiment was a three way cross classification and the data was subjected to a
factorial ANOVA with the three factors being forage energy and time using Statistica 81 (2008) This was
done for all the non-linear parameters Significant forage x energy interactions were observed for the non-
linear parameters Therefore a one-way ANOVA was done on each of the forages to determine the effect of
the energy sources Differences between means were determined using a Tukey test Significance was
declared at P lt 005
44 Results and discussion
441 Effect of maize meal citrus pulp and molasses on apparent in vitro dry matter degradability
Results of the in vitro dry matter degradability (DMD) trial are presented in Table 48 Unsupplemented
forage values clearly indicate that ryegrass and kikuyu are more digestible than lucerne hay oat hay and
wheat straw This can be attributed to the fact that pasture grasses were cut after only 28 days of re-growth
thus having more digestible nutrients compared to lucerne and oat hay which were harvested at the 10
flowering stage and wheat straw at maturity With maturity the NDF and ADL contents increase (Table 44)
and DMD decreases (Canbolat et al 2006) When forage substrates were supplemented with applied
energy sources a forage x energy source interaction was observed When maize meal citrus pulp and
molasses replaced 50 of the forage substrates DMD was increased (P lt 001) in all forage substrates
(after 24 and 72 hours of incubation) with molasses having the biggest effect throughout It should be kept
in mind that the energy sources as such were all more degradable than the forages and therefore it could be
expected that a 50 replacement of forages with energy sources would increase total substrate DMD The
increase in DMD of forage substrates could thus be due to increased stimulation of rumen micro-organisms
in response to the readily available energy supplied by energy sources
61
Table 48 Effects of maize meal citrus pulp and molasses as energy sources on in vitro dry matter
degradability (DMD) parameters of different forage substrates
Treatment
Item Maize meal Citrus pulp Molasses Control
SEm
P
Lucerne hay
DMD 24h 707 b 731 b 832 c 565 a 159 lt0001
DMD 72h 829 b 825 b 858 c 690 a 044 lt0001
Oat hay
DMD 24h 637 b 676 bc 739 c 442 a 153 lt0001
DMD 72h 773 b 788 bc 820 c 588 a 080 lt0001
Wheat straw
DMD 24h 602 b 627 b 710 c 383 a 092 lt0001
DMD 72h 721 b 744 bc 778 c 510 a 089 lt0001
Ryegrass
DMD 24h 796 a 835 ab 901 b 760 a 212 0003
DMD 72h 926 b 934 b 964 b 877 a 095 lt0001
Kikuyu grass
DMD 24h 802 b 806 b 886 c 695 a 188 lt0001
DMD 72h 915 b 923 b 953 b 867 a 098 lt0001
Superscripts are compared across rows
The biggest effect of energy supplementation occurred with wheat straw as also reported in the gas
production experiments (Chapter 3) Wheat straw was high in NDF and ADL (Table 44) Neutral detergent
fibre is slowly degraded by rumen micro-organisms whereas ADL are not degraded by rumen micro-
organisms explaining the lower DMD of wheat straw when compared to the other forages Supplementing
readily available energy sources would therefore have a greater impact on DMD of wheat straw compared to
other forages Molasses had the highest impact on wheat straw DMD during the early phases of incubation
(24 hours) but after 72 hours the effect of molasses and citrus pulp was similar
In lucerne hay molasses had the highest impact on DMD at 24 and 72 hours incubation but citrus pulp and
maize meal also improved DMD significantly In oat hay maize meal citrus pulp and molasses improved
DMD at 24 and 72 hours incubation with molasses also having the most noticeable effect (P lt 001) Fall et
al (1998) also found improvements in DMD of straws supplemented with molasses In contrast to results
obtained in this study Williams et al (1953) found that addition of starch to oat hay diets of sheep decreased
DMD by one to two percentage units Burroughs et al (1949) observed a 5 ndash 12 reduction in lucerne hay
DMD when the diet was supplemented with 60 starch Mould amp Orskov (1983) however concluded that
62
the decrease in DMD of hays are mainly due to reduced rumen pH and not directly related to starch
digestion Abrupt changes in cattle diets (forage to concentrate diets) decrease rumen pH resulting in an
overgrowth of starch fermenting bacteria which causes acute acidosis with devastating effects on production
(Owens et al 1998) Cellulolytic bacteria are also inhibited at low rumen pH values decreasing fibre
digestion (Russel amp Wilson 1996)
In ryegrass molasses was the only energy source that improved DMD after 24 hours incubation Simeone
et al (2004) found similar results and reported that neither ground nor whole maize meal had an effect on
ryegrass DMD Ryegrass and kikuyu are highly fermentable forages as was also observed in terms of total
gas production and rate of gas production (Chapter 3) Molasses which is also rapidly fermentable had the
largest influence on DMD of pasture grasses at 24 hours probably because of its high fermentation rates
(Chapter 3) and because it is free of NDF and does not have trace amounts of lignin (Table 44) Overall
however all the energy sources improved DMD of ryegrass and kikuyu to the same extent at 72 hours
442 Effect of maize meal citrus pulp and molasses on apparent in vitro neutral detergent fibre degradability
The effects of sugar (molasses) starch (maize meal) and pectin (citrus pulp) on in vitro apparent NDF
degradability (NDFD) of different forages and forage-energy source combinations are shown in Table 49
Unsupplemented pasture grasses harvested at 28 days of re-growth had a higher NDFD than the mature
forages The NDFD of mature forages ranged between 197 and 284 which is too low to sustain
production and hence the need for energy supplementation Ryegrass and kikuyu was lower in NDF and
ADL (Table 44) and had greater gas production volumes (above 320 mlg OM Chapter 3) compared to the
other forages (ranging between 229 and 297 mlg OM) A negative correlation between ADL content and
NDFD of forage substrates have been reported by Smith et al (1972) and Tomlin et al (1964)
When forage substrates were supplemented with applied energy sources a forage x energy source
interaction was observed When energy sources replaced 50 of the forage substrates 24 hours NDFD of
lucerne hay was significantly increased by citrus pulp and molasses Hall (2002a) however postulated that
molasses decreases fibre digestion when fed in large quantities After 72 hours both maize meal and citrus
pulp resulted in increased NDFD Contrary to this observation Mertens amp Loften (1980) reported that starch
decreased the potential extent of fibre digestion These results (Mertens amp Loften 1980) however confirm
our findings obtained in the gas production experiments (Chapter 3) namely that maize meal tended to
increase the lag time of lucerne hay The lack of response of molasses at 72 hours could be due to its rapid
fermentation rate (Chapter 3) and also to the fact that molasses does not have any NDF (Table 44) that
could contribute to NDFD Maize meal and especially citrus pulp however contain some NDF that is readily
digestible
63
Table 49 Effects of maize meal citrus pulp and molasses as energy sources on in vitro neutral detergent
fibre degradability (NDFD) parameters when incubated in combination with different forage substrates
Treatment
Item Maize meal Citrus pulp Molasses Control
SEm
P
Lucerne hay
NDFD 24h 230 ab 296 b 300 b 197 a 219 0014
NDFD 72h 503 b 541 b 414 a 403 a 126 lt0001
Oat hay
NDFD 24h 300 356 289 284 222 0138
NDFD 72h 522 ab 579 b 509 a 472 a 139 lt0001
Wheat straw
NDFD 24h 196 a 285 b 249 ab 247 ab 171 0024
NDFD 72h 437 a 509 b 421 a 403 a 163 0003
Ryegrass
NDFD 24h 522 599 571 501 249 0059
NDFD 72h 775 822 843 748 242 0063
Kikuyu grass
NDFD 24h 516 561 624 530 424 0326
NDFD 72h 794 826 837 795 205 0368
Superscripts are compared across rows
Apparent NDFD of oat hay was not affected by energy source after 24 hours incubation but with citrus pulp
longer incubations (72 hours) resulted in higher NDFD (P lt 001) probably due to a relative high digestibility
of citrus pulp NDF Miron et al (2002) obtained similar positive results on NDFD of forages when maize or
barley was replaced with citrus pulp Voelker amp Allen (2003) proposed that the optimal rate and extent of
NDFD of high concentrate diets can be achieved by using dried beet pulp instead of high moisture corn
Heldt et al (1999) found that supplementing low-quality tallgrass-prairie hay with degradable intake protein
and NFC increased the total tract NDFD but supplementation with NFC alone decreased NDFD
Citrus pulp was the only energy source that consistently improved apparent NDFD when incubated in
combination with the hays and straw Citrus pulp had significant positive effects on NDFD of these forages
probably because mature forages are slowly degradable and citrus pulp supplementation thus provided high
amounts of digestable fibre at both 24 hours and 72 hours incubations The degradation rate of citrus pulp
possibly synchronizes the release of nutrients with the requirements of fibrolytic bacteria Increased NDFD is
important as it increases the supply of energy and support microbial N production (Allen amp Oba 2000)
64
resulting in higher milk production and reduced rumen fill in lactating dairy cows (Dado amp Allen 1995)
Bampidis amp Robinson (2006) stated that citrus pulp might be a good supplement to dairy cow diets as it
improves NDFD and has less negative effects on rumen pH and cellulolytic activities compared to sugar and
starch
Energy sources had no effect on apparent NDFD of kikuyu and ryegrass possibly because these pasture
grasses was immature and thus high in soluble readily available energy In the gas production experiments
(Chapter 3) these pasture grasses also had higher gas production volumes than the mature forages It
would thus appear given the high nutrient content in these forages that energy supplementation would have
minimal effects on NDFD
None of the energy source and forage combinations had lower NDFD values than the forages alone
contrary to Sanson et al (1990) who reported that the supplementation of low-quality forages with rapidly
degradable NFC depressed NDFD Grant amp Mertens (1992) suggested that acidification of the rumen due
to fast ruminal NFC fermentation is a prime factor responsible for depression in fibre digestion
443 Effect of maize starch citrus pectin and sucrose on apparent in vitro dry matter degradability
The effect of purified energy sources viz sugar (sucrose) starch (maize starch) and pectin (citrus pectin) on
in vitro apparent DMD of different forages are shown in Table 410 When forage substrates were
supplemented with purified energy sources a forage x energy source interaction was observed In lucerne
hay only pectin resulted in an improved DMD (both at 24 hours and 72 hours) while in oat hay all the
energy sources improved DMD at both incubation times Carey et al (1993) reported similar improvements
in DMD of brome hay (in situ) when it was supplemented with maize and beet pulp In contrast Burroughs et
al (1949) reported that DMD of lucerne was reduced when forages were supplemented with 20 and 40
starch In wheat straw all the energy sources improved DMD but at 24 hours pectin and sucrose had a
bigger effect than starch Pectin and sucrose are more fermentable than starch hence the more visible
effect on DMD of slow degradable wheat straw forages At 72 hours pectin also improved DMD more than
starch
Ryegrass and kikuyu had high DMD values without supplementation The higher DMD of pasture grasses
was most likely because they were immature at harvesting whereas lucerne and oat hay were cut at the
10 flowering stage and wheat straw was harvested at maturity Immature pasture grasses were thus
higher in fast fermentable sugars and lower in NDF and ADL (Table 44) improving DMD and gas production
volumes (Chapter 3) Only sucrose was sufficient in improving DMD in these grasses and then only at 24
hours due to their very high fermentability The absence of a sucrose effect at 72 hours was probably
because sucrose was depleted before 72 hours as it is rapidly fermented in the early hours of incubation
Purified energy sources are all more degradable than forages and therefore it could be expected that
inclusion of these energy sources in forage diets will increase DMD In general purified energy sources
resulted in lower DMD when compared to the applied energy sources (Table 48) We can postulate that
65
there was a rapid decline in rumen pH with purified energy source supplementation (as these energy sources
has no NDF) resulting in higher lactic acid production and slower microbial growth hence the lower DMD
Table 410 Effects of maize starch citrus pectin and sucrose as energy sources on in vitro dry matter
degradability (DMD) parameters of different forage substrates
Treatment
Item Maize starch Citrus pectin Sucrose Control
SEm
P
Lucerne hay
DMD 24h 642 ab 687 b 660 ab 593 a 182 0021
DMD 72h 745 ab 773 b 746 ab 673 a 203 0025
Oat hay
DMD 24h 476 b 512 b 504 b 377 a 096 lt0001
DMD 72h 638 b 658 b 644 b 552 a 116 lt0001
Wheat straw
DMD 24h 449 b 508 c 520 c 348 a 080 lt0001
DMD 72h 591 b 643 c 617 bc 510 a 094 lt0001
Ryegrass
DMD 24h 769 ab 768 ab 771 b 708 a 147 0026
DMD 72h 884 862 875 847 185 0548
Kikuyu grass
DMD 24h 681 ab 684 ab 709 b 634 a 150 0027
DMD 72h 859 826 843 808 213 0408
Superscripts are compared across rows
444 Effect of maize starch citrus pectin and sucrose on apparent in vitro neutral detergent fibre degradability
Purified energy source supplementation on in vitro apparent NDFD of the different forage substrates are
illustrated in Table 411 As was the case with DMD an energy source x forage interaction was observed for
NDFD Purified energy sources have negligible amounts of NDF thus the NDFD was solely from forages
In the control diets it is evident that the immature pasture grasses had the highest NDFD probably as they
are low in NDF and ADL (Table 44)
With lucerne hay energy supplementation had no significant effect on NDFD while in oat hay starch and
pectin supplementation suppressed NDFD but only at 24 hours incubation (P = 0011) Sucrose had no
66
effect on NDFD of oat hay at 24 hours Hall (2002a) proposed that in general sucrose tends to decrease
fibre digestion when fed in large quantities probably due to its lowering effect on rumen pH Heldt et al
(1999) reported that NFC supplementation to low-quality tallgrass-prairie decrease NDFD agreeing with our
results
Table 411 Effects of maize starch citrus pectin and sucrose as energy sources on in vitro neutral
detergent fibre degradability (NDFD) parameters of different forage substrates
Treatment
Item Maize starch Citrus pectin Sucrose Control
SEm
P
Lucerne hay NDFD 24h 123 197 178 179 277 0305
NDFD 72h 353 319 366 371 218 0364
Oat hay
NDFD 24h 131 b 137 b 174 ab 202 a 138 0011
NDFD 72h 389 395 406 425 201 0608
Wheat straw
NDFD 24h 116 b 171 a 239 c 205 ac 126 lt0001
NDFD 72h 343 b 402 a 393 a 403 a 140 0032
Ryegrass
NDFD 24h 419 401 392 403 186 0781
NDFD 72h 687 a 556 b 620 ab 649 ab 236 0013
Kikuyu grass
NDFD 24h 353 329 419 437 293 0068
NDFD 72h 714 a 573 b 687 ab 705 ab 324 0033
Superscripts are compared across rows
Sucrose had no effect on NDFD of wheat straw while pectin had a negative effect and starch severely
suppressed NDFD at both incubation times (P lt 005) The severe suppression in NDFD after
supplementation of maize starch can result from the negative effect that starch has on rumen pH Sucrose
and starch ferment rapidly producing lactic acid a product that lowers rumen pH whereas pectin does not
produce lactic acid (Hall 2002b) Starch has shown to decrease rumen pH and affect cellulolytic activity in
the rumen thereby lowering fibre digestion and increasing the risks of acidosis (Mertens amp Loften 1980)
Heldt et al (1999) reported similar results and found that starch decreased fibre digestion more than sugar
This is also in agreement with Vallimont et al (2004) who found that by replacing starch with sugar
incrementally in a continuous culture system fibre digestion was increased
67
Ryegrass and kikuyu NDFD was not affected at 24 hours by energy supplementation Pasture grasses are
high in rapidly fermentable sugars especially when harvested young as was the case with ryegrass and
kikuyu (28 days re-growth) Supplementation with energy sources would thus have a much smaller effect on
these forages compared to mature forages
45 Conclusion
Forage based diets that constitute mainly of mature forages are deficient in energy and therefore cannot
support growth and production in ruminant animals Lactating dairy cows have high energy requirements for
milk production Supplementation of lactating dairy cow diets with concentrates which are high in energy
can thus not be over-emphasized Supplementation with optimal amounts of energy substrates provide the
high producing dairy cow with energy needed to improve fibre digestibility and utilization It must however
be kept in mind that incorrect feeding and large amounts of energy substrates (especially starch and sugar)
increase the risks of ruminal acidosis due to the production of large quantities of lactic acid which
subsequently reduces milk production and profitability
Results obtained from this study proved that supplementation of applied as well as purified energy sources
have positive effects on DMD of forages Supplementing forages with 50 of the applied energy sources
improved DMD of all forages significantly Purified energy sources improved DMD of the hays and straws
significantly These forages are mature and thus have less soluble readily fermentable energy sources in
their tissue compared to ryegrass and kikuyu With the applied energy sources molasses tended to have
the biggest effect on DMD In general however the applied energy sources had a greater influence on
DMD probably because they do not tend to lower rumen pH as much as purified energy sources
The effect of applied energy sources on NDFD showed similar positive results The energy sources
improved NDFD of the total hay and straw substrates significantly These forages are high in NDF and ADL
which lowers NDFD It must also be kept in mind that these energy sources also contain various amounts of
NDF Subsequently substitution with energy sources (low in NDF and ADL) lowered the cell wall content of
the substrate thereby improving NDFD Citrus pulp had the greatest effect on all forages NDFD probably
due to its highly digestible NDF content The energy sources however had no effect on kikuyu grass and
ryegrass because these grasses were lower in NDF and ADL content and high in available sugars Purified
energy sources in contrast tended to decrease NDFD of all the forages The negative effect on NDFD
when supplementing with purified energy sources may be because fermentation of these energy sources by
rumen micro-organisms may result in a depletion of available nitrogen needed by micro-organisms to
ferment the slowly digestible fibre in forages (Heldt et al 1999) Another reason may be due to the fact that
these energy sources lower the rumen fluid pH due to large amounts of lactic acid production (especially by
sucrose and starch) thus decreasing the activity of cellulolytic and hemicellulolytic enzymes needed for fibre
digestion (Hoover amp Miller-Webster 1998) Another reason may be that rumen micro-organisms first attack
the readily fermentable energy sources before attaching to the forage substrates thereby decreasing the
rate of NDFD
68
It must be emphasized that when supplementing dairy cow diets with large amounts of energy sources it is
of utmost importance to provide adequate amounts of effective fibre to ensure a healthy rumen as well as
enough RDP to provide in the rumen microorganismrsquos nitrogen requirements In vitro experiments that show
the effects of supplementing poor quality roughage (such as wheat straw) with RDP or non-protein nitrogen
(NPN would also be useful in further studies as the limiting nutrient in wheat straw is nitrogen Nitrogen in
turn is needed for energy-nitrogen coupling to take place and improve microbial growth Not much research
has also been done to quantify the relationship between different carbohydrate sources and rumen
metabolism parameters leaving room for improvement and further studies
46 References
Allen M amp Oba M 2000 Getting more milk from forages Michigan Dairy Review 5(4) Michigan State
University
Available at
httpwwwadmanicomalliancedairyTechBulletinsNon20Structural20Carbohydrate20Nutrition
htm
(Accessed 5 August 2008)
ANKOM 2005 Method for Determining Acid Detergent Lignin in Beakers ANKOM Technology 0805
AOAC 1990 Official Methods of Analysis 15th edition Association of Official Analytical Chemists Arlington
Virginia
AOAC 1995 Official Methods of Analysis 15th edition Association of Official Analytical Chemists
Washington DC USA
Bampidis VA amp Robinson PH 2006 Citrus by-products as ruminant feeds A review Anim Feed Sci
Technol 128 175 - 217
Burroughs W Gerlaugh WP Edington BH amp Bethke RM 1949 The influence of corn starch upon
roughage digestion in cattle J Anim Sci 8 271
Canbolat O Kamalak A Ozkan CO Erol A Sahin M Karakas E amp Ozkose E 2006 Prediction of
relative feed value of alfalfa hays harvested at different maturity stages using in vitro gas production
Livestock Res Rural Dev 18(2) Article 27
Available at httpwwwcipavorgcolrrdlrrd182canb18027htm
(Accessed 18 October 2008)
Carey D A Caton J S amp Biondini M 1993 Influence of energy source on forage intake digestibility in
situ forage degradation and ruminal fermentation in beef steers fed medium-quality brome hay J
Anim Sci 71 2260 - 2269
69
Dado RG amp M S Allen 1995 Intake limitations feeding behaviour and rumen function of cows
challenged with rumen fill from dietary fiber or inert bulk J Dairy Sci 78 118 - 133
Fall ST Cisseacute M Ditaroh D Richard D Ndiaye NS amp Diaw B 1998 In vivo nutrient digestibility in
sheep and rumen dry matter degradability in cattle fed crop by-product based diets J Anim Feed
Sci 7 171 - 185
Goering HK Van Soest PJ 1970 Forage Fiber Analysis (apparatus reagents procedures and some
applications) In Agriculture Handbook No 379 Agriculture Research Service United States
Department of Agriculture Washington USA
Giraldo LA Tejido ML Ranilla MJ amp Carro MD 2008 In press Effect of exogenous fibrolytic
enzymes on in vitro rumen fermentation of substrates with different forage concentrate ratios Anim
Feed Sci Technol 141 306 - 325
Grant RJ amp Mertens DR 1992 Development of buffer systems for pH control and evaluation of pH
effects on fiber digestion in vitro J Dairy Sci 75 1581 - 1587
Hall MB 2002a Working with Non-NDF carbohydrates with manure evaluation and environmental
considerations In Proc Mid-South Ruminant Nutrition Conference Texas A amp M University Texas
USA pp 37 - 48
Available at httpwwwtxancorgproceedings2002Non-NDF20Carbohydratespdf
(Accessed 20 October 2008)
Hall MB 2002b Working with sugars (and molasses) In Proceedings of the 13th Annual Florida Ruminant
Nutrition Symp January 11 - 12 Gainesville Florida USA pp 146 - 158
Heldt JS Cochran GL Stokka GL Farmer CG Mathis CP Titgemeyer EC amp Nagaraja TG
1999 Effects of different supplemental sugars and starch fed in combination with degradable intake
protein on low-quality forage use by beef steers J Anim Sci 77 2793 - 2802
Henning P 2004 Acidosis in high-producing ruminants - myth or menace Animal Feed Manufacturers
Association (AFMA) South Africa pp 1 - 9
Available at httpwwwengormixcome_articles_viewaspart=529ampAREA=GDC
(Accessed 5 Augustus 2008)
Holtshausen L 2004 Effect of nonfibre carbohydrates on product yield and fibre digestion in fermentations
with mixed ruminal microbes PhD thesis University of Florida Gainesville Florida USA pp 1 - 33
Hoover WH amp Miller-Webster TK 1998 Role of sugar and starch in ruminal fermentation Tri-State Dairy
Nutrition Conference Michigan State University pp 1 - 16
70
Larson CC 2003 The effect of nonfiber carbohydrate source and protein degradability on lactation
performance of Holstein cows pp 1 - 108 MSc (Agric) thesis University of Florida Gainesville
Florida USA pp 1 - 108
Leiva E Hall MB amp Van Horn HH 2000 Performance of dairy cattle fed citrus pulp or corn products as
sources of neutral detergent-soluble carbohydrates J Dairy Sci 83 2866 - 2875
Mertens DR 1997 Creating a system for meeting the fiber requirements of dairy cows J Dairy Sci 80
1463 - 1481
Mertens DR amp Loften JR 1980 The effect of starch on forage fiber digestion kinetics in vitro J Dairy Sci
63 1437 - 1446
Miron J Yosef E Ben-Ghedalia D Chase LE Bauman DE amp Solomon R 2002 Digestibility by dairy
cows of monosaccharide constituents in total mixed rations containing citrus pulp J Dairy Sci 85 89 -
94
Mould F L amp Orskov E R 1983 Manipulation of rumen fluid pH and its influence on cellulolysis in sacco
dry matter degradation and the rumen microflora of sheep offered either hay or concentrate Anim
Feed Sci Technol 10 1 - 14
National Research Council (NRC) 2001 Nutrient requirements of dairy cattle (7th Rev Ed) National
Academy Press Washington DC USA pp 34 - 35
Owens FN Secrist DS Hill WJ amp Gill DR 1998 Acidosis in cattle a review J Anim Sci 76 275 -
286
Russel JB amp Wilson DB 1996 Why are ruminal cellulolytic bacteria unable to digest cellulose at low pH
J Dairy Sci 79 1503 - 1509
Sanson DW Clanton DC Rush IG 1990 Intake and digestion of low-quality meadow hay by steers
and performance of cows on native range when fed protein supplements containing various levels of
corn J Anim Sci 68 595 - 603
Schwarz FJ Haffner J amp Krichgessner M 1995 Supplementation of zero-grazed dairy cows with
molassed sugar beet pulp maize or cereal-rich concentrate Anim Feed Sci Technol 54 237 - 248
Simeone A Beretta V Rowe J Nolan J Elizalde JC amp Baldi F 2004 Rumen fermentation in
Hereford steers grazing ryegrass and supplemented with whole or ground maize In Proceedings of
the 25th Biennial Conference of the Australian Society of Animal Production 4 - 8 July University of
Melbourne Victoria Australia 25 168 - 171
71
Smith LW Goering HK amp Gordon CH 1972 Relationships of forage composition with rates of cell wall
digestion and indigestibility of cell walls J Dairy Sci 55 1140
Statistica 81 2008 StatSoft Inc USA
Tomlin DC Johnson RR amp Dehority BA 1964 Relationship of lignification to in vitro cellulose
digestibility of grasses and legumes J Anim Sci 23 161
Vallimont JE Bargo F Cassidy TW Luchini ND Broderick GA amp Varga GA 2004 Effects of
replacing dietary starch with sucrose on ruminal fermentation and nitrogen metabolism in continuous
culture J Dairy Sci 87 4221 - 4229
Van Soest PJ amp Robertson JB 1985 Analysis of forages and fibrous feeds A laboratory manual for
animal science 613 Cornell University Ithaca New York USA
Van Soest PJ Robertson JB amp Lewis BA 1991 Methods for dietary fiber neutral detergent fiber and
nonstarch polysaccharides in relation to animal nutrition J Dairy Sci 74 3583 - 3587
Voelker JA amp Allen MS 2003 Pelleted beet pulp substituted for high-moisture corn effect on rumianl
fermentation pH and microbial protein efficiency in lactating dairy cows J Dairy Sci 86 (11) 3562 -
3570
Williams VJ Rottle MC Moir RJ amp Underwood EJ 1953 Ruminal flora studies in the sheep IV The
influence of varying dietary levels of protein and starch upon digestibility nitrogen retention and the
free microorganisms of the rumen Aust J Biol Sci 6 142
72
Chapter 5
GENERAL CONCLUSION
The constant availability of high quality forages remains a problem in South Africa The efficiency of forage
utilization by ruminants is limited by several chemical and physical properties of forages including a high
fibre content and relative low energy content The primary components of fibre are cellulose hemicellulose
and lignin Supplementing dairy cow diets with concentrates such as sugar starch and pectin has the
potential to improve animal performance by improving the degradability of forage feedstuffs
Results from the current study suggested that the in vitro methods used were sufficient to indicate not only
that forages differ in terms of fermentability and digestibility but also to show that different energy sources
affect fermentation and digestion patterns of forages in different ways
The first study indicated that molasses per se may have a negative effect on total forage fermentability (as
determined by gas production) while citrus pulp may have a negative effect on the fermentability of certain
forages in this case oat hay and ryegrass Maize meal did not affect forage fermentability as measured by
total gas production The study also suggested that citrus pulp and maize meal may increase the
fermentation rate of oat hay while maize may also increase the fermentation rate of kikuyu The lag phase
of wheat straw and kikuyu fermentation may be shortened by all the energy sources investigated viz maize
meal molasses and citrus pulp It was concluded from the first study that forage fermentability is affected
differently by different energy sources These observations may have significant effects in practice on
rumen health and milk production and the data obtained can potentially be used as guide lines in feed
formulations
In the second study it was shown that different energy sources had different effects on in vitro NDF
digestibility (NDFD) of forages In general sucrose (after 24 and 72 hours of incubation) and pectin (72
hours) had no effect on NDFD of forage substrates The supplementation of oat hay with starch and pectin
(24 hours) and wheat straw with starch (24 and 72 hours) however lowered NDFD when compared to the
control treatment It is hypothesized that micro-organisms fermented the easily fermentable energy sources
first before attacking forage NDF The study suggested that forage NDF degradation values are not fixed
and may be altered by energy supplementation
Understanding the interactions that exist between rumen pH forages and NFC fractions used in dairy cow
rations will help when formulating diets for lactating dairy cows Knowledge of these concepts will aid in
formulating diets that will ensure optimal NDFD milk yield and milk composition without causing ruminal
health problems Papers focusing on the topic of the effect of energy sources on forage digestibility and
comparisons between in vivo and in vitro trials are limited and more research are needed in this regard

v
rumen microbes than the low quality hays and straw explaining the higher NDFD In the study involving the
purified energy sources (sucrose maize starch and citrus pectin) forage x energy source interactions were
observed In general supplementation with these energy sources improved DMD at 24 and 72 hours except
for RYE and KIK (72 hours) Pasture grasses (RYE and KIK) had a higher NDFD than LUC OH and WS At
72 hours NDFD was 371 for LUC 425 for OH and 403 for WS compared to 705 for KIK and
649 for RYE A possible explanation is that KIK and RYE samples came from freshly cut material
harvested after a 28d re-growth period In general sucrose (24 and 72 hours) and citrus pectin (72 hours)
had no effect on NDFD of forage substrates However supplementing oat hay (24 hours) with starch and
citrus pectin and wheat straw (24 and 72 hours) with starch lowered NDFD when compared to the control
treatment It is hypothesized that microbes fermented the easily fermentable energy sources first before
attacking forage NDF The study suggested that forage NDFD values are not fixed and may be altered by
type of energy supplementation
vi
Uittreksel
Titel Die invloed van stysel suiker en pektien as mikrobiese energiebronne op in vitro ruvoer-
fermentasiekinetika
Naam Marcia Malan
Studieleier Prof CW Cruywagen
Instansie Departement Veekundige Wetenskappe Universiteit van Stellenbosch
Graad MScAgric
Die meervoudige maagsisteem van herkouers stel hulle in staat om ruvoer meer effektief te benut as
enkelmaagdiere Ruvoere alleen bevat egter nie genoeg voedingstowwe om die behoeftes van hoog-
produserende melkbeeste te bevredig nie Ruvoere is ryk aan vesel en hul voedingstofbeskikbaarheid word
bepaal deur die graad van selwand degradeerbaarheid lsquon Verhoging in ruvoerfermentasie sal energie-
inname verhoog en gevolglik ook melkproduksie en prestasie Dit is dus belangrik om maniere te vind om
ruvoerdegradeerbaarheid en -verbruik in die rumen te verbeter
Die gebruik van verskillende nie-vesel koolhidraat (NFC) bronne het verskillende uitwerkings op die prestasie
van diere Energie-aanvullings soos suiker stysel en pektien tot ruvoer-gebasseerde dieumlte beiumlnvloed
prestasiemaatstawwe soos melkproduksie melksamestelling en droeumlmateriaalinname (DMI) op verskillende
maniere
Hierdie tesis lewer verslag oor twee studies waar die invloed van energie-aanvullings op ruvoerfermentasie
en verteringsmaatstawwe ondersoek is In die eerste studie is lsquon in vitro gasproduksieprotokol gebruik om
die invloed van suiker (melasse) stysel (mieliemeel) en pektien (sitruspulp) op totale gasproduksie (b) en
tempo van gasproduksie (c) van verskillende ruvoersubstrate te bepaal Ruvoersubstrate wat gebruik is
was koringstrooi (WS) hawerhooi (OH) lusernhooi (LUC) raaigras (RYE) en kikuyugras (KIK) Die drie
energiebronne sowel as lsquon kontrole (geen energiebron) is in vitro geiumlnkubeer saam met elk van die
genoemde ruvoere Rumenvloeistof is verkry van twee lakterende Holsteinkoeie wat lsquon dieet ontvang het
bestaande uit hawerhooi koringstrooi en lsquon kragvoermengsel Ruvoere is alleen enof in kombinasie met
melasse (01412 g DM) sitruspulp (01425 g DM) of mieliemeel (0125 g DM) in glasbottels afgeweeg en vir
72 uur geiumlnkubeer Die massas van die energiebronne is op lsquon energie-ekwivalente basis bereken Leeuml
bottels wat geen substraat bevat het nie is ingesluit om te korrigeer vir gasproduksie afkomstig vanaf
rumenvloeistof alleen Substrate is in 40 ml van lsquon buffermedium 2 ml reduserende oplossing en 10ml
rumenvloeistof geiumlnkubeer Gasdruk is elke vyf minute outomaties aangeteken deur gebruik te maak van lsquon
drukmetersisteem en die metode is gebasseer op die Reading gasdruktegniek Gasdruk is omgeskakel na
vii
gasvolume deur gebruik te maak van lsquon voorafbepaalde regressievergelyking In die eerste proef het totale
gasproduksie die gas wat deur die onderskeie energiebronne geproduseer is ingesluit In die tweede proef
is gasproduksie afkomstig van die energiebronne afgetrek van totale gasproduksie om sodoende die invloed
van die energiebronne per se op die gasproduksie van die onderskeie ruvoersubstrate te bepaal Data is
met behulp van twee nie-linieumlre modelle gepas Betekenisvolle ruvoer x energie-interaksies is in albei
proewe waargeneem vir die nie-linieumlre parameter b (gasproduksie) in Model 1 en vir b en L (sloerfase) in
Model 2 In die eerste proef het die energiebronne se hoeuml fermentasie gelei to lsquon verhoging in b (Model 1 amp
2) van LUC en WS Energie-aanvullings het die c-waarde van die onderskeie ruvoere verskillend beiumlnvloed
met WS wat die mees opvallende effek gehad het Al die energiebronne het die c-waarde van WS verhoog
ongeag watter model gebruik is Energiebronne het geen invloed op die L-waarde van LUC OH of RYE
gehad nie maar het wel die L-waarde van WS en KIK verlaag In die tweede proef het mieliemeel geen
invloed op die b-waarde van enige van die ruvoere gehad nie (Model 1 amp 2) terwyl melasse (Model 1 amp 2)
die b-waarde van alle ruvoere verlaag het en sitruspulp (Model 1 amp 2) OH en RYE se b waardes verlaag het
tot laer as die kontroles Melasse het geen invloed op die c-waarde van die onderskeie ruvoersubstrate
gehad nie terwyl sitruspulp (Model 1 amp 2) die c-waarde van OH en mieliemeel die c-waarde van OH en KIK
verhoog het Energiebronne het slegs lsquon invloed op die sloerfase in WS en KIK gehad waar dit L verlaag
het tot laer waardes as dieacute van die kontroles Daar is gevind dat ruvoer-fermenteerbaarheid verskillend
beiumlnvloed word deur verskillende energiebronne Bogenoemde resultate kan in die praktyk betekenisvolle
invloede hecirc op rumengesondheid en melkproduksie en die data wat verkry is kan potensieeumll gebruik word
as riglyne in voerformulerings
In die tweede studie is in vitro verteerbaarheidsproewe gedoen om die effek van suiker (molasse en
sukrose) stysel (mieliemeel en mieliestysel) en pektien (sitruspulp en sitrus-pektien) op neutraal-
onoplosbare vesel (NDF) en droeuml materiaal (DM) degradeerbaarheid van ruvoere te bepaal
Ruvoersubstrate wat gebruik is was WS OH LUC RYE en KIK Rumen vloeistof is verkry van twee
lakterende Holstein koeie wat lsquon dieet ontvang het bestaande uit hawerhooi koringstrooi en lsquon konsentraat
mengsel Die in vitro degradeerbaarheidsproef is gedoen met lsquon ANKOM Daisy II inkubator
Ruvoersubstrate is geiumlnkubeer met of sonder die onderskeie energiebronne vir 24 48 en 72 uur Die
substrate is geiumlnkubeer in 1076 ml buffer medium 54 ml reduserende oplossing en 270 ml rumen vloeistof
Residue is gewas gedroog en geanaliseer vir NDF In die proef met toegepaste energiebronne (molasse
mieliemeel en sitruspulp) was daar ruvoer x energiebron interaksies Toegepaste energiebron aanvullings
het almal DMD van ruvoersubstrate (24 en 72 uur) verbeter uitsluitend vir RYE wat aangevul is met
mieliemeel (24 uur) en sitruspulp (24 uur) Van al die ruvoersubstrate het molasse die grootste effek gehad
op DMD Mieliemeel aanvullings het geen effek gehad op neutraal-onoplosbare vesel degradeerbaarheid
(NDFD) van ruvoersubstrate nie behalwe vir lsquon verbetering in NDFD van LUC by 72 uur Molasse het NDFD
van lucern by 24 uur verbeter maar geen effek gehad op ander ruvoersubstrate nie Sitruspulp het NDFD
van OH (72 uur) asook LUC en WS (24 amp 72 uur) verbeter Daar word beweer dat die NDF van
energiebronne meer verteerbaar is as die van ruvoersubstrate en dat die verbetering in NDFD waardes
toegeskryf kan word aan die bydraes van energiebronne se NDFD Weidingsgrasse (RYE amp KIK) het oor die
algemeen lsquon hoeumlr NDFD as hooie en strooi gehad Rumen mikrobes blyk ook om dieacute grasse vinniger te
verteer as lae kwaliteit hooie en strooi wat gevolglik die hoeumlr NDFD verduidelik In die proef met suiwer
energiebronne (sukrose mieliestysel en sitrus-pektien) is ruvoer x energiebron interaksies waargeneem
viii
Energiebronaanvullings het DMD by 24 en 72 uur verbeter buiten vir RYE en KIK (72 uur) Weidingsgrasse
het hoeumlr NDFD as LUC OH en WS By 72 uur was die NDFD van LUC 371 OH 425 WS 403 in
vergelyking met 705 vir KIK en 649 vir RYE lsquon Moontlike verklaring vir die hoeumlr NDFD van KIK en
RYE is omdat dit vars gesnyde material is geoes na slegs 28 dae hergroei Oor die algemeen het sukrose
(24 amp 72 uur) en sitrus-pektien (72 uur) geen effek gehad op NDFD van ruvoersubstrate nie terwyl stysel en
pektien aanvullings tot OH (24 uur) en stysel aanvullings tot WS (24 amp 72 uur) NDFD verlaag het Daar
word hipotetieseer dat mikrobes eers die vinnig fermenteerbare energiebronne fermenteer voordat hulle
ruvoer NDF aanval Hierdie studie beweer dat ruvoer NDFD waardes nie vas is nie en dat dieacute waardes
beiumlnvloed mag word deur energiebron aanvullings
ix
Acknowledgements
I wish to thank the following people and organizations
Prof CW Cruywagen for his support and guidance
Dr Nherera for her help and support
The Hennie Steenberg Trust Fund for funding for the study
The Western Cape Department of Agriculture (Elsenburg) who made cannulated Holstein cows
available for the collection of rumen fluid
Academic and technical staff at the Department of Animal Sciences Stellenbosch University for
providing support where necessary and an ideal working environment
Fellow students who provided me with help and support throughout
My parents for their motivation and support
Al my friends for their motivation support and help
x
Table of Contents
Abstract
ii
Uittreksel
v
Acknowledgements
viii
List of Figures
xii
List of Tables
ix
List of Abbreviations
xiv
CHAPTER 1 INTRODUCTION 1
11 References 2
CHAPTER 2 LITERATURE REVIEW 4
21 Introduction 4
22 Non-fibre carbohydrates and non-structural carbohydrates 5
23 Rumen microbiology 5
24 Physical effective fibre and particle size 6
25 Forage classification 7
251 Factors influencing forage nutritive value 7
2511 Age and maturity 8
2512 Soil fertility and environment 8
26 Fibre 9
27 Van Soest forage fraction analysis 9
28 In vitro techniques for evaluating feed resources 10
29 Carbohydrates 10
291 Non-fibre carbohydrates non-structural carbohydrates 11
2911 Sugar 12
2912 Starch 12
2913 Pectin 13
2914 Sugar vs Starch 14
210 Non-fibre carbohydrate digestibility 14
xi
211 Non-fibre carbohydrate fermentation and organic acid production 15
212 Ruminal acidosis 16
213 Conclusion 17
214 References 18
CHAPTER 3 THE EFFECT OF SUGAR STARCH OR PECTIN ON RATE AND EXTENT OF GAS
PRODUCTION IN DIFFERENT FORAGES 23
Abstract 23
31 Introduction 23
32 Materials and methods 24
321 Study area 24
322 Simulated diets 24
3221 Basal forages 24
3222 Energy supplements 25
3223 Defining the diets 25
323 Chemical analyses of forages and energy sources 25
324 Preparation of samples for gas production 26
325 Preparation of the in vitro medium and reducing solution 28
326 Collection and preparation of rumen fluid 28
327 In vitro incubation 28
328 Converting gas pressure to gas volume 29
329 Estimating kinetic coefficients 29
33 Statistical analysis 30
34 Results and discussion 30
341 Gas production including that from the energy sources 30
342 Gas production parameters including that of forage and energy sources in cases where no
interaction was observed 37
343 Gas production excluding that from energy sources 39
344 Gas production parameters excluding that of energy sources in cases where no interaction was
observed 45
35 Conclusion 47
36 References 48
CHAPTER 4 THE EFFECT OF SUGAR STARCH AND PECTIN AS MICROBIAL ENERGY
SOURCES ON IN VITRO NEUTRAL DETERGENT FIBRE AND DRY MATTER DEGRADABILITY OF
FORAGES
51
Abstract 51
xii
41 Introduction 52
42 Materials and methods 52
421 Study area 52
422 Simulated diets 52
4221 Basal forages 52
4222 Energy supplements 53
4223 Defining the diets 54
423 Chemical analyses of forages and energy sources 54
424 Sample preparation 55
425 Preparation of in vitro medium and reducing solution 58
426 Collection and preparation of rumen fluid 58
427 In vitro incubation 58
428 Residue analysis 59
429 Estimating dry matter degradability 59
4210 Estimating neutral detergent fibre degradability 59
43 Statistical analyses 60
44 Results and discussion 60
441 Effect of maize meal citrus pulp and molasses on apparent in vitro dry matter
degradability 60
442 Effect of maize meal citrus pulp and molasses on apparent in vitro neutral
detergent fibre degradability 62
443 Effect of maize starch citrus pectin and sucrose on apparent in vitro dry matter
degradability 64
444 Effect of maize starch citrus pectin and sucrose on apparent in vitro neutral
detergent fibre degradability 65
45 Conclusion 67
46 References 67
CHAPTER 5 GENERAL CONCLUSION 71
xiii
List of Tables
Table 21 Feed types that fall within the definition of forage (adapted from
Wilkens 2000)
7
Table 22 Energy (MJkg DM) and protein (gkg DM) content of different
classes of forages (Wilkens 2000)
8
Table 23 Forage fraction classification using the method of Van Soest (Van
Soest amp Wine 1967)
9
Table 24 The effect of sugar on dairy cattle performance 14
Table 25
Non-fibre carbohydrate levels for various ration types (Ishler amp
Varga 2001)
15
Table 26 Comparison of acute and sub-acute acidosis (Henning 2004) 6
Table 31 Forages used in simulation diets for lactating dairy cows 25
Table 32 Energy sources used in simulating lactating dairy cow diets 25
Table 33 Chemical composition (gkg DM plusmn SD) of forages and energy
sources used in the trial All values are on a DM basis
27
Table 34 Substrate samples containing either forage or energy
supplements
27
Table 35 Composite dietary samples containing forage and energy sources 28
Table 36 Effects of maize meal citrus pulp and molasses as energy
sources on fermentation kinetics of different forage substrates as
measured by in vitro gas production Gas production of both
energy sources and forage substrates are included
32
Table 37 In vitro gas production parameters of forages as affected by
energy sources as main effects in cases where no interactions
were observed Gas production of both energy sources and
forage substrates are included
38
Table 38 In vitro gas production parameters of forages (irrespective of
forage substrate used) as affected by different energy sources as
main effects in cases where no interactions were observed Gas
production of both energy sources and forage substrates are
included
38
Deleted 8
Deleted 9
Deleted 11
Deleted 6
Deleted 7
Deleted 1
Deleted 8
Deleted 7
Deleted 7
Deleted para
Deleted 9
Deleted 30
Deleted 30
Deleted para35
Deleted 41
Deleted 41
xiv
Table 39 Effects of maize meal citrus pulp and molasses as energy
sources on fermentation kinetics of different forage substrates as
measured by in vitro gas production Gas production resulting
from energy sources was deducted from total gas production
40
Table 310 In vitro gas production parameters of forages as affected by
energy sources as main effects in cases where no interactions
were observed Gas production resulting from energy sources
was deducted from total gas production
45
Table 311 In vitro gas production parameters of forages (irrespective of
forage substrate used) as affected by different energy sources as
main effects in cases where no interactions were observed Gas
production resulting from energy sources was deducted from total
gas production
52
Table 41 Forages used in simulation diets for lactating dairy cows 53
Table 42 Applied energy sources used in simulating the dairy cow diets 54
Table 43 Purified energy sources used in simulating the dairy cow diets 54
Table 44 Chemical composition (gkg DM plusmn SD) of forages and energy
sources used in the trial All values are on a DM basis
55
Table 45 Substrate samples containing either forage or applied energy
supplements
55
Table 46 Composite diets containing forage and applied energy sources 56
Table 47
Diets containing forages alone or a mixture of forages and purified
energy sources Amounts are on an air dry basis
56
Table 48 Effects of maize meal citrus pulp and molasses as energy
sources on in vitro dry matter degradability (DMD) parameters of
different forage substrates
60
Table 49 Effects of maize meal citrus pulp and molasses as energy
sources on in vitro neutral detergent fibre degradability (NDFD)
parameters when incubated in combination with different forage
substrates
63
Table 410 Effects of maize starch citrus pectin and sucrose as energy
sources on in vitro dry matter degradability (DMD) parameters of
different forage substrates
64
Deleted 43
Deleted parapara 48
Deleted 49
Deleted 57
Deleted 57
Deleted
Deleted 58
Deleted para59
Deleted 60
Deleted para60
Deleted 61
Deleted 65
Deleted 67
Deleted 9
xv
Table 411 Effects of maize starch citrus pectin and sucrose as energy
sources on in vitro neutral detergent fibre degradability (NDFD)
parameters of different forage substrates
65
Deleted 70
xvi
List of Figures
Figure 21 Structural and non-structural carbohydrates of plants where ADF
= acid detergent fibre szlig-glucans = (1 rarr 3) (1 rarr 4)-szlig-D-glucans
NDF = neutral detergent fibre NDSF = neutral detergent-soluble
fibre (includes all non-starch polysaccharides not present in
NDF) NSC = non-NDF carbohydrates (Ishler amp Varga 2001)
11
Figure 22 Ruminal pH results for citrus and hominy rations where CPD =
citrus pulp diet and HD = hominy diet (Leiva et al 2000)
14
Figure 31 Gas production of forage substrates alone 34
Figure 32 Gas production of lucerne hay when supplemented with different
energy sources
35
Figure 33 Gas production of oat hay when supplemented with different
energy sources
36
Figure 34 Gas production of wheat straw when supplemented with different
energy sources
36
Figure 35 Gas production of ryegrass when supplemented with different
energy sources
37
Figure 36 Gas production of kikuyu grass when supplemented with
different energy sources
37
Figure 37 Gas production of forage substrates after gas production of
energy sources has been deducted
42
Figure 38 The net effect of energy supplements on gas production of
lucerne hay
42
Figure 39 The net effect of energy supplements on gas production of oat
hay
43
Figure 310 The net effect of energy supplements on gas production of
wheat straw
44
Figure 311 The net effect of energy supplements on gas production of
ryegrass
44
Figure 312 The net effect of energy supplements on gas production of
kikuyu grass
45
Deleted para
Deleted 2
Deleted para15
Deleted 6
Deleted 7
Deleted 8
Deleted 9
Deleted 9
Deleted 40
Deleted 4
Deleted 5
Deleted 6
Deleted 6
Deleted 7
Deleted 7
xvii
List of Abbreviations
ADF Acid detergent fibre
ADL Acid detergent lignin
b Gas production
c Gas production rate
C3H7NO2HCL Cysteine hydrochloride
cp Citrus pulp
CP Crude protein
DM Dry matter
DMI Dry matter intake
EE Ether extract
KIK Kikuyu grass
KOH Potassium hydroxide
L Lag phase
LUC lucerne hay
mm Maize meal
mol Molasses
MP Microbial protein
Na2S9H2O Sodium sulfide nonahydrate
ND Neutral detergent
NDF Neutral detergent fibre
NDSF Neutral detergent-soluble fibre
NFC Non-fibre carbohydrates
NH3N Ammonia nitrogen
NPN Non-protein nitrogen
NSC Non-structural carbohydrates
OH Oat hay
OM Organic matter
pef Physical effectiveness factor
peNDF Physical effective neutral detergent fibre
RDP Rumen degradable protein
RPT Reading pressure technique
RYE Ryegrass
VFA Volatile fatty acids
WS Wheat straw
1
Chapter 1
INTRODUCTION
The compound stomach system of ruminants is adapted to roughage based diets mainly grass (Cherney
1998) Diets of grass and other fibrous feeds however do not meet the energy requirements of high
producing dairy cows (Schwarz et al 1995) Fibre is low in energy and a large consumption thereof results
in rumen fill thus limiting feed intake (Allen amp Oba 2000) Concentrate feeds such as non-fibre
carbohydrates (NFC) provide lactating dairy cows with energy needed to improve performance and
efficiency of production (Henning 2004) Balanced rations consisting of forages and concentrate feeds
ensure optimal production and rumen health For dairy cattle forages should comprise at least 40 of the
diet and NFC should constitute between 35 and 42 of the diet (NRC 2001) Non-fibre carbohydrates such
as sugars starch and pectin are critical in meeting energy requirements for growth and production (Roche amp
Dalley 1996)
The symbiotic relationship between rumen micro-organisms and the host animal is an essential component
in nutrient supply (Van Saun 1998) Ruminant rations should provide the rumen micro-organisms with
sufficient nutrients and an optimal environment for growth (Ishler et al 1996) According to the NRC (2001)
the most important nutrients for optimal microbial growth are protein and carbohydrates Microbial
fermentation and digestion of carbohydrates and protein provide ruminants with volatile fatty acids (VFA) and
microbial protein (MP) The animal uses the VFA as energy and the MP for protein synthesis (Van Saun
1998)
Energy shortages affect lactating cows especially during the first three weeks after calving (Hutjens 1998)
During this time dry matter intake (DMI) is low and milk production is high resulting in a negative energy
balance When formulating diets for lactating dairy cows it is important to consider the total NFC fraction
which primarily comprise of sugars starch and pectins (Larson 2003) The NFC ferment rapidly in the
rumen to VFA (Holtshausen 2004) Batajoo amp Shaver (1994) reported that cows receiving diets with more
than 30 NFC produced more than 40 kg of milkday However they found no milk yield benefits by
increasing the NFC beyond 36 Molasses is a common energy supplement used in dairy rations
(Holtshausen 2004) In addition to this molasses also reduce dustiness and increase palatibility and
moisture content of diets (De Ondarza 2000) Other energy supplements include soybean hulls sugar beet
pulp and citrus pulp Leiva et al (2000) showed that substituting diets that contain 205 citrus pulp (pectin)
for diets containing 195 maize meal (starch) increased milk yield Solomon et al (2000) however
reported that substituting starch-rich diets with pectinndashrich diets had no effect on milk yield
Energy sources such as sugar starch and pectin are frequently used as supplements to forage in ruminant
diets in order to meet the energy requirements for growth and production However there is a lack of
information on the magnitude of the relationship between different carbohydrate sources and rumen neutral
detergent fibre fermentation kinetics
2
The objectives of this study were to determine the impact of three energy sources viz maize meal
molasses and citrus pulp on total gas production rate of gas production dry matter (DM) degradability and
NDF degradability of different forage substrates Forages commonly used in dairy cow diets were chosen as
fermentation substrates These were wheat straw (Triticum aestivum) oat hay (Avena sativa) lucerne hay
(Medicago sativa) kikuyu (Pennisetum clandestinum) and ryegrass (Lolium multiflorum)
11 References
Allen M amp Oba M 2000 Getting more milk from forages Michigan Dairy Review 5(4) Department of
Animal Science Michigan State University
Available at
httpwwwadmanicomalliancedairyTechBulletinsNon20Structural20Carbohydrate20Nutrition
htm
(Accessed 5 August 2008)
Batajoo KK amp Shaver RD 1994 Impact of nonfiber carbohydrate on intake digestion and milk
production by dairy cows J Dairy Sci 77 1580 - 1588
Cherney DJR 1998 Forages for dairy cattle Economical alternatives to alfalfa grass and corn In
Proceedings of the 1998 Tri-State Dairy Nutrition Conference April 21 - 22 Fort Wayne Indiana
USA pp 35 - 50
De Ondarza MB 2000 Non-fibre carbohydrates
Available at httpwwwmilkproductioncomLibraryArticlesNon_Fibre_Carbohydrateshtm
(Accessed 5 August 2008)
Henning P 2004 Acidosis in high producing ruminants - myth or menace Animal Feed Manufacturers
Association (AFMA) South Africa pp 1 - 9
Available at httpwwwengormixcome_articles_viewaspart=529ampAREA=GDC
(Accessed 5 Augustus 2008)
Holtshausen L 2004 Effect of nonfibre carbohydrates on product yield and fibre digestion in fermentations
with mixed ruminal microbes PhD thesis University of Florida Gainesville Florida USA pp 1 - 33
Hutjens MF 1998 Practical approaches to feeding the high producing cow Illini DairyNet University of
Illinois Extension
Available at httpwwwlivestocktrailuiucedudairynetpaperDisplaycfmContentID=247
(Accessed 5 Augustus 2008)
Ishler V Heinrichs J amp Varga G 1996 From feed to milk Understanding rumen function Pennsylvania
State University Extension Circular 422
3
Available at httpanimsciagrenvmcgillcacourses450extrafeed_to_milkconceptshtml
(Accessed 25 August 2008)
Larson CC 2003 The effect of nonfiber carbohydrate source and protein degradability on lactation
performance of holstein cows MSc (Agric) thesis University of Florida Gainesville Florida USA pp
1 - 4
Leiva E Hall MB amp Van Horn HH 2000 Performance of dairy cattle fed citrus pulp or corn products as
sources of neutral detergent-soluble carbohydrates J Dairy Sci 83 2866 - 2875
National Research Council (NRC) 2001 Nutrient requirements of dairy cattle (7th Rev Ed) National
Academy Press Washington DC USA pp 34 - 35
Roche J amp Dalley D 1996 Nutrition and milk composition Agriculture Notes State of Victoria Department
of Primary Industries pp 1 - 3
Available at
httpwwwdpivicgovaudpinreninfnsf9e58661e880ba9e44a256c640023eb2e036a3ac34d507323c
a257181001f0359$FILEAG0534pdf
(Accessed 1 October 2008)
Schwarz FJ Haffner J amp Krichgessner M 1995 Supplementation of zero-grazed dairy cows with
molassed sugar beet pulp maize or cereal-rich concentrate Anim Feed Sci Technol 54 237 - 248
Solomon R Chase LE Ben-Ghedalia D amp Bauman DE 2000 The effect of nonstructural carbohydrate
and addition of full fat soybeans on the concentration of conjugated linoleic acid in milk fat of dairy
cows J Dairy Sci 83 1322 - 1329
Van Saun RJ 1998 Beef cattle nutrition Feeding for two (How to properly feed the cow and her rumen)
In Cow-calf management guide-cattle producers library (2nd Ed) Cooperative Extension Service
Publications Agricultural Publications University of Idaho Moscow Idaho USA pp 172 - 180
4
Chapter 2
LITERATURE REVIEW
21 Introduction
With the increase in the cost of feed medicine labour fuel and other production essentials it is vital for any
agricultural enterprise specifically the traditional lsquofarmrsquo to be operated like a business With the profit-
making goal in mind the single most important facet of a modern dairy-operation is its feeding program An
efficient and successful feeding program will not only maximize the animalrsquos production but will also cut
costs in other areas of the operation by increasing animal health productive life-expectancy and reducing
labour costs A feeding program that achieve these goals will ultimately make the agricultural enterprise
more economically competitive
Dairy cattle require specific amounts of nutrients to support various levels of performance Feeding high
levels of concentrates (especially non-fibrous carbohydrates) to high producing dairy cows is common in all
intensive production systems around the world The problem with high levels of concentrates in dairy cow
diets is the risk of these diets causing digestive disturbances The aim of diet formulation and thus nutritional
management for intensive production systems must be to maximize productivity and overall efficiency
without enhancing digestive disturbances such as acidosis (Henning 2004) A successful feeding program
will meet the cowrsquos nutritive needs for high production minimize weight loss (during early lactation) prevent
digestive upsets and maintain ruminal and animal health
In order to achieve full genetic potential for high milk production it is of the utmost importance to keep the
rumens of dairy cows in a healthy state The rumen is home to a wide diversity of micro-organisms
(including bacteria protozoa and fungi) collectively utilizing the extensive variety of feeds which make up
dairy cow diets (Kamra 2005) Forages are the main component of dairy cow diets Forages alone
however do not meet the energy requirements of high producing dairy cows (Schwarz et al 1995)
Supplementing dairy cow diets with concentrate feeds provide high milk producing cows with energy needed
to improve efficiency of production and performance (Henning 2004) Carbohydrates are the largest nutrient
component of dairy diets and the most important source of energy for rumen micro-organisms
Carbohydrates important for growth reproduction milk production and rumen health make up roughly 70
of dry matter (DM) in dairy diets making it the lsquoheartrsquo of dairy diets (Mertens 1997) Carbohydrates (fibre
starch and sugar) are degraded in the rumen to simple sugars and then fermented into volatile fatty acids
(VFA) by rumen bacteria supplying up to 80 of the animalrsquos energy requirements
5
22 Non-fibre carbohydrates and non-structural carbohydrates
The three main components of the carbohydrate fraction of feeds referred to as non-fibre carbohydrates
(NFC) are starch NDSF (neutral detergent-soluble fibre) and sugars The NFC fraction of feedstuffs is
estimated from the following calculation as proposed by Holtshausen (2004)
100 - crude protein - ether extract - ash - neutral detergent fibre + neutral detergent insoluble crude
protein
The fraction derived by the above calculation has at times been used interchangeably for the terms NFC and
non-structural carbohydrates (NSC) Non-structural carbohydrates however refer to plant cell contents and
include mono- and oligosaccharides organic acids (which are not carbohydrates) starch and fructans Non-
fibre carbohydrates include all of the above substances as well as soluble fibre (pectic substances szlig-
glucans and galactans) Thus NFC includes non-structural and structural carbohydrates as well as non-
fibrous and fibrous carbohydrates (Holtshausen 2004)
In the interest of clarity I will not use the terms NSC and NFC interchangeably I will use NFC exclusively
as its meaning is more complete in the context of this thesis
23 Rumen microbiology
All living organisms require some essential nutrients to sustain metabolic processes and to maintain a
healthy state These essential nutrients include water protein minerals vitamins and essential energy The
difference between the cow itself and the micro-organisms living within its rumen is defined by the source of
their respective nutrients (Van Saun 1993)
Feeding dairy cattle nutritional balanced diets ensures healthy rumens that maximize microbial production
and growth Ruminal pH is the main variable influencing the microbial population and thus the overall VFA
production (major energy source to animal) Diets containing too much NFC may cause the ruminal pH to
decrease below 6 This low rumen pH leads to a reduction in cellulolytic organisms and an increase in
propionate producing micro-organisms in turn leading to a low acetate-propionate ratio This in turn results
in low milk fat percentages (Ishler et al 1996)
Maintaining a healthy rumen microbial population is an essential function of any feeding program Carbon
skeletons and energy are used by rumen micro-organisms for protein synthesis Ruminant systems are
sometimes based on digestible organic or fermentable matter even though rumen micro-organisms are able
to grow and develop on only secondary carbohydrate products Rumen bacteria have specific maintenance
requirements for growth and development Both bacterial growth rate and fractional degradation rate of
carbohydrates determine bacterial yield (Nocek amp Tamminga 1991)
6
24 Physical effective fibre and particle size
Preventing ruminal acidosis requires chemical and physical considerations of the diet as well as a well-
organized feed and herd management system (Hall 2002) The physical form of the diet affects the nutritive
value of the feed as well as the chewing activity dry matter intake rumen function and milk production of the
animal
Particle size plays a critical role in the extent to which rumen micro-organisms can carry out their digestive
functions Grinding or chopping forages does not change the forage composition it only reduces the particle
size Reduced particle size increases dry matter intake and the rumen turnover rate resulting in a reduced
time period within which rumen micro-organisms can digest fibre Reduced particle size also reduces the
time spent on rumination thus leading to less mucus production and a subsequent decrease in rumen pH
Low rumen pH leads to an increase in propionic acid production and tend to change milk components by
lowering milk fat percentages and increasing milk protein percentages Chopping and grinding of
concentrates increase the starch exposure to rumen microbial digestion resulting in increased degradation
Processing methods such as pelleting steam rolling or grinding of concentrates alter the structure of starch
by increasing its availability for fermentation in the rumen This increase in starch availability can be either
favorable by boosting rumen microbial growth or harmful by enhancing the risk of rumen acidosis (Van der
Merwe amp Smith 1991)
As with particle length fibre content of the diet plays an important role in maintaining rumen functions Fibre
ensures sufficient amounts of carbohydrates to slow down the rate of digestion and prevent rumen acidity
Neutral detergent fibre (NDF) and acid detergent fibre (ADF) are the most important fibre fractions in ration
formulation Effective fibre is needed in dairy diets to form a ruminal mat and slow down carbohydrate
availability thereby preventing rumen acidosis (Ishler et al 1996) Balancing the dairy ration for NDF and
non-fibre carbohydrates (NFC) fractions is very important in controlling the rumen pH Buffers are also
commonly used for controlling pH
Physical effective fibre (peNDF) relates the physical properties of a feed (by measuring particle size and
chewing activity) to rumen pH The peNDF of a feed is the product of the feedrsquos physical effectiveness factor
(pef) and the feedrsquos NDF By definition pef varies between 0 (if NDF if is not successful in stimulating
chewing activity) and 1 (if NDF is successful in encouraging chewing activity) (Mertens 1997)
It is very important to always balance the peNDF of the dairy cow diet with dietary fermentability Physical
effective fibre is that fraction of fibre that promotes the chewing activity Thus when feeding lactating cows
it is very important to add adequate amounts of peNDF Optimal inclusion of peNDF will ensure that the cow
chews her cud well enough and in the process secrete enough saliva that helps to control rumen pH
Ruminal pH is primarily determined by the balance between the quantity of fermentation acid produced and
the buffer secretion during chewing (Allen 1997)
7
25 Forage classification
Good forage sources are the foundation of efficient dairy production (Morrison 1959) A large variety of
feeds can be defined as forages (Baloyi 2008) as listed in Table 21 By definition forages are the edible
fractions of plants other than grain that can be harvested for feeding or used as feed for grazing animals
(Forage amp Grazing Terminology Committee 1991) The definition also states that feedstuff must contain
35 or more NDF to be classified as forage (Zinn amp Ware 2007)
It is of utmost importance to remember that a high producing dairy cowrsquos digestible nutrient and net energy
requirements cannot be met by forage alone Generally dairy cows are fed good quality forages and then
supplemented with additional grains or other concentrates in order to meet their requirements
Table 21 Feed types that fall within the definition of forage (adapted from Wilkens 2000)
Forage Feed types
Herbage Leaves roots of non-woody species stems sown and
permanent grasslands crops that may be cut or grazed
Hay Grasses and legumes that have been cut dried and
stored for use as animal feed
Silage
Browse
Fermented high moisture fodder
Leaves bud and twigs of woody species
Straw Dry stalk of cereal plant after the grain or seed has been
removed
251 Factors influencing forage nutritive value
Chemical composition digestibility and the physical characteristics of the digested feed determines the
nutritive value of forage (Goosen 2004) Forages between and within species differ significantly in
composition and nutritive value as indicated in Table 22
8
Table 22 Energy (MJkg DM) and protein (gkg DM) content of different classes of forages (Wilkens 2000)
Forage class Metabolizable energy
MJkg DM
Crude protein
gkg DM
Temperate grasses hays and silages
70-130 60-250
Tropical grasses
50-110 20-200
Maize silage
100-120 60-120
Cereal straw
50-80 20-40
Root crops
110-140 40-130
Kale and rape 90-120 140-220
Age and maturity soil fertility and environmental conditions are the primary factors influencing the nutritive
value of forages Herbage maturity has the largest influence on forage nutritive value (Buxton amp Mertens
1995) Mature forages have higher lignin and cell wall contents that limit fibre utilization due to the rate and
degree of plant cell hydrolysis (Van Soest 1994)
2511 Age and maturity
Young plants are tender with less structural carbohydrates (hemicellulose and cellulose) and lignin compared
to mature plants (McDonald et al 2002) Lignin is indigestible explaining the higher digestibility in younger
plants As plants mature the stems and leaves become lignified decreasing the nutritive value of the plant
due to the lower digestibility of nutrients enclosed in the cell walls (Morrison 1959) Leaves have lower cell
wall content than stems As the plant matures there is an increase in the proportion of stems compared to
leaves thus contributing to the lower digestibility of mature plants (Van Soest 1994)
2512 Soil fertility and environment
Environmental factors that affect forage quality the most are temperature light water and soil fertility (Van
Soest 1994) The mineral content in soil influences not only the crop yield but also its composition
Fertilizers can have a great influence on the nutrient content of soils Fertilized pastures grow better are
more palatable and have higher protein vitamin and mineral contents than unfertilized pastures (Morrison
1959)
9
26 Fibre
Fibre is composed of an indigestible fraction and several potentially digestible fractions that occupy space in
the gastrointestinal tract of ruminants (Mertens 1997) The primary components of fibre are cellulose
hemicellulose and lignin In the rumen feed is digested through microbial fermentation and the physical
breakdown of feed through rumination (Ishler amp Varga 2001) The type of diet fed influences and change
bacteria population in the rumen in order to successfully digest the food used by the cows The level to
which fibre will digest depends on the particle size rumen pH and fibre level in the diet
27 Van Soest forage fraction analysis
Fibre lignin and protein are the three most important chemical fractions determining nutrient supply and
performance (Mould 2003) According to Van Soest (1994) chemical analysis measures digestibility and
intake using the statistical relationship between feed quality and the analyzed feed components The
proximate analysis divided feedstuff into six fractions namely moisture crude protein ash ether extract
nitrogen-free extract and crude fibre (Fisher et al 1995) Van Soest (1994) claimed that the proximate
analysis had one serious error namely that the proximate analysis divided carbohydrates into crude fibre
and nitrogen-free extract Van Soest then developed an analysis specifically for fibre-rich feeds that
replaced the proximate analysis The method of Van Soest predicts intake and the nutritive value of
feedstuffs by determining the fibre fractions according to the degradability of fractions insoluble in neutral
detergent and fractions insoluble in acid detergent (Goosen 2004) Acid detergent fibre determines the
cellulose and lignin content and NDF the cellulose hemicellulose and lignin The difference between NDF
and ADF gives the hemicellulose content (Knudsen 2001) Table 23 gives an outlay of the components
soluble and insoluble in NDF
Table 23 Forage fraction classification using the method of Van Soest (Van Soest amp Wine 1967)
Fraction Components
Cell contents (soluble in neutral detergent) Lipids
Sugar organic acids
Water-soluble matter
Pectin starch
Non-protein nitrogen
Soluble protein
10
Table 23(continue) Forage fraction classification using the method of Van Soest (Van Soest amp Wine 1967)
Cell wall contents (insoluble in neutral detergent)
1 Soluble in acid detergent Fibre-bound protein
Hemicellulose
2 ADF Cellulose
Lignin
Lignified N
Silica
28 In vitro techniques for evaluating feed resources
In vitro methods used to evaluate feed resources are less time-consuming and less expensive than in vivo
methods The in vitro gas production procedure measures the amount of gas produced or collected
recording it manually (Theodorou et al 1994) or automatically (Pell amp Schofield 1993 Davies et al 2000)
This procedure thus generates kinetic data rather than digested feed disappearance (Baloyi 2008) Gas
production gives a description of the microbial activity and how micro-organisms respond to a specific
substrate thereby giving a practical imitation of what happens in the rumen Pell et al (1998) used in vitro
gas production to measure the rate and extent of fermentation VFA production and microbial protein (MP)
production The biggest advantage of the gas production technique is that there is no need to terminate the
gas production in order to measure the extent of digestion The disadvantage of this technique however is
the lack of uniformity in methodology and factors such as pH and temperature that may affect a feedrsquos gas
production (Getachew et al 1997) The traditional two-stage method (Tilley amp Terry 1963) involved an in
vitro fermentation of forages in rumen fluid followed by pepsin digestion The disadvantage of this
technique however is that it is an end-point measurement thus giving no indication on forage digestion
kinetics (Theodorou et al 1994) Goering amp Van Soest (1970) modified the procedure to accurately
estimate the true DM digestibility by treating the residue with a ND solution (Baloyi 2008) The method of
Goering and Van Soest however are also an end-point measurement thus giving no indication on forage
digestion kinetics (Theodorou et al 1994) ANKOM technology developed a technique that simplifies in vitro
digestibility evaluations using an insulated incubator (Daisy II incubator) (Baloyi 2008) The ANKOM
technique predict potential and true digestibility in vitro accurately faster and with less labour
29 Carbohydrates
Carbohydrates can be classified into two groups (structural carbohydrates and non-fibrous carbohydrates)
based on their function in plants (see Figure 21) Structural carbohydrates which are located in the plantrsquos
cell walls are very fibrous and are digested slowly Non-fibrous carbohydrates are located in the plantrsquos
11
leaves and seeds Non-fibrous carbohydrates are easily digested and include starches sugars fructans and
organic acids (Ishler amp Varga 2001)
Acid detergent fibre and NDF are the most universal way of analyzing fibre It is important to note that
although pectins are part of the cell wall they are grouped as non-structural carbohydrates The reason for
this is because pectin other than hemicellulose is entirely fermentable by rumen micro-organisms (Van der
Merwe amp Smith 1991)
Figure 21 Structural and non-structural carbohydrates of plants where ADF = acid detergent fibre szlig-
glucans = (1 rarr 3) (1 rarr 4)-szlig-D-glucans NDF = neutral detergent fibre NDSF = neutral detergent-soluble
fibre (includes all non-starch polysaccharides not present in NDF) NSC = non-NDF carbohydrates (Ishler amp
Varga 2001)
291 Non-fibre carbohydrates non-structural carbohydrates
Non-fibre carbohydrates are the major source of energy for high producing dairy cattle all around the world
Non-fibre carbohydrates are very palatable and easily digested but fermentation varies with type of feed and
means of processing Increasing NFC in the diet fulfils the high energy demands of a lactating dairy cow but
at the expense of NDF (NRC 2001)
The non-structural component of plants can be identified by two different methods chemical analysis (which
uses enzymes to determine the level of starch and sugar in the feed) or difference calculations (which use
NDF crude protein fat and ash to estimate NFC) (Stokes 1997) Russell et al (1992) reported that greater
amounts of NFC in dairy cow diets increase the production of MP Thus NFC in diets for lactating cows has
the potential to increase MP synthesis as well as the efficiency of ruminal undegradable protein utilization
(Casper et al 1990) It must however be emphasized that MP yield differs with different NFC sources
12
Different NFC sources require different inclusions of rumen degradable protein and rumen undegradable
protein in order for an animal to reach optimal performance (Mertens et al 1994)
Milk production per cow is the major factor determining any dairy farmrsquos profitability The inclusion of NFC is
a fashionable way to increase energy density and thus milk production of the dairy herd Replacing part of
the starch in the diet with sugar leads to higher fermentation rates and more MP This might be due to the
fact that sugar digests at a rate of 300 per hour whereas starch digests at a rate of 6 ndash 60 per hour
(Carver 2007) Research has also shown that additional supplementary sugar in feed has the power to
increase feed intake milk yield and fat content of milk due to better fibre digestion and production of MP in
the rumen (Lykos et al 1997)
The importance of adequate amounts of NFC cannot be over emphasized Feeding inadequate amounts of
NFC reduces the energy available from propionic and lactic acid production reduces MP synthesis and
decrease fibre digestion Overfeeding of NFC depress fibre digestion and acetic acid production (lowering
milk fat percentages)
It is important to note that NFC and NSC is not the same in all feeds The difference between these two is
caused by the input of pectin and organic acids Pectin is always included in NFC but not in NSC (NRC
2001) Numerous research experiments investigated the effect of NFC on ruminal pH Knowledge of the
individual as well as a combination of supplemented NFC fermentation characteristics can be helpful in
predicting an animalrsquos performance (Holtshausen 2004)
2911 Sugar
Simple sugars are rapidly fermented in the rumen (at a rate of 300 per hour) and are composed of one or
two units of sugar Sugars commonly fed to dairy cows include sucrose lactose and dextrose Initially
sugar was used in diets to improve the palatability of the feed Recently it was discovered that rumen micro-
organisms respond to sugar by increasing their production of MP leading to higher milk production The
addition of sugar to the feed also helps rumen micro-organisms capture and utilize diet nitrogen Even
though sugar has very advantageous effects on rumen micro-organisms and their actions it is important not
to add too much sugar in dairy cow diets as it can cause ruminal acid-spikes resulting in acidosis (De
Ondarza 2000)
2912 Starch
The NFC in most grain-based diets is made up of starch (24 ndash 28 of the total ration DM) Starch
digestibility plays an important role in the milk production of dairy cows Maize and barley (being cereal
grains) provide most of the starch in a dairy cowrsquos diet Theoretically starch is units of glucose bonded
together Depending on the starch source and method of processing the glucose units can be firmly bonded
or weakly connected This is the main reason why some starches ferment rapidly and others slowly in the
13
rumen of dairy cows Ruminal digestion of starch can vary from 6 ndash 60 per hour depending on the starch
source and processing method used The goal of feeding starch is to achieve maximum total tract
digestibility and maximum MP production without causing ruminal health problems due to production of
fermentation acids (De Ondarza 2000)
2913 Pectin
Pectin is one of the three most essential structural components in forages and is found primarily in the
intercellular layers of plant tissues Pectin diminishes as the plant gets older Most feeds consumed by
dairy cows are low in pectin (2 ndash 3) but several feeds may contain higher concentrations such as citrus
pulp (15) beet pulp (15 ndash 20) and lucerne (3 ndash 10) Pectin contributes to the energy requirements of
rumen micro-organisms (75 ndash 90 of pectin fermentation takes place in the rumen) (Allen 2001)
Many of the species that break down pectin also digest plant components such as cellulose and
hemicellulose Pectin is extremely fermentable and highly digestible but this does not appear to lower pH as
is often seen with starch digestion Due to this feeds containing pectin are often supplemented into high
concentrate dairy diets to avoid problems associated with rumen acidosis (Mohney 2002)
A study done by Dehority (1969) found that a number of different rumen bacteria are capable of fermenting
pectin (using it as a carbon source) eg Butyrivibrio fibrisolvens Prevotella ruminicola Lachnospira
multiparus Treponema bryantii and Succinivibrio dextrinosolvens Later studies discovered that the
products of the hydrolysis (by Lachnospira multiparus bacterium) of pectic material can be used by other
ruminal micro-organisms such as Selenomonas ruminantium Fusobacterium sp Eubacterium ruminantium
and Succinivibrio dextrinosolvens (Paggi et al 2005)
2914 Sugar vs Starch
Leiva et al (2000) investigated the effect of two maize silagelucerne hay-based diets on ruminal pH The
only difference between these two diets was that their NFC came from either starch (hominy) or sugars
(dried citrus pulp) From this trial it was concluded that the pH declined more rapidly on citrus diets (sugar)
than on hominy (starch) diets and also reaching the lowest pH point faster (Figure 22)
14
Figure 22 Ruminal pH results for citrus and hominy rations where CPD = citrus pulp diet and HD = hominy
diet (Leiva et al 2000)
From the studies done by Leiva et al (2000) it was observed that starch has the best chance of increasing
milk production However the problem with high starch diets is that they are likely to cause serious rumen
acidosis One way to ensure healthy rumens as well as high milk production is to use peNDF as a
benchmark The more peNDF a cow consumes the more starch may be included in the diet Physical
effective neutral detergent fibre thus lowers the risk of ruminal acidosis The effect of supplementing sugar
to forage based diets is shown in Table 24
Table 24 The effect of sugar on dairy cattle performance
MP = microbial protein OM = organic matter DMI = dry matter intake
210 Non-fibre carbohydrate digestibility
Non fibre carbohydrates are composed of starch and sugar Starch digestibility has a major effect on the
rumen Starch fermentation varies with processing and type of grain fed Processing such as grinding
Reference Forage Source Supplements Intake g DM day Animal Response
Chamberlain et al
1985
Grass Sugar 9072 g sugar MP synthesis uarr
Huhtanen 1988 Grass Molasses 9979 g molasses
(499 g sugar)
OM digestion amp
MP production uarr
Nombekela amp
Murphy 1995
Lucerne Haylage
amp Maize Silage
Sucrose 2858 g sucrose Milk yield (9072 g)
amp DMI uarr
15
steaming and ensiling affects ruminal availability of starch Processing mostly increases rate of fermentation
and digestibility of starch Soluble sugar ferments rapidly in the rumen and is readily available as energy
sources for the animal (Ishler amp Varga 2001) Mature grains (maize or oats) usually contain a small amount
of sugar because most has been converted to storage polysaccharides Forages (pasture or hay) usually
contain a lot of sugars The level of sugar in hay is depended on crop management Byproducts (molasses
citrus pulp and almond hulls) contain high levels of sugars However the variation in processing methods
(as in the case of starch) and the type of material used can lead to large variation in sugar content (Hall
2002)
One problem with diets high in NFC is the fact that it lowers the rumen pH increasing the risk of acidosis
The main reason for this is NFC fast fermentability especially if it replaces fibre in low fibre diets Acidosis in
turn affects ruminal digestion intake metabolism milk fat production milk production as well as rumen and
animal health The NFC levels of various feed types are shown in Table 25
Table 25 Non-fibre carbohydrate levels for various ration types (Ishler amp Varga 2001)
211 Non-fibre carbohydrate fermentation and organic acid production
The rate and extent of carbohydrate fermentation determines the concentration of organic acids produced
Rumen micro-organisms digest simple and complex carbohydrates (fibre) by converting them into VFA
(mainly acetic propionic and butyric acid) These VFA are the most important energy source for ruminants
Volatile fatty acids account for 60 ndash 70 of metabolizable energy supply in ruminants making it of great
importance in the production of milk by dairy cows Reduction in fibre digestion leads to a reduction in
ruminal pH This is caused by rapid NFC fermentations leading to increased VFA production by rumen
micro-organisms
Typical NFC level Typical feedstuffs
33 ndash 36 Barley oats high moisture- steam flaked-
and finely ground grain predominate the
concentrate portion of the diet
37 ndash 39
High quality hay crop forages
predominates the ration maize silage
rations include non-forage fibre sources
40 ndash 42
Coarsely processed maize is used diet
has a high inclusion level of non-forage
fibre sources
16
Feeding large amounts of forage produces greater amounts of acetic acid whilst resulting in lesser amounts
of propionic and butyric acid On the other hand feeding grain or other finely ground forages may lead to a
reduction in acetic acid while the amount of propionic acid may increase The ratio of acetic to propionic
acids imitates the rumen fermentation pattern Under an optimal rumen fermentation environment the acetic
to propionic ratio should be greater than 221 High planes of acetate can point to a low fermentable
carbohydrate high fibre ration High planes of propionic acid on the other hand can point to reduced fibre
digestion and acidosis (University of Minnesota 1996)
A study done by Strobel amp Russel (1986) found that pectin fermentation increased acetate concentrations
further compared to starch and sucrose The study concluded that the increased acetate might ultimately
contribute to increase precursors for fatty acid and milk fat synthesis in lactating dairy cows Fermentation
studies done with sucrose and starch on the other hand increased butyrate production (Hoover et al
2006) Butyrate has shown to be an important precursor of energy supplied to skeletal and heart muscles
(Holtshausen 2004) Sugar ferments extremely fast in the rumen Without linkages to other carbohydrates
and due to the high solubility of sugars there is little to impede microbial fermentation (Hall 2002) Several
studies reported that sugar has a much higher potential for lactate production when compared to other NFC
sources (for example starch) (Strobel amp Russel 1986 Heldt et al 1999)
212 Ruminal acidosis
Micro-organisms in the rumen obtain energy primarily from fermentation of carbohydrates Acidosis occurs
when the diet of ruminants is suddenly changed from a forage based diet to a predominant concentrate diet
The highest risks come from diets that are high in starch or fast fermentable carbohydrates and the effective
fibre is below the recommended level or the particle size is too small This leads to higher VFA production
as well as very high glucose levels in the rumen Subsequently ruminal osmolarity increases leading to
ruminal acidity The increase in osmolarrity is due to the negative effect the high glucose level has on
Streptococcus bovis and lactic acid-producing micro-organisms (Henning 2004) Acidosis can be divided
into sub-acute ruminal acidosis and acute acidosis as seen in Table 26
Table 26 Comparison of acute and sub-acute acidosis (Henning 2004)
Acidosis Item Acute Sub-Acute
Clinical Signs Present Absent
Systemic Acidosis Present Absent
Mortality Yes No
Ruminal pH lt 50 50 -55
17
Table 26(continue) Comparison of acute and sub-acute acidosis (Henning 2004)
Ruminal Acids
Lactic Acid High (50-100mM) Normal (0-5mM)
Volatile Fatty Acids Below Normal (lt100mM) High (150-200mM)
Ruminal Bacteria
Lactic Acid Producers Very High Normal to Small Increase
Lactic acid Utilisers Significant Reduction Increase
Ruminal Protozoa Absent or Reduced Absent or Reduced
Indicators determining whether ruminal acidosis is accruing in the herd include (Ishler amp Varga 2001)
Milk fat percentage (darr milk fat ndash darr ruminal pH)
Chewing activity (darr rumination ndash uarr ruminal acidosis)
Laminitis (uarr laminitis ndash uarr ruminal acidosis)
Strategies for avoiding acidosis
Provide good quality total mixed rations
Give small but frequent meals
Avoid abrupt changes in diets
213 Conclusion
Achieving maximum production and maintaining a healthy rumen ecosystem at the same time is a balancing
act A cow will attain more VFA when fermentation is maximized These VFA are used as energy
precursors and to synthesize MP Increased fermentation however goes together with increased acid
production and a lower rumen pH Low rumen pH can lead to metabolic disorders due to impaired fibre
digestion Thus by increasing the peNDF intake the risk of acidosis can be reduced effectively
Non-fibre carbohydrates are the essential source of energy for high producing dairy cattle One problem with
diets high in NFC however is the fact that it lowers the rumen pH increasing the risk of acidosis This is
mainly due to the fast fermentability of NFC especially if it replaces fibre in low fibre diets Acidosis in turn
affects ruminal digestion intake metabolism milk fat production and milk production as well as rumen and
animal health
A better understanding of the workings of the rumen as a whole ecosystem as well as ensuring optimal
sugar starch and peNDF in dairy cow ration will enable farmers to maintain the fine balance between
productivity and acidosis
18
Whilst the goal of any modern agricultural enterprise is to maximize profits special care should be taken not
to increase short-term profits at the cost of long-term viability A dairy cowrsquos productivity can easily be
increased whilst the animalrsquos health could suffer in the long term In the modern scenario the farm is as
much a profit-seeking enterprise as any other business With this in mind the modern farmer in his capacity
as a business manager should ensure the well-being and optimal performance of his assets
214 References
Allen MS 1997 Relationship between fermentation acid production in the rumen and the requirement
for physically effective fiber J Dairy Sci 80 1447 - 1462
Allen M 2001 Formulating lactating cow diets for carbohydrates In Proceedings of the 5th Western Dairy
Management Conference April 4 - 6 Las Vegas Nevada USA pp 79 - 86
Baloyi TF 2008 Effects of exogenous fibrolytic enzymes on in vitro fermentation kinetics of forage and
mixed feed substrates MSc (Agric) thesis Stellenbosch University Stellenbosch South Africa pp 1 -
28
Buxton DR amp Mertens DR 1995 Quality-related characteristics of forage In Forages An introduction to
grassland agriculture (2nd Ed) Eds Barnes RF Miller DA and Nelson CJ Iowa State University
Press Ames Iowa USA pp 83 - 96
Carver LA 2007 Sugar aids lactating dairy cattle production Feedstuffs 79(2) 1 - 3
Casper DP Schingoethe DJ amp Esenbeisz WA 1990 Response of early lactation dairy cows fed diets
varying in source of nonstructural carbohydrate and crude protein J Dairy Sci 73 1039 - 1050
Chamberlain DG Thomas PC Wilson W Newbold CJ amp MacDonald JC 1985 The effects of
carbohydrate supplements on ruminal concentrations of ammonia in animals given diets of grass
silage J Agric Sci Cam 104 331 - 340
Davies ZS Mason D Brooks AE Griffith GW Merry RW amp Theodorou MK 2000 An automated
system for measuring gas production from forages inoculated with rumen fluid and its use in
determining the effect of enzymes on grass silage Anim Feed Sci Technol 83 205 - 221
Dehority BA 1969 Pectin-fermenting bacteria isolated from bovine rumen J Bacteriol 99 189 - 196
De Ondarza MB 2000 Non-fibre carbohydrates
Available at httpwwwmilkproductioncomLibraryArticlesNon_Fibre_Carbohydrateshtm
(Accessed 5 August 2008)
19
Fisher DS Burns JC amp Moore JE 1995 The nutritive evaluation of forage In Forages An introduction
to grassland agriculture (1st Ed) Eds Barnes RF Miller DA amp Nelson CJ Iowa State University
Press Ames Iowa USA pp 105 - 115
Forage amp Grazing Terminology Committee 1991 Vegetation terms In Terminology for grazing lands and
grazing animals Pocahontas Press Inc Blacksburg Virginia USA
Getachew G Makkar HPS amp Becker K 1997 The in vitro gas coupled with ammonia measurements for
evaluation of nitrogen digestibility in low quality roughages using incubation measurements of different
measuring capacity J Sci Food Agric
Goering HK amp Van Soest PJ 1970 Forage fibre analysis (apparatus reagents procedures and some
applications) Agricultural Handbook Number 379 ARS-USDA Washington DC USA
Goosen L 2004 The effect of an exogenous fibrolytic enzyme on forage digestibility parameters MSc
(Agric) thesis Stellenbosch University Stellenbosch South Africa pp 1 - 27
Hall MB 2002 Working with sugars (and molasses) In Proceedings of the 13th Annual Florida Ruminant
Nutrition Symp January 11 - 12 Gainesville Florida USA pp 146 - 158
Heldt JS Cochran GL Stokka GL Farmer CG Mathis CP Titgemeyer EC amp Nagaraja TG
1999 Effects of different supplemental sugars and starch fed in combination with degradable intake
protein on low-quality forage use by beef steers J Anim Sci 77 2793 - 2802
Henning P 2004 Acidosis in high-producing ruminants - myth or menace Animal Feed Manufacturers
Association (AFMA) South Africa pp 1 - 9
Available at httpwwwengormixcome_articles_viewaspart=529ampAREA=GDC
(Accessed 5 Augustus 2008)
Holtshausen L 2004 Effect of nonfibre carbohydrates on product yield and fibre digestion in fermentations
with mixed ruminal microbes PhD thesis University of Florida Gainesville Florida USA pp 1 - 33
Hoover WH Tucker C Harris J Sniffen CF amp De Ondarza MB 2006 Effects of nonstructural
carbohydrate level and starchsugar ratio on microbial metabolism in continuous culture of rumen
contents Anim Feed Sci Technol 128(3 - 4) 307 - 319
Huhtanen P 1988 The effects of barley unmolassed sugar-beet pulp and molasses supplements on
organic matter nitrogen and fibre digestion in the rumen of cattle given a silage diet Anim Feed Sci
Technol 20 259
20
Ishler V Heinrichs J amp Varga G 1996 From feed to milk Understanding rumen function Pennsylvania
State University Extension Circular 422
Available at httpanimsciagrenvmcgillcacourses450extrafeed_to_milkconceptshtml
(Accessed 25 August 2008)
Ishler V amp Varga G 2001 Carbohydrate nutrition for lactating dairy cattle Pennsylvania State University
Code DAS 01 - 29 (online) pp 1 - 11
Available at httpwwwdaspsueduteamdiary
(Accessed 5 August 2008)
Kamra DN 2005 Rumen microbial ecosystem Current Science 89(1) 124 - 135
Knudsen KE 2001 The nutritional significance of lsquodietary fibrersquo analysis Anim Feed Sci Technol 90 3 -
20
Leiva E Hall MB amp Van Horn HH 2000 Performance of dairy cattle fed citrus pulp or corn products as
sources of neutral detergent-soluble carbohydrates J Dairy Sci 83 2866 - 2875
Lykos T Varga GA amp Casper D 1997 Varying degradation rates of total nonstructural carbohydrates
effects on ruminal fermentation blood metabolites and milk production and composition in high
producing holstein cows J Dairy Sci 80(12) 3341 - 3355
McDonald P Edwards RA Greenhalgh JFD amp Morgan CA 2002 Evaluation of food Digestibility In
Animal Nutrition (6th Ed) Pearson Education Ltd Edinburgh Gate Harlow Essex UK pp 246 - 263
Mertens DR 1997 Creating a system for meeting the fibre requirements of dairy cows J Dairy Sci 80
1463 - 1481
Mertens D R Broderick GA amp Simons R 1994 Efficacy of carbohydrate sources for improving
utilization of N in alfalfa silage J Dairy Sci 77(Suppl 1) 240 - 252
Mohney K 2002 Synchronization of carbohydrate and protein metabolism by ruminal microbes in
continuous culture PhD thesis North Carolina State University Raleigh North Carolina USA pp 1 -
69
Morrison FB 1959 Feeds and feeding A handbook for the student and stockman (22nd Ed) Eds The
Morrison Publishing Company Clinton Iowa USA 1165 pp
Mould FL 2003 Predicting feed quality - chemical analysis and in vitro evaluation Field Crops Research
84(1) 31 - 44
21
National Research Council (NRC) 2001 Nutrient requirements of dairy cattle (7th Rev Ed) National
Academy Press Washington DC USA pp 34 - 35
Nocek J E amp Tamminga S 1991 Site of digestion of starch in the gastrointestinal tract of dairy cows and
its effect on milk yield and composition J Dairy Sci 74 3598 - 3629
Nombekela S W amp Murphy MR 1995 Sucrose supplementation and feed intake of dairy cows in early
lactation J Dairy Sci 78 880 - 885
Paggi RA Rodriguez C amp Fay JP 2005 Growth and pectate-lyase activity of the ruminal bacterium
lachnospira multiparus in the presence of short-chain organic acids Lett Appl Microbiol 41 434 -
439
Pell AN amp Schofield P 1993 Computerized monitoring of gas production to measure forage digestion in
vitro J Dairy Sci 76 1063 - 1073
Pell AN Pitt RE Doane PH amp Shofield P 1998 The development use and application of gas
production techniques at Cornell University USA In In vitro techniques for measuring nutrient supply
to ruminants Eds Deaville ER Owen E Adesogan AT Rymer CHuntington JA amp Lawrence
TLJ British Society of Animal Science Edinburgh UK Publication 22 45 - 54
Russell JB OrsquoConnor JD Fox DG Van Soest PJ amp Sniffen CJ 1992 A net carbohydrate and
protein system for evaluating cattle diets Ruminal fermentation J Anim Sci 70 3551 ndash 3561
Schwarz FJ Haffner J amp Krichgessner M 1995 Supplementation of zero-grazed dairy cows with
molassed sugar beet pulp maize or cereal-rich concentrate Anim Feed Sci Technol 54 237 - 248
Stobel HJ amp Russel JB 1986 Effect of pH and energy spilling on bacterial proteien synthesis by
carbohydrate-limited cultures of mixed rumen bacteria J Dairy Sci 69 2941 - 2947
Stokes SR 1997 Balancing carbohydrates for optimal rumen function and animal health In Proceedings
of the West Can Dairy Sem 9 73 - 86
Available at httpwwwwcdsafnsualbertacaProceedings1997ch06-97htm
(Accessed 7 October 2008)
Theodorou MK Williams BA Dhanoa MS McAllan AB amp France J 1994 A simple gas production
method using a pressure transducer to determine the fermentation kinetics of ruminant feeds Anim
Feed Sci Technol 48 185 - 197
Tilley JMA amp Terry RA 1963 A two-stage technique for the in vitro digestion of forage crops J Br
Grassl Soc 18 104 - 111
22
University of Minnesota 1996 Feeding the dairy herd (online)
Available at httpwwwextensionumnedudistributionlivestocksystemscomponentsDI0469-02
(Accessed 5 August 2008)
Van der Merwe FJ amp Smith WA 1991 Dierevoeding Kosmo Publ Stellenbosch South Africa pp 89 -
141 (in Afrikaans)
Van Saun RJ 1993 Dairy cattle nutrition feeding for two In Proceedings of the 1993 Northwest and
Lower Columbia Dairy Short Course January 21 - 22 amp 25 - 26 Everett Washington and Portland
Oregon USA pp 172 - 180
Van Soest PJ 1994 Nutritional ecology of the ruminant (2nd Ed) Cornell University Press Ithaca New
York USA pp 467 - 476
Van Soest PJ amp Wine RH 1967 Use of detergents in the analysis of fibrous feeds IV Contamination of
Plant Cell-wall Constituents J Assoc Off Anal Chem 50 50 - 55
Wilkins RJ 2000 Forages and their role in animal systems In Forage evaluation in ruminant nutrition
Eds Givens DI Owen E Axford RFE Omed HM CAB International Wallingford UK pp 1 -14
Zinn RA amp Ware RA 2007 Forage quality Digestive limitations and their relationships to performance of
beef and dairy cattle 22nd Annual Southwest Nutrition amp Management Conference February 22 - 23
University of California Davis Caifornia USA
Available at httpagarizonaeduansswnmc2007talksZinn_2007SWNMCpdf
(Accessed 16 September 2008)
23
Chapter 3
THE EFFECT OF SUGAR STARCH OR PECTIN ON RATE AND
EXTENT OF GAS PRODUCTION IN DIFFERENT FORAGES
Abstract
The study evaluated the effect of sugar (molasses) starch (maize meal) or pectin (citrus pulp) on total gas production (b)
and rate of gas production (c) of different forages The forage substrates included wheat straw (WS) oat hay (OH)
lucerne hay (LUC) ryegrass (RYE) and kikuyu grass (KIK) The three energy sources as well as a control (no energy
source) were incubated in vitro with each of the above mentioned forages Rumen fluid was collected from two lactating
Holstein cows receiving a diet consisting of oat hay lucerne wheat straw and a concentrate mix Forages alone andor
together with either molasses citrus pulp or maize meal were weighed into 100 ml glass vials and incubated for 72
hours The weights of the energy sources were calculated on an energy equivalent basis Blank vials that contained no
substrates were included to correct for gas production from rumen fluid alone The substrates were incubated in a
mixture of 40 ml buffered medium 2 ml of reducing solution and 10 ml rumen fluid Gas pressure was recorded
automatically every five minutes using a pressure transducer system and the method based on the Reading Pressure
Technique Gas pressure was converted to gas volume using a predetermined regression equation In the first trial the
gas production included gas produced by the energy sources while in the second trial the energy source gas production
was deducted from the total gas production to determine the effect of energy source on gas production of respective
forage substrates per se Data were fitted to two non-linear models Significant forage x energy interactions were
observed for the non-linear parameter b (gas production) in Model 1 and for b and L (lag phase) in Model 2 in both trials
In the first trial the higher fermentability of the energy sources supplemented to forage substrates increased b (Model 1
amp 2) of the LUC and WS (P lt 005) The gas production rate was affected in different ways for different forages with the
most noticeable effect when WS was supplemented with energy sources All the energy sources increased c of WS
irrespective of the model used Energy sources had no effect on the L of LUC OH or RYE but decreased the L of WS (P
= 0004) and KIK (P = 0022) In the second trial maize meal had no effect on b for any of the forages (Model 1 amp 2)
while molasses (Model 1 amp 2) decreased b for all forage substrates and citrus pulp (Model 1 amp 2) decreased b of OH and
RYE to lower values than those of the control treatments Gas production rate was not affected by molasses for any of
the forage substrates while citrus pulp (Model 1 amp 2) increased c of OH and maize meal increased c of OH and KIK
Lag phase was only affected by energy sources in WS (P = 0001) and KIK (P = 0009) where all the energy sources
had lower L values than the control treatment It was concluded that forage fermentability is affected differently by
different energy sources These observations may have important implications for rumen health and milk production
and the data obtained can potentially be used as guidelines in feed formulations
31 Introduction
Forages contribute significant major part of dairy cow diets However forages alone cannot provide all the
energy requirements of high producing dairy cows (Schwarz et al 1995) Forage degradation by rumen
micro-organisms is restricted by the chemical composition and physical quality of the forage (Mertens 1997)
Fibrous feeds are low in energy and a large consumption thereof results in rumen fill thus limiting feed intake
24
(Allen amp Oba 2000) It is important to find ways to improve forage degradation and utilization
Improvements in forage degradation will increase energy intake and subsequently milk production and
performance (Giraldo et al 2008)
Different sources of non-fibre carbohydrates (NFC) have different effects on animal performance
Supplementing forage based diets with energy sources containing sugar starch or pectin results in variation
of performance measurements such as milk yield milk composition dry matter intake (DMI) and feed
efficiency (Larson 2003) Aldrich et al (1993) reported that feeding high rumen-available NFC increased
milk protein percentage slightly (301 vs 307) but significantly Leiva et al (2000) showed that
substituting diets containing 205 citrus pulp for diets containing 195 corn meal yielded more milk
Solomon et al (2000) however reported that substituting starch (maize) diets with pectin (citrus pulp) diets
had no effect on milk yield but increased linoleic acid concentration in milk fat When formulating diets for
dairy cows it is important to understand the digestion and metabolizable nutrient yield of the various NFC
sources (Larson 2003)
The objective of this study was to determine the impact of three energy sources viz maize meal
(representative of starch) molasses (representative of sugar) and citrus pulp (representative of pectin) on
fermentation kinetics of different forage substrates as determined by total gas production (b) and the rate of
gas production (c) Forages commonly used in dairy cow diets in South Africa (wheat straw oat hay lucerne
hay kikuyu and ryegrass) were used as substrates
32 Materials and methods
321 Study area
The study to evaluate the effect of supplementing forage based diets with sugar starch and pectin on rumen
kinetic parameters was conducted at Stellenbosch University Stellenbosch South Africa (33deg 55prime 12Prime S
18deg 51prime 36Prime E)
322 Simulated diets
3221 Basal forages
Five forages (Table 31) were used to prepare rations to simulate diets for lactating dairy cows
25
Table 31 Forages used in simulation diets for lactating dairy cows
Forage Type Abbreviation
Wheat straw (Triticum aestivum) WS
Oat hay (Avena sativa) OH
Lucerne hay (Medicago sativa) LUC
Ryegrass (Lolium multiflorum) RYE
Kikuyu grass (Pennisetum clandestinum) KIK
Rye and kikuyu grasses were harvested after four weeks of re-growth All the forages were oven dried at
60ordmC for 72 hours Wheat straw oat hay and lucerne hay were ground (Cyclotec 1093 mill) through a 2 mm
screen Rye and kikuyu grasses were obtained from the Outeniqua experimental farm (33deg 57prime 0Prime S
22deg 25prime 0Prime E) situated just outside George South Africa (33deg 58prime 0Prime S 22deg 27prime 0Prime E) The rye and kikuyu
grasses were already ground through a 1 mm screen when received
3222 Energy supplements
Three energy sources (Table 32) were selected as supplements to prepare rations that would simulate
lactating cow diets
Table 32 Energy sources used in simulating lactating dairy cow diets
Energy type Source Abbreviation
Starch Yellow maize meal (Zea mays) Mm
Sugar Molasses syrup Mol
Pectin Citrus pulp Cp
These energy feedstuffs were sourced in the following forms molasses as a syrup by-product from the
processing of sugar cane (Officinarum saccharum) citrus pulp as a finely granulated residue by-product from
the peel pulp and seeds of oranges and grapefruit and yellow maize grain The citrus pulp and maize was
milled (Cyclotec 1093 mill) through a 1 mm screen
3223 Defining the diets
A total of 23 simulated diets (forages and forage-concentrate mixes) were prepared
bull 5 diets contained forage substrates only (Table 31)
bull 3 diets contained energy sources only (Table 32)
bull 15 diets contained a mixture of forages (Table 31) and energy sources (Table 32)
26
The final substrate compositions are indicated in Table 34
323 Chemical analyses of forages and energy sources
Samples (1 g) of each forage type and energy sources (1 g) were accurately weighed and placed in a 100ordmC
conventional oven for 24 hours to determine dry matter (DM) content (AOAC 1995 Method 93015)
Organic matter was determined by weighing 1 g of each feedstuff into crucibles and ashing the content at
500ordmC in a muffle furnace for 6 hours (AOAC 1995 Method 94205)
The NDF content was determined by measuring 05 g of each feedstuff into F57 ANKOM fibre analysis bags
The bags were heat sealed and NDF determined using the method of Van Soest et al (1991) Sodium
sulfite (Na2SO3) was added to the NDF solution during digestion and heat-stable amylase was added during
rinsing Ether extract was determined using the AOAC method (AOAC 1995 Method 92039) About 2 g of
ground sample was weighed into a thimble and samples were extracted with diethyl ether (C4H10O)
Acid detergent lignin (ADL) was determined by measuring 05 g of each substrate sample into separate F57
ANKOM fibre analysis bags The bags were heat sealed and acid detergent fibre (ADF) determined using
the method of Van Soest et al (1991) The ADF residue was then soaked in 72 sulphuric acid for three
hours to dissolve the cellulose Acid detergent lignin was determined using the ANKOM method (ANKOM
2005)
Total nitrogen content was determined with a Leco Nitrogen Gas Analyzer custom designed and built by
LECO Africa (Pty) Ltd (Kempton Park) About 01 g of sample was accurately weighed into a small square of
aluminum foil The samples were then ignited inside the Leco furnace at about 900degC according to the
Dumas procedure (AOAC 1990 Method 96806) Crude protein (CP) was calculated by multiplying the
nitrogen content with 625 (AOAC 1995 Method 99003) The results obtained from the chemical analysis
are shown in Table 33
324 Preparation of samples for gas production
The gas production method used was based on the Reading Pressure Technique (Mauricio et al 1999)
Samples of the respective dietary substrates (Tables 34 and 35) were weighed into glass vials with known
volume The vials had a nominal volume of 100 ml but the exact volume of each vial was previously
accurately determined The amount of the energy sources in Table 35 were calculated to provide the same
amount of metabolizable energy (ME) than 0125 g maize DM For calculation purposes ME values were
assumed to be 139 MJkg DM for maize 122 MJkg DM for citrus pulp and 123 MJkg for molasses (NRC
2001) Blank vials were prepared exactly as the others except that they did not contain any substrates in
order to correct for gas production from rumen fluid alone
27
Table 33 Chemical composition (gkg DM plusmn SD) of forages and energy sources used in the trial All values
are on a DM basis
Feedstuff DM OM NDF CP EE ADL
WS 9150 plusmn 05 9022 plusmn 16 8179 plusmn 71 723 plusmn 10 36 plusmn 05 1022 plusmn 30
OH 8504 plusmn 23 9403 plusmn 173 7819 plusmn 110 910 plusmn 12 97 plusmn 08 825 plusmn 03
LUC 8989 plusmn 20 9062 plusmn 18 5153 plusmn 10 2370 plusmn 46 81 plusmn 06 927 plusmn 67
RYE 938 plusmn 10 845 plusmn 05 4892 plusmn 30 2509 plusmn 27 431 plusmn 01 448 plusmn 181
KIK 1242 plusmn 104 1122 plusmn 01 6512 plusmn 20 2534 plusmn 41 283 plusmn 11 480 plusmn 17
mm 8559 plusmn 09 9844 plusmn 13 1743 plusmn 550 1071 plusmn 02 377 plusmn 04 70 plusmn 06
cp 8799 plusmn 09 9285 plusmn 07 2614 plusmn 140 786 plusmn 18 164 plusmn 04 253 plusmn 64
mol 6980 plusmn 19 8927 plusmn 06 ND ND ND ND
DM = dry matter OM = organic matter NDF = neutral detergent fibre CP = crude protein EE = ether
extract ADL = acid detergent lignin ND = not determined WS = wheat straw OH = oat hay LUC = lucerne
RYE = ryegrass KIK = kikuyu grass mm = maize meal cp = citrus pulp mol = molasses
Table 34 Substrate samples containing either forage or energy supplements
Forage type Energy source Sample size (g DM)
Wheat straw - 02500
Oat hay - 02500
Lucerne hay - 02500
Ryegrass - 02500
Kikuyu grass - 02500
- Maize meal 01250
- Citrus pulp 01425
- Molasses 01412
28
Table 35 Composite dietary samples containing forage and energy sources
Forage type Energy source Forage (g DM) Energy (g DM)
Wheat straw Maize meal 01250 01250
Wheat straw Citrus pulp 01250 01425
Wheat straw Molasses 01250
01412
Oat hay Maize meal 01250 01250
Oat hay Citrus pulp 01250 01425
Oat hay Molasses 01250
01412
Lucerne hay Maize meal 01250 01250
Lucerne hay Citrus pulp 01250 01425
Lucerne hay Molasses 01250 01412
Ryegrass Maize meal 01250 01250
Ryegrass Citrus pulp 01250 01425
Ryegrass Molasses 01250
01412
Kikuyu grass Maize meal 01250 01250
Kikuyu grass Citrus pulp 01250 01425
Kikuyu grass Molasses 01250 01412
325 Preparation of the in vitro medium and reducing solution
The incubation medium was prepared as described by Van Soest amp Robertson (1985) The medium
consisted of micro minerals macro-mineral solution buffer solution tryptose rezasurin and distilled water
The medium was kept in a water bath at 395ordmC The pH of the medium was about 78 Reducing solution
was prepared as described by Van Soest amp Robertson (1985) and consisted of cysteine hydrochloride
(C3H7NO2HCL) potassium hydroxide (KOH) pellets sodium sulfide nonahydrate (Na2S9H2O) and distilled
water
326 Collection and preparation of rumen fluid
Rumen fluid was collected from two ruminally cannulated lactating Holstein cows The cows were confined
and received 25 kg per day (air dry basis) of a diet consisting of oat hay lucerne hay wheat straw and a
concentrate mix The total diet contained 11279 gkg CP 55948 gkg NDF and 5950 gkg ash with a
calculated ME content of 108 MJkg The diet was offered in two equal amounts viz 125 kg in the morning
(0630) and 125 kg in the afternoon (1630) Rumen fluid was squeezed through two layers of cheese cloth
into pre-warmed thermos flasks and a handful of solid material was added The rumen fluid was then
blended in a pre-warmed blender at a low speed for 10 seconds The rumen fluid was then filtered through
29
four layers of cheese cloth into pre-warmed beakers while flushing with carbon dioxide (CO2) The
temperature of the rumen fluid averaged 38ordmC and the pH averaged 58
327 In vitro incubation
The glass vials were flushed with CO2 while adding 40 ml of the medium and 2 ml of the reducing solution to
each vial A magnetic stirrer (02 ml) was also placed into each vial The vials were then lightly closed with
rubber stoppers and placed in the incubator at 39ordmC until the medium was reduced (ie clear) Vials were re-
opened and 10 ml of rumen fluid was added while flushing with CO2 The vials were then closed tightly with
rubber stoppers crimp sealed and connected via needles to a pressure logging system The vials were
placed on magnetic stirrer plates in an incubator at 39ordmC and were constantly stirred at a low speed The
material was incubated for 72 hours and gas pressure was recorded automatically every five minutes using a
pressure transducer system that was custom designed and built by Eagle Technology (Pty) Ltd (Cape Town)
based on the Reading Pressure Technique (RPT) (Mauricio et al 1999) Gas pressure was released on
regular intervals to prevent pressure build-up in the vials
328 Converting gas pressure to gas volume
Gas pressure data were converted to gas volume using the following linear regression equation developed
by Goosen (2004) for Department of Animal Sciencesrsquo in vitro lab
OMCXY )])09770((1000[=
Where Y = Gas volume (mlg OM)
X = Gas pressure (psi)
C = Vial head space (ml)
OM = Organic Matter (mg)
329 Estimating kinetic coefficients
Kinetic coefficients for gas production were derived from the gas volume data using the solver option in Excel
and the non-linear models 1 and 2 (with and without a lag phase respectively) The models are based on the
modified version described by Oslashrskov and McDonald (1979)
30
Model 1 ⎟⎠⎞
⎜⎝⎛ minusminus= ctebY 1
Model 2 ( )⎟⎠⎞
⎜⎝⎛ minusminusminus= LtcebY 1
Where Y = gas volume at time t
b = total gas production
c = rate of gas production
t = incubation time
L = lag time
33 Statistical analysis
The first derivatives b and c (Model 1) and b c and L (Model 2) were subjected to statistical analysis The
experiment was a two way cross classification and data was subjected to a factorial ANOVA with the factors
forage and energy using Statistica 81 (2008) This was done for all the non-linear parameters Main effects
were interpreted in the cases where no interaction was observed Significant forage x energy source
interactions were observed for the non-linear parameter b in Model 1 and for b and L in Model 2 Therefore
a one-way ANOVA was done on each of the forages to determine the effect of energy sources Differences
between means were determined with a Tukey test and significance was declared at P lt 005
34 Results and discussion
341 Gas production including that from the energy sources
Results of total gas (b) and rate (c) of gas production are presented in Table 36 Pasture grasses had
higher gas volumes than mature forages before substitution with energy sources Gas volume is generally a
good indicator of digestibility fermentability and microbial protein production (Sommart et al 2000)
Substitution with energy sources tended to raise gas production (Table 36) When maize meal replaced
50 of the forage substrate total 72 hour gas production was increased in the case of lucerne and wheat
straw irrespective of the model used In wheat straw total gas production was also increased with citrus
pulp supplementation (Models 1 amp 2) and with molasses (Model 2) For the other forages (oat hay ryegrass
and kikuyu) energy supplements did not have an effect on total gas production values The total (72 hour)
gas production values represent the sum of forage and energy source fermentations except for the control
31
treatment where the substrates were forages only The higher gas production values observed with energy
supplementation (especially for wheat straw) was due to the energy sources being more readily fermentable
and easily available to rumen micro-organisms Energy sources are also low in NDF and ADL (Table 33)
which would increase gas production as there exists a negative correlation between gas production and
plant cell wall content (Sallam 2005)
The rate of gas production (c) of forage substrates alone ranged between 003 and 009 mlh with lucerne
and ryegrass having the highest rates When the respective energy sources replaced 50 of the forage
substrates there were variable positive responses in terms of c of different forage substrates In general
energy sources tended to raise the rate of gas production probably due to the higher nutrient content and
easier accessibility of chemical constitutes to rumen microbial enzymes as compared to the forage
substrates alone (Arigbede et al 2006) In lucerne hay molasses increased c compared to the control
treatment (Model 1 amp 2) Maize meal had no effect on c when compared to the control treatment The latter
agrees with Mertens amp Loften (1980) where starch increased the lag time but had no effect on digestion rate
of lucerne This would suggest that the addition of energy sources to forage substrates do not decrease
fibre digestibility by lowering the rate of fermentation In oat hay citrus pulp had the biggest effect on c (both
models) while with Model 1 molasses also increased c Maize meal (both models) tended to increase c but
not significantly compared to the control treatment The most noticeable effect of forage substitution with
energy sources was observed for wheat straw In this case all the energy sources increased the rate of gas
production irrespective of the model used While the other forages have moderate fermentation potentials
(as can be seen from the b and c values) the fermentability of wheat straw is low resulting in a higher
response when energy was supplemented In ryegrass maize meal had no effect on c (Model 1 amp 2) while
citrus pulp (Model 1) and molasses (both models) improved c compared to the control treatment Citrus pulp
increased gas production rate in kikuyu (P lt 005) when Model 1 was used while maize meal and molasses
only tended to increase c Supplementation with citrus pulp tended to improve gas production rates of
forages more than maize meal Citrus pulp is high in degradable NDF resulting in less negative effects on
cellulolytic bacteria and the ruminal environment than starch supplementations (Bampidis amp Robinson
2006) Unlike sugars and starches pectin substances do not lower the rumen pH (Mohney 2002) Pectin
supplementation would thus sustain an optimal ruminal environment for cellulolytic bacteria functions
explaining the better gas production rates resulting from forages supplemented with citrus pulp Leiva et al
(2000) also reported that citrus pulp ferment at a faster rate than corn hominy Energy source had no
significant effect on gas production rate of kikuyu in Model 2 It thus seems that energy sources per se
tended to improve forage gas production rate Energy sources are high in nutrients that are easily available
and rapidly fermentable by rumen micro-organisms Hiltner amp Dehority (1983) found that forage digestion
improved with energy sources supplementation due to an increase in the number of rumen micro-organisms
available to help with fermentation
When the respective energy sources replaced 50 of the forage substrates a significant forage x energy
source interaction was observed for the lag phase Different lag times of forage substrates (control
treatments) may be the result of differences in plant tissue composition between forages that require different
degrees of physical or chemical changes before rumen micro-organisms can start with fibre digestion
(Mertens amp Loften 1980) Lucerne fermented alone had almost no lag phase but supplementation of maize
32
meal tended (P = 0069) to increase the lag phase Adesogan et al (2005) found that maize and citrus pulp
incubated individually had longer lag phases when compared to hays (P lt 0001) agreeing with results
obtained in this study that the energy sources tended to lengthen the lag phase of lucerne hay The longer
lag phase for the maize and citrus pulp treatments might be associated with a high proportion of cellulolytic
micro-organisms in the rumen fluid The diet of the cannulated cows consisted predominantly of oat hay
lucerne hay and wheat straw and might have resulted in insufficient numbers of pectin-fermenting and
amylolytic bacteria in the collected rumen fluid to instantly colonize the citrus pulp and maize respectively
(Adesogan et al 2005) The results also agree with the work of Mertens amp Loften (1980) where starch
increased the lag time but had no effect on digestion rate of lucerne Possible reasons include a delay in
fermentation due to microbial colonization (Chesson amp Forsberg 1988) In contrast Haddad amp Grant (2000)
found that a reduction in NFC content substituted to lucerne based diets in vitro increased the lag time of
lucerne
Table 36 Effects of maize meal citrus pulp and molasses as energy sources on fermentation kinetics of
different forage substrates as measured by in vitro gas production Gas production of both energy sources
and forage substrates are included
Treatment
Item Maize meal Citrus pulp Molasses Control
SEm
P
Lucerne hay
Model 1
b 3981 b 3500 ab 3342 ab 2701 a 2498 0025
c 009 a 011 ab 014 b 009 a 001 0005
Model 2
b 3965 b 3490 ab 3340 ab 2700 a 2513 0028
c 010 a 011 ab 015 b 009 a 001 0013
L 045 033 009 005 011 0069
Oat hay
Model 1
b 3982 3654 3150 2966 372 0250
c 008 ab 011 b 008 b 004 a 001 0002
Model 2
b 3971 3654 3150 2951 3745 0253
c 008 ab 011 b 008 ab 005 a 001 0004
L 032 0 0 036 013 0125
33
Table 36 (continue) Effects of maize meal citrus pulp and molasses as energy sources on fermentation kinetics of different forage substrates as measured by in vitro gas production Gas production of both energy sources and forage substrates are included
Wheat straw
Model 1
b 3706 b 3591 b 3062 ab 2460 a 1876 0002
c 008 b 010 b 009 b 003 a 001 0001
Model 2
b 3696 b 3591 b 3062 b 2289 a 1796 0001
c 008 b 010 b 009 b 003 a 001 0001
L 032 b 000 b 000 b 225 a 040 0004
Ryegrass
Model 1
b 4492 4113 3777 3727 3454 0406
c 008 a 012 b 012 b 008 a 001 0001
Model 2
b 4471 4106 3776 3711 3475 0422
c 008 a 012 cb 012 b 009 ac 001 0006
L 051 024 003 054 018 0213
Kikuyu grass
Model 1
b 4236 4269 3902 3230 2634 0055
c 009 ab 011 b 010 ab 005 a 001 0025
Model 2
b 4224 4266 3902 3776 2403 0425
c 010 011 010 006 001 0059
L 026 ab 011 b 000 b 163 a 035 0022
b = Total gas production (mlg OM) c = gas production rate (mlh) L = Lag time (h)
Model 1 Y = b + (1 ndash e-ct) Model 2 Y = b + (1 ndash e-c(t-L)) Superscripts are comparing across rows
The lag phase for oat hay was about 22 minutes and was not significantly affected by energy source The
greatest effect of forage substitution with energy sources was observed for wheat straw where all the energy
sources shortened the lag phase compared to the control treatment where wheat straw had a lag phase of
more than 2 hours In ryegrass treatment had no significant effect on lag phase but molasses tended to
decrease the lag phase In kikuyu the lag phase was significantly shortened when supplemented with citrus
pulp and molasses (P lt 005) while maize meal only tended to shorten the lag Hiltner amp Dehority (1983)
also found a decrease in lag times of fibre digestion when soluble carbohydrates were added to in vitro
incubations They concluded that the decrease in lag phase was due to an increase in bacteria numbers
helping with digestion as they found similar results when they increased the inoculum
The parameters presented in Table 36 (Model 2) were used to construct Figures 31 - 36 The data
presented in the figures represent total gas production including that of the energy sources
34
0
50
100
150
200
250
300
350
400
450
0 10 20 30 40 50 60 70 80
Gas
Pro
duct
ion
(mlg
OM
)
Time (hours)
Lucerne hay
Oat hay
Wheat straw
Ryegrass
Kikuyu grass
Figure 31 Gas production of forage substrates alone
Figure 31 show differences in fermentation characteristics of the different forages Variations in NDF ADL
and CP contents of these forages (Table 33) as well as different arrangements of their cell-wall
polysaccharides (Cheng et al 1984) are most likely responsible for different fermentation characteristics
observed between forage substrates The fermentation patterns of the forages are functions of the forage
type as well as the physiological stage at which they were harvested both of which affect their chemical
composition The grasses (ryegrass and kikuyu) were immature (28 days of re-growth) Lucerne and oat
hay were harvested at the 10 flowering stage while wheat straw was a mature forage As forages mature
their NDF and ADL contents increase (McDonald et al 2002) Wheat straw had the highest NDF and ADL
contents (Table 33) Although lucerne hay had a relatively low NDF content its ADL content was quite high
compared to kikuyu which had a fairly high NDF content but a low ADL content resulting in the early cut
grasses to manifest a much higher fermentability profile than the other forages Figure 31 clearly indicates
that wheat straw has a much lower fermentability both in terms of total gas production and rate of gas
production than the other forages Wheat straw also has a much longer lag phase compared to other
forages The lower fermentability and longer lag phase of wheat straw which is a mature forage can be
explained by the tissue content of wheat straw that is high in NDF and ADL (which is negatively correlated
with gas production) subsequently requiring more physical and chemical alterations before bacteria in the
rumen can start digestion The high rate and extent of gas production from both ryegrass and kikuyu can
also be observed (Figure 31) Apart from readily fermentable fibre these pasture grasses are also high in
nitrogen (Table 33) and total carbohydrates which are both needed for optimal growth of rumen micro-
organisms and thus fermentation (NRC 2001)
35
The effect of energy sources on the fermentation profiles of the different forages can be observed in Figures
32 - 36
0
50
100
150
200
250
300
350
400
450
0 10 20 30 40 50 60 70 80
Gas
Pro
duct
ion
(mlg
OM
)
Tme (hours)
Maize mealCitrus pulpMolassesControl
Figure 32 Gas production of lucerne hay when supplemented with different energy sources
Substituting 50 of the forages with an energy source improved gas production (Figures 32 - 36) probably
by boosting microbial growth Maize meal and citrus pulp had the biggest effect throughout Molasses is a
fast fermenting simple sugar (Hall 2002) which is rapidly utilized explaining the fast increase in gas
production followed by a plateau soon afterwards Maize meal and citrus pulp other than molasses are
more complex energy sources which ferment slower and are available over a longer period of time As
mentioned before wheat straw was a mature forage compared to ryegrass and kikuyu which were harvested
after only 28 days of re-growth while lucerne and oat hay were harvested at 10 flowering stage
Ryegrass lucerne and kikuyu are high in nitrogen (Table 33) Sufficient nitrogen ensures nitrogen-energy
coupling to occur at a greater extent thereby ensuring more efficient microbial fermentation and cellulose
degradation by rumen bacteria (NRC 2001) As forages mature the NDF and ADF contents increase and
CP (supplying nitrogen) decreases making less nitrogen readily available to rumen micro-organisms for
fermentation (Ghadaki et al 1975) This may explain why maize meal and citrus pulp had higher impacts
than molasses on gas production of the mature forages Citrus pulp and maize meal release energy at a
slower rate which match the slow release of nitrogen in mature forages Also even though small these
energy sources contributes rumen degradable protein (RDP) which with substrates like wheat straw (that
has very low CP content) could be quite substantial It should be kept in mind though that the gas
production profiles in these figures reflect the combination of forages and energy sources
36
0
50
100
150
200
250
300
350
400
450
0 10 20 30 40 50 60 70 80
Gas
Pro
duct
ion
(mlg
OM
)
Time (hours)
Maize mealCitrus pulpMolassesControl
Figure 33 Gas production of oat hay when supplemented with different energy sources
0
50
100
150
200
250
300
350
400
450
0 10 20 30 40 50 60 70 80
Gas
Pro
duct
ion
(mlg
OM
)
Time (hours)
Maize mealCitrus pulpMolassesControl
Figure 34 Gas production of wheat straw when supplemented with different energy sources
37
0
50
100
150
200
250
300
350
400
450
0 10 20 30 40 50 60 70 80
Gas
Pro
duct
ion
(mlg
OM
)
Time (hours)
Maize mealCitrus pulpMolassesControl
Figure 35 Gas production of ryegrass when supplemented with different energy sources
0
50
100
150
200
250
300
350
400
450
0 10 20 30 40 50 60 70 80
Gas
Pro
duct
ion
(mlg
OM
)
Time (hours)
Maize mealCitrus pulpMolassesControl
Figure 36 Gas production of kikuyu grass when supplemented with different energy sources
342 Gas production parameters including that of forage and energy sources in cases where no interaction was observed
In the cases where in vitro gas production parameters showed no interactions the main effects are
discussed Gas production values of the different forages (Models 1 amp 2) differed (P lt 005) from each other
38
independent of the energy source supplemented (Table 37) The NDF ADL and CP content of the forages
differed (Table 33) The differences in chemical and physical tissue structure probably influenced their
fermentation kinetic patterns (Figure 31) In Model 1 ryegrass resulted in higher gas productions than oat
hay wheat straw and lucerne but did not differ from kikuyu In Model 2 the same trend was seen for gas
production with kikuyu and ryegrass having higher values than lucerne oat hay and wheat straw The
reason for the higher gas production from ryegrass compared to lucerne wheat straw and oat hay are due to
the lower NDF and ADF contents of ryegrass resulting in higher gas production (Sallam 2005) Ryegrass
and kikuyu as mentioned before were harvested young compared to the other forages These pasture
grasses therefore had more rapidly fermentable sugar resulting in higher gas production values Ryegrass
and kikuyu are also high in CP (Table 33) which is essential for optimal rumen fermentation as it supplies
the rumen micro-organisms with nitrogen that is important for their growth Gas production rates differed for
among forages (P lt 005) irrespective of the energy source Ryegrass and lucerne had higher c values than
oat hay and wheat straw
Table 37 In vitro gas production parameters of forages as affected by energy sources as main effects in
cases where no interactions were observed Gas production of both energy sources and forage substrates
are included
Forage Item Lucerne
hay Oat hay Wheat
straw Ryegrass Kikuyu grass SEm P
Model 1
b 3381 ac 3438 ac 3205 a 4027 b 3909 bc 1457 lt0001
Model 2
b 3374 a 3431 a 3159 a 4016 b 4042 b 1439 lt0001
c 011 b 008 a 008 a 010 bc 009 ac 001 lt0001
b = Total gas production (mlg OM) c = gas production rate (mlh)
Model 1 Y = b + (1 ndash e-ct) Model 2 Y = b + (1 ndash e-c(t-L)) Superscripts are compared across rows
The total gas production values of forage substrates (Models 1 amp 2) differed (P lt 005) for each energy
source supplemented (Table 38) Maize meal and citrus pulp supplementations resulted in higher forage
gas production values than the control treatment (Model 1 amp 2) Maize meal tended to have higher gas
production than citrus pulp supporting the theory of Sallam (2005) that feedstuffs higher in NDF and ADF
content result in lower gas production Gas production rate (c) of the forages were all higher for the energy
source treatments than that of the control treatment (P lt 005) indicating the faster fermentation potential of
the energy sources The highest gas production rates were achieved when forages were supplemented with
citrus pulp and molasses irrespective of the forage substrate used Pectin substances other than starches
and sugars produce no lactic acid (Van Soest 1994) Pectin subsequently does not tend to lower the
rumen pH as much as sugars and starches thus sustaining optimal ruminal environments for cellulolytic
bacteria This could partly explain the better gas production rates of forages supplemented with citrus pulp
39
Table 38 In vitro gas production parameters of forages (irrespective of forage substrate used) as affected by
different energy sources as main effects in cases where no interactions were observed Gas production of
both energy sources and forage substrates are included
Energy source Item Maize meal Citrus pulp Molasses Control SEm P
Model 1
b 4079 b 3825 bc 3446 ac 3017 a 1303 lt0001
Model 2
b 4065 b 3821 bc 3446 ac 3085 a 1287 lt0001
c 009 b 011 c 011 c 006 a 000 lt0001
b = Total gas production (mlg OM) c = gas production rate (mlh)
Model 1 Y = b + (1 ndash e-ct) Model 2 Y = b + (1 ndash e-c(t-L)) Superscripts are compared across rows
343 Gas production excluding that from energy sources
Gas production values from the respective energy sources alone were obtained from separate fermentations
where forage substrates were omitted These values were subtracted from total gas production values
where forages and energy sources were incubated together to calculate the effect of energy sources on gas
production of the respective forage sources per se (Table 39)
When the maize meal gas production was deducted from the total gas production there was no difference
between the control and the maize meal supplemented treatments in any of the forages (Models 1 amp 2)
When molasses gas production was deducted from the total gas production however total gas production
from forages in the molasses supplemented treatments was lower than that of the control treatments in all
forage substrates irrespective of the model used In oat hay molasses lowered gas production more than in
any of the other treatments including the control treatment In oat hay and ryegrass (both models) and in
lucerne hay (Model 2) citrus pulp as energy source also decreased forage gas production compared to the
control treatment The lower gas production after energy sources gas production was deducted illustrate that
energy sources were the main reason for the higher gas production presented earlier in treatments with
forage and energy source combinations as substrates Gas production is negatively correlated with NDF
and ADL content (Sallam 2005) Energy sources had lower NDF and trace amounts of lignin content when
compared to forage substrates (Table 33) supporting the theory of higher gas production observed after
energy inclusions in the simulated dairy cow diets Energy sources per se thus seemed to increase the rate
of forage digestion but maintained or decreased the digestibility of forages Possible reasons for the lower
digestibility as determined by gas production can be because micro-organisms first attack the easily
fermentable energy sources before starting with fibre digestion
40
Deducting energy source gas production resulted in variable positive responses in terms of rate of gas
production from forage substrates In oat hay maize meal and citrus pulp treatments both improved c
compared to the control treatment (Models 1 amp 2) In kikuyu grass maize meal had a profound effect and
increased c when compared to the control treatment For the other forages (lucerne wheat straw and
ryegrass) deduction of the energy sources had no effect on fermentation rate
Deducting energy source gas production values indicated that treatment with energy sources affected the lag
phase differently for the different forages Lucerne hay oat hay and ryegrass had short lag phases which
were not affected by energy source Citrus pulp and maize meal however tended to increase the lag phase
of lucerne hay Similar results were obtained by Adesogan et al (2005) who found that maize and citrus
pulp resulted in a longer lag phase than hays (P lt 0001) The diet of the cows consisted predominantly of
oat hay lucerne hay and wheat straw The diet of donor cows thus had high proportions of cellulolytic micro-
organisms and less pectin-fermenting and amylolytic bacteria needed to colonize citrus pulp and maize meal
respectively explaining the longer lag phase of maize meal and citrus pulp (Adesogan et al 2005) Kikuyu
and wheat straw had long lag phases compared to the other forages All the energy sources significantly
shortened the lag phase of wheat straw and kikuyu
Table 39 Effects of maize meal citrus pulp and molasses as energy sources on fermentation kinetics of
different forage substrates as measured by in vitro gas production Gas production resulting from energy
sources was deducted from total gas production
Treatment
Item Maize meal Citrus pulp Molasses Control SEm P
Lucerne hay
Model 1
b 2293 ab 1974 ab 1789 b 2837 a 2063 0018
c 009 010 015 009 002 0103
Model 2
b 2192 ab 1959 b 1789 b 2836 a 1836 0008
c 012 011 015 009 002 0189
L 023 076 006 005 023 0166
Oat hay
Model 1
b 2842 ab 2367 b 1761 c 3283 a 1315 0001
c 008 b 010 b 004 a 004 a 001 0001
Model 2
b 2842 ab 2367 b 1761 c 3273 a 1317 0001
c 008 b 010 b 004 a 004 a 001 0001
L 000 000 000 017 007 0240
41
Table 39(continue) Effects of maize meal citrus pulp and molasses as energy sources on fermentation kinetics of different forage substrates as measured by in vitro gas production Gas production resulting from energy sources was deducted from total gas production
Wheat straw
Model 1
b 2108 ab 1903 ab 1510 b 2499 a 1657 0009
c 008 007 006 002 002 0110
Model 2
b 2108 ab 1903 ab 1510 b 2312 a 1559 0020
c 008 007 006 003 002 0168
L 000 b 000 b 000 b 229 a 036 0001
Ryegrass
Model 1
b 2845 ab 2429 b 2093 b 3995 a 291 0003
c 008 010 011 008 001 0324
Model 2
b 2835 ab 2419 b 2092 b 3983 a 2934 0004
c 009 010 011 009 001 0459
L 040 062 005 039 029 0588
Kikuyu grass
Model 1
b 2500 ab 2611 ab 2193 b 3349 a 2369 0028
c 012 b 010 ab 008 ab 005 a 001 0017
Model 2
b 2499 ab 2610 ab 2193 b 3243 a 2408 0050
c 012 b 010 ab 008 ab 005 a 002 0040
L 007 b 012 b 000 b 173 a 034 0009
b = Total gas production (mlg OM) c = gas production rate (mlh) L = Lag time (h)
Model 1 Y = b + (1 ndash e-ct) Model 2 Y = b + (1 ndash e-c(t-L)) Superscripts are compared across rows
Hiltner amp Dehority (1983) similarly found that the addition of soluble carbohydrates to in vitro incubations
decreased the lag time of fibre digestion They concluded that supplementation increased bacteria numbers
thus decreasing the lag phase by supporting fibre digestion They found similar results with increased
amounts of inoculum A possible reason for the long lag phase of kikuyu grass may be because it was
heavily fertilized with nitrogen Marais et al (1988) showed that nitrite derived from high nitrate pastures
resulted in reduced in vitro digestibility as it affected rumen microbial function The long lag phase of wheat
straw was probably due to the high NDF content which is slowly digested and the high ADL content which is
not digested by rumen micro-organisms The latter could also have an effect on the structure of the fibre
matrix making it more difficult for rumen organisms to reach the more digestible fibre fractions The short
lag phases of lucerne and oat hay could partially be explained by the fact that the cannulated cows received
diets containing these substrates but also because their chemical composition allows higher digestibility
compared to wheat straw In general it would appear that the supplementation of forages with various
42
energy sources had a negative effect on total gas production but increased the rate of gas production in
some instances
Profiles of forage fermentation after deduction of energy source values are illustrated in Figures 37 ndash 312
0
50
100
150
200
250
300
350
400
450
0 10 20 30 40 50 60 70 80
Gas
Pro
duct
ion
(mlg
OM
)
Time (hours)
Lucerne hayOat hayWheat strawRyegrassKikuyu grass
Figure 37 Gas production of forage substrates after gas production of energy sources has been deducted
Variations in fermentation patterns of different forages are illustrated in Figure 37 All the forages differed in
terms of gas production lag phase and gas production rate This is probably due to differences in their cell-
wall polysaccharide arrangements (Cheng et al 1984) as well as NDF ADL and CP composition (Table
33) It is clear that wheat straw has a much lower fermentability both in terms of total gas production and
rate of gas production than the other forages As forages mature their NDF and ADL contents increase
(McDonald et al 2002) Wheat straw had the highest NDF and ADL contents (Table 33) The NDF and
ADF contents of diets are negatively correlated with gas production (Sallam 2005) which would explain the
lower gas production of wheat straw in comparison with the other forages Wheat straw is also very low in
CP (Table 33) Crude protein provides rumen micro-organisms with nitrogen needed for optimal growth and
fermentation Ryegrass and kikuyu show a high rate and extent of gas production maybe due to the lower
NDF and ADL and higher CP contents as compared to wheat straw Although lucerne hay had a relatively
low NDF content its ADL content was quite high compared to kikuyu which had a higher NDF content but a
low ADL content resulting in the early cut grasses to manifest a much higher fermentability profile than the
other forages
43
0
50
100
150
200
250
300
350
400
450
0 10 20 30 40 50 60 70 80
Gas
Pro
duct
ion
(mlg
OM
)
Time (hours)
Maize meal
Citrus pulp
Molasses
Control
Figure 38 The net effect of energy supplements on gas production of lucerne hay
0
50
100
150
200
250
300
350
400
450
0 10 20 30 40 50 60 70 80
Gas
Pro
duct
ion
(mlg
OM
)
Time (hours)
Maize mealCitrus pulpMolassesControl
Figure 39 The net effect of energy supplements on gas production of oat hay
44
0
50
100
150
200
250
300
350
400
450
0 10 20 30 40 50 60 70 80
Gas
Pro
duct
ion
(mlg
OM
)
Time (hours)
Maize meal
Citrus pulpMolassesControl
Figure 310 The net effect of energy supplements on gas production of wheat straw
0
50
100
150
200
250
300
350
400
450
0 10 20 30 40 50 60 70 80
Gas
Pro
duct
ion
(mlg
OM
)
Time (hours)
Maize mealCitrus pulpMolassesControl
Figure 311 The net effect of energy supplements on gas production of ryegrass
45
0
50
100
150
200
250
300
350
400
450
0 10 20 30 40 50 60 70 80
Gas
Pro
duct
ion
(mlg
OM
)
Time (hours)
Maize mealCitrus pulpMolassesControl
Figure 312 The net effect of energy supplements on gas production of kikuyu grass
In many of these figures the control clearly did not reach a plateau in the 72 hour incubation period This
enforces the findings that the energy sources increased the rate of gas production especially during the
earlier parts of the incubation
344 Gas production parameters excluding that of energy sources in cases where no interaction was observed
The in vitro gas parameters that showed no interactions were interpreted in terms of main effects Gas
production values from the energy sources were deducted from the total gas production to derive forage gas
production values (Table 310) It can be seen that the gas production values of the forage substrates
differed (P lt 005) from each other independent of the deducted energy source (Models 1 amp 2) Gas
production resulting from wheat straw differed from ryegrass oat hay and kikuyu but not from lucerne (both
models) The higher gas production of ryegrass and kikuyu compared to wheat straw results from the
higher NDF and ADF contents of wheat straw which negatively affected its gas production (Sallam 2005)
Rate of gas production (c) also differed (P lt 005) between forages independent of energy source (Model 2)
Oat hay and wheat straw had lower c-values than ryegrass and lucerne but did not differ from kikuyu The
lower gas production rate of wheat straw and oat hay can be due to the maturity of these forages These
forages contain less readily fermentable substrates and more NDF and ADL compared to immature ryegrass
and kikuyu cut at 28 days of re-growth
46
Table 310 In vitro gas production parameters of forages as affected by energy sources as main effects in
cases where no interactions were observed Gas production resulting from energy sources was deducted
from total gas production
Forage
Item Lucerne hay Oat hay Wheat
straw Ryegrass Kikuyu grass
SEm P
Model 1
b 2223 ab 2563 bc 2005 a 2840 c 2663 c 1068 lt0001
Model 2
b 2194 ab 2561 bc 1959 a 2832 c 2636 c 1047 lt0001
c 012 b 007 a 006 a 010 b 009 ab 001 lt0001
b = Total gas production (mlg OM) c = gas production rate (mlh)
Model 1 Y = b + (1 ndash e-ct) Model 2 Y = b + (1 ndash e-c(t-L)) Superscripts are compared across rows
The effect of energy source treatment on forage fermentation is presented in Table 311 Energy sources
differed in terms of total gas produced by forages as a group It appeared that deduction of gas production
resulting from energy supplementation lowered total gas production of forages when either of the two models
was used Molasses resulted in the lowest total gas production from forages With Model 2 all the energy
sources increased the rate of fermentation of forage substrates but no differences occurred between energy
sources The increase in fermentation rates might suggest that energy supplementation does not
necessarily result in lower fibre digestion as observed by Mertens amp Loften (1980) by reducing their
fermentation rates (Miller amp Muntifering 1985) The increase in rate of gas production of forages after
energy sources substitution may be due to their higher nutrient content and easier accessibility of the energy
sources chemical constitutes to rumen microbial enzymes (Arigbede et al 2006)
Table 311 In vitro gas production parameters of forages (irrespective of forage substrate used) as affected
by different energy sources as main effects in cases where no interactions were observed Gas production
resulting from energy sources was deducted from total gas production
Energy source
Item Maize meal Citrus pulp Molasses Control SEm P
Model 1
b 2518 b 2257 b 1869 c 3193 a 955 lt0001
Model 2
b 2495 b 2251 b 1869 c 3130 a 937 lt0001
c 010 b 010 b 009 b 006 a 001 lt0001
b = Total gas production (mlg OM) c = gas production rate (mlh)
Model 1 Y = b + (1 ndash e-ct) Model 2 Y = b + (1 ndash e-c(t-L)) Superscripts are compared across rows
47
35 Conclusion
Forage diets alone do not provide in the high energy requirements of lactating cows Lactating cows
produce large quantities of milk which can only be maintained if forage diets are supplemented with
concentrates Supplementation of dairy cow diets with optimal amounts of energy substrates provide the
high producing dairy cow with energy needed to improve fibre digestibility and utilization Energy improves
the total digestibility of a diet when forages are supplemented with energy sources but decreases the
utilization of the forage component per se Possible reasons for the latter could be the structure of the fibre
matrix making it more difficult for rumen organisms to reach the more digestible fractions in forages thereby
digesting first the easily fermentable energy sources before attacking the more complex fibre fractions It
should be noted however that overfeeding of energy supplements increase the risks of acidosis due to the
production of large amounts of lactic acid subsequently lowering milk production and income
Looking at the individual forage fermentation kinetics irrespective of the energy source used it is evident
that the pasture grasses had higher total gas production values than the straw and hays This is most likely
because the pasture grasses were cut after only 28 days of re-growth whereas the hays and straw were
more mature and of lower quality especially the straw The pasture grasses thus had more readily
fermentable nutrients and less NDF and ADL than the hays and straw leading to higher gas production
values The fermentation rate of the forages supplemented with energy sources differed amongst each
other with lucerne and ryegrass having the fastest fermentation rates irrespective of the energy source
supplemented Gas production of forages supplemented with citrus pulp and maize meal were higher
compared to molasses Molasses produced a greater volume of gas during the first few hours of incubation
but it was also quickly depleted due to its high content of readily fermentable sugars These sugars are
highly soluble and rumen micro-organisms have easy access to induce fermentation The gas production
rate of forages supplemented with energy sources was higher than the control treatments (forages alone)
with molasses and citrus pulp resulting in the highest rates It thus seemed that supplementation of energy
sources improved forage fermentability as well as the rate of forage fermentation This could have major
implications in practice as there is a need to find ways of improving fibre utilization in South Africa
The effect of the energy sources on the fermentation kinetics of different forages per se showed a decrease
in gas production and lag phase but a tendency to raise gas production rate Molasses decreased gas
production the most throughout all the forage substrates A possible reason may be that the rumen micro-
organisms first digest the fast fermentable simple sugar substrates before starting with substrates that are
digested at a slower rate The raise in gas production rate and decrease in lag time may be due to a higher
number of rumen micro-organisms available to ferment the feed when energy sources were added to the
forage substrates thus supporting digestion
Little research has been done on this and related topics to quantify the relationship between different
carbohydrate sources and rumen metabolism parameters leaving room for improvement and further studies
More research is also needed with regard to inclusion levels of different energy sources in lactating cow diets
and the potential outcomes regarding milk production and rumen health
48
36 References
Adesogan T Krueger NK amp Kim SC 2005 A novel wireless automated system for measuring
fermentation gas production kinetics of feeds and its application to feed characterization Anim Feed
Sci Technol 123 - 124(1) 211 - 223
Aldrich JM Muller LD amp Varga GA 1993 Nonstructural carbohydrates and protein effects on rumen
fermentation nutrient flow and performance of dairy cows J Dairy Sci 76 1091 - 1105
Allen M amp Oba M 2000 Getting more milk from forages Michigan Dairy Review 5(4) Michigan State
University
Available at
httpwwwadmanicomalliancedairyTechBulletinsNon20Structural20Carbohydrate20Nutrition
htm
(Accessed 5 August 2008)
ANKOM 2005 Method for determining acid detergent lignin in beakers ANKOM Technology 0805
AOAC 1990 Official Methods of Analysis (15th Ed) Association of Official Analytical Chemists Inc
Arlington Virginia USA
AOAC 1995 Official Methods of Analysis (15th Ed) Association of Official Analytical Chemists Inc
Washington DC USA
Arigbede OM Anele UY Olanite JA Adekunle IO Jolaosho OA amp Onifade OS 2006 Seasonal in
vitro gas production parameters of three multi - purpose tree species in Abeokuta Nigeria Livestock
Res Rural Dev 18(10) Article 142
Available at httpwwwcipavorgcolrrdlrrd1810arig18142htm
(Accessed 14 October 2008)
Bampidis VA amp Robinson PH 2006 Citrus by-products as ruminant feeds A review Anim Feed Sci
Technol 128 175 - 217
Cheng KJ Stewart CS Dinsdale D amp Costeron JW 1984 Electron bacteria involved in the digestion
of plant cell walls Anim Feed Sci Technol 10 93 - 120
Chesson A amp Forsberg C W 1988 Polysaccharide degradation by rumen micro-organisms In The
Rumen Microbial Ecosystem Ed Hobson PN Elsevier Science Publishers Ltd London UK pp 251
- 284
49
Ghadaki MB Van Soest PJ McDowell RE amp Malekpour B 1975 Chemical composition and in vitro
digestibility of some range forage species of Iran In Proceedings of the sem Bamako 2 - 3 March
Bamako Mali
Available at httpwwwfaoorgwairdocsilrix5543bx5543b0zhtm
(Accessed 17 October 2008)
Giraldo LA Tejido ML Ranilla MJ amp Carro MD 2008 Effect of exogenous fibrolytic enzymes on in
vitro rumen fermentation of substrates with different forageconcentrate ratios Anim Feed Sci
Technol 141 306 - 325
Goosen L 2004 Effect of an exogenous fibrolytic enzyme on forage digestibility parameters MSc (Agric)
thesis Stellenbosch University Stellenbosch South Africa pp 1 - 91
Haddad SG amp Grant RJ 2000 Influence of nonfiber carbohydrate concentration on forage fiber digestion
in vitro Anim Feed Sci Technol 86 107 - 115
Hall MB 2002 Working with sugars (and molasses) In Proceedings of the 13th Annual Florida Ruminant
Nutrition Symp Jaunary 11 - 12 Gainesville Florida USA pp 146 - 158
Hiltner P amp Dehority A 1983 Effect of soluble carbohydrates on digestion of cellulose by pure
cultures of rumen bacteria Appl Environ Microbiol 46 542
Larson CC 2003 The effect of nonfibre carbohydrate source and protein degradability on lactation
performance of holstein cows MSc (Agric) thesis University of Florida Gainesville Florida USA pp
1 - 108
Leiva E Hall MB amp Van Horn HH 2000 Performance of dairy cattle fed citrus pulp or corn products as
sources of neutral detergent-soluble carbohydrates J Dairy Sci 83 2866 - 2875
Marais JP Therion JJ Mackie RI Kistner A amp Dennison C 1988 Effect of nitrate and its reduction
products on the growth and activity of the rumen microbial population Brit J Nutr 59 301 - 313
Mauricio RM Mould FL Dhanoa MS Owen E Channa KS amp Theodorou MK 1999 A semi-
automated in vitro gas production technique for ruminants feedstuff evaluation Anim Feed Sci
Technol 79 321 - 330
McDonald P Edwards RA Greenhalgh JFD amp Morgan CA 2002 Evaluation of food Digestibility In
Animal Nutrition (6th Ed) Pearson Education Ltd Edinburgh Gate Harlow Essex UK pp 246 - 263
Mertens DR 1997 Creating a system for meeting the fibre requirements of dairy cows J Dairy Sci 80
1463 - 1481
50
Mertens DR amp Loften JR 1980 The effect of starch on forage fiber digestion kinetics in vitro J Dairy Sci
63 1437 - 1446
Miller BG amp Muntifering RB 1985 Effect of forageconcentrate on kinetics of forage fiber digestion in
vitro J Dairy Sci 68 40 - 44
Mohney K 2002 Synchronization of carbohydrate and protein metabolism by ruminal microbes in
continuous culture PhD thesis North Carolina State University Raleigh North Carolina USA pp 1 -
69
National Research Council (NRC) 2001 Nutrient requirements of dairy cattle (7th Rev Ed) National
Academy Press Washington DC USA pp 34 - 35
Sallam SMA 2005 Nutritive value assessment of the alternative feed resources by gas production and
rumen fermentation in vitro Res J Agric amp Biol Sci 1(2) 200 - 209
Schwarz FJ Haffner J amp Krichgessner M 1995 Supplementation of zero-grazed dairy cows with
molassed sugar beet pulp maize or cereal-rich concentrate Anim Feed Sci Technol 54 237 - 248
Solomon R Chase LE Ben-Ghedalia D amp Bauman DE 2000 The effect of nonstructural carbohydrate
and addition of full fat soybeans on the concentration of conjugated linoleic acid in milk fat of dairy
cows J Dairy Sci 83 1322 - 1329
Sommart K Parker DS Wanapat M amp Rowlinson P 2000 Fermentation characteristics and microbial
protein synthesis in an in vitro system using cassava rice straw and dried ruzi grass as substrates
Asian-Aust J Anim Sci 13 1084 - 1093
Statistica 81 2008 StatSoft Inc USA
Van Soest PJ 1994 Nutritional ecology of the ruminant (2nd Ed) Cornell University Press Ithaca New
York USA pp 251 - 252
Van Soest PJ amp Robertson JB 1985 Analysis of forages and fibrous feeds A laboratory manual for
animal science 613 Cornell University Ithaca New York USA
Van Soest PJ Robertson JB amp Lewis BA 1991 Methods for dietary fibre neutral detergent fibre and
nonstarch polysaccharides in relation to animal nutrition J Dairy Sci 74 3583 - 3587
Oslashrskov ER amp McDonald P 1979 The estimation of protein degradability in the rumen from incubation
measurements weighed according to rate of passage J Agric Sci 92 499 - 503
51
Chapter 4
THE EFFECT OF SUGAR STARCH AND PECTIN AS MICROBIAL
ENERGY SOURCES ON IN VITRO NEUTRAL DETERGENT FIBRE
AND DRY MATTER DEGRADABILITY OF FORAGES
Abstract
The study evaluated the effect of sugar (molasses and sucrose) starch (maize meal and maize starch) and
pectin (citrus pulp and citrus pectin) on neutral detergent fibre (NDF) and dry matter (DM) degradability of
forages Forage substrates used included wheat straw (WS) oat hay (OH) lucerne hay (LUC) ryegrass
(RYE) and kikuyu grass (KIK) Rumen fluid was collected from two lactating Holstein cows receiving a diet
consisting of oat hay lucerne wheat straw and a concentrate mix In vitro degradability was done with an
ANKOM Daisy II incubator and forage substrates were incubated with or without the respective energy
sources for 24 48 and 72 hours The substrates were incubated in 1076 ml buffered medium 54 ml of
reducing solution and 270 ml rumen fluid The residues were washed dried and analyzed for NDF In the
trial with the applied energy sources (molasses maize meal and citrus pulp) there was forage x energy
source interactions Supplementation with the applied energy sources all improved DMD of forages (24 amp 72
hours) when compared to the control treatment except for RYE supplemented with maize meal and citrus
pulp at 24 hours Molasses had the biggest effect on DMD in all forage substrates Supplementation with
maize meal had no effect on neutral detergent fibre degradability (NDFD) of any forage substrate except for
an improvement in NDFD of LUC at 72 hours Molasses improved NDFD of LUC at 24 hours but had no
effect on the other forage substrates Citrus pulp improved NDFD of OH (72 hours) as well as LUC and WS
(24 amp 72 hours) It is postulated that the NDF of the energy sources was more digestible than that of the
respective forages and that the improved NDFD values could be ascribed to the contribution of the energy
source NDFD Overall pasture grasses had a higher NDFD than the hays and straw and appear to be more
readily fermentable by rumen micro-organisms than the low quality hays and straw explaining the higher
NDFD In the trial involving the purified energy sources (sucrose maize starch and citrus pectin) forage x
energy source interactions were observed In general supplementation with these energy sources improved
DMD at 24 and 72 hours except for RYE and KIK (72 hours) Pasture grasses (RYE amp KIK) had a higher
NDFD than LUC OH and WS At 72 hours NDFD was 371 for LUC 425 for OH and 403 for WS
compared to 705 for KIK and 649 for RYE A possible explanation is that KIK and RYE samples came
from freshly cut material harvested after a 28d re-growth period In general sucrose (24 amp 72 hours) and
citrus pectin (72 hours) had no effect on NDFD of forage substrates Supplementing oat hay (24 hours) with
starch and citrus pectin and wheat straw (24 amp 72 hours) with starch however lowered NDFD (P lt 005)
when compared to the control treatment It is hypothesized that micro-organisms fermented the easily
fermentable energy sources first before attacking forage NDF The study suggested that forage NDFD
values are not fixed and may be altered by type of energy supplementation
52
41 Introduction
The production potential of ruminants is determined to a great extent by the availability and quality of
forages Lactating dairy cows depend significantly on forages to maintain optimal fermentation rumen
function and high production However the ability of rumen micro-organisms to degrade forages is restricted
by the chemical composition and physical quality of the forage (Mertens 1997) Forages alone also do not
provide all the energy requirements of a high producing dairy cow (Schwarz et al 1995) Supplementing
dairy cow diets with energy-rich feeds provide high yielding dairy cows with the energy needed to improve
efficiency of production and performance (Henning 2004) The most important source of energy and largest
nutrient component for rumen micro-organisms is carbohydrates (especially non-fibre carbohydrates or
NFC)
It is important to try and find ways to improve forage degradation Improvement of forage utilization and
degradation will aid in animal performance (Giraldo et al 2008) Forage based diets supplemented with NFC
(sugar starch or pectin) result in variation of performance measurements such as milk yield milk
composition dry matter intake (DMI) and feed efficiency (Larson 2003) Miron et al (2002) reported that
cows receiving total mixed rations (TMR) with a high percentage of citrus pulp had higher NDF and NSC
digestibilities compared to cows that received TMR with a high percentage of corn Leiva et al (2000)
reported that the rumen pH declined more rapidly on citrus diets (pectin) than on hominy (starch) diets and
also reached the lowest pH point faster Knowledge of the individual (as well as a combination of NFC)
fermentation characteristics can thus be helpful in predicting an animalrsquos performance due to NFC
supplementation (Holtshausen 2004)
The objectives of this study were to determine the impact of three applied energy sources viz maize meal
molasses syrup and citrus pulp and three purified energy sources viz maize starch sucrose and citrus
pectin on dry matter (DM) and neutral detergent fibre (NDF) digestibility of different forage substrates
Forages commonly used in dairy cow diets (wheat straw oat hay lucerne hay kikuyu grass and ryegrass)
were used
42 Materials and methods
421 Study area
The study to evaluate the effect of supplementing forage based diets with sugar starch and pectin on DM
and NDF degradability was conducted at the Stellenbosch University Stellenbosch South Africa
(33deg 55prime 12Prime S 18deg 51prime 36Prime E)
53
422 Simulated diets
4221 Basal forages
Five forages (Table 41) were used to prepare rations to simulate diets for lactating dairy cows
Table 41 Forages used in simulation diets for lactating dairy cows
Forage Type Acronym
Wheat straw (Triticum aestivum ) WS
Oat hay (Avena sativa) OH
Lucerne hay (Medicago sativa) LUC
Ryegrass (Lolium multiflorum ) RYE
Kikuyu grass (Pennisetum clandestinum) KIK
Rye and kikuyu grasses were harvested after four weeks of re-growth All the forages were oven dried at
60ordmC for 72 hours Wheat straw oat hay and lucerne hay were ground (cyclotec 1093 mill) through a 2 mm
screen Rye and kikuyu grasses were obtained from Outeniqua experimental farm (33deg 57prime 0Prime S
22deg 25prime 0Prime E) just outside George South Africa (33deg 58prime 0Prime S 22deg 27prime 0Prime E) The rye and kikuyu grasses were
already ground through a 1 mm screen when received
4222 Energy supplements
Three energy sources (Table 42) were selected as supplements to prepare rations that would simulate
lactating dairy cow diets
Table 42 Applied energy sources used in simulating the dairy cow diets
Energy type Source Acronym
Starch Yellow maize (Zea mays) meal Mm
Sugar Molasses syrup Mol
Pectin Citrus pulp Cp
These energy feedstuffs were sourced in the following forms molasses as a syrup by-product from the
processing of sugar cane (Officinarum saccharum) citrus pulp as a finely granulated residue by-product from
the peel pulp and seeds of oranges and grapefruit and yellow maize grain The citrus pulp and maize were
ground (cyclotec 1093 mill) through a 1 mm screen
Three purified energy sources (Table 43) were selected as supplements to prepare rations that would
simulate lactating cow diets
54
Table 43 Purified energy sources used in simulating the dairy cow diets
Energy type Source Acronym
Starch Maize starch Maiz
Sugar Sucrose Suc
Pectin Citrus pectin Pec
4223 Defining the diets
A total of 43 simulated diets were prepared
bull 5 diets contained forage substrates only (Table 41)
bull 3 diets contained applied energy sources only (Table 42)
bull 15 diets contained a mixture of forages and applied energy sources
bull 5 diets contained forage substrates only (Table 41)
bull 15 diets contained a mixture of forages and purified energy sources
The final substrate compositions are indicated in Tables 45 and 46
423 Chemical analyses of forages and energy sources
About 1 g of each forage type as well as 1 g of the energy sources were weighed and placed in a 100ordmC
conventional oven for 24 hours to determine DM content (AOAC 1995 Method 93015) Organic matter
(OM) was determined by weighing 1 g of each type of feedstuff used into crucibles and ashing the content at
500ordmC in a muffle furnace for 6 hours (AOAC 1995 Method 94205)
The NDF component was determined by measuring 05 g of each feedstuff into F57 ANKOM fibre analysis
bags The bags were heat sealed and NDF determined using the method of Van Soest et al (1991)
Sodium sulfite (Na2SO3) was added to the NDF solution during digestion and heat-stable amylase was
added during rinsing Ether extract was determined using the AOAC method (AOAC 1995 Method 92039) About 2 g of ground sample was weighed into a thimble The samples were then extracted with diethyl ether
(C4H10O)
Acid detergent lignin (ADL) was determined by measuring 05 g of each basal forage and 05 g of maize
meal and citrus pulp into separate F57 ANKOM fibre analysis bags The bags were heat sealed and acid
detergent fibre (ADF) was determined using the method of Van Soest et al (1991) The ADF residue was
then soaked in 72 sulphuric acid for three hours to dissolve the cellulose Acid detergent lignin was
determined using the ANKOM method (ANKOM 2005)
55
Total nitrogen content was determined with a Leco Nitrogen Gas Analyzer custom designed and built by
LECO Africa (Pty) Ltd (Kempton Park) About 01 g of sample was weighed into a small piece of aluminum
foil The samples were then ignited inside the Leco furnace at about 900degC using the Dumas procedure
(AOAC 1990 Method 96806) Crude protein (CP) was calculated by multiplying nitrogen content with 625
(AOAC 1995 Method 99003)
Table 44 Chemical composition (gkg DM plusmn SD) of forages and energy sources used in the trial All values
are on a DM basis
Sources DM OM NDF CP EE ADL
WS 9150plusmn05 9022plusmn16 8179plusmn71 723plusmn10 36plusmn05 1022plusmn30
OH 8504plusmn23 9403plusmn173 7819plusmn110 910plusmn12 97plusmn08 825plusmn03
LUC 8989plusmn20 9062plusmn18 5153plusmn10 2370plusmn46 81plusmn06 927plusmn67
RYE 938plusmn10 845plusmn05 4892plusmn30 2509plusmn27 431plusmn01 448plusmn181
KIK 1242plusmn104 1122plusmn01 6512plusmn20 2534plusmn41 283plusmn11 480plusmn17
mm 8559plusmn09 9844plusmn13 1743plusmn550 1071plusmn02 377plusmn04 70plusmn06
cp 8799plusmn09 9285plusmn07 2614plusmn140 786plusmn18 164plusmn04 253plusmn64
mol 6980plusmn19 8927plusmn06 ND ND ND ND
DM = dry matter OM = organic matter NDF = neutral detergent fibre CP = crude protein EE = ether
extract ADL = acid detergent lignin ND = not determined WS = wheat straw OH = oat hay LUC = lucerne
RYE = ryegrass KIK = kikuyu grass mm = maize meal cp = citrus pulp mol = molasses
Purified energy sources were 99 pure based on manufacturers analyses
424 Sample preparation
Small fibre analysis bags were used (F57 ANKOM Technology) The bags were pre-rinsed in acetone for
five minutes air dried and placed in a conventional oven at 100ordmC for three to four hours The diets were
constituted as shown in Tables 45 46 and 47 The total amount of substrate was based on a forage to
concentrate ratio of 5050 The substrate amount of the energy sources in Table 45 was calculated to
provide the same amount of metabolizable energy (ME) contained in 025 g DM of yellow maize meal For
calculation purposes the ME values were assumed to be 139 MJkg DM for maize 123 MJkg for molasses
and 122 MJkg for citrus pulp (NRC 2001)
56
Table 45 Substrate samples containing either forage or applied energy supplements
Forage type Energy source Forage (g DM) Energy (g DM)
Wheat straw - 0250 -
Oat hay - 0250 -
Lucerne hay - 0250 -
Ryegrass - 0250 -
Kikuyu grass - 0250 -
- Maize meal - 0250
- Citrus pulp - 0285
- Molasses - 0282
The amount of energy sources used in the composite substrates (Table 46) was calculated to provide the
same amount of ME contained in 0125 g DM of yellow maize meal (139 MJMEkg)
Table 46 Composite diets containing forage and applied energy sources
Forage type Energy source Forage (g DM) Energy (g DM)
Wheat straw Maize meal 01250 01250
Wheat straw Citrus pulp 01250 01425
Wheat straw Molasses 01250
01412
Oat hay Maize meal 01250 01250
Oat hay Citrus pulp 01250 01425
Oat hay Molasses 01250
01412
Lucerne hay Maize meal 01250 01250
Lucerne hay Citrus pulp 01250 01425
Lucerne hay Molasses 01250
01412
Ryegrass Maize meal 01250 01250
Ryegrass Citrus pulp 01250 01425
Ryegrass Molasses 01250
01412
Kikuyu grass Maize meal 01250 01250
Kikuyu grass Citrus pulp 01250 01425
Kikuyu grass Molasses 01250 01412
The amount of purified energy sources (Table 47) was based on suggestions by Holtshausen (2004) who
used starch pectin and sucrose at hexose equivalent amounts of 40 80 or 120 mg per 120 mg purified NDF
in in vitro incubations
57
Table 47 Diets containing forages alone or a mixture of forages and purified energy sources Amounts are
on an air dry basis
Forage type Energy source Forage (g) Energy (g)
Wheat straw - 0500 -
Oat hay - 0500 -
Lucerne hay - 0500 -
Ryegrass - 0500 -
Kikuyu grass - 0500
-
Wheat straw Maize starch 0500 0163
Wheat straw Citrus pectin 0500 0192
Wheat straw Sucrose 0500
0137
Oat hay Maize starch 0500 0152
Oat hay Citrus pectin 0500 0178
Oat hay Sucrose 0500
0127
Lucerne hay Maize starch 0500 0160
Lucerne hay Citrus pectin 0500 0189
Lucerne hay Sucrose 0500
0135
Ryegrass Maize starch 0500 0162
Ryegrass Citrus pectin 0500 0191
Ryegrass Sucrose 0500
0137
Kikuyu grass Maize starch 0500 0161
Kikuyu grass Citrus pectin 0500 0190
Kikuyu grass Sucrose 0500 0136
In the current study a hexose equivalent amount of 40 mg of each energy source per 120 mg of forage
substrate was used Since 500 mg (air dry) of each forage substrate was weighed out into the incubation
bags in the current study the hexose equivalent of the energy sources amounted to 167 mg DM
To calculate the actual amount of energy source DM the following conversion coefficients were used (based
on Holtshausen 2004)
bull 090 for maize starch
bull 114 for citrus pectin
bull 095 for sucrose
58
The DM content of the energy sources were taken into account when calculating the air dry amounts that
were finally weighed out into the bags (Table 47)
Blank bags were included to correct for residues from rumen fluid alone All bags were heat-sealed using an
impulse sealer after sample preparation
425 Preparation of in vitro medium and reducing solution
The incubation medium was prepared as described by Van Soest amp Robertson (1985) The medium
consisted of micro minerals macro-mineral solution buffer solution tryptose rezasurin and distilled water
The medium was kept in a water bath at 395ordmC The pH of the medium was about 78 Reducing solution
was prepared as described by Van Soest amp Robertson (1985) and consisted of cysteine hydrochloride
(C3H7NO2HCL) potassium hydroxide (KOH) pellets sodium sulfide nonahydrate (Na2S9H2O) and distilled
water
426 Collection and preparation of rumen fluid Rumen fluid was collected from two ruminally cannulated lactating dairy cows The cows were confined and
fed 25 kg (as is) of a diet (125 kg in the mornings and 125 kg in the evenings) consisting of oat hay lucerne
hay wheat straw and a concentrate mix Rumen fluid was squeezed through two layers of cheesecloth into
pre-warmed flasks and a small amount of coarse material was added The rumen fluid was then blended in
a pre-warmed blender at a low speed for 10 seconds The rumen fluid was then filtered through four layers
of cheesecloth into pre-warmed flasks while flushing with carbon dioxide (CO2) The temperature of the
rumen fluid averaged 38ordmC and the pH averaged 58
427 In vitro incubation
The in vitro procedure for the ANKOM Daisy incubations required four glass vessels (2 L) and is based on
the method described by Goering amp Van Soest (1970) The glass vessels were flushed with CO2 while
adding 1076 ml of incubation medium and 54 ml of reducing solution to each vessel The vessels were
closed and placed in the incubator at 395ordmC until the medium was clear The vessels were opened and
flushed with CO2 while adding 270 ml of rumen fluid and bags to the vessels Incubation periods were 24
and 72 hours At each time interval one vessel was removed and the residue bags washed with water air-
dried and then placed in a conventional oven at 100ordmC for 24 hours
59
428 Residue analysis
The NDF content of the residues in the bags was determined using an ANKOM fibre machine (ANKOM220
fibre analyzer) and was based on the method of Van Soest et al (1991) Sodium sulfite (20 g) was added to
19 L of NDF solution during digestion and heat-stable amylase (4 ml x 2 rinse) was added during rinsing
Before using the bags they were rinsed in acetone for three to five minutes and then air-dried before being
placed in a forced draft oven at 100ordmC for 24 hours After the NDF procedure the bags were dried weighed
and subsequently ashed in a muffle furnace at 500ordmC for 6 hours
429 Estimating dry matter degradability
The estimation of DM degradability of the substrates was based on DM disappearance and calculated in
Excel using the following equation (Van Soest et al 1991)
( )[ ] 1001002
113 timestimesminus
minus=W
CWWDMD Equation 5
Where DMD = Apparent DM degradability ()
W1 = Bag weight (mg)
W2 = Sample weight (mg DM)
W3 = Weight of dried bag and residue after incubation (mg DM)
C1 = Blank bag correction factor
4210 Estimating neutral detergent fibre degradability
The estimation of NDF degradability of the substrates was based on NDF disappearance and was
calculated in Excel using the following equation (Van Soest et al 1991)
( )[ ]100100
2
113 timestimesminus
minus=W
CWWNDF Equation 6
60
Where NDF = Apparent NDF degradability ()
W1 = Bag weight (mg)
W2 = Sample weight (mg NDF in DM)
W3 = Dried weight of bag with residue after incubation (mg NDF in DM)
C1 = Blank bag correction factor
43 Statistical analyses
The in vitro digestibility experiment was a three way cross classification and the data was subjected to a
factorial ANOVA with the three factors being forage energy and time using Statistica 81 (2008) This was
done for all the non-linear parameters Significant forage x energy interactions were observed for the non-
linear parameters Therefore a one-way ANOVA was done on each of the forages to determine the effect of
the energy sources Differences between means were determined using a Tukey test Significance was
declared at P lt 005
44 Results and discussion
441 Effect of maize meal citrus pulp and molasses on apparent in vitro dry matter degradability
Results of the in vitro dry matter degradability (DMD) trial are presented in Table 48 Unsupplemented
forage values clearly indicate that ryegrass and kikuyu are more digestible than lucerne hay oat hay and
wheat straw This can be attributed to the fact that pasture grasses were cut after only 28 days of re-growth
thus having more digestible nutrients compared to lucerne and oat hay which were harvested at the 10
flowering stage and wheat straw at maturity With maturity the NDF and ADL contents increase (Table 44)
and DMD decreases (Canbolat et al 2006) When forage substrates were supplemented with applied
energy sources a forage x energy source interaction was observed When maize meal citrus pulp and
molasses replaced 50 of the forage substrates DMD was increased (P lt 001) in all forage substrates
(after 24 and 72 hours of incubation) with molasses having the biggest effect throughout It should be kept
in mind that the energy sources as such were all more degradable than the forages and therefore it could be
expected that a 50 replacement of forages with energy sources would increase total substrate DMD The
increase in DMD of forage substrates could thus be due to increased stimulation of rumen micro-organisms
in response to the readily available energy supplied by energy sources
61
Table 48 Effects of maize meal citrus pulp and molasses as energy sources on in vitro dry matter
degradability (DMD) parameters of different forage substrates
Treatment
Item Maize meal Citrus pulp Molasses Control
SEm
P
Lucerne hay
DMD 24h 707 b 731 b 832 c 565 a 159 lt0001
DMD 72h 829 b 825 b 858 c 690 a 044 lt0001
Oat hay
DMD 24h 637 b 676 bc 739 c 442 a 153 lt0001
DMD 72h 773 b 788 bc 820 c 588 a 080 lt0001
Wheat straw
DMD 24h 602 b 627 b 710 c 383 a 092 lt0001
DMD 72h 721 b 744 bc 778 c 510 a 089 lt0001
Ryegrass
DMD 24h 796 a 835 ab 901 b 760 a 212 0003
DMD 72h 926 b 934 b 964 b 877 a 095 lt0001
Kikuyu grass
DMD 24h 802 b 806 b 886 c 695 a 188 lt0001
DMD 72h 915 b 923 b 953 b 867 a 098 lt0001
Superscripts are compared across rows
The biggest effect of energy supplementation occurred with wheat straw as also reported in the gas
production experiments (Chapter 3) Wheat straw was high in NDF and ADL (Table 44) Neutral detergent
fibre is slowly degraded by rumen micro-organisms whereas ADL are not degraded by rumen micro-
organisms explaining the lower DMD of wheat straw when compared to the other forages Supplementing
readily available energy sources would therefore have a greater impact on DMD of wheat straw compared to
other forages Molasses had the highest impact on wheat straw DMD during the early phases of incubation
(24 hours) but after 72 hours the effect of molasses and citrus pulp was similar
In lucerne hay molasses had the highest impact on DMD at 24 and 72 hours incubation but citrus pulp and
maize meal also improved DMD significantly In oat hay maize meal citrus pulp and molasses improved
DMD at 24 and 72 hours incubation with molasses also having the most noticeable effect (P lt 001) Fall et
al (1998) also found improvements in DMD of straws supplemented with molasses In contrast to results
obtained in this study Williams et al (1953) found that addition of starch to oat hay diets of sheep decreased
DMD by one to two percentage units Burroughs et al (1949) observed a 5 ndash 12 reduction in lucerne hay
DMD when the diet was supplemented with 60 starch Mould amp Orskov (1983) however concluded that
62
the decrease in DMD of hays are mainly due to reduced rumen pH and not directly related to starch
digestion Abrupt changes in cattle diets (forage to concentrate diets) decrease rumen pH resulting in an
overgrowth of starch fermenting bacteria which causes acute acidosis with devastating effects on production
(Owens et al 1998) Cellulolytic bacteria are also inhibited at low rumen pH values decreasing fibre
digestion (Russel amp Wilson 1996)
In ryegrass molasses was the only energy source that improved DMD after 24 hours incubation Simeone
et al (2004) found similar results and reported that neither ground nor whole maize meal had an effect on
ryegrass DMD Ryegrass and kikuyu are highly fermentable forages as was also observed in terms of total
gas production and rate of gas production (Chapter 3) Molasses which is also rapidly fermentable had the
largest influence on DMD of pasture grasses at 24 hours probably because of its high fermentation rates
(Chapter 3) and because it is free of NDF and does not have trace amounts of lignin (Table 44) Overall
however all the energy sources improved DMD of ryegrass and kikuyu to the same extent at 72 hours
442 Effect of maize meal citrus pulp and molasses on apparent in vitro neutral detergent fibre degradability
The effects of sugar (molasses) starch (maize meal) and pectin (citrus pulp) on in vitro apparent NDF
degradability (NDFD) of different forages and forage-energy source combinations are shown in Table 49
Unsupplemented pasture grasses harvested at 28 days of re-growth had a higher NDFD than the mature
forages The NDFD of mature forages ranged between 197 and 284 which is too low to sustain
production and hence the need for energy supplementation Ryegrass and kikuyu was lower in NDF and
ADL (Table 44) and had greater gas production volumes (above 320 mlg OM Chapter 3) compared to the
other forages (ranging between 229 and 297 mlg OM) A negative correlation between ADL content and
NDFD of forage substrates have been reported by Smith et al (1972) and Tomlin et al (1964)
When forage substrates were supplemented with applied energy sources a forage x energy source
interaction was observed When energy sources replaced 50 of the forage substrates 24 hours NDFD of
lucerne hay was significantly increased by citrus pulp and molasses Hall (2002a) however postulated that
molasses decreases fibre digestion when fed in large quantities After 72 hours both maize meal and citrus
pulp resulted in increased NDFD Contrary to this observation Mertens amp Loften (1980) reported that starch
decreased the potential extent of fibre digestion These results (Mertens amp Loften 1980) however confirm
our findings obtained in the gas production experiments (Chapter 3) namely that maize meal tended to
increase the lag time of lucerne hay The lack of response of molasses at 72 hours could be due to its rapid
fermentation rate (Chapter 3) and also to the fact that molasses does not have any NDF (Table 44) that
could contribute to NDFD Maize meal and especially citrus pulp however contain some NDF that is readily
digestible
63
Table 49 Effects of maize meal citrus pulp and molasses as energy sources on in vitro neutral detergent
fibre degradability (NDFD) parameters when incubated in combination with different forage substrates
Treatment
Item Maize meal Citrus pulp Molasses Control
SEm
P
Lucerne hay
NDFD 24h 230 ab 296 b 300 b 197 a 219 0014
NDFD 72h 503 b 541 b 414 a 403 a 126 lt0001
Oat hay
NDFD 24h 300 356 289 284 222 0138
NDFD 72h 522 ab 579 b 509 a 472 a 139 lt0001
Wheat straw
NDFD 24h 196 a 285 b 249 ab 247 ab 171 0024
NDFD 72h 437 a 509 b 421 a 403 a 163 0003
Ryegrass
NDFD 24h 522 599 571 501 249 0059
NDFD 72h 775 822 843 748 242 0063
Kikuyu grass
NDFD 24h 516 561 624 530 424 0326
NDFD 72h 794 826 837 795 205 0368
Superscripts are compared across rows
Apparent NDFD of oat hay was not affected by energy source after 24 hours incubation but with citrus pulp
longer incubations (72 hours) resulted in higher NDFD (P lt 001) probably due to a relative high digestibility
of citrus pulp NDF Miron et al (2002) obtained similar positive results on NDFD of forages when maize or
barley was replaced with citrus pulp Voelker amp Allen (2003) proposed that the optimal rate and extent of
NDFD of high concentrate diets can be achieved by using dried beet pulp instead of high moisture corn
Heldt et al (1999) found that supplementing low-quality tallgrass-prairie hay with degradable intake protein
and NFC increased the total tract NDFD but supplementation with NFC alone decreased NDFD
Citrus pulp was the only energy source that consistently improved apparent NDFD when incubated in
combination with the hays and straw Citrus pulp had significant positive effects on NDFD of these forages
probably because mature forages are slowly degradable and citrus pulp supplementation thus provided high
amounts of digestable fibre at both 24 hours and 72 hours incubations The degradation rate of citrus pulp
possibly synchronizes the release of nutrients with the requirements of fibrolytic bacteria Increased NDFD is
important as it increases the supply of energy and support microbial N production (Allen amp Oba 2000)
64
resulting in higher milk production and reduced rumen fill in lactating dairy cows (Dado amp Allen 1995)
Bampidis amp Robinson (2006) stated that citrus pulp might be a good supplement to dairy cow diets as it
improves NDFD and has less negative effects on rumen pH and cellulolytic activities compared to sugar and
starch
Energy sources had no effect on apparent NDFD of kikuyu and ryegrass possibly because these pasture
grasses was immature and thus high in soluble readily available energy In the gas production experiments
(Chapter 3) these pasture grasses also had higher gas production volumes than the mature forages It
would thus appear given the high nutrient content in these forages that energy supplementation would have
minimal effects on NDFD
None of the energy source and forage combinations had lower NDFD values than the forages alone
contrary to Sanson et al (1990) who reported that the supplementation of low-quality forages with rapidly
degradable NFC depressed NDFD Grant amp Mertens (1992) suggested that acidification of the rumen due
to fast ruminal NFC fermentation is a prime factor responsible for depression in fibre digestion
443 Effect of maize starch citrus pectin and sucrose on apparent in vitro dry matter degradability
The effect of purified energy sources viz sugar (sucrose) starch (maize starch) and pectin (citrus pectin) on
in vitro apparent DMD of different forages are shown in Table 410 When forage substrates were
supplemented with purified energy sources a forage x energy source interaction was observed In lucerne
hay only pectin resulted in an improved DMD (both at 24 hours and 72 hours) while in oat hay all the
energy sources improved DMD at both incubation times Carey et al (1993) reported similar improvements
in DMD of brome hay (in situ) when it was supplemented with maize and beet pulp In contrast Burroughs et
al (1949) reported that DMD of lucerne was reduced when forages were supplemented with 20 and 40
starch In wheat straw all the energy sources improved DMD but at 24 hours pectin and sucrose had a
bigger effect than starch Pectin and sucrose are more fermentable than starch hence the more visible
effect on DMD of slow degradable wheat straw forages At 72 hours pectin also improved DMD more than
starch
Ryegrass and kikuyu had high DMD values without supplementation The higher DMD of pasture grasses
was most likely because they were immature at harvesting whereas lucerne and oat hay were cut at the
10 flowering stage and wheat straw was harvested at maturity Immature pasture grasses were thus
higher in fast fermentable sugars and lower in NDF and ADL (Table 44) improving DMD and gas production
volumes (Chapter 3) Only sucrose was sufficient in improving DMD in these grasses and then only at 24
hours due to their very high fermentability The absence of a sucrose effect at 72 hours was probably
because sucrose was depleted before 72 hours as it is rapidly fermented in the early hours of incubation
Purified energy sources are all more degradable than forages and therefore it could be expected that
inclusion of these energy sources in forage diets will increase DMD In general purified energy sources
resulted in lower DMD when compared to the applied energy sources (Table 48) We can postulate that
65
there was a rapid decline in rumen pH with purified energy source supplementation (as these energy sources
has no NDF) resulting in higher lactic acid production and slower microbial growth hence the lower DMD
Table 410 Effects of maize starch citrus pectin and sucrose as energy sources on in vitro dry matter
degradability (DMD) parameters of different forage substrates
Treatment
Item Maize starch Citrus pectin Sucrose Control
SEm
P
Lucerne hay
DMD 24h 642 ab 687 b 660 ab 593 a 182 0021
DMD 72h 745 ab 773 b 746 ab 673 a 203 0025
Oat hay
DMD 24h 476 b 512 b 504 b 377 a 096 lt0001
DMD 72h 638 b 658 b 644 b 552 a 116 lt0001
Wheat straw
DMD 24h 449 b 508 c 520 c 348 a 080 lt0001
DMD 72h 591 b 643 c 617 bc 510 a 094 lt0001
Ryegrass
DMD 24h 769 ab 768 ab 771 b 708 a 147 0026
DMD 72h 884 862 875 847 185 0548
Kikuyu grass
DMD 24h 681 ab 684 ab 709 b 634 a 150 0027
DMD 72h 859 826 843 808 213 0408
Superscripts are compared across rows
444 Effect of maize starch citrus pectin and sucrose on apparent in vitro neutral detergent fibre degradability
Purified energy source supplementation on in vitro apparent NDFD of the different forage substrates are
illustrated in Table 411 As was the case with DMD an energy source x forage interaction was observed for
NDFD Purified energy sources have negligible amounts of NDF thus the NDFD was solely from forages
In the control diets it is evident that the immature pasture grasses had the highest NDFD probably as they
are low in NDF and ADL (Table 44)
With lucerne hay energy supplementation had no significant effect on NDFD while in oat hay starch and
pectin supplementation suppressed NDFD but only at 24 hours incubation (P = 0011) Sucrose had no
66
effect on NDFD of oat hay at 24 hours Hall (2002a) proposed that in general sucrose tends to decrease
fibre digestion when fed in large quantities probably due to its lowering effect on rumen pH Heldt et al
(1999) reported that NFC supplementation to low-quality tallgrass-prairie decrease NDFD agreeing with our
results
Table 411 Effects of maize starch citrus pectin and sucrose as energy sources on in vitro neutral
detergent fibre degradability (NDFD) parameters of different forage substrates
Treatment
Item Maize starch Citrus pectin Sucrose Control
SEm
P
Lucerne hay NDFD 24h 123 197 178 179 277 0305
NDFD 72h 353 319 366 371 218 0364
Oat hay
NDFD 24h 131 b 137 b 174 ab 202 a 138 0011
NDFD 72h 389 395 406 425 201 0608
Wheat straw
NDFD 24h 116 b 171 a 239 c 205 ac 126 lt0001
NDFD 72h 343 b 402 a 393 a 403 a 140 0032
Ryegrass
NDFD 24h 419 401 392 403 186 0781
NDFD 72h 687 a 556 b 620 ab 649 ab 236 0013
Kikuyu grass
NDFD 24h 353 329 419 437 293 0068
NDFD 72h 714 a 573 b 687 ab 705 ab 324 0033
Superscripts are compared across rows
Sucrose had no effect on NDFD of wheat straw while pectin had a negative effect and starch severely
suppressed NDFD at both incubation times (P lt 005) The severe suppression in NDFD after
supplementation of maize starch can result from the negative effect that starch has on rumen pH Sucrose
and starch ferment rapidly producing lactic acid a product that lowers rumen pH whereas pectin does not
produce lactic acid (Hall 2002b) Starch has shown to decrease rumen pH and affect cellulolytic activity in
the rumen thereby lowering fibre digestion and increasing the risks of acidosis (Mertens amp Loften 1980)
Heldt et al (1999) reported similar results and found that starch decreased fibre digestion more than sugar
This is also in agreement with Vallimont et al (2004) who found that by replacing starch with sugar
incrementally in a continuous culture system fibre digestion was increased
67
Ryegrass and kikuyu NDFD was not affected at 24 hours by energy supplementation Pasture grasses are
high in rapidly fermentable sugars especially when harvested young as was the case with ryegrass and
kikuyu (28 days re-growth) Supplementation with energy sources would thus have a much smaller effect on
these forages compared to mature forages
45 Conclusion
Forage based diets that constitute mainly of mature forages are deficient in energy and therefore cannot
support growth and production in ruminant animals Lactating dairy cows have high energy requirements for
milk production Supplementation of lactating dairy cow diets with concentrates which are high in energy
can thus not be over-emphasized Supplementation with optimal amounts of energy substrates provide the
high producing dairy cow with energy needed to improve fibre digestibility and utilization It must however
be kept in mind that incorrect feeding and large amounts of energy substrates (especially starch and sugar)
increase the risks of ruminal acidosis due to the production of large quantities of lactic acid which
subsequently reduces milk production and profitability
Results obtained from this study proved that supplementation of applied as well as purified energy sources
have positive effects on DMD of forages Supplementing forages with 50 of the applied energy sources
improved DMD of all forages significantly Purified energy sources improved DMD of the hays and straws
significantly These forages are mature and thus have less soluble readily fermentable energy sources in
their tissue compared to ryegrass and kikuyu With the applied energy sources molasses tended to have
the biggest effect on DMD In general however the applied energy sources had a greater influence on
DMD probably because they do not tend to lower rumen pH as much as purified energy sources
The effect of applied energy sources on NDFD showed similar positive results The energy sources
improved NDFD of the total hay and straw substrates significantly These forages are high in NDF and ADL
which lowers NDFD It must also be kept in mind that these energy sources also contain various amounts of
NDF Subsequently substitution with energy sources (low in NDF and ADL) lowered the cell wall content of
the substrate thereby improving NDFD Citrus pulp had the greatest effect on all forages NDFD probably
due to its highly digestible NDF content The energy sources however had no effect on kikuyu grass and
ryegrass because these grasses were lower in NDF and ADL content and high in available sugars Purified
energy sources in contrast tended to decrease NDFD of all the forages The negative effect on NDFD
when supplementing with purified energy sources may be because fermentation of these energy sources by
rumen micro-organisms may result in a depletion of available nitrogen needed by micro-organisms to
ferment the slowly digestible fibre in forages (Heldt et al 1999) Another reason may be due to the fact that
these energy sources lower the rumen fluid pH due to large amounts of lactic acid production (especially by
sucrose and starch) thus decreasing the activity of cellulolytic and hemicellulolytic enzymes needed for fibre
digestion (Hoover amp Miller-Webster 1998) Another reason may be that rumen micro-organisms first attack
the readily fermentable energy sources before attaching to the forage substrates thereby decreasing the
rate of NDFD
68
It must be emphasized that when supplementing dairy cow diets with large amounts of energy sources it is
of utmost importance to provide adequate amounts of effective fibre to ensure a healthy rumen as well as
enough RDP to provide in the rumen microorganismrsquos nitrogen requirements In vitro experiments that show
the effects of supplementing poor quality roughage (such as wheat straw) with RDP or non-protein nitrogen
(NPN would also be useful in further studies as the limiting nutrient in wheat straw is nitrogen Nitrogen in
turn is needed for energy-nitrogen coupling to take place and improve microbial growth Not much research
has also been done to quantify the relationship between different carbohydrate sources and rumen
metabolism parameters leaving room for improvement and further studies
46 References
Allen M amp Oba M 2000 Getting more milk from forages Michigan Dairy Review 5(4) Michigan State
University
Available at
httpwwwadmanicomalliancedairyTechBulletinsNon20Structural20Carbohydrate20Nutrition
htm
(Accessed 5 August 2008)
ANKOM 2005 Method for Determining Acid Detergent Lignin in Beakers ANKOM Technology 0805
AOAC 1990 Official Methods of Analysis 15th edition Association of Official Analytical Chemists Arlington
Virginia
AOAC 1995 Official Methods of Analysis 15th edition Association of Official Analytical Chemists
Washington DC USA
Bampidis VA amp Robinson PH 2006 Citrus by-products as ruminant feeds A review Anim Feed Sci
Technol 128 175 - 217
Burroughs W Gerlaugh WP Edington BH amp Bethke RM 1949 The influence of corn starch upon
roughage digestion in cattle J Anim Sci 8 271
Canbolat O Kamalak A Ozkan CO Erol A Sahin M Karakas E amp Ozkose E 2006 Prediction of
relative feed value of alfalfa hays harvested at different maturity stages using in vitro gas production
Livestock Res Rural Dev 18(2) Article 27
Available at httpwwwcipavorgcolrrdlrrd182canb18027htm
(Accessed 18 October 2008)
Carey D A Caton J S amp Biondini M 1993 Influence of energy source on forage intake digestibility in
situ forage degradation and ruminal fermentation in beef steers fed medium-quality brome hay J
Anim Sci 71 2260 - 2269
69
Dado RG amp M S Allen 1995 Intake limitations feeding behaviour and rumen function of cows
challenged with rumen fill from dietary fiber or inert bulk J Dairy Sci 78 118 - 133
Fall ST Cisseacute M Ditaroh D Richard D Ndiaye NS amp Diaw B 1998 In vivo nutrient digestibility in
sheep and rumen dry matter degradability in cattle fed crop by-product based diets J Anim Feed
Sci 7 171 - 185
Goering HK Van Soest PJ 1970 Forage Fiber Analysis (apparatus reagents procedures and some
applications) In Agriculture Handbook No 379 Agriculture Research Service United States
Department of Agriculture Washington USA
Giraldo LA Tejido ML Ranilla MJ amp Carro MD 2008 In press Effect of exogenous fibrolytic
enzymes on in vitro rumen fermentation of substrates with different forage concentrate ratios Anim
Feed Sci Technol 141 306 - 325
Grant RJ amp Mertens DR 1992 Development of buffer systems for pH control and evaluation of pH
effects on fiber digestion in vitro J Dairy Sci 75 1581 - 1587
Hall MB 2002a Working with Non-NDF carbohydrates with manure evaluation and environmental
considerations In Proc Mid-South Ruminant Nutrition Conference Texas A amp M University Texas
USA pp 37 - 48
Available at httpwwwtxancorgproceedings2002Non-NDF20Carbohydratespdf
(Accessed 20 October 2008)
Hall MB 2002b Working with sugars (and molasses) In Proceedings of the 13th Annual Florida Ruminant
Nutrition Symp January 11 - 12 Gainesville Florida USA pp 146 - 158
Heldt JS Cochran GL Stokka GL Farmer CG Mathis CP Titgemeyer EC amp Nagaraja TG
1999 Effects of different supplemental sugars and starch fed in combination with degradable intake
protein on low-quality forage use by beef steers J Anim Sci 77 2793 - 2802
Henning P 2004 Acidosis in high-producing ruminants - myth or menace Animal Feed Manufacturers
Association (AFMA) South Africa pp 1 - 9
Available at httpwwwengormixcome_articles_viewaspart=529ampAREA=GDC
(Accessed 5 Augustus 2008)
Holtshausen L 2004 Effect of nonfibre carbohydrates on product yield and fibre digestion in fermentations
with mixed ruminal microbes PhD thesis University of Florida Gainesville Florida USA pp 1 - 33
Hoover WH amp Miller-Webster TK 1998 Role of sugar and starch in ruminal fermentation Tri-State Dairy
Nutrition Conference Michigan State University pp 1 - 16
70
Larson CC 2003 The effect of nonfiber carbohydrate source and protein degradability on lactation
performance of Holstein cows pp 1 - 108 MSc (Agric) thesis University of Florida Gainesville
Florida USA pp 1 - 108
Leiva E Hall MB amp Van Horn HH 2000 Performance of dairy cattle fed citrus pulp or corn products as
sources of neutral detergent-soluble carbohydrates J Dairy Sci 83 2866 - 2875
Mertens DR 1997 Creating a system for meeting the fiber requirements of dairy cows J Dairy Sci 80
1463 - 1481
Mertens DR amp Loften JR 1980 The effect of starch on forage fiber digestion kinetics in vitro J Dairy Sci
63 1437 - 1446
Miron J Yosef E Ben-Ghedalia D Chase LE Bauman DE amp Solomon R 2002 Digestibility by dairy
cows of monosaccharide constituents in total mixed rations containing citrus pulp J Dairy Sci 85 89 -
94
Mould F L amp Orskov E R 1983 Manipulation of rumen fluid pH and its influence on cellulolysis in sacco
dry matter degradation and the rumen microflora of sheep offered either hay or concentrate Anim
Feed Sci Technol 10 1 - 14
National Research Council (NRC) 2001 Nutrient requirements of dairy cattle (7th Rev Ed) National
Academy Press Washington DC USA pp 34 - 35
Owens FN Secrist DS Hill WJ amp Gill DR 1998 Acidosis in cattle a review J Anim Sci 76 275 -
286
Russel JB amp Wilson DB 1996 Why are ruminal cellulolytic bacteria unable to digest cellulose at low pH
J Dairy Sci 79 1503 - 1509
Sanson DW Clanton DC Rush IG 1990 Intake and digestion of low-quality meadow hay by steers
and performance of cows on native range when fed protein supplements containing various levels of
corn J Anim Sci 68 595 - 603
Schwarz FJ Haffner J amp Krichgessner M 1995 Supplementation of zero-grazed dairy cows with
molassed sugar beet pulp maize or cereal-rich concentrate Anim Feed Sci Technol 54 237 - 248
Simeone A Beretta V Rowe J Nolan J Elizalde JC amp Baldi F 2004 Rumen fermentation in
Hereford steers grazing ryegrass and supplemented with whole or ground maize In Proceedings of
the 25th Biennial Conference of the Australian Society of Animal Production 4 - 8 July University of
Melbourne Victoria Australia 25 168 - 171
71
Smith LW Goering HK amp Gordon CH 1972 Relationships of forage composition with rates of cell wall
digestion and indigestibility of cell walls J Dairy Sci 55 1140
Statistica 81 2008 StatSoft Inc USA
Tomlin DC Johnson RR amp Dehority BA 1964 Relationship of lignification to in vitro cellulose
digestibility of grasses and legumes J Anim Sci 23 161
Vallimont JE Bargo F Cassidy TW Luchini ND Broderick GA amp Varga GA 2004 Effects of
replacing dietary starch with sucrose on ruminal fermentation and nitrogen metabolism in continuous
culture J Dairy Sci 87 4221 - 4229
Van Soest PJ amp Robertson JB 1985 Analysis of forages and fibrous feeds A laboratory manual for
animal science 613 Cornell University Ithaca New York USA
Van Soest PJ Robertson JB amp Lewis BA 1991 Methods for dietary fiber neutral detergent fiber and
nonstarch polysaccharides in relation to animal nutrition J Dairy Sci 74 3583 - 3587
Voelker JA amp Allen MS 2003 Pelleted beet pulp substituted for high-moisture corn effect on rumianl
fermentation pH and microbial protein efficiency in lactating dairy cows J Dairy Sci 86 (11) 3562 -
3570
Williams VJ Rottle MC Moir RJ amp Underwood EJ 1953 Ruminal flora studies in the sheep IV The
influence of varying dietary levels of protein and starch upon digestibility nitrogen retention and the
free microorganisms of the rumen Aust J Biol Sci 6 142
72
Chapter 5
GENERAL CONCLUSION
The constant availability of high quality forages remains a problem in South Africa The efficiency of forage
utilization by ruminants is limited by several chemical and physical properties of forages including a high
fibre content and relative low energy content The primary components of fibre are cellulose hemicellulose
and lignin Supplementing dairy cow diets with concentrates such as sugar starch and pectin has the
potential to improve animal performance by improving the degradability of forage feedstuffs
Results from the current study suggested that the in vitro methods used were sufficient to indicate not only
that forages differ in terms of fermentability and digestibility but also to show that different energy sources
affect fermentation and digestion patterns of forages in different ways
The first study indicated that molasses per se may have a negative effect on total forage fermentability (as
determined by gas production) while citrus pulp may have a negative effect on the fermentability of certain
forages in this case oat hay and ryegrass Maize meal did not affect forage fermentability as measured by
total gas production The study also suggested that citrus pulp and maize meal may increase the
fermentation rate of oat hay while maize may also increase the fermentation rate of kikuyu The lag phase
of wheat straw and kikuyu fermentation may be shortened by all the energy sources investigated viz maize
meal molasses and citrus pulp It was concluded from the first study that forage fermentability is affected
differently by different energy sources These observations may have significant effects in practice on
rumen health and milk production and the data obtained can potentially be used as guide lines in feed
formulations
In the second study it was shown that different energy sources had different effects on in vitro NDF
digestibility (NDFD) of forages In general sucrose (after 24 and 72 hours of incubation) and pectin (72
hours) had no effect on NDFD of forage substrates The supplementation of oat hay with starch and pectin
(24 hours) and wheat straw with starch (24 and 72 hours) however lowered NDFD when compared to the
control treatment It is hypothesized that micro-organisms fermented the easily fermentable energy sources
first before attacking forage NDF The study suggested that forage NDF degradation values are not fixed
and may be altered by energy supplementation
Understanding the interactions that exist between rumen pH forages and NFC fractions used in dairy cow
rations will help when formulating diets for lactating dairy cows Knowledge of these concepts will aid in
formulating diets that will ensure optimal NDFD milk yield and milk composition without causing ruminal
health problems Papers focusing on the topic of the effect of energy sources on forage digestibility and
comparisons between in vivo and in vitro trials are limited and more research are needed in this regard

viii
Energiebronaanvullings het DMD by 24 en 72 uur verbeter buiten vir RYE en KIK (72 uur) Weidingsgrasse
het hoeumlr NDFD as LUC OH en WS By 72 uur was die NDFD van LUC 371 OH 425 WS 403 in
vergelyking met 705 vir KIK en 649 vir RYE lsquon Moontlike verklaring vir die hoeumlr NDFD van KIK en
RYE is omdat dit vars gesnyde material is geoes na slegs 28 dae hergroei Oor die algemeen het sukrose
(24 amp 72 uur) en sitrus-pektien (72 uur) geen effek gehad op NDFD van ruvoersubstrate nie terwyl stysel en
pektien aanvullings tot OH (24 uur) en stysel aanvullings tot WS (24 amp 72 uur) NDFD verlaag het Daar
word hipotetieseer dat mikrobes eers die vinnig fermenteerbare energiebronne fermenteer voordat hulle
ruvoer NDF aanval Hierdie studie beweer dat ruvoer NDFD waardes nie vas is nie en dat dieacute waardes
beiumlnvloed mag word deur energiebron aanvullings
ix
Acknowledgements
I wish to thank the following people and organizations
Prof CW Cruywagen for his support and guidance
Dr Nherera for her help and support
The Hennie Steenberg Trust Fund for funding for the study
The Western Cape Department of Agriculture (Elsenburg) who made cannulated Holstein cows
available for the collection of rumen fluid
Academic and technical staff at the Department of Animal Sciences Stellenbosch University for
providing support where necessary and an ideal working environment
Fellow students who provided me with help and support throughout
My parents for their motivation and support
Al my friends for their motivation support and help
x
Table of Contents
Abstract
ii
Uittreksel
v
Acknowledgements
viii
List of Figures
xii
List of Tables
ix
List of Abbreviations
xiv
CHAPTER 1 INTRODUCTION 1
11 References 2
CHAPTER 2 LITERATURE REVIEW 4
21 Introduction 4
22 Non-fibre carbohydrates and non-structural carbohydrates 5
23 Rumen microbiology 5
24 Physical effective fibre and particle size 6
25 Forage classification 7
251 Factors influencing forage nutritive value 7
2511 Age and maturity 8
2512 Soil fertility and environment 8
26 Fibre 9
27 Van Soest forage fraction analysis 9
28 In vitro techniques for evaluating feed resources 10
29 Carbohydrates 10
291 Non-fibre carbohydrates non-structural carbohydrates 11
2911 Sugar 12
2912 Starch 12
2913 Pectin 13
2914 Sugar vs Starch 14
210 Non-fibre carbohydrate digestibility 14
xi
211 Non-fibre carbohydrate fermentation and organic acid production 15
212 Ruminal acidosis 16
213 Conclusion 17
214 References 18
CHAPTER 3 THE EFFECT OF SUGAR STARCH OR PECTIN ON RATE AND EXTENT OF GAS
PRODUCTION IN DIFFERENT FORAGES 23
Abstract 23
31 Introduction 23
32 Materials and methods 24
321 Study area 24
322 Simulated diets 24
3221 Basal forages 24
3222 Energy supplements 25
3223 Defining the diets 25
323 Chemical analyses of forages and energy sources 25
324 Preparation of samples for gas production 26
325 Preparation of the in vitro medium and reducing solution 28
326 Collection and preparation of rumen fluid 28
327 In vitro incubation 28
328 Converting gas pressure to gas volume 29
329 Estimating kinetic coefficients 29
33 Statistical analysis 30
34 Results and discussion 30
341 Gas production including that from the energy sources 30
342 Gas production parameters including that of forage and energy sources in cases where no
interaction was observed 37
343 Gas production excluding that from energy sources 39
344 Gas production parameters excluding that of energy sources in cases where no interaction was
observed 45
35 Conclusion 47
36 References 48
CHAPTER 4 THE EFFECT OF SUGAR STARCH AND PECTIN AS MICROBIAL ENERGY
SOURCES ON IN VITRO NEUTRAL DETERGENT FIBRE AND DRY MATTER DEGRADABILITY OF
FORAGES
51
Abstract 51
xii
41 Introduction 52
42 Materials and methods 52
421 Study area 52
422 Simulated diets 52
4221 Basal forages 52
4222 Energy supplements 53
4223 Defining the diets 54
423 Chemical analyses of forages and energy sources 54
424 Sample preparation 55
425 Preparation of in vitro medium and reducing solution 58
426 Collection and preparation of rumen fluid 58
427 In vitro incubation 58
428 Residue analysis 59
429 Estimating dry matter degradability 59
4210 Estimating neutral detergent fibre degradability 59
43 Statistical analyses 60
44 Results and discussion 60
441 Effect of maize meal citrus pulp and molasses on apparent in vitro dry matter
degradability 60
442 Effect of maize meal citrus pulp and molasses on apparent in vitro neutral
detergent fibre degradability 62
443 Effect of maize starch citrus pectin and sucrose on apparent in vitro dry matter
degradability 64
444 Effect of maize starch citrus pectin and sucrose on apparent in vitro neutral
detergent fibre degradability 65
45 Conclusion 67
46 References 67
CHAPTER 5 GENERAL CONCLUSION 71
xiii
List of Tables
Table 21 Feed types that fall within the definition of forage (adapted from
Wilkens 2000)
7
Table 22 Energy (MJkg DM) and protein (gkg DM) content of different
classes of forages (Wilkens 2000)
8
Table 23 Forage fraction classification using the method of Van Soest (Van
Soest amp Wine 1967)
9
Table 24 The effect of sugar on dairy cattle performance 14
Table 25
Non-fibre carbohydrate levels for various ration types (Ishler amp
Varga 2001)
15
Table 26 Comparison of acute and sub-acute acidosis (Henning 2004) 6
Table 31 Forages used in simulation diets for lactating dairy cows 25
Table 32 Energy sources used in simulating lactating dairy cow diets 25
Table 33 Chemical composition (gkg DM plusmn SD) of forages and energy
sources used in the trial All values are on a DM basis
27
Table 34 Substrate samples containing either forage or energy
supplements
27
Table 35 Composite dietary samples containing forage and energy sources 28
Table 36 Effects of maize meal citrus pulp and molasses as energy
sources on fermentation kinetics of different forage substrates as
measured by in vitro gas production Gas production of both
energy sources and forage substrates are included
32
Table 37 In vitro gas production parameters of forages as affected by
energy sources as main effects in cases where no interactions
were observed Gas production of both energy sources and
forage substrates are included
38
Table 38 In vitro gas production parameters of forages (irrespective of
forage substrate used) as affected by different energy sources as
main effects in cases where no interactions were observed Gas
production of both energy sources and forage substrates are
included
38
Deleted 8
Deleted 9
Deleted 11
Deleted 6
Deleted 7
Deleted 1
Deleted 8
Deleted 7
Deleted 7
Deleted para
Deleted 9
Deleted 30
Deleted 30
Deleted para35
Deleted 41
Deleted 41
xiv
Table 39 Effects of maize meal citrus pulp and molasses as energy
sources on fermentation kinetics of different forage substrates as
measured by in vitro gas production Gas production resulting
from energy sources was deducted from total gas production
40
Table 310 In vitro gas production parameters of forages as affected by
energy sources as main effects in cases where no interactions
were observed Gas production resulting from energy sources
was deducted from total gas production
45
Table 311 In vitro gas production parameters of forages (irrespective of
forage substrate used) as affected by different energy sources as
main effects in cases where no interactions were observed Gas
production resulting from energy sources was deducted from total
gas production
52
Table 41 Forages used in simulation diets for lactating dairy cows 53
Table 42 Applied energy sources used in simulating the dairy cow diets 54
Table 43 Purified energy sources used in simulating the dairy cow diets 54
Table 44 Chemical composition (gkg DM plusmn SD) of forages and energy
sources used in the trial All values are on a DM basis
55
Table 45 Substrate samples containing either forage or applied energy
supplements
55
Table 46 Composite diets containing forage and applied energy sources 56
Table 47
Diets containing forages alone or a mixture of forages and purified
energy sources Amounts are on an air dry basis
56
Table 48 Effects of maize meal citrus pulp and molasses as energy
sources on in vitro dry matter degradability (DMD) parameters of
different forage substrates
60
Table 49 Effects of maize meal citrus pulp and molasses as energy
sources on in vitro neutral detergent fibre degradability (NDFD)
parameters when incubated in combination with different forage
substrates
63
Table 410 Effects of maize starch citrus pectin and sucrose as energy
sources on in vitro dry matter degradability (DMD) parameters of
different forage substrates
64
Deleted 43
Deleted parapara 48
Deleted 49
Deleted 57
Deleted 57
Deleted
Deleted 58
Deleted para59
Deleted 60
Deleted para60
Deleted 61
Deleted 65
Deleted 67
Deleted 9
xv
Table 411 Effects of maize starch citrus pectin and sucrose as energy
sources on in vitro neutral detergent fibre degradability (NDFD)
parameters of different forage substrates
65
Deleted 70
xvi
List of Figures
Figure 21 Structural and non-structural carbohydrates of plants where ADF
= acid detergent fibre szlig-glucans = (1 rarr 3) (1 rarr 4)-szlig-D-glucans
NDF = neutral detergent fibre NDSF = neutral detergent-soluble
fibre (includes all non-starch polysaccharides not present in
NDF) NSC = non-NDF carbohydrates (Ishler amp Varga 2001)
11
Figure 22 Ruminal pH results for citrus and hominy rations where CPD =
citrus pulp diet and HD = hominy diet (Leiva et al 2000)
14
Figure 31 Gas production of forage substrates alone 34
Figure 32 Gas production of lucerne hay when supplemented with different
energy sources
35
Figure 33 Gas production of oat hay when supplemented with different
energy sources
36
Figure 34 Gas production of wheat straw when supplemented with different
energy sources
36
Figure 35 Gas production of ryegrass when supplemented with different
energy sources
37
Figure 36 Gas production of kikuyu grass when supplemented with
different energy sources
37
Figure 37 Gas production of forage substrates after gas production of
energy sources has been deducted
42
Figure 38 The net effect of energy supplements on gas production of
lucerne hay
42
Figure 39 The net effect of energy supplements on gas production of oat
hay
43
Figure 310 The net effect of energy supplements on gas production of
wheat straw
44
Figure 311 The net effect of energy supplements on gas production of
ryegrass
44
Figure 312 The net effect of energy supplements on gas production of
kikuyu grass
45
Deleted para
Deleted 2
Deleted para15
Deleted 6
Deleted 7
Deleted 8
Deleted 9
Deleted 9
Deleted 40
Deleted 4
Deleted 5
Deleted 6
Deleted 6
Deleted 7
Deleted 7
xvii
List of Abbreviations
ADF Acid detergent fibre
ADL Acid detergent lignin
b Gas production
c Gas production rate
C3H7NO2HCL Cysteine hydrochloride
cp Citrus pulp
CP Crude protein
DM Dry matter
DMI Dry matter intake
EE Ether extract
KIK Kikuyu grass
KOH Potassium hydroxide
L Lag phase
LUC lucerne hay
mm Maize meal
mol Molasses
MP Microbial protein
Na2S9H2O Sodium sulfide nonahydrate
ND Neutral detergent
NDF Neutral detergent fibre
NDSF Neutral detergent-soluble fibre
NFC Non-fibre carbohydrates
NH3N Ammonia nitrogen
NPN Non-protein nitrogen
NSC Non-structural carbohydrates
OH Oat hay
OM Organic matter
pef Physical effectiveness factor
peNDF Physical effective neutral detergent fibre
RDP Rumen degradable protein
RPT Reading pressure technique
RYE Ryegrass
VFA Volatile fatty acids
WS Wheat straw
1
Chapter 1
INTRODUCTION
The compound stomach system of ruminants is adapted to roughage based diets mainly grass (Cherney
1998) Diets of grass and other fibrous feeds however do not meet the energy requirements of high
producing dairy cows (Schwarz et al 1995) Fibre is low in energy and a large consumption thereof results
in rumen fill thus limiting feed intake (Allen amp Oba 2000) Concentrate feeds such as non-fibre
carbohydrates (NFC) provide lactating dairy cows with energy needed to improve performance and
efficiency of production (Henning 2004) Balanced rations consisting of forages and concentrate feeds
ensure optimal production and rumen health For dairy cattle forages should comprise at least 40 of the
diet and NFC should constitute between 35 and 42 of the diet (NRC 2001) Non-fibre carbohydrates such
as sugars starch and pectin are critical in meeting energy requirements for growth and production (Roche amp
Dalley 1996)
The symbiotic relationship between rumen micro-organisms and the host animal is an essential component
in nutrient supply (Van Saun 1998) Ruminant rations should provide the rumen micro-organisms with
sufficient nutrients and an optimal environment for growth (Ishler et al 1996) According to the NRC (2001)
the most important nutrients for optimal microbial growth are protein and carbohydrates Microbial
fermentation and digestion of carbohydrates and protein provide ruminants with volatile fatty acids (VFA) and
microbial protein (MP) The animal uses the VFA as energy and the MP for protein synthesis (Van Saun
1998)
Energy shortages affect lactating cows especially during the first three weeks after calving (Hutjens 1998)
During this time dry matter intake (DMI) is low and milk production is high resulting in a negative energy
balance When formulating diets for lactating dairy cows it is important to consider the total NFC fraction
which primarily comprise of sugars starch and pectins (Larson 2003) The NFC ferment rapidly in the
rumen to VFA (Holtshausen 2004) Batajoo amp Shaver (1994) reported that cows receiving diets with more
than 30 NFC produced more than 40 kg of milkday However they found no milk yield benefits by
increasing the NFC beyond 36 Molasses is a common energy supplement used in dairy rations
(Holtshausen 2004) In addition to this molasses also reduce dustiness and increase palatibility and
moisture content of diets (De Ondarza 2000) Other energy supplements include soybean hulls sugar beet
pulp and citrus pulp Leiva et al (2000) showed that substituting diets that contain 205 citrus pulp (pectin)
for diets containing 195 maize meal (starch) increased milk yield Solomon et al (2000) however
reported that substituting starch-rich diets with pectinndashrich diets had no effect on milk yield
Energy sources such as sugar starch and pectin are frequently used as supplements to forage in ruminant
diets in order to meet the energy requirements for growth and production However there is a lack of
information on the magnitude of the relationship between different carbohydrate sources and rumen neutral
detergent fibre fermentation kinetics
2
The objectives of this study were to determine the impact of three energy sources viz maize meal
molasses and citrus pulp on total gas production rate of gas production dry matter (DM) degradability and
NDF degradability of different forage substrates Forages commonly used in dairy cow diets were chosen as
fermentation substrates These were wheat straw (Triticum aestivum) oat hay (Avena sativa) lucerne hay
(Medicago sativa) kikuyu (Pennisetum clandestinum) and ryegrass (Lolium multiflorum)
11 References
Allen M amp Oba M 2000 Getting more milk from forages Michigan Dairy Review 5(4) Department of
Animal Science Michigan State University
Available at
httpwwwadmanicomalliancedairyTechBulletinsNon20Structural20Carbohydrate20Nutrition
htm
(Accessed 5 August 2008)
Batajoo KK amp Shaver RD 1994 Impact of nonfiber carbohydrate on intake digestion and milk
production by dairy cows J Dairy Sci 77 1580 - 1588
Cherney DJR 1998 Forages for dairy cattle Economical alternatives to alfalfa grass and corn In
Proceedings of the 1998 Tri-State Dairy Nutrition Conference April 21 - 22 Fort Wayne Indiana
USA pp 35 - 50
De Ondarza MB 2000 Non-fibre carbohydrates
Available at httpwwwmilkproductioncomLibraryArticlesNon_Fibre_Carbohydrateshtm
(Accessed 5 August 2008)
Henning P 2004 Acidosis in high producing ruminants - myth or menace Animal Feed Manufacturers
Association (AFMA) South Africa pp 1 - 9
Available at httpwwwengormixcome_articles_viewaspart=529ampAREA=GDC
(Accessed 5 Augustus 2008)
Holtshausen L 2004 Effect of nonfibre carbohydrates on product yield and fibre digestion in fermentations
with mixed ruminal microbes PhD thesis University of Florida Gainesville Florida USA pp 1 - 33
Hutjens MF 1998 Practical approaches to feeding the high producing cow Illini DairyNet University of
Illinois Extension
Available at httpwwwlivestocktrailuiucedudairynetpaperDisplaycfmContentID=247
(Accessed 5 Augustus 2008)
Ishler V Heinrichs J amp Varga G 1996 From feed to milk Understanding rumen function Pennsylvania
State University Extension Circular 422
3
Available at httpanimsciagrenvmcgillcacourses450extrafeed_to_milkconceptshtml
(Accessed 25 August 2008)
Larson CC 2003 The effect of nonfiber carbohydrate source and protein degradability on lactation
performance of holstein cows MSc (Agric) thesis University of Florida Gainesville Florida USA pp
1 - 4
Leiva E Hall MB amp Van Horn HH 2000 Performance of dairy cattle fed citrus pulp or corn products as
sources of neutral detergent-soluble carbohydrates J Dairy Sci 83 2866 - 2875
National Research Council (NRC) 2001 Nutrient requirements of dairy cattle (7th Rev Ed) National
Academy Press Washington DC USA pp 34 - 35
Roche J amp Dalley D 1996 Nutrition and milk composition Agriculture Notes State of Victoria Department
of Primary Industries pp 1 - 3
Available at
httpwwwdpivicgovaudpinreninfnsf9e58661e880ba9e44a256c640023eb2e036a3ac34d507323c
a257181001f0359$FILEAG0534pdf
(Accessed 1 October 2008)
Schwarz FJ Haffner J amp Krichgessner M 1995 Supplementation of zero-grazed dairy cows with
molassed sugar beet pulp maize or cereal-rich concentrate Anim Feed Sci Technol 54 237 - 248
Solomon R Chase LE Ben-Ghedalia D amp Bauman DE 2000 The effect of nonstructural carbohydrate
and addition of full fat soybeans on the concentration of conjugated linoleic acid in milk fat of dairy
cows J Dairy Sci 83 1322 - 1329
Van Saun RJ 1998 Beef cattle nutrition Feeding for two (How to properly feed the cow and her rumen)
In Cow-calf management guide-cattle producers library (2nd Ed) Cooperative Extension Service
Publications Agricultural Publications University of Idaho Moscow Idaho USA pp 172 - 180
4
Chapter 2
LITERATURE REVIEW
21 Introduction
With the increase in the cost of feed medicine labour fuel and other production essentials it is vital for any
agricultural enterprise specifically the traditional lsquofarmrsquo to be operated like a business With the profit-
making goal in mind the single most important facet of a modern dairy-operation is its feeding program An
efficient and successful feeding program will not only maximize the animalrsquos production but will also cut
costs in other areas of the operation by increasing animal health productive life-expectancy and reducing
labour costs A feeding program that achieve these goals will ultimately make the agricultural enterprise
more economically competitive
Dairy cattle require specific amounts of nutrients to support various levels of performance Feeding high
levels of concentrates (especially non-fibrous carbohydrates) to high producing dairy cows is common in all
intensive production systems around the world The problem with high levels of concentrates in dairy cow
diets is the risk of these diets causing digestive disturbances The aim of diet formulation and thus nutritional
management for intensive production systems must be to maximize productivity and overall efficiency
without enhancing digestive disturbances such as acidosis (Henning 2004) A successful feeding program
will meet the cowrsquos nutritive needs for high production minimize weight loss (during early lactation) prevent
digestive upsets and maintain ruminal and animal health
In order to achieve full genetic potential for high milk production it is of the utmost importance to keep the
rumens of dairy cows in a healthy state The rumen is home to a wide diversity of micro-organisms
(including bacteria protozoa and fungi) collectively utilizing the extensive variety of feeds which make up
dairy cow diets (Kamra 2005) Forages are the main component of dairy cow diets Forages alone
however do not meet the energy requirements of high producing dairy cows (Schwarz et al 1995)
Supplementing dairy cow diets with concentrate feeds provide high milk producing cows with energy needed
to improve efficiency of production and performance (Henning 2004) Carbohydrates are the largest nutrient
component of dairy diets and the most important source of energy for rumen micro-organisms
Carbohydrates important for growth reproduction milk production and rumen health make up roughly 70
of dry matter (DM) in dairy diets making it the lsquoheartrsquo of dairy diets (Mertens 1997) Carbohydrates (fibre
starch and sugar) are degraded in the rumen to simple sugars and then fermented into volatile fatty acids
(VFA) by rumen bacteria supplying up to 80 of the animalrsquos energy requirements
5
22 Non-fibre carbohydrates and non-structural carbohydrates
The three main components of the carbohydrate fraction of feeds referred to as non-fibre carbohydrates
(NFC) are starch NDSF (neutral detergent-soluble fibre) and sugars The NFC fraction of feedstuffs is
estimated from the following calculation as proposed by Holtshausen (2004)
100 - crude protein - ether extract - ash - neutral detergent fibre + neutral detergent insoluble crude
protein
The fraction derived by the above calculation has at times been used interchangeably for the terms NFC and
non-structural carbohydrates (NSC) Non-structural carbohydrates however refer to plant cell contents and
include mono- and oligosaccharides organic acids (which are not carbohydrates) starch and fructans Non-
fibre carbohydrates include all of the above substances as well as soluble fibre (pectic substances szlig-
glucans and galactans) Thus NFC includes non-structural and structural carbohydrates as well as non-
fibrous and fibrous carbohydrates (Holtshausen 2004)
In the interest of clarity I will not use the terms NSC and NFC interchangeably I will use NFC exclusively
as its meaning is more complete in the context of this thesis
23 Rumen microbiology
All living organisms require some essential nutrients to sustain metabolic processes and to maintain a
healthy state These essential nutrients include water protein minerals vitamins and essential energy The
difference between the cow itself and the micro-organisms living within its rumen is defined by the source of
their respective nutrients (Van Saun 1993)
Feeding dairy cattle nutritional balanced diets ensures healthy rumens that maximize microbial production
and growth Ruminal pH is the main variable influencing the microbial population and thus the overall VFA
production (major energy source to animal) Diets containing too much NFC may cause the ruminal pH to
decrease below 6 This low rumen pH leads to a reduction in cellulolytic organisms and an increase in
propionate producing micro-organisms in turn leading to a low acetate-propionate ratio This in turn results
in low milk fat percentages (Ishler et al 1996)
Maintaining a healthy rumen microbial population is an essential function of any feeding program Carbon
skeletons and energy are used by rumen micro-organisms for protein synthesis Ruminant systems are
sometimes based on digestible organic or fermentable matter even though rumen micro-organisms are able
to grow and develop on only secondary carbohydrate products Rumen bacteria have specific maintenance
requirements for growth and development Both bacterial growth rate and fractional degradation rate of
carbohydrates determine bacterial yield (Nocek amp Tamminga 1991)
6
24 Physical effective fibre and particle size
Preventing ruminal acidosis requires chemical and physical considerations of the diet as well as a well-
organized feed and herd management system (Hall 2002) The physical form of the diet affects the nutritive
value of the feed as well as the chewing activity dry matter intake rumen function and milk production of the
animal
Particle size plays a critical role in the extent to which rumen micro-organisms can carry out their digestive
functions Grinding or chopping forages does not change the forage composition it only reduces the particle
size Reduced particle size increases dry matter intake and the rumen turnover rate resulting in a reduced
time period within which rumen micro-organisms can digest fibre Reduced particle size also reduces the
time spent on rumination thus leading to less mucus production and a subsequent decrease in rumen pH
Low rumen pH leads to an increase in propionic acid production and tend to change milk components by
lowering milk fat percentages and increasing milk protein percentages Chopping and grinding of
concentrates increase the starch exposure to rumen microbial digestion resulting in increased degradation
Processing methods such as pelleting steam rolling or grinding of concentrates alter the structure of starch
by increasing its availability for fermentation in the rumen This increase in starch availability can be either
favorable by boosting rumen microbial growth or harmful by enhancing the risk of rumen acidosis (Van der
Merwe amp Smith 1991)
As with particle length fibre content of the diet plays an important role in maintaining rumen functions Fibre
ensures sufficient amounts of carbohydrates to slow down the rate of digestion and prevent rumen acidity
Neutral detergent fibre (NDF) and acid detergent fibre (ADF) are the most important fibre fractions in ration
formulation Effective fibre is needed in dairy diets to form a ruminal mat and slow down carbohydrate
availability thereby preventing rumen acidosis (Ishler et al 1996) Balancing the dairy ration for NDF and
non-fibre carbohydrates (NFC) fractions is very important in controlling the rumen pH Buffers are also
commonly used for controlling pH
Physical effective fibre (peNDF) relates the physical properties of a feed (by measuring particle size and
chewing activity) to rumen pH The peNDF of a feed is the product of the feedrsquos physical effectiveness factor
(pef) and the feedrsquos NDF By definition pef varies between 0 (if NDF if is not successful in stimulating
chewing activity) and 1 (if NDF is successful in encouraging chewing activity) (Mertens 1997)
It is very important to always balance the peNDF of the dairy cow diet with dietary fermentability Physical
effective fibre is that fraction of fibre that promotes the chewing activity Thus when feeding lactating cows
it is very important to add adequate amounts of peNDF Optimal inclusion of peNDF will ensure that the cow
chews her cud well enough and in the process secrete enough saliva that helps to control rumen pH
Ruminal pH is primarily determined by the balance between the quantity of fermentation acid produced and
the buffer secretion during chewing (Allen 1997)
7
25 Forage classification
Good forage sources are the foundation of efficient dairy production (Morrison 1959) A large variety of
feeds can be defined as forages (Baloyi 2008) as listed in Table 21 By definition forages are the edible
fractions of plants other than grain that can be harvested for feeding or used as feed for grazing animals
(Forage amp Grazing Terminology Committee 1991) The definition also states that feedstuff must contain
35 or more NDF to be classified as forage (Zinn amp Ware 2007)
It is of utmost importance to remember that a high producing dairy cowrsquos digestible nutrient and net energy
requirements cannot be met by forage alone Generally dairy cows are fed good quality forages and then
supplemented with additional grains or other concentrates in order to meet their requirements
Table 21 Feed types that fall within the definition of forage (adapted from Wilkens 2000)
Forage Feed types
Herbage Leaves roots of non-woody species stems sown and
permanent grasslands crops that may be cut or grazed
Hay Grasses and legumes that have been cut dried and
stored for use as animal feed
Silage
Browse
Fermented high moisture fodder
Leaves bud and twigs of woody species
Straw Dry stalk of cereal plant after the grain or seed has been
removed
251 Factors influencing forage nutritive value
Chemical composition digestibility and the physical characteristics of the digested feed determines the
nutritive value of forage (Goosen 2004) Forages between and within species differ significantly in
composition and nutritive value as indicated in Table 22
8
Table 22 Energy (MJkg DM) and protein (gkg DM) content of different classes of forages (Wilkens 2000)
Forage class Metabolizable energy
MJkg DM
Crude protein
gkg DM
Temperate grasses hays and silages
70-130 60-250
Tropical grasses
50-110 20-200
Maize silage
100-120 60-120
Cereal straw
50-80 20-40
Root crops
110-140 40-130
Kale and rape 90-120 140-220
Age and maturity soil fertility and environmental conditions are the primary factors influencing the nutritive
value of forages Herbage maturity has the largest influence on forage nutritive value (Buxton amp Mertens
1995) Mature forages have higher lignin and cell wall contents that limit fibre utilization due to the rate and
degree of plant cell hydrolysis (Van Soest 1994)
2511 Age and maturity
Young plants are tender with less structural carbohydrates (hemicellulose and cellulose) and lignin compared
to mature plants (McDonald et al 2002) Lignin is indigestible explaining the higher digestibility in younger
plants As plants mature the stems and leaves become lignified decreasing the nutritive value of the plant
due to the lower digestibility of nutrients enclosed in the cell walls (Morrison 1959) Leaves have lower cell
wall content than stems As the plant matures there is an increase in the proportion of stems compared to
leaves thus contributing to the lower digestibility of mature plants (Van Soest 1994)
2512 Soil fertility and environment
Environmental factors that affect forage quality the most are temperature light water and soil fertility (Van
Soest 1994) The mineral content in soil influences not only the crop yield but also its composition
Fertilizers can have a great influence on the nutrient content of soils Fertilized pastures grow better are
more palatable and have higher protein vitamin and mineral contents than unfertilized pastures (Morrison
1959)
9
26 Fibre
Fibre is composed of an indigestible fraction and several potentially digestible fractions that occupy space in
the gastrointestinal tract of ruminants (Mertens 1997) The primary components of fibre are cellulose
hemicellulose and lignin In the rumen feed is digested through microbial fermentation and the physical
breakdown of feed through rumination (Ishler amp Varga 2001) The type of diet fed influences and change
bacteria population in the rumen in order to successfully digest the food used by the cows The level to
which fibre will digest depends on the particle size rumen pH and fibre level in the diet
27 Van Soest forage fraction analysis
Fibre lignin and protein are the three most important chemical fractions determining nutrient supply and
performance (Mould 2003) According to Van Soest (1994) chemical analysis measures digestibility and
intake using the statistical relationship between feed quality and the analyzed feed components The
proximate analysis divided feedstuff into six fractions namely moisture crude protein ash ether extract
nitrogen-free extract and crude fibre (Fisher et al 1995) Van Soest (1994) claimed that the proximate
analysis had one serious error namely that the proximate analysis divided carbohydrates into crude fibre
and nitrogen-free extract Van Soest then developed an analysis specifically for fibre-rich feeds that
replaced the proximate analysis The method of Van Soest predicts intake and the nutritive value of
feedstuffs by determining the fibre fractions according to the degradability of fractions insoluble in neutral
detergent and fractions insoluble in acid detergent (Goosen 2004) Acid detergent fibre determines the
cellulose and lignin content and NDF the cellulose hemicellulose and lignin The difference between NDF
and ADF gives the hemicellulose content (Knudsen 2001) Table 23 gives an outlay of the components
soluble and insoluble in NDF
Table 23 Forage fraction classification using the method of Van Soest (Van Soest amp Wine 1967)
Fraction Components
Cell contents (soluble in neutral detergent) Lipids
Sugar organic acids
Water-soluble matter
Pectin starch
Non-protein nitrogen
Soluble protein
10
Table 23(continue) Forage fraction classification using the method of Van Soest (Van Soest amp Wine 1967)
Cell wall contents (insoluble in neutral detergent)
1 Soluble in acid detergent Fibre-bound protein
Hemicellulose
2 ADF Cellulose
Lignin
Lignified N
Silica
28 In vitro techniques for evaluating feed resources
In vitro methods used to evaluate feed resources are less time-consuming and less expensive than in vivo
methods The in vitro gas production procedure measures the amount of gas produced or collected
recording it manually (Theodorou et al 1994) or automatically (Pell amp Schofield 1993 Davies et al 2000)
This procedure thus generates kinetic data rather than digested feed disappearance (Baloyi 2008) Gas
production gives a description of the microbial activity and how micro-organisms respond to a specific
substrate thereby giving a practical imitation of what happens in the rumen Pell et al (1998) used in vitro
gas production to measure the rate and extent of fermentation VFA production and microbial protein (MP)
production The biggest advantage of the gas production technique is that there is no need to terminate the
gas production in order to measure the extent of digestion The disadvantage of this technique however is
the lack of uniformity in methodology and factors such as pH and temperature that may affect a feedrsquos gas
production (Getachew et al 1997) The traditional two-stage method (Tilley amp Terry 1963) involved an in
vitro fermentation of forages in rumen fluid followed by pepsin digestion The disadvantage of this
technique however is that it is an end-point measurement thus giving no indication on forage digestion
kinetics (Theodorou et al 1994) Goering amp Van Soest (1970) modified the procedure to accurately
estimate the true DM digestibility by treating the residue with a ND solution (Baloyi 2008) The method of
Goering and Van Soest however are also an end-point measurement thus giving no indication on forage
digestion kinetics (Theodorou et al 1994) ANKOM technology developed a technique that simplifies in vitro
digestibility evaluations using an insulated incubator (Daisy II incubator) (Baloyi 2008) The ANKOM
technique predict potential and true digestibility in vitro accurately faster and with less labour
29 Carbohydrates
Carbohydrates can be classified into two groups (structural carbohydrates and non-fibrous carbohydrates)
based on their function in plants (see Figure 21) Structural carbohydrates which are located in the plantrsquos
cell walls are very fibrous and are digested slowly Non-fibrous carbohydrates are located in the plantrsquos
11
leaves and seeds Non-fibrous carbohydrates are easily digested and include starches sugars fructans and
organic acids (Ishler amp Varga 2001)
Acid detergent fibre and NDF are the most universal way of analyzing fibre It is important to note that
although pectins are part of the cell wall they are grouped as non-structural carbohydrates The reason for
this is because pectin other than hemicellulose is entirely fermentable by rumen micro-organisms (Van der
Merwe amp Smith 1991)
Figure 21 Structural and non-structural carbohydrates of plants where ADF = acid detergent fibre szlig-
glucans = (1 rarr 3) (1 rarr 4)-szlig-D-glucans NDF = neutral detergent fibre NDSF = neutral detergent-soluble
fibre (includes all non-starch polysaccharides not present in NDF) NSC = non-NDF carbohydrates (Ishler amp
Varga 2001)
291 Non-fibre carbohydrates non-structural carbohydrates
Non-fibre carbohydrates are the major source of energy for high producing dairy cattle all around the world
Non-fibre carbohydrates are very palatable and easily digested but fermentation varies with type of feed and
means of processing Increasing NFC in the diet fulfils the high energy demands of a lactating dairy cow but
at the expense of NDF (NRC 2001)
The non-structural component of plants can be identified by two different methods chemical analysis (which
uses enzymes to determine the level of starch and sugar in the feed) or difference calculations (which use
NDF crude protein fat and ash to estimate NFC) (Stokes 1997) Russell et al (1992) reported that greater
amounts of NFC in dairy cow diets increase the production of MP Thus NFC in diets for lactating cows has
the potential to increase MP synthesis as well as the efficiency of ruminal undegradable protein utilization
(Casper et al 1990) It must however be emphasized that MP yield differs with different NFC sources
12
Different NFC sources require different inclusions of rumen degradable protein and rumen undegradable
protein in order for an animal to reach optimal performance (Mertens et al 1994)
Milk production per cow is the major factor determining any dairy farmrsquos profitability The inclusion of NFC is
a fashionable way to increase energy density and thus milk production of the dairy herd Replacing part of
the starch in the diet with sugar leads to higher fermentation rates and more MP This might be due to the
fact that sugar digests at a rate of 300 per hour whereas starch digests at a rate of 6 ndash 60 per hour
(Carver 2007) Research has also shown that additional supplementary sugar in feed has the power to
increase feed intake milk yield and fat content of milk due to better fibre digestion and production of MP in
the rumen (Lykos et al 1997)
The importance of adequate amounts of NFC cannot be over emphasized Feeding inadequate amounts of
NFC reduces the energy available from propionic and lactic acid production reduces MP synthesis and
decrease fibre digestion Overfeeding of NFC depress fibre digestion and acetic acid production (lowering
milk fat percentages)
It is important to note that NFC and NSC is not the same in all feeds The difference between these two is
caused by the input of pectin and organic acids Pectin is always included in NFC but not in NSC (NRC
2001) Numerous research experiments investigated the effect of NFC on ruminal pH Knowledge of the
individual as well as a combination of supplemented NFC fermentation characteristics can be helpful in
predicting an animalrsquos performance (Holtshausen 2004)
2911 Sugar
Simple sugars are rapidly fermented in the rumen (at a rate of 300 per hour) and are composed of one or
two units of sugar Sugars commonly fed to dairy cows include sucrose lactose and dextrose Initially
sugar was used in diets to improve the palatability of the feed Recently it was discovered that rumen micro-
organisms respond to sugar by increasing their production of MP leading to higher milk production The
addition of sugar to the feed also helps rumen micro-organisms capture and utilize diet nitrogen Even
though sugar has very advantageous effects on rumen micro-organisms and their actions it is important not
to add too much sugar in dairy cow diets as it can cause ruminal acid-spikes resulting in acidosis (De
Ondarza 2000)
2912 Starch
The NFC in most grain-based diets is made up of starch (24 ndash 28 of the total ration DM) Starch
digestibility plays an important role in the milk production of dairy cows Maize and barley (being cereal
grains) provide most of the starch in a dairy cowrsquos diet Theoretically starch is units of glucose bonded
together Depending on the starch source and method of processing the glucose units can be firmly bonded
or weakly connected This is the main reason why some starches ferment rapidly and others slowly in the
13
rumen of dairy cows Ruminal digestion of starch can vary from 6 ndash 60 per hour depending on the starch
source and processing method used The goal of feeding starch is to achieve maximum total tract
digestibility and maximum MP production without causing ruminal health problems due to production of
fermentation acids (De Ondarza 2000)
2913 Pectin
Pectin is one of the three most essential structural components in forages and is found primarily in the
intercellular layers of plant tissues Pectin diminishes as the plant gets older Most feeds consumed by
dairy cows are low in pectin (2 ndash 3) but several feeds may contain higher concentrations such as citrus
pulp (15) beet pulp (15 ndash 20) and lucerne (3 ndash 10) Pectin contributes to the energy requirements of
rumen micro-organisms (75 ndash 90 of pectin fermentation takes place in the rumen) (Allen 2001)
Many of the species that break down pectin also digest plant components such as cellulose and
hemicellulose Pectin is extremely fermentable and highly digestible but this does not appear to lower pH as
is often seen with starch digestion Due to this feeds containing pectin are often supplemented into high
concentrate dairy diets to avoid problems associated with rumen acidosis (Mohney 2002)
A study done by Dehority (1969) found that a number of different rumen bacteria are capable of fermenting
pectin (using it as a carbon source) eg Butyrivibrio fibrisolvens Prevotella ruminicola Lachnospira
multiparus Treponema bryantii and Succinivibrio dextrinosolvens Later studies discovered that the
products of the hydrolysis (by Lachnospira multiparus bacterium) of pectic material can be used by other
ruminal micro-organisms such as Selenomonas ruminantium Fusobacterium sp Eubacterium ruminantium
and Succinivibrio dextrinosolvens (Paggi et al 2005)
2914 Sugar vs Starch
Leiva et al (2000) investigated the effect of two maize silagelucerne hay-based diets on ruminal pH The
only difference between these two diets was that their NFC came from either starch (hominy) or sugars
(dried citrus pulp) From this trial it was concluded that the pH declined more rapidly on citrus diets (sugar)
than on hominy (starch) diets and also reaching the lowest pH point faster (Figure 22)
14
Figure 22 Ruminal pH results for citrus and hominy rations where CPD = citrus pulp diet and HD = hominy
diet (Leiva et al 2000)
From the studies done by Leiva et al (2000) it was observed that starch has the best chance of increasing
milk production However the problem with high starch diets is that they are likely to cause serious rumen
acidosis One way to ensure healthy rumens as well as high milk production is to use peNDF as a
benchmark The more peNDF a cow consumes the more starch may be included in the diet Physical
effective neutral detergent fibre thus lowers the risk of ruminal acidosis The effect of supplementing sugar
to forage based diets is shown in Table 24
Table 24 The effect of sugar on dairy cattle performance
MP = microbial protein OM = organic matter DMI = dry matter intake
210 Non-fibre carbohydrate digestibility
Non fibre carbohydrates are composed of starch and sugar Starch digestibility has a major effect on the
rumen Starch fermentation varies with processing and type of grain fed Processing such as grinding
Reference Forage Source Supplements Intake g DM day Animal Response
Chamberlain et al
1985
Grass Sugar 9072 g sugar MP synthesis uarr
Huhtanen 1988 Grass Molasses 9979 g molasses
(499 g sugar)
OM digestion amp
MP production uarr
Nombekela amp
Murphy 1995
Lucerne Haylage
amp Maize Silage
Sucrose 2858 g sucrose Milk yield (9072 g)
amp DMI uarr
15
steaming and ensiling affects ruminal availability of starch Processing mostly increases rate of fermentation
and digestibility of starch Soluble sugar ferments rapidly in the rumen and is readily available as energy
sources for the animal (Ishler amp Varga 2001) Mature grains (maize or oats) usually contain a small amount
of sugar because most has been converted to storage polysaccharides Forages (pasture or hay) usually
contain a lot of sugars The level of sugar in hay is depended on crop management Byproducts (molasses
citrus pulp and almond hulls) contain high levels of sugars However the variation in processing methods
(as in the case of starch) and the type of material used can lead to large variation in sugar content (Hall
2002)
One problem with diets high in NFC is the fact that it lowers the rumen pH increasing the risk of acidosis
The main reason for this is NFC fast fermentability especially if it replaces fibre in low fibre diets Acidosis in
turn affects ruminal digestion intake metabolism milk fat production milk production as well as rumen and
animal health The NFC levels of various feed types are shown in Table 25
Table 25 Non-fibre carbohydrate levels for various ration types (Ishler amp Varga 2001)
211 Non-fibre carbohydrate fermentation and organic acid production
The rate and extent of carbohydrate fermentation determines the concentration of organic acids produced
Rumen micro-organisms digest simple and complex carbohydrates (fibre) by converting them into VFA
(mainly acetic propionic and butyric acid) These VFA are the most important energy source for ruminants
Volatile fatty acids account for 60 ndash 70 of metabolizable energy supply in ruminants making it of great
importance in the production of milk by dairy cows Reduction in fibre digestion leads to a reduction in
ruminal pH This is caused by rapid NFC fermentations leading to increased VFA production by rumen
micro-organisms
Typical NFC level Typical feedstuffs
33 ndash 36 Barley oats high moisture- steam flaked-
and finely ground grain predominate the
concentrate portion of the diet
37 ndash 39
High quality hay crop forages
predominates the ration maize silage
rations include non-forage fibre sources
40 ndash 42
Coarsely processed maize is used diet
has a high inclusion level of non-forage
fibre sources
16
Feeding large amounts of forage produces greater amounts of acetic acid whilst resulting in lesser amounts
of propionic and butyric acid On the other hand feeding grain or other finely ground forages may lead to a
reduction in acetic acid while the amount of propionic acid may increase The ratio of acetic to propionic
acids imitates the rumen fermentation pattern Under an optimal rumen fermentation environment the acetic
to propionic ratio should be greater than 221 High planes of acetate can point to a low fermentable
carbohydrate high fibre ration High planes of propionic acid on the other hand can point to reduced fibre
digestion and acidosis (University of Minnesota 1996)
A study done by Strobel amp Russel (1986) found that pectin fermentation increased acetate concentrations
further compared to starch and sucrose The study concluded that the increased acetate might ultimately
contribute to increase precursors for fatty acid and milk fat synthesis in lactating dairy cows Fermentation
studies done with sucrose and starch on the other hand increased butyrate production (Hoover et al
2006) Butyrate has shown to be an important precursor of energy supplied to skeletal and heart muscles
(Holtshausen 2004) Sugar ferments extremely fast in the rumen Without linkages to other carbohydrates
and due to the high solubility of sugars there is little to impede microbial fermentation (Hall 2002) Several
studies reported that sugar has a much higher potential for lactate production when compared to other NFC
sources (for example starch) (Strobel amp Russel 1986 Heldt et al 1999)
212 Ruminal acidosis
Micro-organisms in the rumen obtain energy primarily from fermentation of carbohydrates Acidosis occurs
when the diet of ruminants is suddenly changed from a forage based diet to a predominant concentrate diet
The highest risks come from diets that are high in starch or fast fermentable carbohydrates and the effective
fibre is below the recommended level or the particle size is too small This leads to higher VFA production
as well as very high glucose levels in the rumen Subsequently ruminal osmolarity increases leading to
ruminal acidity The increase in osmolarrity is due to the negative effect the high glucose level has on
Streptococcus bovis and lactic acid-producing micro-organisms (Henning 2004) Acidosis can be divided
into sub-acute ruminal acidosis and acute acidosis as seen in Table 26
Table 26 Comparison of acute and sub-acute acidosis (Henning 2004)
Acidosis Item Acute Sub-Acute
Clinical Signs Present Absent
Systemic Acidosis Present Absent
Mortality Yes No
Ruminal pH lt 50 50 -55
17
Table 26(continue) Comparison of acute and sub-acute acidosis (Henning 2004)
Ruminal Acids
Lactic Acid High (50-100mM) Normal (0-5mM)
Volatile Fatty Acids Below Normal (lt100mM) High (150-200mM)
Ruminal Bacteria
Lactic Acid Producers Very High Normal to Small Increase
Lactic acid Utilisers Significant Reduction Increase
Ruminal Protozoa Absent or Reduced Absent or Reduced
Indicators determining whether ruminal acidosis is accruing in the herd include (Ishler amp Varga 2001)
Milk fat percentage (darr milk fat ndash darr ruminal pH)
Chewing activity (darr rumination ndash uarr ruminal acidosis)
Laminitis (uarr laminitis ndash uarr ruminal acidosis)
Strategies for avoiding acidosis
Provide good quality total mixed rations
Give small but frequent meals
Avoid abrupt changes in diets
213 Conclusion
Achieving maximum production and maintaining a healthy rumen ecosystem at the same time is a balancing
act A cow will attain more VFA when fermentation is maximized These VFA are used as energy
precursors and to synthesize MP Increased fermentation however goes together with increased acid
production and a lower rumen pH Low rumen pH can lead to metabolic disorders due to impaired fibre
digestion Thus by increasing the peNDF intake the risk of acidosis can be reduced effectively
Non-fibre carbohydrates are the essential source of energy for high producing dairy cattle One problem with
diets high in NFC however is the fact that it lowers the rumen pH increasing the risk of acidosis This is
mainly due to the fast fermentability of NFC especially if it replaces fibre in low fibre diets Acidosis in turn
affects ruminal digestion intake metabolism milk fat production and milk production as well as rumen and
animal health
A better understanding of the workings of the rumen as a whole ecosystem as well as ensuring optimal
sugar starch and peNDF in dairy cow ration will enable farmers to maintain the fine balance between
productivity and acidosis
18
Whilst the goal of any modern agricultural enterprise is to maximize profits special care should be taken not
to increase short-term profits at the cost of long-term viability A dairy cowrsquos productivity can easily be
increased whilst the animalrsquos health could suffer in the long term In the modern scenario the farm is as
much a profit-seeking enterprise as any other business With this in mind the modern farmer in his capacity
as a business manager should ensure the well-being and optimal performance of his assets
214 References
Allen MS 1997 Relationship between fermentation acid production in the rumen and the requirement
for physically effective fiber J Dairy Sci 80 1447 - 1462
Allen M 2001 Formulating lactating cow diets for carbohydrates In Proceedings of the 5th Western Dairy
Management Conference April 4 - 6 Las Vegas Nevada USA pp 79 - 86
Baloyi TF 2008 Effects of exogenous fibrolytic enzymes on in vitro fermentation kinetics of forage and
mixed feed substrates MSc (Agric) thesis Stellenbosch University Stellenbosch South Africa pp 1 -
28
Buxton DR amp Mertens DR 1995 Quality-related characteristics of forage In Forages An introduction to
grassland agriculture (2nd Ed) Eds Barnes RF Miller DA and Nelson CJ Iowa State University
Press Ames Iowa USA pp 83 - 96
Carver LA 2007 Sugar aids lactating dairy cattle production Feedstuffs 79(2) 1 - 3
Casper DP Schingoethe DJ amp Esenbeisz WA 1990 Response of early lactation dairy cows fed diets
varying in source of nonstructural carbohydrate and crude protein J Dairy Sci 73 1039 - 1050
Chamberlain DG Thomas PC Wilson W Newbold CJ amp MacDonald JC 1985 The effects of
carbohydrate supplements on ruminal concentrations of ammonia in animals given diets of grass
silage J Agric Sci Cam 104 331 - 340
Davies ZS Mason D Brooks AE Griffith GW Merry RW amp Theodorou MK 2000 An automated
system for measuring gas production from forages inoculated with rumen fluid and its use in
determining the effect of enzymes on grass silage Anim Feed Sci Technol 83 205 - 221
Dehority BA 1969 Pectin-fermenting bacteria isolated from bovine rumen J Bacteriol 99 189 - 196
De Ondarza MB 2000 Non-fibre carbohydrates
Available at httpwwwmilkproductioncomLibraryArticlesNon_Fibre_Carbohydrateshtm
(Accessed 5 August 2008)
19
Fisher DS Burns JC amp Moore JE 1995 The nutritive evaluation of forage In Forages An introduction
to grassland agriculture (1st Ed) Eds Barnes RF Miller DA amp Nelson CJ Iowa State University
Press Ames Iowa USA pp 105 - 115
Forage amp Grazing Terminology Committee 1991 Vegetation terms In Terminology for grazing lands and
grazing animals Pocahontas Press Inc Blacksburg Virginia USA
Getachew G Makkar HPS amp Becker K 1997 The in vitro gas coupled with ammonia measurements for
evaluation of nitrogen digestibility in low quality roughages using incubation measurements of different
measuring capacity J Sci Food Agric
Goering HK amp Van Soest PJ 1970 Forage fibre analysis (apparatus reagents procedures and some
applications) Agricultural Handbook Number 379 ARS-USDA Washington DC USA
Goosen L 2004 The effect of an exogenous fibrolytic enzyme on forage digestibility parameters MSc
(Agric) thesis Stellenbosch University Stellenbosch South Africa pp 1 - 27
Hall MB 2002 Working with sugars (and molasses) In Proceedings of the 13th Annual Florida Ruminant
Nutrition Symp January 11 - 12 Gainesville Florida USA pp 146 - 158
Heldt JS Cochran GL Stokka GL Farmer CG Mathis CP Titgemeyer EC amp Nagaraja TG
1999 Effects of different supplemental sugars and starch fed in combination with degradable intake
protein on low-quality forage use by beef steers J Anim Sci 77 2793 - 2802
Henning P 2004 Acidosis in high-producing ruminants - myth or menace Animal Feed Manufacturers
Association (AFMA) South Africa pp 1 - 9
Available at httpwwwengormixcome_articles_viewaspart=529ampAREA=GDC
(Accessed 5 Augustus 2008)
Holtshausen L 2004 Effect of nonfibre carbohydrates on product yield and fibre digestion in fermentations
with mixed ruminal microbes PhD thesis University of Florida Gainesville Florida USA pp 1 - 33
Hoover WH Tucker C Harris J Sniffen CF amp De Ondarza MB 2006 Effects of nonstructural
carbohydrate level and starchsugar ratio on microbial metabolism in continuous culture of rumen
contents Anim Feed Sci Technol 128(3 - 4) 307 - 319
Huhtanen P 1988 The effects of barley unmolassed sugar-beet pulp and molasses supplements on
organic matter nitrogen and fibre digestion in the rumen of cattle given a silage diet Anim Feed Sci
Technol 20 259
20
Ishler V Heinrichs J amp Varga G 1996 From feed to milk Understanding rumen function Pennsylvania
State University Extension Circular 422
Available at httpanimsciagrenvmcgillcacourses450extrafeed_to_milkconceptshtml
(Accessed 25 August 2008)
Ishler V amp Varga G 2001 Carbohydrate nutrition for lactating dairy cattle Pennsylvania State University
Code DAS 01 - 29 (online) pp 1 - 11
Available at httpwwwdaspsueduteamdiary
(Accessed 5 August 2008)
Kamra DN 2005 Rumen microbial ecosystem Current Science 89(1) 124 - 135
Knudsen KE 2001 The nutritional significance of lsquodietary fibrersquo analysis Anim Feed Sci Technol 90 3 -
20
Leiva E Hall MB amp Van Horn HH 2000 Performance of dairy cattle fed citrus pulp or corn products as
sources of neutral detergent-soluble carbohydrates J Dairy Sci 83 2866 - 2875
Lykos T Varga GA amp Casper D 1997 Varying degradation rates of total nonstructural carbohydrates
effects on ruminal fermentation blood metabolites and milk production and composition in high
producing holstein cows J Dairy Sci 80(12) 3341 - 3355
McDonald P Edwards RA Greenhalgh JFD amp Morgan CA 2002 Evaluation of food Digestibility In
Animal Nutrition (6th Ed) Pearson Education Ltd Edinburgh Gate Harlow Essex UK pp 246 - 263
Mertens DR 1997 Creating a system for meeting the fibre requirements of dairy cows J Dairy Sci 80
1463 - 1481
Mertens D R Broderick GA amp Simons R 1994 Efficacy of carbohydrate sources for improving
utilization of N in alfalfa silage J Dairy Sci 77(Suppl 1) 240 - 252
Mohney K 2002 Synchronization of carbohydrate and protein metabolism by ruminal microbes in
continuous culture PhD thesis North Carolina State University Raleigh North Carolina USA pp 1 -
69
Morrison FB 1959 Feeds and feeding A handbook for the student and stockman (22nd Ed) Eds The
Morrison Publishing Company Clinton Iowa USA 1165 pp
Mould FL 2003 Predicting feed quality - chemical analysis and in vitro evaluation Field Crops Research
84(1) 31 - 44
21
National Research Council (NRC) 2001 Nutrient requirements of dairy cattle (7th Rev Ed) National
Academy Press Washington DC USA pp 34 - 35
Nocek J E amp Tamminga S 1991 Site of digestion of starch in the gastrointestinal tract of dairy cows and
its effect on milk yield and composition J Dairy Sci 74 3598 - 3629
Nombekela S W amp Murphy MR 1995 Sucrose supplementation and feed intake of dairy cows in early
lactation J Dairy Sci 78 880 - 885
Paggi RA Rodriguez C amp Fay JP 2005 Growth and pectate-lyase activity of the ruminal bacterium
lachnospira multiparus in the presence of short-chain organic acids Lett Appl Microbiol 41 434 -
439
Pell AN amp Schofield P 1993 Computerized monitoring of gas production to measure forage digestion in
vitro J Dairy Sci 76 1063 - 1073
Pell AN Pitt RE Doane PH amp Shofield P 1998 The development use and application of gas
production techniques at Cornell University USA In In vitro techniques for measuring nutrient supply
to ruminants Eds Deaville ER Owen E Adesogan AT Rymer CHuntington JA amp Lawrence
TLJ British Society of Animal Science Edinburgh UK Publication 22 45 - 54
Russell JB OrsquoConnor JD Fox DG Van Soest PJ amp Sniffen CJ 1992 A net carbohydrate and
protein system for evaluating cattle diets Ruminal fermentation J Anim Sci 70 3551 ndash 3561
Schwarz FJ Haffner J amp Krichgessner M 1995 Supplementation of zero-grazed dairy cows with
molassed sugar beet pulp maize or cereal-rich concentrate Anim Feed Sci Technol 54 237 - 248
Stobel HJ amp Russel JB 1986 Effect of pH and energy spilling on bacterial proteien synthesis by
carbohydrate-limited cultures of mixed rumen bacteria J Dairy Sci 69 2941 - 2947
Stokes SR 1997 Balancing carbohydrates for optimal rumen function and animal health In Proceedings
of the West Can Dairy Sem 9 73 - 86
Available at httpwwwwcdsafnsualbertacaProceedings1997ch06-97htm
(Accessed 7 October 2008)
Theodorou MK Williams BA Dhanoa MS McAllan AB amp France J 1994 A simple gas production
method using a pressure transducer to determine the fermentation kinetics of ruminant feeds Anim
Feed Sci Technol 48 185 - 197
Tilley JMA amp Terry RA 1963 A two-stage technique for the in vitro digestion of forage crops J Br
Grassl Soc 18 104 - 111
22
University of Minnesota 1996 Feeding the dairy herd (online)
Available at httpwwwextensionumnedudistributionlivestocksystemscomponentsDI0469-02
(Accessed 5 August 2008)
Van der Merwe FJ amp Smith WA 1991 Dierevoeding Kosmo Publ Stellenbosch South Africa pp 89 -
141 (in Afrikaans)
Van Saun RJ 1993 Dairy cattle nutrition feeding for two In Proceedings of the 1993 Northwest and
Lower Columbia Dairy Short Course January 21 - 22 amp 25 - 26 Everett Washington and Portland
Oregon USA pp 172 - 180
Van Soest PJ 1994 Nutritional ecology of the ruminant (2nd Ed) Cornell University Press Ithaca New
York USA pp 467 - 476
Van Soest PJ amp Wine RH 1967 Use of detergents in the analysis of fibrous feeds IV Contamination of
Plant Cell-wall Constituents J Assoc Off Anal Chem 50 50 - 55
Wilkins RJ 2000 Forages and their role in animal systems In Forage evaluation in ruminant nutrition
Eds Givens DI Owen E Axford RFE Omed HM CAB International Wallingford UK pp 1 -14
Zinn RA amp Ware RA 2007 Forage quality Digestive limitations and their relationships to performance of
beef and dairy cattle 22nd Annual Southwest Nutrition amp Management Conference February 22 - 23
University of California Davis Caifornia USA
Available at httpagarizonaeduansswnmc2007talksZinn_2007SWNMCpdf
(Accessed 16 September 2008)
23
Chapter 3
THE EFFECT OF SUGAR STARCH OR PECTIN ON RATE AND
EXTENT OF GAS PRODUCTION IN DIFFERENT FORAGES
Abstract
The study evaluated the effect of sugar (molasses) starch (maize meal) or pectin (citrus pulp) on total gas production (b)
and rate of gas production (c) of different forages The forage substrates included wheat straw (WS) oat hay (OH)
lucerne hay (LUC) ryegrass (RYE) and kikuyu grass (KIK) The three energy sources as well as a control (no energy
source) were incubated in vitro with each of the above mentioned forages Rumen fluid was collected from two lactating
Holstein cows receiving a diet consisting of oat hay lucerne wheat straw and a concentrate mix Forages alone andor
together with either molasses citrus pulp or maize meal were weighed into 100 ml glass vials and incubated for 72
hours The weights of the energy sources were calculated on an energy equivalent basis Blank vials that contained no
substrates were included to correct for gas production from rumen fluid alone The substrates were incubated in a
mixture of 40 ml buffered medium 2 ml of reducing solution and 10 ml rumen fluid Gas pressure was recorded
automatically every five minutes using a pressure transducer system and the method based on the Reading Pressure
Technique Gas pressure was converted to gas volume using a predetermined regression equation In the first trial the
gas production included gas produced by the energy sources while in the second trial the energy source gas production
was deducted from the total gas production to determine the effect of energy source on gas production of respective
forage substrates per se Data were fitted to two non-linear models Significant forage x energy interactions were
observed for the non-linear parameter b (gas production) in Model 1 and for b and L (lag phase) in Model 2 in both trials
In the first trial the higher fermentability of the energy sources supplemented to forage substrates increased b (Model 1
amp 2) of the LUC and WS (P lt 005) The gas production rate was affected in different ways for different forages with the
most noticeable effect when WS was supplemented with energy sources All the energy sources increased c of WS
irrespective of the model used Energy sources had no effect on the L of LUC OH or RYE but decreased the L of WS (P
= 0004) and KIK (P = 0022) In the second trial maize meal had no effect on b for any of the forages (Model 1 amp 2)
while molasses (Model 1 amp 2) decreased b for all forage substrates and citrus pulp (Model 1 amp 2) decreased b of OH and
RYE to lower values than those of the control treatments Gas production rate was not affected by molasses for any of
the forage substrates while citrus pulp (Model 1 amp 2) increased c of OH and maize meal increased c of OH and KIK
Lag phase was only affected by energy sources in WS (P = 0001) and KIK (P = 0009) where all the energy sources
had lower L values than the control treatment It was concluded that forage fermentability is affected differently by
different energy sources These observations may have important implications for rumen health and milk production
and the data obtained can potentially be used as guidelines in feed formulations
31 Introduction
Forages contribute significant major part of dairy cow diets However forages alone cannot provide all the
energy requirements of high producing dairy cows (Schwarz et al 1995) Forage degradation by rumen
micro-organisms is restricted by the chemical composition and physical quality of the forage (Mertens 1997)
Fibrous feeds are low in energy and a large consumption thereof results in rumen fill thus limiting feed intake
24
(Allen amp Oba 2000) It is important to find ways to improve forage degradation and utilization
Improvements in forage degradation will increase energy intake and subsequently milk production and
performance (Giraldo et al 2008)
Different sources of non-fibre carbohydrates (NFC) have different effects on animal performance
Supplementing forage based diets with energy sources containing sugar starch or pectin results in variation
of performance measurements such as milk yield milk composition dry matter intake (DMI) and feed
efficiency (Larson 2003) Aldrich et al (1993) reported that feeding high rumen-available NFC increased
milk protein percentage slightly (301 vs 307) but significantly Leiva et al (2000) showed that
substituting diets containing 205 citrus pulp for diets containing 195 corn meal yielded more milk
Solomon et al (2000) however reported that substituting starch (maize) diets with pectin (citrus pulp) diets
had no effect on milk yield but increased linoleic acid concentration in milk fat When formulating diets for
dairy cows it is important to understand the digestion and metabolizable nutrient yield of the various NFC
sources (Larson 2003)
The objective of this study was to determine the impact of three energy sources viz maize meal
(representative of starch) molasses (representative of sugar) and citrus pulp (representative of pectin) on
fermentation kinetics of different forage substrates as determined by total gas production (b) and the rate of
gas production (c) Forages commonly used in dairy cow diets in South Africa (wheat straw oat hay lucerne
hay kikuyu and ryegrass) were used as substrates
32 Materials and methods
321 Study area
The study to evaluate the effect of supplementing forage based diets with sugar starch and pectin on rumen
kinetic parameters was conducted at Stellenbosch University Stellenbosch South Africa (33deg 55prime 12Prime S
18deg 51prime 36Prime E)
322 Simulated diets
3221 Basal forages
Five forages (Table 31) were used to prepare rations to simulate diets for lactating dairy cows
25
Table 31 Forages used in simulation diets for lactating dairy cows
Forage Type Abbreviation
Wheat straw (Triticum aestivum) WS
Oat hay (Avena sativa) OH
Lucerne hay (Medicago sativa) LUC
Ryegrass (Lolium multiflorum) RYE
Kikuyu grass (Pennisetum clandestinum) KIK
Rye and kikuyu grasses were harvested after four weeks of re-growth All the forages were oven dried at
60ordmC for 72 hours Wheat straw oat hay and lucerne hay were ground (Cyclotec 1093 mill) through a 2 mm
screen Rye and kikuyu grasses were obtained from the Outeniqua experimental farm (33deg 57prime 0Prime S
22deg 25prime 0Prime E) situated just outside George South Africa (33deg 58prime 0Prime S 22deg 27prime 0Prime E) The rye and kikuyu
grasses were already ground through a 1 mm screen when received
3222 Energy supplements
Three energy sources (Table 32) were selected as supplements to prepare rations that would simulate
lactating cow diets
Table 32 Energy sources used in simulating lactating dairy cow diets
Energy type Source Abbreviation
Starch Yellow maize meal (Zea mays) Mm
Sugar Molasses syrup Mol
Pectin Citrus pulp Cp
These energy feedstuffs were sourced in the following forms molasses as a syrup by-product from the
processing of sugar cane (Officinarum saccharum) citrus pulp as a finely granulated residue by-product from
the peel pulp and seeds of oranges and grapefruit and yellow maize grain The citrus pulp and maize was
milled (Cyclotec 1093 mill) through a 1 mm screen
3223 Defining the diets
A total of 23 simulated diets (forages and forage-concentrate mixes) were prepared
bull 5 diets contained forage substrates only (Table 31)
bull 3 diets contained energy sources only (Table 32)
bull 15 diets contained a mixture of forages (Table 31) and energy sources (Table 32)
26
The final substrate compositions are indicated in Table 34
323 Chemical analyses of forages and energy sources
Samples (1 g) of each forage type and energy sources (1 g) were accurately weighed and placed in a 100ordmC
conventional oven for 24 hours to determine dry matter (DM) content (AOAC 1995 Method 93015)
Organic matter was determined by weighing 1 g of each feedstuff into crucibles and ashing the content at
500ordmC in a muffle furnace for 6 hours (AOAC 1995 Method 94205)
The NDF content was determined by measuring 05 g of each feedstuff into F57 ANKOM fibre analysis bags
The bags were heat sealed and NDF determined using the method of Van Soest et al (1991) Sodium
sulfite (Na2SO3) was added to the NDF solution during digestion and heat-stable amylase was added during
rinsing Ether extract was determined using the AOAC method (AOAC 1995 Method 92039) About 2 g of
ground sample was weighed into a thimble and samples were extracted with diethyl ether (C4H10O)
Acid detergent lignin (ADL) was determined by measuring 05 g of each substrate sample into separate F57
ANKOM fibre analysis bags The bags were heat sealed and acid detergent fibre (ADF) determined using
the method of Van Soest et al (1991) The ADF residue was then soaked in 72 sulphuric acid for three
hours to dissolve the cellulose Acid detergent lignin was determined using the ANKOM method (ANKOM
2005)
Total nitrogen content was determined with a Leco Nitrogen Gas Analyzer custom designed and built by
LECO Africa (Pty) Ltd (Kempton Park) About 01 g of sample was accurately weighed into a small square of
aluminum foil The samples were then ignited inside the Leco furnace at about 900degC according to the
Dumas procedure (AOAC 1990 Method 96806) Crude protein (CP) was calculated by multiplying the
nitrogen content with 625 (AOAC 1995 Method 99003) The results obtained from the chemical analysis
are shown in Table 33
324 Preparation of samples for gas production
The gas production method used was based on the Reading Pressure Technique (Mauricio et al 1999)
Samples of the respective dietary substrates (Tables 34 and 35) were weighed into glass vials with known
volume The vials had a nominal volume of 100 ml but the exact volume of each vial was previously
accurately determined The amount of the energy sources in Table 35 were calculated to provide the same
amount of metabolizable energy (ME) than 0125 g maize DM For calculation purposes ME values were
assumed to be 139 MJkg DM for maize 122 MJkg DM for citrus pulp and 123 MJkg for molasses (NRC
2001) Blank vials were prepared exactly as the others except that they did not contain any substrates in
order to correct for gas production from rumen fluid alone
27
Table 33 Chemical composition (gkg DM plusmn SD) of forages and energy sources used in the trial All values
are on a DM basis
Feedstuff DM OM NDF CP EE ADL
WS 9150 plusmn 05 9022 plusmn 16 8179 plusmn 71 723 plusmn 10 36 plusmn 05 1022 plusmn 30
OH 8504 plusmn 23 9403 plusmn 173 7819 plusmn 110 910 plusmn 12 97 plusmn 08 825 plusmn 03
LUC 8989 plusmn 20 9062 plusmn 18 5153 plusmn 10 2370 plusmn 46 81 plusmn 06 927 plusmn 67
RYE 938 plusmn 10 845 plusmn 05 4892 plusmn 30 2509 plusmn 27 431 plusmn 01 448 plusmn 181
KIK 1242 plusmn 104 1122 plusmn 01 6512 plusmn 20 2534 plusmn 41 283 plusmn 11 480 plusmn 17
mm 8559 plusmn 09 9844 plusmn 13 1743 plusmn 550 1071 plusmn 02 377 plusmn 04 70 plusmn 06
cp 8799 plusmn 09 9285 plusmn 07 2614 plusmn 140 786 plusmn 18 164 plusmn 04 253 plusmn 64
mol 6980 plusmn 19 8927 plusmn 06 ND ND ND ND
DM = dry matter OM = organic matter NDF = neutral detergent fibre CP = crude protein EE = ether
extract ADL = acid detergent lignin ND = not determined WS = wheat straw OH = oat hay LUC = lucerne
RYE = ryegrass KIK = kikuyu grass mm = maize meal cp = citrus pulp mol = molasses
Table 34 Substrate samples containing either forage or energy supplements
Forage type Energy source Sample size (g DM)
Wheat straw - 02500
Oat hay - 02500
Lucerne hay - 02500
Ryegrass - 02500
Kikuyu grass - 02500
- Maize meal 01250
- Citrus pulp 01425
- Molasses 01412
28
Table 35 Composite dietary samples containing forage and energy sources
Forage type Energy source Forage (g DM) Energy (g DM)
Wheat straw Maize meal 01250 01250
Wheat straw Citrus pulp 01250 01425
Wheat straw Molasses 01250
01412
Oat hay Maize meal 01250 01250
Oat hay Citrus pulp 01250 01425
Oat hay Molasses 01250
01412
Lucerne hay Maize meal 01250 01250
Lucerne hay Citrus pulp 01250 01425
Lucerne hay Molasses 01250 01412
Ryegrass Maize meal 01250 01250
Ryegrass Citrus pulp 01250 01425
Ryegrass Molasses 01250
01412
Kikuyu grass Maize meal 01250 01250
Kikuyu grass Citrus pulp 01250 01425
Kikuyu grass Molasses 01250 01412
325 Preparation of the in vitro medium and reducing solution
The incubation medium was prepared as described by Van Soest amp Robertson (1985) The medium
consisted of micro minerals macro-mineral solution buffer solution tryptose rezasurin and distilled water
The medium was kept in a water bath at 395ordmC The pH of the medium was about 78 Reducing solution
was prepared as described by Van Soest amp Robertson (1985) and consisted of cysteine hydrochloride
(C3H7NO2HCL) potassium hydroxide (KOH) pellets sodium sulfide nonahydrate (Na2S9H2O) and distilled
water
326 Collection and preparation of rumen fluid
Rumen fluid was collected from two ruminally cannulated lactating Holstein cows The cows were confined
and received 25 kg per day (air dry basis) of a diet consisting of oat hay lucerne hay wheat straw and a
concentrate mix The total diet contained 11279 gkg CP 55948 gkg NDF and 5950 gkg ash with a
calculated ME content of 108 MJkg The diet was offered in two equal amounts viz 125 kg in the morning
(0630) and 125 kg in the afternoon (1630) Rumen fluid was squeezed through two layers of cheese cloth
into pre-warmed thermos flasks and a handful of solid material was added The rumen fluid was then
blended in a pre-warmed blender at a low speed for 10 seconds The rumen fluid was then filtered through
29
four layers of cheese cloth into pre-warmed beakers while flushing with carbon dioxide (CO2) The
temperature of the rumen fluid averaged 38ordmC and the pH averaged 58
327 In vitro incubation
The glass vials were flushed with CO2 while adding 40 ml of the medium and 2 ml of the reducing solution to
each vial A magnetic stirrer (02 ml) was also placed into each vial The vials were then lightly closed with
rubber stoppers and placed in the incubator at 39ordmC until the medium was reduced (ie clear) Vials were re-
opened and 10 ml of rumen fluid was added while flushing with CO2 The vials were then closed tightly with
rubber stoppers crimp sealed and connected via needles to a pressure logging system The vials were
placed on magnetic stirrer plates in an incubator at 39ordmC and were constantly stirred at a low speed The
material was incubated for 72 hours and gas pressure was recorded automatically every five minutes using a
pressure transducer system that was custom designed and built by Eagle Technology (Pty) Ltd (Cape Town)
based on the Reading Pressure Technique (RPT) (Mauricio et al 1999) Gas pressure was released on
regular intervals to prevent pressure build-up in the vials
328 Converting gas pressure to gas volume
Gas pressure data were converted to gas volume using the following linear regression equation developed
by Goosen (2004) for Department of Animal Sciencesrsquo in vitro lab
OMCXY )])09770((1000[=
Where Y = Gas volume (mlg OM)
X = Gas pressure (psi)
C = Vial head space (ml)
OM = Organic Matter (mg)
329 Estimating kinetic coefficients
Kinetic coefficients for gas production were derived from the gas volume data using the solver option in Excel
and the non-linear models 1 and 2 (with and without a lag phase respectively) The models are based on the
modified version described by Oslashrskov and McDonald (1979)
30
Model 1 ⎟⎠⎞
⎜⎝⎛ minusminus= ctebY 1
Model 2 ( )⎟⎠⎞
⎜⎝⎛ minusminusminus= LtcebY 1
Where Y = gas volume at time t
b = total gas production
c = rate of gas production
t = incubation time
L = lag time
33 Statistical analysis
The first derivatives b and c (Model 1) and b c and L (Model 2) were subjected to statistical analysis The
experiment was a two way cross classification and data was subjected to a factorial ANOVA with the factors
forage and energy using Statistica 81 (2008) This was done for all the non-linear parameters Main effects
were interpreted in the cases where no interaction was observed Significant forage x energy source
interactions were observed for the non-linear parameter b in Model 1 and for b and L in Model 2 Therefore
a one-way ANOVA was done on each of the forages to determine the effect of energy sources Differences
between means were determined with a Tukey test and significance was declared at P lt 005
34 Results and discussion
341 Gas production including that from the energy sources
Results of total gas (b) and rate (c) of gas production are presented in Table 36 Pasture grasses had
higher gas volumes than mature forages before substitution with energy sources Gas volume is generally a
good indicator of digestibility fermentability and microbial protein production (Sommart et al 2000)
Substitution with energy sources tended to raise gas production (Table 36) When maize meal replaced
50 of the forage substrate total 72 hour gas production was increased in the case of lucerne and wheat
straw irrespective of the model used In wheat straw total gas production was also increased with citrus
pulp supplementation (Models 1 amp 2) and with molasses (Model 2) For the other forages (oat hay ryegrass
and kikuyu) energy supplements did not have an effect on total gas production values The total (72 hour)
gas production values represent the sum of forage and energy source fermentations except for the control
31
treatment where the substrates were forages only The higher gas production values observed with energy
supplementation (especially for wheat straw) was due to the energy sources being more readily fermentable
and easily available to rumen micro-organisms Energy sources are also low in NDF and ADL (Table 33)
which would increase gas production as there exists a negative correlation between gas production and
plant cell wall content (Sallam 2005)
The rate of gas production (c) of forage substrates alone ranged between 003 and 009 mlh with lucerne
and ryegrass having the highest rates When the respective energy sources replaced 50 of the forage
substrates there were variable positive responses in terms of c of different forage substrates In general
energy sources tended to raise the rate of gas production probably due to the higher nutrient content and
easier accessibility of chemical constitutes to rumen microbial enzymes as compared to the forage
substrates alone (Arigbede et al 2006) In lucerne hay molasses increased c compared to the control
treatment (Model 1 amp 2) Maize meal had no effect on c when compared to the control treatment The latter
agrees with Mertens amp Loften (1980) where starch increased the lag time but had no effect on digestion rate
of lucerne This would suggest that the addition of energy sources to forage substrates do not decrease
fibre digestibility by lowering the rate of fermentation In oat hay citrus pulp had the biggest effect on c (both
models) while with Model 1 molasses also increased c Maize meal (both models) tended to increase c but
not significantly compared to the control treatment The most noticeable effect of forage substitution with
energy sources was observed for wheat straw In this case all the energy sources increased the rate of gas
production irrespective of the model used While the other forages have moderate fermentation potentials
(as can be seen from the b and c values) the fermentability of wheat straw is low resulting in a higher
response when energy was supplemented In ryegrass maize meal had no effect on c (Model 1 amp 2) while
citrus pulp (Model 1) and molasses (both models) improved c compared to the control treatment Citrus pulp
increased gas production rate in kikuyu (P lt 005) when Model 1 was used while maize meal and molasses
only tended to increase c Supplementation with citrus pulp tended to improve gas production rates of
forages more than maize meal Citrus pulp is high in degradable NDF resulting in less negative effects on
cellulolytic bacteria and the ruminal environment than starch supplementations (Bampidis amp Robinson
2006) Unlike sugars and starches pectin substances do not lower the rumen pH (Mohney 2002) Pectin
supplementation would thus sustain an optimal ruminal environment for cellulolytic bacteria functions
explaining the better gas production rates resulting from forages supplemented with citrus pulp Leiva et al
(2000) also reported that citrus pulp ferment at a faster rate than corn hominy Energy source had no
significant effect on gas production rate of kikuyu in Model 2 It thus seems that energy sources per se
tended to improve forage gas production rate Energy sources are high in nutrients that are easily available
and rapidly fermentable by rumen micro-organisms Hiltner amp Dehority (1983) found that forage digestion
improved with energy sources supplementation due to an increase in the number of rumen micro-organisms
available to help with fermentation
When the respective energy sources replaced 50 of the forage substrates a significant forage x energy
source interaction was observed for the lag phase Different lag times of forage substrates (control
treatments) may be the result of differences in plant tissue composition between forages that require different
degrees of physical or chemical changes before rumen micro-organisms can start with fibre digestion
(Mertens amp Loften 1980) Lucerne fermented alone had almost no lag phase but supplementation of maize
32
meal tended (P = 0069) to increase the lag phase Adesogan et al (2005) found that maize and citrus pulp
incubated individually had longer lag phases when compared to hays (P lt 0001) agreeing with results
obtained in this study that the energy sources tended to lengthen the lag phase of lucerne hay The longer
lag phase for the maize and citrus pulp treatments might be associated with a high proportion of cellulolytic
micro-organisms in the rumen fluid The diet of the cannulated cows consisted predominantly of oat hay
lucerne hay and wheat straw and might have resulted in insufficient numbers of pectin-fermenting and
amylolytic bacteria in the collected rumen fluid to instantly colonize the citrus pulp and maize respectively
(Adesogan et al 2005) The results also agree with the work of Mertens amp Loften (1980) where starch
increased the lag time but had no effect on digestion rate of lucerne Possible reasons include a delay in
fermentation due to microbial colonization (Chesson amp Forsberg 1988) In contrast Haddad amp Grant (2000)
found that a reduction in NFC content substituted to lucerne based diets in vitro increased the lag time of
lucerne
Table 36 Effects of maize meal citrus pulp and molasses as energy sources on fermentation kinetics of
different forage substrates as measured by in vitro gas production Gas production of both energy sources
and forage substrates are included
Treatment
Item Maize meal Citrus pulp Molasses Control
SEm
P
Lucerne hay
Model 1
b 3981 b 3500 ab 3342 ab 2701 a 2498 0025
c 009 a 011 ab 014 b 009 a 001 0005
Model 2
b 3965 b 3490 ab 3340 ab 2700 a 2513 0028
c 010 a 011 ab 015 b 009 a 001 0013
L 045 033 009 005 011 0069
Oat hay
Model 1
b 3982 3654 3150 2966 372 0250
c 008 ab 011 b 008 b 004 a 001 0002
Model 2
b 3971 3654 3150 2951 3745 0253
c 008 ab 011 b 008 ab 005 a 001 0004
L 032 0 0 036 013 0125
33
Table 36 (continue) Effects of maize meal citrus pulp and molasses as energy sources on fermentation kinetics of different forage substrates as measured by in vitro gas production Gas production of both energy sources and forage substrates are included
Wheat straw
Model 1
b 3706 b 3591 b 3062 ab 2460 a 1876 0002
c 008 b 010 b 009 b 003 a 001 0001
Model 2
b 3696 b 3591 b 3062 b 2289 a 1796 0001
c 008 b 010 b 009 b 003 a 001 0001
L 032 b 000 b 000 b 225 a 040 0004
Ryegrass
Model 1
b 4492 4113 3777 3727 3454 0406
c 008 a 012 b 012 b 008 a 001 0001
Model 2
b 4471 4106 3776 3711 3475 0422
c 008 a 012 cb 012 b 009 ac 001 0006
L 051 024 003 054 018 0213
Kikuyu grass
Model 1
b 4236 4269 3902 3230 2634 0055
c 009 ab 011 b 010 ab 005 a 001 0025
Model 2
b 4224 4266 3902 3776 2403 0425
c 010 011 010 006 001 0059
L 026 ab 011 b 000 b 163 a 035 0022
b = Total gas production (mlg OM) c = gas production rate (mlh) L = Lag time (h)
Model 1 Y = b + (1 ndash e-ct) Model 2 Y = b + (1 ndash e-c(t-L)) Superscripts are comparing across rows
The lag phase for oat hay was about 22 minutes and was not significantly affected by energy source The
greatest effect of forage substitution with energy sources was observed for wheat straw where all the energy
sources shortened the lag phase compared to the control treatment where wheat straw had a lag phase of
more than 2 hours In ryegrass treatment had no significant effect on lag phase but molasses tended to
decrease the lag phase In kikuyu the lag phase was significantly shortened when supplemented with citrus
pulp and molasses (P lt 005) while maize meal only tended to shorten the lag Hiltner amp Dehority (1983)
also found a decrease in lag times of fibre digestion when soluble carbohydrates were added to in vitro
incubations They concluded that the decrease in lag phase was due to an increase in bacteria numbers
helping with digestion as they found similar results when they increased the inoculum
The parameters presented in Table 36 (Model 2) were used to construct Figures 31 - 36 The data
presented in the figures represent total gas production including that of the energy sources
34
0
50
100
150
200
250
300
350
400
450
0 10 20 30 40 50 60 70 80
Gas
Pro
duct
ion
(mlg
OM
)
Time (hours)
Lucerne hay
Oat hay
Wheat straw
Ryegrass
Kikuyu grass
Figure 31 Gas production of forage substrates alone
Figure 31 show differences in fermentation characteristics of the different forages Variations in NDF ADL
and CP contents of these forages (Table 33) as well as different arrangements of their cell-wall
polysaccharides (Cheng et al 1984) are most likely responsible for different fermentation characteristics
observed between forage substrates The fermentation patterns of the forages are functions of the forage
type as well as the physiological stage at which they were harvested both of which affect their chemical
composition The grasses (ryegrass and kikuyu) were immature (28 days of re-growth) Lucerne and oat
hay were harvested at the 10 flowering stage while wheat straw was a mature forage As forages mature
their NDF and ADL contents increase (McDonald et al 2002) Wheat straw had the highest NDF and ADL
contents (Table 33) Although lucerne hay had a relatively low NDF content its ADL content was quite high
compared to kikuyu which had a fairly high NDF content but a low ADL content resulting in the early cut
grasses to manifest a much higher fermentability profile than the other forages Figure 31 clearly indicates
that wheat straw has a much lower fermentability both in terms of total gas production and rate of gas
production than the other forages Wheat straw also has a much longer lag phase compared to other
forages The lower fermentability and longer lag phase of wheat straw which is a mature forage can be
explained by the tissue content of wheat straw that is high in NDF and ADL (which is negatively correlated
with gas production) subsequently requiring more physical and chemical alterations before bacteria in the
rumen can start digestion The high rate and extent of gas production from both ryegrass and kikuyu can
also be observed (Figure 31) Apart from readily fermentable fibre these pasture grasses are also high in
nitrogen (Table 33) and total carbohydrates which are both needed for optimal growth of rumen micro-
organisms and thus fermentation (NRC 2001)
35
The effect of energy sources on the fermentation profiles of the different forages can be observed in Figures
32 - 36
0
50
100
150
200
250
300
350
400
450
0 10 20 30 40 50 60 70 80
Gas
Pro
duct
ion
(mlg
OM
)
Tme (hours)
Maize mealCitrus pulpMolassesControl
Figure 32 Gas production of lucerne hay when supplemented with different energy sources
Substituting 50 of the forages with an energy source improved gas production (Figures 32 - 36) probably
by boosting microbial growth Maize meal and citrus pulp had the biggest effect throughout Molasses is a
fast fermenting simple sugar (Hall 2002) which is rapidly utilized explaining the fast increase in gas
production followed by a plateau soon afterwards Maize meal and citrus pulp other than molasses are
more complex energy sources which ferment slower and are available over a longer period of time As
mentioned before wheat straw was a mature forage compared to ryegrass and kikuyu which were harvested
after only 28 days of re-growth while lucerne and oat hay were harvested at 10 flowering stage
Ryegrass lucerne and kikuyu are high in nitrogen (Table 33) Sufficient nitrogen ensures nitrogen-energy
coupling to occur at a greater extent thereby ensuring more efficient microbial fermentation and cellulose
degradation by rumen bacteria (NRC 2001) As forages mature the NDF and ADF contents increase and
CP (supplying nitrogen) decreases making less nitrogen readily available to rumen micro-organisms for
fermentation (Ghadaki et al 1975) This may explain why maize meal and citrus pulp had higher impacts
than molasses on gas production of the mature forages Citrus pulp and maize meal release energy at a
slower rate which match the slow release of nitrogen in mature forages Also even though small these
energy sources contributes rumen degradable protein (RDP) which with substrates like wheat straw (that
has very low CP content) could be quite substantial It should be kept in mind though that the gas
production profiles in these figures reflect the combination of forages and energy sources
36
0
50
100
150
200
250
300
350
400
450
0 10 20 30 40 50 60 70 80
Gas
Pro
duct
ion
(mlg
OM
)
Time (hours)
Maize mealCitrus pulpMolassesControl
Figure 33 Gas production of oat hay when supplemented with different energy sources
0
50
100
150
200
250
300
350
400
450
0 10 20 30 40 50 60 70 80
Gas
Pro
duct
ion
(mlg
OM
)
Time (hours)
Maize mealCitrus pulpMolassesControl
Figure 34 Gas production of wheat straw when supplemented with different energy sources
37
0
50
100
150
200
250
300
350
400
450
0 10 20 30 40 50 60 70 80
Gas
Pro
duct
ion
(mlg
OM
)
Time (hours)
Maize mealCitrus pulpMolassesControl
Figure 35 Gas production of ryegrass when supplemented with different energy sources
0
50
100
150
200
250
300
350
400
450
0 10 20 30 40 50 60 70 80
Gas
Pro
duct
ion
(mlg
OM
)
Time (hours)
Maize mealCitrus pulpMolassesControl
Figure 36 Gas production of kikuyu grass when supplemented with different energy sources
342 Gas production parameters including that of forage and energy sources in cases where no interaction was observed
In the cases where in vitro gas production parameters showed no interactions the main effects are
discussed Gas production values of the different forages (Models 1 amp 2) differed (P lt 005) from each other
38
independent of the energy source supplemented (Table 37) The NDF ADL and CP content of the forages
differed (Table 33) The differences in chemical and physical tissue structure probably influenced their
fermentation kinetic patterns (Figure 31) In Model 1 ryegrass resulted in higher gas productions than oat
hay wheat straw and lucerne but did not differ from kikuyu In Model 2 the same trend was seen for gas
production with kikuyu and ryegrass having higher values than lucerne oat hay and wheat straw The
reason for the higher gas production from ryegrass compared to lucerne wheat straw and oat hay are due to
the lower NDF and ADF contents of ryegrass resulting in higher gas production (Sallam 2005) Ryegrass
and kikuyu as mentioned before were harvested young compared to the other forages These pasture
grasses therefore had more rapidly fermentable sugar resulting in higher gas production values Ryegrass
and kikuyu are also high in CP (Table 33) which is essential for optimal rumen fermentation as it supplies
the rumen micro-organisms with nitrogen that is important for their growth Gas production rates differed for
among forages (P lt 005) irrespective of the energy source Ryegrass and lucerne had higher c values than
oat hay and wheat straw
Table 37 In vitro gas production parameters of forages as affected by energy sources as main effects in
cases where no interactions were observed Gas production of both energy sources and forage substrates
are included
Forage Item Lucerne
hay Oat hay Wheat
straw Ryegrass Kikuyu grass SEm P
Model 1
b 3381 ac 3438 ac 3205 a 4027 b 3909 bc 1457 lt0001
Model 2
b 3374 a 3431 a 3159 a 4016 b 4042 b 1439 lt0001
c 011 b 008 a 008 a 010 bc 009 ac 001 lt0001
b = Total gas production (mlg OM) c = gas production rate (mlh)
Model 1 Y = b + (1 ndash e-ct) Model 2 Y = b + (1 ndash e-c(t-L)) Superscripts are compared across rows
The total gas production values of forage substrates (Models 1 amp 2) differed (P lt 005) for each energy
source supplemented (Table 38) Maize meal and citrus pulp supplementations resulted in higher forage
gas production values than the control treatment (Model 1 amp 2) Maize meal tended to have higher gas
production than citrus pulp supporting the theory of Sallam (2005) that feedstuffs higher in NDF and ADF
content result in lower gas production Gas production rate (c) of the forages were all higher for the energy
source treatments than that of the control treatment (P lt 005) indicating the faster fermentation potential of
the energy sources The highest gas production rates were achieved when forages were supplemented with
citrus pulp and molasses irrespective of the forage substrate used Pectin substances other than starches
and sugars produce no lactic acid (Van Soest 1994) Pectin subsequently does not tend to lower the
rumen pH as much as sugars and starches thus sustaining optimal ruminal environments for cellulolytic
bacteria This could partly explain the better gas production rates of forages supplemented with citrus pulp
39
Table 38 In vitro gas production parameters of forages (irrespective of forage substrate used) as affected by
different energy sources as main effects in cases where no interactions were observed Gas production of
both energy sources and forage substrates are included
Energy source Item Maize meal Citrus pulp Molasses Control SEm P
Model 1
b 4079 b 3825 bc 3446 ac 3017 a 1303 lt0001
Model 2
b 4065 b 3821 bc 3446 ac 3085 a 1287 lt0001
c 009 b 011 c 011 c 006 a 000 lt0001
b = Total gas production (mlg OM) c = gas production rate (mlh)
Model 1 Y = b + (1 ndash e-ct) Model 2 Y = b + (1 ndash e-c(t-L)) Superscripts are compared across rows
343 Gas production excluding that from energy sources
Gas production values from the respective energy sources alone were obtained from separate fermentations
where forage substrates were omitted These values were subtracted from total gas production values
where forages and energy sources were incubated together to calculate the effect of energy sources on gas
production of the respective forage sources per se (Table 39)
When the maize meal gas production was deducted from the total gas production there was no difference
between the control and the maize meal supplemented treatments in any of the forages (Models 1 amp 2)
When molasses gas production was deducted from the total gas production however total gas production
from forages in the molasses supplemented treatments was lower than that of the control treatments in all
forage substrates irrespective of the model used In oat hay molasses lowered gas production more than in
any of the other treatments including the control treatment In oat hay and ryegrass (both models) and in
lucerne hay (Model 2) citrus pulp as energy source also decreased forage gas production compared to the
control treatment The lower gas production after energy sources gas production was deducted illustrate that
energy sources were the main reason for the higher gas production presented earlier in treatments with
forage and energy source combinations as substrates Gas production is negatively correlated with NDF
and ADL content (Sallam 2005) Energy sources had lower NDF and trace amounts of lignin content when
compared to forage substrates (Table 33) supporting the theory of higher gas production observed after
energy inclusions in the simulated dairy cow diets Energy sources per se thus seemed to increase the rate
of forage digestion but maintained or decreased the digestibility of forages Possible reasons for the lower
digestibility as determined by gas production can be because micro-organisms first attack the easily
fermentable energy sources before starting with fibre digestion
40
Deducting energy source gas production resulted in variable positive responses in terms of rate of gas
production from forage substrates In oat hay maize meal and citrus pulp treatments both improved c
compared to the control treatment (Models 1 amp 2) In kikuyu grass maize meal had a profound effect and
increased c when compared to the control treatment For the other forages (lucerne wheat straw and
ryegrass) deduction of the energy sources had no effect on fermentation rate
Deducting energy source gas production values indicated that treatment with energy sources affected the lag
phase differently for the different forages Lucerne hay oat hay and ryegrass had short lag phases which
were not affected by energy source Citrus pulp and maize meal however tended to increase the lag phase
of lucerne hay Similar results were obtained by Adesogan et al (2005) who found that maize and citrus
pulp resulted in a longer lag phase than hays (P lt 0001) The diet of the cows consisted predominantly of
oat hay lucerne hay and wheat straw The diet of donor cows thus had high proportions of cellulolytic micro-
organisms and less pectin-fermenting and amylolytic bacteria needed to colonize citrus pulp and maize meal
respectively explaining the longer lag phase of maize meal and citrus pulp (Adesogan et al 2005) Kikuyu
and wheat straw had long lag phases compared to the other forages All the energy sources significantly
shortened the lag phase of wheat straw and kikuyu
Table 39 Effects of maize meal citrus pulp and molasses as energy sources on fermentation kinetics of
different forage substrates as measured by in vitro gas production Gas production resulting from energy
sources was deducted from total gas production
Treatment
Item Maize meal Citrus pulp Molasses Control SEm P
Lucerne hay
Model 1
b 2293 ab 1974 ab 1789 b 2837 a 2063 0018
c 009 010 015 009 002 0103
Model 2
b 2192 ab 1959 b 1789 b 2836 a 1836 0008
c 012 011 015 009 002 0189
L 023 076 006 005 023 0166
Oat hay
Model 1
b 2842 ab 2367 b 1761 c 3283 a 1315 0001
c 008 b 010 b 004 a 004 a 001 0001
Model 2
b 2842 ab 2367 b 1761 c 3273 a 1317 0001
c 008 b 010 b 004 a 004 a 001 0001
L 000 000 000 017 007 0240
41
Table 39(continue) Effects of maize meal citrus pulp and molasses as energy sources on fermentation kinetics of different forage substrates as measured by in vitro gas production Gas production resulting from energy sources was deducted from total gas production
Wheat straw
Model 1
b 2108 ab 1903 ab 1510 b 2499 a 1657 0009
c 008 007 006 002 002 0110
Model 2
b 2108 ab 1903 ab 1510 b 2312 a 1559 0020
c 008 007 006 003 002 0168
L 000 b 000 b 000 b 229 a 036 0001
Ryegrass
Model 1
b 2845 ab 2429 b 2093 b 3995 a 291 0003
c 008 010 011 008 001 0324
Model 2
b 2835 ab 2419 b 2092 b 3983 a 2934 0004
c 009 010 011 009 001 0459
L 040 062 005 039 029 0588
Kikuyu grass
Model 1
b 2500 ab 2611 ab 2193 b 3349 a 2369 0028
c 012 b 010 ab 008 ab 005 a 001 0017
Model 2
b 2499 ab 2610 ab 2193 b 3243 a 2408 0050
c 012 b 010 ab 008 ab 005 a 002 0040
L 007 b 012 b 000 b 173 a 034 0009
b = Total gas production (mlg OM) c = gas production rate (mlh) L = Lag time (h)
Model 1 Y = b + (1 ndash e-ct) Model 2 Y = b + (1 ndash e-c(t-L)) Superscripts are compared across rows
Hiltner amp Dehority (1983) similarly found that the addition of soluble carbohydrates to in vitro incubations
decreased the lag time of fibre digestion They concluded that supplementation increased bacteria numbers
thus decreasing the lag phase by supporting fibre digestion They found similar results with increased
amounts of inoculum A possible reason for the long lag phase of kikuyu grass may be because it was
heavily fertilized with nitrogen Marais et al (1988) showed that nitrite derived from high nitrate pastures
resulted in reduced in vitro digestibility as it affected rumen microbial function The long lag phase of wheat
straw was probably due to the high NDF content which is slowly digested and the high ADL content which is
not digested by rumen micro-organisms The latter could also have an effect on the structure of the fibre
matrix making it more difficult for rumen organisms to reach the more digestible fibre fractions The short
lag phases of lucerne and oat hay could partially be explained by the fact that the cannulated cows received
diets containing these substrates but also because their chemical composition allows higher digestibility
compared to wheat straw In general it would appear that the supplementation of forages with various
42
energy sources had a negative effect on total gas production but increased the rate of gas production in
some instances
Profiles of forage fermentation after deduction of energy source values are illustrated in Figures 37 ndash 312
0
50
100
150
200
250
300
350
400
450
0 10 20 30 40 50 60 70 80
Gas
Pro
duct
ion
(mlg
OM
)
Time (hours)
Lucerne hayOat hayWheat strawRyegrassKikuyu grass
Figure 37 Gas production of forage substrates after gas production of energy sources has been deducted
Variations in fermentation patterns of different forages are illustrated in Figure 37 All the forages differed in
terms of gas production lag phase and gas production rate This is probably due to differences in their cell-
wall polysaccharide arrangements (Cheng et al 1984) as well as NDF ADL and CP composition (Table
33) It is clear that wheat straw has a much lower fermentability both in terms of total gas production and
rate of gas production than the other forages As forages mature their NDF and ADL contents increase
(McDonald et al 2002) Wheat straw had the highest NDF and ADL contents (Table 33) The NDF and
ADF contents of diets are negatively correlated with gas production (Sallam 2005) which would explain the
lower gas production of wheat straw in comparison with the other forages Wheat straw is also very low in
CP (Table 33) Crude protein provides rumen micro-organisms with nitrogen needed for optimal growth and
fermentation Ryegrass and kikuyu show a high rate and extent of gas production maybe due to the lower
NDF and ADL and higher CP contents as compared to wheat straw Although lucerne hay had a relatively
low NDF content its ADL content was quite high compared to kikuyu which had a higher NDF content but a
low ADL content resulting in the early cut grasses to manifest a much higher fermentability profile than the
other forages
43
0
50
100
150
200
250
300
350
400
450
0 10 20 30 40 50 60 70 80
Gas
Pro
duct
ion
(mlg
OM
)
Time (hours)
Maize meal
Citrus pulp
Molasses
Control
Figure 38 The net effect of energy supplements on gas production of lucerne hay
0
50
100
150
200
250
300
350
400
450
0 10 20 30 40 50 60 70 80
Gas
Pro
duct
ion
(mlg
OM
)
Time (hours)
Maize mealCitrus pulpMolassesControl
Figure 39 The net effect of energy supplements on gas production of oat hay
44
0
50
100
150
200
250
300
350
400
450
0 10 20 30 40 50 60 70 80
Gas
Pro
duct
ion
(mlg
OM
)
Time (hours)
Maize meal
Citrus pulpMolassesControl
Figure 310 The net effect of energy supplements on gas production of wheat straw
0
50
100
150
200
250
300
350
400
450
0 10 20 30 40 50 60 70 80
Gas
Pro
duct
ion
(mlg
OM
)
Time (hours)
Maize mealCitrus pulpMolassesControl
Figure 311 The net effect of energy supplements on gas production of ryegrass
45
0
50
100
150
200
250
300
350
400
450
0 10 20 30 40 50 60 70 80
Gas
Pro
duct
ion
(mlg
OM
)
Time (hours)
Maize mealCitrus pulpMolassesControl
Figure 312 The net effect of energy supplements on gas production of kikuyu grass
In many of these figures the control clearly did not reach a plateau in the 72 hour incubation period This
enforces the findings that the energy sources increased the rate of gas production especially during the
earlier parts of the incubation
344 Gas production parameters excluding that of energy sources in cases where no interaction was observed
The in vitro gas parameters that showed no interactions were interpreted in terms of main effects Gas
production values from the energy sources were deducted from the total gas production to derive forage gas
production values (Table 310) It can be seen that the gas production values of the forage substrates
differed (P lt 005) from each other independent of the deducted energy source (Models 1 amp 2) Gas
production resulting from wheat straw differed from ryegrass oat hay and kikuyu but not from lucerne (both
models) The higher gas production of ryegrass and kikuyu compared to wheat straw results from the
higher NDF and ADF contents of wheat straw which negatively affected its gas production (Sallam 2005)
Rate of gas production (c) also differed (P lt 005) between forages independent of energy source (Model 2)
Oat hay and wheat straw had lower c-values than ryegrass and lucerne but did not differ from kikuyu The
lower gas production rate of wheat straw and oat hay can be due to the maturity of these forages These
forages contain less readily fermentable substrates and more NDF and ADL compared to immature ryegrass
and kikuyu cut at 28 days of re-growth
46
Table 310 In vitro gas production parameters of forages as affected by energy sources as main effects in
cases where no interactions were observed Gas production resulting from energy sources was deducted
from total gas production
Forage
Item Lucerne hay Oat hay Wheat
straw Ryegrass Kikuyu grass
SEm P
Model 1
b 2223 ab 2563 bc 2005 a 2840 c 2663 c 1068 lt0001
Model 2
b 2194 ab 2561 bc 1959 a 2832 c 2636 c 1047 lt0001
c 012 b 007 a 006 a 010 b 009 ab 001 lt0001
b = Total gas production (mlg OM) c = gas production rate (mlh)
Model 1 Y = b + (1 ndash e-ct) Model 2 Y = b + (1 ndash e-c(t-L)) Superscripts are compared across rows
The effect of energy source treatment on forage fermentation is presented in Table 311 Energy sources
differed in terms of total gas produced by forages as a group It appeared that deduction of gas production
resulting from energy supplementation lowered total gas production of forages when either of the two models
was used Molasses resulted in the lowest total gas production from forages With Model 2 all the energy
sources increased the rate of fermentation of forage substrates but no differences occurred between energy
sources The increase in fermentation rates might suggest that energy supplementation does not
necessarily result in lower fibre digestion as observed by Mertens amp Loften (1980) by reducing their
fermentation rates (Miller amp Muntifering 1985) The increase in rate of gas production of forages after
energy sources substitution may be due to their higher nutrient content and easier accessibility of the energy
sources chemical constitutes to rumen microbial enzymes (Arigbede et al 2006)
Table 311 In vitro gas production parameters of forages (irrespective of forage substrate used) as affected
by different energy sources as main effects in cases where no interactions were observed Gas production
resulting from energy sources was deducted from total gas production
Energy source
Item Maize meal Citrus pulp Molasses Control SEm P
Model 1
b 2518 b 2257 b 1869 c 3193 a 955 lt0001
Model 2
b 2495 b 2251 b 1869 c 3130 a 937 lt0001
c 010 b 010 b 009 b 006 a 001 lt0001
b = Total gas production (mlg OM) c = gas production rate (mlh)
Model 1 Y = b + (1 ndash e-ct) Model 2 Y = b + (1 ndash e-c(t-L)) Superscripts are compared across rows
47
35 Conclusion
Forage diets alone do not provide in the high energy requirements of lactating cows Lactating cows
produce large quantities of milk which can only be maintained if forage diets are supplemented with
concentrates Supplementation of dairy cow diets with optimal amounts of energy substrates provide the
high producing dairy cow with energy needed to improve fibre digestibility and utilization Energy improves
the total digestibility of a diet when forages are supplemented with energy sources but decreases the
utilization of the forage component per se Possible reasons for the latter could be the structure of the fibre
matrix making it more difficult for rumen organisms to reach the more digestible fractions in forages thereby
digesting first the easily fermentable energy sources before attacking the more complex fibre fractions It
should be noted however that overfeeding of energy supplements increase the risks of acidosis due to the
production of large amounts of lactic acid subsequently lowering milk production and income
Looking at the individual forage fermentation kinetics irrespective of the energy source used it is evident
that the pasture grasses had higher total gas production values than the straw and hays This is most likely
because the pasture grasses were cut after only 28 days of re-growth whereas the hays and straw were
more mature and of lower quality especially the straw The pasture grasses thus had more readily
fermentable nutrients and less NDF and ADL than the hays and straw leading to higher gas production
values The fermentation rate of the forages supplemented with energy sources differed amongst each
other with lucerne and ryegrass having the fastest fermentation rates irrespective of the energy source
supplemented Gas production of forages supplemented with citrus pulp and maize meal were higher
compared to molasses Molasses produced a greater volume of gas during the first few hours of incubation
but it was also quickly depleted due to its high content of readily fermentable sugars These sugars are
highly soluble and rumen micro-organisms have easy access to induce fermentation The gas production
rate of forages supplemented with energy sources was higher than the control treatments (forages alone)
with molasses and citrus pulp resulting in the highest rates It thus seemed that supplementation of energy
sources improved forage fermentability as well as the rate of forage fermentation This could have major
implications in practice as there is a need to find ways of improving fibre utilization in South Africa
The effect of the energy sources on the fermentation kinetics of different forages per se showed a decrease
in gas production and lag phase but a tendency to raise gas production rate Molasses decreased gas
production the most throughout all the forage substrates A possible reason may be that the rumen micro-
organisms first digest the fast fermentable simple sugar substrates before starting with substrates that are
digested at a slower rate The raise in gas production rate and decrease in lag time may be due to a higher
number of rumen micro-organisms available to ferment the feed when energy sources were added to the
forage substrates thus supporting digestion
Little research has been done on this and related topics to quantify the relationship between different
carbohydrate sources and rumen metabolism parameters leaving room for improvement and further studies
More research is also needed with regard to inclusion levels of different energy sources in lactating cow diets
and the potential outcomes regarding milk production and rumen health
48
36 References
Adesogan T Krueger NK amp Kim SC 2005 A novel wireless automated system for measuring
fermentation gas production kinetics of feeds and its application to feed characterization Anim Feed
Sci Technol 123 - 124(1) 211 - 223
Aldrich JM Muller LD amp Varga GA 1993 Nonstructural carbohydrates and protein effects on rumen
fermentation nutrient flow and performance of dairy cows J Dairy Sci 76 1091 - 1105
Allen M amp Oba M 2000 Getting more milk from forages Michigan Dairy Review 5(4) Michigan State
University
Available at
httpwwwadmanicomalliancedairyTechBulletinsNon20Structural20Carbohydrate20Nutrition
htm
(Accessed 5 August 2008)
ANKOM 2005 Method for determining acid detergent lignin in beakers ANKOM Technology 0805
AOAC 1990 Official Methods of Analysis (15th Ed) Association of Official Analytical Chemists Inc
Arlington Virginia USA
AOAC 1995 Official Methods of Analysis (15th Ed) Association of Official Analytical Chemists Inc
Washington DC USA
Arigbede OM Anele UY Olanite JA Adekunle IO Jolaosho OA amp Onifade OS 2006 Seasonal in
vitro gas production parameters of three multi - purpose tree species in Abeokuta Nigeria Livestock
Res Rural Dev 18(10) Article 142
Available at httpwwwcipavorgcolrrdlrrd1810arig18142htm
(Accessed 14 October 2008)
Bampidis VA amp Robinson PH 2006 Citrus by-products as ruminant feeds A review Anim Feed Sci
Technol 128 175 - 217
Cheng KJ Stewart CS Dinsdale D amp Costeron JW 1984 Electron bacteria involved in the digestion
of plant cell walls Anim Feed Sci Technol 10 93 - 120
Chesson A amp Forsberg C W 1988 Polysaccharide degradation by rumen micro-organisms In The
Rumen Microbial Ecosystem Ed Hobson PN Elsevier Science Publishers Ltd London UK pp 251
- 284
49
Ghadaki MB Van Soest PJ McDowell RE amp Malekpour B 1975 Chemical composition and in vitro
digestibility of some range forage species of Iran In Proceedings of the sem Bamako 2 - 3 March
Bamako Mali
Available at httpwwwfaoorgwairdocsilrix5543bx5543b0zhtm
(Accessed 17 October 2008)
Giraldo LA Tejido ML Ranilla MJ amp Carro MD 2008 Effect of exogenous fibrolytic enzymes on in
vitro rumen fermentation of substrates with different forageconcentrate ratios Anim Feed Sci
Technol 141 306 - 325
Goosen L 2004 Effect of an exogenous fibrolytic enzyme on forage digestibility parameters MSc (Agric)
thesis Stellenbosch University Stellenbosch South Africa pp 1 - 91
Haddad SG amp Grant RJ 2000 Influence of nonfiber carbohydrate concentration on forage fiber digestion
in vitro Anim Feed Sci Technol 86 107 - 115
Hall MB 2002 Working with sugars (and molasses) In Proceedings of the 13th Annual Florida Ruminant
Nutrition Symp Jaunary 11 - 12 Gainesville Florida USA pp 146 - 158
Hiltner P amp Dehority A 1983 Effect of soluble carbohydrates on digestion of cellulose by pure
cultures of rumen bacteria Appl Environ Microbiol 46 542
Larson CC 2003 The effect of nonfibre carbohydrate source and protein degradability on lactation
performance of holstein cows MSc (Agric) thesis University of Florida Gainesville Florida USA pp
1 - 108
Leiva E Hall MB amp Van Horn HH 2000 Performance of dairy cattle fed citrus pulp or corn products as
sources of neutral detergent-soluble carbohydrates J Dairy Sci 83 2866 - 2875
Marais JP Therion JJ Mackie RI Kistner A amp Dennison C 1988 Effect of nitrate and its reduction
products on the growth and activity of the rumen microbial population Brit J Nutr 59 301 - 313
Mauricio RM Mould FL Dhanoa MS Owen E Channa KS amp Theodorou MK 1999 A semi-
automated in vitro gas production technique for ruminants feedstuff evaluation Anim Feed Sci
Technol 79 321 - 330
McDonald P Edwards RA Greenhalgh JFD amp Morgan CA 2002 Evaluation of food Digestibility In
Animal Nutrition (6th Ed) Pearson Education Ltd Edinburgh Gate Harlow Essex UK pp 246 - 263
Mertens DR 1997 Creating a system for meeting the fibre requirements of dairy cows J Dairy Sci 80
1463 - 1481
50
Mertens DR amp Loften JR 1980 The effect of starch on forage fiber digestion kinetics in vitro J Dairy Sci
63 1437 - 1446
Miller BG amp Muntifering RB 1985 Effect of forageconcentrate on kinetics of forage fiber digestion in
vitro J Dairy Sci 68 40 - 44
Mohney K 2002 Synchronization of carbohydrate and protein metabolism by ruminal microbes in
continuous culture PhD thesis North Carolina State University Raleigh North Carolina USA pp 1 -
69
National Research Council (NRC) 2001 Nutrient requirements of dairy cattle (7th Rev Ed) National
Academy Press Washington DC USA pp 34 - 35
Sallam SMA 2005 Nutritive value assessment of the alternative feed resources by gas production and
rumen fermentation in vitro Res J Agric amp Biol Sci 1(2) 200 - 209
Schwarz FJ Haffner J amp Krichgessner M 1995 Supplementation of zero-grazed dairy cows with
molassed sugar beet pulp maize or cereal-rich concentrate Anim Feed Sci Technol 54 237 - 248
Solomon R Chase LE Ben-Ghedalia D amp Bauman DE 2000 The effect of nonstructural carbohydrate
and addition of full fat soybeans on the concentration of conjugated linoleic acid in milk fat of dairy
cows J Dairy Sci 83 1322 - 1329
Sommart K Parker DS Wanapat M amp Rowlinson P 2000 Fermentation characteristics and microbial
protein synthesis in an in vitro system using cassava rice straw and dried ruzi grass as substrates
Asian-Aust J Anim Sci 13 1084 - 1093
Statistica 81 2008 StatSoft Inc USA
Van Soest PJ 1994 Nutritional ecology of the ruminant (2nd Ed) Cornell University Press Ithaca New
York USA pp 251 - 252
Van Soest PJ amp Robertson JB 1985 Analysis of forages and fibrous feeds A laboratory manual for
animal science 613 Cornell University Ithaca New York USA
Van Soest PJ Robertson JB amp Lewis BA 1991 Methods for dietary fibre neutral detergent fibre and
nonstarch polysaccharides in relation to animal nutrition J Dairy Sci 74 3583 - 3587
Oslashrskov ER amp McDonald P 1979 The estimation of protein degradability in the rumen from incubation
measurements weighed according to rate of passage J Agric Sci 92 499 - 503
51
Chapter 4
THE EFFECT OF SUGAR STARCH AND PECTIN AS MICROBIAL
ENERGY SOURCES ON IN VITRO NEUTRAL DETERGENT FIBRE
AND DRY MATTER DEGRADABILITY OF FORAGES
Abstract
The study evaluated the effect of sugar (molasses and sucrose) starch (maize meal and maize starch) and
pectin (citrus pulp and citrus pectin) on neutral detergent fibre (NDF) and dry matter (DM) degradability of
forages Forage substrates used included wheat straw (WS) oat hay (OH) lucerne hay (LUC) ryegrass
(RYE) and kikuyu grass (KIK) Rumen fluid was collected from two lactating Holstein cows receiving a diet
consisting of oat hay lucerne wheat straw and a concentrate mix In vitro degradability was done with an
ANKOM Daisy II incubator and forage substrates were incubated with or without the respective energy
sources for 24 48 and 72 hours The substrates were incubated in 1076 ml buffered medium 54 ml of
reducing solution and 270 ml rumen fluid The residues were washed dried and analyzed for NDF In the
trial with the applied energy sources (molasses maize meal and citrus pulp) there was forage x energy
source interactions Supplementation with the applied energy sources all improved DMD of forages (24 amp 72
hours) when compared to the control treatment except for RYE supplemented with maize meal and citrus
pulp at 24 hours Molasses had the biggest effect on DMD in all forage substrates Supplementation with
maize meal had no effect on neutral detergent fibre degradability (NDFD) of any forage substrate except for
an improvement in NDFD of LUC at 72 hours Molasses improved NDFD of LUC at 24 hours but had no
effect on the other forage substrates Citrus pulp improved NDFD of OH (72 hours) as well as LUC and WS
(24 amp 72 hours) It is postulated that the NDF of the energy sources was more digestible than that of the
respective forages and that the improved NDFD values could be ascribed to the contribution of the energy
source NDFD Overall pasture grasses had a higher NDFD than the hays and straw and appear to be more
readily fermentable by rumen micro-organisms than the low quality hays and straw explaining the higher
NDFD In the trial involving the purified energy sources (sucrose maize starch and citrus pectin) forage x
energy source interactions were observed In general supplementation with these energy sources improved
DMD at 24 and 72 hours except for RYE and KIK (72 hours) Pasture grasses (RYE amp KIK) had a higher
NDFD than LUC OH and WS At 72 hours NDFD was 371 for LUC 425 for OH and 403 for WS
compared to 705 for KIK and 649 for RYE A possible explanation is that KIK and RYE samples came
from freshly cut material harvested after a 28d re-growth period In general sucrose (24 amp 72 hours) and
citrus pectin (72 hours) had no effect on NDFD of forage substrates Supplementing oat hay (24 hours) with
starch and citrus pectin and wheat straw (24 amp 72 hours) with starch however lowered NDFD (P lt 005)
when compared to the control treatment It is hypothesized that micro-organisms fermented the easily
fermentable energy sources first before attacking forage NDF The study suggested that forage NDFD
values are not fixed and may be altered by type of energy supplementation
52
41 Introduction
The production potential of ruminants is determined to a great extent by the availability and quality of
forages Lactating dairy cows depend significantly on forages to maintain optimal fermentation rumen
function and high production However the ability of rumen micro-organisms to degrade forages is restricted
by the chemical composition and physical quality of the forage (Mertens 1997) Forages alone also do not
provide all the energy requirements of a high producing dairy cow (Schwarz et al 1995) Supplementing
dairy cow diets with energy-rich feeds provide high yielding dairy cows with the energy needed to improve
efficiency of production and performance (Henning 2004) The most important source of energy and largest
nutrient component for rumen micro-organisms is carbohydrates (especially non-fibre carbohydrates or
NFC)
It is important to try and find ways to improve forage degradation Improvement of forage utilization and
degradation will aid in animal performance (Giraldo et al 2008) Forage based diets supplemented with NFC
(sugar starch or pectin) result in variation of performance measurements such as milk yield milk
composition dry matter intake (DMI) and feed efficiency (Larson 2003) Miron et al (2002) reported that
cows receiving total mixed rations (TMR) with a high percentage of citrus pulp had higher NDF and NSC
digestibilities compared to cows that received TMR with a high percentage of corn Leiva et al (2000)
reported that the rumen pH declined more rapidly on citrus diets (pectin) than on hominy (starch) diets and
also reached the lowest pH point faster Knowledge of the individual (as well as a combination of NFC)
fermentation characteristics can thus be helpful in predicting an animalrsquos performance due to NFC
supplementation (Holtshausen 2004)
The objectives of this study were to determine the impact of three applied energy sources viz maize meal
molasses syrup and citrus pulp and three purified energy sources viz maize starch sucrose and citrus
pectin on dry matter (DM) and neutral detergent fibre (NDF) digestibility of different forage substrates
Forages commonly used in dairy cow diets (wheat straw oat hay lucerne hay kikuyu grass and ryegrass)
were used
42 Materials and methods
421 Study area
The study to evaluate the effect of supplementing forage based diets with sugar starch and pectin on DM
and NDF degradability was conducted at the Stellenbosch University Stellenbosch South Africa
(33deg 55prime 12Prime S 18deg 51prime 36Prime E)
53
422 Simulated diets
4221 Basal forages
Five forages (Table 41) were used to prepare rations to simulate diets for lactating dairy cows
Table 41 Forages used in simulation diets for lactating dairy cows
Forage Type Acronym
Wheat straw (Triticum aestivum ) WS
Oat hay (Avena sativa) OH
Lucerne hay (Medicago sativa) LUC
Ryegrass (Lolium multiflorum ) RYE
Kikuyu grass (Pennisetum clandestinum) KIK
Rye and kikuyu grasses were harvested after four weeks of re-growth All the forages were oven dried at
60ordmC for 72 hours Wheat straw oat hay and lucerne hay were ground (cyclotec 1093 mill) through a 2 mm
screen Rye and kikuyu grasses were obtained from Outeniqua experimental farm (33deg 57prime 0Prime S
22deg 25prime 0Prime E) just outside George South Africa (33deg 58prime 0Prime S 22deg 27prime 0Prime E) The rye and kikuyu grasses were
already ground through a 1 mm screen when received
4222 Energy supplements
Three energy sources (Table 42) were selected as supplements to prepare rations that would simulate
lactating dairy cow diets
Table 42 Applied energy sources used in simulating the dairy cow diets
Energy type Source Acronym
Starch Yellow maize (Zea mays) meal Mm
Sugar Molasses syrup Mol
Pectin Citrus pulp Cp
These energy feedstuffs were sourced in the following forms molasses as a syrup by-product from the
processing of sugar cane (Officinarum saccharum) citrus pulp as a finely granulated residue by-product from
the peel pulp and seeds of oranges and grapefruit and yellow maize grain The citrus pulp and maize were
ground (cyclotec 1093 mill) through a 1 mm screen
Three purified energy sources (Table 43) were selected as supplements to prepare rations that would
simulate lactating cow diets
54
Table 43 Purified energy sources used in simulating the dairy cow diets
Energy type Source Acronym
Starch Maize starch Maiz
Sugar Sucrose Suc
Pectin Citrus pectin Pec
4223 Defining the diets
A total of 43 simulated diets were prepared
bull 5 diets contained forage substrates only (Table 41)
bull 3 diets contained applied energy sources only (Table 42)
bull 15 diets contained a mixture of forages and applied energy sources
bull 5 diets contained forage substrates only (Table 41)
bull 15 diets contained a mixture of forages and purified energy sources
The final substrate compositions are indicated in Tables 45 and 46
423 Chemical analyses of forages and energy sources
About 1 g of each forage type as well as 1 g of the energy sources were weighed and placed in a 100ordmC
conventional oven for 24 hours to determine DM content (AOAC 1995 Method 93015) Organic matter
(OM) was determined by weighing 1 g of each type of feedstuff used into crucibles and ashing the content at
500ordmC in a muffle furnace for 6 hours (AOAC 1995 Method 94205)
The NDF component was determined by measuring 05 g of each feedstuff into F57 ANKOM fibre analysis
bags The bags were heat sealed and NDF determined using the method of Van Soest et al (1991)
Sodium sulfite (Na2SO3) was added to the NDF solution during digestion and heat-stable amylase was
added during rinsing Ether extract was determined using the AOAC method (AOAC 1995 Method 92039) About 2 g of ground sample was weighed into a thimble The samples were then extracted with diethyl ether
(C4H10O)
Acid detergent lignin (ADL) was determined by measuring 05 g of each basal forage and 05 g of maize
meal and citrus pulp into separate F57 ANKOM fibre analysis bags The bags were heat sealed and acid
detergent fibre (ADF) was determined using the method of Van Soest et al (1991) The ADF residue was
then soaked in 72 sulphuric acid for three hours to dissolve the cellulose Acid detergent lignin was
determined using the ANKOM method (ANKOM 2005)
55
Total nitrogen content was determined with a Leco Nitrogen Gas Analyzer custom designed and built by
LECO Africa (Pty) Ltd (Kempton Park) About 01 g of sample was weighed into a small piece of aluminum
foil The samples were then ignited inside the Leco furnace at about 900degC using the Dumas procedure
(AOAC 1990 Method 96806) Crude protein (CP) was calculated by multiplying nitrogen content with 625
(AOAC 1995 Method 99003)
Table 44 Chemical composition (gkg DM plusmn SD) of forages and energy sources used in the trial All values
are on a DM basis
Sources DM OM NDF CP EE ADL
WS 9150plusmn05 9022plusmn16 8179plusmn71 723plusmn10 36plusmn05 1022plusmn30
OH 8504plusmn23 9403plusmn173 7819plusmn110 910plusmn12 97plusmn08 825plusmn03
LUC 8989plusmn20 9062plusmn18 5153plusmn10 2370plusmn46 81plusmn06 927plusmn67
RYE 938plusmn10 845plusmn05 4892plusmn30 2509plusmn27 431plusmn01 448plusmn181
KIK 1242plusmn104 1122plusmn01 6512plusmn20 2534plusmn41 283plusmn11 480plusmn17
mm 8559plusmn09 9844plusmn13 1743plusmn550 1071plusmn02 377plusmn04 70plusmn06
cp 8799plusmn09 9285plusmn07 2614plusmn140 786plusmn18 164plusmn04 253plusmn64
mol 6980plusmn19 8927plusmn06 ND ND ND ND
DM = dry matter OM = organic matter NDF = neutral detergent fibre CP = crude protein EE = ether
extract ADL = acid detergent lignin ND = not determined WS = wheat straw OH = oat hay LUC = lucerne
RYE = ryegrass KIK = kikuyu grass mm = maize meal cp = citrus pulp mol = molasses
Purified energy sources were 99 pure based on manufacturers analyses
424 Sample preparation
Small fibre analysis bags were used (F57 ANKOM Technology) The bags were pre-rinsed in acetone for
five minutes air dried and placed in a conventional oven at 100ordmC for three to four hours The diets were
constituted as shown in Tables 45 46 and 47 The total amount of substrate was based on a forage to
concentrate ratio of 5050 The substrate amount of the energy sources in Table 45 was calculated to
provide the same amount of metabolizable energy (ME) contained in 025 g DM of yellow maize meal For
calculation purposes the ME values were assumed to be 139 MJkg DM for maize 123 MJkg for molasses
and 122 MJkg for citrus pulp (NRC 2001)
56
Table 45 Substrate samples containing either forage or applied energy supplements
Forage type Energy source Forage (g DM) Energy (g DM)
Wheat straw - 0250 -
Oat hay - 0250 -
Lucerne hay - 0250 -
Ryegrass - 0250 -
Kikuyu grass - 0250 -
- Maize meal - 0250
- Citrus pulp - 0285
- Molasses - 0282
The amount of energy sources used in the composite substrates (Table 46) was calculated to provide the
same amount of ME contained in 0125 g DM of yellow maize meal (139 MJMEkg)
Table 46 Composite diets containing forage and applied energy sources
Forage type Energy source Forage (g DM) Energy (g DM)
Wheat straw Maize meal 01250 01250
Wheat straw Citrus pulp 01250 01425
Wheat straw Molasses 01250
01412
Oat hay Maize meal 01250 01250
Oat hay Citrus pulp 01250 01425
Oat hay Molasses 01250
01412
Lucerne hay Maize meal 01250 01250
Lucerne hay Citrus pulp 01250 01425
Lucerne hay Molasses 01250
01412
Ryegrass Maize meal 01250 01250
Ryegrass Citrus pulp 01250 01425
Ryegrass Molasses 01250
01412
Kikuyu grass Maize meal 01250 01250
Kikuyu grass Citrus pulp 01250 01425
Kikuyu grass Molasses 01250 01412
The amount of purified energy sources (Table 47) was based on suggestions by Holtshausen (2004) who
used starch pectin and sucrose at hexose equivalent amounts of 40 80 or 120 mg per 120 mg purified NDF
in in vitro incubations
57
Table 47 Diets containing forages alone or a mixture of forages and purified energy sources Amounts are
on an air dry basis
Forage type Energy source Forage (g) Energy (g)
Wheat straw - 0500 -
Oat hay - 0500 -
Lucerne hay - 0500 -
Ryegrass - 0500 -
Kikuyu grass - 0500
-
Wheat straw Maize starch 0500 0163
Wheat straw Citrus pectin 0500 0192
Wheat straw Sucrose 0500
0137
Oat hay Maize starch 0500 0152
Oat hay Citrus pectin 0500 0178
Oat hay Sucrose 0500
0127
Lucerne hay Maize starch 0500 0160
Lucerne hay Citrus pectin 0500 0189
Lucerne hay Sucrose 0500
0135
Ryegrass Maize starch 0500 0162
Ryegrass Citrus pectin 0500 0191
Ryegrass Sucrose 0500
0137
Kikuyu grass Maize starch 0500 0161
Kikuyu grass Citrus pectin 0500 0190
Kikuyu grass Sucrose 0500 0136
In the current study a hexose equivalent amount of 40 mg of each energy source per 120 mg of forage
substrate was used Since 500 mg (air dry) of each forage substrate was weighed out into the incubation
bags in the current study the hexose equivalent of the energy sources amounted to 167 mg DM
To calculate the actual amount of energy source DM the following conversion coefficients were used (based
on Holtshausen 2004)
bull 090 for maize starch
bull 114 for citrus pectin
bull 095 for sucrose
58
The DM content of the energy sources were taken into account when calculating the air dry amounts that
were finally weighed out into the bags (Table 47)
Blank bags were included to correct for residues from rumen fluid alone All bags were heat-sealed using an
impulse sealer after sample preparation
425 Preparation of in vitro medium and reducing solution
The incubation medium was prepared as described by Van Soest amp Robertson (1985) The medium
consisted of micro minerals macro-mineral solution buffer solution tryptose rezasurin and distilled water
The medium was kept in a water bath at 395ordmC The pH of the medium was about 78 Reducing solution
was prepared as described by Van Soest amp Robertson (1985) and consisted of cysteine hydrochloride
(C3H7NO2HCL) potassium hydroxide (KOH) pellets sodium sulfide nonahydrate (Na2S9H2O) and distilled
water
426 Collection and preparation of rumen fluid Rumen fluid was collected from two ruminally cannulated lactating dairy cows The cows were confined and
fed 25 kg (as is) of a diet (125 kg in the mornings and 125 kg in the evenings) consisting of oat hay lucerne
hay wheat straw and a concentrate mix Rumen fluid was squeezed through two layers of cheesecloth into
pre-warmed flasks and a small amount of coarse material was added The rumen fluid was then blended in
a pre-warmed blender at a low speed for 10 seconds The rumen fluid was then filtered through four layers
of cheesecloth into pre-warmed flasks while flushing with carbon dioxide (CO2) The temperature of the
rumen fluid averaged 38ordmC and the pH averaged 58
427 In vitro incubation
The in vitro procedure for the ANKOM Daisy incubations required four glass vessels (2 L) and is based on
the method described by Goering amp Van Soest (1970) The glass vessels were flushed with CO2 while
adding 1076 ml of incubation medium and 54 ml of reducing solution to each vessel The vessels were
closed and placed in the incubator at 395ordmC until the medium was clear The vessels were opened and
flushed with CO2 while adding 270 ml of rumen fluid and bags to the vessels Incubation periods were 24
and 72 hours At each time interval one vessel was removed and the residue bags washed with water air-
dried and then placed in a conventional oven at 100ordmC for 24 hours
59
428 Residue analysis
The NDF content of the residues in the bags was determined using an ANKOM fibre machine (ANKOM220
fibre analyzer) and was based on the method of Van Soest et al (1991) Sodium sulfite (20 g) was added to
19 L of NDF solution during digestion and heat-stable amylase (4 ml x 2 rinse) was added during rinsing
Before using the bags they were rinsed in acetone for three to five minutes and then air-dried before being
placed in a forced draft oven at 100ordmC for 24 hours After the NDF procedure the bags were dried weighed
and subsequently ashed in a muffle furnace at 500ordmC for 6 hours
429 Estimating dry matter degradability
The estimation of DM degradability of the substrates was based on DM disappearance and calculated in
Excel using the following equation (Van Soest et al 1991)
( )[ ] 1001002
113 timestimesminus
minus=W
CWWDMD Equation 5
Where DMD = Apparent DM degradability ()
W1 = Bag weight (mg)
W2 = Sample weight (mg DM)
W3 = Weight of dried bag and residue after incubation (mg DM)
C1 = Blank bag correction factor
4210 Estimating neutral detergent fibre degradability
The estimation of NDF degradability of the substrates was based on NDF disappearance and was
calculated in Excel using the following equation (Van Soest et al 1991)
( )[ ]100100
2
113 timestimesminus
minus=W
CWWNDF Equation 6
60
Where NDF = Apparent NDF degradability ()
W1 = Bag weight (mg)
W2 = Sample weight (mg NDF in DM)
W3 = Dried weight of bag with residue after incubation (mg NDF in DM)
C1 = Blank bag correction factor
43 Statistical analyses
The in vitro digestibility experiment was a three way cross classification and the data was subjected to a
factorial ANOVA with the three factors being forage energy and time using Statistica 81 (2008) This was
done for all the non-linear parameters Significant forage x energy interactions were observed for the non-
linear parameters Therefore a one-way ANOVA was done on each of the forages to determine the effect of
the energy sources Differences between means were determined using a Tukey test Significance was
declared at P lt 005
44 Results and discussion
441 Effect of maize meal citrus pulp and molasses on apparent in vitro dry matter degradability
Results of the in vitro dry matter degradability (DMD) trial are presented in Table 48 Unsupplemented
forage values clearly indicate that ryegrass and kikuyu are more digestible than lucerne hay oat hay and
wheat straw This can be attributed to the fact that pasture grasses were cut after only 28 days of re-growth
thus having more digestible nutrients compared to lucerne and oat hay which were harvested at the 10
flowering stage and wheat straw at maturity With maturity the NDF and ADL contents increase (Table 44)
and DMD decreases (Canbolat et al 2006) When forage substrates were supplemented with applied
energy sources a forage x energy source interaction was observed When maize meal citrus pulp and
molasses replaced 50 of the forage substrates DMD was increased (P lt 001) in all forage substrates
(after 24 and 72 hours of incubation) with molasses having the biggest effect throughout It should be kept
in mind that the energy sources as such were all more degradable than the forages and therefore it could be
expected that a 50 replacement of forages with energy sources would increase total substrate DMD The
increase in DMD of forage substrates could thus be due to increased stimulation of rumen micro-organisms
in response to the readily available energy supplied by energy sources
61
Table 48 Effects of maize meal citrus pulp and molasses as energy sources on in vitro dry matter
degradability (DMD) parameters of different forage substrates
Treatment
Item Maize meal Citrus pulp Molasses Control
SEm
P
Lucerne hay
DMD 24h 707 b 731 b 832 c 565 a 159 lt0001
DMD 72h 829 b 825 b 858 c 690 a 044 lt0001
Oat hay
DMD 24h 637 b 676 bc 739 c 442 a 153 lt0001
DMD 72h 773 b 788 bc 820 c 588 a 080 lt0001
Wheat straw
DMD 24h 602 b 627 b 710 c 383 a 092 lt0001
DMD 72h 721 b 744 bc 778 c 510 a 089 lt0001
Ryegrass
DMD 24h 796 a 835 ab 901 b 760 a 212 0003
DMD 72h 926 b 934 b 964 b 877 a 095 lt0001
Kikuyu grass
DMD 24h 802 b 806 b 886 c 695 a 188 lt0001
DMD 72h 915 b 923 b 953 b 867 a 098 lt0001
Superscripts are compared across rows
The biggest effect of energy supplementation occurred with wheat straw as also reported in the gas
production experiments (Chapter 3) Wheat straw was high in NDF and ADL (Table 44) Neutral detergent
fibre is slowly degraded by rumen micro-organisms whereas ADL are not degraded by rumen micro-
organisms explaining the lower DMD of wheat straw when compared to the other forages Supplementing
readily available energy sources would therefore have a greater impact on DMD of wheat straw compared to
other forages Molasses had the highest impact on wheat straw DMD during the early phases of incubation
(24 hours) but after 72 hours the effect of molasses and citrus pulp was similar
In lucerne hay molasses had the highest impact on DMD at 24 and 72 hours incubation but citrus pulp and
maize meal also improved DMD significantly In oat hay maize meal citrus pulp and molasses improved
DMD at 24 and 72 hours incubation with molasses also having the most noticeable effect (P lt 001) Fall et
al (1998) also found improvements in DMD of straws supplemented with molasses In contrast to results
obtained in this study Williams et al (1953) found that addition of starch to oat hay diets of sheep decreased
DMD by one to two percentage units Burroughs et al (1949) observed a 5 ndash 12 reduction in lucerne hay
DMD when the diet was supplemented with 60 starch Mould amp Orskov (1983) however concluded that
62
the decrease in DMD of hays are mainly due to reduced rumen pH and not directly related to starch
digestion Abrupt changes in cattle diets (forage to concentrate diets) decrease rumen pH resulting in an
overgrowth of starch fermenting bacteria which causes acute acidosis with devastating effects on production
(Owens et al 1998) Cellulolytic bacteria are also inhibited at low rumen pH values decreasing fibre
digestion (Russel amp Wilson 1996)
In ryegrass molasses was the only energy source that improved DMD after 24 hours incubation Simeone
et al (2004) found similar results and reported that neither ground nor whole maize meal had an effect on
ryegrass DMD Ryegrass and kikuyu are highly fermentable forages as was also observed in terms of total
gas production and rate of gas production (Chapter 3) Molasses which is also rapidly fermentable had the
largest influence on DMD of pasture grasses at 24 hours probably because of its high fermentation rates
(Chapter 3) and because it is free of NDF and does not have trace amounts of lignin (Table 44) Overall
however all the energy sources improved DMD of ryegrass and kikuyu to the same extent at 72 hours
442 Effect of maize meal citrus pulp and molasses on apparent in vitro neutral detergent fibre degradability
The effects of sugar (molasses) starch (maize meal) and pectin (citrus pulp) on in vitro apparent NDF
degradability (NDFD) of different forages and forage-energy source combinations are shown in Table 49
Unsupplemented pasture grasses harvested at 28 days of re-growth had a higher NDFD than the mature
forages The NDFD of mature forages ranged between 197 and 284 which is too low to sustain
production and hence the need for energy supplementation Ryegrass and kikuyu was lower in NDF and
ADL (Table 44) and had greater gas production volumes (above 320 mlg OM Chapter 3) compared to the
other forages (ranging between 229 and 297 mlg OM) A negative correlation between ADL content and
NDFD of forage substrates have been reported by Smith et al (1972) and Tomlin et al (1964)
When forage substrates were supplemented with applied energy sources a forage x energy source
interaction was observed When energy sources replaced 50 of the forage substrates 24 hours NDFD of
lucerne hay was significantly increased by citrus pulp and molasses Hall (2002a) however postulated that
molasses decreases fibre digestion when fed in large quantities After 72 hours both maize meal and citrus
pulp resulted in increased NDFD Contrary to this observation Mertens amp Loften (1980) reported that starch
decreased the potential extent of fibre digestion These results (Mertens amp Loften 1980) however confirm
our findings obtained in the gas production experiments (Chapter 3) namely that maize meal tended to
increase the lag time of lucerne hay The lack of response of molasses at 72 hours could be due to its rapid
fermentation rate (Chapter 3) and also to the fact that molasses does not have any NDF (Table 44) that
could contribute to NDFD Maize meal and especially citrus pulp however contain some NDF that is readily
digestible
63
Table 49 Effects of maize meal citrus pulp and molasses as energy sources on in vitro neutral detergent
fibre degradability (NDFD) parameters when incubated in combination with different forage substrates
Treatment
Item Maize meal Citrus pulp Molasses Control
SEm
P
Lucerne hay
NDFD 24h 230 ab 296 b 300 b 197 a 219 0014
NDFD 72h 503 b 541 b 414 a 403 a 126 lt0001
Oat hay
NDFD 24h 300 356 289 284 222 0138
NDFD 72h 522 ab 579 b 509 a 472 a 139 lt0001
Wheat straw
NDFD 24h 196 a 285 b 249 ab 247 ab 171 0024
NDFD 72h 437 a 509 b 421 a 403 a 163 0003
Ryegrass
NDFD 24h 522 599 571 501 249 0059
NDFD 72h 775 822 843 748 242 0063
Kikuyu grass
NDFD 24h 516 561 624 530 424 0326
NDFD 72h 794 826 837 795 205 0368
Superscripts are compared across rows
Apparent NDFD of oat hay was not affected by energy source after 24 hours incubation but with citrus pulp
longer incubations (72 hours) resulted in higher NDFD (P lt 001) probably due to a relative high digestibility
of citrus pulp NDF Miron et al (2002) obtained similar positive results on NDFD of forages when maize or
barley was replaced with citrus pulp Voelker amp Allen (2003) proposed that the optimal rate and extent of
NDFD of high concentrate diets can be achieved by using dried beet pulp instead of high moisture corn
Heldt et al (1999) found that supplementing low-quality tallgrass-prairie hay with degradable intake protein
and NFC increased the total tract NDFD but supplementation with NFC alone decreased NDFD
Citrus pulp was the only energy source that consistently improved apparent NDFD when incubated in
combination with the hays and straw Citrus pulp had significant positive effects on NDFD of these forages
probably because mature forages are slowly degradable and citrus pulp supplementation thus provided high
amounts of digestable fibre at both 24 hours and 72 hours incubations The degradation rate of citrus pulp
possibly synchronizes the release of nutrients with the requirements of fibrolytic bacteria Increased NDFD is
important as it increases the supply of energy and support microbial N production (Allen amp Oba 2000)
64
resulting in higher milk production and reduced rumen fill in lactating dairy cows (Dado amp Allen 1995)
Bampidis amp Robinson (2006) stated that citrus pulp might be a good supplement to dairy cow diets as it
improves NDFD and has less negative effects on rumen pH and cellulolytic activities compared to sugar and
starch
Energy sources had no effect on apparent NDFD of kikuyu and ryegrass possibly because these pasture
grasses was immature and thus high in soluble readily available energy In the gas production experiments
(Chapter 3) these pasture grasses also had higher gas production volumes than the mature forages It
would thus appear given the high nutrient content in these forages that energy supplementation would have
minimal effects on NDFD
None of the energy source and forage combinations had lower NDFD values than the forages alone
contrary to Sanson et al (1990) who reported that the supplementation of low-quality forages with rapidly
degradable NFC depressed NDFD Grant amp Mertens (1992) suggested that acidification of the rumen due
to fast ruminal NFC fermentation is a prime factor responsible for depression in fibre digestion
443 Effect of maize starch citrus pectin and sucrose on apparent in vitro dry matter degradability
The effect of purified energy sources viz sugar (sucrose) starch (maize starch) and pectin (citrus pectin) on
in vitro apparent DMD of different forages are shown in Table 410 When forage substrates were
supplemented with purified energy sources a forage x energy source interaction was observed In lucerne
hay only pectin resulted in an improved DMD (both at 24 hours and 72 hours) while in oat hay all the
energy sources improved DMD at both incubation times Carey et al (1993) reported similar improvements
in DMD of brome hay (in situ) when it was supplemented with maize and beet pulp In contrast Burroughs et
al (1949) reported that DMD of lucerne was reduced when forages were supplemented with 20 and 40
starch In wheat straw all the energy sources improved DMD but at 24 hours pectin and sucrose had a
bigger effect than starch Pectin and sucrose are more fermentable than starch hence the more visible
effect on DMD of slow degradable wheat straw forages At 72 hours pectin also improved DMD more than
starch
Ryegrass and kikuyu had high DMD values without supplementation The higher DMD of pasture grasses
was most likely because they were immature at harvesting whereas lucerne and oat hay were cut at the
10 flowering stage and wheat straw was harvested at maturity Immature pasture grasses were thus
higher in fast fermentable sugars and lower in NDF and ADL (Table 44) improving DMD and gas production
volumes (Chapter 3) Only sucrose was sufficient in improving DMD in these grasses and then only at 24
hours due to their very high fermentability The absence of a sucrose effect at 72 hours was probably
because sucrose was depleted before 72 hours as it is rapidly fermented in the early hours of incubation
Purified energy sources are all more degradable than forages and therefore it could be expected that
inclusion of these energy sources in forage diets will increase DMD In general purified energy sources
resulted in lower DMD when compared to the applied energy sources (Table 48) We can postulate that
65
there was a rapid decline in rumen pH with purified energy source supplementation (as these energy sources
has no NDF) resulting in higher lactic acid production and slower microbial growth hence the lower DMD
Table 410 Effects of maize starch citrus pectin and sucrose as energy sources on in vitro dry matter
degradability (DMD) parameters of different forage substrates
Treatment
Item Maize starch Citrus pectin Sucrose Control
SEm
P
Lucerne hay
DMD 24h 642 ab 687 b 660 ab 593 a 182 0021
DMD 72h 745 ab 773 b 746 ab 673 a 203 0025
Oat hay
DMD 24h 476 b 512 b 504 b 377 a 096 lt0001
DMD 72h 638 b 658 b 644 b 552 a 116 lt0001
Wheat straw
DMD 24h 449 b 508 c 520 c 348 a 080 lt0001
DMD 72h 591 b 643 c 617 bc 510 a 094 lt0001
Ryegrass
DMD 24h 769 ab 768 ab 771 b 708 a 147 0026
DMD 72h 884 862 875 847 185 0548
Kikuyu grass
DMD 24h 681 ab 684 ab 709 b 634 a 150 0027
DMD 72h 859 826 843 808 213 0408
Superscripts are compared across rows
444 Effect of maize starch citrus pectin and sucrose on apparent in vitro neutral detergent fibre degradability
Purified energy source supplementation on in vitro apparent NDFD of the different forage substrates are
illustrated in Table 411 As was the case with DMD an energy source x forage interaction was observed for
NDFD Purified energy sources have negligible amounts of NDF thus the NDFD was solely from forages
In the control diets it is evident that the immature pasture grasses had the highest NDFD probably as they
are low in NDF and ADL (Table 44)
With lucerne hay energy supplementation had no significant effect on NDFD while in oat hay starch and
pectin supplementation suppressed NDFD but only at 24 hours incubation (P = 0011) Sucrose had no
66
effect on NDFD of oat hay at 24 hours Hall (2002a) proposed that in general sucrose tends to decrease
fibre digestion when fed in large quantities probably due to its lowering effect on rumen pH Heldt et al
(1999) reported that NFC supplementation to low-quality tallgrass-prairie decrease NDFD agreeing with our
results
Table 411 Effects of maize starch citrus pectin and sucrose as energy sources on in vitro neutral
detergent fibre degradability (NDFD) parameters of different forage substrates
Treatment
Item Maize starch Citrus pectin Sucrose Control
SEm
P
Lucerne hay NDFD 24h 123 197 178 179 277 0305
NDFD 72h 353 319 366 371 218 0364
Oat hay
NDFD 24h 131 b 137 b 174 ab 202 a 138 0011
NDFD 72h 389 395 406 425 201 0608
Wheat straw
NDFD 24h 116 b 171 a 239 c 205 ac 126 lt0001
NDFD 72h 343 b 402 a 393 a 403 a 140 0032
Ryegrass
NDFD 24h 419 401 392 403 186 0781
NDFD 72h 687 a 556 b 620 ab 649 ab 236 0013
Kikuyu grass
NDFD 24h 353 329 419 437 293 0068
NDFD 72h 714 a 573 b 687 ab 705 ab 324 0033
Superscripts are compared across rows
Sucrose had no effect on NDFD of wheat straw while pectin had a negative effect and starch severely
suppressed NDFD at both incubation times (P lt 005) The severe suppression in NDFD after
supplementation of maize starch can result from the negative effect that starch has on rumen pH Sucrose
and starch ferment rapidly producing lactic acid a product that lowers rumen pH whereas pectin does not
produce lactic acid (Hall 2002b) Starch has shown to decrease rumen pH and affect cellulolytic activity in
the rumen thereby lowering fibre digestion and increasing the risks of acidosis (Mertens amp Loften 1980)
Heldt et al (1999) reported similar results and found that starch decreased fibre digestion more than sugar
This is also in agreement with Vallimont et al (2004) who found that by replacing starch with sugar
incrementally in a continuous culture system fibre digestion was increased
67
Ryegrass and kikuyu NDFD was not affected at 24 hours by energy supplementation Pasture grasses are
high in rapidly fermentable sugars especially when harvested young as was the case with ryegrass and
kikuyu (28 days re-growth) Supplementation with energy sources would thus have a much smaller effect on
these forages compared to mature forages
45 Conclusion
Forage based diets that constitute mainly of mature forages are deficient in energy and therefore cannot
support growth and production in ruminant animals Lactating dairy cows have high energy requirements for
milk production Supplementation of lactating dairy cow diets with concentrates which are high in energy
can thus not be over-emphasized Supplementation with optimal amounts of energy substrates provide the
high producing dairy cow with energy needed to improve fibre digestibility and utilization It must however
be kept in mind that incorrect feeding and large amounts of energy substrates (especially starch and sugar)
increase the risks of ruminal acidosis due to the production of large quantities of lactic acid which
subsequently reduces milk production and profitability
Results obtained from this study proved that supplementation of applied as well as purified energy sources
have positive effects on DMD of forages Supplementing forages with 50 of the applied energy sources
improved DMD of all forages significantly Purified energy sources improved DMD of the hays and straws
significantly These forages are mature and thus have less soluble readily fermentable energy sources in
their tissue compared to ryegrass and kikuyu With the applied energy sources molasses tended to have
the biggest effect on DMD In general however the applied energy sources had a greater influence on
DMD probably because they do not tend to lower rumen pH as much as purified energy sources
The effect of applied energy sources on NDFD showed similar positive results The energy sources
improved NDFD of the total hay and straw substrates significantly These forages are high in NDF and ADL
which lowers NDFD It must also be kept in mind that these energy sources also contain various amounts of
NDF Subsequently substitution with energy sources (low in NDF and ADL) lowered the cell wall content of
the substrate thereby improving NDFD Citrus pulp had the greatest effect on all forages NDFD probably
due to its highly digestible NDF content The energy sources however had no effect on kikuyu grass and
ryegrass because these grasses were lower in NDF and ADL content and high in available sugars Purified
energy sources in contrast tended to decrease NDFD of all the forages The negative effect on NDFD
when supplementing with purified energy sources may be because fermentation of these energy sources by
rumen micro-organisms may result in a depletion of available nitrogen needed by micro-organisms to
ferment the slowly digestible fibre in forages (Heldt et al 1999) Another reason may be due to the fact that
these energy sources lower the rumen fluid pH due to large amounts of lactic acid production (especially by
sucrose and starch) thus decreasing the activity of cellulolytic and hemicellulolytic enzymes needed for fibre
digestion (Hoover amp Miller-Webster 1998) Another reason may be that rumen micro-organisms first attack
the readily fermentable energy sources before attaching to the forage substrates thereby decreasing the
rate of NDFD
68
It must be emphasized that when supplementing dairy cow diets with large amounts of energy sources it is
of utmost importance to provide adequate amounts of effective fibre to ensure a healthy rumen as well as
enough RDP to provide in the rumen microorganismrsquos nitrogen requirements In vitro experiments that show
the effects of supplementing poor quality roughage (such as wheat straw) with RDP or non-protein nitrogen
(NPN would also be useful in further studies as the limiting nutrient in wheat straw is nitrogen Nitrogen in
turn is needed for energy-nitrogen coupling to take place and improve microbial growth Not much research
has also been done to quantify the relationship between different carbohydrate sources and rumen
metabolism parameters leaving room for improvement and further studies
46 References
Allen M amp Oba M 2000 Getting more milk from forages Michigan Dairy Review 5(4) Michigan State
University
Available at
httpwwwadmanicomalliancedairyTechBulletinsNon20Structural20Carbohydrate20Nutrition
htm
(Accessed 5 August 2008)
ANKOM 2005 Method for Determining Acid Detergent Lignin in Beakers ANKOM Technology 0805
AOAC 1990 Official Methods of Analysis 15th edition Association of Official Analytical Chemists Arlington
Virginia
AOAC 1995 Official Methods of Analysis 15th edition Association of Official Analytical Chemists
Washington DC USA
Bampidis VA amp Robinson PH 2006 Citrus by-products as ruminant feeds A review Anim Feed Sci
Technol 128 175 - 217
Burroughs W Gerlaugh WP Edington BH amp Bethke RM 1949 The influence of corn starch upon
roughage digestion in cattle J Anim Sci 8 271
Canbolat O Kamalak A Ozkan CO Erol A Sahin M Karakas E amp Ozkose E 2006 Prediction of
relative feed value of alfalfa hays harvested at different maturity stages using in vitro gas production
Livestock Res Rural Dev 18(2) Article 27
Available at httpwwwcipavorgcolrrdlrrd182canb18027htm
(Accessed 18 October 2008)
Carey D A Caton J S amp Biondini M 1993 Influence of energy source on forage intake digestibility in
situ forage degradation and ruminal fermentation in beef steers fed medium-quality brome hay J
Anim Sci 71 2260 - 2269
69
Dado RG amp M S Allen 1995 Intake limitations feeding behaviour and rumen function of cows
challenged with rumen fill from dietary fiber or inert bulk J Dairy Sci 78 118 - 133
Fall ST Cisseacute M Ditaroh D Richard D Ndiaye NS amp Diaw B 1998 In vivo nutrient digestibility in
sheep and rumen dry matter degradability in cattle fed crop by-product based diets J Anim Feed
Sci 7 171 - 185
Goering HK Van Soest PJ 1970 Forage Fiber Analysis (apparatus reagents procedures and some
applications) In Agriculture Handbook No 379 Agriculture Research Service United States
Department of Agriculture Washington USA
Giraldo LA Tejido ML Ranilla MJ amp Carro MD 2008 In press Effect of exogenous fibrolytic
enzymes on in vitro rumen fermentation of substrates with different forage concentrate ratios Anim
Feed Sci Technol 141 306 - 325
Grant RJ amp Mertens DR 1992 Development of buffer systems for pH control and evaluation of pH
effects on fiber digestion in vitro J Dairy Sci 75 1581 - 1587
Hall MB 2002a Working with Non-NDF carbohydrates with manure evaluation and environmental
considerations In Proc Mid-South Ruminant Nutrition Conference Texas A amp M University Texas
USA pp 37 - 48
Available at httpwwwtxancorgproceedings2002Non-NDF20Carbohydratespdf
(Accessed 20 October 2008)
Hall MB 2002b Working with sugars (and molasses) In Proceedings of the 13th Annual Florida Ruminant
Nutrition Symp January 11 - 12 Gainesville Florida USA pp 146 - 158
Heldt JS Cochran GL Stokka GL Farmer CG Mathis CP Titgemeyer EC amp Nagaraja TG
1999 Effects of different supplemental sugars and starch fed in combination with degradable intake
protein on low-quality forage use by beef steers J Anim Sci 77 2793 - 2802
Henning P 2004 Acidosis in high-producing ruminants - myth or menace Animal Feed Manufacturers
Association (AFMA) South Africa pp 1 - 9
Available at httpwwwengormixcome_articles_viewaspart=529ampAREA=GDC
(Accessed 5 Augustus 2008)
Holtshausen L 2004 Effect of nonfibre carbohydrates on product yield and fibre digestion in fermentations
with mixed ruminal microbes PhD thesis University of Florida Gainesville Florida USA pp 1 - 33
Hoover WH amp Miller-Webster TK 1998 Role of sugar and starch in ruminal fermentation Tri-State Dairy
Nutrition Conference Michigan State University pp 1 - 16
70
Larson CC 2003 The effect of nonfiber carbohydrate source and protein degradability on lactation
performance of Holstein cows pp 1 - 108 MSc (Agric) thesis University of Florida Gainesville
Florida USA pp 1 - 108
Leiva E Hall MB amp Van Horn HH 2000 Performance of dairy cattle fed citrus pulp or corn products as
sources of neutral detergent-soluble carbohydrates J Dairy Sci 83 2866 - 2875
Mertens DR 1997 Creating a system for meeting the fiber requirements of dairy cows J Dairy Sci 80
1463 - 1481
Mertens DR amp Loften JR 1980 The effect of starch on forage fiber digestion kinetics in vitro J Dairy Sci
63 1437 - 1446
Miron J Yosef E Ben-Ghedalia D Chase LE Bauman DE amp Solomon R 2002 Digestibility by dairy
cows of monosaccharide constituents in total mixed rations containing citrus pulp J Dairy Sci 85 89 -
94
Mould F L amp Orskov E R 1983 Manipulation of rumen fluid pH and its influence on cellulolysis in sacco
dry matter degradation and the rumen microflora of sheep offered either hay or concentrate Anim
Feed Sci Technol 10 1 - 14
National Research Council (NRC) 2001 Nutrient requirements of dairy cattle (7th Rev Ed) National
Academy Press Washington DC USA pp 34 - 35
Owens FN Secrist DS Hill WJ amp Gill DR 1998 Acidosis in cattle a review J Anim Sci 76 275 -
286
Russel JB amp Wilson DB 1996 Why are ruminal cellulolytic bacteria unable to digest cellulose at low pH
J Dairy Sci 79 1503 - 1509
Sanson DW Clanton DC Rush IG 1990 Intake and digestion of low-quality meadow hay by steers
and performance of cows on native range when fed protein supplements containing various levels of
corn J Anim Sci 68 595 - 603
Schwarz FJ Haffner J amp Krichgessner M 1995 Supplementation of zero-grazed dairy cows with
molassed sugar beet pulp maize or cereal-rich concentrate Anim Feed Sci Technol 54 237 - 248
Simeone A Beretta V Rowe J Nolan J Elizalde JC amp Baldi F 2004 Rumen fermentation in
Hereford steers grazing ryegrass and supplemented with whole or ground maize In Proceedings of
the 25th Biennial Conference of the Australian Society of Animal Production 4 - 8 July University of
Melbourne Victoria Australia 25 168 - 171
71
Smith LW Goering HK amp Gordon CH 1972 Relationships of forage composition with rates of cell wall
digestion and indigestibility of cell walls J Dairy Sci 55 1140
Statistica 81 2008 StatSoft Inc USA
Tomlin DC Johnson RR amp Dehority BA 1964 Relationship of lignification to in vitro cellulose
digestibility of grasses and legumes J Anim Sci 23 161
Vallimont JE Bargo F Cassidy TW Luchini ND Broderick GA amp Varga GA 2004 Effects of
replacing dietary starch with sucrose on ruminal fermentation and nitrogen metabolism in continuous
culture J Dairy Sci 87 4221 - 4229
Van Soest PJ amp Robertson JB 1985 Analysis of forages and fibrous feeds A laboratory manual for
animal science 613 Cornell University Ithaca New York USA
Van Soest PJ Robertson JB amp Lewis BA 1991 Methods for dietary fiber neutral detergent fiber and
nonstarch polysaccharides in relation to animal nutrition J Dairy Sci 74 3583 - 3587
Voelker JA amp Allen MS 2003 Pelleted beet pulp substituted for high-moisture corn effect on rumianl
fermentation pH and microbial protein efficiency in lactating dairy cows J Dairy Sci 86 (11) 3562 -
3570
Williams VJ Rottle MC Moir RJ amp Underwood EJ 1953 Ruminal flora studies in the sheep IV The
influence of varying dietary levels of protein and starch upon digestibility nitrogen retention and the
free microorganisms of the rumen Aust J Biol Sci 6 142
72
Chapter 5
GENERAL CONCLUSION
The constant availability of high quality forages remains a problem in South Africa The efficiency of forage
utilization by ruminants is limited by several chemical and physical properties of forages including a high
fibre content and relative low energy content The primary components of fibre are cellulose hemicellulose
and lignin Supplementing dairy cow diets with concentrates such as sugar starch and pectin has the
potential to improve animal performance by improving the degradability of forage feedstuffs
Results from the current study suggested that the in vitro methods used were sufficient to indicate not only
that forages differ in terms of fermentability and digestibility but also to show that different energy sources
affect fermentation and digestion patterns of forages in different ways
The first study indicated that molasses per se may have a negative effect on total forage fermentability (as
determined by gas production) while citrus pulp may have a negative effect on the fermentability of certain
forages in this case oat hay and ryegrass Maize meal did not affect forage fermentability as measured by
total gas production The study also suggested that citrus pulp and maize meal may increase the
fermentation rate of oat hay while maize may also increase the fermentation rate of kikuyu The lag phase
of wheat straw and kikuyu fermentation may be shortened by all the energy sources investigated viz maize
meal molasses and citrus pulp It was concluded from the first study that forage fermentability is affected
differently by different energy sources These observations may have significant effects in practice on
rumen health and milk production and the data obtained can potentially be used as guide lines in feed
formulations
In the second study it was shown that different energy sources had different effects on in vitro NDF
digestibility (NDFD) of forages In general sucrose (after 24 and 72 hours of incubation) and pectin (72
hours) had no effect on NDFD of forage substrates The supplementation of oat hay with starch and pectin
(24 hours) and wheat straw with starch (24 and 72 hours) however lowered NDFD when compared to the
control treatment It is hypothesized that micro-organisms fermented the easily fermentable energy sources
first before attacking forage NDF The study suggested that forage NDF degradation values are not fixed
and may be altered by energy supplementation
Understanding the interactions that exist between rumen pH forages and NFC fractions used in dairy cow
rations will help when formulating diets for lactating dairy cows Knowledge of these concepts will aid in
formulating diets that will ensure optimal NDFD milk yield and milk composition without causing ruminal
health problems Papers focusing on the topic of the effect of energy sources on forage digestibility and
comparisons between in vivo and in vitro trials are limited and more research are needed in this regard

ix
Acknowledgements
I wish to thank the following people and organizations
Prof CW Cruywagen for his support and guidance
Dr Nherera for her help and support
The Hennie Steenberg Trust Fund for funding for the study
The Western Cape Department of Agriculture (Elsenburg) who made cannulated Holstein cows
available for the collection of rumen fluid
Academic and technical staff at the Department of Animal Sciences Stellenbosch University for
providing support where necessary and an ideal working environment
Fellow students who provided me with help and support throughout
My parents for their motivation and support
Al my friends for their motivation support and help
x
Table of Contents
Abstract
ii
Uittreksel
v
Acknowledgements
viii
List of Figures
xii
List of Tables
ix
List of Abbreviations
xiv
CHAPTER 1 INTRODUCTION 1
11 References 2
CHAPTER 2 LITERATURE REVIEW 4
21 Introduction 4
22 Non-fibre carbohydrates and non-structural carbohydrates 5
23 Rumen microbiology 5
24 Physical effective fibre and particle size 6
25 Forage classification 7
251 Factors influencing forage nutritive value 7
2511 Age and maturity 8
2512 Soil fertility and environment 8
26 Fibre 9
27 Van Soest forage fraction analysis 9
28 In vitro techniques for evaluating feed resources 10
29 Carbohydrates 10
291 Non-fibre carbohydrates non-structural carbohydrates 11
2911 Sugar 12
2912 Starch 12
2913 Pectin 13
2914 Sugar vs Starch 14
210 Non-fibre carbohydrate digestibility 14
xi
211 Non-fibre carbohydrate fermentation and organic acid production 15
212 Ruminal acidosis 16
213 Conclusion 17
214 References 18
CHAPTER 3 THE EFFECT OF SUGAR STARCH OR PECTIN ON RATE AND EXTENT OF GAS
PRODUCTION IN DIFFERENT FORAGES 23
Abstract 23
31 Introduction 23
32 Materials and methods 24
321 Study area 24
322 Simulated diets 24
3221 Basal forages 24
3222 Energy supplements 25
3223 Defining the diets 25
323 Chemical analyses of forages and energy sources 25
324 Preparation of samples for gas production 26
325 Preparation of the in vitro medium and reducing solution 28
326 Collection and preparation of rumen fluid 28
327 In vitro incubation 28
328 Converting gas pressure to gas volume 29
329 Estimating kinetic coefficients 29
33 Statistical analysis 30
34 Results and discussion 30
341 Gas production including that from the energy sources 30
342 Gas production parameters including that of forage and energy sources in cases where no
interaction was observed 37
343 Gas production excluding that from energy sources 39
344 Gas production parameters excluding that of energy sources in cases where no interaction was
observed 45
35 Conclusion 47
36 References 48
CHAPTER 4 THE EFFECT OF SUGAR STARCH AND PECTIN AS MICROBIAL ENERGY
SOURCES ON IN VITRO NEUTRAL DETERGENT FIBRE AND DRY MATTER DEGRADABILITY OF
FORAGES
51
Abstract 51
xii
41 Introduction 52
42 Materials and methods 52
421 Study area 52
422 Simulated diets 52
4221 Basal forages 52
4222 Energy supplements 53
4223 Defining the diets 54
423 Chemical analyses of forages and energy sources 54
424 Sample preparation 55
425 Preparation of in vitro medium and reducing solution 58
426 Collection and preparation of rumen fluid 58
427 In vitro incubation 58
428 Residue analysis 59
429 Estimating dry matter degradability 59
4210 Estimating neutral detergent fibre degradability 59
43 Statistical analyses 60
44 Results and discussion 60
441 Effect of maize meal citrus pulp and molasses on apparent in vitro dry matter
degradability 60
442 Effect of maize meal citrus pulp and molasses on apparent in vitro neutral
detergent fibre degradability 62
443 Effect of maize starch citrus pectin and sucrose on apparent in vitro dry matter
degradability 64
444 Effect of maize starch citrus pectin and sucrose on apparent in vitro neutral
detergent fibre degradability 65
45 Conclusion 67
46 References 67
CHAPTER 5 GENERAL CONCLUSION 71
xiii
List of Tables
Table 21 Feed types that fall within the definition of forage (adapted from
Wilkens 2000)
7
Table 22 Energy (MJkg DM) and protein (gkg DM) content of different
classes of forages (Wilkens 2000)
8
Table 23 Forage fraction classification using the method of Van Soest (Van
Soest amp Wine 1967)
9
Table 24 The effect of sugar on dairy cattle performance 14
Table 25
Non-fibre carbohydrate levels for various ration types (Ishler amp
Varga 2001)
15
Table 26 Comparison of acute and sub-acute acidosis (Henning 2004) 6
Table 31 Forages used in simulation diets for lactating dairy cows 25
Table 32 Energy sources used in simulating lactating dairy cow diets 25
Table 33 Chemical composition (gkg DM plusmn SD) of forages and energy
sources used in the trial All values are on a DM basis
27
Table 34 Substrate samples containing either forage or energy
supplements
27
Table 35 Composite dietary samples containing forage and energy sources 28
Table 36 Effects of maize meal citrus pulp and molasses as energy
sources on fermentation kinetics of different forage substrates as
measured by in vitro gas production Gas production of both
energy sources and forage substrates are included
32
Table 37 In vitro gas production parameters of forages as affected by
energy sources as main effects in cases where no interactions
were observed Gas production of both energy sources and
forage substrates are included
38
Table 38 In vitro gas production parameters of forages (irrespective of
forage substrate used) as affected by different energy sources as
main effects in cases where no interactions were observed Gas
production of both energy sources and forage substrates are
included
38
Deleted 8
Deleted 9
Deleted 11
Deleted 6
Deleted 7
Deleted 1
Deleted 8
Deleted 7
Deleted 7
Deleted para
Deleted 9
Deleted 30
Deleted 30
Deleted para35
Deleted 41
Deleted 41
xiv
Table 39 Effects of maize meal citrus pulp and molasses as energy
sources on fermentation kinetics of different forage substrates as
measured by in vitro gas production Gas production resulting
from energy sources was deducted from total gas production
40
Table 310 In vitro gas production parameters of forages as affected by
energy sources as main effects in cases where no interactions
were observed Gas production resulting from energy sources
was deducted from total gas production
45
Table 311 In vitro gas production parameters of forages (irrespective of
forage substrate used) as affected by different energy sources as
main effects in cases where no interactions were observed Gas
production resulting from energy sources was deducted from total
gas production
52
Table 41 Forages used in simulation diets for lactating dairy cows 53
Table 42 Applied energy sources used in simulating the dairy cow diets 54
Table 43 Purified energy sources used in simulating the dairy cow diets 54
Table 44 Chemical composition (gkg DM plusmn SD) of forages and energy
sources used in the trial All values are on a DM basis
55
Table 45 Substrate samples containing either forage or applied energy
supplements
55
Table 46 Composite diets containing forage and applied energy sources 56
Table 47
Diets containing forages alone or a mixture of forages and purified
energy sources Amounts are on an air dry basis
56
Table 48 Effects of maize meal citrus pulp and molasses as energy
sources on in vitro dry matter degradability (DMD) parameters of
different forage substrates
60
Table 49 Effects of maize meal citrus pulp and molasses as energy
sources on in vitro neutral detergent fibre degradability (NDFD)
parameters when incubated in combination with different forage
substrates
63
Table 410 Effects of maize starch citrus pectin and sucrose as energy
sources on in vitro dry matter degradability (DMD) parameters of
different forage substrates
64
Deleted 43
Deleted parapara 48
Deleted 49
Deleted 57
Deleted 57
Deleted
Deleted 58
Deleted para59
Deleted 60
Deleted para60
Deleted 61
Deleted 65
Deleted 67
Deleted 9
xv
Table 411 Effects of maize starch citrus pectin and sucrose as energy
sources on in vitro neutral detergent fibre degradability (NDFD)
parameters of different forage substrates
65
Deleted 70
xvi
List of Figures
Figure 21 Structural and non-structural carbohydrates of plants where ADF
= acid detergent fibre szlig-glucans = (1 rarr 3) (1 rarr 4)-szlig-D-glucans
NDF = neutral detergent fibre NDSF = neutral detergent-soluble
fibre (includes all non-starch polysaccharides not present in
NDF) NSC = non-NDF carbohydrates (Ishler amp Varga 2001)
11
Figure 22 Ruminal pH results for citrus and hominy rations where CPD =
citrus pulp diet and HD = hominy diet (Leiva et al 2000)
14
Figure 31 Gas production of forage substrates alone 34
Figure 32 Gas production of lucerne hay when supplemented with different
energy sources
35
Figure 33 Gas production of oat hay when supplemented with different
energy sources
36
Figure 34 Gas production of wheat straw when supplemented with different
energy sources
36
Figure 35 Gas production of ryegrass when supplemented with different
energy sources
37
Figure 36 Gas production of kikuyu grass when supplemented with
different energy sources
37
Figure 37 Gas production of forage substrates after gas production of
energy sources has been deducted
42
Figure 38 The net effect of energy supplements on gas production of
lucerne hay
42
Figure 39 The net effect of energy supplements on gas production of oat
hay
43
Figure 310 The net effect of energy supplements on gas production of
wheat straw
44
Figure 311 The net effect of energy supplements on gas production of
ryegrass
44
Figure 312 The net effect of energy supplements on gas production of
kikuyu grass
45
Deleted para
Deleted 2
Deleted para15
Deleted 6
Deleted 7
Deleted 8
Deleted 9
Deleted 9
Deleted 40
Deleted 4
Deleted 5
Deleted 6
Deleted 6
Deleted 7
Deleted 7
xvii
List of Abbreviations
ADF Acid detergent fibre
ADL Acid detergent lignin
b Gas production
c Gas production rate
C3H7NO2HCL Cysteine hydrochloride
cp Citrus pulp
CP Crude protein
DM Dry matter
DMI Dry matter intake
EE Ether extract
KIK Kikuyu grass
KOH Potassium hydroxide
L Lag phase
LUC lucerne hay
mm Maize meal
mol Molasses
MP Microbial protein
Na2S9H2O Sodium sulfide nonahydrate
ND Neutral detergent
NDF Neutral detergent fibre
NDSF Neutral detergent-soluble fibre
NFC Non-fibre carbohydrates
NH3N Ammonia nitrogen
NPN Non-protein nitrogen
NSC Non-structural carbohydrates
OH Oat hay
OM Organic matter
pef Physical effectiveness factor
peNDF Physical effective neutral detergent fibre
RDP Rumen degradable protein
RPT Reading pressure technique
RYE Ryegrass
VFA Volatile fatty acids
WS Wheat straw
1
Chapter 1
INTRODUCTION
The compound stomach system of ruminants is adapted to roughage based diets mainly grass (Cherney
1998) Diets of grass and other fibrous feeds however do not meet the energy requirements of high
producing dairy cows (Schwarz et al 1995) Fibre is low in energy and a large consumption thereof results
in rumen fill thus limiting feed intake (Allen amp Oba 2000) Concentrate feeds such as non-fibre
carbohydrates (NFC) provide lactating dairy cows with energy needed to improve performance and
efficiency of production (Henning 2004) Balanced rations consisting of forages and concentrate feeds
ensure optimal production and rumen health For dairy cattle forages should comprise at least 40 of the
diet and NFC should constitute between 35 and 42 of the diet (NRC 2001) Non-fibre carbohydrates such
as sugars starch and pectin are critical in meeting energy requirements for growth and production (Roche amp
Dalley 1996)
The symbiotic relationship between rumen micro-organisms and the host animal is an essential component
in nutrient supply (Van Saun 1998) Ruminant rations should provide the rumen micro-organisms with
sufficient nutrients and an optimal environment for growth (Ishler et al 1996) According to the NRC (2001)
the most important nutrients for optimal microbial growth are protein and carbohydrates Microbial
fermentation and digestion of carbohydrates and protein provide ruminants with volatile fatty acids (VFA) and
microbial protein (MP) The animal uses the VFA as energy and the MP for protein synthesis (Van Saun
1998)
Energy shortages affect lactating cows especially during the first three weeks after calving (Hutjens 1998)
During this time dry matter intake (DMI) is low and milk production is high resulting in a negative energy
balance When formulating diets for lactating dairy cows it is important to consider the total NFC fraction
which primarily comprise of sugars starch and pectins (Larson 2003) The NFC ferment rapidly in the
rumen to VFA (Holtshausen 2004) Batajoo amp Shaver (1994) reported that cows receiving diets with more
than 30 NFC produced more than 40 kg of milkday However they found no milk yield benefits by
increasing the NFC beyond 36 Molasses is a common energy supplement used in dairy rations
(Holtshausen 2004) In addition to this molasses also reduce dustiness and increase palatibility and
moisture content of diets (De Ondarza 2000) Other energy supplements include soybean hulls sugar beet
pulp and citrus pulp Leiva et al (2000) showed that substituting diets that contain 205 citrus pulp (pectin)
for diets containing 195 maize meal (starch) increased milk yield Solomon et al (2000) however
reported that substituting starch-rich diets with pectinndashrich diets had no effect on milk yield
Energy sources such as sugar starch and pectin are frequently used as supplements to forage in ruminant
diets in order to meet the energy requirements for growth and production However there is a lack of
information on the magnitude of the relationship between different carbohydrate sources and rumen neutral
detergent fibre fermentation kinetics
2
The objectives of this study were to determine the impact of three energy sources viz maize meal
molasses and citrus pulp on total gas production rate of gas production dry matter (DM) degradability and
NDF degradability of different forage substrates Forages commonly used in dairy cow diets were chosen as
fermentation substrates These were wheat straw (Triticum aestivum) oat hay (Avena sativa) lucerne hay
(Medicago sativa) kikuyu (Pennisetum clandestinum) and ryegrass (Lolium multiflorum)
11 References
Allen M amp Oba M 2000 Getting more milk from forages Michigan Dairy Review 5(4) Department of
Animal Science Michigan State University
Available at
httpwwwadmanicomalliancedairyTechBulletinsNon20Structural20Carbohydrate20Nutrition
htm
(Accessed 5 August 2008)
Batajoo KK amp Shaver RD 1994 Impact of nonfiber carbohydrate on intake digestion and milk
production by dairy cows J Dairy Sci 77 1580 - 1588
Cherney DJR 1998 Forages for dairy cattle Economical alternatives to alfalfa grass and corn In
Proceedings of the 1998 Tri-State Dairy Nutrition Conference April 21 - 22 Fort Wayne Indiana
USA pp 35 - 50
De Ondarza MB 2000 Non-fibre carbohydrates
Available at httpwwwmilkproductioncomLibraryArticlesNon_Fibre_Carbohydrateshtm
(Accessed 5 August 2008)
Henning P 2004 Acidosis in high producing ruminants - myth or menace Animal Feed Manufacturers
Association (AFMA) South Africa pp 1 - 9
Available at httpwwwengormixcome_articles_viewaspart=529ampAREA=GDC
(Accessed 5 Augustus 2008)
Holtshausen L 2004 Effect of nonfibre carbohydrates on product yield and fibre digestion in fermentations
with mixed ruminal microbes PhD thesis University of Florida Gainesville Florida USA pp 1 - 33
Hutjens MF 1998 Practical approaches to feeding the high producing cow Illini DairyNet University of
Illinois Extension
Available at httpwwwlivestocktrailuiucedudairynetpaperDisplaycfmContentID=247
(Accessed 5 Augustus 2008)
Ishler V Heinrichs J amp Varga G 1996 From feed to milk Understanding rumen function Pennsylvania
State University Extension Circular 422
3
Available at httpanimsciagrenvmcgillcacourses450extrafeed_to_milkconceptshtml
(Accessed 25 August 2008)
Larson CC 2003 The effect of nonfiber carbohydrate source and protein degradability on lactation
performance of holstein cows MSc (Agric) thesis University of Florida Gainesville Florida USA pp
1 - 4
Leiva E Hall MB amp Van Horn HH 2000 Performance of dairy cattle fed citrus pulp or corn products as
sources of neutral detergent-soluble carbohydrates J Dairy Sci 83 2866 - 2875
National Research Council (NRC) 2001 Nutrient requirements of dairy cattle (7th Rev Ed) National
Academy Press Washington DC USA pp 34 - 35
Roche J amp Dalley D 1996 Nutrition and milk composition Agriculture Notes State of Victoria Department
of Primary Industries pp 1 - 3
Available at
httpwwwdpivicgovaudpinreninfnsf9e58661e880ba9e44a256c640023eb2e036a3ac34d507323c
a257181001f0359$FILEAG0534pdf
(Accessed 1 October 2008)
Schwarz FJ Haffner J amp Krichgessner M 1995 Supplementation of zero-grazed dairy cows with
molassed sugar beet pulp maize or cereal-rich concentrate Anim Feed Sci Technol 54 237 - 248
Solomon R Chase LE Ben-Ghedalia D amp Bauman DE 2000 The effect of nonstructural carbohydrate
and addition of full fat soybeans on the concentration of conjugated linoleic acid in milk fat of dairy
cows J Dairy Sci 83 1322 - 1329
Van Saun RJ 1998 Beef cattle nutrition Feeding for two (How to properly feed the cow and her rumen)
In Cow-calf management guide-cattle producers library (2nd Ed) Cooperative Extension Service
Publications Agricultural Publications University of Idaho Moscow Idaho USA pp 172 - 180
4
Chapter 2
LITERATURE REVIEW
21 Introduction
With the increase in the cost of feed medicine labour fuel and other production essentials it is vital for any
agricultural enterprise specifically the traditional lsquofarmrsquo to be operated like a business With the profit-
making goal in mind the single most important facet of a modern dairy-operation is its feeding program An
efficient and successful feeding program will not only maximize the animalrsquos production but will also cut
costs in other areas of the operation by increasing animal health productive life-expectancy and reducing
labour costs A feeding program that achieve these goals will ultimately make the agricultural enterprise
more economically competitive
Dairy cattle require specific amounts of nutrients to support various levels of performance Feeding high
levels of concentrates (especially non-fibrous carbohydrates) to high producing dairy cows is common in all
intensive production systems around the world The problem with high levels of concentrates in dairy cow
diets is the risk of these diets causing digestive disturbances The aim of diet formulation and thus nutritional
management for intensive production systems must be to maximize productivity and overall efficiency
without enhancing digestive disturbances such as acidosis (Henning 2004) A successful feeding program
will meet the cowrsquos nutritive needs for high production minimize weight loss (during early lactation) prevent
digestive upsets and maintain ruminal and animal health
In order to achieve full genetic potential for high milk production it is of the utmost importance to keep the
rumens of dairy cows in a healthy state The rumen is home to a wide diversity of micro-organisms
(including bacteria protozoa and fungi) collectively utilizing the extensive variety of feeds which make up
dairy cow diets (Kamra 2005) Forages are the main component of dairy cow diets Forages alone
however do not meet the energy requirements of high producing dairy cows (Schwarz et al 1995)
Supplementing dairy cow diets with concentrate feeds provide high milk producing cows with energy needed
to improve efficiency of production and performance (Henning 2004) Carbohydrates are the largest nutrient
component of dairy diets and the most important source of energy for rumen micro-organisms
Carbohydrates important for growth reproduction milk production and rumen health make up roughly 70
of dry matter (DM) in dairy diets making it the lsquoheartrsquo of dairy diets (Mertens 1997) Carbohydrates (fibre
starch and sugar) are degraded in the rumen to simple sugars and then fermented into volatile fatty acids
(VFA) by rumen bacteria supplying up to 80 of the animalrsquos energy requirements
5
22 Non-fibre carbohydrates and non-structural carbohydrates
The three main components of the carbohydrate fraction of feeds referred to as non-fibre carbohydrates
(NFC) are starch NDSF (neutral detergent-soluble fibre) and sugars The NFC fraction of feedstuffs is
estimated from the following calculation as proposed by Holtshausen (2004)
100 - crude protein - ether extract - ash - neutral detergent fibre + neutral detergent insoluble crude
protein
The fraction derived by the above calculation has at times been used interchangeably for the terms NFC and
non-structural carbohydrates (NSC) Non-structural carbohydrates however refer to plant cell contents and
include mono- and oligosaccharides organic acids (which are not carbohydrates) starch and fructans Non-
fibre carbohydrates include all of the above substances as well as soluble fibre (pectic substances szlig-
glucans and galactans) Thus NFC includes non-structural and structural carbohydrates as well as non-
fibrous and fibrous carbohydrates (Holtshausen 2004)
In the interest of clarity I will not use the terms NSC and NFC interchangeably I will use NFC exclusively
as its meaning is more complete in the context of this thesis
23 Rumen microbiology
All living organisms require some essential nutrients to sustain metabolic processes and to maintain a
healthy state These essential nutrients include water protein minerals vitamins and essential energy The
difference between the cow itself and the micro-organisms living within its rumen is defined by the source of
their respective nutrients (Van Saun 1993)
Feeding dairy cattle nutritional balanced diets ensures healthy rumens that maximize microbial production
and growth Ruminal pH is the main variable influencing the microbial population and thus the overall VFA
production (major energy source to animal) Diets containing too much NFC may cause the ruminal pH to
decrease below 6 This low rumen pH leads to a reduction in cellulolytic organisms and an increase in
propionate producing micro-organisms in turn leading to a low acetate-propionate ratio This in turn results
in low milk fat percentages (Ishler et al 1996)
Maintaining a healthy rumen microbial population is an essential function of any feeding program Carbon
skeletons and energy are used by rumen micro-organisms for protein synthesis Ruminant systems are
sometimes based on digestible organic or fermentable matter even though rumen micro-organisms are able
to grow and develop on only secondary carbohydrate products Rumen bacteria have specific maintenance
requirements for growth and development Both bacterial growth rate and fractional degradation rate of
carbohydrates determine bacterial yield (Nocek amp Tamminga 1991)
6
24 Physical effective fibre and particle size
Preventing ruminal acidosis requires chemical and physical considerations of the diet as well as a well-
organized feed and herd management system (Hall 2002) The physical form of the diet affects the nutritive
value of the feed as well as the chewing activity dry matter intake rumen function and milk production of the
animal
Particle size plays a critical role in the extent to which rumen micro-organisms can carry out their digestive
functions Grinding or chopping forages does not change the forage composition it only reduces the particle
size Reduced particle size increases dry matter intake and the rumen turnover rate resulting in a reduced
time period within which rumen micro-organisms can digest fibre Reduced particle size also reduces the
time spent on rumination thus leading to less mucus production and a subsequent decrease in rumen pH
Low rumen pH leads to an increase in propionic acid production and tend to change milk components by
lowering milk fat percentages and increasing milk protein percentages Chopping and grinding of
concentrates increase the starch exposure to rumen microbial digestion resulting in increased degradation
Processing methods such as pelleting steam rolling or grinding of concentrates alter the structure of starch
by increasing its availability for fermentation in the rumen This increase in starch availability can be either
favorable by boosting rumen microbial growth or harmful by enhancing the risk of rumen acidosis (Van der
Merwe amp Smith 1991)
As with particle length fibre content of the diet plays an important role in maintaining rumen functions Fibre
ensures sufficient amounts of carbohydrates to slow down the rate of digestion and prevent rumen acidity
Neutral detergent fibre (NDF) and acid detergent fibre (ADF) are the most important fibre fractions in ration
formulation Effective fibre is needed in dairy diets to form a ruminal mat and slow down carbohydrate
availability thereby preventing rumen acidosis (Ishler et al 1996) Balancing the dairy ration for NDF and
non-fibre carbohydrates (NFC) fractions is very important in controlling the rumen pH Buffers are also
commonly used for controlling pH
Physical effective fibre (peNDF) relates the physical properties of a feed (by measuring particle size and
chewing activity) to rumen pH The peNDF of a feed is the product of the feedrsquos physical effectiveness factor
(pef) and the feedrsquos NDF By definition pef varies between 0 (if NDF if is not successful in stimulating
chewing activity) and 1 (if NDF is successful in encouraging chewing activity) (Mertens 1997)
It is very important to always balance the peNDF of the dairy cow diet with dietary fermentability Physical
effective fibre is that fraction of fibre that promotes the chewing activity Thus when feeding lactating cows
it is very important to add adequate amounts of peNDF Optimal inclusion of peNDF will ensure that the cow
chews her cud well enough and in the process secrete enough saliva that helps to control rumen pH
Ruminal pH is primarily determined by the balance between the quantity of fermentation acid produced and
the buffer secretion during chewing (Allen 1997)
7
25 Forage classification
Good forage sources are the foundation of efficient dairy production (Morrison 1959) A large variety of
feeds can be defined as forages (Baloyi 2008) as listed in Table 21 By definition forages are the edible
fractions of plants other than grain that can be harvested for feeding or used as feed for grazing animals
(Forage amp Grazing Terminology Committee 1991) The definition also states that feedstuff must contain
35 or more NDF to be classified as forage (Zinn amp Ware 2007)
It is of utmost importance to remember that a high producing dairy cowrsquos digestible nutrient and net energy
requirements cannot be met by forage alone Generally dairy cows are fed good quality forages and then
supplemented with additional grains or other concentrates in order to meet their requirements
Table 21 Feed types that fall within the definition of forage (adapted from Wilkens 2000)
Forage Feed types
Herbage Leaves roots of non-woody species stems sown and
permanent grasslands crops that may be cut or grazed
Hay Grasses and legumes that have been cut dried and
stored for use as animal feed
Silage
Browse
Fermented high moisture fodder
Leaves bud and twigs of woody species
Straw Dry stalk of cereal plant after the grain or seed has been
removed
251 Factors influencing forage nutritive value
Chemical composition digestibility and the physical characteristics of the digested feed determines the
nutritive value of forage (Goosen 2004) Forages between and within species differ significantly in
composition and nutritive value as indicated in Table 22
8
Table 22 Energy (MJkg DM) and protein (gkg DM) content of different classes of forages (Wilkens 2000)
Forage class Metabolizable energy
MJkg DM
Crude protein
gkg DM
Temperate grasses hays and silages
70-130 60-250
Tropical grasses
50-110 20-200
Maize silage
100-120 60-120
Cereal straw
50-80 20-40
Root crops
110-140 40-130
Kale and rape 90-120 140-220
Age and maturity soil fertility and environmental conditions are the primary factors influencing the nutritive
value of forages Herbage maturity has the largest influence on forage nutritive value (Buxton amp Mertens
1995) Mature forages have higher lignin and cell wall contents that limit fibre utilization due to the rate and
degree of plant cell hydrolysis (Van Soest 1994)
2511 Age and maturity
Young plants are tender with less structural carbohydrates (hemicellulose and cellulose) and lignin compared
to mature plants (McDonald et al 2002) Lignin is indigestible explaining the higher digestibility in younger
plants As plants mature the stems and leaves become lignified decreasing the nutritive value of the plant
due to the lower digestibility of nutrients enclosed in the cell walls (Morrison 1959) Leaves have lower cell
wall content than stems As the plant matures there is an increase in the proportion of stems compared to
leaves thus contributing to the lower digestibility of mature plants (Van Soest 1994)
2512 Soil fertility and environment
Environmental factors that affect forage quality the most are temperature light water and soil fertility (Van
Soest 1994) The mineral content in soil influences not only the crop yield but also its composition
Fertilizers can have a great influence on the nutrient content of soils Fertilized pastures grow better are
more palatable and have higher protein vitamin and mineral contents than unfertilized pastures (Morrison
1959)
9
26 Fibre
Fibre is composed of an indigestible fraction and several potentially digestible fractions that occupy space in
the gastrointestinal tract of ruminants (Mertens 1997) The primary components of fibre are cellulose
hemicellulose and lignin In the rumen feed is digested through microbial fermentation and the physical
breakdown of feed through rumination (Ishler amp Varga 2001) The type of diet fed influences and change
bacteria population in the rumen in order to successfully digest the food used by the cows The level to
which fibre will digest depends on the particle size rumen pH and fibre level in the diet
27 Van Soest forage fraction analysis
Fibre lignin and protein are the three most important chemical fractions determining nutrient supply and
performance (Mould 2003) According to Van Soest (1994) chemical analysis measures digestibility and
intake using the statistical relationship between feed quality and the analyzed feed components The
proximate analysis divided feedstuff into six fractions namely moisture crude protein ash ether extract
nitrogen-free extract and crude fibre (Fisher et al 1995) Van Soest (1994) claimed that the proximate
analysis had one serious error namely that the proximate analysis divided carbohydrates into crude fibre
and nitrogen-free extract Van Soest then developed an analysis specifically for fibre-rich feeds that
replaced the proximate analysis The method of Van Soest predicts intake and the nutritive value of
feedstuffs by determining the fibre fractions according to the degradability of fractions insoluble in neutral
detergent and fractions insoluble in acid detergent (Goosen 2004) Acid detergent fibre determines the
cellulose and lignin content and NDF the cellulose hemicellulose and lignin The difference between NDF
and ADF gives the hemicellulose content (Knudsen 2001) Table 23 gives an outlay of the components
soluble and insoluble in NDF
Table 23 Forage fraction classification using the method of Van Soest (Van Soest amp Wine 1967)
Fraction Components
Cell contents (soluble in neutral detergent) Lipids
Sugar organic acids
Water-soluble matter
Pectin starch
Non-protein nitrogen
Soluble protein
10
Table 23(continue) Forage fraction classification using the method of Van Soest (Van Soest amp Wine 1967)
Cell wall contents (insoluble in neutral detergent)
1 Soluble in acid detergent Fibre-bound protein
Hemicellulose
2 ADF Cellulose
Lignin
Lignified N
Silica
28 In vitro techniques for evaluating feed resources
In vitro methods used to evaluate feed resources are less time-consuming and less expensive than in vivo
methods The in vitro gas production procedure measures the amount of gas produced or collected
recording it manually (Theodorou et al 1994) or automatically (Pell amp Schofield 1993 Davies et al 2000)
This procedure thus generates kinetic data rather than digested feed disappearance (Baloyi 2008) Gas
production gives a description of the microbial activity and how micro-organisms respond to a specific
substrate thereby giving a practical imitation of what happens in the rumen Pell et al (1998) used in vitro
gas production to measure the rate and extent of fermentation VFA production and microbial protein (MP)
production The biggest advantage of the gas production technique is that there is no need to terminate the
gas production in order to measure the extent of digestion The disadvantage of this technique however is
the lack of uniformity in methodology and factors such as pH and temperature that may affect a feedrsquos gas
production (Getachew et al 1997) The traditional two-stage method (Tilley amp Terry 1963) involved an in
vitro fermentation of forages in rumen fluid followed by pepsin digestion The disadvantage of this
technique however is that it is an end-point measurement thus giving no indication on forage digestion
kinetics (Theodorou et al 1994) Goering amp Van Soest (1970) modified the procedure to accurately
estimate the true DM digestibility by treating the residue with a ND solution (Baloyi 2008) The method of
Goering and Van Soest however are also an end-point measurement thus giving no indication on forage
digestion kinetics (Theodorou et al 1994) ANKOM technology developed a technique that simplifies in vitro
digestibility evaluations using an insulated incubator (Daisy II incubator) (Baloyi 2008) The ANKOM
technique predict potential and true digestibility in vitro accurately faster and with less labour
29 Carbohydrates
Carbohydrates can be classified into two groups (structural carbohydrates and non-fibrous carbohydrates)
based on their function in plants (see Figure 21) Structural carbohydrates which are located in the plantrsquos
cell walls are very fibrous and are digested slowly Non-fibrous carbohydrates are located in the plantrsquos
11
leaves and seeds Non-fibrous carbohydrates are easily digested and include starches sugars fructans and
organic acids (Ishler amp Varga 2001)
Acid detergent fibre and NDF are the most universal way of analyzing fibre It is important to note that
although pectins are part of the cell wall they are grouped as non-structural carbohydrates The reason for
this is because pectin other than hemicellulose is entirely fermentable by rumen micro-organisms (Van der
Merwe amp Smith 1991)
Figure 21 Structural and non-structural carbohydrates of plants where ADF = acid detergent fibre szlig-
glucans = (1 rarr 3) (1 rarr 4)-szlig-D-glucans NDF = neutral detergent fibre NDSF = neutral detergent-soluble
fibre (includes all non-starch polysaccharides not present in NDF) NSC = non-NDF carbohydrates (Ishler amp
Varga 2001)
291 Non-fibre carbohydrates non-structural carbohydrates
Non-fibre carbohydrates are the major source of energy for high producing dairy cattle all around the world
Non-fibre carbohydrates are very palatable and easily digested but fermentation varies with type of feed and
means of processing Increasing NFC in the diet fulfils the high energy demands of a lactating dairy cow but
at the expense of NDF (NRC 2001)
The non-structural component of plants can be identified by two different methods chemical analysis (which
uses enzymes to determine the level of starch and sugar in the feed) or difference calculations (which use
NDF crude protein fat and ash to estimate NFC) (Stokes 1997) Russell et al (1992) reported that greater
amounts of NFC in dairy cow diets increase the production of MP Thus NFC in diets for lactating cows has
the potential to increase MP synthesis as well as the efficiency of ruminal undegradable protein utilization
(Casper et al 1990) It must however be emphasized that MP yield differs with different NFC sources
12
Different NFC sources require different inclusions of rumen degradable protein and rumen undegradable
protein in order for an animal to reach optimal performance (Mertens et al 1994)
Milk production per cow is the major factor determining any dairy farmrsquos profitability The inclusion of NFC is
a fashionable way to increase energy density and thus milk production of the dairy herd Replacing part of
the starch in the diet with sugar leads to higher fermentation rates and more MP This might be due to the
fact that sugar digests at a rate of 300 per hour whereas starch digests at a rate of 6 ndash 60 per hour
(Carver 2007) Research has also shown that additional supplementary sugar in feed has the power to
increase feed intake milk yield and fat content of milk due to better fibre digestion and production of MP in
the rumen (Lykos et al 1997)
The importance of adequate amounts of NFC cannot be over emphasized Feeding inadequate amounts of
NFC reduces the energy available from propionic and lactic acid production reduces MP synthesis and
decrease fibre digestion Overfeeding of NFC depress fibre digestion and acetic acid production (lowering
milk fat percentages)
It is important to note that NFC and NSC is not the same in all feeds The difference between these two is
caused by the input of pectin and organic acids Pectin is always included in NFC but not in NSC (NRC
2001) Numerous research experiments investigated the effect of NFC on ruminal pH Knowledge of the
individual as well as a combination of supplemented NFC fermentation characteristics can be helpful in
predicting an animalrsquos performance (Holtshausen 2004)
2911 Sugar
Simple sugars are rapidly fermented in the rumen (at a rate of 300 per hour) and are composed of one or
two units of sugar Sugars commonly fed to dairy cows include sucrose lactose and dextrose Initially
sugar was used in diets to improve the palatability of the feed Recently it was discovered that rumen micro-
organisms respond to sugar by increasing their production of MP leading to higher milk production The
addition of sugar to the feed also helps rumen micro-organisms capture and utilize diet nitrogen Even
though sugar has very advantageous effects on rumen micro-organisms and their actions it is important not
to add too much sugar in dairy cow diets as it can cause ruminal acid-spikes resulting in acidosis (De
Ondarza 2000)
2912 Starch
The NFC in most grain-based diets is made up of starch (24 ndash 28 of the total ration DM) Starch
digestibility plays an important role in the milk production of dairy cows Maize and barley (being cereal
grains) provide most of the starch in a dairy cowrsquos diet Theoretically starch is units of glucose bonded
together Depending on the starch source and method of processing the glucose units can be firmly bonded
or weakly connected This is the main reason why some starches ferment rapidly and others slowly in the
13
rumen of dairy cows Ruminal digestion of starch can vary from 6 ndash 60 per hour depending on the starch
source and processing method used The goal of feeding starch is to achieve maximum total tract
digestibility and maximum MP production without causing ruminal health problems due to production of
fermentation acids (De Ondarza 2000)
2913 Pectin
Pectin is one of the three most essential structural components in forages and is found primarily in the
intercellular layers of plant tissues Pectin diminishes as the plant gets older Most feeds consumed by
dairy cows are low in pectin (2 ndash 3) but several feeds may contain higher concentrations such as citrus
pulp (15) beet pulp (15 ndash 20) and lucerne (3 ndash 10) Pectin contributes to the energy requirements of
rumen micro-organisms (75 ndash 90 of pectin fermentation takes place in the rumen) (Allen 2001)
Many of the species that break down pectin also digest plant components such as cellulose and
hemicellulose Pectin is extremely fermentable and highly digestible but this does not appear to lower pH as
is often seen with starch digestion Due to this feeds containing pectin are often supplemented into high
concentrate dairy diets to avoid problems associated with rumen acidosis (Mohney 2002)
A study done by Dehority (1969) found that a number of different rumen bacteria are capable of fermenting
pectin (using it as a carbon source) eg Butyrivibrio fibrisolvens Prevotella ruminicola Lachnospira
multiparus Treponema bryantii and Succinivibrio dextrinosolvens Later studies discovered that the
products of the hydrolysis (by Lachnospira multiparus bacterium) of pectic material can be used by other
ruminal micro-organisms such as Selenomonas ruminantium Fusobacterium sp Eubacterium ruminantium
and Succinivibrio dextrinosolvens (Paggi et al 2005)
2914 Sugar vs Starch
Leiva et al (2000) investigated the effect of two maize silagelucerne hay-based diets on ruminal pH The
only difference between these two diets was that their NFC came from either starch (hominy) or sugars
(dried citrus pulp) From this trial it was concluded that the pH declined more rapidly on citrus diets (sugar)
than on hominy (starch) diets and also reaching the lowest pH point faster (Figure 22)
14
Figure 22 Ruminal pH results for citrus and hominy rations where CPD = citrus pulp diet and HD = hominy
diet (Leiva et al 2000)
From the studies done by Leiva et al (2000) it was observed that starch has the best chance of increasing
milk production However the problem with high starch diets is that they are likely to cause serious rumen
acidosis One way to ensure healthy rumens as well as high milk production is to use peNDF as a
benchmark The more peNDF a cow consumes the more starch may be included in the diet Physical
effective neutral detergent fibre thus lowers the risk of ruminal acidosis The effect of supplementing sugar
to forage based diets is shown in Table 24
Table 24 The effect of sugar on dairy cattle performance
MP = microbial protein OM = organic matter DMI = dry matter intake
210 Non-fibre carbohydrate digestibility
Non fibre carbohydrates are composed of starch and sugar Starch digestibility has a major effect on the
rumen Starch fermentation varies with processing and type of grain fed Processing such as grinding
Reference Forage Source Supplements Intake g DM day Animal Response
Chamberlain et al
1985
Grass Sugar 9072 g sugar MP synthesis uarr
Huhtanen 1988 Grass Molasses 9979 g molasses
(499 g sugar)
OM digestion amp
MP production uarr
Nombekela amp
Murphy 1995
Lucerne Haylage
amp Maize Silage
Sucrose 2858 g sucrose Milk yield (9072 g)
amp DMI uarr
15
steaming and ensiling affects ruminal availability of starch Processing mostly increases rate of fermentation
and digestibility of starch Soluble sugar ferments rapidly in the rumen and is readily available as energy
sources for the animal (Ishler amp Varga 2001) Mature grains (maize or oats) usually contain a small amount
of sugar because most has been converted to storage polysaccharides Forages (pasture or hay) usually
contain a lot of sugars The level of sugar in hay is depended on crop management Byproducts (molasses
citrus pulp and almond hulls) contain high levels of sugars However the variation in processing methods
(as in the case of starch) and the type of material used can lead to large variation in sugar content (Hall
2002)
One problem with diets high in NFC is the fact that it lowers the rumen pH increasing the risk of acidosis
The main reason for this is NFC fast fermentability especially if it replaces fibre in low fibre diets Acidosis in
turn affects ruminal digestion intake metabolism milk fat production milk production as well as rumen and
animal health The NFC levels of various feed types are shown in Table 25
Table 25 Non-fibre carbohydrate levels for various ration types (Ishler amp Varga 2001)
211 Non-fibre carbohydrate fermentation and organic acid production
The rate and extent of carbohydrate fermentation determines the concentration of organic acids produced
Rumen micro-organisms digest simple and complex carbohydrates (fibre) by converting them into VFA
(mainly acetic propionic and butyric acid) These VFA are the most important energy source for ruminants
Volatile fatty acids account for 60 ndash 70 of metabolizable energy supply in ruminants making it of great
importance in the production of milk by dairy cows Reduction in fibre digestion leads to a reduction in
ruminal pH This is caused by rapid NFC fermentations leading to increased VFA production by rumen
micro-organisms
Typical NFC level Typical feedstuffs
33 ndash 36 Barley oats high moisture- steam flaked-
and finely ground grain predominate the
concentrate portion of the diet
37 ndash 39
High quality hay crop forages
predominates the ration maize silage
rations include non-forage fibre sources
40 ndash 42
Coarsely processed maize is used diet
has a high inclusion level of non-forage
fibre sources
16
Feeding large amounts of forage produces greater amounts of acetic acid whilst resulting in lesser amounts
of propionic and butyric acid On the other hand feeding grain or other finely ground forages may lead to a
reduction in acetic acid while the amount of propionic acid may increase The ratio of acetic to propionic
acids imitates the rumen fermentation pattern Under an optimal rumen fermentation environment the acetic
to propionic ratio should be greater than 221 High planes of acetate can point to a low fermentable
carbohydrate high fibre ration High planes of propionic acid on the other hand can point to reduced fibre
digestion and acidosis (University of Minnesota 1996)
A study done by Strobel amp Russel (1986) found that pectin fermentation increased acetate concentrations
further compared to starch and sucrose The study concluded that the increased acetate might ultimately
contribute to increase precursors for fatty acid and milk fat synthesis in lactating dairy cows Fermentation
studies done with sucrose and starch on the other hand increased butyrate production (Hoover et al
2006) Butyrate has shown to be an important precursor of energy supplied to skeletal and heart muscles
(Holtshausen 2004) Sugar ferments extremely fast in the rumen Without linkages to other carbohydrates
and due to the high solubility of sugars there is little to impede microbial fermentation (Hall 2002) Several
studies reported that sugar has a much higher potential for lactate production when compared to other NFC
sources (for example starch) (Strobel amp Russel 1986 Heldt et al 1999)
212 Ruminal acidosis
Micro-organisms in the rumen obtain energy primarily from fermentation of carbohydrates Acidosis occurs
when the diet of ruminants is suddenly changed from a forage based diet to a predominant concentrate diet
The highest risks come from diets that are high in starch or fast fermentable carbohydrates and the effective
fibre is below the recommended level or the particle size is too small This leads to higher VFA production
as well as very high glucose levels in the rumen Subsequently ruminal osmolarity increases leading to
ruminal acidity The increase in osmolarrity is due to the negative effect the high glucose level has on
Streptococcus bovis and lactic acid-producing micro-organisms (Henning 2004) Acidosis can be divided
into sub-acute ruminal acidosis and acute acidosis as seen in Table 26
Table 26 Comparison of acute and sub-acute acidosis (Henning 2004)
Acidosis Item Acute Sub-Acute
Clinical Signs Present Absent
Systemic Acidosis Present Absent
Mortality Yes No
Ruminal pH lt 50 50 -55
17
Table 26(continue) Comparison of acute and sub-acute acidosis (Henning 2004)
Ruminal Acids
Lactic Acid High (50-100mM) Normal (0-5mM)
Volatile Fatty Acids Below Normal (lt100mM) High (150-200mM)
Ruminal Bacteria
Lactic Acid Producers Very High Normal to Small Increase
Lactic acid Utilisers Significant Reduction Increase
Ruminal Protozoa Absent or Reduced Absent or Reduced
Indicators determining whether ruminal acidosis is accruing in the herd include (Ishler amp Varga 2001)
Milk fat percentage (darr milk fat ndash darr ruminal pH)
Chewing activity (darr rumination ndash uarr ruminal acidosis)
Laminitis (uarr laminitis ndash uarr ruminal acidosis)
Strategies for avoiding acidosis
Provide good quality total mixed rations
Give small but frequent meals
Avoid abrupt changes in diets
213 Conclusion
Achieving maximum production and maintaining a healthy rumen ecosystem at the same time is a balancing
act A cow will attain more VFA when fermentation is maximized These VFA are used as energy
precursors and to synthesize MP Increased fermentation however goes together with increased acid
production and a lower rumen pH Low rumen pH can lead to metabolic disorders due to impaired fibre
digestion Thus by increasing the peNDF intake the risk of acidosis can be reduced effectively
Non-fibre carbohydrates are the essential source of energy for high producing dairy cattle One problem with
diets high in NFC however is the fact that it lowers the rumen pH increasing the risk of acidosis This is
mainly due to the fast fermentability of NFC especially if it replaces fibre in low fibre diets Acidosis in turn
affects ruminal digestion intake metabolism milk fat production and milk production as well as rumen and
animal health
A better understanding of the workings of the rumen as a whole ecosystem as well as ensuring optimal
sugar starch and peNDF in dairy cow ration will enable farmers to maintain the fine balance between
productivity and acidosis
18
Whilst the goal of any modern agricultural enterprise is to maximize profits special care should be taken not
to increase short-term profits at the cost of long-term viability A dairy cowrsquos productivity can easily be
increased whilst the animalrsquos health could suffer in the long term In the modern scenario the farm is as
much a profit-seeking enterprise as any other business With this in mind the modern farmer in his capacity
as a business manager should ensure the well-being and optimal performance of his assets
214 References
Allen MS 1997 Relationship between fermentation acid production in the rumen and the requirement
for physically effective fiber J Dairy Sci 80 1447 - 1462
Allen M 2001 Formulating lactating cow diets for carbohydrates In Proceedings of the 5th Western Dairy
Management Conference April 4 - 6 Las Vegas Nevada USA pp 79 - 86
Baloyi TF 2008 Effects of exogenous fibrolytic enzymes on in vitro fermentation kinetics of forage and
mixed feed substrates MSc (Agric) thesis Stellenbosch University Stellenbosch South Africa pp 1 -
28
Buxton DR amp Mertens DR 1995 Quality-related characteristics of forage In Forages An introduction to
grassland agriculture (2nd Ed) Eds Barnes RF Miller DA and Nelson CJ Iowa State University
Press Ames Iowa USA pp 83 - 96
Carver LA 2007 Sugar aids lactating dairy cattle production Feedstuffs 79(2) 1 - 3
Casper DP Schingoethe DJ amp Esenbeisz WA 1990 Response of early lactation dairy cows fed diets
varying in source of nonstructural carbohydrate and crude protein J Dairy Sci 73 1039 - 1050
Chamberlain DG Thomas PC Wilson W Newbold CJ amp MacDonald JC 1985 The effects of
carbohydrate supplements on ruminal concentrations of ammonia in animals given diets of grass
silage J Agric Sci Cam 104 331 - 340
Davies ZS Mason D Brooks AE Griffith GW Merry RW amp Theodorou MK 2000 An automated
system for measuring gas production from forages inoculated with rumen fluid and its use in
determining the effect of enzymes on grass silage Anim Feed Sci Technol 83 205 - 221
Dehority BA 1969 Pectin-fermenting bacteria isolated from bovine rumen J Bacteriol 99 189 - 196
De Ondarza MB 2000 Non-fibre carbohydrates
Available at httpwwwmilkproductioncomLibraryArticlesNon_Fibre_Carbohydrateshtm
(Accessed 5 August 2008)
19
Fisher DS Burns JC amp Moore JE 1995 The nutritive evaluation of forage In Forages An introduction
to grassland agriculture (1st Ed) Eds Barnes RF Miller DA amp Nelson CJ Iowa State University
Press Ames Iowa USA pp 105 - 115
Forage amp Grazing Terminology Committee 1991 Vegetation terms In Terminology for grazing lands and
grazing animals Pocahontas Press Inc Blacksburg Virginia USA
Getachew G Makkar HPS amp Becker K 1997 The in vitro gas coupled with ammonia measurements for
evaluation of nitrogen digestibility in low quality roughages using incubation measurements of different
measuring capacity J Sci Food Agric
Goering HK amp Van Soest PJ 1970 Forage fibre analysis (apparatus reagents procedures and some
applications) Agricultural Handbook Number 379 ARS-USDA Washington DC USA
Goosen L 2004 The effect of an exogenous fibrolytic enzyme on forage digestibility parameters MSc
(Agric) thesis Stellenbosch University Stellenbosch South Africa pp 1 - 27
Hall MB 2002 Working with sugars (and molasses) In Proceedings of the 13th Annual Florida Ruminant
Nutrition Symp January 11 - 12 Gainesville Florida USA pp 146 - 158
Heldt JS Cochran GL Stokka GL Farmer CG Mathis CP Titgemeyer EC amp Nagaraja TG
1999 Effects of different supplemental sugars and starch fed in combination with degradable intake
protein on low-quality forage use by beef steers J Anim Sci 77 2793 - 2802
Henning P 2004 Acidosis in high-producing ruminants - myth or menace Animal Feed Manufacturers
Association (AFMA) South Africa pp 1 - 9
Available at httpwwwengormixcome_articles_viewaspart=529ampAREA=GDC
(Accessed 5 Augustus 2008)
Holtshausen L 2004 Effect of nonfibre carbohydrates on product yield and fibre digestion in fermentations
with mixed ruminal microbes PhD thesis University of Florida Gainesville Florida USA pp 1 - 33
Hoover WH Tucker C Harris J Sniffen CF amp De Ondarza MB 2006 Effects of nonstructural
carbohydrate level and starchsugar ratio on microbial metabolism in continuous culture of rumen
contents Anim Feed Sci Technol 128(3 - 4) 307 - 319
Huhtanen P 1988 The effects of barley unmolassed sugar-beet pulp and molasses supplements on
organic matter nitrogen and fibre digestion in the rumen of cattle given a silage diet Anim Feed Sci
Technol 20 259
20
Ishler V Heinrichs J amp Varga G 1996 From feed to milk Understanding rumen function Pennsylvania
State University Extension Circular 422
Available at httpanimsciagrenvmcgillcacourses450extrafeed_to_milkconceptshtml
(Accessed 25 August 2008)
Ishler V amp Varga G 2001 Carbohydrate nutrition for lactating dairy cattle Pennsylvania State University
Code DAS 01 - 29 (online) pp 1 - 11
Available at httpwwwdaspsueduteamdiary
(Accessed 5 August 2008)
Kamra DN 2005 Rumen microbial ecosystem Current Science 89(1) 124 - 135
Knudsen KE 2001 The nutritional significance of lsquodietary fibrersquo analysis Anim Feed Sci Technol 90 3 -
20
Leiva E Hall MB amp Van Horn HH 2000 Performance of dairy cattle fed citrus pulp or corn products as
sources of neutral detergent-soluble carbohydrates J Dairy Sci 83 2866 - 2875
Lykos T Varga GA amp Casper D 1997 Varying degradation rates of total nonstructural carbohydrates
effects on ruminal fermentation blood metabolites and milk production and composition in high
producing holstein cows J Dairy Sci 80(12) 3341 - 3355
McDonald P Edwards RA Greenhalgh JFD amp Morgan CA 2002 Evaluation of food Digestibility In
Animal Nutrition (6th Ed) Pearson Education Ltd Edinburgh Gate Harlow Essex UK pp 246 - 263
Mertens DR 1997 Creating a system for meeting the fibre requirements of dairy cows J Dairy Sci 80
1463 - 1481
Mertens D R Broderick GA amp Simons R 1994 Efficacy of carbohydrate sources for improving
utilization of N in alfalfa silage J Dairy Sci 77(Suppl 1) 240 - 252
Mohney K 2002 Synchronization of carbohydrate and protein metabolism by ruminal microbes in
continuous culture PhD thesis North Carolina State University Raleigh North Carolina USA pp 1 -
69
Morrison FB 1959 Feeds and feeding A handbook for the student and stockman (22nd Ed) Eds The
Morrison Publishing Company Clinton Iowa USA 1165 pp
Mould FL 2003 Predicting feed quality - chemical analysis and in vitro evaluation Field Crops Research
84(1) 31 - 44
21
National Research Council (NRC) 2001 Nutrient requirements of dairy cattle (7th Rev Ed) National
Academy Press Washington DC USA pp 34 - 35
Nocek J E amp Tamminga S 1991 Site of digestion of starch in the gastrointestinal tract of dairy cows and
its effect on milk yield and composition J Dairy Sci 74 3598 - 3629
Nombekela S W amp Murphy MR 1995 Sucrose supplementation and feed intake of dairy cows in early
lactation J Dairy Sci 78 880 - 885
Paggi RA Rodriguez C amp Fay JP 2005 Growth and pectate-lyase activity of the ruminal bacterium
lachnospira multiparus in the presence of short-chain organic acids Lett Appl Microbiol 41 434 -
439
Pell AN amp Schofield P 1993 Computerized monitoring of gas production to measure forage digestion in
vitro J Dairy Sci 76 1063 - 1073
Pell AN Pitt RE Doane PH amp Shofield P 1998 The development use and application of gas
production techniques at Cornell University USA In In vitro techniques for measuring nutrient supply
to ruminants Eds Deaville ER Owen E Adesogan AT Rymer CHuntington JA amp Lawrence
TLJ British Society of Animal Science Edinburgh UK Publication 22 45 - 54
Russell JB OrsquoConnor JD Fox DG Van Soest PJ amp Sniffen CJ 1992 A net carbohydrate and
protein system for evaluating cattle diets Ruminal fermentation J Anim Sci 70 3551 ndash 3561
Schwarz FJ Haffner J amp Krichgessner M 1995 Supplementation of zero-grazed dairy cows with
molassed sugar beet pulp maize or cereal-rich concentrate Anim Feed Sci Technol 54 237 - 248
Stobel HJ amp Russel JB 1986 Effect of pH and energy spilling on bacterial proteien synthesis by
carbohydrate-limited cultures of mixed rumen bacteria J Dairy Sci 69 2941 - 2947
Stokes SR 1997 Balancing carbohydrates for optimal rumen function and animal health In Proceedings
of the West Can Dairy Sem 9 73 - 86
Available at httpwwwwcdsafnsualbertacaProceedings1997ch06-97htm
(Accessed 7 October 2008)
Theodorou MK Williams BA Dhanoa MS McAllan AB amp France J 1994 A simple gas production
method using a pressure transducer to determine the fermentation kinetics of ruminant feeds Anim
Feed Sci Technol 48 185 - 197
Tilley JMA amp Terry RA 1963 A two-stage technique for the in vitro digestion of forage crops J Br
Grassl Soc 18 104 - 111
22
University of Minnesota 1996 Feeding the dairy herd (online)
Available at httpwwwextensionumnedudistributionlivestocksystemscomponentsDI0469-02
(Accessed 5 August 2008)
Van der Merwe FJ amp Smith WA 1991 Dierevoeding Kosmo Publ Stellenbosch South Africa pp 89 -
141 (in Afrikaans)
Van Saun RJ 1993 Dairy cattle nutrition feeding for two In Proceedings of the 1993 Northwest and
Lower Columbia Dairy Short Course January 21 - 22 amp 25 - 26 Everett Washington and Portland
Oregon USA pp 172 - 180
Van Soest PJ 1994 Nutritional ecology of the ruminant (2nd Ed) Cornell University Press Ithaca New
York USA pp 467 - 476
Van Soest PJ amp Wine RH 1967 Use of detergents in the analysis of fibrous feeds IV Contamination of
Plant Cell-wall Constituents J Assoc Off Anal Chem 50 50 - 55
Wilkins RJ 2000 Forages and their role in animal systems In Forage evaluation in ruminant nutrition
Eds Givens DI Owen E Axford RFE Omed HM CAB International Wallingford UK pp 1 -14
Zinn RA amp Ware RA 2007 Forage quality Digestive limitations and their relationships to performance of
beef and dairy cattle 22nd Annual Southwest Nutrition amp Management Conference February 22 - 23
University of California Davis Caifornia USA
Available at httpagarizonaeduansswnmc2007talksZinn_2007SWNMCpdf
(Accessed 16 September 2008)
23
Chapter 3
THE EFFECT OF SUGAR STARCH OR PECTIN ON RATE AND
EXTENT OF GAS PRODUCTION IN DIFFERENT FORAGES
Abstract
The study evaluated the effect of sugar (molasses) starch (maize meal) or pectin (citrus pulp) on total gas production (b)
and rate of gas production (c) of different forages The forage substrates included wheat straw (WS) oat hay (OH)
lucerne hay (LUC) ryegrass (RYE) and kikuyu grass (KIK) The three energy sources as well as a control (no energy
source) were incubated in vitro with each of the above mentioned forages Rumen fluid was collected from two lactating
Holstein cows receiving a diet consisting of oat hay lucerne wheat straw and a concentrate mix Forages alone andor
together with either molasses citrus pulp or maize meal were weighed into 100 ml glass vials and incubated for 72
hours The weights of the energy sources were calculated on an energy equivalent basis Blank vials that contained no
substrates were included to correct for gas production from rumen fluid alone The substrates were incubated in a
mixture of 40 ml buffered medium 2 ml of reducing solution and 10 ml rumen fluid Gas pressure was recorded
automatically every five minutes using a pressure transducer system and the method based on the Reading Pressure
Technique Gas pressure was converted to gas volume using a predetermined regression equation In the first trial the
gas production included gas produced by the energy sources while in the second trial the energy source gas production
was deducted from the total gas production to determine the effect of energy source on gas production of respective
forage substrates per se Data were fitted to two non-linear models Significant forage x energy interactions were
observed for the non-linear parameter b (gas production) in Model 1 and for b and L (lag phase) in Model 2 in both trials
In the first trial the higher fermentability of the energy sources supplemented to forage substrates increased b (Model 1
amp 2) of the LUC and WS (P lt 005) The gas production rate was affected in different ways for different forages with the
most noticeable effect when WS was supplemented with energy sources All the energy sources increased c of WS
irrespective of the model used Energy sources had no effect on the L of LUC OH or RYE but decreased the L of WS (P
= 0004) and KIK (P = 0022) In the second trial maize meal had no effect on b for any of the forages (Model 1 amp 2)
while molasses (Model 1 amp 2) decreased b for all forage substrates and citrus pulp (Model 1 amp 2) decreased b of OH and
RYE to lower values than those of the control treatments Gas production rate was not affected by molasses for any of
the forage substrates while citrus pulp (Model 1 amp 2) increased c of OH and maize meal increased c of OH and KIK
Lag phase was only affected by energy sources in WS (P = 0001) and KIK (P = 0009) where all the energy sources
had lower L values than the control treatment It was concluded that forage fermentability is affected differently by
different energy sources These observations may have important implications for rumen health and milk production
and the data obtained can potentially be used as guidelines in feed formulations
31 Introduction
Forages contribute significant major part of dairy cow diets However forages alone cannot provide all the
energy requirements of high producing dairy cows (Schwarz et al 1995) Forage degradation by rumen
micro-organisms is restricted by the chemical composition and physical quality of the forage (Mertens 1997)
Fibrous feeds are low in energy and a large consumption thereof results in rumen fill thus limiting feed intake
24
(Allen amp Oba 2000) It is important to find ways to improve forage degradation and utilization
Improvements in forage degradation will increase energy intake and subsequently milk production and
performance (Giraldo et al 2008)
Different sources of non-fibre carbohydrates (NFC) have different effects on animal performance
Supplementing forage based diets with energy sources containing sugar starch or pectin results in variation
of performance measurements such as milk yield milk composition dry matter intake (DMI) and feed
efficiency (Larson 2003) Aldrich et al (1993) reported that feeding high rumen-available NFC increased
milk protein percentage slightly (301 vs 307) but significantly Leiva et al (2000) showed that
substituting diets containing 205 citrus pulp for diets containing 195 corn meal yielded more milk
Solomon et al (2000) however reported that substituting starch (maize) diets with pectin (citrus pulp) diets
had no effect on milk yield but increased linoleic acid concentration in milk fat When formulating diets for
dairy cows it is important to understand the digestion and metabolizable nutrient yield of the various NFC
sources (Larson 2003)
The objective of this study was to determine the impact of three energy sources viz maize meal
(representative of starch) molasses (representative of sugar) and citrus pulp (representative of pectin) on
fermentation kinetics of different forage substrates as determined by total gas production (b) and the rate of
gas production (c) Forages commonly used in dairy cow diets in South Africa (wheat straw oat hay lucerne
hay kikuyu and ryegrass) were used as substrates
32 Materials and methods
321 Study area
The study to evaluate the effect of supplementing forage based diets with sugar starch and pectin on rumen
kinetic parameters was conducted at Stellenbosch University Stellenbosch South Africa (33deg 55prime 12Prime S
18deg 51prime 36Prime E)
322 Simulated diets
3221 Basal forages
Five forages (Table 31) were used to prepare rations to simulate diets for lactating dairy cows
25
Table 31 Forages used in simulation diets for lactating dairy cows
Forage Type Abbreviation
Wheat straw (Triticum aestivum) WS
Oat hay (Avena sativa) OH
Lucerne hay (Medicago sativa) LUC
Ryegrass (Lolium multiflorum) RYE
Kikuyu grass (Pennisetum clandestinum) KIK
Rye and kikuyu grasses were harvested after four weeks of re-growth All the forages were oven dried at
60ordmC for 72 hours Wheat straw oat hay and lucerne hay were ground (Cyclotec 1093 mill) through a 2 mm
screen Rye and kikuyu grasses were obtained from the Outeniqua experimental farm (33deg 57prime 0Prime S
22deg 25prime 0Prime E) situated just outside George South Africa (33deg 58prime 0Prime S 22deg 27prime 0Prime E) The rye and kikuyu
grasses were already ground through a 1 mm screen when received
3222 Energy supplements
Three energy sources (Table 32) were selected as supplements to prepare rations that would simulate
lactating cow diets
Table 32 Energy sources used in simulating lactating dairy cow diets
Energy type Source Abbreviation
Starch Yellow maize meal (Zea mays) Mm
Sugar Molasses syrup Mol
Pectin Citrus pulp Cp
These energy feedstuffs were sourced in the following forms molasses as a syrup by-product from the
processing of sugar cane (Officinarum saccharum) citrus pulp as a finely granulated residue by-product from
the peel pulp and seeds of oranges and grapefruit and yellow maize grain The citrus pulp and maize was
milled (Cyclotec 1093 mill) through a 1 mm screen
3223 Defining the diets
A total of 23 simulated diets (forages and forage-concentrate mixes) were prepared
bull 5 diets contained forage substrates only (Table 31)
bull 3 diets contained energy sources only (Table 32)
bull 15 diets contained a mixture of forages (Table 31) and energy sources (Table 32)
26
The final substrate compositions are indicated in Table 34
323 Chemical analyses of forages and energy sources
Samples (1 g) of each forage type and energy sources (1 g) were accurately weighed and placed in a 100ordmC
conventional oven for 24 hours to determine dry matter (DM) content (AOAC 1995 Method 93015)
Organic matter was determined by weighing 1 g of each feedstuff into crucibles and ashing the content at
500ordmC in a muffle furnace for 6 hours (AOAC 1995 Method 94205)
The NDF content was determined by measuring 05 g of each feedstuff into F57 ANKOM fibre analysis bags
The bags were heat sealed and NDF determined using the method of Van Soest et al (1991) Sodium
sulfite (Na2SO3) was added to the NDF solution during digestion and heat-stable amylase was added during
rinsing Ether extract was determined using the AOAC method (AOAC 1995 Method 92039) About 2 g of
ground sample was weighed into a thimble and samples were extracted with diethyl ether (C4H10O)
Acid detergent lignin (ADL) was determined by measuring 05 g of each substrate sample into separate F57
ANKOM fibre analysis bags The bags were heat sealed and acid detergent fibre (ADF) determined using
the method of Van Soest et al (1991) The ADF residue was then soaked in 72 sulphuric acid for three
hours to dissolve the cellulose Acid detergent lignin was determined using the ANKOM method (ANKOM
2005)
Total nitrogen content was determined with a Leco Nitrogen Gas Analyzer custom designed and built by
LECO Africa (Pty) Ltd (Kempton Park) About 01 g of sample was accurately weighed into a small square of
aluminum foil The samples were then ignited inside the Leco furnace at about 900degC according to the
Dumas procedure (AOAC 1990 Method 96806) Crude protein (CP) was calculated by multiplying the
nitrogen content with 625 (AOAC 1995 Method 99003) The results obtained from the chemical analysis
are shown in Table 33
324 Preparation of samples for gas production
The gas production method used was based on the Reading Pressure Technique (Mauricio et al 1999)
Samples of the respective dietary substrates (Tables 34 and 35) were weighed into glass vials with known
volume The vials had a nominal volume of 100 ml but the exact volume of each vial was previously
accurately determined The amount of the energy sources in Table 35 were calculated to provide the same
amount of metabolizable energy (ME) than 0125 g maize DM For calculation purposes ME values were
assumed to be 139 MJkg DM for maize 122 MJkg DM for citrus pulp and 123 MJkg for molasses (NRC
2001) Blank vials were prepared exactly as the others except that they did not contain any substrates in
order to correct for gas production from rumen fluid alone
27
Table 33 Chemical composition (gkg DM plusmn SD) of forages and energy sources used in the trial All values
are on a DM basis
Feedstuff DM OM NDF CP EE ADL
WS 9150 plusmn 05 9022 plusmn 16 8179 plusmn 71 723 plusmn 10 36 plusmn 05 1022 plusmn 30
OH 8504 plusmn 23 9403 plusmn 173 7819 plusmn 110 910 plusmn 12 97 plusmn 08 825 plusmn 03
LUC 8989 plusmn 20 9062 plusmn 18 5153 plusmn 10 2370 plusmn 46 81 plusmn 06 927 plusmn 67
RYE 938 plusmn 10 845 plusmn 05 4892 plusmn 30 2509 plusmn 27 431 plusmn 01 448 plusmn 181
KIK 1242 plusmn 104 1122 plusmn 01 6512 plusmn 20 2534 plusmn 41 283 plusmn 11 480 plusmn 17
mm 8559 plusmn 09 9844 plusmn 13 1743 plusmn 550 1071 plusmn 02 377 plusmn 04 70 plusmn 06
cp 8799 plusmn 09 9285 plusmn 07 2614 plusmn 140 786 plusmn 18 164 plusmn 04 253 plusmn 64
mol 6980 plusmn 19 8927 plusmn 06 ND ND ND ND
DM = dry matter OM = organic matter NDF = neutral detergent fibre CP = crude protein EE = ether
extract ADL = acid detergent lignin ND = not determined WS = wheat straw OH = oat hay LUC = lucerne
RYE = ryegrass KIK = kikuyu grass mm = maize meal cp = citrus pulp mol = molasses
Table 34 Substrate samples containing either forage or energy supplements
Forage type Energy source Sample size (g DM)
Wheat straw - 02500
Oat hay - 02500
Lucerne hay - 02500
Ryegrass - 02500
Kikuyu grass - 02500
- Maize meal 01250
- Citrus pulp 01425
- Molasses 01412
28
Table 35 Composite dietary samples containing forage and energy sources
Forage type Energy source Forage (g DM) Energy (g DM)
Wheat straw Maize meal 01250 01250
Wheat straw Citrus pulp 01250 01425
Wheat straw Molasses 01250
01412
Oat hay Maize meal 01250 01250
Oat hay Citrus pulp 01250 01425
Oat hay Molasses 01250
01412
Lucerne hay Maize meal 01250 01250
Lucerne hay Citrus pulp 01250 01425
Lucerne hay Molasses 01250 01412
Ryegrass Maize meal 01250 01250
Ryegrass Citrus pulp 01250 01425
Ryegrass Molasses 01250
01412
Kikuyu grass Maize meal 01250 01250
Kikuyu grass Citrus pulp 01250 01425
Kikuyu grass Molasses 01250 01412
325 Preparation of the in vitro medium and reducing solution
The incubation medium was prepared as described by Van Soest amp Robertson (1985) The medium
consisted of micro minerals macro-mineral solution buffer solution tryptose rezasurin and distilled water
The medium was kept in a water bath at 395ordmC The pH of the medium was about 78 Reducing solution
was prepared as described by Van Soest amp Robertson (1985) and consisted of cysteine hydrochloride
(C3H7NO2HCL) potassium hydroxide (KOH) pellets sodium sulfide nonahydrate (Na2S9H2O) and distilled
water
326 Collection and preparation of rumen fluid
Rumen fluid was collected from two ruminally cannulated lactating Holstein cows The cows were confined
and received 25 kg per day (air dry basis) of a diet consisting of oat hay lucerne hay wheat straw and a
concentrate mix The total diet contained 11279 gkg CP 55948 gkg NDF and 5950 gkg ash with a
calculated ME content of 108 MJkg The diet was offered in two equal amounts viz 125 kg in the morning
(0630) and 125 kg in the afternoon (1630) Rumen fluid was squeezed through two layers of cheese cloth
into pre-warmed thermos flasks and a handful of solid material was added The rumen fluid was then
blended in a pre-warmed blender at a low speed for 10 seconds The rumen fluid was then filtered through
29
four layers of cheese cloth into pre-warmed beakers while flushing with carbon dioxide (CO2) The
temperature of the rumen fluid averaged 38ordmC and the pH averaged 58
327 In vitro incubation
The glass vials were flushed with CO2 while adding 40 ml of the medium and 2 ml of the reducing solution to
each vial A magnetic stirrer (02 ml) was also placed into each vial The vials were then lightly closed with
rubber stoppers and placed in the incubator at 39ordmC until the medium was reduced (ie clear) Vials were re-
opened and 10 ml of rumen fluid was added while flushing with CO2 The vials were then closed tightly with
rubber stoppers crimp sealed and connected via needles to a pressure logging system The vials were
placed on magnetic stirrer plates in an incubator at 39ordmC and were constantly stirred at a low speed The
material was incubated for 72 hours and gas pressure was recorded automatically every five minutes using a
pressure transducer system that was custom designed and built by Eagle Technology (Pty) Ltd (Cape Town)
based on the Reading Pressure Technique (RPT) (Mauricio et al 1999) Gas pressure was released on
regular intervals to prevent pressure build-up in the vials
328 Converting gas pressure to gas volume
Gas pressure data were converted to gas volume using the following linear regression equation developed
by Goosen (2004) for Department of Animal Sciencesrsquo in vitro lab
OMCXY )])09770((1000[=
Where Y = Gas volume (mlg OM)
X = Gas pressure (psi)
C = Vial head space (ml)
OM = Organic Matter (mg)
329 Estimating kinetic coefficients
Kinetic coefficients for gas production were derived from the gas volume data using the solver option in Excel
and the non-linear models 1 and 2 (with and without a lag phase respectively) The models are based on the
modified version described by Oslashrskov and McDonald (1979)
30
Model 1 ⎟⎠⎞
⎜⎝⎛ minusminus= ctebY 1
Model 2 ( )⎟⎠⎞
⎜⎝⎛ minusminusminus= LtcebY 1
Where Y = gas volume at time t
b = total gas production
c = rate of gas production
t = incubation time
L = lag time
33 Statistical analysis
The first derivatives b and c (Model 1) and b c and L (Model 2) were subjected to statistical analysis The
experiment was a two way cross classification and data was subjected to a factorial ANOVA with the factors
forage and energy using Statistica 81 (2008) This was done for all the non-linear parameters Main effects
were interpreted in the cases where no interaction was observed Significant forage x energy source
interactions were observed for the non-linear parameter b in Model 1 and for b and L in Model 2 Therefore
a one-way ANOVA was done on each of the forages to determine the effect of energy sources Differences
between means were determined with a Tukey test and significance was declared at P lt 005
34 Results and discussion
341 Gas production including that from the energy sources
Results of total gas (b) and rate (c) of gas production are presented in Table 36 Pasture grasses had
higher gas volumes than mature forages before substitution with energy sources Gas volume is generally a
good indicator of digestibility fermentability and microbial protein production (Sommart et al 2000)
Substitution with energy sources tended to raise gas production (Table 36) When maize meal replaced
50 of the forage substrate total 72 hour gas production was increased in the case of lucerne and wheat
straw irrespective of the model used In wheat straw total gas production was also increased with citrus
pulp supplementation (Models 1 amp 2) and with molasses (Model 2) For the other forages (oat hay ryegrass
and kikuyu) energy supplements did not have an effect on total gas production values The total (72 hour)
gas production values represent the sum of forage and energy source fermentations except for the control
31
treatment where the substrates were forages only The higher gas production values observed with energy
supplementation (especially for wheat straw) was due to the energy sources being more readily fermentable
and easily available to rumen micro-organisms Energy sources are also low in NDF and ADL (Table 33)
which would increase gas production as there exists a negative correlation between gas production and
plant cell wall content (Sallam 2005)
The rate of gas production (c) of forage substrates alone ranged between 003 and 009 mlh with lucerne
and ryegrass having the highest rates When the respective energy sources replaced 50 of the forage
substrates there were variable positive responses in terms of c of different forage substrates In general
energy sources tended to raise the rate of gas production probably due to the higher nutrient content and
easier accessibility of chemical constitutes to rumen microbial enzymes as compared to the forage
substrates alone (Arigbede et al 2006) In lucerne hay molasses increased c compared to the control
treatment (Model 1 amp 2) Maize meal had no effect on c when compared to the control treatment The latter
agrees with Mertens amp Loften (1980) where starch increased the lag time but had no effect on digestion rate
of lucerne This would suggest that the addition of energy sources to forage substrates do not decrease
fibre digestibility by lowering the rate of fermentation In oat hay citrus pulp had the biggest effect on c (both
models) while with Model 1 molasses also increased c Maize meal (both models) tended to increase c but
not significantly compared to the control treatment The most noticeable effect of forage substitution with
energy sources was observed for wheat straw In this case all the energy sources increased the rate of gas
production irrespective of the model used While the other forages have moderate fermentation potentials
(as can be seen from the b and c values) the fermentability of wheat straw is low resulting in a higher
response when energy was supplemented In ryegrass maize meal had no effect on c (Model 1 amp 2) while
citrus pulp (Model 1) and molasses (both models) improved c compared to the control treatment Citrus pulp
increased gas production rate in kikuyu (P lt 005) when Model 1 was used while maize meal and molasses
only tended to increase c Supplementation with citrus pulp tended to improve gas production rates of
forages more than maize meal Citrus pulp is high in degradable NDF resulting in less negative effects on
cellulolytic bacteria and the ruminal environment than starch supplementations (Bampidis amp Robinson
2006) Unlike sugars and starches pectin substances do not lower the rumen pH (Mohney 2002) Pectin
supplementation would thus sustain an optimal ruminal environment for cellulolytic bacteria functions
explaining the better gas production rates resulting from forages supplemented with citrus pulp Leiva et al
(2000) also reported that citrus pulp ferment at a faster rate than corn hominy Energy source had no
significant effect on gas production rate of kikuyu in Model 2 It thus seems that energy sources per se
tended to improve forage gas production rate Energy sources are high in nutrients that are easily available
and rapidly fermentable by rumen micro-organisms Hiltner amp Dehority (1983) found that forage digestion
improved with energy sources supplementation due to an increase in the number of rumen micro-organisms
available to help with fermentation
When the respective energy sources replaced 50 of the forage substrates a significant forage x energy
source interaction was observed for the lag phase Different lag times of forage substrates (control
treatments) may be the result of differences in plant tissue composition between forages that require different
degrees of physical or chemical changes before rumen micro-organisms can start with fibre digestion
(Mertens amp Loften 1980) Lucerne fermented alone had almost no lag phase but supplementation of maize
32
meal tended (P = 0069) to increase the lag phase Adesogan et al (2005) found that maize and citrus pulp
incubated individually had longer lag phases when compared to hays (P lt 0001) agreeing with results
obtained in this study that the energy sources tended to lengthen the lag phase of lucerne hay The longer
lag phase for the maize and citrus pulp treatments might be associated with a high proportion of cellulolytic
micro-organisms in the rumen fluid The diet of the cannulated cows consisted predominantly of oat hay
lucerne hay and wheat straw and might have resulted in insufficient numbers of pectin-fermenting and
amylolytic bacteria in the collected rumen fluid to instantly colonize the citrus pulp and maize respectively
(Adesogan et al 2005) The results also agree with the work of Mertens amp Loften (1980) where starch
increased the lag time but had no effect on digestion rate of lucerne Possible reasons include a delay in
fermentation due to microbial colonization (Chesson amp Forsberg 1988) In contrast Haddad amp Grant (2000)
found that a reduction in NFC content substituted to lucerne based diets in vitro increased the lag time of
lucerne
Table 36 Effects of maize meal citrus pulp and molasses as energy sources on fermentation kinetics of
different forage substrates as measured by in vitro gas production Gas production of both energy sources
and forage substrates are included
Treatment
Item Maize meal Citrus pulp Molasses Control
SEm
P
Lucerne hay
Model 1
b 3981 b 3500 ab 3342 ab 2701 a 2498 0025
c 009 a 011 ab 014 b 009 a 001 0005
Model 2
b 3965 b 3490 ab 3340 ab 2700 a 2513 0028
c 010 a 011 ab 015 b 009 a 001 0013
L 045 033 009 005 011 0069
Oat hay
Model 1
b 3982 3654 3150 2966 372 0250
c 008 ab 011 b 008 b 004 a 001 0002
Model 2
b 3971 3654 3150 2951 3745 0253
c 008 ab 011 b 008 ab 005 a 001 0004
L 032 0 0 036 013 0125
33
Table 36 (continue) Effects of maize meal citrus pulp and molasses as energy sources on fermentation kinetics of different forage substrates as measured by in vitro gas production Gas production of both energy sources and forage substrates are included
Wheat straw
Model 1
b 3706 b 3591 b 3062 ab 2460 a 1876 0002
c 008 b 010 b 009 b 003 a 001 0001
Model 2
b 3696 b 3591 b 3062 b 2289 a 1796 0001
c 008 b 010 b 009 b 003 a 001 0001
L 032 b 000 b 000 b 225 a 040 0004
Ryegrass
Model 1
b 4492 4113 3777 3727 3454 0406
c 008 a 012 b 012 b 008 a 001 0001
Model 2
b 4471 4106 3776 3711 3475 0422
c 008 a 012 cb 012 b 009 ac 001 0006
L 051 024 003 054 018 0213
Kikuyu grass
Model 1
b 4236 4269 3902 3230 2634 0055
c 009 ab 011 b 010 ab 005 a 001 0025
Model 2
b 4224 4266 3902 3776 2403 0425
c 010 011 010 006 001 0059
L 026 ab 011 b 000 b 163 a 035 0022
b = Total gas production (mlg OM) c = gas production rate (mlh) L = Lag time (h)
Model 1 Y = b + (1 ndash e-ct) Model 2 Y = b + (1 ndash e-c(t-L)) Superscripts are comparing across rows
The lag phase for oat hay was about 22 minutes and was not significantly affected by energy source The
greatest effect of forage substitution with energy sources was observed for wheat straw where all the energy
sources shortened the lag phase compared to the control treatment where wheat straw had a lag phase of
more than 2 hours In ryegrass treatment had no significant effect on lag phase but molasses tended to
decrease the lag phase In kikuyu the lag phase was significantly shortened when supplemented with citrus
pulp and molasses (P lt 005) while maize meal only tended to shorten the lag Hiltner amp Dehority (1983)
also found a decrease in lag times of fibre digestion when soluble carbohydrates were added to in vitro
incubations They concluded that the decrease in lag phase was due to an increase in bacteria numbers
helping with digestion as they found similar results when they increased the inoculum
The parameters presented in Table 36 (Model 2) were used to construct Figures 31 - 36 The data
presented in the figures represent total gas production including that of the energy sources
34
0
50
100
150
200
250
300
350
400
450
0 10 20 30 40 50 60 70 80
Gas
Pro
duct
ion
(mlg
OM
)
Time (hours)
Lucerne hay
Oat hay
Wheat straw
Ryegrass
Kikuyu grass
Figure 31 Gas production of forage substrates alone
Figure 31 show differences in fermentation characteristics of the different forages Variations in NDF ADL
and CP contents of these forages (Table 33) as well as different arrangements of their cell-wall
polysaccharides (Cheng et al 1984) are most likely responsible for different fermentation characteristics
observed between forage substrates The fermentation patterns of the forages are functions of the forage
type as well as the physiological stage at which they were harvested both of which affect their chemical
composition The grasses (ryegrass and kikuyu) were immature (28 days of re-growth) Lucerne and oat
hay were harvested at the 10 flowering stage while wheat straw was a mature forage As forages mature
their NDF and ADL contents increase (McDonald et al 2002) Wheat straw had the highest NDF and ADL
contents (Table 33) Although lucerne hay had a relatively low NDF content its ADL content was quite high
compared to kikuyu which had a fairly high NDF content but a low ADL content resulting in the early cut
grasses to manifest a much higher fermentability profile than the other forages Figure 31 clearly indicates
that wheat straw has a much lower fermentability both in terms of total gas production and rate of gas
production than the other forages Wheat straw also has a much longer lag phase compared to other
forages The lower fermentability and longer lag phase of wheat straw which is a mature forage can be
explained by the tissue content of wheat straw that is high in NDF and ADL (which is negatively correlated
with gas production) subsequently requiring more physical and chemical alterations before bacteria in the
rumen can start digestion The high rate and extent of gas production from both ryegrass and kikuyu can
also be observed (Figure 31) Apart from readily fermentable fibre these pasture grasses are also high in
nitrogen (Table 33) and total carbohydrates which are both needed for optimal growth of rumen micro-
organisms and thus fermentation (NRC 2001)
35
The effect of energy sources on the fermentation profiles of the different forages can be observed in Figures
32 - 36
0
50
100
150
200
250
300
350
400
450
0 10 20 30 40 50 60 70 80
Gas
Pro
duct
ion
(mlg
OM
)
Tme (hours)
Maize mealCitrus pulpMolassesControl
Figure 32 Gas production of lucerne hay when supplemented with different energy sources
Substituting 50 of the forages with an energy source improved gas production (Figures 32 - 36) probably
by boosting microbial growth Maize meal and citrus pulp had the biggest effect throughout Molasses is a
fast fermenting simple sugar (Hall 2002) which is rapidly utilized explaining the fast increase in gas
production followed by a plateau soon afterwards Maize meal and citrus pulp other than molasses are
more complex energy sources which ferment slower and are available over a longer period of time As
mentioned before wheat straw was a mature forage compared to ryegrass and kikuyu which were harvested
after only 28 days of re-growth while lucerne and oat hay were harvested at 10 flowering stage
Ryegrass lucerne and kikuyu are high in nitrogen (Table 33) Sufficient nitrogen ensures nitrogen-energy
coupling to occur at a greater extent thereby ensuring more efficient microbial fermentation and cellulose
degradation by rumen bacteria (NRC 2001) As forages mature the NDF and ADF contents increase and
CP (supplying nitrogen) decreases making less nitrogen readily available to rumen micro-organisms for
fermentation (Ghadaki et al 1975) This may explain why maize meal and citrus pulp had higher impacts
than molasses on gas production of the mature forages Citrus pulp and maize meal release energy at a
slower rate which match the slow release of nitrogen in mature forages Also even though small these
energy sources contributes rumen degradable protein (RDP) which with substrates like wheat straw (that
has very low CP content) could be quite substantial It should be kept in mind though that the gas
production profiles in these figures reflect the combination of forages and energy sources
36
0
50
100
150
200
250
300
350
400
450
0 10 20 30 40 50 60 70 80
Gas
Pro
duct
ion
(mlg
OM
)
Time (hours)
Maize mealCitrus pulpMolassesControl
Figure 33 Gas production of oat hay when supplemented with different energy sources
0
50
100
150
200
250
300
350
400
450
0 10 20 30 40 50 60 70 80
Gas
Pro
duct
ion
(mlg
OM
)
Time (hours)
Maize mealCitrus pulpMolassesControl
Figure 34 Gas production of wheat straw when supplemented with different energy sources
37
0
50
100
150
200
250
300
350
400
450
0 10 20 30 40 50 60 70 80
Gas
Pro
duct
ion
(mlg
OM
)
Time (hours)
Maize mealCitrus pulpMolassesControl
Figure 35 Gas production of ryegrass when supplemented with different energy sources
0
50
100
150
200
250
300
350
400
450
0 10 20 30 40 50 60 70 80
Gas
Pro
duct
ion
(mlg
OM
)
Time (hours)
Maize mealCitrus pulpMolassesControl
Figure 36 Gas production of kikuyu grass when supplemented with different energy sources
342 Gas production parameters including that of forage and energy sources in cases where no interaction was observed
In the cases where in vitro gas production parameters showed no interactions the main effects are
discussed Gas production values of the different forages (Models 1 amp 2) differed (P lt 005) from each other
38
independent of the energy source supplemented (Table 37) The NDF ADL and CP content of the forages
differed (Table 33) The differences in chemical and physical tissue structure probably influenced their
fermentation kinetic patterns (Figure 31) In Model 1 ryegrass resulted in higher gas productions than oat
hay wheat straw and lucerne but did not differ from kikuyu In Model 2 the same trend was seen for gas
production with kikuyu and ryegrass having higher values than lucerne oat hay and wheat straw The
reason for the higher gas production from ryegrass compared to lucerne wheat straw and oat hay are due to
the lower NDF and ADF contents of ryegrass resulting in higher gas production (Sallam 2005) Ryegrass
and kikuyu as mentioned before were harvested young compared to the other forages These pasture
grasses therefore had more rapidly fermentable sugar resulting in higher gas production values Ryegrass
and kikuyu are also high in CP (Table 33) which is essential for optimal rumen fermentation as it supplies
the rumen micro-organisms with nitrogen that is important for their growth Gas production rates differed for
among forages (P lt 005) irrespective of the energy source Ryegrass and lucerne had higher c values than
oat hay and wheat straw
Table 37 In vitro gas production parameters of forages as affected by energy sources as main effects in
cases where no interactions were observed Gas production of both energy sources and forage substrates
are included
Forage Item Lucerne
hay Oat hay Wheat
straw Ryegrass Kikuyu grass SEm P
Model 1
b 3381 ac 3438 ac 3205 a 4027 b 3909 bc 1457 lt0001
Model 2
b 3374 a 3431 a 3159 a 4016 b 4042 b 1439 lt0001
c 011 b 008 a 008 a 010 bc 009 ac 001 lt0001
b = Total gas production (mlg OM) c = gas production rate (mlh)
Model 1 Y = b + (1 ndash e-ct) Model 2 Y = b + (1 ndash e-c(t-L)) Superscripts are compared across rows
The total gas production values of forage substrates (Models 1 amp 2) differed (P lt 005) for each energy
source supplemented (Table 38) Maize meal and citrus pulp supplementations resulted in higher forage
gas production values than the control treatment (Model 1 amp 2) Maize meal tended to have higher gas
production than citrus pulp supporting the theory of Sallam (2005) that feedstuffs higher in NDF and ADF
content result in lower gas production Gas production rate (c) of the forages were all higher for the energy
source treatments than that of the control treatment (P lt 005) indicating the faster fermentation potential of
the energy sources The highest gas production rates were achieved when forages were supplemented with
citrus pulp and molasses irrespective of the forage substrate used Pectin substances other than starches
and sugars produce no lactic acid (Van Soest 1994) Pectin subsequently does not tend to lower the
rumen pH as much as sugars and starches thus sustaining optimal ruminal environments for cellulolytic
bacteria This could partly explain the better gas production rates of forages supplemented with citrus pulp
39
Table 38 In vitro gas production parameters of forages (irrespective of forage substrate used) as affected by
different energy sources as main effects in cases where no interactions were observed Gas production of
both energy sources and forage substrates are included
Energy source Item Maize meal Citrus pulp Molasses Control SEm P
Model 1
b 4079 b 3825 bc 3446 ac 3017 a 1303 lt0001
Model 2
b 4065 b 3821 bc 3446 ac 3085 a 1287 lt0001
c 009 b 011 c 011 c 006 a 000 lt0001
b = Total gas production (mlg OM) c = gas production rate (mlh)
Model 1 Y = b + (1 ndash e-ct) Model 2 Y = b + (1 ndash e-c(t-L)) Superscripts are compared across rows
343 Gas production excluding that from energy sources
Gas production values from the respective energy sources alone were obtained from separate fermentations
where forage substrates were omitted These values were subtracted from total gas production values
where forages and energy sources were incubated together to calculate the effect of energy sources on gas
production of the respective forage sources per se (Table 39)
When the maize meal gas production was deducted from the total gas production there was no difference
between the control and the maize meal supplemented treatments in any of the forages (Models 1 amp 2)
When molasses gas production was deducted from the total gas production however total gas production
from forages in the molasses supplemented treatments was lower than that of the control treatments in all
forage substrates irrespective of the model used In oat hay molasses lowered gas production more than in
any of the other treatments including the control treatment In oat hay and ryegrass (both models) and in
lucerne hay (Model 2) citrus pulp as energy source also decreased forage gas production compared to the
control treatment The lower gas production after energy sources gas production was deducted illustrate that
energy sources were the main reason for the higher gas production presented earlier in treatments with
forage and energy source combinations as substrates Gas production is negatively correlated with NDF
and ADL content (Sallam 2005) Energy sources had lower NDF and trace amounts of lignin content when
compared to forage substrates (Table 33) supporting the theory of higher gas production observed after
energy inclusions in the simulated dairy cow diets Energy sources per se thus seemed to increase the rate
of forage digestion but maintained or decreased the digestibility of forages Possible reasons for the lower
digestibility as determined by gas production can be because micro-organisms first attack the easily
fermentable energy sources before starting with fibre digestion
40
Deducting energy source gas production resulted in variable positive responses in terms of rate of gas
production from forage substrates In oat hay maize meal and citrus pulp treatments both improved c
compared to the control treatment (Models 1 amp 2) In kikuyu grass maize meal had a profound effect and
increased c when compared to the control treatment For the other forages (lucerne wheat straw and
ryegrass) deduction of the energy sources had no effect on fermentation rate
Deducting energy source gas production values indicated that treatment with energy sources affected the lag
phase differently for the different forages Lucerne hay oat hay and ryegrass had short lag phases which
were not affected by energy source Citrus pulp and maize meal however tended to increase the lag phase
of lucerne hay Similar results were obtained by Adesogan et al (2005) who found that maize and citrus
pulp resulted in a longer lag phase than hays (P lt 0001) The diet of the cows consisted predominantly of
oat hay lucerne hay and wheat straw The diet of donor cows thus had high proportions of cellulolytic micro-
organisms and less pectin-fermenting and amylolytic bacteria needed to colonize citrus pulp and maize meal
respectively explaining the longer lag phase of maize meal and citrus pulp (Adesogan et al 2005) Kikuyu
and wheat straw had long lag phases compared to the other forages All the energy sources significantly
shortened the lag phase of wheat straw and kikuyu
Table 39 Effects of maize meal citrus pulp and molasses as energy sources on fermentation kinetics of
different forage substrates as measured by in vitro gas production Gas production resulting from energy
sources was deducted from total gas production
Treatment
Item Maize meal Citrus pulp Molasses Control SEm P
Lucerne hay
Model 1
b 2293 ab 1974 ab 1789 b 2837 a 2063 0018
c 009 010 015 009 002 0103
Model 2
b 2192 ab 1959 b 1789 b 2836 a 1836 0008
c 012 011 015 009 002 0189
L 023 076 006 005 023 0166
Oat hay
Model 1
b 2842 ab 2367 b 1761 c 3283 a 1315 0001
c 008 b 010 b 004 a 004 a 001 0001
Model 2
b 2842 ab 2367 b 1761 c 3273 a 1317 0001
c 008 b 010 b 004 a 004 a 001 0001
L 000 000 000 017 007 0240
41
Table 39(continue) Effects of maize meal citrus pulp and molasses as energy sources on fermentation kinetics of different forage substrates as measured by in vitro gas production Gas production resulting from energy sources was deducted from total gas production
Wheat straw
Model 1
b 2108 ab 1903 ab 1510 b 2499 a 1657 0009
c 008 007 006 002 002 0110
Model 2
b 2108 ab 1903 ab 1510 b 2312 a 1559 0020
c 008 007 006 003 002 0168
L 000 b 000 b 000 b 229 a 036 0001
Ryegrass
Model 1
b 2845 ab 2429 b 2093 b 3995 a 291 0003
c 008 010 011 008 001 0324
Model 2
b 2835 ab 2419 b 2092 b 3983 a 2934 0004
c 009 010 011 009 001 0459
L 040 062 005 039 029 0588
Kikuyu grass
Model 1
b 2500 ab 2611 ab 2193 b 3349 a 2369 0028
c 012 b 010 ab 008 ab 005 a 001 0017
Model 2
b 2499 ab 2610 ab 2193 b 3243 a 2408 0050
c 012 b 010 ab 008 ab 005 a 002 0040
L 007 b 012 b 000 b 173 a 034 0009
b = Total gas production (mlg OM) c = gas production rate (mlh) L = Lag time (h)
Model 1 Y = b + (1 ndash e-ct) Model 2 Y = b + (1 ndash e-c(t-L)) Superscripts are compared across rows
Hiltner amp Dehority (1983) similarly found that the addition of soluble carbohydrates to in vitro incubations
decreased the lag time of fibre digestion They concluded that supplementation increased bacteria numbers
thus decreasing the lag phase by supporting fibre digestion They found similar results with increased
amounts of inoculum A possible reason for the long lag phase of kikuyu grass may be because it was
heavily fertilized with nitrogen Marais et al (1988) showed that nitrite derived from high nitrate pastures
resulted in reduced in vitro digestibility as it affected rumen microbial function The long lag phase of wheat
straw was probably due to the high NDF content which is slowly digested and the high ADL content which is
not digested by rumen micro-organisms The latter could also have an effect on the structure of the fibre
matrix making it more difficult for rumen organisms to reach the more digestible fibre fractions The short
lag phases of lucerne and oat hay could partially be explained by the fact that the cannulated cows received
diets containing these substrates but also because their chemical composition allows higher digestibility
compared to wheat straw In general it would appear that the supplementation of forages with various
42
energy sources had a negative effect on total gas production but increased the rate of gas production in
some instances
Profiles of forage fermentation after deduction of energy source values are illustrated in Figures 37 ndash 312
0
50
100
150
200
250
300
350
400
450
0 10 20 30 40 50 60 70 80
Gas
Pro
duct
ion
(mlg
OM
)
Time (hours)
Lucerne hayOat hayWheat strawRyegrassKikuyu grass
Figure 37 Gas production of forage substrates after gas production of energy sources has been deducted
Variations in fermentation patterns of different forages are illustrated in Figure 37 All the forages differed in
terms of gas production lag phase and gas production rate This is probably due to differences in their cell-
wall polysaccharide arrangements (Cheng et al 1984) as well as NDF ADL and CP composition (Table
33) It is clear that wheat straw has a much lower fermentability both in terms of total gas production and
rate of gas production than the other forages As forages mature their NDF and ADL contents increase
(McDonald et al 2002) Wheat straw had the highest NDF and ADL contents (Table 33) The NDF and
ADF contents of diets are negatively correlated with gas production (Sallam 2005) which would explain the
lower gas production of wheat straw in comparison with the other forages Wheat straw is also very low in
CP (Table 33) Crude protein provides rumen micro-organisms with nitrogen needed for optimal growth and
fermentation Ryegrass and kikuyu show a high rate and extent of gas production maybe due to the lower
NDF and ADL and higher CP contents as compared to wheat straw Although lucerne hay had a relatively
low NDF content its ADL content was quite high compared to kikuyu which had a higher NDF content but a
low ADL content resulting in the early cut grasses to manifest a much higher fermentability profile than the
other forages
43
0
50
100
150
200
250
300
350
400
450
0 10 20 30 40 50 60 70 80
Gas
Pro
duct
ion
(mlg
OM
)
Time (hours)
Maize meal
Citrus pulp
Molasses
Control
Figure 38 The net effect of energy supplements on gas production of lucerne hay
0
50
100
150
200
250
300
350
400
450
0 10 20 30 40 50 60 70 80
Gas
Pro
duct
ion
(mlg
OM
)
Time (hours)
Maize mealCitrus pulpMolassesControl
Figure 39 The net effect of energy supplements on gas production of oat hay
44
0
50
100
150
200
250
300
350
400
450
0 10 20 30 40 50 60 70 80
Gas
Pro
duct
ion
(mlg
OM
)
Time (hours)
Maize meal
Citrus pulpMolassesControl
Figure 310 The net effect of energy supplements on gas production of wheat straw
0
50
100
150
200
250
300
350
400
450
0 10 20 30 40 50 60 70 80
Gas
Pro
duct
ion
(mlg
OM
)
Time (hours)
Maize mealCitrus pulpMolassesControl
Figure 311 The net effect of energy supplements on gas production of ryegrass
45
0
50
100
150
200
250
300
350
400
450
0 10 20 30 40 50 60 70 80
Gas
Pro
duct
ion
(mlg
OM
)
Time (hours)
Maize mealCitrus pulpMolassesControl
Figure 312 The net effect of energy supplements on gas production of kikuyu grass
In many of these figures the control clearly did not reach a plateau in the 72 hour incubation period This
enforces the findings that the energy sources increased the rate of gas production especially during the
earlier parts of the incubation
344 Gas production parameters excluding that of energy sources in cases where no interaction was observed
The in vitro gas parameters that showed no interactions were interpreted in terms of main effects Gas
production values from the energy sources were deducted from the total gas production to derive forage gas
production values (Table 310) It can be seen that the gas production values of the forage substrates
differed (P lt 005) from each other independent of the deducted energy source (Models 1 amp 2) Gas
production resulting from wheat straw differed from ryegrass oat hay and kikuyu but not from lucerne (both
models) The higher gas production of ryegrass and kikuyu compared to wheat straw results from the
higher NDF and ADF contents of wheat straw which negatively affected its gas production (Sallam 2005)
Rate of gas production (c) also differed (P lt 005) between forages independent of energy source (Model 2)
Oat hay and wheat straw had lower c-values than ryegrass and lucerne but did not differ from kikuyu The
lower gas production rate of wheat straw and oat hay can be due to the maturity of these forages These
forages contain less readily fermentable substrates and more NDF and ADL compared to immature ryegrass
and kikuyu cut at 28 days of re-growth
46
Table 310 In vitro gas production parameters of forages as affected by energy sources as main effects in
cases where no interactions were observed Gas production resulting from energy sources was deducted
from total gas production
Forage
Item Lucerne hay Oat hay Wheat
straw Ryegrass Kikuyu grass
SEm P
Model 1
b 2223 ab 2563 bc 2005 a 2840 c 2663 c 1068 lt0001
Model 2
b 2194 ab 2561 bc 1959 a 2832 c 2636 c 1047 lt0001
c 012 b 007 a 006 a 010 b 009 ab 001 lt0001
b = Total gas production (mlg OM) c = gas production rate (mlh)
Model 1 Y = b + (1 ndash e-ct) Model 2 Y = b + (1 ndash e-c(t-L)) Superscripts are compared across rows
The effect of energy source treatment on forage fermentation is presented in Table 311 Energy sources
differed in terms of total gas produced by forages as a group It appeared that deduction of gas production
resulting from energy supplementation lowered total gas production of forages when either of the two models
was used Molasses resulted in the lowest total gas production from forages With Model 2 all the energy
sources increased the rate of fermentation of forage substrates but no differences occurred between energy
sources The increase in fermentation rates might suggest that energy supplementation does not
necessarily result in lower fibre digestion as observed by Mertens amp Loften (1980) by reducing their
fermentation rates (Miller amp Muntifering 1985) The increase in rate of gas production of forages after
energy sources substitution may be due to their higher nutrient content and easier accessibility of the energy
sources chemical constitutes to rumen microbial enzymes (Arigbede et al 2006)
Table 311 In vitro gas production parameters of forages (irrespective of forage substrate used) as affected
by different energy sources as main effects in cases where no interactions were observed Gas production
resulting from energy sources was deducted from total gas production
Energy source
Item Maize meal Citrus pulp Molasses Control SEm P
Model 1
b 2518 b 2257 b 1869 c 3193 a 955 lt0001
Model 2
b 2495 b 2251 b 1869 c 3130 a 937 lt0001
c 010 b 010 b 009 b 006 a 001 lt0001
b = Total gas production (mlg OM) c = gas production rate (mlh)
Model 1 Y = b + (1 ndash e-ct) Model 2 Y = b + (1 ndash e-c(t-L)) Superscripts are compared across rows
47
35 Conclusion
Forage diets alone do not provide in the high energy requirements of lactating cows Lactating cows
produce large quantities of milk which can only be maintained if forage diets are supplemented with
concentrates Supplementation of dairy cow diets with optimal amounts of energy substrates provide the
high producing dairy cow with energy needed to improve fibre digestibility and utilization Energy improves
the total digestibility of a diet when forages are supplemented with energy sources but decreases the
utilization of the forage component per se Possible reasons for the latter could be the structure of the fibre
matrix making it more difficult for rumen organisms to reach the more digestible fractions in forages thereby
digesting first the easily fermentable energy sources before attacking the more complex fibre fractions It
should be noted however that overfeeding of energy supplements increase the risks of acidosis due to the
production of large amounts of lactic acid subsequently lowering milk production and income
Looking at the individual forage fermentation kinetics irrespective of the energy source used it is evident
that the pasture grasses had higher total gas production values than the straw and hays This is most likely
because the pasture grasses were cut after only 28 days of re-growth whereas the hays and straw were
more mature and of lower quality especially the straw The pasture grasses thus had more readily
fermentable nutrients and less NDF and ADL than the hays and straw leading to higher gas production
values The fermentation rate of the forages supplemented with energy sources differed amongst each
other with lucerne and ryegrass having the fastest fermentation rates irrespective of the energy source
supplemented Gas production of forages supplemented with citrus pulp and maize meal were higher
compared to molasses Molasses produced a greater volume of gas during the first few hours of incubation
but it was also quickly depleted due to its high content of readily fermentable sugars These sugars are
highly soluble and rumen micro-organisms have easy access to induce fermentation The gas production
rate of forages supplemented with energy sources was higher than the control treatments (forages alone)
with molasses and citrus pulp resulting in the highest rates It thus seemed that supplementation of energy
sources improved forage fermentability as well as the rate of forage fermentation This could have major
implications in practice as there is a need to find ways of improving fibre utilization in South Africa
The effect of the energy sources on the fermentation kinetics of different forages per se showed a decrease
in gas production and lag phase but a tendency to raise gas production rate Molasses decreased gas
production the most throughout all the forage substrates A possible reason may be that the rumen micro-
organisms first digest the fast fermentable simple sugar substrates before starting with substrates that are
digested at a slower rate The raise in gas production rate and decrease in lag time may be due to a higher
number of rumen micro-organisms available to ferment the feed when energy sources were added to the
forage substrates thus supporting digestion
Little research has been done on this and related topics to quantify the relationship between different
carbohydrate sources and rumen metabolism parameters leaving room for improvement and further studies
More research is also needed with regard to inclusion levels of different energy sources in lactating cow diets
and the potential outcomes regarding milk production and rumen health
48
36 References
Adesogan T Krueger NK amp Kim SC 2005 A novel wireless automated system for measuring
fermentation gas production kinetics of feeds and its application to feed characterization Anim Feed
Sci Technol 123 - 124(1) 211 - 223
Aldrich JM Muller LD amp Varga GA 1993 Nonstructural carbohydrates and protein effects on rumen
fermentation nutrient flow and performance of dairy cows J Dairy Sci 76 1091 - 1105
Allen M amp Oba M 2000 Getting more milk from forages Michigan Dairy Review 5(4) Michigan State
University
Available at
httpwwwadmanicomalliancedairyTechBulletinsNon20Structural20Carbohydrate20Nutrition
htm
(Accessed 5 August 2008)
ANKOM 2005 Method for determining acid detergent lignin in beakers ANKOM Technology 0805
AOAC 1990 Official Methods of Analysis (15th Ed) Association of Official Analytical Chemists Inc
Arlington Virginia USA
AOAC 1995 Official Methods of Analysis (15th Ed) Association of Official Analytical Chemists Inc
Washington DC USA
Arigbede OM Anele UY Olanite JA Adekunle IO Jolaosho OA amp Onifade OS 2006 Seasonal in
vitro gas production parameters of three multi - purpose tree species in Abeokuta Nigeria Livestock
Res Rural Dev 18(10) Article 142
Available at httpwwwcipavorgcolrrdlrrd1810arig18142htm
(Accessed 14 October 2008)
Bampidis VA amp Robinson PH 2006 Citrus by-products as ruminant feeds A review Anim Feed Sci
Technol 128 175 - 217
Cheng KJ Stewart CS Dinsdale D amp Costeron JW 1984 Electron bacteria involved in the digestion
of plant cell walls Anim Feed Sci Technol 10 93 - 120
Chesson A amp Forsberg C W 1988 Polysaccharide degradation by rumen micro-organisms In The
Rumen Microbial Ecosystem Ed Hobson PN Elsevier Science Publishers Ltd London UK pp 251
- 284
49
Ghadaki MB Van Soest PJ McDowell RE amp Malekpour B 1975 Chemical composition and in vitro
digestibility of some range forage species of Iran In Proceedings of the sem Bamako 2 - 3 March
Bamako Mali
Available at httpwwwfaoorgwairdocsilrix5543bx5543b0zhtm
(Accessed 17 October 2008)
Giraldo LA Tejido ML Ranilla MJ amp Carro MD 2008 Effect of exogenous fibrolytic enzymes on in
vitro rumen fermentation of substrates with different forageconcentrate ratios Anim Feed Sci
Technol 141 306 - 325
Goosen L 2004 Effect of an exogenous fibrolytic enzyme on forage digestibility parameters MSc (Agric)
thesis Stellenbosch University Stellenbosch South Africa pp 1 - 91
Haddad SG amp Grant RJ 2000 Influence of nonfiber carbohydrate concentration on forage fiber digestion
in vitro Anim Feed Sci Technol 86 107 - 115
Hall MB 2002 Working with sugars (and molasses) In Proceedings of the 13th Annual Florida Ruminant
Nutrition Symp Jaunary 11 - 12 Gainesville Florida USA pp 146 - 158
Hiltner P amp Dehority A 1983 Effect of soluble carbohydrates on digestion of cellulose by pure
cultures of rumen bacteria Appl Environ Microbiol 46 542
Larson CC 2003 The effect of nonfibre carbohydrate source and protein degradability on lactation
performance of holstein cows MSc (Agric) thesis University of Florida Gainesville Florida USA pp
1 - 108
Leiva E Hall MB amp Van Horn HH 2000 Performance of dairy cattle fed citrus pulp or corn products as
sources of neutral detergent-soluble carbohydrates J Dairy Sci 83 2866 - 2875
Marais JP Therion JJ Mackie RI Kistner A amp Dennison C 1988 Effect of nitrate and its reduction
products on the growth and activity of the rumen microbial population Brit J Nutr 59 301 - 313
Mauricio RM Mould FL Dhanoa MS Owen E Channa KS amp Theodorou MK 1999 A semi-
automated in vitro gas production technique for ruminants feedstuff evaluation Anim Feed Sci
Technol 79 321 - 330
McDonald P Edwards RA Greenhalgh JFD amp Morgan CA 2002 Evaluation of food Digestibility In
Animal Nutrition (6th Ed) Pearson Education Ltd Edinburgh Gate Harlow Essex UK pp 246 - 263
Mertens DR 1997 Creating a system for meeting the fibre requirements of dairy cows J Dairy Sci 80
1463 - 1481
50
Mertens DR amp Loften JR 1980 The effect of starch on forage fiber digestion kinetics in vitro J Dairy Sci
63 1437 - 1446
Miller BG amp Muntifering RB 1985 Effect of forageconcentrate on kinetics of forage fiber digestion in
vitro J Dairy Sci 68 40 - 44
Mohney K 2002 Synchronization of carbohydrate and protein metabolism by ruminal microbes in
continuous culture PhD thesis North Carolina State University Raleigh North Carolina USA pp 1 -
69
National Research Council (NRC) 2001 Nutrient requirements of dairy cattle (7th Rev Ed) National
Academy Press Washington DC USA pp 34 - 35
Sallam SMA 2005 Nutritive value assessment of the alternative feed resources by gas production and
rumen fermentation in vitro Res J Agric amp Biol Sci 1(2) 200 - 209
Schwarz FJ Haffner J amp Krichgessner M 1995 Supplementation of zero-grazed dairy cows with
molassed sugar beet pulp maize or cereal-rich concentrate Anim Feed Sci Technol 54 237 - 248
Solomon R Chase LE Ben-Ghedalia D amp Bauman DE 2000 The effect of nonstructural carbohydrate
and addition of full fat soybeans on the concentration of conjugated linoleic acid in milk fat of dairy
cows J Dairy Sci 83 1322 - 1329
Sommart K Parker DS Wanapat M amp Rowlinson P 2000 Fermentation characteristics and microbial
protein synthesis in an in vitro system using cassava rice straw and dried ruzi grass as substrates
Asian-Aust J Anim Sci 13 1084 - 1093
Statistica 81 2008 StatSoft Inc USA
Van Soest PJ 1994 Nutritional ecology of the ruminant (2nd Ed) Cornell University Press Ithaca New
York USA pp 251 - 252
Van Soest PJ amp Robertson JB 1985 Analysis of forages and fibrous feeds A laboratory manual for
animal science 613 Cornell University Ithaca New York USA
Van Soest PJ Robertson JB amp Lewis BA 1991 Methods for dietary fibre neutral detergent fibre and
nonstarch polysaccharides in relation to animal nutrition J Dairy Sci 74 3583 - 3587
Oslashrskov ER amp McDonald P 1979 The estimation of protein degradability in the rumen from incubation
measurements weighed according to rate of passage J Agric Sci 92 499 - 503
51
Chapter 4
THE EFFECT OF SUGAR STARCH AND PECTIN AS MICROBIAL
ENERGY SOURCES ON IN VITRO NEUTRAL DETERGENT FIBRE
AND DRY MATTER DEGRADABILITY OF FORAGES
Abstract
The study evaluated the effect of sugar (molasses and sucrose) starch (maize meal and maize starch) and
pectin (citrus pulp and citrus pectin) on neutral detergent fibre (NDF) and dry matter (DM) degradability of
forages Forage substrates used included wheat straw (WS) oat hay (OH) lucerne hay (LUC) ryegrass
(RYE) and kikuyu grass (KIK) Rumen fluid was collected from two lactating Holstein cows receiving a diet
consisting of oat hay lucerne wheat straw and a concentrate mix In vitro degradability was done with an
ANKOM Daisy II incubator and forage substrates were incubated with or without the respective energy
sources for 24 48 and 72 hours The substrates were incubated in 1076 ml buffered medium 54 ml of
reducing solution and 270 ml rumen fluid The residues were washed dried and analyzed for NDF In the
trial with the applied energy sources (molasses maize meal and citrus pulp) there was forage x energy
source interactions Supplementation with the applied energy sources all improved DMD of forages (24 amp 72
hours) when compared to the control treatment except for RYE supplemented with maize meal and citrus
pulp at 24 hours Molasses had the biggest effect on DMD in all forage substrates Supplementation with
maize meal had no effect on neutral detergent fibre degradability (NDFD) of any forage substrate except for
an improvement in NDFD of LUC at 72 hours Molasses improved NDFD of LUC at 24 hours but had no
effect on the other forage substrates Citrus pulp improved NDFD of OH (72 hours) as well as LUC and WS
(24 amp 72 hours) It is postulated that the NDF of the energy sources was more digestible than that of the
respective forages and that the improved NDFD values could be ascribed to the contribution of the energy
source NDFD Overall pasture grasses had a higher NDFD than the hays and straw and appear to be more
readily fermentable by rumen micro-organisms than the low quality hays and straw explaining the higher
NDFD In the trial involving the purified energy sources (sucrose maize starch and citrus pectin) forage x
energy source interactions were observed In general supplementation with these energy sources improved
DMD at 24 and 72 hours except for RYE and KIK (72 hours) Pasture grasses (RYE amp KIK) had a higher
NDFD than LUC OH and WS At 72 hours NDFD was 371 for LUC 425 for OH and 403 for WS
compared to 705 for KIK and 649 for RYE A possible explanation is that KIK and RYE samples came
from freshly cut material harvested after a 28d re-growth period In general sucrose (24 amp 72 hours) and
citrus pectin (72 hours) had no effect on NDFD of forage substrates Supplementing oat hay (24 hours) with
starch and citrus pectin and wheat straw (24 amp 72 hours) with starch however lowered NDFD (P lt 005)
when compared to the control treatment It is hypothesized that micro-organisms fermented the easily
fermentable energy sources first before attacking forage NDF The study suggested that forage NDFD
values are not fixed and may be altered by type of energy supplementation
52
41 Introduction
The production potential of ruminants is determined to a great extent by the availability and quality of
forages Lactating dairy cows depend significantly on forages to maintain optimal fermentation rumen
function and high production However the ability of rumen micro-organisms to degrade forages is restricted
by the chemical composition and physical quality of the forage (Mertens 1997) Forages alone also do not
provide all the energy requirements of a high producing dairy cow (Schwarz et al 1995) Supplementing
dairy cow diets with energy-rich feeds provide high yielding dairy cows with the energy needed to improve
efficiency of production and performance (Henning 2004) The most important source of energy and largest
nutrient component for rumen micro-organisms is carbohydrates (especially non-fibre carbohydrates or
NFC)
It is important to try and find ways to improve forage degradation Improvement of forage utilization and
degradation will aid in animal performance (Giraldo et al 2008) Forage based diets supplemented with NFC
(sugar starch or pectin) result in variation of performance measurements such as milk yield milk
composition dry matter intake (DMI) and feed efficiency (Larson 2003) Miron et al (2002) reported that
cows receiving total mixed rations (TMR) with a high percentage of citrus pulp had higher NDF and NSC
digestibilities compared to cows that received TMR with a high percentage of corn Leiva et al (2000)
reported that the rumen pH declined more rapidly on citrus diets (pectin) than on hominy (starch) diets and
also reached the lowest pH point faster Knowledge of the individual (as well as a combination of NFC)
fermentation characteristics can thus be helpful in predicting an animalrsquos performance due to NFC
supplementation (Holtshausen 2004)
The objectives of this study were to determine the impact of three applied energy sources viz maize meal
molasses syrup and citrus pulp and three purified energy sources viz maize starch sucrose and citrus
pectin on dry matter (DM) and neutral detergent fibre (NDF) digestibility of different forage substrates
Forages commonly used in dairy cow diets (wheat straw oat hay lucerne hay kikuyu grass and ryegrass)
were used
42 Materials and methods
421 Study area
The study to evaluate the effect of supplementing forage based diets with sugar starch and pectin on DM
and NDF degradability was conducted at the Stellenbosch University Stellenbosch South Africa
(33deg 55prime 12Prime S 18deg 51prime 36Prime E)
53
422 Simulated diets
4221 Basal forages
Five forages (Table 41) were used to prepare rations to simulate diets for lactating dairy cows
Table 41 Forages used in simulation diets for lactating dairy cows
Forage Type Acronym
Wheat straw (Triticum aestivum ) WS
Oat hay (Avena sativa) OH
Lucerne hay (Medicago sativa) LUC
Ryegrass (Lolium multiflorum ) RYE
Kikuyu grass (Pennisetum clandestinum) KIK
Rye and kikuyu grasses were harvested after four weeks of re-growth All the forages were oven dried at
60ordmC for 72 hours Wheat straw oat hay and lucerne hay were ground (cyclotec 1093 mill) through a 2 mm
screen Rye and kikuyu grasses were obtained from Outeniqua experimental farm (33deg 57prime 0Prime S
22deg 25prime 0Prime E) just outside George South Africa (33deg 58prime 0Prime S 22deg 27prime 0Prime E) The rye and kikuyu grasses were
already ground through a 1 mm screen when received
4222 Energy supplements
Three energy sources (Table 42) were selected as supplements to prepare rations that would simulate
lactating dairy cow diets
Table 42 Applied energy sources used in simulating the dairy cow diets
Energy type Source Acronym
Starch Yellow maize (Zea mays) meal Mm
Sugar Molasses syrup Mol
Pectin Citrus pulp Cp
These energy feedstuffs were sourced in the following forms molasses as a syrup by-product from the
processing of sugar cane (Officinarum saccharum) citrus pulp as a finely granulated residue by-product from
the peel pulp and seeds of oranges and grapefruit and yellow maize grain The citrus pulp and maize were
ground (cyclotec 1093 mill) through a 1 mm screen
Three purified energy sources (Table 43) were selected as supplements to prepare rations that would
simulate lactating cow diets
54
Table 43 Purified energy sources used in simulating the dairy cow diets
Energy type Source Acronym
Starch Maize starch Maiz
Sugar Sucrose Suc
Pectin Citrus pectin Pec
4223 Defining the diets
A total of 43 simulated diets were prepared
bull 5 diets contained forage substrates only (Table 41)
bull 3 diets contained applied energy sources only (Table 42)
bull 15 diets contained a mixture of forages and applied energy sources
bull 5 diets contained forage substrates only (Table 41)
bull 15 diets contained a mixture of forages and purified energy sources
The final substrate compositions are indicated in Tables 45 and 46
423 Chemical analyses of forages and energy sources
About 1 g of each forage type as well as 1 g of the energy sources were weighed and placed in a 100ordmC
conventional oven for 24 hours to determine DM content (AOAC 1995 Method 93015) Organic matter
(OM) was determined by weighing 1 g of each type of feedstuff used into crucibles and ashing the content at
500ordmC in a muffle furnace for 6 hours (AOAC 1995 Method 94205)
The NDF component was determined by measuring 05 g of each feedstuff into F57 ANKOM fibre analysis
bags The bags were heat sealed and NDF determined using the method of Van Soest et al (1991)
Sodium sulfite (Na2SO3) was added to the NDF solution during digestion and heat-stable amylase was
added during rinsing Ether extract was determined using the AOAC method (AOAC 1995 Method 92039) About 2 g of ground sample was weighed into a thimble The samples were then extracted with diethyl ether
(C4H10O)
Acid detergent lignin (ADL) was determined by measuring 05 g of each basal forage and 05 g of maize
meal and citrus pulp into separate F57 ANKOM fibre analysis bags The bags were heat sealed and acid
detergent fibre (ADF) was determined using the method of Van Soest et al (1991) The ADF residue was
then soaked in 72 sulphuric acid for three hours to dissolve the cellulose Acid detergent lignin was
determined using the ANKOM method (ANKOM 2005)
55
Total nitrogen content was determined with a Leco Nitrogen Gas Analyzer custom designed and built by
LECO Africa (Pty) Ltd (Kempton Park) About 01 g of sample was weighed into a small piece of aluminum
foil The samples were then ignited inside the Leco furnace at about 900degC using the Dumas procedure
(AOAC 1990 Method 96806) Crude protein (CP) was calculated by multiplying nitrogen content with 625
(AOAC 1995 Method 99003)
Table 44 Chemical composition (gkg DM plusmn SD) of forages and energy sources used in the trial All values
are on a DM basis
Sources DM OM NDF CP EE ADL
WS 9150plusmn05 9022plusmn16 8179plusmn71 723plusmn10 36plusmn05 1022plusmn30
OH 8504plusmn23 9403plusmn173 7819plusmn110 910plusmn12 97plusmn08 825plusmn03
LUC 8989plusmn20 9062plusmn18 5153plusmn10 2370plusmn46 81plusmn06 927plusmn67
RYE 938plusmn10 845plusmn05 4892plusmn30 2509plusmn27 431plusmn01 448plusmn181
KIK 1242plusmn104 1122plusmn01 6512plusmn20 2534plusmn41 283plusmn11 480plusmn17
mm 8559plusmn09 9844plusmn13 1743plusmn550 1071plusmn02 377plusmn04 70plusmn06
cp 8799plusmn09 9285plusmn07 2614plusmn140 786plusmn18 164plusmn04 253plusmn64
mol 6980plusmn19 8927plusmn06 ND ND ND ND
DM = dry matter OM = organic matter NDF = neutral detergent fibre CP = crude protein EE = ether
extract ADL = acid detergent lignin ND = not determined WS = wheat straw OH = oat hay LUC = lucerne
RYE = ryegrass KIK = kikuyu grass mm = maize meal cp = citrus pulp mol = molasses
Purified energy sources were 99 pure based on manufacturers analyses
424 Sample preparation
Small fibre analysis bags were used (F57 ANKOM Technology) The bags were pre-rinsed in acetone for
five minutes air dried and placed in a conventional oven at 100ordmC for three to four hours The diets were
constituted as shown in Tables 45 46 and 47 The total amount of substrate was based on a forage to
concentrate ratio of 5050 The substrate amount of the energy sources in Table 45 was calculated to
provide the same amount of metabolizable energy (ME) contained in 025 g DM of yellow maize meal For
calculation purposes the ME values were assumed to be 139 MJkg DM for maize 123 MJkg for molasses
and 122 MJkg for citrus pulp (NRC 2001)
56
Table 45 Substrate samples containing either forage or applied energy supplements
Forage type Energy source Forage (g DM) Energy (g DM)
Wheat straw - 0250 -
Oat hay - 0250 -
Lucerne hay - 0250 -
Ryegrass - 0250 -
Kikuyu grass - 0250 -
- Maize meal - 0250
- Citrus pulp - 0285
- Molasses - 0282
The amount of energy sources used in the composite substrates (Table 46) was calculated to provide the
same amount of ME contained in 0125 g DM of yellow maize meal (139 MJMEkg)
Table 46 Composite diets containing forage and applied energy sources
Forage type Energy source Forage (g DM) Energy (g DM)
Wheat straw Maize meal 01250 01250
Wheat straw Citrus pulp 01250 01425
Wheat straw Molasses 01250
01412
Oat hay Maize meal 01250 01250
Oat hay Citrus pulp 01250 01425
Oat hay Molasses 01250
01412
Lucerne hay Maize meal 01250 01250
Lucerne hay Citrus pulp 01250 01425
Lucerne hay Molasses 01250
01412
Ryegrass Maize meal 01250 01250
Ryegrass Citrus pulp 01250 01425
Ryegrass Molasses 01250
01412
Kikuyu grass Maize meal 01250 01250
Kikuyu grass Citrus pulp 01250 01425
Kikuyu grass Molasses 01250 01412
The amount of purified energy sources (Table 47) was based on suggestions by Holtshausen (2004) who
used starch pectin and sucrose at hexose equivalent amounts of 40 80 or 120 mg per 120 mg purified NDF
in in vitro incubations
57
Table 47 Diets containing forages alone or a mixture of forages and purified energy sources Amounts are
on an air dry basis
Forage type Energy source Forage (g) Energy (g)
Wheat straw - 0500 -
Oat hay - 0500 -
Lucerne hay - 0500 -
Ryegrass - 0500 -
Kikuyu grass - 0500
-
Wheat straw Maize starch 0500 0163
Wheat straw Citrus pectin 0500 0192
Wheat straw Sucrose 0500
0137
Oat hay Maize starch 0500 0152
Oat hay Citrus pectin 0500 0178
Oat hay Sucrose 0500
0127
Lucerne hay Maize starch 0500 0160
Lucerne hay Citrus pectin 0500 0189
Lucerne hay Sucrose 0500
0135
Ryegrass Maize starch 0500 0162
Ryegrass Citrus pectin 0500 0191
Ryegrass Sucrose 0500
0137
Kikuyu grass Maize starch 0500 0161
Kikuyu grass Citrus pectin 0500 0190
Kikuyu grass Sucrose 0500 0136
In the current study a hexose equivalent amount of 40 mg of each energy source per 120 mg of forage
substrate was used Since 500 mg (air dry) of each forage substrate was weighed out into the incubation
bags in the current study the hexose equivalent of the energy sources amounted to 167 mg DM
To calculate the actual amount of energy source DM the following conversion coefficients were used (based
on Holtshausen 2004)
bull 090 for maize starch
bull 114 for citrus pectin
bull 095 for sucrose
58
The DM content of the energy sources were taken into account when calculating the air dry amounts that
were finally weighed out into the bags (Table 47)
Blank bags were included to correct for residues from rumen fluid alone All bags were heat-sealed using an
impulse sealer after sample preparation
425 Preparation of in vitro medium and reducing solution
The incubation medium was prepared as described by Van Soest amp Robertson (1985) The medium
consisted of micro minerals macro-mineral solution buffer solution tryptose rezasurin and distilled water
The medium was kept in a water bath at 395ordmC The pH of the medium was about 78 Reducing solution
was prepared as described by Van Soest amp Robertson (1985) and consisted of cysteine hydrochloride
(C3H7NO2HCL) potassium hydroxide (KOH) pellets sodium sulfide nonahydrate (Na2S9H2O) and distilled
water
426 Collection and preparation of rumen fluid Rumen fluid was collected from two ruminally cannulated lactating dairy cows The cows were confined and
fed 25 kg (as is) of a diet (125 kg in the mornings and 125 kg in the evenings) consisting of oat hay lucerne
hay wheat straw and a concentrate mix Rumen fluid was squeezed through two layers of cheesecloth into
pre-warmed flasks and a small amount of coarse material was added The rumen fluid was then blended in
a pre-warmed blender at a low speed for 10 seconds The rumen fluid was then filtered through four layers
of cheesecloth into pre-warmed flasks while flushing with carbon dioxide (CO2) The temperature of the
rumen fluid averaged 38ordmC and the pH averaged 58
427 In vitro incubation
The in vitro procedure for the ANKOM Daisy incubations required four glass vessels (2 L) and is based on
the method described by Goering amp Van Soest (1970) The glass vessels were flushed with CO2 while
adding 1076 ml of incubation medium and 54 ml of reducing solution to each vessel The vessels were
closed and placed in the incubator at 395ordmC until the medium was clear The vessels were opened and
flushed with CO2 while adding 270 ml of rumen fluid and bags to the vessels Incubation periods were 24
and 72 hours At each time interval one vessel was removed and the residue bags washed with water air-
dried and then placed in a conventional oven at 100ordmC for 24 hours
59
428 Residue analysis
The NDF content of the residues in the bags was determined using an ANKOM fibre machine (ANKOM220
fibre analyzer) and was based on the method of Van Soest et al (1991) Sodium sulfite (20 g) was added to
19 L of NDF solution during digestion and heat-stable amylase (4 ml x 2 rinse) was added during rinsing
Before using the bags they were rinsed in acetone for three to five minutes and then air-dried before being
placed in a forced draft oven at 100ordmC for 24 hours After the NDF procedure the bags were dried weighed
and subsequently ashed in a muffle furnace at 500ordmC for 6 hours
429 Estimating dry matter degradability
The estimation of DM degradability of the substrates was based on DM disappearance and calculated in
Excel using the following equation (Van Soest et al 1991)
( )[ ] 1001002
113 timestimesminus
minus=W
CWWDMD Equation 5
Where DMD = Apparent DM degradability ()
W1 = Bag weight (mg)
W2 = Sample weight (mg DM)
W3 = Weight of dried bag and residue after incubation (mg DM)
C1 = Blank bag correction factor
4210 Estimating neutral detergent fibre degradability
The estimation of NDF degradability of the substrates was based on NDF disappearance and was
calculated in Excel using the following equation (Van Soest et al 1991)
( )[ ]100100
2
113 timestimesminus
minus=W
CWWNDF Equation 6
60
Where NDF = Apparent NDF degradability ()
W1 = Bag weight (mg)
W2 = Sample weight (mg NDF in DM)
W3 = Dried weight of bag with residue after incubation (mg NDF in DM)
C1 = Blank bag correction factor
43 Statistical analyses
The in vitro digestibility experiment was a three way cross classification and the data was subjected to a
factorial ANOVA with the three factors being forage energy and time using Statistica 81 (2008) This was
done for all the non-linear parameters Significant forage x energy interactions were observed for the non-
linear parameters Therefore a one-way ANOVA was done on each of the forages to determine the effect of
the energy sources Differences between means were determined using a Tukey test Significance was
declared at P lt 005
44 Results and discussion
441 Effect of maize meal citrus pulp and molasses on apparent in vitro dry matter degradability
Results of the in vitro dry matter degradability (DMD) trial are presented in Table 48 Unsupplemented
forage values clearly indicate that ryegrass and kikuyu are more digestible than lucerne hay oat hay and
wheat straw This can be attributed to the fact that pasture grasses were cut after only 28 days of re-growth
thus having more digestible nutrients compared to lucerne and oat hay which were harvested at the 10
flowering stage and wheat straw at maturity With maturity the NDF and ADL contents increase (Table 44)
and DMD decreases (Canbolat et al 2006) When forage substrates were supplemented with applied
energy sources a forage x energy source interaction was observed When maize meal citrus pulp and
molasses replaced 50 of the forage substrates DMD was increased (P lt 001) in all forage substrates
(after 24 and 72 hours of incubation) with molasses having the biggest effect throughout It should be kept
in mind that the energy sources as such were all more degradable than the forages and therefore it could be
expected that a 50 replacement of forages with energy sources would increase total substrate DMD The
increase in DMD of forage substrates could thus be due to increased stimulation of rumen micro-organisms
in response to the readily available energy supplied by energy sources
61
Table 48 Effects of maize meal citrus pulp and molasses as energy sources on in vitro dry matter
degradability (DMD) parameters of different forage substrates
Treatment
Item Maize meal Citrus pulp Molasses Control
SEm
P
Lucerne hay
DMD 24h 707 b 731 b 832 c 565 a 159 lt0001
DMD 72h 829 b 825 b 858 c 690 a 044 lt0001
Oat hay
DMD 24h 637 b 676 bc 739 c 442 a 153 lt0001
DMD 72h 773 b 788 bc 820 c 588 a 080 lt0001
Wheat straw
DMD 24h 602 b 627 b 710 c 383 a 092 lt0001
DMD 72h 721 b 744 bc 778 c 510 a 089 lt0001
Ryegrass
DMD 24h 796 a 835 ab 901 b 760 a 212 0003
DMD 72h 926 b 934 b 964 b 877 a 095 lt0001
Kikuyu grass
DMD 24h 802 b 806 b 886 c 695 a 188 lt0001
DMD 72h 915 b 923 b 953 b 867 a 098 lt0001
Superscripts are compared across rows
The biggest effect of energy supplementation occurred with wheat straw as also reported in the gas
production experiments (Chapter 3) Wheat straw was high in NDF and ADL (Table 44) Neutral detergent
fibre is slowly degraded by rumen micro-organisms whereas ADL are not degraded by rumen micro-
organisms explaining the lower DMD of wheat straw when compared to the other forages Supplementing
readily available energy sources would therefore have a greater impact on DMD of wheat straw compared to
other forages Molasses had the highest impact on wheat straw DMD during the early phases of incubation
(24 hours) but after 72 hours the effect of molasses and citrus pulp was similar
In lucerne hay molasses had the highest impact on DMD at 24 and 72 hours incubation but citrus pulp and
maize meal also improved DMD significantly In oat hay maize meal citrus pulp and molasses improved
DMD at 24 and 72 hours incubation with molasses also having the most noticeable effect (P lt 001) Fall et
al (1998) also found improvements in DMD of straws supplemented with molasses In contrast to results
obtained in this study Williams et al (1953) found that addition of starch to oat hay diets of sheep decreased
DMD by one to two percentage units Burroughs et al (1949) observed a 5 ndash 12 reduction in lucerne hay
DMD when the diet was supplemented with 60 starch Mould amp Orskov (1983) however concluded that
62
the decrease in DMD of hays are mainly due to reduced rumen pH and not directly related to starch
digestion Abrupt changes in cattle diets (forage to concentrate diets) decrease rumen pH resulting in an
overgrowth of starch fermenting bacteria which causes acute acidosis with devastating effects on production
(Owens et al 1998) Cellulolytic bacteria are also inhibited at low rumen pH values decreasing fibre
digestion (Russel amp Wilson 1996)
In ryegrass molasses was the only energy source that improved DMD after 24 hours incubation Simeone
et al (2004) found similar results and reported that neither ground nor whole maize meal had an effect on
ryegrass DMD Ryegrass and kikuyu are highly fermentable forages as was also observed in terms of total
gas production and rate of gas production (Chapter 3) Molasses which is also rapidly fermentable had the
largest influence on DMD of pasture grasses at 24 hours probably because of its high fermentation rates
(Chapter 3) and because it is free of NDF and does not have trace amounts of lignin (Table 44) Overall
however all the energy sources improved DMD of ryegrass and kikuyu to the same extent at 72 hours
442 Effect of maize meal citrus pulp and molasses on apparent in vitro neutral detergent fibre degradability
The effects of sugar (molasses) starch (maize meal) and pectin (citrus pulp) on in vitro apparent NDF
degradability (NDFD) of different forages and forage-energy source combinations are shown in Table 49
Unsupplemented pasture grasses harvested at 28 days of re-growth had a higher NDFD than the mature
forages The NDFD of mature forages ranged between 197 and 284 which is too low to sustain
production and hence the need for energy supplementation Ryegrass and kikuyu was lower in NDF and
ADL (Table 44) and had greater gas production volumes (above 320 mlg OM Chapter 3) compared to the
other forages (ranging between 229 and 297 mlg OM) A negative correlation between ADL content and
NDFD of forage substrates have been reported by Smith et al (1972) and Tomlin et al (1964)
When forage substrates were supplemented with applied energy sources a forage x energy source
interaction was observed When energy sources replaced 50 of the forage substrates 24 hours NDFD of
lucerne hay was significantly increased by citrus pulp and molasses Hall (2002a) however postulated that
molasses decreases fibre digestion when fed in large quantities After 72 hours both maize meal and citrus
pulp resulted in increased NDFD Contrary to this observation Mertens amp Loften (1980) reported that starch
decreased the potential extent of fibre digestion These results (Mertens amp Loften 1980) however confirm
our findings obtained in the gas production experiments (Chapter 3) namely that maize meal tended to
increase the lag time of lucerne hay The lack of response of molasses at 72 hours could be due to its rapid
fermentation rate (Chapter 3) and also to the fact that molasses does not have any NDF (Table 44) that
could contribute to NDFD Maize meal and especially citrus pulp however contain some NDF that is readily
digestible
63
Table 49 Effects of maize meal citrus pulp and molasses as energy sources on in vitro neutral detergent
fibre degradability (NDFD) parameters when incubated in combination with different forage substrates
Treatment
Item Maize meal Citrus pulp Molasses Control
SEm
P
Lucerne hay
NDFD 24h 230 ab 296 b 300 b 197 a 219 0014
NDFD 72h 503 b 541 b 414 a 403 a 126 lt0001
Oat hay
NDFD 24h 300 356 289 284 222 0138
NDFD 72h 522 ab 579 b 509 a 472 a 139 lt0001
Wheat straw
NDFD 24h 196 a 285 b 249 ab 247 ab 171 0024
NDFD 72h 437 a 509 b 421 a 403 a 163 0003
Ryegrass
NDFD 24h 522 599 571 501 249 0059
NDFD 72h 775 822 843 748 242 0063
Kikuyu grass
NDFD 24h 516 561 624 530 424 0326
NDFD 72h 794 826 837 795 205 0368
Superscripts are compared across rows
Apparent NDFD of oat hay was not affected by energy source after 24 hours incubation but with citrus pulp
longer incubations (72 hours) resulted in higher NDFD (P lt 001) probably due to a relative high digestibility
of citrus pulp NDF Miron et al (2002) obtained similar positive results on NDFD of forages when maize or
barley was replaced with citrus pulp Voelker amp Allen (2003) proposed that the optimal rate and extent of
NDFD of high concentrate diets can be achieved by using dried beet pulp instead of high moisture corn
Heldt et al (1999) found that supplementing low-quality tallgrass-prairie hay with degradable intake protein
and NFC increased the total tract NDFD but supplementation with NFC alone decreased NDFD
Citrus pulp was the only energy source that consistently improved apparent NDFD when incubated in
combination with the hays and straw Citrus pulp had significant positive effects on NDFD of these forages
probably because mature forages are slowly degradable and citrus pulp supplementation thus provided high
amounts of digestable fibre at both 24 hours and 72 hours incubations The degradation rate of citrus pulp
possibly synchronizes the release of nutrients with the requirements of fibrolytic bacteria Increased NDFD is
important as it increases the supply of energy and support microbial N production (Allen amp Oba 2000)
64
resulting in higher milk production and reduced rumen fill in lactating dairy cows (Dado amp Allen 1995)
Bampidis amp Robinson (2006) stated that citrus pulp might be a good supplement to dairy cow diets as it
improves NDFD and has less negative effects on rumen pH and cellulolytic activities compared to sugar and
starch
Energy sources had no effect on apparent NDFD of kikuyu and ryegrass possibly because these pasture
grasses was immature and thus high in soluble readily available energy In the gas production experiments
(Chapter 3) these pasture grasses also had higher gas production volumes than the mature forages It
would thus appear given the high nutrient content in these forages that energy supplementation would have
minimal effects on NDFD
None of the energy source and forage combinations had lower NDFD values than the forages alone
contrary to Sanson et al (1990) who reported that the supplementation of low-quality forages with rapidly
degradable NFC depressed NDFD Grant amp Mertens (1992) suggested that acidification of the rumen due
to fast ruminal NFC fermentation is a prime factor responsible for depression in fibre digestion
443 Effect of maize starch citrus pectin and sucrose on apparent in vitro dry matter degradability
The effect of purified energy sources viz sugar (sucrose) starch (maize starch) and pectin (citrus pectin) on
in vitro apparent DMD of different forages are shown in Table 410 When forage substrates were
supplemented with purified energy sources a forage x energy source interaction was observed In lucerne
hay only pectin resulted in an improved DMD (both at 24 hours and 72 hours) while in oat hay all the
energy sources improved DMD at both incubation times Carey et al (1993) reported similar improvements
in DMD of brome hay (in situ) when it was supplemented with maize and beet pulp In contrast Burroughs et
al (1949) reported that DMD of lucerne was reduced when forages were supplemented with 20 and 40
starch In wheat straw all the energy sources improved DMD but at 24 hours pectin and sucrose had a
bigger effect than starch Pectin and sucrose are more fermentable than starch hence the more visible
effect on DMD of slow degradable wheat straw forages At 72 hours pectin also improved DMD more than
starch
Ryegrass and kikuyu had high DMD values without supplementation The higher DMD of pasture grasses
was most likely because they were immature at harvesting whereas lucerne and oat hay were cut at the
10 flowering stage and wheat straw was harvested at maturity Immature pasture grasses were thus
higher in fast fermentable sugars and lower in NDF and ADL (Table 44) improving DMD and gas production
volumes (Chapter 3) Only sucrose was sufficient in improving DMD in these grasses and then only at 24
hours due to their very high fermentability The absence of a sucrose effect at 72 hours was probably
because sucrose was depleted before 72 hours as it is rapidly fermented in the early hours of incubation
Purified energy sources are all more degradable than forages and therefore it could be expected that
inclusion of these energy sources in forage diets will increase DMD In general purified energy sources
resulted in lower DMD when compared to the applied energy sources (Table 48) We can postulate that
65
there was a rapid decline in rumen pH with purified energy source supplementation (as these energy sources
has no NDF) resulting in higher lactic acid production and slower microbial growth hence the lower DMD
Table 410 Effects of maize starch citrus pectin and sucrose as energy sources on in vitro dry matter
degradability (DMD) parameters of different forage substrates
Treatment
Item Maize starch Citrus pectin Sucrose Control
SEm
P
Lucerne hay
DMD 24h 642 ab 687 b 660 ab 593 a 182 0021
DMD 72h 745 ab 773 b 746 ab 673 a 203 0025
Oat hay
DMD 24h 476 b 512 b 504 b 377 a 096 lt0001
DMD 72h 638 b 658 b 644 b 552 a 116 lt0001
Wheat straw
DMD 24h 449 b 508 c 520 c 348 a 080 lt0001
DMD 72h 591 b 643 c 617 bc 510 a 094 lt0001
Ryegrass
DMD 24h 769 ab 768 ab 771 b 708 a 147 0026
DMD 72h 884 862 875 847 185 0548
Kikuyu grass
DMD 24h 681 ab 684 ab 709 b 634 a 150 0027
DMD 72h 859 826 843 808 213 0408
Superscripts are compared across rows
444 Effect of maize starch citrus pectin and sucrose on apparent in vitro neutral detergent fibre degradability
Purified energy source supplementation on in vitro apparent NDFD of the different forage substrates are
illustrated in Table 411 As was the case with DMD an energy source x forage interaction was observed for
NDFD Purified energy sources have negligible amounts of NDF thus the NDFD was solely from forages
In the control diets it is evident that the immature pasture grasses had the highest NDFD probably as they
are low in NDF and ADL (Table 44)
With lucerne hay energy supplementation had no significant effect on NDFD while in oat hay starch and
pectin supplementation suppressed NDFD but only at 24 hours incubation (P = 0011) Sucrose had no
66
effect on NDFD of oat hay at 24 hours Hall (2002a) proposed that in general sucrose tends to decrease
fibre digestion when fed in large quantities probably due to its lowering effect on rumen pH Heldt et al
(1999) reported that NFC supplementation to low-quality tallgrass-prairie decrease NDFD agreeing with our
results
Table 411 Effects of maize starch citrus pectin and sucrose as energy sources on in vitro neutral
detergent fibre degradability (NDFD) parameters of different forage substrates
Treatment
Item Maize starch Citrus pectin Sucrose Control
SEm
P
Lucerne hay NDFD 24h 123 197 178 179 277 0305
NDFD 72h 353 319 366 371 218 0364
Oat hay
NDFD 24h 131 b 137 b 174 ab 202 a 138 0011
NDFD 72h 389 395 406 425 201 0608
Wheat straw
NDFD 24h 116 b 171 a 239 c 205 ac 126 lt0001
NDFD 72h 343 b 402 a 393 a 403 a 140 0032
Ryegrass
NDFD 24h 419 401 392 403 186 0781
NDFD 72h 687 a 556 b 620 ab 649 ab 236 0013
Kikuyu grass
NDFD 24h 353 329 419 437 293 0068
NDFD 72h 714 a 573 b 687 ab 705 ab 324 0033
Superscripts are compared across rows
Sucrose had no effect on NDFD of wheat straw while pectin had a negative effect and starch severely
suppressed NDFD at both incubation times (P lt 005) The severe suppression in NDFD after
supplementation of maize starch can result from the negative effect that starch has on rumen pH Sucrose
and starch ferment rapidly producing lactic acid a product that lowers rumen pH whereas pectin does not
produce lactic acid (Hall 2002b) Starch has shown to decrease rumen pH and affect cellulolytic activity in
the rumen thereby lowering fibre digestion and increasing the risks of acidosis (Mertens amp Loften 1980)
Heldt et al (1999) reported similar results and found that starch decreased fibre digestion more than sugar
This is also in agreement with Vallimont et al (2004) who found that by replacing starch with sugar
incrementally in a continuous culture system fibre digestion was increased
67
Ryegrass and kikuyu NDFD was not affected at 24 hours by energy supplementation Pasture grasses are
high in rapidly fermentable sugars especially when harvested young as was the case with ryegrass and
kikuyu (28 days re-growth) Supplementation with energy sources would thus have a much smaller effect on
these forages compared to mature forages
45 Conclusion
Forage based diets that constitute mainly of mature forages are deficient in energy and therefore cannot
support growth and production in ruminant animals Lactating dairy cows have high energy requirements for
milk production Supplementation of lactating dairy cow diets with concentrates which are high in energy
can thus not be over-emphasized Supplementation with optimal amounts of energy substrates provide the
high producing dairy cow with energy needed to improve fibre digestibility and utilization It must however
be kept in mind that incorrect feeding and large amounts of energy substrates (especially starch and sugar)
increase the risks of ruminal acidosis due to the production of large quantities of lactic acid which
subsequently reduces milk production and profitability
Results obtained from this study proved that supplementation of applied as well as purified energy sources
have positive effects on DMD of forages Supplementing forages with 50 of the applied energy sources
improved DMD of all forages significantly Purified energy sources improved DMD of the hays and straws
significantly These forages are mature and thus have less soluble readily fermentable energy sources in
their tissue compared to ryegrass and kikuyu With the applied energy sources molasses tended to have
the biggest effect on DMD In general however the applied energy sources had a greater influence on
DMD probably because they do not tend to lower rumen pH as much as purified energy sources
The effect of applied energy sources on NDFD showed similar positive results The energy sources
improved NDFD of the total hay and straw substrates significantly These forages are high in NDF and ADL
which lowers NDFD It must also be kept in mind that these energy sources also contain various amounts of
NDF Subsequently substitution with energy sources (low in NDF and ADL) lowered the cell wall content of
the substrate thereby improving NDFD Citrus pulp had the greatest effect on all forages NDFD probably
due to its highly digestible NDF content The energy sources however had no effect on kikuyu grass and
ryegrass because these grasses were lower in NDF and ADL content and high in available sugars Purified
energy sources in contrast tended to decrease NDFD of all the forages The negative effect on NDFD
when supplementing with purified energy sources may be because fermentation of these energy sources by
rumen micro-organisms may result in a depletion of available nitrogen needed by micro-organisms to
ferment the slowly digestible fibre in forages (Heldt et al 1999) Another reason may be due to the fact that
these energy sources lower the rumen fluid pH due to large amounts of lactic acid production (especially by
sucrose and starch) thus decreasing the activity of cellulolytic and hemicellulolytic enzymes needed for fibre
digestion (Hoover amp Miller-Webster 1998) Another reason may be that rumen micro-organisms first attack
the readily fermentable energy sources before attaching to the forage substrates thereby decreasing the
rate of NDFD
68
It must be emphasized that when supplementing dairy cow diets with large amounts of energy sources it is
of utmost importance to provide adequate amounts of effective fibre to ensure a healthy rumen as well as
enough RDP to provide in the rumen microorganismrsquos nitrogen requirements In vitro experiments that show
the effects of supplementing poor quality roughage (such as wheat straw) with RDP or non-protein nitrogen
(NPN would also be useful in further studies as the limiting nutrient in wheat straw is nitrogen Nitrogen in
turn is needed for energy-nitrogen coupling to take place and improve microbial growth Not much research
has also been done to quantify the relationship between different carbohydrate sources and rumen
metabolism parameters leaving room for improvement and further studies
46 References
Allen M amp Oba M 2000 Getting more milk from forages Michigan Dairy Review 5(4) Michigan State
University
Available at
httpwwwadmanicomalliancedairyTechBulletinsNon20Structural20Carbohydrate20Nutrition
htm
(Accessed 5 August 2008)
ANKOM 2005 Method for Determining Acid Detergent Lignin in Beakers ANKOM Technology 0805
AOAC 1990 Official Methods of Analysis 15th edition Association of Official Analytical Chemists Arlington
Virginia
AOAC 1995 Official Methods of Analysis 15th edition Association of Official Analytical Chemists
Washington DC USA
Bampidis VA amp Robinson PH 2006 Citrus by-products as ruminant feeds A review Anim Feed Sci
Technol 128 175 - 217
Burroughs W Gerlaugh WP Edington BH amp Bethke RM 1949 The influence of corn starch upon
roughage digestion in cattle J Anim Sci 8 271
Canbolat O Kamalak A Ozkan CO Erol A Sahin M Karakas E amp Ozkose E 2006 Prediction of
relative feed value of alfalfa hays harvested at different maturity stages using in vitro gas production
Livestock Res Rural Dev 18(2) Article 27
Available at httpwwwcipavorgcolrrdlrrd182canb18027htm
(Accessed 18 October 2008)
Carey D A Caton J S amp Biondini M 1993 Influence of energy source on forage intake digestibility in
situ forage degradation and ruminal fermentation in beef steers fed medium-quality brome hay J
Anim Sci 71 2260 - 2269
69
Dado RG amp M S Allen 1995 Intake limitations feeding behaviour and rumen function of cows
challenged with rumen fill from dietary fiber or inert bulk J Dairy Sci 78 118 - 133
Fall ST Cisseacute M Ditaroh D Richard D Ndiaye NS amp Diaw B 1998 In vivo nutrient digestibility in
sheep and rumen dry matter degradability in cattle fed crop by-product based diets J Anim Feed
Sci 7 171 - 185
Goering HK Van Soest PJ 1970 Forage Fiber Analysis (apparatus reagents procedures and some
applications) In Agriculture Handbook No 379 Agriculture Research Service United States
Department of Agriculture Washington USA
Giraldo LA Tejido ML Ranilla MJ amp Carro MD 2008 In press Effect of exogenous fibrolytic
enzymes on in vitro rumen fermentation of substrates with different forage concentrate ratios Anim
Feed Sci Technol 141 306 - 325
Grant RJ amp Mertens DR 1992 Development of buffer systems for pH control and evaluation of pH
effects on fiber digestion in vitro J Dairy Sci 75 1581 - 1587
Hall MB 2002a Working with Non-NDF carbohydrates with manure evaluation and environmental
considerations In Proc Mid-South Ruminant Nutrition Conference Texas A amp M University Texas
USA pp 37 - 48
Available at httpwwwtxancorgproceedings2002Non-NDF20Carbohydratespdf
(Accessed 20 October 2008)
Hall MB 2002b Working with sugars (and molasses) In Proceedings of the 13th Annual Florida Ruminant
Nutrition Symp January 11 - 12 Gainesville Florida USA pp 146 - 158
Heldt JS Cochran GL Stokka GL Farmer CG Mathis CP Titgemeyer EC amp Nagaraja TG
1999 Effects of different supplemental sugars and starch fed in combination with degradable intake
protein on low-quality forage use by beef steers J Anim Sci 77 2793 - 2802
Henning P 2004 Acidosis in high-producing ruminants - myth or menace Animal Feed Manufacturers
Association (AFMA) South Africa pp 1 - 9
Available at httpwwwengormixcome_articles_viewaspart=529ampAREA=GDC
(Accessed 5 Augustus 2008)
Holtshausen L 2004 Effect of nonfibre carbohydrates on product yield and fibre digestion in fermentations
with mixed ruminal microbes PhD thesis University of Florida Gainesville Florida USA pp 1 - 33
Hoover WH amp Miller-Webster TK 1998 Role of sugar and starch in ruminal fermentation Tri-State Dairy
Nutrition Conference Michigan State University pp 1 - 16
70
Larson CC 2003 The effect of nonfiber carbohydrate source and protein degradability on lactation
performance of Holstein cows pp 1 - 108 MSc (Agric) thesis University of Florida Gainesville
Florida USA pp 1 - 108
Leiva E Hall MB amp Van Horn HH 2000 Performance of dairy cattle fed citrus pulp or corn products as
sources of neutral detergent-soluble carbohydrates J Dairy Sci 83 2866 - 2875
Mertens DR 1997 Creating a system for meeting the fiber requirements of dairy cows J Dairy Sci 80
1463 - 1481
Mertens DR amp Loften JR 1980 The effect of starch on forage fiber digestion kinetics in vitro J Dairy Sci
63 1437 - 1446
Miron J Yosef E Ben-Ghedalia D Chase LE Bauman DE amp Solomon R 2002 Digestibility by dairy
cows of monosaccharide constituents in total mixed rations containing citrus pulp J Dairy Sci 85 89 -
94
Mould F L amp Orskov E R 1983 Manipulation of rumen fluid pH and its influence on cellulolysis in sacco
dry matter degradation and the rumen microflora of sheep offered either hay or concentrate Anim
Feed Sci Technol 10 1 - 14
National Research Council (NRC) 2001 Nutrient requirements of dairy cattle (7th Rev Ed) National
Academy Press Washington DC USA pp 34 - 35
Owens FN Secrist DS Hill WJ amp Gill DR 1998 Acidosis in cattle a review J Anim Sci 76 275 -
286
Russel JB amp Wilson DB 1996 Why are ruminal cellulolytic bacteria unable to digest cellulose at low pH
J Dairy Sci 79 1503 - 1509
Sanson DW Clanton DC Rush IG 1990 Intake and digestion of low-quality meadow hay by steers
and performance of cows on native range when fed protein supplements containing various levels of
corn J Anim Sci 68 595 - 603
Schwarz FJ Haffner J amp Krichgessner M 1995 Supplementation of zero-grazed dairy cows with
molassed sugar beet pulp maize or cereal-rich concentrate Anim Feed Sci Technol 54 237 - 248
Simeone A Beretta V Rowe J Nolan J Elizalde JC amp Baldi F 2004 Rumen fermentation in
Hereford steers grazing ryegrass and supplemented with whole or ground maize In Proceedings of
the 25th Biennial Conference of the Australian Society of Animal Production 4 - 8 July University of
Melbourne Victoria Australia 25 168 - 171
71
Smith LW Goering HK amp Gordon CH 1972 Relationships of forage composition with rates of cell wall
digestion and indigestibility of cell walls J Dairy Sci 55 1140
Statistica 81 2008 StatSoft Inc USA
Tomlin DC Johnson RR amp Dehority BA 1964 Relationship of lignification to in vitro cellulose
digestibility of grasses and legumes J Anim Sci 23 161
Vallimont JE Bargo F Cassidy TW Luchini ND Broderick GA amp Varga GA 2004 Effects of
replacing dietary starch with sucrose on ruminal fermentation and nitrogen metabolism in continuous
culture J Dairy Sci 87 4221 - 4229
Van Soest PJ amp Robertson JB 1985 Analysis of forages and fibrous feeds A laboratory manual for
animal science 613 Cornell University Ithaca New York USA
Van Soest PJ Robertson JB amp Lewis BA 1991 Methods for dietary fiber neutral detergent fiber and
nonstarch polysaccharides in relation to animal nutrition J Dairy Sci 74 3583 - 3587
Voelker JA amp Allen MS 2003 Pelleted beet pulp substituted for high-moisture corn effect on rumianl
fermentation pH and microbial protein efficiency in lactating dairy cows J Dairy Sci 86 (11) 3562 -
3570
Williams VJ Rottle MC Moir RJ amp Underwood EJ 1953 Ruminal flora studies in the sheep IV The
influence of varying dietary levels of protein and starch upon digestibility nitrogen retention and the
free microorganisms of the rumen Aust J Biol Sci 6 142
72
Chapter 5
GENERAL CONCLUSION
The constant availability of high quality forages remains a problem in South Africa The efficiency of forage
utilization by ruminants is limited by several chemical and physical properties of forages including a high
fibre content and relative low energy content The primary components of fibre are cellulose hemicellulose
and lignin Supplementing dairy cow diets with concentrates such as sugar starch and pectin has the
potential to improve animal performance by improving the degradability of forage feedstuffs
Results from the current study suggested that the in vitro methods used were sufficient to indicate not only
that forages differ in terms of fermentability and digestibility but also to show that different energy sources
affect fermentation and digestion patterns of forages in different ways
The first study indicated that molasses per se may have a negative effect on total forage fermentability (as
determined by gas production) while citrus pulp may have a negative effect on the fermentability of certain
forages in this case oat hay and ryegrass Maize meal did not affect forage fermentability as measured by
total gas production The study also suggested that citrus pulp and maize meal may increase the
fermentation rate of oat hay while maize may also increase the fermentation rate of kikuyu The lag phase
of wheat straw and kikuyu fermentation may be shortened by all the energy sources investigated viz maize
meal molasses and citrus pulp It was concluded from the first study that forage fermentability is affected
differently by different energy sources These observations may have significant effects in practice on
rumen health and milk production and the data obtained can potentially be used as guide lines in feed
formulations
In the second study it was shown that different energy sources had different effects on in vitro NDF
digestibility (NDFD) of forages In general sucrose (after 24 and 72 hours of incubation) and pectin (72
hours) had no effect on NDFD of forage substrates The supplementation of oat hay with starch and pectin
(24 hours) and wheat straw with starch (24 and 72 hours) however lowered NDFD when compared to the
control treatment It is hypothesized that micro-organisms fermented the easily fermentable energy sources
first before attacking forage NDF The study suggested that forage NDF degradation values are not fixed
and may be altered by energy supplementation
Understanding the interactions that exist between rumen pH forages and NFC fractions used in dairy cow
rations will help when formulating diets for lactating dairy cows Knowledge of these concepts will aid in
formulating diets that will ensure optimal NDFD milk yield and milk composition without causing ruminal
health problems Papers focusing on the topic of the effect of energy sources on forage digestibility and
comparisons between in vivo and in vitro trials are limited and more research are needed in this regard
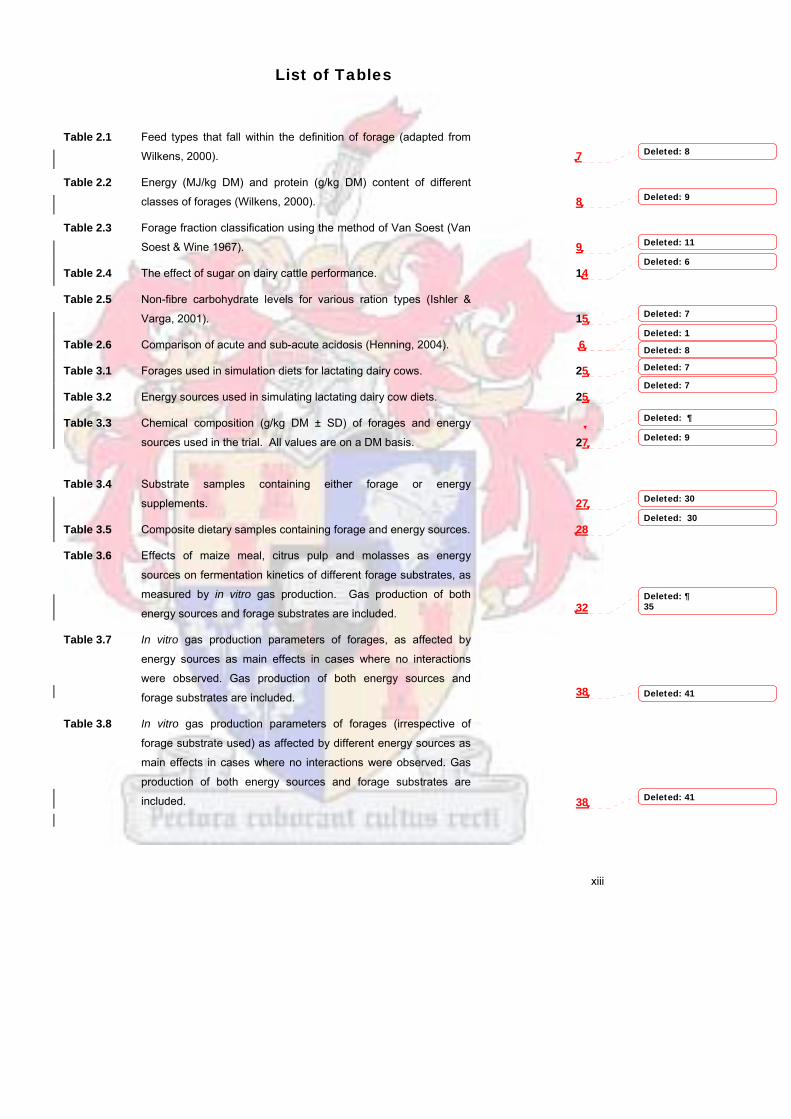


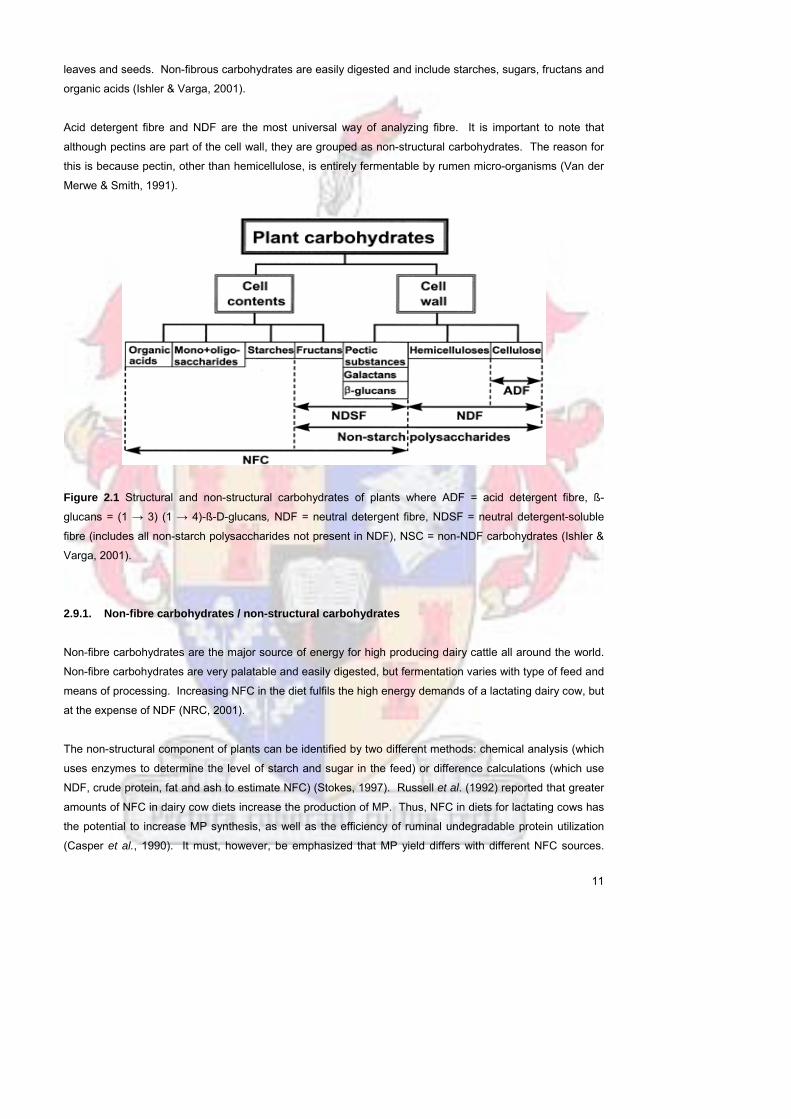
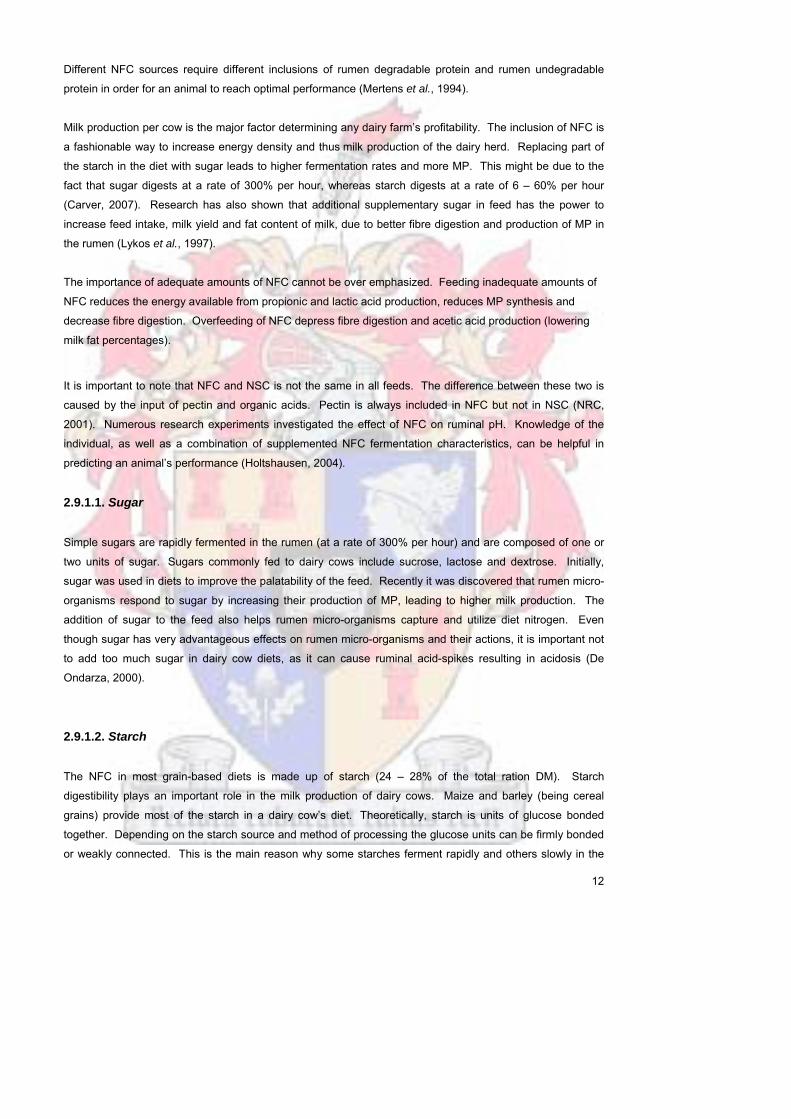

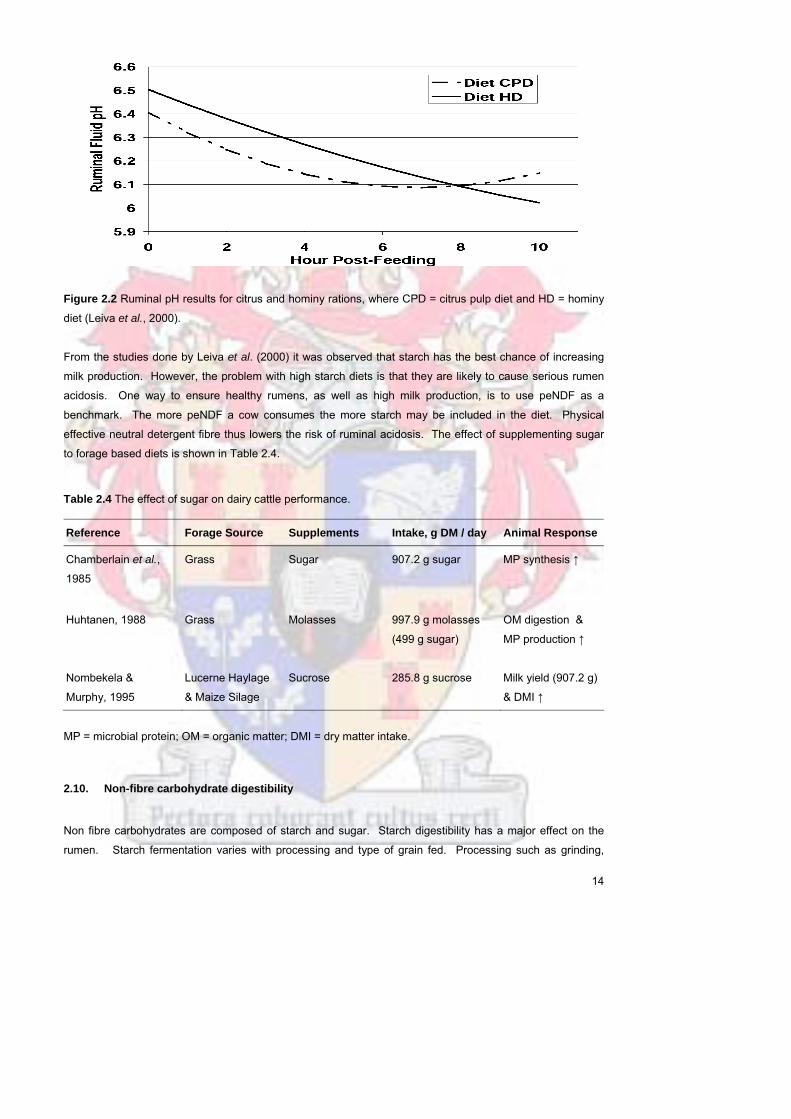

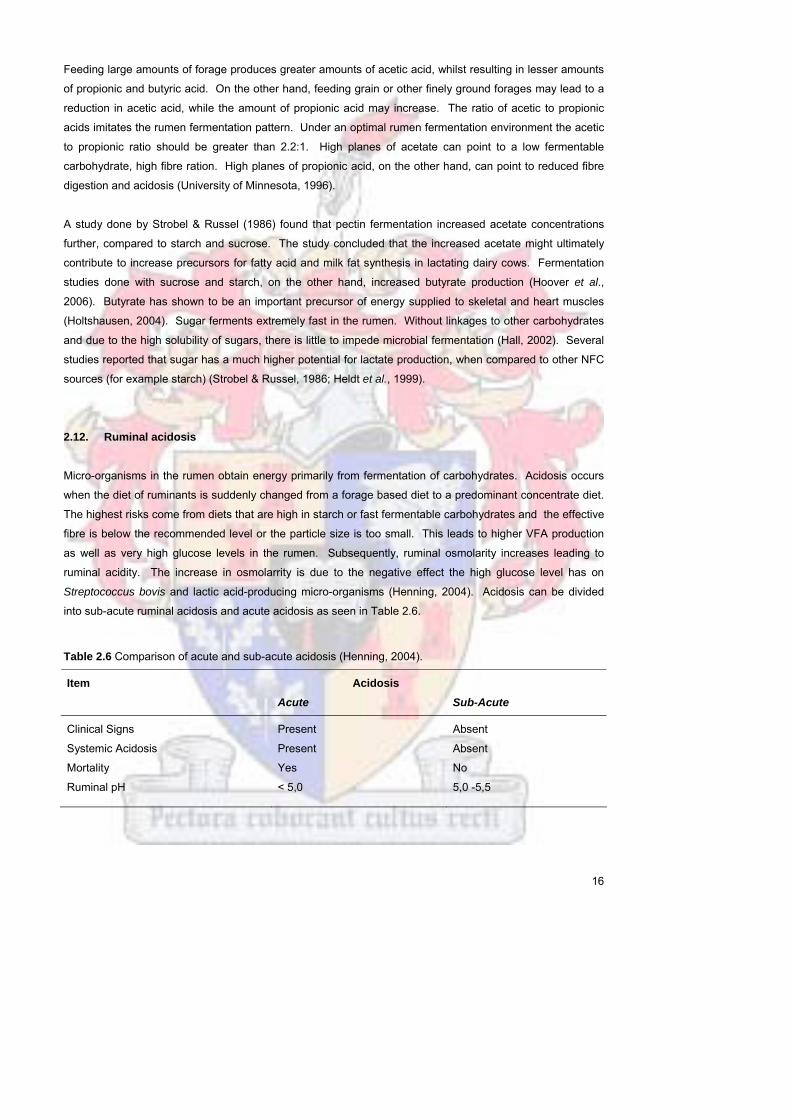


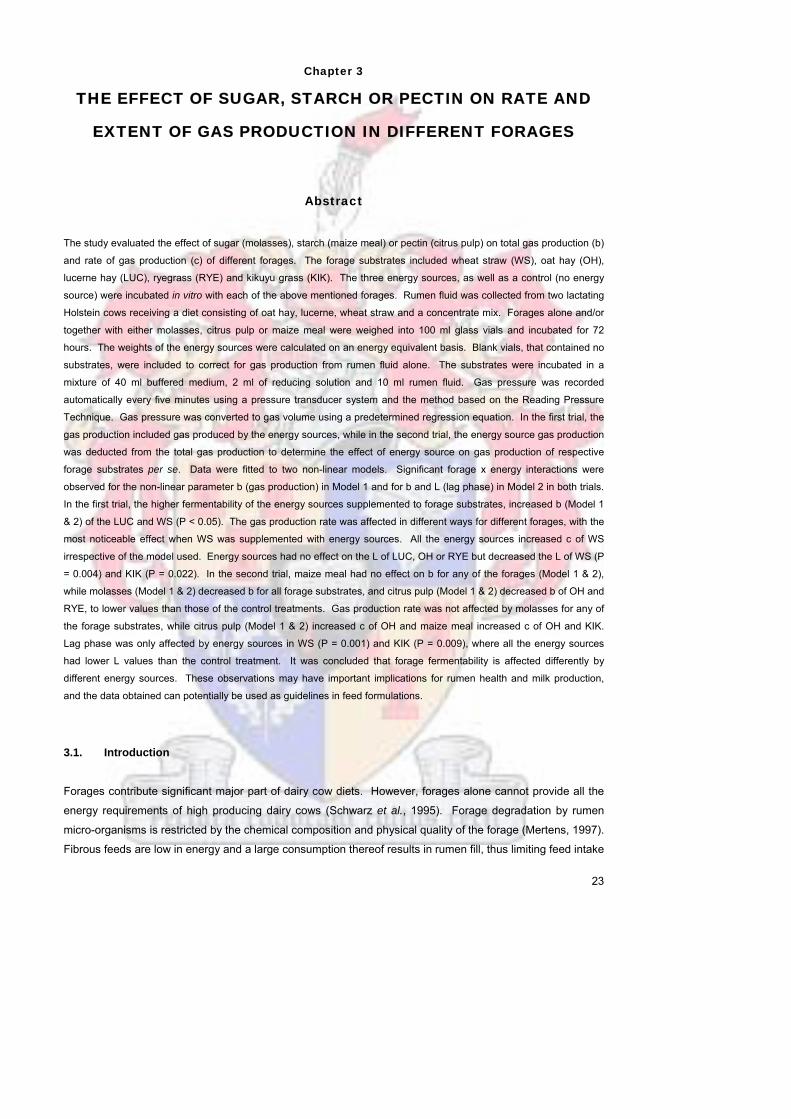


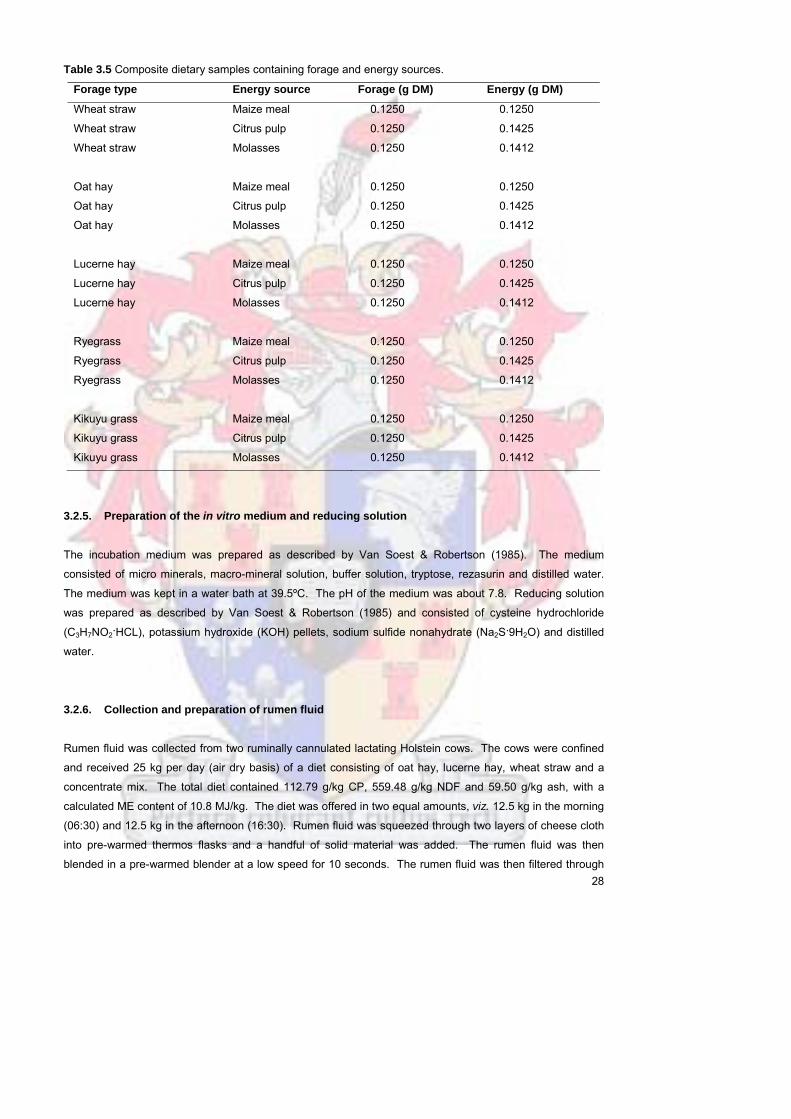
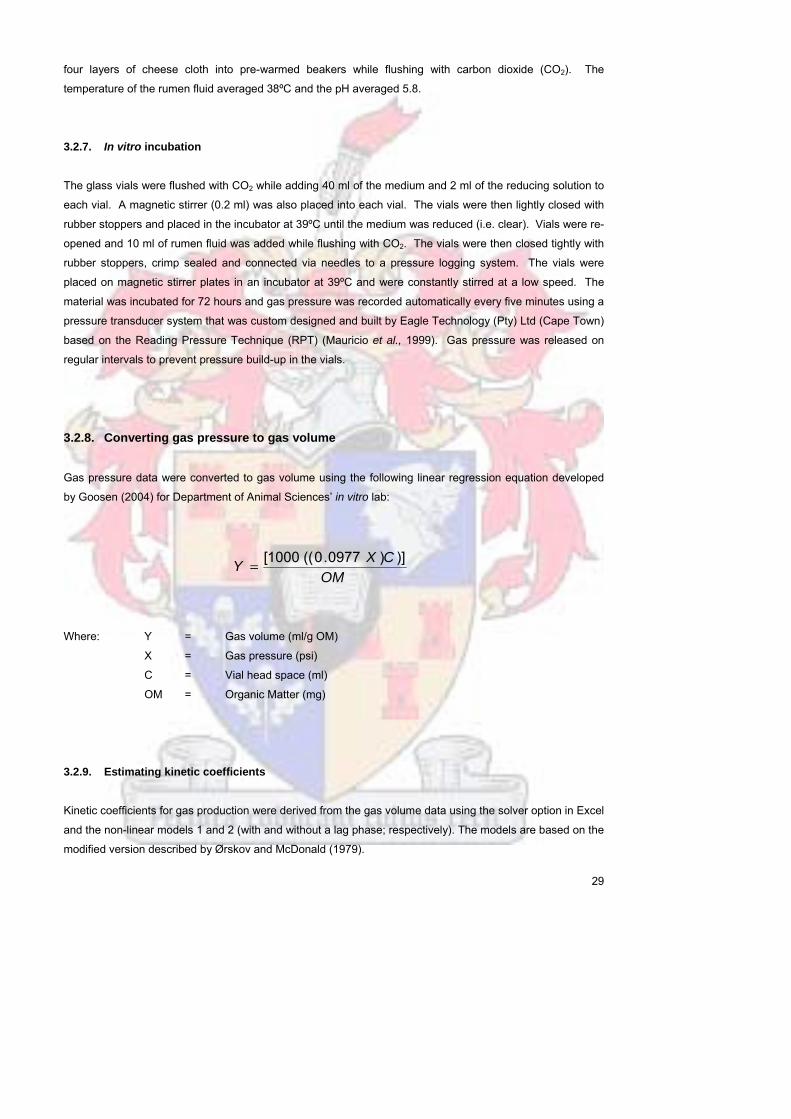


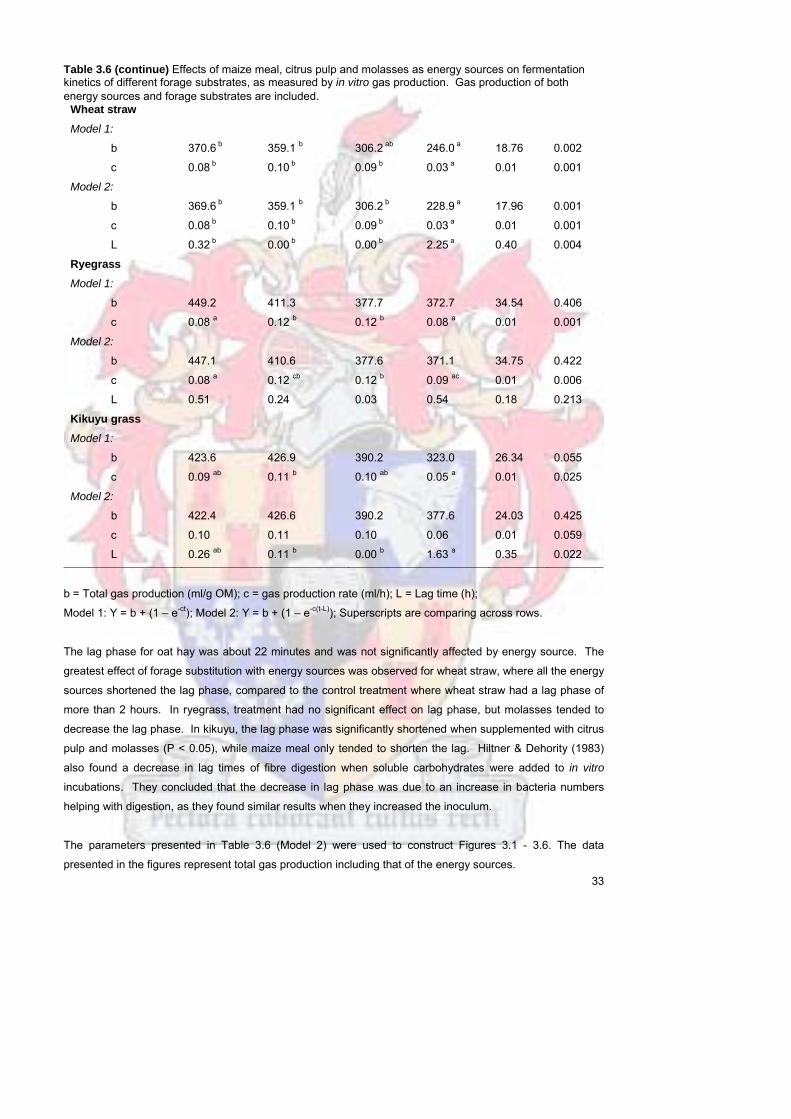
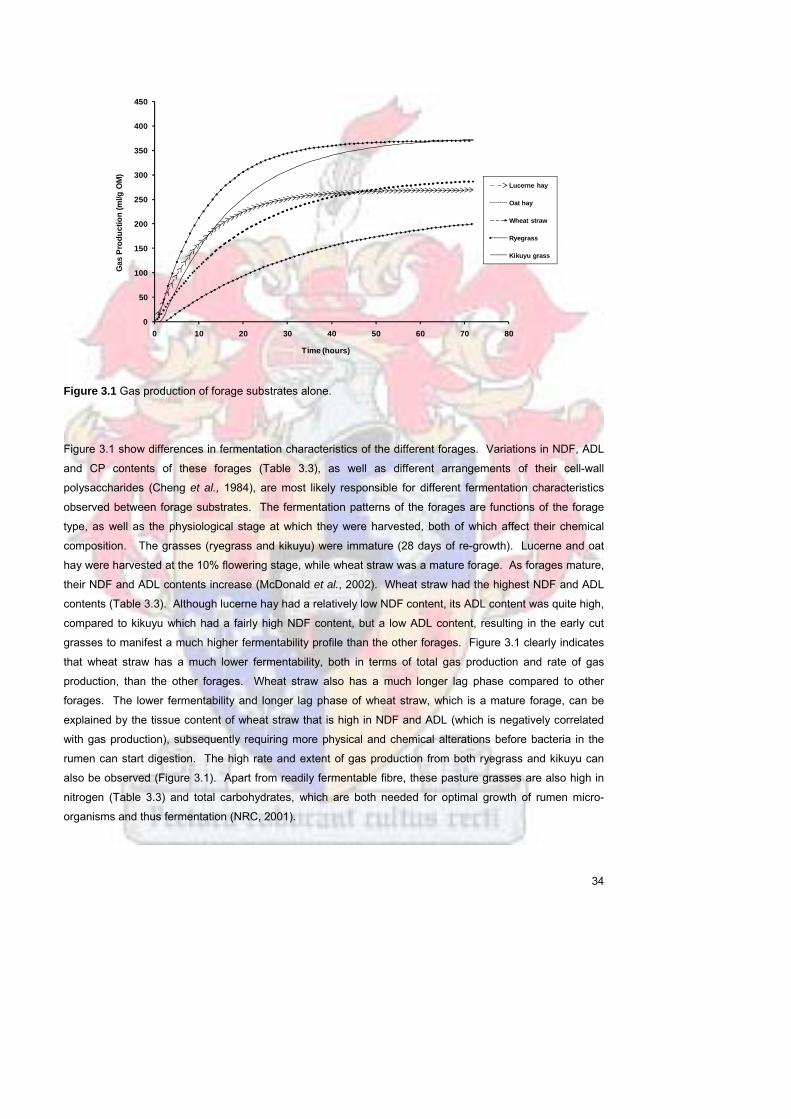
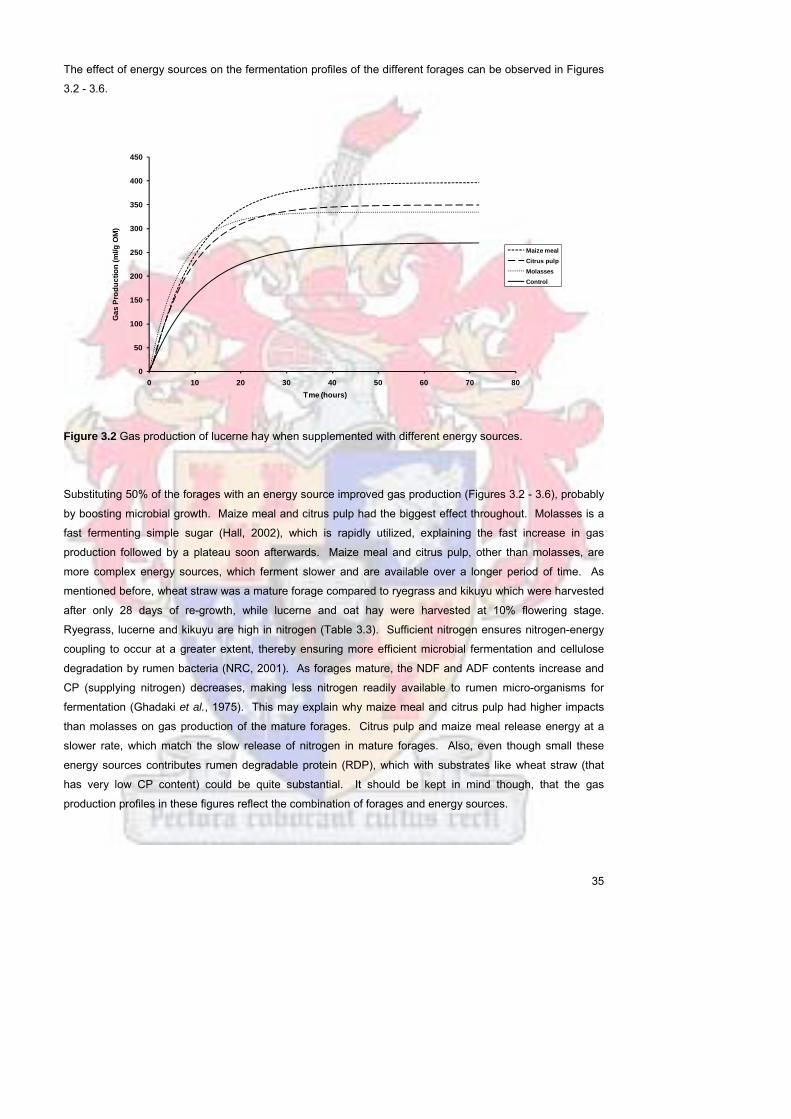

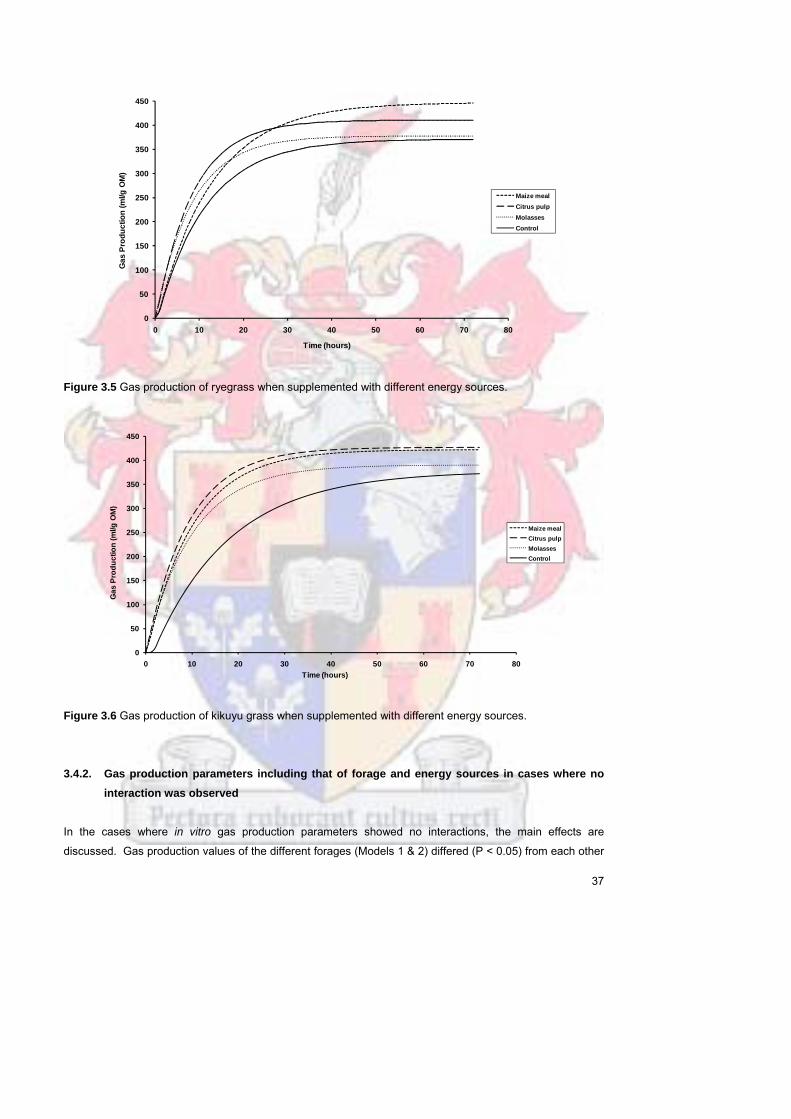

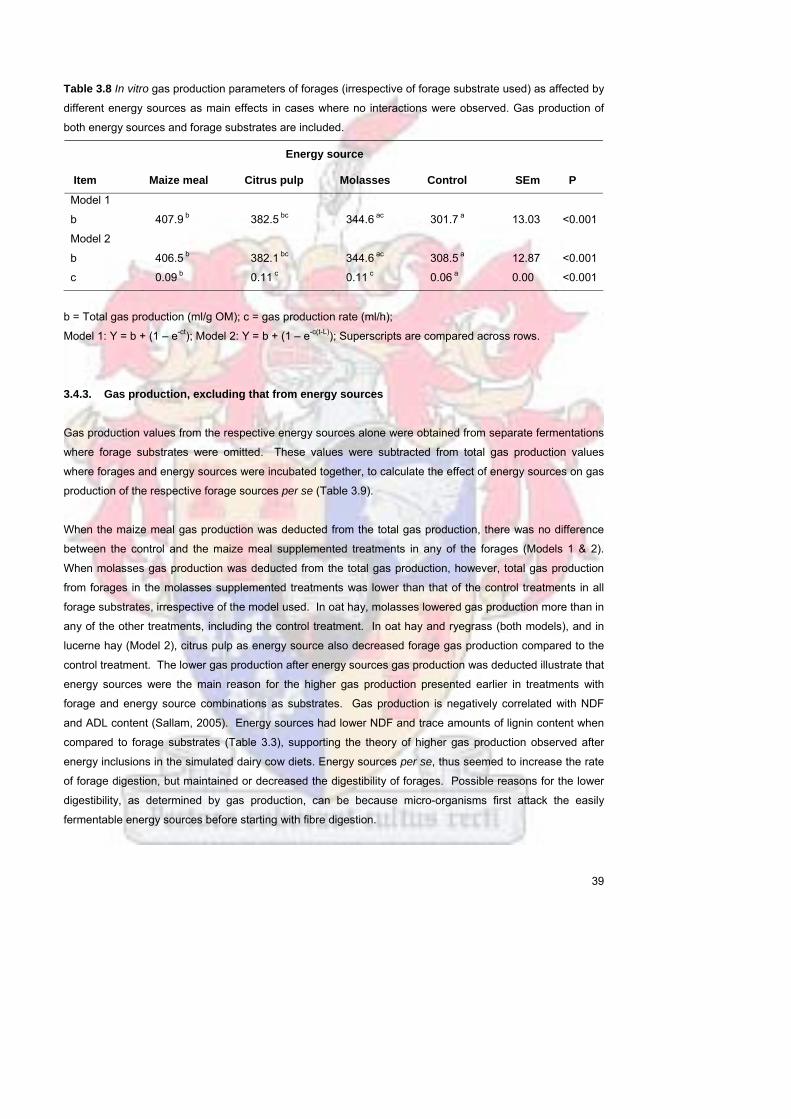

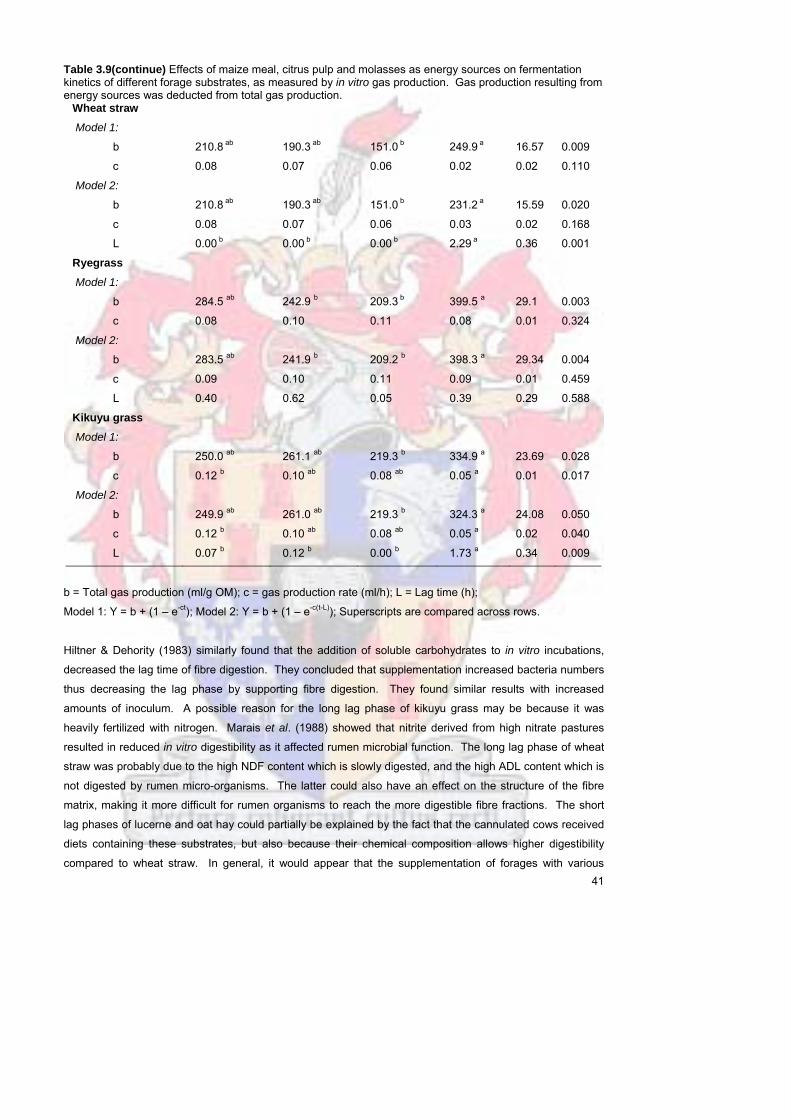


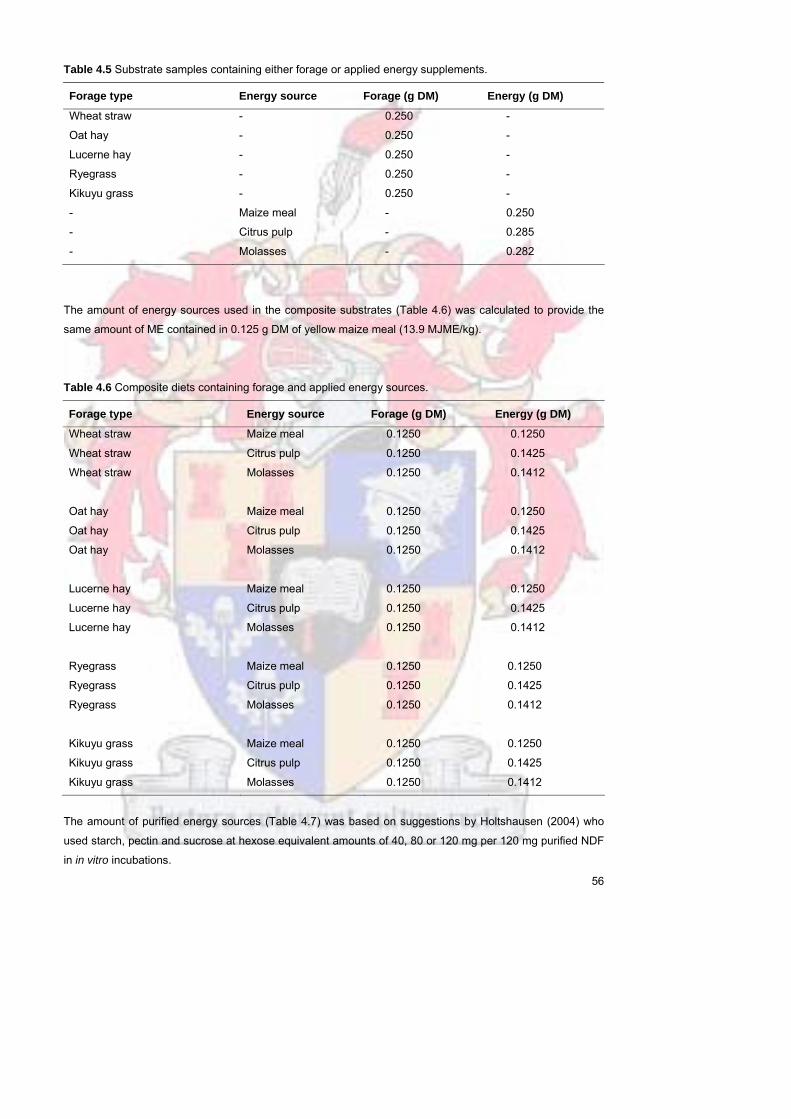


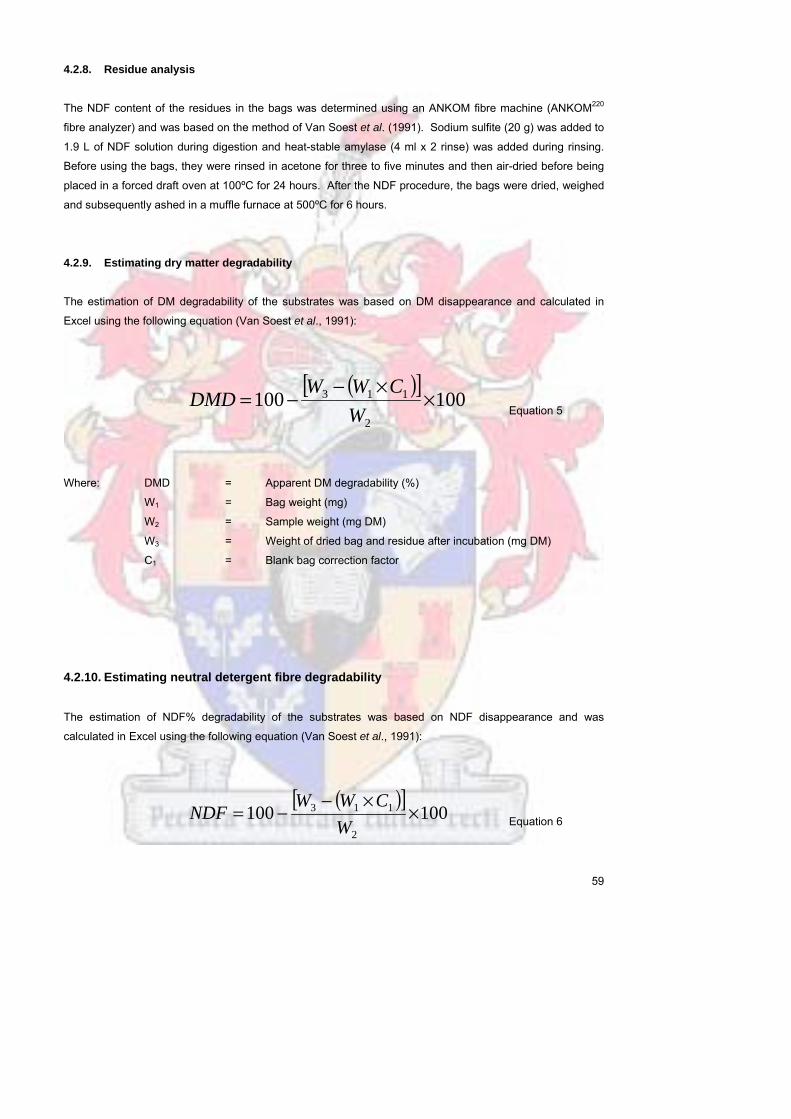
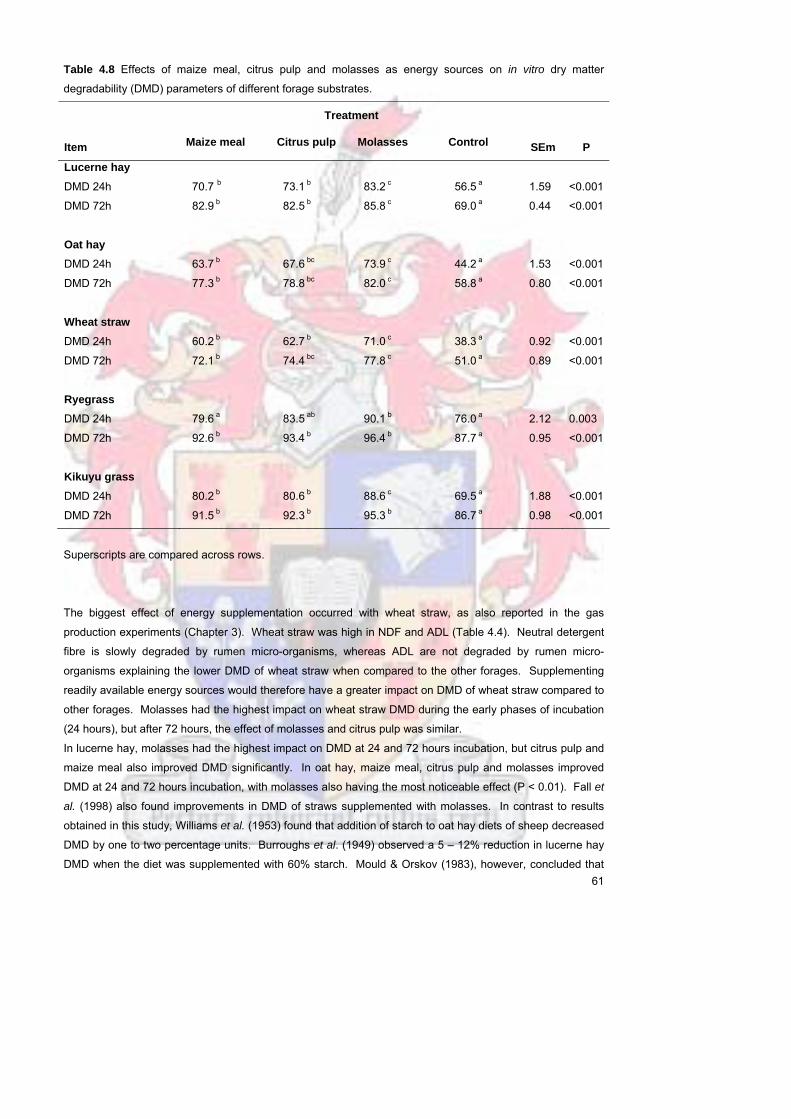

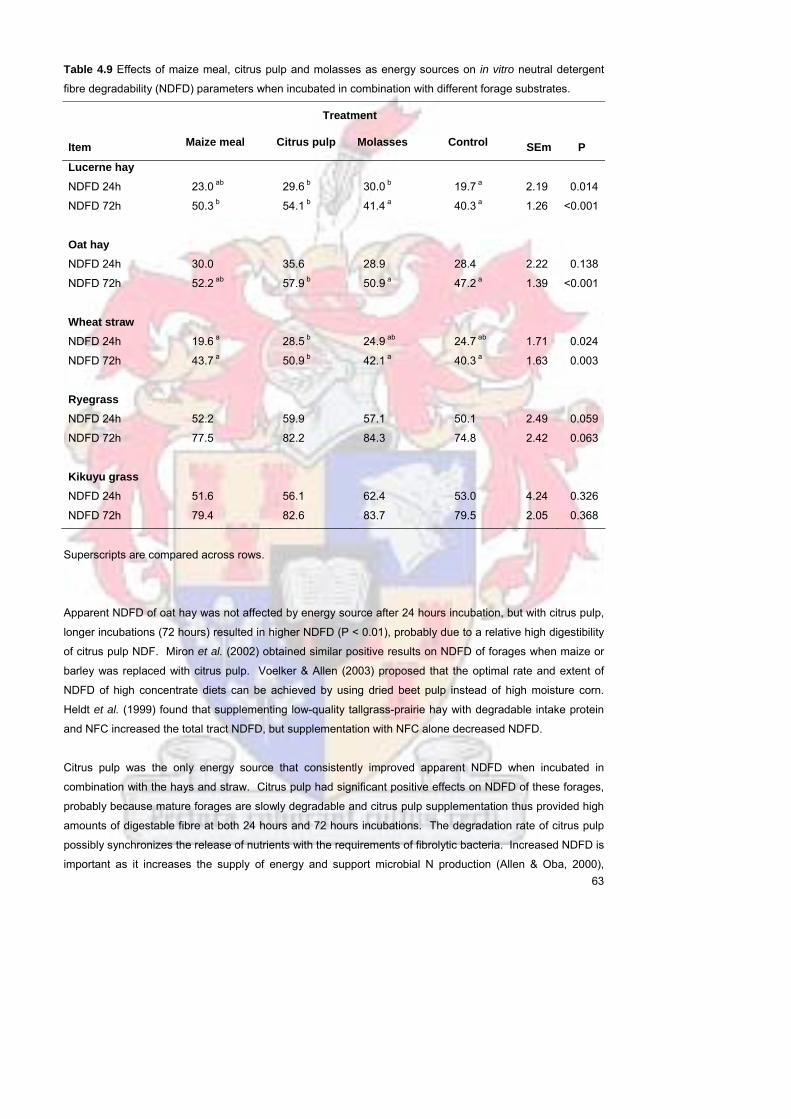


Related Documents