March 2015

March 2015. 2 BUSINESS COMPOSITION Rm turnover 2014 % Animal Feed1 24134,8 Layers1 08730,5 Broilers1 08130,4 Africa1524,3 Quantum Foods3 561100.
Dec 21, 2015
Welcome message from author
This document is posted to help you gain knowledge. Please leave a comment to let me know what you think about it! Share it to your friends and learn new things together.
Transcript

March 2015

2BUSINESS COMPOSITION
Rm turnover 2014
%
Animal Feed 1 241 34,8
Layers 1 087 30,5
Broilers 1 081 30,4
Africa 152 4,3
Quantum Foods 3 561 100

3NOVA FEEDS
Malmesbury
52%
George
14%
Pretoria
34%
42% sales to external market
CAGR for external sales volumes for period 2010-2014 is 6.7%
Leading supplier of diary feed in Western Cape
Ability to “pass though” raw material price changes
Superior technical input with custom mixes are key success factors

4NULAID EGGS
GP
Parents
Hatchery
BREEDING COMMERCIAL
Rearing
Laying
SALES
Pack Station
Ungraded
Liquid Egg
Integrated business from grand parent level to pack stations
Quantum Foods sell the equivalent of over 1 billion eggs per annum
90% of eggs sold are produced by own farms
One of only three suppliers of pullets
Geographical spread of farms
Nulaid brand commands a premium
Day old pullet sales
Point of lay sales
Transfer Transfer

5BROILER BUSINESS
GP
Parents
Hatchery
BREEDING COMMERCIAL
Rearing
Sales to
Others
Own
Abattoir
Significant re-engineering to stop losses
• Exit Eastern Cape market
• Closure of two abattoirs
• Live bird supply agreement in Western Cape
Western Cape business essentially a livestock farming business
Gauteng business remain fully integrated
560 000 broilers per week Western Cape
250 000 broilers per week Gauteng
Retail
&
WholesaleTransfer

6AFRICA OUTSIDE SOUTH AFRICA
Significant contributor to profits during 2013 and 2014
ZAMBIA
• Broiler and layer breeding• Commercial egg farm in
Copperbelt• Feed mixing plant
UGANDA
• Broiler and layer breeding• Feed mixing plant

7SUCCESS FACTORS
Commodity prices
• Maize (refer to slide 11)
• Soybean meal
ZAR/US$
• Exchange rate (refer to slide 12)
Egg prices
• Egg cycle of supply and demand (refer to slide 13)
• Feed prices
Broiler meat prices
• Trade regime
• Domestic supply and demand
• Feed prices
1
2
3
4
Economic factors

8OPERATIONAL FACTORS
Feed Conversion Ratio ( FCR ) both layers and broilers
Eggs per hen housed
Lowest cost of production throughout value chains
Disease status of national flocks
1
2
3
4
9
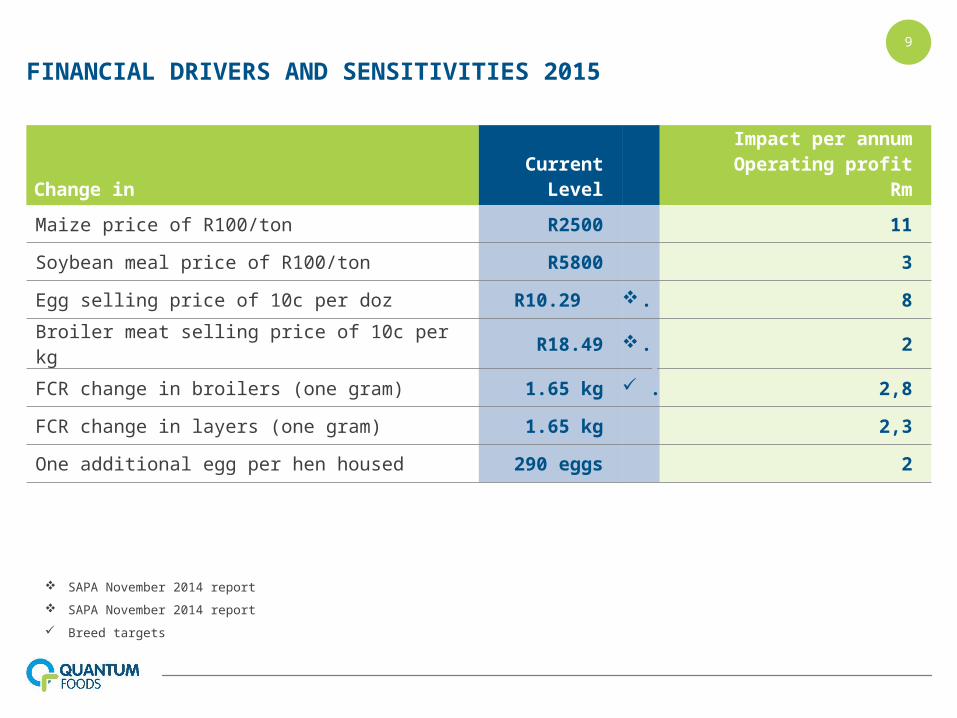
FINANCIAL DRIVERS AND SENSITIVITIES 2015
Change inCurrent
Level
Impact per annumOperating profit
Rm
Maize price of R100/ton R2500 11
Soybean meal price of R100/ton R5800 3
Egg selling price of 10c per doz R10.29 . 8
Broiler meat selling price of 10c per kg R18.49 . 2
FCR change in broilers (one gram) 1.65 kg . 2,8
FCR change in layers (one gram) 1.65 kg 2,3
One additional egg per hen housed 290 eggs 2
SAPA November 2014 report
SAPA November 2014 report
Breed targets

10STRATEGY
1. Western Cape de-risking of boiler business
2. Review Hartebees abattoir
3. Improve Customer and Product mix in Egg business
4. Increase Africa geographic footprint
Reducing cyclicality
1
1. Improvement of farm operations• Broiler FCR close to optimum• Layer FCR and eggs per hen
housed can improve by at least 2.5%
2. Cost efficiency in pack stations
3. Consolidated supply chain efforts
4. Utilize import opportunities for maize
5. Pack station project KZN
1. Organic growth in feed business
2. Acquisitive growth in feed business
3. “Off balance sheet” growth in egg business
4. Growth in current Africa operations
5. Grow the layer livestock business
Improve margins Grow selected markets
2 3

11ECONOMIC FACTORS: MAIZE
0
500
1000
1500
2000
2500
3000
3500
Yellow Maize (Safex)
R/t
on
2010 2011 2012 2013
R1,278
R1,672
R2,380
R2,264
2010 - 2014 Reporting period: Oct - Sep2015 Reporting period: Oct - Febr
R2,377
2014 2015
R2,069
-15.70%
+30.80%
+42.34
-4.87%
+5.03%
-12.98%

12ECONOMIC FACTORS: EXCHANGE RATE
5.5
6
6.5
7
7.5
8
8.5
9
9.5
10
10.5
11
11.5
12
ZAR vs US$
Rand
2010 2011 2012 2013
R7.4865
R6.9697
R8.0729
R9.2888
2014
R10.6037
R11.3085
-17.39%
-6.90%
+15.83%
+15.06%
+14.16%
+6.65%
2015

13
Source: SAPA

Thank you
Related Documents


![Accelerometer: Understanding Acceleration Opportunities ......tractors and learned models [26, 51, 101, 132]. The feature vectors are sent to Feed1, which calculates and returns a](https://static.cupdf.com/doc/110x72/5f46f6dffef9262e03429cd9/accelerometer-understanding-acceleration-opportunities-tractors-and-learned.jpg)