March 2006 Silvio de Carvalho Executive Director Roadshow

March 2006 Silvio de Carvalho Executive Director Roadshow.
Dec 21, 2015
Welcome message from author
This document is posted to help you gain knowledge. Please leave a comment to let me know what you think about it! Share it to your friends and learn new things together.
Transcript

March 2006
Silvio de CarvalhoExecutive Director
Roadshow
2
Brazilian Economy
Brazilian Banking System
Highlights Itaú
Itaú´s Positioning
2005 Results
Strategy
Agenda
3
Brazilian Macroeconomic Scenario
Floating exchange rate and outstanding adjustment in external
accounts
Monetary policy: inflation expectation and growth
Fiscal policy: accomplishment of fiscal targets, even without IMF
surveillance
Credit expansion: public sector crowding out
Baseline scenario
Brazil: towards investment grade
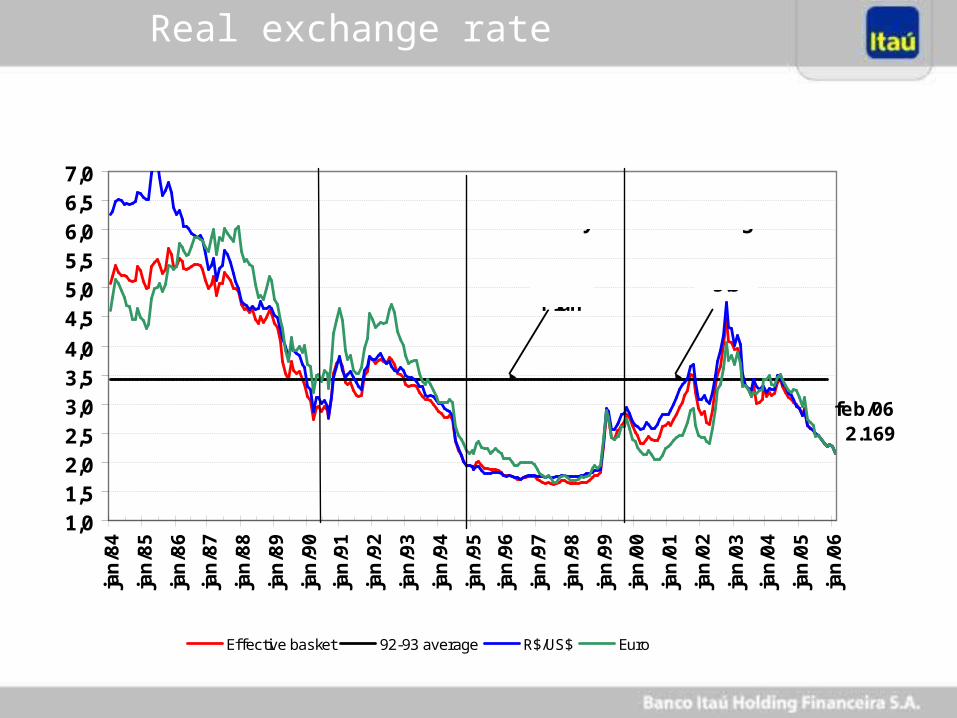
Real exchange rate
feb/06 2.169
1,0
1,52,02,5
3,03,54,0
4,55,05,5
6,06,57,0
jan
/84
jan
/85
jan
/86
jan
/87
jan
/88
jan
/89
jan
/90
jan
/91
jan
/92
jan
/93
jan
/94
jan
/95
jan
/96
jan
/97
jan
/98
jan
/99
jan
/00
jan
/01
jan
/02
jan
/03
jan
/04
jan
/05
jan
/06
Effective basket 92-93 average R$/US$ Euro
Collor-ItamarPeriod
Peggedcurrency
Floatingexchange rate
RealPlan
3.5
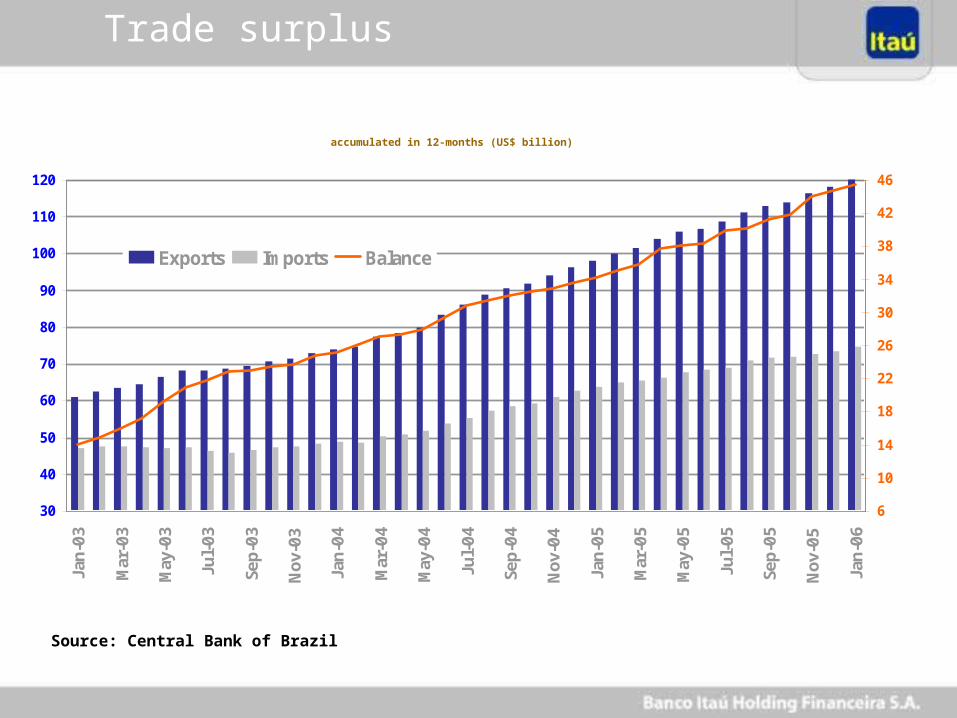
Trade surplus
accumulated in 12-months (US$ billion)
Source: Central Bank of Brazil
30
40
50
60
70
80
90
100
110
120
Jan-
03
Mar
-03
May
-03
Jul-03
Sep-
03
Nov
-03
Jan-
04
Mar
-04
May
-04
Jul-04
Sep-
04
Nov
-04
Jan-
05
Mar
-05
May
-05
Jul-05
Sep-
05
Nov
-05
Jan-
06
6
10
14
18
22
26
30
34
38
42
46
Exports Imports Balance
6
0
2
4
6
8
10
12
14
16
18Ja
n-99
Apr-
99Ju
l-99
Oct
-99
Jan-
00Ap
r-00
Jul-
00O
ct-0
0Ja
n-01
Apr-
01Ju
l-01
Oct
-01
Jan-
02Ap
r-02
Jul-
02O
ct-0
2Ja
n-03
Apr-
03Ju
l-03
Oct
-03
Jan-
04Ap
r-04
Jul-
04O
ct-0
4Ja
n-05
Apr-
05Ju
l-05
Oct
-05
Jan-
06Ap
r-06
Jul-
06O
ct-0
6
0
2
4
6
8
10
12
14
16
18
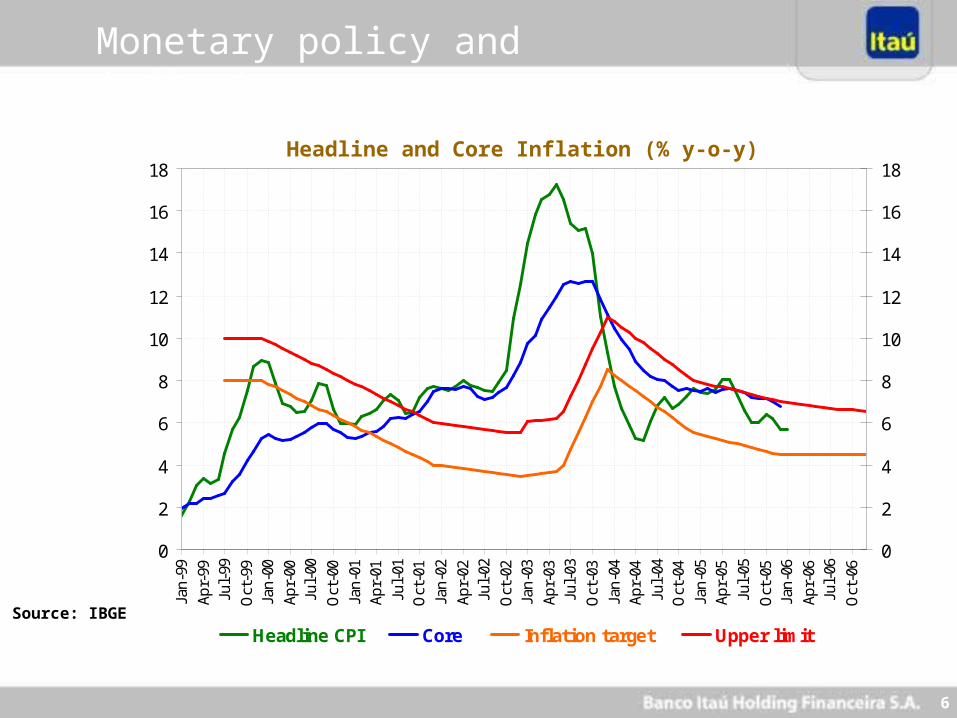
Headline CPI Core Inflation target Upper limit
Monetary policy and inflation
Source: IBGE
Headline and Core Inflation (% y-o-y)
7
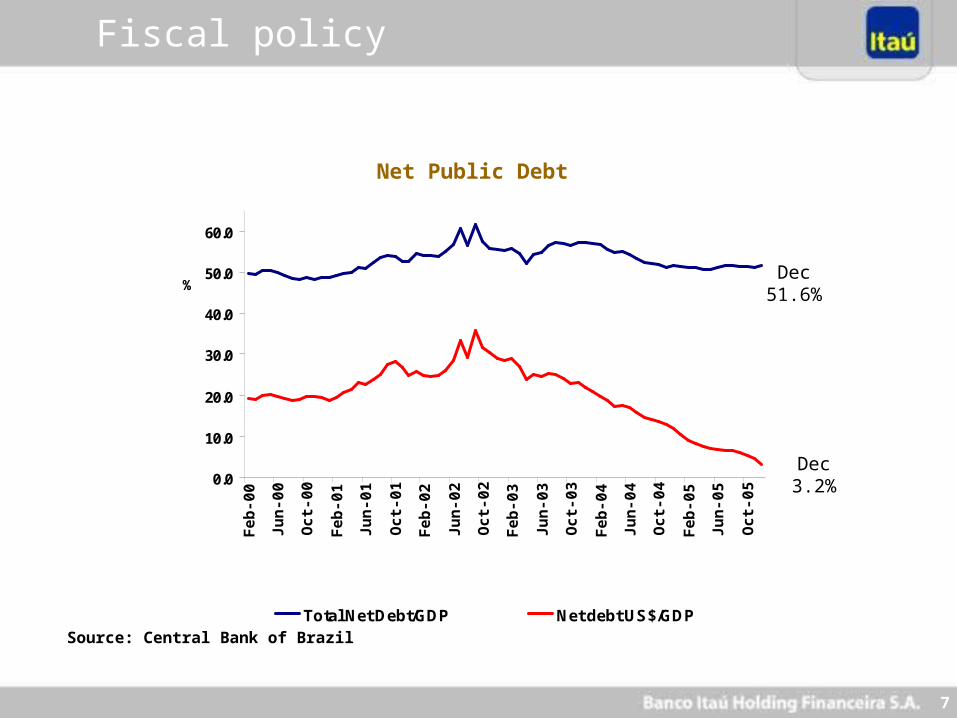
Fiscal policy
Source: Central Bank of Brazil
Net Public Debt
Dec 51.6%
Dec 3.2%0.0
10.0
20.0
30.0
40.0
50.0
60.0F
eb-0
0
Jun
-00
Oct
-00
Feb
-01
Jun
-01
Oct
-01
Feb
-02
Jun
-02
Oct
-02
Feb
-03
Jun
-03
Oct
-03
Feb
-04
Jun
-04
Oct
-04
Feb
-05
Jun
-05
Oct
-05
Total Net Debt/GDP Net debt US$/GDP
%
8
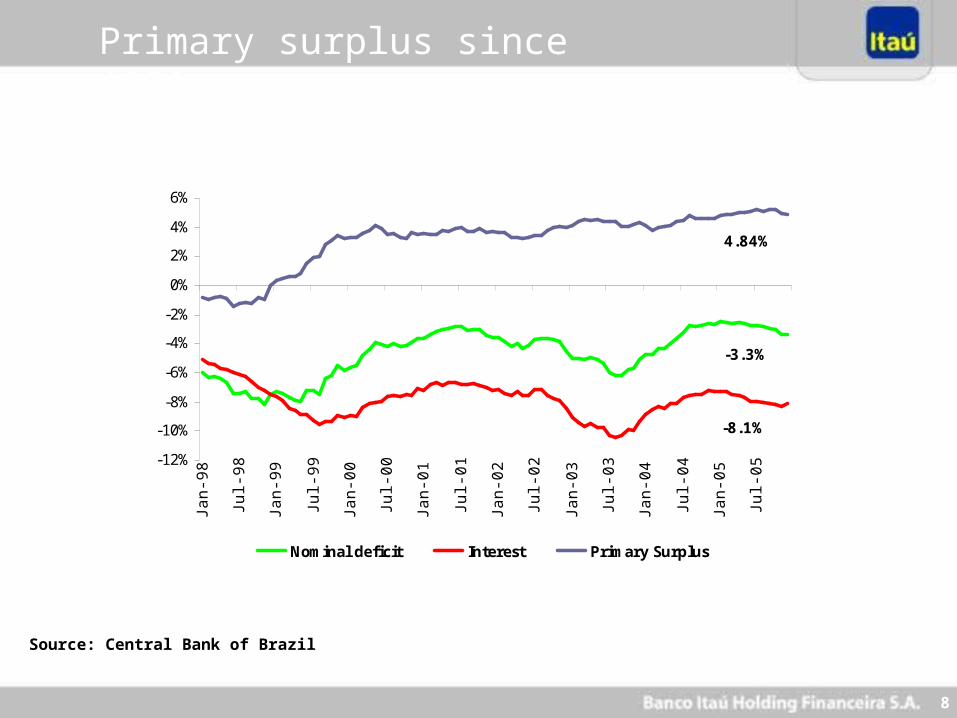
Primary surplus since 1998
Source: Central Bank of Brazil
-3.3%
-8.1%
4.84%
-12%
-10%
-8%
-6%
-4%
-2%
0%
2%
4%
6%Ja
n-9
8
Jul-
98
Jan-9
9
Jul-
99
Jan-0
0
Jul-
00
Jan-0
1
Jul-
01
Jan-0
2
Jul-
02
Jan-0
3
Jul-
03
Jan-0
4
Jul-
04
Jan-0
5
Jul-
05
Nominal deficit Interest Primary Surplus
9
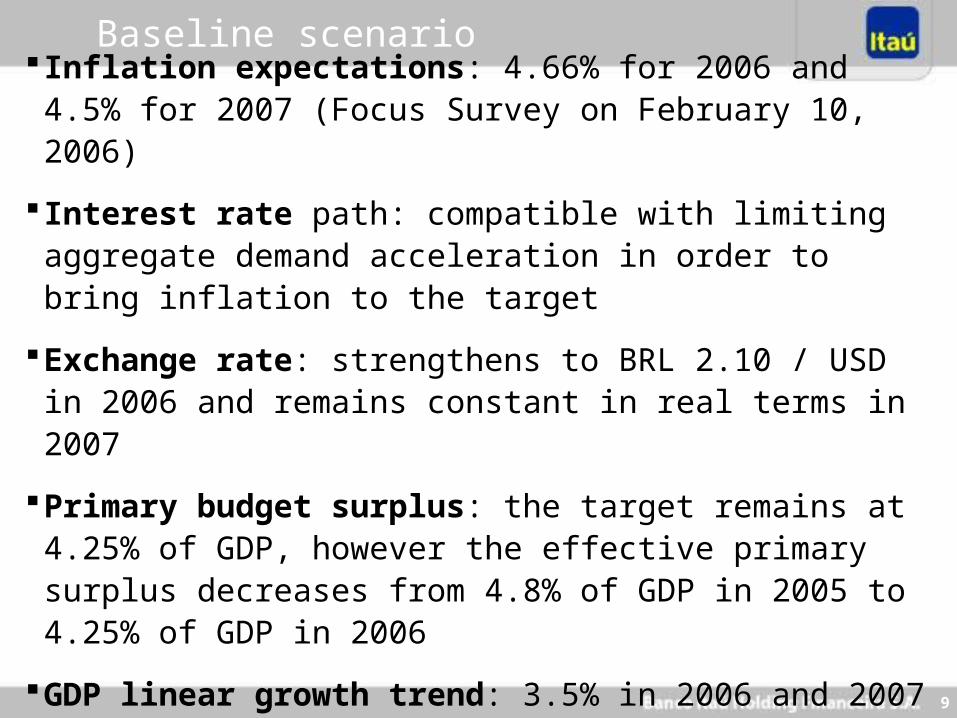
Inflation expectations: 4.66% for 2006 and 4.5% for 2007 (Focus Survey on February 10, 2006)
Interest rate path: compatible with limiting aggregate demand acceleration in order to bring inflation to the target
Exchange rate: strengthens to BRL 2.10 / USD in 2006 and remains constant in real terms in 2007
Primary budget surplus: the target remains at 4.25% of GDP, however the effective primary surplus decreases from 4.8% of GDP in 2005 to 4.25% of GDP in 2006
GDP linear growth trend: 3.5% in 2006 and 2007
Baseline scenario
10
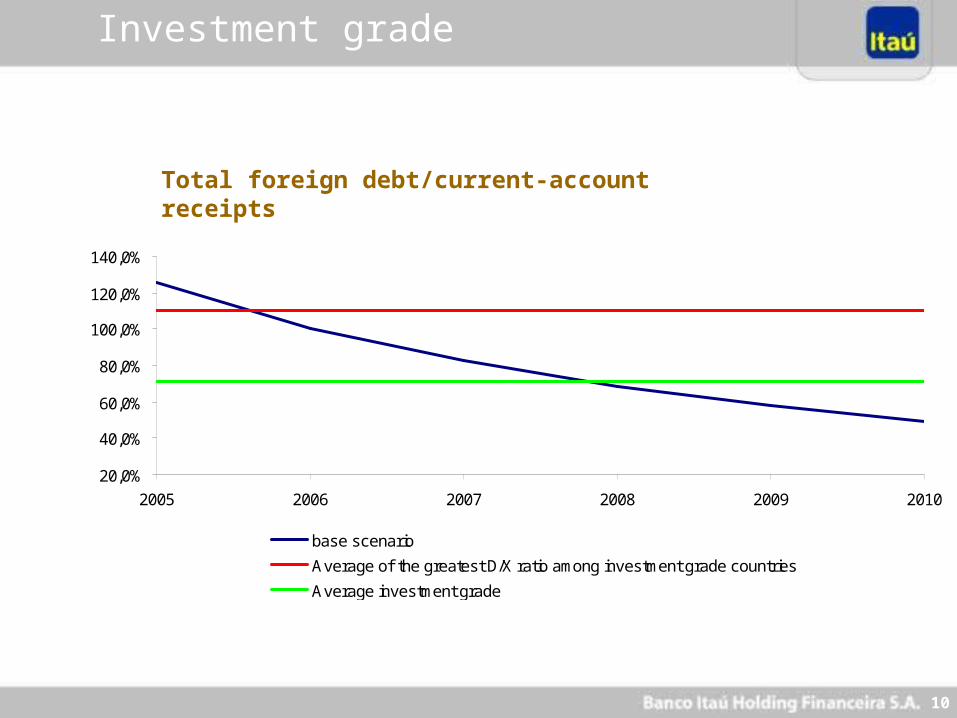
Investment grade
Total foreign debt/current-account receipts
20,0%
40,0%
60,0%
80,0%
100,0%
120,0%
140,0%
2005 2006 2007 2008 2009 2010
base scenario
Average of the greatest D/X ratio among investment grade countries
Average investment grade
11
Brazilian Economy
Brazilian Banking System
Highlights Itaú
Itaú´s Positioning
2005 Results
Strategy
Agenda
12
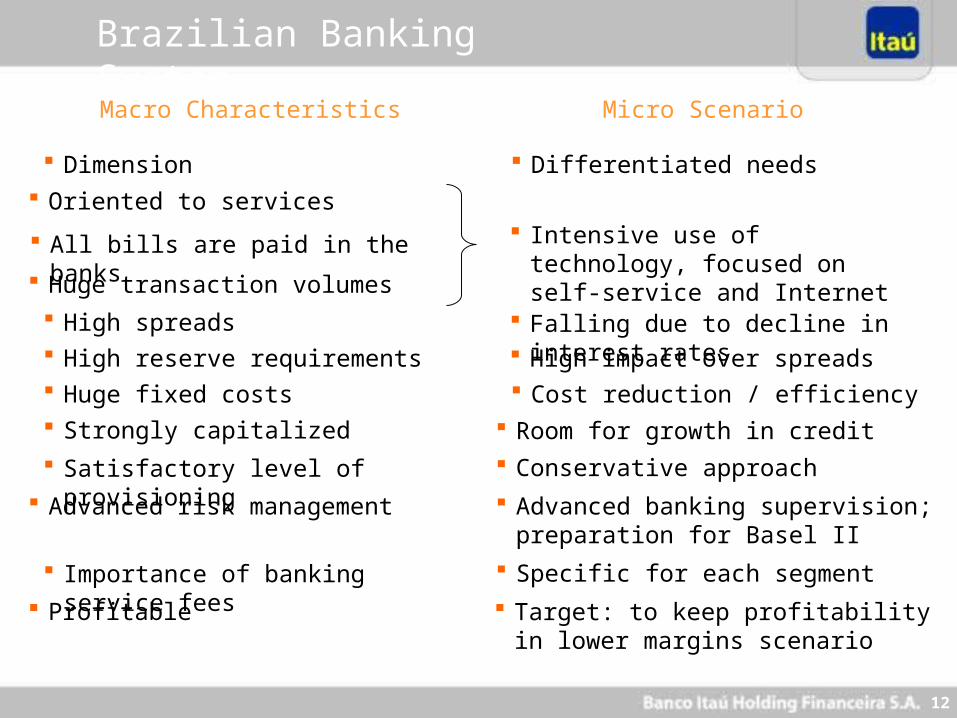
Brazilian Banking System
Macro Characteristics Micro Scenario
Huge fixed costs Cost reduction / efficiency Strongly capitalized Room for growth in credit Satisfactory level of provisioning Conservative approach
Advanced risk management Advanced banking supervision; preparation for Basel II
Importance of banking service fees Specific for each segment
Profitable Target: to keep profitability in lower margins scenario
Oriented to services Intensive use of technology, focused
on self-service and Internet All bills are paid in the banks
Huge transaction volumes
High spreads Falling due to decline in interest rates
Dimension Differentiated needs
High reserve requirements High impact over spreads

13
Declining Interest Rates x Increasing Loan Demand: New Revenue Dynamics
Growing Fee Earnings and Tighter Cost Control To Offset Lower Treasury Gains
Focus on Higher-Yielding Consumer Finance and SME Lending
Efforts of Client Acquisition and Gains of Scale
Government Still Attracts Large Portions of the System’s Liquidity; Gradual Replacement of Bonds By Loans
Public Sector Banks Still Dominant: 45% of Deposits
More Aggressive Competition
Current Scenario
14
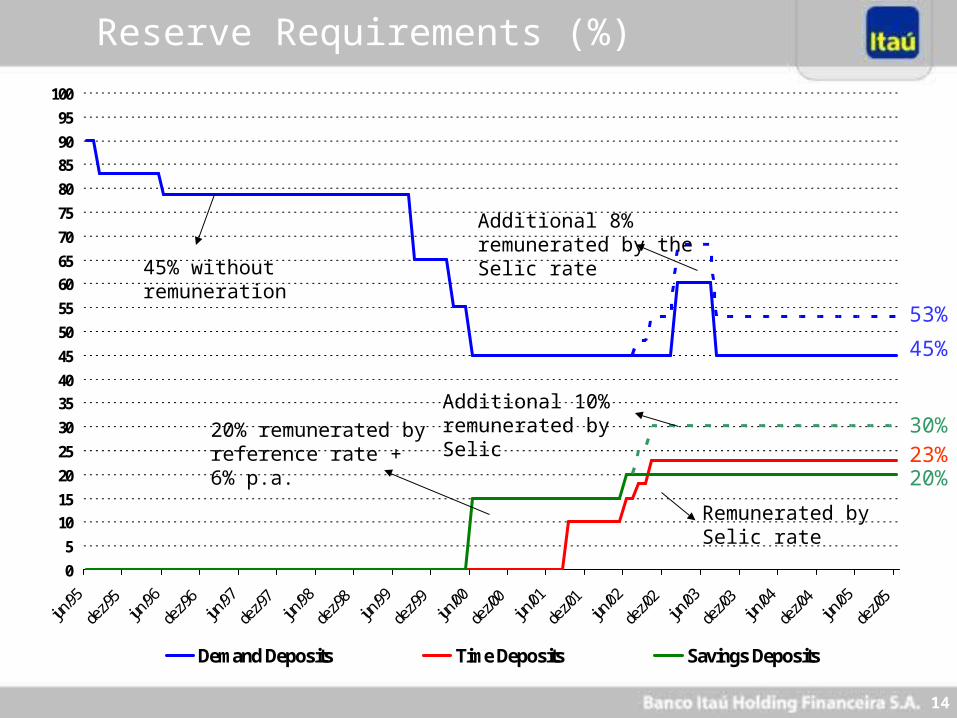
Reserve Requirements (%)
0
5
10
15
20
25
30
35
40
45
50
55
60
65
70
75
80
85
90
95
100
jun/95
dez/9
5jun
/96
dez/9
6jun
/97
dez/9
7jun
/98
dez/9
8jun
/99
dez/9
9jun
/00
dez/0
0jun
/01
dez/0
1jun
/02
dez/0
2jun
/03
dez/0
3jun
/04
dez/0
4jun
/05
dez/0
5
Demand Deposits Time Deposits Savings Deposits
53%
30%23%
45%
20%
Additional 8% remunerated by the Selic rate
20% remunerated by reference rate + 6% p.a.
Additional 10% remunerated by Selic
Remunerated by Selic rate
45% without remuneration
15
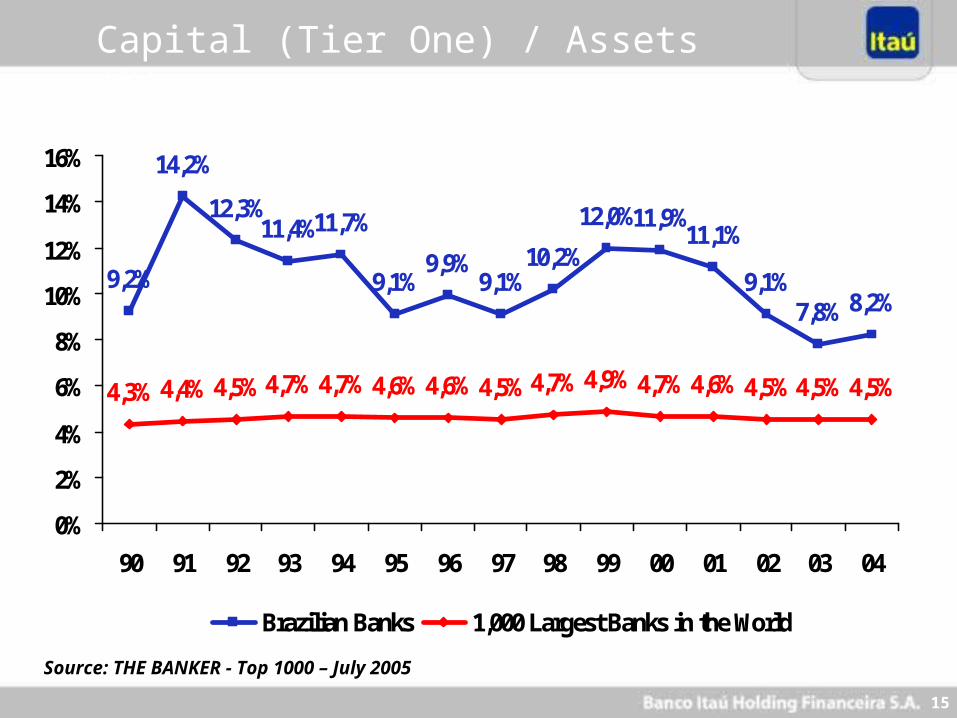
Capital (Tier One) / Assets (%)
9,2%
14,2%
12,3%11,4%11,7%
9,1%9,9%
9,1%10,2%
12,0%11,9%11,1%
9,1%7,8% 8,2%
4,3% 4,4% 4,5% 4,7% 4,7% 4,6% 4,6% 4,5% 4,7% 4,9% 4,7% 4,6% 4,5% 4,5% 4,5%
0%
2%
4%
6%
8%
10%
12%
14%
16%
90 91 92 93 94 95 96 97 98 99 00 01 02 03 04
Brazilian Banks 1,000 Largest Banks in the World
Source: THE BANKER - Top 1000 – July 2005
16
Brazilian Economy
Brazilian Banking System
Highlights Itaú
Itaú´s Positioning
2005 Results
Strategy
Agenda

17
Ownership Structure - Dec/05
ESA Family: 33.67%
• Common Shares: 60.64%
• Preferred Shares: 17.15%
Free Float: 66.33%
• Common Shares: 39.36%
• Preferred Shares: 82.85%
Itaúsa
Banco Itaú Holding Financeira S.A.
Free Float: 51.59%
• Common Shares: 11.16%
• Preferred Shares: 99.99%
Total: 48.41%• Commom Shares: 88.84%• Preferred Shares: 0.01%
18
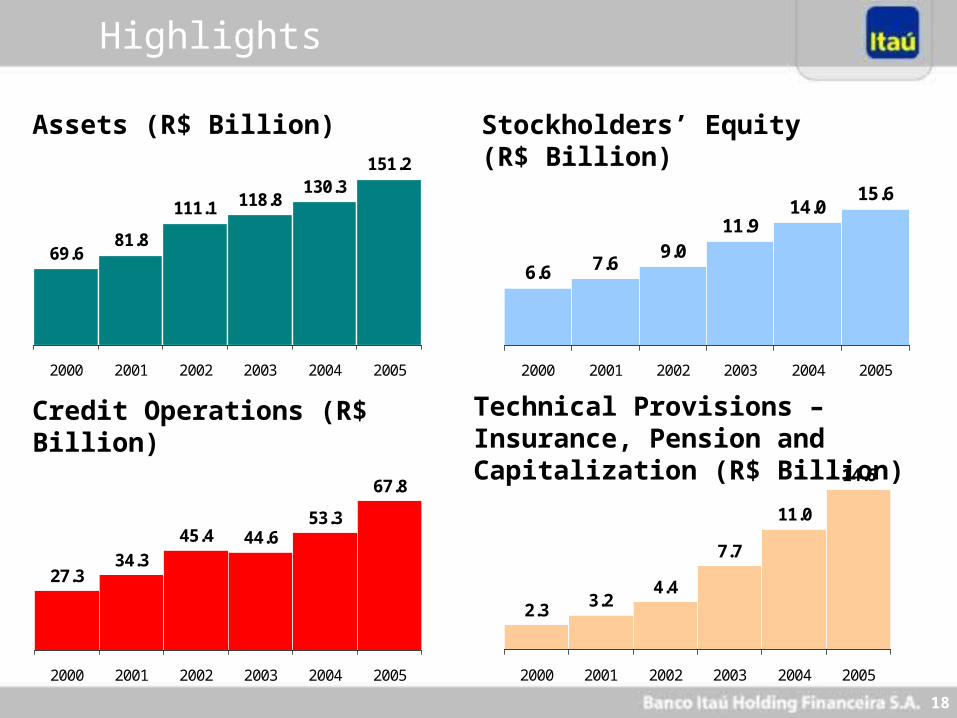
69.681.8
151.2130.3
118.8111.1
2000 2001 2002 2003 2004 2005
27.334.3
45.4 44.653.3
67.8
2000 2001 2002 2003 2004 2005
6.6 7.69.0
11.914.0
15.6
2000 2001 2002 2003 2004 2005
Highlights
Assets (R$ Billion)
Credit Operations (R$ Billion)
Stockholders’ Equity (R$ Billion)
2.3 3.24.4
7.7
11.0
14.6
2000 2001 2002 2003 2004 2005
Technical Provisions – Insurance, Pension and Capitalization (R$ Billion)
19
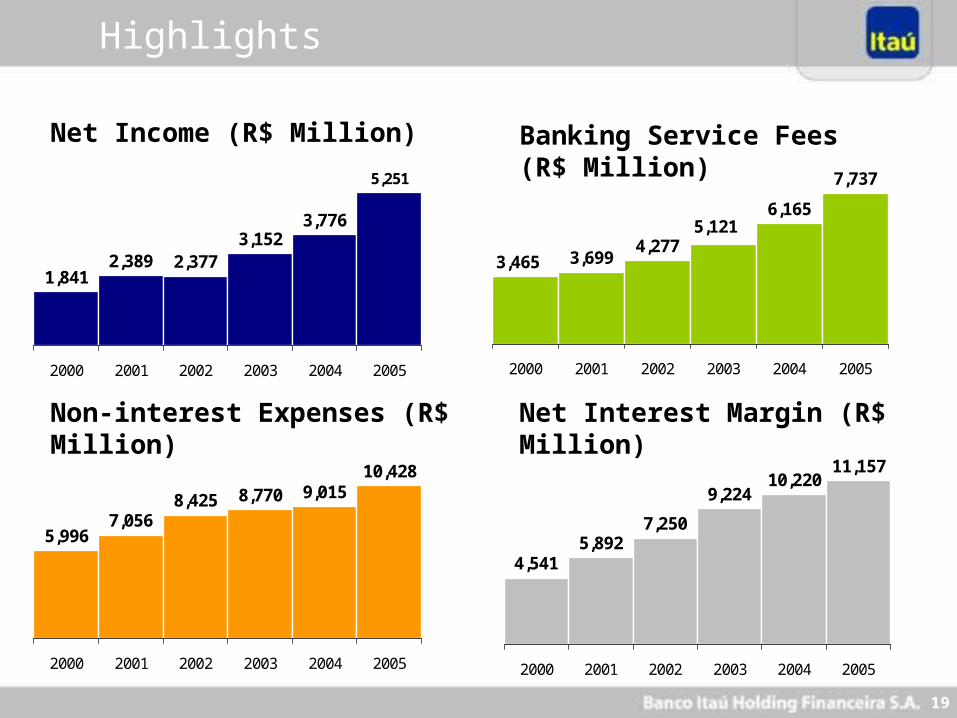
11,15710,220
9,224
7,2505,892
4,541
2000 2001 2002 2003 2004 2005
1,841
3,7763,152
5,251
2,3772,389
2000 2001 2002 2003 2004 2005
7,056
8,770 9,0158,425
5,996
10,428
2000 2001 2002 2003 2004 2005
3,6994,277
6,165
7,737
3,465
5,121
2000 2001 2002 2003 2004 2005
Net Income (R$ Million)
Non-interest Expenses (R$ Million)
Banking Service Fees (R$ Million)
Net Interest Margin (R$ Million)
Highlights
20
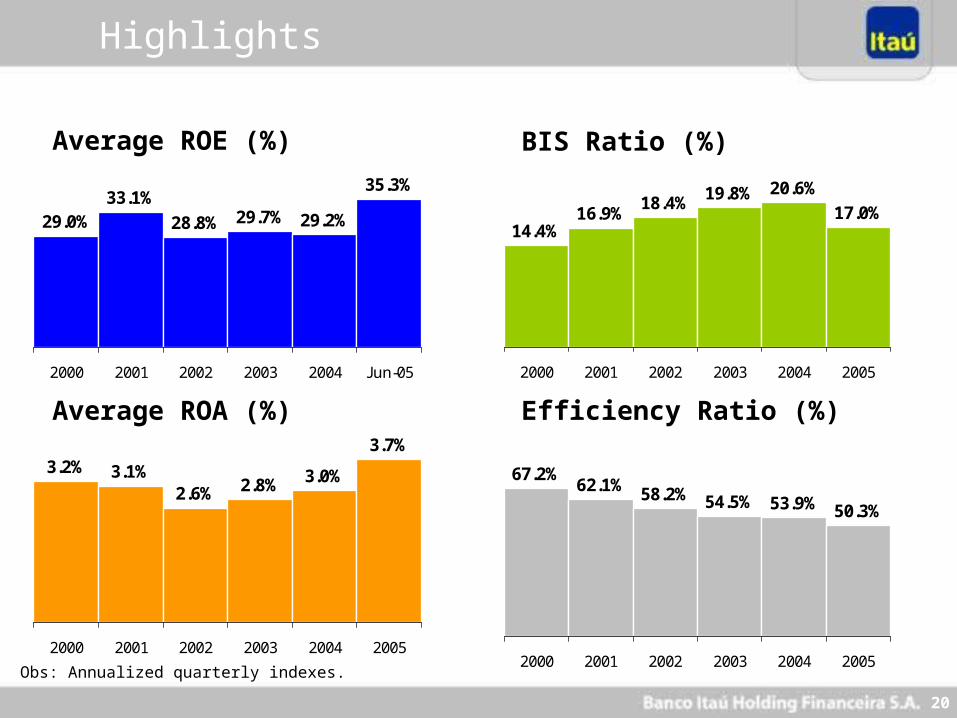
29.0%33.1%
28.8% 29.7% 29.2%
35.3%
2000 2001 2002 2003 2004 Jun-05
3.2% 3.1%2.6% 2.8% 3.0%
3.7%
2000 2001 2002 2003 2004 2005
14.4%16.9%
18.4% 19.8% 20.6%
17.0%
2000 2001 2002 2003 2004 2005
67.2%62.1% 58.2% 54.5% 53.9% 50.3%
2000 2001 2002 2003 2004 2005Obs: Annualized quarterly indexes.
Average ROE (%)
Average ROA (%)
BIS Ratio (%)
Efficiency Ratio (%)
Highlights
21
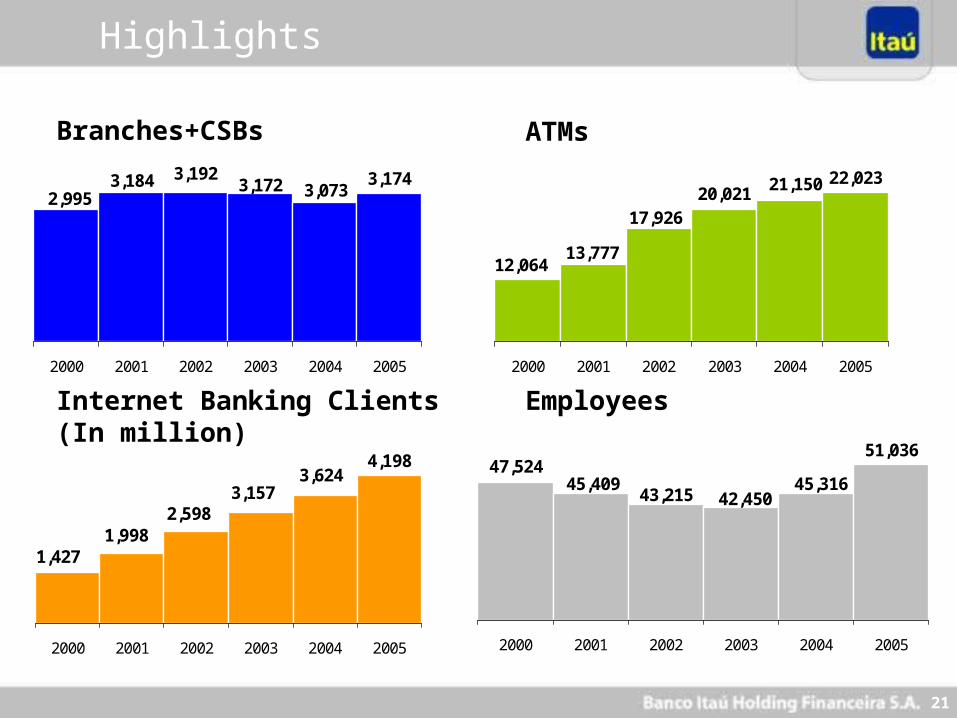
3,1743,0733,172
3,1923,1842,995
2000 2001 2002 2003 2004 2005
3,6243,157
2,5981,998
1,427
4,198
2000 2001 2002 2003 2004 2005
22,02320,021 21,150
17,926
13,77712,064
2000 2001 2002 2003 2004 2005
42,45045,316
43,21545,409
47,52451,036
2000 2001 2002 2003 2004 2005
Branches+CSBs
Internet Banking Clients (In million)
ATMs
Employees
Highlights
22
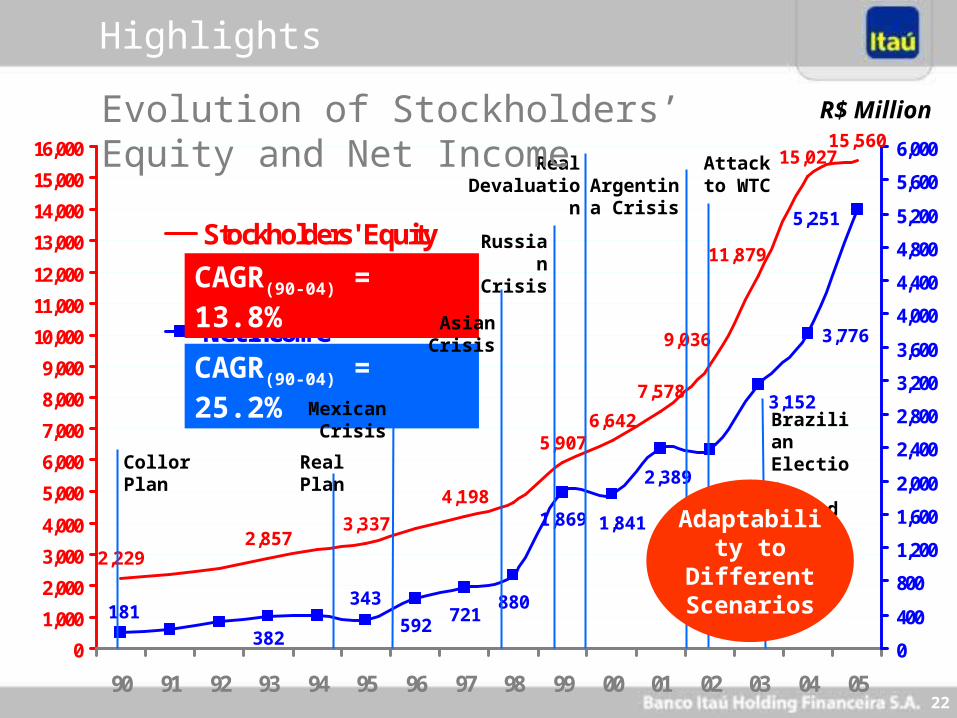
11,879
15,027
2,229
15,560
9,036
7,578
6,6425,907
4,198
3,3372,857
880
3,152
181
3,776
5,251
2,389
1,8411,869
721592
343
3820
1,000
2,000
3,000
4,000
5,000
6,000
7,000
8,000
9,000
10,000
11,000
12,000
13,000
14,000
15,000
16,000
90 91 92 93 94 95 96 97 98 99 00 01 02 03 04 05
0
400
800
1,200
1,600
2,000
2,400
2,800
3,200
3,600
4,000
4,400
4,800
5,200
5,600
6,000
Stockholders' Equity
Net Income
CAGR(90-04) = 13.8%
CAGR(90-04) = 25.2%
Real Plan
Mexican Crisis
Asian Crisis
Russian Crisis
Real Devaluation Argentina
Crisis
Collor Plan
Attack to WTC
Brazilian Election Period
R$ Million
Adaptability to Different
Scenarios
Evolution of Stockholders’ Equity and Net Income
Highlights
23
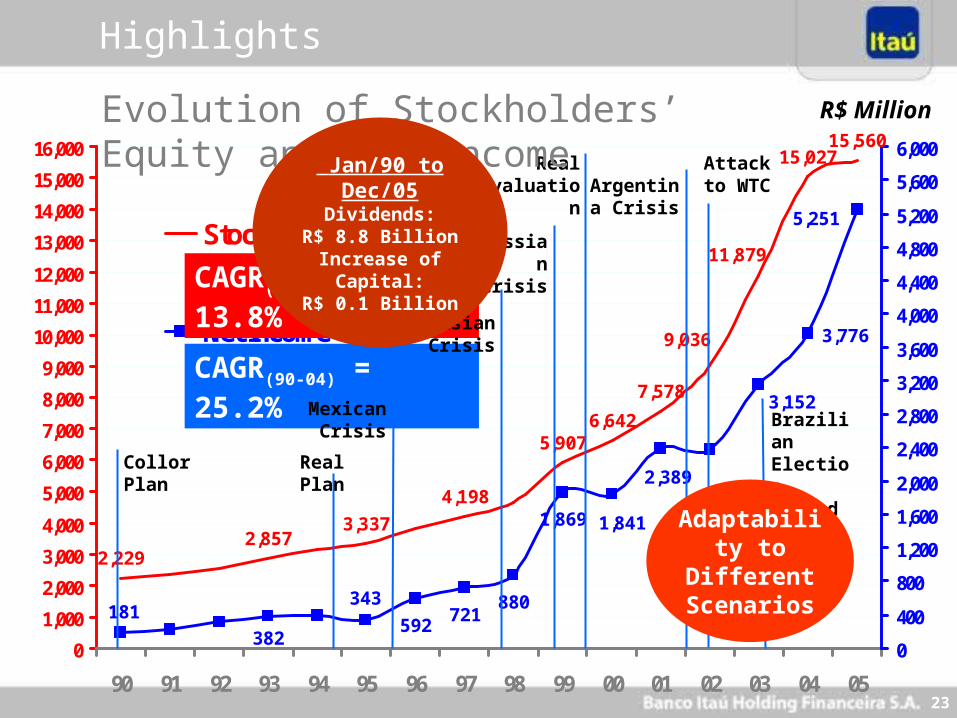
11,879
15,027
2,229
15,560
9,036
7,578
6,6425,907
4,198
3,3372,857
880
3,152
181
3,776
5,251
2,389
1,8411,869
721592
343
3820
1,000
2,000
3,000
4,000
5,000
6,000
7,000
8,000
9,000
10,000
11,000
12,000
13,000
14,000
15,000
16,000
90 91 92 93 94 95 96 97 98 99 00 01 02 03 04 05
0
400
800
1,200
1,600
2,000
2,400
2,800
3,200
3,600
4,000
4,400
4,800
5,200
5,600
6,000
Stockholders' Equity
Net Income
CAGR(90-04) = 13.8%
CAGR(90-04) = 25.2%
Real Plan
Mexican Crisis
Asian Crisis
Russian Crisis
Real Devaluation Argentina
Crisis
Collor Plan
Attack to WTC
Brazilian Election Period
R$ Million
Adaptability to Different
Scenarios
Evolution of Stockholders’ Equity and Net Income
Highlights
Jan/90 to Dec/05Dividends:
R$ 8.8 BillionIncrease of Capital:
R$ 0.1 Billion
24
Agenda
Brazilian Economy
Brazilian Banking System
Highlights Itaú
Itaú´s Positioning
2005 Results
Strategy
25
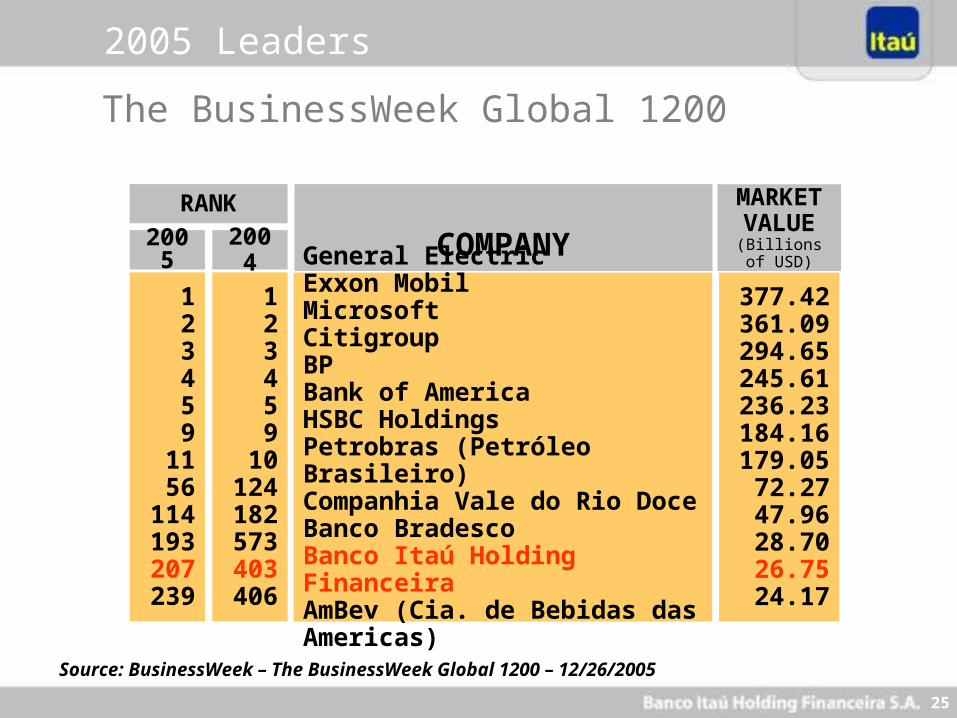
2005 Leaders
Source: BusinessWeek – The BusinessWeek Global 1200 – 12/26/2005
RANK
123459
1156
114193207239
2005
123459
10124182573403406
2004 COMPANY
General ElectricExxon MobilMicrosoftCitigroupBPBank of AmericaHSBC HoldingsPetrobras (Petróleo Brasileiro)Companhia Vale do Rio DoceBanco BradescoBanco Itaú Holding FinanceiraAmBev (Cia. de Bebidas das Americas)
377.42361.09294.65245.61236.23184.16179.0572.2747.9628.7026.7524.17
MARKET VALUE
(Billions of USD)
The BusinessWeek Global 1200
26
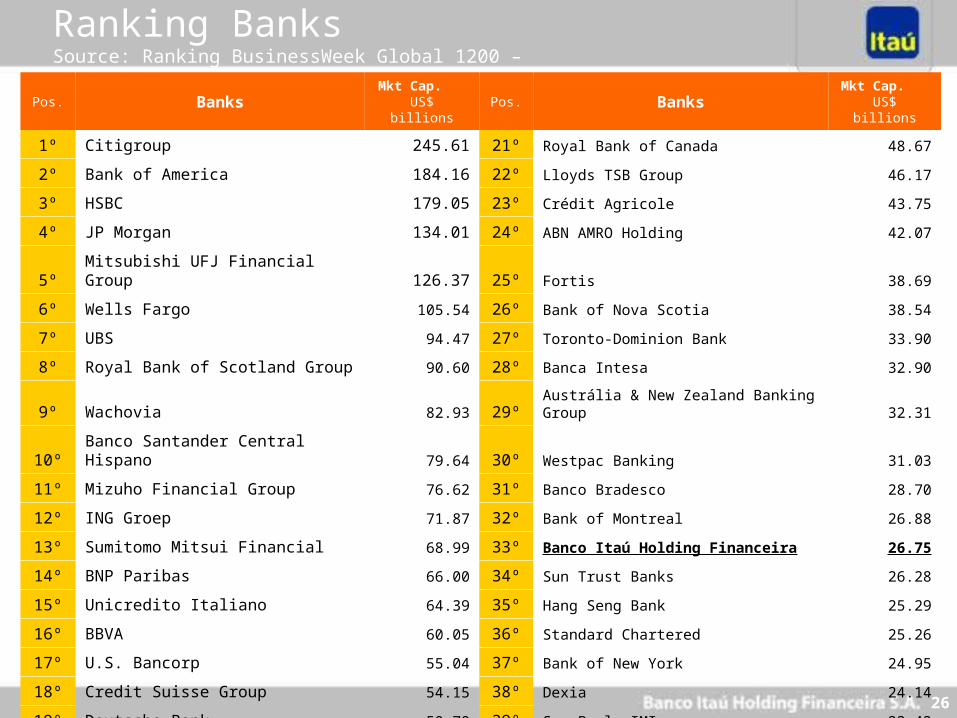
Ranking Banks Source: Ranking BusinessWeek Global 1200 – 12/26/2005
Pos. BanksMkt Cap. US$
billionsPos. Banks
Mkt Cap. US$ billions
1º Citigroup 245.61 21º Royal Bank of Canada 48.67
2º Bank of America 184.16 22º Lloyds TSB Group 46.17
3º HSBC 179.05 23º Crédit Agricole 43.75
4º JP Morgan 134.01 24º ABN AMRO Holding 42.07
5º Mitsubishi UFJ Financial Group 126.37 25º Fortis 38.69
6º Wells Fargo 105.54 26º Bank of Nova Scotia 38.54
7º UBS 94.47 27º Toronto-Dominion Bank 33.90
8º Royal Bank of Scotland Group 90.60 28º Banca Intesa 32.90
9º Wachovia 82.93 29º Austrália & New Zealand Banking Group 32.31
10º Banco Santander Central Hispano 79.64 30º Westpac Banking 31.03
11º Mizuho Financial Group 76.62 31º Banco Bradesco 28.70
12º ING Groep 71.87 32º Bank of Montreal 26.88
13º Sumitomo Mitsui Financial 68.99 33º Banco Itaú Holding Financeira 26.75
14º BNP Paribas 66.00 34º Sun Trust Banks 26.28
15º Unicredito Italiano 64.39 35º Hang Seng Bank 25.29
16º BBVA 60.05 36º Standard Chartered 25.26
17º U.S. Bancorp 55.04 37º Bank of New York 24.95
18º Credit Suisse Group 54.15 38º Dexia 24.14
19º Deutsche Bank 50.70 39º San Paolo-IMI 22.42
20º Société Générale 49.44 40º Canadian Imperial Bank of Commerce 22.36
27
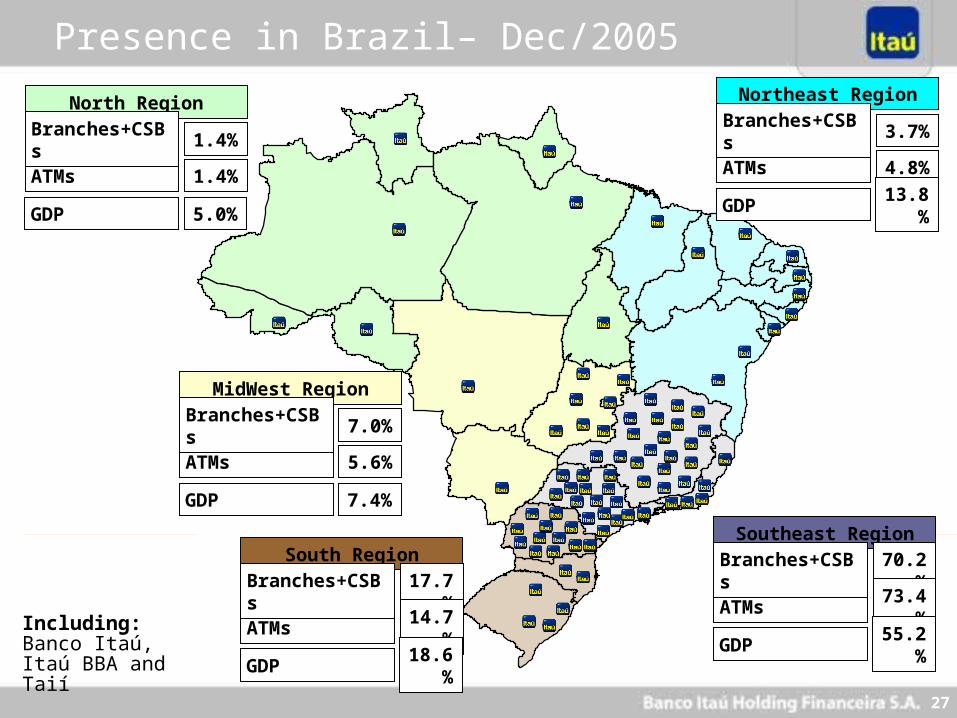
Presence in Brazil– Dec/2005
Including: Banco Itaú, Itaú BBA and Taií
ATMs
North Region
Branches+CSBs 1.4%
1.4%
GDP 5.0%
ATMs
MidWest Region
Branches+CSBs 7.0%
5.6%
GDP 7.4%
ATMs
South Region
Branches+CSBs 17.7%
14.7%
GDP 18.6%
ATMs
Southeast Region
Branches+CSBs 70.2%
73.4%
GDP 55.2%
ATMs
Northeast Region
Branches+CSBs 3.7%
4.8%
GDP 13.8%
28
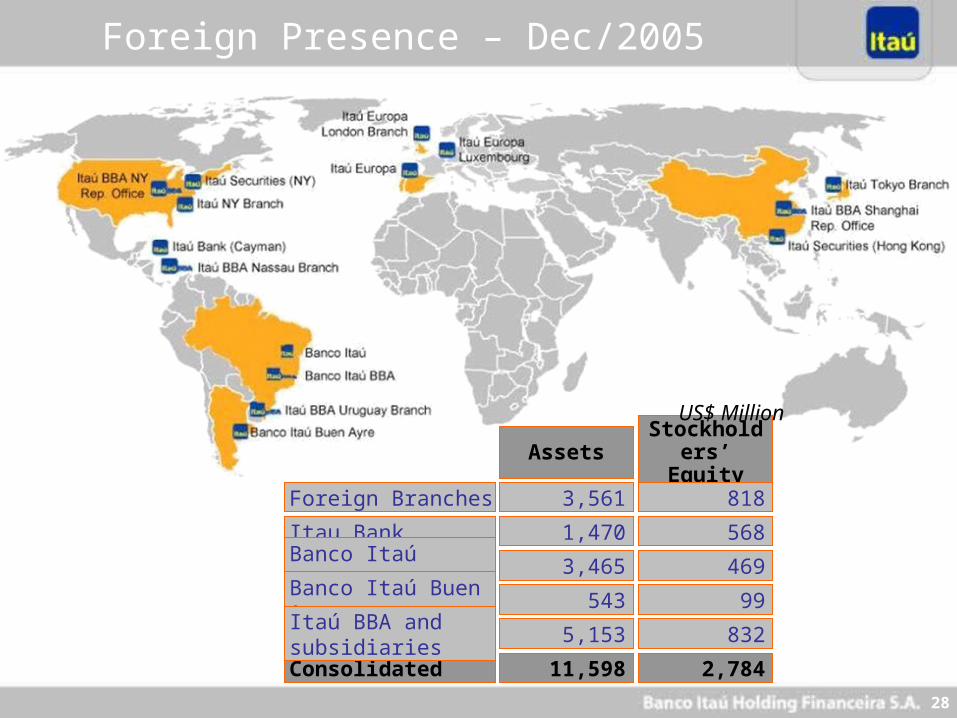
Foreign Presence – Dec/2005
Itau Bank 1,470 568
Banco Itaú Europa 3,465 469
Consolidated 11,598 2,784
Assets Stockholders’ Equity
Foreign Branches 3,561 818
Banco Itaú Buen Ayre 543 99
Itaú BBA and subsidiaries 5,153 832
US$ Million
29
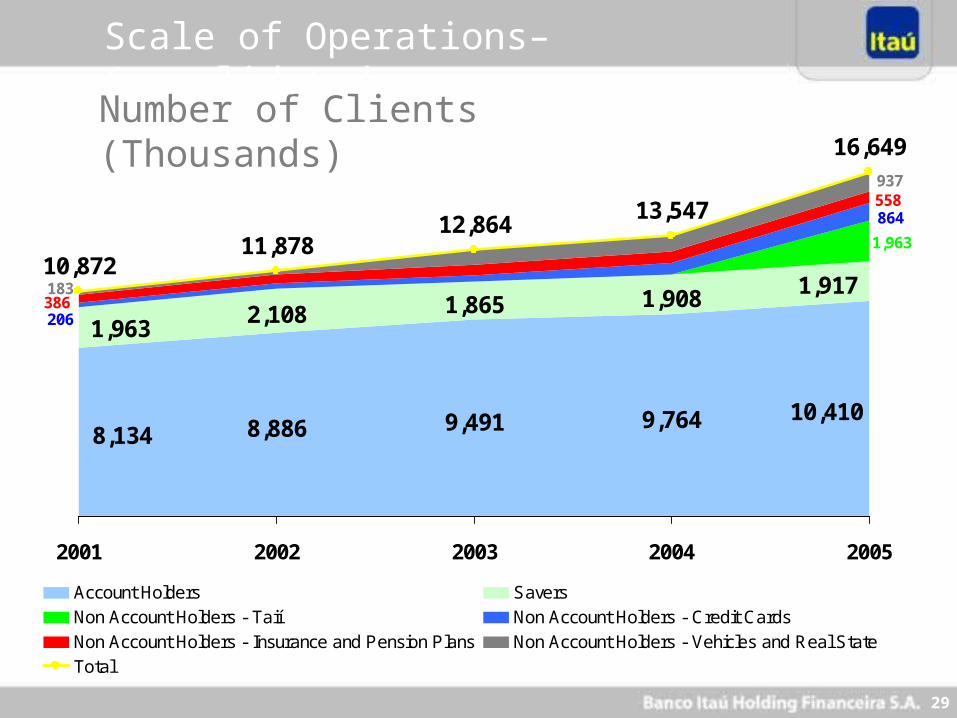
Number of Clients (Thousands)
Scale of Operations– Consolidated
8,886 9,491 9,764
2,108 1,865 1,908
10,4108,134
1,917
1,963
1,963
864
206
558
386
937
183
11,87812,864
13,547
16,649
10,872
2001 2002 2003 2004 2005
Account Holders Savers
Non Account Holders - Taií Non Account Holders - Credit Cards
Non Account Holders - Insurance and Pension Plans Non Account Holders - Vehicles and Real State
Total
30
Agenda
Brazilian Economy
Brazilian Banking System
Highlights Itaú
Itaú´s Positioning
2005 Results
Strategy
31
Highlights
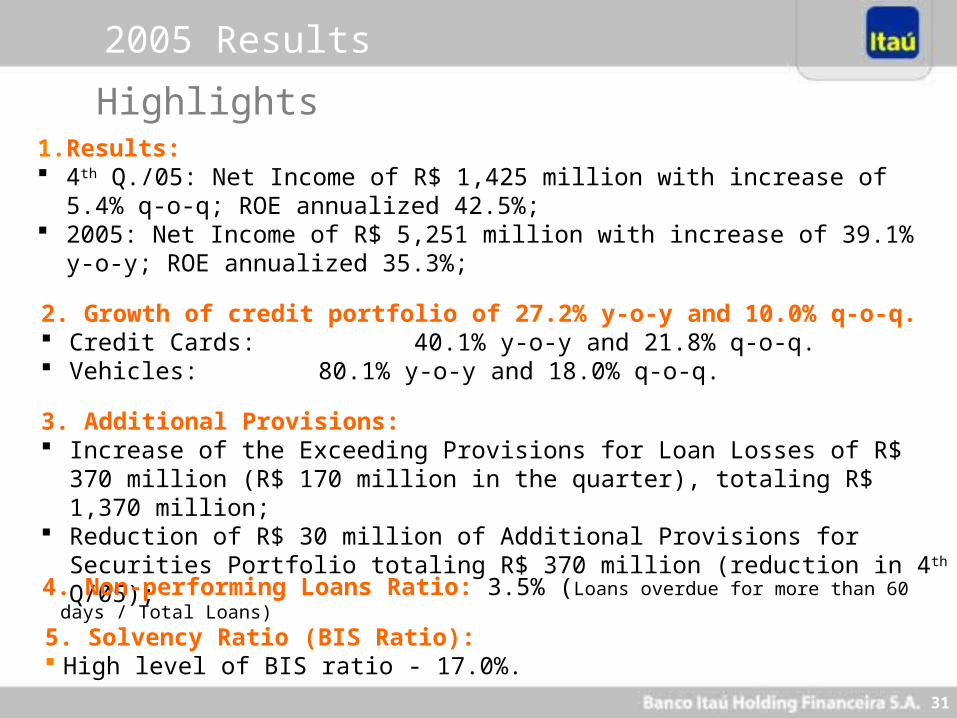
3. Additional Provisions: Increase of the Exceeding Provisions for Loan Losses of R$ 370 million (R$ 170
million in the quarter), totaling R$ 1,370 million; Reduction of R$ 30 million of Additional Provisions for Securities Portfolio totaling
R$ 370 million (reduction in 4th Q/05);
1. Results: 4th Q./05: Net Income of R$ 1,425 million with increase of 5.4% q-o-q; ROE
annualized 42.5%; 2005: Net Income of R$ 5,251 million with increase of 39.1% y-o-y; ROE
annualized 35.3%;
4. Non-performing Loans Ratio: 3.5% (Loans overdue for more than 60 days / Total Loans)
2. Growth of credit portfolio of 27.2% y-o-y and 10.0% q-o-q. Credit Cards: 40.1% y-o-y and 21.8% q-o-q. Vehicles: 80.1% y-o-y and 18.0% q-o-q.
5. Solvency Ratio (BIS Ratio): High level of BIS ratio - 17.0%.
2005 Results
32
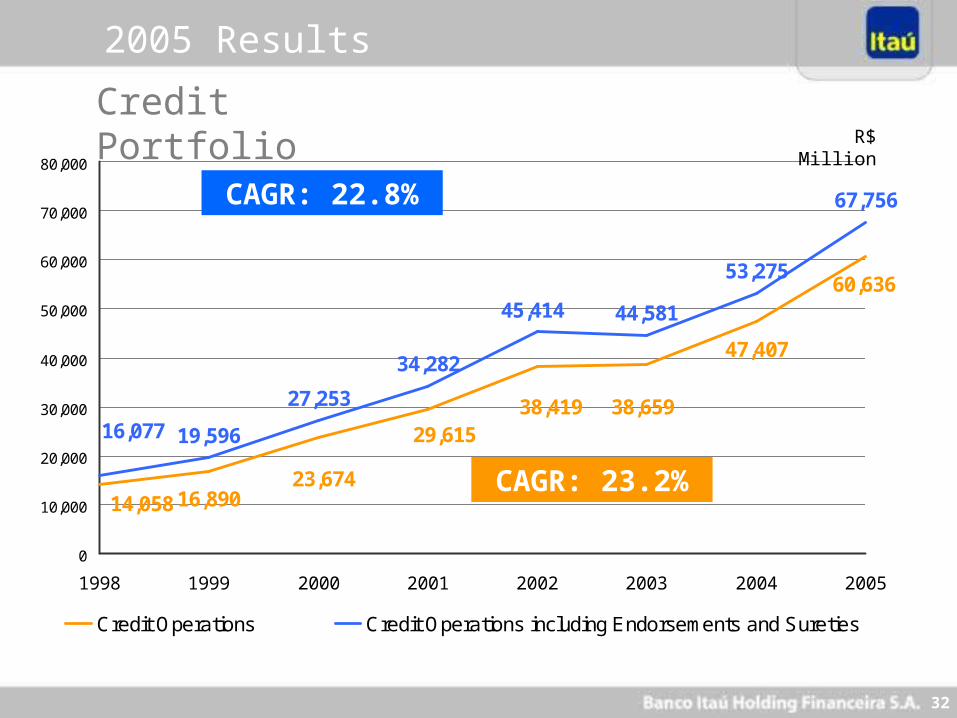
16,890
47,407
60,636
19,596
27,253
34,282
44,581
53,275
67,756
38,419 38,65929,615
23,67414,058
16,077
45,414
0
10,000
20,000
30,000
40,000
50,000
60,000
70,000
80,000
1998 1999 2000 2001 2002 2003 2004 2005
Credit Operations Credit Operations including Endorsements and Sureties
CAGR: 22.8%
CAGR: 23.2%
R$ Million
Credit Portfolio
2005 Results
33
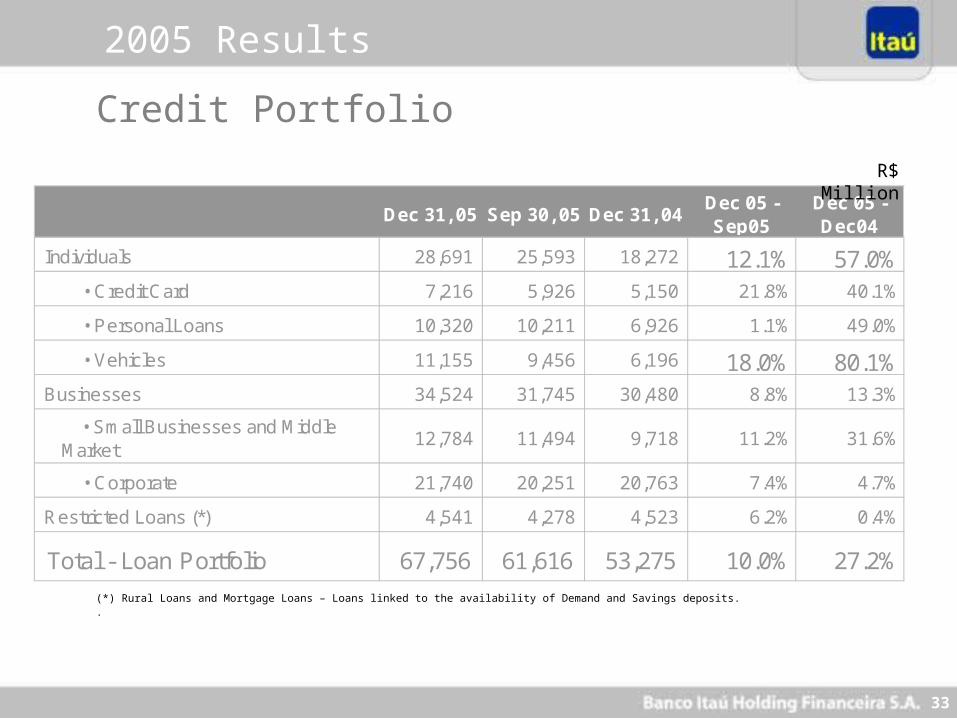
Dec 31, 05 Sep 30, 05 Dec 31, 04Dec 05 - Sep05
Dec 05 - Dec04
Individuals 28,691 25,593 18,272 12.1% 57.0% • Credit Card 7,216 5,926 5,150 21.8% 40.1%
• Personal Loans 10,320 10,211 6,926 1.1% 49.0%
• Vehicles 11,155 9,456 6,196 18.0% 80.1%Businesses 34,524 31,745 30,480 8.8% 13.3%
• Small Businesses and Middle Market
12,784 11,494 9,718 11.2% 31.6%
• Corporate 21,740 20,251 20,763 7.4% 4.7%
Restricted Loans (*) 4,541 4,278 4,523 6.2% 0.4%
Total - Loan Portfolio 67,756 61,616 53,275 10.0% 27.2%
(*) Rural Loans and Mortgage Loans – Loans linked to the availability of Demand and Savings deposits..
Credit Portfolio
R$ Million
2005 Results
34
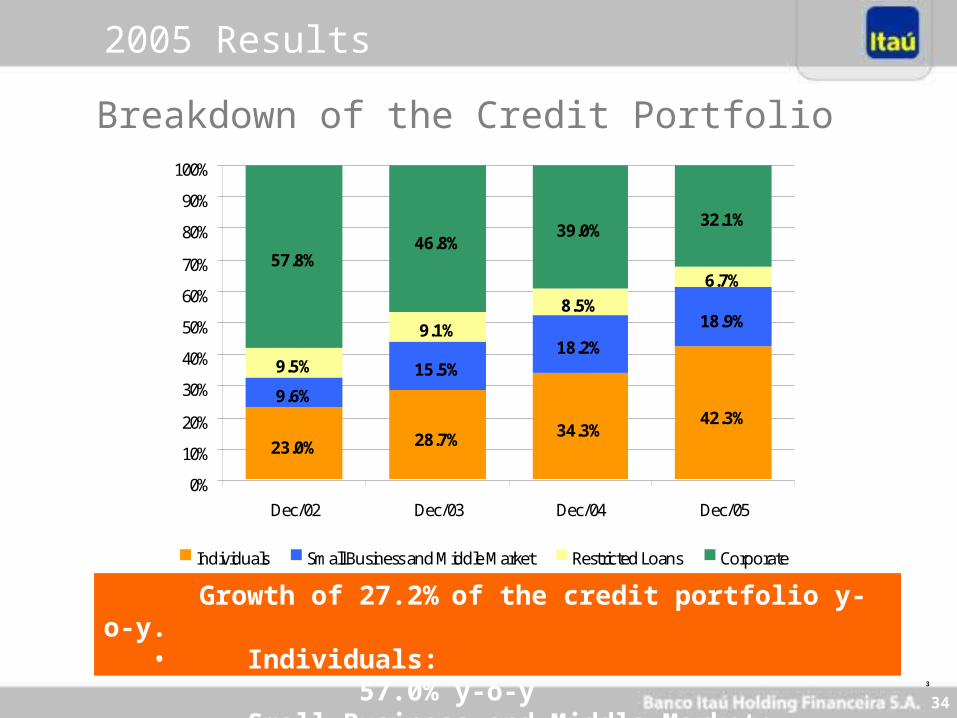
Growth of 27.2% of the credit portfolio y-o-y.• Individuals: 57.0% y-o-y• Small Business and Middle Market: 31.6% y-o-y
Breakdown of the Credit Portfolio
3
23.0% 28.7% 34.3%42.3%
9.6%
15.5%18.2%
18.9%
9.5%
9.1%
8.5%
57.8%46.8%
39.0%32.1%
6.7%
0%
10%
20%
30%
40%
50%
60%
70%
80%
90%
100%
Dec/02 Dec/03 Dec/04 Dec/05
Individuals Small Business and Middle Market Restricted Loans Corporate
2005 Results
35
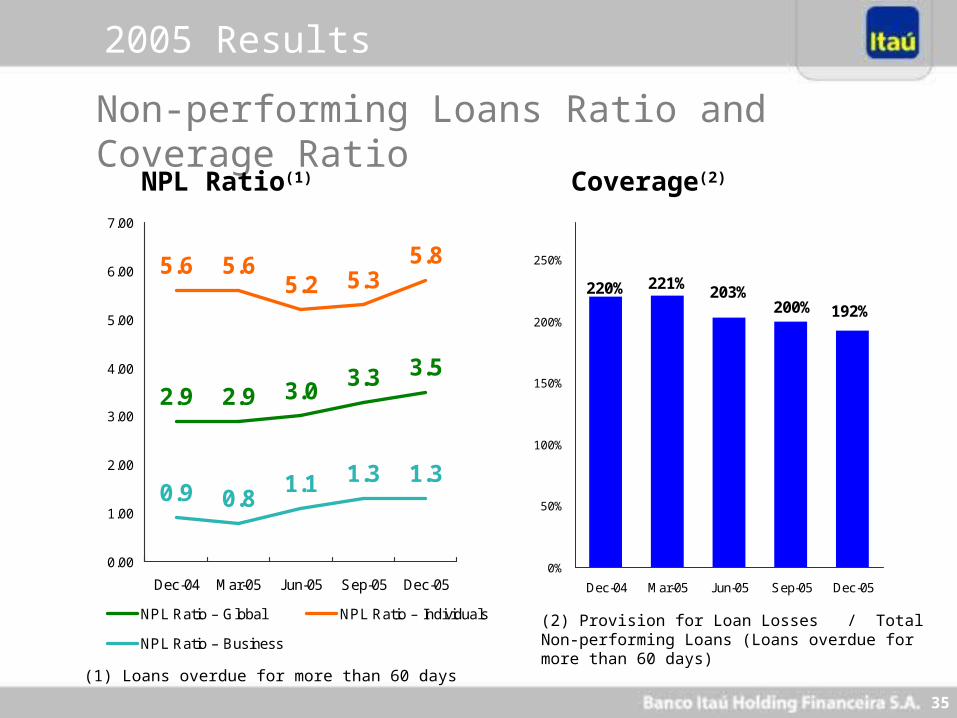
3.53.33.02.92.9
5.6 5.6 5.85.2 5.3
0.9 0.81.1 1.3 1.3
0.00
1.00
2.00
3.00
4.00
5.00
6.00
7.00
Dec-04 Mar-05 Jun-05 Sep-05 Dec-05
NPL Ratio – Global NPL Ratio – Individuals
NPL Ratio – Business
192%200%203%
221%220%
0%
50%
100%
150%
200%
250%
Dec-04 Mar-05 Jun-05 Sep-05 Dec-05
Non-performing Loans Ratio and Coverage Ratio
NPL Ratio(1) Coverage(2)
(2) Provision for Loan Losses / Total Non-performing Loans (Loans overdue for more than 60 days)
(1) Loans overdue for more than 60 days
2005 Results
36
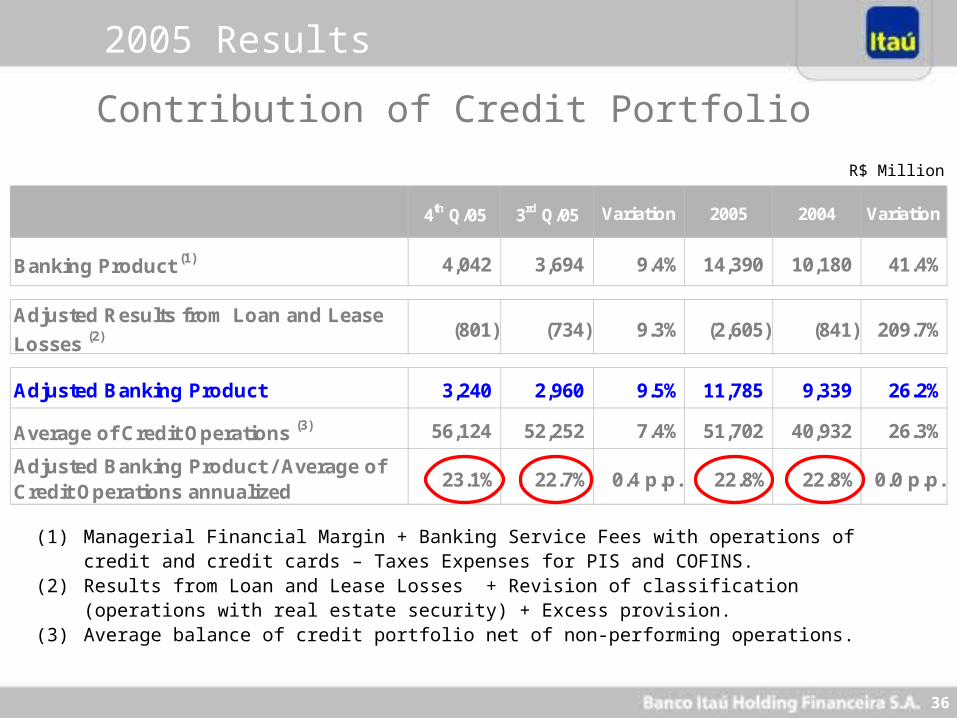
4th Q/05 3rd Q/05 Variation 2005 2004 Variation
Banking Product (1) 4,042 3,694 9.4% 14,390 10,180 41.4%
Adjusted Results from Loan and Lease
Losses (2) (801) (734) 9.3% (2,605) (841) 209.7%
Adjusted Banking Product 3,240 2,960 9.5% 11,785 9,339 26.2%
Average of Credit Operations (3) 56,124 52,252 7.4% 51,702 40,932 26.3%
Adjusted Banking Product / Average of Credit Operations annualized
23.1% 22.7% 0.4 p.p. 22.8% 22.8% 0.0 p.p.
R$ Million
Contribution of Credit Portfolio
(1) Managerial Financial Margin + Banking Service Fees with operations of credit and credit cards – Taxes Expenses for PIS and COFINS.
(2) Results from Loan and Lease Losses + Revision of classification (operations with real estate security) + Excess provision.
(3) Average balance of credit portfolio net of non-performing operations.
2005 Results
37
R$ Million
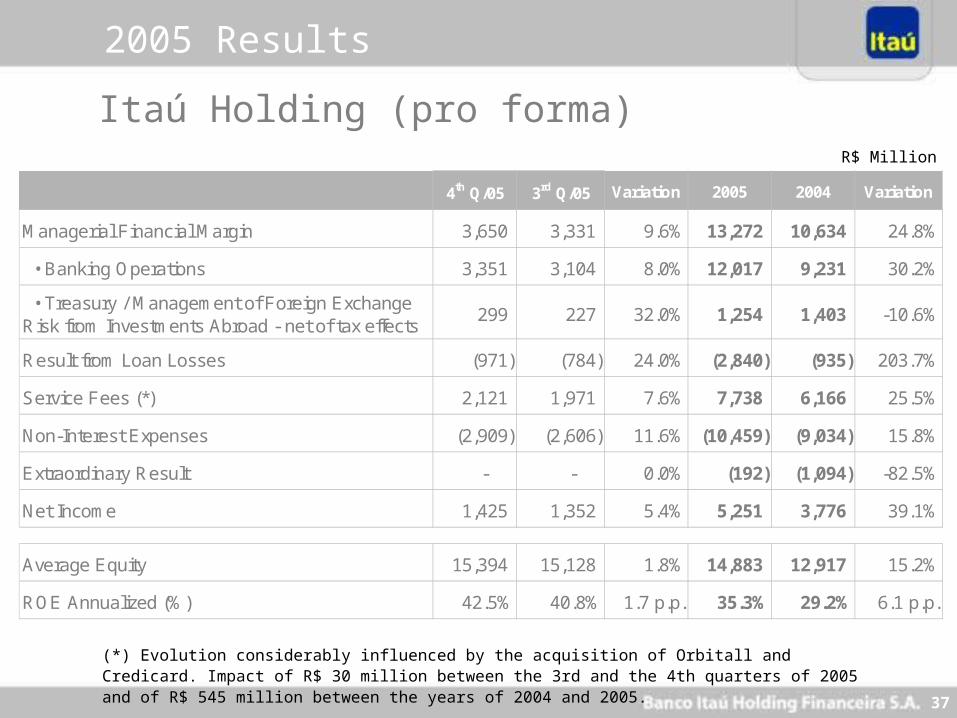
Itaú Holding (pro forma)
(*) Evolution considerably influenced by the acquisition of Orbitall and Credicard. Impact of R$ 30 million between the 3rd and the 4th quarters of 2005 and of R$ 545 million between the years of 2004 and 2005.
4th Q/05 3rd Q/05 Variation 2005 2004 Variation
Managerial Financial Margin 3,650 3,331 9.6% 13,272 10,634 24.8%
• Banking Operations 3,351 3,104 8.0% 12,017 9,231 30.2%
• Treasury / Management of Foreign Exchange Risk from Investments Abroad - net of tax effects
299 227 32.0% 1,254 1,403 -10.6%
Result from Loan Losses (971) (784) 24.0% (2,840) (935) 203.7%
Service Fees (*) 2,121 1,971 7.6% 7,738 6,166 25.5%
Non-Interest Expenses (2,909) (2,606) 11.6% (10,459) (9,034) 15.8%
Extraordinary Result - - 0.0% (192) (1,094) -82.5%
Net Income 1,425 1,352 5.4% 5,251 3,776 39.1%
Average Equity 15,394 15,128 1.8% 14,883 12,917 15.2%
ROE Annualized (%) 42.5% 40.8% 1.7 p.p. 35.3% 29.2% 6.1 p.p.
2005 Results
38
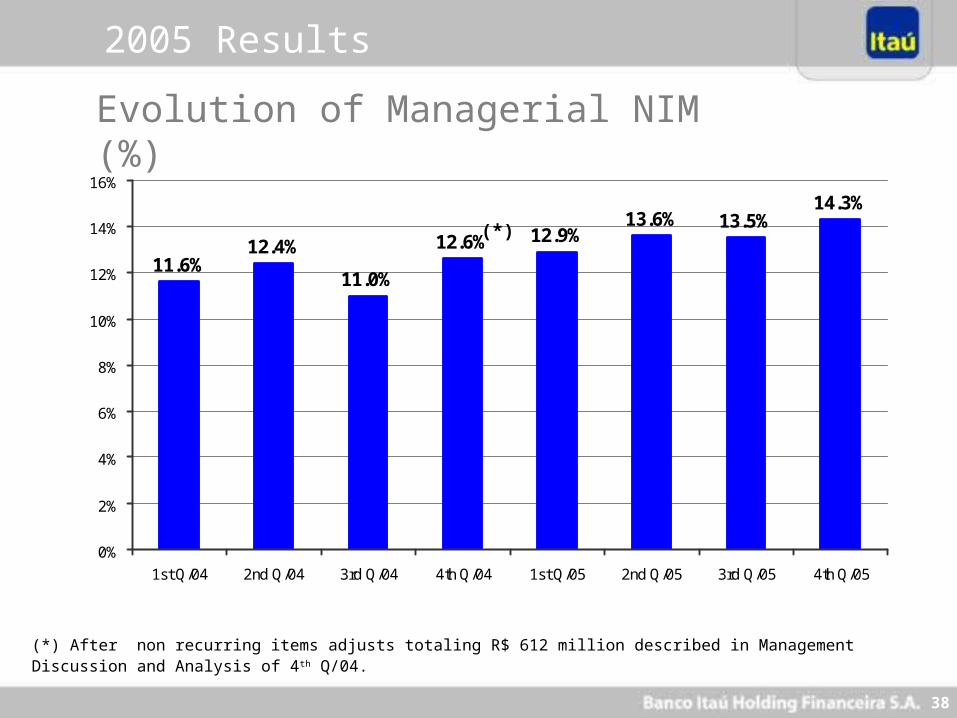
Evolution of Managerial NIM (%)
12.4%13.5%
14.3%
11.6%11.0%
12.6%13.6%
12.9%
0%
2%
4%
6%
8%
10%
12%
14%
16%
1st Q/04 2nd Q/04 3rd Q/04 4th Q/04 1st Q/05 2nd Q/05 3rd Q/05 4th Q/05
(*)
(*) After non recurring items adjusts totaling R$ 612 million described in Management Discussion and Analysis of 4 th Q/04.
2005 Results
39
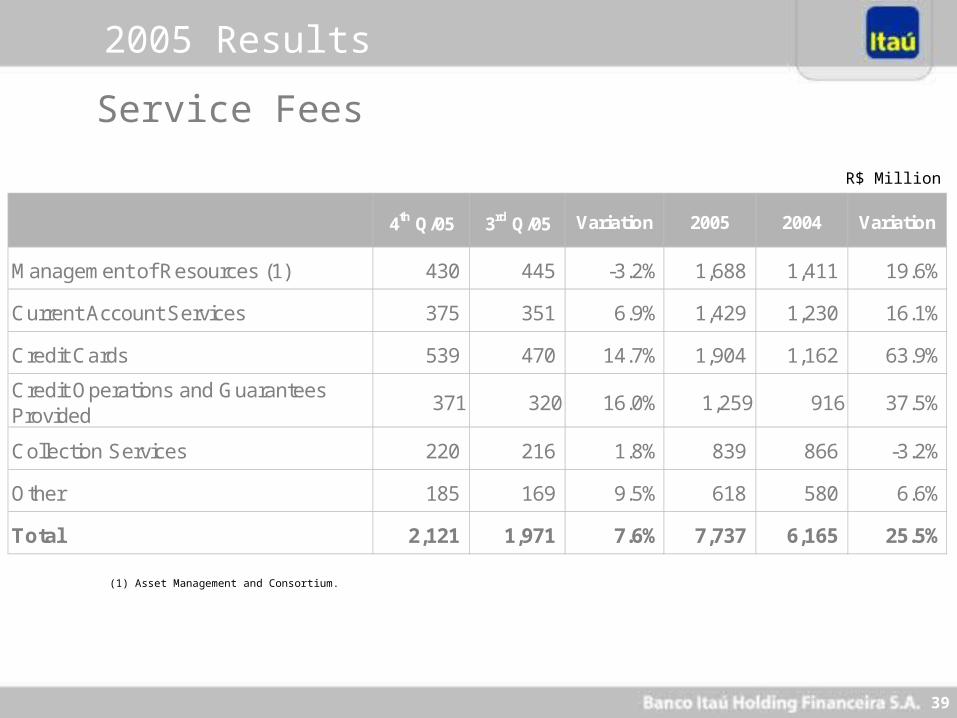
R$ Million
(1) Asset Management and Consortium.
Service Fees
4th Q/05 3rd Q/05 Variation 2005 2004 Variation
Management of Resources (1) 430 445 -3.2% 1,688 1,411 19.6%
Current Account Services 375 351 6.9% 1,429 1,230 16.1%
Credit Cards 539 470 14.7% 1,904 1,162 63.9%
Credit Operations and Guarantees Provided
371 320 16.0% 1,259 916 37.5%
Collection Services 220 216 1.8% 839 866 -3.2%
Other 185 169 9.5% 618 580 6.6%
Total 2,121 1,971 7.6% 7,737 6,165 25.5%
2005 Results
40
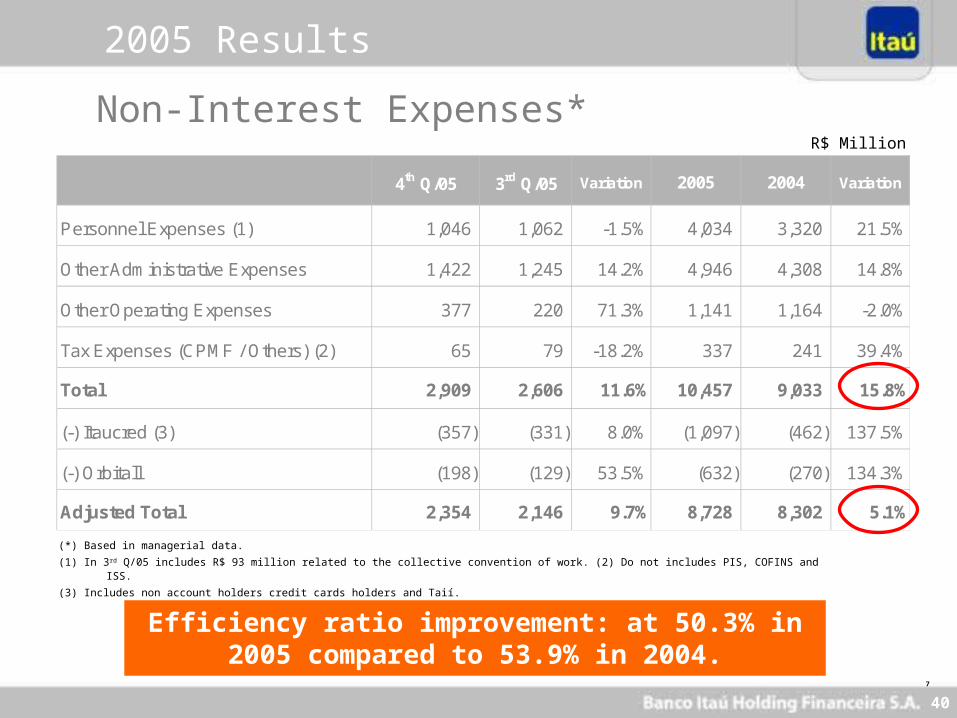
4th Q/05 3rd Q/05 Variation 2005 2004 Variation
Personnel Expenses (1) 1,046 1,062 -1.5% 4,034 3,320 21.5%
Other Administrative Expenses 1,422 1,245 14.2% 4,946 4,308 14.8%
Other Operating Expenses 377 220 71.3% 1,141 1,164 -2.0%
Tax Expenses (CPMF / Others) (2) 65 79 -18.2% 337 241 39.4%
Total 2,909 2,606 11.6% 10,457 9,033 15.8%
(-) Itaucred (3) (357) (331) 8.0% (1,097) (462) 137.5%
(-) Orbitall (198) (129) 53.5% (632) (270) 134.3%
Adjusted Total 2,354 2,146 9.7% 8,728 8,302 5.1%
R$ Million
(*) Based in managerial data.
(1) In 3rd Q/05 includes R$ 93 million related to the collective convention of work. (2) Do not includes PIS, COFINS and ISS.
(3) Includes non account holders credit cards holders and Taií.
Non-Interest Expenses*
Efficiency ratio improvement: at 50.3% in 2005 compared to 53.9% in 2004.
7
2005 Results
41
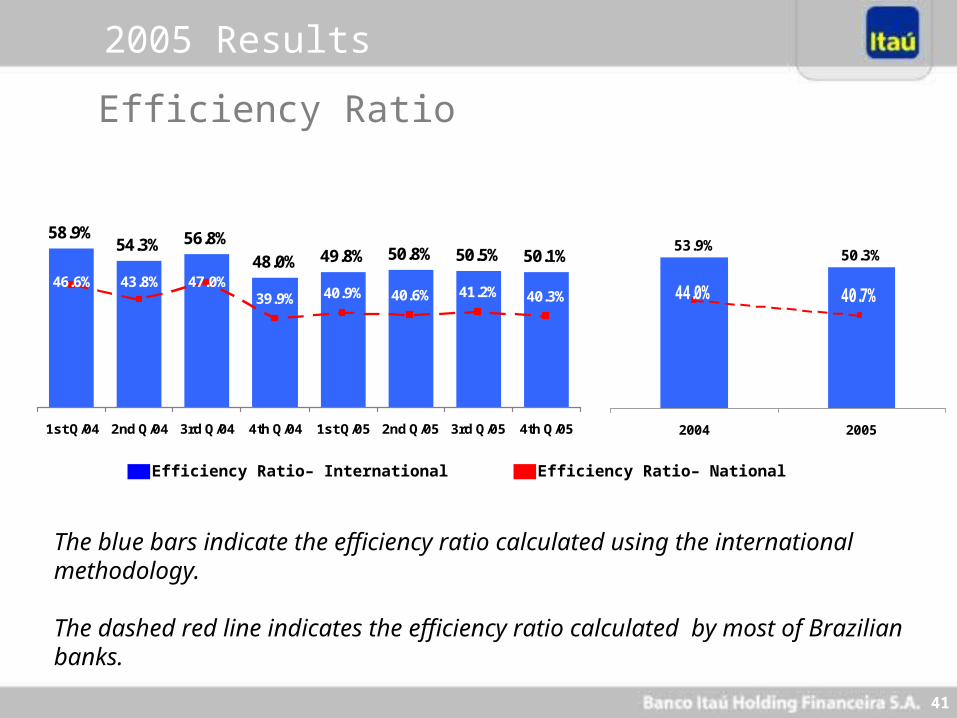
53.9%50.3%
2004 2005
44.0% 40.7%
58.9%54.3% 56.8%
48.0% 49.8% 50.8% 50.5% 50.1%
1st Q/04 2nd Q/04 3rd Q/04 4th Q/04 1st Q/05 2nd Q/05 3rd Q/05 4th Q/05
46.6% 43.8% 47.0%39.9% 41.2% 40.3%40.6%40.9%
Efficiency Ratio– International
Efficiency Ratio
The blue bars indicate the efficiency ratio calculated using the international methodology.
The dashed red line indicates the efficiency ratio calculated by most of Brazilian banks.
Efficiency Ratio– National
2005 Results

42
(*) Values differ from the one published in note “Market Value” because they are net of the additional provision for securities.
Conservative Accounting Practices
SecuritiesAdjust. market value
Additional Provision
Total
Additional Provision for Loan Losses (PDD)
Financial Instruments: Market vs. Recorded Value(*)
R$ 435 million
R$ 370 million
R$ 3,6 billion
12/31/05
R$ 1,37 billion
R$ 1,4 billion
R$ 733 million
R$ 400 million
R$ 3,8 billion
12/31/04
R$ 1,0 billion
R$ 1,67 billion
R$ 758 million
R$ 545 million
R$ 3,7 billion
12/31/03
R$ 906 million
R$ 1,5 billion
2005 Results
43
Agenda
Brazilian Economy
Brazilian Banking System
Highlights Itaú
Itaú´s Positioning
2005 Results
Strategy
44
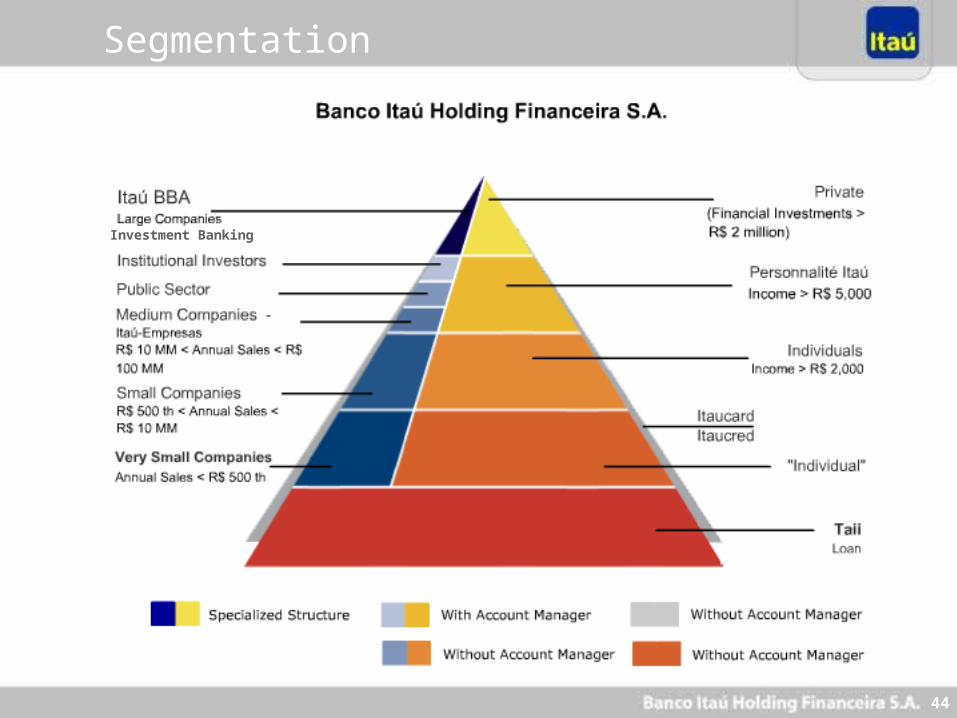
Segmentation
Investment Banking
45
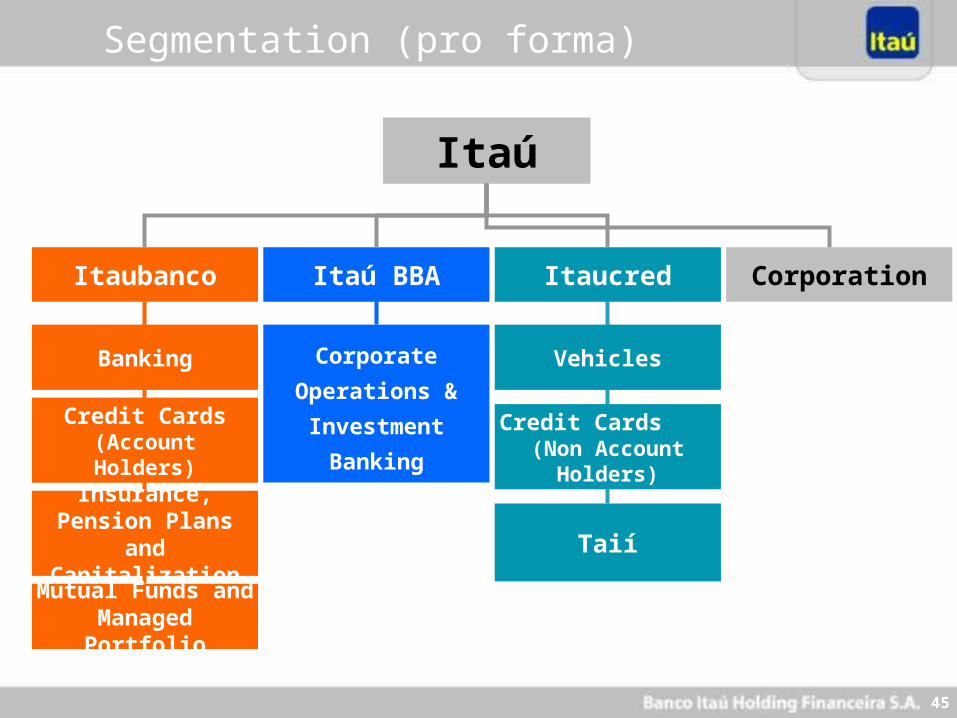
Itaú
ItaucredItaú BBAItaubanco
Banking
Credit Cards (Account Holders)
Insurance, Pension Plans
and CapitalizationMutual Funds and Managed
Portfolio
Corporation
Corporate
Operations &
Investment
Banking
Vehicles
Credit Cards (Non Account
Holders)
Taií
Segmentation (pro forma)
46
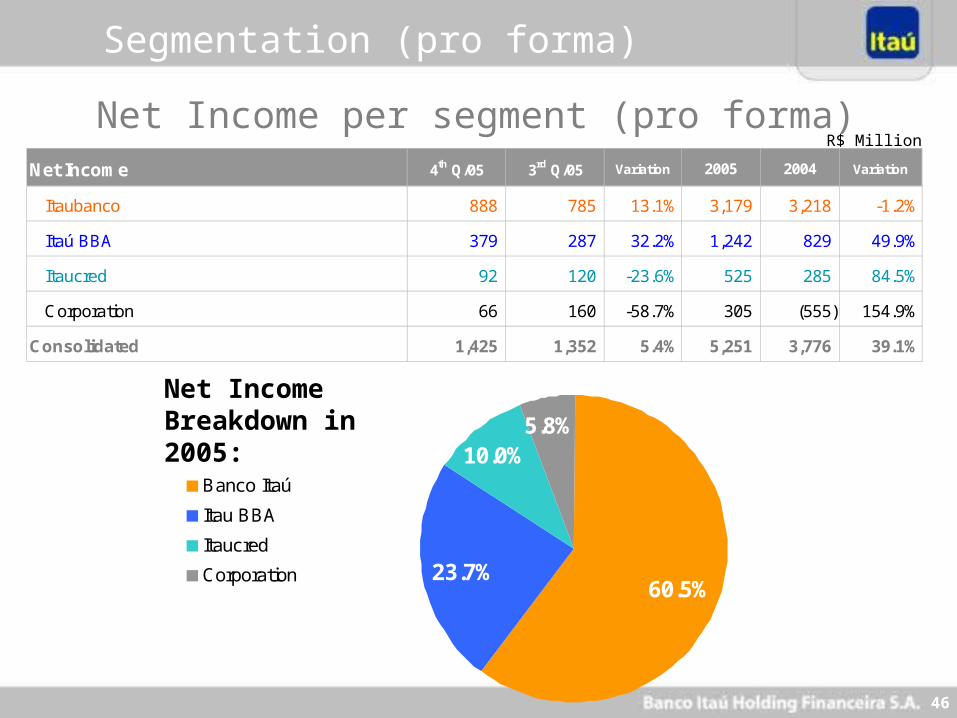
Net Income 4th Q/05 3rd Q/05 Variation 2005 2004 Variation
Itaubanco 888 785 13.1% 3,179 3,218 -1.2%
Itaú BBA 379 287 32.2% 1,242 829 49.9%
Itaucred 92 120 -23.6% 525 285 84.5%
Corporation 66 160 -58.7% 305 (555) 154.9%
Consolidated 1,425 1,352 5.4% 5,251 3,776 39.1%
R$ MillionNet Income per segment (pro forma)
23.7%
10.0%5.8%
60.5%
Banco Itaú
Itau BBA
Itaucred
Corporation
Net Income Breakdown in 2005:
Segmentation (pro forma)
47
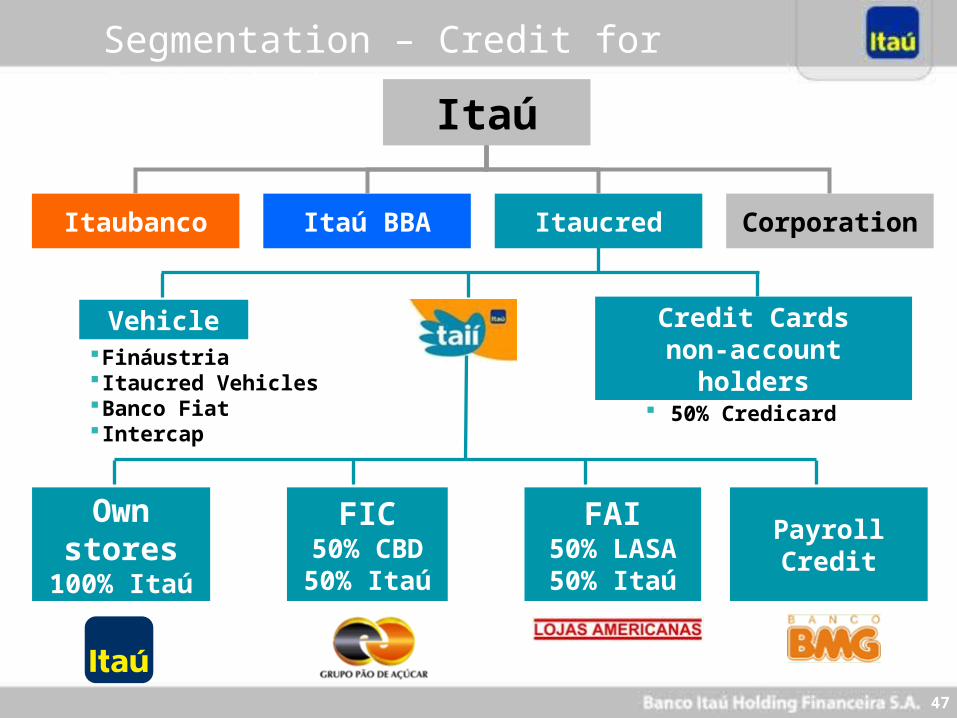
Itaú
CorporationItaucredItaú BBAItaubanco
FIC50% CBD50% Itaú
FAI50% LASA50% Itaú
Own stores
100% Itaú
Payroll Credit
FináustriaItaucred VehiclesBanco FiatIntercap
Vehicle Credit Cardsnon-account
holders 50% Credicard
Segmentation – Credit for Individuals
48
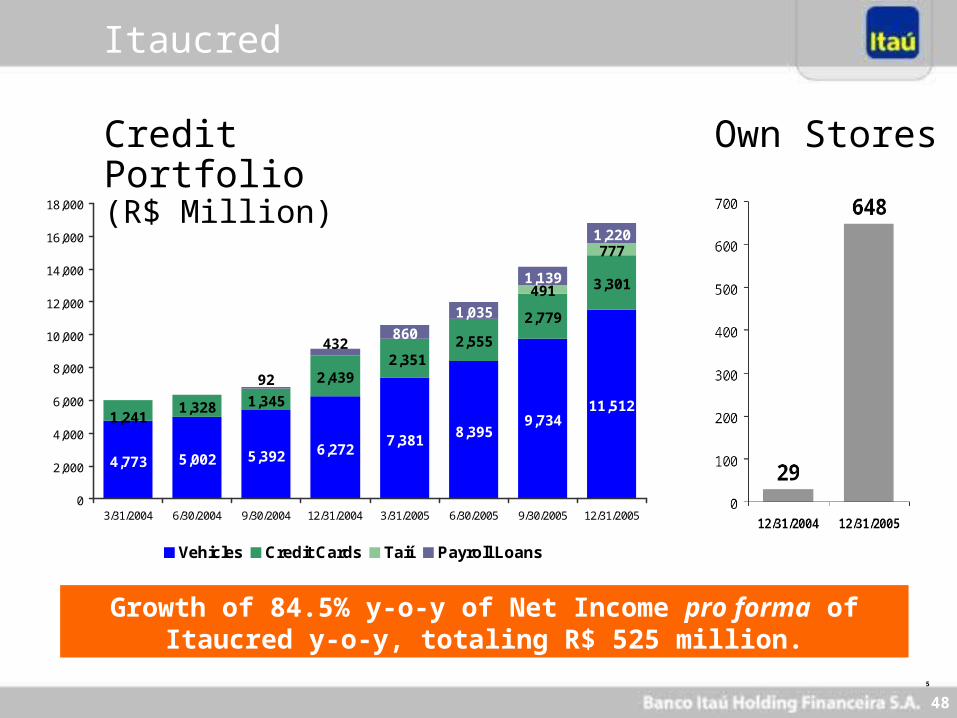
5,002
9,73411,5121,328 1,345
2,439
2,555
2,779
3,301491
777
860
1,035
1,139
1,220
4,773 5,392 6,2728,395
7,381
2,351
1,241
92
432
0
2,000
4,000
6,000
8,000
10,000
12,000
14,000
16,000
18,000
3/31/2004 6/30/2004 9/30/2004 12/31/2004 3/31/2005 6/30/2005 9/30/2005 12/31/2005
Vehicles Credit Cards Taií Payroll Loans
Growth of 84.5% y-o-y of Net Income pro forma of Itaucred y-o-y, totaling R$ 525 million.
Credit Portfolio (R$ Million)
Own Stores
5
Itaucred
49
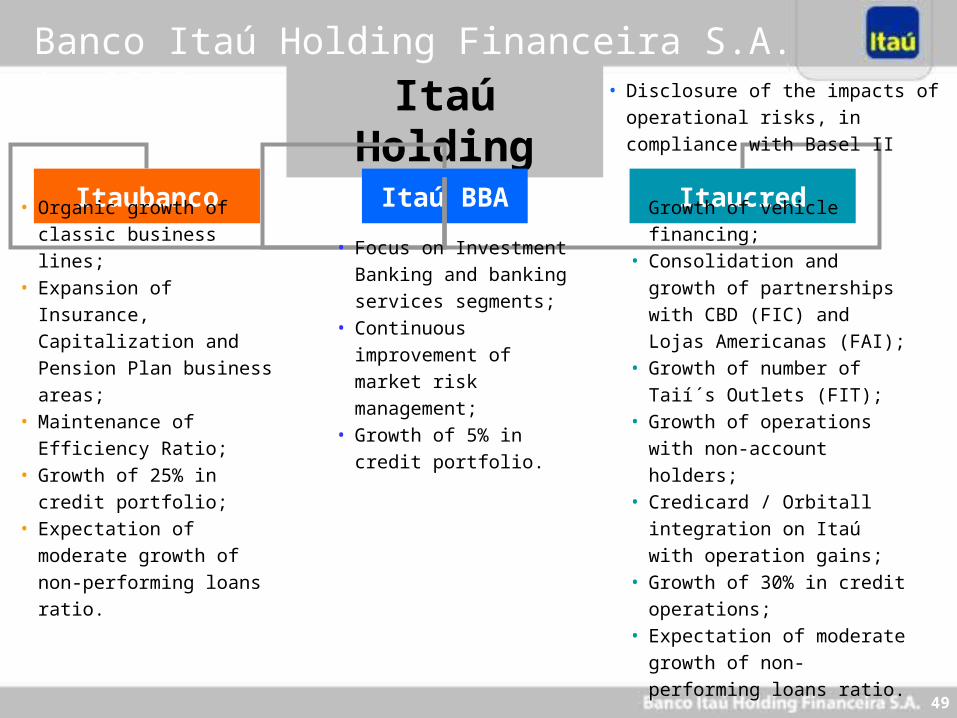
Itaú Holding
ItaucredItaú BBAItaubanco
• Organic growth of classic
business lines;• Expansion of Insurance,
Capitalization and Pension
Plan business areas;• Maintenance of Efficiency
Ratio;• Growth of 25% in credit
portfolio; • Expectation of moderate
growth of non-performing
loans ratio.
• Focus on Investment
Banking and banking
services segments;• Continuous improvement
of market risk
management;• Growth of 5% in credit
portfolio.
• Growth of vehicle financing;• Consolidation and growth of
partnerships with CBD (FIC)
and Lojas Americanas (FAI);• Growth of number of Taií´s
Outlets (FIT);• Growth of operations with non-
account holders;• Credicard / Orbitall integration
on Itaú with operation gains;• Growth of 30% in credit
operations;• Expectation of moderate
growth of non-performing loans
ratio.
• Disclosure of the impacts of operational
risks, in compliance with Basel II
Banco Itaú Holding Financeira S.A. in 2006
50
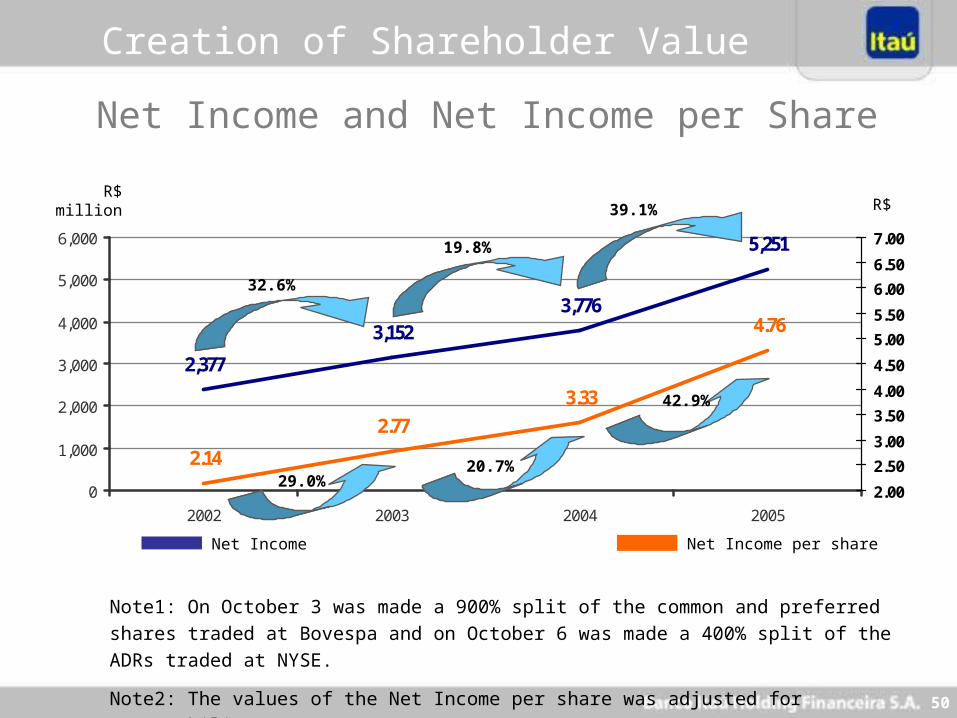
R$
3,1523,776
5,251
2,377
3.33
4.76
2.77
2.14
0
1,000
2,000
3,000
4,000
5,000
6,000
2002 2003 2004 2005
2.00
2.50
3.00
3.50
4.00
4.50
5.00
5.50
6.00
6.50
7.00
Net Income per shareNet Income
R$ million
Note1: On October 3 was made a 900% split of the common and preferred shares traded at
Bovespa and on October 6 was made a 400% split of the ADRs traded at NYSE.
Note2: The values of the Net Income per share was adjusted for comparability purposes.
Net Income and Net Income per Share
19.8%
39.1%
20.7%
42.9%
29.0%
32.6%
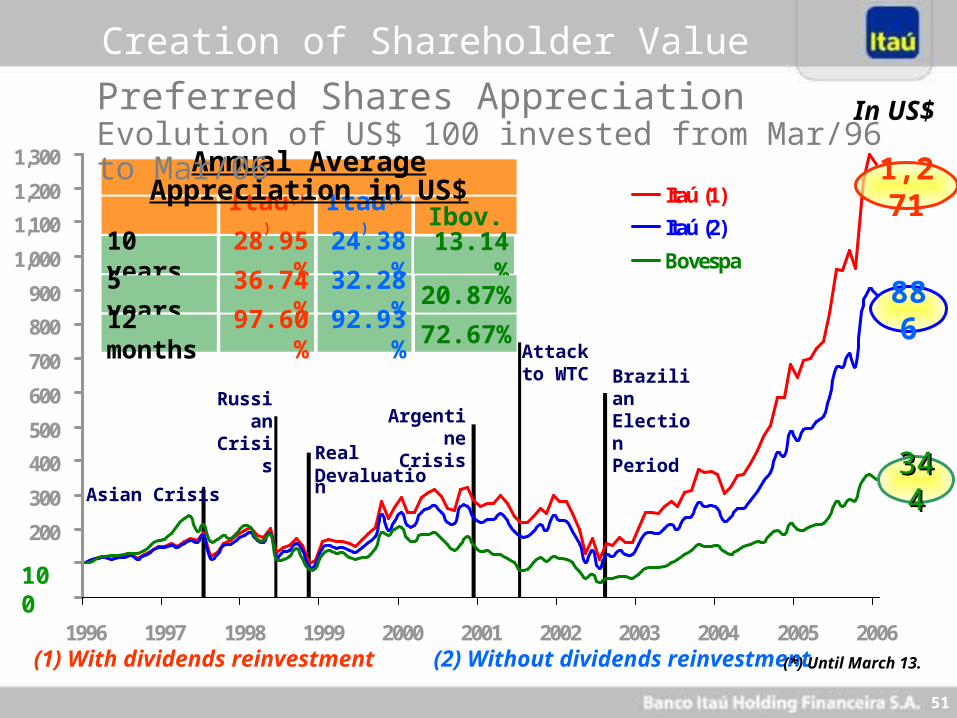
Creation of Shareholder Value
51
0
100
200
300
400
500
600
700
800
900
1,000
1,100
1,200
1,300
1996 1997 1998 1999 2000 2001 2002 2003 2004 2005 2006
Itaú (1)
Itaú (2)
Bovespa
In US$
100
Itaú(1) Itaú(2) Ibov.
10 years 28.95% 24.38% 13.14%
5 years 36.74% 32.28% 20.87%
12 months 97.60% 92.93% 72.67%
Annual Average Appreciation in US$
Preferred Shares AppreciationEvolution of US$ 100 invested from Mar/96 to Mar/06
Asian Crisis
Russian Crisis
Real Devaluation
Argentine Crisis
Attack to WTC
Brazilian Election Period
(1) With dividends reinvestment (2) Without dividends reinvestment
Creation of Shareholder Value
886
344344
1,271
(*) Until March 13.
March 2006
Silvio de CarvalhoExecutive Director
Roadshow
Related Documents