March 11, 2011 ICICIdirect.com | Equity Research Initiating Coverage ICICI Securities Limited Exhibit 1: Valuation Metrics (| Crore) (Year-end March) FY09 FY10 FY11E FY12E FY13E Net Sales 12,319.1 15,758.2 19,150.7 22,245.0 24,558.9 EBITDA 1,684.4 2,662.0 2,429.8 2,681.0 3,147.4 PAT 1,281.8 2,231.8 1,942.7 2,206.9 2,520.6 EPS (|) 64.2 111.8 97.3 110.5 126.2 P/E (x) 23.8 13.7 15.7 13.8 12.1 Price / Book (x) 8.0 8.8 6.2 4.6 3.5 EV/EBITDA (x) 16.2 9.4 9.8 7.9 6.0 RoCE (%) 38.8 70.0 44.0 35.8 32.1 RoE (%) 33.7 64.4 39.3 33.0 28.9 Source: Company, ICICIdirect.com Research “Splendorous” Hero to ride solo… Hero Honda (HHL) is the largest two wheeler manufacturer in the world and caters to the mass segment in the domestic two-wheeler industry. With strong brand equity (Splendor, Passion) along with a strong sales and distribution network, we believe it will be a key beneficiary of the structural demand growth originating from the strong and ever-growing middle class in the rural and urban regions. It recently underwent a JV break-up with Honda, which has left it with opportunities and challenges. Its higher operating costs and downward trending margins have received no respite from steep input prices and increased selling expenses. We project revenues and PAT will grow at 15.9% and 4.1% CAGR over FY10-13E to | 24,559 crore and | 2,521 crore, respectively. We are initiating coverage on Hero Honda with an ADD rating. Economics and demographics sweeten long term growth prospects The Indian economy along with China is the leader in growth among emerging markets. With improvements in disposable incomes for the growing middle class (~35 million household above | 2 lakh p.a. income) and younger demographics position (median age ~37 years) India is at the beginning of a long-term consumption boom. We believe the boom would be strongly driven by rural segment along with urban support as the middle class size is expected to more than double in the next decade. Strong brand equity to continue driving sales Hero Honda has mammoth brands in Splendor and Passion that contribute ~75% of total sales volumes. The brands have continued to be leaders for more than a decade due to strong, stable and consistent consumer outlook towards the same. We believe brand recognition/belief and wide distribution reach are critical aspects of sales in India. This would help Hero Honda to maintain its position in the wake of higher competition. Valuations At the current market price of | 1530, HHL is trading at 13.8x FY12E EPS of | 110.5 and 12.1x FY13E EPS of | 126.2.We have factored in positive growth for HHL. However, concerns related to margins remain a dampener towards the stock outlook. We have valued the stock on a P/E multiple basis at 13x FY13E EPS of | 126.2. The multiple assigned has been conservative due to the margin maintenance overhang on the stock. We are initiating coverage on Hero Honda with an ADD rating at a target price of | 1641 with a 7% upside potential. Hero Honda (HERHON) | 1530 Rating Matrix Rating : Add Target : | 1641 Target Period : 12 months Potential Upside : 7% YoY Growth (%) (YoY Growth) FY10 FY11E FY12E FY13E Net Sales 27.9 21.5 16.2 10.4 EBITDA 58.0 (8.7) 10.3 17.4 Net Profit 74.1 (13.0) 13.6 14.2 EPS (|) 74.1 (13.0) 13.6 14.2 Current & target multiple FY10 FY11E FY12E FY13E P/E 13.7 15.7 13.8 12.1 Target P/E 14.7 16.9 14.8 13.0 EV / EBITDA 9.4 9.8 7.9 6.0 Target EV / EBITDA 10.2 10.6 8.6 6.6 P/BV 8.8 6.2 4.6 3.5 Target P/BV 9.5 6.6 4.9 3.8 Stock Data Bloomberg/Reuters Code HH IS / HROH.NS Sensex 18,174.1 Average volumes 535,091 Market Cap (Rs crore) 30,706.9 52 week H/L 2086 / 1391 Equity Capital (Rs crore) 39.9 Promoter's Stake (%) 52.2 FII Holding (%) 33.5 DII Holding (%) 4.6 Comparative return matrix (%) Return % 1M 3M 6M 12M Hero Honda Motors 6.0 (13.9) (11.4) (20.8) Bajaj Auto 15.8 (6.0) (4.0) 51.5 TVS Motors 17.2 (21.3) (27.5) 49.1 Price movement 0 500 1,000 1,500 2,000 2,500 Mar-11 Dec-10 Sep-10 Jun-10 Mar-10 0 1,000 2,000 3,000 4,000 5,000 6,000 7,000 Price (R.H.S) Nifty (L.H.S) Analyst’s name Karan Mittal [email protected] Nishant Vass [email protected]

Welcome message from author
This document is posted to help you gain knowledge. Please leave a comment to let me know what you think about it! Share it to your friends and learn new things together.
Transcript

March 11, 2011
ICICIdirect.com | Equity Research
Initiating Coverage
ICICI Securities Limited
Exhibit 1: Valuation Metrics (| Crore)
(Year-end March) FY09 FY10 FY11E FY12E FY13ENet Sales 12,319.1 15,758.2 19,150.7 22,245.0 24,558.9 EBITDA 1,684.4 2,662.0 2,429.8 2,681.0 3,147.4 PAT 1,281.8 2,231.8 1,942.7 2,206.9 2,520.6 EPS (|) 64.2 111.8 97.3 110.5 126.2 P/E (x) 23.8 13.7 15.7 13.8 12.1 Price / Book (x) 8.0 8.8 6.2 4.6 3.5 EV/EBITDA (x) 16.2 9.4 9.8 7.9 6.0 RoCE (%) 38.8 70.0 44.0 35.8 32.1 RoE (%) 33.7 64.4 39.3 33.0 28.9
Source: Company, ICICIdirect.com Research
“Splendorous” Hero to ride solo… Hero Honda (HHL) is the largest two wheeler manufacturer in the world and caters to the mass segment in the domestic two-wheeler industry. With strong brand equity (Splendor, Passion) along with a strong sales and distribution network, we believe it will be a key beneficiary of the structural demand growth originating from the strong and ever-growing middle class in the rural and urban regions. It recently underwent a JV break-up with Honda, which has left it with opportunities and challenges. Its higher operating costs and downward trending margins have received no respite from steep input prices and increased selling expenses. We project revenues and PAT will grow at 15.9% and 4.1% CAGR over FY10-13E to | 24,559 crore and | 2,521 crore, respectively. We are initiating coverage on Hero Honda with an ADD rating.
Economics and demographics sweeten long term growth prospects The Indian economy along with China is the leader in growth among emerging markets. With improvements in disposable incomes for the growing middle class (~35 million household above | 2 lakh p.a. income) and younger demographics position (median age ~37 years) India is at the beginning of a long-term consumption boom. We believe the boom would be strongly driven by rural segment along with urban support as the middle class size is expected to more than double in the next decade.
Strong brand equity to continue driving sales Hero Honda has mammoth brands in Splendor and Passion that contribute ~75% of total sales volumes. The brands have continued to be leaders for more than a decade due to strong, stable and consistent consumer outlook towards the same. We believe brand recognition/belief and wide distribution reach are critical aspects of sales in India. This would help Hero Honda to maintain its position in the wake of higher competition.
Valuations At the current market price of | 1530, HHL is trading at 13.8x FY12E EPS of | 110.5 and 12.1x FY13E EPS of | 126.2.We have factored in positive growth for HHL. However, concerns related to margins remain a dampener towards the stock outlook. We have valued the stock on a P/E multiple basis at 13x FY13E EPS of | 126.2. The multiple assigned has been conservative due to the margin maintenance overhang on the stock. We are initiating coverage on Hero Honda with an ADD rating at a target price of | 1641 with a 7% upside potential.
Hero Honda (HERHON) | 1530
Rating Matrix Rating : Add
Target : | 1641
Target Period : 12 months
Potential Upside : 7%
YoY Growth (%) (YoY Growth) FY10 FY11E FY12E FY13ENet Sales 27.9 21.5 16.2 10.4 EBITDA 58.0 (8.7) 10.3 17.4 Net Profit 74.1 (13.0) 13.6 14.2 EPS (|) 74.1 (13.0) 13.6 14.2
Current & target multiple FY10 FY11E FY12E FY13E
P/E 13.7 15.7 13.8 12.1 Target P/E 14.7 16.9 14.8 13.0 EV / EBITDA 9.4 9.8 7.9 6.0 Target EV / EBITDA 10.2 10.6 8.6 6.6 P/BV 8.8 6.2 4.6 3.5 Target P/BV 9.5 6.6 4.9 3.8
Stock Data Bloomberg/Reuters Code HH IS / HROH.NSSensex 18,174.1
Average volumes 535,091 Market Cap (Rs crore) 30,706.9
52 week H/L 2086 / 1391
Equity Capital (Rs crore) 39.9 Promoter's Stake (%) 52.2 FII Holding (%) 33.5 DII Holding (%) 4.6
Comparative return matrix (%)
Return % 1M 3M 6M 12MHero Honda Motors 6.0 (13.9) (11.4) (20.8) Bajaj Auto 15.8 (6.0) (4.0) 51.5 TVS Motors 17.2 (21.3) (27.5) 49.1
Price movement
0
500
1,000
1,500
2,000
2,500
Mar-11Dec-10Sep-10Jun-10Mar-10
0
1,000
2,000
3,000
4,000
5,000
6,000
7,000
Price (R.H.S) Nifty (L.H.S)
Analyst’s name
Karan Mittal [email protected]
Nishant Vass [email protected]

ICICIdirect.com | Equity Research Page 2
ICICI Securities Limited
Company Background Hero Honda Motors (HHL) is the world's largest two-wheeler manufacturing company with the company having three manufacturing facilities, namely Dharuhera, Gurgaon at Haryana and Hardwar at Uttarakhand. The company was incorporated in 1984 as a joint venture (JV) company between Honda Motor Company of Japan and the Hero Group. Both parties owned 26% each in the JV and the technology sharing agreement is renewed every 10 years.
HHL has been a market leader for more than a decade. Even in the wake of rising competition, it still has a market share of ~44% in the two-wheeler segment. Further, in the motorcycle segment, which comprises ~79% of the two-wheeler segment, it has a market share in excess of 53%. One of the major drivers of volumes has always been the strong product acceptance for Splendor and Passion among the masses along with the extensive dealer and service network. At present, the company has ~750 dealers spread across India and has continued to increase its penetration among the underdeveloped towns and villages. On the after sales front, it has more than 4,500 touch points and 1,000 service centres supporting product purchase for the Indian consumer.
Honda had set up a 100% subsidiary Honda Motorcycles and Scooters India Ltd (HMSI) in 1999 and launched scooters in the Indian market in 2001. There were concerns raised over the renewal of the JV agreement between the two partners as the non-compete agreement came to an end in 2004. HMSIL has till now got five motorcycles in its product portfolio. However, the agreement was renewed for another 10 years. Hero and Honda recently terminated their JV, which had spanned more than two decades. The Hero group would complete the purchase of Honda Motors stake through its investment arm HIPL at | 740 per share, under the confidentiality agreement. Under the new agreement, the Honda name would be dropped over a period of time. Also, under the new licensing agreement, the technology support, if required, would be extended till 2014. This departure from Honda would also open up the vast export markets, which, until now, the company wasunable to enter due to JV
Exhibit 2: Hero Honda timeline…
Source: Company, ICICIdirect.com Research
1984 1994 1998 1999 2001 2002 2003 2004 2005 2007 2009-10
JV signed with Honda, launches first 100 cc four-stroke engine in India CD 100-SS
Honda exits JV with Kinetic Motors Hero Honda launches
100 cc Passion
Hero Honda launches refurbished CD Dawn
First scooter launched in the form of “Pleasure”
Karizma ZMR launched. JV terminated between Hero and Honda
Remodelled “Splendor” is launched
Hero Honda enters into scooters segment
Hero Honda becomes the world’s largest two wheeler manufacturer
Hero and Honda exit Joint venture agreement in December 2010 Hero and Honda
group renews alliance
Hero Honda launches “Hunk”, achieves 20 million production milestone
Promoter and institutional holding trend (%)
55.0 55.0 52.2 52.2 52.2
36.6 36.7 37.2 37.5 38.0
-
15
30
45
60
Q3FY10 Q4FY10 Q1FY11 Q2FY11 Q3FY11
(%)
Promoter Holding FII & DII
Source: Company, ICICIdirect.com Research modalities
FII & DII
modalities.

ICICIdirect.com | Equity Research Page 3
ICICI Securities Limited
Exhibit 3: Hero Honda’s product portfolio and composition of sales
Source: Company, ICICIdirect.com Research, Figures in brackets indicate share of total volumes as of Dec’10
Hero Honda
Scooter segment (5%)
Pleasure (5%)
Passion (28%)
Motorcycle segment (95%)
Glamour (4.5%)
CBZ-Xtreme (4%)
Hunk (5%)
Karizma (3.5%)
CD Dawn (10%)
Splendor (40%)
Economy segment (78%)
Executive segment (4.5%)
Premium segment (12.5%)
Volumes for Dec’10 have been ~5 lakh units

ICICIdirect.com | Equity Research Page 4
ICICI Securities Limited
Investment Rationale We expect the domestic two-wheeler segment to remain the core driver of revenues with an increase in exports adding positively from FY13E. Domestic volume growth will be driven by the executive segment demand from the lowly penetrated rural and Tier-II, III segments as rising disposable incomes and favourable demographics would continue to fuel “Splendorous” growth. Consequently, we expect HHL’s revenues to post CAGR of 14.5% over FY10-13E to | 23,579 crore. Volume sales are estimated to increase at 11.7% CAGR in FY10-13E to 6.4 million units with a blended realisation improvement of ~3% CAGR FY10-13E at ~ | 39,752 per unit.
Post recession growth witnessed though penetration remains low…
The automobile industry generally acts as a leading indicator in terms of economic growth. Post recession and the global slowdown, India has seen a strong rebound in the domestic market. In the last three years, the overall automotive industry has seen strong volume growth of ~25.4% while the two-wheeler segment has seen growth of 21.4% CAGR in FY09-11E YTD. Even in the wake of high growth, automobile penetration in India still remains extremely low compared to global averages of peers. If we look at the BRIC nations also, India has seen the slowest growth in automotive penetration. We expect the improvement of the much required infrastructure development along with speedy and easier access to credit (via UID, mobile banking) for the rural segment (enjoying the fruits of MNREGA) to provide Herculean support to demand sustenance and to further increase in the coming years. Even in Union Budget 2011-12, we saw stronger budgetary support towards the rural segment with higher farm credit and higher incomes with CPI linkages of MNREGA payments. Exhibit 4: Automotive penetration at low levels…
Year 2- wheelers PV CV All segments Population (in bn)
1991 16.0 3.0 0.4 25.0 0.9
2001 37.0 6.0 0.6 53.0 1.0
2006 58.4 10.4 0.9 80.8 1.1
2009* 75.0 13.0 1.0 102.0 1.2 Source: SIAM, Company, ICICIdirect.com Research * estimated, The penetration numbers are for 1000 persons
Exhibit 5: Global car ownership trends
40
673
1,200
520
-
200
400
600
800
1,000
1,200
1,400
China G7 nations USA EU
Source: UN,CIA-Factbook,ICICIdirect.com Research, The numbers are per 1000 population basis
ICICIdirect.com | Equity Research Page 5
ICICI Securities Limited
Consumption tsunami to fuel industry growth…
India is at a critical juncture in terms of domestic growth with household consumption expected to gain further steam as macros ranging from income growth to demographics start to turn positive. India is driven by one of the youngest populations (37.2 years median age) lending it demographic muscle. This coupled with rising disposable and per capita income could propel a demand wave similar to what was witnessed in China. We anticipate that income growth has lagged GDP growth to a certain extent as the latter has been led by businesses making profits. However, as the profits get invested back into the system, the income growth quotient for the “Strivers, Seekers” (refer Exhibit 8), which constitute the middle class, would increase more rapidly.
On the automotive segment side, this gigantic growth in consumer class with higher spending potential would definitely instil a change in the purchase mindset of the middle class as motorcycles and cars would no longer be on the luxury items category and would trend towards the essentials list in the minds of the consumer. Exhibit 6: Per household consumption growth pattern
4000
5000
6000
7000
8000
9000
10000
11000
Mar
-05
Jul-0
5
Nov
-05
Mar
-06
Jul-0
6
Nov
-06
Mar
-07
Jul-0
7
Nov
-07
Mar
-08
Jul-0
8
Nov
-08
Mar
-09
Jul-0
9
Nov
-09
Mar
-10
(|)
CAGR gorwth -16.4 % FY05-10*
Source: Bloomberg ,IMF, ICICIdirect.com Research, The consumption numbers are quarterly * comparison periods are similar
Household consumption has grown at a healthy rate of
16.4% CAGR (05-10*) mainly driven by the GDP growth
of ~17% CAGR for the same period. The consumption
growth has lagged economic growth. However, we
expect it to catch up and improve household consumption
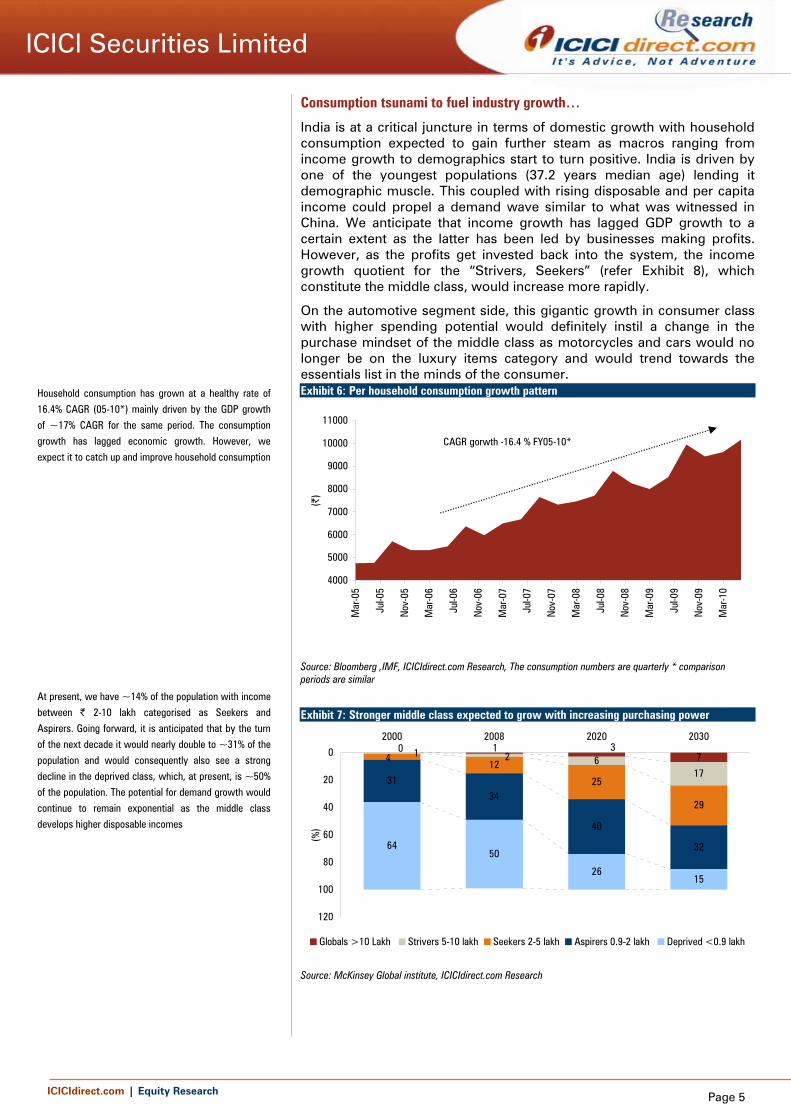
At present, we have ~14% of the population with income
between | 2-10 lakh categorised as Seekers and
Aspirers. Going forward, it is anticipated that by the turn
of the next decade it would nearly double to ~31% of the
population and would consequently also see a strong
decline in the deprived class, which, at present, is ~50%
of the population. The potential for demand growth would
continue to remain exponential as the middle class
develops higher disposable incomes
Exhibit 7: Stronger middle class expected to grow with increasing purchasing power
7617
2531
34
40
326450
2615
10 321
29
1240
20
40
60
80
100
120
2000 2008 2020 2030
(%)
Globals >10 Lakh Strivers 5-10 lakh Seekers 2-5 lakh Aspirers 0.9-2 lakh Deprived <0.9 lakh
Source: McKinsey Global institute, ICICIdirect.com Research

ICICIdirect.com | Equity Research Page 6
ICICI Securities Limited
Growing Indian middle class aided by “demographic dividend”…
Lending more credence to the consumption theme, India, in comparison to the rest of the world, would have relatively less unproductive dependant population (old) as majority of them would be young (49% of the total 57% dependant). This would signify two things. First is the rapid growth of the labour force while the second would be the gargantuan expansion of the consumer base. In comparison to China, India has ~147 million people in the 14-19 years age group. This is ~12.6% of the population as against 9.1% (122 million people) for China. In the next two or three years, a minimum of ~ 70-75% of this segment could join the consumer class. If we look even deeper in the <14 years age group, India continues to enjoy an even stronger position as compared to China. Hence, it would provide further support towards higher consumption for a number of years to come. The challenges, however, would lie in training the young workers and absorbing them in the domestic labour market.
Expected trends in growth of Indian households
189
222
273
322
100
150
200
250
300
350
2000 2008 2020 2030
( in
mill
ion)
Source: McKinsey Global institute, ICICIdirect.com Research * Households have been considered with number of persons between 4-5 per household
Exhibit 8: Demographic advantage vis-à-vis peers…
30
34
38
42
46
50
54
58
62
US
Japa
n
Chin
a
Indi
a
Mal
aysi
a
Sout
h
Thai
land
Indo
nesi
a
HK
Mal
aysi
a
Germ
any
UK
Fran
ce
Italy
Russ
ia
Spai
n
Hung
ary
Irela
nd
Portu
gal
Gree
ce
Braz
il
Aust
ralia SA
Asia Europe ROW
Med
ian
age
(Yea
rs)
Source: IMF, ICICIdirect.com Research
India holds a strong demographic advantage in
comparison to its peers as reflected in Exhibit 6 and 7.
The median age of India remains among the lowest in the
world at ~37 years even better than China at ~48.9
years
On the population front also, India along with China has a
huge population base signalling in itself the potential for
higher degree of consumption. Along with this, India has
the strongest percentage of population in the 14-19 years
group (12.6% vs. China’s 9.1%). This would also add to
the consumption strata in the next three or four years
providing a stronger demand push
Exhibit 9: Gigantic population with strongest influx of youth to fuel consumption…
020406080
100120140160
Indi
a
Chin
a
Russ
ia
Braz
il
UK US
Germ
any
Aust
ralia
(in c
rore
s)
0
2
4
6
8
10
12
14
(%)
Total population percentage of population aged between 14-19 yrs
Source: IMF,ICICIdirect.com Research

ICICIdirect.com | Equity Research Page 7
ICICI Securities Limited
Growth booming… industry on cusp of inflexion… The Indian automobile industry is being touted to be near an inflection point. It is expected to recount a story similar to China (CY03) with a huge domestic demand outburst. The increasing degree of affordability (Exhibit 8) of popular cars is an early signal of structural demand growth. We believe the Indian automobile sector in CY10 is at a point similar to China in 2003-04. In CY03, China’s GDP per capita (PPP basis) stood at $3217 while motorcycle volumes stood at ~134 lakh per annum. Post this, the sales saw a growth of 12.4% CAGR for the next seven years. China’s volume growth in the automotive segment was more pronounced in the PV segment as the two-wheeler segment is dominated in volume terms by the bicycle segment. In CY10, India’s GDP per capita was $3291 (PPP terms) while similarly two-wheeler sales stood at ~127 lakh per annum.
Exhibit 11: India could be following the China path…
3291
3217134
127
1000
2000
3000
4000
5000
6000
7000
8000
CY01
CY02
CY03
CY04
CY05
CY06
CY07
CY08
CY09
CY10
(in U
S$)
0
50
100
150
200
250
300
350
(in la
khs)
India GDP per capita China GDP per capitaChina PV(RHS) India PV (RHS)
2-W sales-India-127.4lakhs(CY10),China-134.2 lakhs(CY03)Per capita-India-$3291(CY10),China-$3217(CY03) PPP termsIndia ~ 7 years behind China in volume growthChina CAGR-(03-10) 12.4%
Source: IMF,Bloomberg ICICIdirect.com, Research
Exhibit 12: Wages comparison between India and China
392.1
153.1
220.2
149.2
0
50
100
150
200
250
300
350
400
450
1997
1998
1999
2000
2001
2002
2003
2004
2005
2006
2007
2008
2009
*
2010
*
($ te
rms)
China India
Source: IMF, Bloomberg, ICICIdirect.com, Research,
Exhibit 10: Affordability trends
1915
1011 9 8
57
119
1113
02468
101214161820
CY03
CY06
CY10
(nos
)
0
2
4
6
8
10
12
14
(%)
Price/per capita China* Price/per capita India*
Affordability degree -China Affordability degree-India
Source: IMF, ICICIdirect.com Research * largest selling car in both nations The affordability index is calculated as percentage of largest selling vehicle and GDP per capita (PPP terms)

ICICIdirect.com | Equity Research Page 8
ICICI Securities Limited
India seems to be in a similar spot as demand growth is increasingly backed by income growth. Another view towards positional similarity in terms of income growth can also be gauged from the manufacturing wages in India and China being at a similar level in CY10 and CY03, respectively. This would also substantiate the probable influx of this section of population in the demand strata with increasing capacity to spend.
Thus, we have modelled and regressed GDP per capita (PPP terms) and volume growth in the automotive industry of both nations. Post this, we have followed the methodology of using China’s regression coefficients for projections post CY13 as we believe India would start entering into a similar high growth phase. Overall, we expect India to witness a structural change in demand in the automotive industry similar to China. India’s two-wheeler industry is expected to grow at a higher growth rate (CY11-15) of ~14-15% CAGR in comparison to China on account of the absence of a strong domestic bicycle market in India unlike China.
Exhibit 13: Volume growth estimations based on regression analysis
(mn units) CY11E CY12E CY13E CY14E CY15E CAGR (FY10-15E)
Base case 12.9 14.1 15.5 20.1 21.9 14.6%
YoY growth (%) 9% 10% 30% 9%
Bull case 13.6 14.9 16.4 21.2 23.1 16.1%
YoY growth (%) 9% 10% 29% 9%
Bear case 12.1 13.3 14.6 16.0 17.6 8.5%
YoY growth (%) 10% 10% 10% 10%
Source: Company, ICICIdirect.com Research, Estimates based on regression analysis between India and China

ICICIdirect.com | Equity Research Page 9
ICICI Securities Limited
To remain market leader in mass segment.... competition hotting up… The Indian two wheeler industry, at present, has ~ 14.5 million units with the motorcycle segment comprising ~80% of the volumes and the rest being automatic scooters and mopeds. Hero Honda has been the market leader for more than a decade. Even in the wake of rising competition, it still has a market share of ~44% in the two-wheeler segment. Even further, in the motorcycle segment, it has a market share in excess of 53%. The major driver of volumes for Hero Honda in comparison to its peers has been the strong brand presence in the executive segment through its product Splendor and Passion. We anticipate an overall volume growth of 13.2% CAGR FY10-13E at ~6.6 million units in FY13E. The <125 cc segment would contribute ~86% to total sales with the rest coming from scooters and premium segment motorcycles. Exhibit 14: Volume trends of two-wheeler industry
62.170.4
78.572.5 74.4
93.7
109.6
49.658.1
65.557.7 58.4
73.4
86.5
9.2 8.9 9.4 10.5 11.5 14.6 17.4-
20
40
60
80
100
120
FY05 FY06 FY07 FY08 FY09 FY10 FY11*
(lakh
)
Two wheeler industry Motorcycle segment Scooter Segment
Source: SIAM, Company, ICICIdirect.com Research, *FY11~YTD
Exhibit 15: Market share trends of domestic two-wheeler industry
Industry segments FY05 FY06 FY07 FY08 FY09 FY10 FY11*
Hero Honda 58.1 58.5 59.0 70.7 80.2 74.7 70.7
Executive segment Bajaj Auto 22.7 21.8 24.4 17.5 10.6 17.1 17.9
HMSI - - - - - 0.5 2.7
TVS 12.8 14.0 13.4 9.8 7.9 6.6 7.5
Hero Honda 15.6 7.7 7.7 11.3 11.7 12.2 12.9
Premium segment Bajaj Auto 50.7 69.6 59.0 58.6 48.5 44.3 49.6
HMSI 8.4 9.8 11.9 16.1 20.8 22.4 19.4
TVS 13.7 8.0 10.8 5.9 7.7 7.2 6.0
Hero Honda - - 9.8 9.8 13.4 14.0 16.2
Scooters Bajaj Auto 13.7 11.9 2.1 2.0 0.8 0.3 -
HMSI 48.8 51.9 56.3 58.9 57.1 51.1 43.3
TVS 23.7 26.2 26.7 23.8 20.9 21.2 21.7
Hero Honda 41.2 41.1 41.4 44.8 49.0 48.1 44.5
Total 2-Wheelers Bajaj Auto 23.7 26.3 26.7 23.2 17.3 19.0 20.6
HMSI 8.3 8.0 8.8 12.0 13.7 12.7 13.2
TVS 18.0 17.9 18.2 15.9 15.3 14.5 15.1 Source: SIAM,Company,ICICIdirect.com Research * FY11 ~YTD Apr’10 -Jan’11, The numbers are in percentages

ICICIdirect.com | Equity Research Page 10
ICICI Securities Limited
Brand to retain “Splendorous” image among customers… Hero Honda has the single largest selling motorcycle brand in India in terms of Splendor along with another key brand Passion. These remain the most trusted brands in the mindset of Indian consumers. Both brands together contribute ~72% of total volumes of the company and have around five variants for the same. Splendor has remained the undisputed leader in the motorcycle segment for more than two decades with sales of ~ 2 lakh units per month and has surpassed the 2 million sales mark in FY10. In comparison to peers, only Bajaj Auto’s brands of Discover and Pulsar compare to Hero Honda’s stable (Refer Exhibit:16). In the overall segment, we estimate volume growth of 13.2% CAGR in FY10-13E. At a segmental level, volume growth would continue to be driven through the executive segment with growth of 11.8% CAGR (FY10-13E). The premium segment would see higher growth of 20.7% CAGR in FY10-13E primarily due to the base effect. The rapidly growing scooter segment is also expected to maintain the recently witnessed demand trend (Refer Exhibit: 19) with a growth of 28.9% CAGR in FY10-13E. Exhibit 16: Volume estimates for Hero Honda
Volume trends FY10 FY11E FY12E FY13E CAGR (FY10-13E)
Scooter segment 214,272 349,561 416,065 459,155 28.9
Motorcycle segment
>75cc<125cc 4,138,128 4,692,445 5,357,557 5,780,281 11.8
>125 cc 247,730 341,074 394,526 435,223 20.7
Total 2-wheelers 4,600,130 5,383,080 6,168,149 6,674,659 13.2 Source: Company, ICICIdirect.com Research
Exhibit 17: Monthly volume run rate for major selling models
0
50000
100000
150000
200000
250000
Splendor Passion Pulsar Discover
(uni
ts)
Source: SIAM, Company, ICICIdirect.com Research
Market share declines, expected to have bottomed out…
Hero Honda has seen a market share decline of ~ 440 bps in FY11 (YTD) since the resurgence of Bajaj Auto through its flagship brands Pulsar and Discover. Bajaj Auto recovered from the declines of FY09 that occurred mainly due to the decline in retail financing during that period and portfolio adjustments undertaken by Bajaj Auto during this period. We believe the gains in market share in CY08-09 were more related to problems in Bajaj Auto. Similarly, the loss accounted for in FY11 is a culmination of Bajaj regressing back to its normal levels of market share. The levels of market share at present seem sustainable for both major players as both continue to be heavily dominant in each of their

ICICIdirect.com | Equity Research Page 11
ICICI Securities Limited
respective segments. We believe both these players would continue to enjoy strong brand equity through their respective flagship brands of Splendor and Pulsar and maintain their market share, going forward.
Exhibit 18: Market share regressing back to historical means
44.544.8
20.623.2
36
38
40
42
44
46
48
50
FY05 FY06 FY07 FY08 FY09 FY10 FY11*
(%)
5
10
15
20
25
30
(%)
Hero Honda Bajaj Auto
Source: Company, ICICIdirect.com Research * FY11~YTD
Tier-II, III & rural demand to be in focus …pan-India presence to support growth… The next leg-up in terms of consumption towards the two-wheeler segment is expected to be driven on the legs of the domestic rural consumption along with Tier-II, Tier-III cities. In terms of population distribution, even until now urbanisation is only ~30%* while the rest comprises the Tier-II, Tier-III and the rural segment. Even on the penetration front, the rural segment continues to be strongly under-penetrated with motorcycle penetration only one-third in the rural segment as compared to towns. This would present a humongous rural population of ~0.18 billion households who do not have access to basic personal transportation facilities. They would come into the fold of the consumer class as income growth starts to catch up with GDP growth. Exhibit 19: Rural, urban motorcycle penetration comparisons
8.2
22.0
30.9
10.1
28.4
36.8
-
5
10
15
20
25
30
35
40
Rural Areas Towns 1mn+ cities
(nos
)
2006 2008
`
Source: Bajaj Auto presentation, ICICIdirect.com Research, * CIA -The World Fact book
ICICIdirect.com | Equity Research Page 12
ICICI Securities Limited
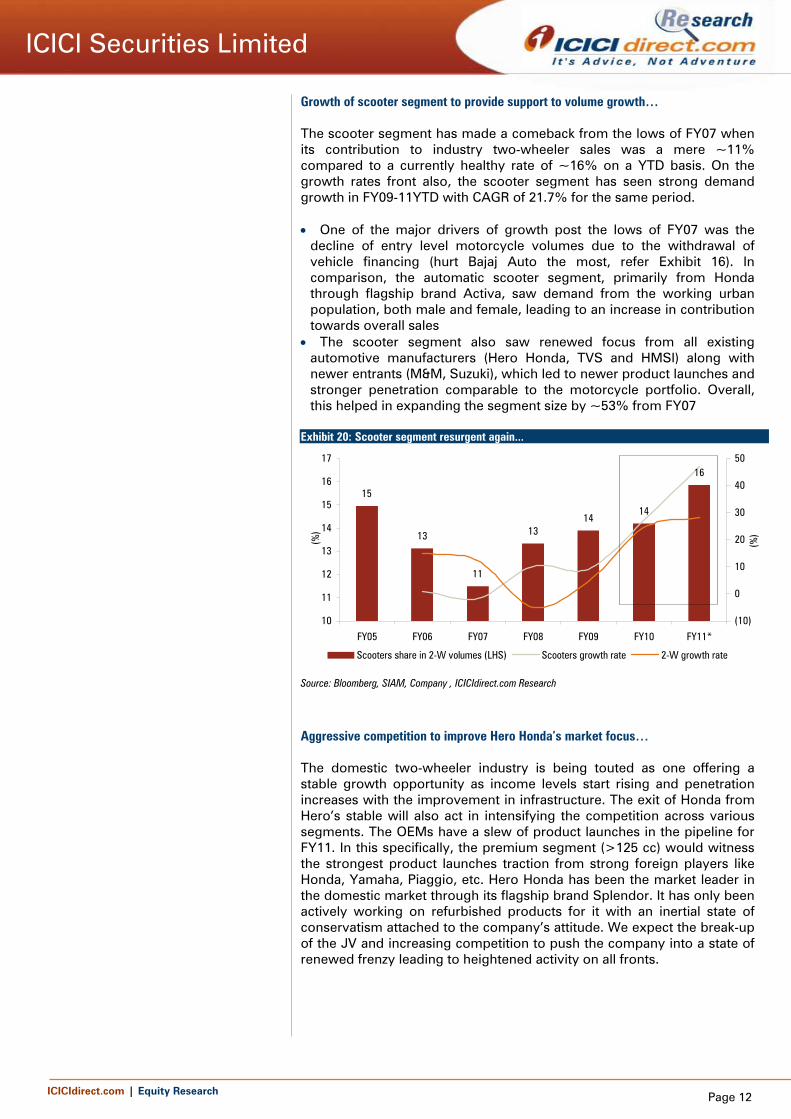
Growth of scooter segment to provide support to volume growth… The scooter segment has made a comeback from the lows of FY07 when its contribution to industry two-wheeler sales was a mere ~11% compared to a currently healthy rate of ~16% on a YTD basis. On the growth rates front also, the scooter segment has seen strong demand growth in FY09-11YTD with CAGR of 21.7% for the same period. • One of the major drivers of growth post the lows of FY07 was the
decline of entry level motorcycle volumes due to the withdrawal of vehicle financing (hurt Bajaj Auto the most, refer Exhibit 16). In comparison, the automatic scooter segment, primarily from Honda through flagship brand Activa, saw demand from the working urban population, both male and female, leading to an increase in contribution towards overall sales
• The scooter segment also saw renewed focus from all existing automotive manufacturers (Hero Honda, TVS and HMSI) along with newer entrants (M&M, Suzuki), which led to newer product launches and stronger penetration comparable to the motorcycle portfolio. Overall, this helped in expanding the segment size by ~53% from FY07
Exhibit 20: Scooter segment resurgent again...
15
13
11
1314
14
16
10
11
12
13
14
15
16
17
FY05 FY06 FY07 FY08 FY09 FY10 FY11*
(%)
(10)
0
10
20
30
40
50
(%)
Scooters share in 2-W volumes (LHS) Scooters growth rate 2-W growth rate
Source: Bloomberg, SIAM, Company , ICICIdirect.com Research
Aggressive competition to improve Hero Honda’s market focus… The domestic two-wheeler industry is being touted as one offering a stable growth opportunity as income levels start rising and penetration increases with the improvement in infrastructure. The exit of Honda from Hero’s stable will also act in intensifying the competition across various segments. The OEMs have a slew of product launches in the pipeline for FY11. In this specifically, the premium segment (>125 cc) would witness the strongest product launches traction from strong foreign players like Honda, Yamaha, Piaggio, etc. Hero Honda has been the market leader in the domestic market through its flagship brand Splendor. It has only been actively working on refurbished products for it with an inertial state of conservatism attached to the company’s attitude. We expect the break-up of the JV and increasing competition to push the company into a state of renewed frenzy leading to heightened activity on all fronts.
ICICIdirect.com | Equity Research Page 13
ICICI Securities Limited
Exhibit 21: Competition turns aggressive, slew of product launches on the anvil... OEM Product Launch date*Honda 100cc Motorbike Mar-11Bajaj KTM Duke-125cc May-11
New Pulsar May-11Sonic-100cc Mar-11
TVS Rockz-125cc Moped Nov-11Suzuki Skydrive-125 cc scooter Nov-11Yamaha Fazer-250 cc Feb-11TVS Neo-140cc Moped Oct-11Piaggio Vespa LX-125cc Jan-12M&M 2-wheelers Mojo- 250cc Dec-11
Source: Company, ICICIdirect.com Research
Life without Honda…how different will it be?
Long overdue capacity expansion process to gather steam…
The Hero Honda JV was mired in strong hierarchy and procedural hassles. This did not allow the company to undergo swift capacity expansion processes in FY11. This also resulted in a loss of probable sales of ~1.8 lakh units in H1FY11. With the annulment of the JV, we expect the board to act swiftly and expedite the overdue capacity expansion process. The management earlier had the view of establishing 0.5 million capacity, which would be ramped up to 2.0 million in due course. Attractive export markets to provide diversification of sales…
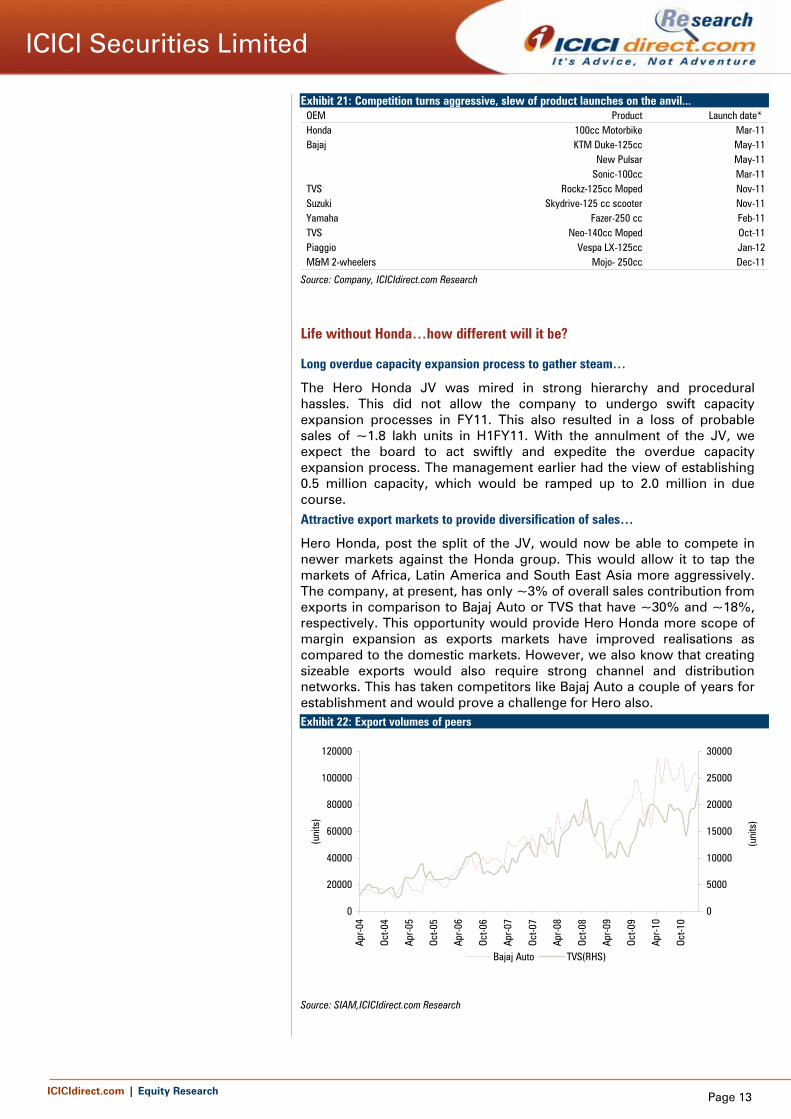
Hero Honda, post the split of the JV, would now be able to compete in newer markets against the Honda group. This would allow it to tap the markets of Africa, Latin America and South East Asia more aggressively. The company, at present, has only ~3% of overall sales contribution from exports in comparison to Bajaj Auto or TVS that have ~30% and ~18%, respectively. This opportunity would provide Hero Honda more scope of margin expansion as exports markets have improved realisations as compared to the domestic markets. However, we also know that creating sizeable exports would also require strong channel and distribution networks. This has taken competitors like Bajaj Auto a couple of years for establishment and would prove a challenge for Hero also. Exhibit 22: Export volumes of peers
0
20000
40000
60000
80000
100000
120000
Apr-0
4
Oct-0
4
Apr-0
5
Oct-0
5
Apr-0
6
Oct-0
6
Apr-0
7
Oct-0
7
Apr-0
8
Oct-0
8
Apr-0
9
Oct-0
9
Apr-1
0
Oct-1
0
(uni
ts)
0
5000
10000
15000
20000
25000
30000(u
nits
)
Bajaj Auto TVS(RHS)
Source: SIAM,ICICIdirect.com Research

ICICIdirect.com | Equity Research Page 14
ICICI Securities Limited
Exhibit 23: Export sales growth of peers & contribution to volumes
0
10
20
30
40
50
60
Apr-0
4
Oct-0
4
Apr-0
5
Oct-0
5
Apr-0
6
Oct-0
6
Apr-0
7
Oct-0
7
Apr-0
8
Oct-0
8
Apr-0
9
Oct-0
9
Apr-1
0
Oct-1
0
(%)
0
5
10
15
20
25
(%)
Bajaj Auto TVS(RHS)
Source: Company, ICICIdirect.com Research
Royalty concerns addressed …however advertisement expenses may increase...
Hero Honda has allayed fears of any untoward increase in royalty payments post the split in the JV. The management has said that the royalty would be similar to the current levels (~2.6%) and would start to decline from January 2011 as slowly older models would cease to attract royalty. The new models, which Honda would supply to Hero Honda till FY14, would attract normal rates of royalties (~5%) attached with new launches. However, even as royalty rates are expected to trend downwards we expect the company to continue to invest strongly in marketing expenses to maintain the brand image among customers and loyalists as Honda’s exit could cloud customer perception to a certain degree. Also, post 2014, the company would have to drop the Honda branding. Hence, it would require an active marketing strategy to dilute the Honda brand. If we observe TVS in 2002 the company also post the split with Suzuki witnessed a decline in royalty charges (refer Exhibit 19) and increase in selling expenses (refer Exhibit 20) to maintain market presence. However, Hero Honda is on a stronger footing since it is the market leader and has time till 2014 to bring the change. Still, it would remain one of the major challenges faced by the company.
Exhibit 24: Royalty rates for comparable TVS trend down post JV split
-
0.2
0.4
0.6
0.8
1.0
1.2
1998 1999 2000 2001 2002 2003 2004
(%)
Royalty rates (% of sales)
Source: Company, ICICIdirect.com, Research
Exhibit 25: Selling expenses trend upwards initially for TVS
4
5
6
7
8
9
10
2000 2001 2002 2003 2004 2005 2006 2007 2008 2009 2010
(%)
Selling expense ( as % to sales)
TVS witnessed steep risein selling expenses post JV dissolution
Source: Company, ICICIdirect.com, Research

ICICIdirect.com | Equity Research Page 15
ICICI Securities Limited
Exhibit 26: Royalty rates where will they go?
0
1
2
3
4
1990
1992
1994
1996
1998
2000
2002
2004
2006
2008
2010
(%)
launch of "Splendor", However no royalty increase significantly
Marked the JV renewal after serious concerns, Royalty trends upwards
Source: Capital Line, ICICIdirect.com Research
R&D capability development may prove a challenge…
Hero Honda is the largest two-wheeler manufacturer in the world whose products have been designed and developed through Honda’s technology. However, now it would have to establish a world class R&D structure with strong product development capabilities to match its peers. It would remain one of the critical issues that Hero Honda would have to successfully navigate to ensure growth momentum post 2014. We know that production and designing of motorcycles for the executive segment and even sub-200 cc segment is not rocket science. It would be a task, which would be taken as a given for Hero Honda in this three year time frame. However, a successful motorcycle requires more than just R&D and also needs various other facets like high class engineers, appropriate positioning and a series of successful test marketing operations, which would decide its fate. In a nutshell, R&D would be decisive in developing newer Splendors for the future.
Exhibit 27: R&D expenses saw a considerable rise in case of TVS
-
0.5
1.0
1.5
2.0
2.5
3.0
3.5
2000 2001 2002 2003 2004 2005 2006 2007 2008 2009 2010
(%)
R&D expenses (% of sales)
Source: Company, ICICIdirect.com Research

ICICIdirect.com | Equity Research Page 16
ICICI Securities Limited
Risks and Concerns
Margin pressures may continue to haunt
Hero Honda has witnessed pressure on its margins since Q1FY11 as higher input prices and upward trending SG&A expenses have left no margin for comfort. We believe Hero Honda could face margin pressure due to the above reason along with stronger competition removing any room for pricing improvements in the near term. The sensitivity analysis towards RM and SG&A expenses reflects a probable band of ~10-15% for EBITDA margins. We, however, anticipate the trend of rise in end product prices undertaken by OEMs will continue to sustain the margin pressure.
Exhibit 28: Earnings sensitivity
Cases Conditions FY12E FY13E FY12E FY13E
Base case No change in RM 12.0 12.7 - - No change in SG&A 12.0 12.7 - -
Bear case 2% rise in RM 10.0 10.9 (200) (180) 2% rise in SG&A 10.0 10.7 (200) (200)
Bull case 2% decline in RM 14.1 14.6 (210) (190) 2% decline in SG&A 14.0 14.7 (200) (200)
Change (bps)EBIDTA margins (%)
Source: Company, ICICIdirect.com Research
Hike in interest rates, ballooning crude oil prices
In FY11, the volume growth has been strong. However, it has also seen a spate of interest rate hikes and petrol and diesel price increase. This has led to the rise in cost of ownership of automotive vehicles to a certain degree. A further increase in such costs could act as a demand dampener for the near term as still at present ~50% of overall two wheeler sales are financed.
Shift of mass volumes from executive to premium segment
The domestic Indian market is heavily skewed towards the executive (<125 cc) segment with ~70% of total motorcycle volumes sold in this segment. It continues to remain the bread and butter segment for Hero Honda led by Splendor and Passion. However, there is a possibility, though limited, of migration of customers towards the premium (>125 cc) segment. It could lead to a decrease in contribution to overall sales volumes of the motorcycle segment.
Lack of reinvigorated product portfolio
The Hero Honda stable has not seen any new product launches in FY11 except the entry of the refurbished versions of the Splendor and Passion. This lack of good support brands/products along with the flagship brands could lead to disillusionment among customers who would be spoilt for choices from other OEMs like Honda and Bajaj Auto. Though we recognise the fact that even competitor Bajaj Auto has focused its energies on Discover and Pulsar recognising brand equity, complacency in product development could leave Hero Honda in a spot of bother in future.
Lack of development of world class in-house R&D capabilities
The company is faced with the challenge of setting up world class R&D facilities, which are not only able to cater to the domestic market but also to the latest exports market, which Hero Honda has an eye on. Any delay or lack of success in this endeavour could tarnish the strong brand value and hamper future product development.
ICICIdirect.com | Equity Research Page 17
ICICI Securities Limited
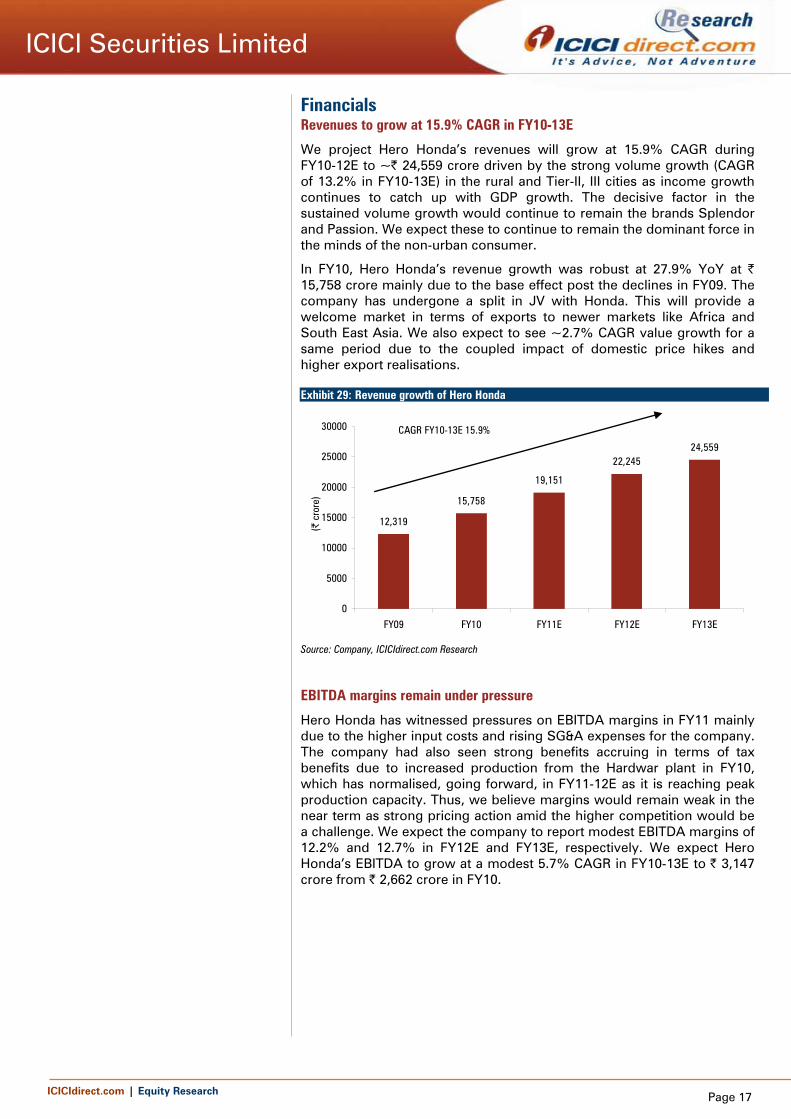
Financials Revenues to grow at 15.9% CAGR in FY10-13E
We project Hero Honda’s revenues will grow at 15.9% CAGR during FY10-12E to ~| 24,559 crore driven by the strong volume growth (CAGR of 13.2% in FY10-13E) in the rural and Tier-II, III cities as income growth continues to catch up with GDP growth. The decisive factor in the sustained volume growth would continue to remain the brands Splendor and Passion. We expect these to continue to remain the dominant force in the minds of the non-urban consumer.
In FY10, Hero Honda’s revenue growth was robust at 27.9% YoY at | 15,758 crore mainly due to the base effect post the declines in FY09. The company has undergone a split in JV with Honda. This will provide a welcome market in terms of exports to newer markets like Africa and South East Asia. We also expect to see ~2.7% CAGR value growth for a same period due to the coupled impact of domestic price hikes and higher export realisations.
Exhibit 29: Revenue growth of Hero Honda
12,319
15,758
19,151
22,24524,559
0
5000
10000
15000
20000
25000
30000
FY09 FY10 FY11E FY12E FY13E
(| c
rore
)
CAGR FY10-13E 15.9%
Source: Company, ICICIdirect.com Research
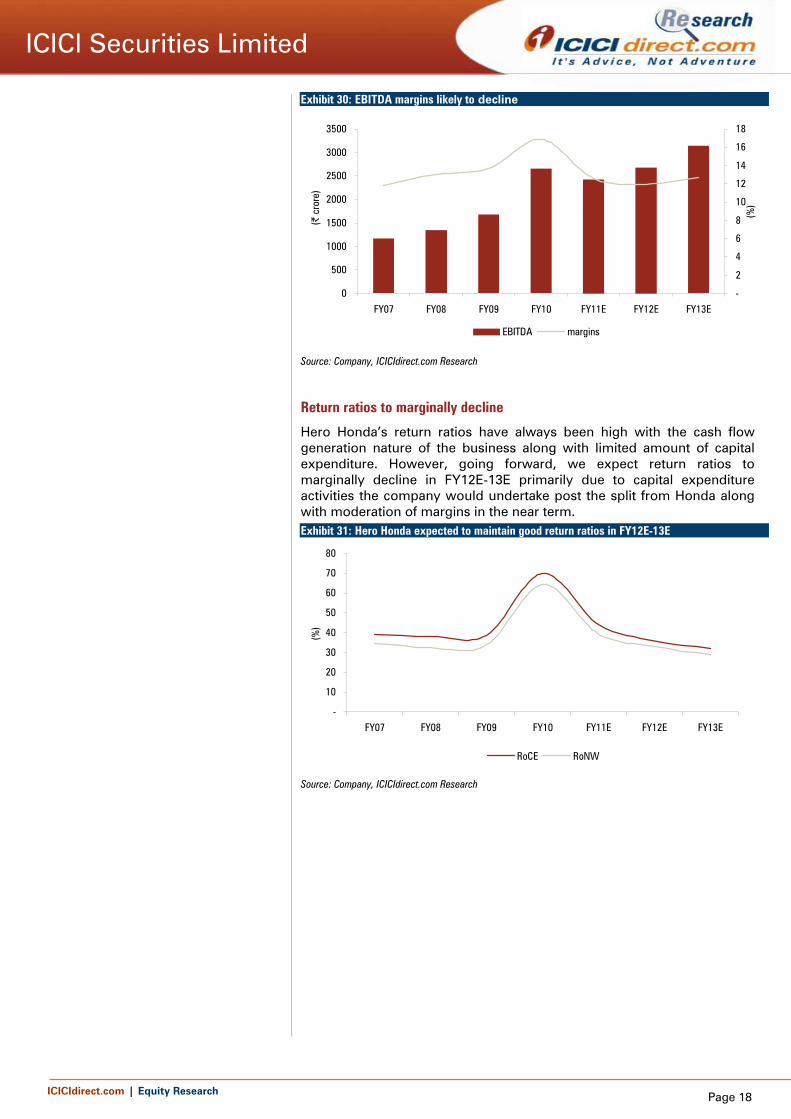
EBITDA margins remain under pressure
Hero Honda has witnessed pressures on EBITDA margins in FY11 mainly due to the higher input costs and rising SG&A expenses for the company. The company had also seen strong benefits accruing in terms of tax benefits due to increased production from the Hardwar plant in FY10, which has normalised, going forward, in FY11-12E as it is reaching peak production capacity. Thus, we believe margins would remain weak in the near term as strong pricing action amid the higher competition would be a challenge. We expect the company to report modest EBITDA margins of 12.2% and 12.7% in FY12E and FY13E, respectively. We expect Hero Honda’s EBITDA to grow at a modest 5.7% CAGR in FY10-13E to | 3,147 crore from | 2,662 crore in FY10.
ICICIdirect.com | Equity Research Page 18
ICICI Securities Limited
Return ratios to marginally decline
Hero Honda’s return ratios have always been high with the cash flow generation nature of the business along with limited amount of capital expenditure. However, going forward, we expect return ratios to marginally decline in FY12E-13E primarily due to capital expenditure activities the company would undertake post the split from Honda along with moderation of margins in the near term. Exhibit 31: Hero Honda expected to maintain good return ratios in FY12E-13E
-
10
20
30
40
50
60
70
80
FY07 FY08 FY09 FY10 FY11E FY12E FY13E
(%)
RoCE RoNW
Source: Company, ICICIdirect.com Research
Exhibit 30: EBITDA margins likely to decline
0
500
1000
1500
2000
2500
3000
3500
FY07 FY08 FY09 FY10 FY11E FY12E FY13E(|
cro
re)
-
2
4
6
8
10
12
14
16
18
(%)
EBITDA margins
Source: Company, ICICIdirect.com Research
ICICIdirect.com | Equity Research Page 19
ICICI Securities Limited
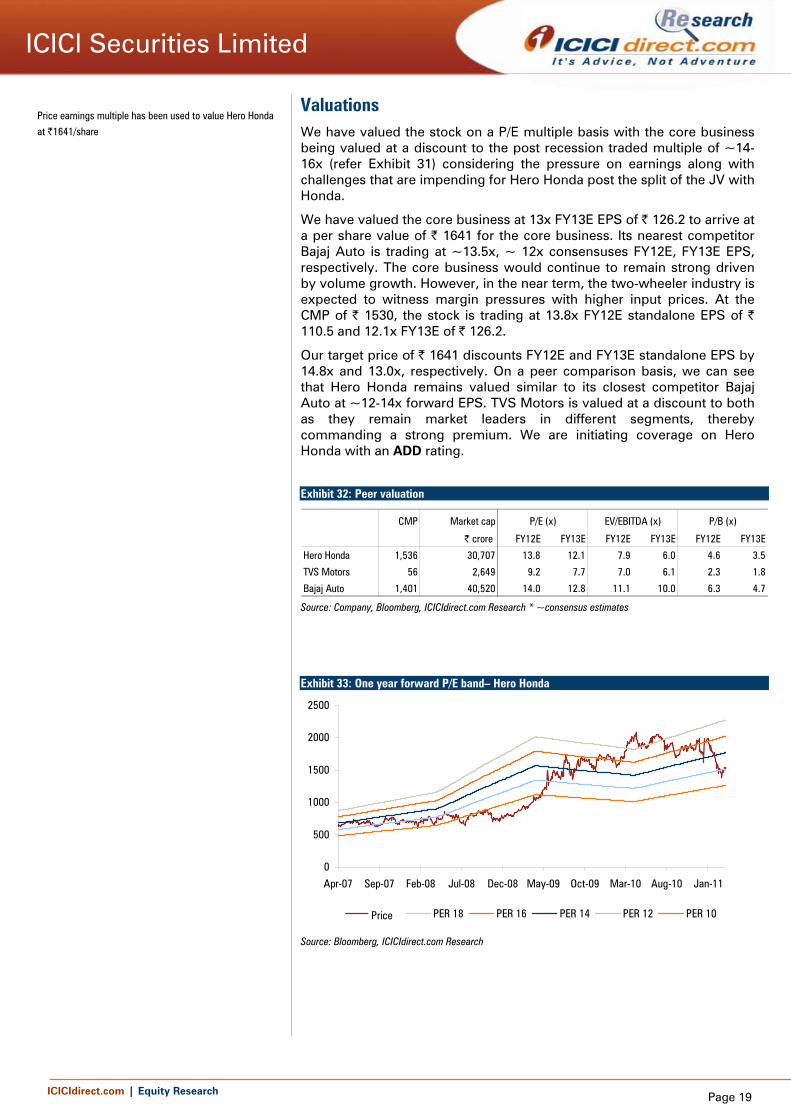
Valuations We have valued the stock on a P/E multiple basis with the core business being valued at a discount to the post recession traded multiple of ~14-16x (refer Exhibit 31) considering the pressure on earnings along with challenges that are impending for Hero Honda post the split of the JV with Honda.
We have valued the core business at 13x FY13E EPS of | 126.2 to arrive at a per share value of | 1641 for the core business. Its nearest competitor Bajaj Auto is trading at ~13.5x, ~ 12x consensuses FY12E, FY13E EPS, respectively. The core business would continue to remain strong driven by volume growth. However, in the near term, the two-wheeler industry is expected to witness margin pressures with higher input prices. At the CMP of | 1530, the stock is trading at 13.8x FY12E standalone EPS of | 110.5 and 12.1x FY13E of | 126.2.
Our target price of | 1641 discounts FY12E and FY13E standalone EPS by 14.8x and 13.0x, respectively. On a peer comparison basis, we can see that Hero Honda remains valued similar to its closest competitor Bajaj Auto at ~12-14x forward EPS. TVS Motors is valued at a discount to both as they remain market leaders in different segments, thereby commanding a strong premium. We are initiating coverage on Hero Honda with an ADD rating.
Exhibit 32: Peer valuation
CMP Market cap
| crore FY12E FY13E FY12E FY13E FY12E FY13E
Hero Honda 1,536 30,707 13.8 12.1 7.9 6.0 4.6 3.5
TVS Motors 56 2,649 9.2 7.7 7.0 6.1 2.3 1.8
Bajaj Auto 1,401 40,520 14.0 12.8 11.1 10.0 6.3 4.7
P/E (x) EV/EBITDA (x) P/B (x)
Source: Company, Bloomberg, ICICIdirect.com Research * ~consensus estimates
Exhibit 33: One year forward P/E band– Hero Honda
0
500
1000
1500
2000
2500
Apr-07 Sep-07 Feb-08 Jul-08 Dec-08 May-09 Oct-09 Mar-10 Aug-10 Jan-11
CLOSE PER 18 PER 16 PER 14 PER 12 PER 10Price
Source: Bloomberg, ICICIdirect.com Research
Price earnings multiple has been used to value Hero Honda
at |1641/share

ICICIdirect.com | Equity Research Page 20
ICICI Securities Limited
Table and ratios Profit and loss statement
(| Crore)
(Year-end March) FY09 FY10 FY11E FY12E FY13ENet Sales 12,319.1 15,758.2 19,150.7 22,245.0 24,558.9 Other Operating Income - - 158.2 178.0 221.0 Total Operating Income 12,319.1 15,758.2 19,308.9 22,423.0 24,779.9 Other Income 246.1 340.6 230.3 273.2 331.3 Total Revenue 12,565.2 16,098.8 19,539.2 22,696.2 25,111.2
Raw Material Expenses 8,742.0 10,736.4 14,075.4 16,326.6 17,801.3 Employee Expenses 448.7 560.3 611.2 711.8 810.4 Other expenses 1,444.1 1,799.5 2,192.5 2,703.5 3,020.7 Total Operating Expenditure 10,634.8 13,096.2 16,879.1 19,742.0 21,632.5
EBITDA 1,684.4 2,662.0 2,429.8 2,681.0 3,147.4 Interest (31.7) (20.6) (12.5) (10.0) (12.0) PBDT 1,962.1 3,023.2 2,672.5 2,964.2 3,490.6 Depreciation 180.7 191.5 231.9 276.5 339.8 PBT 1,781.5 2,831.7 2,360.7 2,687.6 3,150.8 Total Tax 499.7 599.9 418.1 480.7 630.2 PAT before MI 1,281.8 2,231.8 1,942.7 2,206.9 2,520.6 PAT 1,281.8 2,231.8 1,942.7 2,206.9 2,520.6 EPS 64.2 111.8 97.3 110.5 126.2
Balance sheet
(Year-end March) FY09 FY10 FY11E FY12E FY13EEquity Capital 39.9 39.9 39.9 39.9 39.9 Reserve and Surplus 3,760.8 3,425.0 4,900.4 6,640.1 8,693.4 Total Shareholders funds 3,800.7 3,465.0 4,940.4 6,680.0 8,733.3 Unsecured Loan 78.5 66.0 51.0 36.0 26.0 Deferred Tax Liability 153.1 160.6 160.6 160.6 160.6 Liability side total 4,032.3 3,691.6 5,152.0 6,876.7 8,920.0
Total Gross Block 2,309.7 2,519.2 2,894.2 3,344.2 3,894.2 Less Accumulated Depreciation 801.8 917.5 1,111.5 1,346.3 1,640.6 Net Block 1,507.9 1,601.8 1,782.7 1,997.9 2,253.6 Capital Work in Progress 120.5 48.1 48.1 48.1 48.1 Total Fixed Assets 1,628.5 1,649.9 1,830.8 2,046.0 2,301.8
Other Investments 63.6 25.0 25.0 25.0 25.0 Liquid Investments 3,305.1 3,900.6 3,900.6 4,150.6 4,400.6
Cash 219.5 1,907.2 3,107.3 5,541.2 7,489.2 Debtors 149.9 108.4 136.4 158.5 174.9 Loans and Advances 311.3 405.8 666.7 579.0 648.9 Inventory 326.8 436.4 508.0 649.9 695.8 Total Current Assets 1,013.5 2,882.6 4,430.9 6,959.4 9,025.9 Creditors 1,525.9 3,805.1 4,624.2 5,371.4 6,055.6 Provisions 527.0 1,026.4 462.4 966.9 1,090.0 Total Current Liabilities 2,052.8 4,831.4 5,086.7 6,338.3 7,145.6
Net Current Assets (1,039.4) (1,948.8) (655.7) 621.2 1,880.2 Assets side total 4,032.3 3,691.7 5,152.0 6,876.7 8,920.0

ICICIdirect.com | Equity Research Page 21
ICICI Securities Limited
Cash flow statement
(| Crore)
(Year-end March) FY09 FY10 FY11E FY12E FY13EProfit after Tax 1,281.8 2,231.8 1,942.7 2,206.9 2,520.6 Depreciation 180.7 191.5 231.9 276.5 339.8 Net Increase in Current Assets 11.8 (181.5) (348.3) (94.7) (118.3) Net Increase in Current Liabilities 228.1 2,778.6 255.3 1,251.6 807.4 Net cash flow from operating activitie 1,702.3 5,020.4 2,081.6 3,640.4 3,549.5
(Purchase)/Sale of Fixed Assets (326.2) (204.1) (400.0) (475.0) (874.9) Deferred Tax Assets (3.4) 0.8 0.8 0.8 0.8
22.5 7.5 - - - Liquid Investments (946.8) (595.5) - (250.0) (250.0) Net Cash flow from Investing Activitie (1,093.0) (752.7) (399.2) (724.2) (1,124.1)
Inc / (Dec) in Equity Capital (467.3) (2,567.6) (467.3) (467.3) (467.3) Inc / (Dec) in Loan Funds (53.5) (12.5) (15.0) (15.0) (10.0) Inc / (Dec) in Loan Funds (520.8) (2,580.0) (482.3) (482.3) (477.3)
Net Cash flow 88.5 1,687.7 1,200.1 2,433.8 1,948.1 Cash and Cash Equivalent at the begin 131.1 219.5 1,907.2 3,107.3 5,541.2 Closing Cash/ Cash Equivalent 219.5 1,907.2 3,107.3 5,541.2 7,489.2
Ratios
(Year-end March) FY09 FY10 FY11E FY12E FY13EPer Share DataEPS 64.2 111.8 97.3 110.5 126.2 Cash EPS 73.2 121.3 108.9 124.4 143.2 BV 190.3 173.5 247.4 334.5 437.3 Operating profit per share 84.3 133.3 121.7 134.2 157.6
Operating RatiosEBITDA / Total Operating Income 13.7 16.9 12.6 12.0 12.7 PAT / Total Operating Income 10.4 14.2 10.1 9.8 10.2
Return RatiosRoE 33.7 64.4 39.3 33.0 28.9 RoCE 38.8 70.0 44.0 35.8 32.1
Valuation RatiosEV / EBITDA 16.1 9.3 9.7 7.8 5.9 P/E 23.9 13.7 15.8 13.9 12.2 EV / Net Sales 2.2 1.6 1.2 0.9 0.8 Sales / Equity 3.2 4.5 3.9 3.3 2.8 Market Cap / Sales 2.5 1.9 1.6 1.4 1.2 Price to Book Value 8.1 8.9 6.2 4.6 3.5
Turnover RatiosAsset turnover 3.4 4.1 4.3 3.7 3.1
Debtors Turnover Ratio 82.2 145.4 140.4 140.4 140.4 Creditors Turnover Ratio 8.1 4.1 4.1 4.1 4.1
Solvency RatiosDebt / Equity 0.0 0.0 0.0 0.0 0.0 Current Ratio 0.5 0.6 0.9 1.1 1.3 Quick Ratio 0.4 0.2 0.3 0.2 0.2

ICICIdirect.com | Equity Research
ICICI Securities Limited
RATING RATIONALE ICICIdirect.com endeavours to provide objective opinions and recommendations. ICICIdirect.com assigns ratings to its stocks according to their notional target price vs. current market price and then categorises them as Strong Buy, Buy, Add, Reduce and Sell. The performance horizon is two years unless specified and the notional target price is defined as the analysts' valuation for a stock. Strong Buy: 20% or more; Buy: Between 10% and 20%; Add: Up to 10%; Reduce: Up to -10% Sell: -10% or more;
Pankaj Pandey Head – Research [email protected]
ICICIdirect.com Research Desk, ICICI Securities Limited, 7th Floor, Akruti Centre Point, MIDC Main Road, Marol Naka, Andheri (East) Mumbai – 400 093
ANALYST CERTIFICATION We /I, Karan Mittal MBA Nishant Vass MBA research analysts, authors and the names subscribed to this report, hereby certify that all of the views expressed in this research report accurately reflect our personal views about any and all of the subject issuer(s) or securities. We also certify that no part of our compensation was, is, or will be directly or indirectly related to the specific recommendation(s) or view(s) in this report. Analysts aren't registered as research analysts by FINRA and might not be an associated person of the ICICI Securities Inc.
Disclosures: ICICI Securities Limited (ICICI Securities) and its affiliates are a full-service, integrated investment banking, investment management and brokerage and financing group. We along with affiliates are leading underwriter of securities and participate in virtually all securities trading markets in India. We and our affiliates have investment banking and other business relationship with a significant percentage of companies covered by our Investment Research Department. Our research professionals provide important input into our investment banking and other business selection processes. ICICI Securities generally prohibits its analysts, persons reporting to analysts and their dependent family members from maintaining a financial interest in the securities or derivatives of any companies that the analysts cover.
The information and opinions in this report have been prepared by ICICI Securities and are subject to change without any notice. The report and information contained herein is strictly confidential and meant solely for the selected recipient and may not be altered in any way, transmitted to, copied or distributed, in part or in whole, to any other person or to the media or reproduced in any form, without prior written consent of ICICI Securities. While we would endeavour to update the information herein on reasonable basis, ICICI Securities, its subsidiaries and associated companies, their directors and employees (“ICICI Securities and affiliates”) are under no obligation to update or keep the information current. Also, there may be regulatory, compliance or other reasons that may prevent ICICI Securities from doing so. Non-rated securities indicate that rating on a particular security has been suspended temporarily and such suspension is in compliance with applicable regulations and/or ICICI Securities policies, in circumstances where ICICI Securities is acting in an advisory capacity to this company, or in certain other circumstances.
This report is based on information obtained from public sources and sources believed to be reliable, but no independent verification has been made nor is its accuracy or completeness guaranteed. This report and information herein is solely for informational purpose and may not be used or considered as an offer document or solicitation of offer to buy or sell or subscribe for securities or other financial instruments. Though disseminated to all the customers simultaneously, not all customers may receive this report at the same time. ICICI Securities will not treat recipients as customers by virtue of their receiving this report. Nothing in this report constitutes investment, legal, accounting and tax advice or a representation that any investment or strategy is suitable or appropriate to your specific circumstances. The securities discussed and opinions expressed in this report may not be suitable for all investors, who must make their own investment decisions, based on their own investment objectives, financial positions and needs of specific recipient. This may not be taken in substitution for the exercise of independent judgment by any recipient. The recipient should independently evaluate the investment risks. The value and return of investment may vary because of changes in interest rates, foreign exchange rates or any other reason. ICICI Securities and affiliates accept no liabilities for any loss or damage of any kind arising out of the use of this report. Past performance is not necessarily a guide to future performance. Investors are advised to see Risk Disclosure Document to understand the risks associated before investing in the securities markets. Actual results may differ materially from those set forth in projections. Forward-looking statements are not predictions and may be subject to change without notice.
ICICI Securities and its affiliates might have managed or co-managed a public offering for the subject company in the preceding twelve months. ICICI Securities and affiliates might have received compensation from the companies mentioned in the report during the period preceding twelve months from the date of this report for services in respect of public offerings, corporate finance, investment banking or other advisory services in a merger or specific transaction. ICICI Securities and affiliates expect to receive compensation from the companies mentioned in the report within a period of three months following the date of publication of the research report for services in respect of public offerings, corporate finance, investment banking or other advisory services in a merger or specific transaction. It is confirmed that Karan Mittal MBA Nishant Vass MBA research analysts and the authors of this report have not received any compensation from the companies mentioned in the report in the preceding twelve months. Our research professionals are paid in part based on the profitability of ICICI Securities, which include earnings from Investment Banking and other business.
ICICI Securities or its subsidiaries collectively do not own 1% or more of the equity securities of the Company mentioned in the report as of the last day of the month preceding the publication of the research report.
It is confirmed that Karan Mittal MBA Nishant Vass MBA research analysts and the authors of this report or any of their family members does not serve as an officer, director or advisory board member of the companies mentioned in the report.
ICICI Securities may have issued other reports that are inconsistent with and reach different conclusion from the information presented in this report. ICICI Securities and affiliates may act upon or make use of information contained in the report prior to the publication thereof.
This report is not directed or intended for distribution to, or use by, any person or entity who is a citizen or resident of or located in any locality, state, country or other jurisdiction, where such distribution, publication, availability or use would be contrary to law, regulation or which would subject ICICI Securities and affiliates to any registration or licensing requirement within such jurisdiction. The securities described herein may or may not be eligible for sale in all jurisdictions or to certain category of investors. Persons in whose possession this document may come are required to inform themselves of and to observe such restriction.
Related Documents