Mechanical Engineering Laboratory 2 1 Marcet Boiler Candidate’s Name: Manimendra Shimal Damian De Silva Student ID: SCM: 029710 Lecturer/ Supervisor: Dr. Lai Date of Experiment: 25/03/2015

Welcome message from author
This document is posted to help you gain knowledge. Please leave a comment to let me know what you think about it! Share it to your friends and learn new things together.
Transcript
Mechanical Engineering Laboratory 2
1
Marcet Boiler
Candidate’s Name: Manimendra Shimal Damian De Silva
Student ID: SCM: 029710
Lecturer/ Supervisor: Dr. Lai
Date of Experiment: 25/03/2015
Date of Submission: 1/04/2015

1. Abstract
The aim of this experiment is to investigate the relationship between the pressure and the
temperature of saturated steam in equilibrium and also to demonstrate the vapor pressure
curve. The apparatus used is a market boiler. When the pressure increases the temperature
also increases. Thus the relationship between pressure and temperature is directly
proportional. Based on the data collected and with the help of Clausius-Clapeyron’s
equation the gradient was calculated. The measured slope dT/dP were slightly different to
the calculated slope Tvg/hfg. This maybe occurred due to few errors while conducting the
experiment.
2. Objective
To demonstrate the relationship between the pressure and temperature of saturated
steam in equilibrium with water.
To determine the vapor pressure curve.
3. Introduction/ Theoretical Background
Thermodynamics is a branch of physics that deals with temperature and heat and their
relation to energy and work in a system. Properties of fluids is also part of
thermodynamics. Most thermodynamics substances are known as P-V-T (pressure-
volume-temperature) substances. (Khan Academy, 2013)
An ideal gas is defined as one in which all collisions between atoms or molecules are
perfectly elastic and in which there are no intermolecular attractive forces. In such a gas
2

all the internal energy is in the form of kinetic energy and any change in internal energy
is accompanied by a change in temperature. (Cengel, 1999)
An ideal gas obeys the equation of state that relates the pressure, specific volume or
density, and absolute temperature with mass of molecule and the gas constant, R.
PV = nRT
Where,
P = Absolute pressure
V = Volume
n = Amount of substance (moles)
R = Ideal gas constant
T = Absolute temperature (K)
However, real gas does not absolutely obey the equation of state. A few changes on the
ideal gas equation of state allow its application in the properties of real gas.”
Furthermore, “when energy increases within water, the increasing of activities among the
molecules enables the increase in the number of molecule escape from the surface until
an equilibrium state is reached. The state of equilibrium depends on the pressure between
the water surface and steam. At lower pressure, the molecules become easier leaving the
water surface while less energy required in achieving the state of equilibrium (boiling
point). The temperature where equilibrium occurs at a given pressure level is called
saturated temperature.
The Marcet Boiler is used to investigate the relationship between the pressure and
temperature of saturated steam in equilibrium with water at all temperature levels
3

between the atmospheric pressure and 10 bars. The experimental slope (dT/dP)SAT
obtained is compared to the theoretical value determined through calculation from the
steam table.
Clausius-Clapeyron states:
( dTdP )
SAT=
Tv fg
h fg
( dTdP )
SAT=
T (v g−v f )hg−hf
Where,
h fg=hg−h f
( dTdP )
SAT=
T (v g−v f )hfg
=Tv fg
h fg as vg >> vf
In which,
vf = specific volume of saturated liquid
vg = specific volume of saturated vapor
hf = enthalpy of saturated liquid
hg = enthalpy of saturated vapor
hfg = latent heat of vaporization
4

4. Apparatus
HE169 Marcet boiler
a) Pressure transducer
b) Temperature controller/indicator
c) Pressure indicator
d) Control panel
e) Bench
f) Bourdon tube pressure gauge
g) Temperature sensor
h) Pressure relief valve
i) Water inlet port & valve
j) Heater
5

5. Experimental Method
1. The power supply was switched on.
2. The boiler was initially filled with water, to check the water level the valves at the left side tube was opened and then closed.
3. The temperature controller was set to 185ᴼC, which was slightly above the expected boiling point of water at 10 bar.
4. The feed port valve was opened and the heater was switched on. (It was made sure that the valve at the level sight tube was closed
before the heater was switched on because the sight tube was not designed to withstand high pressure and temperature.)
5. The steam temperature rise was observed as the water boiled.
6. The valve was closed after 30 seconds, to ensure that the air in the boiler was out because the accuracy of the experimental results would get affected when air is present.
7. The steam temperature and pressure was recorded till the steam pressure reached 10bar.
8. The heater was turned off and the steam temperature and the pressure began to drop. The boiler was left to cool down to room temperature.
9. The steam temperatures were recorded at different pressure readings when the boiler was heating and cooling.
10. The heater was switched off and was left for the temperature to drop.
Warnings
Never open valves when the boiler is heated as pressurized steam can cause severe injury.
Do not open the valve at the water inlet port as it is highly pressurized at high temperature.
6

6. Results and Analysis
Atmospheric pressure : 1.01325 bar
Atmospheric temperature: 27 (0C)
Data collected and calculated results
Average Average
T avc (0C) T avc (K)
1 0 0 100 96.8 98.4 371.4 0.2794222721.5 0.345 0.483 110.2 110 110.1 383.1 0.234 0.1999617372 0.965 1.034 119.7 119.4 119.55 392.55 0.189 0.158054969
2.5 1.379 1.448 127.3 126.9 127.1 400.1 0.151 0.1317477313 1.999 2.068 133.6 133.3 133.45 406.45 0.127 0.11363872
3.5 2.413 2.482 138.9 138.7 138.8 411.8 0.107 0.1002705464 2.827 2.965 143.6 143.5 143.55 416.55 0.095 0.089988568
4.5 3.447 3.516 147.9 147.9 147.9 420.9 0.087 0.0819670145 3.861 3.999 151.8 151.9 151.85 424.85 0.079 0.075331133
5.5 4.482 4.482 155.5 155.6 155.55 428.55 0.074 0.0698709636 4.826 4.964 158.8 159 158.9 431.9 0.067 0.065174418
6.5 5.309 5.516 162 162.2 162.1 435.1 0.064 0.0611455077 5.861 5.929 164.9 165.2 165.05 438.05 0.059 0.057619845
7.5 6.412 6.481 167.7 167.9 167.8 440.8 0.055 0.0546049148 6.895 6.895 170.4 170.4 170.4 443.4 0.052 0.051719536
Measured Slope, dT/dP
Calculated Slope,
Tvfg/hfg
Pressure, P (bar) Temperature, T
Gauge (Increase)absolute Gauge (Decrease)Increase
( ᴼC) Decrease
( ᴼC)
Sample Calculation
Formulas used
7

h fg=hg−h f
( dTdP )
SAT=
Tv fg
h fg
Calculations
For calculated slope
When Pressure = 2bar
Temperature = 120.2ᴼC = 393.2 K
hf = 504.5 kJ kg-1
hg = 2706 kJ kg-1
hfg = 2706 – 504.5
= 2201.5 kJ kg-1
v f = 1.061x10⁻³ m3 kg-1
vg = 0.886 m3 kg-1
v fg = 0.886 – 1.061x10-3
= 0.884939 m3 kg-1
Calculated slope =
Tv fg
h fg
8

= 393.2 X 0.884939
2201.5
= 0.1580549692 K kpa-1
Note: The values used in the above calculations were taken from the “Little book of Thermofluids” which
is shown in the Appendix 1.
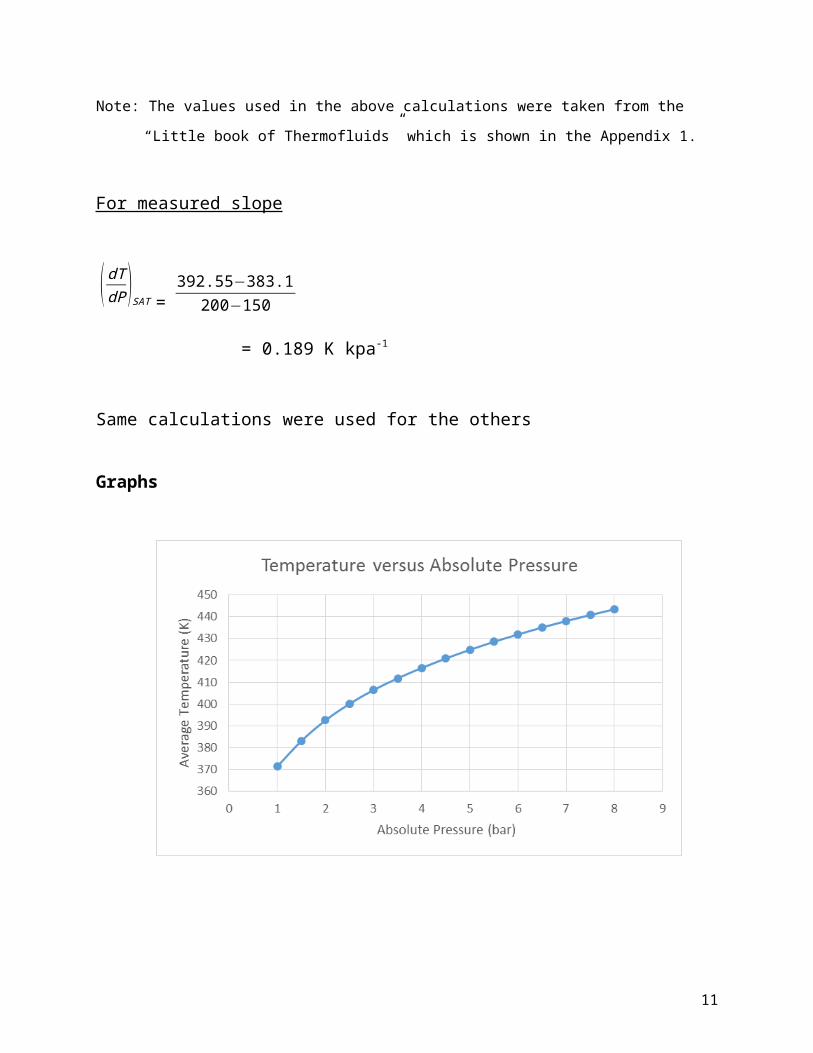
For measured slope
( dTdP )
SAT = 392.55−383.1
200−150
= 0.189 K kpa-1
Same calculations were used for the others
Graphs
9

7. Discussion
It is necessary to remove air from the boiler because if the air is not expelled the correct
equilibrium measurements between the steam and boiling water will not be obtained. Due
to the partial pressure of air a lower water temperature will be required to raise the
pressure.
Based on the graph the experiment and calculated graphs are similar and they overlay
each other at certain points so it can be assumed that the results obtained are marginally
accurate. The reason why the two graphs doesn’t overlay at few points might be due to
some errors.
Sources of errors are measurements or reading accuracy, room temperature, pressure, the
stability of materials and calculations.
10
When the liquid absorbs enough heat energy, it will change to vapor form. As this is not
allowed to exit, it will cause an increase in pressure and thus causing the temperature to
increase. Marcet boiler can be used as a water boiler, pressure cooker, steam generated
power plants and many more.
8. Conclusion
Marcet boiler is the device which we use to study the relation in between pressure and temperature for a water at saturated liquid phase. As we did in the lab investigation, we started heating water with constant pressure until it reached boiling point. Then, closing the valve which created a constant volume system. Forcing the pressure to increase as the temperature rises. And thus studying the direct relation between pressure and temperature for water at that point. We notice that it is essential to close the valve as we reach boiling point to make sure we are now in a constant volume process, otherwise pressure would have never increased. After tabulating the results and plotting the graph we found out that the relationship between pressure and temperature is directly proportional. The difference between the theoretical values and the actual values is caused by errors with certain calculation mistakes.
9. References
Khan Academy, 2013, Thermodynamics, [ONLINE] Available at: https://www.khanacademy.org/science/physics/thermodynamics, [Accessed 27 March 15].
Cengel and Boles, Thermodynamics, An engineering Approach, 5th Edition, McGraw Hill, 1999.
S.B.M. Beck and S.G. Blakey, The Little Book of Thermofluids, 3rd Edition, University of Sheffield, 2006
10. Appendix 1
11

12
Related Documents


