Marcelo Godoy Simões Sensitivity Analysis of Parameters Used in Simulation of PEM Fuel Cells For Integration with a High Frequency Link

Marcelo Godoy Simões Sensitivity Analysis of Parameters Used in Simulation of PEM Fuel Cells For Integration with a High Frequency Link.
Dec 14, 2015
Welcome message from author
This document is posted to help you gain knowledge. Please leave a comment to let me know what you think about it! Share it to your friends and learn new things together.
Transcript

Marcelo Godoy Simões
Sensitivity Analysis of Parameters Used in Simulation of PEM Fuel Cells
For Integration with a High Frequency Link

Outline
MotivationFuel Cell Modeling Requirements for Control SystemsPEM Fuel Cell Electrochemical ModelParameters and Simulation of Fuel Cell StackMulti-Parametric Sensitivity AnalysisEvaluation of Relative SensitivityDynamical Evaluation of PEMFC StackConclusions

Types of Fuel Cells
Main characteristics of PEMFC stacks are: they produce water as a residue; they have high efficiency when compared to thermal generation they operate at low temperatures which allows a fast start-up
and improved dispatchability; and they use a solid polymer as the electrolyte, which reduces
concerns related to construction, transport and safety.
CharacteristicCharacteristic PEMFCPEMFC DMFCDMFC AFCAFC PAFCPAFC MCFCMCFC SOFCSOFC
ElectrolyteElectrolyteProtonProton
ExchangeExchangeMembraneMembrane
ProtonProtonExchangeExchangeMembraneMembrane
PotassiumPotassiumHydroxideHydroxide
PhosphoricPhosphoricAcidAcid
MoltenMoltenCarbonatesCarbonates(Li, K, Na)(Li, K, Na)
Solid OxideSolid OxideZrOZrO22--Y2OY2O33
Temperature (Temperature (ooC)C) 5050--9090 5050--130130 5050--250250 180180--200200 650650 750750--10501050
Charge CarrierCharge Carrier HH++ HH++ OHOH-- HH++ COCO3322-- OO22--
CatalystCatalyst PtPt PtPt Pt, NiPt, Ni PtPt Ni, LiNiNi, LiNi NiNi
FuelFuel HH22 (Pure or(Pure orReformed)Reformed) CHCH33OHOH
HH22
(Pure)(Pure)HH22
(Reformed)(Reformed)HH22 and COand COreformed &reformed &
CHCH44
HH22 and COand COreformed &reformed &
CHCH44
PoisonPoison CO>10ppmCO>10ppmAdsorbedAdsorbed
intermediatesintermediatesCO, COCO, CO22
CO>1%CO>1%HH22S>50ppmS>50ppm
HH22S>0.5ppmS>0.5ppm HH22S>1ppmS>1ppm
MainMainApplicationsApplications
Portable,Portable,TransportationTransportation
Portable,Portable,TransportationTransportation
SpaceSpacePower gener.,Power gener.,CoCo--generation,generation,TransportationTransportation
Power gener.,Power gener.,CoCo--generationgeneration
Power gener.,Power gener.,CoCo--generationgeneration

1 10 100 1k 10k 100k 1M 10M
Portableelectronicsequipment
Cars, boats,and domestic
CHP
Distributed powergeneration,
CHP, also buses
Higher energy
density than batteries.Faster recharging
Potential for zeroemissions,
higher efficiency
Higher efficiency,less pollution,
quiet
AFC
PEMFC
SOFC
PAFC
MCFC
Typicalapplications
Power (W)
Mainadvantages
Range ofapplication ofthe differenttypes of FC
Power Based Fuel Cell Applications

Fuel Cell Modeling
Difficulties for accurate PEMFC dynamical model
Lack of information and familiarity for the modeling parameters.
Parameters choice affect voltage, power, efficiency and time response.
Disagreements arise of uncertainties on hard experimental verification and ill-defined parameters.
Multi-Parametric Sensitivity Analysis (MPSA) is a tool to find the relative importance of the physical and electrochemical processes.

Fuel Cell Modeling – cont.
Multi-Parametric Sensitivity Analysis (MPSA) comprises the ranking of parameters importance and assessment of ill-defined parameters that limit the accuracy of modeling. The goal is to perform a variance decomposition sensitivity analysis of the system in various situations characterized by different nominal values of the parameters, so as to put in evidence how they may affect the system behavior, or which are the grade of redundancy on the uncertainty of some signals.The procedure includes the following steps : Select the parameters to be tested; Set the range of each parameter to include expected variations; For each parameter generate a large series of independent random
values in the design range; Run the model using this large series and calculate an objective function; Determine the validity range (from acceptable to unacceptable) by
comparing the objective function to a given criterion(R); Evaluate the distributions of the parameters with the acceptable/non-
acceptable results to define relative importance.

Typical Fuel Cell PEM Control System
ac output 127/220 V
water pump
+ _
+ sV -
dc output for the
auxiliary components
+
water air
fuel
air
H2 reforming system
exhaustion
heat exchanger
fan water
storage
air
H2 purge
air exhaustion
S H2 solenoid valve pressure regulator
voltage regulator
water excess
DI water feeding
DI bed
air blower
starting battery
fuel cell stack
DC
AC
+
cooling water
_
+ _
+ dc/dc converter
S S
cooling water
DC
DC
dc/ac inverter

PEM Fuel Cell Electrochemical Model
The output voltage of a single cell, VFC, can be defined as follow:
For n cells connected in series, forming a stack, the voltage, Vs, can be calculated by:
ENernst is the thermodynamic potential of each unit cell and it represents its reversible voltage;
Vact is the voltage drop associated with the activation of the anode and of the cathode;
Vohmic is the ohmic voltage drop, a measure of the voltage drop associated with the conduction of protons and electrons;
Vcon represents the voltage drop resulted from the decrease in the concentration of oxygen and hydrogen
conohmicactNernstFC VVVEV
FCs VnV
J. E. Larminie and A. Dicks, Fuel Cell Systems Explained, John Wiley & Sons, Chichester, England, 2000, 308p.

Each individual term is defined by:
PEM Fuel Cell Electrochemical Model – Cont.
FC
Oact
iT
cTTV
ln..
ln...
4
321 2
CMFCohmic RRiV .
max
1ln.J
JBVcon
T
OO
e
Pc
4986.10.08.5
2
2
22ln
2
1ln..10.31.4
15.298.10.85.0229.1
5
3
OH
Nernst
PPT
TE
PEM Fuel Cell Electrochemical Model – Cont.
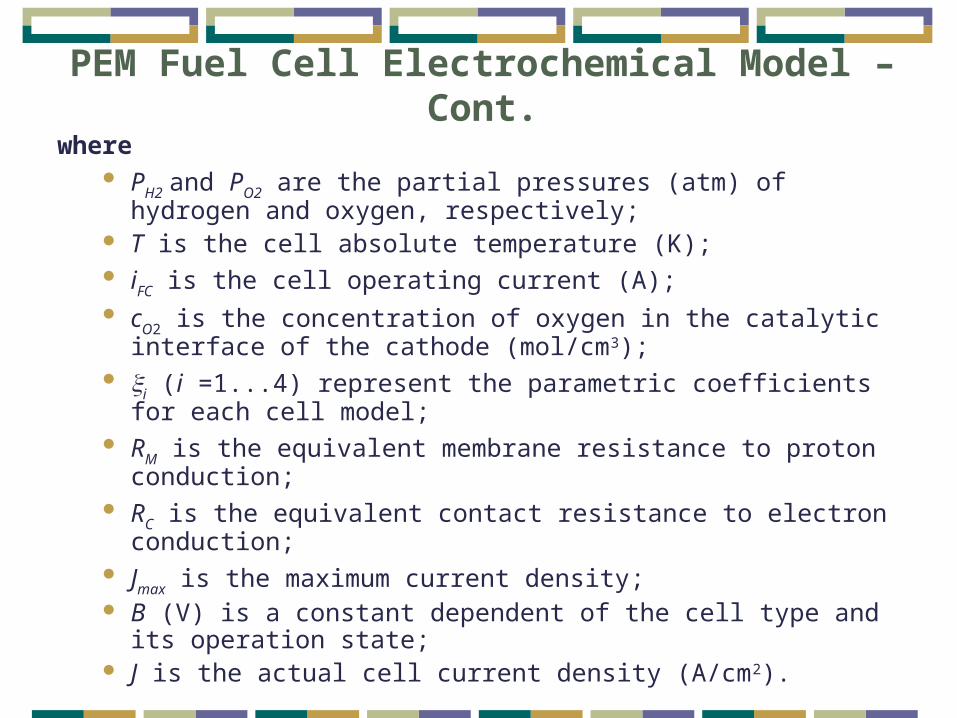
where PH2 and PO2 are the partial pressures (atm) of hydrogen and
oxygen, respectively; T is the cell absolute temperature (K); iFC is the cell operating current (A); cO2 is the concentration of oxygen in the catalytic interface
of the cathode (mol/cm3); i (i =1...4) represent the parametric coefficients for each
cell model; RM is the equivalent membrane resistance to proton
conduction; RC is the equivalent contact resistance to electron
conduction; Jmax is the maximum current density; B (V) is a constant dependent of the cell type and its
operation state; J is the actual cell current density (A/cm2).

PEM Fuel Cell Electrochemical Model – Cont.
The equivalent membrane resistance can be calculated by :
M is the membrane specific resistivity (.cm), which can be obtained by
TT
Ai
AiT
Ai
FC
FCFC
M303
.18.4exp..3634.0
.303
.062.0.03.01.6.1815.22
AR M
M
.

PEM Fuel Cell Electrochemical Model – Cont.
where
the term 181.6/(-0.634) is the specific resistivity (.cm) at zero current and at temperature of 30oC (303 K);
the exponential term in the denominator is the temperature factor correction if the cell is not at 30oC.
The parametric coefficient is considered an adjustable parameter, with a possible minimum value of 14 and a maximum value of 23.
Such nine equations represent the fuel cell stack static behavior.

PEM Fuel Cell Electrochemical Model – Cont.
An electrical circuit can be used to model the FC dynamical behavior :
+
_
_ +
R v ohmic
_ +
V FC C v d R act R con
E Nernst
i FC
LOAD
+ _

PEM Fuel Cell Electrochemical Model – Cont.
The dynamical equation is represented by:
vd represents the dynamical voltage (associate with Vact and Vcon), C is the equivalent electrical capacitance and is the FC electrical time constant (where Ra is an equivalent resistance)
Including the dynamic behavior :
Therefore, the dynamic behavior is incorporated in the model.
dFCd vi
Cdt
dv
11
FC
conactconacta i
VVCRRCRC ...
dohmicNernstFC vVEV

Parametric Sensitivity Analysis
The model needs definition of several parametersParameters are based on manufacturing data.PEMFC operation is difficult to assess accurately because those processes are electrochemical in nature and some design considerations are proprietary.A 500 W BCS stack was simulated to investigate the parameter sensitivity.
R. F. Mann; J.C. Amphlett; M. A. I. Hooper; H. M. Jensen; B. A. Peppley and P. R. Roberge; “Development and application of a generalized steady-state electrochemical model for a PEM fuel cell”; Journal of Power Sources 86 (2000); pp. 173-180.
J. E. Larminie and A. Dicks, Fuel Cell Systems Explained, John Wiley & Sons, Chichester, England, 2000, 308p.
BCS Technology Co.; Data sheet for a 500 W FC stack; 2001

Simulation of fuel cell stack
The following block diagram shows the overall simulation requirements
FUEL CELL
MODELLOAD
Vs
T
iFC
PH2
PO2
Parameters:n, A, , i, Jn, Jmax,
RC, B, C
T, iFC

Parameter Set for a 500 W BSC Stack
Param.
ValueParam
.Value
n 32 1 -0.948
A 64 cm2 20.00286+0.0002.ln (A)+
(4.3.10-5).ln (cH2)
178 mm 3 7.6.10-5
T 333 K 4 -1.93.10-4
PO2 0.2095 atm
23.0
PH2 1 atm Jn 3 mA/cm2
RC 0.0003 Jmax 469 mA/cm2
B 0.016 V C 3 F

Simulation of fuel cell stack – cont.
Using the previous parameter set presented the simulated polarization curve, obtained with the electrochemical model is presented and compared to the manufacturer data.
The simulated results present a good agreement with the real data, except at the very beginning and at the very end of the polarization curve.
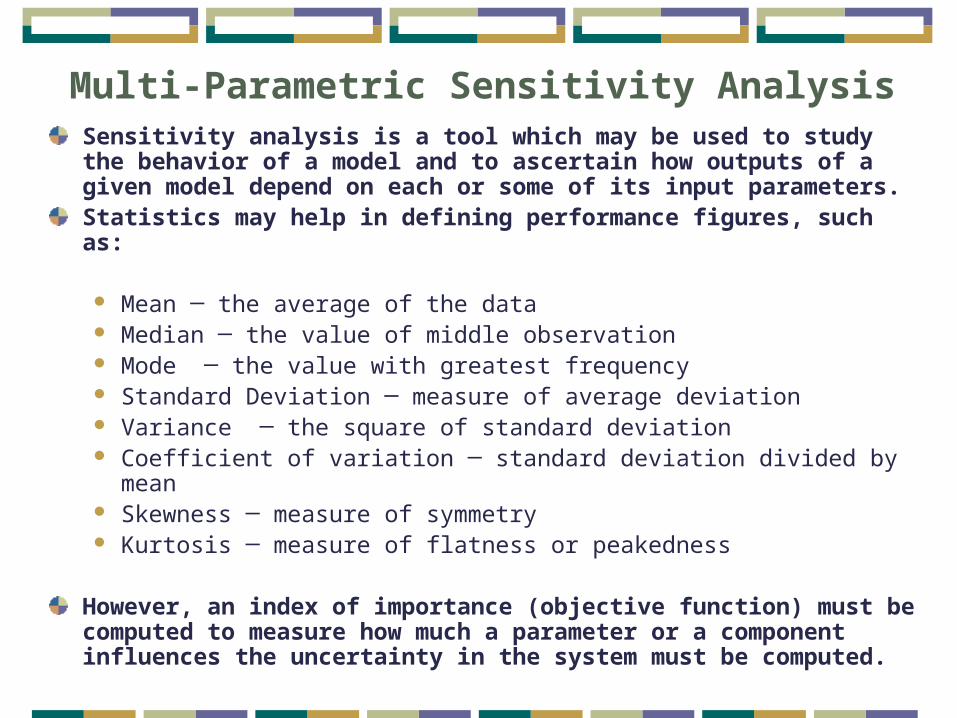
Multi-Parametric Sensitivity AnalysisSensitivity analysis is a tool which may be used to study the behavior of a model and to ascertain how outputs of a given model depend on each or some of its input parameters.Statistics may help in defining performance figures, such as:
Mean ─ the average of the data Median ─ the value of middle observation Mode ─ the value with greatest frequency Standard Deviation ─ measure of average deviation Variance ─ the square of standard deviation Coefficient of variation ─ standard deviation divided by mean Skewness ─ measure of symmetry Kurtosis ─ measure of flatness or peakedness
However, an index of importance (objective function) must be computed to measure how much a parameter or a component influences the uncertainty in the system must be computed.

Multi Parametric Sensitivity Analysis – Cont.
The procedure of MPSA was based on the reference below. The following steps were employed :
1. Select the parameters to be tested.2. Set the range of each parameter.3. For each parameter, generate a series of independent
random numbers with a uniform distribution within the defined range.
4. Run the model using the selected series and calculate the objective function for each value of cell current.
5. Determine the relative importance of each parameter for each value of current.
6. Evaluate parametric sensitivity (to define the sensitive and insensitive parameters).
J. Choi, J. W. Harvey, and M. H. Conklin; “Use of multi-parameter sensitivity analysis to determine relative importance of factors influencing natural attenuation of mining contaminants” Proceedings of the U.S. Geological Survey Toxic Substances Hydrology Program - Technical Meeting, Charleston, South Caroline, USA; March 8-12, 1999; Vol. 1, Section C, pp. 185 – 192.

Multi Parametric Sensitivity Analysis – Cont.
Objective function
Relative Importance
where f is the objective function value, x0(i) is theobserved value, xc(i) is the calculated value and k is the number of elements contained in the random series (Step 3)
500 uniformly distributed values were used to calculate the above figure of merit.
k
ic ixixf
1
20
)(0 ix
fii

Range of Parameters Used for MPSA
Param. Test range Param. Test range A 64 5% [cm2]
1 -0.948 10%
178 5% [m] 3 7.6.10-5 10%
RC 0.0003 15% [] 4 -1.93.10-4 10%
B 0.016 15% [V] 15 – 24
Jn 3 25% [mA/cm2] C 1 – 5 [F]
Jmax 469 10% [mA/cm2]

Relative Importance Results
Cell active area(A)
0
0.0002
0.0004
0.0006
0.0008
0 5 10 15 20 25
Current (A)
Se
ns
itiv
ity
[A
]
0.00
25.00
50.00
75.00
100.00
0 5 10 15 20 25
Current (A)
Se
nsit
ivity
[J m
ax]
0.00
0.40
0.80
1.20
1.60
0 5 10 15 20 25
Current (A)
Se
nsit
ivity
[J n
]
Maximum current
density (Jmax)
Internal current
density (Jn)

Relative Importance Results – Cont.
Membranethickness ()
Contact resistance
(RC)
Parameter B
0.00
0.01
0.02
0.03
0.04
0 5 10 15 20 25
Current (A )
Sen
sitiv
ity [ ]
0.000
0.003
0.006
0.009
0.012
0 5 10 15 20 25
Current (A)
Se
ns
itiv
ity
[R
c]
0.00
0.60
1.20
1.80
2.40
0 5 10 15 20 25
Current (A)
Se
ns
itiv
ity
[B
]

Relative Importance Results – Cont.
Parameter 1 Parameter 3
Parameter 2
8.8266
8.8267
8.8268
8.8269
0 5 10 15 20 25
Current (A )
Se
nsit
ivity
[3]
[3]
0.00
0.80
1.60
2.40
3.20
0 5 10 15 20 25
Current (A)
Se
nsit
ivity
[4]
[4]
48.710
48.713
48.715
48.718
48.720
0 5 10 15 20 25
Current (A )
Se
nsit
ivity
[1]
[1]

Relative Importance Results – Cont.
Parameter
0.00
1.00
2.00
3.00
4.00
0 5 10 15 20 25
Current (A )
Se
ns
itiv
ity
[]
[]

Evaluation of Relative Sensitivity
As higher is the relative importance index, more sensitive is the modeling in respect to the parameter. An inspection on the previous results suggests the following classification :
Insensitive: A, , RC
Sensitive: Jn, B, 4, Highly sensitive: Jmax, 1, 3

Evaluation of Relative Sensitivity – Cont.
Insensitive parameters : the ones related to the cell constructionParameter Jn only affects the simulation results at low current valuesParameters B, 4 and also have more influence on the stack voltage for high current values

Evaluation of Relative Sensitivity – Cont.For the parameter Jmax the model results are more affected for high current values. This can be explained by the logarithm term in the correspondent equation. When the current density is close to the maximum value, the logarithm term tend to zero as well the concentration voltage. This, by its turn, changes the resulting stack voltage.For parameters 1 and 3 the model results are affected for all current values in a same order. Their electrochemical exact definition is given by R. F. Mann et. alli.
R. F. Mann; J.C. Amphlett; M. A. I. Hooper; H. M. Jensen; B. A. Peppley and P. R. Roberge; “Development and application of a generalized steady-state electrochemical model for a PEM fuel cell”; Journal of Power Sources 86 (2000); pp. 173-180.
Evaluation of Relative Sensitivity – Cont.
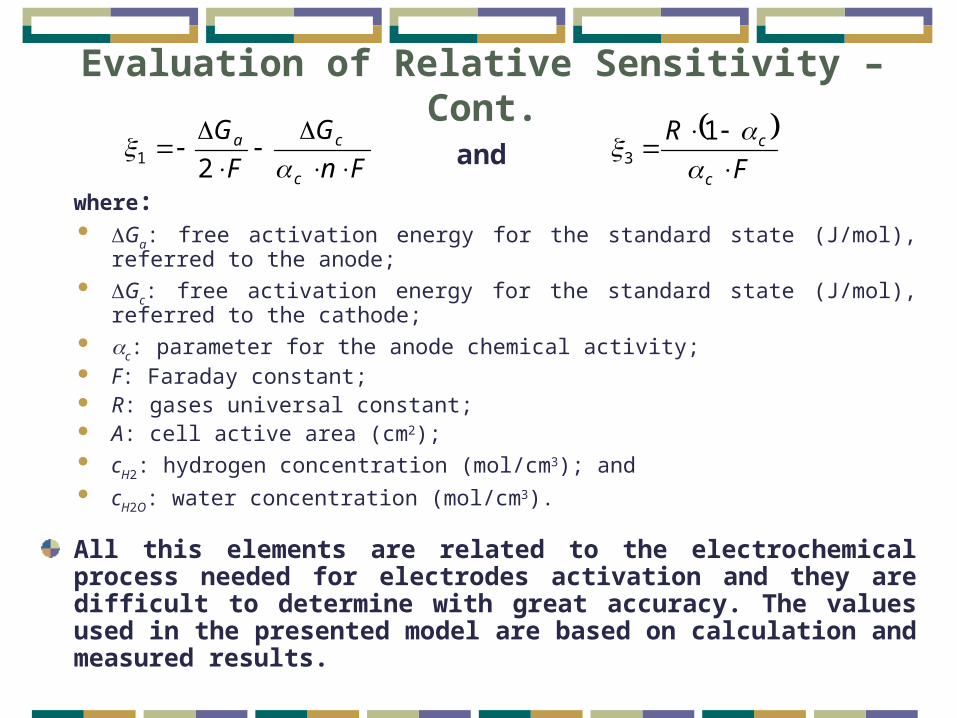
where: Ga: free activation energy for the standard state (J/mol), referred to
the anode; Gc: free activation energy for the standard state (J/mol), referred to
the cathode; c: parameter for the anode chemical activity; F: Faraday constant; R: gases universal constant; A: cell active area (cm2); cH2: hydrogen concentration (mol/cm3); and cH2O: water concentration (mol/cm3).
All this elements are related to the electrochemical process needed for electrodes activation and they are difficult to determine with great accuracy. The values used in the presented model are based on calculation and measured results.
Fn
G
F
G
c
ca
21
F
R
c
c
13an
d

Influence of the uncertainty due 1 and 3
The following stack polarization curve was calculated considering that 1 and 3 vary in the range of 5% (at random).It can be seen the stack voltage changes considerably, making the polarization curve far from similar to the real data.
0
5
10
15
20
25
30
35
0 5 10 15 20 25
Current (A)
Sta
ck
Vo
lta
ge
(V
)
Simulation Manuf . Data

Dynamical Evaluation of PEMFC Stack
The dynamical behavior of a PEMFC stack is modeled as an equivalent electrical circuit.The charge double layer effect is responsible for a delay in the FC voltage change, after a change in its current. The parameter used to describe this behavior is the equivalent capacitance C, whose value, for the PEMFC, is of a few Farads.This capacitance does not influence the stack polarization curve, because each point of this curve is obtained after the voltage has reached its steady-state value. To evaluate its effect, a current interruption test can be simulated.In practical electronics circuits, the values of the capacitors are much less than these. Despite of that, these values are representative of the PEMFC dynamical behavior and do not represent real capacitors.
R.M. Nelms; D.R. Cahela; B.J. Tatarchuk “Modeling double-layer capacitor behavior using ladder circuits” IEEE Transactions on Aerospace and Electronic Systems, Vol. 39., No. 2; April/2003; pp. 430 – 438.

Dynamical Evaluation of PEMFC Stack – Cont.
The figure shows the effect for a reduction in the stack current, from 15 A to 0 A (open circuit). The curves showed in are from equivalent capacitances values from 0,5 F to 5 F, resulting in a range of 1:10.The current reduction occurs after 10 seconds of simulation. The stack voltage presents an instantaneous change (ohmic overpotential), followed by a first order delay, until it reaches its new final steady-state value (open circuit voltage).
15
20
25
30
35
0 50 100 150 200 250 300
Time (s)
Stac
k V
olta
ge (V
)
C = 5 F
C = 3 F
C = 1 F
C = 0,5 F
C
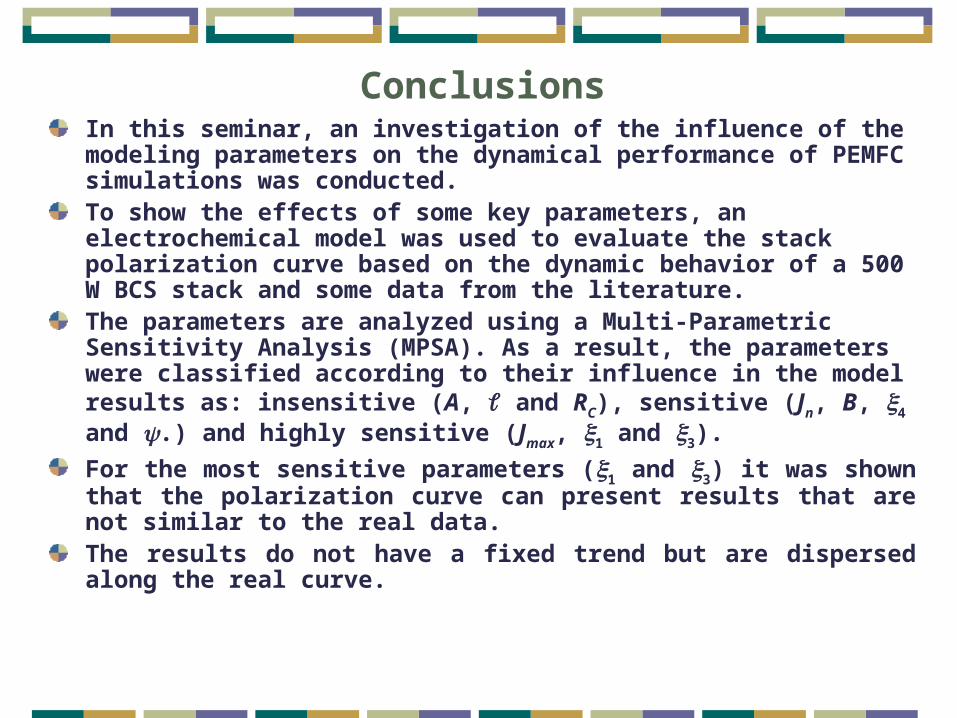
ConclusionsIn this seminar, an investigation of the influence of the modeling parameters on the dynamical performance of PEMFC simulations was conducted.To show the effects of some key parameters, an electrochemical model was used to evaluate the stack polarization curve based on the dynamic behavior of a 500 W BCS stack and some data from the literature.The parameters are analyzed using a Multi-Parametric Sensitivity Analysis (MPSA). As a result, the parameters were classified according to their influence in the model results as: insensitive (A, and RC), sensitive (Jn, B, 4 and .) and highly sensitive (Jmax, 1 and 3).
For the most sensitive parameters (1 and 3) it was shown that the polarization curve can present results that are not similar to the real data. The results do not have a fixed trend but are dispersed along the real curve.

Conclusions – Cont.The definition of the values for the fuel cell simulation parameters is not a simple task,Once the parameter set is defined, it is only valid for a specific cell or stack. To simulate other fuel cells, almost all the values must be defined again.This work evaluated the importance of each parameter in the simulations accuracy.A synergy must exist between Electrical Engineers and Chemical Engineers to define the best parameters for a consistent fuel cell stack simulation !!!
Related Documents