Mapping Waterborne Disease Data Paul Gager Technical Director

Mapping Waterborne Disease Data
Jul 13, 2015
Welcome message from author
This document is posted to help you gain knowledge. Please leave a comment to let me know what you think about it! Share it to your friends and learn new things together.
Transcript

Mapping Waterborne Disease Data
Paul Gager
Technical Director
Background
• Mapping work conducted for Cambodia Climate Change, Water and Health Project
• DRIP-SWICCH: Developing Research and Innovative Policies Specific to the Water-related Impacts of Climate Change on Health
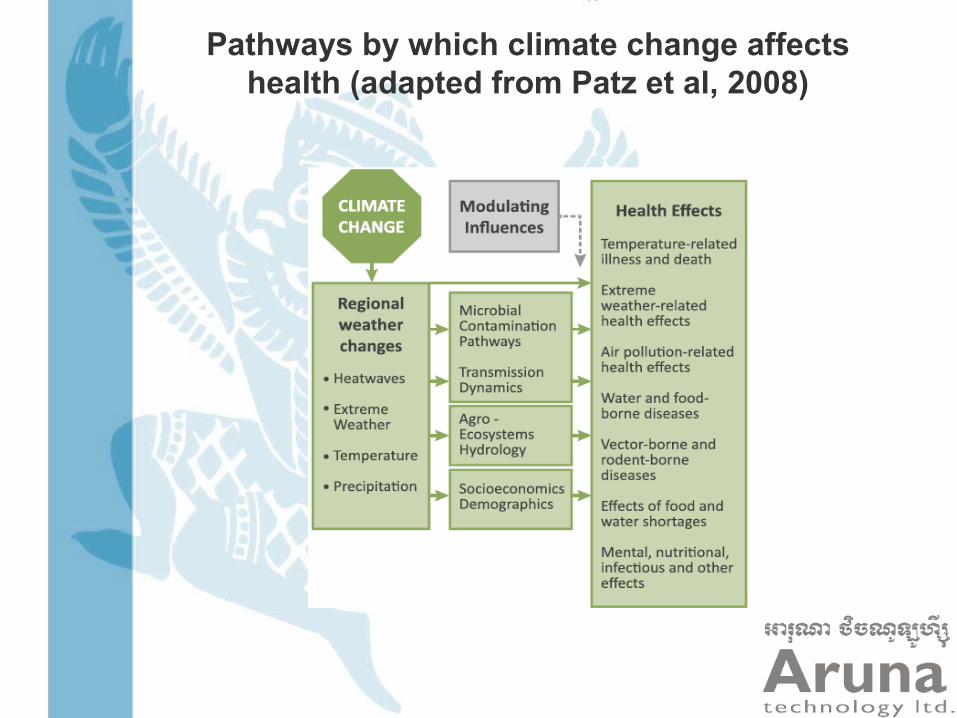
Pathways by which climate change affects health (adapted from Patz et al, 2008)
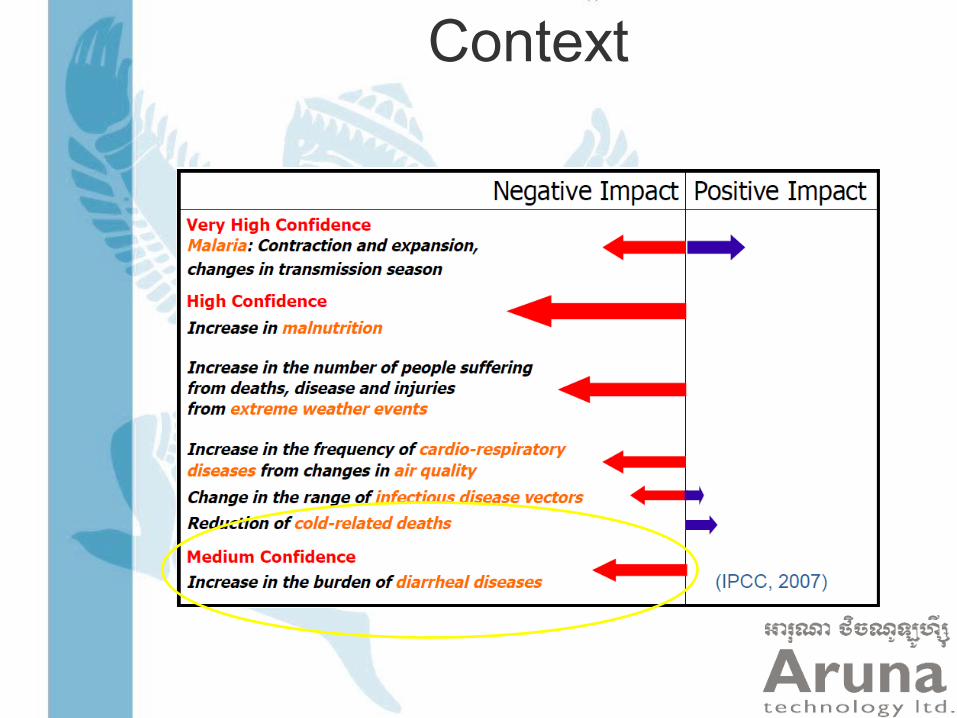
Context
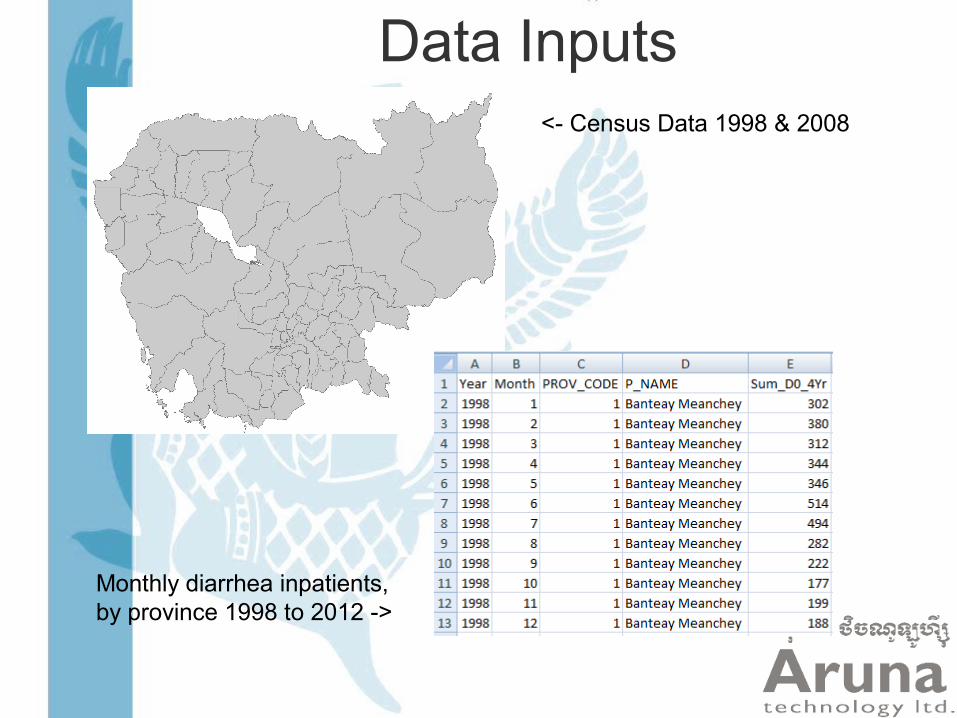
Data Inputs<- Census Data 1998 & 2008
Monthly diarrhea inpatients, by province 1998 to 2012 ->
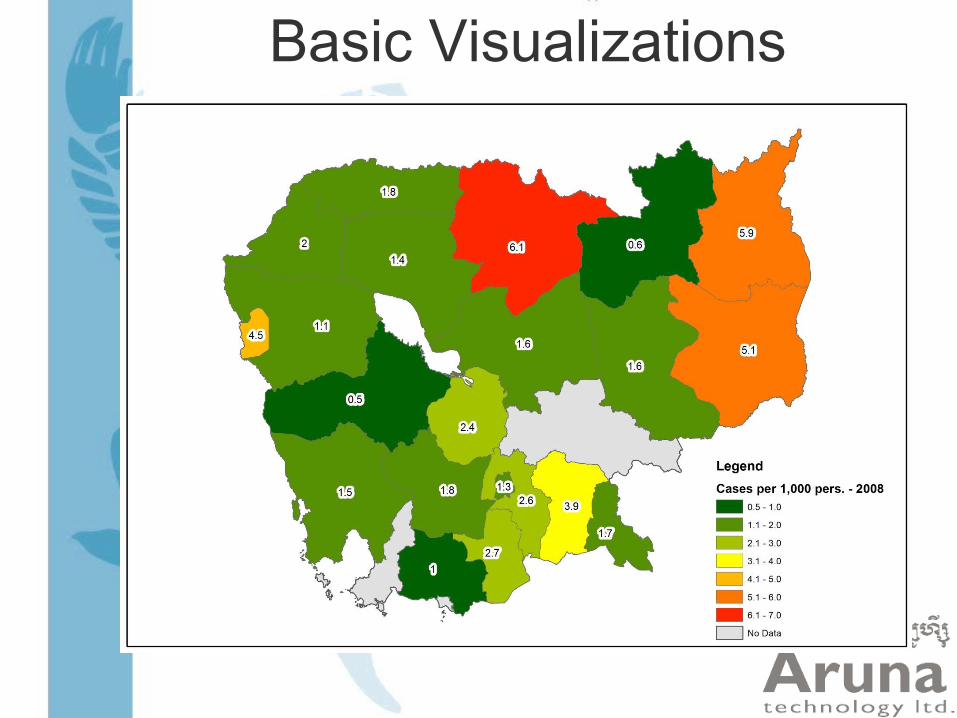
Basic Visualizations
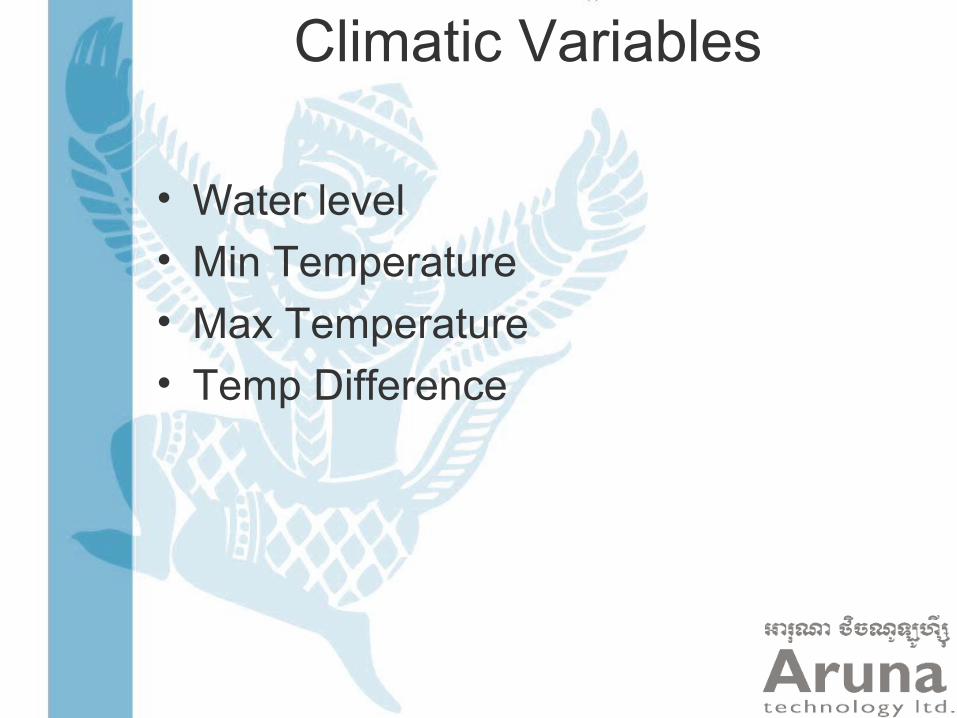
Climatic Variables
• Water level
• Min Temperature
• Max Temperature
• Temp Difference
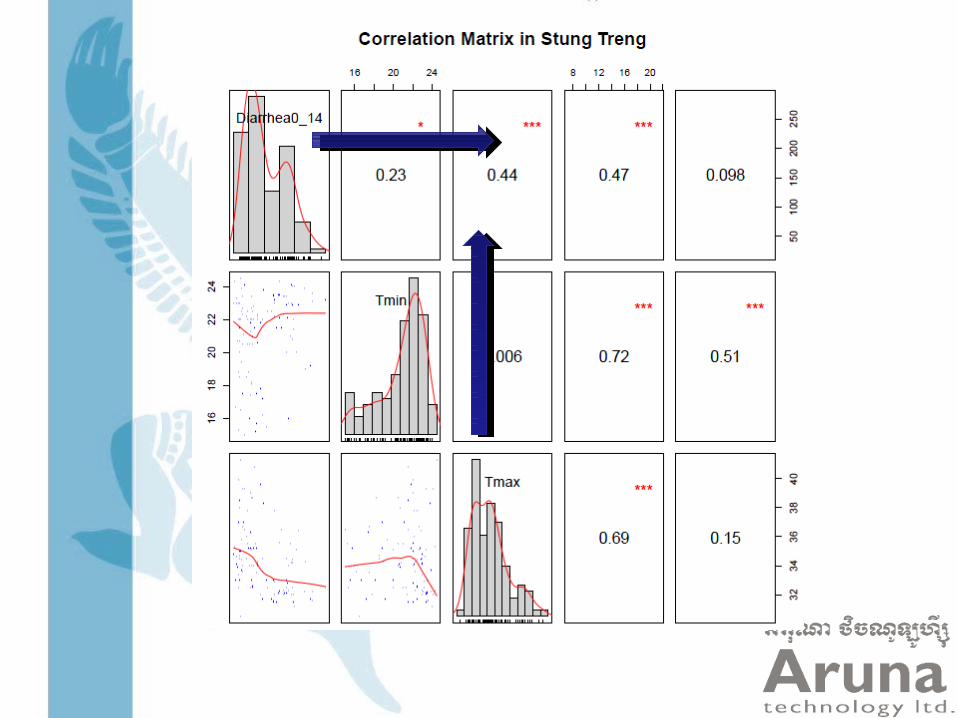
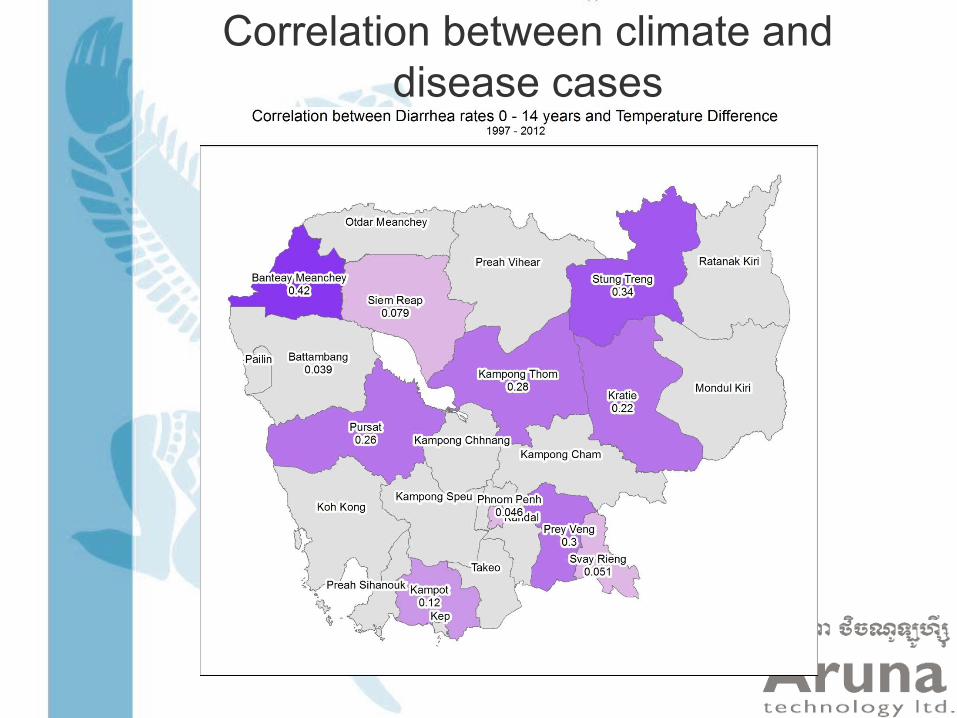
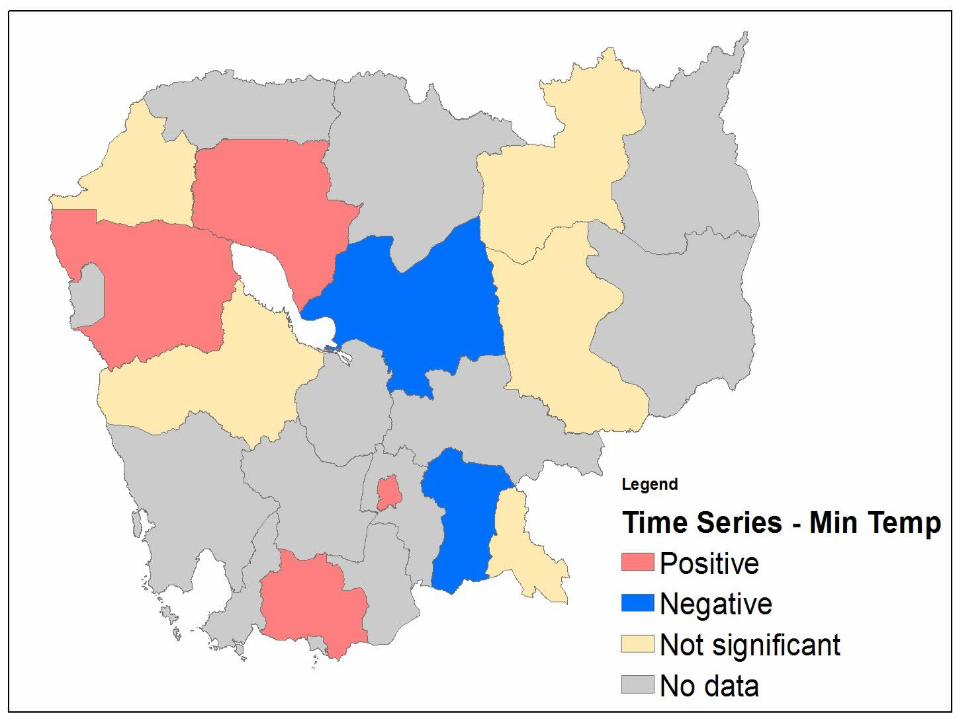
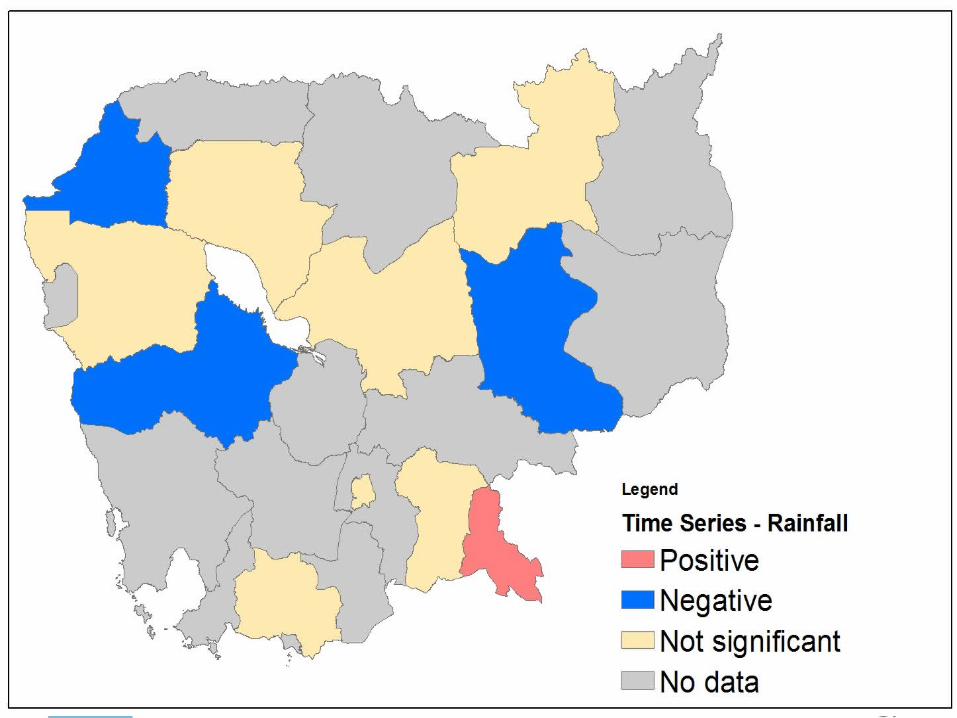
Correlation between climate and disease cases
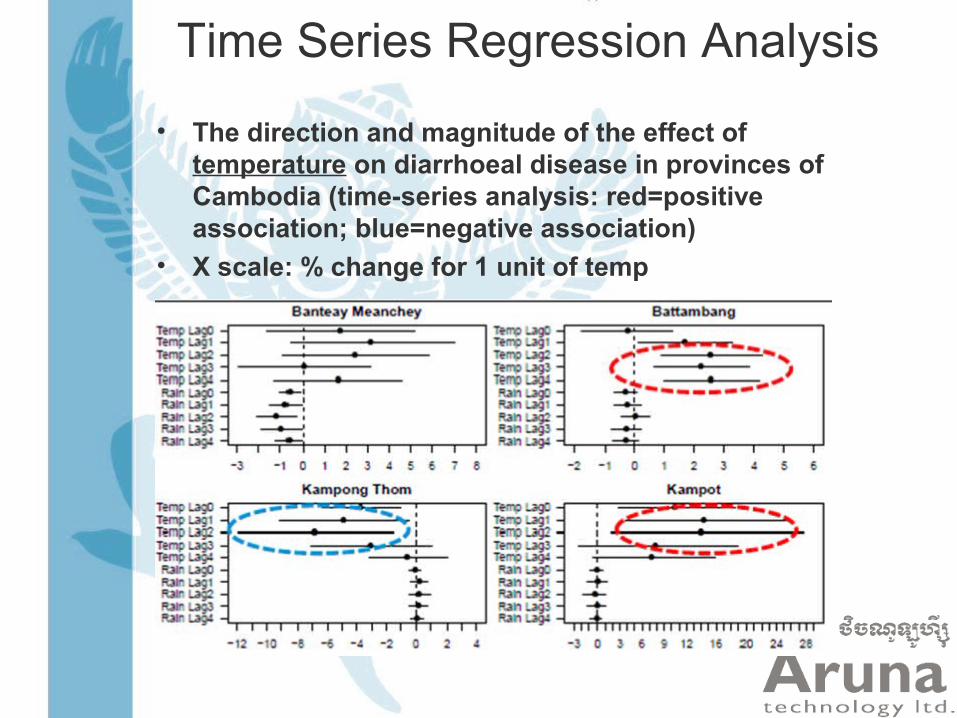
Time Series Regression Analysis
• The direction and magnitude of the effect of temperature on diarrhoeal disease in provinces of Cambodia (time-series analysis: red=positive association; blue=negative association)
• X scale: % change for 1 unit of temp
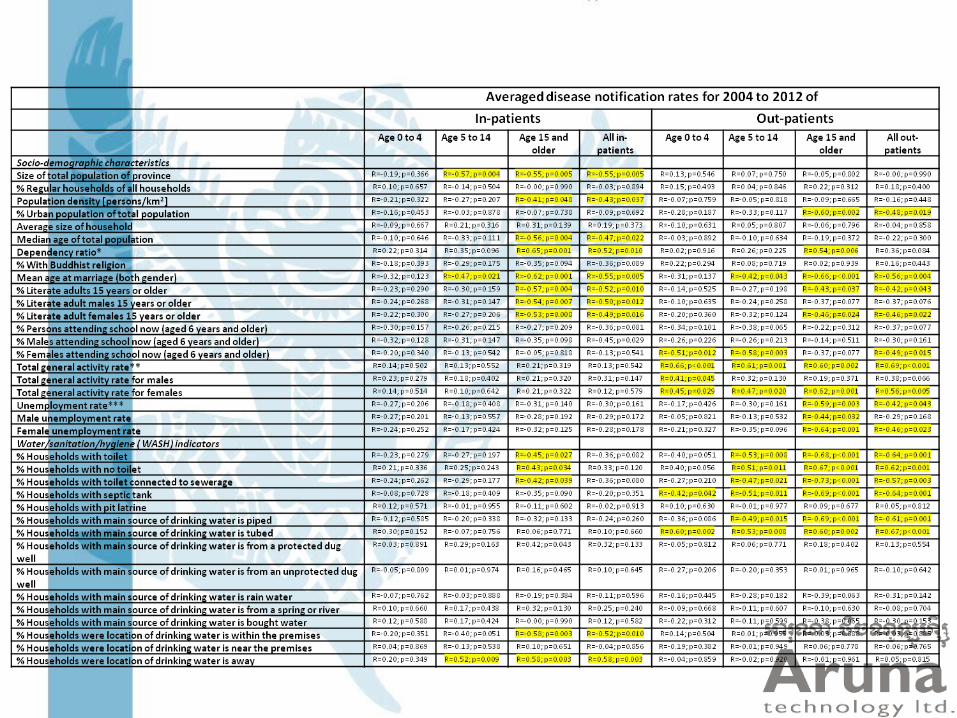
Correlation between disease rates and other factors, by province
• Flooding
• Census 1998 & 2008– Water Supply– Sanitation– Poverty– Education
• Disease rates were averaged for years 97-03 and 2012
Summary – Human Factors
• Main risk factors– unimproved water sources (e.g. tube
wells and surface water)– poor sanitation facilities (i.e. lack of
latrines and sewerage infrastructure),
• Strong evidence of a protective effect of education and literacy, particularly for women and girls, against diarrhoeal disease.
Summary – Human Factors
• Population size and density and factors related to employment were also significantly correlated with diarrhoeal disease incidence.
Summary - Climate
• The relationship between monthly temperature, rainfall and river height and diarrhoeal disease incidence across Cambodia’s provinces proved heterogeneous
• Provinces differing with respect to the direction and magnitude of these associations.

Thank you
Questions ?
Related Documents