Mapping socio-environmentally vulnerable populations access and exposure to ecosystem services at the U.S.eMexico borderlands Laura M. Norman a, * , Miguel L. Villarreal b , Francisco Lara-Valencia c , Yongping Yuan d , Wenming Nie d , Sylvia Wilson e , Gladys Amaya f , Rachel Sleeter g a U.S. Geological Survey, Western Geographic Science Center, 520 N. Park Avenue, Suite #102K, Tucson, AZ 85719-5035, USA b University of Arizona, School of Natural Resources and the Environment, Tucson, AZ 85721, USA c Arizona State University, School of Transborder Studies, Tempe, AZ 85287, USA d U.S. Environmental Protection Agency, Landscape Ecology Branch, Las Vegas, NV 89119, USA e U.S. Geological Survey, Texas Water Science Center, Austin, TX, USA f University of Arizona, Tucson, AZ 85719, USA g U.S. Geological Survey, Western Geographic Science Center, Menlo Park, CA, USA Keywords: Ecosystem services Human well-being Vulnerability Sustainability Equity Environmental justice abstract Socio-environmental vulnerable populations are often unrepresented in land-use planning yet have great potential for loss when exposed to changes in ecosystem services. Administrative boundaries, cultural differences, and language barriers increase the disassociation between land-use management and marginalized populations living in the U.S.eMexico borderlands. This paper describes the devel- opment of a Modified Socio-Environmental Vulnerability Index (M-SEVI), using determinants from binational census and neighborhood data that describe levels of education, access to resources, migratory status, housing, and number of dependents, to provide a simplified snapshot of the region’s populace that can be used in binational planning efforts. We apply this index at the SCW, located on the border between Arizona, USA and Sonora, Mexico. For comparison, the Soil and Water Assessment Tool is concurrently applied to assess the provision of erosion- and flood control services over a 9-year period. We describe how this coupling of data can form the base for an ecosystem services assessment across political boundaries that can be used by land-use planners. Results reveal potential disparities in envi- ronmental risks and burdens throughout the binational watershed in residential districts surrounding and between urban centers. The M-SEVI can be used as an important first step in addressing environ- mental justice for binational decision-making. Published by Elsevier Ltd. Introduction The most vulnerable people do not always live in the most vulnerable environments. Spatial analysis allows for the identifi- cation of where impoverished populations and marginal environ- ments coexist. In social-ecological systems, vulnerability describes a community’s resilience to change, necessary for sustainable development (Adger, 2006; Briguglio, Cordina, Farrugia, & Vella, 2009; Folke et al., 2002; Nelson, Adger, & Brown, 2007). Sustain- able development is recognized as a mutual goal that provides for the inevitable population growth expected without harming resources for future generations. The United Nations identified three components necessary to be integrated for sustainable development, (i) economic development, (ii) social development, and (iii) environmental protection, as interdependent and mutually reinforcing pillars (United Nations, 1987, 1992; Brundtland, 1987). Equity and social justice are major social goals of sustainable development (Brundtland, 1987). Prugh, Costanza, and Daly (2000) and Warner (2002) recognize that local sustainability practices are imperative but the environ- mental justice movement has not intersected with local sustainable initiatives to consider the social dimensions of sustainability. Environmental justice is the concept that environmental burdens and benefits should be equally distributed to all people to ensure a safe, healthy environment for all (Adger, 2004; Arnold, 1998; Been & Gupta, 1997; Camacho, 1998; Dow, Kasperson, & Bohn, 2006; Faber, 1998). Historically, spatial studies of environmental justice analyze the characteristics of the population potentially exposed to * Corresponding author. Tel.: þ1 520 670 5510; fax: þ1 520 670 5113. E-mail addresses: [email protected] (L.M. Norman), [email protected] (M.L. Villarreal), [email protected] (F. Lara-Valencia), [email protected] (Y. Yuan), [email protected] (W. Nie), [email protected] (S. Wilson), [email protected] (G. Amaya), [email protected] (R. Sleeter). Contents lists available at SciVerse ScienceDirect Applied Geography journal homepage: www.elsevier.com/locate/apgeog 0143-6228/$ e see front matter Published by Elsevier Ltd. doi:10.1016/j.apgeog.2012.01.006 Applied Geography 34 (2012) 413e424

Welcome message from author
This document is posted to help you gain knowledge. Please leave a comment to let me know what you think about it! Share it to your friends and learn new things together.
Transcript
Mapping socio-environmentally vulnerable populations access and exposureto ecosystem services at the U.S.eMexico borderlands
Laura M. Norman a,*, Miguel L. Villarreal b, Francisco Lara-Valencia c, Yongping Yuan d, Wenming Nie d,Sylvia Wilson e, Gladys Amaya f, Rachel Sleeter g
aU.S. Geological Survey, Western Geographic Science Center, 520 N. Park Avenue, Suite #102K, Tucson, AZ 85719-5035, USAbUniversity of Arizona, School of Natural Resources and the Environment, Tucson, AZ 85721, USAcArizona State University, School of Transborder Studies, Tempe, AZ 85287, USAdU.S. Environmental Protection Agency, Landscape Ecology Branch, Las Vegas, NV 89119, USAeU.S. Geological Survey, Texas Water Science Center, Austin, TX, USAfUniversity of Arizona, Tucson, AZ 85719, USAgU.S. Geological Survey, Western Geographic Science Center, Menlo Park, CA, USA
Keywords:Ecosystem servicesHuman well-beingVulnerabilitySustainabilityEquityEnvironmental justice
a b s t r a c t
Socio-environmental vulnerable populations are often unrepresented in land-use planning yet havegreat potential for loss when exposed to changes in ecosystem services. Administrative boundaries,cultural differences, and language barriers increase the disassociation between land-use managementand marginalized populations living in the U.S.eMexico borderlands. This paper describes the devel-opment of a Modified Socio-Environmental Vulnerability Index (M-SEVI), using determinants frombinational census and neighborhood data that describe levels of education, access to resources, migratorystatus, housing, and number of dependents, to provide a simplified snapshot of the region’s populacethat can be used in binational planning efforts. We apply this index at the SCW, located on the borderbetween Arizona, USA and Sonora, Mexico. For comparison, the Soil and Water Assessment Tool isconcurrently applied to assess the provision of erosion- and flood control services over a 9-year period.We describe how this coupling of data can form the base for an ecosystem services assessment acrosspolitical boundaries that can be used by land-use planners. Results reveal potential disparities in envi-ronmental risks and burdens throughout the binational watershed in residential districts surroundingand between urban centers. The M-SEVI can be used as an important first step in addressing environ-mental justice for binational decision-making.
Published by Elsevier Ltd.
Introduction
The most vulnerable people do not always live in the mostvulnerable environments. Spatial analysis allows for the identifi-cation of where impoverished populations and marginal environ-ments coexist. In social-ecological systems, vulnerability describesa community’s resilience to change, necessary for sustainabledevelopment (Adger, 2006; Briguglio, Cordina, Farrugia, & Vella,2009; Folke et al., 2002; Nelson, Adger, & Brown, 2007). Sustain-able development is recognized as a mutual goal that provides forthe inevitable population growth expected without harming
resources for future generations. The United Nations identifiedthree components necessary to be integrated for sustainabledevelopment, (i) economic development, (ii) social development,and (iii) environmental protection, as interdependent andmutuallyreinforcing pillars (United Nations, 1987, 1992; Brundtland, 1987).Equity and social justice are major social goals of sustainabledevelopment (Brundtland, 1987).
Prugh, Costanza, and Daly (2000) and Warner (2002) recognizethat local sustainability practices are imperative but the environ-mental justice movement has not intersectedwith local sustainableinitiatives to consider the social dimensions of sustainability.Environmental justice is the concept that environmental burdensand benefits should be equally distributed to all people to ensurea safe, healthy environment for all (Adger, 2004; Arnold,1998; Been& Gupta, 1997; Camacho, 1998; Dow, Kasperson, & Bohn, 2006;Faber, 1998). Historically, spatial studies of environmental justiceanalyze the characteristics of the population potentially exposed to
* Corresponding author. Tel.: þ1 520 670 5510; fax: þ1 520 670 5113.E-mail addresses: [email protected] (L.M. Norman), [email protected]
(M.L. Villarreal), [email protected] (F. Lara-Valencia), [email protected](Y. Yuan), [email protected] (W. Nie), [email protected](S. Wilson), [email protected] (G. Amaya), [email protected] (R. Sleeter).
Contents lists available at SciVerse ScienceDirect
Applied Geography
journal homepage: www.elsevier .com/locate/apgeog
0143-6228/$ e see front matter Published by Elsevier Ltd.doi:10.1016/j.apgeog.2012.01.006
Applied Geography 34 (2012) 413e424
a hazardous land-use (Been and Gupta 1997; Maantay, 2002;United Church of Christ Commission for Racial Justice, 1987;Warner, 2002). Less-resilient or vulnerable populations may beless likely to respond to, cope with, and recover from disasters andhazards and need to be recognized as such in decision-making andland-use planning (Adger, 2006; Arnold, 1998; Butler, Corvalan, &Koren, 2005; Rodríguez et al., 2006; Tallis & Polasky, 2009).Agyeman and Evans (2003, 2004) and Warner (2002) argue thatenvironmental justice is the social dimension and keystone ofsustainable development.
Methodological difficulties, issues of data quality and access,and conceptual shortcomings within social vulnerability researchlimit the development of measuring social vulnerability (Cutter &Finch, 2008). However, one method that has been accepted tomeasure and map vulnerability is through the use of compoundindices. A composite index incorporates a large number of factorsthat are averaged together to form a singular product, meant to berepresentative of an overall group. The combination of multiplefactors or indicators into a compound index increases the sensi-tivity, reliability, and ease of communication (Donelson & Esparza,2010a; Sholes, Biggs, Palm, & Duraiappah, 2010).
The conceptual framework for using ecosystem services toevaluate the complex interrelationships between human systemsand the environment is provided by the United Nations MillenniumEcosystem Assessment (2003, 2005). The provision of ecosystemservices varies when land uses change and/or land cover is altered,yet quantifying impacts on different socioeconomic systems is stilla novel challenge (Tallis & Polasky, 2009). The MillenniumEcosystem Assessment states that changes in ecosystem serviceshave disproportionate impacts on different segments of society(2005). Indigent, poorly-resourced, and otherwise disadvantagedcommunities may be more dependent on healthy ecosystems and/or lack the means to subsidize themselves by purchasing orimporting ecosystem services (Ash et al., 2010; Butler et al., 2005;Butler & McMichael, 2006; Butler & Oluoch-Kosura, 2005). López-Hoffman, McGovern, Varady, and Flessa (2009) argue that theconcept of ecosystem services could be used to promote morecollaborative and equitable management of ecosystem servicesacross international borders.
At the U.S.eMexico border, physical barriers demarcate a divi-sion of political administration, yet international policies like theBorder Industrialization Program (BIP) in 1965 and the NorthAmerican Free Trade Agreement (NAFTA) in 1994 have led to theopening of this border for trade. The establishment of internationalmaquiladoras (factories) and other social and economic changesassociated with development has been made to accommodatetrade, transforming the physical environment of the U.S.eMexicoborderlands (Esparza, Waldorf, & Chavez, 2004; Gomez, 1993;Gruben, 2001; Sassen, 2006). Related compromises in thesustainability of air- and water quality pose risks to public health,safety, and the environment for people living in colonias (Apitz,2007; Carter, Peña, Varady, & Suk, 1996; Collins-Dogrul, 2006;Faber, 1998; Moda, 2007; Norman, 2010; Norman, Hirsch, & Ward,2008, p. 63).
Colonias, the Spanish word for neighborhood, are defined by theCranston-Gonzales Act 1992, as unincorporated communitieslocated within 150-miles of the U.S.eMexico border, with lowincomes, that lack safe housing and/or services such as potablewater, adequate sewage systems, drainage, streets, and utilities. InArizona, colonias can include tribal communities, long-establishedmining towns, retirement communities, rural utility districts, andillegal “wildcat” subdivisions (Esparza & Donelson, 2008; Norman,2010). In Sonora, Mexico, migrants from all over the country, andoften from countries further south, relocate to the border in searchof work. Mexican colonias can develop when family and friends join
relocated workers, overcrowding individual dwellings, and/oroccupying property that is not otherwise developed (Norman,Parcher, & Lam, 2004, 2010). Arnold (1998) and Henkel (2010)recognize that colonias are also characterized as having a dispro-portionate concentration of potentially hazardous land uses.
Politicians and land-use and natural resource managers cannotconsider impacts to human well-being, nor preemptively sheltersocio-environmentally vulnerable populations, without under-standing the geography of socio-environmental vulnerability inrelationship to the distribution of goods and services (Butler &Oluoch-Kosura, 2006). Socioeconomic vulnerability in theUSeMexico border region is a function globalization processes andlocal environmental change, as well as class, ethnicity, age, andgender (Wilder et al., 2010). People living in colonias do not havethe resources to fund infrastructure improvements needed tominimize environmental degradation associated with develop-ment (Arnold, 1998; Fisher, 2008; Henkel, 2010; Moda, 2007;Norman, 2010; and Pepin, 1998).
Future generations living in the borderlands will be dependenton binational administrations adopting management strategiesthat best accommodate sustainable development. A goal ofsustainable development is to eliminate risks to the most vulner-able populations by making this central to decision-makingprocesses (Adger, 2006; Nelson et al., 2007). A more sustainablefuture also requires new approaches to the way decisions are madeabout natural resources, where the benefits and services providedby ecosystems are recognized and represented in planning andpolicy discussions (Hancock, 2010). The U.S. Geological Survey(USGS) has developed an Ecosystem Portfolio Model (EPM; Labiosaet al., 2009, p. 41) that presents the three pillars of sustainability(social, economic, and biophysical characteristics) together in anonline decision support system to help managers visualize theimpacts of management practices. The EPM offers a place-basedholistic ecosystem analysis that portrays an unbiased view ofregional impacts and ecosystem service tradeoffs in alternativescenarios and is being applied in the Santa Cruz Watershed at theU.S.eMexico border of ArizonaeSonorato help decision-makersidentify where ecosystem services distribution should be regu-lated across the USeMexico border (Norman, Tallent-Halsell et al.,2010).
Definitional, conceptual, methodological, and data-relatedconcerns raise questions in regards to the potential of mappingenvironmental equity (Maantay, 2002). This is magnified when thechallenge extends across international boundaries where largeeconomic disparities exist. The Gross Domestic Product (GDP) is thevalue of all goods and services produced (Briguglio & Galea, 2002).In the United States, the GDP per capita, is more than quadruple tothat in Mexico e making crossborder economic comparison highlyskewed. Advances made in the mapping of social indicators usingcompound indices can be used to identify where vulnerable pop-ulations exist in the borderlands (Anderson & Gerber, 2007; Collinset al., 2010; Lara-Valencia, Declet-Barreto, & Keys, 2008). Andersonand Gerber (2007) combine Mexican and U.S. Census variables indiscussing income and poverty in municipios and counties. Lara-Valencia et al. (2008) developed a Socio-Environmental Vulnera-bility Index (SEVI) that classifies residential areas binationally at thecensus block level in order to investigate the health impacts oftransportation facilities in Ambos Nogales.
Cutter and Finch (2008) recognize two research veins todescribe vulnerability: (i) human-environmental vulnerability toglobal environmental processes (climate change and its impacts)and (ii) vulnerability to natural-hazards or disasters e both ofwhich agree that exposure, sensitivity, and response requiremeasurements of both environmental and social systems. Vulner-able populations living in colonias are more susceptible to harmful
L.M. Norman et al. / Applied Geography 34 (2012) 413e424414
impacts associated with land-use and climate change (Liverman,1990; Wilder et al., 2010). Flooding can be considered beneficialto the environment and is a natural occurrence, but can also bedevastating to natural systems when impervious surface increasesand vegetation is removed. Floods can interfere with drainage,damage property and infrastructure, and reduce the economicvalue of land. Soil erosion is the detachment of soil particles that aretransported as sediment by flowing water. Sediment yield is thetotal amount of sediment detached, transported and deposited ordischarged. Sediment is a major pollutant in waterways anda transporter of contaminants (Lane, Hernandez, & Nichols, 1997;Norman, Guertin, & Feller, 2008). Flooding and erosion are twomain issues confronting people in the borderlands in the face ofclimate change that impact human livelihoods, health, and some-times mortality (Norman, Hirsch et al., 2008; Norman, Huth et al.,2010, p. 63). For example, in January 2008, a 5-foot-high concretebarrier was constructed by the U.S. Border Patrol in a storm-watertunnel to block illegal immigration in Ambos Nogales e on July 12,of the same year, a severe thunderstorm caused major floodingaround the structure (Wilder et al., 2010). Photographs depict fivefeet of standing water south of the border wall, where $8 millionworth of damage was reported, including 578 homes, 45 cars, anda collapsed tunnel in Nogales, Sonora (McCombs, 2008). Regulatingservices, such as flood and erosion-control can help protectcommunities from extreme climate events such as rainstorms anddroughts (Ash et al., 2010).
The objective of this paper is to demonstrate a method to mapthe distribution of socio-environmentally vulnerable populationsacross international boundaries and show how these socialdimensions can be compared to regulating ecosystem services, topromote binational environmental justice. This is a challenginganalysis with many methodological obstacles to overcome,including variances in resolution of the data, data quality, datacomparability, modeling resolution and uncertainty e all of whichconstrain the analysis and generate issues of certainty and reli-ability in the outcomes, placing limitations on what can be ach-ieved. Yet, this analysis is intended to present a learning process inwhich methodologies stand to be tried and then improved subse-quently. We describe the development of a Modified Socio-Environmental Vulnerability Index (M-SEVI) for the Santa CruzWatershed, using determinants from binational census andneighborhood data that depict levels of education, access toresources, migratory status, housing, and number of dependents.The Soil and Water Assessment Tool (SWAT), a hydrologic model, isalso applied to the watershed to derive estimates of historicalecosystem services provision, of both flood and erosion-control.This combination of social (M-SEVI) and biophysical (SWAT)models, provides a tool for sustainable land-use planning that canenable more equitable management of resources.
Study area
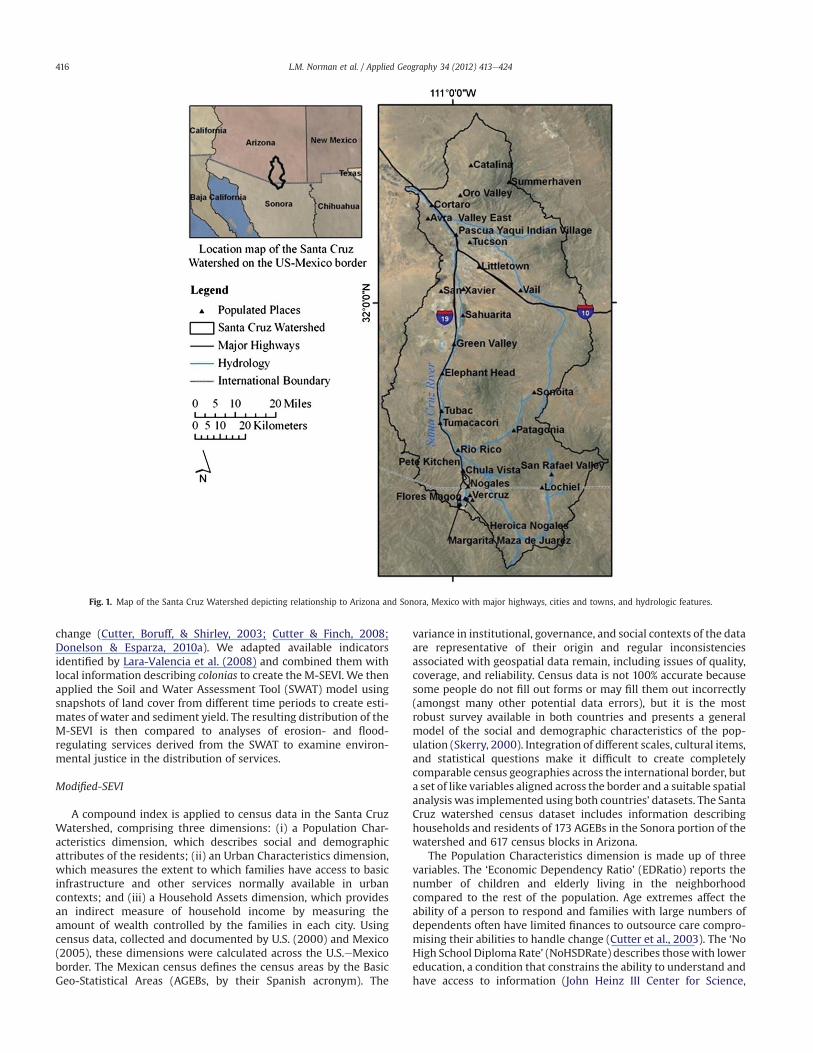
The Santa Cruz River is a binational river in the Sonoran Desertthat flows across the Arizona-Sonora portion of the U.S.eMexicoborder and drains the binational Santa Cruz Watershed (Fig. 1). Inthis description of the study area, we will follow the river throughthe watershed, describing the environment, people, and potentialissues associated with the nexus along the way.
The Santa Cruz River originates in the southwest corner of theSanta Cruz Watershed in a grassland and cattle-grazing region inArizona, called the San Rafael Valley, then flows south across theinternational border at Lochiel into a u-turn through farmlands andranches in Sonora, Mexico, and back into Arizona where agricul-tural settlements exist (Brown, 2002, p. 27). The southernmostNogales Wash tributary begins in Sonora, Mexico and travels north
through Heroica Nogales (a.k.a. Nogales), Sonora, Mexico, sur-rounded by the colonias of Solidaridad, Veracruz, Flores Magón andMargarita Maza de Juarez. The Nogales Wash runs into Nogales,Arizona and the colonias of Chula Vista and Pete Kitchen before it’sconfluence with the Santa Cruz River. Ambos Nogales (“both”Nogales) is a major urban hub of International export, that faceswater issues including the provision of supply, infrastructure andwaste facility maintenance, inter-basin transfers, flooding prob-lems, and associated environmental quality issues (MorrisonInstitute for Public Policy 2008, 2009; Norman, Huth et al., 2010a).
Streamflow north of Nogales in the Santa Cruz River is sup-ported mostly by wastewater (effluent) from the InternationalWastewater Treatment Plant at Rio Rico. The Sonoita Creek tribu-tary to the Santa Cruz River originates in Sonoita, Arizona, north-east of Ambos Nogales, and feeds into the Patagonia and thesouthern Santa Rita Mountains area, which were mined intermit-tently from the 1600’s to the mid- 1960’s, for silver, lead, copper,zinc, and gold. Locally disturbed surface water is highly acidicbecause of the association with sulfide pyrite (Brady, Gray, Wissler,& Guertin, 2001; Norman, Gray, Guertin, Wissler, & Bliss, 2008a).However, the Sonoita Creek is one of a few remaining permanentstreams in the watershed and provides for a wide array of diversespecies and habitats protected by The Nature Conservancy.
The Santa Cruz River flows to the northwest with contributionsfrom the Sonoita Creek, through the Tumacácori National HistoricalPark, yet surface flows are intermittent only after precipitationevents in the communities of Tubac, Elephant Head, Green Valley,and Sahuarita. As the course of the river continues north, it crossesthe San Xavier District of the Tohono O’odham Nation. The SanXavier District is approximately 70,000 acres, with several inter-related land and water-management issues related to leasedparcels of land managed by a major copper mining firm (Brown,2002, p. 27). East of the San Xavier and the Santa Cruz River arethe communities of Vail, Old Nogales Hwy, and Littletown.
The Santa Cruz River becomes channelized for flood controlpurposes as its course moves through urban reaches of Tucson,Avra Valley East, and Cortaro, after which it drains to the Gila Riverand ultimately the Colorado River (Brown, 2002, p. 27). The pop-ulation of the Tucson Metropolitan area is about 1 million people,and the city’s major contributors to population and economy arethe University of Arizona and Davis-Monthan Air Force Base. ThePascua Yaqui Indian Village is located inside of Tucson city limits.The Morrison Institute (2008, 2009) identifies rapid groundwateruse, travel/transportation considerations, related to urbanization,water quantity, and river restoration as major issues in Tucson.Catalina and Oro Valley are located north of Tucson with urbanhousing, small ranches, and recreational bike paths. The touristcommunity of Summerhaven is located on Mount Lemmon in theSanta Catalina Mountains.
According to the 2005 Mexican and the 2000 United States’national censuses,1,070,100 people live in the binational Santa CruzWatershed: 194,272 are in Mexico and 875,828 in the U.S. There are19 colonias in the Santa CruzWatershed, 8 of which are south of theborder (Donelson & Esparza, 2010b; Esparza & Donelson, 2008;Norman, Donelson, Pfeifer, & Lam, 2006).
Materials and methods
In order to identify where vulnerable populations coexist withdeclining ecosystem services in the watershed, we first developedthe Modified Socio-Environmental Index (M-SEVI). People withhigher levels of education, easier access to resources, nonexistentmigratory status, secure housing, and limited number of depen-dents are shown to have stronger ties to their community, betterfoundations from which to draw support, and higher resilience to
L.M. Norman et al. / Applied Geography 34 (2012) 413e424 415
change (Cutter, Boruff, & Shirley, 2003; Cutter & Finch, 2008;Donelson & Esparza, 2010a). We adapted available indicatorsidentified by Lara-Valencia et al. (2008) and combined them withlocal information describing colonias to create the M-SEVI. We thenapplied the Soil and Water Assessment Tool (SWAT) model usingsnapshots of land cover from different time periods to create esti-mates of water and sediment yield. The resulting distribution of theM-SEVI is then compared to analyses of erosion- and flood-regulating services derived from the SWAT to examine environ-mental justice in the distribution of services.
Modified-SEVI
A compound index is applied to census data in the Santa CruzWatershed, comprising three dimensions: (i) a Population Char-acteristics dimension, which describes social and demographicattributes of the residents; (ii) an Urban Characteristics dimension,which measures the extent to which families have access to basicinfrastructure and other services normally available in urbancontexts; and (iii) a Household Assets dimension, which providesan indirect measure of household income by measuring theamount of wealth controlled by the families in each city. Usingcensus data, collected and documented by U.S. (2000) and Mexico(2005), these dimensions were calculated across the U.S.eMexicoborder. The Mexican census defines the census areas by the BasicGeo-Statistical Areas (AGEBs, by their Spanish acronym). The
variance in institutional, governance, and social contexts of the dataare representative of their origin and regular inconsistenciesassociated with geospatial data remain, including issues of quality,coverage, and reliability. Census data is not 100% accurate becausesome people do not fill out forms or may fill them out incorrectly(amongst many other potential data errors), but it is the mostrobust survey available in both countries and presents a generalmodel of the social and demographic characteristics of the pop-ulation (Skerry, 2000). Integration of different scales, cultural items,and statistical questions make it difficult to create completelycomparable census geographies across the international border, buta set of like variables aligned across the border and a suitable spatialanalysis was implemented using both countries’ datasets. The SantaCruz watershed census dataset includes information describinghouseholds and residents of 173 AGEBs in the Sonora portion of thewatershed and 617 census blocks in Arizona.
The Population Characteristics dimension is made up of threevariables. The ‘Economic Dependency Ratio’ (EDRatio) reports thenumber of children and elderly living in the neighborhoodcompared to the rest of the population. Age extremes affect theability of a person to respond and families with large numbers ofdependents often have limited finances to outsource care compro-mising their abilities to handle change (Cutter et al., 2003). The ‘NoHigh School Diploma Rate’ (NoHSDRate) describes thosewith lowereducation, a condition that constrains the ability to understand andhave access to information (John Heinz III Center for Science,
Fig. 1. Map of the Santa Cruz Watershed depicting relationship to Arizona and Sonora, Mexico with major highways, cities and towns, and hydrologic features.
L.M. Norman et al. / Applied Geography 34 (2012) 413e424416
Economics, and the Environment 1999). Further, those with highereducation have access to higher earnings, which leads to increasedsocioeconomic status, political power, and prestige e creating theability to absorb losses and enhance resilience using insurance,social safety nets, and entitlement programs (Cutter et al., 2003).And, the third of the population variables is the ‘New Resident Rate’(NewResidRate), which represents peoples who are new to theirneighborhood. New migrants may not speak the language and notbe familiar with how to obtain information, which increasesvulnerability (John Heinz III Center for Science, Economics, and theEnvironment 1999; Donelson & Esparza, 2010a).
The Urban Characteristics dimension has only one variable inthe M-SEVI, the ‘Incomplete Plumbing Rate’ (IncPlumbRate).According to the Census, complete plumbing facilities means thata housing unit has hot and cold piped water, a flush toilet, anda bathtub or shower e those homes who do not have these threethings somewhere in their house are considered those with“incomplete plumbing facilities”. In the U.S., Arizona has the secondhighest rate of incomplete plumbing (7.8 percent) after Alaska (U.S.Environmental Protection Agency 2011). The Household Assetsdimension is represented by two variables in the M-SEVI: the ‘OneBedroom Rate’ (OneBedRate) and the ‘Occupancy Rate’ (OccRate).These variables represent the value and quality of living conditions,an indicator of the state of economic health of a community. Table 1describes how each dimension of the M-SEVI is quantified usingbinational census data in a GIS.
These dimensions mimic the variables developed by Lara-Valencia et al. (2008) or are slightly altered to accommodateavailable data, as follows:
� the “EDRatio” variable was adjusted to calculate population ofyouths 14 and under vs.11 (based on data available) and under;
� binational information describing telephone service, renteroccupancy automobile ownership, and complete kitchens arenot available and therefore left out of this index; and
� the “OccRate” variable was altered to represent number ofpeople per household vs. number of people per room.
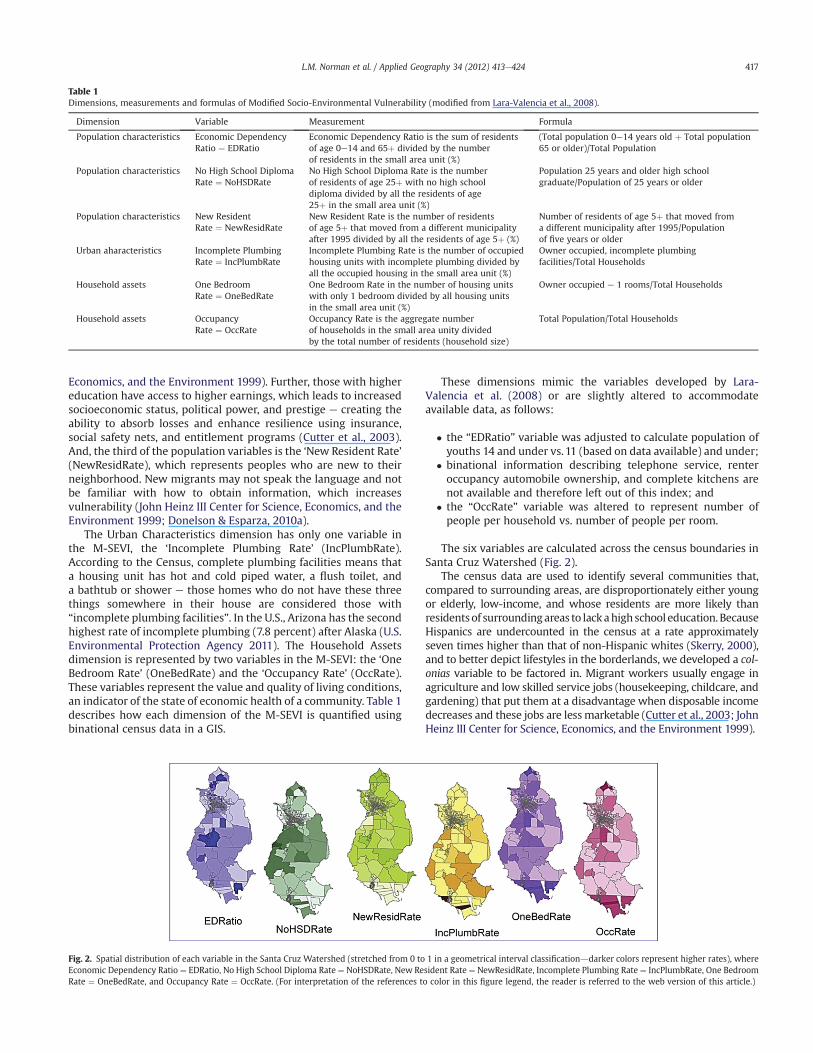
The six variables are calculated across the census boundaries inSanta Cruz Watershed (Fig. 2).
The census data are used to identify several communities that,compared to surrounding areas, are disproportionately either youngor elderly, low-income, and whose residents are more likely thanresidentsof surroundingareas to lackahighschool education. BecauseHispanics are undercounted in the census at a rate approximatelyseven times higher than that of non-Hispanic whites (Skerry, 2000),and to better depict lifestyles in the borderlands, we developed a col-onias variable to be factored in. Migrant workers usually engage inagriculture and low skilled service jobs (housekeeping, childcare, andgardening) that put them at a disadvantage when disposable incomedecreases and these jobs are lessmarketable (Cutter et al., 2003; JohnHeinz III Center for Science, Economics, and the Environment 1999).
Fig. 2. Spatial distribution of each variable in the Santa Cruz Watershed (stretched from 0 to 1 in a geometrical interval classificationddarker colors represent higher rates), whereEconomic Dependency Ratio ¼ EDRatio, No High School Diploma Rate ¼ NoHSDRate, New Resident Rate ¼ NewResidRate, Incomplete Plumbing Rate ¼ IncPlumbRate, One BedroomRate ¼ OneBedRate, and Occupancy Rate ¼ OccRate. (For interpretation of the references to color in this figure legend, the reader is referred to the web version of this article.)
Table 1Dimensions, measurements and formulas of Modified Socio-Environmental Vulnerability (modified from Lara-Valencia et al., 2008).
Dimension Variable Measurement Formula
Population characteristics Economic DependencyRatio ¼ EDRatio
Economic Dependency Ratio is the sum of residentsof age 0e14 and 65þ divided by the numberof residents in the small area unit (%)
(Total population 0e14 years old þ Total population65 or older)/Total Population
Population characteristics No High School DiplomaRate ¼ NoHSDRate
No High School Diploma Rate is the numberof residents of age 25þ with no high schooldiploma divided by all the residents of age25þ in the small area unit (%)
Population 25 years and older high schoolgraduate/Population of 25 years or older
Population characteristics New ResidentRate ¼ NewResidRate
New Resident Rate is the number of residentsof age 5þ that moved from a different municipalityafter 1995 divided by all the residents of age 5þ (%)
Number of residents of age 5þ that moved froma different municipality after 1995/Populationof five years or older
Urban aharacteristics Incomplete PlumbingRate ¼ IncPlumbRate
Incomplete Plumbing Rate is the number of occupiedhousing units with incomplete plumbing divided byall the occupied housing in the small area unit (%)
Owner occupied, incomplete plumbingfacilities/Total Households
Household assets One BedroomRate ¼ OneBedRate
One Bedroom Rate in the number of housing unitswith only 1 bedroom divided by all housing unitsin the small area unit (%)
Owner occupied e 1 rooms/Total Households
Household assets OccupancyRate ¼ OccRate
Occupancy Rate is the aggregate numberof households in the small area unity dividedby the total number of residents (household size)
Total Population/Total Households
L.M. Norman et al. / Applied Geography 34 (2012) 413e424 417
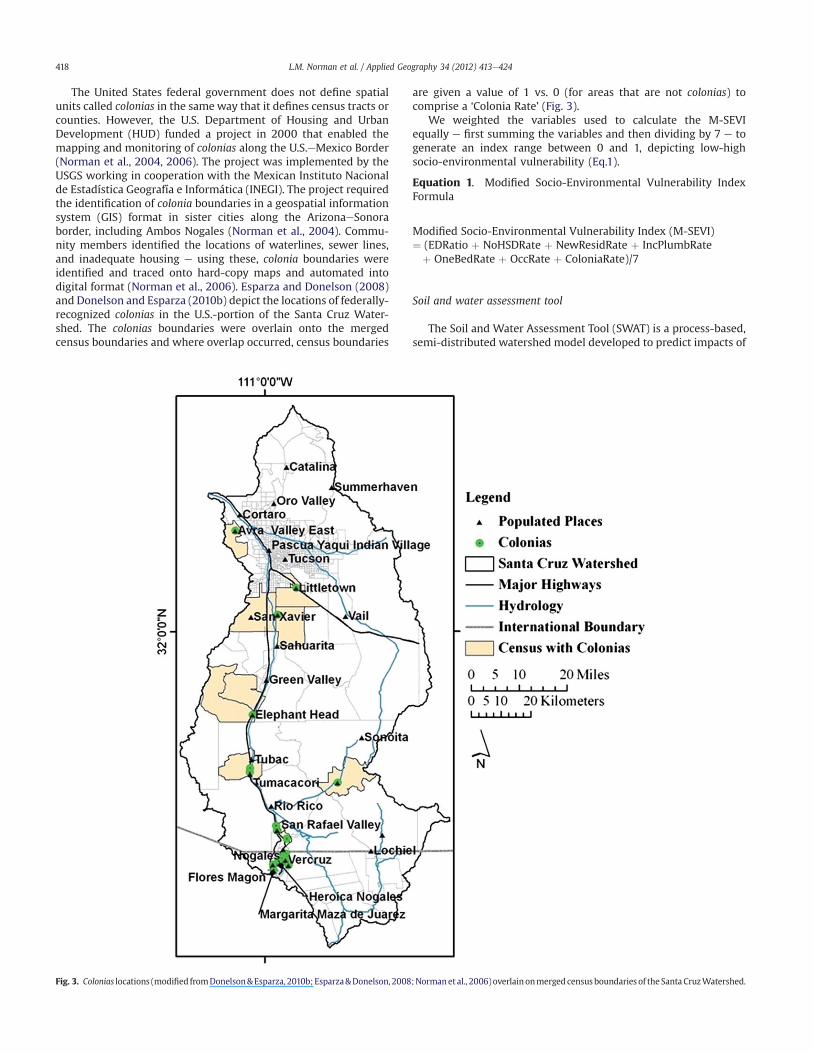
The United States federal government does not define spatialunits called colonias in the same way that it defines census tracts orcounties. However, the U.S. Department of Housing and UrbanDevelopment (HUD) funded a project in 2000 that enabled themapping and monitoring of colonias along the U.S.eMexico Border(Norman et al., 2004, 2006). The project was implemented by theUSGS working in cooperation with the Mexican Instituto Nacionalde Estadística Geografía e Informática (INEGI). The project requiredthe identification of colonia boundaries in a geospatial informationsystem (GIS) format in sister cities along the ArizonaeSonoraborder, including Ambos Nogales (Norman et al., 2004). Commu-nity members identified the locations of waterlines, sewer lines,and inadequate housing e using these, colonia boundaries wereidentified and traced onto hard-copy maps and automated intodigital format (Norman et al., 2006). Esparza and Donelson (2008)and Donelson and Esparza (2010b) depict the locations of federally-recognized colonias in the U.S.-portion of the Santa Cruz Water-shed. The colonias boundaries were overlain onto the mergedcensus boundaries and where overlap occurred, census boundaries
are given a value of 1 vs. 0 (for areas that are not colonias) tocomprise a ‘Colonia Rate’ (Fig. 3).
We weighted the variables used to calculate the M-SEVIequally e first summing the variables and then dividing by 7 e togenerate an index range between 0 and 1, depicting low-highsocio-environmental vulnerability (Eq.1).
Equation 1. Modified Socio-Environmental Vulnerability IndexFormula
Modified Socio-Environmental Vulnerability Index (M-SEVI)¼ (EDRatio þ NoHSDRate þ NewResidRate þ IncPlumbRateþ OneBedRate þ OccRate þ ColoniaRate)/7
Soil and water assessment tool
The Soil and Water Assessment Tool (SWAT) is a process-based,semi-distributed watershed model developed to predict impacts of
Fig. 3. Colonias locations (modified fromDonelson&Esparza, 2010b; Esparza&Donelson, 2008;Normanet al., 2006)overlainonmerged censusboundaries of the Santa CruzWatershed.
L.M. Norman et al. / Applied Geography 34 (2012) 413e424418
management practices on water and sediment with varying land-use/land cover (Arnold, Srinivasan, Muttiah, & Williams, 1998). TheSWAT model has been applied to assess erosion- and floodpotential under different development scenarios in many locationsinternationally and has been used in the field of ecosystem servicesto assess and quantify tradeoffs with water quality (Lautenbach,Gruber, Dorman, Strauch, & Seppelt, 2010), economic values(Immerzeel, Stoorvogel, & Antle, 2008), and agricultural provi-sioning (Swallow et al., 2009). The SWAT model is being adaptedfor the first time herein to offer a biophysical representation ofecosystem services that can be compared with social characteris-tics across the U.S.eMexico border. We calibrated and validatedSWAT at monthly-time step for four USGS gages using 22 weatherstations in hydrological response units (Nie, Yuan, Tallent-Halsellet al., 2010; Nie, Yuan, Norman, Tallent-Halsell, & Callegary,2010). SWAT was used to simulate long-term hydrologicalprocesses for two land-use scenarios, 1992 and 2001, derived fromthe U.S.eMexico Border Environmental Health Initiative (BEHI)project (USGS, 2011), to determine the impacts of land-use changeover a 9-year period.
Results
Socio-environmental vulnerability
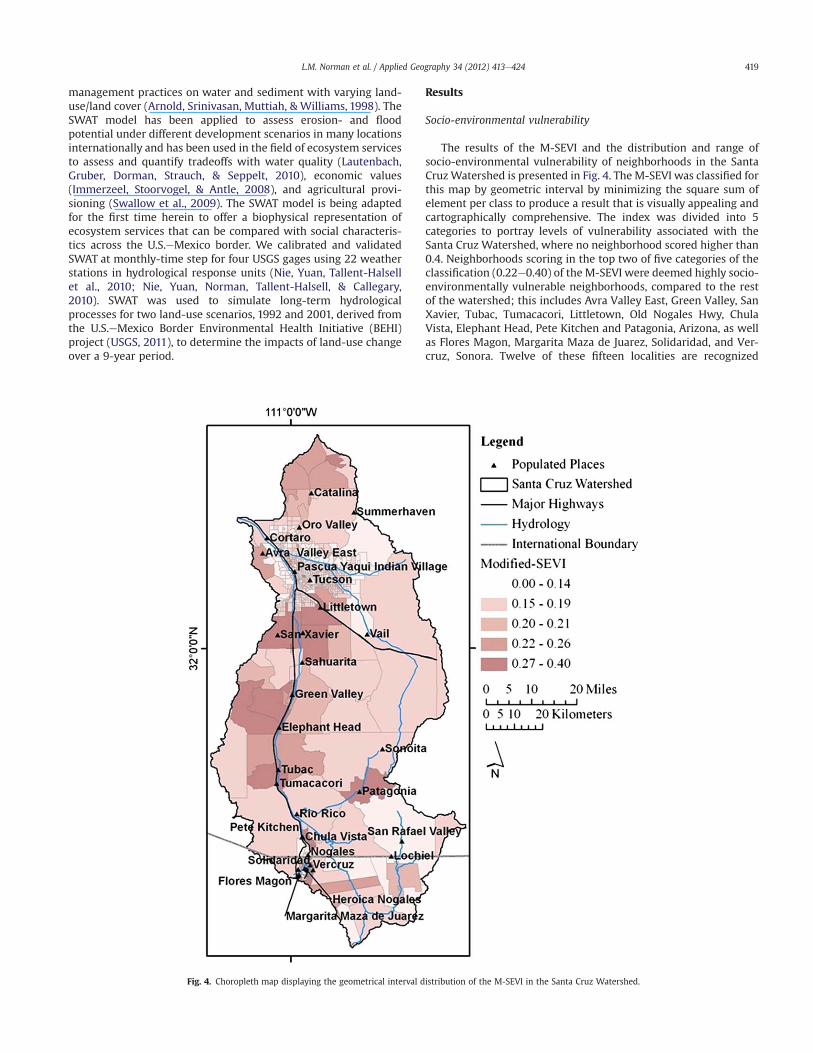
The results of the M-SEVI and the distribution and range ofsocio-environmental vulnerability of neighborhoods in the SantaCruzWatershed is presented in Fig. 4. The M-SEVI was classified forthis map by geometric interval by minimizing the square sum ofelement per class to produce a result that is visually appealing andcartographically comprehensive. The index was divided into 5categories to portray levels of vulnerability associated with theSanta Cruz Watershed, where no neighborhood scored higher than0.4. Neighborhoods scoring in the top two of five categories of theclassification (0.22e0.40) of the M-SEVI were deemed highly socio-environmentally vulnerable neighborhoods, compared to the restof the watershed; this includes Avra Valley East, Green Valley, SanXavier, Tubac, Tumacacori, Littletown, Old Nogales Hwy, ChulaVista, Elephant Head, Pete Kitchen and Patagonia, Arizona, as wellas Flores Magon, Margarita Maza de Juarez, Solidaridad, and Ver-cruz, Sonora. Twelve of these fifteen localities are recognized
Fig. 4. Choropleth map displaying the geometrical interval distribution of the M-SEVI in the Santa Cruz Watershed.
L.M. Norman et al. / Applied Geography 34 (2012) 413e424 419
colonias with inadequate housing and/or access to sewer orwaterlines. The occupancy rate is higher, and a large proportion ofthe households in the area are composed mostly of persons atproductive age, with no college education. This combination ofattributes seems to indicate that the area is in a transitional stagewith newly formed households replacing old-time resident fami-lies. Families who are predisposed to transitional change are morevulnerable to environmental changes since they are not yet rootedin communities.
A cluster of moderately socio-environmentally vulnerable (acombination of the twomiddle classes; 0.15e0.21) residential areasare located at Oro Valley, Catalina, Cortaro, Sahuarita, Sonoita, andRio Rico, Arizona. In contrast with the high socio-environmentalvulnerability neighborhoods described above, neighborhoods inthis area report slightly higher dependency ratios, which might beindicative of a larger number of more mature households. Lesseducated households are also in this group and the percentage ofhouses with only one bedroom or lacking basic services, likeplumbing, is lower.
The residential areas of Vail, Lochiel, Tucson, Pascua YaquiIndian Village, Summerhaven, San Rafael Valley, and Nogales,
Arizona and Heroica Nogales, Sonora report very low socio-environmental vulnerability (the lowest class; 0e0.14). Addition-ally, the outskirts of the watershed, in more rural zones portraya lower socio-environmental vulnerability. There are scatterings ofneighborhoods located at the mid-section of the Tucson metro-politan area and that present a short time of residence and highoccupancy, though housing and urban conditions are slightlyabove average. Fig. 4 is a choropleth map that portrays the pop-ulation as distributed homogenously throughout the census units.
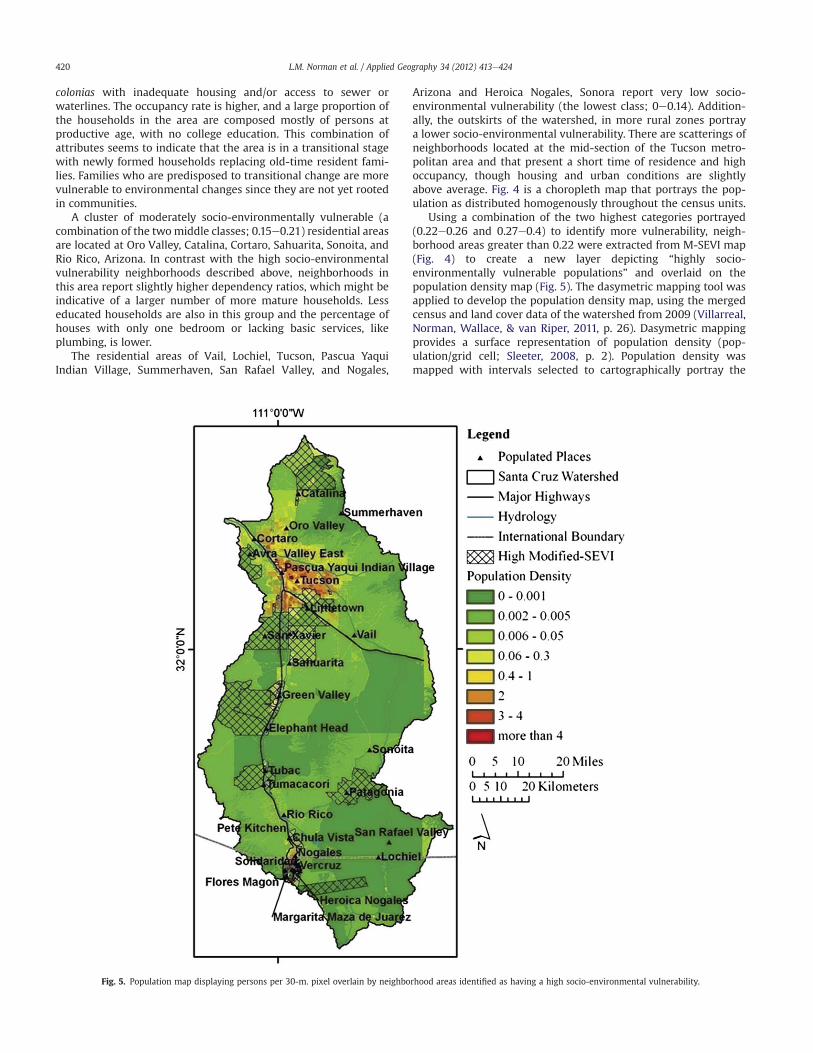
Using a combination of the two highest categories portrayed(0.22e0.26 and 0.27e0.4) to identify more vulnerability, neigh-borhood areas greater than 0.22 were extracted from M-SEVI map(Fig. 4) to create a new layer depicting “highly socio-environmentally vulnerable populations” and overlaid on thepopulation density map (Fig. 5). The dasymetric mapping tool wasapplied to develop the population density map, using the mergedcensus and land cover data of the watershed from 2009 (Villarreal,Norman, Wallace, & van Riper, 2011, p. 26). Dasymetric mappingprovides a surface representation of population density (pop-ulation/grid cell; Sleeter, 2008, p. 2). Population density wasmapped with intervals selected to cartographically portray the
Fig. 5. Population map displaying persons per 30-m. pixel overlain by neighborhood areas identified as having a high socio-environmental vulnerability.
L.M. Norman et al. / Applied Geography 34 (2012) 413e424420
extent and density of population across the watershed. In the SantaCruz Watershed, areas north of Catalina, south of Tucson, and partsof Green Valley, Nogales, Arizona, and south of Nogales, Sonora, areclearly identified as being more densely-populated, as well as,socio-environmentally vulnerable communities (Fig. 5).
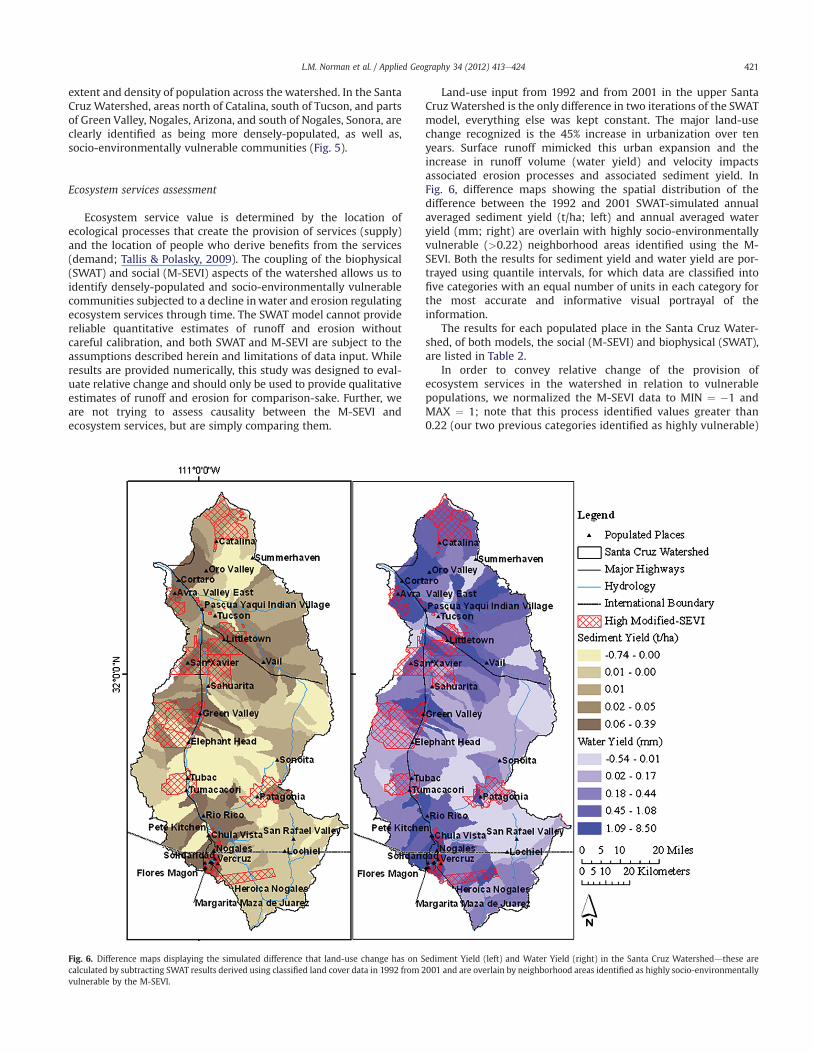
Ecosystem services assessment
Ecosystem service value is determined by the location ofecological processes that create the provision of services (supply)and the location of people who derive benefits from the services(demand; Tallis & Polasky, 2009). The coupling of the biophysical(SWAT) and social (M-SEVI) aspects of the watershed allows us toidentify densely-populated and socio-environmentally vulnerablecommunities subjected to a decline inwater and erosion regulatingecosystem services through time. The SWAT model cannot providereliable quantitative estimates of runoff and erosion withoutcareful calibration, and both SWAT and M-SEVI are subject to theassumptions described herein and limitations of data input. Whileresults are provided numerically, this study was designed to eval-uate relative change and should only be used to provide qualitativeestimates of runoff and erosion for comparison-sake. Further, weare not trying to assess causality between the M-SEVI andecosystem services, but are simply comparing them.
Land-use input from 1992 and from 2001 in the upper SantaCruzWatershed is the only difference in two iterations of the SWATmodel, everything else was kept constant. The major land-usechange recognized is the 45% increase in urbanization over tenyears. Surface runoff mimicked this urban expansion and theincrease in runoff volume (water yield) and velocity impactsassociated erosion processes and associated sediment yield. InFig. 6, difference maps showing the spatial distribution of thedifference between the 1992 and 2001 SWAT-simulated annualaveraged sediment yield (t/ha; left) and annual averaged wateryield (mm; right) are overlain with highly socio-environmentallyvulnerable (>0.22) neighborhood areas identified using the M-SEVI. Both the results for sediment yield and water yield are por-trayed using quantile intervals, for which data are classified intofive categories with an equal number of units in each category forthe most accurate and informative visual portrayal of theinformation.
The results for each populated place in the Santa Cruz Water-shed, of both models, the social (M-SEVI) and biophysical (SWAT),are listed in Table 2.
In order to convey relative change of the provision ofecosystem services in the watershed in relation to vulnerablepopulations, we normalized the M-SEVI data to MIN ¼ �1 andMAX ¼ 1; note that this process identified values greater than0.22 (our two previous categories identified as highly vulnerable)
Fig. 6. Difference maps displaying the simulated difference that land-use change has on Sediment Yield (left) and Water Yield (right) in the Santa Cruz Watersheddthese arecalculated by subtracting SWAT results derived using classified land cover data in 1992 from 2001 and are overlain by neighborhood areas identified as highly socio-environmentallyvulnerable by the M-SEVI.
L.M. Norman et al. / Applied Geography 34 (2012) 413e424 421
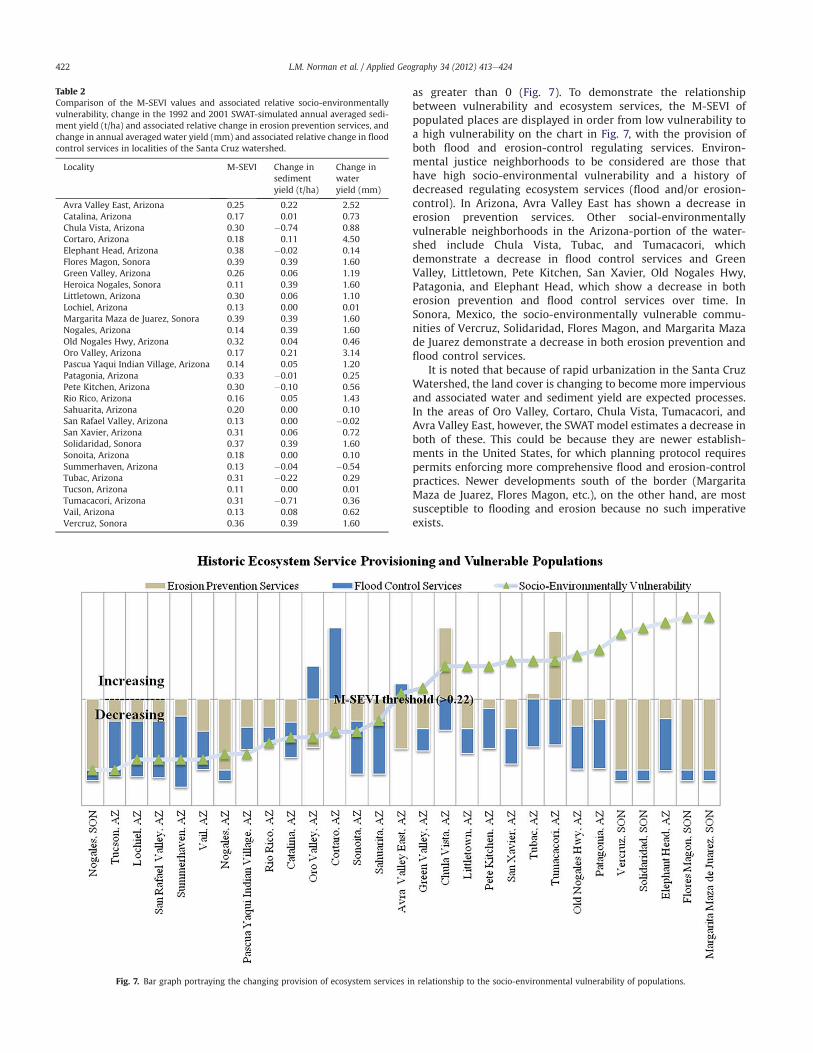
as greater than 0 (Fig. 7). To demonstrate the relationshipbetween vulnerability and ecosystem services, the M-SEVI ofpopulated places are displayed in order from low vulnerability toa high vulnerability on the chart in Fig. 7, with the provision ofboth flood and erosion-control regulating services. Environ-mental justice neighborhoods to be considered are those thathave high socio-environmental vulnerability and a history ofdecreased regulating ecosystem services (flood and/or erosion-control). In Arizona, Avra Valley East has shown a decrease inerosion prevention services. Other social-environmentallyvulnerable neighborhoods in the Arizona-portion of the water-shed include Chula Vista, Tubac, and Tumacacori, whichdemonstrate a decrease in flood control services and GreenValley, Littletown, Pete Kitchen, San Xavier, Old Nogales Hwy,Patagonia, and Elephant Head, which show a decrease in botherosion prevention and flood control services over time. InSonora, Mexico, the socio-environmentally vulnerable commu-nities of Vercruz, Solidaridad, Flores Magon, and Margarita Mazade Juarez demonstrate a decrease in both erosion prevention andflood control services.
It is noted that because of rapid urbanization in the Santa CruzWatershed, the land cover is changing to become more imperviousand associated water and sediment yield are expected processes.In the areas of Oro Valley, Cortaro, Chula Vista, Tumacacori, andAvra Valley East, however, the SWAT model estimates a decrease inboth of these. This could be because they are newer establish-ments in the United States, for which planning protocol requirespermits enforcing more comprehensive flood and erosion-controlpractices. Newer developments south of the border (MargaritaMaza de Juarez, Flores Magon, etc.), on the other hand, are mostsusceptible to flooding and erosion because no such imperativeexists.
Fig. 7. Bar graph portraying the changing provision of ecosystem services in relationship to the socio-environmental vulnerability of populations.
Table 2Comparison of the M-SEVI values and associated relative socio-environmentallyvulnerability, change in the 1992 and 2001 SWAT-simulated annual averaged sedi-ment yield (t/ha) and associated relative change in erosion prevention services, andchange in annual averaged water yield (mm) and associated relative change in floodcontrol services in localities of the Santa Cruz watershed.
Locality M-SEVI Change insedimentyield (t/ha)
Change inwateryield (mm)
Avra Valley East, Arizona 0.25 0.22 2.52Catalina, Arizona 0.17 0.01 0.73Chula Vista, Arizona 0.30 �0.74 0.88Cortaro, Arizona 0.18 0.11 4.50Elephant Head, Arizona 0.38 �0.02 0.14Flores Magon, Sonora 0.39 0.39 1.60Green Valley, Arizona 0.26 0.06 1.19Heroica Nogales, Sonora 0.11 0.39 1.60Littletown, Arizona 0.30 0.06 1.10Lochiel, Arizona 0.13 0.00 0.01Margarita Maza de Juarez, Sonora 0.39 0.39 1.60Nogales, Arizona 0.14 0.39 1.60Old Nogales Hwy, Arizona 0.32 0.04 0.46Oro Valley, Arizona 0.17 0.21 3.14Pascua Yaqui Indian Village, Arizona 0.14 0.05 1.20Patagonia, Arizona 0.33 �0.01 0.25Pete Kitchen, Arizona 0.30 �0.10 0.56Rio Rico, Arizona 0.16 0.05 1.43Sahuarita, Arizona 0.20 0.00 0.10San Rafael Valley, Arizona 0.13 0.00 �0.02San Xavier, Arizona 0.31 0.06 0.72Solidaridad, Sonora 0.37 0.39 1.60Sonoita, Arizona 0.18 0.00 0.10Summerhaven, Arizona 0.13 �0.04 �0.54Tubac, Arizona 0.31 �0.22 0.29Tucson, Arizona 0.11 0.00 0.01Tumacacori, Arizona 0.31 �0.71 0.36Vail, Arizona 0.13 0.08 0.62Vercruz, Sonora 0.36 0.39 1.60
L.M. Norman et al. / Applied Geography 34 (2012) 413e424422
Discussion
Costs of ecosystem service degradation are being consistentlyand disproportionately felt by the poor, which exacerbates socialinequalities and conflict (Millennium Ecosystem Assessment,2005). Free trade policies have allowed large investmentsbetween the U.S. andMexico that are mutually beneficial; however,to promote sustainability in the region, binational land-use plan-ners and others need tools to consider the impacts of developmentin terms of social displacement and environmental degradation.A more flexible approach to incorporate local variability oftemporal and spatial changes in socio-environmental vulnerabilitywithin federal policy is necessary, especially along Internationalboundaries.
In the United States, environmental justice is part of everyfederal agency’s mission (Executive Order 12898) but the conceptof vulnerability is complex and often argued about within theresearch community, which makes the establishment of viablemetrics for measuring vulnerability problematic (Cutter & Finch,2008). More conclusive spatial correlations need to be produced,with higher resolution and more up-to-date data, but this researchoffers a starting point to integrate ecosystem services and envi-ronmental justice considerations into sustainable developmentplans. The addition of the M-SEVI data layer for an ecosystemservices assessment provides binational decision-makers witha mechanism to identify which socio-environmentally vulnerablepopulations have a history of access or exposure to ecosystemservices and integrate environmental justice into future sustainableland-use planning. Resulting hot spots of vulnerability are criticalfor binational managers to consider in making decisions concern-ing land-use planning or policy change.
Acknowledgments
The authors wish to thank the U.S. Geological Survey’s (USGS)Geographic Analysis and Monitoring (GAM) Program and U.S.-Mexico Border Environmental Health Initiative (BEHI) as well as theU.S. Environmental Protection Agency’s (EPA) Ecosystem ServicesResearch Program (ESRP) and Southwest Ecosystem ServicesProject (SwESP) for investing in this research.Wewant to thank theMexican Geography and Census Bureau (INEGI), for providing theMexican Census data and Engineer Mario R. Chavarría Espinosa(INEGI) and Jean Parcher (USGS) for assisting with spatial integra-tion of the U.S. and Mexican Census data. Finally, we thank AngelaDonelson, Laura Lopez-Hoffman, Jean Parcher, and Rudy Shuster fortheir reviews of this manuscript.
References
Adger, W. N. (2004). The right to keep cold. Environment and Planning A, 36(10),1711e1715. doi:10.1068/a37108.
Adger, W. (2006). Vulnerability. Global Environmental Change, 16(3), 268e281.doi:10.1016/j.gloenvcha.2006.02.006.
Agyeman, J., & Evans, B. (2004). “Just sustainability”: the emerging discourse ofenvironmental justice in Britain? The Geographical Journal, 170(2), 155e164.doi:10.1111/j.0016-7398.2004.00117.x.
Agyeman, J., & Evans, T. (2003). Toward just sustainability in urban communities:building equity rights with sustainable solutions. Annals of the AmericanAcademy of Political and Social Science, 590, 35e53.
Anderson, J. B., & Gerber, J. (2007). Fifty years of change on the U.S.-Mexico border:Growth, development, and quality of life. University of Texas Press.
Apitz, S. E. (2007). Conceptual frameworks to balance ecosystem and security goals.In I. Linkov, R. J. Wenning, & G. A. Kiker (Eds.), Managing critical infrastructurerisks: Decision tools and applications for port security (pp. 147e173). Springer.
Arnold, C. A. (1998). Planning milagros: environmental justice and land use regu-lation. Denver University Law Review, 76, 1.
Arnold, J. G., Srinivasan, R., Muttiah, R. S., & Williams, J. R. (1998). Large areahydrologic modeling and assessment part I: model development. JAWRA Journalof the American Water Resources Association, 34(1), 73e89. doi:10.1111/j.1752-1688.1998.tb05961.x.
Ash, N., Bennett, K., Reid, W., Irwin, F., Ranganathan, J., Scholes, R., et al. (2010).Assessing ecosystems, ecosystem services, and human well-being. In N. Ash,H. Blanco, C. Brown, K. Garcia, T. Tomich, B. Vira, et al. (Eds.), Ecosystems andhuman well-being: A manual for assessment practitioners (1st ed.). Island Press.
Been, V., & Gupta, F. (1997). Coming to the nuisance or going to the barrios e a longi-tudinal analysis of environmental justice claims. Ecology Law Quarterly, 24, 1.
Briguglio, L., Cordina, G., Farrugia, N., & Vella, S. (2009). Economic vulnerability andresilience: concepts and measurements. Oxford Development Studies, 37(3),229e247.
Briguglio, L., & Galea, W. (2002). Updating and augmenting the economic vulnerabilityindex. Occasional Paper by the Islands and Small States Institute of theUniversity of Malta. https://secure.um.edu.mt/__data/assets/pdf_file/0012/44130/eviar_briguglio_galea_ver4.pdf Version 4. Retrieved from.
Brady, L. M., Gray, F., Wissler, C. A., & Guertin, D. P. (2001). Spatial variability ofsediment erosion processes using GIS analysis within watersheds in a historicallymined region, Patagonia Mountains, Arizona. U.S. Geological Survey Open FileReport 01e267. http://geopubs.wr.usgs.gov/open-file/of01-267/ Retrieved June21, 2011.
Brown, C. (2002). Binational watershed councils as instruments for conflict resolutionin the Upper Santa Cruz River Basin. Udall Center Publications. http://udall.jsdix.com/publications/sites/default/files/143_en.pdf Retrieved from.
Brundtland, G. H. (1987). World commission on environment and development. OurCommon Future, 8e9.
Butler, C. D., Corvalan, C. F., & Koren, H. S. (2005). Human health, well-being, andglobal ecological scenarios. Ecosystems, 8(2), 153e162. doi:10.1007/s10021-004-0076-0.
Butler, C. D., & McMichael, A. J. (2006). Environmental health. In B. S. Levy, &V. W. Sidel (Eds.), Social injustice and public health (pp. 318e336). USA: OxfordUniversity Press.
Butler, C., & Oluoch-Kosura, W. (2005). Human well-being across scenarios. InMillennium Ecosystem Assessment. (Ed.), Ecosystems and human well-being (1sted.).. Scenarios: Findings of the scenarios working group, Vol. 2 Island Press.
Butler, C. D., & Oluoch-Kosura, W. (2006). Linking future ecosystem services andfuture human well-being. Ecology and Society, 11(1), 30. http://www.ecologyandsociety.org/vol11/iss1/art30/ Retrieved June 21, 2011.
Camacho, D. E. C. (1998). Environmental injustices, political struggles: Race, class, andthe environment. Duke University Press.
Carter, D. E., Peña, C., Varady, R., & Suk, W. A. (1996). Environmental health andhazardous waste issues related to the U.S.-Mexico border. Environmental HealthPerspectives, 104(6), 590e594.
Collins, K., Guhathakurta, S., Sadalla, E., Pijawka, D., Peña, S., & Ley, J. (2010).A longitudinal assessment of quality of life in the US-Mexico border region. http://scerpfiles.org/cont_mgt/doc_files/EIR_06_2-3.pdf Project Number: EIR-06e2/3.Retrieved from.
Collins-Dogrul, J. (2006). Managing US-Mexico “border health”: an organizationalfield approach. Social Science & Medicine, 63(12), 3199e3211. doi:10.1016/j.socscimed.2006.07.031.
Cutter, S. L., Boruff, B. J., & Shirley, W. L. (2003). Social vulnerability to environ-mental hazards*. Social Science Quarterly, 84(2), 242e261.
Cutter, S. L., & Finch, C. (2008). Temporal and spatial changes in social vulnerabilityto natural hazards. Proceedings of the National Academy of Sciences, 105(7),2301e2306. doi:10.1073/pnas.0710375105.
Donelson, A., & Esparza, A. X. (2010a). Undocumented immigrants and quality of lifein New Mexico and Arizona colonias. Journal of Borderlands Studies, 22(1),39e52.
Donelson, A., & Esparza, A. X. (2010b). The colonias reader: Economy, housing, andpublic health in U.S.-Mexico border colonias. Tucson: University of Arizona Press.
Dow, K., Kasperson, R. E., & Bohn, M. (2006). Exploring the social justice implica-tions of adaptation and vulnerability. In W. N. Adger, J. Paavola, S. Huq, &M. J. Mace (Eds.), Fairness in adaptation to climate change. The MIT Press.
Esparza, A. X., & Donelson, A. J. (2008). Colonias in Arizona and New Mexico: Borderpoverty and community development solutions. University of Arizona Press.
Esparza, A., Waldorf, B., & Chavez, J. (2004). Localized effects of globalization: thecase of Ciudad Juárez, Chihuahua, Mexico. Urban Geography, 25(2), 120e138.doi:10.2747/0272-3638.25.2.120.
Faber, D. J. (1998). The struggle for ecological democracy: Environmental justicemovements in the United States. Guilford Press.
Fisher, K. (2008). The colonia and the landfill: Colonias development council V. RhinoEnvironmental Services, Inc.. http://repository.unm.edu/handle/1928/6838Retrieved June 21, 2011.
Folke, C., Carpenter, S., Elmqvist, T., Gunderson, L., Holling, C. S., & Walker, B. (2002).Resilience and sustainable development: building adaptive capacity in a worldof transformations. AMBIO, 31(5), 437e440.
Gomez, S. (1993). Environmental risks related to the maquiladora industry and thelikely environmental impact of NAFTA. La Raza Law Journal, 6, 174.
Gruben, W. C. (2001). Was NAFTA behind Mexico’s high maquiladora growth?Economic and Financial Review21. http://dallasfed.org/research/efr/2001/efr0103b.pdf Third QuarterRetrieved from.
Hancock, J. (2010). The case for an ecosystem service approach to decision-making:an overview. Bioscience Horizons, . doi:10.1093/biohorizons/hzq013.
Henkel, D. S., Jr. (2010). Upholding environmental justice in the colonias: a NewMexico approach. Journal of Borderlands Studies, 24(1), 62e75.
Immerzeel, W. W., Stoorvogel, J., & Antle, J. (2008). Can payments for ecosystemservices secure the water tower of Tibet? Agricultural Systems, 96(1e3), 52e63.doi:10.1016/j.agsy.2007.05.005.
L.M. Norman et al. / Applied Geography 34 (2012) 413e424 423
John Heinz III Center for Science, Economics, and the Environment, H. (1999). Thehidden costs of coastal hazards: Implications for risk assessment and mitigation(1st ed.). Island Press.
Labiosa, W. B., Bernknopf, R., Hearn, P., Hogan, D., Strong, D., Pearlstine, L., et al.(2009). The South Florida ecosystem portfolio model: A map-based multicriteriaecological, economic, and community land-use planning tool. U.S. GeologicalSurvey Scientific Investigations Report 2009-5181 http://pubs.usgs.gov/sir/2009/5181/ Retrieved June 21, 2011.
Lane, L. J., Hernandez, M., & Nichols, M. (1997). Processes controlling sediment yieldfrom watersheds as functions of spatial scale. Environmental Modelling & Soft-ware, 12(4), 355e369. doi:10.1016/S1364-8152(97)00027-3.
Lara-Valencia, F., Declet-Barreto, J., & Keys, E. (2008). Spatial equity and trans-portation hazard along cross-border trade corridors: the case of ambos nogales.Journal of Borderlands Studies, 23(2), 1e18.
Lautenbach, S., Gruber, B., Dorman, C. F., Strauch, M., & Seppelt, R. (2010). Quanti-fying ecosystem service trade-offs. In Modelling for environment’s sake, fifthbiennial meeting. Ottawa, Canada: International Congress on EnvironmentalModelling and Software.
Liverman, D. M. (1990). Vulnerability to global change. Report on an InternationalWorkshop. In R. Kasperson (Ed.), Understanding global environmental change:The contributions of risk analysis and management (pp. 8e23) Worcester MA:Clark University, Earth Transformed Program. http://www.environment.arizona.edu/files/env/profiles/liverman/liverman-1990-kasperson-et-al.pdfRetrieved June 22, 2011.
López-Hoffman, L., McGovern, E. D., Varady, R. G., & Flessa, K. W. (2009). Conser-vation of shared environments: Learning from the United states and Mexico.University of Arizona Press.
Maantay, J. (2002). Mapping environmental injustices: pitfalls and potential ofgeographic information systems in assessing environmental health and equity.Environmental Health Perspectives, 110(Suppl. 2), 161e171.
McCombs, B. (2008). Mexico ties flooding in Nogales to U.S. Border Patrol-built wall.Arizona Daily Star, July 23. http://azstarnet.com/news/local/border/article_a11265b0-17c3-5bed-b50a-72e5d17e1369.html#ixzz1d9O3wLR8 RetrievedNovember 7, 2011.
Millennium Ecosystem Assessment. (2003). Ecosystems and human well-being: Aframework for assessment (1st ed.). Island Press.
Millennium Ecosystem Assessment. (2005). Ecosystems and human well-being:Current state and trends: Findings of the condition and trends working group(1st ed.). Island Press.
Moda, M. A. (2007). A critical review of current EJ research: Where do we go from here.Master thesis; Clark University: Worcester, MA, USA. Retrieved from https://www.clarku.edu/departments/idce/docs/Moda_2007.pdf.
Morrison Institute. (2008). Megapolitan: Arizona’s sun corridor. http://morrisoninstitute.asu.edu/publications-reports/Mega_AzSunCorr/view RetrievedJune 21, 2011.
Morrison Institute. (2009).Megapolitan: Arizona’s sun corridor. http://morrisoninstitute.asu.edu/morrison-update/megapolitan-arizonas-sun-corridor Retrieved June 21,2011.
Nelson, D. R., Adger, W. N., & Brown, K. (2007). Adaptation to environmentalchange: contributions of a resilience framework. Annual Review of Environmentand Resources, 32(1), 395e419. doi:10.1146/annurev.energy.32.051807.090348.
Nie, W., Yuan, Y., Tallent-Halsell, N., Norman, L. M., Jackson, M., & Erickson, C. (2010).Assessing surface water availability in the Upper Santa Cruz watershed. In 65thinternational soil and water conservation society (SWCS) annual conference. St.Louis: Missouri, July 18e21, 2010.
Nie, W., Yuan, Y., Norman, L. M., Tallent-Halsell, N., & Callegary, J. (2010). Assessingclimate change impacts on surface water availability in the Upper Santa CruzWatershed. Tucson, Ariz: Arizona Hydrological Society. Sept 1e4.
Norman, L. M. (2010). Urbanization and environmental health in Arizona colonias.In A. Donelson, & A. X. Esparza (Eds.), The colonias reader: Economy, housing, andpublic health in U.S.-Mexico border colonias. Tucson: University of Arizona Press.
Norman, L. M., Donelson, A., Pfeifer, E., & Lam, A. H. (2006). Colonia development andland use change in Ambos Nogales, United states-Mexican border. U.S. GeologicalSurvey Open File Report: 2006-1112. http://pubs.usgs.gov/of/2006/1112/Retrieved June 21, 2011.
Norman, L. M., Gray, F., Guertin, D. P., Wissler, C., & Bliss, J. D. (2008). Tracking acidmine-drainage in Southeast Arizona using GIS and sediment delivery models.Environmental Monitoring and Assessment, 145(1e3), 145e157. doi:10.1007/s10661-007-0024-5.
Norman, L., Guertin, D., & Feller, M. (2008). A coupled model approach to reducenonpoint-source pollution resulting from predicted urban growth: a case studyin the Ambos Nogales watershed. Urban Geography, 29(5), 496e516.doi:10.2747/0272-3638.29.5.496.
Norman, L. M., Hirsch, D. D., & Ward, A. W. (2008). Proceedings of a USGS workshopon facing tomorrow’s challenges along the U.S.-Mexico border; monitoring,modeling, and forecasting change within the Arizona-Sonora transboundarywatersheds. U.S. Geological Survey Circular 1322. http://pubs.usgs.gov/circ/1322/ Retrieved June 21, 2011.
Norman, L. M., Huth, H., Levick, L., Shea Burns, I., Phillip Guertin, D., Lara-Valencia, F., et al. (2010). Flood hazard awareness and hydrologic modelling atAmbos Nogales, United StateseMexico border. Journal of Flood Risk Manage-ment, 3(2), 151e165. doi:10.1111/j.1753-318X.2010.01066.x.
Norman, L. M., Parcher, J. W., & Lam, A. H. (2004). Monitoring colonias along the U.S.-Mexico border. U.S. Geological Survey Fact Sheet. USGS FS 2004-3070 e Colonias.http://egsc.usgs.gov/isb/pubs/factsheets/fs307004.html Retrieved June 21, 2011.
Norman, L. M., Tallent-Halsell, N., Labiosa, W., Weber, M., McCoy, A., Hirschboeck, K.,et al. (2010). Developing an ecosystem services online decision support tool toassess the impacts of climate change and urban growth in the Santa Cruzwatershed; where we live, work, and play. Sustainability, 2(7), 2044e2069.doi:10.3390/su2072044.
Pepin, M. (1998). Texas colonias: An environmental justice case study (November 5,1998). http://itc.ollusa.edu/faculty/pepim/philosophy/cur/colonias.htmRetrievedDecember 2, 2003.
Rodríguez, J. P., Beard, T. D., Jr., Bennett, E. M., Cumming, G. S., Cork, S., Agard, J., et al.(2006). Trade-offs across space, time, and ecosystem services. Ecologyand Society, 11(1), 28. http://www.ecologyandsociety.org/vol11/iss1/art28/Retrieved June 21, 2011.
Prugh, T., Costanza, R., & Daly, H. E. (2000). The local politics of global sustainability.Island Press.
Sassen, S. (2006). Cities in a world economy (3rd ed.). Pine Forge Press.Sholes, R., Biggs, R., Palm, C., & Duraiappah, A. (2010). Assessing state and trends in
ecosystem services and human well-being. In N. Ash, H. Blanco, C. Brown,K. Garcia, T. Tomich, B. Vira, et al. (Eds.), Ecosystems and human well-being: Amanual for assessment practitioners (1st ed.). Island Press, chap. 4.
Skerry, P. (2000). Counting on the census?: Race, group identity, and the evasion ofpolitics. Brookings Institution Press.
Sleeter, R. (2008). A new method for mapping population distribution. U.S. GeologicalSurvey Fact Sheet 2008-3010. http://pubs.usgs.gov/fs/2008/3010/ RetrievedJune 21, 2011.
Swallow, B. M., Sang, J. K., Nyabenge, M., Bundotich, D. K., Duraiappah, A. K., &Yatich, T. B. (2009). Tradeoffs, synergies and traps among ecosystem services inthe Lake Victoria basin of East Africa. Environmental Science & Policy, 12(4),504e519. doi:10.1016/j.envsci.2008.11.003.
Tallis, H., & Polasky, S. (2009). Mapping and valuing ecosystem services as anapproach for conservation and natural-resource management. Annals ofthe New York Academy of Sciences, 1162(1), 265e283. doi:10.1111/j.1749-6632.2009.04152.x.
United Church of Christ Commission for Racial Justice. (1987). Toxic wastes and racein the United States: A national report on the racial and socio-economic charac-teristics of communities with hazardous waste sites. Public Data Access.
United Nations. (1987). Report of the world commission on environment and devel-opment: Our common future e A/42/427 Annex e UN Documents: Gatheringa body of global agreements. http://www.un-documents.net/wced-ocf.htm.
United Nations. (1992). Agenda 21, the Rio declaration on environment and develop-ment, the statement of forest principles, the United Nations framework conventionon climate change and the United Nations convention on biological diversity. Riode Janeiro, Brazil: United Nations Conference on Environment and Develop-ment (UNCED); The Earth Summit. http://www.un.org/geninfo/bp/enviro.html.
United States Environmental Protection Agency. (2011). U.S census data on smallcommunity housing and wastewater disposal and plumbing practices j septic j USEPA. http://water.epa.gov/infrastructure/wastewater/septic/census_index.cfmRetrieved January 20, 2012.
United States Geological Survey. (2011). U.S.-Mexico border environmentalhealth initiative home page. http://borderhealth.cr.usgs.gov/projectindex.htmlRetrieved January 20, 2012.
Villarreal, M. L., Norman, L. M., Wallace, C. S. A., & van Riper, C., III. (2011).A multitemporal (1979e2009) land-use/land-cover dataset of the binationalSanta Cruz watershed. U.S. Geological Survey Open-File Report 2011-1131and database. http://pubs.usgs.gov/of/2011/1131/ Retrieved June 21, 2011.
Warner, K. (2002). Linking local sustainability initiatives with environmentaljustice. Local Environment, 7(1), 35e47. doi:10.1080/13549830220115402.
Wilder, M., Scott, C. A., Pablos, N. P., Varady, R. G., Garfin, G. M., & McEvoy, J.(2010). Adapting across boundaries: climate change, social learning,and resilience in the U.S.eMexico border region. Annals of theAssociation of American Geographers, 100(4), 917e928. doi:10.1080/00045608.2010.500235.
L.M. Norman et al. / Applied Geography 34 (2012) 413e424424
Related Documents