ACMP ©2006-2008 UAF Geophysical Institute B-1 Mapping Sea Level Rise Overview: Students create and explore topographical maps as a means of study- ing sea level rise. Objectives: The student will: • investigate the difference between sea ice and glaciers in relation to sea level rise; • create a topographical map; • use a topographical map to predict sea level rise; and • discuss how sea level rise will affect Alaska’s coastline. GLEs Addressed: Science • [9] SA1.1 The student demonstrates an understanding of the processes of science by asking questions, predicting, observing, describing, measuring, classifying, making generalizations, inferring, and communicating. • [10-11] SA1.1 The student demonstrates an understanding of the processes of science by asking questions, predicting, observing, describing, measuring, classifying, making generalizations, analyzing data, developing models, inferring, and communicating. • [9-11] SD2.1 The student demonstrates an understanding of the forces that shape Earth by recognizing the dynamic interaction of erosion and deposition including human causes. Materials: • Beaker (one per group) • Pitcher • Ice (several cubes per group) • Potato (1/2 per pair) • Clear plastic tub with flat bottom and clear plastic lid (one per pair) • Water soluble marker (one per pair) • Centimeter ruler (one per pair) • Kitchen knife • Water • Blue food coloring • White paper • Scissors • Clear tape • Global Climate Interactive DVD • OVERHEAD: “Map of Shishmaref” • STUDENT INFORMATION SHEET: “Sea Level Mapping” • STUDENT WORKSHEET: “The Rising Coast” Activity Preparation: Prepare water for the student activity by adding blue food coloring to the pitcher until the water is a dark blue color. Mapping Sea Level Rise Levels V-VI Grades 9-12

Welcome message from author
This document is posted to help you gain knowledge. Please leave a comment to let me know what you think about it! Share it to your friends and learn new things together.
Transcript

ACMP ©2006-2008 UAF Geophysical Institute B-1 Mapping Sea Level Rise
Overview:Students create and explore topographical maps as a means of study-ing sea level rise.
Objectives:The student will:• investigatethedifferencebetweenseaiceandglaciersinrelationtosealevelrise;• createatopographicalmap;• useatopographicalmaptopredictsealevelrise;and• discusshowsealevelrisewillaffectAlaska’scoastline.
GLEs Addressed:Science• [9]SA1.1Thestudentdemonstratesanunderstandingoftheprocessesofsciencebyaskingquestions,predicting,observing,describing,measuring,classifying,makinggeneralizations,inferring, and communicating.
• [10-11]SA1.1Thestudentdemonstratesanunderstandingoftheprocessesofsciencebyaskingquestions,predicting,observing,describing,measuring,classifying,makinggeneralizations,analyzingdata,developingmodels,inferring,andcommunicating.
• [9-11]SD2.1ThestudentdemonstratesanunderstandingoftheforcesthatshapeEarthbyrecognizingthedynamicinteractionoferosionanddepositionincludinghumancauses.
Materials:• Beaker(onepergroup)• Pitcher• Ice(severalcubespergroup)• Potato(1/2perpair)• Clearplastictubwithflatbottomandclearplasticlid(oneperpair)• Watersolublemarker(oneperpair)• Centimeterruler(oneperpair)• Kitchenknife• Water• Bluefoodcoloring• Whitepaper• Scissors• Cleartape• Global ClimateInteractiveDVD• OVERHEAD:“MapofShishmaref”• STUDENTINFORMATIONSHEET:“SeaLevelMapping”• STUDENTWORKSHEET:“TheRisingCoast”
Activity Preparation: Preparewaterforthestudentactivitybyaddingbluefoodcoloringtothepitcheruntilthewaterisadark
blue color.
Mapping Sea Level Rise Levels V-VI
Grades 9-12

ACMP ©2006-2008 UAF Geophysical Institute B-2 Mapping Sea Level Rise
Activity Procedure:1. Remind students that one result of global climate change is rising sea levels. Glacial melting contrib-
utes to rising sea levels, which impact coastal communities and ecosystems. As a class, explore the “ClimateChangeImpacts”Unit“ArcticRegionImpacts-Glaciers”sectionoftheGlobal Climate Inter-activeDVD.
2. Explain that scientists have been mapping and continue to map coastlines to study how sea levels riseorfall.Explainthemeltingofland-basedice,suchasglaciers(notseaice),iscausingsealevelstorise.Askstudentswhyseaicemeltingdoesnotimpactsealevels.
3. Explain that ice already in the ocean does not contribute to sea level rise because the ice displaces thesameamountofwateritwillcontributewhenitmelts.However,glaciersareformedonland.Whenglaciersbreakoffintotheoceantheydisplaceexistingwater(justasapersondisplaceswaterwhentheyenterabathtub),causingthewaterleveltorise.
4. Demonstratethisprinciplebydistributingabeaker,plainwater,andseveralicecubestoeachgroup.Askstudentstoplaceafewicecubesinthewaterandmarkthewaterlevel.Whentheicehasmelted,askstudentstonotewhetherthewaterlevelhaschanged(itshouldnothavechanged).Next,distrib-utemoreicecubesandaskeachgrouptoplaceanothericecubeintheirwater.Askgroupsifthewaterlevelchanged(itshouldhavegoneup).
5. Explainthatthefirsticecubesrepresentseaice;theyalreadyexistinthewater,sowhentheymeltthewaterleveldoesn’tchange.Thesecondsetoficecubesrepresentglaciers;astheycalveoffintothe ocean, they displace the water, causing sea levels to rise.
Critical Thinking Question: Wait Time Method.Informstudentsthattheywillbeaskedaquestionandgiventimetothinkabouttheiranswers;theywillnotbecalledonforanswersimmediately.Thewait time can be anywhere from 15 seconds to 5 minutes.Askstudentsifincreasedprecipitationaddstosealevelrise.Whyorwhynot?Whentheallottedtimeisupaskforashowofhandsorselectastudenttoanswer.(Precipitation is part of the water cycle. As water evaporates from oceans and rises into the atmosphere, it cools, condenses, forms clouds, and eventually precipitates falling back to Earth as rain, snow, sleet, etc. Although in the short-term there is not complete balance in the cycle, water may evaporate from a lake and fall as snow on a glacier – ultimately the water that evaporates from the oceans will return to the oceans. Thus, sea levels will not rise as a result of precipitation.)
6. Dividestudents intopairsanddistribute theSTUDENT INFORMATIONSHEET: “SeaLevelMap-ping.”Cutpotatoesinhalf,anddistributealongwithaclearplastictubwithclearplasticlid,marker,ruler, dyed water, and half a potato to each pair.
7. Guide students through the activity, providing assistance as needed.
8. Whenstudentsaredonewiththemappingexercise,distributeapairofscissors,tape,andawhitesheetofpapertoeachgroup.Askgroupstocutoutawhitecircleandtapeittothebackofthecon-tainerlidtoincreasevisibilityoftheshoreline(contourlines).Asaclass,comparestudents’mapsanddiscuss how they compare and contrast.
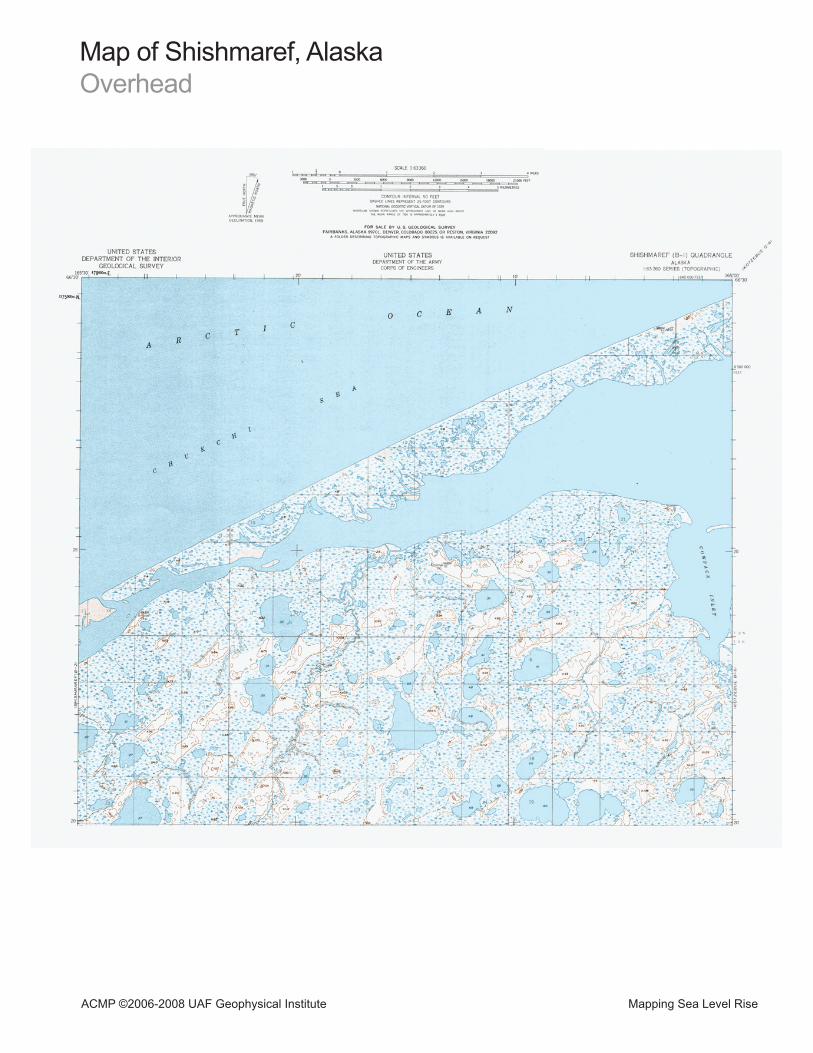
9. ShowOVERHEAD:“MapofShishmaref.”Explain topographicalmapsshowtheelevation,orhowhigh up, geographical features are. Each line on the map represents a change in height, the closer togetherthelines,thesteeperthelandatthatparticularlocation.Thesolidlinesonthismapmark50feet of elevation, the dashed lines represent 25 feet of elevation.
10. Explain that in the sea level mapping activity, students created topographical maps of their potato. Scientists can use satellite images and topographical maps to estimate how far inland ocean water will travel if sea levels rise. For example, the steeper the coastline the less inland the sea will travel. However,ashallowcoastlinewillresultinmoreinlandflooding.
ACMP ©2006-2008 UAF Geophysical Institute B-3 Mapping Sea Level Rise
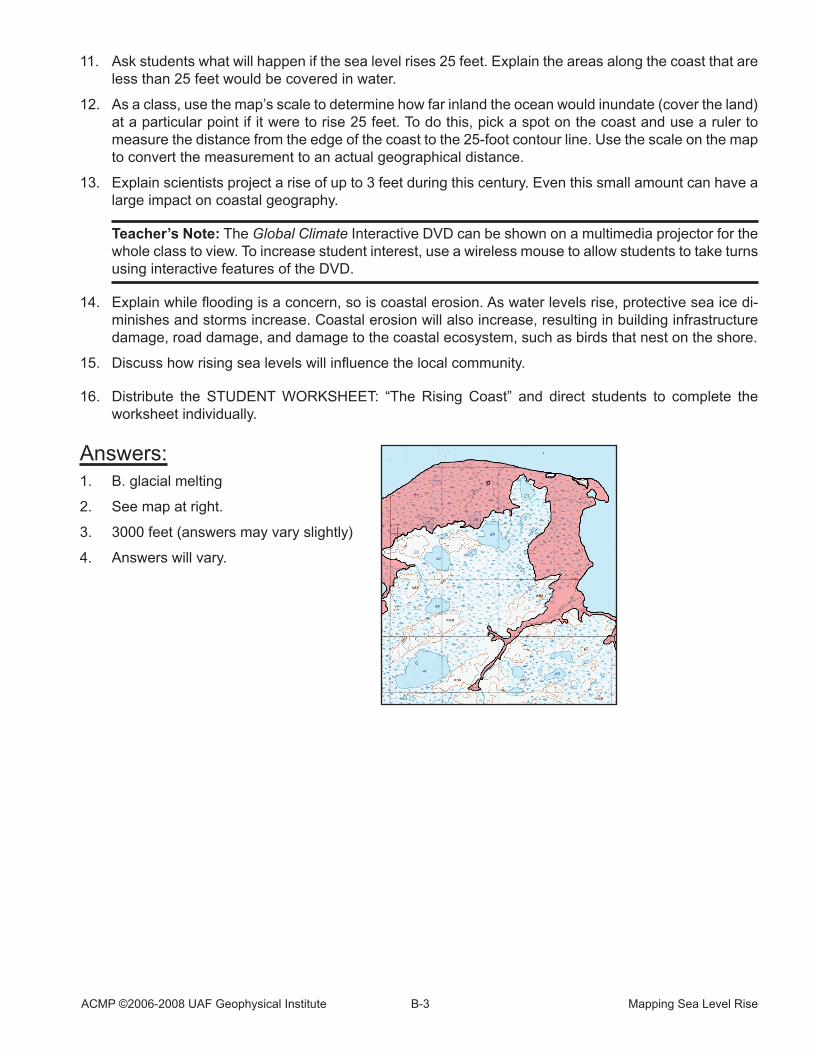
11. Askstudentswhatwillhappenifthesealevelrises25feet.Explaintheareasalongthecoastthatareless than 25 feet would be covered in water.
12. Asaclass,usethemap’sscaletodeterminehowfarinlandtheoceanwouldinundate(covertheland)ataparticularpointifitweretorise25feet.Todothis,pickaspotonthecoastandusearulertomeasure the distance from the edge of the coast to the 25-foot contour line. Use the scale on the map to convert the measurement to an actual geographical distance.
13. Explain scientists project a rise of up to 3 feet during this century. Even this small amount can have a large impact on coastal geography.
Teacher’s Note: The Global ClimateInteractiveDVDcanbeshownonamultimediaprojectorforthewholeclasstoview.Toincreasestudentinterest,useawirelessmousetoallowstudentstotaketurnsusinginteractivefeaturesoftheDVD.
14. Explainwhilefloodingisaconcern,soiscoastalerosion.Aswaterlevelsrise,protectiveseaicedi-minishes and storms increase. Coastal erosion will also increase, resulting in building infrastructure damage, road damage, and damage to the coastal ecosystem, such as birds that nest on the shore.
15. Discusshowrisingsealevelswillinfluencethelocalcommunity.
16. Distribute the STUDENTWORKSHEET: “TheRisingCoast” and direct students to complete theworksheetindividually.
Answers:1. B. glacial melting
2. See map at right.
3. 3000feet(answersmayvaryslightly)
4. Answers will vary.

ACMP ©2006-2008 UAF Geophysical Institute B-4 Mapping Sea Level Rise
Directions:
STEP 1. Place the lid on the container and draw a line along the edge of the lid and the side of the container so that they can be matched up later.
STEP2.Usetherulerandmarkertodrawascaleinone-centimeter increments along the side of the container.
STEP 3. Remove the lid and place the potato, cut side down, in the clear plastic container.
STEP 4. Add colored water carefully until the level reachesthetwo-centimetermark.Donotpour water directly on the potato.
STEP 5. Replace the lid and orient it so that the lines drawn in STEP 1 are aligned.
STEP6.Lookstraightdownintothecontaineranddraw a line that represents where the water meets the potato. This is the shoreline.
STEP 7. Repeat steps 4, 5, and 6, adding one centi-meter of water each time until the potato is submerged.
ACMP ©2007 UAF Geophysical Institute C-4 Mapping Sea Level Rise
STEP 3
STEP 6
STEP 7
Levels V-VISea Level MappingStudent Information Sheet
ACMP ©2006-2008 UAF Geophysical Institute B-5 Mapping Sea Level Rise
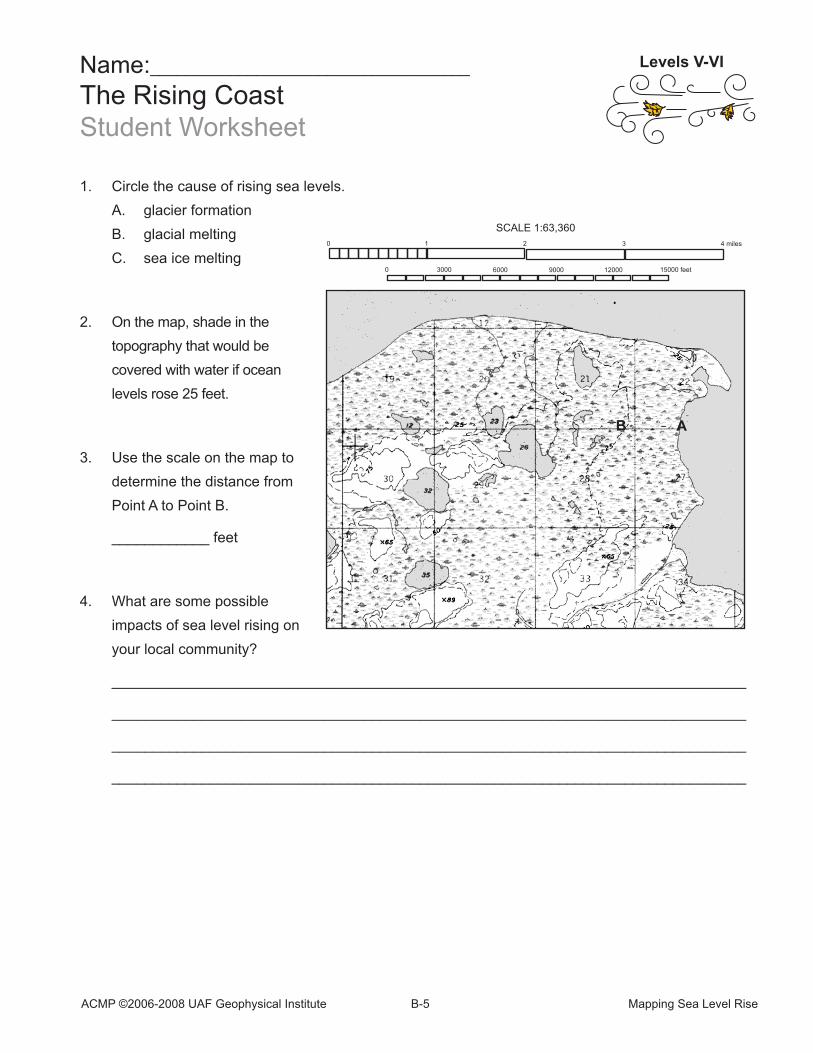
1. Circle the cause of rising sea levels.
A. glacier formation
B. glacial melting
C. sea ice melting
2. On the map, shade in the
topography that would be
covered with water if ocean
levels rose 25 feet.
3. Use the scale on the map to
determine the distance from
Point A to Point B.
____________ feet
4. Whataresomepossible
impacts of sea level rising on
yourlocalcommunity?
______________________________________________________________________________
______________________________________________________________________________
______________________________________________________________________________
______________________________________________________________________________
3000 6000 9000 12000 15000 feet0
1 2 30 4 miles
SCALE 1:63,360
AB
Name:____________________________________
The Rising CoastStudentWorksheet
Levels V-VI
ACMP ©2006-2008 UAF Geophysical Institute Mapping Sea Level Rise
Map of Shishmaref, AlaskaOverhead
Related Documents