Mapping Riparian Land Use within Agricultural Zones A Case Study in Skagit County Joshua Greenberg, PhD Sean Carson Skagit County GIS Abstract In 2008, as part of Skagit County’s Salmon Policy Resolution (R20070499), Skagit County tasked its GIS Department with performing a land use analysis within Agricultural-Natural Resource Land (Ag-NRL) and Rural Resource- Natural Resource Land (RRc-NRL) zones. Using heads-up digitizing from high-resolution aerial photos, the GIS Department digitized and analyzed 16,000 acres, 8,031 acres of which were within standard buffer distances. We evaluated our compiled information to answer the most commonly-posed questions from past discussions regarding the imposition of riparian buffers on agricultural land uses: How much riparian area in Ag-NRL or RRc-NRL zones is already in a forested, grass, or wetland state that would be expected under a regulatory buffer system? Of that land, how much is protected from development by conservation easements, public agencies, or conservation organization ownership? How much riparian land would be eligible for protection under a habitat acquisition program such as Skagit County’s proposed Salmon Heritage Program? Our analysis reveals that within standard buffer distances, 73% of the area is forest, wetland, or grass. The remaining land uses includes 22% agriculture and 5% developed land or road cover. The amount of vegetated area decreases as buffer widths increase, but the amount of vegetated area that covers significant distances from streams is contrary to conventional wisdom; at 50 feet, nearly 84% of studied stream reaches are vegetated and more than 80% of that vegetation is forest. Even at 100 feet, 76% of studied stream reaches are vegetated and nearly 85% of that vegetation is forest. Only 22% of the study area within standard buffer distances is agricultural land. Of that 22%, there are 75 acres of publicly-owned land, 42 acres protected by conservation organizations, and 64 acres with no ecosystem functions or values. Together, these three categories, which would not qualify for habitat acquisition programs, constitute 10% of the total agricultural land studied within the standard buffer area. Of the remaining agricultural area, 90% is potentially restorable. The amount of agricultural land in different regions of the County varied greatly from 13% in the Sauk region to 35% in the Nookachamps. We compared the results of this study with other satellite land use analysis studies of the area and found that courser studies overestimated agricultural land use by as much as 289%. The information compiled from this study is useful for policy discussions and future planning of riparian protection programs. Skagit County GIS/Mapping 700 S. 2nd Street, Room 202 Mount Vernon, WA 98273 360-336-9368

Welcome message from author
This document is posted to help you gain knowledge. Please leave a comment to let me know what you think about it! Share it to your friends and learn new things together.
Transcript

Mapping Riparian Land Use within Agricultural Zones
A Case Study in Skagit County Joshua Greenberg, PhD
Sean Carson Skagit County GIS
Abstract
In 2008, as part of Skagit County’s Salmon Policy Resolution (R20070499), Skagit County tasked its GIS Department
with performing a land use analysis within Agricultural-Natural Resource Land (Ag-NRL) and Rural Resource-
Natural Resource Land (RRc-NRL) zones. Using heads-up digitizing from high-resolution aerial photos, the GIS
Department digitized and analyzed 16,000 acres, 8,031 acres of which were within standard buffer distances. We
evaluated our compiled information to answer the most commonly-posed questions from past discussions
regarding the imposition of riparian buffers on agricultural land uses:
How much riparian area in Ag-NRL or RRc-NRL zones is already in a forested, grass, or wetland state that would be expected under a regulatory buffer system?
Of that land, how much is protected from development by conservation easements, public agencies, or conservation organization ownership?
How much riparian land would be eligible for protection under a habitat acquisition program such as Skagit County’s proposed Salmon Heritage Program?
Our analysis reveals that within standard buffer distances, 73% of the area is forest, wetland, or grass. The
remaining land uses includes 22% agriculture and 5% developed land or road cover. The amount of vegetated area
decreases as buffer widths increase, but the amount of vegetated area that covers significant distances from
streams is contrary to conventional wisdom; at 50 feet, nearly 84% of studied stream reaches are vegetated and
more than 80% of that vegetation is forest. Even at 100 feet, 76% of studied stream reaches are vegetated and
nearly 85% of that vegetation is forest.
Only 22% of the study area within standard buffer distances is agricultural land. Of that 22%, there are 75 acres of
publicly-owned land, 42 acres protected by conservation organizations, and 64 acres with no ecosystem functions
or values. Together, these three categories, which would not qualify for habitat acquisition programs, constitute
10% of the total agricultural land studied within the standard buffer area. Of the remaining agricultural area, 90%
is potentially restorable. The amount of agricultural land in different regions of the County varied greatly from 13%
in the Sauk region to 35% in the Nookachamps.
We compared the results of this study with other satellite land use analysis studies of the area and found that
courser studies overestimated agricultural land use by as much as 289%. The information compiled from this study
is useful for policy discussions and future planning of riparian protection programs.
Skagit County GIS/Mapping 700 S. 2nd Street, Room 202
Mount Vernon, WA 98273 360-336-9368
Mapping Riparian Land Use within Agricultural Zones A Case Study in Skagit County
May 6, 2010
Board of County Commissioners Ron Wesen
Ken Dahlstedt Sharon Dillon, Chair
Skagit County Administrative Building
1800 Continental Place Suite 100 Mount Vernon, WA 98273
Prepared by Emma Whitfield

Skagit County Geographic Information Systems May 6, 2010
3
Table of Contents
Introduction ................................................................................................................................................................... 5 Background ............................................................................................................................................................... 5 Salmon Heritage Program ......................................................................................................................................... 5 Ruckelshaus Center SSB 5248 Process ...................................................................................................................... 6 Salmon Policy Resolution .......................................................................................................................................... 6 Riparian Mapping Project ......................................................................................................................................... 6
Methods ........................................................................................................................................................................ 7 Study Area ................................................................................................................................................................. 7
Zones and Watercourses ...................................................................................................................................... 7 Regions ................................................................................................................................................................. 8
Buffers ....................................................................................................................................................................... 9 Hydrology Data ....................................................................................................................................................... 10 Aerial Photography ................................................................................................................................................. 11
Heads-Up Digitizing Versus Automatic Classification......................................................................................... 11 Land Use Classifications .......................................................................................................................................... 12
Results ......................................................................................................................................................................... 13 Land Use by Type .................................................................................................................................................... 13 Variation by Buffer Width ....................................................................................................................................... 14 Variation by Stream Type ....................................................................................................................................... 15 Variation by Study Region ....................................................................................................................................... 16 No Ecosystem Functions and Values ...................................................................................................................... 17 Open Space-Agricultural Tax Designation ............................................................................................................... 17 Privately-Protected Public Lands ............................................................................................................................ 17
Privately-Protected Lands .................................................................................................................................. 18 Public Lands........................................................................................................................................................ 18
Comparison of Land Use Techniques ...................................................................................................................... 18 National Land Cover Database ........................................................................................................................... 18 Rural Technology Institute ................................................................................................................................. 19
Conclusions .................................................................................................................................................................. 20 Works Cited ................................................................................................................................................................. 20 Appendix A. Land Use Classification Descriptions ....................................................................................................... 21
Crop/Dirt Field ........................................................................................................................................................ 21 Forested Pasture ..................................................................................................................................................... 21 Mowed/Grazed Field .............................................................................................................................................. 22 General Wetland ..................................................................................................................................................... 22 Grassland/Field ....................................................................................................................................................... 23 Low Shrub/Tree ...................................................................................................................................................... 23 Deciduous Trees ...................................................................................................................................................... 24 Mixed Trees ............................................................................................................................................................ 24 Evergreen Trees ...................................................................................................................................................... 25 Residential .............................................................................................................................................................. 25 Commercial ............................................................................................................................................................. 26 Building ................................................................................................................................................................... 26 Dirt .......................................................................................................................................................................... 27 Road ........................................................................................................................................................................ 27 Timber Harvest ....................................................................................................................................................... 28 Open Water ............................................................................................................................................................ 28 Dike ......................................................................................................................................................................... 30
May 6, 2010 Skagit County Geographic Information Systems
4
List of Figures
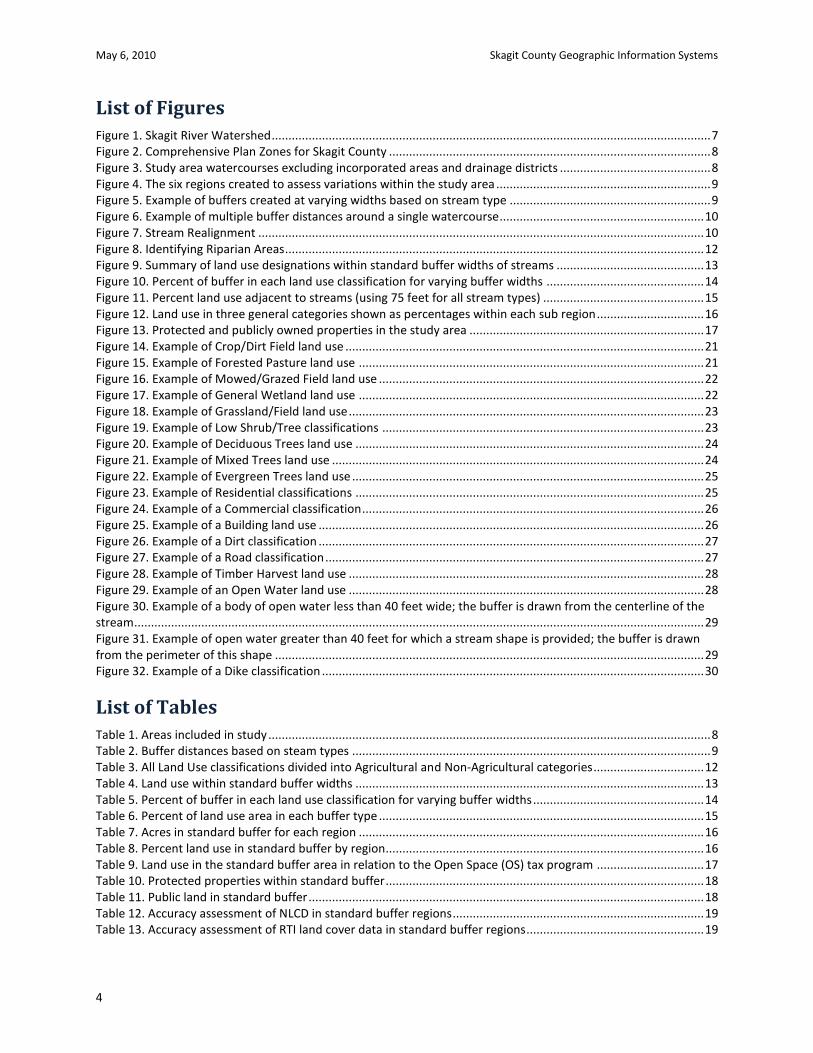
Figure 1. Skagit River Watershed ................................................................................................................................... 7 Figure 2. Comprehensive Plan Zones for Skagit County ................................................................................................ 8 Figure 3. Study area watercourses excluding incorporated areas and drainage districts ............................................. 8 Figure 4. The six regions created to assess variations within the study area ................................................................ 9 Figure 5. Example of buffers created at varying widths based on stream type ............................................................ 9 Figure 6. Example of multiple buffer distances around a single watercourse............................................................. 10 Figure 7. Stream Realignment ..................................................................................................................................... 10 Figure 8. Identifying Riparian Areas ............................................................................................................................. 12 Figure 9. Summary of land use designations within standard buffer widths of streams ............................................ 13 Figure 10. Percent of buffer in each land use classification for varying buffer widths ............................................... 14 Figure 11. Percent land use adjacent to streams (using 75 feet for all stream types) ................................................ 15 Figure 12. Land use in three general categories shown as percentages within each sub region ................................ 16 Figure 13. Protected and publicly owned properties in the study area ...................................................................... 17 Figure 14. Example of Crop/Dirt Field land use ........................................................................................................... 21 Figure 15. Example of Forested Pasture land use ....................................................................................................... 21 Figure 16. Example of Mowed/Grazed Field land use ................................................................................................. 22 Figure 17. Example of General Wetland land use ....................................................................................................... 22 Figure 18. Example of Grassland/Field land use .......................................................................................................... 23 Figure 19. Example of Low Shrub/Tree classifications ................................................................................................ 23 Figure 20. Example of Deciduous Trees land use ........................................................................................................ 24 Figure 21. Example of Mixed Trees land use ............................................................................................................... 24 Figure 22. Example of Evergreen Trees land use ......................................................................................................... 25 Figure 23. Example of Residential classifications ........................................................................................................ 25 Figure 24. Example of a Commercial classification ...................................................................................................... 26 Figure 25. Example of a Building land use ................................................................................................................... 26 Figure 26. Example of a Dirt classification ................................................................................................................... 27 Figure 27. Example of a Road classification ................................................................................................................. 27 Figure 28. Example of Timber Harvest land use .......................................................................................................... 28 Figure 29. Example of an Open Water land use .......................................................................................................... 28 Figure 30. Example of a body of open water less than 40 feet wide; the buffer is drawn from the centerline of the stream .......................................................................................................................................................................... 29 Figure 31. Example of open water greater than 40 feet for which a stream shape is provided; the buffer is drawn from the perimeter of this shape ................................................................................................................................ 29 Figure 32. Example of a Dike classification .................................................................................................................. 30
List of Tables
Table 1. Areas included in study .................................................................................................................................... 8 Table 2. Buffer distances based on steam types ........................................................................................................... 9 Table 3. All Land Use classifications divided into Agricultural and Non-Agricultural categories ................................. 12 Table 4. Land use within standard buffer widths ........................................................................................................ 13 Table 5. Percent of buffer in each land use classification for varying buffer widths ................................................... 14 Table 6. Percent of land use area in each buffer type ................................................................................................. 15 Table 7. Acres in standard buffer for each region ....................................................................................................... 16 Table 8. Percent land use in standard buffer by region............................................................................................... 16 Table 9. Land use in the standard buffer area in relation to the Open Space (OS) tax program ................................ 17 Table 10. Protected properties within standard buffer ............................................................................................... 18 Table 11. Public land in standard buffer ...................................................................................................................... 18 Table 12. Accuracy assessment of NLCD in standard buffer regions ........................................................................... 19 Table 13. Accuracy assessment of RTI land cover data in standard buffer regions ..................................................... 19
Skagit County Geographic Information Systems May 6, 2010
5
Introduction
Background The Skagit River is the only large river in Washington State home to all five species of native salmon and two
species of trout. A majority of the upper watershed is undeveloped, while the lower Skagit, due to development
pressures by increased population and retail services associated with the Interstate 5 corridor, is largely
developed. Still, agriculture is the number one industry in the county. According to the Washington State
University Skagit County Extension, “Skagit County maintains one of the largest and most diverse agricultural
communities west of the Cascade mountain range,” with local production of crops, livestock, and dairy products
approaching $300 million.
The Washington State Growth Management Act requires that Skagit County designate and protect “critical
areas”— wetlands, aquifer recharge areas, fish and wildlife habitat conservation areas, frequently-flooded areas,
and geologically-hazardous areas. Fish and wildlife habitat areas and wetlands are especially important to
maintaining healthy salmon populations, including the Chinook species. Puget Sound Chinook Salmon are listed as
“threatened” under the Endangered Species Act, and the Orca that feed on Chinook are listed as “endangered,” a
more serious classification that triggers the most protective regulations.
Many jurisdictions protect streams and other critical areas using mandatory buffers—strips of land bordering
streams where development or farming is not allowed. Like most jurisdictions, Skagit County requires riparian
buffers in almost every land use zone; however, it does not require farmers to install riparian buffers on actively-
farmed agricultural lands.
Instead, after protracted legal battles with the Swinomish Tribe, Washington Environmental Council, the local Farm
Bureau, and the Western Washington Agricultural Association, Skagit County chose to require agriculture to
comply with specified “watercourse protection measures” designed to prevent harm to non-buffered critical
areas.1 Skagit County uses a monitoring and adaptive management approach to ensure its watercourse protection
measures are effective: the County monitors streams for water and habitat quality and envisions modifying its
protective measures or the entire regulatory scheme if they fail to preserve existing habitat quality. In a 2007
decision, the Washington State Supreme Court upheld Skagit County’s authority to take such an approach, but
found the County had not yet defined the baseline standards or triggers for corrective action that are necessary for
a complete evaluation of the County’s monitoring and adaptive management scheme.2 The County remains non-
compliant with the Growth Management Act until it can modify its management approach and adopt a baseline
and triggers for corrective action.
Salmon Heritage Program In early 2007, Skagit County proposed a “Salmon Heritage Program” that envisioned asking voters to approve a
property tax increase of ten cents per thousand that would have yielded in excess of $1 million per year to acquire
conservation easements or properties in fee along key salmon streams in agricultural areas. After five years, the
program would have imposed mandatory buffers on streams Type I-IV where the County had not achieved
1 Skagit County Code 14.24.120(4), available at www.codepublishing.com/wa/skagitcounty.
2 Swinomish Indian Tribal Cmty. v. W. Wash. Growth Mgmt. Hearings Bd., et al., 161 Wash.2d 415, at 434 (2007).

May 6, 2010 Skagit County Geographic Information Systems
6
protection equal to 80% of the standard buffer widths through voluntary acquisitions. [1] GIS analysis similar to
that used in this report would have been required to identify and prioritize stream areas for acquisition.
Although the initial public reaction to the Salmon Heritage Program was positive, and polling data suggests broad
support for habitat acquisition as a means of balancing the environment and property rights, failure of school bond
measures countywide in 2007 revealed a lack of voter support for increased property taxes during a time of
economic uncertainty. The Salmon Heritage Program has been shelved indefinitely.
Ruckelshaus Center SSB 5248 Process
In May 2007, the Legislature passed SSB 5248, creating a statewide “timeout” for the ongoing controversy and
litigation over riparian buffers on agricultural land. This timeout prohibits new critical area regulations affecting
agriculture and will last until at least July 1, 2011. Various stakeholders are currently participating in a collaborative
process at the UW/WSU William D. Ruckelshaus Center, with the intent of creating a uniform and equitable plan to
protect riparian habitat in agricultural areas. The Ruckelshaus process is a high priority for Skagit County as the
County is at the center of this statewide dispute. If the timeout expires without a solution, Skagit County will need
to bring its monitoring and adaptive management program into compliance with the Growth Management Act.
Salmon Policy Resolution On October 8, 2007, the Skagit County Commissioners approved Resolution R20070499, the Salmon Policy
Resolution, directing County departments to pursue salmon recovery efforts proactively. This resolution
encourages all County departments to consider utilizing the Puget Sound Salmon Recovery Plan in all department
activities. It also directs all County departments to pursue grant funding for salmon habitat enhancement where
possible.
County departments must pursue ways to implement the recommendations of the Puget Sound Salmon Recovery
Plan whenever possible. These recommendations include enhancing riparian habitat while working on adjacent
country roads and drainage control, training road crews in Best Management Practices, avoiding the spraying of
harmful pesticides near salmon streams, enhancing riparian habitat within County-owned lands, acquiring riparian
habitat adjacent to county parks, and integrating education regarding salmon topics into interpretive centers and
road signs. The resolution also requires County departments to provide the Board of Commissioners with an
annual report regarding salmon recovery measures accomplished throughout the preceding year.
Riparian Mapping Project The Salmon Policy Resolution also directed the County’s Geographic Information Systems department to
undertake a large-scale mapping project of riparian areas on agricultural and natural resource lands within the
Skagit River watershed (some 770 miles of watercourse). The resolution provides that,
Skagit County Geographic Information Systems shall, by June 1, 2008, (a) assess riparian areas in
the AG-NRL and RR-NRL zones to determine existing buffer type and width, (b) determine amount
and map location of linear stream distance that has existing riparian buffer (c) determine amount
of linear stream distance where location of existing roads, buildings, and other structures
preclude riparian buffers, and (d) develop maps and other visual aids to assist County personnel in
the Ruckelshaus process.
Skagit County Geographic Information Systems May 6, 2010
7
The results of this project will assist with the Ruckelshaus Center’s effort to protect riparian and agricultural areas,
however, Skagit County also intends to use this project to evaluate the status of riparian habitat in the Skagit River
Basin, protect and enhance local riparian areas, and assist with efforts related to future habitat acquisition.
Methods This study took around 1,000 hours of meticulous analysis to complete. While one person completed most of the
work, up to three people worked on the data at any given time. The use of three individuals provided small
variations in land use classification within the study area; however, all three members collaborated and discussed
any controversial designations thereby making the variations statistically insignificant.
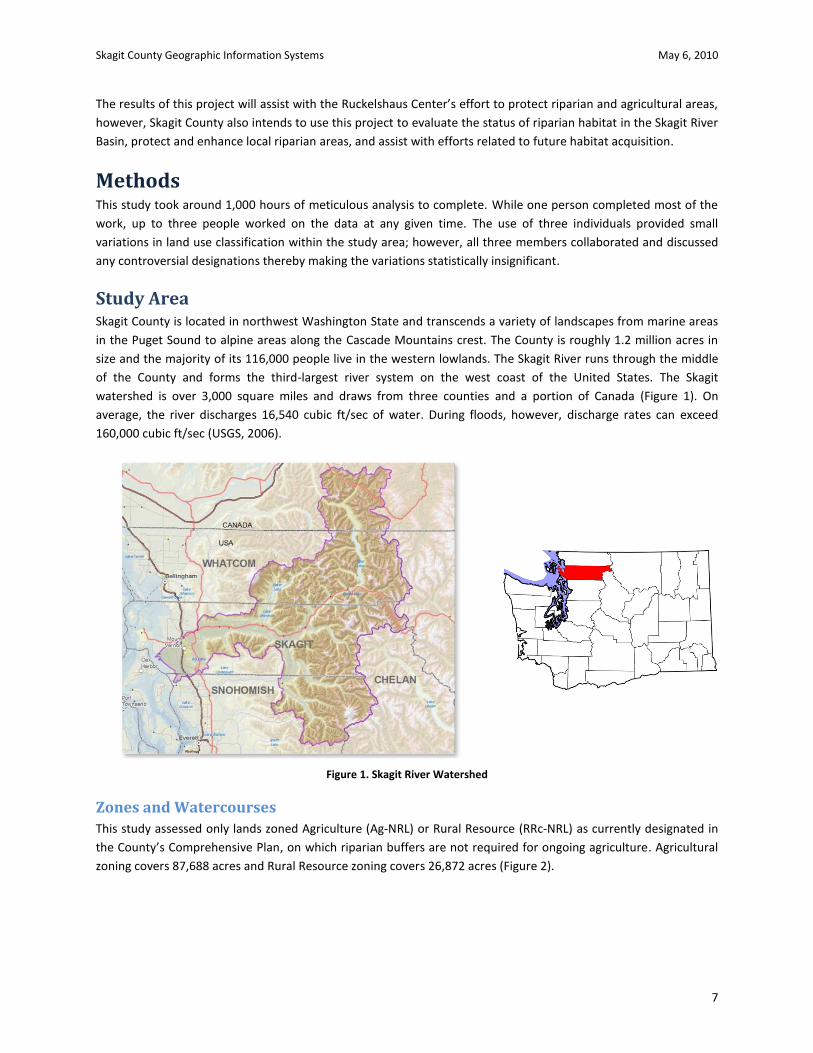
Study Area Skagit County is located in northwest Washington State and transcends a variety of landscapes from marine areas
in the Puget Sound to alpine areas along the Cascade Mountains crest. The County is roughly 1.2 million acres in
size and the majority of its 116,000 people live in the western lowlands. The Skagit River runs through the middle
of the County and forms the third-largest river system on the west coast of the United States. The Skagit
watershed is over 3,000 square miles and draws from three counties and a portion of Canada (Figure 1). On
average, the river discharges 16,540 cubic ft/sec of water. During floods, however, discharge rates can exceed
160,000 cubic ft/sec (USGS, 2006).
Figure 1. Skagit River Watershed
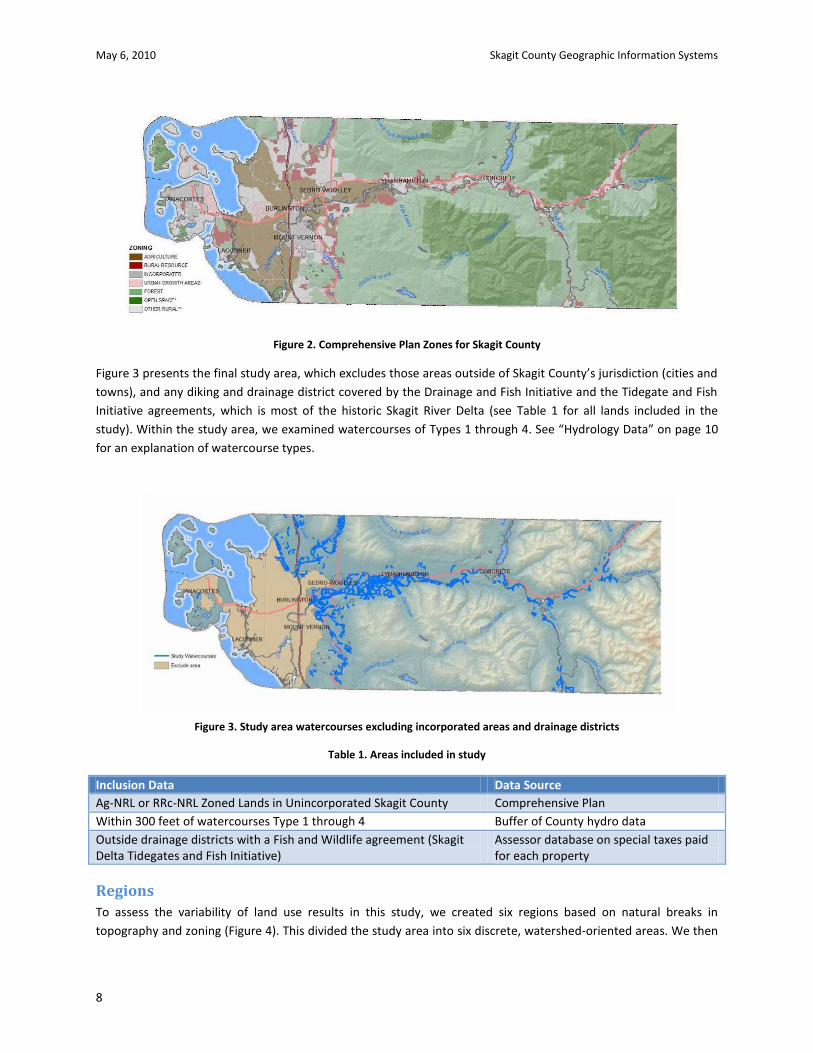
Zones and Watercourses
This study assessed only lands zoned Agriculture (Ag-NRL) or Rural Resource (RRc-NRL) as currently designated in
the County’s Comprehensive Plan, on which riparian buffers are not required for ongoing agriculture. Agricultural
zoning covers 87,688 acres and Rural Resource zoning covers 26,872 acres (Figure 2).
May 6, 2010 Skagit County Geographic Information Systems
8
Figure 2. Comprehensive Plan Zones for Skagit County
Figure 3 presents the final study area, which excludes those areas outside of Skagit County’s jurisdiction (cities and
towns), and any diking and drainage district covered by the Drainage and Fish Initiative and the Tidegate and Fish
Initiative agreements, which is most of the historic Skagit River Delta (see Table 1 for all lands included in the
study). Within the study area, we examined watercourses of Types 1 through 4. See “Hydrology Data” on page 10
for an explanation of watercourse types.
Figure 3. Study area watercourses excluding incorporated areas and drainage districts
Table 1. Areas included in study
Inclusion Data Data Source
Ag-NRL or RRc-NRL Zoned Lands in Unincorporated Skagit County Comprehensive Plan
Within 300 feet of watercourses Type 1 through 4 Buffer of County hydro data
Outside drainage districts with a Fish and Wildlife agreement (Skagit Delta Tidegates and Fish Initiative)
Assessor database on special taxes paid for each property
Regions
To assess the variability of land use results in this study, we created six regions based on natural breaks in
topography and zoning (Figure 4). This divided the study area into six discrete, watershed-oriented areas. We then

Skagit County Geographic Information Systems May 6, 2010
9
analyzed the land uses within each of the regions to determine whether patterns were consistent across the entire
study area or whether they were regional patterns.
Figure 4. The six regions created to assess variations within the study area
Buffers In GIS analysis, buffer zones refer to the area of a specified width
drawn around a map element, such as a stream (Aronoff, 1989).
In this analysis, we drew buffer zones along streamlines to
determine the land uses of the areas bordering the streams. The
width of these buffers vary by stream type as shown in Figure 5
and can have multiple widths as shown in Figure 6. We assigned
buffer widths based on then-current County regulations.
Figure 5. Example of buffers created at varying widths based on stream type
Table 2. Buffer distances based on steam types
Stream Type BufferDistance
Type 1 & 2 200 feet
Type 3 100 feet
Type 4 50 feet
Type 5 Excluded from study

May 6, 2010 Skagit County Geographic Information Systems
10
Figure 6. Example of multiple buffer distances around a single watercourse
Hydrology Data The Washington State Department of Natural Resources (DNR) provided the original hydrology data for this study,
which outlined watercourse locations in the study area. The DNR’s watercourse locations, however, did not match
Skagit County’s 2007 aerial photography of the study area. We therefore corrected the existing hydrological data
to realign misrepresented stream locations. Figure 7 provides an example of this process.
We used the same 2007 aerial photography to depict both stream location and land use classifications (e.g. roads,
structures, class of vegetation). This was important in creating a strong and consistent analysis of the study area.
This information is available upon request and at www.skagitcounty.net/gis (click on “Digital Data”).
OOlldd LLooccaattiioonn
CCoorrrreecctteedd LLooccaattiioonn
Figure 7. Stream Realignment
The red line, or old location, represents the location of a watercourse as provided by the Washington State Department of Natural Resources (DNR). The blue line, or corrected location, depicts the actual location of the watercourse as provided by the 2007 aerial photography. The project team modified all misaligned DNR watercourses to match the correct information provided by the 2007 aerial photography.

Skagit County Geographic Information Systems May 6, 2010
11
Watercourse types are defined by Washington Administrative Code 222-16-31:
Type 1: All waters, within their ordinary high-water mark, as inventoried as “shorelines of the state” under chapter RCW 90.58.
Type 2: Segments of natural waters not classified as Type 1 Water and have a high fish, wildlife, or human use.
Type 3: Segments of natural waters not classified as Type 1 or Type 2 Waters and have a moderate-to-slight fish, wildlife, or human use.
Type 4: All segments of natural waters within the bankfull width of defined channels that are perennial nonfish habitat streams. Perennial streams are flowing waters that do not go dry any time of a year of normal rainfall and include the intermittent dry portions of the perennial channel below the uppermost point of perennial flow.
Type 5: All segments of natural waters within the bankfull width of defined channels that are not Type 1, 2, 3, or 4 Waters.
We used data from the Skagit River System Cooperative (SRSC), a non-profit research agency of the local Sauk-
Suiattle and Swinomish Indian Tribes, to update DNR’s watercourse types. The typing we used for this study,
therefore, was the best available and most up-to-date data.
Aerial Photography In March 2007, Pictometry International provided Skagit County with aerial photos of the study area. Flying over
Skagit County with a set of digital cameras positioned around the airplane, Pictometry took photographs in both a
straight-down orientation as well as at a 40-degree angle. The photos are georegistered using a combination of an
airborne Global Positioning System (GPS), an Inertial Measurement Unit (IMU), and a digital elevation model of the
earth’s surface. The resulting orthophotos are one-foot color; the oblique photos have variable resolution but are
invaluable for determining land use and land class information.
Heads-Up Digitizing Versus Automatic Classification
There are two main methods used for performing a land cover or land use classification analysis: heads-up
digitizing and automatic classification. We used heads-up digitizing for the purpose of our study. Heads-up
digitizing is the oldest method and requires one person to evaluate photos and draw lines around the boundaries
of different land use classifications. The accuracy of this approach depends on the quality of the photos and the
skill of the digitizer.

May 6, 2010 Skagit County Geographic Information Systems
12
Automatic classification is a newer technique that uses a computer to analyze images and determine
classifications, or at least the boundaries of the study areas. This method is often faster and more systematic and is
therefore easier to repeat. Computer-derived classification is more common with lower-resolution satellite
images; however, newly-developed software programs and techniques assist in classifying higher-resolution data.
Skagit County GIS attempted to use automated techniques on the 2007 imagery but the results were not accurate
enough for the project as the boundaries were very small in area or covered multiple classes. The detail of
classification needed for this project required the use of the more time-consuming heads-up digitizing approach.
This approach also provided for the use of the oblique photos as there were no software programs readily
available that used multiple oblique photos along with traditional orthophotos to classify land use. See Error!
eference source not found. for an example of designated riparian areas.
Land Use Classifications All study areas within this project fall into one of the following categories. See Appendix A (page 21) for
descriptions of each classification.
Table 3. All Land Use classifications divided into Agricultural and Non-Agricultural categories
Agricultural Land Uses Non-Agricultural Land Uses
Crop/Dirt Field
Forested Pasture
Mowed/Grazed Field
General Wetland
Grassland/Field
Low Shrub/Tree
Open Water
Dike
Residential
Commercial
Building
Dirt
Timber Harvest
Deciduous Trees
Mixed Trees
Evergreen Trees
Road
field
field
deciduous forest
mixed mature forest
young plants
dirt road Figure 8. Identifying Riparian Areas
Using 2007 aerial photography, the project
team categorized the types of ground cover
within 200-feet of each stream in the study
area. Map designations distinguish be-
tween young plants, mixed mature forests,
deciduous forests, and other vegetation
and ground cover classifications such as
roads and structures.
Image to right: an example of a map show-
ing different designations of riparian areas.
Skagit County Geographic Information Systems May 6, 2010
13
Results
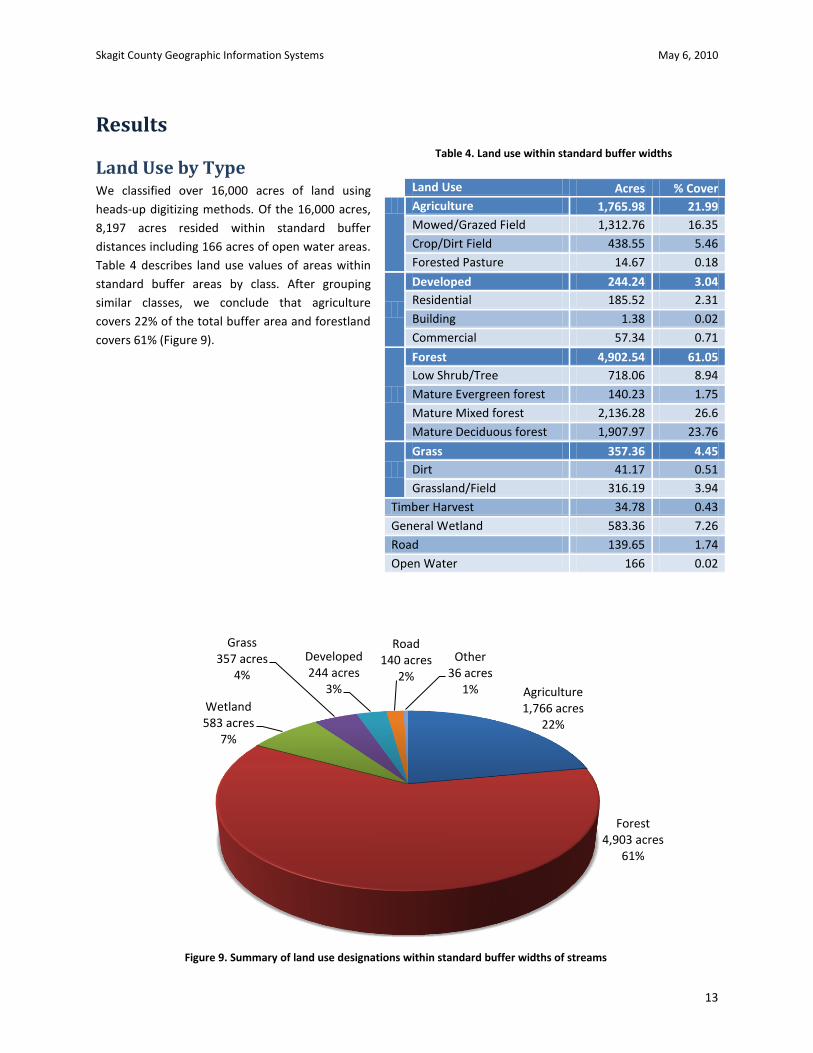
Land Use by Type We classified over 16,000 acres of land using
heads-up digitizing methods. Of the 16,000 acres,
8,197 acres resided within standard buffer
distances including 166 acres of open water areas.
Table 4 describes land use values of areas within
standard buffer areas by class. After grouping
similar classes, we conclude that agriculture
covers 22% of the total buffer area and forestland
covers 61% (Figure 9).
Land Use Acres % Cover
Agriculture 1,765.98 21.99
Mowed/Grazed Field 1,312.76 16.35
Crop/Dirt Field 438.55 5.46
Forested Pasture 14.67 0.18
Developed 244.24 3.04
Residential 185.52 2.31
Building 1.38 0.02
Commercial 57.34 0.71
Forest 4,902.54 61.05
Low Shrub/Tree 718.06 8.94
Mature Evergreen forest 140.23 1.75
Mature Mixed forest 2,136.28 26.6
Mature Deciduous forest 1,907.97 23.76
Grass 357.36 4.45
Dirt 41.17 0.51
Grassland/Field 316.19 3.94
Timber Harvest 34.78 0.43
General Wetland 583.36 7.26
Road 139.65 1.74
Open Water 166 0.02
Table 4. Land use within standard buffer widths
Agriculture1,766 acres
22%
Forest4,903 acres
61%
Wetland583 acres
7%
Grass357 acres
4%
Developed244 acres
3%
Road140 acres
2%
Other36 acres
1%
Figure 9. Summary of land use designations within standard buffer widths of streams

May 6, 2010 Skagit County Geographic Information Systems
14
Variation by Buffer Width Land use varied with different buffer widths. Within 25 feet of a stream, less than 10 percent of the buffer area
was in agricultural use; agriculture was almost 23 percent of the area, however, within 150 feet of a stream.
Conversely, within 25 feet of a stream, forest cover accounted for almost 70 percent; however, forest only made
up 60 percent of the buffer area within 150 feet of a stream.
Table 5. Percent of buffer in each land use classification for varying buffer widths
Buffer area for varying buffer widths
Land Use Classification 25 feet 50 feet 75 feet 100 feet 150 feet
Agriculture 9.49% 12.90% 16.11% 18.84% 22.94%
Natural 87.82% 83.56% 79.6% 76.39% 71.51%
Forest 69.59% 68.20% 65.80% 63.58% 60.03%
Grass 5.67% 5.05% 4.88% 4.78% 4.55%
Wetland 12.56% 10.31% 8.92% 8.03% 6.93%
Development 2.69% 3.54% 4.28% 4.77% 5.56%
Developed 1.24% 1.68% 2.17% 2.60% 3.28%
Road 1.06% 1.51% 1.74% 1.74% 1.68%
Other 0.39% 0.35% 0.37% 0.43% 0.60%
Figure 10. Percent of buffer in each land use classification for varying buffer widths
0
10
20
30
40
50
60
70
80
25' 50' 75' 100' 150'
% L
and
Co
ver
Buffer Width (feet)
Agriculture
Forest
Grass
Developed
Road
Wetland
Other
Skagit County Geographic Information Systems May 6, 2010
15
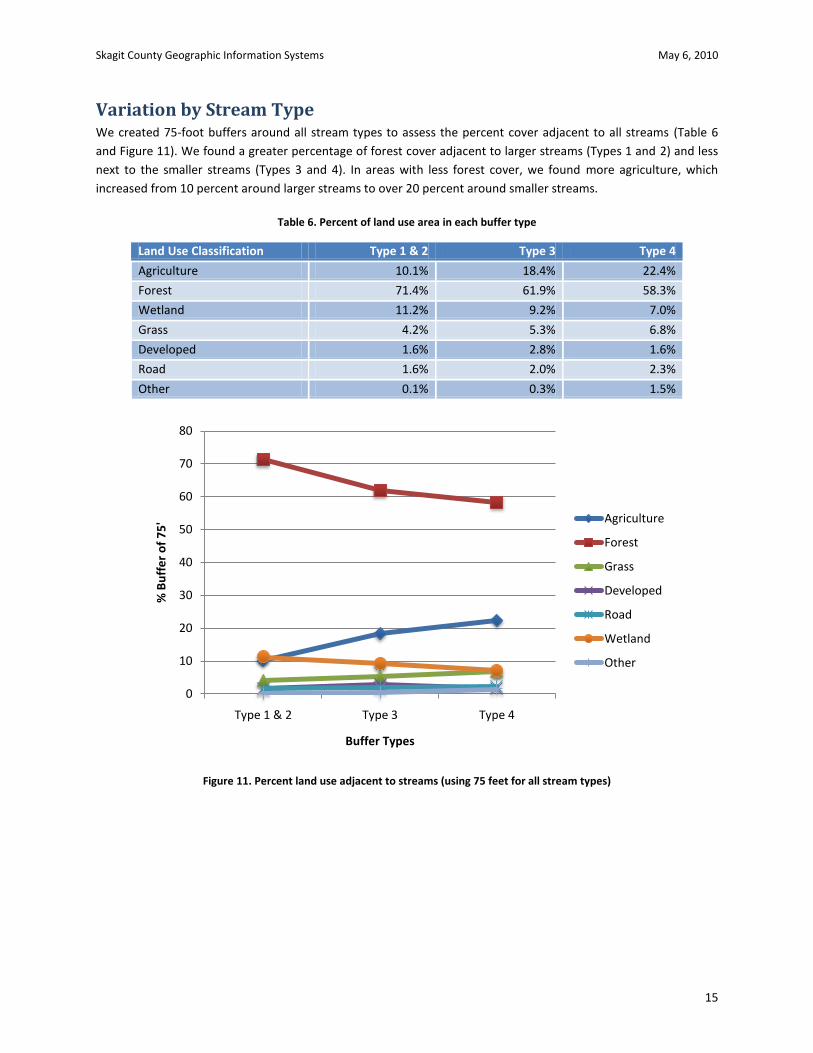
Variation by Stream Type We created 75-foot buffers around all stream types to assess the percent cover adjacent to all streams (Table 6
and Figure 11). We found a greater percentage of forest cover adjacent to larger streams (Types 1 and 2) and less
next to the smaller streams (Types 3 and 4). In areas with less forest cover, we found more agriculture, which
increased from 10 percent around larger streams to over 20 percent around smaller streams.
Table 6. Percent of land use area in each buffer type
Land Use Classification Type 1 & 2 Type 3 Type 4
Agriculture 10.1% 18.4% 22.4%
Forest 71.4% 61.9% 58.3%
Wetland 11.2% 9.2% 7.0%
Grass 4.2% 5.3% 6.8%
Developed 1.6% 2.8% 1.6%
Road 1.6% 2.0% 2.3%
Other 0.1% 0.3% 1.5%
Figure 11. Percent land use adjacent to streams (using 75 feet for all stream types)
0
10
20
30
40
50
60
70
80
Type 1 & 2 Type 3 Type 4
% B
uff
er
of
75
'
Buffer Types
Agriculture
Forest
Grass
Developed
Road
Wetland
Other
May 6, 2010 Skagit County Geographic Information Systems
16
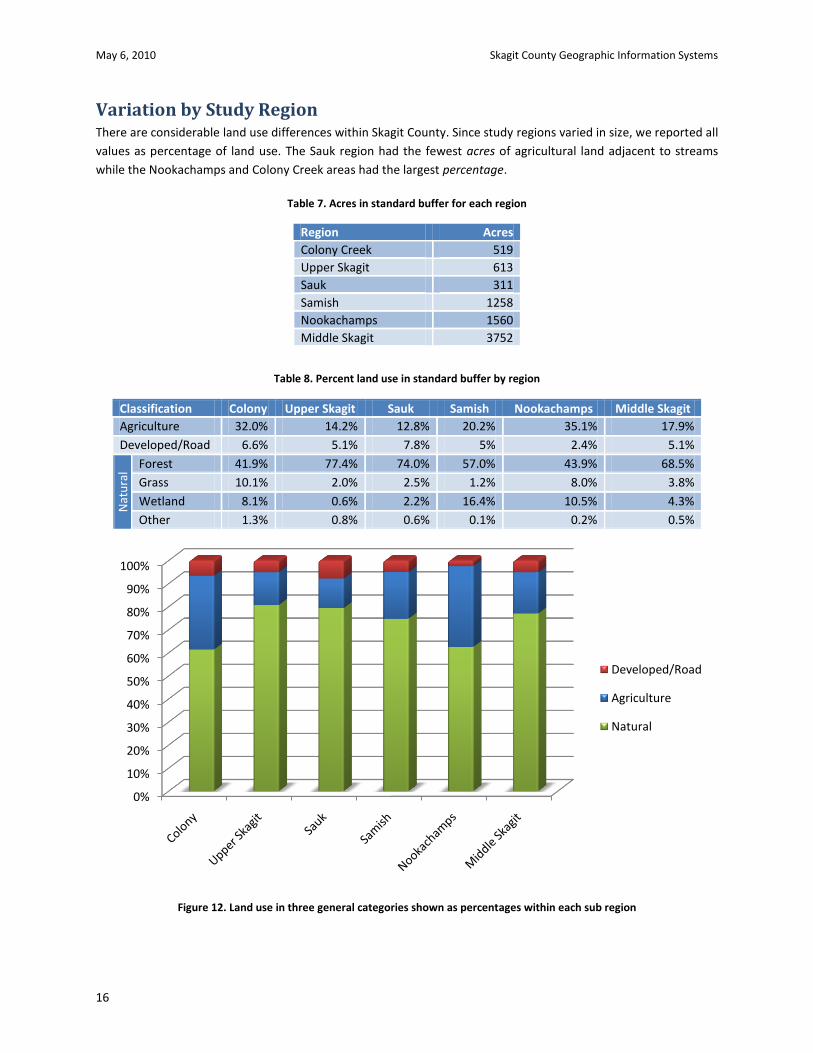
Variation by Study Region There are considerable land use differences within Skagit County. Since study regions varied in size, we reported all
values as percentage of land use. The Sauk region had the fewest acres of agricultural land adjacent to streams
while the Nookachamps and Colony Creek areas had the largest percentage.
Table 7. Acres in standard buffer for each region
Region Acres
Colony Creek 519
Upper Skagit 613
Sauk 311
Samish 1258
Nookachamps 1560
Middle Skagit 3752
Table 8. Percent land use in standard buffer by region
Classification Colony Upper Skagit Sauk Samish Nookachamps Middle Skagit
Agriculture 32.0% 14.2% 12.8% 20.2% 35.1% 17.9%
Developed/Road 6.6% 5.1% 7.8% 5% 2.4% 5.1%
Nat
ura
l
Forest 41.9% 77.4% 74.0% 57.0% 43.9% 68.5%
Grass 10.1% 2.0% 2.5% 1.2% 8.0% 3.8%
Wetland 8.1% 0.6% 2.2% 16.4% 10.5% 4.3%
Other 1.3% 0.8% 0.6% 0.1% 0.2% 0.5%
Figure 12. Land use in three general categories shown as percentages within each sub region
0%
10%
20%
30%
40%
50%
60%
70%
80%
90%
100%
Developed/Road
Agriculture
Natural

Skagit County Geographic Information Systems May 6, 2010
17
No Ecosystem Functions and Values Skagit County Code considers areas physically separated from the watercourse (such as areas on the far side of a
dike, SCC 14.24.530(1)(b), or a road, SCC 14.24.530(4)) to have no ecological function or value (“NFV”) because the
physical separation restricts the benefits that a protected buffer would provide to a watercourse. Therefore, we
excluded these NFV areas from our analysis.
Of the 1,766 agricultural acres within the standard buffer area, 64.2 acres have no function or value, i.e. a buffer in
those locations would provide no ecosystem services. This suggests that 3.6% of the agricultural land use would
not benefit from watercourse riparian protection efforts.
Open Space-Agricultural Tax Designation Within the standard buffer area, there are 3,480 acres currently receiving reduced tax rates as farm and
agricultural land under Washington State’s Open Space Taxation Act program (RCW 84.34). Approximately 40% of
this area, or 1,383 acres, qualify as agricultural land use as compared to 8.4% in other areas (Table 9).
Table 9. Land use in the standard buffer area in relation to the Open Space (OS) tax program
Land Use Classification OS-Agriculture Other Areas
Agriculture 1,383 381
Forested/Shrub 1,565 3,342
General Wetland 233 350
Grass/Dirt 206 150
Res/Com/Bldg 69 174
Road 22 116
Total 3,480 4,514
Sums do not match totals due to rounding
Privately-Protected Public Lands There are many private organizations in Skagit County dedicated to protecting properties from development. In
addition, there are many properties owned by public organizations; these properties are priorities for riparian
improvements as they have little impact on individual landowners (Figure 13). A quantitative analysis of these
public lands is an important aspect of the riparian protection discussion as many argue that a great number of
public lands reside inside buffer zones.
Figure 13. Protected and publicly owned properties in the study area

May 6, 2010 Skagit County Geographic Information Systems
18
Privately-Protected Lands
Within the standard buffer, there are 640 acres that are protected from development by conservation
organizations either through ownership in fee or conservation easement, or participation in the USDA
Conservation and Reserve Enhancement Program (Table 10). Of these, 70% are forest cover; only 6% are
agricultural land use. Nearly 596 acres of forested, grass, or wetland acres are protected.
Table 10. Protected properties within standard buffer
Land Use Acres % Cover
Agriculture 42.0 6.6%
Forest 449.8 70.2%
Grass 38.2 6.0%
Develop 1.6 0.3%
Road 1.4 0.2%
General Wetland 107.5 16.8%
Other 0.0 0.0%
Total 640.59 100%
Public Lands
There are 868 publicly-owned acres within standard buffers. A majority of this area is forest cover while only 75
acres are in agricultural use (Table 11). Throughout the course of our study, we discovered that the Washington
Department of Fish and Wildlife owns a majority of the studied public lands.
Table 11. Public land in standard buffer
Land Use Acres % Cover
Agriculture 75.0 8.6%
Forest 737.1 84.9%
Grass 20.8 2.4%
Develop 2.7 0.3%
Road 2.8 0.3%
Wetland 27.5 3.2%
Other 2.1 0.2%
Total 868.11 100%
Comparison of Land Use Techniques We did not perform an intensive accuracy assessment of our work for this project; however, we performed some
accuracy assessments by visiting specific sites in person and comparing our on-the-ground observations with our
compiled photography results. We also achieved greater accuracy using the oblique photos than normal overhead
photos. In addition, we compared our land use data with two previously-classified datasets that were performed
using satellite data.
National Land Cover Database
The National Land Cover Database (NLCD) is a dataset created from Landsat satellite data. The NLCD uses a thirty-
meter grid and computer-generated classification to produce a course analysis of land cover. The NLCD database
classifies the entire state and is available without charge. We compared the results of this study with the NLCD
data (within the standard buffer study area).

Skagit County Geographic Information Systems May 6, 2010
19
The NLCD grouped land cover types into six categories. These categories did not exactly match our study’s
categories but were close enough for comparison. Table 12 displays our accurate land use assessment across the
top and the NLCD’s classified dataset down the left (Congalton & Green, 1999).The dark boxes indicate the amount
of land both study methods classified within the same category. For example, both the NLCD Assessment and our
study classified 1,063.2 acres as agriculture and 3,645 acres as forest. To determine the amount of land that was
misclassified, cross comparisons must be examined. For example, the NLCD classified 579.9 acres as forest that is
actually agriculture and 39.8 acres as developed that is also agriculture.
Table 12. Accuracy assessment of NLCD in standard buffer regions
Skagit County GIS Assessment
Agriculture Forest Developed Grass/Dirt Wetland Water Total
NLC
D A
sse
ssm
en
t
Agriculture 1,063.2 733.2 53.5 153.8 131.8 26.2 2,161.7
Forest 579.9 3,645 124 146 334.8 114.3 4,944
Developed 39.8 51.5 27.6 10.3 10.5 3 142.7
Grass/Dirt 26.6 53.7 5.5 6.2 2.3 2.2 96.5
Wetland 38.4 99.1 3.5 18.3 58.9 9.9 228.1
Water 11.7 122.3 1.9 5.7 30.5 1.5 173.6
Total 1,759.6 4,704.8 216 340.3 568.8 157.1 7,746.6
Total 15,493.2
The NLCD’s database correctly classified 4,802.5 acres making the database 62% accurate within the standard
buffer. The NLCD only correctly classified 60% of agricultural areas; the final calculation was 400 acres higher than
our observed results. The NLCD therefore classified 123% more agricultural area than actually exists.
Rural Technology Institute
The Rural Technology Institute (RTI) at the University of Washington created statewide land cover datasets using
Landsat satellite imagery. We also compared our results with these datasets. Similar to the NLCD, the categories
did not match exactly; however, we grouped the major categories together for comparison (Table 13).
Table 13. Accuracy assessment of RTI land cover data in standard buffer regions
Skagit County GIS Assessment
Agriculture Forest Developed Water Total
RTI
Agriculture 1,383.2 2,904.2 578.8 181.5 5,047.7
Forest 95.0 1,342.8 73.4 54.4 1,565.6
Developed 204.6 147.4 91.5 52.1 495.6
Water 63.8 520.8 5.4 35.9 625.9
Total 1,746.6 4,915.1 749.1 324.0 7,734.8
Total 15,469.6
RTI’s data correctly classified 2,835.4 acres making the dataset 37% accurate within the standard buffer. RTI
correctly classified 79% of agricultural areas, however, RTI over-predicted total agricultural area by 289%. While
our study identified 1,746 acres of agriculture using these five categories, the RTI analysis predicted over 5,000
acres.

May 6, 2010 Skagit County Geographic Information Systems
20
Conclusions This study provides an accurate land use analysis of areas surrounding watercourses that flow through Agricultural
and Rural Resource zones.
For the purpose of our report, we evaluated our compiled information based on the most commonly-posed
questions collected throughout past buffer discussions. It is possible, however, to use this data for many other
purposes not addressed in this study such as establishing a baseline for comparing change over time.
We classified land uses out to 300 feet from the streams, but we used standard buffer distances (50, 100, and 200
feet depending on stream type) for most of the analysis in this project. Of the 8,031 acres of standard buffer area
analyzed, we classified the following land uses: 22% agriculture, 5% developed land or road covered, and 73%
forest, wetland, or natural grass. Agricultural activity varied by region ranging from 13% in the Sauk region to 35%
in the Nookachamps.
One purpose of this study was to determine how many acres of riparian agricultural land would be eligible for
habitat protection. For agricultural use areas within standard buffer areas (1,766 acres), we concluded that there
are 42 acres of protected land, 75 acres of public land, and 64 acres of land with no functions or values. Together,
these three categories, which would not qualify for habitat acquisition programs, constitute 10% of the agricultural
land studied within the standard buffer area. Of the remaining agricultural area, 90% is potentially restorable.
We also compared our land use data with other compiled satellite data sets. These other studies used an
automated processing of land cover and have a course resolution of only 30 meters, which detects only large-scale
patterns. In addition, these other methods classified land cover, which is slightly different from land use. During
this analysis, we found that the high-resolution photography detected many clues and cover types that the 30-
meter data set did not detect. In comparison with our study, both course resolution studies over-estimated
agricultural land use—NLCD by 123% and RTI by 289%.
While it may be cost-prohibitive in other regions to perform a detailed analysis such as this study, care should be
taken when using coarse imagery for land use calculations. The role of unmanaged areas such as fallow fields are
probably beneficial to riparian health, yet may likely classify as agriculture in coarse scale imagery. This is only one
study so the coarse estimates may vary from one county to another; however, some attempts to reconcile errors
should be made before drawing conclusions based on the provided results.
Works Cited Aronoff, S. (1989). Geographic Information Systems: a Management Perspective. Ottawa: WDL Publications. Congalton, R. G., & Green, K. (1999). Assessing the Accuracy of Remotely Sensed Data: Principles and Practices. Boca Raton: CRC Press. USGS. (2006). Water Data Report 2006: 12200500 Skagit River Near Mount Vernon, WA. Retrieved from http://wdr.water.usgs.gov/wy2006/pdfs/12200500.2006.pdf

Skagit County Geographic Information Systems May 6, 2010
21
Appendix A. Land Use Classification Descriptions
Crop/Dirt Field This classification includes all agricultural areas with disturbed soil that appear to be for the purpose of crop
planting.
Figure 14. Example of Crop/Dirt Field land use
Forested Pasture A forested pasture consists of forested areas with evidence of cattle or horse grazing. Animal grazing also classifies
as agricultural use. This category is difficult to classify with single snapshot aerial photos, however, we selected this
category in cases where grazing appeared certain under tree coverage.
Figure 15. Example of Forested Pasture land use
May 6, 2010 Skagit County Geographic Information Systems
22
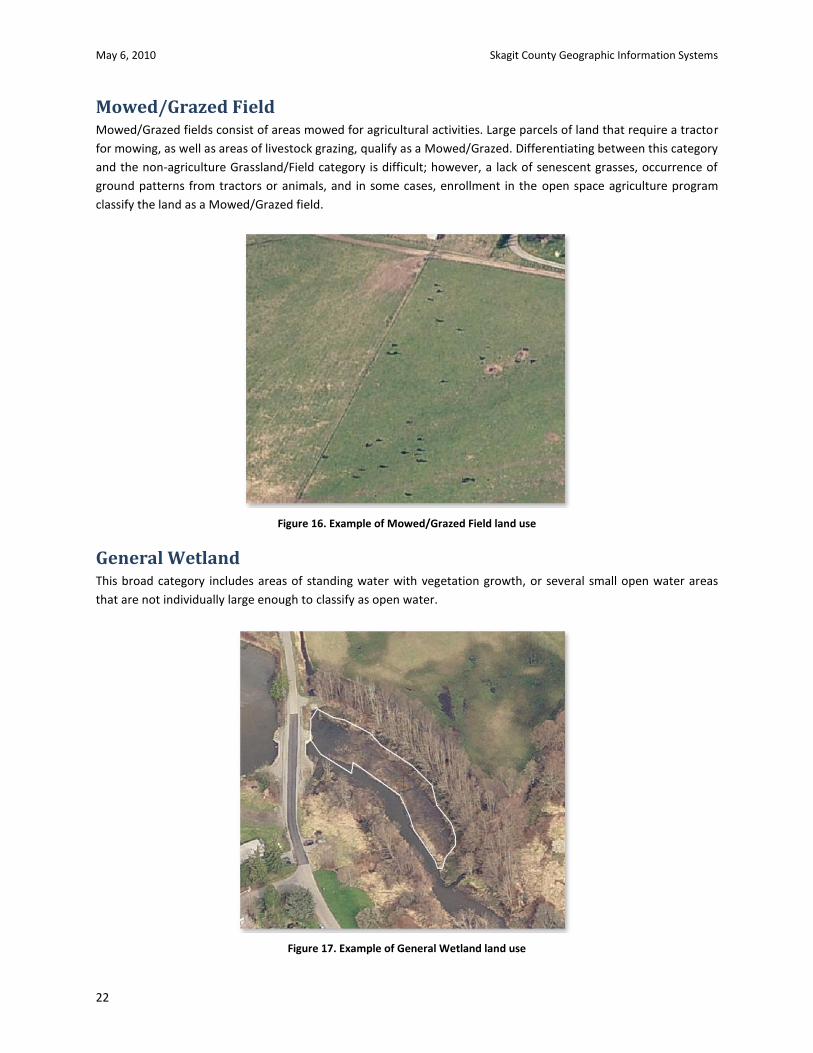
Mowed/Grazed Field Mowed/Grazed fields consist of areas mowed for agricultural activities. Large parcels of land that require a tractor
for mowing, as well as areas of livestock grazing, qualify as a Mowed/Grazed. Differentiating between this category
and the non-agriculture Grassland/Field category is difficult; however, a lack of senescent grasses, occurrence of
ground patterns from tractors or animals, and in some cases, enrollment in the open space agriculture program
classify the land as a Mowed/Grazed field.
Figure 16. Example of Mowed/Grazed Field land use
General Wetland This broad category includes areas of standing water with vegetation growth, or several small open water areas
that are not individually large enough to classify as open water.
Figure 17. Example of General Wetland land use
Skagit County Geographic Information Systems May 6, 2010
23
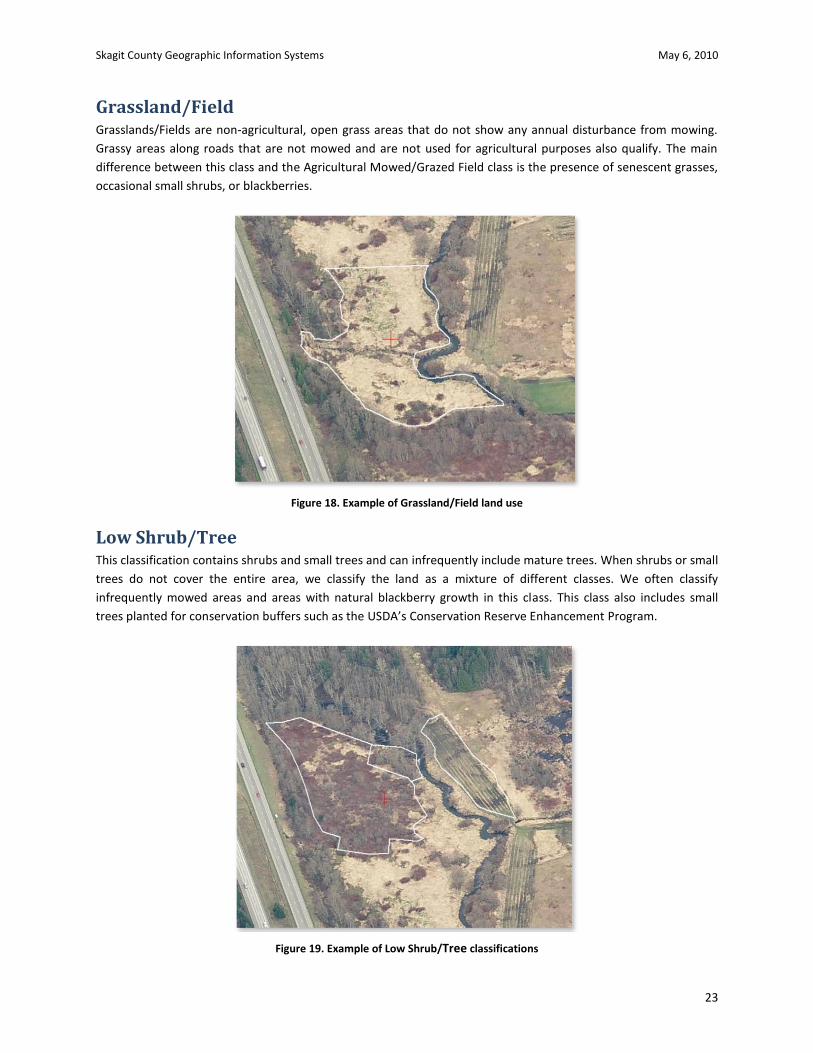
Grassland/Field Grasslands/Fields are non-agricultural, open grass areas that do not show any annual disturbance from mowing.
Grassy areas along roads that are not mowed and are not used for agricultural purposes also qualify. The main
difference between this class and the Agricultural Mowed/Grazed Field class is the presence of senescent grasses,
occasional small shrubs, or blackberries.
Figure 18. Example of Grassland/Field land use
Low Shrub/Tree This classification contains shrubs and small trees and can infrequently include mature trees. When shrubs or small
trees do not cover the entire area, we classify the land as a mixture of different classes. We often classify
infrequently mowed areas and areas with natural blackberry growth in this class. This class also includes small
trees planted for conservation buffers such as the USDA’s Conservation Reserve Enhancement Program.
Figure 19. Example of Low Shrub/Tree classifications

May 6, 2010 Skagit County Geographic Information Systems
24
Deciduous Trees This classification contains areas made up of only deciduous trees over 10-15 feet tall. The trees must cover more
than 50% of the area.
Figure 20. Example of Deciduous Trees land use
Mixed Trees The Mixed Trees classification contains forested areas made up of trees over 10-15 feet tall that cover over 50% of
the selected area. The area may contain a mixture of deciduous and evergreen trees. The ratio of deciduous to
evergreen trees may vary greatly, however, there must be a combination of both. The boundary of this class can
be subjective and often blends with the low shrub/tree classification.
Figure 21. Example of Mixed Trees land use
Skagit County Geographic Information Systems May 6, 2010
25
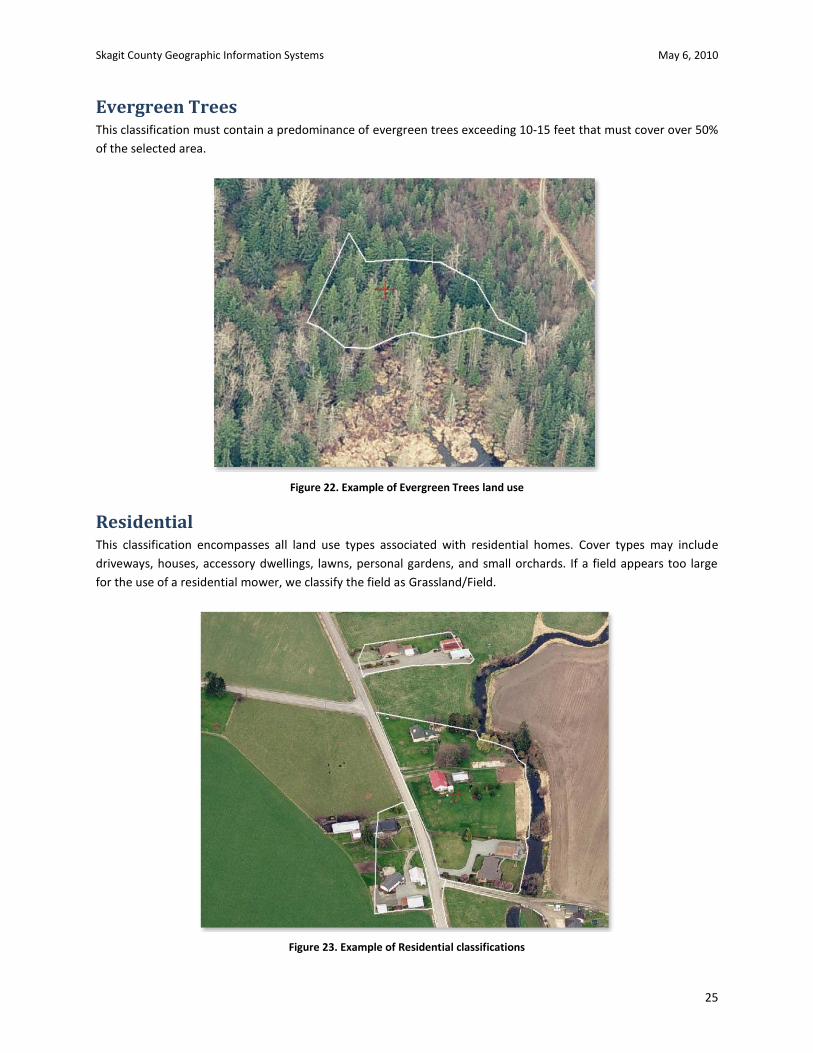
Evergreen Trees This classification must contain a predominance of evergreen trees exceeding 10-15 feet that must cover over 50%
of the selected area.
Figure 22. Example of Evergreen Trees land use
Residential This classification encompasses all land use types associated with residential homes. Cover types may include
driveways, houses, accessory dwellings, lawns, personal gardens, and small orchards. If a field appears too large
for the use of a residential mower, we classify the field as Grassland/Field.
Figure 23. Example of Residential classifications
May 6, 2010 Skagit County Geographic Information Systems
26
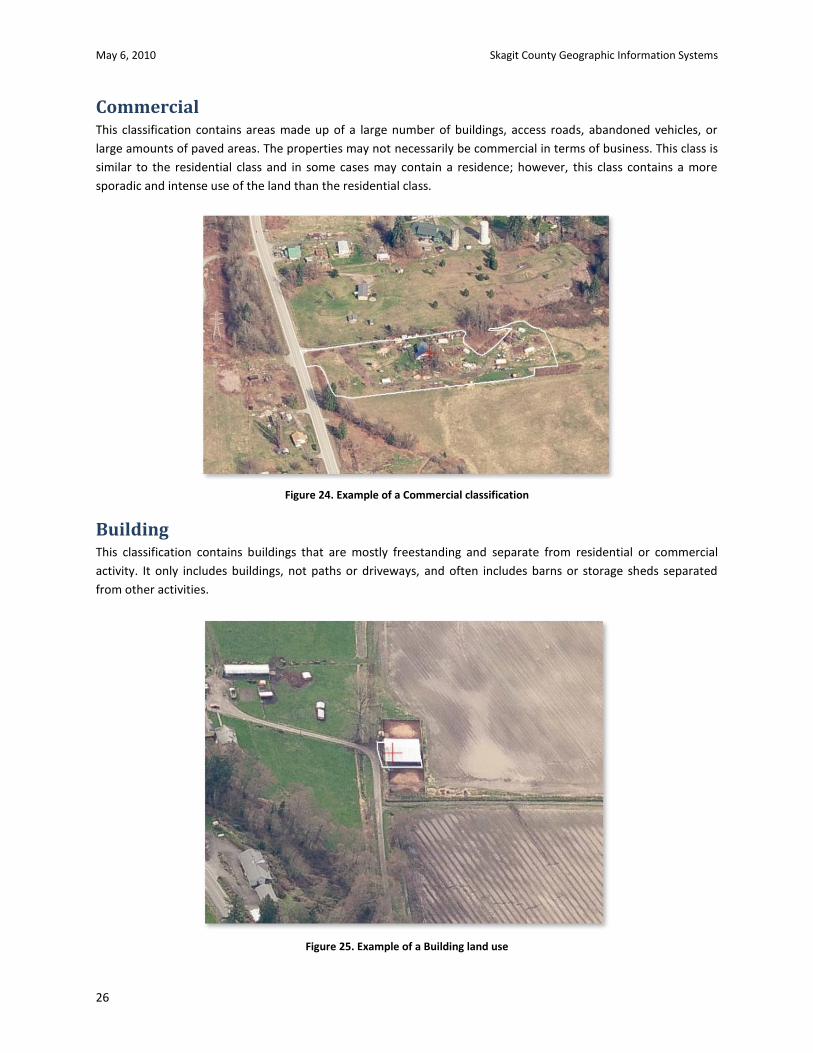
Commercial This classification contains areas made up of a large number of buildings, access roads, abandoned vehicles, or
large amounts of paved areas. The properties may not necessarily be commercial in terms of business. This class is
similar to the residential class and in some cases may contain a residence; however, this class contains a more
sporadic and intense use of the land than the residential class.
Figure 24. Example of a Commercial classification
Building This classification contains buildings that are mostly freestanding and separate from residential or commercial
activity. It only includes buildings, not paths or driveways, and often includes barns or storage sheds separated
from other activities.
Figure 25. Example of a Building land use

Skagit County Geographic Information Systems May 6, 2010
27
Dirt This classification contains large areas of exposed dirt used for non-agricultural purposes. To distinguish the
difference between a non-agricultural dirt area and an agricultural dirt area, we examine the overall size of the
area, determine if the area is enrolled in an open space taxation program, and look for a lack of characteristics
normally found in agricultural areas such as rows and paths from plowing and barns.
Figure 26. Example of a Dirt classification
Road Road classifications include (a) paved public and private roads, (b) dirt roads that are significant enough in size and
construction to make relocation of the road a substantial expense, (c) railroad tracks, (d) roadside shoulders and
pullouts, and (e) large, maintained trails.
Figure 27. Example of a Road classification

May 6, 2010 Skagit County Geographic Information Systems
28
Timber Harvest This class contains areas of cleared timber with little or no re-growth. The land is often bare with disturbed soil or
dead wood debris. Once re-growth begins, we classify the area as Low Shrub/Tree.
Figure 28. Example of Timber Harvest land use
Open Water This classification contains bodies of water wider than 40 feet (Figure 29). The hydrological dataset used for this
study does not contain shape data for bodies of water less than 40 feet wide. As such, these bodies of water are
represented only by a thin centerline; we drew the buffer area from this centerline (Figure 30). Our photography is
from late March and early April 2008, when there is significant freestanding water on the ground. This is important
as some open water areas are visible in spring but diminish or disappear altogether by fall. We did not classify
areas with grass visible in the water because the presence of grass would indicate the water body is not
continuously present since grass could not grow with continuous water cover.
Figure 29. Example of an Open Water land use

Skagit County Geographic Information Systems May 6, 2010
29
Figure 30. Example of a body of open water less than 40 feet wide; the buffer is drawn from the centerline of the stream
For bodies of water that are 40 feet and wider, the hydrological dataset contains shape data depicting the
watercourse. For these larger bodies of water, we drew the buffer from the perimeter of the shape (Figure 31).
Figure 31. Example of open water greater than 40 feet for which a stream shape is provided; the buffer is drawn from the perimeter of this shape

May 6, 2010 Skagit County Geographic Information Systems
30
Dike Dike areas consist of elevated land used for the purpose of controlling water flow or preventing floods. Almost all
dikes in this project’s study area are outside official dike district areas; most are also mowed as part of an annual
maintenance routine.
Figure 32. Example of a Dike classification


Related Documents