____________________________________________________________________________________________ *Corresponding author: E-mail: [email protected]; International Journal of Plant & Soil Science 3(3): 303-329, 2014; Article no. IJPSS.2014.008 SCIENCEDOMAIN international www.sciencedomain.org Mapping of Variability in Major and Micro Nutrients for Site-Specific Nutrient Management Muhammad Jamal Khan 1 , Muhammad Rashid 1 , Shamsher Ali 1 , Inayat Khattak 2 , Shahida Naveed 3* and Zahid Hanif 4 1 Department of Soil and Environmental Sciences, Khyber Pakhtunkhwa Agricultural University Peshawar, Pakistan. 2 NRM Coordinator BKPAP,SRSP,KARAK, Pakistan. 3 Department of Botany, University of Peshawar, Pakistan. 4 Agriculture Department, Khyber Pakhtoonkhwa, Pakistan. Authors’ contributions This work was carried out in collaboration between all authors. Author MJK being Principal investigator of the project has designed the study and helped in manuscript correction and final evaluation. Author MR performed laboratory analytical analysis, statistical analysis and wrote the first draft of manuscript. Author SA managed intensive field sampling and computer analysis. Author IK conducted and manage all the agronomic and soil related activities. Author SN helped in conducting the lab work including soil testing and carried out proof reading of the manuscript. All authors read and approved the final manuscript. Received 1 st March 2013 Accepted 19 th June 2013 Published 14 th January 2014 ABSTRACT Background: Spatial variation of soil physical and chemical properties influences soil and crop management efficiency causes uneven crop growth and decreases the effectiveness of uniformly applied fertilizers. Purpose: Therefore, a comprehensive survey was made to determine the spatial variability of soil properties and their mapping in Charsadda district of Khyber Pakhtunkhwa Province (KP) of Pakistan to delineated area into low, medium and high level of plant nutrients for site-specific nutrient management using variable rate fertilizer technology. Method: Soil sampling was done on a grid system using Global Position System (GPS) from two depths (0-15, and 15-45 cm) during 2004; and the samples were analyzed for soil physical (soil texture and saturation percentage), soil chemical (pH, ECe, SAR, lime, Original Research Article

Welcome message from author
This document is posted to help you gain knowledge. Please leave a comment to let me know what you think about it! Share it to your friends and learn new things together.
Transcript
____________________________________________________________________________________________
*Corresponding author: E-mail: [email protected];
International Journal of Plant & Soil Science3(3): 303-329, 2014; Article no. IJPSS.2014.008
SCIENCEDOMAIN internationalwww.sciencedomain.org
Mapping of Variability in Major and MicroNutrients for Site-Specific Nutrient Management
Muhammad Jamal Khan1, Muhammad Rashid1, Shamsher Ali1,Inayat Khattak2, Shahida Naveed3* and Zahid Hanif4
1Department of Soil and Environmental Sciences, Khyber Pakhtunkhwa AgriculturalUniversity Peshawar, Pakistan.
2NRM Coordinator BKPAP,SRSP,KARAK, Pakistan.3Department of Botany, University of Peshawar, Pakistan.
4Agriculture Department, Khyber Pakhtoonkhwa, Pakistan.
Authors’ contributions
This work was carried out in collaboration between all authors. Author MJK being Principalinvestigator of the project has designed the study and helped in manuscript correction and
final evaluation. Author MR performed laboratory analytical analysis, statistical analysis andwrote the first draft of manuscript. Author SA managed intensive field sampling and
computer analysis. Author IK conducted and manage all the agronomic and soil relatedactivities. Author SN helped in conducting the lab work including soil testing and carried out
proof reading of the manuscript. All authors read and approved the final manuscript.
Received 1st March 2013Accepted 19th June 2013
Published 14th January 2014
ABSTRACT
Background: Spatial variation of soil physical and chemical properties influences soil andcrop management efficiency causes uneven crop growth and decreases the effectivenessof uniformly applied fertilizers.Purpose: Therefore, a comprehensive survey was made to determine the spatialvariability of soil properties and their mapping in Charsadda district of KhyberPakhtunkhwa Province (KP) of Pakistan to delineated area into low, medium and highlevel of plant nutrients for site-specific nutrient management using variable rate fertilizertechnology.Method: Soil sampling was done on a grid system using Global Position System (GPS)from two depths (0-15, and 15-45 cm) during 2004; and the samples were analyzed forsoil physical (soil texture and saturation percentage), soil chemical (pH, ECe, SAR, lime,
Original Research Article

Khan et al.; IJPSS, Article no. IJPSS.2014.008
304
and organic matter) and soil fertility status (mineral N, AB-DTPA extractable P, K, Zn, Cu,Fe, Mn and HCl extractable B). Geostatistical techniques of semivariogram analysis andkriging were used to model the spatial variability and interpolation of data values atunsampled locations and mapping of the district. Semivariogram analyses of data showedsome spatial patterns for soil properties. Silt (r2=0.48), clay (r2=0.71) contents andsaturation percentage (r2=0.71) were described by linear model in both the depths (0-15,and 15-45 cm). Electrical conductivity was described by a linear model in both the depthswith strong spatial structure in surface soil (r2=0.81). Calcium carbonate (CaCO3) in thesurface soil had strong spatial structure (r2=0.59), organic matter content in the surfacesoil was described by a spherical model with a range of influence 6.65 km, while in thesubsoil (15-45 cm) it was described by a linear model with moderate spatial structure(r2=0.41). Mineral N and P were described by linear models with strong spatial structurefor P in both the depths (r2=0.77, 0.73) and moderate spatial structure (r2=0.36) forsurface soil N. Potash content was described by a linear model in surface soil withmoderate structure (r2=0.24), while in subsoil it was explained by a spherical model withstrong spatial structure (r2=0.64) and a range of about 9 km. Zinc and Cu in the surfacesoil were randomly distributed, while they have strong spatial structure (r2=0.63 and 0.54,respectively) with a linear model in subsoil. Boron content in both the depths wasdescribed by a linear model with strong spatial structure in surface (r2=0.61) andmoderate structure (r2=0.31) in subsoil.Results: The maps of various measured soil properties showed that soil mineral N andboron (B) increases from north-east toward west-south, available P form south-easttowards north-west and lime form northern towards southern parts of the district. Soilorganic matter, sand and silt contents showed little spatial variation within sampled areas.Conclusion: Texture of Charsadda district ranged from silt to sandy loam. Sand contentin the east and silt in the whole area was higher, while clay was found low throughout thesoil surveyed. All the soils were alkaline in reaction and calcareous in nature to differentdegrees as indicated in maps of surface soil pH and CaCO3. Organic matter content ofboth the depths was low. surface soils was deficient in N in all soils of district Charsaddawhile deficiencies of P, Zn and B were observed to a greater extent, while K, Cu and Mnare also appearing deficient in soil.
Keywords: Macro and Micro Nutrients, Charsadda, KP Province, Soil Properties, GPS.
1. INTRODUCTION
Crop production is affected by various factors that vary both in space (spatial variability) andtime (temporal variability). Spatial variability of soil chemical and physical propertiesinfluences soil and crop management efficiency as well as the design and effectiveness offield research trials [1,2,3,4]. Spatial variability in soil properties causes uneven crop growth,confounds treatment effects in field experiments, and decreases the effectiveness ofuniformly applied fertilizer or chemical amendments on field scale [5,6,7,8]. Understandingthe magnitude and pattern in spatial variability of soil properties is necessary for improvedmanagement options relating to application of fertilizers and strategies for sampling anddesign of field research trials and mapping of fields on lower scale and districts on largescale [9,10,11,12,13,14].
Soil variability has been extensively studied in the past by soil scientists [14,15,16,17,18].Geostatistical approaches involve analysis and modeling of spatial patterns using

Khan et al.; IJPSS, Article no. IJPSS.2014.008
305
semivariograms and pattern interpolation and mapping using punctual kriging. Krigingmethod of interpolation has been successfully applied to regionalized variables in mining[19], hydrology [18], soil science [20,21,22,23,24,25], heavy metals in soils [26,27,28,29]and crop science [7,15,16,30].
Keeping in view the importance of spatial variability, this project was carried out to model thespatial variability of soil properties and their mapping in Charsadda district of KhyberPakhtunkhwa sof Pakistan with the objective to assess the spatial variability and currentnutritional status of the soils, delineate the area into different categories low, medium andhigh nutrients status for site-specific plant nutrients management.
Such information is needed for the best management of soil resources for enhancingagricultural production and provide as base for further research by the scientists.
2. MATERIALS AND METHODS
Intensive soil sampling from district Charsadda of Khyber Pakhtunkhwa of Pakistan wasdone on a grid system using Global Positioning System (GPS) during 2004. Stratifiedsystematic unaligned sampling design [31] was used for sampling. Whole area was dividedinto different roads i.e. Peshawar-Charsadda road, Tangi-Charsadda road, Rajarh-Takhtbairoad, Umarzai-Harichand road, Charsadda – Mardan road, and Charsadda – Nowsheraroad. Along each road, soil samples were collected at a regular interval of 5 km and theircoordinates were recorded by GPS. Soil samples were collected from two depths i.e. 0-15and 15-45 cm. In all, 79 soil samples were collected from each depth from agricultural fieldsgrowing wheat crop.
Soil samples thus collected were brought to the laboratory of Soil and EnvironmentalSciences, KP Agricultural University, Peshawar, Pakistan. Soil samples were air dried andsieved through a 2mm sieve. Soil samples thus prepared were analyzed for soil propertiesviz. texture [32], saturation percentage [33], pH [34], electrical conductivity [34], organicmatter [35], CaCO3 content using acid neutralization method method [36], SAR [33], totalmineral N [37], AB-DTPA extractable P, K, Cu, Zn, Fe and Mn [38] and boron by HCl acidmethod [39]. Phosphorus was read on spectrophotometer, K on flamephotometer, and Cu,Zn, Fe and Mn on atomic absorption spectrophotometer. Texture of the sampling locations isgiven in Table 1.
Table 1. Location and soil textural class at the sampling sites for 0-15 cm depth
S.No.
RoadLocation
GPSReading
TexturalClass
S.No
RoadLocation
GPSReading
TexturalClass
1 Arif abad 34-07-13N71-39-34E
Loam 41 Mahmoodabad
34-09-27N71-52-56E
Silt loam
2 Station kalla 34-18-24N71-38-04E
Loam 42 Malagi kalle 34-08-48N71-53-20E
Silt loam
3 Tangi bazaar 34-17-37N71-39-20E
Silt loam 43 Patwarikalle
34-08-16N71-53-32E
Silt
4 Tangi 34-17-27N71-39-46E
Silt loam 44 Dusaharakalle
34-08-36N71-54-02E
Silt loam
5 Hoara 34-17-23N71-40-44E
Silt loam 45 Nazo kale 34-08-04N71-52-57E
Silt loam
6 Shoakano 34-17-26N Silt loam 46 Aziz abad 34-07-47N Silt loam

Khan et al.; IJPSS, Article no. IJPSS.2014.008
306
kalle 71-41-28E 71-52-06E7 Karhi wal 34-17-20N
71-41-35ESilt loam 47 Ahmad khan
kale34-07-34N71-51-24E
Silt loam
8 Tani wal kalle 34-17-00N71-40-55E
Silt loam 48 Captan kalle 34-07-42N71-51-49E
Silt loam
9 Ummer zai 34-16-44N71-41-24E
Loam 49 Sher bhadarkakke
34-07-12N71-50-18E
Silt loam
10 Hagi Awaldinkalle
34-16-50N71-41-26E
Sandyloam
50 Nisatta 34-07-30N71-48-03E
Silt loam
11 Saifur kale 34-16-41N71-41-53E
Silt loam 51 Khan zadakale
34-07-32N71-46-57E
Silt loam
12 Noor Muhdkalle
34-17-05N71-42-05E
Silt loam 52 Policeline 34-08-04N71-46-17E
Silt loam
13 Chacha khankale
34-17-25N71-42-25E
Silt loam 53 Banda 34-07-58N71-46-43E
Silt loam
14 Mamanodhari
34-17-38N71-42-45E
Silt loam 54 Gulballa 34-07-13N71-39-19E
Silt loam
15 Zarin abad 34-17-56N71-43-10E
Silt loam 55 Sardhariab(mumtazabad)
34-07-32N71-41-01E
Silt loam
16 Zaim kalle 34-17-20N71-42-32E
Silt loam 56 Allahabad 34-08-18N71-41-49E
Silt loam
17 Masal korona 34-16-49N71-42-15E
Silt loam 57 Shad abadkale
34-09-18N71-43-05E
Silt loam
18 Aslam khankalle
34-16-34N71-42-12E
Silt loam 58 34-09-51N71-42-58E
Silt loam
19 Sharpaokalle
34-16-17N71-41-54E
Silt loam 59 Ghidharekalle
34-09-44N71-42-44E
Silt loam
20 Maih kalle 34-15-55N71-41-46E
Silt loam 60 Sarki kalle 34-10-35N71-42-03E
Silt loam
21 Maih jan kale 34-15-37N71-42-37E
Silt loam 61 Ummarabad
34-08-37N71-45-31E
Silt loam
22 Umar zai 34-13-42N71-44-12E
Silt loam 62 Nisatta(tauhidabad)
34-06-48N71-47-53E
Silt loam
23 Torang zai 34-12-22N71-45-21E
Silt loam 63 Nisatta(dagai)
34-06-23N71-48-18E
Silt loam
24 Uttaman zai 34-10-54N71-45-43E
Silt loam 64 Shahpasand kale
34-05-53N71-48-53E
Silt loam
25 Rajarh kalle 34-10-22N71-44-02E
Silt loam 65 Tarlandi(bahramkale)
34-05-27N71-49-30E
Silt loam
26 Muffti abad 34-11-04N71-47-24E
Silt loam 66 Nawa kale 34-04-34N71-50-39E
Silt loam
27 Khan mai 34-11-57N71-48-55E
Silt loam 67 Hishgi (hisarkale)
34-03-55N71-51-24E
Loam
28 Azam khankorona
34-13-02N71-50-36E
Silt loam 68 Guggarabad
34-02-55N71-52-29E
Sandyloam
29 Sadullahkhan kalle
34-13-38N71-50-29E
Silt loam 69 Nisatta(schoolkorona)
34-05-47N71-48-43E
Silt loam
30 Behlola 34-14-34N71-50-46E
Silt 70 Nisatta(madni
34-06-15N71-48-00E
Silt loam

Khan et al.; IJPSS, Article no. IJPSS.2014.008
307
mahalla)31 Hafiz abad
colony34-09-20N71-45-52E
Silt loam 71 Ummar zai(qaiamabad)
34-14-35N71-43-54E
Silt loam
32 Pola dhair 34-09-27N71-46-33E
Silt loam 72 Khan ghari 34-15-29N71-44-44E
Silt loam
33 Malka dhair 34-09-49N71-38-35E
Silt loam 73 Qamar abad 34-16-24N71-45-44E
Silt loam
34 Sar dairy 34-10-06N71-50-08E
Silt loam 74 Dakki 34-17-25N71-46-36E
Silt loam
35 Shah jahanabad
34-10-29N71-51-36E
Silt loam 75 Jahangirabad(mandarhi)
34-19-09N71-46-51E
Silt loam
36 Dargai 34-10-47N71-52-50E
Silt 76 Uzbako 33-20-09N71-47-03E
Silt loam
37 Manga kalle 34-11-18N71-54-34E
Silt 77 Harichan 34-21-44N71-47-54E
Silt
38 mandarokalle
34-11-38N71-54-30E
Silt loam 78 Dahra kale 34-17-48N71-46-17E
Silt loam
39 Dargai hafizabad
34-10-52N71-52-36E
Silt 79 Rajarh-sharsaddabypass
34-09-20N71-44-36E
Silt loam
40 Dargairailway patak
34-10-16N71-52-26E
Silt loam
Location and soil textural class at the sampling sites for 15-45 cm depth
S.No.
RoadLocation
GPSReading
TexturalClass
S.No.
RoadLocation
GPSReading
TexturalClass
1 Arif abad 34-07-13N71-39-34E
Silt loam 41 Mahmoodabad
34-09-27N71-52-56E
Silt
2 Stationkalla
34-18-24N71-38-04E
Sandyloam
42 Malagi kalle 34-08-48N71-53-20E
Silt
3 Tangibazaar
34-17-37N71-39-20E
Silt loam 43 Patwari kalle 34-08-16N71-53-32E
Silt
4 Tangi 34-17-27N71-39-46E
Silt loam 44 Dusaharakalle
34-08-36N71-54-02E
Silt loam
5 Hoara 34-17-23N71-40-44E
Silt loam 45 Nazo kale 34-08-04N71-52-57E
Silt loam
6 Shoakanokalle
34-17-26N71-41-28E
Loam 46 Aziz abad 34-07-47N71-52-06E
Silt
7 Karhi wal 34-17-20N71-41-35E
Loam 47 Ahmad khankalle
34-07-34N71-51-24E
Silt loam
8 Taniwalkalle
34-17-00N71-40-55E
Silt loam 48 Captan kalle 34-07-42N71-51-49E
Silt loam
9 Ummerzai
34-16-44N71-41-24E
Sandyloam
49 Sher bhadarkakke
34-07-12N71-50-18E
Silt loam
10 HagiAwaldinkale
34-16-50N71-41-26E
Sandyloam
50 Nisatta 34-07-30N71-48-03E
Silt loam
11 Saifur kale 34-16-41N71-41-53E
Loam 51 Khan zadakalle
34-07-32N71-46-57E
Silt loam

Khan et al.; IJPSS, Article no. IJPSS.2014.008
308
12 NoorMuhd kale
34-17-05N71-42-05E
Silt loam 52 Policeline 34-08-04N71-46-17E
Silt loam
13 Chachakhan kale
34-17-25N71-42-25E
Silt loam 53 Banda 34-07-58N71-46-43E
Silt loam
14 Mamanodhari
34-17-38N71-42-45E
Silt loam 54 Gulballa 34-07-13N71-39-19E
Silt loam
15 Zarinabad
34-17-56N71-43-10E
Silt loam 55 Sardhariab(Mumtazabad)
34-07-32N71-41-01E
Silt loam
16 Zaim kale 34-17-20N71-42-32E
Silt loam 56 Allahabad 34-08-18N71-41-49E
Silt loam
17 Masalkorona
34-16-49N71-42-15E
Silt loam 57 Shad abadkalle
34-09-18N71-43-05E
Silt loam
18 AslamKhan Kale
34-16-34N71-42-12E
Silt loam 58 Ahmad abad 34-09-51N71-42-58E
Silt loam
19 Sharpaokalle
34-16-17N71-41-54E
Silt loam 59 Ghidharekalle
34-09-44N71-42-44E
Silt loam
20 Maih kale 34-15-55N71-41-46E
Silt loam 60 Sarki kalle 34-10-35N71-42-03E
Silt loam
21 Maih jankale
34-15-37N71-42-37E
Silt loam 61 Ummar abad 34-08-37N71-45-31E
Silt loam
22 Umar zai 34-13-42N71-44-12E
Silt loam 62 Nisatta(tauhidabad)
34-06-48N71-47-53E
Silt loam
23 Torang zai 34-12-22N71-45-21E
Silt loam 63 Nisatta(dagai)
34-06-23N71-48-18E
Silt loam
24 Uttamanzai
34-10-54N71-45-43E
Silt loam 64 Shah pasandkalle
34-05-53N71-48-53E
Silt loam
25 Rajarhkalle
34-10-22N71-44-02E
Silt loam 65 Tarlandi(bahram kale)
34-05-27N71-49-30E
Silt loam
26 Mufftiabad
34-11-04N71-47-24E
Silt loam 66 Nawa kalle 34-04-34N71-50-39E
Silt loam
27 Khan mai 34-11-57N71-48-55E
Silt loam 67 Hishgi (hisarkale)
34-03-55N71-51-24E
Silt loam
28 Azamkhankorona
34-13-02N71-50-36E
Silt loam 68 Guggar abad 34-02-55N71-52-29E
Sandyloam
29 Sadullahkhan kale
34-13-38N71-50-29E
Silt loam 69 Nisatta(schoolkorona)
34-05-47N71-48-43E
Silt loam
30 Behlola 34-14-34N71-50-46E
Silt 70 Nisatta(madnimahalla)
34-06-15N71-48-00E
Silt loam
31 Hafizabadcolony
34-09-20N71-45-52E
Silt loam 71 Ummar zai(qaiam abad)
34-14-35N71-43-54E
Silt loam
32 Pola dhair 34-09-27N71-46-33E
Silt loam 72 Khan ghari 34-15-29N71-44-44E
Silt loam
33 Malkadhair
34-09-49N71-38-35E
Silt loam 73 Qamar abad 34-16-24N71-45-44E
Silt loam
34 Sar dairy 34-10-06N71-50-08E
Silt loam 74 Dakki 34-17-25N71-46-36E
Silt loam
35 Shah 34-10-29N Silt 75 Jahangir abad 34-19-09N Silt
Khan et al.; IJPSS, Article no. IJPSS.2014.008
309
jahanabad
71-51-36E (mandarhi) 71-46-51E
36 Dargai 34-10-47N71-52-50E
Silt 76 Uzbako 33-20-09N71-47-03E
Silt loam
37 Mangakalle
34-11-18N71-54-34E
Silt 77 Harichan 34-21-44N71-47-54E
Silt loam
38 mandarokalle
34-11-38N71-54-30E
Silt loam 78 Dahra kalle 34-17-48N71-46-17E
Silt loam
39 Dargaihafiz abad
34-10-52N71-52-36E
Silt 79 Rajarh-sharsaddabypass
34-09-20N71-44-36E
Silt loam
40 Dargairailwaypatak
34-10-16N71-52-26E
Silt loam
The readings taken by GPS in degrees and minutes were changed to meters and kilometersusing Arc view GIS3.2 version. The far most western edge of Charsadda was taken as zeropoint on X-axis, and the extreme southern end of the district map as zero on Y-axis. Graphiclines were drawn at regular intervals on the maps. Points were made on the map sheetsfrom where the samples were collected and then x and y coordinates were noted from themap of the district for further analysis. Geostatistical technique of semivariogram analysis[7,21,40]. was used to determine spatial structure of various soil properties. Soil test valuesat unsampled locations were interpolated using geostatistical technique of punctual kriging[21] and detailed isarithmic maps were prepared at smaller gird spacing using Surfer 6.04.
Geostatistical analysis of semivariogram and kriging of the collected data on various soilproperties was done using the Geo-Eas (US EPA). In case of punctual kriging the searchneighborhood was 10 km radius. In this study, the linear and spherical models were the bestfit using r2-values as a criterion to the data on different soil physical and chemical properties.Tentatively, a model with r2 < 0.20 was classified as poor, r2 of 0.20 to 0.50 as moderateand r2 >0.50 as strong spatial structure.
3. RESULTS AND DISCUSSION
3.1 Variability in Soil Properties
Considerable soil variation in various physical and chemical properties was observed. Incase of soil physical properties, variation in sand content was higher in both the depths (41.4and 44.1 %, respectively) than the other variables, while the lowest was observed forsaturation percentage (Table 2). In case of soil chemical properties, pH had the lowestcoefficient of variation (CV) in both the depths (4.80 and 6.30 %, respectively); while SARwas found with the highest CV in both the depths (Table 3). As regards plant nutrients,available P had the highest CV in both the depths (83.8 and 95.6 %, respectively) as againstthe lowest CV (46.9 %) for available K (Table 4) in the surface and available Zn (50.5 %) inthe subsoil. It seems that there was a considerable magnitude of variation in various soilphysical and chemical properties, and there is need to identify the spatial patterns in thedistribution of these properties.

Khan et al.; IJPSS, Article no. IJPSS.2014.008
310
Table 2. Descriptive statistics of soil physical properties (N = 79)
Property Mean Minimum Maximum CV (%)(0-15 cm depth)
Sand (%) 22.9 12.0 60.0 41.4Silt (%) 67.3 36.0 81.0 15.3Clay (%) 97.4 7.00 21.0 33.4Saturation (%) 22.7 22.0 34.0 14.3
(15-45 cm depth)Sand (%) 23.7 12.0 60.0 44.1Silt (%) 68.7 35.0 82.0 16.4Clay (%) 7.89 5.00 20.0 33.1Saturation (%) 20.8 18.0 33.0 12.5
Table 3. Descriptive statistics of soil chemical properties (N = 79)
Property Mean Minimum Maximum CV (%)(0-15 cm depth)
pH 8.09 7.11 9.05 4.80ECe (dS m-1) 9.42 3.10 22.7 63.6Lime (%) 7.5 0.63 21.4 53.3Organic matter (%) 1.37 0.40 4.23 55.2SAR (meq L-1)1/2 0.71 0.09 6.58 149
(15-45 cm depth)pH 8.41 7.25 10.1 6.30ECe (dS m-1) 6.82 1.80 25.5 56.8Lime (%) 7.93 1.00 21.8 56.5Organic matter (%) 1.05 0.15 2.58 58.8SAR (meq L-1)1/2 0.93 0.04 18.5 273
Table 4. Descriptive statistics of extractable plant nutrients (N = 79)
Property Mean Minimum Maximum CV(%)
% SamplesDeficient MarginalAdequate
mg kg-1 (0-15 cm depth)Mineral N 32.9 6.69 91.0 52.4 100 - -AB-DTPA ext. P 5.90 0.07 24.5 83.8 44 25 31AB-DTPA ext. K 212 84.0 510 46.9 - 17 83AB-DTPAext. Zn 12.7 4.65 44.0 53.4 - - 100AB-DTPA ext. Fe 0.47 0.05 1.77 66.2 92 - 8AB-DTPA ext. Cu 3.60 0.01 7.48 50.5 5 4 91AB-DTPA ext.Mn 4.45 0.24 10.5 47.4 8 - 92Dil. HCl ext. B 0.65 0.03 3.34 83.6 41 39 20
(15-45 cm depth)Mineral N 28.3 2.87 60.3 54.0 47 33 20AB-DTPA ext. P 3.79 0.48 18.8 95.6 72 14 14AB-DTPA ext. K 189 56.0 640 61.3 2 26 72AB-DTPA ext. Zn 10.7 3.84 35.3 50.5 - 3 97AB-DTPA ext. Fe 0.35 0.06 1.28 70.6 96 4 -AB-DTPA ext. Cu 2.73 0.02 6.72 60.1 6 4 0AB-DTPAext.Mn 4.28 0.50 12.7 51.1 9 - 91Dil. HCl ext. B 0.61 0.03 2.56 76.4 46 39 15

Khan et al.; IJPSS, Article no. IJPSS.2014.008
311
3.2 Spatial Variability of Soil Properties
3.2.1 Soil physical properties
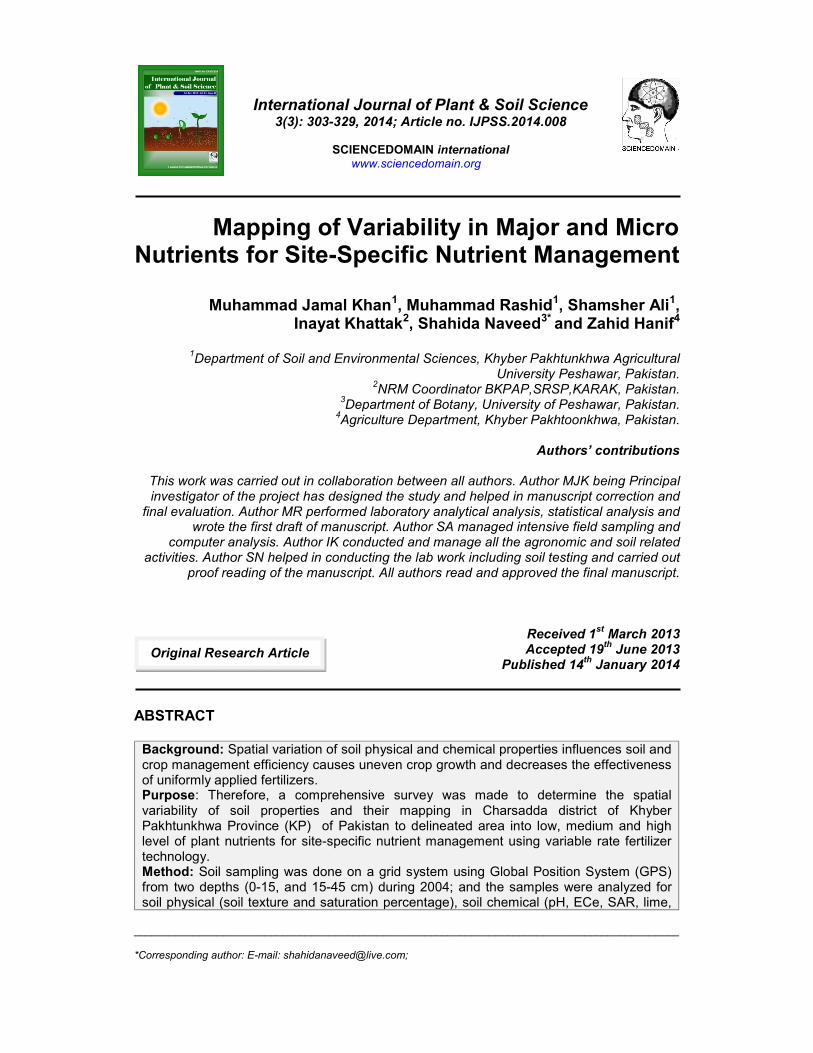
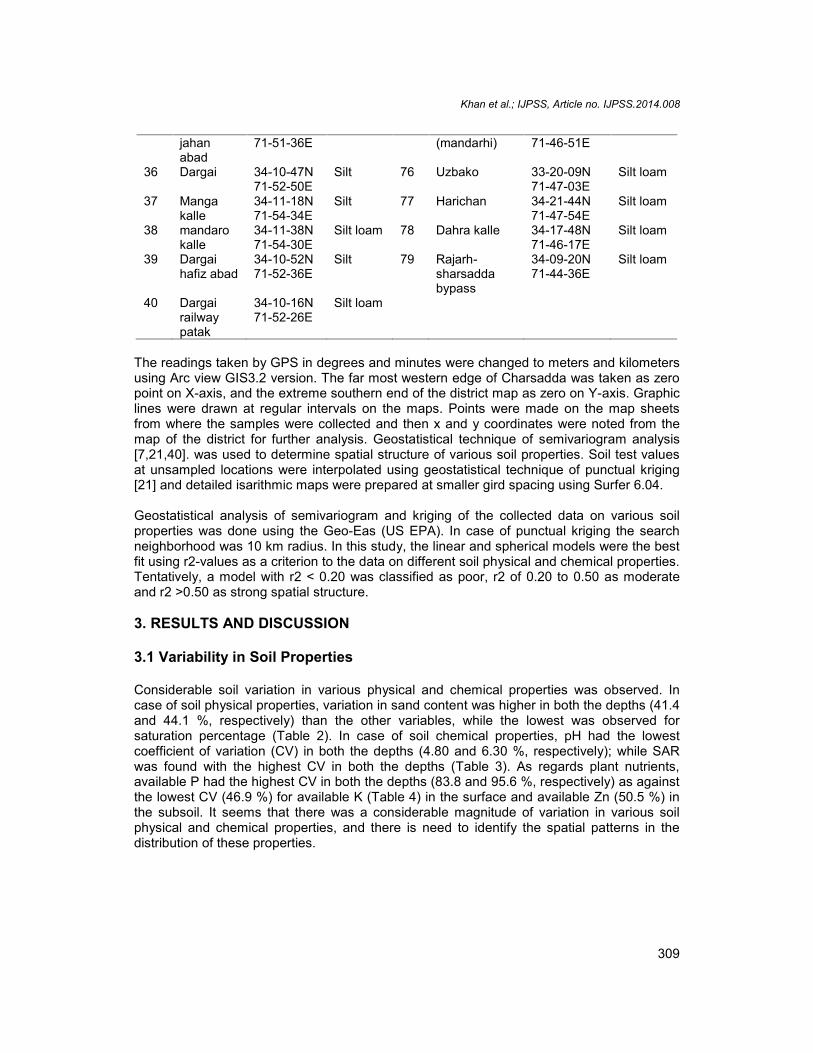
Semivariogram analysis of some of the soil physical properties (Table 5) showed that thephysical parameters viz. sand, silt, clay content and saturation percentage showed somespatial patterns in the surface as well as in subsoil; and they were described by linearmodels for all these soil parameters (Figs. 1 - 3) except for sand content in both the depthsand silt in subsoil. The r2-value for these models ranged from 0.44 to 0.71 being highest forsurface soil clay content. It shows that spatial structure exists for these soil properties,except for sand in both the depths and silt in subsoil, which may be due to the parentmaterial spatial distribution.
Table 5. Parameters of semivariogram models for soil physical properties inCharsadda District
Property Nugget Slope r2 Model(0-15 cm depth)
Sand (%) 91.1 -0.106 0.001 LinearSilt (%) 63.9 2.587 0.48 LinearClay (%) 5.51 0.450 0.71 LinearSaturation % 5.50 0.451 0.70 Linear
(15-45 cm depth)Sand (%) 91.0 -0.106 0.001 LinearSilt (%) 98.1 0.871 0.06 LinearClay (%) 3.71 0.234 0.44 LinearSaturation % 3.71 0.234 0.44 Linear
3.3 Soil Chemical Properties
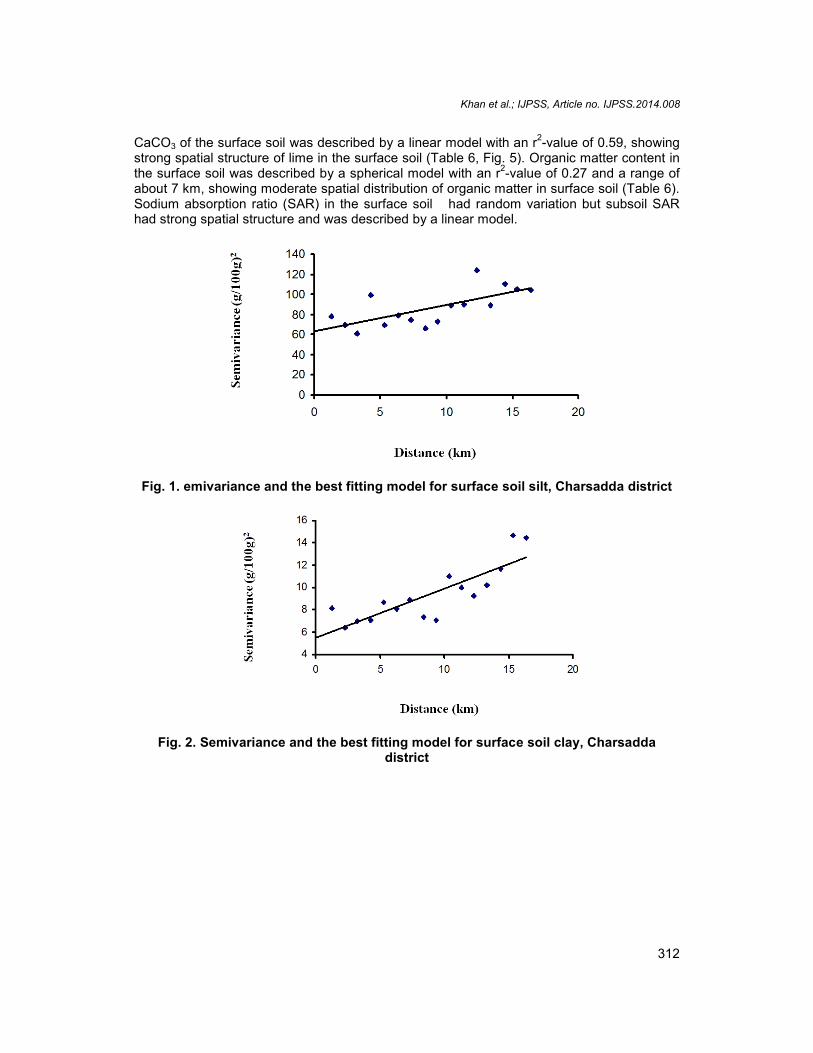
Semivariogram analysis of the data on some soil chemical properties (Table 6) showed thatsoil pH had random variation in surface soil, while in subsoil it was described by a linearmodel with r2-value of 0.49, showing moderate spatial structure. Electrical conductivity(ECe) in the surface and subsurface soil were described by a linear model with strong spatialstructure in the surface soil (Table 6, Fig. 4).
Table 6. Parameters of semivariogram models for soil chemical properties
Property Nugget Slope Sill Range(km)
r2 Model
(0-15 cm depth)pH 0.164 -0.002 - - 0.17 LinearECe (dS m-1) 21.10 1.655 0.81 LinearLime (%) 12.06 0.399 - - 0.59 LinearOrganic matter (%) 0.433 - 0.601 6.65 0.27 SphericalSAR (meq L-1)1/2 1.482 -0.04 - - 0.30 Linear
(15-45 cm depth)pH 0.207 0.0091 - - 0.49 LinearECe (dS m-1) 15.49 0.097 - - 0.03 LinearLime (%) 18.64 -0.035 - - 0.06 LinearOrganic matter (%) 0.318 0.0073 - - 0.41 LinearSAR (meq L-1)1/2 1.954 0.8419 - - 0.69 Linear
Khan et al.; IJPSS, Article no. IJPSS.2014.008
312
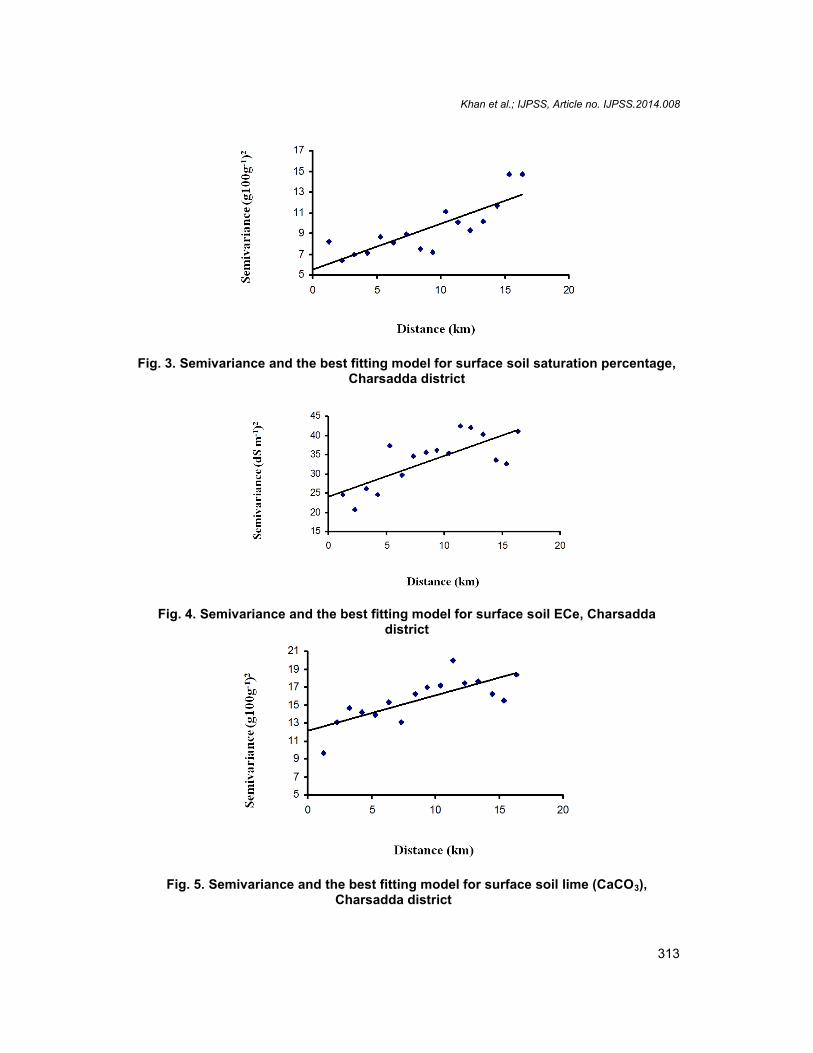
CaCO3 of the surface soil was described by a linear model with an r2-value of 0.59, showingstrong spatial structure of lime in the surface soil (Table 6, Fig. 5). Organic matter content inthe surface soil was described by a spherical model with an r2-value of 0.27 and a range ofabout 7 km, showing moderate spatial distribution of organic matter in surface soil (Table 6).Sodium absorption ratio (SAR) in the surface soil had random variation but subsoil SARhad strong spatial structure and was described by a linear model.
Fig. 1. emivariance and the best fitting model for surface soil silt, Charsadda district
Fig. 2. Semivariance and the best fitting model for surface soil clay, Charsaddadistrict
Khan et al.; IJPSS, Article no. IJPSS.2014.008
313
Fig. 3. Semivariance and the best fitting model for surface soil saturation percentage,Charsadda district
Fig. 4. Semivariance and the best fitting model for surface soil ECe, Charsaddadistrict
Fig. 5. Semivariance and the best fitting model for surface soil lime (CaCO3),Charsadda district

Khan et al.; IJPSS, Article no. IJPSS.2014.008
314
3.4 Soil Fertility Status
Semivariogram analysis of the data on plant nutrients in the soils of Charsadda district(Table 7) showed that mineral nitrogen content of surface soil was described by a linearmodel with an r2-value of 0.36 (Table 7, Fig. 6), showing moderate spatial structure. Thedata on extractable phosphorus content of the surface as will as subsoil were described by alinear model with a high r2-value showing a strong spatial distribution of P (Table 7, Fig. 7).
Table 7. Parameters of semivariogram models for plant nutrients
Propertymg kg-1
Nugget Slope Sill Range(km)
R2 Model
(0-15cm depth)N 245.8 4.795 - - 0.36 LinearP 18.13 0.382 - - 0.77 LinearK 8323 208.3 - - 0.24 LinearZn 48.66 -0.1792 - - 0.009 LinearFe 0.1088 -0.0005 - - 0.02 LinearCu 3.071 0.0215 - - 0.13 LinearMn 4.685 -0.0288 - - 0.08 LinearB 0.145 0.014 - - 0.61 Linear(15-45cm depth)N 226.5 0.553 - - 0.009 LinearP 7.834 0.642 - - 0.73 LinearK 6999 - 14925 9.084 0.64 SphericalZn 19.49 0.927 - - 0.63 LinearFe 0.047 - 0.062 5.011 0.16 SphericalCu 1.967 0.067 - - 0.54 LinearMn 1.997 - 4.876 3.966 0. 34 SphericalB 0.154 0.0058 - - 0.30 Linear
Available potash content of surface soil was described by a linear model having moderatespatial distribution of K (Table 7). In case of subsoil, available K was described by aspherical model with a high r2-value and range of influence of about 9.0 km showing strongspatial variability. Zinc content had random variation in surface soil, while subsoil had stronglinear spatial distribution. Copper content of both the depths were described by linear models(Table 7) with poor structure in the surface soil and strong spatial structure in subsoil.Extractable manganese content in subsoil was described by a spherical model (Table 7) withthe range of influence of about 4 km though the spatial structure was moderate. The data onboron content was described by linear models in both the depths (Table 7). In surface soil, Bhad high r2- value of 0.63, indicating a strong spatial distribution (Fig. 8). In subsoil, B hasmoderate spatial structure with an r2 value of 0.30.

Khan et al.; IJPSS, Article no. IJPSS.2014.008
315
Distance (km)
Fig. 6. Semivariance and the best fitting model for surface soil mineral-N, Charsaddadistrict
Distance (km)
Fig. 7. Semivariance and the best fitting model for surface soil phosphorus,Charsadda district
150
200
250
300
350
400
0 5 10 15 20
15
17
19
21
23
25
27
0 5 10 15
Sem
ivar
ianc
e (m
g kg
-1)2
Sem
ivar
ianc
e (m
g kg
-1)2

Khan et al.; IJPSS, Article no. IJPSS.2014.008
316
Fig. 8. Semivariance and the best fitting model for surface soil B, Charsadda district.
3.5 Interpolation and Mapping of Soil Properties
3.5.1 Physical soil properties
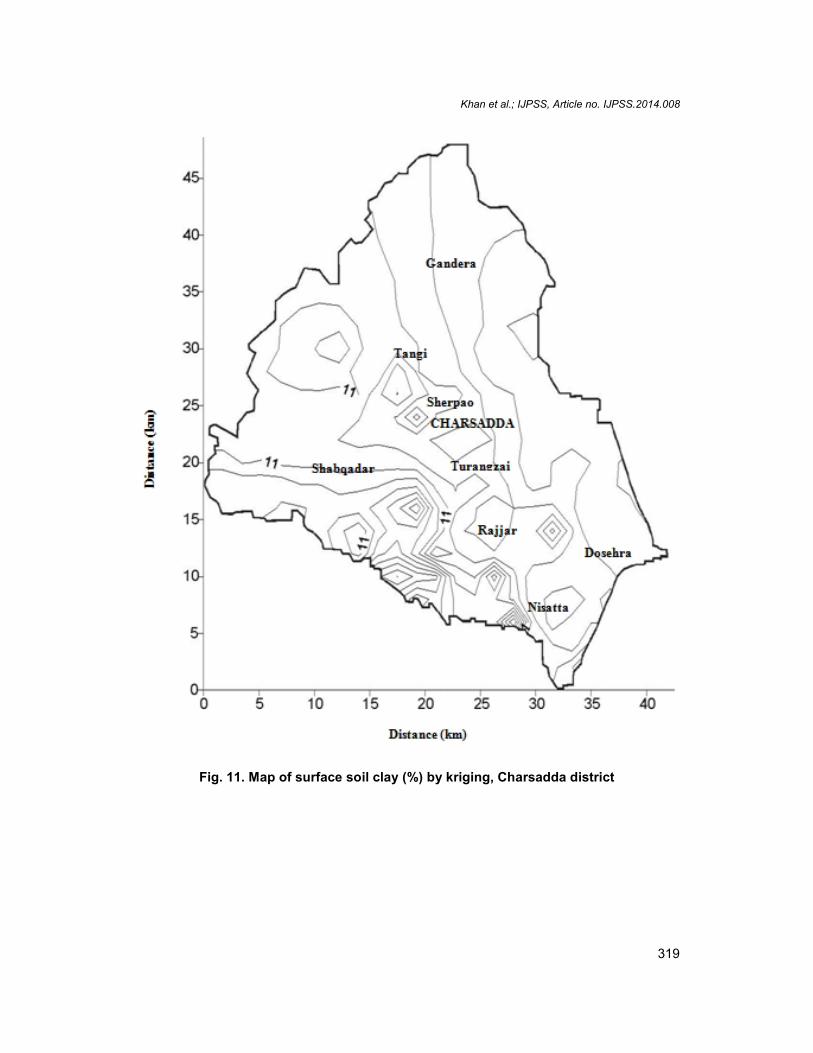
Map of sand content of the surface soils of Charsadda district (Fig. 9) shows some spatialpatterns. The soils in the east are higher in sand content ( 40 %), rest of the area ismedium in sand content (20-40 %). Silt content of the surface soils (Fig. 10) of the districtwas higher in the whole of the area ( 40 %). Clay content of the surface soils (Fig. 11) islow ( 30 %) in the whole area. Very weak variation is observed in clay content in thesurface soil of the district.
3.5.2 Soil chemical properties
Map of pH of the surface soils (Fig. 12) showed that there was no considerable variation inthe pH value of different parts of Charsadda district. However, the pH was alkaline ( 7.5).Map of CaCO3 content of surface soils of Charsadda district (Fig. 13) shows that the soilsare moderately calcareous (3-13%) in the whole area. Map of organic matter content of thesurface soils (Fig. 14) shows that it is low in the north-west ( 1%) and medium in rest of thedistrict (1-2%).
3.6 Soil Fertility
Available nitrogen content of the surface soil (Fig. 15) shows that the whole district is low( 140 mg kg-1) in available N. Available phosphorus content of the surface soils (Fig. 16)shows that there are strong spatial patterns. Available phosphorus is deficient ( 4.0 mg kg-1) in the west and marginal (4.0-7.0 mg kg-1) in southern and central part, while rest of areais adequate (7.0 mg kg-1) in available P. Available boron content of the surface soils (Fig.17) shows some spatial patterns. It is adequate ( 1.0 mg kg-1) in some parts of east- south,while rest of the area is marginal (0.45-1.0 mg kg-1) in available boron.

Khan et al.; IJPSS, Article no. IJPSS.2014.008
317
Fig. 9. Map of surface sand (%) by kriging, Charsadda district

Khan et al.; IJPSS, Article no. IJPSS.2014.008
318
Fig. 10. Map of surface silt (%) by kriging, Charsadda district
Khan et al.; IJPSS, Article no. IJPSS.2014.008
319
Fig. 11. Map of surface soil clay (%) by kriging, Charsadda district

Khan et al.; IJPSS, Article no. IJPSS.2014.008
320
Fig. 12. Map of surface soil pH by kriging, Charsadda district

Khan et al.; IJPSS, Article no. IJPSS.2014.008
321
Fig. 13. Map of CaCO3 in surface soil (%) by kriging, Charsadda district

Khan et al.; IJPSS, Article no. IJPSS.2014.008
322
Fig. 14. Map of surface soil organic matter (%) by kriging, Charsadda district

Khan et al.; IJPSS, Article no. IJPSS.2014.008
323
Fig. 15. Map of surface soil mineral N (mg kg-1) by kriging, Charsadda district

Khan et al.; IJPSS, Article no. IJPSS.2014.008
324
Fig. 16. Map of surface soil extractable P (mg kg-1) by kriging, Charsadda district

Khan et al.; IJPSS, Article no. IJPSS.2014.008
325
Fig. 17. Map of surface soil extractable B (mg kg-1) by kriging, Charsadda district.
Spatial variability of various soil properties in the study area was evident as indicated by thesemivariogram models. Spatial dependence of soil properties can be attributed to extrinsicas well as inherent factors [1,7,15,27].
Maps of various soil properties especially soil fertility showed spatial patterns in theirdistribution. These maps will be useful in delineating the area into low, medium and highnutrients contents and managed accordingly. Such regional variability is determined usinggeostatistical technique of semivariogram analysis and kriging, which has been successfullyused by different workers at field level [7,11,17,18] or at larger unit such as district level[5,41] for the site-specific management of soil fertility. These techniques have also beenused to prepare contour maps of soil properties [28,41,42,43,44,45] and the use of

Khan et al.; IJPSS, Article no. IJPSS.2014.008
326
geostatistics and elaboration of contour maps of heavy metals proved useful to identifyhotspots of contamination for remediation purposes[28].
4. CONCLUSIONS
Soil texture of Charsadda district ranged from silt to sandy loam. Sand content in the eastand silt in the whole area was higher, while clay was found low throughout the soil surveyed.All the soils were alkaline in reaction and calcareous in nature to different degrees asindicated in maps of surface soil pH and CaCO3. Salinity problem was found in most of thesoils surveyed. SAR of soils at both the depths was normal and no sodium hazard was foundin the soils studied. Organic matter content of both the depths was low. Total mineral N ofsurface soils was deficient in all soils of district Charsadda, while in subsoil it was deficient tomoderate level in different soils. Deficiencies of P, Zn and B were observed to a greaterextent, while those of K, Cu and Mn are also appearing. Silt, clay content, saturationpercentage, soil pH, ECe, organic matter and SAR, lime, N, P, K, Fe, Mn, Cu and B either inthe surface soil, subsoil or both have spatial patterns. Maps of various soil propertiesshowed variation in different areas and can be managed accordingly. Currently, a blanketrecommendation is made for the whole district. Whole area can be divided into differentcategories on the basis of each plant nutrient as shown in the maps. Variable rate fertilizermanagement strategy can be developed for different zones, which will increase theefficiency of fertilizers; and this will avoid over or under-fertilization and will be economical,and environmentally safe.
ACKNOWLEDGEMENT
The authors are thankful to Higher Education Commission, Islamabad, Pakistan for financialsupport to carry out the research project.
COMPETING INTERESTS
Authors have declared that no competing interests exist.
REFERENCES
1. Van Es HM, Van Es CL, Cassel DK. Application of regionalized variable theory tolarge-plot field experiments. Soil Sci. Soc. Am. J. 1989;53:1178–1183.
2. Bhatti AU, Mulla DJ, Frazier BE. Estimation of soil properties and wheat yields oncomplex eroded hills using geostatistics and thematic mapper images. Remote Sens.Environ. 1991;37:181-191.
3. Fagroud M, Meirvenne MV, Accounting for soil spatial autocorrelation in the design ofexperimental trials. Soil Sci Soc Am J. 2002;66:1134–1142.
4. Bhatti AU, Rashid M. Shape and size of plots in field experiments and spatialvariability. Sarhad J. Agric. 2005;21(2):33-41.
5. Mulla DJ, Bhatti AU, Kunkel R. Methods for removing spatial variability from fieldresearch trials. Adv. in Soil Sci. 1990;13:201-213.
6. Bhatti AU, Mulla DJ. Spatial variability of soil properties and wheat yields on complexhills and their fertility management. J. Ind. Soc. Soil Sci. 1995;43(1):53-58.
Khan et al.; IJPSS, Article no. IJPSS.2014.008
327
7. Bhatti AU, Bakhsh A, Afzal M, Gurmani AH. Mapping of major plant nutrients and cropproductivity using geostatistical techniques for fertilizer management. Pak. J. Soil Sci.1999;16:129-136.
8. Mzuku M, Khosla R, Reich R, Inman D, Smith F, MacDonald L. Spatial Variability ofMeasured Soil Properties across Site-Specific Management Zones. Soil Sci. Soc. Am.J. 2005;69:1572-1579.
9. Bhatti AU, Bakhsh A. Management strategy of using gypsum for reclamation of saltaffected soils. J. Ind. Soc. Soil Sci. 1995;43(4):657-659.
10. Bhatti A U, Ali, Khan RF, khan MJ. Comparison of wheat yield under uniform andvariable rates of fertilizer on spatially eroded land. Commun. Soil Sci. Plant Anal.1998a;29:2855-2864.
11. Bhatti AU, Khan M, Khurshid KS, Farmanullah. Site-specific determination of N ratesfor irrigated wheat based on soil properties. In: Proceedings of Symposium on NutrientManagement for Sustainable Agricultural Growth at NFDC Islamabad, 1998b. Dec. 8-9;1997:131-137.
12. Wendroth OP, JuÈrschikb, Kersebaumc KC, Reutera H, Kesseld CV, Nielsene DR.Identifying, understanding, and describing spatial processes in agriculturallandscapes. Soil & Till. Res. 2001;58:113-127.
13. Wasiullah, Bhatti AU, Khan F, Akmal M. Spatial variability and geo-statisticsapplication for mapping of soil properties and nutrients in semi arid district Kohat ofKhyber Pakhtunkhwa (Pakistan). Soil & Environ. 2010;29(2):159-166.
14. Adhikari, Paradip, Shukla, Kumar M, Mexal, John G. Spatial variability of soilproperties in an arid ecosystem irrigated with treated municipal and industrialwastewater. Soil Sci. 2012;177(7):458-469.
15. Vieira SR, Nielsen DR, Biggar JW. Spatial variability of field-measured infiltration rate.Soil Sci. Soc. Am. J. 1981;45:1040–1048.
16. Trangmar BB, Yost RS, Wade MK, Uehara G, Sudjadi M. Spatial variation of soilproperties and rice yield in recently cleared land. SSSAJ. 1987;51:668–674.
17. Zuo X, Zhao H, Zhao X, Zhang T, Guo Y, Wang S, Drake S. Spatial pattern andheterogeneity of soil properties of soil properties in sand dunes under grazing andrestoration in Horgin Sandy Land, Northern China. Soil & Till. Res. 2008;99(2):202-212.
18. Strudley MW, Green TR. Ascough II JC. Tillage effects on soil hydraulic properties inspace and time: State of the science. Soil & Till. Res. 2008;99(1):4-48.
19. David M. Geostatistics area reserve estimation. Elsevier Sci. Publ., Amsterdam; 1977.20. Hajrasuliha S, Baniabbassi N, Metthey J, Nielsen DR. Spatial variability of soil
sampling for salinity studies in southwest Iran. Irrig Sci. 1980;1:197–208.21. Trangmar BB, Yost RS, Uehara G. Application of geo- statistics to spatial studies of
soil properties. Adv. Agron. 1985;38:45–93.22. Boruvka L, Donátová H Nemecek K. Spatial distribution and correlation of soil
properties in a field: a case study. Rostl. Výr. 2002;48:425-432.23. Anuar AR, Goh KJ, Heoh TB, Ahmed OH. Spatial variability of soil inorganic N in a
mature oil palm plantation in Sabah, Malaysia. Am. J. App. Sci. 2008;5:1239-1246.24. Amado TJC, Pes LZ, Lemainski CL, Schenato RB. Chemical and physical attributes of
oxisols and their relation with irrigated corn and common bean yields. RevistaBrasileira de Ciência do Solo. 2009;33:831-843.

Khan et al.; IJPSS, Article no. IJPSS.2014.008
328
25. Afshar FA, Ayoubi S, Jalalian A. Soil redistribution rate and its relationship with soilorganic carbon and total nitrogen using 137Cs technique in a cultivated complexhillslope in western Iran. J. Environ.Radioactivity. 2010;101:606-614.
26. Andronikov SV, Davidson DA, Spiers RB. Variability in contamination by heavy metals:sampling implications. Water, Air, and Soil Pollution. 2000;120:29-45.
27. Navas A, Machin J. Spatial distribution of heavy metals and arsenic in soils of Aragon(northeast Spain): Controlling factors and environmental implications. Appl. Geochem.2002;17:961–973.
28. Burgos P, Medejon E, Perez-de-Mora A, Cabrera F. Spatial variability of chemicalcharacteristics of a trace-elements-contaminated soil before and after remediation.Geoderma. 2006;130:157-175.
29. Kabala C, Bojko O, Madynyska A, Szczepaniak A. Spatial variability and temporalchanges in the heavy metal content of soils with a deep furrow-and-ridge microreliefformed by an afforestation plowing. Environ Monit Assess. 2012;185(6):5141–5150.
30. Sadler EJ, Evans RG, Stone KC, Camp CR. Opportunities for conservation withprecision irrigation. J. Soil Water Conserv. 2005;60(6):371–379.
31. Webster R, Oliver MA. Statistical methods in soil and land resource survey. OxfordUniversity Press; 1990.
32. Gee GW, Bauder JW. Particle size analysis. In: A. Klute, A. (ed.) Methods of SoilAnalysis. Part 1. Physical and Minerological Methods. 2nd Edition. Agron. Monogram.9.ASA and SSSA, Madison, WI. 1986;383-411.
33. Richards LA. Diagnosis and Improvement of Saline and Alkali Soils. Agri. HandbookNo.60. U.S.A. Washington, D.C. 1954;102-129.
34. Mclean EO. Soil pH and lime requirement. In: Page AL, Miller RH, Keeney DR. (eds.),Methods of Soil Analysis. Part 2. Agron. 9. ASA. Madison, WI. pp. 209-223; 1982.
35. Nelson D W, Sommers LE. Total carbon, organic carbon and organic matter. In: A.L.Page, R.H. Miller, and D.R. Keeney (eds.). Methods of Soil Analysis. Part 2.Agronomy 9. Amer. Soc. of Agron, Madison, WI. 1982;539-577.
36. Nelson RE. Carbonate and gypsum. In: A.L. Page, Miller RH, Keeney DR, (eds.).Methods of Soil Analysis. Part 2. Agron.9. ASA, Madison, WI. 1982;181-198.
37. Keeney DR, Nelson DW. Nirogen-Inorganic forms. pp.643-693. In: Page AL, MillerRH, Keeney DR. (eds.), Methods of Soil Analysis. Part 2. Agron. 9. ASA. Madison, WI.1982;643-698.
38. Soltanpour PN. Use of AB-DTPA soil test to evaluate elemental availability andtoxicity. Commun. Soil Sci. Plant Anal. 1985;16:323-338.
39. Ryan J, Estefan G, Rashid A. Soil and plant analysis laboratory manual. Jointlypublished by Int. Center Agric. Res. In Dry Areas (ICARDA), Aleppo, Syria andNational Agric. Res. Center (NARC) Islamabad, Pakistan; 2001.
40. Journal AG, Huijbregts CH. Mining Geostatistics. Acadmics Prss, New York; 1978.41. Rafique E, Rashid A, Ryan J, Bhatti AU. Zinc deficiency in rainfed wheat in Pakistan:
Magnitude, spatial variability, management, and plant analysis diagnostic norms.Commun. Soil Sci. & Plant Anal. 2006;37:181-197.
42. Lark RM, Bellamy PH, Rawlins BG. Spatio-temporal variability of some metalconcentrations in the soil of eastern England, and implications for soil monitoring.Geoderma. 2006;133:363–379.
43. Liu D, Wang Z, Zhang B, Song K, Li X, Li J, Li F, Duan H. Spatial distribution of soilorganic carbon and analysis of related factors in croplands of the black soil regionNortheast China. Agric. Ecosyst. Environ. 2006;113:73-81.

Khan et al.; IJPSS, Article no. IJPSS.2014.008
329
44. Bai Y, Wang Y. Spatial variability of soil chemical properties in a Jujube Slope on theLoess Plateau of China. Soil Sci. 2011;176:550-558.
45. Sharma P, Shulka MK, Mexal JG. Spatial variability of soil properties in agriculturalfields of South New Mexico. Soil Sci. 2011;176:288-302.
_________________________________________________________________________© 2014 Khan et al.; This is an Open Access article distributed under the terms of the Creative Commons AttributionLicense (http://creativecommons.org/licenses/by/3.0), which permits unrestricted use, distribution, and reproductionin any medium, provided the original work is properly cited.
Peer-review history:The peer review history for this paper can be accessed here:
http://www.sciencedomain.org/review-history.php?iid= 387&id=24&aid=3341
Related Documents