1. Total Literacy Rate 2. Male Literacy Rate 3. Female Literacy Rate 4. Adult Literacy Rate 5. Male Adult Literacy Rate 6. Female Adult Literacy Rate 7. Ratio of Literate Female to Males of Prime Age 8. Literacy with Different Completed Levels of Education 9. Distribution of Schools 10. Total Number of Schools per Thousand Population 11. Number of Primary Schools per Thousand Population 12. Number of Lower Secondary Schools per Thousand Population 13. Number of Secondary Schools per Thousand Population 14. Total Enrollment in Schools 15. Total Enrollment in Primary Schools 16. Total Enrollment in Lower Secondary Schools 17. Total Enrollment in Secondary Schools 18. Teacher-School Ratio 19. Teacher-School Ratio at Primary Level 20. Teacher-School Ratio at Lower Secondary Level 21. Teacher-School Ratio at Secondary Level 22. Student-Teacher Ratio (All Schools) 23. Student-Teacher Ratio at Primary Level 24. Student-Teacher Ratio at Lower Secondary Level 25. Student-Teacher Ratio at Secondary Level 26. Disadvantaged Castes Students at Primary Level 27. Girl’s Enrollment at All Levels of School 28. Girl’s Enrollment at Primary Level

Welcome message from author
This document is posted to help you gain knowledge. Please leave a comment to let me know what you think about it! Share it to your friends and learn new things together.
Transcript
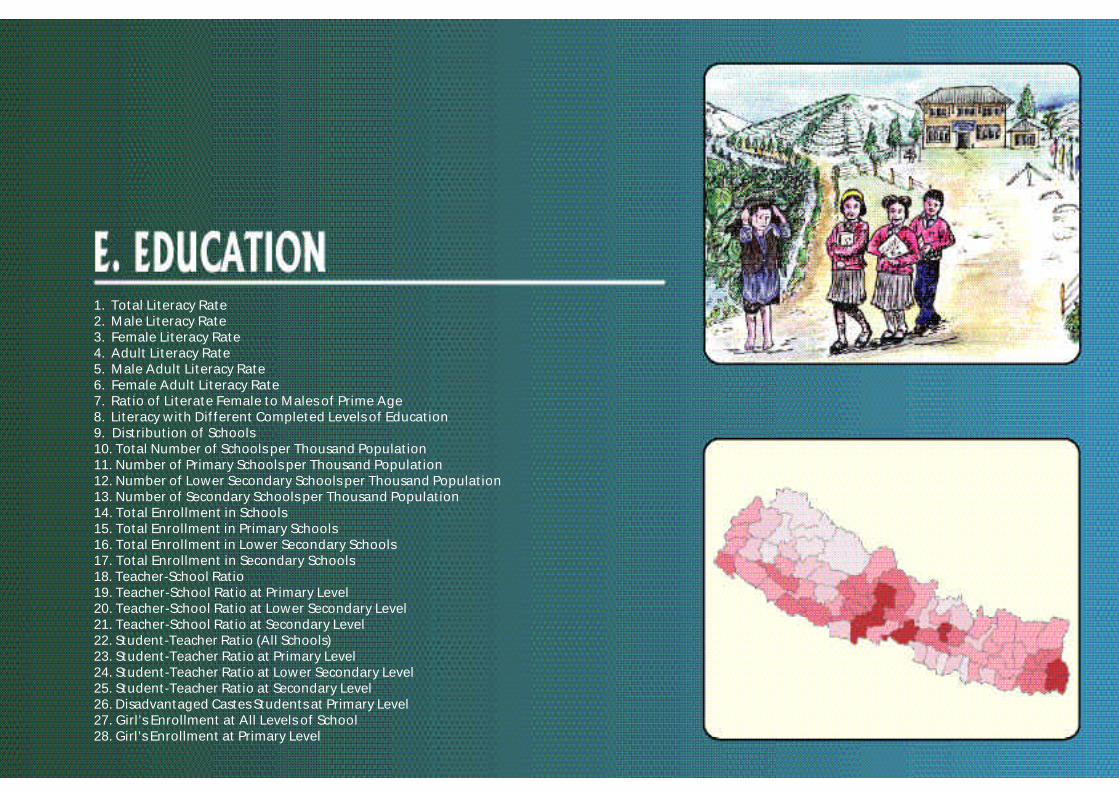
1. Total Literacy Rate2. Male Literacy Rate3. Female Literacy Rate4. Adult Literacy Rate5. Male Adult Literacy Rate6. Female Adult Literacy Rate7. Ratio of Literate Female to Males of Prime Age8. Literacy with Different Completed Levels of Education9. Distribution of Schools10. Total Number of Schools per Thousand Population11. Number of Primary Schools per Thousand Population12. Number of Lower Secondary Schools per Thousand Population13. Number of Secondary Schools per Thousand Population14. Total Enrollment in Schools15. Total Enrollment in Primary Schools16. Total Enrollment in Lower Secondary Schools17. Total Enrollment in Secondary Schools18. Teacher-School Ratio19. Teacher-School Ratio at Primary Level20. Teacher-School Ratio at Lower Secondary Level21. Teacher-School Ratio at Secondary Level22. Student-Teacher Ratio (All Schools)23. Student-Teacher Ratio at Primary Level24. Student-Teacher Ratio at Lower Secondary Level25. Student-Teacher Ratio at Secondary Level26. Disadvantaged Castes Students at Primary Level27. Girl’s Enrollment at All Levels of School28. Girl’s Enrollment at Primary Level
Mapping Nepal Census Indicators 2001 and Trends132
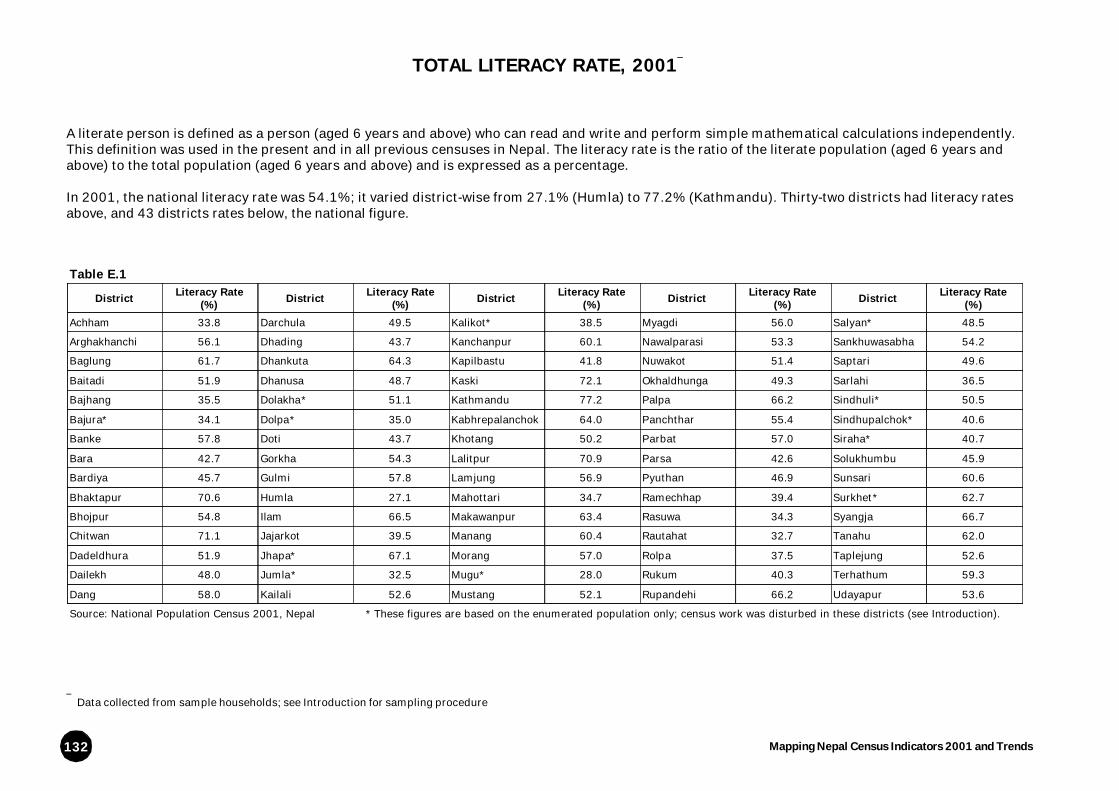
TOTAL LITERACY RATE, 2001⊕
A literate person is defined as a person (aged 6 years and above) who can read and write and perform simple mathematical calculations independently.This definition was used in the present and in all previous censuses in Nepal. The literacy rate is the ratio of the literate population (aged 6 years andabove) to the total population (aged 6 years and above) and is expressed as a percentage.
In 2001, the national literacy rate was 54.1%; it varied district-wise from 27.1% (Humla) to 77.2% (Kathmandu). Thirty-two districts had literacy ratesabove, and 43 districts rates below, the national figure.
Table E.1
District Literacy Rate (%) District Literacy Rate
(%) District Literacy Rate (%) District Literacy Rate
(%) District Literacy Rate (%)
Achham 33.8 Darchula 49.5 Kalikot* 38.5 Myagdi 56.0 Salyan* 48.5
Arghakhanchi 56.1 Dhading 43.7 Kanchanpur 60.1 Nawalparasi 53.3 Sankhuwasabha 54.2
Baglung 61.7 Dhankuta 64.3 Kapilbastu 41.8 Nuwakot 51.4 Saptari 49.6
Baitadi 51.9 Dhanusa 48.7 Kaski 72.1 Okhaldhunga 49.3 Sarlahi 36.5
Bajhang 35.5 Dolakha* 51.1 Kathmandu 77.2 Palpa 66.2 Sindhuli* 50.5
Bajura* 34.1 Dolpa* 35.0 Kabhrepalanchok 64.0 Panchthar 55.4 Sindhupalchok* 40.6
Banke 57.8 Doti 43.7 Khotang 50.2 Parbat 57.0 Siraha* 40.7
Bara 42.7 Gorkha 54.3 Lalitpur 70.9 Parsa 42.6 Solukhumbu 45.9
Bardiya 45.7 Gulmi 57.8 Lamjung 56.9 Pyuthan 46.9 Sunsari 60.6
Bhaktapur 70.6 Humla 27.1 Mahottari 34.7 Ramechhap 39.4 Surkhet* 62.7
Bhojpur 54.8 Ilam 66.5 Makawanpur 63.4 Rasuwa 34.3 Syangja 66.7
Chitwan 71.1 Jajarkot 39.5 Manang 60.4 Rautahat 32.7 Tanahu 62.0
Dadeldhura 51.9 Jhapa* 67.1 Morang 57.0 Rolpa 37.5 Taplejung 52.6
Dailekh 48.0 Jumla* 32.5 Mugu* 28.0 Rukum 40.3 Terhathum 59.3
Dang 58.0 Kailali 52.6 Mustang 52.1 Rupandehi 66.2 Udayapur 53.6
Source: National Population Census 2001, Nepal * These figures are based on the enumerated population only; census work was disturbed in these districts (see Introduction).
⊕ Data collected from sample households; see Introduction for sampling procedure


Mapping Nepal Census Indicators 2001 and Trends134
MALE LITERACY RATE, 2001⊕
The male literacy rate is the ratio of the total literate male population aged 6 years and above to the total male population in the same age group and isexpressed as a percentage. The national male literacy rate was 65.5%; it varied district-wise from 86.5% (Kathmandu) to 41.3% (Humla). Thirty-fourdistricts had male literacy rates above and 41 districts rates below, the national figure.
Table E.2
District Male Literacy Rate (%) District Male Literacy
Rate (%) District Male Literacy Rate (%) District Male Literacy
Rate (%) District Male Literacy Rate (%)
Achham 54.1 Darchula 67.4 Kalikot* 54.2 Myagdi 67.9 Salyan* 60.2
Arghakhanchi 67.2 Dhading 53.9 Kanchanpur 72.8 Nawalparasi 66.0 Sankhuwasabha 63.7
Baglung 73.1 Dhankuta 74.5 Kapilbastu 53.3 Nuwakot 62.4 Saptari 63.2
Baitadi 71.5 Dhanusa 60.1 Kaski 83.2 Okhaldhunga 63.6 Sarlahi 46.9
Bajhang 57.6 Dolakha* 64.0 Kathmandu 86.5 Palpa 76.2 Sindhuli* 62.6
Bajura* 51.2 Dolpa* 49.6 Kabhrepalanchok 75.7 Panchthar 65.7 Sindhupalchok* 51.8
Banke 66.0 Doti 61.2 Khotang 62.3 Parbat 68.2 Siraha* 53.6
Bara 55.2 Gorkha 64.4 Lalitpur 81.0 Parsa 55.5 Solukhumbu 56.7
Bardiya 55.5 Gulmi 70.1 Lamjung 69.0 Pyuthan 62.4 Sunsari 70.9
Bhaktapur 81.1 Humla 41.3 Mahottari 45.9 Ramechhap 53.8 Surkhet* 73.9
Bhojpur 66.1 Ilam 74.4 Makawanpur 72.6 Rasuwa 42.8 Syangja 77.9
Chitwan 79.3 Jajarkot 49.4 Manang 67.3 Rautahat 42.9 Tanahu 72.6
Dadeldhura 72.2 Jhapa* 75.6 Morang 67.1 Rolpa 53.1 Taplejung 62.9
Dailekh 64.7 Jumla* 47.0 Mugu* 45.4 Rukum 51.0 Terhathum 71.3
Dang 69.3 Kailali 64.0 Mustang 61.1 Rupandehi 76.2 Udayapur 64.8
Source: National Population Census 2001, Nepal * These figures are based on the enumerated population only; census work was disturbed in these districts (see Introduction).
⊕ Data collected from sample households; see Introduction for sampling procedure


Mapping Nepal Census Indicators 2001 and Trends136
FEMALE LITERACY RATE, 2001⊕
The female literacy rate is the ratio of the total literate female population aged 6 years and above to the total female population in the same age groupand is expressed as a percentage. The national female literacy rate was 42.8%; it varied district-wise from 9.3% (Mugu) to 66.6% (Kathmandu). Thirty-two districts had female literacy rates above, and 42 districts rates below, the national figure.
Table E.3
District Female Literacy Rate (%) District Female Literacy
Rate (%) District Female Literacy Rate (%) District Female Literacy
Rate (%) District Female Literacy Rate (%)
Achham 16.0 Darchula 32.5 Kalikot* 17.8 Myagdi 45.9 Salyan* 36.2
Arghakhanchi 46.9 Dhading 34.0 Kanchanpur 47.2 Nawalparasi 40.9 Sankhuwasabha 45.1
Baglung 52.3 Dhankuta 54.5 Kapilbastu 29.5 Nuwakot 40.7 Saptari 35.5
Baitadi 33.8 Dhanusa 36.3 Kaski 61.8 Okhaldhunga 36.3 Sarlahi 25.4
Bajhang 15.2 Dolakha* 38.8 Kathmandu 66.6 Palpa 57.8 Sindhuli* 38.5
Bajura* 17.3 Dolpa* 19.8 Kabhrepalanchok 52.8 Panchthar 45.6 Sindhupalchok* 29.5
Banke 49.2 Doti 26.0 Khotang 38.8 Parbat 47.7 Siraha* 27.1
Bara 29.1 Gorkha 45.7 Lalitpur 60.4 Parsa 28.2 Solukhumbu 35.5
Bardiya 35.9 Gulmi 48.1 Lamjung 46.3 Pyuthan 34.0 Sunsari 50.3
Bhaktapur 59.6 Humla 11.8 Mahottari 22.4 Ramechhap 26.6 Surkhet* 51.7
Bhojpur 44.4 Ilam 58.6 Makawanpur 53.9 Rasuwa 24.8 Syangja 57.7
Chitwan 63.0 Jajarkot 29.1 Manang 52.7 Rautahat 21.7 Tanahu 53.0
Dadeldhura 33.3 Jhapa* 58.8 Morang 46.8 Rolpa 23.1 Taplejung 42.8
Dailekh 32.3 Jumla* 16.8 Mugu* 9.3 Rukum 29.0 Terhathum 48.2
Dang 46.9 Kailali 41.0 Mustang 41.1 Rupandehi 55.9 Udayapur 42.5
Source: National Population Census 2001, Nepal * These figures are based on the enumerated population only; census work was disturbed in these districts (see Introduction).
⊕ Data collected from sample households; see Introduction for sampling procedure


Mapping Nepal Census Indicators 2001 and Trends138
ADULT LITERACY RATE, 2001⊕
The adult literacy rate is the basic indicator of the number of adult persons that are literate in the country. It is the ratio of the total literate populationaged 15 years and above to the total population in the same age group and is expressed as a percentage. The national adult literacy rate was 48.6%; itvaried district-wise from 20.1% (Humla) to 73.6% (Kathmandu). Twenty-eight districts had adult literacy rates above, and 47 districts rates below, thenational figure.
Table E.4
District Adult Literacy Rate (%) District Adult Literacy
Rate (%) District Adult Literacy Rate (%) District Adult Literacy
Rate (%) District Adult Literacy Rate (%)
Achham 26.3 Darchula 41.6 Kalikot* 34.0 Myagdi 49.3 Salyan* 40.9
Arghakhanchi 47.9 Dhading 34.5 Kanchanpur 54.2 Nawalparasi 47.2 Sankhuwasabha 48.0
Baglung 55.4 Dhankuta 59.0 Kapilbastu 36.2 Nuwakot 42.8 Saptari 44.5
Baitadi 45.4 Dhanusa 45.2 Kaski 67.1 Okhaldhunga 41.9 Sarlahi 30.7
Bajhang 29.5 Dolakha* 42.8 Kathmandu 73.6 Palpa 61.1 Sindhuli* 42.8
Bajura* 27.6 Dolpa* 29.4 Kabhrepalanchok 56.3 Panchthar 50.1 Sindhupalchok* 31.5
Banke 54.1 Doti 36.8 Khotang 43.4 Parbat 51.4 Siraha* 35.3
Bara 37.0 Gorkha 45.5 Lalitpur 67.1 Parsa 38.1 Solukhumbu 39.1
Bardiya 39.8 Gulmi 50.9 Lamjung 49.5 Pyuthan 38.2 Sunsari 56.5
Bhaktapur 64.3 Humla 20.1 Mahottari 30.5 Ramechhap 31.6 Surkhet* 56.6
Bhojpur 47.1 Ilam 61.9 Makawanpur 58.3 Rasuwa 25.7 Syangja 58.0
Chitwan 65.8 Jajarkot 28.3 Manang 52.8 Rautahat 28.4 Tanahu 54.8
Dadeldhura 43.8 Jhapa* 62.4 Morang 52.6 Rolpa 31.5 Taplejung 47.8
Dailekh 40.7 Jumla* 26.7 Mugu* 24.4 Rukum 30.6 Terhathum 54.3
Dang 52.5 Kailali 47.2 Mustang 48.2 Rupandehi 62.6 Udayapur 47.7
Source: National Population Census 2001, Nepal * These figures are based on the enumerated population only; census work was disturbed in these districts (see Introduction).
⊕ Data collected from sample households; see Introduction for sampling procedure


Mapping Nepal Census Indicators 2001 and Trends140
MALE ADULT LITERACY RATE, 2001⊕
The male adult literacy rate is the ratio of the total literate male population aged 15 years and above to the total male population in the same age groupand is expressed as a percentage. The national male adult literacy rate was 62.7%; it ranged district-wise from 85.1% (Kathmandu) to 34.2% (Humla).Thirty-two districts had adult male literacy rates above, and 43 districts rates below, the national figure.
Table E.5
District Male Adult Literacy Rate (%) District Male Adult
Literacy Rate (%) District Male Adult Literacy Rate (%) District Male Adult
Literacy Rate (%) District Male Adult Literacy Rate (%)
Achham 49.2 Darchula 64.4 Kalikot* 50.7 Myagdi 64.5 Salyan* 56.2
Arghakhanchi 62.8 Dhading 47.0 Kanchanpur 70.7 Nawalparasi 62.9 Sankhuwasabha 60.1
Baglung 70.5 Dhankuta 72.3 Kapilbastu 49.4 Nuwakot 57.0 Saptari 60.5
Baitadi 69.9 Dhanusa 58.8 Kaski 81.6 Okhaldhunga 60.1 Sarlahi 42.8
Bajhang 54.4 Dolakha* 58.8 Kathmandu 85.1 Palpa 74.4 Sindhuli* 57.9
Bajura* 46.9 Dolpa* 45.9 Kabhrepalanchok 71.9 Panchthar 64.4 Sindhupalchok* 44.4
Banke 64.3 Doti 57.7 Khotang 59.0 Parbat 66.6 Siraha* 50.4
Bara 51.6 Gorkha 58.1 Lalitpur 79.5 Parsa 52.7 Solukhumbu 52.9
Bardiya 51.3 Gulmi 67.2 Lamjung 65.5 Pyuthan 58.2 Sunsari 69.4
Bhaktapur 77.9 Humla 34.2 Mahottari 43.1 Ramechhap 48.8 Surkhet* 71.5
Bhojpur 61.9 Ilam 72.5 Makawanpur 70.5 Rasuwa 35.5 Syangja 72.7
Chitwan 76.6 Jajarkot 40.5 Manang 61.8 Rautahat 39.9 Tanahu 68.9
Dadeldhura 70.1 Jhapa* 73.3 Morang 65.3 Rolpa 49.7 Taplejung 61.6
Dailekh 61.3 Jumla* 42.6 Mugu* 42.0 Rukum 44.0 Terhathum 70.2
Dang 67.1 Kailali 61.7 Mustang 59.2 Rupandehi 75.0 Udayapur 62.2
Source: National Population Census 2001, Nepal * These figures are based on the enumerated population only; census work was disturbed in these districts (see Introduction).
⊕ Data collected from sample households; see Introduction for sampling procedure


Mapping Nepal Census Indicators 2001 and Trends142
FEMALE ADULT LITERACY RATE, 2001⊕
The female adult literacy rate is the ratio of the literate female population aged 15 years and above to the total female population in the same age groupand is expressed as a percentage. The national female adult literacy rate was 34.9%; it ranged district-wise from 60.3% (Kathmandu) to 5.0% (Humla).Thirty-two districts had female adult literacy rates above, and 43 districts rates below, the national figure.
Table E.6
District Female Adult Literacy Rate (%) District Female Adult
Literacy Rate (%) District Female Adult Literacy Rate (%) District Female Adult
Literacy Rate (%)
District Female Adult
Literacy Rate (%)
Achham 7.8 Darchula 20.4 Kalikot* 11.2 Myagdi 37.1 Salyan* 24.7
Arghakhanchi 36.6 Dhading 22.9 Kanchanpur 37.5 Nawalparasi 32.5 Sankhuwasabha 36.8
Baglung 44.0 Dhankuta 46.4 Kapilbastu 22.3 Nuwakot 29.1 Saptari 27.9
Baitadi 23.6 Dhanusa 30.5 Kaski 53.9 Okhaldhunga 26.2 Sarlahi 17.8
Bajhang 7.9 Dolakha* 27.6 Kathmandu 60.3 Palpa 50.8 Sindhuli* 28.0
Bajura* 9.2 Dolpa* 11.8 Kabhrepalanchok 42.0 Panchthar 36.9 Sindhupalchok* 18.9
Banke 43.3 Doti 15.9 Khotang 29.3 Parbat 39.9 Siraha* 19.5
Bara 21.5 Gorkha 35.3 Lalitpur 54.1 Parsa 21.8 Solukhumbu 26.0
Bardiya 28.3 Gulmi 39.4 Lamjung 36.4 Pyuthan 23.1 Sunsari 43.7
Bhaktapur 50.4 Humla 5.0 Mahottari 16.9 Ramechhap 17.2 Surkhet* 42.3
Bhojpur 34.1 Ilam 51.2 Makawanpur 45.7 Rasuwa 14.5 Syangja 47.4
Chitwan 55.4 Jajarkot 15.3 Manang 42.2 Rautahat 16.1 Tanahu 43.7
Dadeldhura 20.8 Jhapa* 52.0 Morang 40.1 Rolpa 15.1 Taplejung 34.8
Dailekh 21.9 Jumla* 9.3 Mugu* 5.2 Rukum 16.7 Terhathum 40.0
Dang 38.6 Kailali 32.7 Mustang 33.8 Rupandehi 49.9 Udayapur 33.4
Source: National Population Census 2001, Nepal * These figures are based on the enumerated population only; census work was disturbed in these districts (see Introduction).
⊕ Data collected from sample households; see Introduction for sampling procedure


Mapping Nepal Census Indicators 2001 and Trends144
RATIO OF LITERATE FEMALES TO MALES OF PRIME AGE, 2001⊕
The ratio of the number of literate females per 100 literate males in the same age group is an indicator of gender disparity in literacy. In the country asa whole, the ratio of literate females to males of prime age (aged 15-24 years) was 0.75, i.e. there were 75 literate females for every 100 literate males.The ratio ranged from 0.17 (Mugu) to 0.95 (Manang). Thirty-two districts had ratios above, and 43 districts ratios below, the national figure.
Table E.7
District Female-Male Literacy Ratio District Female-Male
Literacy Ratio District Female-Male Literacy Ratio District Female-Male
Literacy Ratio District Female-Male Literacy Ratio
Achham 0.24 Darchula 0.50 Kalikot* 0.35 Myagdi 0.83 Salyan* 0.61
Arghakhanchi 0.84 Dhading 0.68 Kanchanpur 0.74 Nawalparasi 0.70 Sankhuwasabha 0.85
Baglung 0.86 Dhankuta 0.87 Kapilbastu 0.56 Nuwakot 0.72 Saptari 0.59
Baitadi 0.54 Dhanusa 0.64 Kaski 0.93 Okhaldhunga 0.67 Sarlahi 0.56
Bajhang 0.22 Dolakha* 0.70 Kathmandu 0.90 Palpa 0.89 Sindhuli* 0.67
Bajura* 0.30 Dolpa* 0.38 Kabhrepalanchok 0.83 Panchthar 0.84 Sindhupalchok* 0.60
Banke 0.82 Doti 0.37 Khotang 0.73 Parbat 0.88 Siraha* 0.53
Bara 0.54 Gorkha 0.84 Lalitpur 0.87 Parsa 0.52 Solukhumbu 0.72
Bardiya 0.70 Gulmi 0.87 Lamjung 0.84 Pyuthan 0.59 Sunsari 0.81
Bhaktapur 0.89 Humla 0.21 Mahottari 0.51 Ramechhap 0.57 Surkhet* 0.79
Bhojpur 0.81 Ilam 0.93 Makwanpur 0.85 Rasuwa 0.56 Syangja 0.92
Chitwan 0.92 Jajarkot 0.51 Manang 0.95 Rautahat 0.49 Tanahu 0.87
Dadeldhura 0.49 Jhapa* 0.89 Morang 0.81 Rolpa 0.44 Taplejung 0.85
Dailekh 0.52 Jumla* 0.33 Mugu* 0.17 Rukum 0.50 Terhathum 0.89
Dang 0.74 Kailali 0.69 Mustang 0.86 Rupandehi 0.82 Udayapur 0.74
Source: National Population Census 2001, Nepal * These figures are based on the enumerated population only; census work was disturbed in these districts (see Introduction).
⊕ Data collected from sample households; see Introduction for sampling procedure


Mapping Nepal Census Indicators 2001 and Trends146
COMPLETED LEVEL OF EDUCATION OF LITERATE POPULATION, 2001⊕
The educational structure in Nepal consists broadly of primary, lower secondary, secondary, and higher education (beyond School Leaving Certificate or SLC*). Thetotal literate population is classified here into five categories of successfully completed level of education: primary (grades 1 to 5); lower secondary andsecondary (grades 6 to 10); SLC and equivalent; certificate and above; ‘no schooling’ (includes literate persons with non-formal education) and ‘other’ level(includes literate persons completing an education level other than mentioned above, but not including those who did not state their level attainment. Theproportion of the literate population with different levels of educational attainment is derived as the ratio of the literate population with a particular completedlevel of education to the total literate population, expressed as a percentage. Here, completed level of education means the highest level of education passed bythe individual.
In 2001, a (blown-up) total of 10,243,855 literate people reported their successfully completed level of education. Of these, 42.31% had completed primarylevel, 30.90% lower secondary and secondary level, 9.09% SLC and equivalent level, and 8.63% certificate and above level, 9.07% had no schooling or an‘other’ level. Table E.8 (a) shows the districts with the highest and the lowest proportion of literate population who had completed different levels of education.Table E.8 (b) shows the district-wise proportions of literate population with different completed levels of education.
* SLC is the national exam offered at the end of Grade 10, and represents successful completion of this grade.⊕ Data collected from sample households; see Introduction for sampling procedure
Table E.8 (a) Educational Attainment (Level Passed) District with Lowest Percentage District with Highest Percentage
Primary (1-5) Kathmandu (24.98) Rolpa (66.49)
Lower Secondary and Secondary (6-10) Rolpa (18.20) Syangja (36.96)
S.L.C. and Equivalent Rolpa (2.47) Mahottari (13.95)
Certificate and Above Rolpa (1.10) Kathmandu (23.89)
No Schooling and 'Other' Dang (3.81) Okhaldhunga (20.43)

Part Two – Census 2001 Indicators 147
Table E.8 (b) Completed Level of Education Completed Level of Education
District Primary
Lower Secondary & Secondary
S.L.C. and Equivalent
Certificate and Above
No Schooling and Other
District Primary
Lower Secondary & Secondary
S.L.C. and Equivalent
Certificate and Above
No Schooling and Other
Achham 59.63 25.00 4.92 2.03 8.41 Dolakha* 48.81 30.01 8.88 4.32 7.98
Arghakhanchi 45.44 32.28 7.98 3.16 11.15 Dolpa* 51.51 20.47 10.24 3.47 14.31
Baglung 43.46 28.34 8.80 5.72 13.67 Doti 54.62 28.34 6.10 4.72 6.22
Baitadi 50.89 33.81 4.03 5.09 6.18 Gorkha 48.28 29.79 7.79 4.87 9.26
Bajhang 61.43 24.62 4.77 2.83 6.34 Gulmi 49.76 29.11 6.39 2.89 11.85
Bajura* 58.23 26.65 7.08 2.32 5.72 Humla 57.40 29.14 5.93 2.26 5.27
Banke 40.18 31.43 8.32 13.92 6.14 Ilam 46.57 31.04 8.05 7.59 6.74
Bara 44.84 29.92 11.17 7.52 6.55 Jajarkot 58.96 29.91 3.19 1.13 6.81
Bardiya 50.63 28.22 4.94 4.22 11.99 Jhapa* 36.37 35.64 9.55 7.92 10.53
Bhaktapur 31.64 33.98 11.41 11.67 11.30 Jumla* 54.82 29.20 5.79 3.04 7.16
Bhojpur 54.27 28.17 5.85 2.01 9.69 Kailali 44.14 28.98 7.53 8.02 11.33
Chitwan 34.11 29.97 11.30 11.81 12.80 Kalikot* 39.98 28.78 10.30 4.37 16.58
Dadeldhura 51.03 36.00 3.02 4.93 5.03 Kanchanpur 43.18 33.42 6.87 8.56 7.97
Dailekh 45.78 30.39 8.43 7.30 8.10 Kapilbastu 48.33 31.80 6.34 7.23 6.31
Dang 52.26 34.60 4.73 4.60 3.81 Kaski 35.53 36.56 9.42 8.75 9.74
Darchula 57.24 27.32 5.65 2.11 7.68 Kathmandu 24.98 29.44 13.44 23.89 8.26
Dhading 36.58 28.21 11.52 8.09 15.60 Kabhrepalanchok 39.93 29.52 9.70 5.81 15.03
Dhankuta 35.16 29.85 13.66 15.83 5.50 Khotang 50.52 30.41 7.76 2.52 8.79
Dhanusa 51.12 30.64 7.15 2.80 8.30 Lalitpur 27.47 32.34 10.33 19.64 10.22

Mapping Nepal Census Indicators 2001 and Trends148
Table E.8 (b) cont..... Completed Level of Education Completed Level of Education
District Primary
Lower Secondary & Secondary
S.L.C. and Equivalent
Certificate and Above
No Schooling and Other
District Primary
Lower Secondary & Secondary
S.L.C. and Equivalent
Certificate and Above
No Schooling and Other
Lamjung 44.34 31.40 7.05 3.38 13.83 Rolpa 66.49 18.20 2.47 1.10 11.74
Mahottari 41.84 30.26 13.95 8.04 5.91 Rukum 55.14 32.89 4.44 2.46 5.07
Makawanpur 41.24 29.16 10.61 9.22 9.78 Rupandehi 38.09 32.75 9.97 11.28 7.91
Manang 37.30 32.57 9.04 5.43 15.66 Salyan* 53.91 26.80 8.01 3.30 7.98
Morang 39.67 33.19 9.41 8.14 9.60 Sankhuwasabha 43.54 32.73 8.54 4.91 10.28
Mugu* 52.36 28.52 8.88 3.09 7.16 Saptari 36.30 36.60 9.96 13.01 4.13
Mustang 44.94 25.04 8.92 6.77 14.33 Sarlahi 45.29 30.74 11.15 7.85 4.97
Myagdi 52.69 28.52 4.86 1.88 12.05 Sindhuli* 45.88 26.74 10.33 4.43 12.63
Nawalparasi 51.13 30.45 5.07 4.92 8.44 Sindhupalchok* 55.78 25.45 4.86 1.65 12.27
Nuwakot 42.74 27.68 8.09 4.77 16.71 Siraha* 40.53 30.22 13.15 9.62 6.48
Okhaldhunga 45.37 24.95 6.44 2.82 20.43 Solukhumbu 57.68 24.99 6.20 3.12 8.01
Palpa 41.92 28.36 9.94 8.56 11.22 Sunsari 38.31 33.01 11.27 9.33 8.08
Panchthar 52.61 31.77 5.83 2.91 6.89 Surkhet* 44.57 30.67 8.87 6.59 9.29
Parbat 42.66 34.41 10.87 3.85 8.22 Syangja 44.57 36.95 6.50 4.61 7.38
Parsa 45.79 32.58 7.62 8.79 5.22 Tanahu 44.46 31.32 7.66 5.42 11.14
Pyuthan 60.38 25.14 4.03 2.16 8.29 Taplejung 48.90 32.19 8.11 2.35 8.46
Ramechhap 53.54 23.60 6.03 2.08 14.76 Terhathum 40.94 36.22 9.84 4.30 8.70
Rasuwa 54.46 23.33 8.82 3.53 9.85 Udayapur 46.18 28.89 8.52 4.45 11.96
Rautahat 43.22 30.82 12.92 8.14 4.90
Source: National Population Census 2001, Nepal * These figures are based on the enumerated population only; census work was disturbed in these districts (see Introduction).


Mapping Nepal Census Indicators 2001 and Trends150
DISTRIBUTION OF SCHOOLS, 2000
The Department of Education is the main source of information on the school system and the development of education. For 2000, the Department lists the totalnumber of schools (primary, lower secondary, and secondary, both government and private) as 37,566. District-wise the total number of schools varied from 45in Manang (0.12% of all schools) to 2014 in Kathmandu (5.36%).
Table E.9
District Number of Schools District Number of
Schools District Number of Schools District Number of
Schools District Number of Schools
Achham 408 Darchula 387 Kalikot 218 Myagdi 313 Salyan 420
Arghakhanchi 530 Dhading 638 Kanchanpur 426 Nawalparasi 686 Sankhuwasabha 449
Baglung 707 Dhankuta 438 Kapilbastu 451 Nuwakot 637 Saptari 433
Baitadi 497 Dhanusa 500 Kaski 863 Okhaldhunga 393 Sarlahi 502
Bajhang 368 Dolakha 458 Kathmandu 2014 Palpa 660 Sindhuli 703
Bajura 269 Dolpa 124 Kabhrepalanchok 846 Panchthar 476 Sindhupalchok 623
Banke 338 Doti 408 Khotang 630 Parbat 496 Siraha 495
Bara 413 Gorkha 672 Lalitpur 657 Parsa 396 Solukhumbu 327
Bardiya 354 Gulmi 786 Lamjung 614 Pyuthan 399 Sunsari 603
Bhaktapur 428 Humla 129 Mahottari 363 Ramechhap 511 Surkhet 616
Bhojpur 471 Ilam 515 Makawanpur 530 Rasuwa 131 Syangja 808
Chitwan 700 Jajarkot 320 Manang 45 Rautahat 349 Tanahu 768
Dadeldhura 306 Jhapa 840 Morang 971 Rolpa 375 Taplejung 377
Dailekh 703 Jumla 163 Mugu 160 Rukum 315 Terhathum 332
Dang 560 Kailali 544 Mustang 90 Rupandehi 687 Udayapur 434
Source: Vidyalayastariya Nepal ko Shaikschhik Tathyank 2057 (2000) (Department of Education, Bhaktapur)


Mapping Nepal Census Indicators 2001 and Trends152
TOTAL NUMBER OF SCHOOLS PER THOUSAND POPULATION, 2000
The ratio of the total number of schools to the total population (expressed per thousand capita) shows the distribution of schools relative to thepopulation. Data on the number of schools by district was obtained from the Dept. of Education for 2000, and the population for that year was estimated basedon data from the 2001 census. On average 1.66 schools were available for every thousand persons in the country; district-wise the ratio ranged from 6.85(Manang) to 0.67 (Mahottari). Fifty-two districts had ratios above, and 23 districts ratios below, the national figure.
Table E.10
District Number of Schools per
1000 Population District
Number of Schools per
1000 Population District
Number of Schools per
1000 Population District
Number of Schools per
1000 Population District
Number of Schools per
1000 Population Achham 1.68 Darchula 3.11 Kalikot 2.01 Myagdi 2.54 Salyan 1.89
Arghakhanchi 2.39 Dhading 1.87 Kanchanpur 1.35 Nawalparasi 1.28 Sankhuwasabha 2.58
Baglung 2.48 Dhankuta 2.44 Kapilbastu 0.99 Nuwakot 2.12 Saptari 0.76
Baitadi 2.02 Dhanusa 0.75 Kaski 2.41 Okhaldhunga 2.30 Sarlahi 0.83
Bajhang 2.16 Dolakha 2.16 Kathmandu 2.44 Palpa 2.28 Sindhuli 2.56
Bajura 2.39 Dolpa 4.05 Kabhrepalanchok 2.13 Panchthar 2.22 Sindhupalchok 1.95
Banke 0.97 Doti 1.99 Khotang 2.38 Parbat 2.82 Siraha 0.88
Bara 0.81 Gorkha 2.17 Lalitpur 2.09 Parsa 0.87 Solukhumbu 2.75
Bardiya 1.00 Gulmi 2.41 Lamjung 3.26 Pyuthan 1.86 Sunsari 1.06
Bhaktapur 2.02 Humla 3.06 Mahottari 0.67 Ramechhap 2.22 Surkhet 2.23
Bhojpur 1.94 Ilam 1.84 Makawanpur 1.38 Rasuwa 2.91 Syangja 2.25
Chitwan 1.61 Jajarkot 2.29 Manang 6.85 Rautahat 0.69 Tanahu 2.34
Dadeldhura 2.39 Jhapa 1.16 Morang 1.18 Rolpa 1.71 Taplejung 2.99
Dailekh 3.06 Jumla 1.75 Mugu 3.59 Rukum 1.65 Terhathum 1.23
Dang 1.29 Kailali 1.06 Mustang 5.14 Rupandehi 1.07 Udayapur 2.95
Source: CBS (estimated population for 2000) and Vidyalayastariya Nepal ko Shaikschhik Tathyank 2057 (2000) (Department of Education, Bhaktapur )


Mapping Nepal Census Indicators 2001 and Trends154
NUMBER OF PRIMARY SCHOOLS PER THOUSAND POPULATION, 2000
The number of primary schools (grades 1 to 5) per thousand population indicates the extent of provision of basic educational facilities. On average therewere 1.15 primary schools available for one thousand people in the country as a whole; district-wise the value ranged from 0.47 (Mahottari) to 4.57(Manang). Fifty-one districts had ratios above, and 24 districts ratios below, the national figure.
Table E.11
District Primary Schools per 1000 pop. District Primary Schools
per 1000 pop. District Primary Schools per 1000 pop. District Primary Schools
per 1000 pop. District Primary Schools per 1000 pop.
Achham 1.24 Darchula 2.33 Kalikot 1.50 Myagdi 1.71 Salyan 1.53
Arghakhanchi 1.72 Dhading 1.43 Kanchanpur 0.81 Nawalparasi 0.96 Sankhuwasabha 1.96
Baglung 1.80 Dhankuta 1.70 Kapilbastu 0.74 Nuwakot 1.60 Saptari 0.50
Baitadi 1.43 Dhanusa 0.49 Kaski 1.56 Okhaldhunga 1.70 Sarlahi 0.60
Bajhang 1.55 Dolakha 1.66 Kathmandu 1.23 Palpa 1.60 Sindhuli 1.85
Bajura 1.71 Dolpa 3.43 Kabhrepalanchok 1.46 Panchthar 1.67 Sindhupalchok 1.47
Banke 0.63 Doti 1.49 Khotang 1.74 Parbat 1.97 Siraha 0.64
Bara 0.60 Gorkha 1.55 Lalitpur 1.06 Parsa 0.57 Solukhumbu 1.93
Bardiya 0.68 Gulmi 1.71 Lamjung 2.34 Pyuthan 1.46 Sunsari 0.66
Bhaktapur 1.19 Humla 2.47 Mahottari 0.47 Ramechhap 1.67 Surkhet 1.66
Bhojpur 1.42 Ilam 1.34 Makawanpur 1.03 Rasuwa 2.27 Syangja 1.58
Chitwan 1.04 Jajarkot 1.75 Manang 4.57 Rautahat 0.49 Tanahu 1.71
Dadeldhura 1.71 Jhapa 0.65 Morang 0.74 Rolpa 1.35 Taplejung 2.19
Dailekh 1.78 Jumla 1.34 Mugu 2.74 Rukum 1.12 Terhathum 0.86
Dang 0.87 Kailali 0.75 Mustang 3.72 Rupandehi 0.66 Udayapur 2.05
Source: CBS (estimated population for 2000) and Vidyalayastariya Nepal ko Shaikschhik Tathyank 2057 (2000) (Department of Education, Bhaktapur )


Mapping Nepal Census Indicators 2001 and Trends156
NUMBER OF LOWER SECONDARY SCHOOLS PER THOUSAND POPULATION, 2000
In the country as a whole there were 0.32 lower secondary schools (grades 6 to 8) available for every thousand people; district-wise the value rangedfrom 0.12 (Rautahat) to 1.83. (Manang). Forty-six districts had ratios above, and 27 districts ratios below, the national figure.
Table E.12
District Lower Secondary
Schools per 1000 Population
District Lower Secondary
Schools per 1000 Population
District Lower Secondary
Schools per 1000 Population
District Lower Secondary
Schools per 1000 Population
District Lower Secondary
Schools per 1000 Population
Achham 0.30 Darchula 0.53 Kalikot 0.33 Myagdi 0.54 Salyan 0.24
Arghakhanchi 0.45 Dhading 0.29 Kanchanpur 0.37 Nawalparasi 0.21 Sankhuwasabha 0.43
Baglung 0.42 Dhankuta 0.45 Kapilbastu 0.15 Nuwakot 0.32 Saptari 0.17
Baitadi 0.39 Dhanusa 0.16 Kaski 0.49 Okhaldhunga 0.37 Sarlahi 0.15
Bajhang 0.39 Dolakha 0.33 Kathmandu 0.71 Palpa 0.44 Sindhuli 0.51
Bajura 0.44 Dolpa 0.49 Kabhrepalanchok 0.49 Panchthar 0.35 Sindhupalchok 0.32
Banke 0.21 Doti 0.35 Khotang 0.43 Parbat 0.51 Siraha 0.15
Bara 0.13 Gorkha 0.39 Lalitpur 0.56 Parsa 0.17 Solukhumbu 0.50
Bardiya 0.21 Gulmi 0.41 Lamjung 0.54 Pyuthan 0.27 Sunsari 0.24
Bhaktapur 0.49 Humla 0.45 Mahottari 0.14 Ramechhap 0.35 Surkhet 0.34
Bhojpur 0.34 Ilam 0.30 Makawanpur 0.23 Rasuwa 0.40 Syangja 0.40
Chitwan 0.33 Jajarkot 0.34 Manang 1.83 Rautahat 0.12 Tanahu 0.39
Dadeldhura 0.44 Jhapa 0.30 Morang 0.29 Rolpa 0.27 Taplejung 0.55
Dailekh 0.74 Jumla 0.29 Mugu 0.58 Rukum 0.34 Terhathum 0.24
Dang 0.26 Kailali 0.20 Mustang 1.09 Rupandehi 0.23 Udayapur 0.58
Source: CBS (estimated population for 2000) and Vidyalayastariya Nepal ko Shaikschhik Tathyank 2057 (2000) (Department of Education, Bhaktapur )


Mapping Nepal Census Indicators 2001 and Trends158
NUMBER OF SECONDARY SCHOOLS PER THOUSAND POPULATION, 2000
In the country as a whole there were 0.19 secondary schools (grades 9 to 10) available for every thousand people; district-wise the value ranged from0.07 (Mahottari) to 0.55 (Dailekh). Thirty-nine districts had ratios above, and 33 districts ratios below, the national figure.
Table E.13
District Secondary Schools per
1000 Population District
Secondary Schools per
1000 Population District
Secondary Schools per
1000 Population District
Secondary Schools per
1000 Population District
Secondary Schools per
1000 Population Achham 0.14 Darchula 0.25 Kalikot 0.17 Myagdi 0.30 Salyan 0.12
Arghakhanchi 0.23 Dhading 0.15 Kanchanpur 0.16 Nawalparasi 0.12 Sankhuwasabha 0.20
Baglung 0.26 Dhankuta 0.30 Kapilbastu 0.11 Nuwakot 0.20 Saptari 0.09
Baitadi 0.20 Dhanusa 0.10 Kaski 0.35 Okhaldhunga 0.23 Sarlahi 0.08
Bajhang 0.22 Dolakha 0.17 Kathmandu 0.50 Palpa 0.24 Sindhuli 0.21
Bajura 0.24 Dolpa 0.13 Kabhrepalanchok 0.18 Panchthar 0.19 Sindhupalchok 0.16
Banke 0.12 Doti 0.16 Khotang 0.20 Parbat 0.34 Siraha 0.09
Bara 0.08 Gorkha 0.24 Lalitpur 0.47 Parsa 0.12 Solukhumbu 0.31
Bardiya 0.11 Gulmi 0.29 Lamjung 0.38 Pyuthan 0.13 Sunsari 0.16
Bhaktapur 0.34 Humla 0.14 Mahottari 0.07 Ramechhap 0.20 Surkhet 0.23
Bhojpur 0.17 Ilam 0.20 Makawanpur 0.12 Rasuwa 0.24 Syangja 0.27
Chitwan 0.25 Jajarkot 0.20 Manang 0.46 Rautahat 0.08 Tanahu 0.24
Dadeldhura 0.24 Jhapa 0.21 Morang 0.15 Rolpa 0.09 Taplejung 0.25
Dailekh 0.55 Jumla 0.12 Mugu 0.27 Rukum 0.19 Terhathum 0.13
Dang 0.16 Kailali 0.11 Mustang 0.34 Rupandehi 0.19 Udayapur 0.33
Source: CBS (estimated population for 2000) and Vidyalayastariya Nepal ko Shaikschhik Tathyank 2057 (2000) (Department of Education, Bhaktapur )


Mapping Nepal Census Indicators 2001 and Trends160
TOTAL ENROLLMENT IN SCHOOLS, 2000
Total enrollment refers to the total number of students who are attending school (government and private) at all levels. The Department of Education estimatedthe total enrollment at all levels of school in 2000 to be 4,953,510. At district level, the total enrollment ranged from 1,223 in Manang (0.03% of the totalenrollment) to 204,308 in Kathmandu (4.12% of the total enrollment).
Table E.14 District Total Enrollment District Total Enrollment District Total Enrollment District Total Enrollment District Total Enrollment
Achham 45089 Darchula 32209 Kalikot 19340 Myagdi 30378 Salyan 57172
Arghakhanchi 70613 Dhading 82746 Kanchanpur 83372 Nawalparasi 129285 Sankhuwasabha 43324
Baglung 88297 Dhankuta 47051 Kapilbastu 75734 Nuwakot 74818 Saptari 82894
Baitadi 50633 Dhanusa 54687 Kaski 113045 Okhaldhunga 42230 Sarlahi 74829
Bajhang 31872 Dolakha 57876 Kathmandu 204308 Palpa 89761 Sindhuli 64656
Bajura 22522 Dolpa 7010 Kabhrepalanchok 97135 Panchthar 65444 Sindhupalchok 67924
Banke 54190 Doti 40301 Khotang 72522 Parbat 55890 Siraha 86264
Bara 82684 Gorkha 88454 Lalitpur 70931 Parsa 66829 Solukhumbu 30221
Bardiya 83330 Gulmi 92286 Lamjung 60867 Pyuthan 48512 Sunsari 116590
Bhaktapur 52094 Humla 6629 Mahottari 74453 Ramechhap 54457 Surkhet 79287
Bhojpur 61980 Ilam 64184 Makawanpur 81777 Rasuwa 11486 Syangja 102753
Chitwan 126454 Jajarkot 29588 Manang 1223 Rautahat 68788 Tanahu 93819
Dadeldhura 31523 Jhapa 167179 Morang 176482 Rolpa 42709 Taplejung 45815
Dailekh 51778 Jumla 15327 Mugu 7072 Rukum 36556 Terhathum 38782
Dang 96611 Kailali 103326 Mustang 2588 Rupandehi 114643 Udayapur 58022
Source: Vidyalayastariya Nepal ko Shaikschhik Tathyank 2057 (2000) (Department of Education, Bhaktapur)


Mapping Nepal Census Indicators 2001 and Trends162
TOTAL ENROLLMENT IN PRIMARY SCHOOLS, 2000
The Department of Education estimated total enrollment in primary schools (grades 1 to 5) in 2000 to be 3,623,150, or 73.15% of the total enrollment at alllevels. District-wise the total enrollment in primary schools ranged from 883 (Manang) to 117,197 (Kathmandu).
Table E.15
District Primary School Enrollment District Primary School
Enrollment District Primary School Enrollment District Primary School
Enrollment District Primary School Enrollment
Achham 37034 Darchula 23934 Kalikot 16047 Myagdi 22317 Salyan 46790
Arghakhanchi 50303 Dhading 64824 Kanchanpur 60266 Nawalparasi 95908 Sankhuwasabha 32930
Baglung 64327 Dhankuta 31703 Kapilbastu 58705 Nuwakot 57126 Saptari 62489
Baitadi 38448 Dhanusa 41182 Kaski 73793 Okhaldhunga 31646 Sarlahi 56864
Bajhang 25983 Dolakha 45158 Kathmandu 117197 Palpa 67153 Sindhuli 50879
Bajura 18385 Dolpa 6215 Kabhrepalanchok 71646 Panchthar 48078 Sindhupalchok 53881
Banke 41129 Doti 33422 Khotang 53311 Parbat 39106 Siraha 67421
Bara 64840 Gorkha 65937 Lalitpur 44282 Parsa 51947 Solukhumbu 22402
Bardiya 65166 Gulmi 66390 Lamjung 43178 Pyuthan 39374 Sunsari 80036
Bhaktapur 32062 Humla 5351 Mahottari 58777 Ramechhap 41704 Surkhet 60431
Bhojpur 46559 Ilam 46675 Makawanpur 63211 Rasuwa 9082 Syangja 70599
Chitwan 86435 Jajarkot 24457 Manang 883 Rautahat 52955 Tanahu 65704
Dadeldhura 23512 Jhapa 107050 Morang 116229 Rolpa 37059 Taplejung 34449
Dailekh 40417 Jumla 12456 Mugu 5843 Rukum 29997 Terhathum 27478
Dang 72603 Kailali 75675 Mustang 2049 Rupandehi 83192 Udayapur 41104
Source: Vidyalayastariya Nepal ko Shaikschhik Tathyank 2057 (2000) (Department of Education, Bhaktapur)


Mapping Nepal Census Indicators 2001 and Trends164
TOTAL ENROLLMENT IN LOWER SECONDARY SCHOOLS, 2000
The Department of Education estimated the total enrollment in lower secondary schools (grades 6 to 8) to be 957,446, 19.33% of the total enrollment at alllevels. District-wise the total enrollment in lower secondary schools ranged from 239 in Manang (0.02% of total lower secondary school enrolment) to 60,216 inKathmandu (6.29% of total lower secondary school enrolment).
Table E.16
District Lower Secondary
School Enrollment
District Lower Secondary
School Enrollment
District Lower Secondary
School Enrollment
District Lower Secondary
School Enrollment
District Lower Secondary
School Enrollment
Achham 6055 Darchula 5829 Kalikot 2453 Myagdi 6009 Salyan 7565
Arghakhanchi 14406 Dhading 13111 Kanchanpur 17064 Nawalparasi 25045 Sankhuwasabha 7712
Baglung 17785 Dhankuta 10882 Kapilbastu 12581 Nuwakot 12618 Saptari 13588
Baitadi 9198 Dhanusa 9083 Kaski 28059 Okhaldhunga 7385 Sarlahi 12986
Bajhang 4380 Dolakha 9623 Kathmandu 60216 Palpa 16418 Sindhuli 10010
Bajura 3018 Dolpa 568 Kabhrepalanchok 18119 Panchthar 12717 Sindhupalchok 10228
Banke 9671 Doti 5183 Khotang 13173 Parbat 11576 Siraha 12951
Bara 12405 Gorkha 16710 Lalitpur 17776 Parsa 10701 Solukhumbu 5593
Bardiya 13852 Gulmi 18597 Lamjung 12473 Pyuthan 7211 Sunsari 25030
Bhaktapur 13531 Humla 918 Mahottari 10776 Ramechhap 9247 Surkhet 14037
Bhojpur 11003 Ilam 13506 Makawanpur 14022 Rasuwa 1571 Syangja 23642
Chitwan 28636 Jajarkot 3830 Manang 239 Rautahat 10529 Tanahu 20503
Dadeldhura 6054 Jhapa 41667 Morang 44361 Rolpa 4644 Taplejung 8218
Dailekh 8246 Jumla 2067 Mugu 877 Rukum 5002 Terhathum 8077
Dang 18387 Kailali 20396 Mustang 386 Rupandehi 22704 Udayapur 12757
Source: Vidyalayastariya Nepal ko Shaikschhik Tathyank 2057 (2000) (Department of Education, Bhaktapur)


Mapping Nepal Census Indicators 2001 and Trends166
TOTAL ENROLLMENT IN SECONDARY SCHOOLS, 2000
The Department of Education estimated the total enrollment in secondary schools (grades 9 & 10) to be 372,914, 7.53% of the total enrollment at all levels.District-wise the total enrollment in secondary schools ranged from 101 in Manang (0.02% of total secondary school enrollment) to 26,895 in Kathmandu(7.21% of total secondary school enrollment).
Table E.17
District Secondary
School Enrollment
District Secondary
School Enrollment
District Secondary
School Enrollment
District Secondary
School Enrollment
District Secondary
School Enrollment
Achham 2000 Darchula 2446 Kalikot 840 Myagdi 2052 Salyan 2817
Arghakhanchi 5904 Dhading 4811 Kanchanpur 6042 Nawalparasi 8332 Sankhuwasabha 2682
Baglung 6185 Dhankuta 4466 Kapilbastu 4448 Nuwakot 5074 Saptari 6817
Baitadi 2987 Dhanusa 4422 Kaski 11193 Okhaldhunga 3199 Sarlahi 4979
Bajhang 1509 Dolakha 3095 Kathmandu 26895 Palpa 6190 Sindhuli 3767
Bajura 1119 Dolpa 227 Kabhrepalanchok 7370 Panchthar 4649 Sindhupalchok 3815
Banke 3390 Doti 1696 Khotang 6038 Parbat 5208 Siraha 5892
Bara 5439 Gorkha 5807 Lalitpur 8873 Parsa 4181 Solukhumbu 2226
Bardiya 4312 Gulmi 7299 Lamjung 5216 Pyuthan 1927 Sunsari 11524
Bhaktapur 6501 Humla 360 Mahottari 4900 Ramechhap 3506 Surkhet 4819
Bhojpur 4418 Ilam 4003 Makawanpur 4544 Rasuwa 833 Syangja 8512
Chitwan 11383 Jajarkot 1301 Manang 101 Rautahat 5304 Tanahu 7612
Dadeldhura 1957 Jhapa 18462 Morang 15892 Rolpa 1006 Taplejung 3148
Dailekh 3115 Jumla 804 Mugu 352 Rukum 1557 Terhathum 3227
Dang 5621 Kailali 7255 Mustang 153 Rupandehi 8747 Udayapur 4161
Source: Vidyalayastariya Nepal ko Shaikschhik Tathyank 2057 (2000) (Department of Education, Bhaktapur)


Mapping Nepal Census Indicators 2001 and Trends168
TEACHER-SCHOOL RATIO, 2000
The ratio of the total number of teachers* to the total number of schools at all levels provides an indication of the average number of teachers available to eachschool. The Department of Education estimated that on average there were 3.80 teachers per school in 2000; district-wise the ratio varied from 1.97 (Dailekh) to5.93 (Jhapa). Forty-six districts had a teacher-school ratio below, and 29 districts a ratio above, the national figure.
* It is not clear whether the number includes posts that are temporarily unfilled.
Table E.18
District Teacher-School Ratio District Teacher- School
Ratio District Teacher- School Ratio District Teacher-School
Ratio District Teacher- School Ratio
Achham 3.17 Darchula 3.22 Kalikot 3.14 Myagdi 3.55 Salyan 3.06
Arghakhanchi 3.69 Dhading 3.24 Kanchanpur 4.68 Nawalparasi 4.72 Sankhuwasabha 3.09
Baglung 3.82 Dhankuta 3.58 Kapilbastu 4.09 Nuwakot 2.91 Saptari 4.12
Baitadi 3.20 Dhanusa 2.62 Kaski 5.49 Okhaldhunga 3.05 Sarlahi 3.00
Bajhang 3.20 Dolakha 3.20 Kathmandu 4.37 Palpa 4.17 Sindhuli 2.15
Bajura 3.10 Dolpa 3.47 Kabhrepalanchok 3.13 Panchthar 3.14 Sindhupalchok 2.80
Banke 3.20 Doti 3.18 Khotang 3.11 Parbat 4.15 Siraha 3.82
Bara 3.92 Gorkha 3.61 Lalitpur 4.84 Parsa 4.05 Solukhumbu 3.27
Bardiya 4.34 Gulmi 3.66 Lamjung 4.11 Pyuthan 3.53 Sunsari 4.82
Bhaktapur 5.15 Humla 3.28 Mahottari 4.21 Ramechhap 2.76 Surkhet 3.39
Bhojpur 3.38 Ilam 3.64 Makawanpur 3.59 Rasuwa 3.63 Syangja 4.22
Chitwan 5.37 Jajarkot 2.64 Manang 4.16 Rautahat 4.32 Tanahu 4.29
Dadeldhura 3.39 Jhapa 5.93 Morang 4.62 Rolpa 3.16 Taplejung 3.65
Dailekh 1.97 Jumla 3.53 Mugu 2.90 Rukum 3.00 Terhathum 3.55
Dang 4.52 Kailali 4.53 Mustang 4.21 Rupandehi 4.62 Udayapur 3.32
Source: Vidyalayastariya Nepal ko Shaikschhik Tathyank 2057 (2000) (Department of Education, Bhaktapur)


Mapping Nepal Census Indicators 2001 and Trends170
TEACHER-SCHOOL RATIO AT PRIMARY LEVEL, 2000
The Department of Education estimated that on average there were 3.78 teachers available per primary school in 2000; district-wise the ratio varied from 2.17(Sindhuli) to 6.95 (Jhapa). Forty six districts had a teacher-school ratio above, and 29 districts a ratio below, the national figure.
Table E.19
District Teacher-School Ratio Primary
Level District
Teacher-School Ratio Primary
Level District
Teacher-School Ratio Primary
Level District
Teacher-School Ratio Primary
Level District
Teacher-School Ratio Primary
Level
Achham 3.07 Darchula 3.26 Kalikot 3.04 Myagdi 3.54 Salyan 2.91
Arghakhanchi 3.72 Dhading 3.21 Kanchanpur 5.39 Nawalparasi 4.57 Sankhuwasabha 2.99
Baglung 3.82 Dhankuta 3.65 Kapilbastu 4.10 Nuwakot 2.79 Saptari 4.35
Baitadi 3.13 Dhanusa 2.76 Kaski 5.17 Okhaldhunga 3.05 Sarlahi 2.95
Bajhang 3.36 Dolakha 3.13 Kathmandu 4.15 Palpa 4.29 Sindhuli 2.17
Bajura 3.20 Dolpa 3.35 Kabhrepalanchok 3.23 Panchthar 3.00 Sindhupalchok 2.86
Banke 3.44 Doti 3.05 Khotang 3.08 Parbat 4.09 Siraha 3.84
Bara 3.67 Gorkha 3.81 Lalitpur 4.99 Parsa 4.43 Solukhumbu 3.55
Bardiya 4.46 Gulmi 3.63 Lamjung 3.96 Pyuthan 3.42 Sunsari 4.85
Bhaktapur 4.68 Humla 3.11 Mahottari 4.27 Ramechhap 2.72 Surkhet 3.29
Bhojpur 3.33 Ilam 3.61 Makawanpur 3.75 Rasuwa 3.71 Syangja 4.17
Chitwan 5.28 Jajarkot 2.63 Manang 4.47 Rautahat 4.51 Tanahu 4.16
Dadeldhura 3.25 Jhapa 6.95 Morang 4.73 Rolpa 3.15 Taplejung 3.61
Dailekh 2.50 Jumla 3.45 Mugu 2.89 Rukum 3.39 Terhathum 3.53
Dang 4.53 Kailali 4.36 Mustang 4.35 Rupandehi 4.98 Udayapur 3.30
Source: Vidyalayastariya Nepal ko Shaikschhik Tathyank 2057 (2000) (Department of Education, Bhaktapur)


Mapping Nepal Census Indicators 2001 and Trends172
TEACHER-SCHOOL RATIO AT LOWER SECONDARY LEVEL, 2000
The Department of Education estimated that on average there were 3.48 teachers available per lower secondary school in 2000; district-wise the ratio variedfrom 1.30 (Dailekh) to 5.43 (Chitwan). Forty-seven districts had a teacher-school ratio above, and 28 districts a ratio below, the national figure.
Table E.20
District Teacher-School Ratio at Lower
Secondary Level District
Teacher-School Ratio at Lower
Secondary Level District
Teacher-School Ratio at Lower
Secondary Level District
Teacher-School Ratio at Lower
Secondary Level District
Teacher-School Ratio at Lower
Secondary Level
Achham 3.24 Darchula 2.92 Kalikot 3.08 Myagdi 3.62 Salyan 3.13
Arghakhanchi 3.02 Dhading 3.05 Kanchanpur 3.15 Nawalparasi 4.95 Sankhuwasabha 2.89
Baglung 3.59 Dhankuta 3.35 Kapilbastu 4.23 Nuwakot 2.94 Saptari 3.15
Baitadi 3.01 Dhanusa 1.95 Kaski 5.42 Okhaldhunga 3.19 Sarlahi 2.90
Bajhang 2.51 Dolakha 2.76 Kathmandu 3.75 Palpa 3.59 Sindhuli 1.64
Bajura 2.71 Dolpa 3.33 Kabhrepalanchok 2.06 Panchthar 3.53 Sindhupalchok 2.32
Banke 2.14 Doti 3.27 Khotang 3.02 Parbat 3.98 Siraha 3.36
Bara 4.45 Gorkha 2.85 Lalitpur 4.22 Parsa 3.23 Solukhumbu 2.43
Bardiya 3.70 Gulmi 3.92 Lamjung 4.52 Pyuthan 3.31 Sunsari 4.45
Bhaktapur 4.95 Humla 3.79 Mahottari 3.43 Ramechhap 2.69 Surkhet 4.15
Bhojpur 3.19 Ilam 3.76 Makawanpur 2.75 Rasuwa 3.06 Syangja 4.23
Chitwan 5.43 Jajarkot 2.83 Manang 2.75 Rautahat 2.95 Tanahu 4.02
Dadeldhura 3.96 Jhapa 4.11 Morang 4.02 Rolpa 3.03 Taplejung 3.39
Dailekh 1.30 Jumla 3.00 Mugu 2.46 Rukum 2.02 Terhathum 3.35
Dang 4.50 Kailali 4.78 Mustang 2.89 Rupandehi 3.87 Udayapur 3.35
Source: Vidyalayastariya Nepal ko Shaikschhik Tathyank 2057 (2000) (Department of Education, Bhaktapur)


Mapping Nepal Census Indicators 2001 and Trends174
TEACHER-SCHOOL RATIO AT SECONDARY LEVEL, 2000
The Department of Education estimated that on average there were 4.48 teachers available per secondary school in 2000; district-wise the ratio varied from1.15 (Dailekh) to 7.13 (Bhaktapur). Forty-three districts had a teacher-school ratio above, and 32 districts a ratio below, the national figure.
Table E.21
District Teacher-School
Ratio at Secondary Level
District Teacher-School
Ratio at Secondary Level
District Teacher-School
Ratio at Secondary Level
District Teacher-School
Ratio at Secondary Level
District Teacher-School
Ratio at Secondary Level
Achham 3.85 Darchula 3.55 Kalikot 4.11 Myagdi 3.49 Salyan 4.88
Arghakhanchi 4.76 Dhading 3.92 Kanchanpur 4.63 Nawalparasi 5.52 Sankhuwasabha 4.56
Baglung 4.26 Dhankuta 3.47 Kapilbastu 3.78 Nuwakot 3.80 Saptari 4.70
Baitadi 4.00 Dhanusa 3.08 Kaski 6.97 Okhaldhunga 2.85 Sarlahi 3.57
Bajhang 3.30 Dolakha 4.72 Kathmandu 5.76 Palpa 4.37 Sindhuli 3.23
Bajura 3.07 Dolpa 7.00 Kabhrepalanchok 5.22 Panchthar 3.61 Sindhupalchok 3.24
Banke 3.76 Doti 4.22 Khotang 3.61 Parbat 4.76 Siraha 4.45
Bara 4.90 Gorkha 3.60 Lalitpur 5.26 Parsa 3.40 Solukhumbu 2.89
Bardiya 4.79 Gulmi 3.52 Lamjung 4.46 Pyuthan 5.26 Sunsari 5.27
Bhaktapur 7.13 Humla 4.67 Mahottari 5.41 Ramechhap 3.28 Surkhet 3.02
Bhojpur 4.14 Ilam 3.67 Makawanpur 3.83 Rasuwa 3.91 Syangja 4.50
Chitwan 5.64 Jajarkot 2.36 Manang 6.67 Rautahat 5.23 Tanahu 5.65
Dadeldhura 3.39 Jhapa 5.37 Morang 5.25 Rolpa 3.70 Taplejung 4.50
Dailekh 1.15 Jumla 5.82 Mugu 4.00 Rukum 2.49 Terhathum 4.09
Dang 4.52 Kailali 5.16 Mustang 6.83 Rupandehi 4.29 Udayapur 3.40
Source: Vidyalayastariya Nepal ko Shaikschhik Tathyank 2057 (2000) (Department of Education, Bhaktapur)


Mapping Nepal Census Indicators 2001 and Trends176
STUDENT-TEACHER RATIO (ALL SCHOOLS), 2000
The ratio of the total number of enrolled students to the total number of teachers at all levels indicates the average number of students per teacher. TheDepartment of Education estimated that on average there were 34.70 students per teacher in 2000; district-wise the ratio varied from 6.54 (Manang) to 54.29(Bardiya). Thirty-five districts had a student-teacher ratio below, and 40 districts a student-teacher ratio above, the national figure.
Table E.22
District Student-Teacher
Ratio, All Schools
District Student-Teacher
Ratio, All Schools
District Student-Teacher
Ratio, All Schools
District Student-Teacher
Ratio, All Schools
District Student-Teacher
Ratio, All Schools
Achham 34.90 Darchula 25.83 Kalikot 28.23 Myagdi 27.34 Salyan 44.53
Arghakhanchi 36.12 Dhading 40.03 Kanchanpur 41.85 Nawalparasi 39.94 Sankhuwasabha 31.24
Baglung 32.65 Dhankuta 30.05 Kapilbastu 41.09 Nuwakot 40.42 Saptari 46.44
Baitadi 31.88 Dhanusa 41.68 Kaski 23.86 Okhaldhunga 35.19 Sarlahi 49.69
Bajhang 27.10 Dolakha 39.51 Kathmandu 23.23 Palpa 32.64 Sindhuli 42.82
Bajura 27.04 Dolpa 16.30 Kabhrepalanchok 36.70 Panchthar 43.83 Sindhupalchok 38.90
Banke 50.18 Doti 31.05 Khotang 36.98 Parbat 27.16 Siraha 45.64
Bara 51.13 Gorkha 36.43 Lalitpur 22.28 Parsa 41.72 Solukhumbu 28.27
Bardiya 54.29 Gulmi 32.04 Lamjung 24.12 Pyuthan 34.43 Sunsari 40.09
Bhaktapur 23.63 Humla 15.67 Mahottari 48.66 Ramechhap 38.57 Surkhet 37.92
Bhojpur 38.96 Ilam 34.19 Makawanpur 42.95 Rasuwa 24.13 Syangja 30.12
Chitwan 33.66 Jajarkot 35.06 Manang 6.54 Rautahat 45.68 Tanahu 28.46
Dadeldhura 30.37 Jhapa 33.56 Morang 39.31 Rolpa 36.01 Taplejung 33.32
Dailekh 37.33 Jumla 26.61 Mugu 15.24 Rukum 38.68 Terhathum 32.87
Dang 38.16 Kailali 41.97 Mustang 6.83 Rupandehi 36.13 Udayapur 40.29
Source: Vidyalayastariya Nepal ko Shaikschhik Tathyank 2057 (2000) (Department of Education, Bhaktapur)


Mapping Nepal Census Indicators 2001 and Trends178
STUDENT-TEACHER RATIO AT PRIMARY LEVEL, 2000
The Department of Education estimated that on average there were 37.02 students per teacher at primary level in 2000; district-wise the ratio varied from 6.59(Manang) to 60.17 (Bardiya). Thirty-seven districts had a student-teacher ratio above, and 38 districts a ratio below, the national figure.
Table E.23
District Student-Teacher Ratio, Primary
Level District
Student-Teacher Ratio, Primary
Level District
Student-Teacher Ratio, Primary
Level District
Student-Teacher Ratio, Primary
Level District
Student-Teacher Ratio, Primary
Level Achham 40.21 Darchula 25.35 Kalikot 32.35 Myagdi 30.04 Salyan 47.36
Arghakhanchi 35.47 Dhading 41.42 Kanchanpur 43.70 Nawalparasi 41.09 Sankhuwasabha 32.35
Baglung 32.85 Dhankuta 28.46 Kapilbastu 42.57 Nuwakot 42.60 Saptari 50.64
Baitadi 34.95 Dhanusa 45.96 Kaski 25.42 Okhaldhunga 35.76 Sarlahi 53.59
Bajhang 29.33 Dolakha 41.09 Kathmandu 27.87 Palpa 33.71 Sindhuli 46.38
Bajura 29.80 Dolpa 17.66 Kabhrepalanchok 38.27 Panchthar 44.64 Sindhupalchok 40.00
Banke 53.83 Doti 35.90 Khotang 37.57 Parbat 27.56 Siraha 48.82
Bara 57.58 Gorkha 36.17 Lalitpur 26.48 Parsa 44.78 Solukhumbu 27.45
Bardiya 60.17 Gulmi 32.92 Lamjung 24.74 Pyuthan 36.73 Sunsari 43.98
Bhaktapur 27.08 Humla 16.57 Mahottari 54.63 Ramechhap 39.87 Surkhet 39.97
Bhojpur 40.42 Ilam 34.45 Makawanpur 42.57 Rasuwa 24.03 Syangja 29.78
Chitwan 36.29 Jajarkot 38.10 Manang 6.59 Rautahat 47.20 Tanahu 28.14
Dadeldhura 33.07 Jhapa 32.64 Morang 40.23 Rolpa 39.72 Taplejung 34.55
Dailekh 39.55 Jumla 28.90 Mugu 16.60 Rukum 41.55 Terhathum 33.51
Dang 42.31 Kailali 45.04 Mustang 7.24 Rupandehi 39.90 Udayapur 41.44
Source: Vidyalayastariya Nepal ko Shaikschhik Tathyank 2057 (2000) (Department of Education, Bhaktapur)


Mapping Nepal Census Indicators 2001 and Trends180
STUDENT-TEACHER RATIO AT LOWER SECONDARY LEVEL, 2000
The Department of Education estimated that on average there were 37.73 students per teacher at lower secondary level in 2000; district-wise the ratio variedfrom 7.02 (Banke) to 61.21 (Mustang). Thirty-five districts had a student-teacher ratio below, and 40 districts a ratio above, the national figure.
Table E.24
District Student-Teacher Ratio at Lower
Secondary Level District
Student-Teacher Ratio at Lower
Secondary Level District
Student-Teacher Ratio at Lower
Secondary Level District
Student-Teacher Ratio at Lower
Secondary Level District
Student-Teacher Ratio at Lower
Secondary Level
Achham 25.23 Darchula 30.20 Kalikot 22.10 Myagdi 25.14 Salyan 44.76
Arghakhanchi 48.18 Dhading 43.41 Kanchanpur 45.87 Nawalparasi 46.04 Sankhuwasabha 36.04
Baglung 41.26 Dhankuta 40.60 Kapilbastu 45.09 Nuwakot 44.74 Saptari 44.99
Baitadi 31.50 Dhanusa 42.64 Kaski 29.57 Okhaldhunga 36.74 Sarlahi 48.10
Bajhang 26.07 Dolakha 49.10 Kathmandu 27.51 Palpa 36.32 Sindhuli 43.71
Bajura 22.69 Dolpa 11.36 Kabhrepalanchok 45.41 Panchthar 47.45 Sindhupalchok 43.71
Banke 61.21 Doti 22.34 Khotang 37.96 Parbat 32.34 Siraha 45.93
Bara 43.53 Gorkha 48.86 Lalitpur 24.09 Parsa 41.96 Solukhumbu 38.31
Bardiya 51.30 Gulmi 35.16 Lamjung 27.06 Pyuthan 36.98 Sunsari 40.44
Bhaktapur 26.27 Humla 12.75 Mahottari 42.43 Ramechhap 43.01 Surkhet 36.37
Bhojpur 41.52 Ilam 42.21 Makawanpur 58.67 Rasuwa 28.56 Syangja 38.82
Chitwan 37.14 Jajarkot 28.16 Manang 7.24 Rautahat 58.49 Tanahu 39.81
Dadeldhura 27.27 Jhapa 46.56 Morang 46.74 Rolpa 25.94 Taplejung 35.12
Dailekh 37.48 Jumla 25.52 Mugu 13.70 Rukum 38.18 Terhathum 36.55
Dang 36.48 Kailali 41.80 Mustang 7.02 Rupandehi 39.35 Udayapur 44.76
Source: Vidyalayastariya Nepal ko Shaikschhik Tathyank 2057 (2000) (Department of Education, Bhaktapur)


Mapping Nepal Census Indicators 2001 and Trends182
STUDENT-TEACHER RATIO AT SECONDARY LEVEL, 2000
The Department of Education estimated that on average there were 19.13 students per teacher at secondary level in 2000; district-wise this ratio varied from3.73 (Mustang) to 31.41 (Panchthar). Twenty-nine districts had a student-teacher ratio below, and 46 districts a ratio above, the national figure.
Table E.25
District Student-Teacher
Ratio at Secondary Level
District Student-Teacher
Ratio at Secondary Level
District Student-Teacher
Ratio at Secondary Level
District Student-Teacher
Ratio at Secondary Level
District Student-Teacher
Ratio at Secondary Level
Achham 15.27 Darchula 22.24 Kalikot 10.77 Myagdi 15.91 Salyan 22.18
Arghakhanchi 24.81 Dhading 24.06 Kanchanpur 25.07 Nawalparasi 23.21 Sankhuwasabha 17.30
Baglung 19.63 Dhankuta 24.27 Kapilbastu 24.04 Nuwakot 22.25 Saptari 27.38
Baitadi 15.24 Dhanusa 21.78 Kaski 12.65 Okhaldhunga 28.06 Sarlahi 28.45
Bajhang 12.37 Dolakha 18.21 Kathmandu 11.21 Palpa 20.23 Sindhuli 20.47
Bajura 13.48 Dolpa 8.11 Kabhrepalanchok 19.60 Panchthar 31.41 Sindhupalchok 23.12
Banke 21.46 Doti 12.56 Khotang 30.96 Parbat 18.53 Siraha 25.96
Bara 26.40 Gorkha 22.08 Lalitpur 11.48 Parsa 22.36 Solukhumbu 20.80
Bardiya 23.69 Gulmi 21.85 Lamjung 16.45 Pyuthan 13.57 Sunsari 24.57
Bhaktapur 12.85 Humla 12.86 Mahottari 24.50 Ramechhap 23.22 Surkhet 24.97
Bhojpur 25.39 Ilam 19.82 Makawanpur 25.24 Rasuwa 19.37 Syangja 19.70
Chitwan 18.85 Jajarkot 19.71 Manang 5.05 Rautahat 26.00 Tanahu 17.07
Dadeldhura 18.64 Jhapa 22.91 Morang 24.41 Rolpa 13.59 Taplejung 21.86
Dailekh 21.48 Jumla 12.56 Mugu 7.33 Rukum 16.92 Terhathum 23.22
Dang 18.02 Kailali 24.68 Mustang 3.73 Rupandehi 17.12 Udayapur 25.53
Source: Vidyalayastariya Nepal ko Shaikschhik Tathyank 2057 (2000) (Department of Education, Bhaktapur)


Mapping Nepal Census Indicators 2001 and Trends184
DISADVANTAGED CASTE STUDENTS AT PRIMARY LEVEL, 2000
The proportion of students of disadvantaged (uppechhit, utpidit, dalit) castes enrolled at primary level was derived as the ratio of the total number ofdisadvantaged caste students to the total students at primary level, expressed in percent. The data on disadvantaged caste students and total studentsat primary level was obtained from the report ‘Vidyalayastariya Nepal ko Shaikschhik Tathyank 2057’ (School Level Education Statistics of Nepal, 2000).In this report, students of disadvantaged (uppechhit, utpidit, dalit) castes are taken to include Dom, Chamar, Dusad, Raute, Jhangad, Satar, Dhimal,Sarki, Kami, and Damai castes. In 2000 there were 466,282 students from disadvantaged castes enrolled at primary level, 12.87% of all primary levelstudents. Thirty-nine districts had a proportion below, and 36 districts a proportion above, the national figure. District-wise the proportion ranged from3.56% (Bhaktapur) to 26.00% (Achham).
Table E.26
District Disadvantaged Caste Students
(%) District
Disadvantaged Caste Students
(%) District
Disadvantaged Caste Students
(%) District
Disadvantaged Caste Students
(%) District
Disadvantaged Caste Students
(%) Achham 26.00 Darchula 11.82 Kalikot 20.12 Myagdi 20.85 Salyan 16.41
Arghakhanchi 19.10 Dhading 11.74 Kanchanpur 15.81 Nawalparasi 10.59 Sankhuwasabha 8.03
Baglung 21.34 Dhankuta 7.12 Kapilbastu 14.35 Nuwakot 7.23 Saptari 17.08
Baitadi 15.51 Dhanusa 13.09 Kaski 20.14 Okhaldhunga 9.81 Sarlahi 9.78
Bajhang 14.62 Dolakha 10.40 Kathmandu 4.22 Palpa 12.28 Sindhuli 11.52
Bajura 23.14 Dolpa 11.58 Kabhrepalanchok 6.99 Panchthar 5.97 Sindhupalchok 8.37
Banke 14.19 Doti 20.53 Khotang 9.92 Parbat 21.86 Siraha 13.67
Bara 9.29 Gorkha 14.67 Lalitpur 4.42 Parsa 9.13 Solukhumbu 7.61
Bardiya 10.17 Gulmi 17.72 Lamjung 16.57 Pyuthan 18.74 Sunsari 13.41
Bhaktapur 3.56 Humla 14.22 Mahottari 13.20 Ramechhap 9.04 Surkhet 25.39
Bhojpur 10.34 Ilam 6.16 Makawanpur 5.42 Rasuwa 4.80 Syangja 15.11
Chitwan 9.86 Jajarkot 24.74 Manang 4.98 Rautahat 12.22 Tanahu 15.74
Dadeldhura 17.41 Jhapa 13.05 Morang 12.78 Rolpa 15.76 Taplejung 8.31
Dailekh 21.14 Jumla 11.75 Mugu 15.40 Rukum 18.22 Terhathum 9.51
Dang 12.03 Kailali 11.98 Mustang 16.50 Rupandehi 12.36 Udayapur 11.31
Source: Vidyalayastariya Nepal ko Shaikschhik Tathyank 2057 (2000) (Department of Education, Bhaktapur)


Mapping Nepal Census Indicators 2001 and Trends186
GIRL’S ENROLLMENT AT ALL LEVELS OF SCHOOL, 2000
Gender disparity in education is a major concern. The proportion of female enrollment at all levels of schooling indicates the attitudes to female education. Theratio of the number of girl students to the total number of students at all levels of school is expressed as a percentage. The Department of Education estimatedthat female enrollment in 2000 was 43.33% of the total; district-wise it ranged from 27.40% (Mugu) to 52.09% (Manang). Thirty-seven districts had a femaleenrollment below, and 38 districts a female enrollment above, the national figure.
Table E.27
District Female
Enrollment All Schools (%)
District Female
Enrollment All Schools (%)
District Female
Enrollment All Schools (%)
District Female
Enrollment All Schools (%)
District Female
Enrollment All Schools (%)
Achham 35.55 Darchula 44.26 Kalikot 31.65 Myagdi 47.39 Salyan 40.67
Arghakhanchi 49.05 Dhading 45.11 Kanchanpur 44.03 Nawalparasi 44.75 Sankhuwasabha 45.79
Baglung 47.54 Dhankuta 48.25 Kapilbastu 35.82 Nuwakot 46.09 Saptari 35.58
Baitadi 38.83 Dhanusa 35.66 Kaski 48.93 Okhaldhunga 43.30 Sarlahi 35.28
Bajhang 30.66 Dolakha 41.97 Kathmandu 44.97 Palpa 47.77 Sindhuli 40.31
Bajura 33.23 Dolpa 40.07 Kabhrepalanchok 45.90 Panchthar 47.77 Sindhupalchok 43.29
Banke 40.60 Doti 38.36 Khotang 44.81 Parbat 48.70 Siraha 33.95
Bara 33.23 Gorkha 47.09 Lalitpur 48.90 Parsa 32.54 Solukhumbu 44.61
Bardiya 42.22 Gulmi 48.17 Lamjung 47.76 Pyuthan 42.32 Sunsari 44.66
Bhaktapur 48.34 Humla 30.03 Mahottari 32.00 Ramechhap 40.93 Surkhet 45.02
Bhojpur 47.71 Ilam 49.06 Makawanpur 44.02 Rasuwa 40.59 Syangja 49.48
Chitwan 49.15 Jajarkot 40.26 Manang 52.09 Rautahat 31.30 Tanahu 47.92
Dadeldhura 41.21 Jhapa 47.98 Morang 45.46 Rolpa 38.22 Taplejung 46.67
Dailekh 38.16 Jumla 30.15 Mugu 27.14 Rukum 39.95 Terhathum 48.19
Dang 43.27 Kailali 42.18 Mustang 49.92 Rupandehi 42.24 Udaypur 43.65
Source: Vidyalayastariya Nepal ko Shaikschhik Tathyank 2057 (2000) (Department of Education, Bhaktapur)


Mapping Nepal Census Indicators 2001 and Trends188
GIRL’S ENROLLMENT AT PRIMARY LEVEL, 2000
The proportion of female enrollment at primary school level (grades 1 to 5) is an indicator of the gender gap in education. The indicator is defined as the ratio ofthe number of girl students to the total number of students enrolled at primary school level and is expressed as a percentage. The Department of Educationestimated that female enrollment at primary level was 44.09% in 2000; district-wise it varied from 52.21% (Manang) to 30.52% (Mugu). In 34 districts thefemale enrollment was below, and in 41 districts above, the national figure.
Table E.28
District
Female Enrollment,
Primary Level (%)
District
Female Enrollment,
Primary Level (%)
District
Female Enrollment,
Primary Level (%)
District
Female Enrollment,
Primary Level (%)
District
Female Enrollment,
Primary Level (%)
Achham 39.13 Darchula 47.07 Kalikot 34.67 Myagdi 48.12 Salyan 41.62
Arghakhanchi 49.33 Dhading 45.96 Kanchanpur 46.07 Nawalparasi 45.84 Sankhuwasabha 46.99
Baglung 48.05 Dhankuta 49.06 Kapilbastu 36.05 Nuwakot 47.16 Saptari 36.69
Baitadi 42.07 Dhanusa 36.45 Kaski 49.21 Okhaldhunga 44.67 Sarlahi 35.71
Bajhang 33.90 Dolakha 43.36 Kathmandu 47.38 Palpa 48.56 Sindhuli 41.26
Bajura 36.14 Dolpa 42.17 Kabhrepalanchok 46.52 Panchthar 48.34 Sindhupalchok 44.23
Banke 41.01 Doti 41.68 Khotang 45.88 Parbat 49.13 Siraha 34.18
Bara 34.14 Gorkha 47.92 Lalitpur 48.60 Parsa 33.56 Solukhumbu 45.36
Bardiya 43.59 Gulmi 48.47 Lamjung 48.83 Pyuthan 43.29 Sunsari 44.85
Bhaktapur 49.06 Humla 33.90 Mahottari 32.40 Ramechhap 42.89 Surkhet 46.63
Bhojpur 49.17 Ilam 49.06 Makawanpur 44.08 Rasuwa 40.68 Syangja 50.15
Chitwan 49.86 Jajarkot 42.60 Manang 52.21 Rautahat 32.58 Tanahu 49.32
Dadeldhura 44.56 Jhapa 48.12 Morang 46.18 Rolpa 39.36 Taplejung 46.87
Dailekh 39.72 Jumla 32.96 Mugu 30.52 Rukum 41.31 Terhathum 48.92
Dang 44.26 Kailali 43.32 Mustang 51.29 Rupandehi 42.24 Udaypur 44.55
Source: Vidyalayastariya Nepal ko Shaikschhik Tathyank 2057 (2000) (Department of Education, Bhaktapur)


Mapping Nepal Census Indicators 2001 and Trends190
Related Documents