Abstract We used a well-characterized barley mapping population (BCD 47 · Baronesse) to determine if barley stripe rust (BSR) resistance quantitative trait loci (QTL) mapped in Mexico and the USA were effective against a reported new race in Peru. Essentially the same resistance QTL were detected using data from each of the three environments, indicating that these resistance al- leles are effective against the spectrum of naturally occurring races at these sites. In addition to the mapping population, we evaluated a germplasm array consisting of lines with different numbers of mapped BSR resistance alleles. A higher BSR disease severity on CI10587, which has a single qualitative resistance gene, in Peru versus Mexico suggests there are differences in pathogen viru- lence between the two locations. Confirmation of a new race in Peru will require characterization using a standard set of differentials, an experiment that is underway. The highest levels of resistance in Peru were observed when the qualitative resistance gene was pyramided with quantitative resistance alleles. We also used the mapping population to locate QTL conferring resistance to barley leaf rust and barley powdery mildew. For mildew, we identified resistance QTL under field conditions in Peru that R. Wise Corn Insects and Crop Genetics Research, USDA-ARS & Department of Plant Pathology, Iowa State University, 50011-1020, Ames, IA, USA K. Sato K. Hori Research Institute for Bioresources, Okayama University, Kurashiki 700-8530, Japan F. Capettini H. Vivar ICARDA/CIMMYT, El Batan, Mexico X. Chen USDA/ARS, 99104, Pullman, WA, USA C. Rossi I. Vales P. Hayes (&) Department of Crop and Soil Science, Oregon State University, 97331-4501, Corvallis, OR, USA e-mail: [email protected] C. Rossi Instituto Nacional de Investigacion Agropecuaria (INIA), Colonia, Uruguay A. Cuesta-Marcos Estacio ´ n Experimental de Aula Dei (CSIC), Zaragoza 50080, Spain L. Gomez-Pando University of Nacional Agraria La Molina, Lima 456, Peru ´ G. Orjeda Universidad Peruana Cayetano Heredia, Lima 100, Peru Mol Breeding DOI 10.1007/s11032-006-9043-0 123 Mapping multiple disease resistance genes using a barley mapping population evaluated in Peru, Mexico, and the USA C. Rossi A. Cuesta-Marcos I. Vales L. Gomez-Pando G. Orjeda R. Wise K. Sato K. Hori F. Capettini H. Vivar X. Chen P. Hayes Received: 14 April 2006 / Accepted: 24 August 2006 ȑ Springer Science+Business Media B.V. 2006

Welcome message from author
This document is posted to help you gain knowledge. Please leave a comment to let me know what you think about it! Share it to your friends and learn new things together.
Transcript
Abstract We used a well-characterized barley
mapping population (BCD 47 · Baronesse) to
determine if barley stripe rust (BSR) resistance
quantitative trait loci (QTL) mapped in Mexico
and the USA were effective against a reported new
race in Peru. Essentially the same resistance QTL
were detected using data from each of the three
environments, indicating that these resistance al-
leles are effective against the spectrum of naturally
occurring races at these sites. In addition to the
mapping population, we evaluated a germplasm
array consisting of lines with different numbers of
mapped BSR resistance alleles. A higher BSR
disease severity on CI10587, which has a single
qualitative resistance gene, in Peru versus Mexico
suggests there are differences in pathogen viru-
lence between the two locations. Confirmation of a
new race in Peru will require characterization using
a standard set of differentials, an experiment that is
underway. The highest levels of resistance in Peru
were observed when the qualitative resistance gene
was pyramided with quantitative resistance alleles.
We also used the mapping population to locate
QTL conferring resistance to barley leaf rust and
barley powdery mildew. For mildew, we identified
resistance QTL under field conditions in Peru that
R. WiseCorn Insects and Crop Genetics Research,USDA-ARS & Department of Plant Pathology, IowaState University, 50011-1020, Ames, IA, USA
K. Sato Æ K. HoriResearch Institute for Bioresources, OkayamaUniversity, Kurashiki 700-8530, Japan
F. Capettini Æ H. VivarICARDA/CIMMYT, El Batan, Mexico
X. ChenUSDA/ARS, 99104, Pullman, WA, USA
C. Rossi Æ I. Vales Æ P. Hayes (&)Department of Crop and Soil Science, Oregon StateUniversity, 97331-4501, Corvallis, OR, USAe-mail: [email protected]
C. RossiInstituto Nacional de Investigacion Agropecuaria(INIA), Colonia, Uruguay
A. Cuesta-MarcosEstacion Experimental de Aula Dei (CSIC),Zaragoza 50080, Spain
L. Gomez-PandoUniversity of Nacional Agraria La Molina,Lima 456, Peru
G. OrjedaUniversidad Peruana Cayetano Heredia,Lima 100, Peru
Mol Breeding
DOI 10.1007/s11032-006-9043-0
123
Mapping multiple disease resistance genes using a barleymapping population evaluated in Peru, Mexico,and the USA
C. Rossi Æ A. Cuesta-Marcos Æ I. Vales Æ L. Gomez-Pando ÆG. Orjeda Æ R. Wise Æ K. Sato Æ K. Hori Æ F. Capettini Æ H. Vivar ÆX. Chen Æ P. Hayes
Received: 14 April 2006 / Accepted: 24 August 2006� Springer Science+Business Media B.V. 2006
are distinct from the Mla resistance that we map-
ped using specific isolates under controlled condi-
tions. These results demonstrate the long-term
utility of a reference mapping population and a
well-characterized germplasm array for locating
and validating genes conferring quantitative and
qualitative resistance to multiple pathogens.
Keywords Hordeum vulgare subsp. vulgare ÆPuccinia striiformis f. sp. hordei Æ Puccinia hordei ÆBlumeria graminis f. sp. hordei Æ Quantitative
resistance Æ Qualitative resistance
Introduction
One of the principal challenges faced by plant
breeders is achieving durable disease resistance.
Qualitative resistance has been widely used
because it shows Mendelian inheritance and can be
easily managed in a breeding program. Unfortu-
nately, it is usually not durable and its effective use
requires constant monitoring of pathogen viru-
lence and the identification and introgression of
new host resistance genes (Vanderplank 1968).
There are examples of qualitative (single gene)
durability, such as the stem rust resistance in barley
conferred by Rpg1 gene (Ji et al. 1994). However,
quantitative resistance is generally thought to have
a higher probability of durability than qualitative
resistance.
We have mapped genes conferring quantitative
and qualitative resistance to barley stripe rust
(BSR; incited by Puccinia striiformis f. sp. hordei)
in multiple germplasm combinations (Chen et al.
1994; Hayes et al. 1996; Toojinda et al. 2000;
Castro et al. 2003a). We have introgressed these
genes singly, and in combination, into susceptible
backgrounds and demonstrated that they confer
acceptable levels of resistance (Toojinda et al.
1998; Castro et al. 2003a, b; Vales et al. 2005).
Similar progress has been made in other crop:
pathogen systems, e.g. rice (Hittalmani et al.
2000; Narayanan et al. 2004; Yi et al. 2004) and
soybean (Walker et al. 2004).
In 2000, there were reports of a new BSR race in
the Andean region (H. Vivar, ICARDA/
CIMMYT, personal communication). The same
year, we received data from the USDA Barley
Stripe Rust Screening Nursery [coordinated by
Dr. R. Brown and grown at Huancayo, Peru (HP)]
that included some dramatic changes in resistance
phenotype for some entries. For example, the BSR
severity for CI10587 at HP was 60%, while in
repeated tests in the Toluca Valley of Mexico
(TVM), CI10587 had shown no disease or very low
levels of disease (typically < 1%). We have map-
ped the CI10587 resistance, using phenotype data
from TVM, as a single gene on chromosome 7H
(Castro et al. 2002).
In this study, we used a well-characterized
mapping population to test the effectiveness of
BSR resistance quantitative trait locus (QTL)
alleles at HP. These QTL were mapped based on
disease severity data from TVM and Washington
State, USA (WUSA) (Vales et al. 2005). We
hypothesized that if we detected the same QTL in
Peru that we had mapped using TVM and WUSA
data, this would mean that (1) there was no new
race, or (2) there is a new race but the same QTL
resistance alleles are effective. If the population
was uniformly susceptible, this would confirm the
presence of a new race and it would demonstrate
race-specificity of the QTL. If different resistance
QTL were detected in Peru than in Mexico and
the USA, this would suggest a shift in virulence,
as well as race-specificity of QTL. In addition to
the mapping population, we included a set of
germplasm of known BSR resistance gene archi-
tecture and disease reaction, including CI10587.
During the course of the field experiment at HP,
the mapping population showed a range of phe-
notypic responses to natural infection by powdery
mildew (caused by Blumeria graminis f. sp. hor-
dei) and leaf rust (caused by Puccinia hordei). We
therefore used these data to map QTL conferring
resistance to these diseases, and in the case of
mildew, we compared the QTL results with those
obtained using defined isolates under controlled
environment conditions.
Materials and methods
Plant material
This research used two types of germplasm
resources: a mapping population and a germplasm
Mol Breeding
123
array. The ORO doubled haploid (DH) mapping
population (Vales et al. 2005) was derived from the
F1 of the cross of BCD47 and Baronesse. This
population consists of 409 lines; 94 were used in the
current study. BCD47 is a two-rowed, spring
growth habit DH line, developed via marker-
assisted selection (MAS) for BSR resistance alleles
at QTL on chromosomes 4H and 5H (Castro et al.
2003a). Baronesse is a two-rowed, spring growth
habit developed by Nordsaat Saatzucht GmbH and
introduced by Westbred, LLC to the Pacific
Northwest of the USA, where the variety is widely
grown. The germplasm array (Table 1) consisted of
23 varieties and genetic stocks of known BSR
resistance gene architecture Castro et al. (2003a, b).
Disease assessments under field conditions
Ninety-four ORO maplines, the two parents, and
the germplasm array were evaluated for disease
resistance phenotypes at the Universidad Nacional
Agraria La Molina research farm at HP in 2005 and
2006 using separate two-replicate Randomized
Complete Block Designs. Each plot consisted of
two 1-m rows. The HP facility is located at an ele-
vation of 3,320 m, with latitude 11�49¢ South and
longitude of 75�23¢ West. The following diseases
occurred in response to natural infection without
supplemental inoculation: stripe rust, leaf rust, and
powdery mildew. Stripe rust is an endemic disease
in this area and susceptible check lines produce the
inoculum necessary for infection. All three dis-
eases were scored for disease severity on a plot
basis using visual assessment of the percentage of
crop canopy infected. Ratings were made when the
majority of the test genotypes were at growth stage
55 on the Zadocks scale. For the purposes of
comparing resistance QTL number, location, and
effect, we used the BSR severity data reported by
Vales et al. (2005) for the same 94 lines from the
TVM, and Pullman and Mt. Vernon, WUSA.
Disease assessments under controlled conditions
Blumeria graminis f. sp. hordei (Bgh) isolates
5874 (Torp et al. 1978; Wei et al. 1999; AvrMla1,
AvrMla6, AvrMla12) and A27 (Giese et al. 1981;
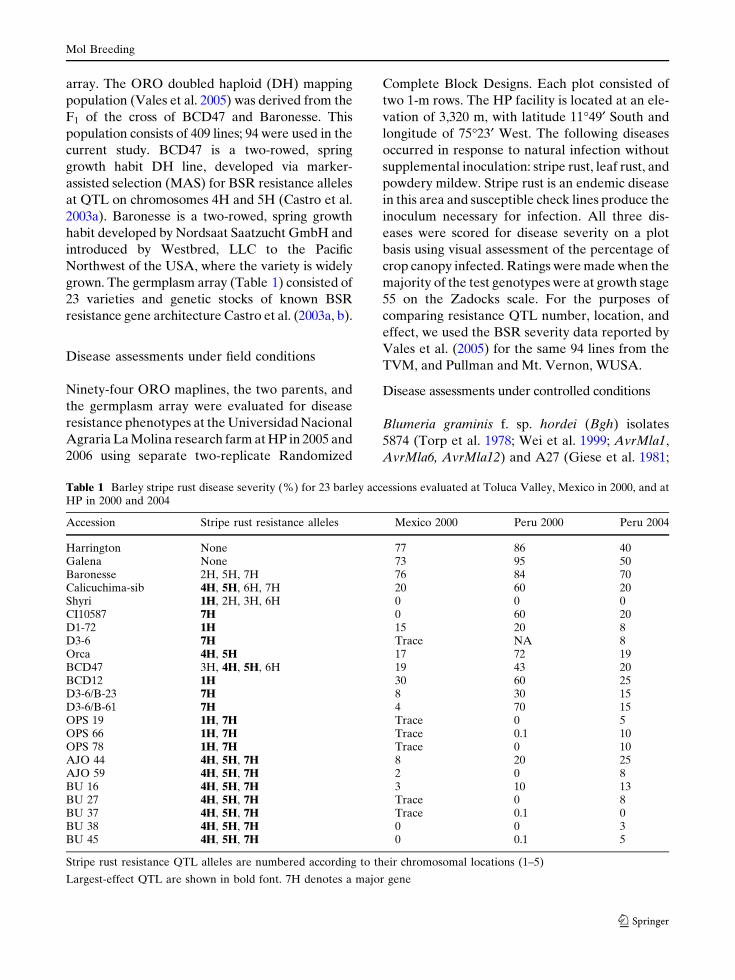
Table 1 Barley stripe rust disease severity (%) for 23 barley accessions evaluated at Toluca Valley, Mexico in 2000, and atHP in 2000 and 2004
Accession Stripe rust resistance alleles Mexico 2000 Peru 2000 Peru 2004
Harrington None 77 86 40Galena None 73 95 50Baronesse 2H, 5H, 7H 76 84 70Calicuchima-sib 4H, 5H, 6H, 7H 20 60 20Shyri 1H, 2H, 3H, 6H 0 0 0CI10587 7H 0 60 20D1-72 1H 15 20 8D3-6 7H Trace NA 8Orca 4H, 5H 17 72 19BCD47 3H, 4H, 5H, 6H 19 43 20BCD12 1H 30 60 25D3-6/B-23 7H 8 30 15D3-6/B-61 7H 4 70 15OPS 19 1H, 7H Trace 0 5OPS 66 1H, 7H Trace 0.1 10OPS 78 1H, 7H Trace 0 10AJO 44 4H, 5H, 7H 8 20 25AJO 59 4H, 5H, 7H 2 0 8BU 16 4H, 5H, 7H 3 10 13BU 27 4H, 5H, 7H Trace 0 8BU 37 4H, 5H, 7H Trace 0.1 0BU 38 4H, 5H, 7H 0 0 3BU 45 4H, 5H, 7H 0 0.1 5
Stripe rust resistance QTL alleles are numbered according to their chromosomal locations (1–5)
Largest-effect QTL are shown in bold font. 7H denotes a major gene
Mol Breeding
123
AvrMla1, AvrMla7, AvrMla10, AvrMla13) were
propagated at Iowa State University on H. vulgare
cv. Manchuria (C.I. 2330) in separate growth
chambers at 18�C (16 h light/8 h darkness). The
same 94 DH lines that were characterized in Peru
were grown in three, 36-cell flats. Groups of three
seedlings per DH line were sown per cell in each
flat. The Baronesse and BCD47 parents, C.I. 16137
(Mla1), C.I. 16151 (Mla6), C.I. 16149 (Mla10),
Sultan5 (Mla12), C.I. 16155 (Mla13), in addition to
the fully susceptible Manchuria (C.I. 2330), were
used as checks (Moseman 1972). Seedlings were
grown to the second leaf stage with the first leaf
unfolded, and inoculation was performed at
16:00 h. US Central Standard Time by tipping the
flats at 45� angle and dusting the plants with a high
density of fresh conidiospores (84 ± 19 spores/
mm2). This conidial density per unit leaf area
routinely results in greater than 50% of epidermal
cells that are successfully infected (Bushnell 2002;
Collinge et al. 2002). Groups of flats were placed
at 18�C (16 h light, 8 h darkness) in separate
controlled growth chambers corresponding to
the two Bgh isolates (5874 and A27). Infection
types were scored at 7 and 9 days post-inoculation
as described in Wei et al. (1999). The infection
types 0, 1, or 2 are considered resistant reactions
while the infection types 3 or 4 are considered
susceptible.
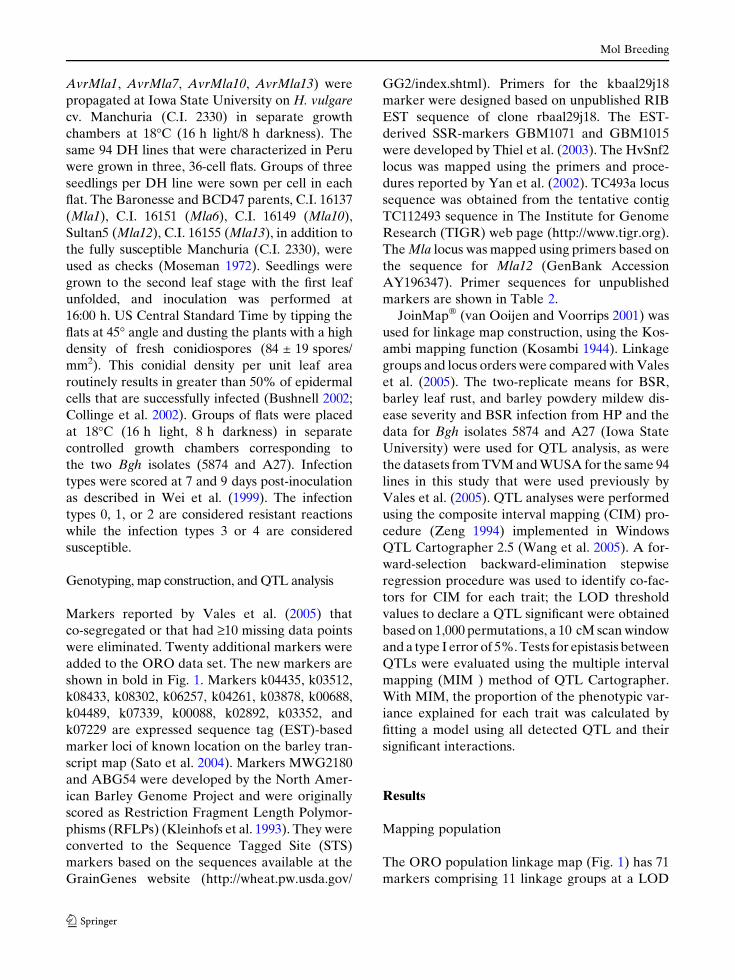
Genotyping, map construction, and QTL analysis
Markers reported by Vales et al. (2005) that
co-segregated or that had ‡10 missing data points
were eliminated. Twenty additional markers were
added to the ORO data set. The new markers are
shown in bold in Fig. 1. Markers k04435, k03512,
k08433, k08302, k06257, k04261, k03878, k00688,
k04489, k07339, k00088, k02892, k03352, and
k07229 are expressed sequence tag (EST)-based
marker loci of known location on the barley tran-
script map (Sato et al. 2004). Markers MWG2180
and ABG54 were developed by the North Amer-
ican Barley Genome Project and were originally
scored as Restriction Fragment Length Polymor-
phisms (RFLPs) (Kleinhofs et al. 1993). They were
converted to the Sequence Tagged Site (STS)
markers based on the sequences available at the
GrainGenes website (http://wheat.pw.usda.gov/
GG2/index.shtml). Primers for the kbaal29j18
marker were designed based on unpublished RIB
EST sequence of clone rbaal29j18. The EST-
derived SSR-markers GBM1071 and GBM1015
were developed by Thiel et al. (2003). The HvSnf2
locus was mapped using the primers and proce-
dures reported by Yan et al. (2002). TC493a locus
sequence was obtained from the tentative contig
TC112493 sequence in The Institute for Genome
Research (TIGR) web page (http://www.tigr.org).
The Mla locus was mapped using primers based on
the sequence for Mla12 (GenBank Accession
AY196347). Primer sequences for unpublished
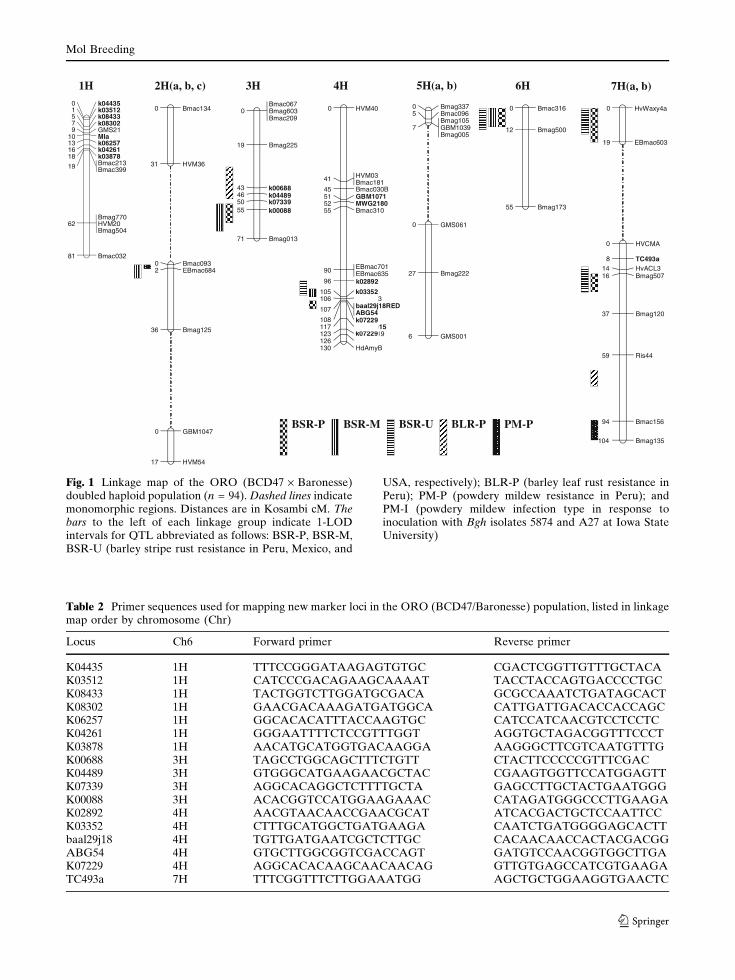
markers are shown in Table 2.
JoinMap� (van Ooijen and Voorrips 2001) was
used for linkage map construction, using the Kos-
ambi mapping function (Kosambi 1944). Linkage
groups and locus orders were compared with Vales
et al. (2005). The two-replicate means for BSR,
barley leaf rust, and barley powdery mildew dis-
ease severity and BSR infection from HP and the
data for Bgh isolates 5874 and A27 (Iowa State
University) were used for QTL analysis, as were
the datasets from TVM and WUSA for the same 94
lines in this study that were used previously by
Vales et al. (2005). QTL analyses were performed
using the composite interval mapping (CIM) pro-
cedure (Zeng 1994) implemented in Windows
QTL Cartographer 2.5 (Wang et al. 2005). A for-
ward-selection backward-elimination stepwise
regression procedure was used to identify co-fac-
tors for CIM for each trait; the LOD threshold
values to declare a QTL significant were obtained
based on 1,000 permutations, a 10 cM scan window
and a type I error of 5%. Tests for epistasis between
QTLs were evaluated using the multiple interval
mapping (MIM ) method of QTL Cartographer.
With MIM, the proportion of the phenotypic var-
iance explained for each trait was calculated by
fitting a model using all detected QTL and their
significant interactions.
Results
Mapping population
The ORO population linkage map (Fig. 1) has 71
markers comprising 11 linkage groups at a LOD
Mol Breeding
123
BSR-P BSR-M BSR-U BLR-P PM-P
HVCMA0
TC493a8HvACL314Bmag50716
Bmag12037
Ris4459
Bmac15694
Bmag135104
HvWaxy4a0
EBmac60319
7H(a, b)
Bmac3160
Bmag50012
Bmag17355
6H2H(a, b, c)
Bmac1340
HVM3631
Bmac0930EBmac6842
Bmag12536
GBM10470
HVM5417
5H(a, b)
Bmag3370Bmac0965Bmag105GBM1039Bmag005
7
GMS0610
Bmag22227
GMS0016
k03512
k08302
k06257k04261k03878Bmac213Bmac399
1Hk04435
k08433
GMS21Mla
Bmag770HVM20Bmag504
Bmac032
01579
10131618
19
62
81
Bmac067Bmag603Bmac209
0
Bmag22519
43465055
Bmag01371
3H
k00688k04489k07339k00088
HVM400
HVM03Bmac18141
Bmac030B45GBM107151MWG218052Bmac31055
EBmac701EBmac63590
*96
*105HvMLO3106baal29j18REDABG54107
*108GBM1015117Bmag419123HvSnf2126HdAmyB130
4H
k02892
k03352
k07229
k07229
Fig. 1 Linkage map of the ORO (BCD47 · Baronesse)doubled haploid population (n = 94). Dashed lines indicatemonomorphic regions. Distances are in Kosambi cM. Thebars to the left of each linkage group indicate 1-LODintervals for QTL abbreviated as follows: BSR-P, BSR-M,BSR-U (barley stripe rust resistance in Peru, Mexico, and
USA, respectively); BLR-P (barley leaf rust resistance inPeru); PM-P (powdery mildew resistance in Peru); andPM-I (powdery mildew infection type in response toinoculation with Bgh isolates 5874 and A27 at Iowa StateUniversity)
Table 2 Primer sequences used for mapping new marker loci in the ORO (BCD47/Baronesse) population, listed in linkagemap order by chromosome (Chr)
Locus Ch6 Forward primer Reverse primer
K04435 1H TTTCCGGGATAAGAGTGTGC CGACTCGGTTGTTTGCTACAK03512 1H CATCCCGACAGAAGCAAAAT TACCTACCAGTGACCCCTGCK08433 1H TACTGGTCTTGGATGCGACA GCGCCAAATCTGATAGCACTK08302 1H GAACGACAAAGATGATGGCA CATTGATTGACACCACCAGCK06257 1H GGCACACATTTACCAAGTGC CATCCATCAACGTCCTCCTCK04261 1H GGGAATTTTCTCCGTTTGGT AGGTGCTAGACGGTTTCCCTK03878 1H AACATGCATGGTGACAAGGA AAGGGCTTCGTCAATGTTTGK00688 3H TAGCCTGGCAGCTTTCTGTT CTACTTCCCCCGTTTCGACK04489 3H GTGGGCATGAAGAACGCTAC CGAAGTGGTTCCATGGAGTTK07339 3H AGGCACAGGCTCTTTTGCTA GAGCCTTGCTACTGAATGGGK00088 3H ACACGGTCCATGGAAGAAAC CATAGATGGGCCCTTGAAGAK02892 4H AACGTAACAACCGAACGCAT ATCACGACTGCTCCAATTCCK03352 4H CTTTGCATGGCTGATGAAGA CAATCTGATGGGGAGCACTTbaal29j18 4H TGTTGATGAATCGCTCTTGC CACAACAACCACTACGACGGABG54 4H GTGCTTGGCGGTCGACCAGT GATGTCCAACGGTGGCTTGAK07229 4H AGGCACACAAGCAACAACAG GTTGTGAGCCATCGTGAAGATC493a 7H TTTCGGTTTCTTGGAAATGG AGCTGCTGGAAGGTGAACTC
Mol Breeding
123
threshold grouping value of 4.0. All linkage
groups were assigned to barley chromosomes per
Vales et al. (2005), with more than one linkage
group for chromosomes 2H, 5H, and 7H. The
map covers 611.8 cM, corresponding to an aver-
age density of 8.7 cM per marker. Segregation
distortion (p < 0.05) in favor of Baronesse was
observed in chromosome 3H (k00688, k04489,
k07339, and k00088) and chromosome 4H
(Bmac310 and GBM1015); and in favor of
BCD47 in chromosome 1H (Bmag770, HVM20,
and Bmag504).
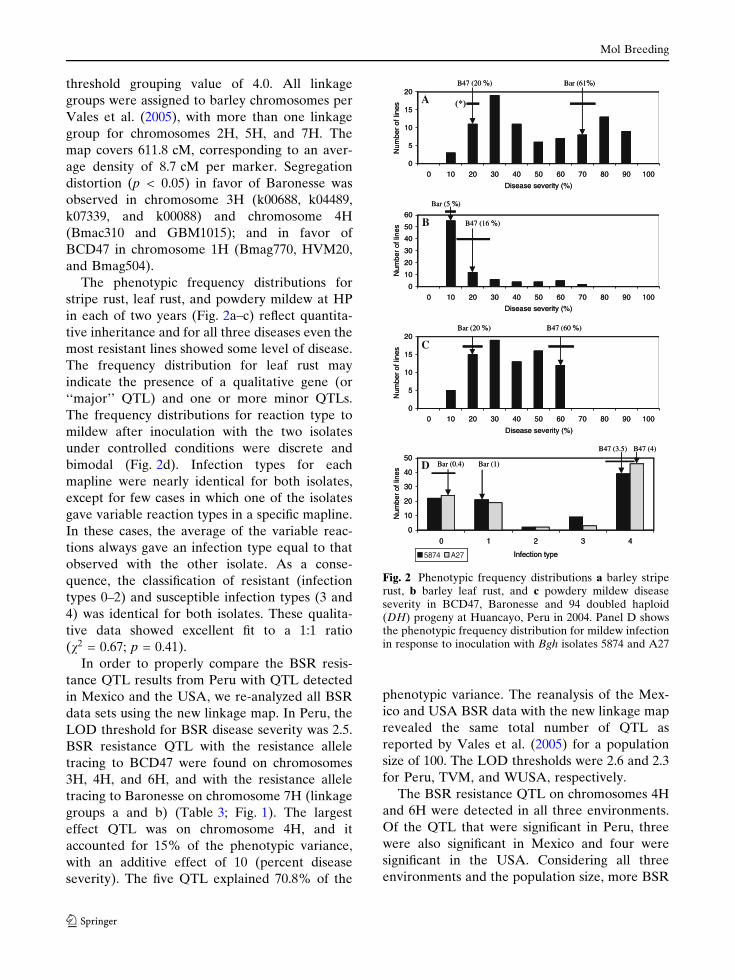
The phenotypic frequency distributions for
stripe rust, leaf rust, and powdery mildew at HP
in each of two years (Fig. 2a–c) reflect quantita-
tive inheritance and for all three diseases even the
most resistant lines showed some level of disease.
The frequency distribution for leaf rust may
indicate the presence of a qualitative gene (or
‘‘major’’ QTL) and one or more minor QTLs.
The frequency distributions for reaction type to
mildew after inoculation with the two isolates
under controlled conditions were discrete and
bimodal (Fig. 2d). Infection types for each
mapline were nearly identical for both isolates,
except for few cases in which one of the isolates
gave variable reaction types in a specific mapline.
In these cases, the average of the variable reac-
tions always gave an infection type equal to that
observed with the other isolate. As a conse-
quence, the classification of resistant (infection
types 0–2) and susceptible infection types (3 and
4) was identical for both isolates. These qualita-
tive data showed excellent fit to a 1:1 ratio
(v2 = 0.67; p = 0.41).
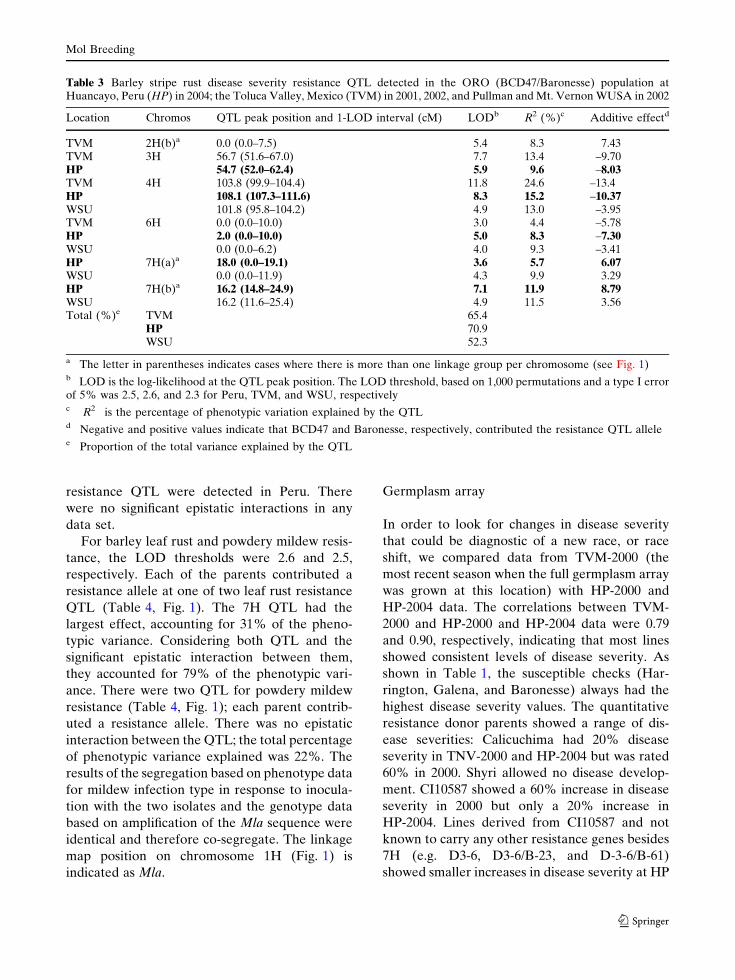
In order to properly compare the BSR resis-
tance QTL results from Peru with QTL detected
in Mexico and the USA, we re-analyzed all BSR
data sets using the new linkage map. In Peru, the
LOD threshold for BSR disease severity was 2.5.
BSR resistance QTL with the resistance allele
tracing to BCD47 were found on chromosomes
3H, 4H, and 6H, and with the resistance allele
tracing to Baronesse on chromosome 7H (linkage
groups a and b) (Table 3; Fig. 1). The largest
effect QTL was on chromosome 4H, and it
accounted for 15% of the phenotypic variance,
with an additive effect of 10 (percent disease
severity). The five QTL explained 70.8% of the
phenotypic variance. The reanalysis of the Mex-
ico and USA BSR data with the new linkage map
revealed the same total number of QTL as
reported by Vales et al. (2005) for a population
size of 100. The LOD thresholds were 2.6 and 2.3
for Peru, TVM, and WUSA, respectively.
The BSR resistance QTL on chromosomes 4H
and 6H were detected in all three environments.
Of the QTL that were significant in Peru, three
were also significant in Mexico and four were
significant in the USA. Considering all three
environments and the population size, more BSR
Bar (5 %)
0
5
10
15
20
0 10 20 30 40 50 60 70 80 90 100
Disease severity (%)
Disease severity (%)
Disease severity (%)
Num
ber
of li
nes
Num
ber
of li
nes
Num
ber
of li
nes
Num
ber
of li
nes
0
10
20
30
40
50
60
0 10 20 30 40 50 60 70 80 90 100
0
5
10
15
20
0 10 20 30 40 50 60 70 80 90 100
Bar (61%)
B47 (16 %)
B47 (60 %) Bar (20 %)
B47 (20 %)
(*)
0
10
20
30
40
50
0 1 2 3 4
Infection type5874 A27
Bar (0.4)
B47 (3.5)
Bar (1)
B47 (4)
A
B
C
D
Fig. 2 Phenotypic frequency distributions a barley striperust, b barley leaf rust, and c powdery mildew diseaseseverity in BCD47, Baronesse and 94 doubled haploid(DH) progeny at Huancayo, Peru in 2004. Panel D showsthe phenotypic frequency distribution for mildew infectionin response to inoculation with Bgh isolates 5874 and A27
Mol Breeding
123
resistance QTL were detected in Peru. There
were no significant epistatic interactions in any
data set.
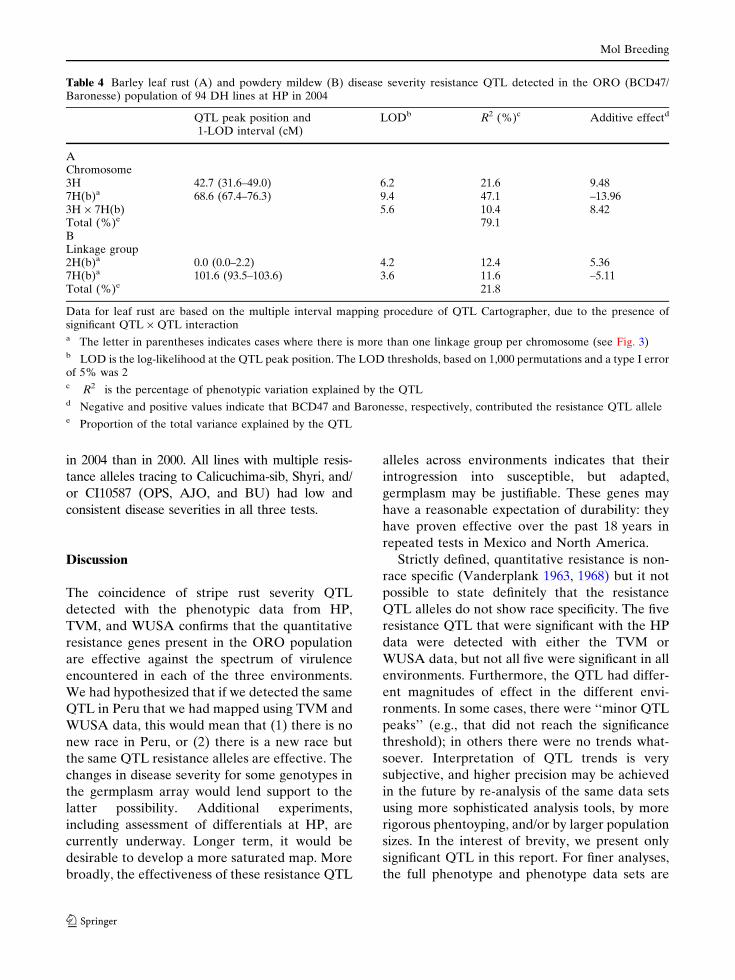
For barley leaf rust and powdery mildew resis-
tance, the LOD thresholds were 2.6 and 2.5,
respectively. Each of the parents contributed a
resistance allele at one of two leaf rust resistance
QTL (Table 4, Fig. 1). The 7H QTL had the
largest effect, accounting for 31% of the pheno-
typic variance. Considering both QTL and the
significant epistatic interaction between them,
they accounted for 79% of the phenotypic vari-
ance. There were two QTL for powdery mildew
resistance (Table 4, Fig. 1); each parent contrib-
uted a resistance allele. There was no epistatic
interaction between the QTL; the total percentage
of phenotypic variance explained was 22%. The
results of the segregation based on phenotype data
for mildew infection type in response to inocula-
tion with the two isolates and the genotype data
based on amplification of the Mla sequence were
identical and therefore co-segregate. The linkage
map position on chromosome 1H (Fig. 1) is
indicated as Mla.
Germplasm array
In order to look for changes in disease severity
that could be diagnostic of a new race, or race
shift, we compared data from TVM-2000 (the
most recent season when the full germplasm array
was grown at this location) with HP-2000 and
HP-2004 data. The correlations between TVM-
2000 and HP-2000 and HP-2004 data were 0.79
and 0.90, respectively, indicating that most lines
showed consistent levels of disease severity. As
shown in Table 1, the susceptible checks (Har-
rington, Galena, and Baronesse) always had the
highest disease severity values. The quantitative
resistance donor parents showed a range of dis-
ease severities: Calicuchima had 20% disease
severity in TNV-2000 and HP-2004 but was rated
60% in 2000. Shyri allowed no disease develop-
ment. CI10587 showed a 60% increase in disease
severity in 2000 but only a 20% increase in
HP-2004. Lines derived from CI10587 and not
known to carry any other resistance genes besides
7H (e.g. D3-6, D3-6/B-23, and D-3-6/B-61)
showed smaller increases in disease severity at HP
Table 3 Barley stripe rust disease severity resistance QTL detected in the ORO (BCD47/Baronesse) population atHuancayo, Peru (HP) in 2004; the Toluca Valley, Mexico (TVM) in 2001, 2002, and Pullman and Mt. Vernon WUSA in 2002
Location Chromos QTL peak position and 1-LOD interval (cM) LODb R2 (%)c Additive effectd
TVM 2H(b)a 0.0 (0.0–7.5) 5.4 8.3 7.43TVM 3H 56.7 (51.6–67.0) 7.7 13.4 –9.70HP 54.7 (52.0–62.4) 5.9 9.6 –8.03TVM 4H 103.8 (99.9–104.4) 11.8 24.6 –13.4HP 108.1 (107.3–111.6) 8.3 15.2 –10.37WSU 101.8 (95.8–104.2) 4.9 13.0 –3.95TVM 6H 0.0 (0.0–10.0) 3.0 4.4 –5.78HP 2.0 (0.0–10.0) 5.0 8.3 –7.30WSU 0.0 (0.0–6.2) 4.0 9.3 –3.41HP 7H(a)a 18.0 (0.0–19.1) 3.6 5.7 6.07WSU 0.0 (0.0–11.9) 4.3 9.9 3.29HP 7H(b)a 16.2 (14.8–24.9) 7.1 11.9 8.79WSU 16.2 (11.6–25.4) 4.9 11.5 3.56Total (%)e TVM 65.4
HP 70.9WSU 52.3
a The letter in parentheses indicates cases where there is more than one linkage group per chromosome (see Fig. 1)b LOD is the log-likelihood at the QTL peak position. The LOD threshold, based on 1,000 permutations and a type I errorof 5% was 2.5, 2.6, and 2.3 for Peru, TVM, and WSU, respectivelyc R2 is the percentage of phenotypic variation explained by the QTLd Negative and positive values indicate that BCD47 and Baronesse, respectively, contributed the resistance QTL allelee Proportion of the total variance explained by the QTL
Mol Breeding
123
in 2004 than in 2000. All lines with multiple resis-
tance alleles tracing to Calicuchima-sib, Shyri, and/
or CI10587 (OPS, AJO, and BU) had low and
consistent disease severities in all three tests.
Discussion
The coincidence of stripe rust severity QTL
detected with the phenotypic data from HP,
TVM, and WUSA confirms that the quantitative
resistance genes present in the ORO population
are effective against the spectrum of virulence
encountered in each of the three environments.
We had hypothesized that if we detected the same
QTL in Peru that we had mapped using TVM and
WUSA data, this would mean that (1) there is no
new race in Peru, or (2) there is a new race but
the same QTL resistance alleles are effective. The
changes in disease severity for some genotypes in
the germplasm array would lend support to the
latter possibility. Additional experiments,
including assessment of differentials at HP, are
currently underway. Longer term, it would be
desirable to develop a more saturated map. More
broadly, the effectiveness of these resistance QTL
alleles across environments indicates that their
introgression into susceptible, but adapted,
germplasm may be justifiable. These genes may
have a reasonable expectation of durability: they
have proven effective over the past 18 years in
repeated tests in Mexico and North America.
Strictly defined, quantitative resistance is non-
race specific (Vanderplank 1963, 1968) but it not
possible to state definitely that the resistance
QTL alleles do not show race specificity. The five
resistance QTL that were significant with the HP
data were detected with either the TVM or
WUSA data, but not all five were significant in all
environments. Furthermore, the QTL had differ-
ent magnitudes of effect in the different envi-
ronments. In some cases, there were ‘‘minor QTL
peaks’’ (e.g., that did not reach the significance
threshold); in others there were no trends what-
soever. Interpretation of QTL trends is very
subjective, and higher precision may be achieved
in the future by re-analysis of the same data sets
using more sophisticated analysis tools, by more
rigorous phentoyping, and/or by larger population
sizes. In the interest of brevity, we present only
significant QTL in this report. For finer analyses,
the full phenotype and phenotype data sets are
Table 4 Barley leaf rust (A) and powdery mildew (B) disease severity resistance QTL detected in the ORO (BCD47/Baronesse) population of 94 DH lines at HP in 2004
QTL peak position and1-LOD interval (cM)
LODb R2 (%)c Additive effectd
AChromosome3H 42.7 (31.6–49.0) 6.2 21.6 9.487H(b)a 68.6 (67.4–76.3) 9.4 47.1 –13.963H · 7H(b) 5.6 10.4 8.42Total (%)e 79.1BLinkage group2H(b)a 0.0 (0.0–2.2) 4.2 12.4 5.367H(b)a 101.6 (93.5–103.6) 3.6 11.6 –5.11Total (%)e 21.8
Data for leaf rust are based on the multiple interval mapping procedure of QTL Cartographer, due to the presence ofsignificant QTL · QTL interactiona The letter in parentheses indicates cases where there is more than one linkage group per chromosome (see Fig. 3)b LOD is the log-likelihood at the QTL peak position. The LOD thresholds, based on 1,000 permutations and a type I errorof 5% was 2c R2 is the percentage of phenotypic variation explained by the QTLd Negative and positive values indicate that BCD47 and Baronesse, respectively, contributed the resistance QTL allelee Proportion of the total variance explained by the QTL
Mol Breeding
123
available from the corresponding author. The
difference in number and location of significant
QTL could be due to a number of causes. Evi-
dence for some race-specificity, and a degree of
race specificity has been reported for some leaf
rust resistance QTL (Qi et al. 1998, 1999; Lindh-
out 2002). It is also true that changes in race
specificity can show quantitative rather than
qualitative effects (Qi et al. 1998, 1999). Alter-
natively, differences in environmental effects
(e.g., temperature, photoperiod, and nutritional
status of the crop) could influence the onset of
initial infection. Although purely speculative, it is
also possible that qualitative resistance against a
specific isolate might appear to be quantitative
resistance, either by induced resistance or due to
a dilution effect. The most prosaic explanation is
that the difference in the number of QTL
detected, and the differences in estimates of QTL
effect, are biases due to small population size.
The BSR QTL are located in resistance gene-
rich regions of the genome (Toojinda et al. 2000;
Hayes et al. 2003). There is ample evidence for
the existence of resistance gene clusters in plants
(Chelkowski et al. 2003; Williams 2003), and for
the occurrence of quantitative and qualitative
resistance genes within such clusters (Wisser et al.
2005). Of particular interest is the presence of
BSR resistance QTL detected in the same regions
as the powdery mildew resistance loci: the Mla
locus on 1H (Toojinda et al. 2000) and the mlo
locus on 4H (this study).
This linkage map proximity of BSR resistance
QTL and qualitative mildew resistance genes,
together with mildew resistance QTL mapped
with the Peru phenotype data, prompted us to
determine if either Mla or mlo resistance alleles
were present in BCD47 and/or Baronesse.
BCD47 had not been characterized for its
response to specific isolates of mildew. Baronesse
is reported to carry Mla3 resistance (Hovmøller
et al. 2000; Dreiseitl 2003), and analysis of its
pedigree (Mentor/Minerva// mutant Vada ////
Carlsberg/ Union///Opvasky/Salle//Ricardo/////
Oriol/6153P40) reveals that the Mentor, Carls-
berg, Oriol, and Ricardo parents are reported to
carry Mla12, Mla8, Mla7, and Mla3 alleles,
respectively (www.scri.sari.ac.uk/cprad). The
mildew infection type data cosegregate with the
results of the genotyping based on Mla12-derived
primers. These results clearly confirm the report
that Baronesse carries Mla resistance, although
the exact allele cannot be determined from these
data. None of the mildew resistance QTL are
coincident with Mla. There are no reports of
mildew resistance, either qualitative or quantita-
tive, at the position of the 2H(b) QTL. Based on
visual alignment of linkage maps, the QTL on
chromosome 7H(b) is in the same region as Mlf
(Schonfeld et al. 1996) and a powdery mildew
resistance QTL in H. vulgare spp. spontaneum
(Backes et al. 2003). The two leaf rust resistance
QTL alleles, either of which was sufficient to
confer resistance, were also found in regions of
the barley genome where other resistance genes
are reported. The 3H QTL is in the same region
as Rph10 (Feurestein et al. 1990) and the QTL on
7H(b) is located in the same region as the RphX
gene mapped in Cali-sib and Shyri (Hayes et al.
1996; Toojinda et al. 2000). Also mapping to this
region are RphQ9, a QTL with race specificity
(Qi et al. 1999; Lindhout 2002), and Rph3 (Park
and Karakousis 2002).
Our rationale for assessing both the mapping
population and a germplasm array was that one or
more of the genetic stocks could be diagnostic of
a new race, or a shift in race frequency. CI10587
showed the most dramatic change in phenotype,
with a 60% disease severity rating in HP2000 vs.
0% in TVM2000 (Castro et al. 2003a). However,
the disease severity of CI10587 was only 20% in
HP2004. This discrepancy merits further study,
since the 0–60% difference in disease severity
suggests ‘‘defeat’’ of a major gene by a new race
whereas a 20% increase in disease is more indic-
ative of a resistance gene behaving as a major
gene in response to one race and as a QTL to
another race, a phenomenon reported in rice with
bacterial blight (Li et al. 1999). Alternatively,
CI10587 may possess minor genes for resistance
to BSR that have heretofore been undetected.
There was a tendency toward increasing levels
of resistance when more resistance QTL alleles
were pyramided per line, as reported by Castro
et al. (2003a), although the differences were not
significant. Of particular interest are the lines with
7H qualitative resistance gene from CI10587. This
gene did not confer an acceptable level of
Mol Breeding
123
resistance in 2000 and more disease was observed
in 2004 than expected based on prior ratings in
Mexico. However, when deployed in combination
with quantitative resistance alleles at 1H or
4H + 5H lines with this gene had some of the
lowest levels of disease severity.
Baronesse, of European origin and moderately
susceptible to BSR, contributed resistance alleles
effective in the Andean environment. Of two
parents, it was also the most resistant to leaf rust
and mildew. The presence of positive and nega-
tive transgressive segregants is reported in many
disease QTL studies and thus the contribution of
positive alleles from ‘‘susceptible’’ parents is not
entirely unexpected (Hayes et al. 2003). The
availability of genotype and phenotype informa-
tion on the ORO population could be useful in
introgressing the resistance genes in both Baro-
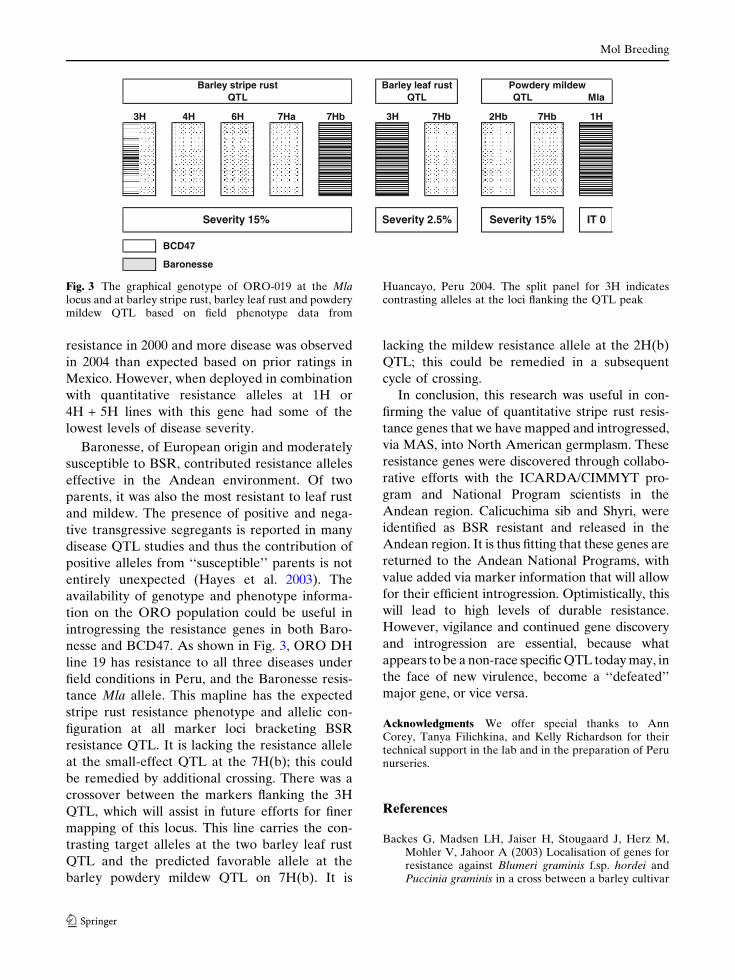
nesse and BCD47. As shown in Fig. 3, ORO DH
line 19 has resistance to all three diseases under
field conditions in Peru, and the Baronesse resis-
tance Mla allele. This mapline has the expected
stripe rust resistance phenotype and allelic con-
figuration at all marker loci bracketing BSR
resistance QTL. It is lacking the resistance allele
at the small-effect QTL at the 7H(b); this could
be remedied by additional crossing. There was a
crossover between the markers flanking the 3H
QTL, which will assist in future efforts for finer
mapping of this locus. This line carries the con-
trasting target alleles at the two barley leaf rust
QTL and the predicted favorable allele at the
barley powdery mildew QTL on 7H(b). It is
lacking the mildew resistance allele at the 2H(b)
QTL; this could be remedied in a subsequent
cycle of crossing.
In conclusion, this research was useful in con-
firming the value of quantitative stripe rust resis-
tance genes that we have mapped and introgressed,
via MAS, into North American germplasm. These
resistance genes were discovered through collabo-
rative efforts with the ICARDA/CIMMYT pro-
gram and National Program scientists in the
Andean region. Calicuchima sib and Shyri, were
identified as BSR resistant and released in the
Andean region. It is thus fitting that these genes are
returned to the Andean National Programs, with
value added via marker information that will allow
for their efficient introgression. Optimistically, this
will lead to high levels of durable resistance.
However, vigilance and continued gene discovery
and introgression are essential, because what
appears to be a non-race specific QTL today may, in
the face of new virulence, become a ‘‘defeated’’
major gene, or vice versa.
Acknowledgments We offer special thanks to AnnCorey, Tanya Filichkina, and Kelly Richardson for theirtechnical support in the lab and in the preparation of Perunurseries.
References
Backes G, Madsen LH, Jaiser H, Stougaard J, Herz M,Mohler V, Jahoor A (2003) Localisation of genes forresistance against Blumeri graminis f.sp. hordei andPuccinia graminis in a cross between a barley cultivar
BCD47
Baronesse
Severity 15% Severity 2.5% Severity 15% IT 0
1H
QTL MlaQTLBarley leaf rust
3H 7Hb 2Hb 7Hb
Powdery mildew
7Hb3H
Barley stripe rustQTL
4H 6H 7Ha
Fig. 3 The graphical genotype of ORO-019 at the Mlalocus and at barley stripe rust, barley leaf rust and powderymildew QTL based on field phenotype data from
Huancayo, Peru 2004. The split panel for 3H indicatescontrasting alleles at the loci flanking the QTL peak
Mol Breeding
123
and a wild barley (Hordeum vulgare ssp. spontaneum)line. Theor Appl Genet 106:353–362
Bushnell WR (2002) The role of powdery mildew researchin understanding host-parasite interaction: past,present and future. In: Belanger RR, Bushnell WR,Dik AJ, Carver TLW (eds) The powdery mildews: acomprehensive treatise. APS Press, St. Paul, MN, pp1–12
Castro AJ, Hayes PM, Fillichkin T, Rossi C (2002) Updateof barley stripe rust resistance in the Calicuchima-sibx Bowman mapping population. Barley Genet Newsl32:1–12
Castro AJ, Capettini F, Corey AE, Fillichkin T, Hayes PM,Kleinhofs A, Kudrna D, Richardson K, Sandoval-IslasS, Rossi C, Vivar H (2003a) Mapping and pyramidingof qualitative and quantitative resistance to stripe rustin barley. Theor Appl Genet 107:922–930
Castro AJ, Chen XM, Hayes PM, Johnston M (2003b)Pyramiding quantitative trait locus (QTL) allelesdetermining resistance to barley stripe rust: effects onresistance at seedling stage. Crop Sci 43:651–659
Chelkowski J, Tyraka M, Sobkiewicz A (2003) Resistancegenes in barley (Horedum vulgare) and their identi-fication with molecular markers. J App Genet 44:291–309
Chen F, Prehn D, Hayes PM, Mulrooney D, Corey A,Vivar H (1994) Mapping genes for resistance to barleystripe rust (Puccinia striiformis f. sp. hordei). TheorAppl Genet 88:215–219
Collinge DB, Gregersen PL, Thordal-Christensen H(2002) The nature and role of defense response genesin cereals. In: Belanger RR, Bushnell WR, Dik AJ,Carver TLW (eds) The powdery mildews: a compre-hensive treatise. APS Press, St. Paul, MN, pp 146–160
Dreiseitl A (2003) Adapation of Blumeria graminis f.sp.hordei to barley resistance genes in the CzechRepublic in 1971–2000. Plant Soil Environ 49:241–248
Feurestein U, Brown AHD, Burdon JJ (1990) Linkage ofrust resistance genes from wild Barley (Hordeumspontaneum) with isozyme markers. Plant Breed104:318–324
Giese H, Jørgensen JH, Jensen HP, Jensen J (1981)Linkage relationships of ten powdery mildew resis-tance genes on barley chromosome 5. Hereditas95:43–50
Hayes P, Prehn D, Vivar H, Blake T, Comeau A, Henry I,Johnston M, Jones B, Steffenson B, St. Pierre CA,Chen F (1996) Multiple disease resistance loci andtheir relationship to agronomic and quality loci in aspring barley population. http://probe.nal-usda.gov:8000/otherdocs/jqtl/jqtl1996-02/jqtl22.html
Hayes PM, Castro A, Marquez-Cedillo L, Corey A, Hen-son C, Jones BL, Kling J, Mather D, Matus I, Rossi C,Sato K (2003) Genetic diversity for quantitativeinherited agronomic and malting quality traits. In: vonBothmer R et al (eds) Diversity in barley (Hordeumvulgare). Elsevier Science Publishers, Amsterdam
Hittalmani S, Parco A, Mew TV, Zeigler RS, Huang N(2000) Fine mapping and DNA marker-assisted pyr-amiding of the three major genes for blast resistancein rice. Theor Appl Genet 100:1121–1128
Hovmøller MS, Caffier V, Jalli M, Andersen O, Bes-enhofer G, Czembor JH, Dreiseitl A, Felsenstein F,Fleck A, Heinrics F, Jonsson R, Limpert E, Mercer P,Plesnik S, Rashal I, Skinnes H, Slater S, Vronska O(2000) The European barley powdery mildew viru-lence survey and disease nursery 1993–1999. Agron-omie 20:729–743
Ji Y, Steffenson BJ, Fetch TG, Jr (1994) Sources ofresistance to pathotype QCC of Puccinia graminis f.sp. tritici in barley. Crop Sci 34:285–288
Kleinhofs A, Kilian A, Saghai Maroof MA, Biyashev RM,Hayes P, Chen FQ, Lapitan N, Fenwich A, Blake TK,Kanazin V, Ananiev E, Dahleen L, Kudrna D, Bol-linger J, Knapp SJ, Liu B, Sorrells M, Heun M,Franckowiak JD, Hoffman D, Skadsen R, SteffensonBJ (1993) A molecular, isozyme and morphologicalmap of the barley (Hordeum vulgare) genome. TheorAppl Genet 86:705–712
Kosambi DD (1944) The estimation of map distance fromrecombination values. Ann Eugen 12:172–175
Li ZK, Luo LJ, Mei HW, Paterson AH, Zhao XH, ZhongDB, Wang YP, Yu XQ, Zhu L, Tabien R, Stansel JW,Ying CS (1999) A defeated rice resistance gene acts asa QTL against a virulent strain of Xanthomonas ory-zae pv. oryzae. Mol Gen Genet 261:58–63
Lindhout P (2002) The perspectives of polygenic resistancein breeding for durable disease resistance. Euphytica124:217–226
Moseman JG (1972) Isogenic barley lines for reaction toErysiphe graminis f. sp. hordei. Crop Sci 12:681–682
Narayanan NN, Baisakh N, Oliva NP, Vera Cruz CM,Gnanamanickam SS, Datta K, Datta SK (2004)Molecular breeding: marker assisted selection com-bined with biolistic transformation for blast and bac-terial blight resistance in Indica rice (cv. CO39). MolBreed 14:61–71
Park RF, Karakousis A (2002) Characterization andmapping of gene Rph19 conferring resistance toPuccinia hordei in the cultivar Reka 1 and severalAustralian barleys. Plant Breed 121:232–236
Qi X, Nicks EE, Stam P, Lindhourt P (1998) Identificationof QTLs for partial resistance to leaf rust (Pucciniahordei) in barley. Theor Appl Genet 96:1205–1215
Qi X, Jiang G, Chen W, Nicks RE, Stam P, Lindhourt P(1999) Isolate-specific QTLs for partial resistance toPuccinia hordei in barley. Theor Appl Genet 99:877–884
Sato K, Nankaku N, Motoi Y, Takeda K (2004) Largescale mapping of ESTs on barley genome. In: SpunarJ, Janikova J (eds) Proceedings of the 9th Interna-tional Barley Genetics Symposium, vol 1. Brno, CzechRepublic, pp 79–85
Schonfeld M, Ragni A, Fischbeck G, Jahoor A (1996)RFLP mapping of three new loci for resistance genesto powdery mildew (Erysiphe graminis f. sp. hordei) inbarley. Theor Appl Genet 93:48–56
Thiel T, Michalek W, Varshney RK, Graner A (2003)Exploiting EST database for the development andcharacterization of gene-derived SSR-markers inbarley (Hordeum vulgare L.). Theor Appl Genet106:411–422
Mol Breeding
123
Toojinda T, Baird E, Booth A, Broers L, Hayes P, PowellW, Thomas W, Vivar H, Young G (1998) Introgressionof quantitative trait loci (QTLs) determining stripe rustresistance in barley: an example of marker-assisted linedevelopment. Theor Appl Genet 96:123–131
Toojinda T, Baird E, Broers L, Chen XM, Hayes PM,Kleinhofs A, Korte J, Kudrna D, Leung H, Line RF,Powell W, Vivar H (2000) Mapping quantitative andqualitative disease resistance genes in a doubledhaploid population of barley. Theor Appl Genet101:580–589
Torp J, Jensen HP, Jørgensen JH (1978) Powdery mildewresistance genes in 106 Northwest European springbarley varieties. Royal Veterinary and AgriculturalUniversity Yearbook, Copenhagen, pp 75–102
Vales MI, Schon CC, Capettini F, Chen XM, Corey AE,Mather DE, Mundt CC, Richardson KL, Sandoval-Is-las JS, Utz HF, Hayes PM (2005) Effect of populationsize on the estimation of QTL: a test using resistance tobarley stripe rust. Theor Appl Genet 111:1260–1270
Vanderplank JE (1963) Plant diseases: epidemics andcontrol. Academic Press, New York London, pp 349
Vanderplank JE (1968) Disease resistance in plants.Academic Press, New York London, pp 206
van Ooijen JW, Voorrips RE (2001) JoinMap 3.0 softwarefor the calculation of genetic linkage maps. Biometris,Wageningen University, Plant Res. Int., The Nether-lands
Wang S, Basten CJ, Zeng Z-B (2005) Windows QTLcartographer 2.5. Department of Statistics, NorthCarolina State University, Raleigh, NC (http://stat-gen.ncsu.edu/qtlcart/WQTLCart.htm)
Walker DR, Narvel JM, Boerma HR, All JN, Parrott WA(2004) A QTL that enhance and broadens Bt insectresistance in soybean. Theor Appl Genet 109:1051–1057
Wei F, Gobelman-Werner K, Morroll S, Long J, Mao L,Wing R, Leister D, Schulze-Lefert P, Wise R (1999)The Mla (powdery mildew) resistance cluster isassociated with three NBS-LRR gene families andsuppressed recombination within a 240-kb DNAinterval on chromosome 5S (1HS) of barley. Genetics153:1929–1948
Williams KJ (2003) The molecular genetics of diseaseresistance in barley. Aust J Agric Res 54:1065–1079
Wisser RJ, Sun Q, Hulbert SH, Kresovich S, Nelson RJ(2005) Identification and characterization of regionsof the rice genome associated with broad-spectrum,quantitative disease resistance. Genome 169:2277–2293
Yan L, Echenique V, Busso C, SanMiguel P, RamakrishnaW, Bennetzen JL, Harrington S, Dubcovsky J (2002)Cereal genes similar to Snf2 define a new subfamilythat includes human and mouse genes. Mol GenGenet 268:488–499
Yi G, Lee SK, Hong YK, Cho YC, Nam MH, Kim SC,Han SS, Wang GL, Hahn TR, Ronald PC, Jeon JS(2004) Use of Pi5(t) markers in marker-assistedselection to screen for cultivars with resistance toMagnaporthe grisea. Theor Appl Genet 109:978–985
Zeng ZB (1994) Precision mapping of quantitative traitloci. Genetics 136:1457–1468
Mol Breeding
123
Related Documents