Mapping fisheries in the German exclusive economic zone with special reference to offshore Natura 2000 sites Søren Anker Pedersen a, , Heino O. Fock b , Anne F. Sell b a International Council for the Exploration of the Sea (ICES), H. C. Andersens Boulevard 44-46, DK-1553 Copenhagen, Denmark b Johann Heinrich von Thu ¨nen-Institut (vTI), Institute of Sea Fisheries, Palmaille 9, D-22767 Hamburg, Germany article info Article history: Received 13 November 2008 Received in revised form 16 December 2008 Accepted 17 December 2008 Keywords: VMS Fishing effort Logbooks MPAs North Sea Baltic Sea Spatial planning abstract Large intensity and diversity of human activities result in an increase in complexity in the utilization of space. This paper describes the fisheries and a method to map fishing efforts and catches of different fleets by combining vessel monitoring system (VMS) data and logbook data. The method makes it possible to explore the spatial and temporal variability of fishing and the potential impacts of proposed management measures on the fisheries. The method is proposed to be used in the development of management plans for marine protected areas such as Natura 2000 sites, designated to protect vulnerable habitats and species. & 2009 Elsevier Ltd. All rights reserved. 1. Introduction The increasing complexity of spatial use in the marine environment calls for marine spatial planning [1,2]. At the same time, international conventions call for the evaluation and where needed reduction of environmental impact. The EU Action Plan on biodiversity titled ‘‘Halting the loss of biodiversity by 2010 – and beyond – Sustaining ecosystem services for human well-being’’ states that the halting of damage to ecosystems is a matter of urgency if we are to protect the future of the natural world, on account of both its intrinsic value (recreational and cultural value) and the services ecosystems provide [3]. Two EU Nature Directives have been the driving force for nature conservation and biodiversity protection: The Birds Directive, hereafter BD, and the Habitats Directive, hereafter HD [4]. The purpose of both directives is to protect biodiversity on land and in the marine environment of the EU and to contribute to the implementation of the 1992 UN Convention on Biological Diversity. With the BD and HD it is obligatory for member states to designate areas in their national waters to protect threatened and declining species and habitats. The Special Protection Areas (SPAs) of the BD and the Special Areas of Conservation (SACs) of the HD constitute the elements of the European coherent network of protected areas called Natura 2000 [5]. According to the EU Action Plan on biodiversity, member states should complete their Natura 2000 site designations by 2008 and the marine network of well-managed marine Natura 2000 sites is to be in place by 2012 [3]. Each EU member state is responsible for maintaining or, where appropriate, restoring habitats and species protected under the Habitats and Birds Directives in marine environments of their exclusive economic zone (EEZ), although the fisheries are regulated under EU Common Fishery Policy [6]. The latter has an impact on the fishing activities and the fishing industry. In May 2004, Germany as the first EU member state nominated a comprehensive set of 10 marine Natura 2000 sites to the European Commission, covering 31.5% of its offshore EEZs in the North Sea and Baltic Sea (Fig. 1). In February 2006, the International Council for the Exploration of the Seas (ICES) in collaboration with the German Federal Agency for Nature Conservation (BfN) started the project ‘‘Environmentally Sound Fishery Management in Protected Areas [EMPAS]’’ aimed at developing fishery management plans for the Natura 2000 sites within the German EEZ of the North Sea and Baltic Sea [7]. To analyse the potential conflict between fishing activities and nature conservation targets of marine Natura 2000 sites, data and information about the fishing activities of the internat- ional commercial fishing fleets need to be available on appropri- ate temporal and spatial scales. The EMPAS project has revealed ARTICLE IN PRESS Contents lists available at ScienceDirect journal homepage: www.elsevier.com/locate/marpol Marine Policy 0308-597X/$ - see front matter & 2009 Elsevier Ltd. All rights reserved. doi:10.1016/j.marpol.2008.12.007 Corresponding author. Tel.: +45 3338 6752; fax: +45 33934215. E-mail address: [email protected] (S.A. Pedersen). Marine Policy 33 (2009) 571–590

Welcome message from author
This document is posted to help you gain knowledge. Please leave a comment to let me know what you think about it! Share it to your friends and learn new things together.
Transcript
ARTICLE IN PRESS
Marine Policy 33 (2009) 571–590
Contents lists available at ScienceDirect
Marine Policy
0308-59
doi:10.1
� Corr
E-m
journal homepage: www.elsevier.com/locate/marpol
Mapping fisheries in the German exclusive economic zone with specialreference to offshore Natura 2000 sites
Søren Anker Pedersen a,�, Heino O. Fock b, Anne F. Sell b
a International Council for the Exploration of the Sea (ICES), H. C. Andersens Boulevard 44-46, DK-1553 Copenhagen, Denmarkb Johann Heinrich von Thunen-Institut (vTI), Institute of Sea Fisheries, Palmaille 9, D-22767 Hamburg, Germany
a r t i c l e i n f o
Article history:
Received 13 November 2008
Received in revised form
16 December 2008
Accepted 17 December 2008
Keywords:
VMS
Fishing effort
Logbooks
MPAs
North Sea
Baltic Sea
Spatial planning
7X/$ - see front matter & 2009 Elsevier Ltd. A
016/j.marpol.2008.12.007
esponding author. Tel.: +45 3338 6752; fax: +
ail address: [email protected] (S.A. Pedersen).
a b s t r a c t
Large intensity and diversity of human activities result in an increase in complexity in the utilization of
space. This paper describes the fisheries and a method to map fishing efforts and catches of different
fleets by combining vessel monitoring system (VMS) data and logbook data. The method makes it
possible to explore the spatial and temporal variability of fishing and the potential impacts of proposed
management measures on the fisheries. The method is proposed to be used in the development of
management plans for marine protected areas such as Natura 2000 sites, designated to protect
vulnerable habitats and species.
& 2009 Elsevier Ltd. All rights reserved.
1. Introduction
The increasing complexity of spatial use in the marineenvironment calls for marine spatial planning [1,2]. At the sametime, international conventions call for the evaluation and whereneeded reduction of environmental impact. The EU Action Plan onbiodiversity titled ‘‘Halting the loss of biodiversity by 2010 – andbeyond – Sustaining ecosystem services for human well-being’’states that the halting of damage to ecosystems is a matter ofurgency if we are to protect the future of the natural world, onaccount of both its intrinsic value (recreational and cultural value)and the services ecosystems provide [3].
Two EU Nature Directives have been the driving force fornature conservation and biodiversity protection: The BirdsDirective, hereafter BD, and the Habitats Directive, hereafter HD[4]. The purpose of both directives is to protect biodiversity onland and in the marine environment of the EU and to contribute tothe implementation of the 1992 UN Convention on BiologicalDiversity. With the BD and HD it is obligatory for member statesto designate areas in their national waters to protect threatenedand declining species and habitats. The Special Protection Areas(SPAs) of the BD and the Special Areas of Conservation (SACs) ofthe HD constitute the elements of the European coherent network
ll rights reserved.
45 3393 4215.
of protected areas called Natura 2000 [5]. According to the EUAction Plan on biodiversity, member states should complete theirNatura 2000 site designations by 2008 and the marine networkof well-managed marine Natura 2000 sites is to be in place by2012 [3].
Each EU member state is responsible for maintaining or, whereappropriate, restoring habitats and species protected under theHabitats and Birds Directives in marine environments of theirexclusive economic zone (EEZ), although the fisheries areregulated under EU Common Fishery Policy [6]. The latter hasan impact on the fishing activities and the fishing industry.
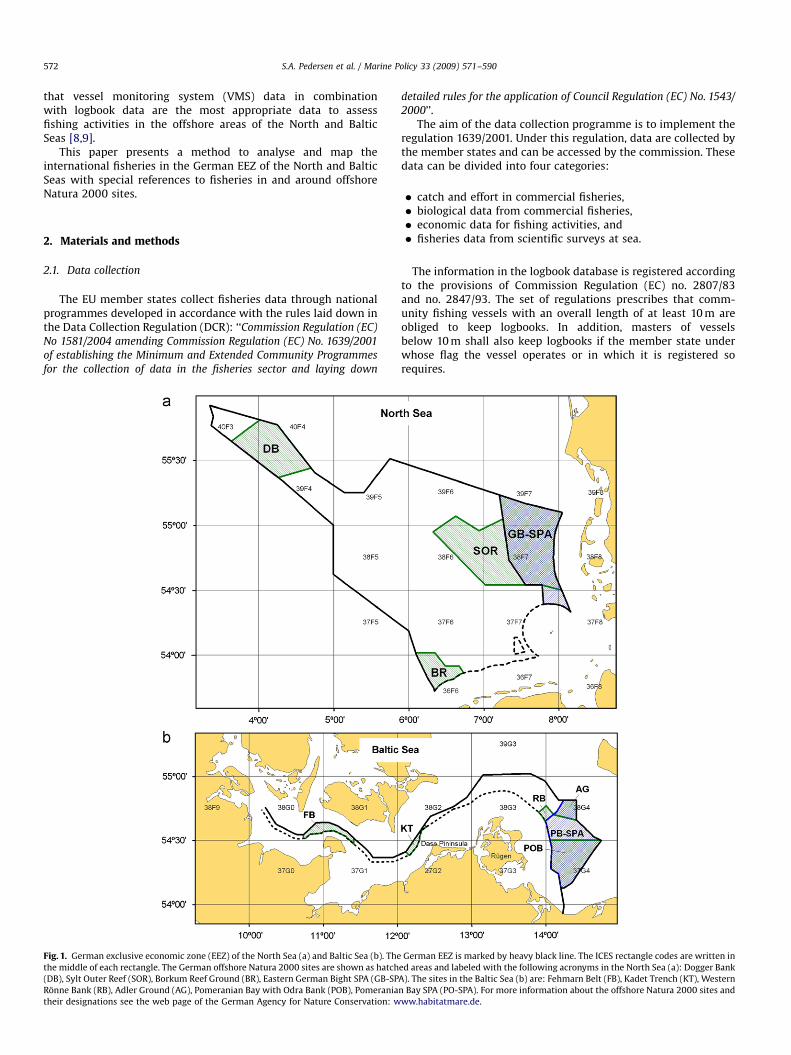
In May 2004, Germany as the first EU member state nominateda comprehensive set of 10 marine Natura 2000 sites to theEuropean Commission, covering 31.5% of its offshore EEZs in theNorth Sea and Baltic Sea (Fig. 1).
In February 2006, the International Council for the Explorationof the Seas (ICES) in collaboration with the German FederalAgency for Nature Conservation (BfN) started the project‘‘Environmentally Sound Fishery Management in Protected Areas[EMPAS]’’ aimed at developing fishery management plans for theNatura 2000 sites within the German EEZ of the North Sea andBaltic Sea [7].
To analyse the potential conflict between fishing activities andnature conservation targets of marine Natura 2000 sites, dataand information about the fishing activities of the internat-ional commercial fishing fleets need to be available on appropri-ate temporal and spatial scales. The EMPAS project has revealed
ARTICLE IN PRESS
S.A. Pedersen et al. / Marine Policy 33 (2009) 571–590572
that vessel monitoring system (VMS) data in combinationwith logbook data are the most appropriate data to assessfishing activities in the offshore areas of the North and BalticSeas [8,9].
This paper presents a method to analyse and map theinternational fisheries in the German EEZ of the North and BalticSeas with special references to fisheries in and around offshoreNatura 2000 sites.
2. Materials and methods
2.1. Data collection
The EU member states collect fisheries data through nationalprogrammes developed in accordance with the rules laid down inthe Data Collection Regulation (DCR): ‘‘Commission Regulation (EC)
No 1581/2004 amending Commission Regulation (EC) No. 1639/2001
of establishing the Minimum and Extended Community Programmes
for the collection of data in the fisheries sector and laying down
Fig. 1. German exclusive economic zone (EEZ) of the North Sea (a) and Baltic Sea (b). The
the middle of each rectangle. The German offshore Natura 2000 sites are shown as hatch
(DB), Sylt Outer Reef (SOR), Borkum Reef Ground (BR), Eastern German Bight SPA (GB-SP
Ronne Bank (RB), Adler Ground (AG), Pomeranian Bay with Odra Bank (POB), Pomerania
their designations see the web page of the German Agency for Nature Conservation: w
detailed rules for the application of Council Regulation (EC) No. 1543/
2000’’.The aim of the data collection programme is to implement the
regulation 1639/2001. Under this regulation, data are collected bythe member states and can be accessed by the commission. Thesedata can be divided into four categories:
�
Ge
ed a
A). T
n Ba
ww
catch and effort in commercial fisheries,
� biological data from commercial fisheries, � economic data for fishing activities, and � fisheries data from scientific surveys at sea.The information in the logbook database is registered accordingto the provisions of Commission Regulation (EC) no. 2807/83and no. 2847/93. The set of regulations prescribes that comm-unity fishing vessels with an overall length of at least 10 m areobliged to keep logbooks. In addition, masters of vesselsbelow 10 m shall also keep logbooks if the member state underwhose flag the vessel operates or in which it is registered sorequires.
rman EEZ is marked by heavy black line. The ICES rectangle codes are written in
reas and labeled with the following acronyms in the North Sea (a): Dogger Bank
he sites in the Baltic Sea (b) are: Fehmarn Belt (FB), Kadet Trench (KT), Western
y SPA (PO-SPA). For more information about the offshore Natura 2000 sites and
.habitatmare.de.
ARTICLE IN PRESS
S.A. Pedersen et al. / Marine Policy 33 (2009) 571–590 573
The following logbook entries are required:
�
TabRep
Spe
Anc
Ang
Bril
Clam
Coc
Atla
Ma
Edi
Shr
Cut
Dab
Dog
Flou
Gre
Tub
Had
Atla
Hak
Hor
Lem
Ling
Atl.
Blu
Red
Nor
Eur
Plai
San
Sole
Spr
Tur
Blu
Wh
Wh
Oth
Tot
The
rep
Information on the vessel.
� Gear type and mesh size. � Dates of operation. � Fishing time for each day at sea with location(location: ICES statistical rectangle where most of the catchwas taken—optional: all rectangles where fish was caughtduring the day. In non-member state: fishing zone).
� Quantities caught and retained on board, major components byspecies.
� (Optional: estimates of discards).The fisheries data (logbook data) analysed and mapped in thispaper were provided by the national fisheries research institutesof Denmark, Germany, Netherlands, Sweden, UK, Belgium, Poland,and Latvia (see Acknowledgements).
2.2. Vessel monitoring system (VMS) data
Within European seas, fishing vessels are obliged to operate asatellite-based vessel monitoring system [10,11]. The EU VMSapplies to all larger fishing vessels—from 2005 onwards, to vesselsin excess of 15 m overall length. In 2006, comprehensive dataincluding vessel code, position, time, speed, and direction wereavailable to EU member states for their national fleets in all EUwaters, and for foreign vessels operating within the bounds of
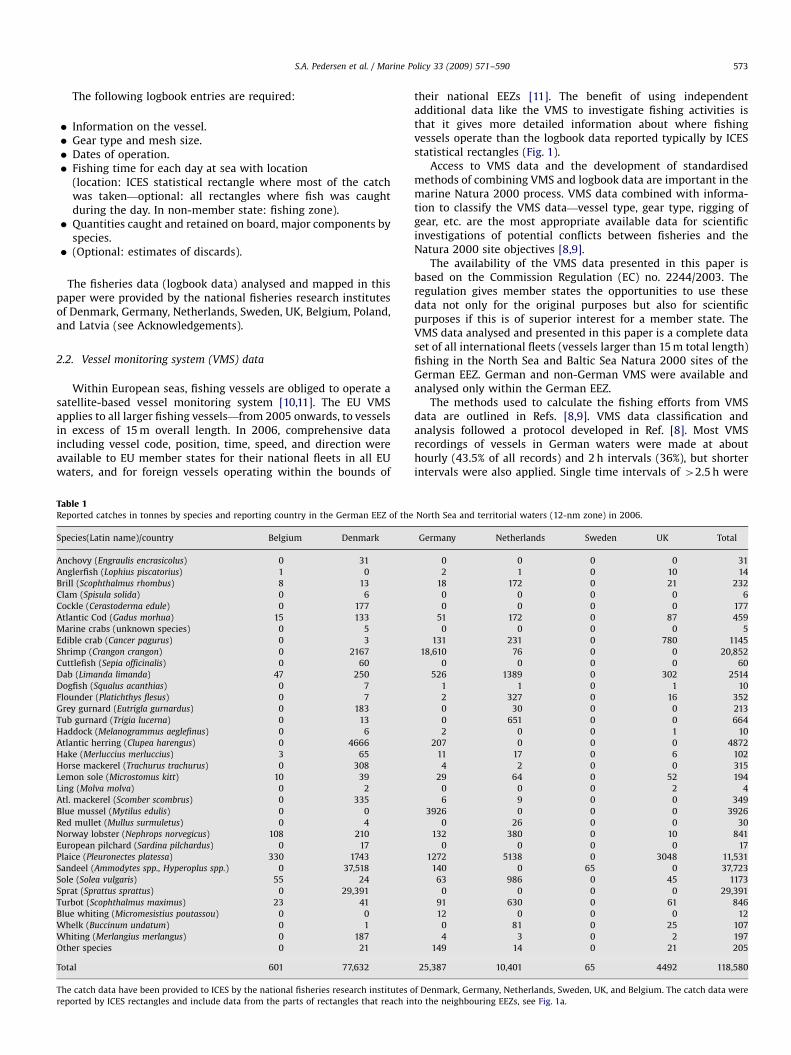
le 1orted catches in tonnes by species and reporting country in the German EEZ of the
cies(Latin name)/country Belgium Denmark
hovy (Engraulis encrasicolus) 0 31
lerfish (Lophius piscatorius) 1 0
l (Scophthalmus rhombus) 8 13
(Spisula solida) 0 6
kle (Cerastoderma edule) 0 177
ntic Cod (Gadus morhua) 15 133
rine crabs (unknown species) 0 5
ble crab (Cancer pagurus) 0 3
imp (Crangon crangon) 0 2167
tlefish (Sepia officinalis) 0 60
(Limanda limanda) 47 250
fish (Squalus acanthias) 0 7
nder (Platichthys flesus) 0 7
y gurnard (Eutrigla gurnardus) 0 183
gurnard (Trigia lucerna) 0 13
dock (Melanogrammus aeglefinus) 0 6
ntic herring (Clupea harengus) 0 4666
e (Merluccius merluccius) 3 65
se mackerel (Trachurus trachurus) 0 308
on sole (Microstomus kitt) 10 39
(Molva molva) 0 2
mackerel (Scomber scombrus) 0 335
e mussel (Mytilus edulis) 0 0
mullet (Mullus surmuletus) 0 4
way lobster (Nephrops norvegicus) 108 210
opean pilchard (Sardina pilchardus) 0 17
ce (Pleuronectes platessa) 330 1743
deel (Ammodytes spp., Hyperoplus spp.) 0 37,518
(Solea vulgaris) 55 24
at (Sprattus sprattus) 0 29,391
bot (Scophthalmus maximus) 23 41
e whiting (Micromesistius poutassou) 0 0
elk (Buccinum undatum) 0 1
iting (Merlangius merlangus) 0 187
er species 0 21
al 601 77,632
catch data have been provided to ICES by the national fisheries research institutes o
orted by ICES rectangles and include data from the parts of rectangles that reach in
their national EEZs [11]. The benefit of using independentadditional data like the VMS to investigate fishing activities isthat it gives more detailed information about where fishingvessels operate than the logbook data reported typically by ICESstatistical rectangles (Fig. 1).
Access to VMS data and the development of standardisedmethods of combining VMS and logbook data are important in themarine Natura 2000 process. VMS data combined with informa-tion to classify the VMS data—vessel type, gear type, rigging ofgear, etc. are the most appropriate available data for scientificinvestigations of potential conflicts between fisheries and theNatura 2000 site objectives [8,9].
The availability of the VMS data presented in this paper isbased on the Commission Regulation (EC) no. 2244/2003. Theregulation gives member states the opportunities to use thesedata not only for the original purposes but also for scientificpurposes if this is of superior interest for a member state. TheVMS data analysed and presented in this paper is a complete dataset of all international fleets (vessels larger than 15 m total length)fishing in the North Sea and Baltic Sea Natura 2000 sites of theGerman EEZ. German and non-German VMS were available andanalysed only within the German EEZ.
The methods used to calculate the fishing efforts from VMSdata are outlined in Refs. [8,9]. VMS data classification andanalysis followed a protocol developed in Ref. [8]. Most VMSrecordings of vessels in German waters were made at abouthourly (43.5% of all records) and 2 h intervals (36%), but shorterintervals were also applied. Single time intervals of 42.5 h were
North Sea and territorial waters (12-nm zone) in 2006.
Germany Netherlands Sweden UK Total
0 0 0 0 31
2 1 0 10 14
18 172 0 21 232
0 0 0 0 6
0 0 0 0 177
51 172 0 87 459
0 0 0 0 5
131 231 0 780 1145
18,610 76 0 0 20,852
0 0 0 0 60
526 1389 0 302 2514
1 1 0 1 10
2 327 0 16 352
0 30 0 0 213
0 651 0 0 664
2 0 0 1 10
207 0 0 0 4872
11 17 0 6 102
4 2 0 0 315
29 64 0 52 194
0 0 0 2 4
6 9 0 0 349
3926 0 0 0 3926
0 26 0 0 30
132 380 0 10 841
0 0 0 0 17
1272 5138 0 3048 11,531
140 0 65 0 37,723
63 986 0 45 1173
0 0 0 0 29,391
91 630 0 61 846
12 0 0 0 12
0 81 0 25 107
4 3 0 2 197
149 14 0 21 205
25,387 10,401 65 4492 118,580
f Denmark, Germany, Netherlands, Sweden, UK, and Belgium. The catch data were
to the neighbouring EEZs, see Fig. 1a.
ARTICLE IN PRESS
S.A. Pedersen et al. / Marine Policy 33 (2009) 571–590574
regarded as indicating extended periods of recording failure ratherthan extended periods of operations and thus were reset to 1 hfor the respective VMS position. In cases of incompleterecords, missing speed values were replaced by an arbitraryspeed of 2.0 knots. VMS speed records were considered inaccuratesince all values were smaller than 1 knot. These were alsoreplaced by 2.0 knots speed. This procedure was applied to o1.5%of all records. Hence fishing activities are probably slightlyoverestimated.
2.3. Mapping fishing efforts and catches
Effort data were aggregated in areal units of 10�2 ICESrectangle approximating 3�3 nm2. This is an appropriate cover-age of interval distances because 460% of the distance intervalswere within a range of 3 nm [8].
The international catches (from logbook data) by species, geartype, and ICES rectangle were allocated to 3�3 nm2 by thefollowing method: reported total catch by species, gear type, andICES rectangle divided by total calculated fishing effort by geartype and ICES rectangle, multiplied by calculated fishing effort in3�3 nm2 by gear type in the ICES rectangle.
To map fishing efforts and catches in and around MPAs weused a geographical information system (Mapinfo Professionalv8.5).
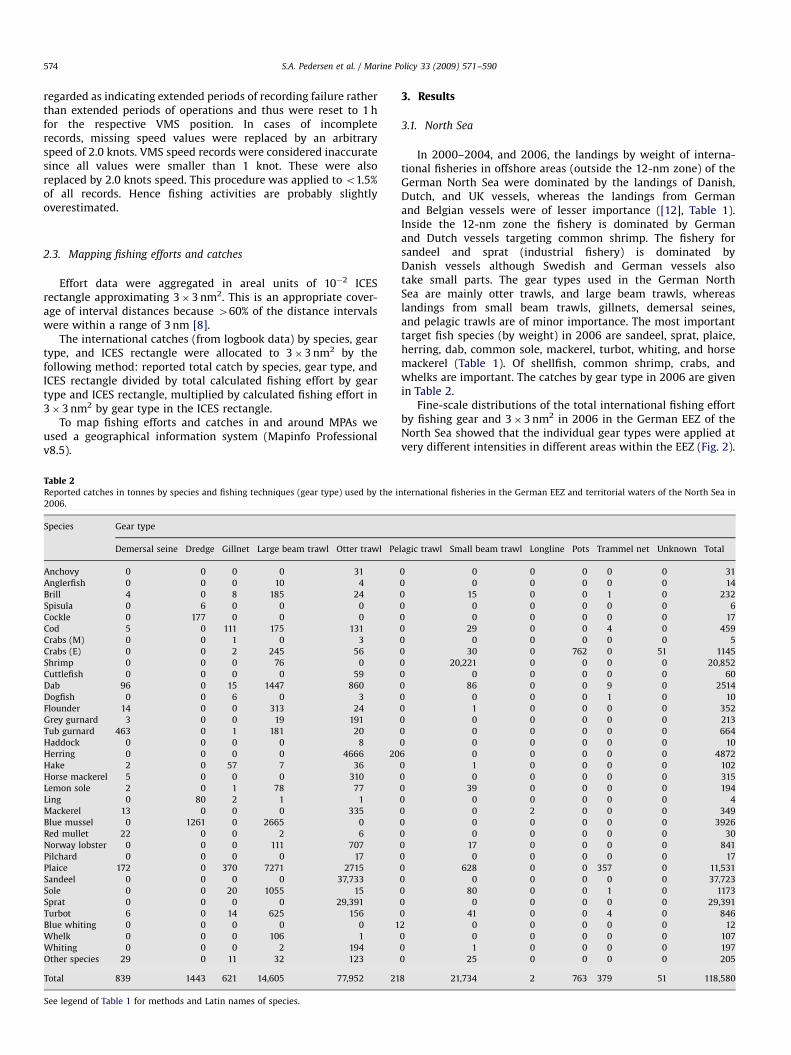
Table 2Reported catches in tonnes by species and fishing techniques (gear type) used by the i
2006.
Species Gear type
Demersal seine Dredge Gillnet Large beam trawl Otter trawl Pe
Anchovy 0 0 0 0 31
Anglerfish 0 0 0 10 4
Brill 4 0 8 185 24
Spisula 0 6 0 0 0
Cockle 0 177 0 0 0
Cod 5 0 111 175 131
Crabs (M) 0 0 1 0 3
Crabs (E) 0 0 2 245 56
Shrimp 0 0 0 76 0
Cuttlefish 0 0 0 0 59
Dab 96 0 15 1447 860
Dogfish 0 0 6 0 3
Flounder 14 0 0 313 24
Grey gurnard 3 0 0 19 191
Tub gurnard 463 0 1 181 20
Haddock 0 0 0 0 8
Herring 0 0 0 0 4666 20
Hake 2 0 57 7 36
Horse mackerel 5 0 0 0 310
Lemon sole 2 0 1 78 77
Ling 0 80 2 1 1
Mackerel 13 0 0 0 335
Blue mussel 0 1261 0 2665 0
Red mullet 22 0 0 2 6
Norway lobster 0 0 0 111 707
Pilchard 0 0 0 0 17
Plaice 172 0 370 7271 2715
Sandeel 0 0 0 0 37,733
Sole 0 0 20 1055 15
Sprat 0 0 0 0 29,391
Turbot 6 0 14 625 156
Blue whiting 0 0 0 0 0 1
Whelk 0 0 0 106 1
Whiting 0 0 0 2 194
Other species 29 0 11 32 123
Total 839 1443 621 14,605 77,952 21
See legend of Table 1 for methods and Latin names of species.
3. Results
3.1. North Sea
In 2000–2004, and 2006, the landings by weight of interna-tional fisheries in offshore areas (outside the 12-nm zone) of theGerman North Sea were dominated by the landings of Danish,Dutch, and UK vessels, whereas the landings from Germanand Belgian vessels were of lesser importance ([12], Table 1).Inside the 12-nm zone the fishery is dominated by Germanand Dutch vessels targeting common shrimp. The fishery forsandeel and sprat (industrial fishery) is dominated byDanish vessels although Swedish and German vessels alsotake small parts. The gear types used in the German NorthSea are mainly otter trawls, and large beam trawls, whereaslandings from small beam trawls, gillnets, demersal seines,and pelagic trawls are of minor importance. The most importanttarget fish species (by weight) in 2006 are sandeel, sprat, plaice,herring, dab, common sole, mackerel, turbot, whiting, and horsemackerel (Table 1). Of shellfish, common shrimp, crabs, andwhelks are important. The catches by gear type in 2006 are givenin Table 2.
Fine-scale distributions of the total international fishing effortby fishing gear and 3�3 nm2 in 2006 in the German EEZ of theNorth Sea showed that the individual gear types were applied atvery different intensities in different areas within the EEZ (Fig. 2).
nternational fisheries in the German EEZ and territorial waters of the North Sea in
lagic trawl Small beam trawl Longline Pots Trammel net Unknown Total
0 0 0 0 0 0 31
0 0 0 0 0 0 14
0 15 0 0 1 0 232
0 0 0 0 0 0 6
0 0 0 0 0 0 17
0 29 0 0 4 0 459
0 0 0 0 0 0 5
0 30 0 762 0 51 1145
0 20,221 0 0 0 0 20,852
0 0 0 0 0 0 60
0 86 0 0 9 0 2514
0 0 0 0 1 0 10
0 1 0 0 0 0 352
0 0 0 0 0 0 213
0 0 0 0 0 0 664
0 0 0 0 0 0 10
6 0 0 0 0 0 4872
0 1 0 0 0 0 102
0 0 0 0 0 0 315
0 39 0 0 0 0 194
0 0 0 0 0 0 4
0 0 2 0 0 0 349
0 0 0 0 0 0 3926
0 0 0 0 0 0 30
0 17 0 0 0 0 841
0 0 0 0 0 0 17
0 628 0 0 357 0 11,531
0 0 0 0 0 0 37,723
0 80 0 0 1 0 1173
0 0 0 0 0 0 29,391
0 41 0 0 4 0 846
2 0 0 0 0 0 12
0 0 0 0 0 0 107
0 1 0 0 0 0 197
0 25 0 0 0 0 205
8 21,734 2 763 379 51 118,580
ARTICLE IN PRESS
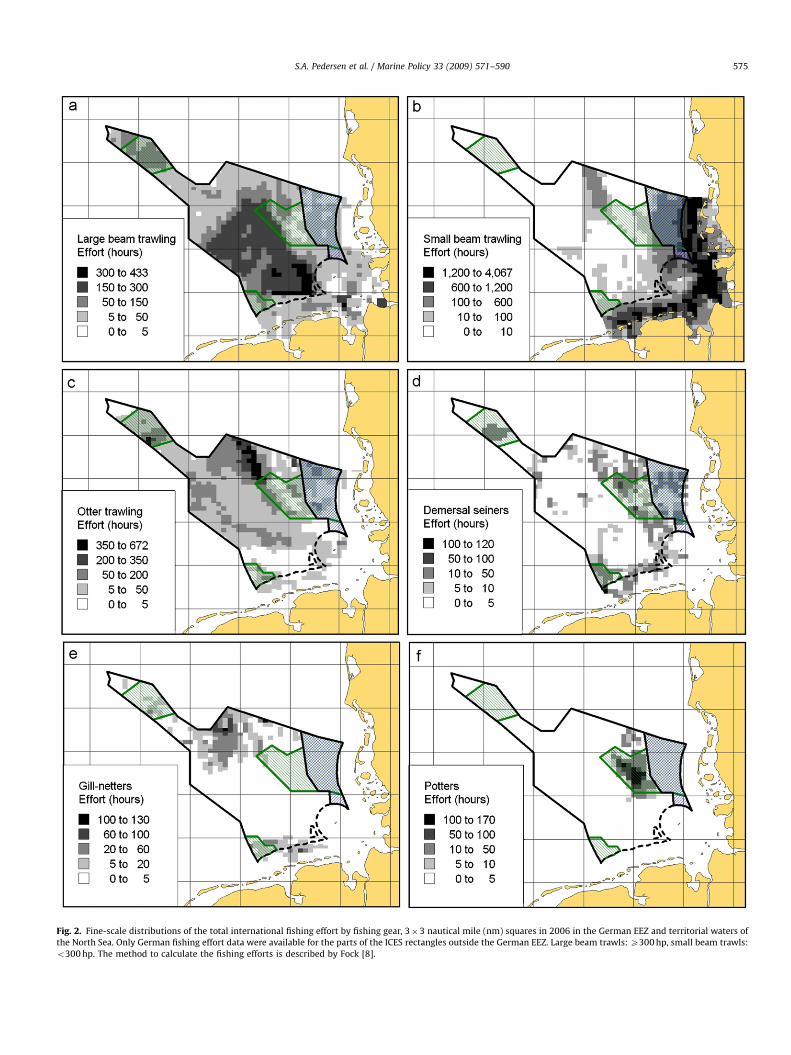
Fig. 2. Fine-scale distributions of the total international fishing effort by fishing gear, 3�3 nautical mile (nm) squares in 2006 in the German EEZ and territorial waters of
the North Sea. Only German fishing effort data were available for the parts of the ICES rectangles outside the German EEZ. Large beam trawls: X300 hp, small beam trawls:
o300 hp. The method to calculate the fishing efforts is described by Fock [8].
S.A. Pedersen et al. / Marine Policy 33 (2009) 571–590 575
ARTICLE IN PRESS
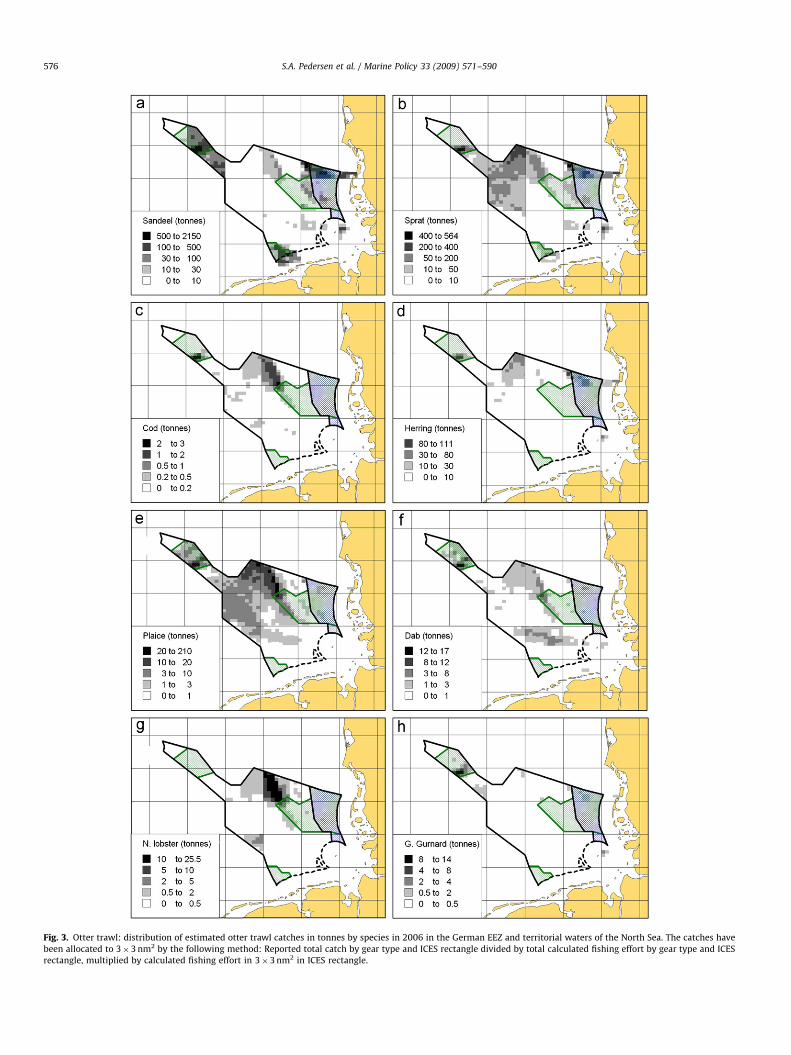
Fig. 3. Otter trawl: distribution of estimated otter trawl catches in tonnes by species in 2006 in the German EEZ and territorial waters of the North Sea. The catches have
been allocated to 3�3 nm2 by the following method: Reported total catch by gear type and ICES rectangle divided by total calculated fishing effort by gear type and ICES
rectangle, multiplied by calculated fishing effort in 3�3 nm2 in ICES rectangle.
S.A. Pedersen et al. / Marine Policy 33 (2009) 571–590576
ARTICLE IN PRESS
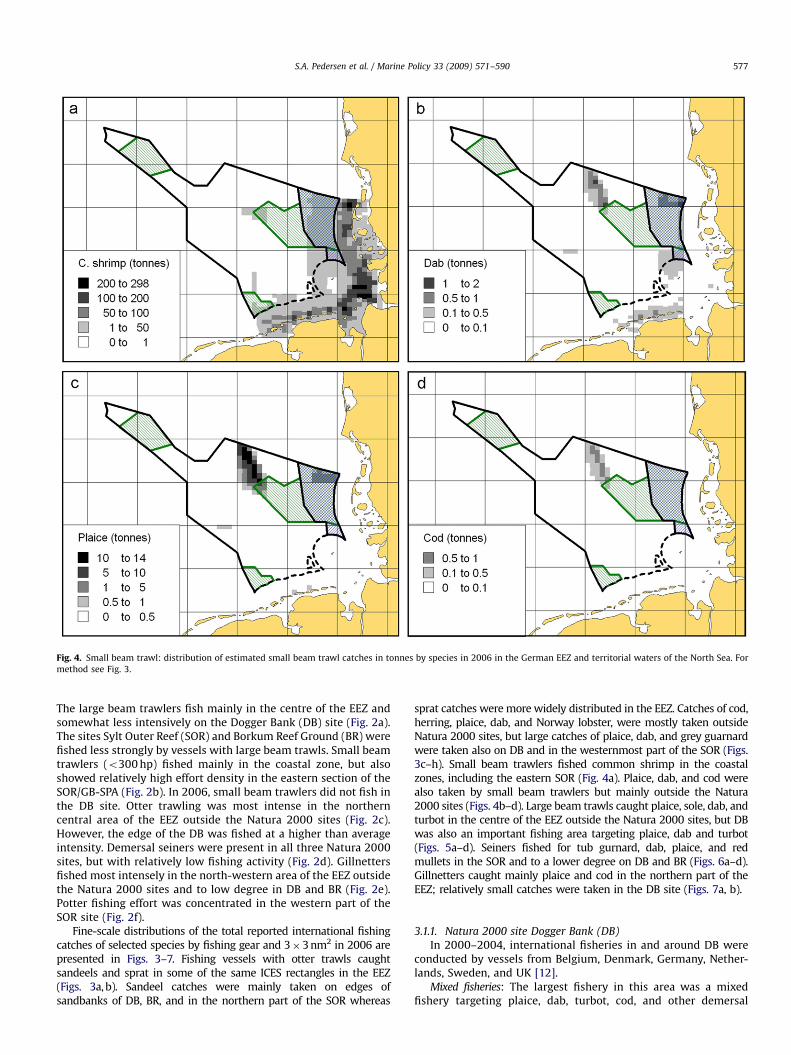
Fig. 4. Small beam trawl: distribution of estimated small beam trawl catches in tonnes by species in 2006 in the German EEZ and territorial waters of the North Sea. For
method see Fig. 3.
S.A. Pedersen et al. / Marine Policy 33 (2009) 571–590 577
The large beam trawlers fish mainly in the centre of the EEZ andsomewhat less intensively on the Dogger Bank (DB) site (Fig. 2a).The sites Sylt Outer Reef (SOR) and Borkum Reef Ground (BR) werefished less strongly by vessels with large beam trawls. Small beamtrawlers (o300 hp) fished mainly in the coastal zone, but alsoshowed relatively high effort density in the eastern section of theSOR/GB-SPA (Fig. 2b). In 2006, small beam trawlers did not fish inthe DB site. Otter trawling was most intense in the northerncentral area of the EEZ outside the Natura 2000 sites (Fig. 2c).However, the edge of the DB was fished at a higher than averageintensity. Demersal seiners were present in all three Natura 2000sites, but with relatively low fishing activity (Fig. 2d). Gillnettersfished most intensely in the north-western area of the EEZ outsidethe Natura 2000 sites and to low degree in DB and BR (Fig. 2e).Potter fishing effort was concentrated in the western part of theSOR site (Fig. 2f).
Fine-scale distributions of the total reported international fishingcatches of selected species by fishing gear and 3�3 nm2 in 2006 arepresented in Figs. 3–7. Fishing vessels with otter trawls caughtsandeels and sprat in some of the same ICES rectangles in the EEZ(Figs. 3a, b). Sandeel catches were mainly taken on edges ofsandbanks of DB, BR, and in the northern part of the SOR whereas
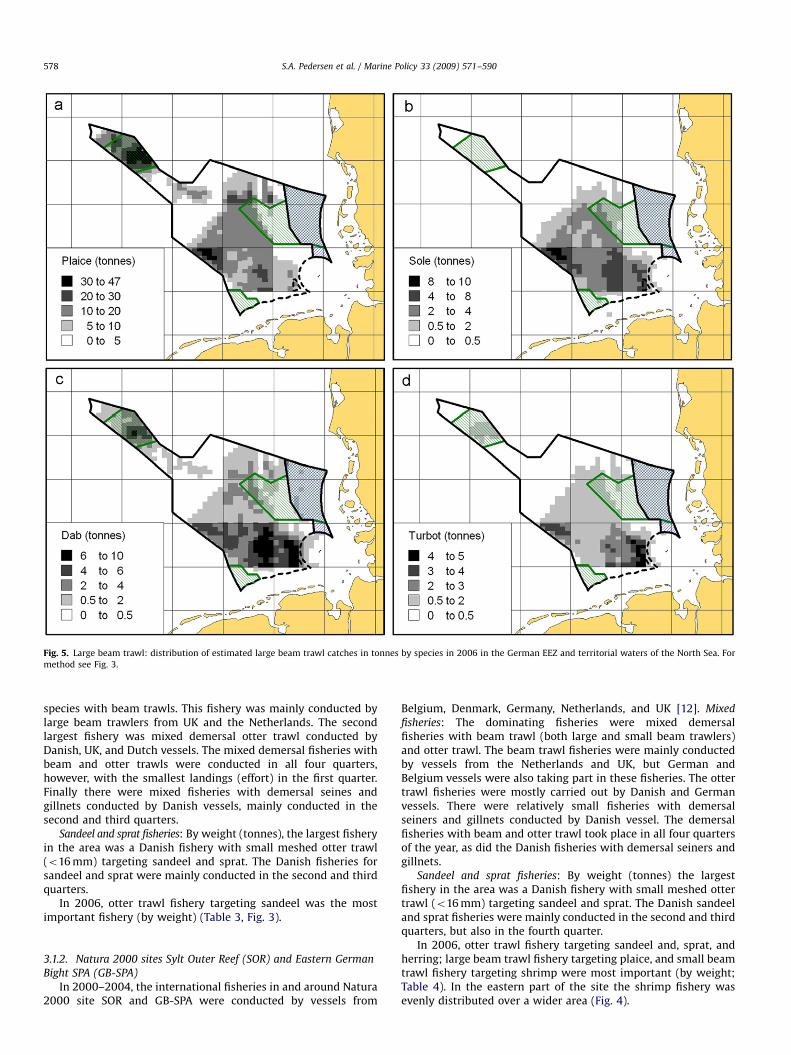
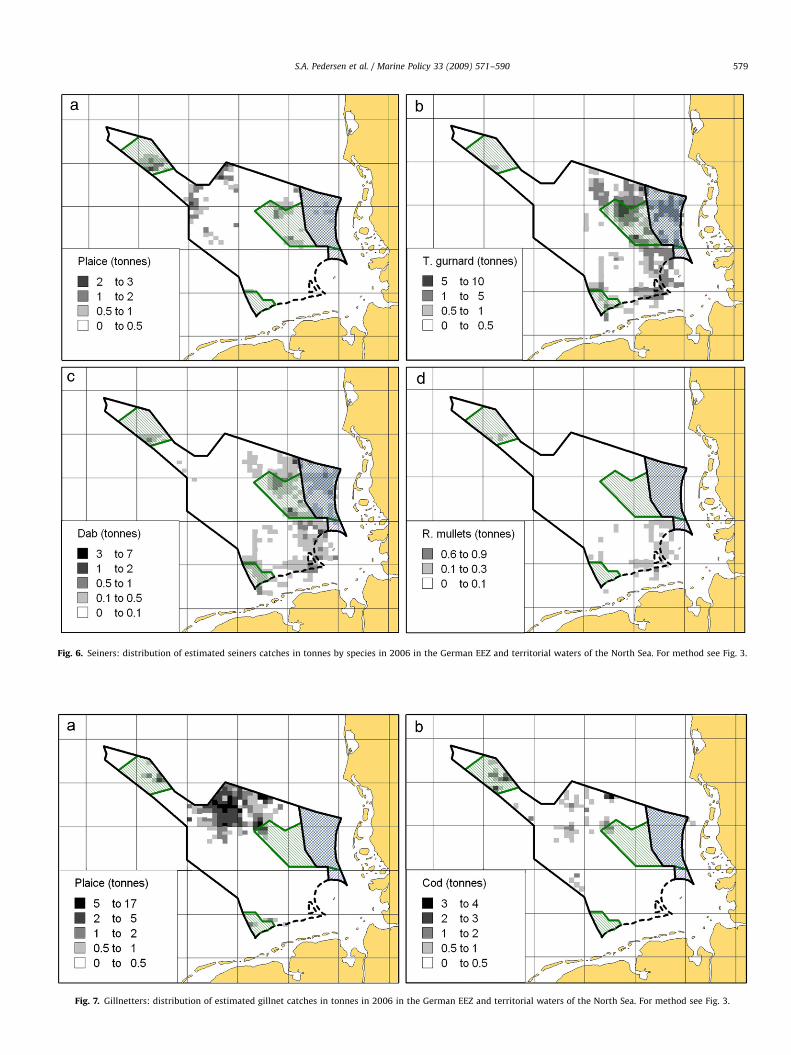
sprat catches were more widely distributed in the EEZ. Catches of cod,herring, plaice, dab, and Norway lobster, were mostly taken outsideNatura 2000 sites, but large catches of plaice, dab, and grey guarnardwere taken also on DB and in the westernmost part of the SOR (Figs.3c–h). Small beam trawlers fished common shrimp in the coastalzones, including the eastern SOR (Fig. 4a). Plaice, dab, and cod werealso taken by small beam trawlers but mainly outside the Natura2000 sites (Figs. 4b–d). Large beam trawls caught plaice, sole, dab, andturbot in the centre of the EEZ outside the Natura 2000 sites, but DBwas also an important fishing area targeting plaice, dab and turbot(Figs. 5a–d). Seiners fished for tub gurnard, dab, plaice, and redmullets in the SOR and to a lower degree on DB and BR (Figs. 6a–d).Gillnetters caught mainly plaice and cod in the northern part of theEEZ; relatively small catches were taken in the DB site (Figs. 7a, b).
3.1.1. Natura 2000 site Dogger Bank (DB)
In 2000–2004, international fisheries in and around DB wereconducted by vessels from Belgium, Denmark, Germany, Nether-lands, Sweden, and UK [12].
Mixed fisheries: The largest fishery in this area was a mixedfishery targeting plaice, dab, turbot, cod, and other demersal
ARTICLE IN PRESS
Fig. 5. Large beam trawl: distribution of estimated large beam trawl catches in tonnes by species in 2006 in the German EEZ and territorial waters of the North Sea. For
method see Fig. 3.
S.A. Pedersen et al. / Marine Policy 33 (2009) 571–590578
species with beam trawls. This fishery was mainly conducted bylarge beam trawlers from UK and the Netherlands. The secondlargest fishery was mixed demersal otter trawl conducted byDanish, UK, and Dutch vessels. The mixed demersal fisheries withbeam and otter trawls were conducted in all four quarters,however, with the smallest landings (effort) in the first quarter.Finally there were mixed fisheries with demersal seines andgillnets conducted by Danish vessels, mainly conducted in thesecond and third quarters.
Sandeel and sprat fisheries: By weight (tonnes), the largest fisheryin the area was a Danish fishery with small meshed otter trawl(o16 mm) targeting sandeel and sprat. The Danish fisheries forsandeel and sprat were mainly conducted in the second and thirdquarters.
In 2006, otter trawl fishery targeting sandeel was the mostimportant fishery (by weight) (Table 3, Fig. 3).
3.1.2. Natura 2000 sites Sylt Outer Reef (SOR) and Eastern German
Bight SPA (GB-SPA)
In 2000–2004, the international fisheries in and around Natura2000 site SOR and GB-SPA were conducted by vessels from
Belgium, Denmark, Germany, Netherlands, and UK [12]. Mixed
fisheries: The dominating fisheries were mixed demersalfisheries with beam trawl (both large and small beam trawlers)and otter trawl. The beam trawl fisheries were mainly conductedby vessels from the Netherlands and UK, but German andBelgium vessels were also taking part in these fisheries. The ottertrawl fisheries were mostly carried out by Danish and Germanvessels. There were relatively small fisheries with demersalseiners and gillnets conducted by Danish vessel. The demersalfisheries with beam and otter trawl took place in all four quartersof the year, as did the Danish fisheries with demersal seiners andgillnets.
Sandeel and sprat fisheries: By weight (tonnes) the largestfishery in the area was a Danish fishery with small meshed ottertrawl (o16 mm) targeting sandeel and sprat. The Danish sandeeland sprat fisheries were mainly conducted in the second and thirdquarters, but also in the fourth quarter.
In 2006, otter trawl fishery targeting sandeel and, sprat, andherring; large beam trawl fishery targeting plaice, and small beamtrawl fishery targeting shrimp were most important (by weight;Table 4). In the eastern part of the site the shrimp fishery wasevenly distributed over a wider area (Fig. 4).
ARTICLE IN PRESS
Fig. 6. Seiners: distribution of estimated seiners catches in tonnes by species in 2006 in the German EEZ and territorial waters of the North Sea. For method see Fig. 3.
Fig. 7. Gillnetters: distribution of estimated gillnet catches in tonnes in 2006 in the German EEZ and territorial waters of the North Sea. For method see Fig. 3.
S.A. Pedersen et al. / Marine Policy 33 (2009) 571–590 579
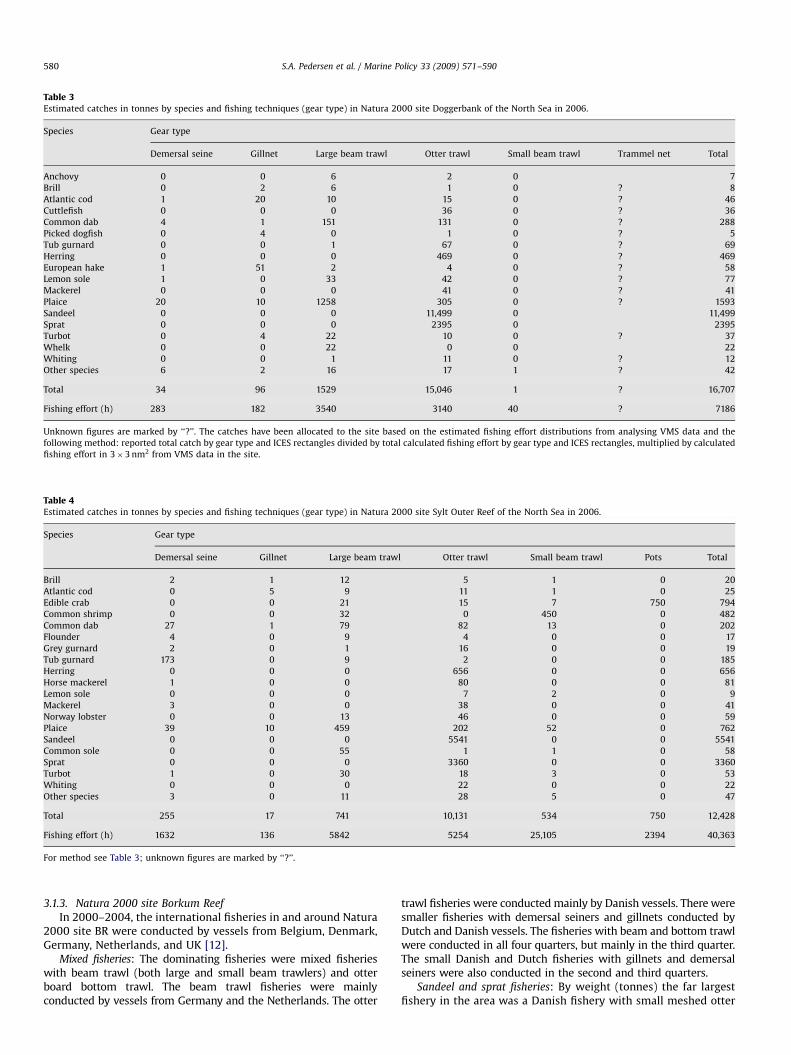
ARTICLE IN PRESS
Table 3Estimated catches in tonnes by species and fishing techniques (gear type) in Natura 2000 site Doggerbank of the North Sea in 2006.
Species Gear type
Demersal seine Gillnet Large beam trawl Otter trawl Small beam trawl Trammel net Total
Anchovy 0 0 6 2 0 7
Brill 0 2 6 1 0 ? 8
Atlantic cod 1 20 10 15 0 ? 46
Cuttlefish 0 0 0 36 0 ? 36
Common dab 4 1 151 131 0 ? 288
Picked dogfish 0 4 0 1 0 ? 5
Tub gurnard 0 0 1 67 0 ? 69
Herring 0 0 0 469 0 ? 469
European hake 1 51 2 4 0 ? 58
Lemon sole 1 0 33 42 0 ? 77
Mackerel 0 0 0 41 0 ? 41
Plaice 20 10 1258 305 0 ? 1593
Sandeel 0 0 0 11,499 0 11,499
Sprat 0 0 0 2395 0 2395
Turbot 0 4 22 10 0 ? 37
Whelk 0 0 22 0 0 22
Whiting 0 0 1 11 0 ? 12
Other species 6 2 16 17 1 ? 42
Total 34 96 1529 15,046 1 ? 16,707
Fishing effort (h) 283 182 3540 3140 40 ? 7186
Unknown figures are marked by ‘‘?’’. The catches have been allocated to the site based on the estimated fishing effort distributions from analysing VMS data and the
following method: reported total catch by gear type and ICES rectangles divided by total calculated fishing effort by gear type and ICES rectangles, multiplied by calculated
fishing effort in 3�3 nm2 from VMS data in the site.
Table 4Estimated catches in tonnes by species and fishing techniques (gear type) in Natura 2000 site Sylt Outer Reef of the North Sea in 2006.
Species Gear type
Demersal seine Gillnet Large beam trawl Otter trawl Small beam trawl Pots Total
Brill 2 1 12 5 1 0 20
Atlantic cod 0 5 9 11 1 0 25
Edible crab 0 0 21 15 7 750 794
Common shrimp 0 0 32 0 450 0 482
Common dab 27 1 79 82 13 0 202
Flounder 4 0 9 4 0 0 17
Grey gurnard 2 0 1 16 0 0 19
Tub gurnard 173 0 9 2 0 0 185
Herring 0 0 0 656 0 0 656
Horse mackerel 1 0 0 80 0 0 81
Lemon sole 0 0 0 7 2 0 9
Mackerel 3 0 0 38 0 0 41
Norway lobster 0 0 13 46 0 0 59
Plaice 39 10 459 202 52 0 762
Sandeel 0 0 0 5541 0 0 5541
Common sole 0 0 55 1 1 0 58
Sprat 0 0 0 3360 0 0 3360
Turbot 1 0 30 18 3 0 53
Whiting 0 0 0 22 0 0 22
Other species 3 0 11 28 5 0 47
Total 255 17 741 10,131 534 750 12,428
Fishing effort (h) 1632 136 5842 5254 25,105 2394 40,363
For method see Table 3; unknown figures are marked by ‘‘?’’.
S.A. Pedersen et al. / Marine Policy 33 (2009) 571–590580
3.1.3. Natura 2000 site Borkum Reef
In 2000–2004, the international fisheries in and around Natura2000 site BR were conducted by vessels from Belgium, Denmark,Germany, Netherlands, and UK [12].
Mixed fisheries: The dominating fisheries were mixed fisherieswith beam trawl (both large and small beam trawlers) and otterboard bottom trawl. The beam trawl fisheries were mainlyconducted by vessels from Germany and the Netherlands. The otter
trawl fisheries were conducted mainly by Danish vessels. There weresmaller fisheries with demersal seiners and gillnets conducted byDutch and Danish vessels. The fisheries with beam and bottom trawlwere conducted in all four quarters, but mainly in the third quarter.The small Danish and Dutch fisheries with gillnets and demersalseiners were also conducted in the second and third quarters.
Sandeel and sprat fisheries: By weight (tonnes) the far largestfishery in the area was a Danish fishery with small meshed otter
ARTICLE IN PRESS
Table 5Estimated catches in tonnes by species and fishing techniques (gear type) in Natura 2000 site Borkum Reef of the North Sea in 2006.
Species Gear type
Demersal seine Dredge Gill net Large beam trawl Otter trawl Small beam trawl Total
Common shrimp 0 0 0 0 16 16
Common dab 3 1 2 3 0 9
European flounder 0 0 2 0 0 2
Tub gurnard 7 0 1 0 0 8
Herring 0 0 0 11 0 11
Horse mackerel 1 0 0 10 0 10
Mackerel 1 0 0 1 0 2
Blue mussel 0 ? 0 264 0 0 264
European pilchard 0 0 0 5 0 5
European plaice 1 4 8 2 0 14
Sandeel 0 0 0 1721 0 1721
Common sole 0 6 4 0 0 10
Sprat 0 0 0 260 0 260
Turbot 0 1 1 0 0 2
Whiting 0 0 0 1 0 2
Other species 9 ? 1 2 2 0 14
Total 14 ? 13 283 2016 16 2343
Fishing effort (h) 316 ? 121 518 354 32 1342
For method see Table 3; unknown figures are marked by ‘‘?’’.
S.A. Pedersen et al. / Marine Policy 33 (2009) 571–590 581
trawl (o16 mm) targeting sandeel and sprat. The Danish sandeeland sprat fisheries were mainly conducted in the second quarter.
In 2006, otter trawl fishery targeting sandeel was by far mostimportant (by weight) (Table 5).
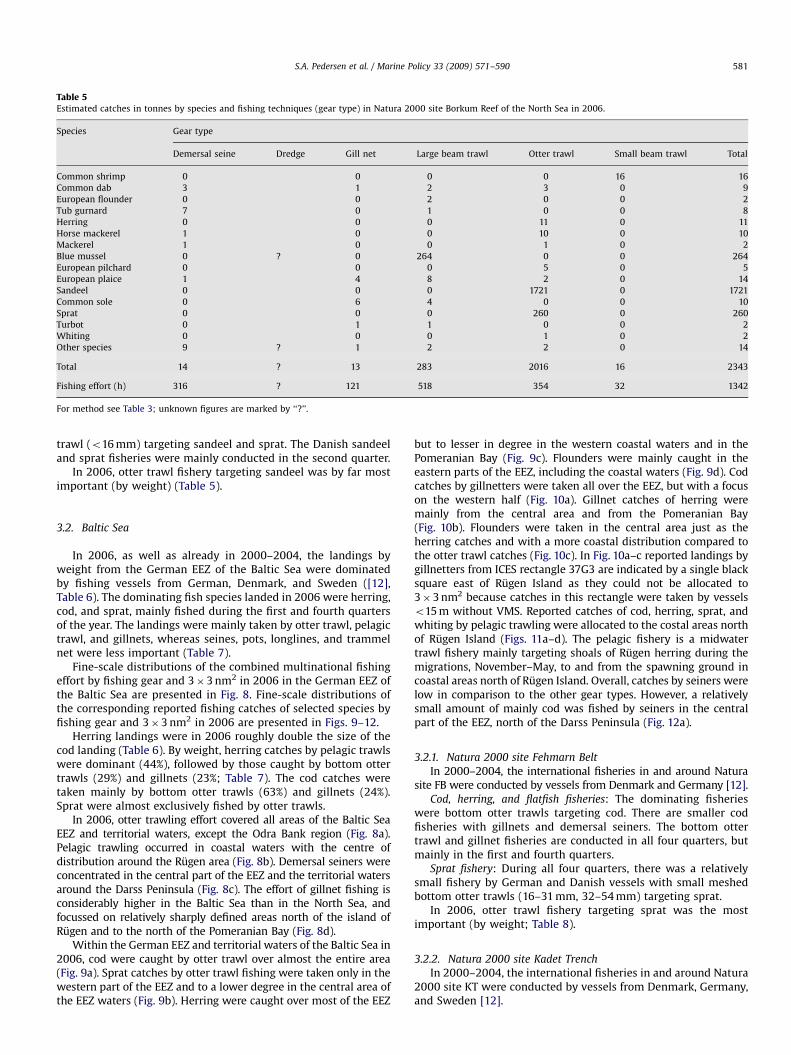
3.2. Baltic Sea
In 2006, as well as already in 2000–2004, the landings byweight from the German EEZ of the Baltic Sea were dominatedby fishing vessels from German, Denmark, and Sweden ([12],Table 6). The dominating fish species landed in 2006 were herring,cod, and sprat, mainly fished during the first and fourth quartersof the year. The landings were mainly taken by otter trawl, pelagictrawl, and gillnets, whereas seines, pots, longlines, and trammelnet were less important (Table 7).
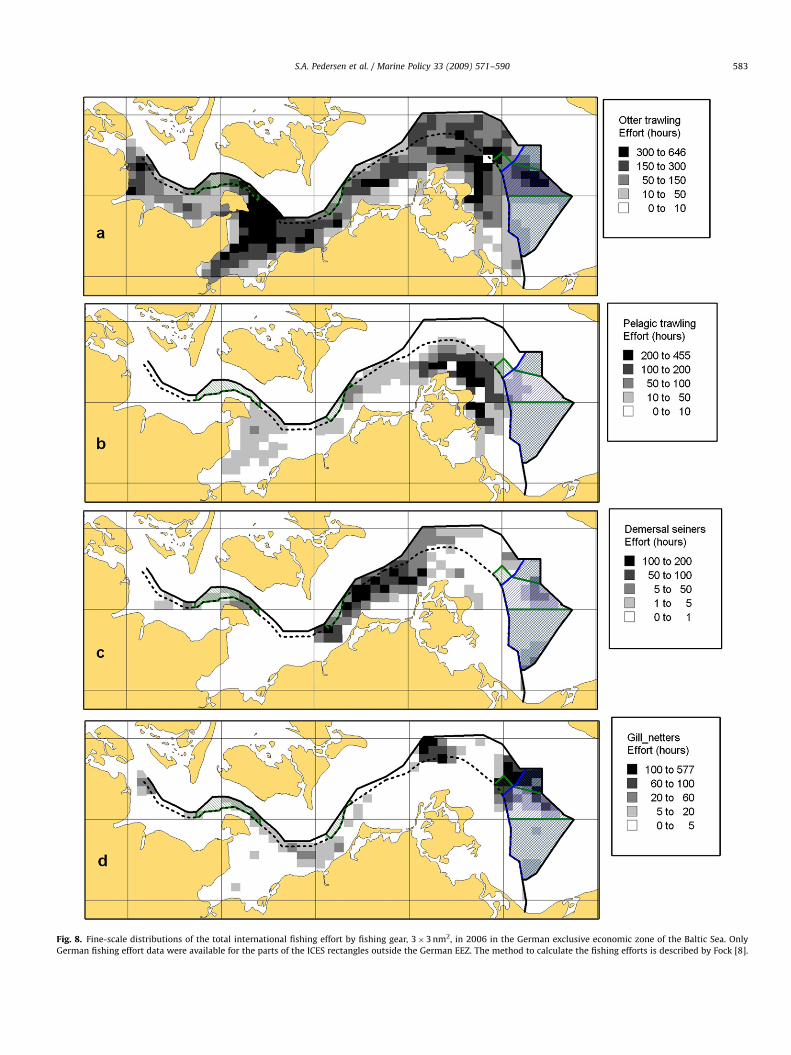
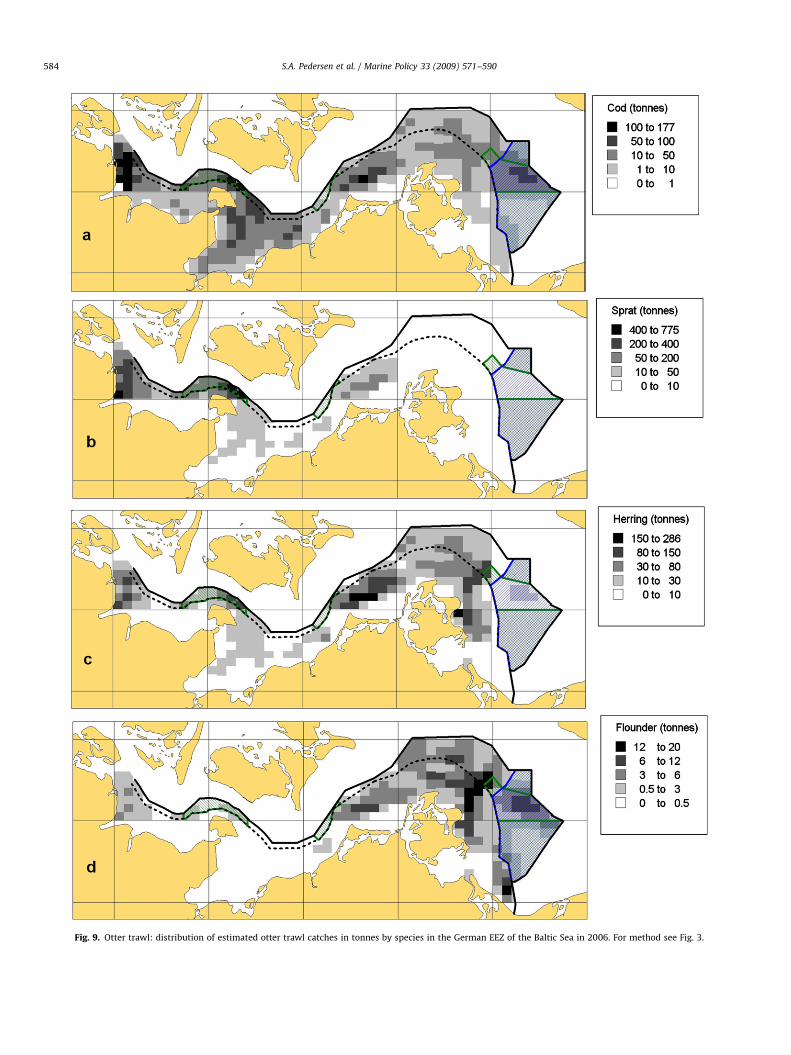
Fine-scale distributions of the combined multinational fishingeffort by fishing gear and 3�3 nm2 in 2006 in the German EEZ ofthe Baltic Sea are presented in Fig. 8. Fine-scale distributions ofthe corresponding reported fishing catches of selected species byfishing gear and 3�3 nm2 in 2006 are presented in Figs. 9–12.
Herring landings were in 2006 roughly double the size of thecod landing (Table 6). By weight, herring catches by pelagic trawlswere dominant (44%), followed by those caught by bottom ottertrawls (29%) and gillnets (23%; Table 7). The cod catches weretaken mainly by bottom otter trawls (63%) and gillnets (24%).Sprat were almost exclusively fished by otter trawls.
In 2006, otter trawling effort covered all areas of the Baltic SeaEEZ and territorial waters, except the Odra Bank region (Fig. 8a).Pelagic trawling occurred in coastal waters with the centre ofdistribution around the Rugen area (Fig. 8b). Demersal seiners wereconcentrated in the central part of the EEZ and the territorial watersaround the Darss Peninsula (Fig. 8c). The effort of gillnet fishing isconsiderably higher in the Baltic Sea than in the North Sea, andfocussed on relatively sharply defined areas north of the island ofRugen and to the north of the Pomeranian Bay (Fig. 8d).
Within the German EEZ and territorial waters of the Baltic Sea in2006, cod were caught by otter trawl over almost the entire area(Fig. 9a). Sprat catches by otter trawl fishing were taken only in thewestern part of the EEZ and to a lower degree in the central area ofthe EEZ waters (Fig. 9b). Herring were caught over most of the EEZ
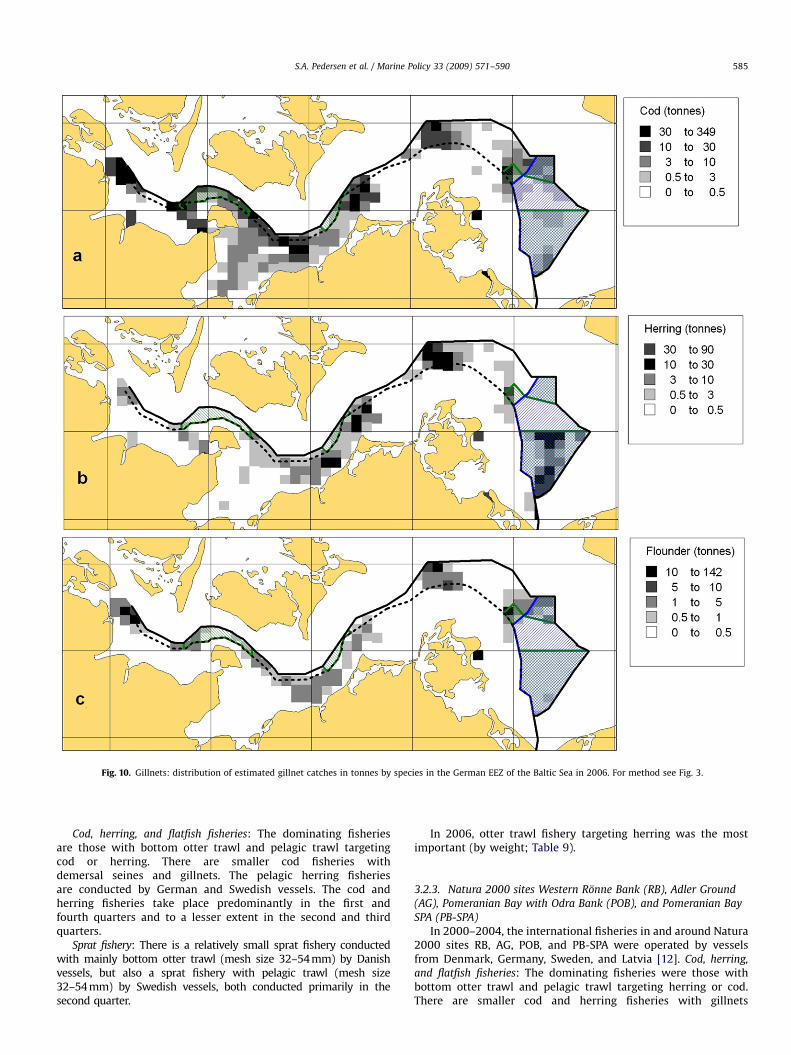
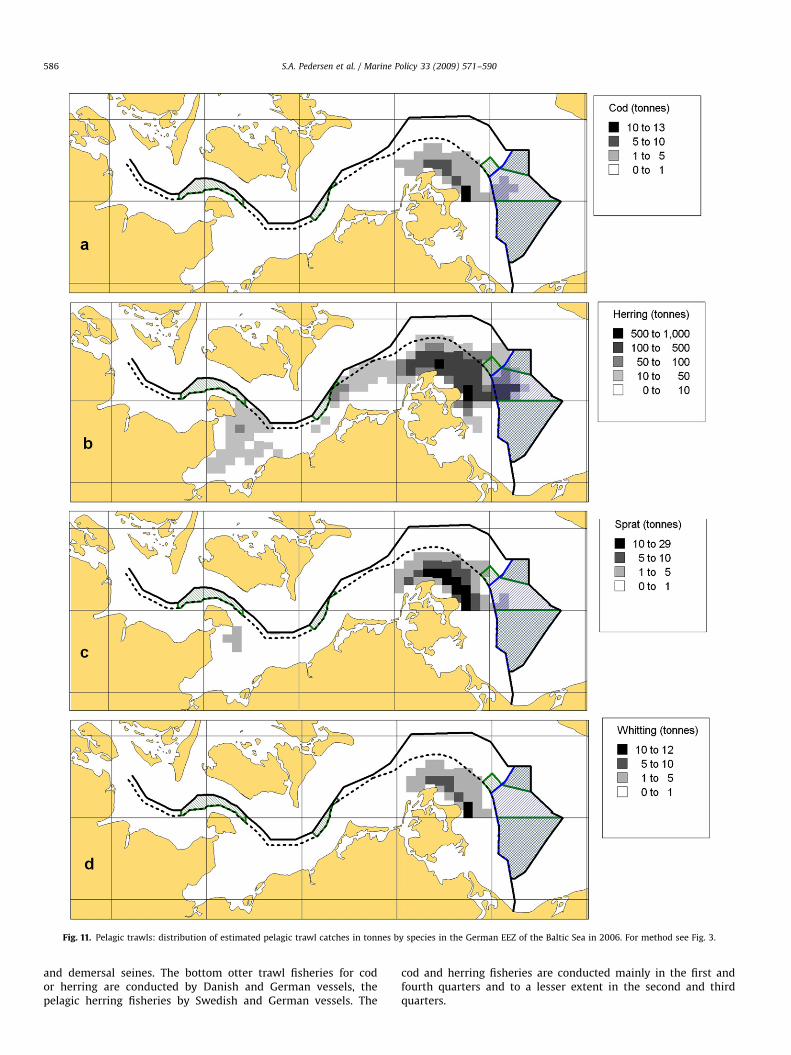
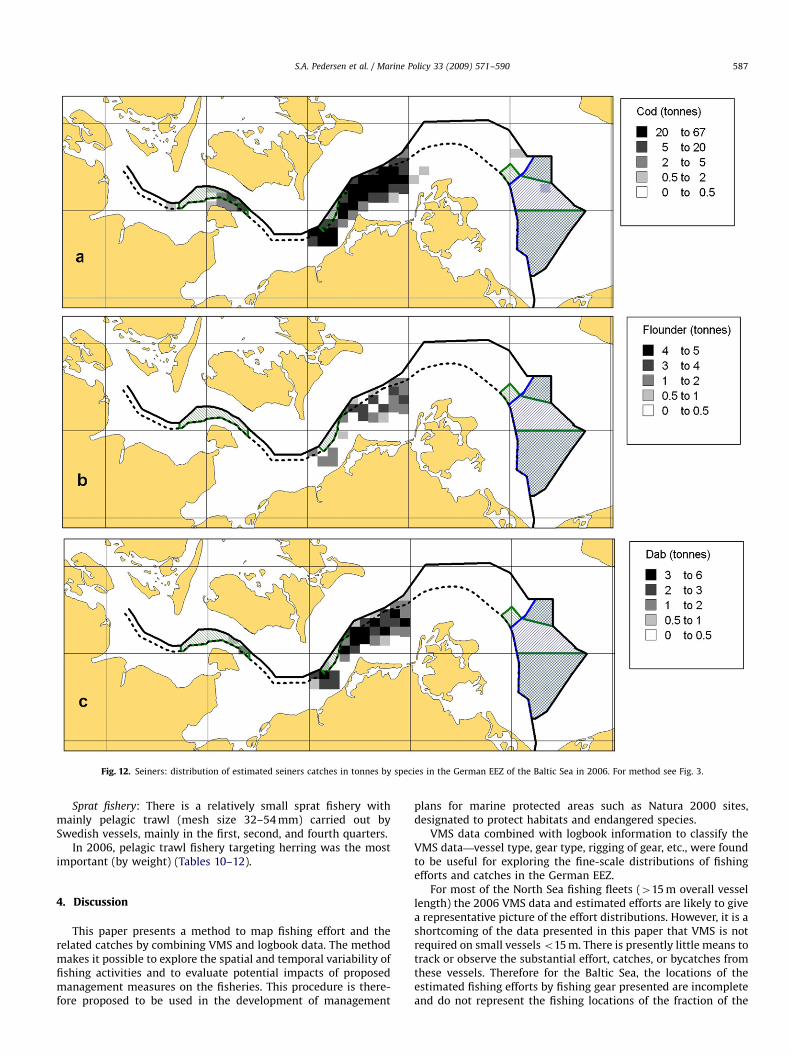
but to lesser in degree in the western coastal waters and in thePomeranian Bay (Fig. 9c). Flounders were mainly caught in theeastern parts of the EEZ, including the coastal waters (Fig. 9d). Codcatches by gillnetters were taken all over the EEZ, but with a focuson the western half (Fig. 10a). Gillnet catches of herring weremainly from the central area and from the Pomeranian Bay(Fig. 10b). Flounders were taken in the central area just as theherring catches and with a more coastal distribution compared tothe otter trawl catches (Fig. 10c). In Fig. 10a–c reported landings bygillnetters from ICES rectangle 37G3 are indicated by a single blacksquare east of Rugen Island as they could not be allocated to3�3 nm2 because catches in this rectangle were taken by vesselso15 m without VMS. Reported catches of cod, herring, sprat, andwhiting by pelagic trawling were allocated to the costal areas northof Rugen Island (Figs. 11a–d). The pelagic fishery is a midwatertrawl fishery mainly targeting shoals of Rugen herring during themigrations, November–May, to and from the spawning ground incoastal areas north of Rugen Island. Overall, catches by seiners werelow in comparison to the other gear types. However, a relativelysmall amount of mainly cod was fished by seiners in the centralpart of the EEZ, north of the Darss Peninsula (Fig. 12a).
3.2.1. Natura 2000 site Fehmarn Belt
In 2000–2004, the international fisheries in and around Naturasite FB were conducted by vessels from Denmark and Germany [12].
Cod, herring, and flatfish fisheries: The dominating fisherieswere bottom otter trawls targeting cod. There are smaller codfisheries with gillnets and demersal seiners. The bottom ottertrawl and gillnet fisheries are conducted in all four quarters, butmainly in the first and fourth quarters.
Sprat fishery: During all four quarters, there was a relativelysmall fishery by German and Danish vessels with small meshedbottom otter trawls (16–31 mm, 32–54 mm) targeting sprat.
In 2006, otter trawl fishery targeting sprat was the mostimportant (by weight; Table 8).
3.2.2. Natura 2000 site Kadet Trench
In 2000–2004, the international fisheries in and around Natura2000 site KT were conducted by vessels from Denmark, Germany,and Sweden [12].
ARTICLE IN PRESS
Table 7Reported catches in tonnes by species and type of fishing gear used by the international fisheries in the German EEZ and territorial waters of the Baltic Sea in 2006.
Species Gear type
Demersal seine Dredge Gill net Longline Otter trawl Pelagic trawl Pots Trammel net Unknown Total
Anchovy 0 0 0 0 31 0 0 0 0 31
Brill 0 0 10 2 8 0 0 3 0 22
Cod 1086 0 3395 274 8847 188 2 233 4 14,030
Shrimp 0 0 0 0 0 0 0 4 0 4
Dab 109 0 116 5 640 0 0 21 0 891
Eel 0 0 104 18 1 0 11 1 9 144
Freshw. bream 0 0 122 1 0 0 28 0 0 152
E. flounder 84 0 443 10 940 4 4 16 0 1501
Flatfish 4 0 122 0 291 1 0 22 0 440
E. perch 0 0 67 3 10 0 18 0 11 110
Pike 0 0 20 4 0 0 6 1 1 32
Pike perch 0 0 47 14 5 0 6 0 0 72
Roach 0 0 288 0 2 1 24 0 2 317
Garfish 0 0 46 1 0 0 4 0 4 55
Herring 1 0 6800 0 8478 13,077 818 0 287 29,462
Horse mackerel 0 0 0 0 528 0 0 0 0 528
Lumpfish 0 0 22 2 0 0 0 2 0 26
Mullets 0 0 6 0 2 0 0 0 0 8
Blue mussel 0 1539 0 0 0 0 0 0 0 1539
Plaice 65 0 85 5 372 1 0 19 0 548
Pollan 0 0 16 0 1 0 0 0 0 18
Sandeel 0 0 0 0 55 0 0 0 0 55
Sole 0 0 3 0 2 0 0 0 0 6
Sprat 0 0 0 0 9763 364 0 4 0 10,130
Sea trout 0 0 21 0 1 0 0 0 1 23
Turbot 2 0 57 1 33 0 0 4 0 98
Whiting 1 0 9 1 1229 137 0 1 0 1417
Other 0 0 4 1 11 1 1 1 1 21
Total 1354 1539 11,377 341 31,243 13,773 922 332 322 61,681
See legend of Table 6 for methods and Latin names of species.
Table 6Reported catches in tonnes by species and reporting country in the German EEZ of the Baltic Sea and territorial waters in 2006.
Species Country
Denmark Germany Poland Sweden Latvia Total
Anchovy (Engraulis encrasicolus) 0 31 0 0 0 31
Brill (Scophthalmus rhombus) 19 3 0 0 0 22
Cod (Gadus morhua) 6384 7106 60 52 428 14,030
Shrimp (Crangon crangon) 0 4 0 0 0 4
Dab (Limanda limanda) 386 505 0 0 0 891
Eel (Anguilla Anguilla) 106 38 0 0 0 144
Freshwater bream (Abramis brama) 0 152 0 0 0 152
E. flounder (Platichthys flesus) 426 1003 72 0 0 1501
Flatfish 0 440 0 0 0 440
E. perch (Perca fluviatilis) 13 78 18 0 0 110
Pike (Esox lucius) 0 32 0 0 0 32
Pike perch (Stizostedion lucioperca) 0 72 1 0 0 72
Roach (Rutilus rutilus) 0 304 13 0 0 317
Garfish (Belone belone) 0 55 0 0 0 55
Herring (Clupea harengus) 3001 21,838 1735 2888 0 29,462
Horse mackerel (Trachurus trachurus) 63 465 0 0 0 528
Lumpfish (Cyclopterus lumpus) 9 16 0 0 0 25
Mullets (Chelon labrosus) 7 1 0 0 0 8
Blue mussel (Mytilus edulis) 0 1539 0 0 0 1539
Plaice (Pleuronectes platessa) 332 216 1 0 0 548
Pollan (Coregonus lavaretus) 0 18 0 0 0 18
Sandeel (Ammodytes spp., Hyperoplus spp.) 55 0 0 0 0 55
Sole (Solea vulgaris) 5 1 0 0 0 6
Sprat (Sprattus sprattus) 8615 1189 244 84 0 10,130
Sea trout (Salmo trutta) 18 4 0 0 0 23
Turbot (Scophthalmus maximus) 39 57 1 0 0 98
Whiting (Merlangius merlangus) 351 886 119 22 39 1417
Other species 4 5 0 1 11 21
Total 19,834 36,058 2263 3048 478 61,681
The catch data have been provided to ICES by the national fisheries research institutes of Denmark, Germany, Sweden, Poland, and Latvia. The Danish and German catch
data were reported by ICES rectangles and they include data from the parts of the rectangles that reach into the neighbouring EEZs, see Fig. 1b. Four Estonian vessels fished
in the German EEZ in 2006 but catch reports have not been available and the Estonian catches are therefore not included in the table.
S.A. Pedersen et al. / Marine Policy 33 (2009) 571–590582
ARTICLE IN PRESS
Fig. 8. Fine-scale distributions of the total international fishing effort by fishing gear, 3�3 nm2, in 2006 in the German exclusive economic zone of the Baltic Sea. Only
German fishing effort data were available for the parts of the ICES rectangles outside the German EEZ. The method to calculate the fishing efforts is described by Fock [8].
S.A. Pedersen et al. / Marine Policy 33 (2009) 571–590 583
ARTICLE IN PRESS
Fig. 9. Otter trawl: distribution of estimated otter trawl catches in tonnes by species in the German EEZ of the Baltic Sea in 2006. For method see Fig. 3.
S.A. Pedersen et al. / Marine Policy 33 (2009) 571–590584
ARTICLE IN PRESS
Fig. 10. Gillnets: distribution of estimated gillnet catches in tonnes by species in the German EEZ of the Baltic Sea in 2006. For method see Fig. 3.
S.A. Pedersen et al. / Marine Policy 33 (2009) 571–590 585
Cod, herring, and flatfish fisheries: The dominating fisheriesare those with bottom otter trawl and pelagic trawl targetingcod or herring. There are smaller cod fisheries withdemersal seines and gillnets. The pelagic herring fisheriesare conducted by German and Swedish vessels. The cod andherring fisheries take place predominantly in the first andfourth quarters and to a lesser extent in the second and thirdquarters.
Sprat fishery: There is a relatively small sprat fishery conductedwith mainly bottom otter trawl (mesh size 32–54 mm) by Danishvessels, but also a sprat fishery with pelagic trawl (mesh size32–54 mm) by Swedish vessels, both conducted primarily in thesecond quarter.
In 2006, otter trawl fishery targeting herring was the mostimportant (by weight; Table 9).
3.2.3. Natura 2000 sites Western Ronne Bank (RB), Adler Ground
(AG), Pomeranian Bay with Odra Bank (POB), and Pomeranian Bay
SPA (PB-SPA)
In 2000–2004, the international fisheries in and around Natura2000 sites RB, AG, POB, and PB-SPA were operated by vesselsfrom Denmark, Germany, Sweden, and Latvia [12]. Cod, herring,
and flatfish fisheries: The dominating fisheries were those withbottom otter trawl and pelagic trawl targeting herring or cod.There are smaller cod and herring fisheries with gillnets
ARTICLE IN PRESS
Fig. 11. Pelagic trawls: distribution of estimated pelagic trawl catches in tonnes by species in the German EEZ of the Baltic Sea in 2006. For method see Fig. 3.
S.A. Pedersen et al. / Marine Policy 33 (2009) 571–590586
and demersal seines. The bottom otter trawl fisheries for codor herring are conducted by Danish and German vessels, thepelagic herring fisheries by Swedish and German vessels. The
cod and herring fisheries are conducted mainly in the first andfourth quarters and to a lesser extent in the second and thirdquarters.
ARTICLE IN PRESS
Fig. 12. Seiners: distribution of estimated seiners catches in tonnes by species in the German EEZ of the Baltic Sea in 2006. For method see Fig. 3.
S.A. Pedersen et al. / Marine Policy 33 (2009) 571–590 587
Sprat fishery: There is a relatively small sprat fishery withmainly pelagic trawl (mesh size 32–54 mm) carried out bySwedish vessels, mainly in the first, second, and fourth quarters.
In 2006, pelagic trawl fishery targeting herring was the mostimportant (by weight) (Tables 10–12).
4. Discussion
This paper presents a method to map fishing effort and therelated catches by combining VMS and logbook data. The methodmakes it possible to explore the spatial and temporal variability offishing activities and to evaluate potential impacts of proposedmanagement measures on the fisheries. This procedure is there-fore proposed to be used in the development of management
plans for marine protected areas such as Natura 2000 sites,designated to protect habitats and endangered species.
VMS data combined with logbook information to classify theVMS data—vessel type, gear type, rigging of gear, etc., were foundto be useful for exploring the fine-scale distributions of fishingefforts and catches in the German EEZ.
For most of the North Sea fishing fleets (415 m overall vessellength) the 2006 VMS data and estimated efforts are likely to givea representative picture of the effort distributions. However, it is ashortcoming of the data presented in this paper that VMS is notrequired on small vessels o15 m. There is presently little means totrack or observe the substantial effort, catches, or bycatches fromthese vessels. Therefore for the Baltic Sea, the locations of theestimated fishing efforts by fishing gear presented are incompleteand do not represent the fishing locations of the fraction of the
ARTICLE IN PRESS
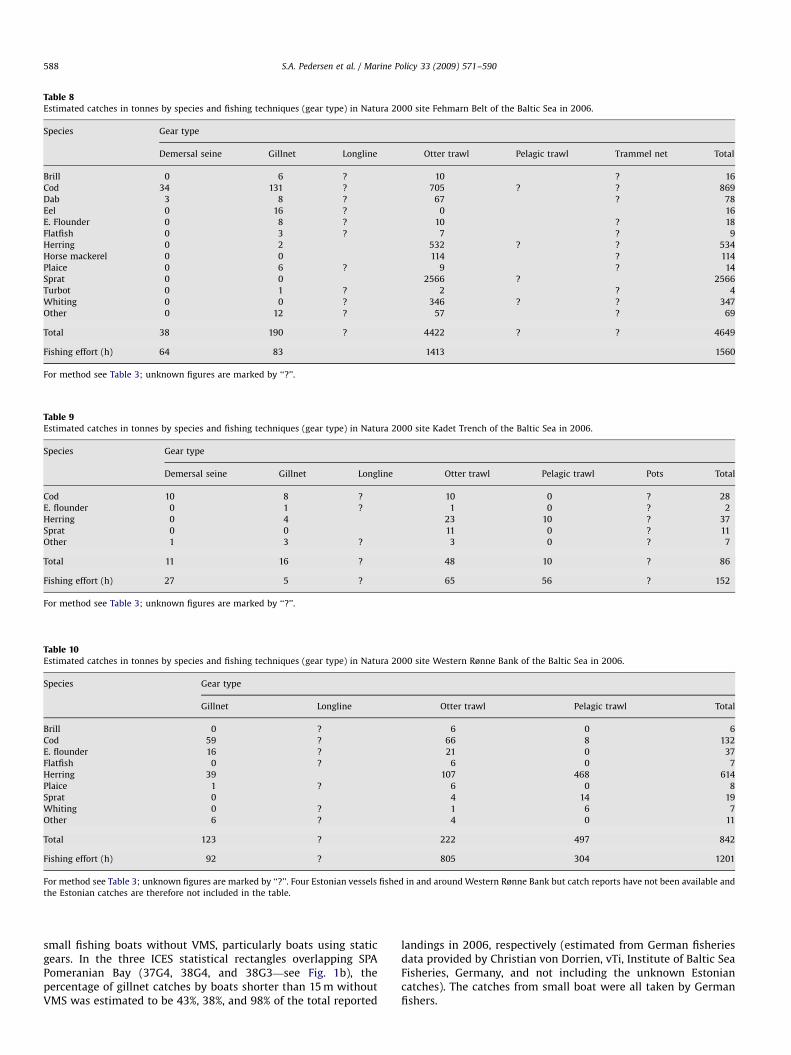
Table 8Estimated catches in tonnes by species and fishing techniques (gear type) in Natura 2000 site Fehmarn Belt of the Baltic Sea in 2006.
Species Gear type
Demersal seine Gillnet Longline Otter trawl Pelagic trawl Trammel net Total
Brill 0 6 ? 10 ? 16
Cod 34 131 ? 705 ? ? 869
Dab 3 8 ? 67 ? 78
Eel 0 16 ? 0 16
E. Flounder 0 8 ? 10 ? 18
Flatfish 0 3 ? 7 ? 9
Herring 0 2 532 ? ? 534
Horse mackerel 0 0 114 ? 114
Plaice 0 6 ? 9 ? 14
Sprat 0 0 2566 ? 2566
Turbot 0 1 ? 2 ? 4
Whiting 0 0 ? 346 ? ? 347
Other 0 12 ? 57 ? 69
Total 38 190 ? 4422 ? ? 4649
Fishing effort (h) 64 83 1413 1560
For method see Table 3; unknown figures are marked by ‘‘?’’.
Table 9Estimated catches in tonnes by species and fishing techniques (gear type) in Natura 2000 site Kadet Trench of the Baltic Sea in 2006.
Species Gear type
Demersal seine Gillnet Longline Otter trawl Pelagic trawl Pots Total
Cod 10 8 ? 10 0 ? 28
E. flounder 0 1 ? 1 0 ? 2
Herring 0 4 23 10 ? 37
Sprat 0 0 11 0 ? 11
Other 1 3 ? 3 0 ? 7
Total 11 16 ? 48 10 ? 86
Fishing effort (h) 27 5 ? 65 56 ? 152
For method see Table 3; unknown figures are marked by ‘‘?’’.
Table 10Estimated catches in tonnes by species and fishing techniques (gear type) in Natura 2000 site Western Rønne Bank of the Baltic Sea in 2006.
Species Gear type
Gillnet Longline Otter trawl Pelagic trawl Total
Brill 0 ? 6 0 6
Cod 59 ? 66 8 132
E. flounder 16 ? 21 0 37
Flatfish 0 ? 6 0 7
Herring 39 107 468 614
Plaice 1 ? 6 0 8
Sprat 0 4 14 19
Whiting 0 ? 1 6 7
Other 6 ? 4 0 11
Total 123 ? 222 497 842
Fishing effort (h) 92 ? 805 304 1201
For method see Table 3; unknown figures are marked by ‘‘?’’. Four Estonian vessels fished in and around Western Rønne Bank but catch reports have not been available and
the Estonian catches are therefore not included in the table.
S.A. Pedersen et al. / Marine Policy 33 (2009) 571–590588
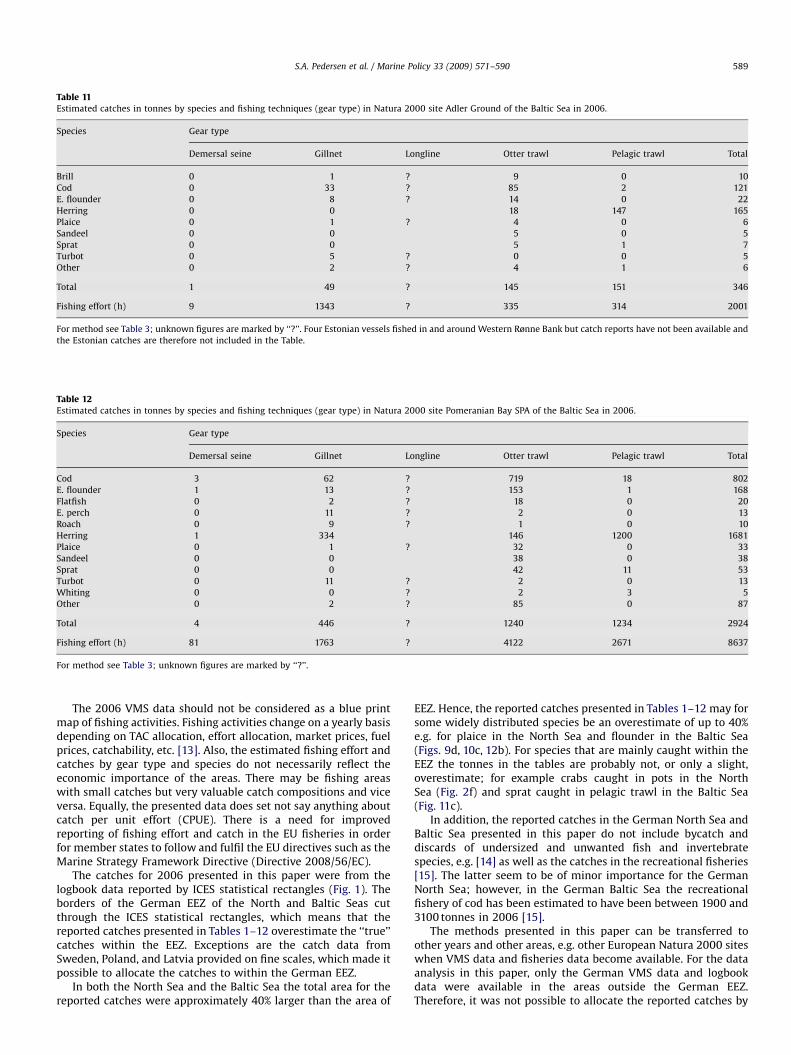
small fishing boats without VMS, particularly boats using staticgears. In the three ICES statistical rectangles overlapping SPAPomeranian Bay (37G4, 38G4, and 38G3—see Fig. 1b), thepercentage of gillnet catches by boats shorter than 15 m withoutVMS was estimated to be 43%, 38%, and 98% of the total reported
landings in 2006, respectively (estimated from German fisheriesdata provided by Christian von Dorrien, vTi, Institute of Baltic SeaFisheries, Germany, and not including the unknown Estoniancatches). The catches from small boat were all taken by Germanfishers.
ARTICLE IN PRESS
Table 11Estimated catches in tonnes by species and fishing techniques (gear type) in Natura 2000 site Adler Ground of the Baltic Sea in 2006.
Species Gear type
Demersal seine Gillnet Longline Otter trawl Pelagic trawl Total
Brill 0 1 ? 9 0 10
Cod 0 33 ? 85 2 121
E. flounder 0 8 ? 14 0 22
Herring 0 0 18 147 165
Plaice 0 1 ? 4 0 6
Sandeel 0 0 5 0 5
Sprat 0 0 5 1 7
Turbot 0 5 ? 0 0 5
Other 0 2 ? 4 1 6
Total 1 49 ? 145 151 346
Fishing effort (h) 9 1343 ? 335 314 2001
For method see Table 3; unknown figures are marked by ‘‘?’’. Four Estonian vessels fished in and around Western Rønne Bank but catch reports have not been available and
the Estonian catches are therefore not included in the Table.
Table 12Estimated catches in tonnes by species and fishing techniques (gear type) in Natura 2000 site Pomeranian Bay SPA of the Baltic Sea in 2006.
Species Gear type
Demersal seine Gillnet Longline Otter trawl Pelagic trawl Total
Cod 3 62 ? 719 18 802
E. flounder 1 13 ? 153 1 168
Flatfish 0 2 ? 18 0 20
E. perch 0 11 ? 2 0 13
Roach 0 9 ? 1 0 10
Herring 1 334 146 1200 1681
Plaice 0 1 ? 32 0 33
Sandeel 0 0 38 0 38
Sprat 0 0 42 11 53
Turbot 0 11 ? 2 0 13
Whiting 0 0 ? 2 3 5
Other 0 2 ? 85 0 87
Total 4 446 ? 1240 1234 2924
Fishing effort (h) 81 1763 ? 4122 2671 8637
For method see Table 3; unknown figures are marked by ‘‘?’’.
S.A. Pedersen et al. / Marine Policy 33 (2009) 571–590 589
The 2006 VMS data should not be considered as a blue printmap of fishing activities. Fishing activities change on a yearly basisdepending on TAC allocation, effort allocation, market prices, fuelprices, catchability, etc. [13]. Also, the estimated fishing effort andcatches by gear type and species do not necessarily reflect theeconomic importance of the areas. There may be fishing areaswith small catches but very valuable catch compositions and viceversa. Equally, the presented data does set not say anything aboutcatch per unit effort (CPUE). There is a need for improvedreporting of fishing effort and catch in the EU fisheries in orderfor member states to follow and fulfil the EU directives such as theMarine Strategy Framework Directive (Directive 2008/56/EC).
The catches for 2006 presented in this paper were from thelogbook data reported by ICES statistical rectangles (Fig. 1). Theborders of the German EEZ of the North and Baltic Seas cutthrough the ICES statistical rectangles, which means that thereported catches presented in Tables 1–12 overestimate the ‘‘true’’catches within the EEZ. Exceptions are the catch data fromSweden, Poland, and Latvia provided on fine scales, which made itpossible to allocate the catches to within the German EEZ.
In both the North Sea and the Baltic Sea the total area for thereported catches were approximately 40% larger than the area of
EEZ. Hence, the reported catches presented in Tables 1–12 may forsome widely distributed species be an overestimate of up to 40%e.g. for plaice in the North Sea and flounder in the Baltic Sea(Figs. 9d, 10c, 12b). For species that are mainly caught within theEEZ the tonnes in the tables are probably not, or only a slight,overestimate; for example crabs caught in pots in the NorthSea (Fig. 2f) and sprat caught in pelagic trawl in the Baltic Sea(Fig. 11c).
In addition, the reported catches in the German North Sea andBaltic Sea presented in this paper do not include bycatch anddiscards of undersized and unwanted fish and invertebratespecies, e.g. [14] as well as the catches in the recreational fisheries[15]. The latter seem to be of minor importance for the GermanNorth Sea; however, in the German Baltic Sea the recreationalfishery of cod has been estimated to have been between 1900 and3100 tonnes in 2006 [15].
The methods presented in this paper can be transferred toother years and other areas, e.g. other European Natura 2000 siteswhen VMS data and fisheries data become available. For the dataanalysis in this paper, only the German VMS data and logbookdata were available in the areas outside the German EEZ.Therefore, it was not possible to allocate the reported catches by
ARTICLE IN PRESS
S.A. Pedersen et al. / Marine Policy 33 (2009) 571–590590
ICES rectangles according to the total international fishingeffort by gear type to the area parts of the ICES rectangles outsidethe German EEZ. The distributions of the estimated fishing effortand catches by gear type and species presented give a genericpicture over the entire year 2006, with patterns of seasonalvariation in fishing effort, catch, and catch per unit effort.
Differences between fishing gear types (size of gear, rigging ofgear, soak time, mesh size, etc.) and their environmental impactsneed to be taken into consideration and evaluated. The fishinggear information should be connected to or included in the VMS.Fishery data at sufficient spatial resolution are not available fromsmall boats (o15 m). In the offshore Natura 2000 sites of theNorth Sea, the fishing effort of smaller vessels is relatively low. Inthe sites of the Baltic Sea the fishing effort of smaller vessels isrelatively high. Therefore, potential environmental impact assess-ments of fishing as well as potential effects of MPAs on the smallboat fisheries are at the moment most difficult to evaluate withinthe German Baltic Sea.
5. Conclusions
VMS data combined with independently obtained fisheryinformation to classify the VMS data—vessel type, gear type, sizeof gear rigging of gear, etc.—were are at present the best data
available for high-resolution mapping of the fisheries. Nonethelessthese data have several shortcomings, leading to the followingsuggestions for improvement:
�
The fishing gear information should be connected to orincluded in the VMS, the latter to be able to separate andassess the impacts caused by, for example, different types ofbeam trawlers or otter trawlers. � The fishery data have been aggregated to 3�3 mile2 grids,while for example conservation features (habitats and species)relevant to impact assessment of fishing activities are oftendistributed on smaller scales.
� Fishery data from smaller vessels (o15 m) must be taken intoconsideration. In the offshore MPAs of the North Sea, thefishing effort of smaller vessels is relatively low. In the offshoreMPAs of the Baltic Sea the fishing effort of smaller vessels isrelatively high.
Acknowledgements
For providing the catch data for 2006 presented in thispaper we thank Christian von Dorrien (vTi, Institute of BalticSea Fisheries, Germany), Ole Folmer (DTU-Aqua, Denmark),
Wlodzimierz Grygiel (Sea Fisheries Institute (MIR) in Gdynia,Poland), Andrzej Jaworski (FRS Marine Laboratory, Scotland), AndySouth (Centre for Environment, Fisheries, and AquacultureScience, England), Gerjan Piet (IMARES, Wageningen UR, Nether-lands), Mattias Skold (Swedish Board of Fisheries), Willy Vanhee(ILVO-DvZ, Belgium), and Maris Plikshs (Latvian Fish ResourceAgency). Nathalie Steins, Cora Markensteijn (Dutch Fish ProductBoard), and Michael Andersen, Henrik Lund, Jesper Larsen (DanishFishermen’s Association) provided useful observations on themapped VMS and catch data, which we have used in ourdiscussion of the results.
References
[1] Douvere F, Ehler CN. International Workshop on Marine Spatial Planning,UNESCO, Paris, 8–10 November 2006. A summary. Marine Policy2007;31:582–3.
[2] Douvere F, Ehler CN. Introduction. Marine Policy 2008;32(5):759–61 [The roleof marine spatial planning in implementing ecosystem-based, sea usemanagement—special issue].
[3] European Commission. Biodiversity Communication 2006 and Action PlanCOM (2006) 216 final. /http://ec.europa.eu/environment/nature/biodiver-sity/comm2006/index_en.htmS, 2006.
[4] European Commission. The Habitats Directive web-page: /http://ec.europa.eu/environment/nature/legislation/habitatsdirective/index_en.htmS, 1992.
[5] European Commission. Natura 2000 in the marine environment, guidelines./http://ec.europa.eu/environment/nature/natura2000/marine/index_en.htmS,2007.
[6] European Commission. Introducing fisheries measures for marine Natura2000 sites. /http://ec.europa.eu/environment/nature/natura2000/marine/docs/fish_measures.pdfS, 2008.
[7] ICES. The EMPAS web-page: /http://www.ices.dk/projects/empas.aspS,2006.
[8] Fock HO. Fisheries in the context of marine spatial planning: definingprincipal areas for fisheries in the German EEZ. Marine Policy 2008;32(4):728–39.
[9] Pedersen SA, Fock H, Krause J, Pusch C, Sell AF, Bottcher U, et al. Natura 2000sites and fisheries in German offshore waters. ICES Journal of Marine Science2009;66:155–69.
[10] O’Shea B, Thompson S. The innovative application of vessel monitoringsystems for the effective fisheries monitoring control and surveillance. ICESCM 2006/N:11, 25pp.
[11] Nolan F. Confidentiality of fisheries data in the context of enforcementactivities versus research. ICES CM 2006/M:05, 11pp
[12] ICES. Interim report 2006 for the ICES/BfN-project: ‘‘Environmentally SoundFisheries Management in Protected Areas’’ [EMPAS], ICES 2007, 107pp.
[13] ICES. Report of the workshop on fisheries management in marine protectedareas, WKFMMPA, 2–4 June 2008, ICES Headquarters, Copenhagen, Denmark.ICES CM 2008/MHC:11, 160pp.
[14] Anon. Report on a policy to reduce unwanted bycatches and eliminatediscards in European fisheries (2007/2112(INI)), Committee on Fisheries,rapporteur: Carl Schlyter. European Parliament, session document A6-0495/2007 and (COM(2007)0136).
[15] Anon. The German recreational fisheries’ cod catch in the Baltic and NorthSeas, 2004–2006. Report of a pilot study in support of the National FisheriesData Collection Program corresponding to Commission Regulation (EC) no.1581/2004, 7. Appendix XI (Section E), para.3. Bundesforschungsanstalt furFischerei, Institut fur Ostseefischerei, Alter Hafen Sud 2, 18069 Rostock,Germany, 2007.
Related Documents


